Structural studies of shikimate 5-dehydrogenase from Mycobacterium tuberculosis
Upload
khangminh22Category
view
0download
0
MycobacteriumtuberculosisSurface‐BindingAntibodiesInfluenceEarlyInfectionEvents
by
Casey Perley
Department of Molecular Genetics and Microbiology
Duke University
Date:_______________________
Approved:
___________________________
Richard Frothingham, Supervisor
___________________________
Jörn Coers
___________________________
Jen‐Tsan Ashley Chi
___________________________
Micah Luftig
___________________________
Gregory Taylor
Dissertation submitted in partial fulfillment of
the requirements for the degree of Doctor
of Philosophy in the Department of
Molecular Genetics and Microbiology in the Graduate School
of Duke University
2015

ABSTRACT
MycobacteriumtuberculosisSurface‐BindingAntibodiesInfluenceEarlyInfectionEvents
Casey Perley
Department of Molecular Genetics and Microbiology
Duke University
Date:_______________________
Approved:
___________________________
Richard Frothingham, Supervisor
___________________________
Jörn Coers
___________________________
Jen‐Tsan Ashley Chi
___________________________
Micah Luftig
___________________________
Gregory Taylor
An abstract of a dissertation submitted in partial fulfillment of
the requirements for the degree of Doctor
of Philosophy in the Department of
Molecular Genetics and Microbiology in the Graduate School
of Duke University.
2015

Copyright by
Casey Perley
2015

iv
Abstract
Mycobacterium tuberculosis, the etiologic agent of tuberculosis (TB), is among the
leading causes of death from infectious disease world‐wide. An intracellular pathogen,
M. tuberculosis infects phagocytic cells, and subverts the host immune response,
preventing eradication once infection has been established. Even after successful
chemotherapy, exogenous re‐infection occurs, indicating that sterilizing immune
responses are not generated during natural infection. While a TB vaccine exists, it does
not alter M. tuberculosis infection rate, rather it prevents the progression from latent TB
infection to active TB disease. Vaccines against Haemophilus influenzae and Streptococcus
pneumonia protect from bacterial colonization and infection through the induction of
antibodies to capsular surface components. This dissertation explores if antibodies to
the surface of M. tuberculosis can alter the initial interaction between a bacterium and
host cell, leading to a reduction in infection rate.
When pre‐mixed with M. tuberculosis prior to in vitro infection of macrophages,
or retropharyngeal instillation of mice, monoclonal surface‐binding, but not non‐surface‐
binding antibodies, decrease bacterial burden and the number of infected cells within
the first twenty‐four hour of infection. If administered retropharyngeally prior to aerosol
exposure, surface‐binding antibodies decreased pulmonary bacterial burden at twenty‐
four hours post infection in an FcγR independent manner. Despite decreasing early
v
bacterial burden, pre‐administration of surface‐binding antibodies prior to ultra‐low
dose aerosol infection did not alter infection rate compared to mice instilled with PBS
(Chapters 4 and 5).
To evaluate the surface‐binding antibody response in humans, plasma from
uninfected controls, individuals with latent TB infection, and active TB disease was
assayed by ELISA to determine the titer, avidity and IgG/IgM ratio for antibodies to the
surface, whole cell lysate, and additional subcellular bacterial fractions . In contrast to
antibodies to antigenic fractions, individuals with active TB disease had decreased
avidity, and no augmentation of the IgG/IgM ratio for antibodies to the live M.
tuberculosis surface, as compared to uninfected controls (Chapter 3).
Overall these findings demonstrate that surface‐binding monoclonal antibodies
alter early infection events, both in vivo and in vitro, though the magnitude of protection
was not sufficient to decrease M. tuberculosis infection rate. Given the failure of patients
with active TB disease to produce highly avid IgG surface‐binding antibodies, they may
represent the target of a protective vaccine.

vi
Dedication
To my grandmother: You have taught me two of the most valuable lessons in life. Always
be yourself, and never let anyone tell you that something is not possible, especially just
because you are a woman. You marched to the beat of your own drummer, and lived life
to the fullest. I inspire to live by your example. You also taught me the secret ingredient
to make the best chocolate chip cookies. I am honored to share your name.
To my parents: Thank you for your unwavering love for all these years. You have always
supported me unconditionally in whatever I did, be it science, or music, and I wouldn’t
have made it to this point without you both.
To Neil: You have sacrificed so much in letting me pursue my doctorate, and hardest
part of writing this dissertation is knowing you won’t be here to see me defend it. I am
so proud of you, and what you are doing. Not all girls are lucky enough to marry their
hero. I am. I love you. I can’t wait until you return.
vii
Contents
Abstract ........................................................................................................................... iv
List of Tables ................................................................................................................ xiv
List of Figures .............................................................................................................. xvi
Acknowledgements ..................................................................................................... xix
1. Tuberculosis ................................................................................................................. 1
1.1 Tuberculosis disease......................................................................................................... 1
1.1.1 Mycobacterium tuberculosis complex .......................................................................... 1
1.1.2 Global disease burden ................................................................................................ 1
1.1.3 Transmission and early infection events .................................................................. 3
1.1.4 The onset of the adaptive immune response and progression to active disease 4
1.2 Vaccines ............................................................................................................................. 6
1.2.1 M. bovis Bacille Calmette‐Guérin (BCG) vaccine .................................................... 6
1.2.2 Vaccines in clinical trials ............................................................................................ 7
1.2.3 Tuberculosis vaccines that induce sterilizing immunity ..................................... 11
1.3 Animal models of tuberculosis ..................................................................................... 13
1.3.1 Murine model of active TB disease ......................................................................... 13
1.3.2 The ultra‐low dose murine infection model .......................................................... 15
1.3.3 Alternative animal models ....................................................................................... 17
1.4 Antibodies and tuberculosis ......................................................................................... 19
1.4.1 Serum therapy as treatment for tuberculosis ........................................................ 19

viii
1.4.2 Antibodies as a principal component of diagnostic testing and as a biomarker
for disease progression ...................................................................................................... 21
1.4.3 Antibodies alter disease course in mice ................................................................. 22
1.4.4 Disease progression in mice lacking components of the humoral immune
response ............................................................................................................................... 24
2. Differences in baseline lung characteristics of BALB/c and C57BL/6J may influence differences in infection rate ........................................................................ 26
2.1 Introduction ..................................................................................................................... 26
2.2 Methods ........................................................................................................................... 27
2.2.1 Animals ....................................................................................................................... 27
2.2.2 Retropharyngeal M. tuberculosis infection ............................................................. 27
2.2.3 Bacterial CFU determinations .................................................................................. 28
2.2.4 Sample collection and processing for Luminex multiplex assay ........................ 28
2.2.5 Luminex multiplex cytokine assay ......................................................................... 28
2.2.6 Single cell suspension of mouse lung ..................................................................... 29
2.2.7 Cell staining and flow cytometry ............................................................................ 30
2.2.8 Flow cytometry gating .............................................................................................. 30
2.2.9 Statistics ...................................................................................................................... 32
2.3 Results .............................................................................................................................. 32
2.3.1 Early CFU differences in BALB/c in and C57BL/6J mice are observed after
aerosol exposure but not retropharyngeal instillation .................................................. 32
2.3.2 Cytokines and chemokines are differentially expressed in the BAL fluid and
lung homogenate of BALB/c and C57BL/6 mice ............................................................ 33
2.3.3 Differences in baseline cell populations in BALB/c and C57BL/6 mice ............. 36
ix
2.4 Discussion ........................................................................................................................ 37
2.5 Future Directions ............................................................................................................ 40
3. Human antibodies to the surface of M. tuberculosis ................................................. 43
3.1 Introduction ..................................................................................................................... 43
3.2 Methods ........................................................................................................................... 44
3.2.1 Bacterial cultures and lysates ................................................................................... 44
3.2.2 Additional ELISA antigens ...................................................................................... 45
3.2.3 ELISA assay ................................................................................................................ 45
3.2.4 Avidity ELISA assay ................................................................................................. 47
3.2.5 Statistical Analysis ..................................................................................................... 48
3.2.6 Human subjects ......................................................................................................... 48
3.2.7 Cytokine profiling ..................................................................................................... 49
3.3 Results .............................................................................................................................. 50
3.3.1 Demographic information on human population ................................................ 50
3.3.2 Human antibody titers to the surface of live M. tuberculosis and to inactivated
antigenic fractions .............................................................................................................. 52
3.3.3 Relative IgG avidity to the surface of live M. tuberculosis and to inactivated
antigenic fractions .............................................................................................................. 55
3.3.4 Ratio of IgG and IgM antibodies to the surface of live M. tuberculosis and to
inactivated antigenic fractions .......................................................................................... 55
3.3.5 Correlations between antibody titers and clinical characteristics ...................... 56
3.3.6 Correlations between relative IgG avidity and clinical characteristics .............. 60

x
3.3.7. Association of cytokine production with surface‐binding and secreted protein
antibody titers and IgG avidity scores ............................................................................ 61
3.3.8 Antibody titers and avidity scores to environmental mycobacteria .................. 62
3.4 Discussion ........................................................................................................................ 64
3.5 Future directions ............................................................................................................. 72
4. Surface-binding antibodies decrease bacterial burden in the murine lung by blocking M. tuberculosis uptake ................................................................................. 75
4.1 Introduction ..................................................................................................................... 75
4.2 Methods ........................................................................................................................... 76
4.2.1 Hybridoma generation ............................................................................................. 76
4.2.2 Hybridoma growth and antibody purification ..................................................... 77
4.2.3 Antibodies .................................................................................................................. 78
4.2.4 ELISA assay ................................................................................................................ 80
4.2.5 Avidity ELISA assay ................................................................................................. 80
4.2.6 Murine immune sera ................................................................................................. 80
4.2.7 Western Blot ............................................................................................................... 81
4.2.8 Bacterial strains and growth conditions ................................................................. 81
4.2.9 Biotin fixation to M. tuberculosis .............................................................................. 82
4.2.10 Macrophage uptake and survival assay ............................................................... 84
4.2.11 Bacterial clumping assay ........................................................................................ 85
4.2.12 Mice ........................................................................................................................... 85
4.2.13 Isolation of dsRed M. tuberculosis from peritoneal lavage ................................. 85
xi
4.2.14 Murine administration of antibody pre‐mixed with M. tuberuclosis ................ 86
4.2.15 Single cell suspension of infected mouse lung and pneumocyte staining ...... 87
4.2.16 Flow cytometry analysis ......................................................................................... 87
4.2.17 Statistics .................................................................................................................... 90
4.3 Results .............................................................................................................................. 90
4.3.1 Screening of M. tuberculosis antibodies from a repository ................................... 90
4.3.2 Generation and screening of surface‐binding antibodies against LAM, HSP‐X
and Apa ................................................................................................................................ 92
4.3.3 Purified antibody reactivity to M. tuberculosis fractions and the live cell surface
............................................................................................................................................... 93
4.3.4 Determination of whole cell lysate avidity for purified antibodies ................... 96
4.3.5 Purified M. tuberculosis antibodies bind to linear epitopes and are polyreactive
............................................................................................................................................... 97
4.3.6 Pre‐mixing of biotin coated M. tuberculosis with antibody, prior to macrophage
infection, decreases bacterial burden ............................................................................... 98
4.3.7 Pre‐mixing of M. tuberculosis with surface‐binding antibodies prior to
macrophage infection decreases bacterial burden ......................................................... 99
4.3.8 Surface‐binding antibodies do not induce bacterial agglutination .................. 103
4.3.9 BTN.4 does not decrease pulmonary bacterial load at three days post infection
when mixed with biotin coated M. tuberculosis prior to retropharyngeal instillation
............................................................................................................................................. 104
4.3.10 Surface‐binding, but not non‐surface‐binding antibodies, decrease bacterial
burden at three days post infection when mixed with M. tuberculosis prior to
retropharyngeal instillation ............................................................................................ 105
xii
4.3.11 Surface‐binding antibodies decrease bacterial burden at three, but not six,
days post infection when mixed with M. tuberculosis prior to retropharyngeal
instillation .......................................................................................................................... 108
4.3.12 Pre‐incubation with surface‐binding antibodies reduces pulmonary bacterial
load three days after infection with mammalian adapted bacteria........................... 110
4.3.13 Pre‐incubation of M. tuberculosis with surface‐binding antibodies reduces the
number of infected cells by one day post retropharyngeal instillation .................... 112
4.3.14 Incubation of M. tuberculosis with surface‐binding antibodies alters the
infected cell profile during the first three days post infection ................................... 114
4.3.15 Total lung cell profile after M. tuberculosis infection ........................................ 121
4.4 Discussion ...................................................................................................................... 124
4.5 Future Direction ............................................................................................................ 131
5. Surface-binding antibodies decrease pulmonary bacterial burden after aerosol infection ....................................................................................................................... 136
5.1 Introduction ................................................................................................................... 136
5.2 Methods ......................................................................................................................... 137
5.2.1 Animals ..................................................................................................................... 137
5.2.2 Retropharyngeal instillation of purified antibody .............................................. 137
5.2.3 Pharmacokinetics of monoclonal antibodies in BAL fluid ................................ 138
5.2.4 Aerosol innocula preparation ................................................................................ 138
5.2.5 Aerosol challenge .................................................................................................... 138
5.2.6 Determination of aerosol dose presented ............................................................ 139
5.2.7 Bacterial CFU determination ................................................................................. 140
5.2.8 Lung culture ............................................................................................................. 140
xiii
5.2.9 Statistics .................................................................................................................... 140
5.3 Results ............................................................................................................................ 141
5.3.1 Antibodies persist in BAL fluid for at least twenty‐four hours after
retropharyngeal instillation ............................................................................................ 141
5.3.2 Surface‐binding antibodies decrease bacterial CFU in a concentration
dependent manner when administered prior to a standard dose M. tuberculosis
aerosol ................................................................................................................................ 142
5.3.3 Retropharyngeal administration of surface‐binding antibodies leads to
variable decreases in bacterial burden three days post aerosol infection ................ 143
5.3.4 Retropharyngeal administration of surface‐binding antibodies one day prior to
standard dose aerosol infection decreased bacterial burden in the lungs in a time
dependent manner ........................................................................................................... 146
5.3.5 Decreased bacterial burden is FCγR independent ............................................. 148
5.3.6 Retropharyngeal administration of surface‐binding antibodies prior to ultra‐
low dose aerosol does not reduce murine infection rate ............................................ 149
5.3.7 The presence of 1mg of antibodies prior to ultra‐low dose M. tuberculosis
exposure leads to decreased bacterial load one month post infection in infected
mice .................................................................................................................................... 151
5.4 Discussion ...................................................................................................................... 153
5.5 Future Directions .......................................................................................................... 157
Appendix A .................................................................................................................. 160
Appendix B .................................................................................................................. 163
Appendix C .................................................................................................................. 172
References ................................................................................................................... 178
Biography .................................................................................................................... 209

xiv
List of Tables
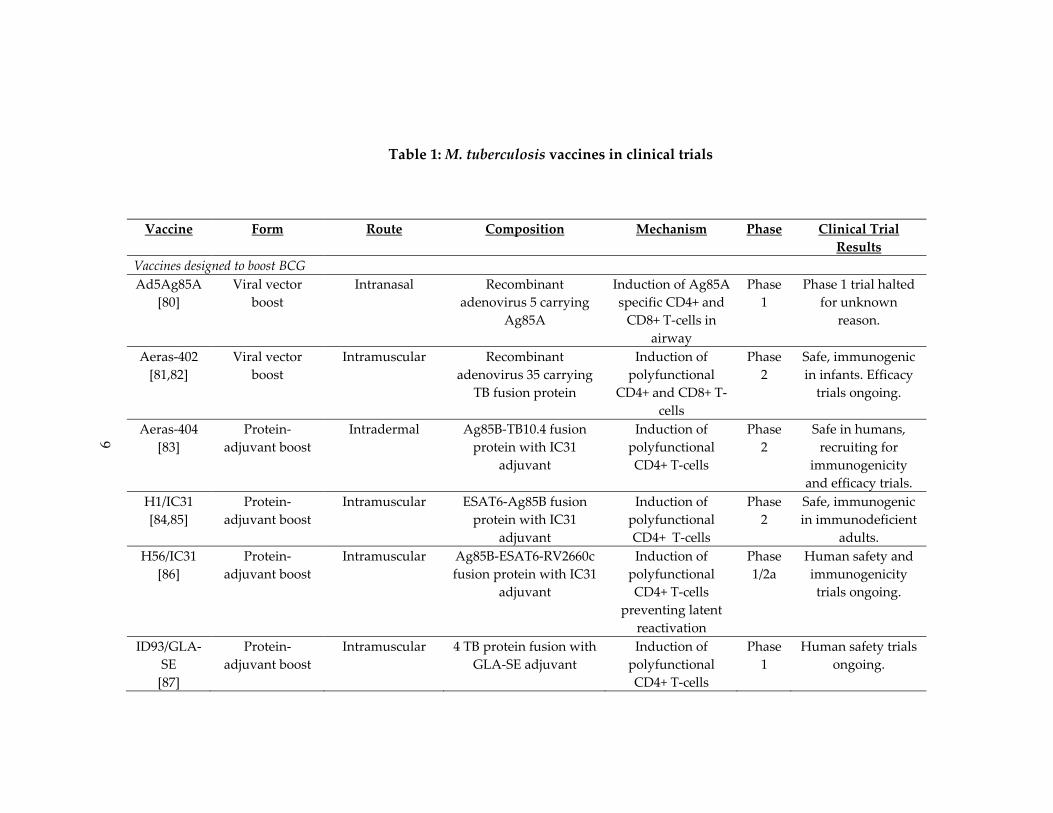
Table 1: M. tuberculosis vaccines in clinical trials ...................................................................... 9
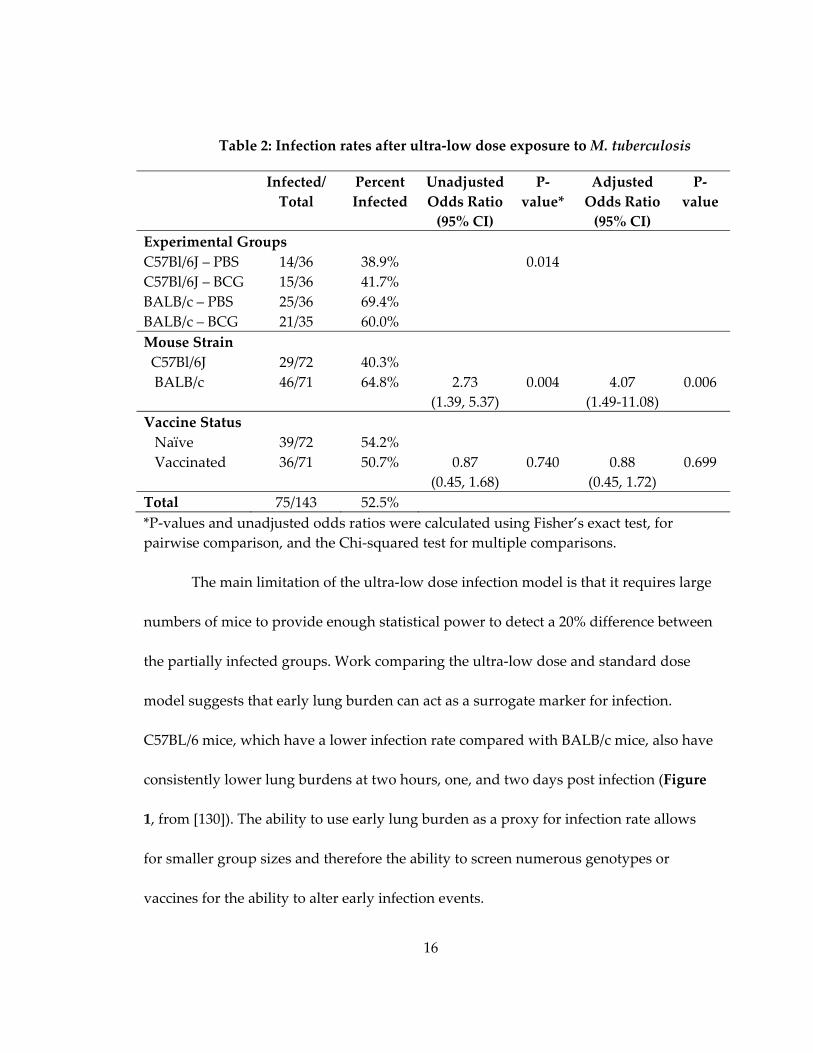
Table 2: Infection rates after ultra‐low dose exposure to M. tuberculosis ............................ 16
Table 3: Cytokine values for C57BL/6 and BALB/c mice in BAL and lung homogenate.. 35
Table 4: Demographics and clinical data ................................................................................. 51
Table 5: Univariate correlation between clinical variables and total antibody titers to the
live M. tuberculosis surface or whole cell lysate in patients with active TB disease........... 58
Table 6: Univariate correlation between clinical variables and avidity of antibodies to the
live M. tuberculosis surface or whole cell lysate in patients with active TB disease........... 59
Table 7: Experimental Antibodies............................................................................................. 79
Table 8: Components of surface‐binding antibody pools ..................................................... 79
Table 9: Screening of anti‐M. tuberculosis monoclonal antibodies from repository ........... 91
Table 10: Peak OD values for monoclonal antibodies to M. tuberculosis fractions and the
live cell surface ............................................................................................................................ 95
Table 11: Peak OD values for monoclonal antibodies to their cognate antigens ............... 95
Table 12: Avidity scores to whole cell lysate for purified antibodies .................................. 96
Table 13: M. tuberculosis antibodies do not induce agglutination ...................................... 104
Table 14: Infection rates after ultra‐low dose M. tuberculosis aerosol exposure ............... 151
Table 15: BAL, lung tissue and sera cytokine data for C57BL/6 and BALB/c mice ......... 160
Table 16: Univariate correlation between clinical variables and total antibody titers to
LAM, cell wall, and secreted proteins in patients with active TB disease ........................ 164
Table 17: Univariate correlation between clinical variables and total antibody titers to the
live M. tuberculosis surface and whole cell lysate in patients with latent TB infection ... 165
xv
Table 18: Univariate correlation between clinical variable and total antibody titers to
LAM, cell wall, and secreted proteins for patients with latent TB infection .................... 166
Table 19: Univariate correlation between clinical variables and relative IgG avidity of
antibodies to LAM, cell wall, and secreted proteins in patients with active TB disease 167
Table 20: Univariate correlation between clinical variables and relative IgG avidity of
antibodies to the live M. tuberculosis surface and to whole cell lysate in patients with
latent TB infection ..................................................................................................................... 168
Table 21: Univariate correlation between clinical factors and relative IgG avidity of
antibodies to LAM, secreted proteins, and cell wall in patients with latent TB infection
..................................................................................................................................................... 169
Table 22: Univariate correlation between cytokine levels in whole blood after
Quantiferon‐Gold peptide stimulation and total antibody titers ....................................... 170
Table 23: Univariate correlation between cytokine levels in whole blood after
Quantiferon‐Gold peptide stimulation and relative IgG avidity ....................................... 171
Table 24: Baseline characteristics and infection status for mice receiving ultra‐low dose
aerosol exposure ........................................................................................................................ 172
Table 25: Baseline characteristics of each exposure group in infection rate studies ........ 177
xvi
List of Figures
Figure 2: Early lung burden in C57BL/6 and BALB/c mice after standard dose aerosol
infection ........................................................................................................................................ 17
Figure 3: Gating scheme for flow cytometry analysis:........................................................... 31
Figure 4: Early lung CFU in C57BL/6 and BALB/c mice after retropharyngeal instillation
....................................................................................................................................................... 33
Figure 5: Pnemocyte populations in C57BL/6 and BALB/c lungs ........................................ 37
Figure 6: Reproducibility of human sera on different ELISA antigens. .............................. 47
Figure 7: Antibody responses to M. tuberculosis live cell surface or whole cell lysate ...... 53
Figure 8: Antibody responses to M. tuberculosis lipoarabinomannan, cell wall, and
secreted protein fractions ........................................................................................................... 54
Figure 9: Reactivity of human plasma to surface of environmental mycobacteria ........... 64
Figure 10: Optimization of biotin fixation to M. tuberculosis ................................................ 83
Figure 11: Gating scheme for dsRed isolation from peritoneal lavage ............................... 86
Figure 12: Gating scheme for infected cell flow cytometry analysis ................................... 89
Figure 13: Comparison of dsRed positive cells in infected vs. uninfected mice ................ 90
Figure 14: M. tuberculosis monoclonal antibodies are polyreactive ..................................... 97
Figure 15: BTM.4 decreases biotin‐coated M. tuberculosis survival in macrophages ......... 99
Figure 16: Surface‐binding but not control antibodies decrease bacterial survival in
macrophages in a concentration dependent manner ........................................................... 100
Figure 17: Surface‐binding, but not non‐surface‐binding antibodies decrease three hour
M. tuberculosis survival in murine macrophages .................................................................. 102
Figure 18: Pre‐incubation with BTN.4 does not decrease biotin coated M. tuberculosis
bacterial burden at three days post infection ........................................................................ 105
xvii
Figure 19: Surface‐binding antibodies decrease pulmonary bacterial load in mice ........ 107
Figure 20: Surface‐binding antibodies decrease bacterial burden at three, but not six,
days post retropharyngeal instillation ................................................................................... 109
Figure 21: Surface‐binding antibodies decrease pulmonary bacterial load three days after
infection with mammalian adapted bacteria ........................................................................ 111
Figure 22: Pre‐incubation of M. tuberculosis with surface‐binding antibodies prior to
retropharyngeal instillation decreases the number of infected cells by flow cytometry 113
Figure 23: Pre‐incubation of M. tuberculosis with surface‐binding antibodies prior to
retropharyngeal instillation decreases the number of infected cells by plate count ....... 114
Figure 24: Effect of surface‐binding antibodies on the type of infected cell after pre‐
mixing with M. tuberculosis infection prior to retropharyngeal instillation ..................... 118
Figure 25: Comparison of the number of infected neutrophils and recruited
macrophages between flow cytometry and plate counts .................................................... 120
Figure 26: Proportion of total cells in the lung after M. tuberculosis infection with and
without surface‐binding antibodies ....................................................................................... 122
Figure 27: retropharyngeal instillation of PBS does not alter the total lung profile within
twenty‐four hours post infection ............................................................................................ 123
Figure 28: Levels of antibody in BAL fluid within first twenty‐four hours after
retropharyngeal administration .............................................................................................. 142
Figure 29: Surface‐binding antibodies reduce pulmonary bacterial burden at 3 days post
infection in a concentration dependent manner. .................................................................. 143
Figure 30: Surface‐binding antibodies provide inconsistent protection at three days post
M. tuberculosis aerosol infection .............................................................................................. 145
Figure 31: The ability of surface‐binding antibodies to decrease pulmonary bacterial
burden wanes over time........................................................................................................... 147
Figure 32: Surface‐binding antibodies decrease bacterial burden at one day post infection
..................................................................................................................................................... 148
xviii
Figure 33: The effect of surface‐binding antibodies is FCγR independent ....................... 149
Figure 34: Pulmonary bacterial burden one month post ultra‐low dose aerosol infection
..................................................................................................................................................... 152
Figure 35: Reactivity of human plasma to protein lysates from M. tuberculosis and
environmental mycobacteria ................................................................................................... 163
xix
Acknowledgements
I want to thank the members of the Frothingham Lab for their invaluable
assistance with these studies: Richard Frothingham for his mentorship and guidance,
Sarah Seay for her assistance with animal work, Eva Click, for the development of the C‐
ELISA assay, Rose Asrican for keeping our lab running, and Ning Zhao, our talented
undergraduate, for antibody purification and a portion of the ELISA data presented in
Chapter 4. Aerobiology would not have been possible without the Aerobiology Core
Facility at the Duke Regional Biocontianment Lab (RBL), and the assistance of Divey
Saini, Chris Sample, and Jim Burch in delivering the aerosol exposures.
Outside of our lab I would like to thank our numerous collaborators. Jason Stout,
of the Department of Medicine, for his gift of human plasma from patients with latent
TB infection and active TB disease, Marc Frahm and Guido Ferrari for their cytokine
profiling data of these same patients, and the patients themselves for donating blood
samples for study. Ian Cumming of the DHVI flow core was invaluable for both his flow
cytometry expertise and assistance in running our samples, especially at BSL‐3.
Biomarker profiling was performed under the direction of Dr. Gregory D. Sempowski in
the Immunology Unit of the Duke RBL, with assistance from Kristina Riebe and Heather
Lynch. Monoclonal antibody generation was conducted with help from the Haynes Lab,
specifically Barton Haynes, Richard Scearce, Daria Pause and Bradley Lockwood. Wes
xx
Rountree provided invaluable statistics assistance. Karen Dobos at Colorado State
University, and Barton Haynes at Duke University provided the hybridoma cell lines for
anti‐M. tuberculosis antibodies, and isotype controls. Gifts of strains were made by
Sunhee Lee (Mycobacterium bovis Bacille‐Calmette‐Guerin Danish, Mycbacterum
tuberculosis H37Rv, and Mycobacterium fortuitum) and the Duke Clinical Microbiology
Lab (Mycobacterum avium). I would especially like to thank my ccommittee, of Jorn
Coers, Jen‐Tsan Ashely Chi, Micah Luftig and Gregory Taylor, for their assistance,
critical review, and support over the past four years.
Working at biosafety level 3 (BSL‐3), where the majority of these studies were
conducted, requires a team of people. Thank you to Scott Alderman and Jim Burch for
the BSL‐3 safety training and assistance. Also, thank you to Doug Elliot for constantly
fixing my autoclave (I swear it wasn’t my fault!), Rose Asrican and Ching‐ju Chen for
keeping the BSL‐3 facility running, and our security guards for the around the clock
monitoring.
This work was supported by NIH grants U54 AI057157 (Southeast Regional
Center of Excellence for Emerging Infections and Biodefense), P30 AI051445 (Duke
Center for Translational Research), and UC6 AI058607 (Regional Biocontainment
Laboratory at Duke), and by National Science Foundation Graduate Research
Fellowship 2011083676 (C.C.P.). Biomarker profiling was conducted by the Immunology
xxi
Unit of the Duke RBL, which received partial support for construction from the National
Institutes of Health, National Institute of Allergy and Infectious Diseases (UC6‐
AI058607). Mycobacterial antigen fractions from Colorado State University were
produced under NIH Contract HHSN266200400091C (Tuberculosis Vaccine Testing and
Research Materials) and distributed by the Biodefense and Emerging Infections Research
Resources Repository. Specimen collection and storage for the TB‐infected subjects was
supported by the Duke NIH grants N01 AI040082 and P30 AI064518 (Center for AIDS
Research)
1
1. Tuberculosis
1.1 Tuberculosis disease
1.1.1 Mycobacterium tuberculosis complex
Mycobacterium tuberculosis is one of the eight members of M. tuberculosis complex
(MBTC) [1]. All members of the complex share >99% nucleotide similarity, identical 16s
RNA sequences, replicate slowly in vitro and in vivo, and possess waxy outer coats of
mycolic acid which make them impervious to gram staining. Despite these similarities,
the members exhibit radically different host tropisms ranging from sea lions to banded
mongooses [2‐4]. M. tuberculosis is the primary cause of tuberculosis (TB) in humans.
Infection with Mycobacterium africanum and Mycobacterium canetti also cause human TB
disease, though these cases are primarily limited to Africa [5,6]. While other members of
the MBTC can infect humans, they contribute relatively little to disease burden.
Mycobacterium bovis and Mycobacterium caprae, account for only seven cases of TB per
one‐hundred thousand, while Mycobacterium microti and Mycobacterium pinnipedi have
resulted in only few documented cases of human infection world‐wide [7‐9].
1.1.2 Global disease burden
Tuberculosis is among the leading causes of death from infectious disease world‐
wide. Approximately one‐third of the global population is infected with the causative
agent, though 90‐95% of these infections are latent and will never progress to active TB
2
disease. 8.8 million cases of active disease and 1.4 million deaths occurred in 2011 [10].
TB most commonly manifests as a pulmonary infection, though it can also present as a
severe disseminated infection, known as miliary TB [11]. Other, far less frequent, sites of
disease include the joints, central nervous system, gastrointestinal tract, pleural space,
and lymph nodes [12‐16]. Effective antibiotic treatment for TB exists, though the course
of therapy requires multiple drugs and takes a minimum of six months to complete [17].
Failure of some patients to adhere to the course of therapy has led to the rise of multi‐
drug and extremely‐drug resistant strains of the bacteria, which further lengthen and
complicate treatment [18].
Though global in its distribution, TB disease burden is most heavily concentrated
in sub‐Saharan Africa, and southeast Asia [10]. While disease incidence is stable or
decreasing across most of the globe, it continues to rise in southern Africa, largely due to
high rates of human immunodeficiency virus (HIV) infection [19]. Of the numerous risk
factors for TB, including substance abuse, malnutrition, a weakened immune system,
and poor living and working conditions, HIV co‐infection is the most notable [20,21].
Individuals with HIV are twenty to thirty‐seven times more likely to contract and
develop active TB disease than their uninfected counterparts, and one‐hundred times
more likely to reactivate a latent infection [19,22].

3
1.1.3 Transmission and early infection events
Tuberculosis is an airborne infection, transmitted when an individual with
pulmonary disease coughs, aerosolizing bacteria. During aerosolization, droplet nuclei,
five micron particles that contain between one and three bacteria, are formed and
remain airborne for a few hours after generation [23]. The particle’s small size facilitates
its travel to the alveoli of the lungs where it infects and colonize mononuclear
phagocytes by preventing phagosomal maturation [24]. A single M. tuberculosis
bacterium is sufficient to cause infection [25,26].
The precise interactions between M. tuberculosis and its host cell, which lead to
productive infection, are not well known. The bacterium is believed to primarily infect
alveolar macrophages, dendritic cells (DCs), and neutrophils; however, the precise
identity of infected cells prior to fourteen days post infection is unknown [27]. M.
tuberculosis is able to interact with at least thirteen host receptors, with receptor
interactions helping to shape each bacterium’s intracellular environment [28,29]. Binding
to some, such as the mannose receptor, leads to impairment of the host cell’s bactericidal
response by blocking phagosomal maturation, suppressing radical species generation,
and damping pro‐inflammatory cytokine production [30,31]. In contrast, M. tuberculosis
binding to toll‐like receptor 2, or the FCγ receptor (FCγR), enhances cellular anti‐
mycobacterial responses through phagosomal maturation and acidification [32‐34].

4
Typically, after internalization of a bacterial pathogen, the nascent phagosome
rapidly acidifies and fuses with lysosomes, leading to bacterial killing. M. tuberculosis
modifies the protein composition of the phagosome surface, inhibiting this fusion
process by retaining Rab22a, a protein critical for the Rab5 to Rab7 conversion that leads
to lysosomal fusion [35,36]. Selective retention and exclusion of additional proteins
impairs the recruitment of inducible nitric oxide synthase (iNOS), lysosomal hydrolases
such as Cathepsin D, and the V‐type ATPase necessary for phagosomal acidification
[37‐39]. The resulting endosomal compartment remains at a close to neutral pH, and is
accessible to fusion with early endosomes, allowing for nutrient trafficking to the
bacterium, creating an environment highly conducive to bacterial replication [37,40‐42].
1.1.4 The onset of the adaptive immune response and progression to
active disease
By nine days post infection M. tuberculosis has migrated to the lymph nodes
inside of mononuclear phagocytes, presumably dendritic cells [27,43]. Once there, the
bacteria trigger the onset of the adaptive immune response by stimulating the
production of CD4+ specific T‐cells, which appear two to three days thereafter [44].
Fifteen to eighteen days post infection, antigen specific T‐cells arrive in the lungs [45].
The presence of these CD4+ T‐cells is correlated with the stabilization of pulmonary
bacillary burden in mice; however, the infection is too established to be eradicated [46].
CD4+ T‐cells produce three cytokines, interferon‐γ (IFN‐γ), tumor necrosis factor‐α
5
(TNF‐α), and interleukin 2 (IL‐2), the former two of which activate infected host cells, a
mechanism crucial for controlling M. tuberculosis infection. The loss of these cytokines in
mice, through germ‐line knock‐outs, or in humans, through somatic mutations or TNF‐α
blocking rheumatoid arthritis drugs, leads to enhanced disease severity and susceptibly
[47‐50].
In addition to secreting cytokines, CD4+ and CD8+ T‐cells, in conjunction with
uninfected macrophages, epitheloid cells, multinucleated giant cells, and B‐cells form
granulomas, walling off infected host cells [51]. These structures can drive bacteria into a
dormant state, triggering latent infection. In individuals susceptible to progression to
active disease, the interior of the granuloma becomes necrotic, causing tissue damage
and allowing bacteria access to the airways, facilitating their spread. The precise cellular
factors that lead to the formation of necrosis and progression to active disease are
unknown [52].
In patients with either active disease or latent infection, the immune response
generated is insufficient to protect from concurrent infection with multiple strains, or
exogenous re‐infection after curative treatment [53,54]. The generation of protective
vaccines, therefore, must simulate immune responses that are not triggered during
natural infection.

6
1.2 Vaccines
1.2.1 M. bovis Bacille Calmette‐Guérin (BCG) vaccine
M. bovis Bacille Calmette‐Guerin (BCG) was developed in the early 20th century
by serially passaging on glycerine‐bile agar [55]. Since its initial tests in humans in 1921,
over four billion doses of the vaccine have been given [56]. BCG is highly efficacious
against miliary TB; however, its efficacy against the pulmonary form of the disease is
variable, ranging from 0‐80% in numerous studies [57,58]. While the variability has been
attributed to numerous causes including environmental mycobacterial exposure,
different strains and growth conditions of the vaccine, poor cold chain management, and
concurrent helminth infection, the true cause is most likely a combination of these and
additional factors [59‐62].
Aside from incomplete protection, BCG has additional limitations. As a live‐
attenuated bacterial vaccine, it cannot be given to HIV+ individuals, a critical flaw given
the high degree of geographic co‐localization of the two infections [63]. Additionally,
protection wanes over time, with re‐vaccination of adolescents and adults affording little
increased effectivity [64,65]. Lastly, the BCG vaccine interferes with the tuberculin skin
test, the easiest and most widely used TB diagnostic test, triggering a positive result in
uninfected individuals within eight to twelve weeks of vaccination [66].
7
1.2.2 Vaccines in clinical trials
As of 2014, twelve novel vaccines have undergone Phase I or Phase II clinical
trials (Table 1) [67]. All but two are designed to boost prior BCG vaccinations. In
countries childhood mortality is high, BCG is given at birth and displays protection from
miliary TB, the most severe childhood form of the disease, and a non‐specific beneficial
effect on childhood survival [58] . Building off BCG harness these protections and
sidesteps the ethical issues of withholding a potentially beneficial vaccine to conduct
clinical trial with a placebo arm [67‐69].
The eight vaccines that function as the boost component of BCG prime‐boost
regimens primarily use two strategies: recombinant viral vectors or adjuvanted fusion
proteins [68,70]. Both strategies seek to augment BCG by improving CD4+/CD8+ T‐cells
responses to immunodominant antigens that are either present in M. tuberculosis but not
the BCG, or are highly expressed by bacteria during latent infection. Ultimately, these
vaccines aim to better control latent infections and prevent the progression to active
disease (Table 1).The two vaccines designed to replace BCG work in a similar manner.
Both MTBVAC and VMP1002 enhance T‐Cell responses, either through induction of M.
tuberculosis specific CD4+/CD8+ T‐cells, or by increasing antigen‐specific central memory
T‐cells [71,72].
8
Two vaccines are currently in clinical trials as post‐exposure therapeutics.
Mycobacterium vaccae is a rapid growing, non‐pathogenic, soil‐dwelling saprophyte [73].
Randomized controlled clinical trials have demonstrated variable efficacy of heat‐killed
M. vaccae preparations in treating active TB when administered after M. tuberculosis
infection. While some studies demonstrate decreased time to sputum conversion and
improved chest radiographic findings, especially in individuals with multidrug resistant
TB, others have shown no benefit [74‐77]. RUTI is a therapeutic vaccine comprised M.
tuberculosis, grown under conditions of progressive starvation and stress, prior to
fragmentation [78]. Designed to augment short‐term chemotherapy in latently infected
individuals, it has a promising safety profile in both HIV‐ and HIV+ individuals [79].
9
Table 1: M. tuberculosis vaccines in clinical trials
Vaccine Form Route Composition Mechanism Phase Clinical Trial
Results
Vaccines designed to boost BCG
Ad5Ag85A
[80]
Viral vector
boost
Intranasal Recombinant
adenovirus 5 carrying
Ag85A
Induction of Ag85A
specific CD4+ and
CD8+ T‐cells in
airway
Phase
1
Phase 1 trial halted
for unknown
reason.
Aeras‐402
[81,82]
Viral vector
boost
Intramuscular Recombinant
adenovirus 35 carrying
TB fusion protein
Induction of
polyfunctional
CD4+ and CD8+ T‐
cells
Phase
2
Safe, immunogenic
in infants. Efficacy
trials ongoing.
Aeras‐404
[83]
Protein‐
adjuvant boost
Intradermal Ag85B‐TB10.4 fusion
protein with IC31
adjuvant
Induction of
polyfunctional
CD4+ T‐cells
Phase
2
Safe in humans,
recruiting for
immunogenicity
and efficacy trials.
H1/IC31
[84,85]
Protein‐
adjuvant boost
Intramuscular ESAT6‐Ag85B fusion
protein with IC31
adjuvant
Induction of
polyfunctional
CD4+ T‐cells
Phase
2
Safe, immunogenic
in immunodeficient
adults.
H56/IC31
[86]
Protein‐
adjuvant boost
Intramuscular Ag85B‐ESAT6‐RV2660c
fusion protein with IC31
adjuvant
Induction of
polyfunctional
CD4+ T‐cells
preventing latent
reactivation
Phase
1/2a
Human safety and
immunogenicity
trials ongoing.
ID93/GLA‐
SE
[87]
Protein‐
adjuvant boost
Intramuscular 4 TB protein fusion with
GLA‐SE adjuvant
Induction of
polyfunctional
CD4+ T‐cells
Phase
1
Human safety trials
ongoing.

10
M72/AS01E
[88,89]
Protein‐
adjuvant boost
Intramuscular M. tuberculosis39a‐M.
tuberculosis32a fusion
protein with AS01E
adjuvant
Indunction of
polyfunctional
CD4+ T‐cells
Phase
2a
Safe, immunogenic
in PPD+ and PPD‐
humans.
MVA85A
[90,91]
Viral vector
boost
Intradermal Modified Vaccinia virus
carrying Ag85A
Induction of
polyfunctional
CD4+ T‐cells and
CD8+ T‐cells
Phase
2b
Safe, immunogenic
but not protective in
infants.
Vaccines designed to replace BCG
MTBVAC
[72]
Attenuated M.
tuberculosis
Intradermal M. tuberculosis with
deletions in PhoP and
fadD26 genes
Increased antigen
specific central
memory T‐cells
Phase
1
Human safety trials
ongoing
VPM1002
[71]
Recombinant
BCG
Intradermal Urease C deficient BCG
expressing listeriolysin
Stronger CD4+,
CD8+ and type‐1
cytokine responses
Phase
2
Safe, immunogenic
in adult humans.
Studies in infants
pending.
Therapeutic vaccines
M. vaccae
[92]
Attenuated
mycobacteria
Intradermal Heat‐killed M. vaccae Unknown Phase
3
Safe, immunogenic,
conflicting reports
on efficacy
RUTI
[79]
M. tuberculosis
fragments
Subcutaneous Detoxified M. tuberculosis
liposomal fragments
Induces combined
TH1/TH2/TH3
response
Phase
2
Safe and
immunogenic in
HIV‐ and HIV+
adults with LTBI

11
1.2.3 Tuberculosis vaccines that induce sterilizing immunity
The severity of the HIV/TB co‐infection epidemic has led to increased interest in
developing a TB vaccine that protects individuals from infection by inducing sterilizing
immunity. Current vaccines and vaccine candidates rely on sustained T‐Cell driven
immune responses to prevent latent TB infections from progressing to active TB disease.
The weakening of T‐Cell immunity in HIV+ individuals therefore diminishes vaccine‐
mediated protection leaving a population already at increased risk of primary
progressive and reactivation TB disease doubly vulnerable [56]. Only two TB vaccines,
BCG and MVA85A have been evaluated for their ability to prevent M. tuberculosis
infection, rather than TB disease. Neither vaccine excels in this area; a meta‐analysis of
fourteen studies demonstrated a 19% decrease in TB infection among children
vaccinated with BCG, while MVA85A vaccinated children possessed a similar infection
rate as BCG vaccinated children in a recent Phase IIb efficacy trial [90,93].
Five childhood vaccines are against bacterial pathogens, and all lead to
sterilizing immunity. Two, those against Haemophilus influenzae type b and Pneumoccocus
sp. act by preventing colonization or invasive infection by the causative microbe [94,95].
In both cases high‐titer, high‐avidity antibodies to the capsule correlate with protection
from disease [96‐98]. Of the other three vaccines, those against Corynebacterium diphtheria
and Clostridium tetani, work through antibody‐mediated toxin neutralization, and the
protective mechanism for the Bordetella pertussis vaccine remains unclear [99‐101].

12
M. tuberculosis is very different from the causative bacteria of the vaccine‐
preventable infections mentioned above. It lacks both a polysaccharide capsule, as well
as secreted toxins. However, it is hypothesized that anti‐M. tuberculosis antibodies could
function in two ways that lead to eradication, rather than control of the infection. First,
antibodies that block uptake by phagocytes could leave bacteria vulnerable to
pulmonary clearance mechanisms or to extracellular killing by myeloperoxidase or a
combination of secreted perforin and granulysin [56,102‐105]. Second, antibody‐
mediated uptake of M. tuberculosis results in enhance phagosome‐lysosome fusion, Ca2+
signaling, and reactive oxygen species generation, all of which impair mycobacterial
survival [34,106‐108]. Antibodies that shunt M. tuberculosis away from receptors that
favor bacterial subjugation of the lysosomal degredation pathway, to FCγRs, could
prevent bacterial infection. Similar strategies have been employed against other
intracellular pathogens including Toxoplasma gondii, B. pertussis, and Salmonella enterica.
In each case, antibodies, which direct bacteria away from complement receptors and
trigger uptake by FCγRs, result in decreased survival by impairing the pathogen’s
ability to alter its vacuolar environment [109‐112].
Induction of M. tuberculosis specific antibodies by vaccines has not attracted
much study. Serum IgG responses have been examined for eight of the twelve vaccines
in clinical trials; however, monitoring of the humoral immune response has been
conducted to either serve as a marker of immune induction, or to help determine the

13
TH1/TH2 polarization of the response [78,87‐89,113‐119]. Correlation between IgG titers
and disease outcome, or functional studies of the antibodies generated, have not been
undertaken.
1.3 Animal models of tuberculosis
1.3.1 Murine model of active TB disease
As human infection with M. tuberculosis is primarily a respiratory disease,
aerosol infection of experimental animals is the most physiologically relevant route of
exposure. In the laboratory setting, nebulizers generating high titer M. tuberculosis
aerosols are used to expose animals. This generation process is harsh, decreasing the
viability of numerous bacterial species, including M. tuberculosis, leading to aerosols
containing a mixture of live and dead bacteria [120‐123]. The murine standard dose
model, the most commonly used animal models of TB disease, provides a uniform,
reproducible infection of between 50‐400 culture forming units (CFU) [124‐126].
Two other commonly used murine models of M. tuberculosis infection exist.
Intravenous instillation of bacteria leads to more rapid colonization of the liver and
spleen than the aerosol model, as the bacteria are systemic and do not need to
disseminate from the lung [127]. Additionally, adaptive immune responses begin
quicker and in the spleen, rather than the lymph node, leading to greater control of the
bacteria and less severe disease [128]. The retropharyngeal model instills M. tuberculosis
into the space above the trachea in a small volume of liquid. While more physiologically

14
relevant than the intravenous route of exposure, the fluid has the ability to wash out
soluble lung factors and is less reproducible in both delivery and lung distribution than
the aerosol model [129,130]. Despite their limitations there are two critical benefits to
each model: both allow for infection with higher dose innocula than the aerosol model,
as well as the pre‐mixing of M. tuberculosis with antibodies or other biomolecules prior
to instillation.
No matter the route of exposure, the use of mice as an experimental animal has
many benefits. Inbred strains are genetically uniform and inexpensive [124]. Knock‐out,
knock‐in, and immunodeficient mouse strains allow for the probing of specific
components of the immune response to M. tuberculosis, and have been critical for
demonstrating the importance of CD4+ T‐cells, TNF‐α and IFN‐γ in controlling infection
[49,50,131]. Despite its many advantages, the murine model does not completely reflect
the spectrum of human M. tuberculosis infection. Mice do not develop the full range of
granulomas, forming only non‐necrotic lesions unless manipulated through the loss of
cytokines or injections of microbial products [50,125,132]. Murine infection also leads to
disseminated active disease, not the pulmonary form primarily seen in
immunocompetent adult humans [44]. Lastly, no true latent M. tuberculosis infection
model exists in mice. Current latency models require antibiotic treatment regimens that
lead to persistent, but unculturable bacteria, “reactivating” months after the cessation of
antibiotic treatment or upon administration of immunosuppressives [133,134].

15
1.3.2 The ultra‐low dose murine infection model
Studies in humans and in animal models have examined numerous factors that
influence M. tuberculosis disease progression; however it is not known if these factors can
influence infection rate [102,135‐137]. The standard‐dose aerosol model is an incredibly
valuable research tool, as all mice are infected at a relatively uniform dose. However, it
does not represent how M. tuberculosis spreads in the environment. There, individuals
are exposed to low aerosol concentrations of bacteria, leading to a range of infection
rates depending on numerous factors including race, proximity to the index case, and
the duration of exposure [138,139]. To better study factors affecting infection, a model
was developed in which mice are exposed to ~1‐2 M. tuberculosis bacterium and not all
mice become infected [25].
Using this ultra‐low dose aerosol model both the impact of BCG vaccination and
genetics on murine infection rate have been examined [130]. Regardless of strain
background, BCG vaccination did not impact infection rate, though it did decrease
bacterial lung burden at one month post infection. While differences in infection rate
between BCG and sham vaccinated mice were not found, infection rate differences were
seen between the C57BL/6 and BALB/c strains (Table 2 from [130]).
16
Table 2: Infection rates after ultra‐low dose exposure to M. tuberculosis
Infected/
Total
Percent
Infected
Unadjusted
Odds Ratio
(95% CI)
P‐
value*
Adjusted
Odds Ratio
(95% CI)
P‐
value
Experimental Groups
C57Bl/6J – PBS 14/36 38.9% 0.014
C57Bl/6J – BCG 15/36 41.7%
BALB/c – PBS 25/36 69.4%
BALB/c – BCG 21/35 60.0%
Mouse Strain
C57Bl/6J 29/72 40.3%
BALB/c 46/71 64.8% 2.73
(1.39, 5.37)
0.004 4.07
(1.49‐11.08)
0.006
Vaccine Status
Naïve 39/72 54.2%
Vaccinated 36/71 50.7% 0.87
(0.45, 1.68)
0.740 0.88
(0.45, 1.72)
0.699
Total 75/143 52.5%
*P‐values and unadjusted odds ratios were calculated using Fisher’s exact test, for
pairwise comparison, and the Chi‐squared test for multiple comparisons.
The main limitation of the ultra‐low dose infection model is that it requires large
numbers of mice to provide enough statistical power to detect a 20% difference between
the partially infected groups. Work comparing the ultra‐low dose and standard dose
model suggests that early lung burden can act as a surrogate marker for infection.
C57BL/6 mice, which have a lower infection rate compared with BALB/c mice, also have
consistently lower lung burdens at two hours, one, and two days post infection (Figure
1, from [130]). The ability to use early lung burden as a proxy for infection rate allows
for smaller group sizes and therefore the ability to screen numerous genotypes or
vaccines for the ability to alter early infection events.

17
Figure 1: Early lung burden in C57BL/6 and BALB/c mice after standard dose
aerosol infection
Naïve C57BL/6 (open red circles) and BALB/c (open blue square) mice were
simultaneously infected with a standard dose aerosol of M. tuberculosis H37Rv and were
sacrificed at two hours (day 0), day one through four, and day twenty‐eight post
infection. Two‐sided p‐values were calculated by Mann‐Whitney test: (*) p ≤ 0.05, (**) p
≤ 0.01, (***) p ≤ 0.001.
1.3.3 Alternative animal models
While no existing animal model perfectly recapitulates the spectrum of M.
tuberculosis infection in humans, mice are the animal model of choice due to the wide
range of immunological reagents, small size, and low cost [124]. Three other animal
models are used to study latent TB infection and active TB disease; however, unique
limitations of each model prevent more wide‐spread use.
The low‐dose aerosol guinea pig infection model is most commonly used to
evaluate novel vaccines and therapeutic regimens prior to testing in non‐human
primates [124]. The pulmonary physiology and inflammatory response of guinea pigs is
more similar to humans than mice, and after infection, guinea pigs display granulomas

18
with caseous necrotic cores, and haematogenous spread of the bacteria [140].
Additionally, the susceptibility of guinea pigs to low quantities of M. tuberculosis allows
for a better recapitulation of the human exposure environment [141]. Despite these
advantages, this experimental animal is not as widely used as the mouse due to a dearth
of immunologic reagents for evaluating cytokines and cell phenotypes, and the extreme
susceptibility of the animal to disease [124].
The initial studies on the genetic basis of M. tuberculosis susceptibility were
conducted in rabbits in the 1930s and 1940s. After exposure to M. bovis resistant rabbits
displayed a progression of pulmonary disease similar to immunocompetent adult
humans, while susceptible rabbits displayed a disseminated phenotype similar to
miliary disease [142‐144]. No other animal model displays this range of phenotypes
without inducing germline mutations that impair the host immune response.
Additionally, resistant rabbits progress to cavitary disease unlike mice and guinea pigs
[140]. Despite the similarities with human disease, the paucity of immunologic reagents,
the lack of inbred rabbit strains, special housing requirements, higher cost, and the need
to use M. bovis rather than M. tuberculosis make the rabbit model less widely used [124].
Initially used solely to evaluate vaccines and therapeutics prior to human testing,
recent advances in reagents have allowed for broader characterization of the non‐human
primate response to M. tuberculosis. After low dose aerosol exposure, macaques produce
the full spectrum of human granulomas, from non‐necrotic lesions, to those with

19
caseous necrotic cores, and rarely, cavitary, fibrotic or calcified lesions [145]. Non‐
human primates are also the only natural model of latent infection with, low‐dose
exposure triggering a mix of primary progressive and latent disease [146]. Though the
non‐human primate model is the most similar to human disease, the challenges of
animal availability, the high cost, and the housing and care of non‐human primates in
BSL‐3, have limited the use of this model [124].
1.4 Antibodies and tuberculosis
1.4.1 Serum therapy as treatment for tuberculosis
In the pre‐antibiotic era administration of immune sera, typically derived from
animals, was the primary means of treatment for numerous infectious diseases including
diphtheria, pneumonia, H. influenza meningitis, erysipelas, whooping cough, dysentery,
measles and pre‐paralytic poliomyelitis, though its efficacy varied [147]. Beginning in
the late 1800s a small number of attempts were made to find similar immune sera that
could be used to treat M. tuberculosis. Various animal species ranging from cows to fowl
were infected with live or attenuated M. tuberculosis, or vaccinated with mycobacterial
preparations. Serum from these animals was then administered to laboratory animals or
humans, through various routes and for non‐standard amounts of time [148]. Even with
the limitations in study design, inexact treatment regimens and lack of controls, two
overarching principles were observed: one, that long treatment durations were

20
necessary to see any effect, and two, that the sera worked best on localized cases that
began treatment early in disease [148].
Believing antibodies to be the critical component of serum preparations, in the
1920s Calmette systematically analyzed antibody content in numerous batches of
clinically used immune sera. Antibody levels ranged widely between sera types, as well
as between individual batches of sera. [149]. These differences are not surprising, as
variations in antigen and vaccination regimes have since been shown to lead to varying
levels of vaccine‐induced antibodies [150‐152]. The inconsistent antibody levels within
serial preparations of a particular serum may explain the varying and sometimes
contradictory results of both human and animal trials.
The failure of these studies, despite the fact that they were poorly controlled,
possibly caused animal to human transmission of M. tuberculosis, and lacked
reproducible sera preparations, lead to the belief that antibodies did not play a role in
protection from or treatment of M. tuberculosis. Recently, however, there has been
renewed interest in serum therapy to treat TB disease. Transfer of sera from infected
mice has been shown to decrease post‐chemotherapy relapse in immunocompromised
mice, and high dose human intravenous immunoglobulin (IVIG) can decrease
pulmonary bacterial burden in mice two months post administration [153‐155].
21
1.4.2 Antibodies as a principal component of diagnostic testing and as a
biomarker for disease progression
Well established methods for diagnosing latent TB infection and TB disease exist.
The tuberculin skin test, using purified‐protein derivative (PPD), the IFN‐γ release
assay, and sputum smear microscopy/culture are the most common. These methods all
have limitations, primarily interference from BCG vaccination or immunodeficiency, or
difficulty of execution in resource poor settings [156]. In order to reach the United
Nation’s millennial goals for a world‐wide reduction of TB cases, new diagnostic
methods are needed [157].
In the last decade there has been a proliferation of studies evaluating the
potential of antibodies to serve as a component of diagnostic tests. These studies have
elucidated two hallmarks of the human antibody response to M. tuberculosis, both of
which lead to difficulties for the development of serologic testing. HIV seropositivity,
infecting strain serotype, and differing disease manifestations all produce antibody
profiles that differ in titer, subtype and antigens recognized [158‐164]. Additionally,
bacillary burden correlates with peak antibody titer making smear negative TB and
latent infection difficult to detect [161,165,166].
Second, cross reactivity of antibodies against environmental mycobacteria lead to
detectable anti‐tuberculosis antibodies in uninfected controls [167,168] . Even when
using multiplex panels, and focusing on IgG rather than IgM or IgA antibodies, there is
a prohibitively large amount of overlap between uninfected controls and patients with

22
active TB disease. [159,169‐176]. While commercial tests have been tried, their
performance in the field remains inferior to sputum smear microscopy and sputum
culture [176‐181]. Based on the body of evidence, the World Health Organization
currently recommends against the use of serodiagnostic testing, citing higher costs,
fewer disability adjusted years of life, and a higher false positive rate in regions where it
is used [179,182,183] .
Research into use of serum diagnostics has elucidated the lack of a “golden
antigen”, one that triggers high‐titer, high avidity antibodies in infected, but not
uninfected controls [161]. The absence of “golden antibodies”, led to further
discouragement about the ability of antibodies to prevent M. tuberculosis infection or
alter disease progression. However, protective antibodies to a wide range of intracellular
and extracellular pathogens including C. tetani and Listeria monocytogenes have been
identified in laboratories, despite not being produced during natural infection [184‐187] .
1.4.3 Antibodies alter disease course in mice
Both M. tuberculosis specific IgA and IgG antibodies have shown protective
effects when passively administered around the time of infection. Two different anti‐
Hsp‐X IgA monoclonal antibodies have been developed. TBA61 decreases pulmonary
bacterial burden in mice if administered either before or after infection [188,189].The
same antibody, when administered with recombinant IFN‐γ and anti‐IL‐10 antibodies
decreases post chemotherapy relapse [190]. 2E9 is a human antibody, selected from a
23
phage library, that, when administered with IFN‐γ two hours prior to infection, has
been shown to decrease pulmonary bacillary burden, in CD89 transgenic mice, one
month post treatment [191].
IgG antibodies against numerous M. tuberculosis targets have been generated as
well. When administered prior to, or at the time of, exposure M. tuberculosis specific IgG
antibodies confer a survival advantage, decrease bacterial burden and reduce
pulmonary pathology [188,192‐194]. One antibody, against HBHA, works through a
different mechanism, drastically decreasing dissemination from the lung rather than
altering pulmonary burden [195].
The precise mechanism through which these monoclonal antibodies work is not
yet known. Antibody‐mediated agglutination can lead to either non‐opsonic clearance
or killing of the bacteria; however, as protection persists when monoclonal antibodies
are administered prior to M. tuberculosis infection, this mechanism appears unlikely
[188,189,194,196,197]. Broadly neutralizing antibodies impair the ability of a pathogen to
interact with host cell receptors, preventing infection in an FCγR independent manner,
while antibody opsonization leads to FCγR mediated uptake, and ultimately killing for a
wide range of pathogens [109,110,112,198,199]. Published studies suggest there is no
overarching mechanism of action for anti‐M. tuberculosis monoclonal antibodies: F(ab)’2
fragments of SMITB14 mediate protection in a FCγR indepdent manner, while murine
expression of human CD89 is necessary for 2E9 mediated protection [191,194]. Antibody
24
target, isotype, and infection route may all influence the mechanism of action for
protective antibodies.
1.4.4 Disease progression in mice lacking components of the humoral
immune response
In addition to the use of monoclonal antibodies, numerous laboratories have
studied the impact of the humoral immune response on M. tuberculosis infection through
knock‐out mice. There is contradictory evidence that mice lacking B‐cells, a key
component of humoral immunity have greater susceptibility to M. tuberculosis infection.
Two types of b‐cell knock out mice were used in these studies: both IgH 6‐/‐ and μMT
mice have a germline deletion of IGHM, the heavy chain variable region, leading to a
lack of mature B‐cells. While two studies demonstrate that B‐cell knockout mice have
decreased pulmonary pathology, decreased bacterial burden and elevated TH2 cytokine
levels post M. tuberculosis exposure, another demonstrated enhanced pulmonary
pathology and dissemination [200‐202]. Additionally, B‐cell knock‐out mice showed
similar pulmonary responses to wild‐type mice after aerogenic rechallenge [203].
Though B‐cell knock out mice have impaired humoral immunity, B‐cells are capable of
antibody independent modulation of the immune system. Through cytokine secretion
B‐cells modulate the local environment around granulomas in infected animals, further
shaping the host’s response, and complicating the interpretation of results from B‐cell
knockout mice [204‐206].

25
Studies have also examined the pathology of TB disease in mice lacking various
antibody subclasses, transporters, and receptor components. In a pair of studies wild‐
type, IgA‐/‐ and IgR‐/‐ mice were intransasally vaccinated with M. tuberculosis
lipoprotein PstS‐1 conjugated to cholera toxin. IgA was produced in wild‐type and
IgR‐/‐ mice (though its localization to mucosal surfaces was impaired in the later) and
was not produced in IgA‐/‐ mice. In both cases, knockout mice had higher pulmonary
bacterial burden at one and four weeks post infection, as well as altered pro‐
inflammatory cytokine profiles in their lungs [207,208]. In 2007 Maglione et al, also
examined the effect the loss of Fc‐receptors have on disease progression. Mice lacking
FcγRIIB, the inhibitory antibody receptor, had decreased bacterial load in the lung and
spleen, enhanced IFN‐γ and IL‐12p40 production and reduced immunopathology one
month post infection. Contrastingly, mice lacking the FCγ chain display increased
bacterial load, enhanced IL‐10 producton, and decreased survival [33]. As with B‐cell
deficient mice, the ability of the antibody receptors themselves to alter the local lung
environment, through cytokine production, makes interpretation of these results
difficult in the context of antibody‐mediated effects.

26
2. Differences in baseline lung characteristics of BALB/c and C57BL/6J may influence differences in infection rate
2.1 Introduction
Previous work in our laboratory has focused on infection rate differences
between C57BL/6 and BALB/c mice. In these studies, C57BL/6 mice possessed both a
decreased infection rate, and decreased pulmonary bacterial burden within the first
three days post infection (Figure 1, Table 2). We hypothesized that this phenotype was
due to differences in the pulmonary environment at the time of infection. To probe this,
we have compared the baseline cytokine/chemokine profiles and pneumocyte
populations in naïve mice. BALB/c mice have higher levels of chemokines in the lung
tissue and BAL fluid than C57BL/6 mice. Though past research has shown differences in
TH1/TH2 polarization between the strains in response to infection, no differences in
baseline systemic TH1 or TH2 cytokine levels were observed [209,210]. Additionally,
pneumocyte populations differ between the strains, with C57BL/6 mice possessing 2.5
times the number of myeloid dendritic cells, than BALB/c mice.
Recently, there has been increased interest in vaccines which induce sterilizing
immunity, a process most likely achieved by preventing the early stages of M.
tuberculosis infection [211]. In order to design vaccines which induce sterilizing
immunity, we need to understand factors that can influence the initial infection event.
Studies in humans and animal models of M. tuberculosis infection have examined factors
that influence M. tuberculosis disease progression; however it is not known if these

27
factors influence infection rate [102,135‐137]. By comparing the pulmonary environment
in two mouse strains, with different infection rates, we can better understand factors
that influence the initial interactions between M. tuberculosis and its host.
2.2 Methods
2.2.1 Animals
The animals in this study were handled under a protocol approved by the Duke
Institutional Animal Care and Use Committee. C57BL/6 (027) and BALB/c (028) from
Charles River Laboratories were house in the Duke RBL for at least one week prior to
aerosol exposure. The animal rooms are environmentally controlled at 21oC, 50% relative
humidity and a twelve‐hour light/dark cycle.
2.2.2 Retropharyngeal M. tuberculosis infection
M. tuberculosis H37Rv was grown to log phase in 7H9 liquid media (BD
Bioscience, 271310) supplemented with Oleic Albumin Dextrose Catalase (OADC)
growth supplement (BD Biosciences, 212351), 0.5% glycerol (Sigma, 5516), and 0.05%
tyloxapol (Sigma, T8761). Cultures were washed twice in phosphate buffered saline with
0.05% tyloxapol (PBS‐Ty) and resuspended to a final optical density (OD) of 0.002. Six
week old female C57BL/6 and BALB/c mice were instilled with 50μL of innocula
retropharyngeally either two or twenty‐four hours prior to sacrifice.

28
2.2.3 Bacterial CFU determinations
Mice were sacrificed at either two hours or one day post retropharyngeal
exposure. Murine lungs were manually homogenized in PBS‐Ty and plated on in‐house
made 7H10 agar plates. Sterility of homogenates was ascertained by plating on
Chocolate II agar with hemoglobin and IsoVitalex (BD Biosciences, 221169). CFU were
counted after three to four weeks incubation at 37oC.
2.2.4 Sample collection and processing for Luminex multiplex assay
Six week old C57BL/6 and BALB/c mice were sacrificed by isofluorane overdose
and terminally bled from the submandibular vein. Mice were then perfused with
endotoxin free PBS. To collect bronchoalveolar (BAL) fluid, 750 μL of PBS was pushed
into the lungs through a nineteen gauge‐needle inserted into the trachea. Fluid was then
drawn out and saved for analysis. Lastly, the lung was dissected and flash frozen in an
ethanol‐dry ice bath.
After flash freezing, lungs were weighed and a volume ice cold PBS was added,
prior to bead beating, so that the final concentration of the homogenate would be 20
mg/mL. Sera was isolated from blood clotted at room temperature by centrifugation at
200g for 15 minutes.
2.2.5 Luminex multiplex cytokine assay
Sera, BAL, and tissue homogenate from both C57BL/6 and BALB/c mice were
assayed on a mouse chemokine/cytokine magnetic bead panel (Millipore, MCYTMAG‐

29
70K‐PX32) according to manufacturer’s instruction. A BioPlex 200 system running
BioPlex Manager v.6.1 was used for acquisition and analysis. Using standard curves the
assay reports the following cytokine/chemokine concentrations in pg/mL: IFN‐γ, IL‐1α,
IL‐1β, IL‐2, IL‐3, IL‐4, IL‐5, IL‐6, IL‐7, IL‐9, IL‐10, IL‐12 (p40),IL‐12 (p70), IL‐13, IL‐15, IL‐
17, IP‐10, KC, leukemia inhibitory factor (LIF), LIX, monocyte chemoattractant protein
(MCP‐1), macrophage colony stimulating factor (M‐CSF), monokine induced by γ‐
interferon (MIG), macrophage inflammatory protein (MIP‐1α), MIP‐1β, MIP‐2, RANTES,
TNF‐α, vascular endothelial growth factor (VEGF), Eotaxin, granulocyte colony
stimulating factor (G‐CSF), and granulocyte macrophage stimulating factor (GM‐CSF).
The limit of detection is defined as the minimum value on the standard curve for each
cytokine. Samples whose values fell below the minimum on the standard curve are
listed at the limit of detection.
2.2.6 Single cell suspension of mouse lung
Following isofluorane overdose, lungs from eight week old C57BL/6 and BALB/c
mice were minced into a single cell suspension in R10 media (RPMI 1610 (Gibco, 11875‐
093), 10% Fetal bovine sera (FBS)(Gibco, 16000), 1% L‐glutamine (Gibco, 25030), and
0.01M HEPES (Gibco, 153600)) containing 50 μg/mL elastase (Sigma, E1250), 0.02 mg/mL
DNAse (Sigma, D4257), 0.5 μg/mL collagenase (Worthington Biochemical, CLS‐1) and 1
μg/mL streptomycin (Sigma, S6501) as previously described [212]. After vortexing the
suspension was incubated at 37oC for 30 minutes, washed in antibiotic‐free R10 media,
30
and passed through a 70 μm cell strainer. The sample was then spun at 450g to pellet,
resuspended in 1x ACK red blood cell lysis buffer (0.155M NH4Cl2, 10mM KHCO3, 1mM
EDTA∙2Na) and washed a final time. The resultant single cell suspension was then
stained for flow cytometry.
2.2.7 Cell staining and flow cytometry
Primary pneumocytes were blocked with 2.4G2, an anti‐CD16/CD32 antibody
(BD Biosciences, 553131), for 15 minutes at room temperature. Pneumocytes were then
stained with the following directly conjugated antibodies for analysis: CD11b Pac Blue
(Biolegend, 101224), CD11c APC‐Cy7 (BD Biosciences, 561241), GR‐1 Alexafluor 700
(AF700) (Biolegend, 108422), and Live/Dead fixable yellow (Invitrogen, L‐34967). All
antibodies were titrated on either RAW264.7 cells or primary pneumocytes prior to use.
APC counting beads (BD Biosciences 3404871) were added to each tube to serve as a
counting standard. Live cells were phenotyped using a FACSAria II SORP with
FACSDiva™ 8.0 (BDIS, San Jose CA).
2.2.8 Flow cytometry gating
The gating scheme for flow cytometry analysis is shown in (Figure 2).
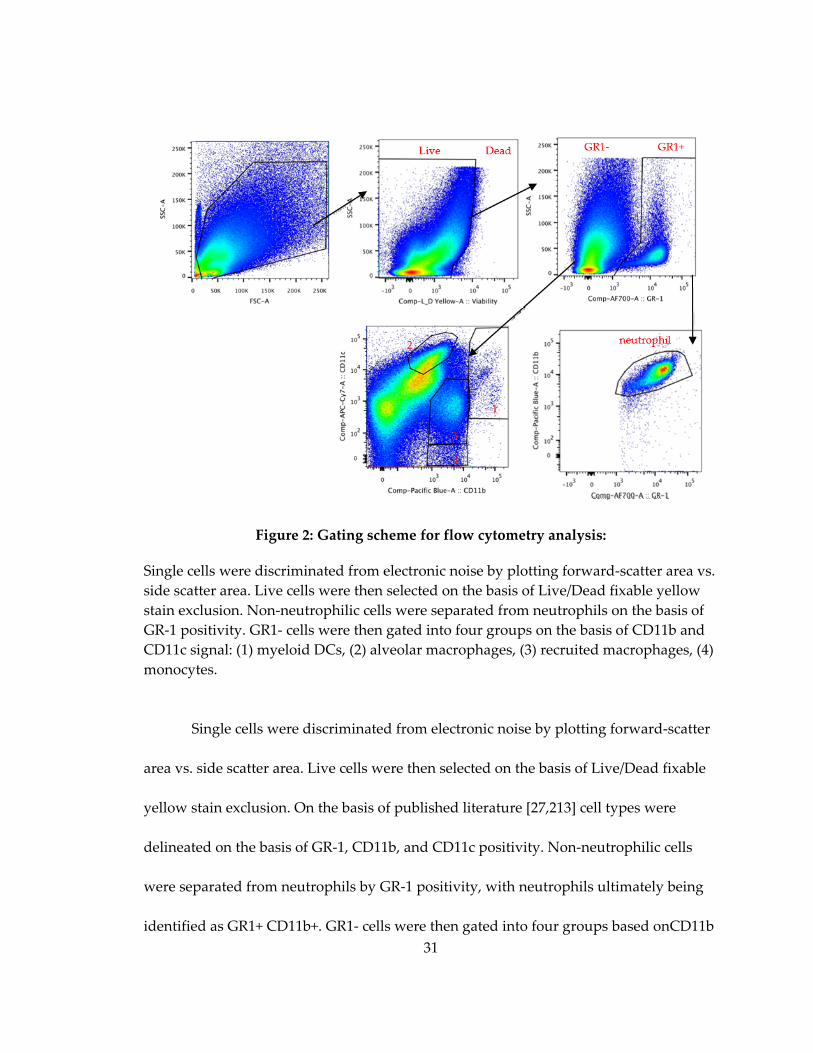
31
Figure 2: Gating scheme for flow cytometry analysis:
Single cells were discriminated from electronic noise by plotting forward‐scatter area vs.
side scatter area. Live cells were then selected on the basis of Live/Dead fixable yellow
stain exclusion. Non‐neutrophilic cells were separated from neutrophils on the basis of
GR‐1 positivity. GR1‐ cells were then gated into four groups on the basis of CD11b and
CD11c signal: (1) myeloid DCs, (2) alveolar macrophages, (3) recruited macrophages, (4)
monocytes.
Single cells were discriminated from electronic noise by plotting forward‐scatter
area vs. side scatter area. Live cells were then selected on the basis of Live/Dead fixable
yellow stain exclusion. On the basis of published literature [27,213] cell types were
delineated on the basis of GR‐1, CD11b, and CD11c positivity. Non‐neutrophilic cells
were separated from neutrophils by GR‐1 positivity, with neutrophils ultimately being
identified as GR1+ CD11b+. GR1‐ cells were then gated into four groups based onCD11b

32
and CD11c signal. (1) myeloid DCs (CD11bhi CD11chi), (2) alveolar macrophages
(CD11blo CD11chi) (3) migratory macrophages (CD11bhi CD11clo) (4) monocyes (CD11bhi
CD11clo). Flowjo v10.0 (Treestar) was used for all flow cytometry analysis.
2.2.9 Statistics
Prism Software (GraphPad) was used for statistical analyses. For pairwise
comparisons among continuous variables a two‐sided student’s t‐test was used for
normally distributed data, and a Mann‐Whitney test was used for non‐normally
distributed data. To determine if total chemokines were upregulated in BALB/c vs.
C57BL/6 mice, aligned ranks tests were used to make the comparisons within the three
samples (sera, lung, BAL). The observations were standardized to a mean of zero within
each chemokine and then ranked. The aligned rank test statistic was computed in SAS
9.2 using PROC FREQ.
2.3 Results
2.3.1 Early CFU differences in BALB/c in and C57BL/6J mice are observed after aerosol exposure but not retropharyngeal instillation
Previous studies from our laboratory have demonstrated that C57BL/6 mice have
decreased pulmonary bacterial burden, compared to BALB/c mice, in the first three days
after aerosol M. tuberculosis exposure (Figure 1). To examine if differences in early
infection CFU were specific to the aerosol infection model, C57BL/6 and BALB/c mice
were instilled with 3.5x10⁵ M. tuberculosis H37Rv retropharyngeally, and sacrificed at
one and twenty‐four hour post infection. In contrast to the aerosol model, no differences
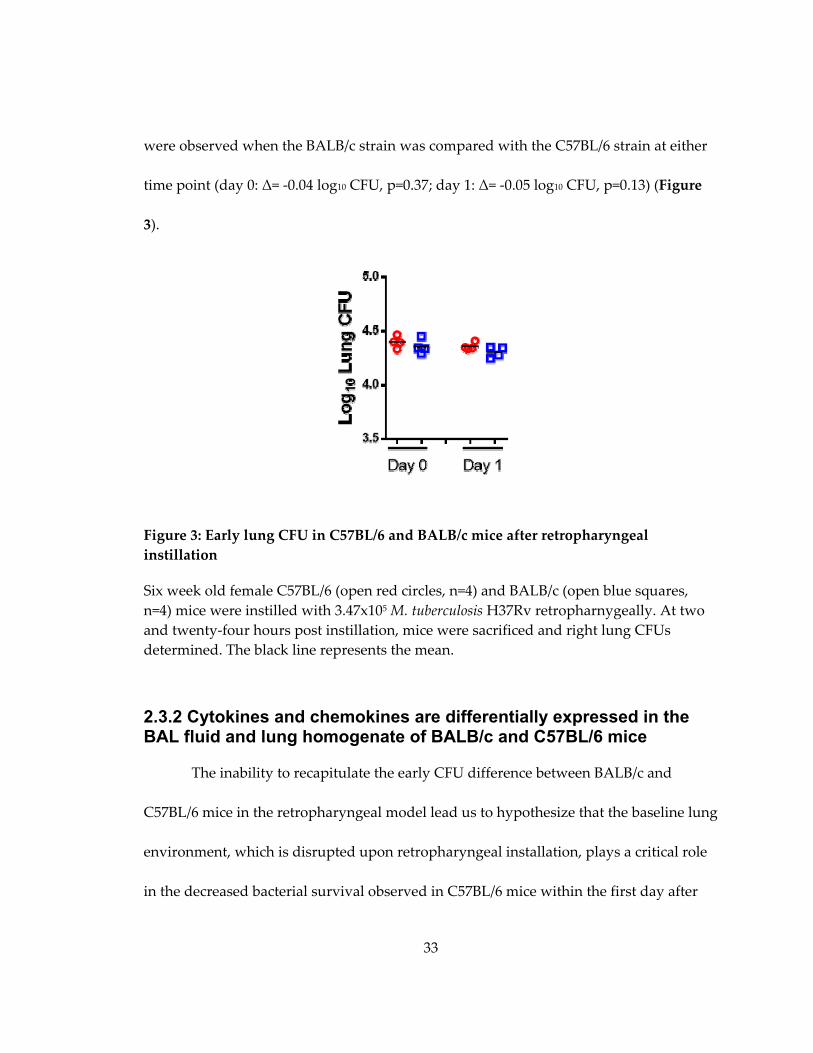
33
were observed when the BALB/c strain was compared with the C57BL/6 strain at either
time point (day 0: Δ= ‐0.04 log10 CFU, p=0.37; day 1: Δ= ‐0.05 log10 CFU, p=0.13) (Figure
3).
Figure 3: Early lung CFU in C57BL/6 and BALB/c mice after retropharyngeal
instillation
Six week old female C57BL/6 (open red circles, n=4) and BALB/c (open blue squares,
n=4) mice were instilled with 3.47x10⁵ M. tuberculosis H37Rv retropharnygeally. At two
and twenty‐four hours post instillation, mice were sacrificed and right lung CFUs
determined. The black line represents the mean.
2.3.2 Cytokines and chemokines are differentially expressed in the BAL fluid and lung homogenate of BALB/c and C57BL/6 mice
The inability to recapitulate the early CFU difference between BALB/c and
C57BL/6 mice in the retropharyngeal model lead us to hypothesize that the baseline lung
environment, which is disrupted upon retropharyngeal installation, plays a critical role
in the decreased bacterial survival observed in C57BL/6 mice within the first day after
34
aerosol infection. Differences in soluble signaling molecules could play an important
role in shaping the pulmonary environment, and dilution of their levels in the BAL fluid
by the volume of the retropharyngeal instillation, could contribute to the elimination of
the early infection CFU differences between the strains.
To test this hypothesis, baseline cytokine and chemokine levels in sera, BAL
fluid, and lung tissue homogenate from naïve BALB/c and C57BL/6 mice were examined
to determine if differences existed between the strains (Table 3; Appendix A, Table 15).
The median cytokine values for IFN‐γ, TNF‐α, IL‐2, IL‐12(p40), IL‐12(p70), IL‐4, IL‐5, IL‐
6, G‐CSF, IL‐1α, IL‐3, IL‐7, IL‐15, IL‐17, LIF fell below the limit of detection for both
C57BL/6 and BALB/c mice in BAL and lung homogenate, and are only displayed in
Table 15 (Appendix A). No differences between TH1 and TH2 cytokines were observed
between the strains in either lung homogenate or BAL fluid, with most cytokines falling
below the limit of detection. Differences were noted for three other cytokines. M‐CSF
(Δ=2.04, p=0.008) was more highly expressed in tissue homogenates of BALB/c mice as
compared to C57BL/6 mice. Conversely, VEGF (Δ=0.36, p=0.008) and IL‐9 (Δ=0.65,
p=0.008) were more highly expressed in lung homogenates of C57BL/6 mice (Table 3).
Several chemokines were upregulated in BALB/c mice. RANTES (Δ=3.26,
p=0.016), and KC (Δ=1.64, p=0.008) were elevated in the lung tissue, while, KC (Δ=2.76,
p=0.016) and MIG (Δ=3.04, p=0.008) were elevated in the BAL fluid. Additonally, Eotaxin
and MIP‐1β had elevated levels in lung tissue and MIP‐2 had elevelated levels in BAL

35
Table 3: Cytokine values for C57BL/6 and BALB/c mice in BAL and lung homogenate
Median and range are displayed. P‐values were determined by Mann‐Whitney test. Cytokine’s whose
median values were at the limit of detection in BAL and lung homogenate for both strains are not shown
here, but can be found in Table 15.
Tissue BAL
B6
(n=5)
BALB/c
(n=5)
Bc/
B6
P‐
value
B6
(n=5)
BALB/c
(n=4)
Bc/
B6
P‐
value
Cytokines associated with a Th2 response
IL‐10 <3.6 <3.6 N/A N/A 7.2
(4.0‐10.2)
5.6
(<1.7‐11.4) 0.78 0.73
IL‐13 755.4
(<360.4‐769.6) <360.6 0.48 0.17 <180.3 <180.3 N/A N/A
Additional cytokines
GM‐CSF 35.4
(4.5‐62.4)
28.1
(22.3‐71.08) 0.79 0.73
2.3
(<1.1‐2.3)
14.1
(6.7‐17.7) 6.19 0.08
M‐CSF 55.4
(43.6‐69.4)
112.8
(80.9‐171.0) 2.04 0.008 <1.9 <1.9 N/A N/A
VEGF 670.6
(574.5‐883.0)
243.1
(208.0‐511.4) 0.36 0.008
7.4
(3.3‐9.8)
3.6
(<1.6‐6.0) 0.49 0.064
IL‐1β <4.1
(<4.1‐9.1)
<4.1
(<4.1‐25.1) N/A 0.44
<2.1
(<2.1‐5.0)
5.8
(<2.1‐8.3) 2.83 0.30
IL‐9 595.8
(489.3‐1179.8)
393.12
(302.0‐445.9) 0.65 0.008
116.0
(21.2‐175.2)
99.1
(37.4‐373.3) 0.85 1.00
IP‐10 306.7
(181.9‐419.4)
334.4
(204.6‐404.2) 1.09 0.55
6.8
(<1.7‐9.0)
7.7
(5.7‐14.1) 1.12 0.56
CCL chemokines
Eotaxin 670.5
(551.3‐1540.5)
879.8
(538.0‐2158.3) 1.31 0.84
<1.6
(<1.6‐6.9)
9.5
(6.2‐23.3) 5.82 0.056
MCP‐1 57.3
(54.9‐80.4)
65.3
(51.0‐73.6) 1.13 0.50 <2.0
<2.0
(<2.0‐4.08) N/A 0.44
MIP‐1α 84.56
(46.3‐118.9)
70.1
(57.5‐93.5) 0.83 1.00
37.5
(24.7‐61.9)
38.7
(31.5‐52.3) 1.03 0.78
MIP‐1β 18.5
(17.6‐49.5)
36.2
(22.5‐43.6) 1.95 0.15 <1.6
<1.6
(<1.6‐3.4) N/A 0.44
RANTES 27.5
(25.0‐52.9)
89.6
(44.0‐107.5) 3.26 0.016 <1.7 <1.7 N/A N/A
CXCL chemokines
KC 166.1
(129.7‐191.1)
274.7
(207.7‐388.0) 1.64 0.008
5.9
(4.4‐8.6)
16.4
(10.5‐18.4) 2.76 0.016
LIX 38.4
(<17.7‐244.7)
<17.7
(<17.7‐80.6) 0.48 0.52 <8.8 <8.8 N/A N/A
MIG 456.1
(393.5‐665.9)
583.0
(398.6‐811.3) 1.27 0.42 <1.8
5.3
(4.0‐9.9) 3.04 0.008
MIP‐2 32.6
(<11.8‐42.5)
24.7
(<11.8‐45.3) 0.75 1.00
<5.9
(<5.9‐12.4)
13.4
(<5.9‐16.3) 2.26 0.13
36
fluid, though the differences were not statistically significant (Δ=5.82, p=0.056; Δ=1.95,
p=0.15, and Δ=2.26, p=0.13 respectively) (Table 3). Multivariant analysis, considering all
cytokines together, demonstrated higher levels of total chemokines in the BAL fluid and
lung tissue homogenate of BALB/c mice (p<0.001 and p=0.038 respectively), but not in
sera (p=0.17). Interestingly, the cytokine and chemokine profile in sera differed
significantly from that observed in BAL and tissue (Appendix A, Table 15).
2.3.3 Differences in baseline cell populations in BALB/c and C57BL/6 mice
In addition to soluble signaling molecules, differences in the percent composition
of pulmonary phagocytes could also play a role in M. tuberculosis survival early in
infection. A bacterium is capable of infecting numerous phagocytic cell types; however,
its ability to survive in each varies [24,27,214,215]. To test this hypothesis primary
pneumocytes were isolated from the lungs of naïve mice, and stained with surface
markers to identify neutrophils, monocytes, myeloid DCs, recruited macrophages, and
alveolar macrophages. While no differences between the strains were observed for
neutrophils, migratory macrophages, alveolar macrophages or monocytes, the
proportion of myeloid DCs were elevated in C57BL/6 mice (0.45% vs. 0.19% of total
pneumocytes, p=0.028) (Figure 4).
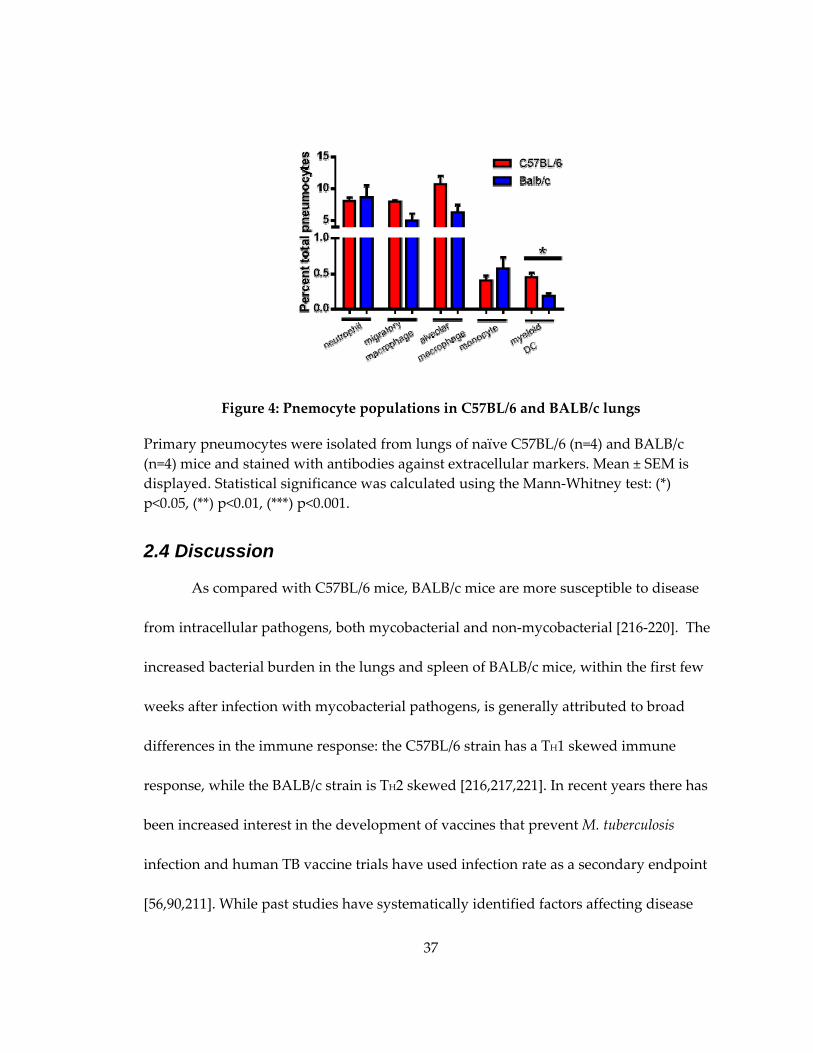
37
Figure 4: Pnemocyte populations in C57BL/6 and BALB/c lungs
Primary pneumocytes were isolated from lungs of naïve C57BL/6 (n=4) and BALB/c
(n=4) mice and stained with antibodies against extracellular markers. Mean ± SEM is
displayed. Statistical significance was calculated using the Mann‐Whitney test: (*)
p<0.05, (**) p<0.01, (***) p<0.001.
2.4 Discussion
As compared with C57BL/6 mice, BALB/c mice are more susceptible to disease
from intracellular pathogens, both mycobacterial and non‐mycobacterial [216‐220]. The
increased bacterial burden in the lungs and spleen of BALB/c mice, within the first few
weeks after infection with mycobacterial pathogens, is generally attributed to broad
differences in the immune response: the C57BL/6 strain has a TH1 skewed immune
response, while the BALB/c strain is TH2 skewed [216,217,221]. In recent years there has
been increased interest in the development of vaccines that prevent M. tuberculosis
infection and human TB vaccine trials have used infection rate as a secondary endpoint
[56,90,211]. While past studies have systematically identified factors affecting disease
38
susceptibility, none have examined if these factors correlate with differences in infection
rate [102,135‐137].
Previous work in our laboratory has demonstrated early infection bacterial
burden, and infection rate differences between C57BL/6 and BALB/c mice (Figure
1,Table 2). The loss of this phenotype upon retropharyngeal instillation lead to the
hypothesis that soluble factors, diluted out due to the volume of the retropharyngeal
instillation, were critical for the decreased bacterial burden in C57BL/6 mice after aerosol
exposure (Figure 3). To test this hypothesis we characterized the lung environment in
naïve mice from both strains.
Chemokines regulate cell migration into the lungs, and contribute to the TH1/
TH2polarization of the immune response. Differences in chemokine and cytokine levels
between the strains have been documented both systemically, and within the lung in
response to infection [217,219,222‐225]. Given, however, that bacterial load differs by as
soon as two hours post infection, in the standard dose aerosol model, if differential
chemokine/cytokine expression plays a role, it is most likely due to baseline differences
between the strains, rather than their response to M. tuberculosis. In this study we noted
that BALB/c mice have elevated levels of both CCL and CXCL chemokines compared to
C57BL/6 mice (Table 3; Appendix A, Table 15). Further studies exploring if differences
in chemokine levels between the strains contribute either to differences in cellular
39
activation, or differences in mycobactericidal activity of pulmonary phagocytes need to
be undertaken.
After noting differences in baseline chemokine levels, we hypothesized that the
higher levels of chemokines in the lungs of BALB/c mice would lead to higher
proportions of myeloid DCs and recruited macrophages in the naïve lung, providing a
larger number of cellular targets for M. tuberculosis to infect. Surprisingly, we noted the
opposite with myeloid DC’s being elevated in the lungs of C57BL/6 mice (Figure 4). M.
tuberculosis infects numerous cell types including macrophages, DCs, neutrophils, and
alveolar epithelial cells, both in vivo and in vitro [27,143,214,215,226]. M. tuberculosis
survival in DCs is constrained, as compared with alveolar macrophages, due to
impairment of nutrient trafficking to the infected phagosome [214,227]. Further studies,
examining if early CFU differences between the strains are attributable to a higher
proportion of infected DCs in C57BL/6 mice are warranted.
An alternate hypothesis is that differences in airway architecture, leading to
decreased M. tuberculosis deposition in the lung, are responsible for the strain differences
in early infection bacterial burden. Several studies have compared respiratory
parameters among inbred strains, and while statistically significant differences have
been found, the magnitude of the differences is small [228‐230]. In addition, detailed
measurements of ventilatory volumes show no differences between C57BL/6 and
BALB/c mice [230]. To exclude airway architecture as a contributing factor in early lung

40
burden differences between the strains, both C57BL/6 and BALB/c mice were infected
retropharyngeally. In this model, the difference between the strains is lost, at both two
and twenty‐four hours post infection: there is less than a 2% difference in CFU between
the two strains at each time point (Figure 3). While this method of infection bypasses the
upper airway, it also introduces 50 μL PBS into the lung, potentially washing out critical
soluble factors, preventing us from distinguishing between hypotheses.
The ability to examine factors which affect M. tuberculosis infection rate, rather
than disease, is critical for a both a better understanding of the M. tuberculosis infection
event, and the development of anti‐infective vaccines. Taken together, this study
demonstrates that genetic factors altering the pulmonary environment in naïve mice
may play a role in influencing the initial interaction between the host and M. tuberculosis.
Further studies with this experimental system have the ability to elucidate a mechanism
by which baseline differences in pneumocyte populations and cytokine levels influence
early infection events, and to identify novel factors influencing M. tuberculosis infection
rate.
2.5 Future Directions
Although this study has generated the interesting hypothesis that the pulmonary
environment at the time of infection can influence infection rate, the precise mechanism
by which this occurs is unknown. Further studies are needed to elucidate the precise
role that differences in the baseline chemokine profile and pneumocyte populations play
41
in altering early infection events. Additionally, examining early bacterial burden in
alternate strains of mice, has the potential to identity genetic factors that play a role in
infection rate differences.
One hypothesis is that the differences in baseline cytokine and chemokine levels
affect the activation state of phagocytes in the lungs. Chemokines and cytokines play a
role in altering macrophage activation status, and in inducing naïve dendritic cell and
monocyte maturation [231,232]. To test this hypothesis, single cell pneumocyte
preparations from naïve mice could be stained with markers for classical (CD40, CD80,
CD86) and alternative (Mannose Receptor (CD 206), transferrin receptor (CD71) and
resistin‐like molecule alpha (RELMα)) macrophage activation, as well as DC activation
(CD40, CD80, CD83, pDL1), prior to interrogation by flow cytometry [233,234]. Even if
no differences are observed in classical activation markers, the cytokine environment in
C57BL/6 mice could predispose lung pneumocytes to M. tuberculosis control or killing.
Ex vivo infection of primary myeloid DCs, neutrophils, alveolar and migratory
macrophages with M. tuberculosis, followed by lysis at early time points and plating for
bacterial CFUs, could elucidate if C57BL/6 phagocytes are more primed for bacterial
killing.
An additional hypothesis is C57BL6 mice, due to differences in the baseline
phagocyte composition in the lung, have a greater proportion of infected myeloid DCs
than BALB/c mice. Myloid DCs are the predominantly infected cell by fourteen days

42
post infection, and constrain M. tuberculosis survival better than macrophages [27,214].
To test this, primary pneumocytes isolated from mice recently exposed to aerosolized M.
tuberculosis can be sorted on the basis of cell surface markers. Alveolar macrophages,
recruited macrophages, neutrophils and myeloid DCs can then be plated on 7H10 agar
plates, with the resultant number of infected cells determined by the number of CFUs.
The studies undertaken in this chapter have attempted to understand the
mechanism underlying the infection rate difference between C57BL/6 and BALB/c mice.
Factors influencing infection rate are most likely complex, influenced by numerous
genetic factors. Cross breeding of C57BL/6 and BALB/c mice, in an attempt to map the
location of these factors, is unlikely to succeed as the magnitude of the early CFU
difference between the strains is small. The collaborative cross project has used cross
breeding of eight genetically diverse strains of mice, to derive hundreds of inbred mouse
strains, with high degrees of genetic variation [235,236]. Screening mice from a
collaborative cross project could identify strains with a more pronounced early infection
CFU differences that are amenable to interrogation through cross breeding.
Identification of genetic loci that contribute to the host response early in M. tuberculosis
infection will not only further our understanding of factors that influence M. tuberculosis
infection rate, it may even identify targets that can be harnessed in an anti‐infective
vaccine.
43
3. Human antibodies to the surface of M. tuberculosis
3.1 Introduction
Studies on antibody production against specific M. tuberculosis proteins abound,
largely focused on their use in the diagnosis of either TB infection or TB disease.
Antibodies to the surface of other bacterial species correlate with protection from
infection, and colonization [95,237,238]. Identifying the types of antibodies produced
during M. tuberculosis infection, especially those against surface components, is
important as these antibodies could potentially modify the course of infection.
To test this, we have developed a novel whole‐cell ELISA assay to detect
antibodies to the live M. tuberculosis surface, and have compared these antibodies to
those produced against a variety of inactivated antigenic fractions. Antibodies to the
surface of live M. tuberculosis are present at low levels in uninfected individuals. Their
titers increase in those with either latent TB infection or active TB disease. Paradoxically,
IgG antibodies to the live M. tuberculosis surface have lower relative avidity in persons
with active TB disease than in uninfected individuals. Antibodies to the M. tuberculosis
surface are comprised of similar amounts of IgG and IgM, while antibodies to antigenic
fractions are predominately IgG. Among patients with active disease, M. tuberculosis
surface‐binding antibodies have higher titers and higher relative IgG avidity scores in
those were BCG‐vaccinated or foreign‐born. These correlates were not seen for
antibodies to the inactivated antigenic fractions.
44
Humoral immunity is increasingly recognized as a component of the protective
immune response to M. tuberculosis, and as a target for TB vaccines [107]. Antibodies
that bind to the surface of live M. tuberculosis are a potentially protective class, and they
have different properties from antibodies produced against other mycobacterial targets.
In particular, most patients with TB infection and disease fail to produce highly‐avid
IgG antibodies to the surface of the live bacterium. These results have important
implications for TB vaccine development.
3.2 Methods
3.2.1 Bacterial cultures and lysates
Mycobacterium fortuitum (ATCC 6841), Mycobacterium bovis BCG Danish (ATCC
35733), Mycobacterium avium subsp. avium Chester 1901 (ATCC 25291), Mycobacterium
tuberculosis H37Rv (ATCC 25681), and Mycobacterium intracellulare (ATCC 13950) were
grown in 7H9 media supplemented with 10% OADC, 0.5% glycerol, 0.05% tyloxapol, at
37oC, in a shaking incubator at 100 ‐ 130 rpm, to an OD between 1.0‐1.5 as measured by a
Cell Density Meter (Biowave, CO8000). For preparation of protein lysates, cultures were
centrifuged at 600g for 5 minutes and pellets were washed twice with PBS, pH7.4,
containing 0.05% tyloxapol. Pellets were lysed by vortexing with 0.1 micron glass beads
in the presence of 50mM tris hydrochloride, 0.5mM EDTA, 60 mM sodium phosphate
0.67% SDS, and protease inhibitors (Roche 11836170001). Lysates were clarified by

45
centrifugation at 600g, then again at 16,000g. Protein concentrations were determined
using BCA protein assay (Pierce 23227).
3.2.2 Additional ELISA antigens
M. tuberculosis H37Rv fractions including culture filtrate (NR‐14825), cell wall
(NR‐14828), whole cell lysate (NR‐14822), and lipoarabinomannan (LAM) (NR‐14848)
were obtained from Colorado State University through BEI resources.
3.2.3 ELISA assay
Antigen fractions and lysates were diluted in CBC buffer (7.5 mM sodium
carbonate, 17.4 mM sodium bicarbonate, pH 9.0) and plated at a concentration of 200
ng/well in 96 well high‐binding plates (Costar 3590). For enzyme‐linked immunosorbant
assays (ELISAs) to the live bacterial surface, growing cultures of mycobacteria at OD of
0.7‐1.5 were pelleted at 200g for 10 minutes. Live bacterial pellets were resuspended in
CBC buffer to an OD of 1.5‐2.5 and approximately 5x10⁷ bacteria were plated per well.
After overnight incubation of plates at 4OC, wells were washed with PBS, pH 7.4
containing 0.05% Tween‐20 (PBST), then blocked with 5% nonfat dry milk in CBC buffer.
PBST‐washed plates were incubated overnight at 4OC with immune and control plasma
diluted in PBST containing 5% nonfat dry milk. A 1:128 dilution of human plasma from
a patient with active TB disease was used as a positive control. PBST with 5% nonfat dry
milk was used as a negative control. PBST washed plates were then incubated for 1
hour with a 1:3000 dilution of either alkaline phosphatase conjugated goat‐anti‐human
46
Ig (whole molecule) (Sigma A15431), IgG (Fc‐specific) (Sigma A9544), or IgM (Fc‐
specific) (Sigma A5937). After the addition of 1 μg/ml para‐nitrophenyl phosphate
(PNP) solution in CBC buffer containing 1.1 mM magnesium chloride (CBC‐Mg), color
development was recorded when positive control (POS) reached an OD of 2.0 as
measured at 405nm by spectrophotometer. Titers were defined as the reciprocal dilution
which produced an OD of twice background, and were determined by exponential
interpolation.
The whole cell ELISA assay is intrinsically more variable due to the nature of its
antigen. Bacteria clump together, and can wash off, during early wash steps, and the
assay takes longer to develop leading to higher backgrounds. All whole cell ELISAs
used in this study possess backgrounds of less than twice seen for whole cell lysate (for
Ig whole molecule and Ig (Fc‐specific) background <0.125, for IgM (Fc‐specific)
background <0.160). The reproducibility of the assay is robust (r2=0.80) and is
comparable to whole cell lysate (r2=0.86) (Figure 5).
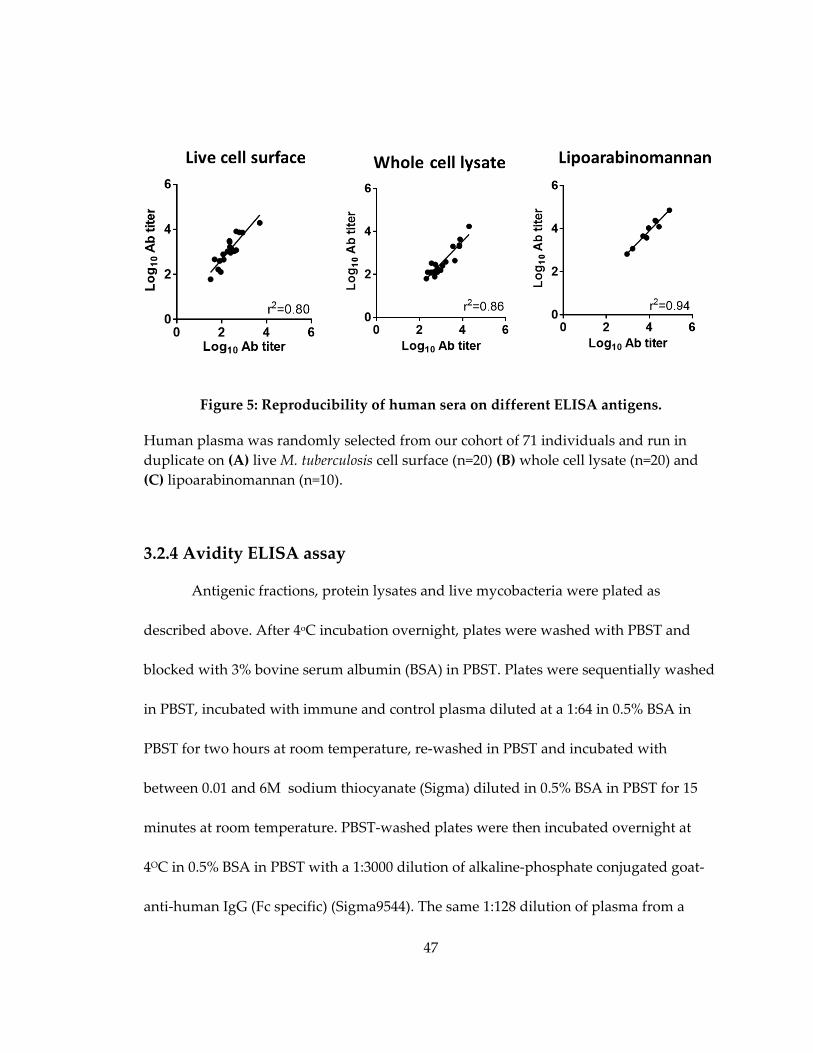
47
Figure 5: Reproducibility of human sera on different ELISA antigens.
Human plasma was randomly selected from our cohort of 71 individuals and run in
duplicate on (A) live M. tuberculosis cell surface (n=20) (B) whole cell lysate (n=20) and
(C) lipoarabinomannan (n=10).
3.2.4 Avidity ELISA assay
Antigenic fractions, protein lysates and live mycobacteria were plated as
described above. After 4oC incubation overnight, plates were washed with PBST and
blocked with 3% bovine serum albumin (BSA) in PBST. Plates were sequentially washed
in PBST, incubated with immune and control plasma diluted at a 1:64 in 0.5% BSA in
PBST for two hours at room temperature, re‐washed in PBST and incubated with
between 0.01 and 6M sodium thiocyanate (Sigma) diluted in 0.5% BSA in PBST for 15
minutes at room temperature. PBST‐washed plates were then incubated overnight at
4OC in 0.5% BSA in PBST with a 1:3000 dilution of alkaline‐phosphate conjugated goat‐
anti‐human IgG (Fc specific) (Sigma9544). The same 1:128 dilution of plasma from a
48
patient with active TB disease was used as a positive control. PBST with 0.5% BSA was
used as a negative control. After a final PBST wash plates were incubated in 1μg/mL
PNP in CBC‐Mg solution. Color development was recorded when POS control reached
OD 2.0 as measured at 405nm by spectrophotometer. The avidity scores are defined as
the concentration of sodium thiocynate where the OD is equal to 50% of the no sodium
thiocynate control value.
3.2.5 Statistical Analysis
For comparison between groups with normal distributions either a two‐tailed
student’s t‐test, for comparisons between two variables, or ANOVA, for comparisons of
more than two variables, was used. A Mann‐Whitney test was used to compare two
groups with non‐normal distributions. For comparison of groups containing categorical
variables, a Chi‐squared or Fisher’s exact test was used as appropriate. Correlations
between two continuous variables were probed through linear regression with r and p‐
values reported. All statistical calculations were conducted using PRISM (Graphpad
Software).
3.2.6 Human subjects
Patients with latent TB infection and active TB disease were enrolled in Durham
and Wake Counties, North Carolina, as part of the “TB Epitope study.” Latent TB
infection was defined by a positive interferon‐gamma release assay (Quantiferon® Gold
In‐Tube, Cellestis Inc, Valencia, CA) with no radiographic or clinical findings suggestive

49
of active TB. Active TB disease was defined by culture‐proven TB disease or a diagnosis
of clinical TB. This group included patients with a recent TB diagnosis, patients who
were in the midst of therapy and patients who had completed therapy in the past.
Uninfected patients were HIV‐seronegative, tuberculin skin test‐negative, healthy
volunteers with no history of BCG vaccination. Informed written consent was obtained
from participants, and the study was approved by the Duke University Medical Center
Institutional Review Board.
3.2.7 Cytokine profiling
The cytokine profiling data used in this study was first reported in Frahm et al.
2011[239]. In brief, whole blood was collected from subjects and assayed by
Quantiferon® Gold In‐Tube (Cellestis Inc, Valencia, CA) testing. Each sample was
incubated with either (a) a mixture of three TB specific antigens (ESAT‐6, CFP‐10, and
TB7.7), (b) a mitogen positive control, or (c) a negative control tube containing no
antigens. Following stimulation supernatant was collected and assayed for 25 cytokines
and chemokines (IL‐1β, IL‐1Ra, IL‐2, IL‐2R, IL‐4, IL‐5, IL‐6, IL‐7, IL‐8, IL‐10, IL‐12
p40/70, IL‐13, IL‐15, IL‐17, TNF‐α, IFN‐α, IFN‐γ, GM‐CSF, MIP‐1α, MIP‐1β, IP‐10, MIG,
Eotaxin, RANTES, MCP‐1) through a Human Cytokine 25‐plex assay (Biosource,
Camarillo, CA).
50
3.3 Results
3.3.1 Demographic information on human population
The 71 patients in our study included healthy uninfected volunteers (n=9), patients with
latent TB infection (n=23), and patients with active TB disease (n=40). Demographic and
clinical data are shown in Table 4. As expected, several clinical characteristics
differenced among the groups. Male gender was less common in uninfected and latent
TB infection groups as compared to the active TB infection group (33% and 48% vs 73%;
p = 0.05 and 0.06 respectively). BCG vaccination was less common in the uninfected
group than in the latent TB infection or the active TB disease group (0% vs. 39% and
43%; p= 0.04 and 0.02 respectively). Similarly, birth in the US was more
common in the uninfected group than in the latent TB infection or the active TB disease
group (78% vs. 44% and 50%; p= 0.05 and 0.06 respectively).

51
Table 4: Demographics and clinical data
Variable Uninfected
(n=9)
Latent TB
infection (n=23)
Active TB
disease (n=40)
N
Percent*/
mean ± SD N
Percent/
mean ± SD N
Percent/
mean ± SD
Age (yrs) 9 38 ± 14 23 42 ± 17 40 43 ± 15
Gender
Male 3 33% 11 48% 29 73%
Female 6 67% 12 52% 11 28%
Race/ethnicity
White 6 67% 8 35% 7 18%
White Hispanic 1 11% 4 17% 11 28%
Black 2 22% 9 39% 17 43%
Black Hispanic 0 0% 0 0% 1 3%
Asian 0 0% 2 9% 4 10%
HIV seropositivity
HIV + 0 0% 2 8% 7 18%
HIV – 9 100% 19 83% 33 83%
Unknown 2 8%
Diabetes
Yes 2 9% 6 15%
No 21 91% 34 85%
Tobacco usage
Yes 7 30% 11 28%
No 16 70% 29 73%
Alcohol consumption (days)
None consumed 14 61% 26 65%
1‐3 drinks 5 22% 6 15%
>3 drinks or binge 4 17% 8 20%
BCG vaccination history
Yes 0 100% 9 39% 17 43%
No 9 0% 14 61% 22 55%
Unknown 0 0% 0 0% 1 3%
US‐born
Yes 7 78% 10 44% 20 50%
No 1 11% 13 57% 20 50%
Unknown 1 11% 0 0% 0 0%
PPD induration (mm) n/a n/a 19 24 ± 19 37 20 ± 16
Disease state n/a n/a n/a n/a
Pulmonary 22 55%
Extra‐pulmonary 14 35%
Both 4 10%
*Percentages may not add to 100% due to rounding.
52
3.3.2 Human antibody titers to the surface of live M. tuberculosis and to
inactivated antigenic fractions
Plasma was assayed by ELISA to determine total antibody titers against the
surface of live M. tuberculosis H37Rv and against four inactivated M. tuberculosis
antigenic fractions (Figure 6A‐B, Figure 7A‐C). Plasma from the uninfected group
reacted to the live M. tuberculosis surface (mean titer 2.0 log10) and to all four antigenic
fractions (mean titers, 2.2 to 3.1 log10). Plasma from the active disease group had higher
antibody titers to the surface of live M. tuberculosis (Δ=0.72 log10), and to two of the
antigenic fractions, whole cell lysate (Δ=0.82 log10) and secreted proteins (Δ=0.62 log10),
when compared to uninfected controls, while cell wall (Δ=0.46 log10) had elevated
antibody titers when compared to individuals with latent infection. The latent TB
infection group had intermediate titers, falling between the uninfected controls and the
active TB disease groups for the surface of live M. tuberculosis, whole cell lysate and
secreted proteins. Antibody titers to lipoarabinomannan were similar among the three
patient groups.

53
Figure 6: Antibody responses to M. tuberculosis live cell surface or whole cell lysate
Plasma from PPD‐negative volunteers (Uninfected), patients with latent TB infection
(Latent), or patients with active TB disease (Active) were assayed by ELISA against the
surface of live M. tuberculosis H37Rv or H37Rv whole cell lysate. (A‐B) Log10 total Ig
titers. (C‐D) Relative IgG avidity. (D‐E) Log10 ratio of IgG to IgM titers. Two‐sided p‐
values by student’s t‐test or Mann‐Whitney test: (*) p ≤ 0.05, (**) p ≤ 0.01, (***) p ≤ 0.001.

54
Figure 7: Antibody responses to M. tuberculosis lipoarabinomannan, cell wall, and
secreted protein fractions
Plasma from PPD‐negative volunteers (Uninfected), patients with latent TB infection
(Latent), or patients with active TB disease (Active) were assayed by ELISA against the
surface of live M. tuberculosis H37Rv or H37Rv whole cell lysate. (A‐C) Log10 total Ig
titers. (D‐F) Relative IgG avidity. (G‐I) Log10 ratio of IgG to IgM titers. Two‐sided p‐
values by student’s t‐test or Mann‐Whitney test: (*) p ≤ 0.05, (**) p ≤ 0.01, (***) p ≤ 0.001.
Persons with active TB disease had variable responses to the live M. tuberculosis
surface (Figure 6A) with a range of 1.6 to 3.8 log10 and an interquartile range from 2.3 to
3.3 log10. Variability was generally less in the uninfected and latent infection groups.
55
This variability resulted in overlap among the patient groups in total antibody titers in
spite of statistically significant differences between groups (Figure 6A). The same trend
was observed for all the antigenic fractions as well (Figure 6B, Figure 7A‐C). Antibody
titers across antigens were correlated for each individual (data not shown).
3.3.3 Relative IgG avidity to the surface of live M. tuberculosis and to
inactivated antigenic fractions
ELISA was used to determine the relative IgG avidity to the live M. tuberculosis
surface and to the four inactivated antigenic fractions. Repeated exposure to antigens, as
in prime/boost vaccinations, normally leads to increased relative avidity [97]. As
expected, persons with active disease had higher relative IgG avidity than the
uninfected controls for all four inactivated fractions (Δ=1.4 to 2.6, Figure 6D, Figure 7D‐
F), and these differences were statistically significant (p = 0.004 for whole cell lysate, and
p < 0.001 for the other fractions). Patients with latent TB infections had avidities
intermediate between uninfected controls and active TB disease for all four fractions.
Surprisingly, the relative IgG avidity to the live M. tuberculosis surface was actually
lower in those with active TB disease (Δ=‐1.53, p=0.004), and in those with latent TB
disease (Δ=‐1.39, p=0.011), when compared to uninfected controls (Figure 6C).
3.3.4 Ratio of IgG and IgM antibodies to the surface of live M.
tuberculosis and to inactivated antigenic fractions
ELISA was used to measure the titers of IgG and IgM‐specific antibodies to the
live M. tuberculosis surface and to four inactivated antigenic fractions (Figure 6E‐F,
56
Figure 7G‐I). Infectious agents typically generate an initial IgM response that is
replaced by an IgG response [240]. Humans in all groups showed a mixed pattern of
response with both IgG and IgM antibodies to the live M. tuberculosis surface, and to all
four fractions. Patients in the uninfected and latent infection groups had roughly equal
quantities of IgG and IgM to the M. tuberculosis surface, whole cell lysate,
lipoarabinomannan, and cell wall (mean IgG/IgM ratios, ‐0.24 to 0.32 log10; Figure 6E‐F,
Figure 7G‐H), and modest IgG predominance against secreted proteins (mean IgG/IgM
ratios, 0.53 and 0.72 log10; Figure 6I). Patients with active TB disease had higher IgG than
IgM titers to all antigenic fractions (mean IgG/IgM ratios, 0.45 to 1.05 log10; Figure 6F,
Figure 7G‐I). In contrast, patients with active disease had equal amounts of IgG and IgM
to the live M. tuberculosis surface (mean IgG/IgM ratio, 0.03 log10; Figure 6E).
3.3.5 Correlations between antibody titers and clinical characteristics
We explored potential correlations between antibody responses and clinical
characteristics. Table 5 displays correlations between clinical characteristics and total
antibody titers to the live M. tuberculosis surface and to whole cell lysate for patients
with active TB disease. For discrete clinical variables the log10 titer is reported (mean ±
SEM). For continuous variables (age, PPD induration), the R‐value is reported based on
linear regression. P‐values are not adjusted for multiple comparisons. Higher titers of M.
tuberculosis surface‐binding antibodies were observed in active TB disease patients who
were BCG vaccinated versus unvaccinated (Δ=0.55 log10, p=0.008) or foreign born versus
57
US born (Δ=0.61 log10, p=0.004). Race/ethnicity was also correlated with surface‐binding
antibody titers (p=0.02), with white Hispanics and Asians possessing higher titers than
other racial/ethnic groups. There was a high degree of overlap in these three variables,
with many patients falling into one of two groups: BCG negative/US born/black or BCG
positive/foreign born/non‐black. HIV seropositivity was associated with lower surface‐
binding antibody titers (Δ=‐0.60 log10, p=0.039), as was increased age (r=‐0.35, p=0.027).
Antibody titers to whole cell lysate showed weak trends in the same direction for several
of these clinical characteristics (age, race/ethnicity, BCG vaccination, and foreign birth),
but there were no statistically significant correlations (Table 5). Similar analyses are
shown in Table 16 (Appendix B) for antibody titers to lipoarabinomannan, cell wall,
and secreted protein fractions. Increased age was associated with lower antibody titers
to lipoarabinomannan (r=‐0.35, p=0.027). No other statistically significant correlations
were observed. Patients with latent TB infection showed no statistically significant
correlations between antibody titers and clinical characteristics (Appendix B Table 17,
Table 18).

58
Table 5: Univariate correlation between clinical variables and total antibody titers to
the live M. tuberculosis surface or whole cell lysate in patients with active TB disease
Log10 total antibody titer by ELISA
Variables M. tuberculosis surface Whole cell lysate
R value or
mean ± SEM
P
value*
R value or
mean ± SEM
P value
Age R=‐0.35 0.027 R=‐0.21 0.19
Gender 0.89 0.67
Male (n=29) 3.1 ± 0.1 3.1 ± 0.1
Female (n=11) 3.1 ± 0.3 3.2 ± 0.2
Race/ethnicity 0.018 0.11
White (n=7) 3.1 ± 0.3 2.9 ± 0.2
White Hispanic (n=11) 3.6 ± 0.2 3.5 ± 0.2
Black (n=17) 2.8 ± 0.2 2.9 ± 0.2
Black Hispanic (n=1) 2.7 2.0
Asian (n=4) 3.5 ± 0.2 3.2 ± 0.3
HIV seropositivity 0.039 0.84
HIV + (n=7) 2.6 ± 0.2 3.1 ± 0.2
HIV – (n=33) 3.2 ± 0.1 3.0 ± 0.1
Diabetes 0.65 0.051
Yes (n=6) 3.1 ± 0.1 3.5 ± 0.3
No (n=34) 3.2 ± 0.3 3.0 ± 0.1
Tobacco usage 0.15 0.48
Yes(n=11) 2.9 ± 0.2 2.9 ± 0.1
No (n=29) 3.3 ± 0.1 3.1 ± 0.1
Alcohol consumption (days) 0.87 0.76
None consumed (n=26) 3.1 ± 0.2 3.1 ± 0.1
1‐3 drinks (n=6) 3.2 ± 0.3 2.9 ± 0.3
>3 drinks or binge (n=8) 3.2 ± 0.2 3.1 ± 0.1
BCG vaccination history 0.008 0.087
Yes (n=17) 3.4 ± 0.1 3.2 ± 0.1
No (n=22) 2.9 ± 0.2 2.9 ± 0.2
US‐Born 0.004 0.18
Yes (n=20) 2.8 ± 0.2 2.9 ± 0.2
No (n=20) 3.4 ± 0.1 3.2 ± 0.2
PPD induration (mm) R=‐0.18 0.28 R=‐0.23 0.17
Disease site 0.96 0.20
Pulmonary (n=22) 3.1 ± 0.2 3.1 ± 0.1
Extra‐pulmonary (n=14) 3.1 ± 0.2 2.8 ± 0.2
Both (n=4) 3.1 ± 0.4 3.4 ± 0.2
*P‐value calculated using one‐way ANOVA or student’s t‐test for categorical variables
or F‐statistic for continuous variables. P‐values are unadjusted for multiple comparisons.
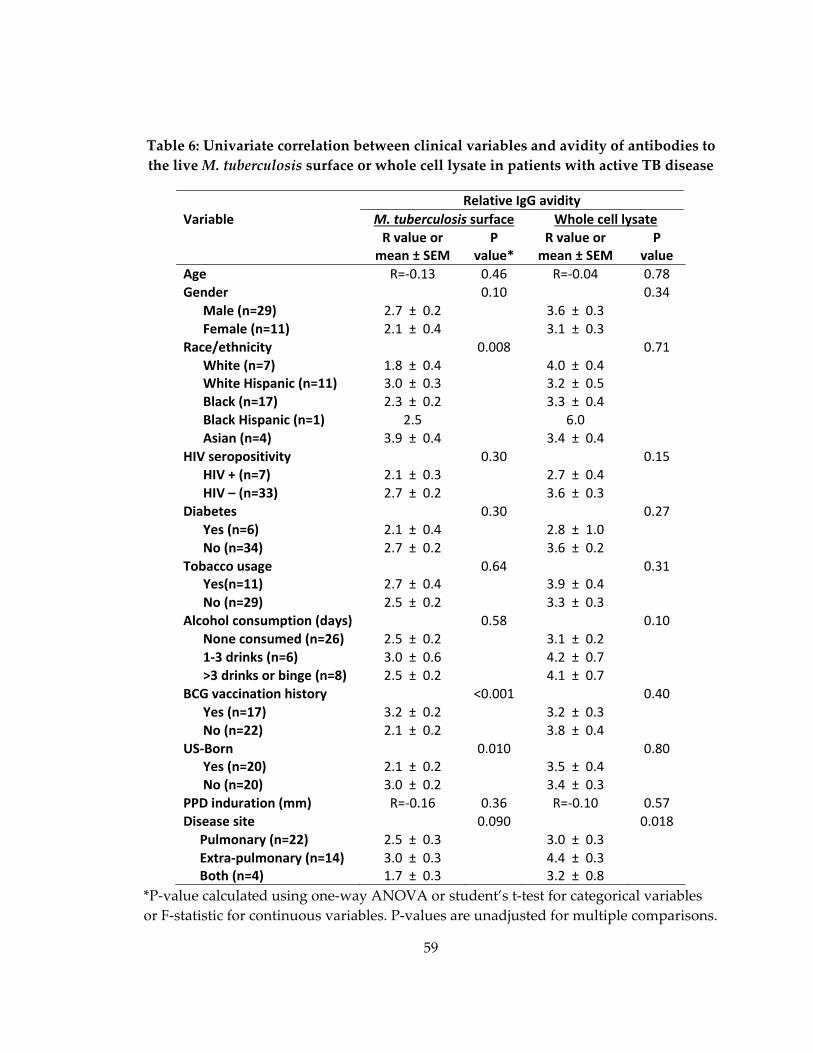
59
Table 6: Univariate correlation between clinical variables and avidity of antibodies to
the live M. tuberculosis surface or whole cell lysate in patients with active TB disease
Relative IgG avidity
Variable M. tuberculosis surface Whole cell lysate
R value or mean ± SEM
P value*
R value or mean ± SEM
P value
Age R=‐0.13 0.46 R=‐0.04 0.78
Gender 0.10 0.34
Male (n=29) 2.7 ± 0.2 3.6 ± 0.3
Female (n=11) 2.1 ± 0.4 3.1 ± 0.3
Race/ethnicity 0.008 0.71
White (n=7) 1.8 ± 0.4 4.0 ± 0.4 White Hispanic (n=11) 3.0 ± 0.3 3.2 ± 0.5
Black (n=17) 2.3 ± 0.2 3.3 ± 0.4
Black Hispanic (n=1) 2.5 6.0
Asian (n=4) 3.9 ± 0.4 3.4 ± 0.4
HIV seropositivity 0.30 0.15
HIV + (n=7) 2.1 ± 0.3 2.7 ± 0.4
HIV – (n=33) 2.7 ± 0.2 3.6 ± 0.3
Diabetes 0.30 0.27
Yes (n=6) 2.1 ± 0.4 2.8 ± 1.0
No (n=34) 2.7 ± 0.2 3.6 ± 0.2
Tobacco usage 0.64 0.31 Yes(n=11) 2.7 ± 0.4 3.9 ± 0.4
No (n=29) 2.5 ± 0.2 3.3 ± 0.3
Alcohol consumption (days) 0.58 0.10
None consumed (n=26) 2.5 ± 0.2 3.1 ± 0.2
1‐3 drinks (n=6) 3.0 ± 0.6 4.2 ± 0.7
>3 drinks or binge (n=8) 2.5 ± 0.2 4.1 ± 0.7
BCG vaccination history <0.001 0.40
Yes (n=17) 3.2 ± 0.2 3.2 ± 0.3
No (n=22) 2.1 ± 0.2 3.8 ± 0.4
US‐Born 0.010 0.80 Yes (n=20) 2.1 ± 0.2 3.5 ± 0.4
No (n=20) 3.0 ± 0.2 3.4 ± 0.3
PPD induration (mm) R=‐0.16 0.36 R=‐0.10 0.57
Disease site 0.090 0.018
Pulmonary (n=22) 2.5 ± 0.3 3.0 ± 0.3
Extra‐pulmonary (n=14) 3.0 ± 0.3 4.4 ± 0.3 Both (n=4) 1.7 ± 0.3 3.2 ± 0.8
*P‐value calculated using one‐way ANOVA or student’s t‐test for categorical variables
or F‐statistic for continuous variables. P‐values are unadjusted for multiple comparisons.

60
3.3.6 Correlations between relative IgG avidity and clinical
characteristics
We conducted similar analyses for relative IgG avidity. Table 6 displays
correlations between clinical characteristics and relative IgG avidity to the live M.
tuberculosis surface and to whole cell lysate for patients with active TB disease. The three
clinical factors that correlated most strongly with surface‐binding antibody titers, were
also correlated with relative IgG avidity to the M. tuberculosis surface. Individuals with a
history of BCG vaccination possessed higher relative IgG avidity to the surface of M.
tuberculosis, than their non‐vaccinated counterparts (Δ=1.12, p<0.001), as did foreign born
individuals versus those born in the US (Δ=0.87, p=0.01). Race/ethnicity was also
correlated with surface‐binding antibody titers (p=0.008), with white Hispanics and
Asians possessing higher relative IgG avidity than other racial/ethnic groups. Taken
together, the group of BCG‐vaccinated/foreign born/non‐black patients had higher
antibody titers and higher relative IgG avidity to the surface of live M. tuberculosis.
Relative IgG avidity to whole cell lysate was correlated with disease site (p=0.018) with
higher avidity in patients with extra‐pulmonary disease. A similar trend was noted for
higher relative IgG avidity to the live M. tuberculosis surface in patients with extra‐
pulmonary disease. No statistically significant correlations were observed for relative
IgG avidity to lipoarabinomannan, cell wall, or secreted protein fractions (Appendix B,
Table 19,). Higher relative IgG avidity to the surface of live M. tuberculosis was observed
in patients with latent TB infection who consumed higher levels of alcohol (p=0.045) and

61
in those born in the US (Δ=0.8, p=0.033) (Appendix B, Table 20). No other statistically
significant correlations were observed between relative IgG avidity and clinical
characteristics in patients with latent TB infection (Appendix B, Table 20 , Table 21).
3.3.7. Association of cytokine production with surface‐binding and
secreted protein antibody titers and IgG avidity scores
All subjects with latent TB infection (n=23) and a subset of subject with active TB
disease (n=10) were included in a previously published M. tuberculosis biomarker study
[239]. Whole blood was incubated with M. tuberculosis‐specific peptides and the
concentrations of cytokines and chemokines determined. These values were plotted
against surface‐binding and whole cell lysate antibody titers (Appendix B, Table 22)
and surface‐binding and whole cell lysate IgG avidity scores (Appendix B, Table 23),
with r and p‐values reported. In the ten patients with active TB disease, there was a
positive correlation between IL‐1β and antibody titers to the surface of live M.
tuberculosis (r=0.70, p=0.02) and to whole cell lysate (r=0.69, p=0.03). The significance of
this finding is unclear: since 96 pairwise comparisons were made, this rate of p‐values
below 0.05 would be expected by chance alone. When cytokines were grouped into those
associated with either TH1 or TH2 responses, there was no pattern of associations.
A greater number of cytokines were correlated with surface‐binding antibody
and whole cell lysate antibody IgG avidity. There was a positive association between
IFN‐γ (r=0.73, p=0.02), IL‐6 (r=0.65, p=0.04), IL‐8 (r=0.89, p=0.001), MIP‐1α (r=0.77, p=0.01)
and MIP‐1β (r=0.85, p=0.002) and surface‐binding antibody IgG in patients with active

62
disease. Associations were also observed between IL‐10 (r=0.77, p=0.01), IL‐13 (r=0.65,
p=0.04), Eotaxin (r=‐0.71, p=0.02), and RANTES (r=‐0.71, p=0.02) and whole cell lysate
antibodies in patients with active disease. As with antibody titers, there was no pattern
of association seen with TH1or TH2 cytokines, and despite the large number of
correlations with IgG avidity scores, no overall pattern was observed.
3.3.8 Antibody titers and avidity scores to environmental mycobacteria
As shown in Figure 6 and Figure 7, subjects with no evidence of TB infection had
detectable antibody to the surface of live M. tuberculosis and to all four antigenic
fractions derived from M. tuberculosis. Humans are exposed to environmental
mycobacteria with significant antigenic similarity to M. tuberculosis. We generated
protein lysates from M. tuberculosis H37Rv, and the type strains of M. intracellulare, M.
avium, and M. fortuitum. We compared antibody titers to these lysates in our nine
uninfected and a randomly selected group of ten patients with active TB disease
(Appendix B, Figure 34A‐D). Uninfected patients had modest antibodies to lysates from
all four mycobacterial species, and these titers were increased to all four species in all
patients with active TB (Δ=0.65 to 0.76 log10). Among those with active TB disease,
antibody titers to the M. tuberculosis protein lysates were correlated to antibody titers to
M. avium (r2=0.92, p<0.001), M. intracellulare (r2=0.94, p<0.001), and M. fortuitum (r2=0.58,
p=0.01) as shown in Figure 34E‐G (Appendix B).
63
As shown in Figure 6C, relative IgG avidity to the surface of live M. tuberculosis
was lower in persons with active TB disease than in uninfected patients. We measured
antibody titers and relative IgG avidity to the surface of environmental mycobacteria to
determine whether this reduced avidity is specific to M. tuberculosis. Antibody titers to
the surface of M. avium, M. intracellulare, and M. fortuitum did not differ significantly
between uninfected patients and patients with active TB disease (Figure 8A‐C). Relative
IgG avidity did not differ between uninfected volunteers and individuals with active TB
disease for the surface of live M. intracellulare (Δ=0.37, p=0.37) or the surface of live M.
avium (Δ=0.62, p=0.33) (Figure 8D‐E). Patients with active TB disease had increased IgG
avidity to the surface of live M. fortuitum (Δ=1.54, p=0.01).

64
Figure 8: Reactivity of human plasma to surface of environmental mycobacteria
Plasma from PPD‐negative volunteers (Uninfected), patients with latent TB infection
(Latent), or patients with active TB disease (Active) were assayed by ELISA against the
surface of live M. intracellulare (A,D) M. avium (B,E), and M. fortuitum (C,F). Log10 total Ig
titers and relative IgG avidity are displayed. Two‐sided p‐values by student’s t‐test or
Mann‐Whitney test: (*) p ≤ 0.05, (**) p ≤ 0.01, (***) p ≤ 0.001.
3.4 Discussion
Previous work has characterized the human humoral response against M.
tuberculosis by examining selected antigens to determine their utility for inclusion in
diagnostic tests for tuberculosis, or as potential biomarkers [164,241‐251]. Our results are

65
in agreement with an overarching principle from these studies. Antibody titers in
persons with latent TB infection or active TB disease are highly variable, and overlap
with the titers found in uninfected individuals [249‐252]. We observed a wide range of
antibody titers among patients with active TB disease to the surface of live M.
tuberculosis and to all four antigenic fractions (Figure 6, Figure 7). In each case, titers
from patients with active TB disease overlapped with titers from uninfected subjects.
In addition our work has identified that antibodies to the surface of M.
tuberculosis do not follow the same trends as antibodies against other M. tuberculosis
antigens. While patients with active disease have slightly elevated titers compared to
uninfected controls, there is a decrease in avidity, and no increase in the IgG/IgM ratio
(Figure 6), suggesting that there is a prolonged IgM response to the live surface of M.
tuberculosis. This contrasts with antibodies to whole cell lysate, secreted proteins, and
two components of the cell wall: LAM, and the cell wall fraction. The decrease of avidity
to cell surface antigens may represent a lowering of overall avidity, conversion of
antibodies from IgM to low‐avidity IgG, or exhaustion of B‐cells producing higher‐
avidity antibodies. The absence of increased avidity is notable none the less, as surface‐
binding antibodies are a potentially protective class, and humans lack high titer‐high
avidity antibodies against the surface. We identified three clinical factors (BCG
vaccination, race/ethnicity, and country of origin) in persons with active TB disease that

66
were strongly correlated with antibody titer (Table 5) and relative IgG avidity (Table 6)
to the live M. tuberculosis surface. These factors were not correlated with antibody titers
or relative IgG avidity to the inactivated antigenic fractions.
Numerous studies have examined the correlation of a variety of clinical factors
with antibody production in tuberculosis and other diseases, though none have
evaluated antibodies to the surface of live M. tuberculosis. While these studies have
examined numerous factors found in this study including age [253], country of origin,
BCG vaccination status and gender [254], HIV status [255], , disease site [246], , and PPD
size [256], their results have varied depending on the antigen or cellular fraction used to
quantitate antibody levels. Among persons with active TB disease, higher surface‐
binding antibody titers and higher relative IgG avidity were strongly correlated with
BCG vaccination, foreign birth, and with race/ ethnicity of either white Hispanic or
Asian. Lower surface‐binding antibody titers were associated with increasing age and
with HIV seropositivity (Table 6).
There was high overlap among the clinical variables of BCG vaccination, country
of birth, and race/ethnicity among patient with active TB disease: 100% of BCG
vaccinated patients were foreign born, 91% of BCG unvaccinated patients were US born,
and 77% of patients identifying themselves as black were US born and BCG
unvaccinated. This overlap was too high to permit meaningful multivariate analysis.
67
The association with higher surface‐binding antibodies may be primarily driven by one
of these three factors, but the present data set does not define this factor. Other studies
have examined race, BCG vaccination status, and country of origin in relation to
antibody responses to antigenic fractions from M. tuberculosis [254,257,258]. Associations
were noted with country of origin, but not with race or BCG vaccination. None of these
studies evaluated antibodies to the surface of live M. tuberculosis.
Antibody titer and antibody avidity have been identified as correlates of
protection for other bacterial vaccines including vaccines against Haemophilus influenzae,
Streptococcus pneumoniae, and Bordetella pertussis [97,98,259,260]. BCG vaccines may
induce increased antibody titers and increased relative avidity to the surface of M.
tuberculosis, and surface‐binding antibodies may serve as a correlate of vaccine‐induced
protection. These questions could be tested using samples from BCG vaccine trials.
Among active TB disease patients, lower surface‐binding antibody titers were
associated with increasing age (r=‐0.35, p=0.027) (Table 5). A similar association was
seen for antibodies to lipoarabinomannan (r=‐0.35, p=0.027) (Appendix B, Table 16), and
trends were seen with other antigenic fractions. Elderly patients also have reduced
antibody responses to vaccination [253]. Previous work focusing on TB has shown either
a negative correlation between antibody titer and age, or no correlation at all depending
on the specific antigens studied [246,254].

68
Among patients with active TB disease, HIV seropositivity was associated with
lower surface‐binding antibody titers (Δ=0.5 log10) (Table 5). Other studies have shown
that HIV infection induces dysregulation in antibody responses to LAM, altering IgG
subtype profiles, and decreasing the levels of IgG2 anti‐M. tuberculosis antibodies as
compared to HIV negative controls [255]. In both aging and HIV infection, T‐cells are
also affected. Increased age is also known to lead to a collapse in T‐Cell diversity [261]
and function [262], while HIV infection leads to a decrease in CD4+ T‐Cell count [263].
Older age and HIV infection are both associated with reactivation TB disease. While T‐
cells are primarily responsible for controlling M. tuberculosis infection [264‐266], our
results raise the possibility of a role for surface‐binding antibodies as well.
We also examined cytokine levels in whole blood after TB‐specific antigen
stimulation for all patients with latent TB infection and ten active TB disease patients
(Appendix B, Table 22). No meaningful correlations were found for either antibody titer
or antibody avidity. Elevated levels of Th2 cytokines, promote B‐cell proliferation and
differentiation to antibody‐producing plasma cells [267] and humans with active TB
disease have also been demonstrated to generate Th2‐like profiles in response to
mycobacterial antigens [268]. However, studies in mice have demonstrated altered
cytokine profiles over the course of infection, starting with a pro‐inflammatory TH1
response, and switching to a TH0 balance (equal amounts of IL‐2 and IL‐4 production)
69
during chronic infection [269]. Having a cross‐sectional study design with patients at
varying stages of disease may have hidden disease‐state dependent cytokine differences
We examined the antibody response to the surface of other live environmental
mycobacteria to determine if the decreased avidity score observed to the surface of live
M. tuberculosis was species‐specific. As expected, antibodies from humans with active
disease cross‐reacted with protein lysates as well as the live surface of M. avium, M.
intracellulare, and M. fortuitum. (Figure 8; Appendix B, Figure 34). This is unsurprising
as previous studies have shown monoclonal antibodies produced against M. tuberculosis
cross react with numerous other mycobacterial species including M. kansasii, M. gastri,
M. fortuitum and M. marinum [167]. The cross‐reactive nature of mycobacterial antibodies
may also explain the presence of M. tuberculosis specific antibodies in the uninfected
control population. Notably, however, avidity scores did not decrease in individuals
with active TB disease to the surface of live environmental microbes, indicating that the
decreased avidity to the surface of M. tuberculosis is species‐specific.
The cohort used for this study has several limitations which affect the scope of
our conclusions. Due to the cross‐sectional nature of this study, we cannot determine
whether antibodies to the surface of M. tuberculosis reduce progression to disease in
patients with latent TB infection, and we are unable to track changes in antibody levels
associated with successful treatment. Prospective studies of patients with latent TB

70
infection and active TB disease would provide additional insights. We also did not
collect data on parasitic infection, in any of our patient groups. The presence of parasites
can induce Th2‐polarize adaptive immune responses, which could mask correlations
between biomarkers and antibody titers/IgG avidity scores [270]. Our uninfected cohort
is also small. Despite its low number, antibody titers and avidity scores had a similar
range and standard deviation as latently infected and actively diseased individuals. In
addition our uninfected cohort contained no BCG vaccinated individuals, making us
unable to comment on the ability of the BCG vaccine to generate high titer/high avidity
surface‐binding antibodies in the absence of M. tuberculosis infection. Expansion of this
cohort to include individuals with BCG vaccination, HIV seropositivity and a higher
percentage of foreign born individuals would provide important information on the
baseline status of surface‐binding antibodies across a broad population.
Our ELISA assay also utilizes bacteria grown in liquid media in the presence of
tyloxapol to reduce bacterial clumping. As tyloxapol has the potential to alter the
bacterial surface, the surface of these culture‐grown bacteria may differ from the surface
of M. tuberculosis that is present in human tissues or sputum [271]. Future studies
detailing changes to the surface of the bacteria when grown in vivo versus in vitro will
enable us to better characterize the human surface‐binding antibody response to the
most physiologically relevant form of the bacterium.
71
Natural TB infection in humans results in incomplete protection from re‐
infection [53]; therefore, a fully effective vaccine may need to generate responses not
found in infected humans. Antibodies to many microbes have the capacity to alter
infection rate when they are present at the time of exposure, and novel TB vaccines with
the goal of preventing infection may need to rely on antibodies, a they can be present in
the lung at the time of infection [272]. Our work demonstrates that most humans with
active TB infection lack high avidity surface‐binding antibodies. Vaccines targeting
specific antigenic components or epitopes that are accessible on the surface of M.
tuberculosis may induce high‐avidity surface‐binding antibodies. Further research is
warranted into the potential protective role of high‐avidity antibodies to the M.
tuberculosis surface.
In summary, these data demonstrate the difference between antibody responses
to the surface of live M. tuberculosis and the responses to inactivated cellular fractions.
When compared to uninfected humans, patients with active TB disease had increased
avidity to cellular fractions, but decreased avidity to the M. tuberculosis surface. Patients
with active TB disease also had increased IgG/IgM ratios to cellular fractions but not to
the M. tuberculosis surface. Lastly, higher surface‐binding antibody titers were correlated
with clinical factors associated with reduced rates of active TB disease: BCG vaccination,
younger age, and HIV seronegativity. As highly‐avid antibodies to surface components
72
of other bacteria are associated with protection, the lack of high‐avidity antibodies to the
surface of M. tuberculosis in humans is notable.
3.5 Future directions
Although this study has generated interesting hypotheses regarding the use of
surface‐binding antibodies as clinical correlates and the failure of humans with active
disease to produce high‐avidity, high titer surface‐binding antibodies, its cross sectional
nature limits its power. Future studies need longitudinal samples, preferably pre‐ and
post‐BCG vaccination, with sufficient clinical tracking to diagnose both latent TB
infection and active TB disease years after enrollment. Large cohorts, with these
characteristics, and uniform countries of origin, exist and plasma from enrollees could
be used to expand on our findings [273,274].
In our study, BCG vaccinated individuals with active disease possess higher‐
titer, higher‐avidity surface‐binding antibodies, than their non‐vaccinated counterparts
(Table 5, Table 6). While factors such as antigen‐specific CD4+ T‐cells, and pro‐
inflammatory cytokine production are critical for disease control, currently, no true
correlates for BCG mediated protection are known [90,275]. Antibodies are correlates of
protection for numerous other vaccines against both viral and bacterial pathogens [276].
However, due to a high degree of confounding between race, country of origin, and
BCG vaccination status, it was impossible to determine if BCG vaccination was the

73
driving factor behind the higher‐titer/higher‐avidity surface‐binding antibodies. To test
the hypothesis that BCG vaccination drove the difference, future studies should
compare surface‐binding antibody titers and relative IgG avidity in BCG vaccinated and
unvaccinated individuals, while controlling for race and country of origin. In addition, it
would be interesting to compare baseline surface‐binding antibody levels in BCG
vaccinated individuals who become infected after exposure to M. tuberculosis, to those
who do not, to determine if surface‐binding antibody levels are a predictor of the failure
of BCG vaccination to protect.
Another intriguing conclusion from our study is that surface‐binding antibodies
have decreased avidity in individuals with active TB disease as compared to uninfected
controls (Figure 6). Examination of relative IgG avidity in longitudinal samples from the
same individual prior to, and after the contraction of TB infection, would elucidate if this
finding is an artifact of the cohorts used. Decreasing IgG avidity over the course of
infection is not unique to M. tuberculosis, as infection of mice with the tapeworm parasite
Echinococcus granulosus leads to decreasing avidity, and corresponding IgG subclass
change over the course of infection[277]. If avidity is observed to decrease in the same
individual over the course of disease, two pronged additional studies should follow.
Standard and avidity ELISA assays of sequential plasma samples can determine if the
decreased avidity is due to a shifting of IgG subclasses from one with higher relative

74
avidity to one with lower relative avidity. Additionally, isolation and immortalization of
plasma and memory B‐cells, followed by sequencing of individual B‐cell clones at
multiple time points, can monitor if there is constant conversion of antibodies from IgM
to low‐avidity IgG, or if there is exhaustion of B‐cells producing high avidity antibodies.
Lastly, in this study, HIV + individuals with active TB disease had decreased
antibody titers to the surface of live M. tuberculosis, but not antigenic fractions, as
compared with HIV ‐ patients (Table 5; Appendix B, Table 16). However, the number
of seropositive individuals examined was small (n=7). HIV seropositivity is known to
impair the formation of some, but not all, antibodies post vaccination, as well as
decrease pre‐existing antibody levels, and trigger shifts in IgG subclass [255,278‐280].
Obtaining plasma samples from a larger cohort of HIV patients to validate this finding is
essential. If HIV seropositivity is confirmed to lead to decreased surface‐binding
antibody titers, the correlation between antibody titers and T‐Cell levels should be
determined. Demonstrating a CD4+ T‐Cell dependence for surface‐binding, but not
other M. tuberculosis antibodies, would provide valuable information on the formation
and maintenance of these potentially critical antibodies during infection.
75
4. Surface-binding antibodies decrease bacterial burden in the murine lung by blocking M. tuberculosis uptake
4.1 Introduction
Antibodies that bind to the surface of bacteria are capable of preventing both
colonization and infection [94,95] . However, humoral immunity has been disregarded
as a potential protective mechanism against M. tuberculosis, largely due to the failure of
passive protection studies at the turn of the 20th century [148]. Recently, there has been
renewed interest in antibody‐mediated immunity to M. tuberculosis, especially as it
related to vaccine design [107]. Monoclonal antibodies have been shown to be protective
in mice, and serum antibody levels correlate with reduced disease severity and impaired
dissemination in humans [188,189,191‐195,281,282]. On the basis of these studies, we
hypothesized that antibodies, specifically those against the surface of the bacteria, could
alter interactions between M. tuberculosis and host immune cells, changing the course of
early infection.
In this study we have identified murine monoclonal antibodies that bind to the
surface of live M. tuberculosis. Surface‐binding, but not non‐surface‐binding antibodies
decrease early pulmonary burden in mice, through an agglutination independent
mechanism, when mixed with M. tuberculosis prior to infection. These changes in early
CFU are accompanied in vivo by a decrease in the number of infected cells, and a change
76
in the cell types that are infected. The ability of surface‐binding antibodies to alter early
infection events makes them a promising component of anti‐infective vaccines.
4.2 Methods
4.2.1 Hybridoma generation
Female BALB/c mice were vaccinated five times intraperitoneally with 50μg of
either purified H47rV heat‐shock protein‐X (HSP‐X) (BEI, NR‐14860), LAM or Apa (BEI
Resources, NR‐14862) diluted 1:1 in SAS adjuvant (Sigma, S6322). Vaccinations occurred
at two week intervals, with a final boost of antigen alone coming three days prior to
fusion. Splenocytes and NS0 Bcl2 myeloma cells were fused using polyethylene glycol
(Roche, 10783641001) according to manufacturer’s instructions. After fusion, cells were
grown in selection media (RPMI 1640, 10% Fetal Calf Serum (FCS) (GE Healthcare,
SH3008002), 1% non‐essential amino acids (Gibco, 11140‐050), 2 mM glutamine, 1 mM
sodium pyruvate (Gibco, 11360‐070), 2% HAT‐media supplement (Duke Cell Culture
Facility, H0262‐VL), and 10% J774A.1 cell supernatant).
Ten to fourteen days after fusion hybridoma supernatants were screened by
ELISA against H37Rv whole cell lysate and their cognate antigens. LAM and Apa
vaccinated mice were screened against the purified antigen used for vaccination, while
HSP‐X vaccinated mice were screened against a recombinant HSP‐X reference standard
(BEI Resources, NR‐31384). Hybridoma lines with high reactivity to both their cognate

77
antigen and whole cell lysate were cloned by limiting dilution. A cell line was
considered clonal when after repeated limiting dilutions, 20/20 clones demonstrated
reactivity to their cognate antigen. Once clonal, cell lines were adapted to hybridoma
growth media (DMEM/F‐12+ glutamax (Gibco, 10565‐018), 1% antibiotic/antimycotic
(GE Healthcare, SV3007901), 10% J774A.1 cell supernatant, 10% FCS, 0.7% β‐
mercaptoethanol (Sigma, M2650)) for propagation and freezing.
4.2.2 Hybridoma growth and antibody purification
Hybridoma lines were next adapted to serum free hybridoma media (SFM
Hybridoma media (Gibco, 1245‐076) with 1% antibiotic/antimycotic). After adaptation,
cells were washed and incubated in serum free hybridoma media in either 1000mL or
300mL cell‐line flasks (VWR WCL1000 and WCL0350). Media in flasks was changed
weekly.
Supernatant from cell line flasks was spun at 200g for six minutes, and then
filtered through a 0.45 μM filter prior to antibody purification. Supernatants were
purified on HiTrap protein G columns (GE Healthcare, 17‐040‐01) according to
manufacturer’s instructions. In brief, columns were washed with binding buffer (20mM
Na2HPO4, pH 7.0), followed by application of hybridoma supernatants diluted 1:1 in
binding buffer. The column was then washed in binding buffer, followed by antibody
elution from the column in 0.1 M glycine‐HCl, pH 2.7. Eluant was immediately restored
78
to neutral pH with 1M Tris‐HCL, pH 9.0. All samples were passed over the column at
1mL/min flow rate, and purified antibody concentrations were determined via the
Nanodrop 2000 (Thermo Scientific).
All samples with over a 0.250mg/mL concentration were buffered exchanged by
centrifugation (Millipore, 4307) into PBS. The isotypes of purified antibodies were
determined using IsoStrip mouse monoclonal antibody isotyping kit (Roche,
11493027001).
4.2.3 Antibodies
In addition to the antibodies generated in this study, hybridoma lines for eight
additional M. tuberculosis‐specific antibodies (gift of Karen Dobos) along with three
control antibodies (gift of Barton Haynes) were obtain. A list of all antibodies used, their
isotypes, sources, and targets can be found in Table 7. Surface‐binding antibody pools
were also tested. A list of the components and ratios for these antibody pools can be
found in Table 8.
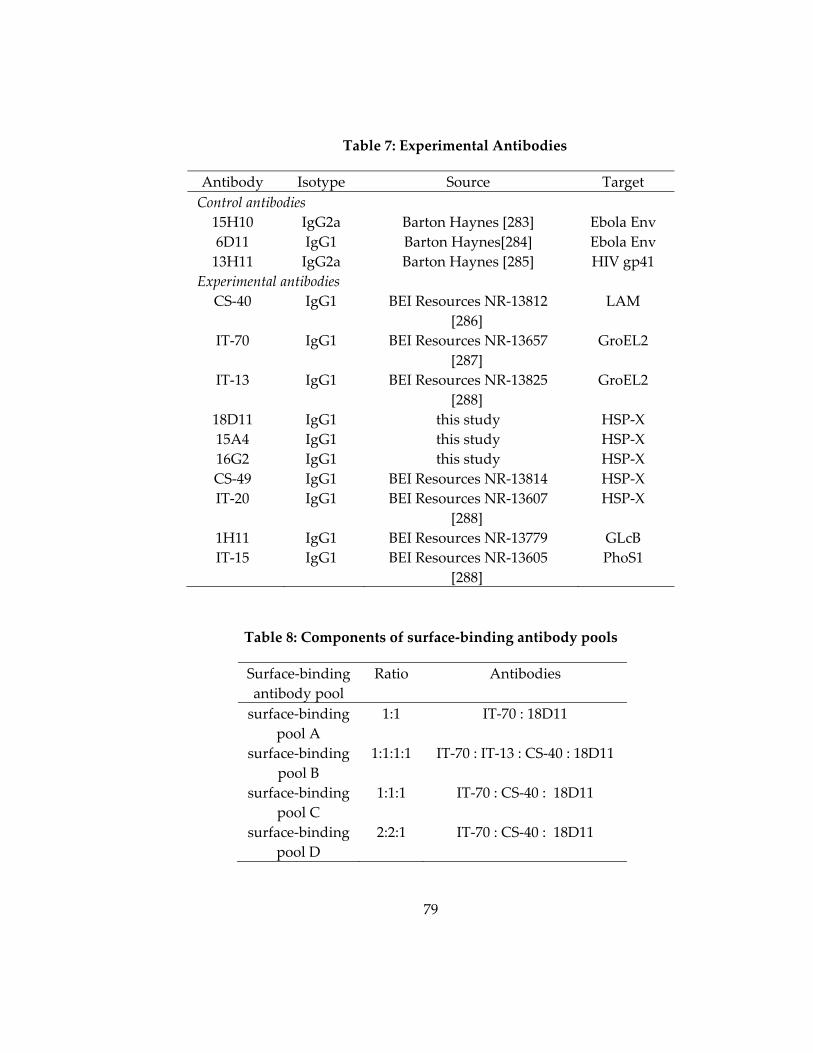
79
Table 7: Experimental Antibodies
Antibody Isotype Source Target
Control antibodies
15H10 IgG2a Barton Haynes [283] Ebola Env
6D11 IgG1 Barton Haynes[284] Ebola Env
13H11 IgG2a Barton Haynes [285] HIV gp41
Experimental antibodies
CS‐40 IgG1 BEI Resources NR‐13812
[286]
LAM
IT‐70 IgG1 BEI Resources NR‐13657
[287]
GroEL2
IT‐13 IgG1 BEI Resources NR‐13825
[288]
GroEL2
18D11 IgG1 this study HSP‐X
15A4 IgG1 this study HSP‐X
16G2 IgG1 this study HSP‐X
CS‐49 IgG1 BEI Resources NR‐13814 HSP‐X
IT‐20 IgG1 BEI Resources NR‐13607
[288]
HSP‐X
1H11 IgG1 BEI Resources NR‐13779 GLcB
IT‐15 IgG1 BEI Resources NR‐13605
[288]
PhoS1
Table 8: Components of surface‐binding antibody pools
Surface‐binding
antibody pool
Ratio Antibodies
surface‐binding
pool A
1:1 IT‐70 : 18D11
surface‐binding
pool B
1:1:1:1 IT‐70 : IT‐13 : CS‐40 : 18D11
surface‐binding
pool C
1:1:1 IT‐70 : CS‐40 : 18D11
surface‐binding
pool D
2:2:1 IT‐70 : CS‐40 : 18D11

80
4.2.4 ELISA assay
The experimental protocol for both antigenic and C‐ELISA assays can be found
in Chapter 3, with a few minor alterations. First, in addition to whole cell lysate and
LAM, the HSP‐X recombinant reference standard and the soluble cell wall protein
fraction (BEI Resources, NR‐ 14840) were used as antigens. Second, since the samples
assayed were mouse, not human, a 1:32 dilution of sera from a mice with chronic M.
tuberculosis was used as a positive control, and a 1:3000 dilution of alkaline‐phosphatase
conjugated goat‐anti‐mouse‐IgG (Sigma, A7434) was used as the secondary antibody.
Third, assay results are displayed as the OD value at a 0.25mg/mL concentration for
purified antibodies and at a 1:64 dilution for murine sera.
4.2.5 Avidity ELISA assay
The experimental protocol for the avidity ELISA assay can be found in Chapter 3,
and was performed using the same murine‐specific secondary antibody and positive
control described above.
4.2.6 Murine immune sera
Twelve week old female BALB/c mice were infected with a viable aerosol
concentration of 0.38 CFU/mL of M. tuberculosis as described in Chapter 5. Blood was
harvested from the submandibular vein every two weeks for one year post infection.
Sera were isolated as described in Chapter 2.
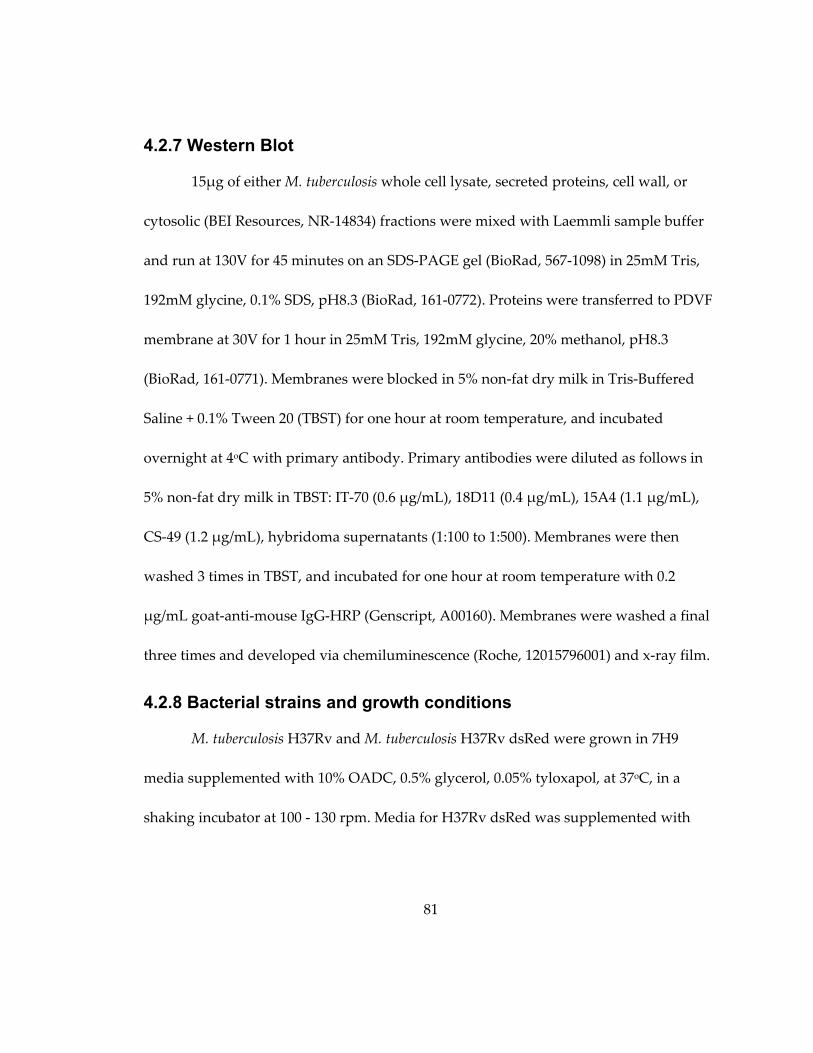
81
4.2.7 Western Blot
15μg of either M. tuberculosis whole cell lysate, secreted proteins, cell wall, or
cytosolic (BEI Resources, NR‐14834) fractions were mixed with Laemmli sample buffer
and run at 130V for 45 minutes on an SDS‐PAGE gel (BioRad, 567‐1098) in 25mM Tris,
192mM glycine, 0.1% SDS, pH8.3 (BioRad, 161‐0772). Proteins were transferred to PDVF
membrane at 30V for 1 hour in 25mM Tris, 192mM glycine, 20% methanol, pH8.3
(BioRad, 161‐0771). Membranes were blocked in 5% non‐fat dry milk in Tris‐Buffered
Saline + 0.1% Tween 20 (TBST) for one hour at room temperature, and incubated
overnight at 4oC with primary antibody. Primary antibodies were diluted as follows in
5% non‐fat dry milk in TBST: IT‐70 (0.6 μg/mL), 18D11 (0.4 μg/mL), 15A4 (1.1 μg/mL),
CS‐49 (1.2 μg/mL), hybridoma supernatants (1:100 to 1:500). Membranes were then
washed 3 times in TBST, and incubated for one hour at room temperature with 0.2
μg/mL goat‐anti‐mouse IgG‐HRP (Genscript, A00160). Membranes were washed a final
three times and developed via chemiluminescence (Roche, 12015796001) and x‐ray film.
4.2.8 Bacterial strains and growth conditions
M. tuberculosis H37Rv and M. tuberculosis H37Rv dsRed were grown in 7H9
media supplemented with 10% OADC, 0.5% glycerol, 0.05% tyloxapol, at 37oC, in a
shaking incubator at 100 ‐ 130 rpm. Media for H37Rv dsRed was supplemented with

82
1μg/mL kanamycin (Sigma, K0129). For CFU determination, M. tuberculosis H37Rv was
grown on the in house 7H10 agar plates described in Chapter 2.
4.2.9 Biotin fixation to M. tuberculosis
M. tuberculosis biotin fixation was adapted from Jhingran et al [289]. To optimize
the ratio of biotin to M. tuberculosis H37Rv dsRed, log phase bacteria were washed in
50mM carbonate buffer. Varying concentrations of bacteria were then rotated with 0.5
mg/mL Biotin‐XX, SSE (Invitrogen, B‐6352) for two hours at 4oC, in 1mL of 50mM
carbonate buffer. Bacteria were washed in 0.1M Tris‐HCL pH 8.0, and stained with
0.02mg/mL FITC‐streptavidin (Life technologies, SNN1008) at room temperature for 30
minutes. FITC signal intensity served as a proxy for the amount of biotin affixed to the
surface. Live bacteria were phenotyped using a FACSAria II SORP and FACSDiva™ 8.0.
Single bacteria were identified on the basis of forward side scatter profiles, and dsRed
positivity (Figure 9). Mean FITC‐intensity increased in a concentration dependent
manner. 0.5 mg/mL Biotin‐XX,SSE per OD 1.0 M. tuberculosis was selected as the
optimum ratio for future studies.
For cell culture and animal experiments M. tuberculosis H37Rv was grown to log
phase and resuspended in 50mM carbonate buffer. 2x10⁸ bacteria were rotated with 0.5
mg/mL of Biotin‐XX, SSE for two hours at 4oC in 1mL of 50mM carbonate buffer.
Bacteria were then washed in 0.1M Tris‐HCL pH 8.0, resuspended in either PBS or cell
83
culture media, and incubated with BTN.4, an IgG1 anti‐biotin antibody (Thermo
Scientific, MA5‐11251), in lieu of M. tuberculosis specific antibodies.
Figure 9: Optimization of biotin fixation to M. tuberculosis
Varying amounts of M. tuberculosis H37Rv dsRed were incubated with 0.5 mg/mL biotin
for two hours at 4C, prior to washing with 0.1M Tris‐HCL (pH 8). After the wash
bacteria were labeled with 0.02 mg/mL FITC –streptavidin in PBS for 30 minutes prior to
flow cytometry. (A) gating strategy for isolating single bacteria (B) Histograms of mean
FITC fluorescence (C) plot of mean FITC intensity per mg/OD∙mL of biotin.
84
4.2.10 Macrophage uptake and survival assay
Raw 264.7 cells were grown to 50‐80% confluence in Raw growth media (DMEM
(Gibco, 11965‐084) with 10% FBS, 1% antibiotic/antimycotic, 1% sodium pyruvate, and
1% non‐essential amino acids). Cells were washed in Raw cell experimental media
(DMEM with 10% FBS, 1% sodium pyruvate and 1% non‐essential amino acids), plated
in 96‐well plates at ~10,000 cells per well, and left to settle at 37oC.
Log phase H37Rv was washed twice in PBS‐Ty and resuspended in Raw cell
experimental media. 5x10⁴ bacteria were incubated with varying concentrations of
antibody or media alone for 30 minutes prior to incubation with cells for two hours at
4oC to synchronize uptake. Infection occurred for two hours at 37oC. After infection cells
were washed with Raw experimental media, and incubated for 1 hour at 37oC in Raw
experimental media containing 1μg /mL streptomycin (Sigma, S6501) to remove
extracellular bacteria. Cells were then either lysed in de‐ionized water (dH2O), or
incubated overnight, in antibiotic‐free Raw experimental media, at 37oC and lysed at
twenty‐four hours post infection. Lysates were serially diluted in PBS‐Ty, and plated.
Data is displayed as percent of no antibody control. Normalized twenty‐four hour data
was calculated by dividing the percent of no antibody control at twenty‐four hours by
the average percent of no antibody control at three hours.
85
4.2.11 Bacterial clumping assay
M. tuberculosis H3Rv was grown to OD 0.78, washed twice in PBS‐Ty, and
resuspended to a final OD of 0.1 in PBS‐Ty. 1x10⁵ bacteria were incubated with either
PBS‐Ty or 60μg of antibody in a total volume of 50μL for 15 minutes at room
temperature. Samples were then serially diluted, and plated on 7H10 agar plates. Each
antibody was tested in triplicate.
4.2.12 Mice
Six week old female wild‐type BALB/c mice from National Cancer Institute
(01B05) were housed in the RBL at Duke University for at least one week prior to M.
tuberculosis exposure under environmental conditions and protocols described in
Chapter 2.
4.2.13 Isolation of dsRed M. tuberculosis from peritoneal lavage
M. tuberculosis H37Rv dsRed was washed twice in PBS‐Ty and resuspended to a
final OD of 1.0. Fifteen ten‐week old female BALB/c mice were injected intraperitoneally
with 1x10⁷ bacteria in 100μL. One week post infection, mice were sacrificed by isoflurane
overdose, with M. tuberculosis dsRed recovered from the peritoneal cavity via peritoneal
lavage with 5 mL of PBS‐Ty. Peritoneal lavages were spun at 200g for 10 minutes, with
the resulting pellet lysed in RIPA buffer (Sigma, R0278) to free intracellular M.
tuberculosis. Samples were then resuspended in 400 μL of PBS‐Ty and dsRed positive
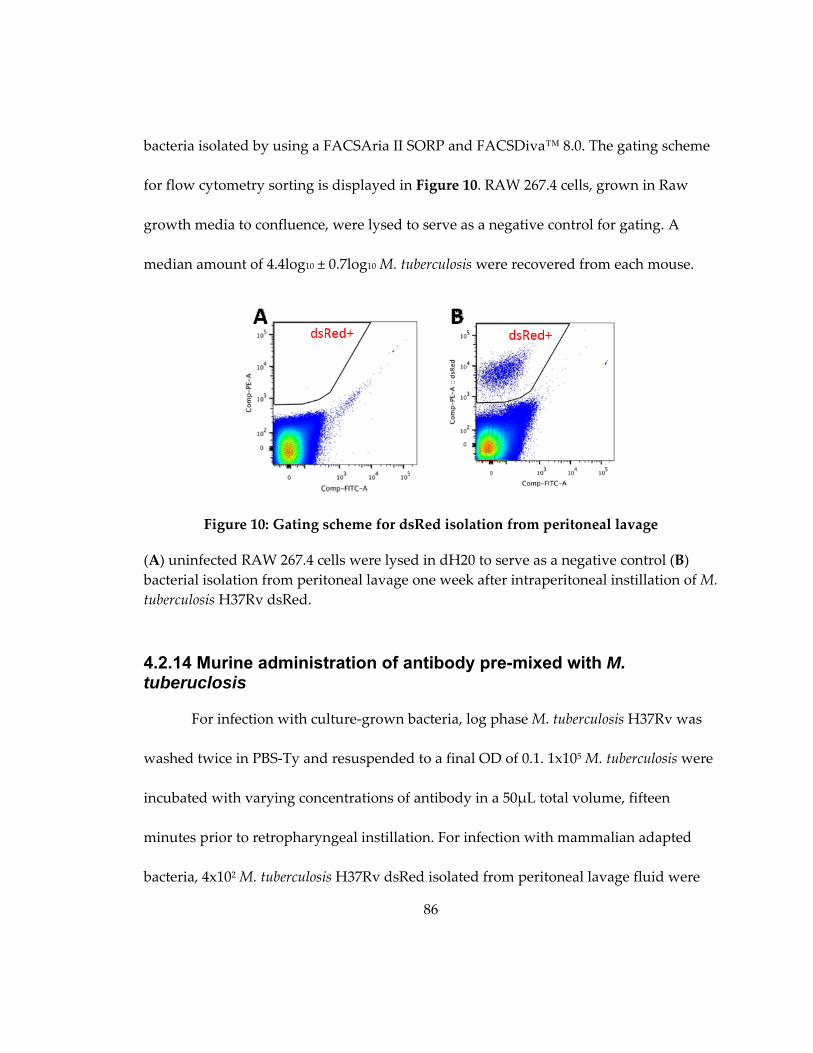
86
bacteria isolated by using a FACSAria II SORP and FACSDiva™ 8.0. The gating scheme
for flow cytometry sorting is displayed in Figure 10. RAW 267.4 cells, grown in Raw
growth media to confluence, were lysed to serve as a negative control for gating. A
median amount of 4.4log10 ± 0.7log10 M. tuberculosis were recovered from each mouse.
Figure 10: Gating scheme for dsRed isolation from peritoneal lavage
(A) uninfected RAW 267.4 cells were lysed in dH20 to serve as a negative control (B)
bacterial isolation from peritoneal lavage one week after intraperitoneal instillation of M.
tuberculosis H37Rv dsRed.
4.2.14 Murine administration of antibody pre-mixed with M. tuberuclosis
For infection with culture‐grown bacteria, log phase M. tuberculosis H37Rv was
washed twice in PBS‐Ty and resuspended to a final OD of 0.1. 1x10⁵ M. tuberculosis were
incubated with varying concentrations of antibody in a 50μL total volume, fifteen
minutes prior to retropharyngeal instillation. For infection with mammalian adapted
bacteria, 4x10² M. tuberculosis H37Rv dsRed isolated from peritoneal lavage fluid were

87
incubated with 30μg of antibody in a 50 μL total volume for fifteen minutes prior to
retropharyngeal instillation.
Mice were sacrificed at either three of six days post retropharyngeal exposure.
Murine lungs were manually homogenized in PBS‐Ty. After homogenization lungs were
serially diluted in PBS‐Ty prior to plating. Sterility of homogenates was ascertained by
plating on Chocolate II agar with hemoglobin and IsoVitalex. CFUs were counted after
3‐4 week incubation at 37oC.
4.2.15 Single cell suspension of infected mouse lung and pneumocyte staining
Seven week old female BALB/c mice were instilled with either PBS, 2.4x10⁵ M.
tuberculosis or 2.4x10⁵ M. tuberculosis mixed with 60μg of surface‐binding pool C as
previously described. Mice were sacrificed at two, twenty‐four, and seventy‐two hours
post infection, and lungs were harvested for processing. The protocol for pneumocyte
isolation and cell staining is the same as found in Chapter 2. Prior to flow cytometry,
10% of the total pneumocyte preparation was removed for CFU determination by
plating.
4.2.16 Flow cytometry analysis
The gating scheme for flow cytometry analysis is shown in Figure 11. Single cells
were discriminated from electronic noise by forward‐scatter area vs. side scatter area.
Live cells were then selected on the basis of Live/Dead fixable yellow stain exclusion. On

88
the basis of published literature cell types were delineated on the basis of GR‐1, CD11b,
and CD11c positivity [27,213]. Non‐neutrophilic cells were separated from neutrophils
by GR‐1 signal, with neutrophils ultimately being identified as GR1+ CD11b+. GR1‐ cells
were then gated into three groups on the basis of CD11b and CD11c signal. (1) alveolar
macrophages (CD11blo CD11chi) (2) migratory macrophages (CD11bhi CD11clo) (3)
monocyes (CD11bhi CD11cneg). Infected cells were discriminated on the basis of dsRed
positivity, with their cell type determined by applying the gates previously described
(Figure 11). The average amount of dsRed background signal was determined using six
uninstilled control mice. A representative image of an infected and an uninfected mouse
can be found in (Figure 12). All reported values for infected cells have been background
subtracted. Flowjo v10.0 was used for all flow cytometry analysis.
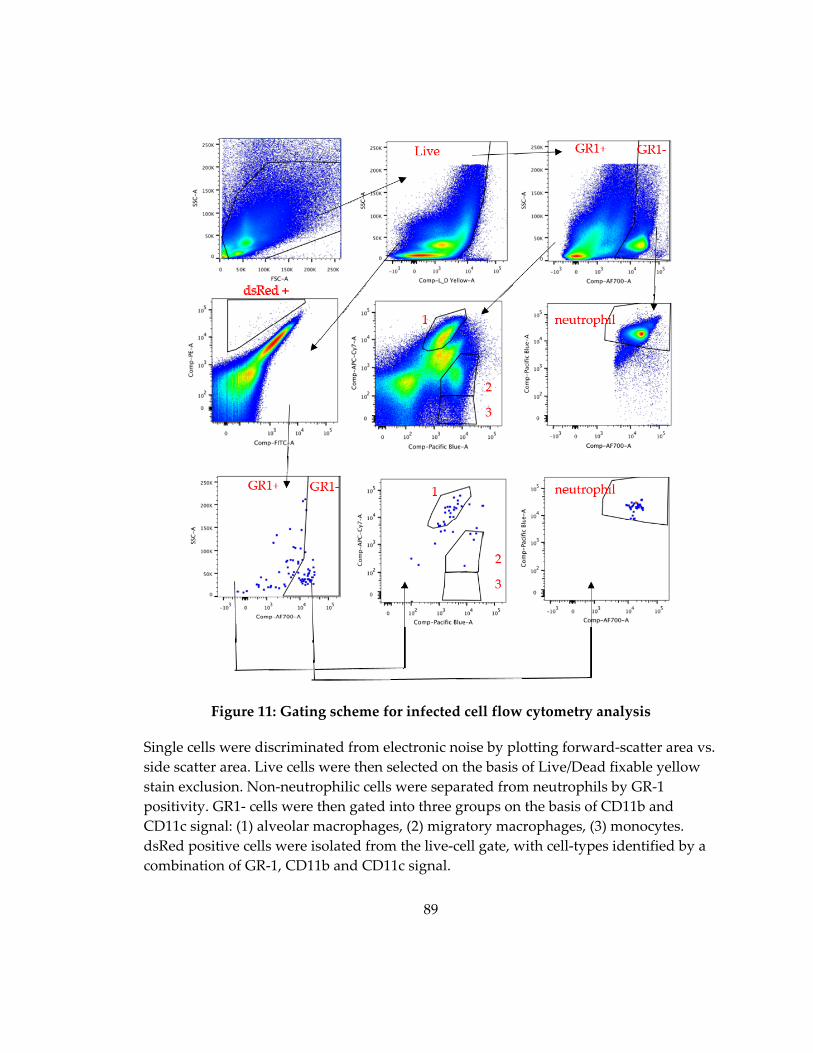
89
Figure 11: Gating scheme for infected cell flow cytometry analysis
Single cells were discriminated from electronic noise by plotting forward‐scatter area vs.
side scatter area. Live cells were then selected on the basis of Live/Dead fixable yellow
stain exclusion. Non‐neutrophilic cells were separated from neutrophils by GR‐1
positivity. GR1‐ cells were then gated into three groups on the basis of CD11b and
CD11c signal: (1) alveolar macrophages, (2) migratory macrophages, (3) monocytes.
dsRed positive cells were isolated from the live‐cell gate, with cell‐types identified by a
combination of GR‐1, CD11b and CD11c signal.
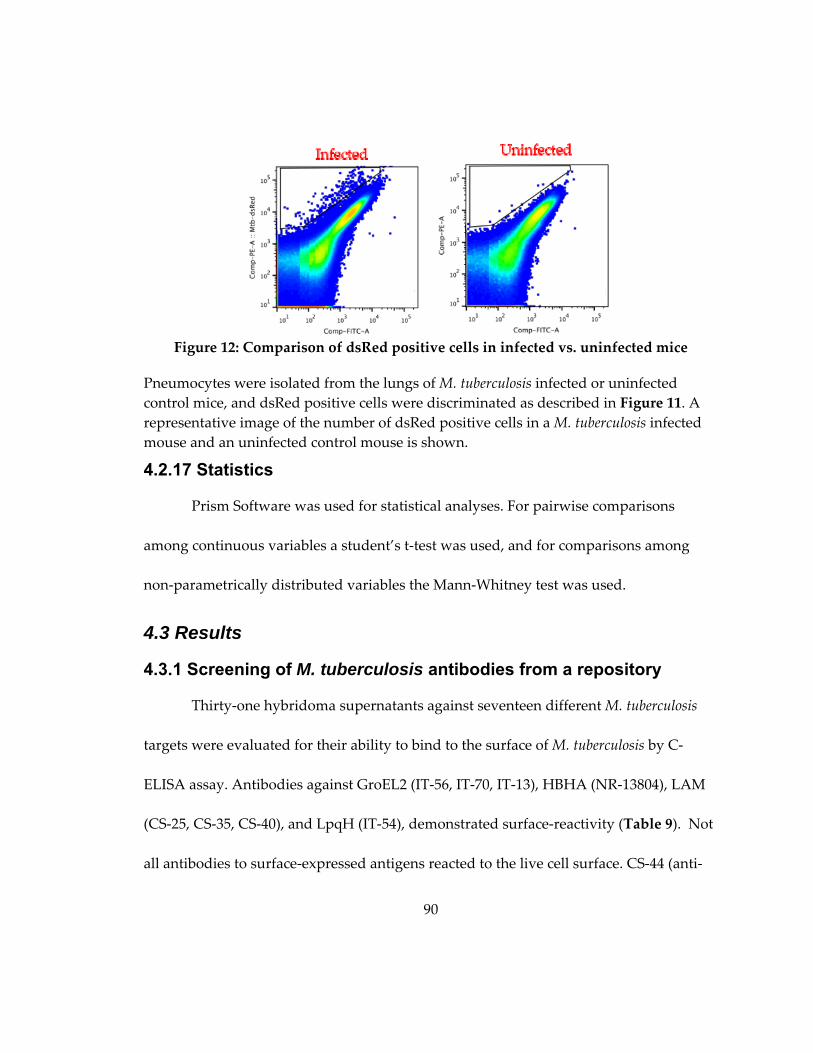
90
Figure 12: Comparison of dsRed positive cells in infected vs. uninfected mice
Pneumocytes were isolated from the lungs of M. tuberculosis infected or uninfected
control mice, and dsRed positive cells were discriminated as described in Figure 11. A
representative image of the number of dsRed positive cells in a M. tuberculosis infected
mouse and an uninfected control mouse is shown.
4.2.17 Statistics
Prism Software was used for statistical analyses. For pairwise comparisons
among continuous variables a student’s t‐test was used, and for comparisons among
non‐parametrically distributed variables the Mann‐Whitney test was used.
4.3 Results
4.3.1 Screening of M. tuberculosis antibodies from a repository
Thirty‐one hybridoma supernatants against seventeen different M. tuberculosis
targets were evaluated for their ability to bind to the surface of M. tuberculosis by C‐
ELISA assay. Antibodies against GroEL2 (IT‐56, IT‐70, IT‐13), HBHA (NR‐13804), LAM
(CS‐25, CS‐35, CS‐40), and LpqH (IT‐54), demonstrated surface‐reactivity (Table 9). Not
all antibodies to surface‐expressed antigens reacted to the live cell surface. CS‐44 (anti‐
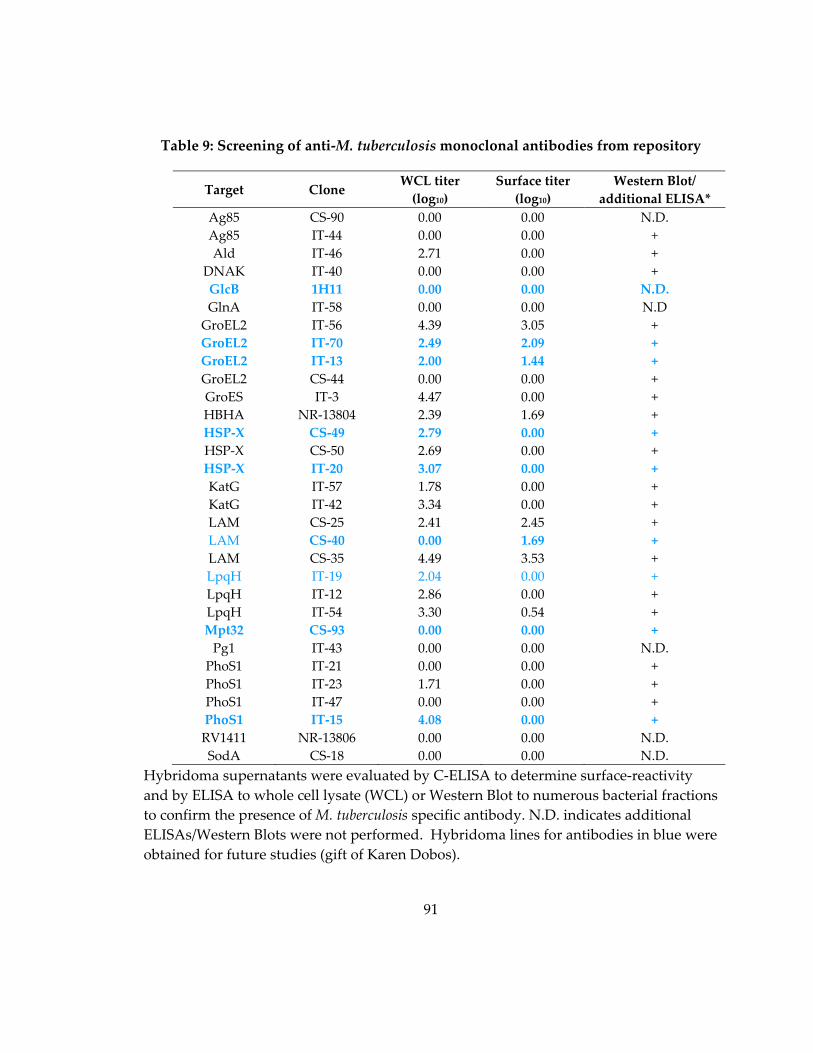
91
Table 9: Screening of anti‐M. tuberculosis monoclonal antibodies from repository
Target Clone WCL titer
(log10)
Surface titer
(log10)
Western Blot/
additional ELISA*
Ag85 CS‐90 0.00 0.00 N.D.
Ag85 IT‐44 0.00 0.00 +
Ald IT‐46 2.71 0.00 +
DNAK IT‐40 0.00 0.00 +
GlcB 1H11 0.00 0.00 N.D.
GlnA IT‐58 0.00 0.00 N.D
GroEL2 IT‐56 4.39 3.05 +
GroEL2 IT‐70 2.49 2.09 +
GroEL2 IT‐13 2.00 1.44 +
GroEL2 CS‐44 0.00 0.00 +
GroES IT‐3 4.47 0.00 +
HBHA NR‐13804 2.39 1.69 +
HSP‐X CS‐49 2.79 0.00 +
HSP‐X CS‐50 2.69 0.00 +
HSP‐X IT‐20 3.07 0.00 +
KatG IT‐57 1.78 0.00 +
KatG IT‐42 3.34 0.00 +
LAM CS‐25 2.41 2.45 +
LAM CS‐40 0.00 1.69 +
LAM CS‐35 4.49 3.53 +
LpqH IT‐19 2.04 0.00 +
LpqH IT‐12 2.86 0.00 +
LpqH IT‐54 3.30 0.54 +
Mpt32 CS‐93 0.00 0.00 +
Pg1 IT‐43 0.00 0.00 N.D.
PhoS1 IT‐21 0.00 0.00 +
PhoS1 IT‐23 1.71 0.00 +
PhoS1 IT‐47 0.00 0.00 +
PhoS1 IT‐15 4.08 0.00 +
RV1411 NR‐13806 0.00 0.00 N.D.
SodA CS‐18 0.00 0.00 N.D.
Hybridoma supernatants were evaluated by C‐ELISA to determine surface‐reactivity
and by ELISA to whole cell lysate (WCL) or Western Blot to numerous bacterial fractions
to confirm the presence of M. tuberculosis specific antibody. N.D. indicates additional
ELISAs/Western Blots were not performed. Hybridoma lines for antibodies in blue were
obtained for future studies (gift of Karen Dobos).
92
GroEL2), and both IT‐19 and IT‐12 (anti‐LpqH), lacked surface‐reactivity, suggesting
they bind to non‐exposed sections of the target molecule. To confirm the presence of
antibody in supernatants from non‐surface‐binding antibodies, ELISA assays and
western blots to whole cell lysate, secreted proteins, and the cell wall and cytosolic
fractions were conducted.
4.3.2 Generation and screening of surface-binding antibodies against LAM, HSP-X and Apa
Groups of three mice were immunized five times with either LAM, HSP‐X or
Apa adjuvanted with SAS, an oil in water immersion. IgG antibody titers were
monitored after each vaccination. LAM vaccinated mice did not develop IgG antibody
titers to the immunogen, and hybridomas to the lipopolysaccharide were not generated.
One Apa vaccinated mouse, and two HSP‐X vaccinated mice with high IgG antibody‐
titers to both the surface of M. tuberculosis and their cognate antigen were sacrificed to
produce hybridomas.
The supernatants from approximately two‐thousand hybridomas, derived from
HSP‐X vaccinated mice, were screened against whole cell lysate and recombinant HSP‐X
by ELISA. Based on a positive signal of twice background for both whole cell lysate and
HSP‐X, fifty‐seven hybridomas were identified as producing HSP‐X antibodies. Of these
fifty‐seven, only four (7.0%) reacted against the cell‐surface as measured by the C‐ELISA
93
assay. One surface‐binding (18D11) and two non‐surface‐binding (15A4, 16G2)
antibodies were cloned by limiting dilution for further study.
The supernatants from approximately eleven‐hundred hybridomas, derived
from Apa vaccinated mice, were screened against whole cell lysate and purified Apa
protein by ELISA. Based on a positive signal of twice background to both whole cell
lysate and Apa, two hybridomas were identified as producing Apa antibodies. One of
these dual reactive clones demonstrated surface‐binding reactivity by C‐ELISA assay,
but was lost to contamination. Using the less stringent cut‐off of a positive signal of
twice background to Apa alone, an additional one‐hundred and twenty‐eight
hybridomas were identified for future screening. Two of these clones demonstrated
weak surface‐binding reactivity. No Apa antibodies were selected for further study.
4.3.3 Purified antibody reactivity to M. tuberculosis fractions and the live cell surface
Purified monoclonal antibodies were assayed by ELISA to determine target
abundance in whole cell lysate, the soluble cell wall protein fraction and the live M.
tuberculosis surface as measured by the OD value at 0.25mg/mL antibody concentration
(Table 10). Five antibodies (IT‐70, 18D11, 15A4, 16G2, CS‐49 had strong reactivity (OD
>1.0) to whole cell lysate and moderately strong reactivity (OD>0.5) to the soluble cell
wall protein fraction. Three antibodies, IT‐20, CS‐40 and IT‐15 possessed weak reactivity
(0.5< OD) to both preparations. 6D11, an IgG1 isotype control antibody, and 1H11
94
demonstrated no‐reactivity to either fraction. Polyclonal sera from chronically infected
mice was also evaluated for comparison at a 1:64 dilution. The average OD to whole cell
lysate was 3.15 ± 0.57, a value higher than any monoclonal antibody tested.
In agreement with the initial hybridoma supernatant screens only three
antibodies, CS‐40, IT‐70, and 18D11 reacted against the surface, though peak OD values
were low (0.18‐0.3) (Table 10). Sera from chronically infected mice had an average peak
OD of 2.10 ±1.01, a value at least seven times higher than any purified monoclonal
antibody tested.
To confirm the ability of purified antibodies to bind to their cognate antigen
antibodies were tested by ELISA for reactivity to either LAM (CS‐40), or HSP‐X (18D11,
15A4, 16G2, CS‐49, IT‐20). Cognate antigens to GroEL2 (IT‐70), PhoS1 (IT‐15), and GlcB
(1H11) were unavailable. All antibodies bound well to their cognate antigen. OD values
for all anti‐HSP‐X antibodies were greater than 1.0, and CS‐40 possessed significantly
higher reactivity to purified LAM than to whole cell lysate (2.70 vs. 0.12).

95
Table 10: Peak OD values for monoclonal antibodies to M. tuberculosis fractions and
the live cell surface
Antibody Whole Cell
Lysate OD*
Soluble Cell
Wall Protein
OD*
Live M.
tuberculosis
Surface OD*
Surface
binders
CS‐40 0.12 0.23 0.28
IT‐70 1.44 0.91 0.30
18D11 1.99 0.98 0.18
Non
Surface
Binders
15A4 1.85 0.52 0.03
16G2 1.61 0.48 0.04
CS‐49 1.41 0.99 0.08
IT‐20 0.52 0.30 0.07
1H11 0.00 0.00 0.00
IT‐15 0.23 0.13 0.03
Controls 6D11 0.00 0.00 0.03
Murine Polyclonal sera 3.15 ± 0.57 2.10 ±1.01
* The OD value at 0.25mg/mL for purified antibodies and a 1:64 dilution for sera is
displayed. The OD is an average of n=3 for purified antibodies on whole cell lysate and
the soluble cell wall protein fraction, and n=3 to n=6 for live cell surface with the
exception of 6D11 (n=1). Peak OD values for murine polyclonal sera, drawn from mice
32 weeks post aerosol M. tuberculosis exposure, are displayed as mean ± SEM (n=5).
Table 11: Peak OD values for monoclonal antibodies to their cognate antigens
Purified antibodies were tested against their cognate antigens by ELISA. OD value is
average of n=3 at 0.25m/mL concentration.
Antigen Antibody
Cognate
antigen OD*
Surface‐binder LAM CS‐40 2.70
Surface‐binder
HSP‐X
18D11 1.26
Non‐surface‐binder 15A4 1.19
Non‐surface‐binder 16G2 1.50
Non‐surface‐binder CS‐49 1.07
Non‐surface‐binder IT‐20 1.58
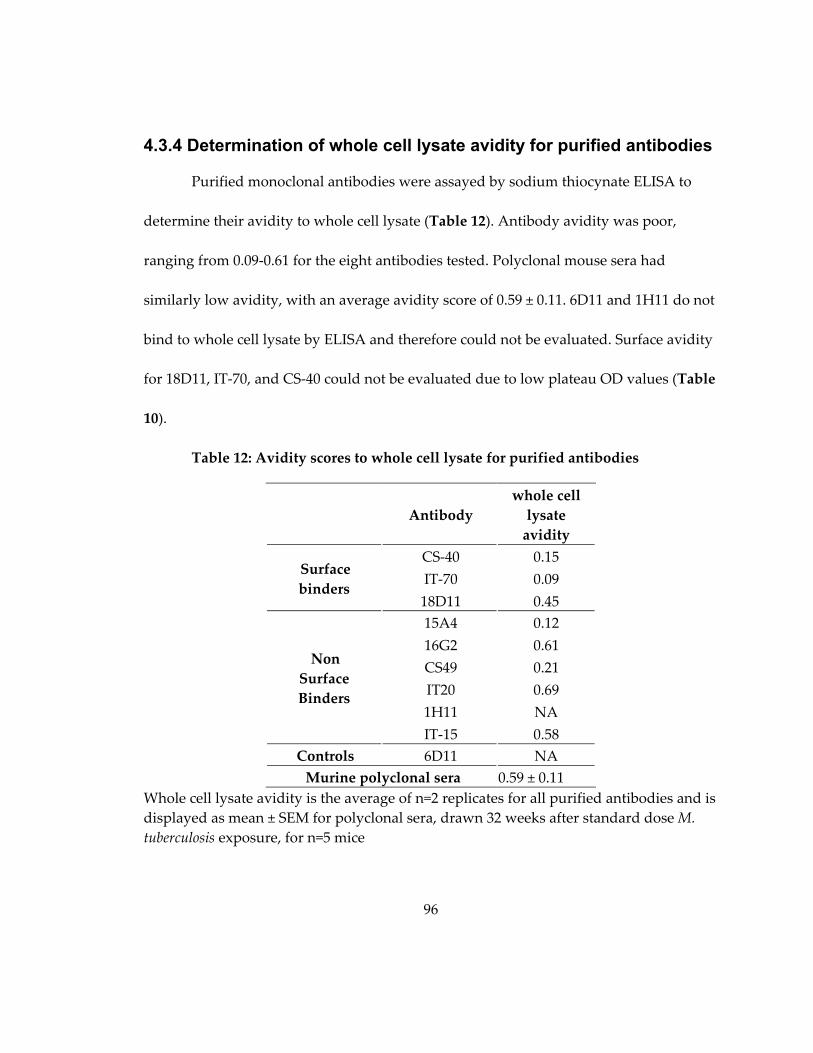
96
4.3.4 Determination of whole cell lysate avidity for purified antibodies
Purified monoclonal antibodies were assayed by sodium thiocynate ELISA to
determine their avidity to whole cell lysate (Table 12). Antibody avidity was poor,
ranging from 0.09‐0.61 for the eight antibodies tested. Polyclonal mouse sera had
similarly low avidity, with an average avidity score of 0.59 ± 0.11. 6D11 and 1H11 do not
bind to whole cell lysate by ELISA and therefore could not be evaluated. Surface avidity
for 18D11, IT‐70, and CS‐40 could not be evaluated due to low plateau OD values (Table
10).
Table 12: Avidity scores to whole cell lysate for purified antibodies
Antibody
whole cell
lysate
avidity
Surface
binders
CS‐40 0.15
IT‐70 0.09
18D11 0.45
Non
Surface
Binders
15A4 0.12
16G2 0.61
CS49 0.21
IT20 0.69
1H11 NA
IT‐15 0.58
Controls 6D11 NA
Murine polyclonal sera 0.59 ± 0.11
Whole cell lysate avidity is the average of n=2 replicates for all purified antibodies and is
displayed as mean ± SEM for polyclonal sera, drawn 32 weeks after standard dose M.
tuberculosis exposure, for n=5 mice

97
4.3.5 Purified M. tuberculosis antibodies bind to linear epitopes and are polyreactive
To further confirm that antibodies recognize their cognate antigens, and to
examine if they are polyreactive, purified antibodies were assayed against whole cell
lysate by Western Blot. All anti‐HSP‐X antibodies assayed (18D11, CS‐49, 15A4),
recognized a band at approximately 15 kDa, the molecular mass of the HSP‐X protein.
IT‐70, an anti‐GroEL2 antibody, recognized a band at approximately 75 kDa, near the
known molecular weight of the GroEL2 protein (70 kDa) (Figure 13).
Figure 13: M. tuberculosis monoclonal antibodies are polyreactive
M. tuberculosis monoclonal antibodies were assayed against whole cell lysate by Western
Blot. Antibody concentrations range from 0.4 μg/mL to 1.2 μg/mL.
98
All antibodies, regardless of their ability to bind to the live M. tuberculosis surface
reacted non‐specifically with M. tuberculosis components (Figure 13). The ability to bind
to non‐specific targets decreases with antibody concentration, but binding ability to the
cognate antigen remains (data not shown).
4.3.6 Pre-mixing of biotin coated M. tuberculosis with antibody, prior to macrophage infection, decreases bacterial burden
The M. tuberculosis antibodies in this study are of low avidity. To test if
antibodies with high avidity to a surface moiety can alter bacterial burden in
macrophages, biotin was affixed to the surface of live M. tuberculosis H37Rv. Biotin
coated bacteria were then incubated with BTN.4, a commercially available high‐affinity
anti‐biotin antibody, at varying concentrations prior to infection of murine
macrophages. At three hours post‐infection BTN.4 decreased the number of recoverable
bacteria in a concentration dependent manner, with a maximal decrease of 59.6%
(p=0.019) with respect to the no antibody control (Figure 14). A similar trend was seen at
twenty‐four hours post infection. Incubation with 5 μg of BTN.4 resulted in a maximal
decrease of 68.1%.When twenty‐four hour bacterial counts were normalized to three
hour bacterial counts, no statistically significant decreases in twenty‐four hour survival
were observed (Figure 14).

99
Figure 14: BTM.4 decreases biotin‐coated M. tuberculosis survival in macrophages
Biotin coated M. tuberculosis was mixed with BTN.4 for thirty minutes prior to Raw
264.7 cell infection at an MOI of 5. After incubation at 4oC for two hours, to ensure
synchronization of uptake, cells were then incubated at 37oC for two hours, washed, and
incubated with media containing 1μg/mL streptomycin for an additional hour at 37oC to
kill extracellular bacteria. Cells were then either lysed with dH20 (three hour time point),
or incubated overnight at 37oC in antibiotic free media for lysis at twenty‐four hours.
Graph depicts mean ± SEM for three replicates, except for 5μg of BTN.4 at twenty‐four
hours (n=2). Normalized twenty‐four hour data was calculated by dividing the percent
of no PBS control at twenty‐four hours by the average percent of no PBS control at three
hours. Statistical significance was calculated using Student’s t‐test: (*) p<0.05, (**) p<0.01,
(***) p<0.001.
4.3.7 Pre-mixing of M. tuberculosis with surface-binding antibodies prior to macrophage infection decreases bacterial burden
We next examined if M. tuberculosis surface‐binding antibodies could decrease
bacterial survival in a similar manner. M. tuberculosis H37Rv was pre‐incubated with a
concentration series of 6D11, an IgG1 control antibody, or surface‐binding antibodies
prior to macrophage infection. At three and twenty‐four hours after inoculation,
macrophages were lysed in water, and titered to determine the number of viable
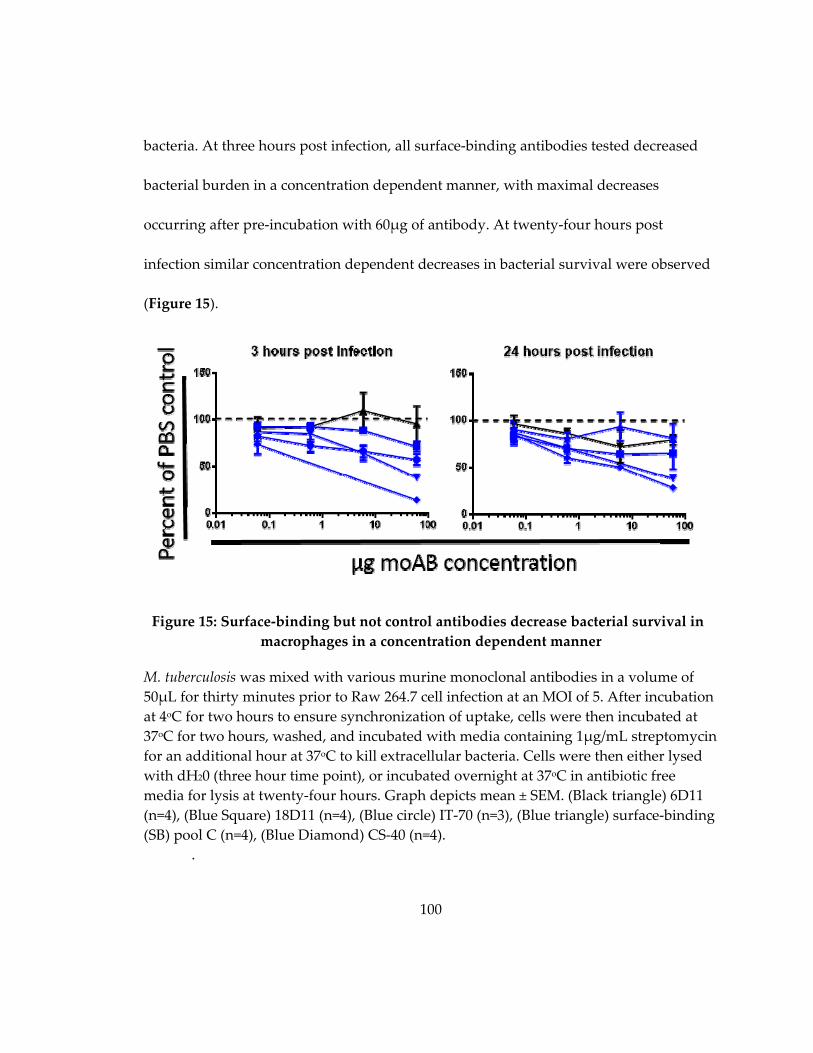
100
bacteria. At three hours post infection, all surface‐binding antibodies tested decreased
bacterial burden in a concentration dependent manner, with maximal decreases
occurring after pre‐incubation with 60μg of antibody. At twenty‐four hours post
infection similar concentration dependent decreases in bacterial survival were observed
(Figure 15).
Figure 15: Surface‐binding but not control antibodies decrease bacterial survival in
macrophages in a concentration dependent manner
M. tuberculosis was mixed with various murine monoclonal antibodies in a volume of
50μL for thirty minutes prior to Raw 264.7 cell infection at an MOI of 5. After incubation
at 4oC for two hours to ensure synchronization of uptake, cells were then incubated at
37oC for two hours, washed, and incubated with media containing 1μg/mL streptomycin
for an additional hour at 37oC to kill extracellular bacteria. Cells were then either lysed
with dH20 (three hour time point), or incubated overnight at 37oC in antibiotic free
media for lysis at twenty‐four hours. Graph depicts mean ± SEM. (Black triangle) 6D11
(n=4), (Blue Square) 18D11 (n=4), (Blue circle) IT‐70 (n=3), (Blue triangle) surface‐binding
(SB) pool C (n=4), (Blue Diamond) CS‐40 (n=4).
.
101
To test if the ability to bind the surface of live M. tuberculosis was necessary for
the decreased bacterial burden after macrophage infection, bacteria were pre‐incubated
with 60μg of non‐surface‐binding antibodies prior to macrophage infection and
compared to pre‐incubation with 60μg of surface‐binding antibodies from the
concentration series in Figure 15. Pre‐mixing of M. tuberculosis with individual surface‐
binding antibodies led to significant reductions in bacterial CFU at three hours post
infection, ranging from ‐28.7% (18D11, p=0.002) to ‐86.4% (CS‐40, p<0.001), with IT‐70
falling in between (Δ= ‐43.0%, p=0.051). A pool of surface‐binding antibodies did not
perform differently than individual monoclonal antibodies, with pre‐incubation of M.
tuberculosis and surface‐binding pool C resulting in a maximal decrease of ‐62.0%
(p=0.005) (Figure 16A). None of the non‐surface‐binding antibodies, nor the control
antibody tested significantly decreased bacterial burden at 3 hours post infection.
At twenty‐four hours post infection the pattern remained the same (Figure 16B).
Pre‐incubation with both surface‐binding Pool C (Δ= ‐71.2%, p=0.015) and CS‐40 (Δ= ‐
38.0%, p=0.009) significantly decreased bacterial CFU, while pre‐incubation 18D11 (Δ= ‐
19.2%, p=0.26) and IT‐70 (Δ= ‐35.3%, p=0.13), trended towards decreased bacterial
burden though the difference was not statistically significant. Neither non‐surface‐
binding nor control antibodies exerted any effect on twenty‐four hour bacterial burden
(Figure 16B).

102
Figure 16: Surface‐binding, but not non‐surface‐binding antibodies decrease three
hour M. tuberculosis survival in murine macrophages
M. tuberculosis was mixed with 60μg of various control, surface‐binding and non‐
surface‐binding antibodies in a volume of 50μL for thirty minutes prior to infection. Raw
264.7 cells were infected at an MOI 5 and incubated at 4oC for two hours to ensure
synchronization of uptake. Cells were then incubated at 37oC for two hours, washed
with PBS, and incubated with media containing 1μg/mL streptomycin for an additional
hour at 37oC to kill extracellular bacteria. Following the incubation, cells were either
lysed with dH20 (3 hour time point), or incubated overnight at 37oC in antibiotic free
media for lysis at twenty‐four hours post infection. Normalized twenty‐four hour data
was calculated by dividing the percent of no PBS control at twenty‐four hours by the
average percent of no PBS control at three hours. Graph depicts mean ± SEM for n=4
except for IT‐70 where n=3. (White) IgG1 control antibody, (Green) non‐surface‐binding
antibody (Blue) surface‐binding antibody. Statistical significance was calculated using
Student’s t‐test: (*) p<0.05, (**) p<0.01, (***) p<0.001.
103
Additionally, twenty‐four hour bacterial burden was normalized to three hour
bacterial burden to determine if additional killing occurred in that time frame, or if the
differences seen at twenty‐four hours post infection were due solely to the differences
observed at the earlier time point. After normalization no antibody differed significantly
from the PBS control (Figure 16C).
4.3.8 Surface-binding antibodies do not induce bacterial agglutination
To test if surface‐binding antibodies mediated their effect by agglutination, as
measured by decreased bacterial CFU, M. tuberculosis was incubated with 60μg of
antibody in a 50μL volume for thirty minutes prior to titering. Neither surface‐binding
nor non‐surface‐binding antibodies agglutinated bacteria, with as the mean titer for all
antibodies tested fell within 15.3% of the PBS control (Table 13).
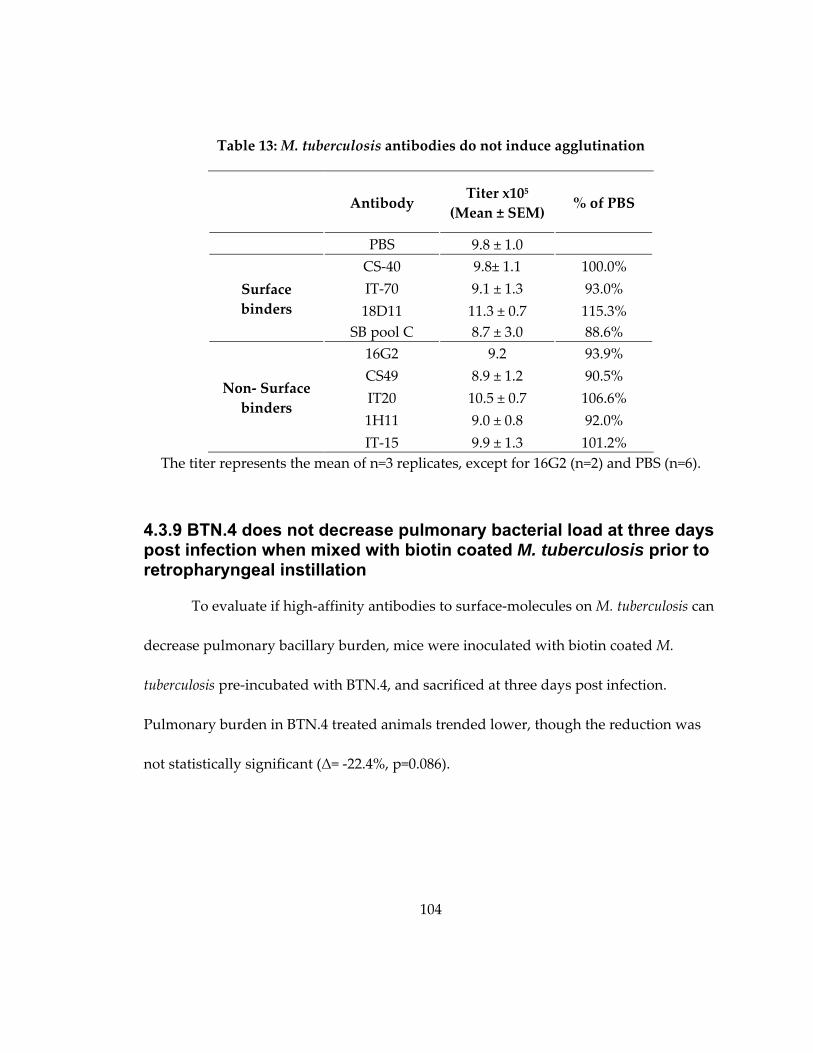
104
Table 13: M. tuberculosis antibodies do not induce agglutination
The titer represents the mean of n=3 replicates, except for 16G2 (n=2) and PBS (n=6).
4.3.9 BTN.4 does not decrease pulmonary bacterial load at three days post infection when mixed with biotin coated M. tuberculosis prior to retropharyngeal instillation
To evaluate if high‐affinity antibodies to surface‐molecules on M. tuberculosis can
decrease pulmonary bacillary burden, mice were inoculated with biotin coated M.
tuberculosis pre‐incubated with BTN.4, and sacrificed at three days post infection.
Pulmonary burden in BTN.4 treated animals trended lower, though the reduction was
not statistically significant (Δ= ‐22.4%, p=0.086).
Antibody Titer x105
(Mean ± SEM) % of PBS
PBS 9.8 ± 1.0
Surface
binders
CS‐40 9.8± 1.1 100.0%
IT‐70 9.1 ± 1.3 93.0%
18D11 11.3 ± 0.7 115.3%
SB pool C 8.7 ± 3.0 88.6%
Non‐ Surface
binders
16G2 9.2 93.9%
CS49 8.9 ± 1.2 90.5%
IT20 10.5 ± 0.7 106.6%
1H11 9.0 ± 0.8 92.0%
IT‐15 9.9 ± 1.3 101.2%

105
Figure 17: Pre‐incubation with BTN.4 does not decrease biotin coated M. tuberculosis
bacterial burden at three days post infection
Eight week old female BALB/c mice were instilled retropharyngeally with 1.1x10⁵ biotin
coated M. tuberculosis was mixed with 23 μg of BTN.4, an anti‐biotin antibody. Three
days after infection lungs were harvested for CFU determination. (Black) PBS (n=8)
(Red) BTN.4 (n=4). Mean ± SEM is displayed. Statistical significance was calculated
using Student’s t‐test: (*) p<0.05, (**) p<0.01, (***) p<0.001.
4.3.10 Surface-binding, but not non-surface-binding antibodies, decrease bacterial burden at three days post infection when mixed with M. tuberculosis prior to retropharyngeal instillation
Incubation with the high‐affinity BTN.4 antibody did not reduce pulmonary
bacterial burden at three days post‐infection; however the system is artificial. Biotin
coating of the surface may alter the initial interaction between M. tuberculosis and host
cells in a manner that makes the protective effect of antibodies less pronounced. To test
if surface‐binding antibodies, despite week avidity, could alter early bacterial burden,
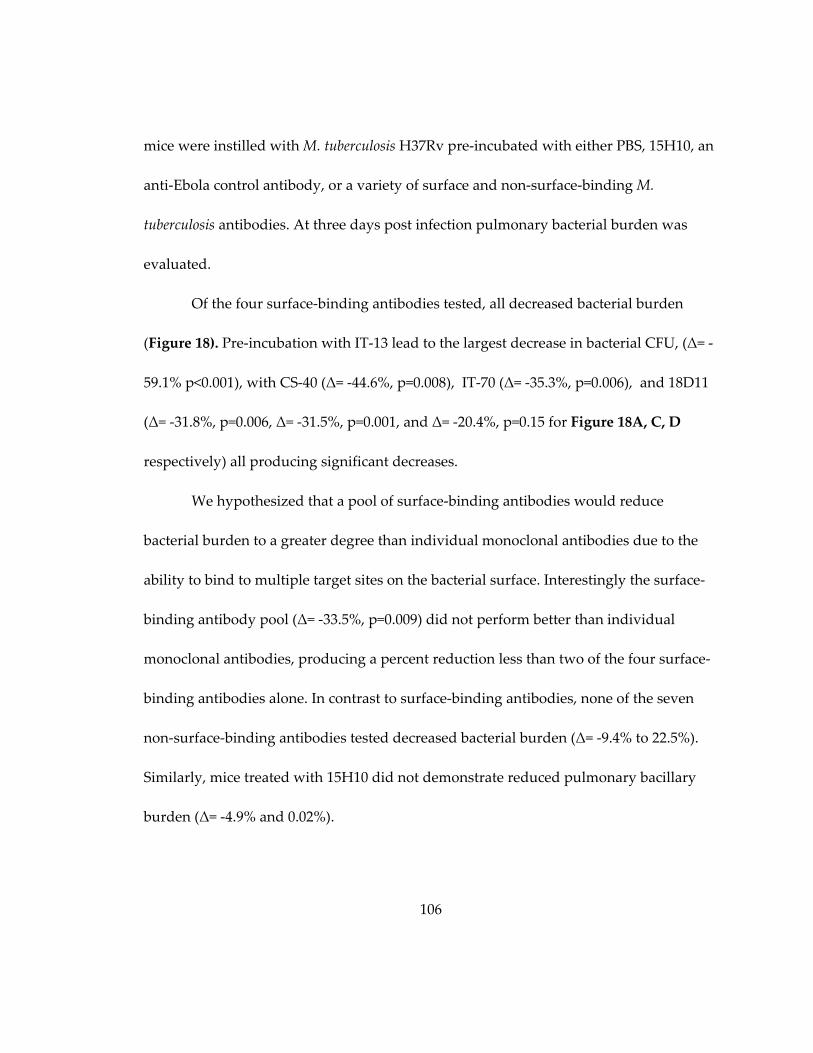
106
mice were instilled with M. tuberculosis H37Rv pre‐incubated with either PBS, 15H10, an
anti‐Ebola control antibody, or a variety of surface and non‐surface‐binding M.
tuberculosis antibodies. At three days post infection pulmonary bacterial burden was
evaluated.
Of the four surface‐binding antibodies tested, all decreased bacterial burden
(Figure 18). Pre‐incubation with IT‐13 lead to the largest decrease in bacterial CFU, (Δ= ‐
59.1% p<0.001), with CS‐40 (Δ= ‐44.6%, p=0.008), IT‐70 (Δ= ‐35.3%, p=0.006), and 18D11
(Δ= ‐31.8%, p=0.006, Δ= ‐31.5%, p=0.001, and Δ= ‐20.4%, p=0.15 for Figure 18A, C, D
respectively) all producing significant decreases.
We hypothesized that a pool of surface‐binding antibodies would reduce
bacterial burden to a greater degree than individual monoclonal antibodies due to the
ability to bind to multiple target sites on the bacterial surface. Interestingly the surface‐
binding antibody pool (Δ= ‐33.5%, p=0.009) did not perform better than individual
monoclonal antibodies, producing a percent reduction less than two of the four surface‐
binding antibodies alone. In contrast to surface‐binding antibodies, none of the seven
non‐surface‐binding antibodies tested decreased bacterial burden (Δ= ‐9.4% to 22.5%).
Similarly, mice treated with 15H10 did not demonstrate reduced pulmonary bacillary
burden (Δ= ‐4.9% and 0.02%).
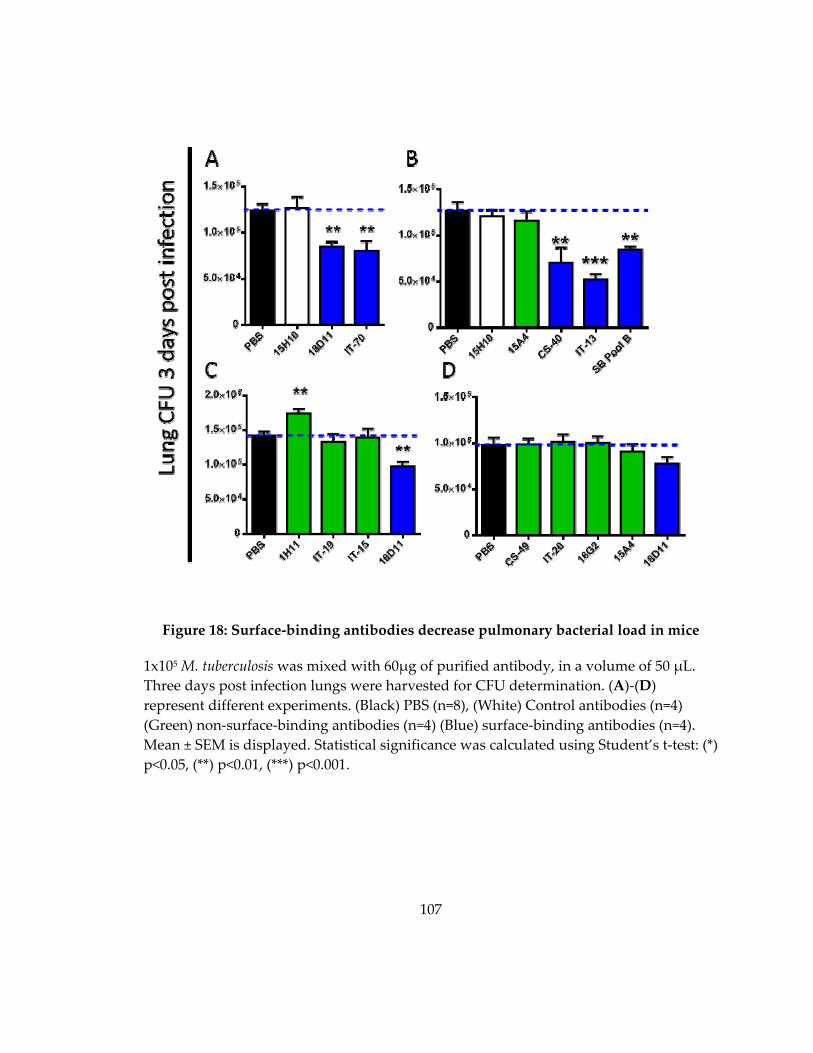
107
Figure 18: Surface‐binding antibodies decrease pulmonary bacterial load in mice
1x10⁵ M. tuberculosis was mixed with 60μg of purified antibody, in a volume of 50 μL.
Three days post infection lungs were harvested for CFU determination. (A)‐(D)
represent different experiments. (Black) PBS (n=8), (White) Control antibodies (n=4)
(Green) non‐surface‐binding antibodies (n=4) (Blue) surface‐binding antibodies (n=4).
Mean ± SEM is displayed. Statistical significance was calculated using Student’s t‐test: (*)
p<0.05, (**) p<0.01, (***) p<0.001.

108
4.3.11 Surface-binding antibodies decrease bacterial burden at three, but not six, days post infection when mixed with M. tuberculosis prior to retropharyngeal instillation
To test the duration of surface‐binding antibody mediated protection, mice were
infected with M. tuberculosis pre‐mixed with PBS, 13H11, an anti‐HIV control antibody,
15A4, a non‐surface‐binding antibody, or one of two surface‐binding antibodies and
sacrificed at three and six days post infection. Similarly to Figure 18, mice treated with
M. tuberculosis mixed with 60μg of surface‐binding antibodies had decreased pulmonary
bacterial burden at three days post infection (Δ= ‐47.9%, p=0.001 and Δ= ‐38.4%, p=0.02
for 18D11 and IT‐70 respectively). This decrease was largely independent of dose, as
30μg and 120μg of antibody yielded similar decreases (Figure 19).
The surface‐binding antibody mediated decrease in bacterial burden observed at
three days post infection was not present at six days post infection for IT‐70 (60μg Δ= ‐
6.3% , p=0.50), and was decreased in magnitude for 18D11 (30μg day 6 Δ= ‐26.5% ,
p=0.03 vs 30μg day 3 Δ= ‐34.5%, p=0.006). Interestingly, pre‐incubation with the non‐
surface‐binding antibody 15A4 decreased bacterial burden at six days post infection (Δ=
‐30.7%, p=0.03) despite not differing from the PBS control three days earlier (Δ= ‐3.1%,
p=0.86). The control antibody 13H11 did not have an effect at either time point (Figure
19).
109
Figure 19: Surface‐binding antibodies decrease bacterial burden at three, but not six,
days post retropharyngeal instillation
Between 1.3x 10⁵ and 2.3x10⁵ M. tuberculosis was mixed with various concentrations of
purified antibody in a volume of 50 μL. At three and six days post infection lungs were
harvested for CFU determination. (A) and (B) represent separate experiments. (Black)
PBS (n=8), (White) Control antibodies (n=4) (Green) non‐surface‐binding antibodies
(n=4) (Blue) surface‐binding antibodies (n=4). Mean ± SEM is displayed. Statistical
significance was calculated using Student’s t‐test: (*) p<0.05, (**) p<0.01, (***) p<0.001.

110
4.3.12 Pre-incubation with surface-binding antibodies reduces pulmonary bacterial load three days after infection with mammalian adapted bacteria
Cultured M. tuberculosis, grown to log phase, expresses different proteins than
bacteria grown inside of mammalian hosts [290]. To test if surface‐binding antibodies
decreased pulmonary bacterial burden when pre‐incubated with mammalian adapted
bacteria, M. tuberculosis H37Rv dsRed was grown intraperionteally in BALB/c mice for
one week. Bacteria were then isolated by flow cytometry on the basis of dsRed
fluorescence, and incubated with either PBS, control or surface‐binding antibodies.
Surface‐binding antibodies decreased three day bacterial burden, similarly to
when pre‐mixed with culture grown bacteria. 18D11 (Δ= ‐15.3%, p=0.053), and IT‐70 (Δ=
‐18.4%, p=0.045) both decreased pulmonary bacterial load, though surface‐binding pool
A decreased CFUs to a greater extent (Δ= ‐36.0%, p<0.001). This is in contrast to culture
grown bacteria, where pools of surface‐binding antibodies did not decrease bacterial
burden to a greater degree than individual monoclonal antibodies. The protection of
surface‐binding antibodies waned by day six, decreasing slightly in magnitude for both
18D11 and surface‐binding pool A. The differences for both individual monoclonal
antibodies and surface‐binding pool A were not statistically significant from the PBS
control at the later time point (IT‐70 Δ= ‐32.1%, p=0.065; 18D11 Δ= ‐11.6%, p=0.51;
surface‐binding pool A Δ= ‐32.7%, p=0.061) (Figure 20).

111
At three days post infection, pre‐incubation with non‐surface‐binding antibody
15A4 did not alter bacterial load in the lungs (Δ= 6.8%, p=0.51). By six days post
infection, however, there was a trend towards decreasing bacterial burden, though the
difference was not statistically significant (Δ= ‐29.2%, p=0.10). The 13H11 control
antibody had no effect at either time point.
Figure 20: Surface‐binding antibodies decrease pulmonary bacterial load three days
after infection with mammalian adapted bacteria
M. tuberculosis dsRed was harvested from mouse peritoneum, sorted by flow cytometry,
mixed with 30μg purified antibody and inoculated into female BALB/c mice by
retropharyngeal instillation. Lungs were harvested three days post infection and
homogenized in PBS‐Ty prior to plating. (Black) PBS (n=8), (White) Control antibodies
(n=4) (Green) non‐surface‐binding antibodies (n=4) (Blue) surface‐binding antibodies
(n=4). Mean ± SEM is displayed. Statistical significance was calculated using Student’s
test: (*) p<0.05, (**) p<0.01, (***) p<0.001.
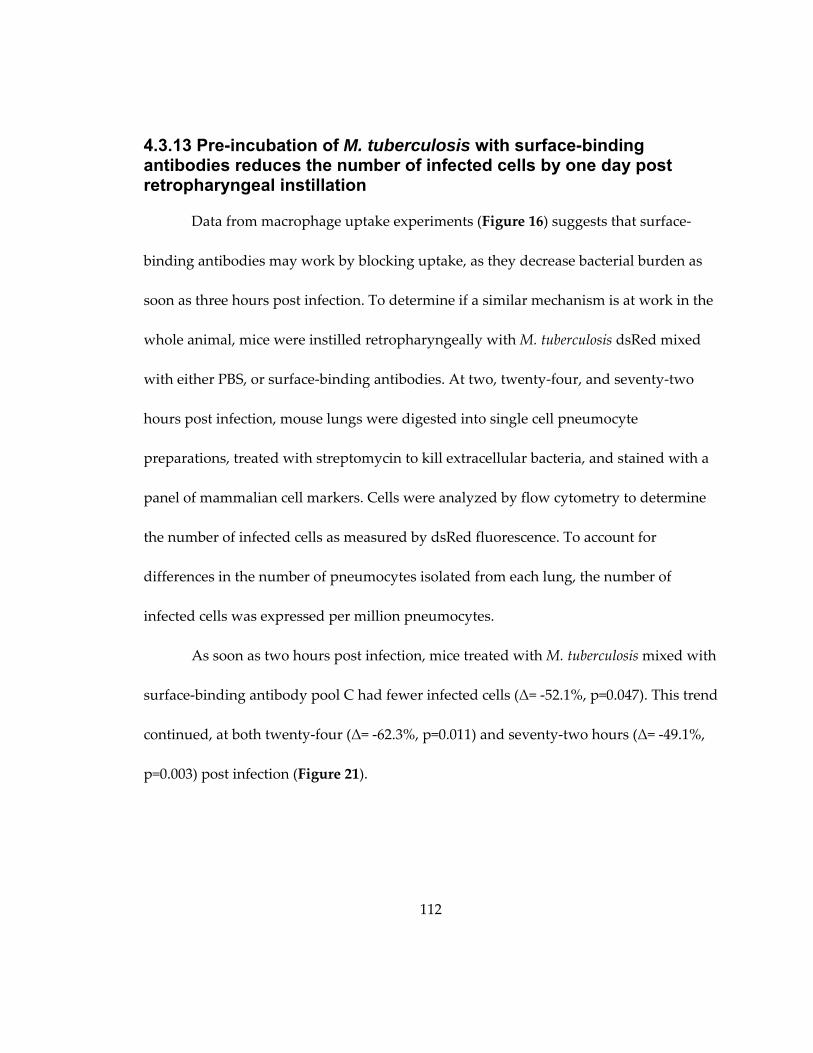
112
4.3.13 Pre-incubation of M. tuberculosis with surface-binding antibodies reduces the number of infected cells by one day post retropharyngeal instillation
Data from macrophage uptake experiments (Figure 16) suggests that surface‐
binding antibodies may work by blocking uptake, as they decrease bacterial burden as
soon as three hours post infection. To determine if a similar mechanism is at work in the
whole animal, mice were instilled retropharyngeally with M. tuberculosis dsRed mixed
with either PBS, or surface‐binding antibodies. At two, twenty‐four, and seventy‐two
hours post infection, mouse lungs were digested into single cell pneumocyte
preparations, treated with streptomycin to kill extracellular bacteria, and stained with a
panel of mammalian cell markers. Cells were analyzed by flow cytometry to determine
the number of infected cells as measured by dsRed fluorescence. To account for
differences in the number of pneumocytes isolated from each lung, the number of
infected cells was expressed per million pneumocytes.
As soon as two hours post infection, mice treated with M. tuberculosis mixed with
surface‐binding antibody pool C had fewer infected cells (Δ= ‐52.1%, p=0.047). This trend
continued, at both twenty‐four (Δ= ‐62.3%, p=0.011) and seventy‐two hours (Δ= ‐49.1%,
p=0.003) post infection (Figure 21).

113
Figure 21: Pre‐incubation of M. tuberculosis with surface‐binding antibodies prior to
retropharyngeal instillation decreases the number of infected cells by flow cytometry
Seven week old female BALB/c mice were instilled retropharyngeally with M.
tuberculosis H37Rv dsRed mixed with either PBS (n=8 at each time point) or 60μg of
surface‐binding antibody pool C (n=4 at each time point). At the time of sacrifice, two,
twenty‐four and seventy‐two hours post infection, lungs were harvested and digested
into a single cell suspension for staining. Infected cells were identified by dsRed
positivity. The number of infected cells for each mouse is expressed as the number of
infected cells per million pneumocytes to account for differences in cell recovery for each
lung. (Black) PBS (Blue) surface‐binding pool C. Mean ± SEM is displayed. Statistical
significance was calculated using Student’s t‐test: (*) p<0.05, (**) p<0.01, (***) p<0.001.
To confirm the decrease in the number of infected cells, a portion of the
pneumocyte preparation was plated prior to flow cytometry. At both twenty‐four
(Δ= ‐22.9%, p=0.24) and seventy‐two hours (Δ= ‐32.2%, p=0.042) mice instilled with M.
tuberculosis mixed with surface‐binding antibodies had fewer infected cells than mice
instilled with M. tuberculosis mixed with PBS, though the difference was only statistically
significant at the later time point (Figure 22).

114
Figure 22: Pre‐incubation of M. tuberculosis with surface‐binding antibodies prior to
retropharyngeal instillation decreases the number of infected cells by plate count
Seven week old female BALB/c mice were instilled retropharyngeally with M.
tuberculosis H37Rv dsRed mixed with either PBS (n=8 at each time point) or 60μg of
surface‐binding antibody pool C (n=4 at each time point). At the time of sacrifice,
twenty‐four and seventy‐two hours post infection, lungs were harvested and digested
into a single cell suspension for staining. Approximately 10% of the preparation was
plated on 7H10 agar plates prior to flow cytometry to enumerate the number of infected
cells. Mean ± SEM is displayed. (Black) PBS, (Blue) surface‐binding pool C. Statistical
significance was calculated using Student’s t‐test: (*) p<0.05, (**) p<0.01, (***) p<0.001.
4.3.14 Incubation of M. tuberculosis with surface-binding antibodies alters the infected cell profile during the first three days post infection
Pre‐incubation of M. tuberculosis with surface‐binding antibodies decreases the
number, but does not eliminate, infected cells after retropharyngeal instillation (Figure
21). To examine if surface‐binding antibody pre‐incubation alters the infected cell
profile, dsRed positive pneumocytes were classified as either alveolar macrophages,

115
recruited macrophages, monocytes, neutrophils, or “other” on the basis of GR‐1, CD11b
and CD11c staining.
Surprisingly at two hours post infection alveolar macrophages only comprised
10.9% and 7.2% of infected pneumocytes in mice instilled with M. tuberculosis mixed
with PBS and surface‐binding antibody pool C respectively. In mice instilled with M.
tuberculosis mixed with PBS, a large mixture of cells were infected at two hours post
instillation, with 59.2% of infected cells classified as “other”, 20.7% classified as
neutrophils, and small number of infected recruited macrophages and monocytes
comprising the remaining 10% of infected cells (Figure 23). The infected cell profile for
mice infected with M. tuberculosis mixed with surface‐binding antibody pool C was also
widely varied, with a larger proportion of infected neutrophils (49.1% vs 20.7%, p=0.002)
and fewer “other” cells (29.3% vs 59.2%, p=0.015) than their PBS counterparts.
In mice instilled with M. tuberculosis mixed with PBS, alveolar macrophage
comprised a larger portion of infected pneumocytes at twenty‐four hours post infection
of as compared to two hours post infection (10.9% vs. 29.1%, p<0.001). This trend,
towards an increasing number of infected alveolar macrophages, continued between
twenty‐four and seventy‐two hours post infection as well (29.1% vs. 43.5% p=0.003).
Mice infected with M. tuberculosis mixed with surface‐binding antibodies demonstrated
different kinetics of alveolar macrophage infection. At twenty‐four hours post infection

116
7.3% of infected pneumocytes were alveolar macrophages, no change from the 7.2% at
two‐hours post infection (p=0.98). By seventy‐two hours post infection, however,
alveolar macrophages accounted for 51.0% of infected pneumocytes, a large increase
from twenty‐four hours post infection (p=0.02), and not significantly different from mice
not infected with M. tuberculosis mixed with PBS (p=0.43) (Figure 23).
The kinetics of neutrophil infection also differed between the two groups. In
mice instilled with M. tuberculosis mixed with PBS, neutrophils comprised 20.7% of
infected cells at two hours post infection, with the percentage increasing to 41.1% by
twenty‐four hours post infection (p<0.001). The percentage then held relatively steady
with neutrophils comprising 38.7% of infected cells at seventy‐two hours post infection
(p=0.51). In mice infected with M. tuberculosis mixed with surface‐binding antibody pool
C, the increase in the proportion of infected neutrophils between two and twenty‐four
hours was even more pronounced. 41.1% of infected pneumocytes were neutrophils at
two hours post infection, a proportion which increased to 85.3% at twenty‐four hours
post infection (p=0.048), and fell back to 33.9% (p=0.010) at seventy‐two hours. The
proportion of infected neutrophils differed between the two groups at both two
(p=0.002) and twenty‐four (p<0.001), but not seventy‐two (p=0.54) hours post infection
(Figure 23).

117
The kinetics of recruited macrophage infection was similar between the two
groups. In mice infected with M. tuberculosis mixed with PBS, recruited macrophages
represented 8.7% of infected cells, which fell to 1.0% at twenty‐four hours (p=0.001).
Similarly, in mice infected with M. tuberculosis mixed with surface‐binding pool C,
recruited macrophages represented 13.5% of infected cells at two hours, a proportion
which fell to 1.5% by twenty‐four hours (p=0.17). Few infected monocytes were
identified during the course of the experiment (Figure 23). No differences between the
proportion of monocytes or recruited macrophages were noted between the groups at
any time points.
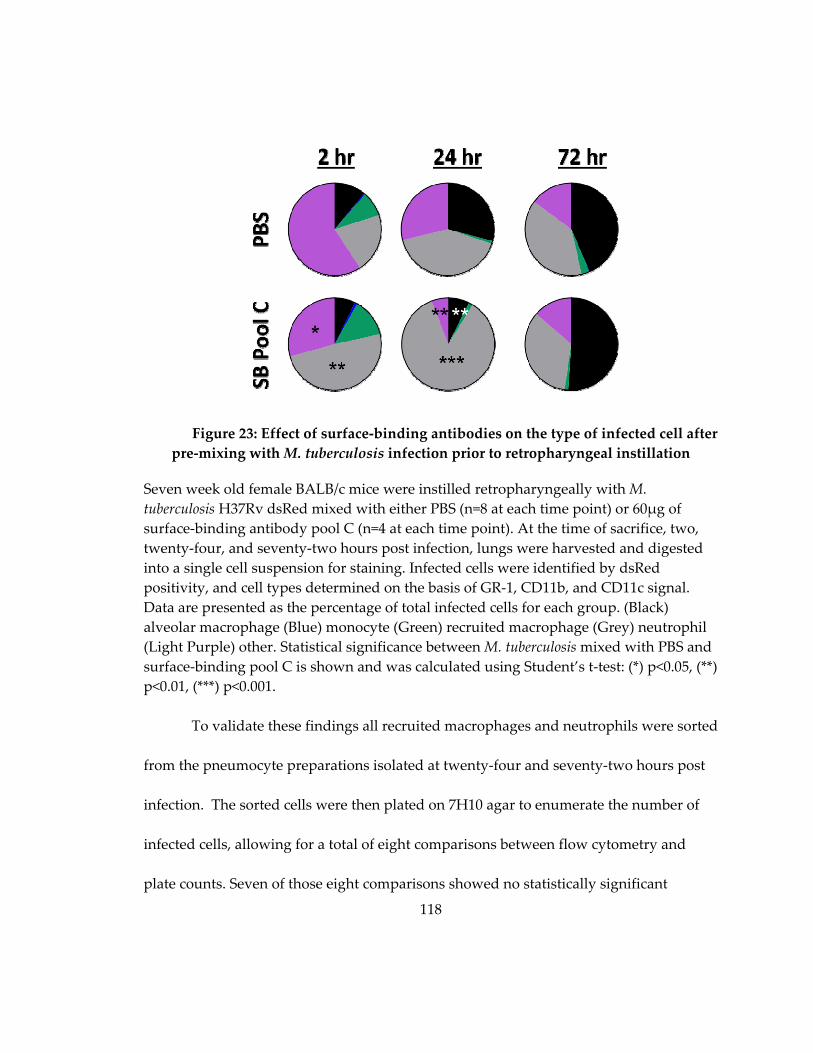
118
Figure 23: Effect of surface‐binding antibodies on the type of infected cell after
pre‐mixing with M. tuberculosis infection prior to retropharyngeal instillation
Seven week old female BALB/c mice were instilled retropharyngeally with M.
tuberculosis H37Rv dsRed mixed with either PBS (n=8 at each time point) or 60μg of
surface‐binding antibody pool C (n=4 at each time point). At the time of sacrifice, two,
twenty‐four, and seventy‐two hours post infection, lungs were harvested and digested
into a single cell suspension for staining. Infected cells were identified by dsRed
positivity, and cell types determined on the basis of GR‐1, CD11b, and CD11c signal.
Data are presented as the percentage of total infected cells for each group. (Black)
alveolar macrophage (Blue) monocyte (Green) recruited macrophage (Grey) neutrophil
(Light Purple) other. Statistical significance between M. tuberculosis mixed with PBS and
surface‐binding pool C is shown and was calculated using Student’s t‐test: (*) p<0.05, (**)
p<0.01, (***) p<0.001.
To validate these findings all recruited macrophages and neutrophils were sorted
from the pneumocyte preparations isolated at twenty‐four and seventy‐two hours post
infection. The sorted cells were then plated on 7H10 agar to enumerate the number of
infected cells, allowing for a total of eight comparisons between flow cytometry and
plate counts. Seven of those eight comparisons showed no statistically significant

119
differences: the lone exception was recruited macrophages in mice instilled with M.
tuberculosis mixed with PBS at twenty‐four hours (p<0.001) (Figure 24).
Additionally, the ratio of the total number of infected cells between mice infected with
M. tuberculosis mixed with PBS and mice infected with M. tuberculosis mixed with.
surface‐binding pool C remained remarkably consistent. At twenty‐four hours post
infection, as measured by flow cytometry, mice infected with M. tuberculosis mixed with
surface‐binding pool C mixed had 25.6% as many infected neutrophils and 44.4% as
many infected macrophages as mice instilled with M. tuberculosis mixed with PBS. By
plate count these ratios were 19.8% and 9.3% respectively. The lack of concordance with
the recruited macrophage ratio is due to the far higher number of infected recruited
macrophages as identified by plate counting (Figure 24A). At seventy‐two hours post
infection, as measured by flow cytometry, mice instilled with M. tuberculosis mixed with
surface‐binding pool C had 28.6% as many infected neutrophils and 29.9% as many
infected recruited macrophages as mice instilled with M. tuberculosis mixed with PBS. By
plate count, those ratios were 31.5% and 30.8% respectively (Figure 24B).
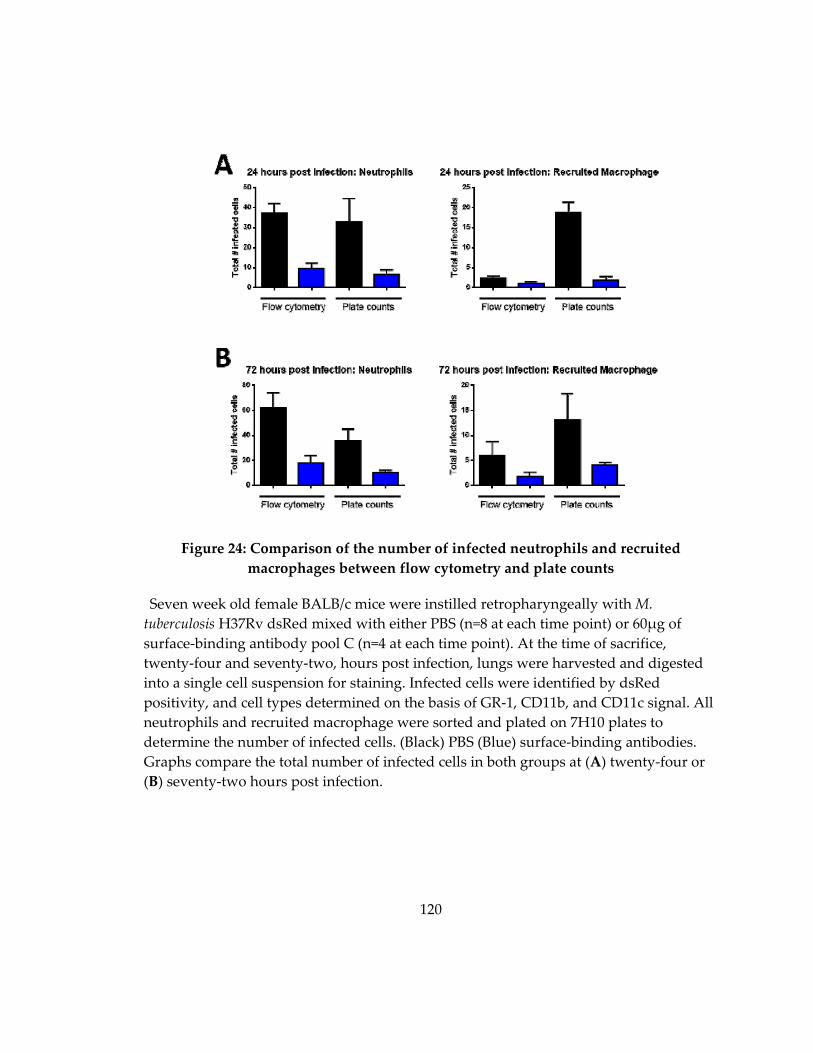
120
Figure 24: Comparison of the number of infected neutrophils and recruited
macrophages between flow cytometry and plate counts
Seven week old female BALB/c mice were instilled retropharyngeally with M.
tuberculosis H37Rv dsRed mixed with either PBS (n=8 at each time point) or 60μg of
surface‐binding antibody pool C (n=4 at each time point). At the time of sacrifice,
twenty‐four and seventy‐two, hours post infection, lungs were harvested and digested
into a single cell suspension for staining. Infected cells were identified by dsRed
positivity, and cell types determined on the basis of GR‐1, CD11b, and CD11c signal. All
neutrophils and recruited macrophage were sorted and plated on 7H10 plates to
determine the number of infected cells. (Black) PBS (Blue) surface‐binding antibodies.
Graphs compare the total number of infected cells in both groups at (A) twenty‐four or
(B) seventy‐two hours post infection.

121
4.3.15 Total lung cell profile after M. tuberculosis infection
Lastly we wanted to examine if pre‐incubation of M. tuberculosis with surface‐
binding antibodies altered cell recruitment to the lungs. M. tuberculosis infection alone
does not drastically alter the total cell profile. No changes were observed in the
proportion of alveolar macrophages, recruited macrophages, or monocytes at any time
point. Neutrophils were elevated beginning at twenty‐four hours post infection
(p=0.099), and had increased by 75% over uninstilled control mice by seventy‐two hours
post infection (p=0.015). At seventy‐two hours post infection the number of cells
classified as “other” were higher in control vs. M. tuberculosis infected mice (p=0.034)
(Figure 25).
Instillation of M. tuberculosis mixed with surface‐binding antibodies altered the
infected cell profile, as compared to mice infected with M. tuberculosis alone. As soon as
two hours post infection, mice infected M. tuberculosis mixed with surface‐binding
antibodies had decreased alveolar macrophages (Δ= ‐26.4%, p=0.01) and increased
neutrophils (Δ= 61.6%, p=0.001). The difference in the proportion of neutrophils
disappeared by twenty‐four hours post infection; however, the decreased proportion of
alveolar macrophages remained (Δ= ‐54.3%, p=0.022). By seventy‐two hours post
infection, the number of alveolar macrophages was equal between the two groups;
however monocytes (Δ= 29.1%, p=0.021) and recruited macrophages (Δ=60.9%, p=0.035)

122
were upregulated in mice infected with M. tuberculosis mixed with surface‐binding
antibodies (Figure 25).
Figure 25: Proportion of total cells in the lung after M. tuberculosis infection with and
without surface‐binding antibodies
Seven week old female BALB/c mice were either uninfected (control) (n=6), or instilled
retropharyngeally with M. tuberculosis H37Rv dsRed mixed with either PBS (n=8 at each
time point) or 60μg of surface‐binding antibody pool C (n=4 at each time point). At the
time of sacrifice, two, twenty‐four, and seventy‐two hours post infection, lungs were
harvested and digested into a single cell suspension for staining. Cell types were
determined on the basis of GR‐1, CD11b, and CD11c signal. (Purple) control, (Black)
PBS, (Blue) surface‐binding antibodies. Mean ± SEM is displayed. Statistical significance
between M. tuberculosis mixed with PBS vs surface‐binding pool C is displayed was
calculated using Student’s t‐test: (*) p<0.05, (**) p<0.01, (***) p<0.001.
123
Figure 26: Retropharyngeal instillation of PBS does not alter the total lung profile
within twenty‐four hours post infection
Seven week old female BALB/c mice were either uninstilled (control)(n=6), or instilled
with PBS retropharyngeally and sacrificed at two hours (n=4) and twenty‐four hours
(n=4) post infection. At time of sacrifice lungs were harvested and digested into a single
cell suspension for staining. Cell types were determined on the basis of GR‐1, CD11b,
and CD11c signal. Mean ± SEM is displayed. (Purple) control (Grey) PBS alone.
Statistical significance between control and instilled mice was calculated using Student’s
t‐test: (*) p<0.05, (**) p<0.01, (***) p<0.001.
To confirm that the changes observed in the total cell profile, as compared to
control mice, are the result of M. tuberculosis instillation, and not caused by
retropharyngeal instillation of 50μL of liquid, single cell pneumocyte preparations were
prepared from mice administered PBS and sacrificed at two, and twenty‐four hours post

124
instillation. No differences between uninfected and PBS instilled mice were observed at
either time point (Figure 26).
4.4 Discussion
Murine monoclonal antibodies against M. tuberculosis have been shown to be
protective from TB disease: blocking uptake of bacteria by host cells, preventing
dissemination, decreasing pulmonary pathology and bacterial burden, and improving
host survival [188,189,192‐195,291] . Aside from SMITB14, an anti‐LAM antibody
capable of blocking uptake, these antibodies function on more long term time scales,
rather than immediately impacting events in the first week after infection [193,194].
Bacterial growth remains stable in the lung during the first three days post M.
tuberculosis aerosol exposure, prior to a period of exponential growth [130]. After
establishing infection, neither cell mediated nor antibody responses have been able to
eradicate the bacteria, suggesting that anti‐infective vaccines must operate in a short
time frame after infection, prior to the onset of bacterial growth [90,153].
Antibodies against surface components of numerous other bacterial and parasitic
pathogens have demonstrated the ability to alter interactions with the host cell, by
enhancing FCγR mediated killing, altering the vacuolar environment triggering
transcriptional changes in the pathogen, and interfering with the colonization and
infection of the host [110,111,237,292]. We hypothesized that antibodies to the surface of

125
M. tuberculosis could alter interactions between an individual bacterium and the first
infected cells. To evaluate this, we identified surface‐binding and non‐surface‐binding
antibodies and compared their ability to alter early bacterial burden both in vivo and in
vitro. Pre‐incubation with surface‐binding antibodies led to a decreased number of
recoverable bacteria three hours after in vitro macrophage infection, and lowered the
bacterial burden and the number of infected cells in mice within the first three days post
retropharyngeal instillation (Figure 16, Figure 18, Figure 21). Non‐surface‐binding and
isotype control antibodies did not protect in any assay (Figure 16, Figure 18).
Though the surface‐binding antibodies in this study decreased bacterial burden
in the lungs of mice, they were of poor avidity to whole cell lysate. This is not surprising,
as the majority of the antibodies were isolated from M. tuberculosis infected mice, and the
whole cell lysate avidity of polyclonal sera, even during chronic M. tuberculosis infection,
is poor (Table 12). High avidity antibodies to surface‐components correlate with
enhanced neutralization or bactericidal ability for numerous pathogens, including
poliovirus, dengue virus, H. influenza, Neisseria meningitis, and Streptococcus pneumoniae,
[293‐297]. It is possible that the avidity of the surface‐binding antibodies used in these
studies to their cognate antigens, is strong, and that weak cross‐reactive binding to other
components of whole cell lysate is decreasing the total avidity score (Figure 13). Even if
true, the live cell surface is a mixture of mycolic acids and proteins, that more closely
126
resembles whole cell lysate than pure preparations of HSP‐X or LAM. Antibodies with
higher‐avidity to their cognate antigens both in purified preparations in and complex
mixtures are needed [298]. Plasma isolated from humans with active TB disease
possesses a broader range of antibody avidities to whole cell lysate than mice [168].
Isolation of new monoclonal antibodies from humans, with high sera avidity to both the
bacterial surface and whole cell lysate, will maximize the probability of identifying
highly avid surface‐binding antibodies that may improve upon the bacterial reductions
already seen in the murine model.
Additionally, plateau ELISA OD values to the live M. tuberculosis surface were
low (Table 10). Polyclonal sera in mice and humans have plateau OD values over seven
fold higher, suggesting that preparations containing antibodies to multiple targets may
generate stronger reactivity [168]. We hypothesized that monoclonal antibody pools
would improve the performance of surface‐binding antibodies in vivo, and in vitro, by
allowed increased antibody binding to the surface. Surprisingly, results were mixed,
showing enhanced performance of antibody pools in some studies (Figure 20), and no
difference from individual monoclonal antibodies in others (Figure 16, Figure 18).
Rather than enhancing the overall magnitude, antibody pools can provide enhanced
protection by decreasing the effective concentration of antibodies needed [299]. Future
127
studies comparing individual and pools of monoclonal antibodies at lower
concentrations may display the hypothesized enhanced protection.
In vitro, surface‐binding, but not control and non‐surface‐binding antibodies,
decreased bacterial burden in RAW macrophages at three, and twenty‐four hours post
infection (Figure 15, Figure 16). The immediacy of the decrease suggests two potential
mechanisms for surface‐binding antibody mediated‐protection: either rapid FCγR
mediated killing, or a blocking of bacterial uptake. Normalization of twenty‐four hour
bacterial load in macrophages, to the three hour bacterial load, demonstrated no further
killing between the time points. Taken together with the observations that antibody‐
mediated early CFU reduction is FCγR independent (Chapter 5), and results fewer
infected cells as soon as two hours post infection in vivo (Figure 21), antibody‐mediated
blocking of bacterial uptake appears the more plausible. SMITB14, an anti‐LAM
antibody whose F(ab’)2 fragment decreases M. tuberculosis bacterial load as soon as two
hours after intranasal infection, is believed to work through a similar mechanism [194].
Another potential mechanism, agglutination, was ruled out by the inability of surface‐
binding antibodies to clump M. tuberculosis in vitro (Table 13).
In addition to culture grown bacteria, two other bacterial models were used in
these experiments. Biotin‐coated M. tuberculosis was used to evaluate the extent to which
the avidity of surface‐binding antibodies mediates their effects [289]. Biotin fixation to
128
the surface of bacteria was detected by the binding of fluorescent streptavidin (Figure 9),
and was uneven, and not abundant enough to reliably distinguish labeled and unlabeled
bacteria. Pre‐incubation with BTN.4, a high‐affinity anti‐biotin antibody, showed a
concentration dependent decrease in bacterial burden in cell culture, and trended
towards decreased pulmonary burden three days post retropharyngeal instillation in
mice, though the magnitude was similar to that of the low avidity anti‐M. tuberculosis
monoclonal antibodies (Figure 14, Figure 17). Whether these results are simply a
reflection of poor biotin fixation, or representative of a phenomenon similar to HIV
where antibody avidity does not affect neutralizing activity, provided there is a
sufficient on‐rate, is unclear [293].
Surface‐binding antibodies also decreased bacterial burden in mice infected with
mammalian adapted M. tuberculosis at three days post infection (Figure 20). Sputum‐
derived M. tuberculosis has a transcriptional profile more similar to bacteria in a non‐
replicative persistence state, than log‐phase cultures [290]. Mammalian adapted bacteria
display similar features to sputum‐isolated bacteria, including the up‐regulation of HSP‐
X, a known surface‐protein, suggesting that infection‐induced transcriptional changes
can alter the bacterial surface [300]. Therefore, the ability of surface‐binding antibodies
to alter bacterial CFU when pre‐mixed with more physiologically relevant bacteria is
noteworthy. However, the mammalian adapted M. tuberculosis did encounter PBS‐Ty
129
during the experiment. Detergent disrupts the protein‐polysaccharide capsule that
forms on bacteria during anexic growth and helps to mediate early interactions between
bacteria and host cells [301,302]. Disruption of the capsule may expose otherwise buried
proteins, and eliminate the true surface‐antigens found on in vivo grown M. tuberculosis.
Future studies examining the ability of surface‐binding antibodies to decrease bacterial
burden, using sputum derived M. tuberculosis, are critical for determining the potential
of surface‐binding antibodies to alter early infection events in humans.
Interestingly, 15A4, a non‐surface‐binding antibody was protective at later time
points during infection, decreasing pulmonary bacterial load at day six but not three
days post infection. This is the opposite pattern from surface‐binding antibodies, whose
protection at day three wanes by day six (Figure 19, Figure 20). This observation
confirms previously published studies that M. tuberculosis antibodies have a variety of
mechanisms of action, with some altering bacterial burden at later time points, though
an as of yet undescribed mechanism [189,194,291]. It is tempting to speculate how non‐
surface‐binding antibodies mediate this protection. M. tuberculosis components are
released from host cells through exocytosis, where non‐surface‐binding antibodies may
find and neutralize their effects, potentially damping M. tuberculosis subversion of the
host immune response [303]. Additionally, antibodies can enter cells, even when not
bound to pathogens, and neutralize bacterial toxins [185,304]. If non‐surface‐binding

130
antibodies can access the intracellular space, they could impair bacterial manipulation of
the phagosome, and ultimately impinge upon M. tuberculosis survival.
When mixed with M. tuberculosis prior to infection, surface‐binding antibodies
alter the infected cell profile at two and twenty‐four hours post infection. By seventy‐
two hours post infection, however, the infected cell profile is identical to mice infected
with M. tuberculosis mixed with PBS (Figure 23). Surface‐binding antibodies impair
uptake by alveolar macrophages, and favor uptake by neutrophils. Neutrophils have
greater mycobactericidal properties than alveolar macrophages, potentially further
contributing to the decreased number of infected cells and reduced bacterial burden in
vivo [30,34,215]. In vivo models of bacterial disease are complex, and it is possible that
while blocking cellular uptake is the primarily mechanism by which surface‐binding
antibodies act, alteration of the infected cell profile may also play a role. It is tempting to
speculate that the waning of surface‐binding antibody mediated protection between
days three and six post‐infection is driven by the change in the infected cell profile,
away from neutrophils and towards alveolar macrophages. The ability to further impair
uptake by alveolar macrophages may increase the duration of the surface‐binding
antibody protection.
In summary, these studies demonstrate the ability of surface‐binding antibodies
to alter early infection events through a mechanism that both blocks bacterial uptake by
131
host cells, and alters the type of host cell infected. This highlights the need for future
studies evaluating the protective role humoral immunity plays in altering M. tuberculosis
early infection events, and its ability to function as a component of an anti‐infective
vaccine.
4.5 Future Direction
The studies described in this chapter have demonstrated the ability of surface‐
binding antibodies to influence early infection events, a key step to altering infection
rate. However, the antibodies used in this study have poor avidity (Table 12). To
evaluate if enhanced avidity can improve early CFU reduction, new surface‐binding
antibodies are needed. Mice do not generate high‐avidity antibodies to the surface of
live M. tuberculosis, even during the chronic stages of infection (Table 12). Humans,
however, have a heterogeneous immune response to the surface of M. tuberculosis with
some individuals possessing relatively high surface avidity scores. As murine
vaccination with cell surface components leads to a low yield of surface‐binding
antibodies, in addition to those found being of low avidity, humans with plasma that
contains higher‐titer, higher‐avidity surface reactivity represent a potential source of
better antibodies [168]. Isolating and immortalizing memory B‐cells from such humans,
using the protocol described in Bonsignori et al., will maximize the chances of finding
high avidity clones. Once M. tuberculosis specific antibodies have been identified, their

132
efficacy in decreasing early bacterial burden can be evaluated using the methods
described in this chapter [305].
Generating a larger pool of surface‐binding antibodies has other benefits.
Multiple studies have cataloged the cell wall components of M tuberculosis using mass
spectrometry [306,307]. The cell wall is a complex, multilayered structure [298,308].
Proteins may be completely buried in the outer layer of mycolic acids, or have portions
exposed. A large collection of surface‐ and non‐surface‐binding antibodies against a
particular target will allow for epitope mapping, to elucidate the portions of the
molecule that are accessible. Even if large collections of antibodies to a specific target do
not exist, the identification of a single surface‐binding antibody against that target
indicates its exposure on the surface and helps to further characterize the portion of each
bacterium exposed to the host.
Interestingly, surface‐binding and non‐surface‐binding antibodies showed
different activity kinetics: surface‐binding antibodies decreased bacterial burden at three
days post infection, though this decrease was waning by day six, while 15A4, a non‐
surface‐binding antibody, had no effect at early time points, but decreased bacterial at
six days post infection (Figure 19, Figure 20). The sample size of the non‐surface‐
binding antibodies tested is small. Future studies evaluating the potency of additional
non‐surface‐binding antibodies, both to HSP‐X and other targets, are necessary to

133
confirm the phenotype. If confirmed, functional studies, including extending the
infected‐cell flow cytometry studies past three days, and the evaluation of the antibodies
in FCγR knock‐out mice should be undertaken to understand the alternate mechanism
of action.
Better animal models to measure the effect surface‐binding antibody mediated
protection are also needed. Pre‐mixing of M. tuberculosis and antibodies pre‐disposes the
system to success: antibodies have the ability to bind to the bacteria prior to infection. To
improve the physiological relevancy, antibodies should be administered prior to an
aerosol infection, as done in Chapter 5. This model, however, is incompatible with the
first‐infected cell flow cytometry assay. Wolf et al. used a standard dose aerosol model
of M. tuberculosis, followed by isolation of single pneumocytes from the lungs to
determine the identity of infected cells, though they were unable to reliability detect
cells prior to ten days post infection [27]. While higher‐dose aerosol models have been
described in the literature, they only deliver ~2000 CFU to the mice, a dose still not
reliably sufficient to detect infected cells at early time points (data not shown) [309]. We
attempted to generate a high dose aerosol, of ~5,000‐10,000 CFU using a vibrating mesh
nebulizer, which is capable of delivering higher doses of M. tuberculosis to mice than the
standard air‐jet nebulizer system. These attempted failed, delivering ~3000 bacteria, with
few to no infected cells detectable by flow cytometry at one day post infection (data not

134
shown). Improvements in aerobiology that allow for longer exposure times without
increasing bacterial death in the innocula, clogging the vibrating mesh, or increasing
humidity leading to droplet condensation, are needed in order to deliver a sufficiently
high dose.
Despite its limitations, the mixing of M. tuberculosis with surface‐binding
antibodies prior to instillation, followed by isolation of pneumocytes, demonstrated an
interesting phenotype. Fewer infected cells were detected at two, twenty‐four, and
seventy‐two hours post infection, when compared to a no‐antibody control (Figure 21).
Additionally, whole‐lung homogenate bacterial burden was decreased at three days post
infection (Figure 18‐Figure 20). Taken together, these findings suggest that bacteria are
either rapidly killed or cleared from the lung. To further understand the mechanism of
early CFU reduction two approaches can be taken. Live/Dead strains of M. tuberculosis
have been described, which use tetracycline induction of green fluorescent protein (GFP)
to distinguish transcriptionally active and inactive cells [310]. Attempts at using a
Live/Dead strain in the early‐infection flow cytometry model failed, as cells must be
exposed to tetracycline for approximately twenty‐four hours to reliably distinguish live
and dead cells (data not shown). Optimization of the strain to more rapidly produce
GFP would allow for the identification of dead bacteria within cells, provided they are
not sufficiently degraded by the lysosome, and the testing of the hypothesis that the

135
decreased number of infected cells is due to rapid bacterial killing. Conversely, bacteria
can be radiolabeled prior to incubation, allowing for the tracing of the bacteria beyond
the lung. After infection, if the amount of radiolabeled bacteria in the lungs of mice
treated with both PBS and antibody‐mixed M. tuberculosis is the same, despite early
infection differences in bacterial burden, it implies that M. tuberculosis is being rapidly
killed. If the amount of radiolabeled bacteria is decreased in the lungs of mice infected
with M. tuberculosis mixed with antibodies, it implies the bacteria are being cleared.

136
5. Surface-binding antibodies decrease pulmonary bacterial burden after aerosol infection
5.1 Introduction
Interest in humoral immunity as a component of a TB vaccine, especially one that
acts by preventing infection, rather than preventing the progression to active disease, is
increasing [107,211,311]. In order to design vaccines which induce sterilizing immunity,
we need to understand if vaccine‐inducible factors, such as antibodies, can alter early
infection events, if present at the time of exposure. While numerous studies have
examined the effect monoclonal antibodies administered near the time of infection have
on M. tuberculosis disease, to our knowledge none have examined their ability to alter
infection rate [107].
In Chapter 4 we demonstrated that surface‐binding antibodies decrease early
infection bacterial load in vivo and in vitro when mixed with M. tuberculosis prior to
infection. While these studies demonstrate the ability of surface‐binding antibodies to
alter early infection events, neither pre‐mixing of the antibodies with M. tuberculosis, nor
the route of administration is physiologically relevant. To evaluate if surface‐binding
antibodies are protective, when present at the time of aerosol infection, we used a more
physiologically relevant animal model; surface‐binding antibodies were administered
retropharyngeally twenty‐four hours prior to M. tuberculosis aerosol exposure. In this
model, surface‐binding antibodies decreased bacterial burden in the lungs within the

137
first three days of infection in an FCγR independent, concentration dependent manner.
The effect was most pronounced at one day post infection, waning in magnitude over
time, and disappearing completely by six days after exposure. When present at the time
of an ultra‐low dose M. tuberculosis aerosol exposure, surface‐binding antibodies did not
alter infection rate. However, in infected mice both an IgG1 isotype control and surface‐
binding antibodies decreased bacterial burden at one month post infection. These
studies reveal that surface‐binding antibodies are capable of altering early infection
events, but that the antibody‐induced changes are not sufficient to reduce infection rate.
5.2 Methods
5.2.1 Animals
The animals in this study were handled under a protocol approved by the Duke
Institutional Animal Care and Use Committee. Six week old female wild‐type BALB/c
mice from Charles River Laboratories (028) and Taconic (BALB‐F) as well as BALB/c
background FCγR knock‐out mice (Taconic, 584‐F) were housed in the RBL at Duke
University for at least one week prior to M. tuberculosis exposure under environmental
conditions described in Chapter 2.
5.2.2 Retropharyngeal instillation of purified antibody
Monoclonal antibodies were purified as described in Chapter 4. After buffer
exchange antibodies were further concentrated to of >20 mg/mL using the Amicon

138
Ultracel‐30k centrifugation filter (Millipore UFC803096). Antibodies were then diluted to
the desired concentration in endotoxin free‐PBS and delivered to anesthetized mice via
retropharyngeal instillation twenty‐four hours prior to aerosol exposure in a volume of
50μL.
5.2.3 Pharmacokinetics of monoclonal antibodies in BAL fluid
20 μL of hybridoma supernatant was instilled retropharyngeally into BALB/c
mice. At fifteen minutes, thirty minutes, one hour, two hours and twenty‐four hours
post instillation mice were sacrificed and perfused, with BAL fluid collected and as
described in Chapter 2. BAL fluid was then assayed by ELISA against whole cell lysate,
as described in Chapter 3, to determine the amount of antibody present.
5.2.4 Aerosol innocula preparation
For ultra‐low dose aerosol exposures, Mycobacterium tuberculosis H37Rv was
diluted from frozen aliquots to an OD of 0.00025 prior to vortexing for one minute. For
standard dose aerosol exposures, M. tuberculosis H37Rv frozen aliquots were diluted to
OD 0.01 prior to horizontal vortexing for one minute. Antifoam Y‐30 (Sigma Aldrich,
A5758) was added to the innocula at a 1:5000 dilution prior to aerosolization.
5.2.5 Aerosol challenge
Mice, at least seven weeks old, were exposed to M. tuberculosis aerosol in a
whole‐body Madison exposure chamber connected to a Class III biological safety
139
cabinet, as we have previously described [25,312]. The aerosol was generated using a 6‐
jet Collison nebulizer (BGI Inc, CN25), operating at 19±1 liters per minute (Lpm), 35±1
pounds per square inch of pressure, 50% relative humidity and a flow rate of 50 Lpm.
The exposure system was controlled by Aerosol Management platform, AeroMP (Biaer
Tech, LLC). Mice were loaded into the chamber with air flowing, and exposed to the
aerosol for 20 minutes. A BioSampler (SKC Inc), drawing at a flow rate of 12.5 Lpm, was
used to sample the viable aerosol concentration through a port in the Madison chamber
door. Bacterial titers were performed to determine the viable bacterial concentration in
the innocula before aerosolization (pre‐neb), in the remaining innocula post
aerosolization (post‐neb), and in the BioSampler.
5.2.6 Determination of aerosol dose presented
The dose presented represents the number of viable M. tuberculosis bacteria
inhaled by the mouse during the aerosol exposure. It is calculated by the formula Dp= VE
x Ca, where VE represents the exposure volume and Ca the viable aerosol concentration
in the aerosol chamber. VE =VM x t, where t is the duration of the aerosol exposure and
VM is the minute ventilatory volume of each mouse as determined by Guyton’s
Forumula VM= 2.1 x (mouse body weight)0.75 [313]. Ca, is defined as Ca= (CSAMPLE x
(VSAMPLE‐(Ec x t)))/(QSAMPLER x t), where CSAMPLE is the BioSampler concentration, VSAMPLER

140
is the initial BioSampler volume, Ec ia evaporation rate, t is aerosol exposure duration,
and QSAMPLER is sample airflow rate.
5.2.7 Bacterial CFU determination
Mice were sacrificed between one day and four weeks post aerosol exposure, and
their lungs were homogenized as described in Chapter 4. Mice sacrificed between one
hour and nine days post infection had lung homogenates plated neat, while
homogenates from mice with a longer duration of infection were serially diluted in PBS‐
Ty prior to plating. CFU were counted after 3‐4 week incubation at 37oC.
5.2.8 Lung culture
For mice sacrificed at one month after ultra‐low dose aerosol exposure, the ~70%
of lung homogenate remaining after CFU plating was added to 9mL of 7H9
supplemented with 10% OADC, 0.5% glycerol and 0.05% tyloxapol. Cultures were
incubated at 37oC for six to seven weeks with intermittent shaking and then evaluated
for turbidity. Thirty‐three out of one‐hundred and ninety liquid cultures were streaked
onto 7H10 agar plates to confirm either negativity (in the absence of turbidity) or M.
tuberculosis growth.
5.2.9 Statistics
Prism Software was used for statistical analyses. For pairwise comparisons
among continuous variables a two‐sided student’s t‐test was used for normally
141
distributed data, and a Mann‐Whitney test was used for non‐normally distributed data.
For discrete variables, a Fisher’s exact test was used for pairwise comparisons, and a
Chi‐squared test was used for comparisons between multiple variables.
5.3 Results
5.3.1 Antibodies persist in BAL fluid for at least twenty-four hours after retropharyngeal instillation
To evaluate if antibodies administered retropharyngeally persisted in the BAL
fluid, fifteen female BALB/c mice were instilled with 20μL of hybridoma supernatant,
and sacrificed at various time points during the first twenty‐four hours after instillation.
BAL fluid from each mouse was evaluated by ELISA (Figure 27). Antibody levels in the
BAL fluid remained relatively stable for the first hour, and fell sharply thereafter.
Despite the decrease, antibody was still detected at twenty‐four hours post instillation,
though it represented only 28% of peak levels.
Aerosol delivery of M. tuberculosis, to mice, two hours post retropharyngeal
instillation, led to large variability in the pulmonary dose retained. This problem was
not noted when the aerosol exposure occurred twenty‐four hours after instillation (data
not shown). The continued persistence of antibody in the BAL fluid at one day post
administration allowed for aerosol exposures to be conducted at that time point for all
future studies.
142
Figure 27: Levels of antibody in BAL fluid within first twenty‐four hours after
retropharyngeal administration
20uL of hybridoma supernatant (anti‐HSPX) was instilled retropharyngeally into female
BALB/c mice. At fifteen minutes (n=3), thirty minutes (n=3), one hour (n=3), two hours
(n=3), and twenty‐four hours (n=3) post infection mice underwent terminal
bronchoalveolar lavage (BAL). BAL fluid was assayed by ELISA against M. tuberculosis
H37Rv whole cell lysate. Mean ± SEM shown for each time point.
5.3.2 Surface-binding antibodies decrease bacterial CFU in a concentration dependent manner when administered prior to a standard dose M. tuberculosis aerosol
Female BALB/c mice were given either PBS, 1mg of an IgG1 control (6D11)
antibody, or varying concentrations of surface‐binding antibody pool D one day prior to
aerosol infection with an M. tuberculosis at a concentration of 0.59 CFU/mL. At three
days post infection mice instilled with surface‐binding antibodies had a concentration
dependent decrease in pulmonary bacterial burden (Figure 28). At the maximal dose of

143
1mg, mice administered surface‐binding antibodies had a 34.0% decrease in pulmonary
bacterial burden (p=0.03), while mice instilled with control antibodies did not differ from
mice instilled with PBS (Δ= ‐2.5%, p= 0.86).
Figure 28: Surface‐binding antibodies reduce pulmonary bacterial burden at 3 days
post infection in a concentration dependent manner.
BALB/c mice were given PBS (n=8), a control antibody (6D11) (n=4) or varying
concentrations of surface‐binding pool D (n=4) retropharyngeally twenty‐four hours
prior to a standard dose M. tuberculosis aerosol infection. At three days post infection
mice were sacrificed, and lungs plated to determine bacterial burden. (Black) PBS,
(White) control antibodies, (Blue) surface‐binding antibodies. Mean ± SEM is displayed.
Statistical significance was calculated using the student’s t‐test: (*) p<0.05, (**) p<0.01,
(***) p<0.001.
5.3.3 Retropharyngeal administration of surface-binding antibodies leads to variable decreases in bacterial burden three days post aerosol infection
To confirm our finding, that 1mg of surface‐binding antibodies, administered prior
to aerosol infection, decreased lung bacterial burden, we conducted three similar
studies. In each study, mice were instilled with either 1mg of individual surface‐binding

144
antibodies, 1mg of a surface‐binding antibody pool, 1mg of an isotype control antibody,
or PBS one day prior to M. tuberculosis aerosol exposure with viable aerosol
concentrations of 0.24‐0.26 CFU/mL, and sacrificed at three days post infection. Overall,
the general trend in these studies confirms our previous findings (Figure 29). However,
large standard deviations within groups, as well as high degrees of variation between
experiments, highlight the inconsistency of this model.
The first study confirmed our previous findings: mice administered 1mg of IT‐70,
a surface‐binding antibody, had decreased bacterial burden at three days post infection
by as compared to a PBS control (Δ= ‐40.1%, p=0.02) (Figure 29A). In the second study,
instillation of 1mg of two different surface‐binding antibodies, 18D11 and IT‐70
decreased lung burden by ~30%, however, due to large standard deviations within the
groups, the p‐values were not significant (Δ= ‐31.3%, p=0.07 and Δ= ‐30.4%, p=0.08
respectively). Mice instilled with 1mg of either CS‐40, or a surface‐binding antibody pool
prior to infection, only had decreased lung burdens of between 10‐20% (Δ= ‐10.7%,
p=0.57 and Δ=‐17.2%, p=0.34 respectively) (Figure 29B). In the third experiment, CS‐40,
IT‐70, and a pool of surface‐binding antibodies all decreased lung CFU by over 35%,
with the pool reducing CFUs by 56%, though none of these decreases were statistically
significant due to large standard errors (CS40: Δ= ‐37.7%, p=0.23, IT‐70: Δ= ‐52.85,
p=0.26, and surface‐binding pool D Δ= ‐56.1%, p=0.16 respectively). 18D11 only reduced
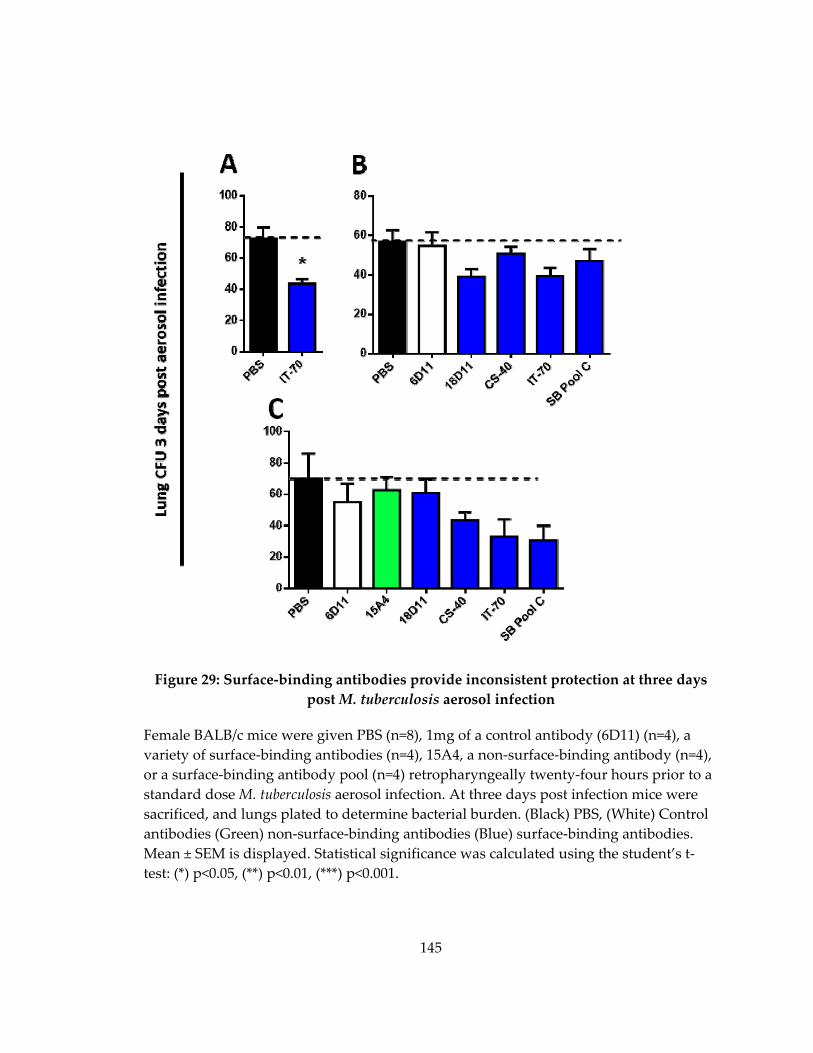
145
Figure 29: Surface‐binding antibodies provide inconsistent protection at three days
post M. tuberculosis aerosol infection
Female BALB/c mice were given PBS (n=8), 1mg of a control antibody (6D11) (n=4), a
variety of surface‐binding antibodies (n=4), 15A4, a non‐surface‐binding antibody (n=4),
or a surface‐binding antibody pool (n=4) retropharyngeally twenty‐four hours prior to a
standard dose M. tuberculosis aerosol infection. At three days post infection mice were
sacrificed, and lungs plated to determine bacterial burden. (Black) PBS, (White) Control
antibodies (Green) non‐surface‐binding antibodies (Blue) surface‐binding antibodies.
Mean ± SEM is displayed. Statistical significance was calculated using the student’s t‐
test: (*) p<0.05, (**) p<0.01, (***) p<0.001.
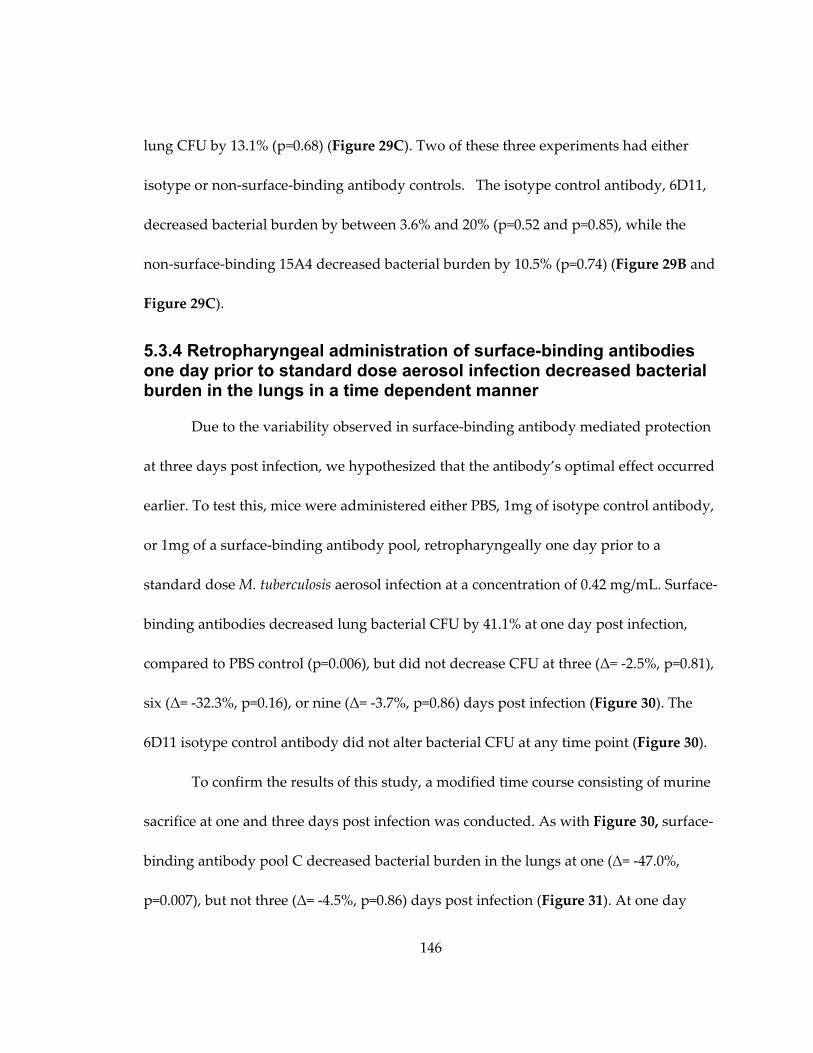
146
lung CFU by 13.1% (p=0.68) (Figure 29C). Two of these three experiments had either
isotype or non‐surface‐binding antibody controls. The isotype control antibody, 6D11,
decreased bacterial burden by between 3.6% and 20% (p=0.52 and p=0.85), while the
non‐surface‐binding 15A4 decreased bacterial burden by 10.5% (p=0.74) (Figure 29B and
Figure 29C).
5.3.4 Retropharyngeal administration of surface-binding antibodies one day prior to standard dose aerosol infection decreased bacterial burden in the lungs in a time dependent manner
Due to the variability observed in surface‐binding antibody mediated protection
at three days post infection, we hypothesized that the antibody’s optimal effect occurred
earlier. To test this, mice were administered either PBS, 1mg of isotype control antibody,
or 1mg of a surface‐binding antibody pool, retropharyngeally one day prior to a
standard dose M. tuberculosis aerosol infection at a concentration of 0.42 mg/mL. Surface‐
binding antibodies decreased lung bacterial CFU by 41.1% at one day post infection,
compared to PBS control (p=0.006), but did not decrease CFU at three (Δ= ‐2.5%, p=0.81),
six (Δ= ‐32.3%, p=0.16), or nine (Δ= ‐3.7%, p=0.86) days post infection (Figure 30). The
6D11 isotype control antibody did not alter bacterial CFU at any time point (Figure 30).
To confirm the results of this study, a modified time course consisting of murine
sacrifice at one and three days post infection was conducted. As with Figure 30, surface‐
binding antibody pool C decreased bacterial burden in the lungs at one (Δ= ‐47.0%,
p=0.007), but not three (Δ= ‐4.5%, p=0.86) days post infection (Figure 31). At one day

147
post‐infection 18D11 also decreased bacterial burden (Δ=‐35.0%, p=0.031), while IT‐70
and CS‐40 trended towards decreased bacterial burden, though it was not statistically
significant (Δ= ‐12.0%, p=0.53, and Δ= ‐22.0%, p=0.17 respectively).
Figure 30: The ability of surface‐binding antibodies to decrease pulmonary bacterial
burden wanes over time
Mice were given either PBS, 1mg of a control antibody (6D11) or 1mg of surface‐binding
pool D retropharyngeally twenty‐four hours prior to a standard dose M. tuberculosis
aerosol infection. At varying time points post infection mice were sacrificed, and lungs
plated to determine bacterial burden. (Black) PBS, (White) Control antibodies (Green)
non‐surface‐binding antibodies (Blue) surface‐binding antibodies. Mean ± SEM is
displayed. Statistical significance was calculated using the student’s t‐test: (*) p<0.05, (**)
p<0.01, (***) p<0.001.
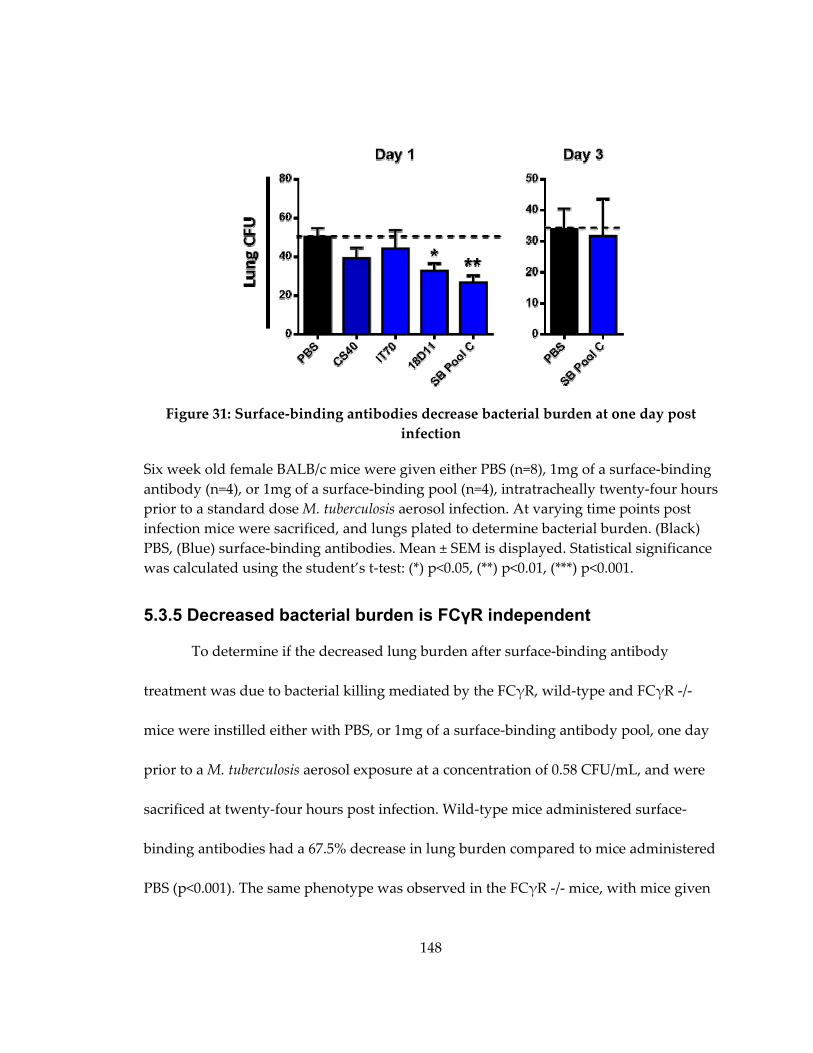
148
Figure 31: Surface‐binding antibodies decrease bacterial burden at one day post
infection
Six week old female BALB/c mice were given either PBS (n=8), 1mg of a surface‐binding
antibody (n=4), or 1mg of a surface‐binding pool (n=4), intratracheally twenty‐four hours
prior to a standard dose M. tuberculosis aerosol infection. At varying time points post
infection mice were sacrificed, and lungs plated to determine bacterial burden. (Black)
PBS, (Blue) surface‐binding antibodies. Mean ± SEM is displayed. Statistical significance
was calculated using the student’s t‐test: (*) p<0.05, (**) p<0.01, (***) p<0.001.
5.3.5 Decreased bacterial burden is FCγR independent
To determine if the decreased lung burden after surface‐binding antibody
treatment was due to bacterial killing mediated by the FCγR, wild‐type and FCγR ‐/‐
mice were instilled either with PBS, or 1mg of a surface‐binding antibody pool, one day
prior to a M. tuberculosis aerosol exposure at a concentration of 0.58 CFU/mL, and were
sacrificed at twenty‐four hours post infection. Wild‐type mice administered surface‐
binding antibodies had a 67.5% decrease in lung burden compared to mice administered
PBS (p<0.001). The same phenotype was observed in the FCγR ‐/‐ mice, with mice given

149
surface‐binding antibodies having a 61.7% decrease lung burden compared to mice
administered PBS (p=0.003).
Figure 32: The effect of surface‐binding antibodies is FCγR independent
Eight week old female wild‐type of FCγR knockout BALB/c mice were instilled with
either PBS, or 1mg surface‐binding pool C in 50μL, twenty‐four hours prior to aerosol
exposure. At one day post infection the mice were sacrificed, their lungs manually
homogenized, and plated to determine lung bacterial burden. Student’s t‐tests were
used to determine statistical significance: (*) p<0.05, (**) p<0.01, (***) p<0.001.
5.3.6 Retropharyngeal administration of surface-binding antibodies prior to ultra-low dose aerosol does not reduce murine infection rate
Female BALB/c mice were divided into three groups and administered with
either PBS, 1mg of an isotype control antibody, or 1mg of a surface‐binding antibody
pool one day prior to ultra‐low dose aerosol M. tuberculosis infection with aerosol
concentrations between 0.007‐0.033 CFU/mL. Aerosol concentrations in this range lead
to infection of ~60% of all animals. The experiment was repeated three times, for a total
of seventy‐two mice in the PBS and surface‐binding antibody groups, and forty‐six mice

150
in the 6D11 group. The large number of mice was necessary to detect a 20% percent
difference in infection rate between the surface‐binding antibody and PBS treated
groups with 80% power. Information on the strain, age, and weight for every mouse can
be found in Table 24 (Appendix C), while the baseline characteristics for each exposure
group can be found in Table 25 (Appendix C). Mouse weight and age did not differ
significantly between treatment or exposure groups.
The entire mouse lung was assayed to determine if a mouse was infected. One
month post infection mice were sacrificed and each lung was homogenized with ~30%
plated on 7H10 agar plates to determine bacterial CFU, and the remaining ~70%
cultured for 7 weeks in 7H9 liquid media. A mouse was determined to be infected if the
liquid culture was positive. If the liquid culture was contaminated, infection status was
determined by the presence or absence of bacterial CFU on 7H10 agar plates.
No infection rate differences were seen among the three groups Table 14. Mice
administered PBS prior to exposure had a 63.8% infection rate, and mice administered
surface‐binding antibodies had a 56.9% infection rate (OR 0.75, p=0.50). The infection
status of each mouse can be found in Table 24.
151
Table 14: Infection rates after ultra‐low dose M. tuberculosis aerosol exposure
Infected/
Total
Percent
Infected
(%)
Odds Ratio
(95% CI)* P‐value*
Experimental group A
PBS 9/24 37.5%
6D11 10/24 41.7% 1.2(0.37‐3.80) 1.0
SB pool C 7/24 29.2% 0.69(0.21‐2.30) 0.76
Experimental Group B
PBS 19/24 79.2%
6D11 17/22 77.3% 0.89(0.22‐3.64) 1.00
SB pool C 15/24 62.5% 0.44(0.12‐1.59) 0.34
Experimental Group C
PBS 18/24 75.0%
SB Pool C 19/24 79.2% 1.27(0.33‐4.89) 1.00
Total
PBS 46/72 63.8%
SB Pool C 41/72 56.9% 0.75(0.38‐1.46) 0.50
* P‐value and odds ratio were calculated using Fisher’s exact test
5.3.7 The presence of 1mg of antibodies prior to ultra-low dose M. tuberculosis exposure leads to decreased bacterial load one month post infection in infected mice
Lung burden was evaluated in all infected mice at one month post ultra‐low dose
aerosol exposure. The log10 CFU for all infected mice, as determined by plate counting,
are displayed in Figure 32, and the value for each individual mouse can be found in
Table 24 (Appendix C). Mice with positive cultures, but no plate counts, are not shown

152
in the figure. One month median CFU counts for mice administered with 1mg of
surface‐binding antibodies prior to ultra‐low dose infection (Δ=0.63 log10 CFU, p<0.001)
were significantly lower than mice administered PBS. The affect appears non‐specific, as
same reduction was observed for mice instilled with 1mg of isotype control antibody
(Δ=0.58 log10 CFU, p=0.004).
Figure 33: Pulmonary bacterial burden one month post ultra‐low dose aerosol
infection
Six week‐old female BALB/c mice were instilled with either PBS, 1mg 6D11 or 1mg
surface‐binding pool C in 50μL, twenty‐four hours prior to ultra‐low dose aerosol.
Lungs were manually homogenized, with~30% of the lung homogenate was plated to
determine lung bacterial burden. The red line represents the median value. (Black) PBS,
(White) control antibody, (Blue) surface‐binding pool C. Mann‐Whitney tests were used
to determine statistical significance. For comparison with 6D11 only Group A and
Group B CFUs for PBS mice were included, as Group C had no mice treated with 6D11:
(*) p<0.05, (**) p<0.01, (***) p<0.001.
153
5.4 Discussion
The cell‐mediated immune response is critical for the control of M. tuberculosis;
however, it does not reach the lung until between two to three weeks post infection, too
late to prevent the logarithmic growth of the bacteria [314]. The BCG vaccine induces
antigen‐specific CD4+ T‐cells, which are present at the time of infection in vaccinated
individuals, but remains unable to prevent infection [90,130,315]. In order design a
vaccine that generates sterilizing immunity, other factors need to be considered. To test
if passive administration of antibodies can alter the initial interactions between the host
and M. tuberculosis, mice were administered monoclonal surface‐binding IgG antibodies
prior to aerosol infection. High concentrations of surface‐binding, but not control,
antibodies were able to reduce early infection CFU; however, these antibodies were
unable to alter infection rate (Table 14, Figure 28, Figure 30).
Previous work has primarily focused on the ability of antibodies to exert long
term effects on M. tuberculosis infection [188,189,191‐195]. These antibodies work in a
variety of ways: altering interactions with epithelial cells to prevent dissemination,
enhancing cellular immune responses, blocking interactions between bacterial ligands
and host‐receptors, and neutralizing the pathogenic effects of secreted polysaccharides
[194,195,291]. Antibodies mediate protection against other bacterial pathogens through a
variety of additional mechanisms including recruitment of complement prior to
phagocytosis, toxin neutralization, agglutination, FCγR mediated killing and alteration

154
of cell entry mechanisms [304,316]. Administration of surface‐binding antibodies one
day prior to standard‐dose M. tuberculosis aerosol exposure reduced bacterial CFU at
twenty‐four hours post infection in both wild‐type and FCγR deficient mice (Figure 32).
When combined with the data from Chapter 4 that showed pre‐mixing of M. tuberculosis
with surface‐binding antibodies leading to fewer infected cells, as soon as two hours
post infection, (Figure 21), it is tempting to speculate that surface‐binding antibodies
mediate protection by blocking uptake by phagocytic cells in an FCγR independent
manner. This would leave the bacteria vulnerable to extracellular killing or mucocilliary
clearance from the lung into the gastrointestinal tract. Mucocilliary clearance is an
important host defense mechanism, rapidly clearing particles from the lung in as little as
three hours in humans, and twelve hours in mice [317,318]. Future studies with
radiolabeled bacteria to determine if surface‐binding antibodies result in enhanced
clearance from the lung will be able to distinguish between the two mechanisms.
In contrast to C57BL/6 and BALB/c mice, where differences in early infection
CFU corresponded to differences in infection rate, we did not see the same correlation
with surface‐binding antibodies [130]. Despite surface‐binding antibody dependent CFU
decreases at one day post infection, the same treatment did not alter infection rate
(Table 14). Two potential reasons for this discrepancy exist. First, peak differences
between the C57BL/6 and BALB/c mice were larger than in this study: at one day post
infection C57BL/6 mice had on average 66% fewer M. tuberculosis CFU, while pre‐

155
administration of surface‐binding antibodies decreased CFUs at the same time point by
only 44% [130] (Figure 30 , Figure 31). Additionally, the infect rate study described in
this chapter was powered to detect a 20% infection rate difference, assuming the peak
bacterial burden decrease by surface‐binding antibodies was 50%. Given the lower
maximal decrease in early infection bacterial reduction, as well variability in antibody
delivery after retropharyngeal instillation, infection rate differences may exist that our
study was not sufficiently powered to detect [319]. Improvement in both antibody
avidity and delivery may reveal surface‐binding antibody dependent infection‐rate
differences. Second, different mechanisms may underlie the early bacillary reduction
seen in the C57BL/6 mice, and antibody treated mice. A better understanding of the
mechanisms that drive both phenotypes is critical for the efforts to design an anti‐
infective M. tuberculosis vaccine [211].
Despite not altering infection rate, treatment with both surface‐binding and
control antibodies decreased pulmonary bacterial load at one month post ultra‐low dose
infection. The ability of the high dose control antibody to decrease bacterial burden is
not surprising, as IvIg, when administered intraperitoneally within twenty‐four hours of
intravenous M. tuberculosis infection, decreases bacterial by 2 log10 at one month post
infection [154]. High dose immunoglobulins have a profound impact on the immune
system, suppressing TH1 cytokine production, decreasing T‐Cell proliferation, and
interfering with complement deposition [167,320,321]. Given the high concentration of

156
surface‐binding antibodies needed to observed early infection CFU decreases, the long
term non‐specific effects of this high a dose may mask the specific effects of surface‐
binding antibodies. Higher‐avidity antibodies which exert protective effects at lower
doses are critical for determining if surface‐binding antibodies, and not non‐specific
effects, can decrease bacterial burden one month.
The animal model used in this study also represents an improvement on the
retropharyngeal mixing studies performed in Chapter 4 and the majority of the
published literature. [192‐195]. While the model is more physiologically relevant, as
antibodies are present at the time of an aerosol infection, retropharyngeal instillation of
antibodies is invasive, depositing 50 μL of liquid into the lungs. Delivery of vehicle can
alter the baseline lung environment, leading to loss of certain strain‐specific
mycobactericidal properties (Chapter 2). Additionally, retropharyngeal instillation is
variable, does not produce uniform delivery to all lobes of the lung, and in some animal
models does not result in reliable in alveolar delivery, a critical limitation, as that is
where initial interactions between host cells and M. tuberculosis occur [319]. To overcome
these limitations, induction of surface‐binding antibodies through vaccination should be
undertaken in future studies. Furthermore, the antibodies used in these studies bind
poorly, requiring high dosages to demonstrate effects (Figure 28). Identification of
antibodies with higher avidity, and more abundant or easily accessible targets could
157
produce a more reproducible phenotype, require a lower dosage of antibody, and
decrease early infection CFUs to a greater degree.
In summary these data demonstrate that surface‐binding antibodies are capable
of influencing early infection events, though not in a manner that is able to alter M.
tuberculosis infection rate. The results of this study further demonstrate that surface‐
binding antibodies can be protective and affirm the need for further research into
humoral immunity both as a component of the immune response to M. tuberculosis, and
as a vaccine component.
5.5 Future Directions
As with the results in Chapter 4, the avidity of the surface‐binding antibodies
used in these studies is poor. Isolating additional surface‐binding antibodies to a variety
of targets has the potential to identify high‐avidity antibodies, which may increase the
magnitude of protection from aerosol infection, and require less antibody to be
administered. Further decreases in early bacterial burden may also lead to reduction in
infection rate, the ultimate goal for surface‐binding antibodies.
The experimental system used in this chapter represents a significant
improvement from Chapter 4: here antibodies are instilled in the lung twenty‐four hours
prior to aerosol infection, rather than being mixed with M. tuberculosis prior to
retropharyngeal instillation. However, it still has significant limitations.
Retropharyngeal instillation is non‐physiologic. The method is invasive, distribution of
158
antibodies into the lung is not uniform, the liquid has the potential to dilute host factors
[322‐324]. Additionally, instilled substances do not always reach the alveolus, a critical
limitation as that is where initial M. tuberculosis‐host cell interactions occur [319].
To overcome these limitations, surface‐binding antibodies must be produced by
the mouse and be present in the lung at the time of infection. There are two predominant
strategies. The first strategy is the induction of mucosal immune responses, or spill‐over
of serum antibodies into the mucosal tract after systemic vaccination. This strategy is
employed by both the H. influenza type B and Pneumoccal sp. vaccines: the mucosal IgG
and IgA antibodies, generated after intramuscular injection are critical for protection
against colonization and infection of the upper airways [237,238,325]. The second
strategy is local production of antibodies in the lungs themselves. Inducible bronchus
associated lymphoid tissue (iBALT) is a tertiary lymphoid organ located in the
perivascular and interstitial areas of the lung, capable of supporting germinal centers
[326,327]. Antibody producing cells generated in the lung are long lived, lasting at least
11 months post induction, and produce pulmonary antibodies directly, rather than
relying on sera antibodies [328]. Regardless of the method used, murine production of
high‐titer/high‐avidity surface‐binding antibodies eliminates the need for their
instillation retropharyngeally, improving the physiologic relevancy of the model, and
potentially decreasing its variability.
159
Lastly, mechanistic studies undertaken in Chapter 4 demonstrate that pre‐mixing
of M. tuberculosis and surface‐binding antibodies results in fewer infected cells within
the first day after infection. To confirm that the FCγR independent mechanism, for the
one day CFU reductions in the aerosol model, is due to blocking of bacterial uptake, and
not FCγR‐independent cellular killing, flow cytometry studies quantifying the number
and type of infected cells, in both wild type and FCγR‐/‐ mice, should be undertaken. In
order to visualize infected cells by flow cytometry at early time points, a dose presented
of ~10,000 bacteria is needed. Due to technical limitations with aerosol delivery systems,
we have not been able to achieve this dose. Optimization of the aerobiology, followed by
isolation and staining of lung pneumocytes, will allow us to further probe the
mechanism behind surface‐binding antibody mediated protection from aerosol M.
tuberculosis infection.
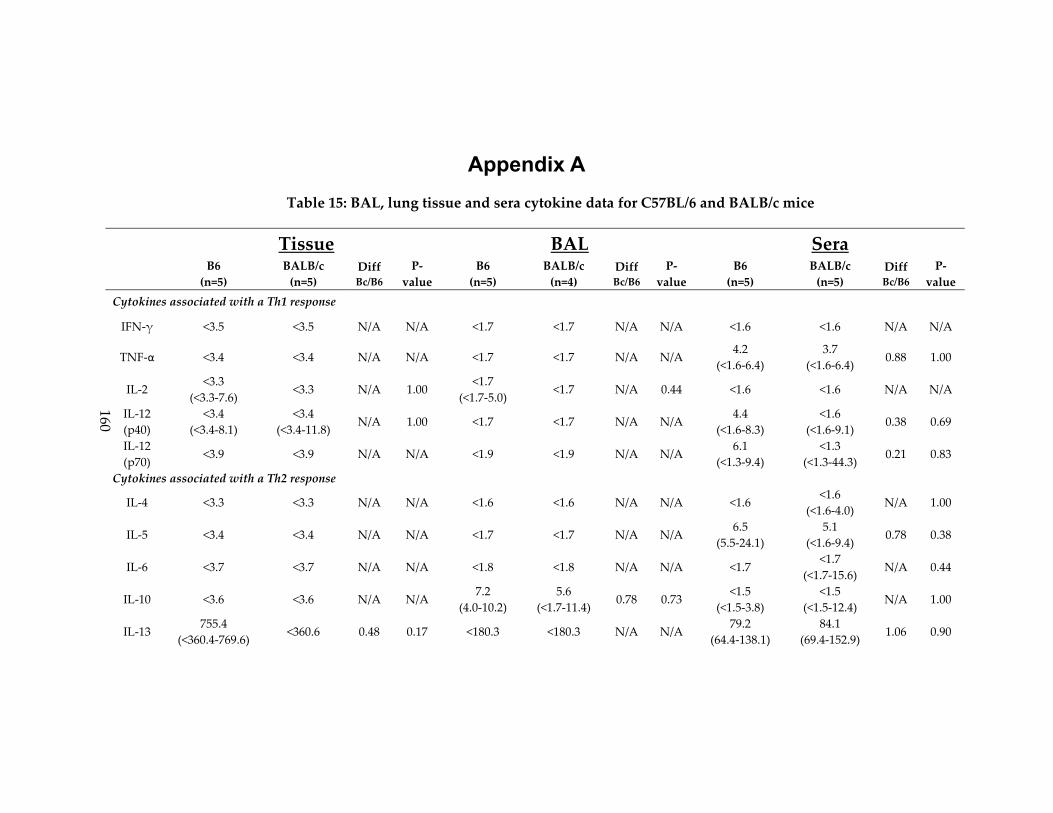
160
Appendix A
Table 15: BAL, lung tissue and sera cytokine data for C57BL/6 and BALB/c mice
Tissue BAL Sera
B6
(n=5)
BALB/c
(n=5)
DiffBc/B6
P‐
value
B6
(n=5)
BALB/c
(n=4)
Diff Bc/B6
P‐
value
B6
(n=5)
BALB/c
(n=5)
Diff Bc/B6
P‐
value
Cytokines associated with a Th1 response
IFN‐γ <3.5 <3.5 N/A N/A <1.7 <1.7 N/A N/A <1.6 <1.6 N/A N/A
TNF‐α <3.4 <3.4 N/A N/A <1.7 <1.7 N/A N/A 4.2
(<1.6‐6.4)
3.7
(<1.6‐6.4) 0.88 1.00
IL‐2 <3.3
(<3.3‐7.6) <3.3 N/A 1.00
<1.7
(<1.7‐5.0) <1.7 N/A 0.44 <1.6 <1.6 N/A N/A
IL‐12
(p40)
<3.4
(<3.4‐8.1)
<3.4
(<3.4‐11.8) N/A 1.00 <1.7 <1.7 N/A N/A
4.4
(<1.6‐8.3)
<1.6
(<1.6‐9.1) 0.38 0.69
IL‐12
(p70) <3.9 <3.9 N/A N/A <1.9 <1.9 N/A N/A
6.1
(<1.3‐9.4)
<1.3
(<1.3‐44.3) 0.21 0.83
Cytokines associated with a Th2 response
IL‐4 <3.3 <3.3 N/A N/A <1.6 <1.6 N/A N/A <1.6 <1.6
(<1.6‐4.0) N/A 1.00
IL‐5 <3.4 <3.4 N/A N/A <1.7 <1.7 N/A N/A 6.5
(5.5‐24.1)
5.1
(<1.6‐9.4) 0.78 0.38
IL‐6 <3.7 <3.7 N/A N/A <1.8 <1.8 N/A N/A <1.7 <1.7
(<1.7‐15.6) N/A 0.44
IL‐10 <3.6 <3.6 N/A N/A 7.2
(4.0‐10.2)
5.6
(<1.7‐11.4) 0.78 0.73
<1.5
(<1.5‐3.8)
<1.5
(<1.5‐12.4) N/A 1.00
IL‐13 755.4
(<360.4‐769.6) <360.6 0.48 0.17 <180.3 <180.3 N/A N/A
79.2
(64.4‐138.1)
84.1
(69.4‐152.9) 1.06 0.90
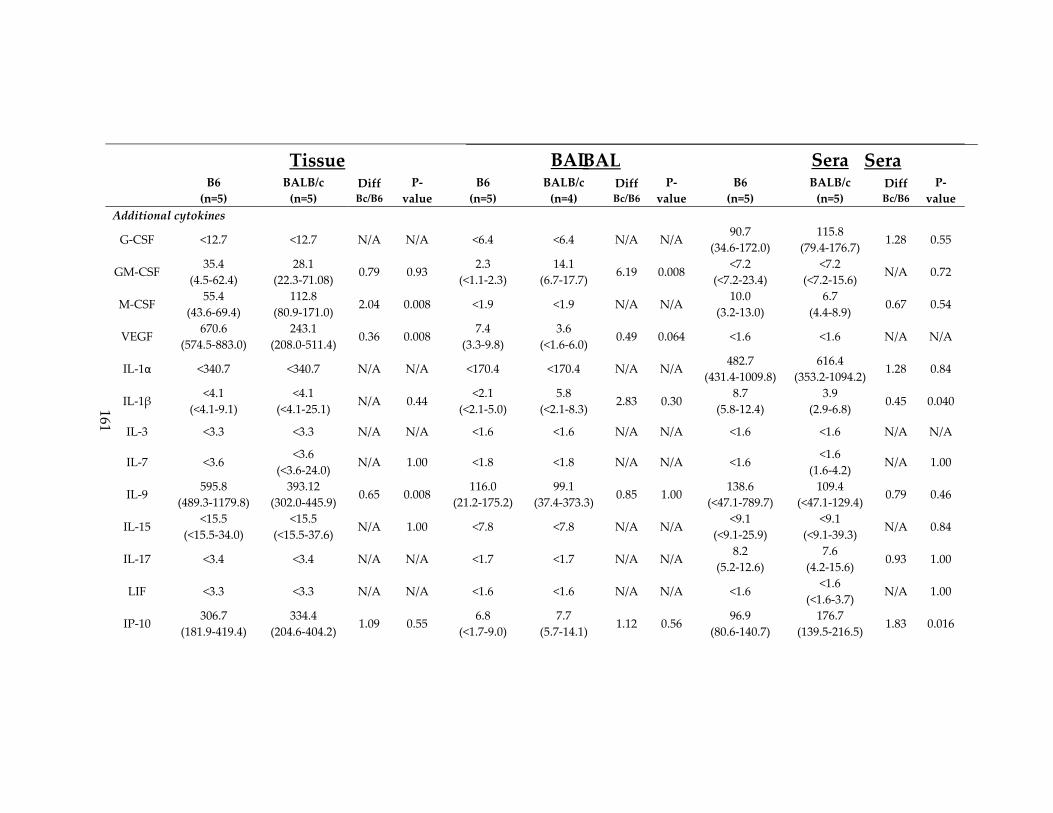
161
Tissue BAL Sera
BAL Sera
B6
(n=5)
BALB/c
(n=5)
DiffBc/B6
P‐
value
B6
(n=5)
BALB/c
(n=4)
Diff Bc/B6
P‐
value
B6
(n=5)
BALB/c
(n=5)
Diff Bc/B6
P‐
value
Additional cytokines
G‐CSF <12.7 <12.7 N/A N/A <6.4 <6.4 N/A N/A 90.7
(34.6‐172.0)
115.8
(79.4‐176.7) 1.28 0.55
GM‐CSF 35.4
(4.5‐62.4)
28.1
(22.3‐71.08) 0.79 0.93
2.3
(<1.1‐2.3)
14.1
(6.7‐17.7) 6.19 0.008
<7.2
(<7.2‐23.4)
<7.2
(<7.2‐15.6) N/A 0.72
M‐CSF 55.4
(43.6‐69.4)
112.8
(80.9‐171.0) 2.04 0.008 <1.9 <1.9 N/A N/A
10.0
(3.2‐13.0)
6.7
(4.4‐8.9) 0.67 0.54
VEGF 670.6
(574.5‐883.0)
243.1
(208.0‐511.4) 0.36 0.008
7.4
(3.3‐9.8)
3.6
(<1.6‐6.0) 0.49 0.064 <1.6 <1.6 N/A N/A
IL‐1α <340.7 <340.7 N/A N/A <170.4 <170.4 N/A N/A 482.7
(431.4‐1009.8)
616.4
(353.2‐1094.2) 1.28 0.84
IL‐1β <4.1
(<4.1‐9.1)
<4.1
(<4.1‐25.1) N/A 0.44
<2.1
(<2.1‐5.0)
5.8
(<2.1‐8.3) 2.83 0.30
8.7
(5.8‐12.4)
3.9
(2.9‐6.8) 0.45 0.040
IL‐3 <3.3 <3.3 N/A N/A <1.6 <1.6 N/A N/A <1.6 <1.6 N/A N/A
IL‐7 <3.6 <3.6
(<3.6‐24.0) N/A 1.00 <1.8 <1.8 N/A N/A <1.6
<1.6
(1.6‐4.2) N/A 1.00
IL‐9 595.8
(489.3‐1179.8)
393.12
(302.0‐445.9) 0.65 0.008
116.0
(21.2‐175.2)
99.1
(37.4‐373.3) 0.85 1.00
138.6
(<47.1‐789.7)
109.4
(<47.1‐129.4) 0.79 0.46
IL‐15 <15.5
(<15.5‐34.0)
<15.5
(<15.5‐37.6) N/A 1.00 <7.8 <7.8 N/A N/A
<9.1
(<9.1‐25.9)
<9.1
(<9.1‐39.3) N/A 0.84
IL‐17 <3.4 <3.4 N/A N/A <1.7 <1.7 N/A N/A 8.2
(5.2‐12.6)
7.6
(4.2‐15.6) 0.93 1.00
LIF <3.3 <3.3 N/A N/A <1.6 <1.6 N/A N/A <1.6 <1.6
(<1.6‐3.7) N/A 1.00
IP‐10 306.7
(181.9‐419.4)
334.4
(204.6‐404.2) 1.09 0.55
6.8
(<1.7‐9.0)
7.7
(5.7‐14.1) 1.12 0.56
96.9
(80.6‐140.7)
176.7
(139.5‐216.5) 1.83 0.016

162
P‐values were calculated using a Mann‐Whitney test.
Tissue BAL Sera
BAL Sera
B6
(n=5)
BALB/c
(n=5)
DiffBc/B6
P‐
value
B6
(n=5)
BALB/c
(n=4)
Diff Bc/B6
P‐
value
B6
(n=5)
BALB/c
(n=5)
Diff Bc/B6
P‐
value
CCL chemokines
Eotaxin 670.5
(551.3‐1540.5)
879.8
(538.0‐2158.3) 1.31 0.85
<1.6
(<1.6‐6.9)
9.5
(6.2‐23.3) 5.82 0.056
609.5
(323.2‐789.1)
430.2
(410.0‐657.9) 0.71 0.55
MCP‐1 57.3
(54.9‐80.4)
65.3
(51.0‐73.6) 1.13 0.50 <2.0
<2.0
(<2.0‐4.08) N/A N/A
37.5
(26.3‐50.8)
35.7
(24.3‐40.9) 0.95 0.82
MIP‐1α 84.56
(46.3‐118.9)
70.1
(57.5‐93.5) 0.83 1.00
37.5
(24.7‐61.9)
38.7
(31.5‐52.3) 1.03 0.78
25.9
(18.2‐42.5)
24.1
(19.1‐32.5) 0.93 0.38
MIP‐1β 18.5
(17.6‐49.5)
36.2
(22.5‐43.6) 1.95 0.15 <1.6
<1.6
(<1.6‐3.4) N/A 0.44
9.7
(3.8‐27.3)
35.9
(34.3‐50.9) 3.70 0.008
RANTES 27.5
(25.0‐52.9)
89.6
(44.0‐107.5) 3.26 0.016 <1.7 <1.7 N/A N/A <921.7 <921.7 N/A N/A
CXCL chemokines
KC 166.1
(129.7‐191.1)
274.7
(207.7‐388.0) 1.64 0.008
5.9
(4.4‐8.6)
16.4
(10.5‐18.4) 2.76 0.016
75.8
(63.3‐101.1)
36.4
(15.8‐49.4) 0.48 0.008
LIX 38.4
(<17.7‐244.7)
<17.7
(<17.7‐80.6) 0.48 0.52 <8.8 <8.8 N/A N/A Values above range, unreadable
MIG 456.1
(393.5‐665.9)
583.0
(398.6‐811.3) 1.27 0.42 <1.8
5.3
(4.0‐9.9) 3.04 0.008
33.7
(21.5‐49.0)
70.3
(52.8‐151.4) 2.08 0.008
MIP‐2 32.6
(<11.8‐42.5)
24.7
(<11.8‐45.3) 0.75 1.00
<5.9
(<5.9‐12.4)
13.4
(<5.9‐16.3) 2.26 0.13
115.7
(85.7‐139.2)
101.6
(97‐129.7) 0.88 0.42

163
Appendix B
Figure 34: Reactivity of human plasma to protein lysates from M. tuberculosis and
environmental mycobacteria
Plasma from PPD‐negative volunteers (Uninfected) and a randomly selected subset of
patients with active TB disease (Active) were assayed against whole cell protein lysates
from M. tuberculosis H37Rv (A), M. intracellulare (B), M. avium (C), and M. fortuitum (D).
Two‐sided p‐values by student’s t‐test: (*) p ≤ 0.05, (**) p ≤ 0.01, (***) p ≤ 0.001. (E‐G)
Correlations between log10 antibody titers for M tuberculosis and environmental
mycobacteria are displayed for individuals with active disease.

164
Table 16: Univariate correlation between clinical variables and total antibody titers to
LAM, cell wall, and secreted proteins in patients with active TB disease
Log10 total antibody titer by ELISA
Variable LAM Cell wall Secreted proteins
R value/
mean ±
SEM
P
value
*
R value/
mean ±
SEM
P
value
R value/
mean ±
SEM
P
value
Age R=‐0.35 0.027 R=‐0.23 0.15 R=‐0.14 0.39
Gender 0.93 0.37 0.55
Male (n=29) 3.2 ± 0.2 3.3 ± 0.1 3.3 ± 0.2
Female (n=11) 3.2 ± 0.2 3.6 ± 0.3 3.1 ± 0.2
Race/ethnicity 0.059 0.48 0.31
White (n=7) 2.9 ± 0.4 3.4 ± 0.3 2.9 ± 0.2
White Hispanic (n=11) 3.8 ± 0.2 3.5 ± 0.1 3.6 ± 0.2
Black (n=17) 3.0 ± 0.2 3.2 ± 0.2 3.2 ± 0.3
Black Hispanic (n=1) 2.3 3.8 2.9
Asian (n=4) 3.2 ± 0.3 3.8 ± 0.4 3.3 ± 0.4
HIV seropositivity 0.10 0.60 0.16
HIV + (n=7) 2.7 ± 0.3 3.5 ± 0.3 2.9 ± 0.2
HIV – (n=33) 3.3 ± 0.3 3.4 ± 0.1 3.3 ± 0.1
Diabetes 0.35 0.70 0.12
Yes (n=6) 3.5 ± 0.5 3.5 ± 0.4 3.7 ± 0.3
No (n=34) 3.0 ± 0.4 3.4 ± 0.1 3.2 ± 0.1
Tobacco usage 0.61 0.67 0.33
Yes(n=11) 3.2 ± 0.2 3.5 ± 0.3 3.0 ± 0.2
No (n=29) 3.1 ± 0.2 3.4 ± 0.1 3.3 ± 0.1
Alcohol consumption (day) 0.62 0.68 0.80
None consumed (n=26) 3.2 ± 0.2 3.4 ± 0.2 3.2 ± 0.1
1‐3 drinks (n=6) 3.0 ± 0.5 3.1 ± 0.2 3.2 ± 0.4
>3 drinks or binge (n=8) 3.4 ± 0.2 3.6 ± 0.2 3.4 ± 0.3
BCG vaccination history 0.057 0.18 0.24
Yes (n=17) 3.0 ± 0.2 3.6 ± 0.1 3.4 ± 0.2
No (n=22) 3.5 ± 0.2 3.2 ± 0.2 3.1 ± 0.2
US‐Born 0.10 0.11 0.32
Yes (n=20) 3.4 ± 0.1 3.2 ± 0.2 3.1 ± 0.2
No (n=20) 3.0 ± 0.2 3.6 ± 0.1 3.4 ± 0.1
PPD induration (mm) R=‐0.19 0.26 R=‐0.06 0.75 R=‐0.13 0.44
Disease Site 0.20 0.43 0.31
Pulmonary (n=22) 3.3 ± 0.2 3.4 ± 0.2 3.4 ± 0.2
Extra‐pulmonary (n=14) 2.9 ± 0.2 3.2 ± 0.2 3.0 ± 0.2
Both (n=4) 3.6 ± 0.3 3.8 ± 0.5 3.5 ± 0.3
*P‐value calculated using one‐way ANOVA or student’s t‐test for categorical variables
or F‐statistic for continuous variables. P‐values are unadjusted for multiple comparisons.
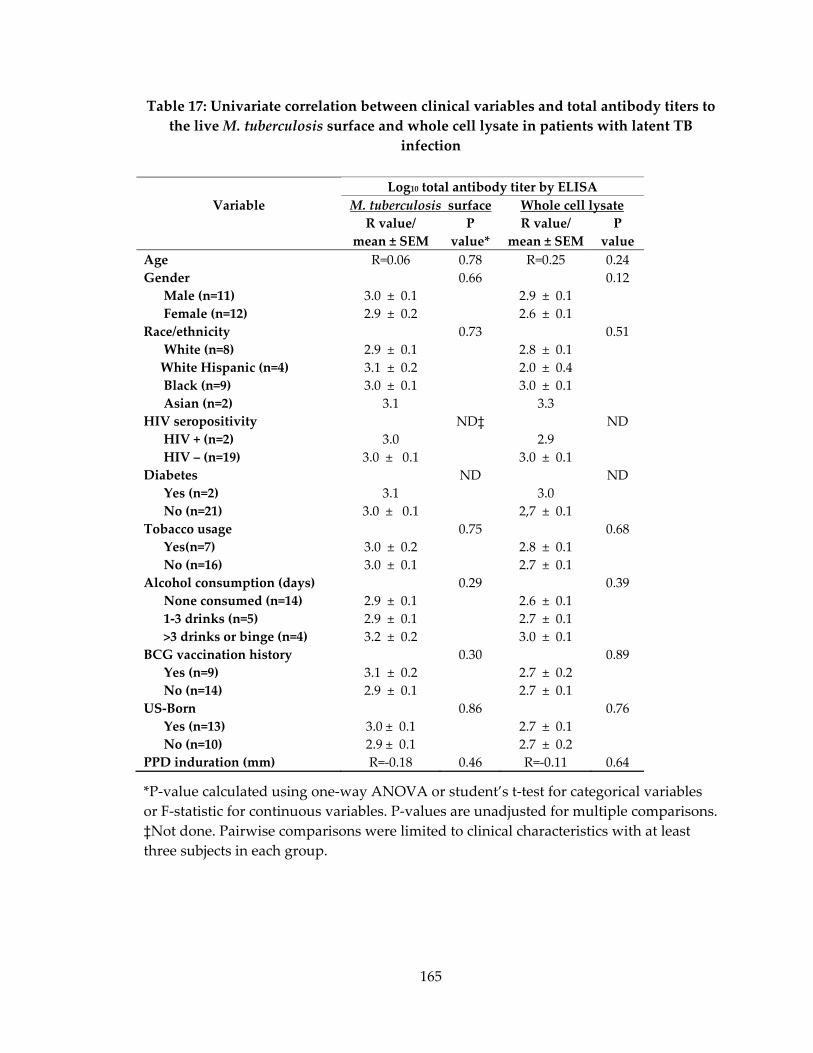
165
Table 17: Univariate correlation between clinical variables and total antibody titers to
the live M. tuberculosis surface and whole cell lysate in patients with latent TB
infection
*P‐value calculated using one‐way ANOVA or student’s t‐test for categorical variables
or F‐statistic for continuous variables. P‐values are unadjusted for multiple comparisons.
‡Not done. Pairwise comparisons were limited to clinical characteristics with at least
three subjects in each group.
Log10 total antibody titer by ELISA
Variable M. tuberculosis surface Whole cell lysate
R value/
mean ± SEM
P
value*
R value/
mean ± SEM
P
value
Age R=0.06 0.78 R=0.25 0.24
Gender 0.66 0.12
Male (n=11) 3.0 ± 0.1 2.9 ± 0.1
Female (n=12) 2.9 ± 0.2 2.6 ± 0.1
Race/ethnicity 0.73 0.51
White (n=8) 2.9 ± 0.1 2.8 ± 0.1
White Hispanic (n=4) 3.1 ± 0.2 2.0 ± 0.4
Black (n=9) 3.0 ± 0.1 3.0 ± 0.1
Asian (n=2) 3.1 3.3
HIV seropositivity ND‡ ND
HIV + (n=2) 3.0 2.9
HIV – (n=19) 3.0 ± 0.1 3.0 ± 0.1
Diabetes ND ND
Yes (n=2) 3.1 3.0
No (n=21) 3.0 ± 0.1 2,7 ± 0.1
Tobacco usage 0.75 0.68
Yes(n=7) 3.0 ± 0.2 2.8 ± 0.1
No (n=16) 3.0 ± 0.1 2.7 ± 0.1
Alcohol consumption (days) 0.29 0.39
None consumed (n=14) 2.9 ± 0.1 2.6 ± 0.1
1‐3 drinks (n=5) 2.9 ± 0.1 2.7 ± 0.1
>3 drinks or binge (n=4) 3.2 ± 0.2 3.0 ± 0.1
BCG vaccination history 0.30 0.89
Yes (n=9) 3.1 ± 0.2 2.7 ± 0.2
No (n=14) 2.9 ± 0.1 2.7 ± 0.1
US‐Born 0.86 0.76
Yes (n=13) 3.0 ± 0.1 2.7 ± 0.1
No (n=10) 2.9 ± 0.1 2.7 ± 0.2
PPD induration (mm) R=‐0.18 0.46 R=‐0.11 0.64

166
Table 18: Univariate correlation between clinical variable and total antibody titers to
LAM, cell wall, and secreted proteins for patients with latent TB infection
Log10 total antibody titer by ELISA
Variables LAM Cell wall Secreted Proteins
R value/
mean ±
SEM
P
value*
R value/
mean ±
SEM
P
value
R value/
mean ±
SEM
P
value
Age R=‐0.22 0.32 0.18 0.42 R=0.27 0.23
Gender 0.89 0.32 0.35
Male (n=11) 2.8 ± 0.2 3.3 ± 0.2 2.9 ± 0.2
Female (n=12) 2.8 ± 0.2 3.7 ± 0.3 2.7 ± 0.2
Race/ethnicity 0.21 0.80 0.95
White (n=8) 2.5 ± 0.2 3.4 ± 0.2 2.7 ± 0.1
White Hispanic (n=4) 3.1 ± 0.2 3.4 ± 0.5 3.0 ± 0.6
Black (n=9) 2.9 ± 0.1 3.7 ± 0.4 2.8 ± 0.1
Asian (n=2) 3.0 3.0 ± 0.4 2.9
HIV seropositivity ND‡ ND ND
HIV + (n=2) 3.0 5.2 ± 0.7 2.5
HIV – (n=19) 2.8 ± 0.1 3.3 ± 0.2 2.9 ± 0.1
Diabetes ND ND ND
Yes (n=2) 3.1 3.0 ± 0.9 2.8
No (n=21) 2.8 ± 0.2 3.5 ± 0.2 2.9 ± 0.1
Tobacco usage 0.83 0.20 0.99
Yes(n=7) 2.8 ± 0.2 3.8 ± 0.5 2.8 ± 0.2
No (n=16) 2.8 ± 0.2 3.3 ± 0.2 2.8 ± 0.1
Alcohol consumption (day) 0.84 0.24 0.98
None consumed (n=14) 2.8 ± 0.1 3.2 ± 0.2 2.9 ± 0.1
1‐3 drinks(n=5) 2.7 ± 0.4 3.6 ± 0.2 2.8 ± 0.2
>3 drinks/or binge (n=4) 2.9 ± 0.1 4.1 ± 0.8 2.8 ± 0.2
BCG vaccination history 0.68 0.70 0.72
Yes (n=9) 2.9 ± 0.2 3.4 ± 0.3 2.9 ± 0.3
No (n=14) 2.8 ± 0.2 3.5 ± 0.3 2.8 ± 0.1
US‐Born 0.84 0.26 0.96
Yes (n=13) 2.8 ± 0.2 3.7 ± 0.3 2.8 ± 0.3
No (n=10) 2.8 ± 0.2 3.2 ± 0.3 2.8 ± 0.1
PPD induration (mm) R=0.06 0.80 0.07 0.78 R=0.05 0.83
*P‐value calculated using one‐way ANOVA or student’s t‐test for categorical variables
or F‐statistic for continuous variables. P‐values are unadjusted for multiple comparisons.
‡Not done. Pairwise comparisons were limited to clinical characteristics with at least
three subjects in each group.
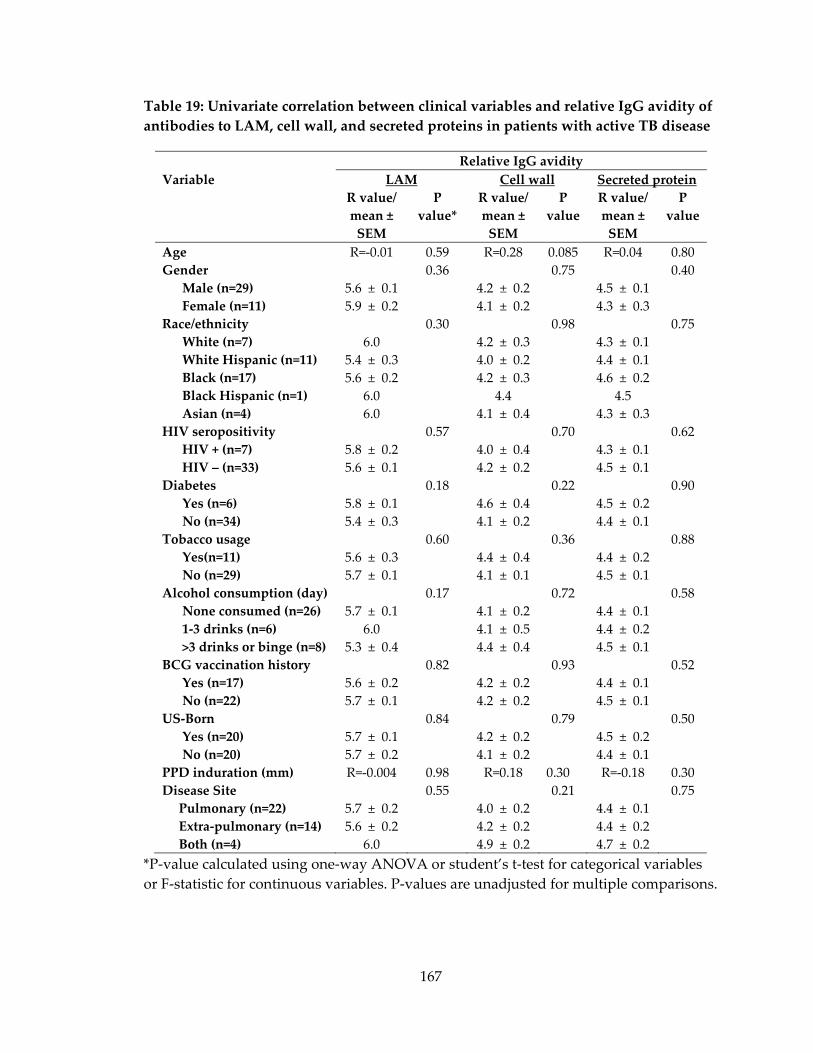
167
Table 19: Univariate correlation between clinical variables and relative IgG avidity of
antibodies to LAM, cell wall, and secreted proteins in patients with active TB disease
Relative IgG avidity
Variable LAM Cell wall Secreted protein
R value/
mean ±
SEM
P
value*
R value/
mean ±
SEM
P
value
R value/
mean ±
SEM
P
value
Age R=‐0.01 0.59 R=0.28 0.085 R=0.04 0.80
Gender 0.36 0.75 0.40
Male (n=29) 5.6 ± 0.1 4.2 ± 0.2 4.5 ± 0.1
Female (n=11) 5.9 ± 0.2 4.1 ± 0.2 4.3 ± 0.3
Race/ethnicity 0.30 0.98 0.75
White (n=7) 6.0 4.2 ± 0.3 4.3 ± 0.1
White Hispanic (n=11) 5.4 ± 0.3 4.0 ± 0.2 4.4 ± 0.1
Black (n=17) 5.6 ± 0.2 4.2 ± 0.3 4.6 ± 0.2
Black Hispanic (n=1) 6.0 4.4 4.5
Asian (n=4) 6.0 4.1 ± 0.4 4.3 ± 0.3
HIV seropositivity 0.57 0.70 0.62
HIV + (n=7) 5.8 ± 0.2 4.0 ± 0.4 4.3 ± 0.1
HIV – (n=33) 5.6 ± 0.1 4.2 ± 0.2 4.5 ± 0.1
Diabetes 0.18 0.22 0.90
Yes (n=6) 5.8 ± 0.1 4.6 ± 0.4 4.5 ± 0.2
No (n=34) 5.4 ± 0.3 4.1 ± 0.2 4.4 ± 0.1
Tobacco usage 0.60 0.36 0.88
Yes(n=11) 5.6 ± 0.3 4.4 ± 0.4 4.4 ± 0.2
No (n=29) 5.7 ± 0.1 4.1 ± 0.1 4.5 ± 0.1
Alcohol consumption (day) 0.17 0.72 0.58
None consumed (n=26) 5.7 ± 0.1 4.1 ± 0.2 4.4 ± 0.1
1‐3 drinks (n=6) 6.0 4.1 ± 0.5 4.4 ± 0.2
>3 drinks or binge (n=8) 5.3 ± 0.4 4.4 ± 0.4 4.5 ± 0.1
BCG vaccination history 0.82 0.93 0.52
Yes (n=17) 5.6 ± 0.2 4.2 ± 0.2 4.4 ± 0.1
No (n=22) 5.7 ± 0.1 4.2 ± 0.2 4.5 ± 0.1
US‐Born 0.84 0.79 0.50
Yes (n=20) 5.7 ± 0.1 4.2 ± 0.2 4.5 ± 0.2
No (n=20) 5.7 ± 0.2 4.1 ± 0.2 4.4 ± 0.1
PPD induration (mm) R=‐0.004 0.98 R=0.18 0.30 R=‐0.18 0.30
Disease Site 0.55 0.21 0.75
Pulmonary (n=22) 5.7 ± 0.2 4.0 ± 0.2 4.4 ± 0.1
Extra‐pulmonary (n=14) 5.6 ± 0.2 4.2 ± 0.2 4.4 ± 0.2
Both (n=4) 6.0 4.9 ± 0.2 4.7 ± 0.2
*P‐value calculated using one‐way ANOVA or student’s t‐test for categorical variables
or F‐statistic for continuous variables. P‐values are unadjusted for multiple comparisons.
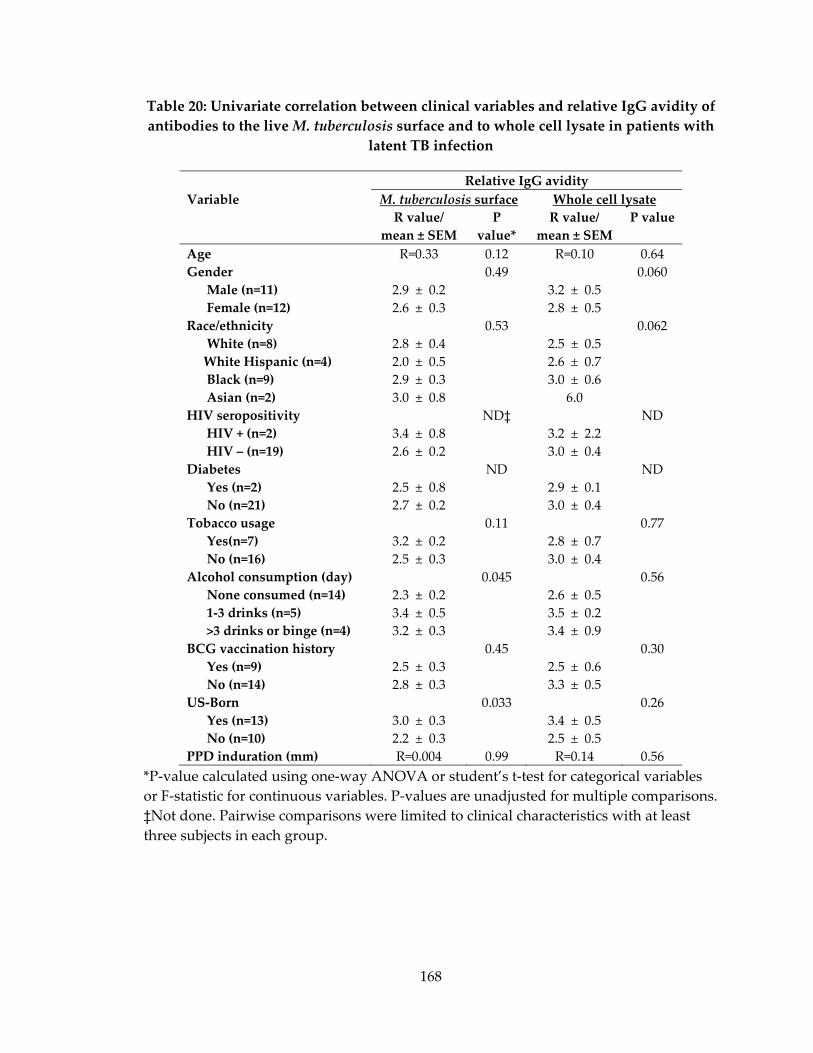
168
Table 20: Univariate correlation between clinical variables and relative IgG avidity of
antibodies to the live M. tuberculosis surface and to whole cell lysate in patients with
latent TB infection
Relative IgG avidity
Variable M. tuberculosis surface Whole cell lysate
R value/
mean ± SEM
P
value*
R value/
mean ± SEM
P value
Age R=0.33 0.12 R=0.10 0.64
Gender 0.49 0.060
Male (n=11) 2.9 ± 0.2 3.2 ± 0.5
Female (n=12) 2.6 ± 0.3 2.8 ± 0.5
Race/ethnicity 0.53 0.062
White (n=8) 2.8 ± 0.4 2.5 ± 0.5
White Hispanic (n=4) 2.0 ± 0.5 2.6 ± 0.7
Black (n=9) 2.9 ± 0.3 3.0 ± 0.6
Asian (n=2) 3.0 ± 0.8 6.0
HIV seropositivity ND‡ ND
HIV + (n=2) 3.4 ± 0.8 3.2 ± 2.2
HIV – (n=19) 2.6 ± 0.2 3.0 ± 0.4
Diabetes ND ND
Yes (n=2) 2.5 ± 0.8 2.9 ± 0.1
No (n=21) 2.7 ± 0.2 3.0 ± 0.4
Tobacco usage 0.11 0.77
Yes(n=7) 3.2 ± 0.2 2.8 ± 0.7
No (n=16) 2.5 ± 0.3 3.0 ± 0.4
Alcohol consumption (day) 0.045 0.56
None consumed (n=14) 2.3 ± 0.2 2.6 ± 0.5
1‐3 drinks (n=5) 3.4 ± 0.5 3.5 ± 0.2
>3 drinks or binge (n=4) 3.2 ± 0.3 3.4 ± 0.9
BCG vaccination history 0.45 0.30
Yes (n=9) 2.5 ± 0.3 2.5 ± 0.6
No (n=14) 2.8 ± 0.3 3.3 ± 0.5
US‐Born 0.033 0.26
Yes (n=13) 3.0 ± 0.3 3.4 ± 0.5
No (n=10) 2.2 ± 0.3 2.5 ± 0.5
PPD induration (mm) R=0.004 0.99 R=0.14 0.56
*P‐value calculated using one‐way ANOVA or student’s t‐test for categorical variables
or F‐statistic for continuous variables. P‐values are unadjusted for multiple comparisons.
‡Not done. Pairwise comparisons were limited to clinical characteristics with at least
three subjects in each group.

169
Table 21: Univariate correlation between clinical factors and relative IgG avidity of
antibodies to LAM, secreted proteins, and cell wall in patients with latent TB
infection
*P‐value calculated using one‐way ANOVA or student’s t‐test for categorical variables
or F‐statistic for continuous variables. P‐values are unadjusted for multiple comparisons.
‡Not done. Pairwise comparisons were limited to clinical characteristics with at least
three subjects in each group.
Relative IgG avidity
Variable LAM Cell wall Secreted proteins
R value/
mean ±
SEM
P
value
*
R value/
mean ±
SEM
P
value
R value/
mean ±
SEM
P
value
Age R=‐0.33 0.13 R=0.18 0.42 R=0.35 0.10
Gender 0.81 0.32 0.31
Male (n=11) 4.2 ± 0.3 3.3 ± 0.2 4.1 ± 0.2
Female (n=12) 4.1 ± 0.2 3.7 ± 0.3 4.4 ± 0.3
Race/ethnicity 0.70 0.80 0.42
White (n=8) 4.0 ± 0.4 3.4 ± 0.2 4.3 ± 0.3
White Hispanic (n=4) 4.3 ± 0.6 3.4 ± 0.5 3.8 ± 0.5
Black (n=9) 4.1 ± 0.3 3.7 ± 0.4 4.5 ± 0.3
Asian (n=2) 4.8 ± 0.1 3.0 ± 0.4 3.7 ± 0.3
HIV seropositivity ND‡ ND ND
HIV + (n=2) 4.8 ± 0.2 5.2 ± 0.7 5.3 ± 1.1
HIV – (n=19) 4.0 ± 0.2 3.3 ± 0.2 4.2 ± 0.2
Diabetes ND ND ND
Yes (n=2) 3.9 ± 1.1 3.0 ± 0.9 4.0 ± 0.0
No (n=21) 4.2 ± 0.2 3.5 ± 0.2 4.3 ± 0.2
Tobacco usage 0.51 0.20 0.54
Yes(n=7) 4.4 ± 0.4 3.8 ± 0.5 4.4 ± 0.2
No (n=16) 4.1 ± 0.2 3.3 ± 0.2 4.2 ± 0.2
Alcohol consumption days 0.61 0.24 0.11
None consumed (n=14) 4.3 ± 0.2 3.2 ± 0.2 4.0 ± 0.2
1‐3 drinks (n=5) 3.8 ± 0.5 3.6 ± 0.2 4.7 ± 0.3
>3 drinks or binge (n=4) 4.0 ± 0.5 4.1 ± 0.8 4.7 ± 0.4
BCG vaccination history 0.87 0.70 0.95
Yes (n=9) 4.2 ± 0.3 3.4 ± 0.3 4.2 ± 0.3
No (n=14) 4.1 ± 0.3 3.5 ± 0.3 4.3 ± 0.2
US‐Born 0.95 0.26 0.32
Yes (n=13) 4.1 ± 0.3 3.7 ± 0.3 4.4 ± 0.2
No (n=10) 4.1 ± 0.3 3.2 ± 0.3 4.1 ± 0.3
PPD induration (mm) R=0.05 0.85 R=0.07 0.78 R=0.15 0.55

170
Table 22: Univariate correlation between cytokine levels in whole blood after
Quantiferon‐Gold peptide stimulation and total antibody titers
Latent TB infection (n=23) Active TB Disease (n=10)
M. tuberculosis
surface
Whole cell
lysate
M. tuberculosis
surface
Whole cell
lysate
R* P‐
value‡ R
P‐
value R
P‐
value R
P‐
value
Cytokines associated with a Th1 response
IL‐2 ‐0.02 0.48 ‐0.20 0.37 0.08 0.83 ‐0.17 0.64
IL‐12p40/p70 0.004 0.78 ‐0.22 0.32 ‐0.06 0.86 ‐0.55 0.10
IFN‐γ ‐0.01 0.68 ‐0.13 0.54 ‐0.12 0.74 ‐0.55 0.10
TNF‐α ‐0.01 0.62 ‐0.31 0.15 0.33 0.35 0.18 0.62
Cytokines associated with a Th2 response
IL‐4 ‐0.02 0.50 ‐0.10 0.65 0.26 0.47 0.12 0.75
IL‐5 0.01 0.73 ‐0.20 0.36 0.35 0.32 0.09 0.80
IL‐6 0.000 0.92 ‐0.34 0.11 0.52 0.12 0.40 0.26
IL‐10 ‐0.04 0.37 ‐0.11 0.61 0.28 0.43 0.01 0.99
IL‐13 ‐0.002 0.85 ‐0.03 0.87 0.00 0.99 ‐0.32 0.37
Additional cytokines
IL‐1β 0.002 0.84 ‐0.34 0.11 0.70 0.02 0.69 0.03
IL‐1Rα ‐0.02 0.56 ‐0.16 0.45 0.31 0.39 ‐0.06 0.87
IL‐2R ‐0.005 0.76 ‐0.20 0.37 0.03 0.93 0.09 0.80
IL‐7 0.000 0.95 ‐0.08 0.74 0.10 0.79 ‐0.15 0.67
IL‐8 ‐0.16 0.06 ‐0.30 0.17 0.45 0.20 0.00 1.00
IL‐15 ‐0.01 0.72 ‐0.01 0.96 ‐0.37 0.30 ‐0.44 0.21
IL‐17 ‐0.004 0.77 ‐0.14 0.52 0.42 0.22 0.00 1.00
IFN‐α ‐0.02 0.47 ‐0.09 0.68 0.48 0.16 0.11 0.76
GM‐CSF ‐0.001 0.87 ‐0.26 0.23 0.58 0.08 0.15 0.69
Chemokines
MIP‐1α ‐0.01 0.67 ‐0.23 0.30 0.51 0.14 0.29 0.41
MIP‐1β ‐0.06 0.26 ‐0.16 0.47 0.47 0.18 0.07 0.85
IP‐10 ‐0.03 0.42 ‐0.14 0.51 0.08 0.82 ‐0.22 0.54
MIG ‐0.03 0.44 ‐0.04 0.87 0.24 0.51 ‐0.27 0.44
Eotaxin 0.02 0.52 ‐0.20 0.36 0.07 0.85 0.34 0.33
RANTES ‐0.13 0.09 ‐0.31 0.15 ‐0.47 0.17 ‐0.25 0.49
MCP‐1 0.02 0.48 ‐0.06 0.77 0.57 0.09 0.07 0.84
* R values determined by linear regression of the log‐transformed antibody titers plotted
against log‐transformed cytokine concentrations
‡ P‐values determined by F‐statistic, and are not adjusted for multiple comparisons.
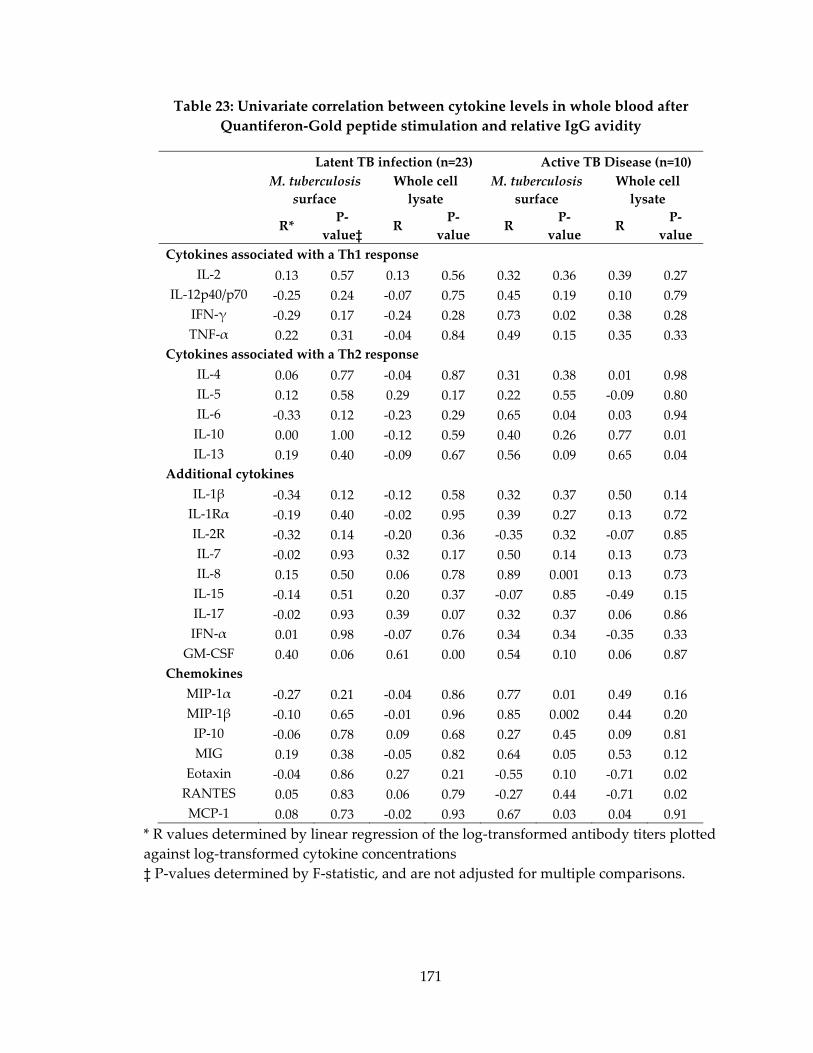
171
Table 23: Univariate correlation between cytokine levels in whole blood after
Quantiferon‐Gold peptide stimulation and relative IgG avidity
Latent TB infection (n=23) Active TB Disease (n=10)
M. tuberculosis
surface
Whole cell
lysate
M. tuberculosis
surface
Whole cell
lysate
R* P‐
value‡ R
P‐
value R
P‐
value R
P‐
value
Cytokines associated with a Th1 response
IL‐2 0.13 0.57 0.13 0.56 0.32 0.36 0.39 0.27
IL‐12p40/p70 ‐0.25 0.24 ‐0.07 0.75 0.45 0.19 0.10 0.79
IFN‐γ ‐0.29 0.17 ‐0.24 0.28 0.73 0.02 0.38 0.28
TNF‐α 0.22 0.31 ‐0.04 0.84 0.49 0.15 0.35 0.33
Cytokines associated with a Th2 response
IL‐4 0.06 0.77 ‐0.04 0.87 0.31 0.38 0.01 0.98
IL‐5 0.12 0.58 0.29 0.17 0.22 0.55 ‐0.09 0.80
IL‐6 ‐0.33 0.12 ‐0.23 0.29 0.65 0.04 0.03 0.94
IL‐10 0.00 1.00 ‐0.12 0.59 0.40 0.26 0.77 0.01
IL‐13 0.19 0.40 ‐0.09 0.67 0.56 0.09 0.65 0.04
Additional cytokines
IL‐1β ‐0.34 0.12 ‐0.12 0.58 0.32 0.37 0.50 0.14
IL‐1Rα ‐0.19 0.40 ‐0.02 0.95 0.39 0.27 0.13 0.72
IL‐2R ‐0.32 0.14 ‐0.20 0.36 ‐0.35 0.32 ‐0.07 0.85
IL‐7 ‐0.02 0.93 0.32 0.17 0.50 0.14 0.13 0.73
IL‐8 0.15 0.50 0.06 0.78 0.89 0.001 0.13 0.73
IL‐15 ‐0.14 0.51 0.20 0.37 ‐0.07 0.85 ‐0.49 0.15
IL‐17 ‐0.02 0.93 0.39 0.07 0.32 0.37 0.06 0.86
IFN‐α 0.01 0.98 ‐0.07 0.76 0.34 0.34 ‐0.35 0.33
GM‐CSF 0.40 0.06 0.61 0.00 0.54 0.10 0.06 0.87
Chemokines
MIP‐1α ‐0.27 0.21 ‐0.04 0.86 0.77 0.01 0.49 0.16
MIP‐1β ‐0.10 0.65 ‐0.01 0.96 0.85 0.002 0.44 0.20
IP‐10 ‐0.06 0.78 0.09 0.68 0.27 0.45 0.09 0.81
MIG 0.19 0.38 ‐0.05 0.82 0.64 0.05 0.53 0.12
Eotaxin ‐0.04 0.86 0.27 0.21 ‐0.55 0.10 ‐0.71 0.02
RANTES 0.05 0.83 0.06 0.79 ‐0.27 0.44 ‐0.71 0.02
MCP‐1 0.08 0.73 ‐0.02 0.93 0.67 0.03 0.04 0.91
* R values determined by linear regression of the log‐transformed antibody titers plotted
against log‐transformed cytokine concentrations
‡ P‐values determined by F‐statistic, and are not adjusted for multiple comparisons.
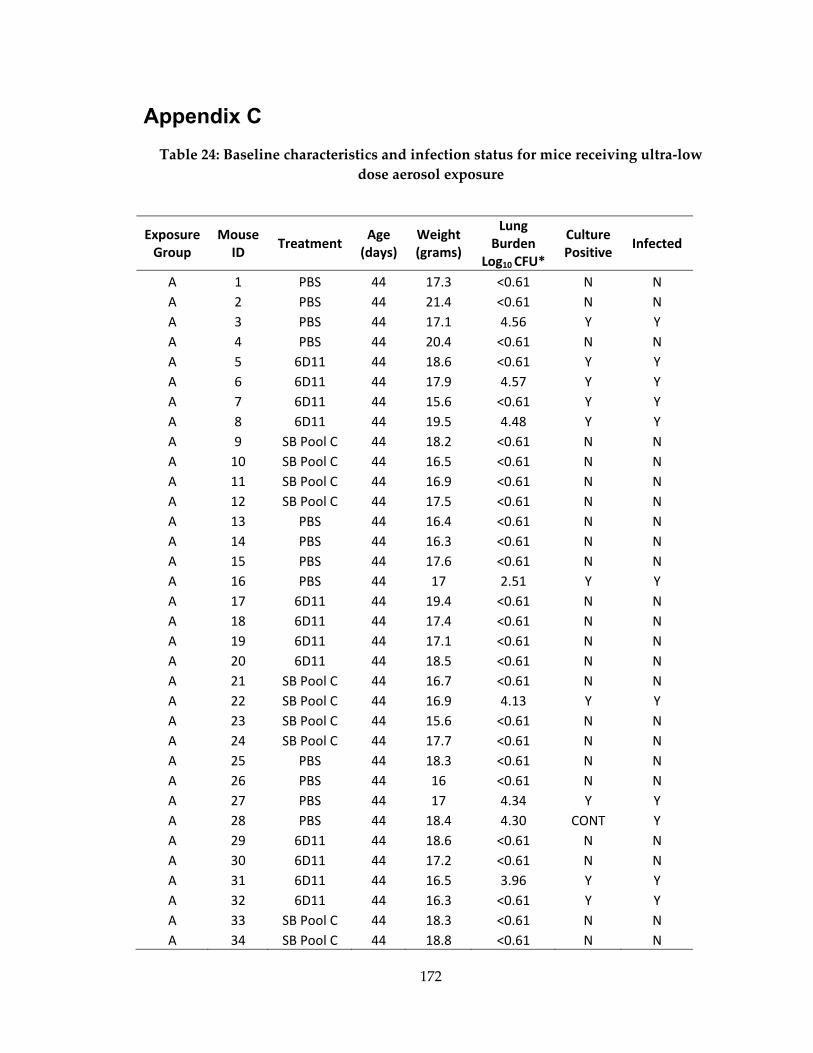
172
Appendix C
Table 24: Baseline characteristics and infection status for mice receiving ultra‐low
dose aerosol exposure
Exposure Group
Mouse ID
Treatment Age (days)
Weight(grams)
Lung Burden
Log10 CFU*
Culture Positive
Infected
A 1 PBS 44 17.3 <0.61 N N
A 2 PBS 44 21.4 <0.61 N N
A 3 PBS 44 17.1 4.56 Y Y
A 4 PBS 44 20.4 <0.61 N N
A 5 6D11 44 18.6 <0.61 Y Y
A 6 6D11 44 17.9 4.57 Y Y
A 7 6D11 44 15.6 <0.61 Y Y
A 8 6D11 44 19.5 4.48 Y Y
A 9 SB Pool C 44 18.2 <0.61 N N
A 10 SB Pool C 44 16.5 <0.61 N N
A 11 SB Pool C 44 16.9 <0.61 N N
A 12 SB Pool C 44 17.5 <0.61 N N
A 13 PBS 44 16.4 <0.61 N N
A 14 PBS 44 16.3 <0.61 N N
A 15 PBS 44 17.6 <0.61 N N
A 16 PBS 44 17 2.51 Y Y
A 17 6D11 44 19.4 <0.61 N N
A 18 6D11 44 17.4 <0.61 N N
A 19 6D11 44 17.1 <0.61 N N
A 20 6D11 44 18.5 <0.61 N N
A 21 SB Pool C 44 16.7 <0.61 N N
A 22 SB Pool C 44 16.9 4.13 Y Y
A 23 SB Pool C 44 15.6 <0.61 N N
A 24 SB Pool C 44 17.7 <0.61 N N
A 25 PBS 44 18.3 <0.61 N N
A 26 PBS 44 16 <0.61 N N
A 27 PBS 44 17 4.34 Y Y
A 28 PBS 44 18.4 4.30 CONT Y
A 29 6D11 44 18.6 <0.61 N N
A 30 6D11 44 17.2 <0.61 N N
A 31 6D11 44 16.5 3.96 Y Y
A 32 6D11 44 16.3 <0.61 Y Y
A 33 SB Pool C 44 18.3 <0.61 N N
A 34 SB Pool C 44 18.8 <0.61 N N
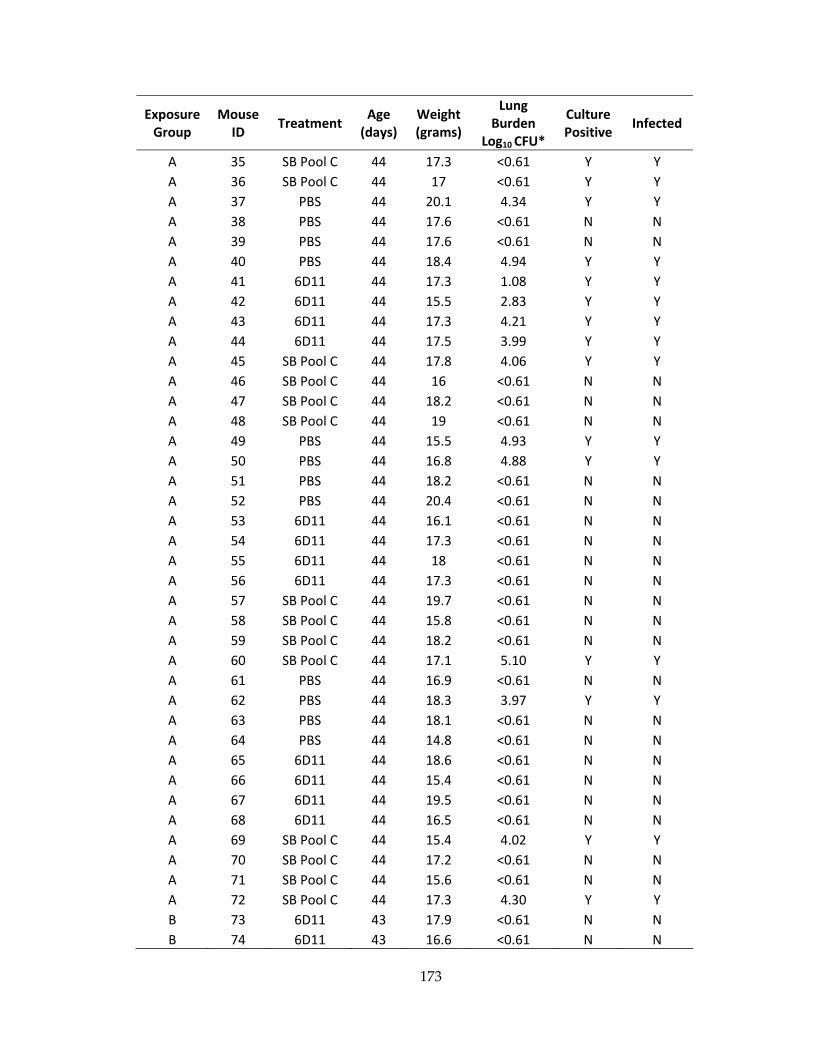
173
Exposure Group
Mouse ID
Treatment Age (days)
Weight(grams)
Lung Burden
Log10 CFU*
Culture Positive
Infected
A 35 SB Pool C 44 17.3 <0.61 Y Y
A 36 SB Pool C 44 17 <0.61 Y Y
A 37 PBS 44 20.1 4.34 Y Y
A 38 PBS 44 17.6 <0.61 N N
A 39 PBS 44 17.6 <0.61 N N
A 40 PBS 44 18.4 4.94 Y Y
A 41 6D11 44 17.3 1.08 Y Y
A 42 6D11 44 15.5 2.83 Y Y
A 43 6D11 44 17.3 4.21 Y Y
A 44 6D11 44 17.5 3.99 Y Y
A 45 SB Pool C 44 17.8 4.06 Y Y
A 46 SB Pool C 44 16 <0.61 N N
A 47 SB Pool C 44 18.2 <0.61 N N
A 48 SB Pool C 44 19 <0.61 N N
A 49 PBS 44 15.5 4.93 Y Y
A 50 PBS 44 16.8 4.88 Y Y
A 51 PBS 44 18.2 <0.61 N N
A 52 PBS 44 20.4 <0.61 N N
A 53 6D11 44 16.1 <0.61 N N
A 54 6D11 44 17.3 <0.61 N N
A 55 6D11 44 18 <0.61 N N
A 56 6D11 44 17.3 <0.61 N N
A 57 SB Pool C 44 19.7 <0.61 N N
A 58 SB Pool C 44 15.8 <0.61 N N
A 59 SB Pool C 44 18.2 <0.61 N N
A 60 SB Pool C 44 17.1 5.10 Y Y
A 61 PBS 44 16.9 <0.61 N N
A 62 PBS 44 18.3 3.97 Y Y
A 63 PBS 44 18.1 <0.61 N N
A 64 PBS 44 14.8 <0.61 N N
A 65 6D11 44 18.6 <0.61 N N
A 66 6D11 44 15.4 <0.61 N N
A 67 6D11 44 19.5 <0.61 N N
A 68 6D11 44 16.5 <0.61 N N
A 69 SB Pool C 44 15.4 4.02 Y Y
A 70 SB Pool C 44 17.2 <0.61 N N
A 71 SB Pool C 44 15.6 <0.61 N N
A 72 SB Pool C 44 17.3 4.30 Y Y
B 73 6D11 43 17.9 <0.61 N N
B 74 6D11 43 16.6 <0.61 N N

174
Exposure Group
Mouse ID
Treatment Age (days)
Weight(grams)
Lung Burden
Log10 CFU*
Culture Positive
Infected
B 75 6D11 43 17.6 4.26 Y Y
B 76 PBS 43 15.6 4.97 Y Y
B 77 PBS 43 16.0 <0.61 N N
B 78 PBS 43 17.0 5.30 Y Y
B 79 PBS 43 18.1 4.96 Y Y
B 80 SB Pool C 43 18.6 4.44 Y Y
B 81 SB Pool C 43 14.7 <0.61 N N
B 82 SB Pool C 43 15.4 3.91 CONT Y
B 83 SB Pool C 43 16.4 <0.61 N N
B 84 PBS 43 16.3 4.33 Y Y
B 85 PBS 43 16.0 4.52 Y Y
B 86 PBS 43 16.2 4.94 Y Y
B 87 PBS 43 17.6 4.20 Y Y
B 88 6D11 43 18.3 4.10 Y Y
B 89 6D11 43 17.0 4.97 Y Y
B 90 6D11 43 15.1 <0.61 CONT N
B 91 6D11 43 15.9 <0.61 CONt N
B 92 SB Pool C 43 16.0 4.91 CONT Y
B 93 SB Pool C 43 16.7 2.41 Y Y
B 94 SB Pool C 43 15.8 <0.61 N N
B 95 SB Pool C 43 15.8 <0.61 N N
B 96 PBS 43 18.0 4.60 Y Y
B 97 PBS 43 18.2 4.90 Y Y
B 98 PBS 43 14.8 3.94 Y Y
B 99 PBS 43 18.3 <0.61 N N
B 100 6D11 43 19.5 4.63 Y Y
B 101 6D11 43 16.9 3.72 Y Y
B 102 6D11 43 17.7 4.51 Y Y
B 103 6D11 43 15.5 <0.61 Y Y
B 104 SB Pool C 43 16.0 4.79 Y Y
B 105 SB Pool C 43 16.5 4.00 Y Y
B 106 SB Pool C 43 17.1 4.19 Y Y
B 107 SB Pool C 43 15.5 4.79 Y Y
B 108 PBS 43 16.1 4.35 Y Y
B 109 PBS 43 17.5 4.49 Y Y
B 110 PBS 43 17.3 5.21 Y Y
B 111 PBS 43 17.7 5.24 Y Y
B 112 6D11 43 15.5 4.33 Y Y
B 113 6D11 43 16.2 5.04 Y Y
B 114 6D11 43 16.3 2.26 Y Y
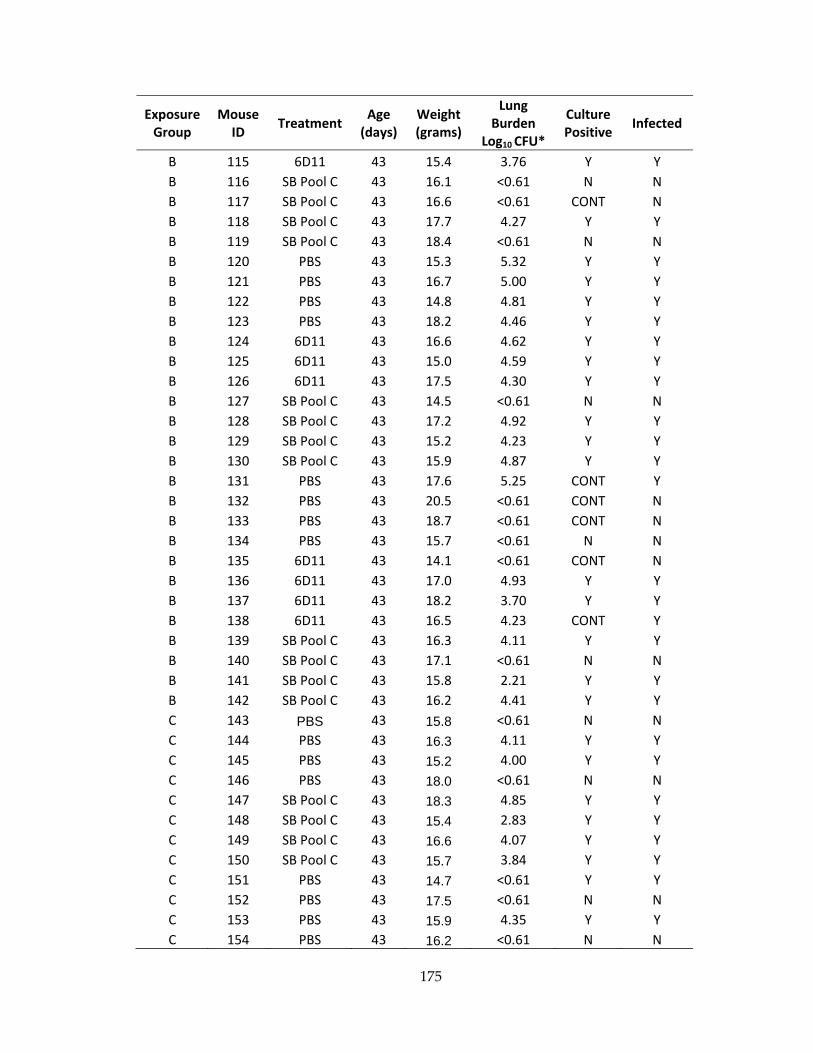
175
Exposure Group
Mouse ID
Treatment Age (days)
Weight(grams)
Lung Burden
Log10 CFU*
Culture Positive
Infected
B 115 6D11 43 15.4 3.76 Y Y
B 116 SB Pool C 43 16.1 <0.61 N N
B 117 SB Pool C 43 16.6 <0.61 CONT N
B 118 SB Pool C 43 17.7 4.27 Y Y
B 119 SB Pool C 43 18.4 <0.61 N N
B 120 PBS 43 15.3 5.32 Y Y
B 121 PBS 43 16.7 5.00 Y Y
B 122 PBS 43 14.8 4.81 Y Y
B 123 PBS 43 18.2 4.46 Y Y
B 124 6D11 43 16.6 4.62 Y Y
B 125 6D11 43 15.0 4.59 Y Y
B 126 6D11 43 17.5 4.30 Y Y
B 127 SB Pool C 43 14.5 <0.61 N N
B 128 SB Pool C 43 17.2 4.92 Y Y
B 129 SB Pool C 43 15.2 4.23 Y Y
B 130 SB Pool C 43 15.9 4.87 Y Y
B 131 PBS 43 17.6 5.25 CONT Y
B 132 PBS 43 20.5 <0.61 CONT N
B 133 PBS 43 18.7 <0.61 CONT N
B 134 PBS 43 15.7 <0.61 N N
B 135 6D11 43 14.1 <0.61 CONT N
B 136 6D11 43 17.0 4.93 Y Y
B 137 6D11 43 18.2 3.70 Y Y
B 138 6D11 43 16.5 4.23 CONT Y
B 139 SB Pool C 43 16.3 4.11 Y Y
B 140 SB Pool C 43 17.1 <0.61 N N
B 141 SB Pool C 43 15.8 2.21 Y Y
B 142 SB Pool C 43 16.2 4.41 Y Y
C 143 PBS 43 15.8 <0.61 N N
C 144 PBS 43 16.3 4.11 Y Y
C 145 PBS 43 15.2 4.00 Y Y
C 146 PBS 43 18.0 <0.61 N N
C 147 SB Pool C 43 18.3 4.85 Y Y
C 148 SB Pool C 43 15.4 2.83 Y Y
C 149 SB Pool C 43 16.6 4.07 Y Y
C 150 SB Pool C 43 15.7 3.84 Y Y
C 151 PBS 43 14.7 <0.61 Y Y
C 152 PBS 43 17.5 <0.61 N N
C 153 PBS 43 15.9 4.35 Y Y
C 154 PBS 43 16.2 <0.61 N N

176
For mice with no colonies on titer plates, Log10 CFU are marked as <0.61 log10 CFU, the limit of
detection for this study.
Exposure Group
Mouse ID
Treatment Age (days)
Weight(grams)
Lung Burden
Log10 CFU*
Culture Positive
Infected
C 155 SB Pool C 43 15.2 4.25 Y Y
C 156 SB Pool C 43 16.3 2.19 Y Y
C 157 SB Pool C 43 16.0 <0.61 CONT N
C 158 SB Pool C 43 15.4 3.04 Y Y
C 159 PBS 43 19.0 4.94 CONT Y
C 160 PBS 43 15.4 4.40 Y Y
C 161 PBS 43 15.9 4.48 Y Y
C 162 PBS 43 18.4 5.03 Y Y
C 163 SB Pool C 43 17.2 2.67 CONT Y
C 164 SB Pool C 43 17.5 <0.61 N N
C 165 SB Pool C 43 16.9 4.46 Y Y
C 166 SB Pool C 43 15.0 4.14 Y Y
C 167 PBS 43 16.0 5.08 Y Y
C 168 PBS 43 16.9 4.33 Y Y
C 169 PBS 43 14.8 4.96 Y Y
C 170 PBS 43 19.2 <0.61 Y Y
C 171 SB Pool C 43 14.5 4.67 CONT Y
C 172 SB Pool C 43 17.4 2.80 CONT Y
C 173 SB Pool C 43 17.0 4.88 CONT Y
C 174 SB Pool C 43 15.8 3.24 Y Y
C 175 PBS 43 15.6 4.52 CONT Y
C 176 PBS 43 16.0 2.92 CONT Y
C 177 PBS 43 16.0 4.82 CONT Y
C 178 PBS 43 14.5 <0.61 N N
C 179 SB Pool C 43 16.0 <0.61 N N
C 180 SB Pool C 43 18.4 <0.61 N N
C 181 SB Pool C 43 15.0 2.56 CONT Y
C 182 SB Pool C 43 16.2 3.89 CONT Y
C 183 PBS 43 16.4 3.89 Y Y
C 184 PBS 43 15.5 <0.61 N N
C 185 PBS 43 14.0 4.76 Y Y
C 186 PBS 43 16.3 4.10 Y Y
C 187 SB Pool C 43 16.6 4.50 Y Y
C 188 SB Pool C 43 16.1 <0.61 N N
C 189 SB Pool C 43 17.6 4.54 Y Y
C 190 SB Pool C 43 14.7 4.35 Y Y

177
Table 25: Baseline characteristics of each exposure group in infection rate studies
Group
(number)
Mean age
(days)
Mean weight
(grams) +/‐ SD
P‐value for
(weight)*
Group 1 (72) 44 17.5 ± 1.3
PBS (24) 44 17.7 ± 1.6 0.48
6D11 (24) 44 17.5 ± 1.2
SB Pool C (24) 44 17.3 ± 1.1
Group 2 (70) 43 16.7 ± 1.3
PBS (24) 43 17.0 ± 1.4 0.16
6D11 (22) 43 16.7 ± 1.3
SB Pool C (24) 43 16.3 ± 1.0
Group 3 (71) 43 16.3 ± 1.2
PBS (24) 43 16.2 ± 1.4 0.96
SB Pool C (24) 43 16.3 ± 1.1
Total (213) 43 ± 0.3 16.8 ± 1.4
PBS (72) 43 ± 0.3 17.0 ± 1.6 0.85
SB Pool C (72) 43 ± 0.3 16.6 ± 1.2
* P‐value was calculated using a one‐way ANOVA for groups with three variables and a student’s t‐test for groups with two variables
178
References
1. Alexander KA, Laver PN, Michel AL, Williams M, van Helden PD, et al. (2010) Novel
Mycobacterium tuberculosis complex pathogen, M. mungi. Emerg Infect Dis 16:
1296‐1299.
2. Frothingham R, Hills HG, Wilson KH (1994) Extensive DNA sequence conservation
throughout the Mycobacterium tuberculosis complex. J Clin Microbiol 32: 1639‐
1643.
3. Gill WP, Harik NS, Whiddon MR, Liao RP, Mittler JE, et al. (2009) A replication clock
for Mycobacterium tuberculosis. Nat Med 15: 211‐214.
4. Botha L, van Pittius NC, van Helden PD (2013) Mycobacteria and disease in southern
Africa. Transbound Emerg Dis 60 Suppl 1: 147‐156.
5. de Jong BC, Antonio M, Gagneux S (2010) Mycobacterium africanum‐‐review of an
important cause of human tuberculosis in West Africa. PLoS Negl Trop Dis 4:
e744.
6. Koeck JL, Fabre M, Simon F, Daffe M, Garnotel E, et al. (2011) Clinical characteristics
of the smooth tubercle bacilli ʹMycobacterium canettiiʹ infection suggest the
existence of an environmental reservoir. Clin Microbiol Infect 17: 1013‐1019.
7. van Soolingen D, van der Zanden AG, de Haas PE, Noordhoek GT, Kiers A, et al.
(1998) Diagnosis of Mycobacterium microti infections among humans by using
novel genetic markers. J Clin Microbiol 36: 1840‐1845.
8. Muller B, Durr S, Alonso S, Hattendorf J, Laisse CJ, et al. (2013) Zoonotic
Mycobacterium bovis‐induced tuberculosis in humans. Emerg Infect Dis 19: 899‐
908.
9. Kiers A, Klarenbeek A, Mendelts B, Van Soolingen D, Koeter G (2008) Transmission of
Mycobacterium pinnipedii to humans in a zoo with marine mammals. Int J
Tuberc Lung Dis 12: 1469‐1473.
10. World Health Organization (2011) WHO Report 2011: Global control of Tuberculosis.
Geneva: World Heath Organization
11. Britton P, Perez‐Velez CM, Marais BJ (2013) Diagnosis, treatment and prevention of
tuberculosis in children. N S W Public Health Bull 24: 15‐21.

179
12. Helbling CA, Lieger O, Smolka W, Iizuka T, Kuttenberger J (2010) Primary
tuberculosis of the TMJ: presentation of a case and literature review. Int J Oral
Maxillofac Surg 39: 834‐838.
13. DeLance AR, Safaee M, Oh MC, Clark AJ, Kaur G, et al. (2013) Tuberculoma of the
central nervous system. J Clin Neurosci 20: 1333‐1341.
14. Jung JH, Kim SH, Kim MJ, Cho YK, Ahn SB, et al. (2014) A case report of primary
duodenal tuberculosis mimicking a malignant tumor. Clin Endosc 47: 346‐349.
15. Jeon D (2014) Tuberculous pleurisy: an update. Tuberc Respir Dis (Seoul) 76: 153‐159.
16. Biadglegne F, Tesfaye W, Anagaw B, Tessema B, Debebe T, et al. (2013) Tuberculosis
lymphadenitis in Ethiopia. Jpn J Infect Dis 66: 263‐268.
17. Sarkar S, Suresh MR (2011) An overview of tuberculosis chemotherapy ‐ a literature
review. J Pharm Pharm Sci 14: 148‐161.
18. Gunther G (2014) Multidrug‐resistant and extensively drug‐resistant tuberculosis: a
review of current concepts and future challenges. Clin Med 14: 279‐285.
19. Chaisson RE, Martinson NA (2008) Tuberculosis in Africa‐‐combating an HIV‐driven
crisis. N Engl J Med 358: 1089‐1092.
20. Gardam MA, Keystone EC, Menzies R, Manners S, Skamene E, et al. (2003) Anti‐
tumour necrosis factor agents and tuberculosis risk: mechanisms of action and
clinical management. Lancet Infect Dis 3: 148‐155.
21. Lonnroth K, Jaramillo E, Williams BG, Dye C, Raviglione M (2009) Drivers of
tuberculosis epidemics: the role of risk factors and social determinants. Soc Sci
Med 68: 2240‐2246.
22. Getahun H, Gunneberg C, Granich R, Nunn P (2010) HIV infection‐associated
tuberculosis: the epidemiology and the response. Clin Infect Dis 50 Suppl 3: S201‐
207.
23. Fennelly KP, Martyny JW, Fulton KE, Orme IM, Cave DM, et al. (2004) Cough‐
generated aerosols of Mycobacterium tuberculosis: a new method to study
infectiousness. Am J Respir Crit Care Med 169: 604‐609.
180
24. Armstrong JA, Hart PD (1971) Response of cultured macrophages to Mycobacterium
tuberculosis, with observations on fusion of lysosomes with phagosomes. J Exp
Med 134: 713‐740.
25. Saini D, Hopkins GW, Seay SA, Chen CJ, Perley CC, et al. (2012) Ultra‐low dose of
Mycobacterium tuberculosis aerosol creates partial infection in mice.
Tuberculosis (Edinb) 92: 160‐165.
26. Dean GS, Rhodes SG, Coad M, Whelan AO, Cockle PJ, et al. (2005) Minimum
infective dose of Mycobacterium bovis in cattle. Infect Immun 73: 6467‐6471.
27. Wolf AJ, Linas B, Trevejo‐Nunez GJ, Kincaid E, Tamura T, et al. (2007)
Mycobacterium tuberculosis infects dendritic cells with high frequency and
impairs their function in vivo. J Immunol 179: 2509‐2519.
28. Ernst JD (1998) Macrophage receptors for Mycobacterium tuberculosis. Infect Immun
66: 1277‐1281.
29. Torrelles JB, Azad AK, Henning LN, Carlson TK, Schlesinger LS (2008) Role of C‐
type lectins in mycobacterial infections. Curr Drug Targets 9: 102‐112.
30. Astarie‐Dequeker C, NʹDiaye EN, Le Cabec V, Rittig MG, Prandi J, et al. (1999) The
mannose receptor mediates uptake of pathogenic and nonpathogenic
mycobacteria and bypasses bactericidal responses in human macrophages. Infect
Immun 67: 469‐477.
31. Kang PB, Azad AK, Torrelles JB, Kaufman TM, Beharka A, et al. (2005) The human
macrophage mannose receptor directs Mycobacterium tuberculosis
lipoarabinomannan‐mediated phagosome biogenesis. J Exp Med 202: 987‐999.
32. Bulut Y, Michelsen KS, Hayrapetian L, Naiki Y, Spallek R, et al. (2005)
Mycobacterium tuberculosis heat shock proteins use diverse Toll‐like receptor
pathways to activate pro‐inflammatory signals. J Biol Chem 280: 20961‐20967.
33. Maglione PJ, Xu J, Casadevall A, Chan J (2008) Fc gamma receptors regulate immune
activation and susceptibility during Mycobacterium tuberculosis infection. J
Immunol 180: 3329‐3338.
34. Armstrong JA, Hart PD (1975) Phagosome‐lysosome interactions in cultured
macrophages infected with virulent tubercle bacilli. Reversal of the usual
nonfusion pattern and observations on bacterial survival. J Exp Med 142: 1‐16.

181
35. Rink J, Ghigo E, Kalaidzidis Y, Zerial M (2005) Rab conversion as a mechanism of
progression from early to late endosomes. Cell 122: 735‐749.
36. Roberts EA, Deretic V (2008) The Mycobacterium tuberculosis phagosome. Methods
Mol Biol 445: 439‐449.
37. Sturgill‐Koszycki S, Schlesinger PH, Chakraborty P, Haddix PL, Collins HL, et al.
(1994) Lack of acidification in Mycobacterium phagosomes produced by
exclusion of the vesicular proton‐ATPase. Science 263: 678‐681.
38. Clemens DL, Horwitz MA (1995) Characterization of the Mycobacterium
tuberculosis phagosome and evidence that phagosomal maturation is inhibited. J
Exp Med 181: 257‐270.
39. Miller BH, Fratti RA, Poschet JF, Timmins GS, Master SS, et al. (2004) Mycobacteria
inhibit nitric oxide synthase recruitment to phagosomes during macrophage
infection. Infect Immun 72: 2872‐2878.
40. Clemens DL, Horwitz MA (1996) The Mycobacterium tuberculosis phagosome
interacts with early endosomes and is accessible to exogenously administered
transferrin. J Exp Med 184: 1349‐1355.
41. Rohde K, Yates RM, Purdy GE, Russell DG (2007) Mycobacterium tuberculosis and
the environment within the phagosome. Immunol Rev 219: 37‐54.
42. Sturgill‐Koszycki S, Schaible UE, Russell DG (1996) Mycobacterium‐containing
phagosomes are accessible to early endosomes and reflect a transitional state in
normal phagosome biogenesis. EMBO J 15: 6960‐6968.
43. Cooper AM (2009) Cell‐mediated immune responses in tuberculosis. Annu Rev
Immunol 27: 393‐422.
44. Chackerian AA, Alt JM, Perera TV, Dascher CC, Behar SM (2002) Dissemination of
Mycobacterium tuberculosis is influenced by host factors and precedes the
initiation of T‐cell immunity. Infect Immun 70: 4501‐4509.
45. Reiley WW, Calayag MD, Wittmer ST, Huntington JL, Pearl JE, et al. (2008) ESAT‐6‐
specific CD4 T cell responses to aerosol Mycobacterium tuberculosis infection are
initiated in the mediastinal lymph nodes. Proc Natl Acad Sci U S A 105: 10961‐
10966.
182
46. Chackerian AA, Perera TV, Behar SM (2001) Gamma interferon‐producing CD4+ T
lymphocytes in the lung correlate with resistance to infection with
Mycobacterium tuberculosis. Infect Immun 69: 2666‐2674.
47. Casanova JL, Abel L (2002) Genetic dissection of immunity to mycobacteria: the
human model. Annu Rev Immunol 20: 581‐620.
48. Keane J, Gershon S, Wise RP, Mirabile‐Levens E, Kasznica J, et al. (2001) Tuberculosis
associated with infliximab, a tumor necrosis factor alpha‐neutralizing agent. N
Engl J Med 345: 1098‐1104.
49. Flynn JL, Chan J, Triebold KJ, Dalton DK, Stewart TA, et al. (1993) An essential role
for interferon gamma in resistance to Mycobacterium tuberculosis infection. J
Exp Med 178: 2249‐2254.
50. Flynn JL, Goldstein MM, Chan J, Triebold KJ, Pfeffer K, et al. (1995) Tumor necrosis
factor‐alpha is required in the protective immune response against
Mycobacterium tuberculosis in mice. Immunity 2: 561‐572.
51. Philips JA, Ernst JD (2012) Tuberculosis pathogenesis and immunity. Annu Rev
Pathol 7: 353‐384.
52. Silva Miranda M, Breiman A, Allain S, Deknuydt F, Altare F (2012) The tuberculous
granuloma: an unsuccessful host defence mechanism providing a safety shelter
for the bacteria? Clin Dev Immunol 2012: 139127.
53. van Rie A, Warren R, Richardson M, Victor TC, Gie RP, et al. (1999) Exogenous
reinfection as a cause of recurrent tuberculosis after curative treatment. N Engl J
Med 341: 1174‐1179.
54. Braden CR, Morlock GP, Woodley CL, Johnson KR, Colombel AC, et al. (2001)
Simultaneous infection with multiple strains of Mycobacterium tuberculosis.
Clin Infect Dis 33: e42‐47.
55. Calmette A (1931) Preventive Vaccination Against Tuberculosis with BCG. Proc R
Soc Med 24: 1481‐1490.
56. Kaufmann SH (2010) Future vaccination strategies against tuberculosis: thinking
outside the box. Immunity 33: 567‐577.
183
57. Colditz GA, Brewer TF, Berkey CS, Wilson ME, Burdick E, et al. (1994) Efficacy of
BCG vaccine in the prevention of tuberculosis. Meta‐analysis of the published
literature. JAMA 271: 698‐702.
58. Trunz BB, Fine P, Dye C (2006) Effect of BCG vaccination on childhood tuberculous
meningitis and miliary tuberculosis worldwide: a meta‐analysis and assessment
of cost‐effectiveness. Lancet 367: 1173‐1180.
59. Brandt L, Feino Cunha J, Weinreich Olsen A, Chilima B, Hirsch P, et al. (2002) Failure
of the Mycobacterium bovis BCG vaccine: some species of environmental
mycobacteria block multiplication of BCG and induction of protective immunity
to tuberculosis. Infect Immun 70: 672‐678.
60. Fine PE (1995) Variation in protection by BCG: implications of and for heterologous
immunity. Lancet 346: 1339‐1345.
61. Ritz N, Hanekom WA, Robins‐Browne R, Britton WJ, Curtis N (2008) Influence of
BCG vaccine strain on the immune response and protection against tuberculosis.
FEMS Microbiol Rev 32: 821‐841.
62. Elias D, Britton S, Aseffa A, Engers H, Akuffo H (2008) Poor immunogenicity of BCG
in helminth infected population is associated with increased in vitro TGF‐beta
production. Vaccine 26: 3897‐3902.
63. Hesseling AC, Marais BJ, Gie RP, Schaaf HS, Fine PE, et al. (2007) The risk of
disseminated Bacille Calmette‐Guerin (BCG) disease in HIV‐infected children.
Vaccine 25: 14‐18.
64. Abubakar I, Pimpin L, Ariti C, Beynon R, Mangtani P, et al. (2013) Systematic review
and meta‐analysis of the current evidence on the duration of protection by
bacillus Calmette‐Guerin vaccination against tuberculosis. Health Technol Assess
17: 1‐372, v‐vi.
65. Rodrigues LC, Pereira SM, Cunha SS, Genser B, Ichihara MY, et al. (2005) Effect of
BCG revaccination on incidence of tuberculosis in school‐aged children in Brazil:
the BCG‐REVAC cluster‐randomised trial. Lancet 366: 1290‐1295.
66. Menzies D (2000) What does tuberculin reactivity after bacille Calmette‐Guerin
vaccination tell us? Clin Infect Dis 31 Suppl 3: S71‐74.
67. Montagnani C, Chiappini E, Galli L, de Martino M (2014) Vaccine against
tuberculosis: whatʹs new? BMC Infect Dis 14 Suppl 1: S2.

184
68. Garly ML, Martins CL, Bale C, Balde MA, Hedegaard KL, et al. (2003) BCG scar and
positive tuberculin reaction associated with reduced child mortality in West
Africa. A non‐specific beneficial effect of BCG? Vaccine 21: 2782‐2790.
69. Brennan MJ, Fruth U, Milstien J, Tiernan R, de Andrade Nishioka S, et al. (2007)
Development of new tuberculosis vaccines: a global perspective on regulatory
issues. PLoS Med 4: e252.
70. Kaufmann SH, Hussey G, Lambert PH (2010) New vaccines for tuberculosis. Lancet
375: 2110‐2119.
71. Kaufmann SH, Cotton MF, Eisele B, Gengenbacher M, Grode L, et al. (2014) The BCG
replacement vaccine VPM1002: from drawing board to clinical trial. Expert Rev
Vaccines 13: 619‐630.
72. Arbues A, Aguilo JI, Gonzalo‐Asensio J, Marinova D, Uranga S, et al. (2013)
Construction, characterization and preclinical evaluation of MTBVAC, the first
live‐attenuated M. tuberculosis‐based vaccine to enter clinical trials. Vaccine 31:
4867‐4873.
73. Stanford JL, Paul RC (1973) A preliminary report on some studies of environmental
mycobacteria. Ann Soc Belg Med Trop 53: 389‐393.
74. Dlugovitzky D, Fiorenza G, Farroni M, Bogue C, Stanford C, et al. (2006)
Immunological consequences of three doses of heat‐killed Mycobacterium vaccae
in the immunotherapy of tuberculosis. Respir Med 100: 1079‐1087.
75. Johnson JL, Kamya RM, Okwera A, Loughlin AM, Nyole S, et al. (2000) Randomized
controlled trial of Mycobacterium vaccae immunotherapy in non‐human
immunodeficiency virus‐infected ugandan adults with newly diagnosed
pulmonary tuberculosis. The Uganda‐Case Western Reserve University Research
Collaboration. J Infect Dis 181: 1304‐1312.
76. Stanford J, Stanford C, Grange J (2004) Immunotherapy with Mycobacterium vaccae
in the treatment of tuberculosis. Front Biosci 9: 1701‐1719.
77. Stanford JL, Stanford CA, Grange JM, Lan NN, Etemadi A (2001) Does
immunotherapy with heat‐killed Mycobacterium vaccae offer hope for the
treatment of multi‐drug‐resistant pulmonary tuberculosis? Respir Med 95: 444‐
447.

185
78. Cardona PJ (2006) RUTI: a new chance to shorten the treatment of latent tuberculosis
infection. Tuberculosis (Edinb) 86: 273‐289.
79. Nell AS, DʹLom E, Bouic P, Sabate M, Bosser R, et al. (2014) Safety, tolerability, and
immunogenicity of the novel antituberculous vaccine RUTI: randomized,
placebo‐controlled phase II clinical trial in patients with latent tuberculosis
infection. PLoS One 9: e89612.
80. Santosuosso M, McCormick S, Zhang X, Zganiacz A, Xing Z (2006) Intranasal
boosting with an adenovirus‐vectored vaccine markedly enhances protection by
parenteral Mycobacterium bovis BCG immunization against pulmonary
tuberculosis. Infect Immun 74: 4634‐4643.
81. Radosevic K, Wieland CW, Rodriguez A, Weverling GJ, Mintardjo R, et al. (2007)
Protective immune responses to a recombinant adenovirus type 35 tuberculosis
vaccine in two mouse strains: CD4 and CD8 T‐cell epitope mapping and role of
gamma interferon. Infect Immun 75: 4105‐4115.
82. Kagina BM, Tameris MD, Geldenhuys H, Hatherill M, Abel B, et al. (2014) The novel
tuberculosis vaccine, AERAS‐402, is safe in healthy infants previously vaccinated
with BCG, and induces dose‐dependent CD4 and CD8T cell responses. Vaccine
32: 5908‐5917.
83. Billeskov R, Elvang TT, Andersen PL, Dietrich J (2012) The HyVac4 subunit vaccine
efficiently boosts BCG‐primed anti‐mycobacterial protective immunity. PLoS
One 7: e39909.
84. Weinrich Olsen A, van Pinxteren LA, Meng Okkels L, Birk Rasmussen P, Andersen P
(2001) Protection of mice with a tuberculosis subunit vaccine based on a fusion
protein of antigen 85b and esat‐6. Infect Immun 69: 2773‐2778.
85. Reither K, Katsoulis L, Beattie T, Gardiner N, Lenz N, et al. (2014) Safety and
Immunogenicity of H1/IC31(R), an Adjuvanted TB Subunit Vaccine, in HIV‐
Infected Adults with CD4+ Lymphocyte Counts Greater than 350 cells/mm3: A
Phase II, Multi‐Centre, Double‐Blind, Randomized, Placebo‐Controlled Trial.
PLoS One 9: e114602.
86. Lin PL, Dietrich J, Tan E, Abalos RM, Burgos J, et al. (2012) The multistage vaccine
H56 boosts the effects of BCG to protect cynomolgus macaques against active
tuberculosis and reactivation of latent Mycobacterium tuberculosis infection. J
Clin Invest 122: 303‐314.
186
87. Bertholet S, Ireton GC, Ordway DJ, Windish HP, Pine SO, et al. (2010) A defined
tuberculosis vaccine candidate boosts BCG and protects against multidrug‐
resistant Mycobacterium tuberculosis. Sci Transl Med 2: 53ra74.
88. Spertini F, Audran R, Lurati F, Ofori‐Anyinam O, Zysset F, et al. (2013) The
candidate tuberculosis vaccine Mtb72F/AS02 in PPD positive adults: a
randomized controlled phase I/II study. Tuberculosis (Edinb) 93: 179‐188.
89. Leroux‐Roels I, Forgus S, De Boever F, Clement F, Demoitie MA, et al. (2013)
Improved CD4(+) T cell responses to Mycobacterium tuberculosis in PPD‐
negative adults by M72/AS01 as compared to the M72/AS02 and Mtb72F/AS02
tuberculosis candidate vaccine formulations: a randomized trial. Vaccine 31:
2196‐2206.
90. Tameris MD, Hatherill M, Landry BS, Scriba TJ, Snowden MA, et al. (2013) Safety
and efficacy of MVA85A, a new tuberculosis vaccine, in infants previously
vaccinated with BCG: a randomised, placebo‐controlled phase 2b trial. Lancet
381: 1021‐1028.
91. McShane H, Pathan AA, Sander CR, Goonetilleke NP, Fletcher HA, et al. (2005)
Boosting BCG with MVA85A: the first candidate subunit vaccine for tuberculosis
in clinical trials. Tuberculosis (Edinb) 85: 47‐52.
92. Yang XY, Chen QF, Li YP, Wu SM (2011) Mycobacterium vaccae as adjuvant therapy
to anti‐tuberculosis chemotherapy in never‐treated tuberculosis patients: a meta‐
analysis. PLoS One 6: e23826.
93. Roy A, Eisenhut M, Harris RJ, Rodrigues LC, Sridhar S, et al. (2014) Effect of BCG
vaccination against Mycobacterium tuberculosis infection in children: systematic
review and meta‐analysis. BMJ 349: g4643.
94. Peltola H, Kayhty H, Virtanen M, Makela PH (1984) Prevention of Hemophilus
influenzae type b bacteremic infections with the capsular polysaccharide vaccine.
N Engl J Med 310: 1561‐1566.
95. Smit P, Oberholzer D, Hayden‐Smith S, Koornhof HJ, Hilleman MR (1977) Protective
efficacy of pneumococcal polysaccharide vaccines. JAMA 238: 2613‐2616.
96. Kayhty H, Peltola H, Karanko V, Makela PH (1983) The protective level of serum
antibodies to the capsular polysaccharide of Haemophilus influenzae type b. J
Infect Dis 147: 1100.
187
97. Goldblatt D, Vaz AR, Miller E (1998) Antibody avidity as a surrogate marker of
successful priming by Haemophilus influenzae type b conjugate vaccines
following infant immunization. J Infect Dis 177: 1112‐1115.
98. Anttila M, Eskola J, Ahman H, Kayhty H (1998) Avidity of IgG for Streptococcus
pneumoniae type 6B and 23F polysaccharides in infants primed with
pneumococcal conjugates and boosted with polysaccharide or conjugate
vaccines. J Infect Dis 177: 1614‐1621.
99. Bjorkholm B, Bottiger M, Christenson B, Hagberg L (1986) Antitoxin antibody levels
and the outcome of illness during an outbreak of diphtheria among alcoholics.
Scand J Infect Dis 18: 235‐239.
100. Mills KH, Ryan M, Ryan E, Mahon BP (1998) A murine model in which protection
correlates with pertussis vaccine efficacy in children reveals complementary roles
for humoral and cell‐mediated immunity in protection against Bordetella
pertussis. Infect Immun 66: 594‐602.
101. Gergen PJ, McQuillan GM, Kiely M, Ezzati‐Rice TM, Sutter RW, et al. (1995) A
population‐based serologic survey of immunity to tetanus in the United States. N
Engl J Med 332: 761‐766.
102. Borelli V, Banfi E, Perrotta MG, Zabucchi G (1999) Myeloperoxidase exerts
microbicidal activity against Mycobacterium tuberculosis. Infect Immun 67: 4149‐
4152.
103. Bradley PP, Christensen RD, Rothstein G (1982) Cellular and extracellular
myeloperoxidase in pyogenic inflammation. Blood 60: 618‐622.
104. Ramos‐Kichik V, Mondragon‐Flores R, Mondragon‐Castelan M, Gonzalez‐Pozos S,
Muniz‐Hernandez S, et al. (2009) Neutrophil extracellular traps are induced by
Mycobacterium tuberculosis. Tuberculosis (Edinb) 89: 29‐37.
105. Dieli F, Troye‐Blomberg M, Ivanyi J, Fournie JJ, Krensky AM, et al. (2001)
Granulysin‐dependent killing of intracellular and extracellular Mycobacterium
tuberculosis by Vgamma9/Vdelta2 T lymphocytes. J Infect Dis 184: 1082‐1085.
106. Suga M, Tanaka F, Muranaka H, Nishikawa H, Ando M (1996) Effect of antibacterial
antibody on bactericidal activities of superoxide and lysosomal enzyme from
alveolar macrophages in rabbits. Respirology 1: 127‐132.
188
107. Achkar JM, Casadevall A (2013) Antibody‐mediated immunity against tuberculosis:
implications for vaccine development. Cell Host Microbe 13: 250‐262.
108. Malik ZA, Denning GM, Kusner DJ (2000) Inhibition of Ca(2+) signaling by
Mycobacterium tuberculosis is associated with reduced phagosome‐lysosome
fusion and increased survival within human macrophages. J Exp Med 191: 287‐
302.
109. Joiner KA, Fuhrman SA, Miettinen HM, Kasper LH, Mellman I (1990) Toxoplasma
gondii: fusion competence of parasitophorous vacuoles in Fc receptor‐transfected
fibroblasts. Science 249: 641‐646.
110. Mordue DG, Sibley LD (1997) Intracellular fate of vacuoles containing Toxoplasma
gondii is determined at the time of formation and depends on the mechanism of
entry. J Immunol 159: 4452‐4459.
111. Drecktrah D, Knodler LA, Ireland R, Steele‐Mortimer O (2006) The mechanism of
Salmonella entry determines the vacuolar environment and intracellular gene
expression. Traffic 7: 39‐51.
112. Hellwig SM, van Oirschot HF, Hazenbos WL, van Spriel AB, Mooi FR, et al. (2001)
Targeting to Fcgamma receptors, but not CR3 (CD11b/CD18), increases clearance
of Bordetella pertussis. J Infect Dis 183: 871‐879.
113. Rowland R, Pathan AA, Satti I, Poulton ID, Matsumiya MM, et al. (2013) Safety and
immunogenicity of an FP9‐vectored candidate tuberculosis vaccine (FP85A),
alone and with candidate vaccine MVA85A in BCG‐vaccinated healthy adults: a
phase I clinical trial. Hum Vaccin Immunother 9: 50‐62.
114. White AD, Sibley L, Dennis MJ, Gooch K, Betts G, et al. (2013) Evaluation of the
safety and immunogenicity of a candidate tuberculosis vaccine, MVA85A,
delivered by aerosol to the lungs of macaques. Clin Vaccine Immunol 20: 663‐
672.
115. Satti I, Meyer J, Harris SA, Manjaly Thomas ZR, Griffiths K, et al. (2014) Safety and
immunogenicity of a candidate tuberculosis vaccine MVA85A delivered by
aerosol in BCG‐vaccinated healthy adults: a phase 1, double‐blind, randomised
controlled trial. Lancet Infect Dis 14: 939‐946.
116. Langermans JA, Doherty TM, Vervenne RA, van der Laan T, Lyashchenko K, et al.
(2005) Protection of macaques against Mycobacterium tuberculosis infection by a
189
subunit vaccine based on a fusion protein of antigen 85B and ESAT‐6. Vaccine 23:
2740‐2750.
117. Perez de Val B, Villarreal‐Ramos B, Nofrarias M, Lopez‐Soria S, Romera N, et al.
(2012) Goats primed with Mycobacterium bovis BCG and boosted with a
recombinant adenovirus expressing Ag85A show enhanced protection against
tuberculosis. Clin Vaccine Immunol 19: 1339‐1347.
118. Skeiky YA, Dietrich J, Lasco TM, Stagliano K, Dheenadhayalan V, et al. (2010) Non‐
clinical efficacy and safety of HyVac4:IC31 vaccine administered in a BCG prime‐
boost regimen. Vaccine 28: 1084‐1093.
119. Grode L, Ganoza CA, Brohm C, Weiner J, 3rd, Eisele B, et al. (2013) Safety and
immunogenicity of the recombinant BCG vaccine VPM1002 in a phase 1 open‐
label randomized clinical trial. Vaccine 31: 1340‐1348.
120. Clark SO, Hall Y, Kelly DL, Hatch GJ, Williams A (2011) Survival of Mycobacterium
tuberculosis during experimental aerosolization and implications for aerosol
challenge models. J Appl Microbiol 111: 350‐359.
121. Tobias HJ, Schafer MP, Pitesky M, Fergenson DP, Horn J, et al. (2005) Bioaerosol
mass spectrometry for rapid detection of individual airborne Mycobacterium
tuberculosis H37Ra particles. Appl Environ Microbiol 71: 6086‐6095.
122. Zhen H, Han T, Fennell DE, Mainelis G (2014) A systematic comparison of four
bioaerosol generators: Affect on culturability and cell membrane integrity when
aerosolizing Escherichia coli bacteria. Journal of Aerosol Science 70: 67–79.
123. Saini D, Perley CC, Asrican RA, Seay SA, Chen CJ, et al. (In preparation) Delivery of
Mycobacterium tuberculosis aerosols using PARI nebulizer to mice for higher
pulmonary deposition
124. Gupta UD, Katoch VM (2005) Animal models of tuberculosis. Tuberculosis (Edinb)
85: 277‐293.
125. Rhoades ER, Frank AA, Orme IM (1997) Progression of chronic pulmonary
tuberculosis in mice aerogenically infected with virulent Mycobacterium
tuberculosis. Tuber Lung Dis 78: 57‐66.
126. Orme I, Gonzalez‐Juarrero M (2007) Animal models of M. tuberculosis Infection.
Curr Protoc Microbiol Chapter 10: Unit 10A 15.

190
127. Vilaplana C, Prats C, Marzo E, Barril C, Vegue M, et al. (2014) To achieve an earlier
IFN‐gamma response is not sufficient to control Mycobacterium tuberculosis
infection in mice. PLoS One 9: e100830.
128. North RJ (1995) Mycobacterium tuberculosis is strikingly more virulent for mice
when given via the respiratory than via the intravenous route. J Infect Dis 172:
1550‐1553.
129. Brain JD, Knudson DE, Sorokin SP, Davis MA (1976) Pulmonary distribution of
particles given by intratracheal instillation or by aerosol inhalation. Environ Res
11: 13‐33.
130. Saini D, Perley CC, Rountree W, Seay SA, Click EM, et al. (In preparation) Strain
differences influence Mycobacterium tuberculosis infection rate. In preparation.
131. Caruso AM, Serbina N, Klein E, Triebold K, Bloom BR, et al. (1999) Mice deficient in
CD4 T cells have only transiently diminished levels of IFN‐gamma, yet succumb
to tuberculosis. J Immunol 162: 5407‐5416.
132. Hunter RL, Olsen M, Jagannath C, Actor JK (2006) Trehalose 6,6ʹ‐dimycolate and
lipid in the pathogenesis of caseating granulomas of tuberculosis in mice. Am J
Pathol 168: 1249‐1261.
133. Flynn JL, Scanga CA, Tanaka KE, Chan J (1998) Effects of aminoguanidine on latent
murine tuberculosis. J Immunol 160: 1796‐1803.
134. McCune RM, Jr., Tompsett R (1956) Fate of Mycobacterium tuberculosis in mouse
tissues as determined by the microbial enumeration technique. I. The persistence
of drug‐susceptible tubercle bacilli in the tissues despite prolonged antimicrobial
therapy. J Exp Med 104: 737‐762.
135. OʹGarra A, Redford PS, McNab FW, Bloom CI, Wilkinson RJ, et al. (2013) The
immune response in tuberculosis. Annu Rev Immunol 31: 475‐527.
136. Lemos MP, McKinney J, Rhee KY (2011) Dispensability of surfactant proteins A and
D in immune control of Mycobacterium tuberculosis infection following aerosol
challenge of mice. Infect Immun 79: 1077‐1085.
137. Bini EI, Mata Espinosa D, Marquina Castillo B, Barrios Payan J, Colucci D, et al.
(2014) The influence of sex steroid hormones in the immunopathology of
experimental pulmonary tuberculosis. PLoS One 9: e93831.

191
138. Stead WW, Senner JW, Reddick WT, Lofgren JP (1990) Racial differences in
susceptibility to infection by Mycobacterium tuberculosis. N Engl J Med 322: 422‐
427.
139. Houk VN, Baker JH, Sorensen K, Kent DC (1968) The epidemiology of tuberculosis
infection in a closed environment. Arch Environ Health 16: 26‐35.
140. Dannenberg AM, Jr., Collins FM (2001) Progressive pulmonary tuberculosis is not
due to increasing numbers of viable bacilli in rabbits, mice and guinea pigs, but
is due to a continuous host response to mycobacterial products. Tuberculosis
(Edinb) 81: 229‐242.
141. Escombe AR, Oeser C, Gilman RH, Navincopa M, Ticona E, et al. (2007) The
detection of airborne transmission of tuberculosis from HIV‐infected patients,
using an in vivo air sampling model. Clin Infect Dis 44: 1349‐1357.
142. Lurie MB (1932) The Correlation between the Histological Changes and the Fate of
Living Tubercle Bacilli in the Organs of Tuberculous Rabbits. J Exp Med 55: 31‐
54.
143. Henderson HJ, Dannenberg AM, Jr., Lurie MB (1963) Phagocytosis of Tubercle
Bacilli by Rabbit Pulmonary Alveolar Macrophages and Its Relation to Native
Resistance to Tuberculosis. J Immunol 91: 553‐556.
144. Lurie MB, Dannenberg AM (1965) Macrophage Function in Infectious Disease with
Inbred Rabbits. Bacteriol Rev 29: 466‐476.
145. Kaushal D, Mehra S, Didier PJ, Lackner AA (2012) The non‐human primate model
of tuberculosis. J Med Primatol 41: 191‐201.
146. Capuano SV, 3rd, Croix DA, Pawar S, Zinovik A, Myers A, et al. (2003)
Experimental Mycobacterium tuberculosis infection of cynomolgus macaques
closely resembles the various manifestations of human M. tuberculosis infection.
Infect Immun 71: 5831‐5844.
147. Casadevall A, Scharff MD (1995) Return to the past: the case for antibody‐based
therapies in infectious diseases. Clin Infect Dis 21: 150‐161.
148. Glatman‐Freedman A, Casadevall A (1998) Serum therapy for tuberculosis
revisited: reappraisal of the role of antibody‐mediated immunity against
Mycobacterium tuberculosis. Clin Microbiol Rev 11: 514‐532.
192
149. Calmette A (1923) Passive immunity: attempts at antituberculous serotherapy.
Tubercle bacillus infection and tuberculosis in man and animals. Baltimore MD:
The Williams & Wilkins Co. pp. 602‐623.
150. Vaine M, Wang S, Liu Q, Arthos J, Montefiori D, et al. (2010) Profiles of human
serum antibody responses elicited by three leading HIV vaccines focusing on the
induction of Env‐specific antibodies. PLoS One 5: e13916.
151. Simmons M, Porter KR, Hayes CG, Vaughn DW, Putnak R (2006) Characterization
of antibody responses to combinations of a dengue virus type 2 DNA vaccine
and two dengue virus type 2 protein vaccines in rhesus macaques. J Virol 80:
9577‐9585.
152. Kester KE, McKinney DA, Tornieporth N, Ockenhouse CF, Heppner DG, et al.
(2001) Efficacy of recombinant circumsporozoite protein vaccine regimens
against experimental Plasmodium falciparum malaria. J Infect Dis 183: 640‐647.
153. Guirado E, Amat I, Gil O, Diaz J, Arcos V, et al. (2006) Passive serum therapy with
polyclonal antibodies against Mycobacterium tuberculosis protects against post‐
chemotherapy relapse of tuberculosis infection in SCID mice. Microbes Infect 8:
1252‐1259.
154. Roy E, Stavropoulos E, Brennan J, Coade S, Grigorieva E, et al. (2005) Therapeutic
efficacy of high‐dose intravenous immunoglobulin in Mycobacterium
tuberculosis infection in mice. Infect Immun 73: 6101‐6109.
155. Olivares N, Leon A, Lopez Y, Puig A, Cadiz A, et al. (2006) The effect of the
administration of human gamma globulins in a model of BCG infection in mice.
Tuberculosis (Edinb) 86: 268‐272.
156. Eichbaum Q, Rubin EJ (2002) Tuberculosis. Advances in laboratory diagnosis and
drug susceptibility testing. Am J Clin Pathol 118 Suppl: S3‐17.
157. Dye C, Watt CJ, Bleed DM, Hosseini SM, Raviglione MC (2005) Evolution of
tuberculosis control and prospects for reducing tuberculosis incidence,
prevalence, and deaths globally. JAMA 293: 2767‐2775.
158. Ravindran R, Krishnan VV, Dhawan R, Wunderlich ML, Lerche NW, et al. (2014)
Plasma antibody profiles in non‐human primate tuberculosis. J Med Primatol 43:
59‐71.

193
159. Ireton GC, Greenwald R, Liang H, Esfandiari J, Lyashchenko KP, et al. (2010)
Identification of Mycobacterium tuberculosis antigens of high serodiagnostic
value. Clin Vaccine Immunol 17: 1539‐1547.
160. Zhang SL, Zhao JW, Sun ZQ, Yang EZ, Yan JH, et al. (2009) Development and
evaluation of a novel multiple‐antigen ELISA for serodiagnosis of tuberculosis.
Tuberculosis (Edinb) 89: 278‐284.
161. Kunnath‐Velayudhan S, Salamon H, Wang HY, Davidow AL, Molina DM, et al.
(2010) Dynamic antibody responses to the Mycobacterium tuberculosis
proteome. Proc Natl Acad Sci U S A 107: 14703‐14708.
162. Kunnath‐Velayudhan S, Gennaro ML (2011) Immunodiagnosis of tuberculosis: a
dynamic view of biomarker discovery. Clin Microbiol Rev 24: 792‐805.
163. Pukazhvanthen P, Anbarasu D, Kabeer Basirudeen SA, Raja A, Singh M (2014)
Assessing humoral immune response of 4 recombinant antigens for
serodiagnosis of tuberculosis. Tuberculosis (Edinb) 94: 622‐633.
164. Yu X, Prados‐Rosales R, Jenny‐Avital ER, Sosa K, Casadevall A, et al. (2012)
Comparative evaluation of profiles of antibodies to mycobacterial capsular
polysaccharides in tuberculosis patients and controls stratified by HIV status.
Clin Vaccine Immunol 19: 198‐208.
165. Steingart KR, Dendukuri N, Henry M, Schiller I, Nahid P, et al. (2009) Performance
of purified antigens for serodiagnosis of pulmonary tuberculosis: a meta‐
analysis. Clin Vaccine Immunol 16: 260‐276.
166. Bothamley GH, Rudd R, Festenstein F, Ivanyi J (1992) Clinical value of the
measurement of Mycobacterium tuberculosis specific antibody in pulmonary
tuberculosis. Thorax 47: 270‐275.
167. Andersen AB, Yuan ZL, Haslov K, Vergmann B, Bennedsen J (1986) Interspecies
reactivity of five monoclonal antibodies to Mycobacterium tuberculosis as
examined by immunoblotting and enzyme‐linked immunosorbent assay. J Clin
Microbiol 23: 446‐451.
168. Perley CC, Frahm M, Click EM, Dobos KM, Ferrari G, et al. (2014) The Human
Antibody Response to the Surface of Mycobacterium tuberculosis. PLoS One 9:
e98938.

194
169. Zhang X, Su Z, Zhang X, Hu C, Yu J, et al. (2013) Generation of Mycobacterium
tuberculosis‐specific recombinant antigens and evaluation of the clinical value of
antibody detection for serological diagnosis of pulmonary tuberculosis. Int J Mol
Med 31: 751‐757.
170. Ben‐Selma W, Harizi H, Boukadida J (2011) Immunochromatographic IgG/IgM test
for rapid diagnosis of active tuberculosis. Clin Vaccine Immunol 18: 2090‐2094.
171. Singh KK, Sharma N, Vargas D, Liu Z, Belisle JT, et al. (2009) Peptides of a novel
Mycobacterium tuberculosis‐specific cell wall protein for immunodiagnosis of
tuberculosis. J Infect Dis 200: 571‐581.
172. Ziegenbalg A, Prados‐Rosales R, Jenny‐Avital ER, Kim RS, Casadevall A, et al.
(2013) Immunogenicity of mycobacterial vesicles in humans: identification of a
new tuberculosis antibody biomarker. Tuberculosis (Edinb) 93: 448‐455.
173. Kaushik A, Singh UB, Porwal C, Venugopal SJ, Mohan A, et al. (2012) Diagnostic
potential of 16 kDa (HspX, alpha‐crystalline) antigen for serodiagnosis of
tuberculosis. Indian J Med Res 135: 771‐777.
174. Feng X, Yang X, Xiu B, Qie S, Dai Z, et al. (2014) IgG, IgM and IgA antibodies
against the novel polyprotein in active tuberculosis. BMC Infect Dis 14: 336.
175. Feng X, Xiu B, Chen K, Yang X, Zhang H, et al. (2013) Enhanced serodiagnostic
utility of novel Mycobacterium tuberculosis polyproteins. J Infect 66: 366‐375.
176. Wang Y, Lu B, Liu J, Xiao T, Wan K, et al. (2014) A multicenter clinical evaluation of
Mycobacterium tuberculosis IgG/IgM antibody detection using the colloidal gold
method. Eur J Clin Microbiol Infect Dis 33: 1989‐1994.
177. Singh S, Singh J, Kumar S, Gopinath K, Balooni V, et al. (2012) Poor performance of
serological tests in the diagnosis of pulmonary tuberculosis: evidence from a
contact tracing field study. PLoS One 7: e40213.
178. Ben Selma W, Harizi H, Marzouk M, Ben Kahla I, Ben Lazreg F, et al. (2010) Rapid
detection of immunoglobulin G against Mycobacterium tuberculosis antigens by
two commercial ELISA kits. Int J Tuberc Lung Dis 14: 841‐846.
179. Steingart KR, Flores LL, Dendukuri N, Schiller I, Laal S, et al. (2011) Commercial
serological tests for the diagnosis of active pulmonary and extrapulmonary
tuberculosis: an updated systematic review and meta‐analysis. PLoS Med 8:
e1001062.
195
180. Sun Z, Nie L, Zhang X, Li Y, Li C (2011) Mycobacterial heparin‐binding
haemagglutinin adhesion‐induced interferon & antibody for detection of
tuberculosis. Indian J Med Res 133: 421‐425.
181. Senol G, Ecevit C, Ozturk A (2009) Humoral immune response against 38‐ and 16‐
kDa mycobacterial antigens in childhood tuberculosis. Pediatr Pulmonol 44: 839‐
844.
182. Steingart KR, Ramsay A, Dowdy DW, Pai M (2012) Serological tests for the
diagnosis of active tuberculosis: relevance for India. Indian J Med Res 135: 695‐
702.
183. Dowdy DW, Steingart KR, Pai M (2011) Serological testing versus other strategies
for diagnosis of active tuberculosis in India: a cost‐effectiveness analysis. PLoS
Med 8: e1001074.
184. Berche P, Reich KA, Bonnichon M, Beretti JL, Geoffroy C, et al. (1990) Detection of
anti‐listeriolysin O for serodiagnosis of human listeriosis. Lancet 335: 624‐627.
185. Edelson BT, Cossart P, Unanue ER (1999) Cutting edge: paradigm revisited:
antibody provides resistance to Listeria infection. J Immunol 163: 4087‐4090.
186. Nosanchuk JD, Steenbergen JN, Shi L, Deepe GS, Jr., Casadevall A (2003)
Antibodies to a cell surface histone‐like protein protect against Histoplasma
capsulatum. J Clin Invest 112: 1164‐1175.
187. Casadevall A, Pirofski LA (2006) A reappraisal of humoral immunity based on
mechanisms of antibody‐mediated protection against intracellular pathogens.
Adv Immunol 91: 1‐44.
188. Williams A, Reljic R, Naylor I, Clark SO, Falero‐Diaz G, et al. (2004) Passive
protection with immunoglobulin A antibodies against tuberculous early infection
of the lungs. Immunology 111: 328‐333.
189. Lopez Y, Yero D, Falero‐Diaz G, Olivares N, Sarmiento ME, et al. (2009) Induction
of a protective response with an IgA monoclonal antibody against
Mycobacterium tuberculosis 16kDa protein in a model of progressive pulmonary
infection. Int J Med Microbiol 299: 447‐452.
190. Buccheri S, Reljic R, Caccamo N, Meraviglia S, Ivanyi J, et al. (2009) Prevention of
the post‐chemotherapy relapse of tuberculous infection by combined
immunotherapy. Tuberculosis (Edinb) 89: 91‐94.
196
191. Balu S, Reljic R, Lewis MJ, Pleass RJ, McIntosh R, et al. (2011) A novel human IgA
monoclonal antibody protects against tuberculosis. J Immunol 186: 3113‐3119.
192. Chambers MA, Gavier‐Widen D, Hewinson RG (2004) Antibody bound to the
surface antigen MPB83 of Mycobacterium bovis enhances survival against high
dose and low dose challenge. FEMS Immunol Med Microbiol 41: 93‐100.
193. Teitelbaum R, Glatman‐Freedman A, Chen B, Robbins JB, Unanue E, et al. (1998) A
mAb recognizing a surface antigen of Mycobacterium tuberculosis enhances host
survival. Proc Natl Acad Sci U S A 95: 15688‐15693.
194. Hamasur B, Haile M, Pawlowski A, Schroder U, Kallenius G, et al. (2004) A
mycobacterial lipoarabinomannan specific monoclonal antibody and its F(abʹ)
fragment prolong survival of mice infected with Mycobacterium tuberculosis.
Clin Exp Immunol 138: 30‐38.
195. Pethe K, Alonso S, Biet F, Delogu G, Brennan MJ, et al. (2001) The heparin‐binding
haemagglutinin of M. tuberculosis is required for extrapulmonary dissemination.
Nature 412: 190‐194.
196. Michetti P, Mahan MJ, Slauch JM, Mekalanos JJ, Neutra MR (1992) Monoclonal
secretory immunoglobulin A protects mice against oral challenge with the
invasive pathogen Salmonella typhimurium. Infect Immun 60: 1786‐1792.
197. Yano M, Gohil S, Coleman JR, Manix C, Pirofski LA (2011) Antibodies to
Streptococcus pneumoniae capsular polysaccharide enhance pneumococcal
quorum sensing. MBio 2.
198. Li Y, Migueles SA, Welcher B, Svehla K, Phogat A, et al. (2007) Broad HIV‐1
neutralization mediated by CD4‐binding site antibodies. Nat Med 13: 1032‐1034.
199. Lok SM, Kostyuchenko V, Nybakken GE, Holdaway HA, Battisti AJ, et al. (2008)
Binding of a neutralizing antibody to dengue virus alters the arrangement of
surface glycoproteins. Nat Struct Mol Biol 15: 312‐317.
200. Bosio CM, Gardner D, Elkins KL (2000) Infection of B cell‐deficient mice with CDC
1551, a clinical isolate of Mycobacterium tuberculosis: delay in dissemination and
development of lung pathology. J Immunol 164: 6417‐6425.
201. Maglione PJ, Xu J, Chan J (2007) B cells moderate inflammatory progression and
enhance bacterial containment upon pulmonary challenge with Mycobacterium
tuberculosis. J Immunol 178: 7222‐7234.
197
202. Vordermeier HM, Venkataprasad N, Harris DP, Ivanyi J (1996) Increase of
tuberculous infection in the organs of B cell‐deficient mice. Clin Exp Immunol
106: 312‐316.
203. Johnson CM, Cooper AM, Frank AA, Bonorino CB, Wysoki LJ, et al. (1997)
Mycobacterium tuberculosis aerogenic rechallenge infections in B cell‐deficient
mice. Tuber Lung Dis 78: 257‐261.
204. Bao Y, Cao X (2014) The immune potential and immunopathology of cytokine‐
producing B cell subsets: A comprehensive review. J Autoimmun 55C: 10‐23.
205. Hoff ST, Salman AM, Ruhwald M, Ravn P, Brock I, et al. (2015) Human B cells
produce chemokine CXCL10 in the presence of Mycobacterium tuberculosis
specific T cells. Tuberculosis (Edinb) 95: 40‐47.
206. Lugo‐Villarino G, Hudrisier D, Benard A, Neyrolles O (2012) Emerging trends in
the formation and function of tuberculosis granulomas. Front Immunol 3: 405.
207. Tjarnlund A, Rodriguez A, Cardona PJ, Guirado E, Ivanyi J, et al. (2006) Polymeric
IgR knockout mice are more susceptible to mycobacterial infections in the
respiratory tract than wild‐type mice. Int Immunol 18: 807‐816.
208. Rodriguez A, Tjarnlund A, Ivanji J, Singh M, Garcia I, et al. (2005) Role of IgA in the
defense against respiratory infections IgA deficient mice exhibited increased
susceptibility to intranasal infection with Mycobacterium bovis BCG. Vaccine 23:
2565‐2572.
209. Muller A, Schott‐Ohly P, Dohle C, Gleichmann H (2002) Differential regulation of
Th1‐type and Th2‐type cytokine profiles in pancreatic islets of C57BL/6 and
BALB/c mice by multiple low doses of streptozotocin. Immunobiology 205: 35‐50.
210. Chen L, Watanabe T, Watanabe H, Sendo F (2001) Neutrophil depletion exacerbates
experimental Chagasʹ disease in BALB/c, but protects C57BL/6 mice through
modulating the Th1/Th2 dichotomy in different directions. Eur J Immunol 31:
265‐275.
211. Brennan MJ, Thole J (2012) Tuberculosis vaccines: a strategic blueprint for the next
decade. Tuberculosis (Edinb) 92 Suppl 1: S6‐13.
212. Barrigan LM, Tuladhar S, Brunton JC, Woolard MD, Chen CJ, et al. (2013) Infection
with Francisella tularensis LVS clpB leads to an altered yet protective immune
response. Infect Immun 81: 2028‐2042.

198
213. Blomgran R, Desvignes L, Briken V, Ernst JD (2012) Mycobacterium tuberculosis
inhibits neutrophil apoptosis, leading to delayed activation of naive CD4 T cells.
Cell Host Microbe 11: 81‐90.
214. Tailleux L, Neyrolles O, Honore‐Bouakline S, Perret E, Sanchez F, et al. (2003)
Constrained intracellular survival of Mycobacterium tuberculosis in human
dendritic cells. J Immunol 170: 1939‐1948.
215. Brown AE, Holzer TJ, Andersen BR (1987) Capacity of human neutrophils to kill
Mycobacterium tuberculosis. J Infect Dis 156: 985‐989.
216. Roch F, Bach MA (1990) Strain differences in mouse cellular responses to
Mycobacterium lepraemurium and BCG subcutaneous infections. I. Analysis of
cell surface phenotype in local granulomas. Clin Exp Immunol 80: 332‐338.
217. Arko‐Mensah J, Rahman MJ, Degano IR, Chuquimia OD, Fotio AL, et al. (2009)
Resistance to mycobacterial infection: a pattern of early immune responses leads
to a better control of pulmonary infection in C57BL/6 compared with BALB/c
mice. Vaccine 27: 7418‐7427.
218. Reiner SL, Locksley RM (1995) The regulation of immunity to Leishmania major.
Annu Rev Immunol 13: 151‐177.
219. Ulett GC, Ketheesan N, Hirst RG (2000) Cytokine gene expression in innately
susceptible BALB/c mice and relatively resistant C57BL/6 mice during infection
with virulent Burkholderia pseudomallei. Infect Immun 68: 2034‐2042.
220. Roque S, Nobrega C, Appelberg R, Correia‐Neves M (2007) IL‐10 underlies distinct
susceptibility of BALB/c and C57BL/6 mice to Mycobacterium avium infection
and influences efficacy of antibiotic therapy. J Immunol 178: 8028‐8035.
221. Wakeham J, Wang J, Xing Z (2000) Genetically determined disparate innate and
adaptive cell‐mediated immune responses to pulmonary Mycobacterium bovis
BCG infection in C57BL/6 and BALB/c mice. Infect Immun 68: 6946‐6953.
222. Zisman DA, Kunkel SL, Strieter RM, Tsai WC, Bucknell K, et al. (1997) MCP‐1
protects mice in lethal endotoxemia. J Clin Invest 99: 2832‐2836.
223. Gangur V, Simons FE, Hayglass KT (1998) Human IP‐10 selectively promotes
dominance of polyclonally activated and environmental antigen‐driven IFN‐
gamma over IL‐4 responses. FASEB J 12: 705‐713.

199
224. Gonzalo JA, Lloyd CM, Wen D, Albar JP, Wells TN, et al. (1998) The coordinated
action of CC chemokines in the lung orchestrates allergic inflammation and
airway hyperresponsiveness. J Exp Med 188: 157‐167.
225. Weinberg JB, Lutzke ML, Alfinito R, Rochford R (2004) Mouse strain differences in
the chemokine response to acute lung infection with a murine
gammaherpesvirus. Viral Immunol 17: 69‐77.
226. Bermudez LE, Goodman J (1996) Mycobacterium tuberculosis invades and
replicates within type II alveolar cells. Infect Immun 64: 1400‐1406.
227. Vergne I, Chua J, Singh SB, Deretic V (2004) Cell biology of mycobacterium
tuberculosis phagosome. Annu Rev Cell Dev Biol 20: 367‐394.
228. Mendez LB, Gookin G, Phalen RF (2010) Inhaled aerosol particle dosimetry in mice:
a review. Inhal Toxicol 22: 1032‐1037.
229. Reinhard C, Eder G, Fuchs H, Ziesenis A, Heyder J, et al. (2002) Inbred strain
variation in lung function. Mamm Genome 13: 429‐437.
230. Tankersley CG, Fitzgerald RS, Kleeberger SR (1994) Differential control of
ventilation among inbred strains of mice. Am J Physiol 267: R1371‐1377.
231. Mantovani A, Sica A, Sozzani S, Allavena P, Vecchi A, et al. (2004) The chemokine
system in diverse forms of macrophage activation and polarization. Trends
Immunol 25: 677‐686.
232. Sallusto F, Palermo B, Lenig D, Miettinen M, Matikainen S, et al. (1999) Distinct
patterns and kinetics of chemokine production regulate dendritic cell function.
Eur J Immunol 29: 1617‐1625.
233. Velazquez VM, Hon H, Ibegbu C, Knechtle SJ, Kirk AD, et al. (2012) Hepatic
enrichment and activation of myeloid dendritic cells during chronic hepatitis C
virus infection. Hepatology 56: 2071‐2081.
234. Misharin AV, Morales‐Nebreda L, Mutlu GM, Budinger GR, Perlman H (2013) Flow
cytometric analysis of macrophages and dendritic cell subsets in the mouse lung.
Am J Respir Cell Mol Biol 49: 503‐510.
235. Churchill GA, Airey DC, Allayee H, Angel JM, Attie AD, et al. (2004) The
Collaborative Cross, a community resource for the genetic analysis of complex
traits. Nat Genet 36: 1133‐1137.
200
236. Valdar W, Flint J, Mott R (2006) Simulating the collaborative cross: power of
quantitative trait loci detection and mapping resolution in large sets of
recombinant inbred strains of mice. Genetics 172: 1783‐1797.
237. Kauppi M, Saarinen L, Kayhty H (1993) Anti‐capsular polysaccharide antibodies
reduce nasopharyngeal colonization by Haemophilus influenzae type b in infant
rats. J Infect Dis 167: 365‐371.
238. Stack AM, Malley R, Thompson CM, Kobzik L, Siber GR, et al. (1998) Minimum
protective serum concentrations of pneumococcal anti‐capsular antibodies in
infant rats. J Infect Dis 177: 986‐990.
239. Frahm M, Goswami ND, Owzar K, Hecker E, Mosher A, et al. (2011) Discriminating
between latent and active tuberculosis with multiple biomarker responses.
Tuberculosis (Edinb) 91: 250‐256.
240. Ogra PL, Karzon DT, Righthand F, MacGillivray M (1968) Immunoglobulin
response in serum and secretions after immunization with live and inactivated
poliovaccine and natural infection. N Engl J Med 279: 893‐900.
241. Greenaway C, Lienhardt C, Adegbola R, Brusasca P, McAdam K, et al. (2005)
Humoral response to Mycobacterium tuberculosis antigens in patients with
tuberculosis in the Gambia. Int J Tuberc Lung Dis 9: 1112‐1119.
242. Bothamley GH, Beck JS, Schreuder GM, DʹAmaro J, de Vries RR, et al. (1989)
Association of tuberculosis and M. tuberculosis‐specific antibody levels with
HLA. J Infect Dis 159: 549‐555.
243. Davidow A, Kanaujia GV, Shi L, Kaviar J, Guo X, et al. (2005) Antibody profiles
characteristic of Mycobacterium tuberculosis infection state. Infect Immun 73:
6846‐6851.
244. Sanchez‐Rodriguez C, Estrada‐Chavez C, Garcia‐Vigil J, Laredo‐Sanchez F, Halabe‐
Cherem J, et al. (2002) An IgG antibody response to the antigen 85 complex is
associated with good outcome in Mexican Totonaca Indians with pulmonary
tuberculosis. Int J Tuberc Lung Dis 6: 706‐712.
245. Arias‐Bouda LM, Kuijper S, Van der Werf A, Nguyen LN, Jansen HM, et al. (2003)
Changes in avidity and level of immunoglobulin G antibodies to Mycobacterium
tuberculosis in sera of patients undergoing treatment for pulmonary
tuberculosis. Clin Diagn Lab Immunol 10: 702‐709.
201
246. Demkow U, Filewska M, Michalowska‐Mitczuk D, Kus J, Jagodzinski J, et al. (2007)
Heterogeneity of antibody response to myobacterial antigens in different clinical
manifestations of pulmonary tuberculosis. J Physiol Pharmacol 58 Suppl 5: 117‐
127.
247. Khan IH, Ravindran R, Krishnan VV, Awan IN, Rizvi SK, et al. (2011) Plasma
antibody profiles as diagnostic biomarkers for tuberculosis. Clin Vaccine
Immunol 18: 2148‐2153.
248. Ben Amor Y, Shashkina E, Johnson S, Bifani PJ, Kurepina N, et al. (2005)
Immunological characterization of novel secreted antigens of Mycobacterium
tuberculosis. Scand J Immunol 61: 139‐146.
249. Lyashchenko K, Colangeli R, Houde M, Al Jahdali H, Menzies D, et al. (1998)
Heterogeneous antibody responses in tuberculosis. Infect Immun 66: 3936‐3940.
250. Azzurri A, Kanaujia GV, Sow OY, Bah B, Diallo A, et al. (2006) Serological markers
of pulmonary tuberculosis and of response to anti‐tuberculosis treatment in a
patient population in Guinea. International Journal of Immunopathology and
Pharmacology 19: 199‐208.
251. Banerjee S, Nandyala A, Podili R, Katoch VM, Murthy KJ, et al. (2004)
Mycobacterium tuberculosis (Mtb) isocitrate dehydrogenases show strong B cell
response and distinguish vaccinated controls from TB patients. Proc Natl Acad
Sci U S A 101: 12652‐12657.
252. Bardana EJ, Jr., McClatchy JK, Farr RS, Minden P (1973) Universal occurrence of
antibodies to tubercle bacilli in sera from non‐tuberculous and tuberculous
individuals. Clin Exp Immunol 13: 65‐77.
253. Stiasny K, Aberle JH, Keller M, Grubeck‐Loebenstein B, Heinz FX (2012) Age affects
quantity but not quality of antibody responses after vaccination with an
inactivated flavivirus vaccine against tick‐borne encephalitis. PLoS One 7:
e34145.
254. Silva VM, Kanaujia G, Gennaro ML, Menzies D (2003) Factors associated with
humoral response to ESAT‐6, 38 kDa and 14 kDa in patients with a spectrum of
tuberculosis. Int J Tuberc Lung Dis 7: 478‐484.
255. Da Costa CT, Khanolkar‐Young S, Elliott AM, Wasunna KM, McAdam KP (1993)
Immunoglobulin G subclass responses to mycobacterial lipoarabinomannan in
202
HIV‐infected and non‐infected patients with tuberculosis. Clin Exp Immunol 91:
25‐29.
256. David HL, Papa F, Cruaud P, Berlie HC, Maroja MF, et al. (1992) Relationships
between titers of antibodies immunoreacting against glycolipid antigens from
Mycobacterium leprae and M. tuberculosis, the Mitsuda and Mantoux reactions,
and bacteriological loads: implications in the pathogenesis, epidemiology and
serodiagnosis of leprosy and tuberculosis. Int J Lepr Other Mycobact Dis 60: 208‐
224.
257. Demkow U, Ziolkowski J, Bialas‐Chromiec B, Filewska M, Zielonka T, et al. (2006)
Humoral immune response against mycobacterial antigens in children with
tuberculosis. J Physiol Pharmacol 57 Suppl 4: 63‐73.
258. Daniel TM, Debanne SM, van der Kuyp F (1985) Enzyme‐linked immunosorbent
assay using Mycobacterium tuberculosis antigen 5 and PPD for the serodiagnosis
of tuberculosis. Chest 88: 388‐392.
259. Barkoff AM, Grondahl‐Yli‐Hannuksela K, Vuononvirta J, Mertsola J, Kallonen T, et
al. (2012) Differences in avidity of IgG antibodies to pertussis toxin after acellular
pertussis booster vaccination and natural infection. Vaccine 30: 6897‐6902.
260. Romero‐Steiner S, Musher DM, Cetron MS, Pais LB, Groover JE, et al. (1999)
Reduction in functional antibody activity against Streptococcus pneumoniae in
vaccinated elderly individuals highly correlates with decreased IgG antibody
avidity. Clin Infect Dis 29: 281‐288.
261. Naylor K, Li G, Vallejo AN, Lee WW, Koetz K, et al. (2005) The influence of age on T
cell generation and TCR diversity. J Immunol 174: 7446‐7452.
262. Hobbs MV, Ernst DN, Torbett BE, Glasebrook AL, Rehse MA, et al. (1991) Cell
proliferation and cytokine production by CD4+ cells from old mice. J Cell
Biochem 46: 312‐320.
263. Connors M, Kovacs JA, Krevat S, Gea‐Banacloche JC, Sneller MC, et al. (1997) HIV
infection induces changes in CD4+ T‐cell phenotype and depletions within the
CD4+ T‐cell repertoire that are not immediately restored by antiviral or immune‐
based therapies. Nat Med 3: 533‐540.
264. Flynn JL, Goldstein MM, Triebold KJ, Koller B, Bloom BR (1992) Major
histocompatibility complex class I‐restricted T cells are required for resistance to
Mycobacterium tuberculosis infection. Proc Natl Acad Sci U S A 89: 12013‐12017.

203
265. Leveton C, Barnass S, Champion B, Lucas S, De Souza B, et al. (1989) T‐cell‐
mediated protection of mice against virulent Mycobacterium tuberculosis. Infect
Immun 57: 390‐395.
266. Shen Y, Zhou D, Chalifoux L, Shen L, Simon M, et al. (2002) Induction of an AIDS
virus‐related tuberculosis‐like disease in macaques: a model of simian
immunodeficiency virus‐ mycobacterium coinfection. Infect Immun 70: 869‐877.
267. Rush JS, Hodgkin PD (2001) B cells activated via CD40 and IL‐4 undergo a division
burst but require continued stimulation to maintain division, survival and
differentiation. Eur J Immunol 31: 1150‐1159.
268. Surcel HM, Troye‐Blomberg M, Paulie S, Andersson G, Moreno C, et al. (1994)
Th1/Th2 profiles in tuberculosis, based on the proliferation and cytokine
response of blood lymphocytes to mycobacterial antigens. Immunology 81: 171‐
176.
269. Hernandez‐Pando R, Orozcoe H, Sampieri A, Pavon L, Velasquillo C, et al. (1996)
Correlation between the kinetics of Th1, Th2 cells and pathology in a murine
model of experimental pulmonary tuberculosis. Immunology 89: 26‐33.
270. Pearce EJ, C MK, Sun J, J JT, McKee AS, et al. (2004) Th2 response polarization
during infection with the helminth parasite Schistosoma mansoni. Immunol Rev
201: 117‐126.
271. Kruh NA, Troudt J, Izzo A, Prenni J, Dobos KM (2010) Portrait of a pathogen: the
Mycobacterium tuberculosis proteome in vivo. PLoS One 5: e13938.
272. Berry JD, Gaudet RG (2011) Antibodies in infectious diseases: Polyclonals,
monoclonals and niche biotechnology. N Biotechnol.
273. Madhi SA, Nachman S, Violari A, Kim S, Cotton MF, et al. (2011) Primary isoniazid
prophylaxis against tuberculosis in HIV‐exposed children. N Engl J Med 365: 21‐
31.
274. Hanekom WA (2005) The immune response to BCG vaccination of newborns. Ann
N Y Acad Sci 1062: 69‐78.
275. Fletcher HA (2007) Correlates of immune protection from tuberculosis. Curr Mol
Med 7: 319‐325.
204
276. Plotkin SA (2008) Vaccines: correlates of vaccine‐induced immunity. Clin Infect Dis
47: 401‐409.
277. Severi MA, Ferragut G, Nieto A (1997) Antibody response of Echinococcus
granulosus infected mice: protoscolex specific response during infection is
associated with decreasing specific IgG1/IgG3 ratio as well as decreasing avidity.
Parasite Immunol 19: 545‐552.
278. Thomas HI, Aird HC (1999) Maintenance of high‐avidity rubella‐specific IgG
antibody and titres in recent HIV seroconvertors and in patients progressing to
the AIDS‐related complex and AIDS. J Med Virol 58: 273‐279.
279. Kroon FP, van Dissel JT, de Jong JC, van Furth R (1994) Antibody response to
influenza, tetanus and pneumococcal vaccines in HIV‐seropositive individuals in
relation to the number of CD4+ lymphocytes. AIDS 8: 469‐476.
280. Netski DM, Mosbruger T, Astemborski J, Mehta SH, Thomas DL, et al. (2007) CD4+
T cell‐dependent reduction in hepatitis C virus‐specific humoral immune
responses after HIV infection. J Infect Dis 195: 857‐863.
281. Costello AM, Kumar A, Narayan V, Akbar MS, Ahmed S, et al. (1992) Does
antibody to mycobacterial antigens, including lipoarabinomannan, limit
dissemination in childhood tuberculosis? Trans R Soc Trop Med Hyg 86: 686‐692.
282. Choucroun N (1949) Precipitin test for carbohydrate antibodies in human
tuberculosis. Am Rev Tuberc 59: 710‐712.
283. Yu JS, Liao HX, Gerdon AE, Huffman B, Scearce RM, et al. (2006) Detection of Ebola
virus envelope using monoclonal and polyclonal antibodies in ELISA, surface
plasmon resonance and a quartz crystal microbalance immunosensor. J Virol
Methods 137: 219‐228.
284. Yu JS, Ma BJ, Scearce RM, Liao HX, Haynes BF (2010) Anti‐Ebola MAb 17A3 reacts
with bovine and human alpha‐2‐macroglobulin proteins. J Virol Methods 168:
248‐250.
285. Nicely NI, Dennison SM, Spicer L, Scearce RM, Kelsoe G, et al. (2010) Crystal
structure of a non‐neutralizing antibody to the HIV‐1 gp41 membrane‐proximal
external region. Nat Struct Mol Biol 17: 1492‐1494.

205
286. Chatterjee D, Lowell K, Rivoire B, McNeil MR, Brennan PJ (1992)
Lipoarabinomannan of Mycobacterium tuberculosis. Capping with mannosyl
residues in some strains. J Biol Chem 267: 6234‐6239.
287. Khanolkar‐Young S, Kolk AH, Andersen AB, Bennedsen J, Brennan PJ, et al. (1992)
Results of the third immunology of leprosy/immunology of tuberculosis
antimycobacterial monoclonal antibody workshop. Infect Immun 60: 3925‐3927.
288. (1986) Results of a World Health Organization‐sponsored workshop to characterize
antigens recognized by mycobacterium‐specific monoclonal antibodies. Infect
Immun 51: 718‐720.
289. Jhingran A, Mar KB, Kumasaka DK, Knoblaugh SE, Ngo LY, et al. (2012) Tracing
conidial fate and measuring host cell antifungal activity using a reporter of
microbial viability in the lung. Cell Rep 2: 1762‐1773.
290. Garton NJ, Waddell SJ, Sherratt AL, Lee SM, Smith RJ, et al. (2008) Cytological and
transcript analyses reveal fat and lazy persister‐like bacilli in tuberculous
sputum. PLoS Med 5: e75.
291. Williams A, Davies A, Marsh PD, Chambers MA, Hewinson RG (2000) Comparison
of the protective efficacy of bacille calmette‐Guerin vaccination against aerosol
challenge with Mycobacterium tuberculosis and Mycobacterium bovis. Clin
Infect Dis 30 Suppl 3: S299‐301.
292. Takala AK, Eskola J, Leinonen M, Kayhty H, Nissinen A, et al. (1991) Reduction of
oropharyngeal carriage of Haemophilus influenzae type b (Hib) in children
immunized with an Hib conjugate vaccine. J Infect Dis 164: 982‐986.
293. Klein JS, Bjorkman PJ (2010) Few and far between: how HIV may be evading
antibody avidity. PLoS Pathog 6: e1000908.
294. Puschnik A, Lau L, Cromwell EA, Balmaseda A, Zompi S, et al. (2013) Correlation
between dengue‐specific neutralizing antibodies and serum avidity in primary
and secondary dengue virus 3 natural infections in humans. PLoS Negl Trop Dis
7: e2274.
295. Icenogle J, Shiwen H, Duke G, Gilbert S, Rueckert R, et al. (1983) Neutralization of
poliovirus by a monoclonal antibody: kinetics and stoichiometry. Virology 127:
412‐425.

206
296. Schlesinger Y, Granoff DM (1992) Avidity and bactericidal activity of antibody
elicited by different Haemophilus influenzae type b conjugate vaccines. The
Vaccine Study Group. JAMA 267: 1489‐1494.
297. Vermont CL, van Dijken HH, van Limpt CJ, de Groot R, van Alphen L, et al. (2002)
Antibody avidity and immunoglobulin G isotype distribution following
immunization with a monovalent meningococcal B outer membrane vesicle
vaccine. Infect Immun 70: 584‐590.
298. Brennan PJ (2003) Structure, function, and biogenesis of the cell wall of
Mycobacterium tuberculosis. Tuberculosis (Edinb) 83: 91‐97.
299. Weltzin R, Monath TP (1999) Intranasal antibody prophylaxis for protection against
viral disease. Clin Microbiol Rev 12: 383‐393.
300. Shi L, Jung YJ, Tyagi S, Gennaro ML, North RJ (2003) Expression of Th1‐mediated
immunity in mouse lungs induces a Mycobacterium tuberculosis transcription
pattern characteristic of nonreplicating persistence. Proc Natl Acad Sci U S A 100:
241‐246.
301. Sani M, Houben EN, Geurtsen J, Pierson J, de Punder K, et al. (2010) Direct
visualization by cryo‐EM of the mycobacterial capsular layer: a labile structure
containing ESX‐1‐secreted proteins. PLoS Pathog 6: e1000794.
302. Daffe M, Etienne G (1999) The capsule of Mycobacterium tuberculosis and its
implications for pathogenicity. Tuber Lung Dis 79: 153‐169.
303. Beatty WL, Ullrich HJ, Russell DG (2001) Mycobacterial surface moieties are
released from infected macrophages by a constitutive exocytic event. Eur J Cell
Biol 80: 31‐40.
304. Casadevall A (1998) Antibody‐mediated protection against intracellular pathogens.
Trends Microbiol 6: 102‐107.
305. Bonsignori M, Hwang KK, Chen X, Tsao CY, Morris L, et al. (2011) Analysis of a
clonal lineage of HIV‐1 envelope V2/V3 conformational epitope‐specific broadly
neutralizing antibodies and their inferred unmutated common ancestors. J Virol
85: 9998‐10009.
306. Mawuenyega KG, Forst CV, Dobos KM, Belisle JT, Chen J, et al. (2005)
Mycobacterium tuberculosis functional network analysis by global subcellular
protein profiling. Mol Biol Cell 16: 396‐404.
207
307. Rosenkrands I, Weldingh K, Jacobsen S, Hansen CV, Florio W, et al. (2000) Mapping
and identification of Mycobacterium tuberculosis proteins by two‐dimensional
gel electrophoresis, microsequencing and immunodetection. Electrophoresis 21:
935‐948.
308. Dmitriev BA, Ehlers S, Rietschel ET, Brennan PJ (2000) Molecular mechanics of the
mycobacterial cell wall: from horizontal layers to vertical scaffolds. Int J Med
Microbiol 290: 251‐258.
309. Holscher C, Atkinson RA, Arendse B, Brown N, Myburgh E, et al. (2001) A
protective and agonistic function of IL‐12p40 in mycobacterial infection. J
Immunol 167: 6957‐6966.
310. Martin CJ, Booty MG, Rosebrock TR, Nunes‐Alves C, Desjardins DM, et al. (2012)
Efferocytosis is an innate antibacterial mechanism. Cell Host Microbe 12: 289‐300.
311. Sweeney KA, Dao DN, Goldberg MF, Hsu T, Venkataswamy MM, et al. (2011) A
recombinant Mycobacterium smegmatis induces potent bactericidal immunity
against Mycobacterium tuberculosis. Nat Med 17: 1261‐1268.
312. Saini D, Hopkins GW, Chen CJ, Seay SA, Click EM, et al. (2011) Sampling port for
real‐time analysis of bioaerosol in whole body exposure system for animal
aerosol model development. J Pharmacol Toxicol Methods 63: 143‐149.
313. Guyton AC (1947) Measurement of the respiratory volumes of laboratory animals.
Am J Physiol 150: 70‐77.
314. Wolf AJ, Desvignes L, Linas B, Banaiee N, Tamura T, et al. (2008) Initiation of the
adaptive immune response to Mycobacterium tuberculosis depends on antigen
production in the local lymph node, not the lungs. J Exp Med 205: 105‐115.
315. Kipnis A, Irwin S, Izzo AA, Basaraba RJ, Orme IM (2005) Memory T lymphocytes
generated by Mycobacterium bovis BCG vaccination reside within a CD4 CD44lo
CD62 ligand(hi) population. Infect Immun 73: 7759‐7764.
316. Roche AM, Richard AL, Rahkola JT, Janoff EN, Weiser JN (2015) Antibody blocks
acquisition of bacterial colonization through agglutination. Mucosal Immunol 8:
176‐185.
317. Benson JM, Holmes AM, Barr EB, Nikula KJ, March TH (2000) Particle clearance
and histopathology in lungs of C3H/HeJ mice administered beryllium/copper
alloy by intratracheal instillation. Inhal Toxicol 12: 733‐749.

208
318. Asgharian B, Hofmann W, Miller F (2001) Mucociliary clearance of insoluble
particles from the. Journal of Aerosol Science 32: 817‐832.
319. Oberdorster G, Oldiges H, Zimmermann B (1980) Lung deposition and clearance of
cadmium in rats exposed by inhalation or by intratracheal instillation. Zentralbl
Bakteriol B 170: 35‐43.
320. Pashov A, Bellon B, Kaveri SV, Kazatchkine MD (1997) A shift in encephalitogenic T
cell cytokine pattern is associated with suppression of EAE by intravenous
immunoglobulins (IVIg). Mult Scler 3: 153‐156.
321. Basta M (1996) Modulation of complement‐mediated immune damage by
intravenous immune globulin. Clin Exp Immunol 104 Suppl 1: 21‐25.
322. Driscoll KE, Costa DL, Hatch G, Henderson R, Oberdorster G, et al. (2000)
Intratracheal instillation as an exposure technique for the evaluation of
respiratory tract toxicity: uses and limitations. Toxicol Sci 55: 24‐35.
323. Dorries AM, Valberg PA (1992) Heterogeneity of phagocytosis for inhaled versus
instilled material. Am Rev Respir Dis 146: 831‐837.
324. Pritchard JN, Holmes A, Evans JC, Evans N, Evans RJ, et al. (1985) The distribution
of dust in the rat lung following administration by inhalation and by single
intratracheal instillation. Environ Res 36: 268‐297.
325. Nurkka A, MacLennan J, Jantti V, Obaro S, Greenwood B, et al. (2000) Salivary
antibody response to vaccination with meningococcal A/C polysaccharide
vaccine in previously vaccinated and unvaccinated Gambian children. Vaccine
19: 547‐556.
326. Moyron‐Quiroz JE, Rangel‐Moreno J, Kusser K, Hartson L, Sprague F, et al. (2004)
Role of inducible bronchus associated lymphoid tissue (iBALT) in respiratory
immunity. Nat Med 10: 927‐934.
327. Rangel‐Moreno J, Hartson L, Navarro C, Gaxiola M, Selman M, et al. (2006)
Inducible bronchus‐associated lymphoid tissue (iBALT) in patients with
pulmonary complications of rheumatoid arthritis. J Clin Invest 116: 3183‐3194.
328. Jones PD, Ada GL (1986) Influenza virus‐specific antibody‐secreting cells in the
murine lung during primary influenza virus infection. J Virol 60: 614‐619.

209
Biography
Casey Crowell Perley was born in Buffalo, NY on April 30, 1986. She lived in the
small town of Boston, NY, twenty‐five miles south of Buffalo until the age of eighteen.
She matriculated from the Buffalo Seminary, an all girl’s high school, in 2000, graduating
cum laude. In 2008, Casey graduated from Yale University with a B.S in Molecular
Biophysics and Biochemistry. While at Yale, she spent two years as an undergraduate
researcher in the Lombroso Lab, receiving the Dean’s Office Fellowship to support her
research in the summer 2007. Her work, on the localization and function of Major Vault
Protein in the rodent brain, resulted in a second author paper; Major Vault Protein is
Expressed along the Nucleus‐Neurite Axis and Associates with mRNAs in Cortical
Neurons, published in Cerebral Cortex in 2008. Her fluorescent microscopy image of a
cortical neuron was selected for the journal cover.
After graduation Casey spent a year as a research technician in the Lindquist Lab
at the Whitehead Institute of MIT. Her work on understanding the role of heat‐shock
proteins in cancer, led to co‐authorship on two papers. Using the Heat‐Shock Response
to Discover Anticancer Compounds that Target Protein Homeostasis, was published in
ACS Chemical Biology in 2012, and Tight coordination of protein translation and heat
shock factor 1 activation supports the anabolic malignant state, was published in
Science in 2013.
210
In 2009 Casey moved to Durham, NC, and entered the PhD program in
Molecular Genetics and Microbiology at Duke University. She received both Duke
University’s Chancellor’s Fellowship, and the National Science Foundation Graduate
Research Fellowship to support her graduate work. She was also named a Duke Scholar
in Infectious Disease in 2012.
In 2010 Casey joined the Frothingham Lab where she has studied the role M.
tuberculosis surface‐binding antibodies play in altering early infection events. These
studies have led to three published papers. Ultra‐low dose of aerosolized Mycobacterium
tuberculosis creates partial infection in mice, was published in Tuberculosis in 2012.
Human antibody response to the surface of Mycobacterium tuberculosis, a first‐author
paper, was published in PLoS One in 2014, and Rhesus immune responses to SIV
Gag expressed by recombinant BCG vectors are independent from pre‐existing
mycobacterial immunity, a second‐author paper, is current in press at Vaccine. She
has three more first/co‐first author papers that are in preparation.
Outside of lab, Casey is an avid harpist and regularly performs with symphony
orchestras in the Raleigh‐Durham area.
Copyright © 2022 FDOKUMEN