The Regulatory Role of sRNAs in Mycobacterium tuberculosis
265
1 The Regulatory Role of sRNAs in Mycobacterium tuberculosis Joanna Houghton A thesis submitted in partial fulfilment of the requirements of University College London for the degree of Doctor of Philosophy Division of Mycobacterial Research MRC National Institute for Medical Research Mill Hill London 2015
-
Upload
khangminh22 -
Category
Documents
-
view
6 -
download
0
Transcript of The Regulatory Role of sRNAs in Mycobacterium tuberculosis

1
The Regulatory Role of sRNAs in Mycobacterium
tuberculosis
Joanna Houghton
A thesis submitted in partial fulfilment of the requirements of
University College London for the degree of Doctor of Philosophy
Division of Mycobacterial Research
MRC National Institute for Medical Research
Mill Hill
London
2015

2
Declaration
I Joanna Houghton confirm that the work presented in this thesis is my own.
Where information has been derived from other sources, I confirm that this has
been indicated in the thesis.

3
Acknowledgements
My first thank you goes to my supervisor Dr. Kristine Arnvig for giving me the
opportunity to work with her in the exciting field of M. tuberculosis sRNAs. I very
much enjoyed working on the project and feel extremely lucky to have benefited
from her guidance. The PhD journey however would not have begun without Dr.
Elaine Davis who encouraged me to apply and I will be eternally grateful for her
belief in me.
I would like to thank my second supervisor Dr. Douglas Young for valuable
advice and discussion in addition to critical reading of the thesis. Thanks to my
thesis committee, Dr. Mark Wilson and Dr. Ian Taylor for advice on the project
and in particular Dr. Ian Taylor’s help with sucrose gradient ultracentrifugation.
The members of the mycobacterial research division past and present deserve
a shout out for valuable input with thanks in particular to Debbie Hunt for
listening to my endless moaning and being super supportive. Also I thank Dr.
Graham Rose and Dr. Teresa Cortes for kindly doing the sequencing mapping
and providing TSS data.
A huge thank you to Dr. Olga Schubert who performed the shotgun mass
spectrometry analysis and MSstats, she went beyond the call of duty to get
results back to me quickly. Thanks to Dr. Angela Rodgers for the mouse
infection experiments and BµG@S for allowing the scanning of the microarrays
and advice on analysis.
Finally, I would like to thank my family for all their support and motivation.
Thanks to my partner Niall for his encouragement and unfaltering belief in me,
and who without a word could produce a glass of Malbec just when I needed it
most.

4
Last but not least I owe the biggest thanks to my mother in law Elizabeth
Densley for supporting my return to work after having my son and providing
childcare among a long list of other amazing things! I have no doubt that I would
not have made it otherwise. This thesis is dedicated to you.

5
Abstract
The presence of small regulatory RNAs (sRNA) have now been identified in
many bacteria. With the ability to regulate multiple targets at the post
transcriptional level, sRNAs allow bacteria to adapt to changing environments
through a regulatory step that is independent of any transcriptional signals of
the target mRNAs. Previous reports show a role for sRNAs in the stress
response [1]. Therefore Mycobacterium tuberculosis sRNAs could be critical for
the adaptive response to the harsh environment encountered during infection.
Multiple potential sRNAs have been identified in M. tuberculosis within the last
few years using cDNA cloning and high throughput RNA sequencing techniques
[2, 3]. Four verified sRNAs found using these two approaches, were selected for
detailed investigation. The aims of the study were to identify function and
interactions for the sRNAs ncRv10243, ncRv11690, ncRv12659 and
ncRv13661 of Mycobacterium tuberculosis and assess their role in virulence.
Transcriptomic and proteomic approaches were used to investigate sRNA
expression strains for regulatory targets.
Deletion and/or over expression were shown to result in changes of both mRNA
and protein abundance, indicating that all candidates were functional in M. tb.
Each sRNA had a varied pattern of expression, induced under a variety of
stress conditions including infection. Deletion of 3 of the sRNAs however did not
result in attenuation in the mouse model of infection.
The challenge of characterising sRNAs demonstrates that one single technique
is inadequate to identify function and a multi-pronged approach is more likely to
identify direct targets.
6
Table of Contents
The Regulatory Role of sRNAs in Mycobacterium tuberculosis .......................... 1
Declaration .......................................................................................................... 2
Acknowledgements ............................................................................................. 3
Abstract ............................................................................................................... 5
List of Abbreviations .......................................................................................... 16
Introduction .................................................................................................. 18
Tuberculosis ........................................................................................ 18
1.1.1 Mycobacteria and the Mycobacterium tuberculosis Complex ........... 19
The pathogenesis of tuberculosis ........................................................ 23
Tuberculosis therapy............................................................................ 28
Vaccination .......................................................................................... 29
Gene Regulation .................................................................................. 29
Identification of sRNAs......................................................................... 31
Hfq ....................................................................................................... 33
1.8 The Degradosome and RNases. ......................................................... 35
1.9 Regulation of Gene Expression by sRNAs in bacteria ......................... 36
1.9.1 Translational Repression ............................................................... 39
1.9.2 Translational Activation ................................................................. 42
1.10 6S RNA............................................................................................. 44
1.11 Dual Function sRNAs ....................................................................... 47
1.12 Riboswitches .................................................................................... 47
1.13 sRNAs in Mycobacterium tuberculosis pathogenesis ....................... 48
1.14 Defining sRNA Regulons .................................................................. 51
1.15 non coding RNA Nomenclature in M. tb ........................................... 52
1.16 Hypotheses & Aims .......................................................................... 54
…Materials and Methods ................................................................................ 57

7
2.1 Bacterial Strains and Growth Media .................................................... 57
2.2 Recombinant DNA techniques ............................................................. 61
2.2.1 Polymerase chain reaction (PCR) ................................................. 61
2.2.2 Agarose Gel Electrophoresis ......................................................... 62
2.2.3 DNA Gel Extraction and PCR purification ..................................... 62
2.2.4 Plasmid DNA Extraction ................................................................ 62
2.2.5 Restriction endonuclease digestion of DNA .................................. 63
2.2.6 Ligation of DNA ............................................................................. 63
2.2.7 Transformation of chemically competent E. coli ............................ 63
2.2.8 Sequencing of plasmid DNA ......................................................... 64
2.2.9 Site directed mutagenesis (SDM) .................................................. 64
2.3 DNase treatment and purification of RNA ............................................ 65
2.4 cDNA synthesis ................................................................................... 65
2.5 qRT-PCR ............................................................................................. 65
2.6 Northern Blotting .................................................................................. 66
2.7 Rapid Amplification of cDNA ends (RACE) .......................................... 67
2.7.1 5’ Rapid Amplification of cDNA ends (RACE) ............................... 67
2.7.2 3’ RACE ........................................................................................ 68
2.8 Western Blotting .................................................................................. 69
2.9 Mycobacterial Specific Techniques ...................................................... 70
2.9.1 Preparation of mycobacterial competent cells ............................... 70
2.9.2 RNA Isolation ................................................................................ 70
2.9.3 Genomic DNA Extraction .............................................................. 70
2.9.4 Instagene Preparations of M. tb .................................................... 71
2.9.5 M. tb Cell Free Extract ................................................................... 71
2.9.6 Sample Preparation for Proteomic Analysis .................................. 72
2.9.7 Sucrose Gradients ......................................................................... 72
2.9.10 Creating Deletion Strains in M. tb .................................................. 74
2.9.11 Macrophage Infection .................................................................... 74
2.9.12 Aerosol infection of mice with M. tb .............................................. 75
2.9.13 Microarray Analysis ....................................................................... 75
…Investigating a function for the starvation induced sRNA ncRv10243 ......... 77
3.1 Introduction .............................................................................................. 77

8
3.2 Hypotheses and Specific Aims ............................................................ 80
3.3. In vitro and In vivo expression levels of ncRv10243 ............................ 81
3.4 Creation of a ncRv10243 deletion strain .............................................. 83
3.4.1 Design and creation of the deletion plasmid .................................. 83
3.4.2 Screening of single and double crossover candidates .................. 84
3.5 Complementation of the ncRv10243 mutant ........................................ 88
3.6 Full Genome sequencing of the ncRv10243 mutant ............................ 88
3.7 Assessment of ncRv10243 expression in deletion and complement
strains ............................................................................................................ 89
3.8 In vitro phenotype analysis of growth compared to wildtype ................ 92
3.9 Growth is inhibited in the Wayne Model ............................................... 94
3.10 Transcriptional Microarray analysis in exponential phase and
starvation. ...................................................................................................... 97
3.10.1 Confirmation of Microarrays by qRT-PCR ................................... 100
3.11 Analysis of the ΔncRv10243 proteome ........................................... 104
3.12.1 Deletion of ncRv10243 had no effect on the ability of M. tb to survive within either naïve or activated macrophages. ............................ 105
3.12.2 Deletion of ncRv10243 does not affect the ability of M. tb to survive in a mouse model of infection. ................................................................. 107
3.12.3 ncRv10243 is expressed in M. tb isolated from the granulomas of infected macaques. .................................................................................. 110
3.13 Discussion ...................................................................................... 114
4 ...The constitutively expressed sRNA ncRv11690, may play a role in regulation
of EsxA secretion ............................................................................................ 119
4.1 Introduction ........................................................................................ 119
4.2 Hypotheses and specific aims ........................................................... 121
4.3 In vitro and In vivo expression levels of ncRv11690 .......................... 121
4.4 Creation of a ncRv11690 deletion strain ............................................ 124
4.4.2 Design and creation of the deletion plasmid ................................ 124
4.4.3 Screening of single and double crossover candidates ................ 125
4.5 Complementation of the ncRv11690 mutant ...................................... 127
9
4.6 Full Genome sequencing of the ncRv11690 mutant .......................... 127
4.7 Assessment of ncRv11690 expression in deletion and complement
strains .......................................................................................................... 128
4.8 In vitro phenotype analysis of growth compared to wildtype .............. 130
4.9 Transcriptional Microarray analysis in exponential phase .................. 132
4.9.1 Confirmation of Microarrays by qRT-PCR ................................... 135
4.10 ΔncRv11690 is not susceptible to changes in magnesium
concentration. .............................................................................................. 139
4.11 Over expression of ncRv11690. ..................................................... 141
4.12 Stability of ncRv11690 .................................................................... 144
4.13 Analysis of the ncRv11690 expression proteomes ......................... 146
4.14 in vivo Analysis of ΔncRv11690 compared to wildtype M. tb .......... 151
4.14.1 Deletion of ncRv11690 had no effect on the ability of M. tb to survive within either naïve or activated macrophages. ............................ 151
4.14.2 Deletion of ncRv11690 had no effect on the ability of M. tb to survive in a mouse model of infection ...................................................... 153
4.15 Discussion ...................................................................................... 155
5….Deletion of ncRv13661, the most abundant sRNA in M. tb has pleiotropic
effects on transcription .................................................................................... 159
5.1 Introduction ........................................................................................ 159
5.2 Hypothesis and specific aims ............................................................. 163
5.3 Expression of ncRv13661 .................................................................. 163
5.4 Creation of an ncRv13661 deletion strain .......................................... 165
5.4.1 Design and creation of the deletion plasmid ................................ 165
5.4.2 Screening of single and double crossover candidates ................ 165
5.4.3 Whole genome sequencing of DCO 3.21 .................................... 168
5.4.4 Whole genome sequencing of DCO 1.1-1.4 ................................ 169
5.5 Transcriptional profiling of DCO 1.4 ................................................... 171
5.6 Transcriptional profiling during growth on propionate ........................ 175
5.7 Transcriptional profiling during stationary phase ................................ 179
5.8 Proteomic analysis of deletion strain during growth on 7H9 .............. 182

10
5.9 Proteomic analysis of over expression during growth on 7H9 ........... 184
5.12 Effects of ncRv13661 deletion on in vivo survival ........................... 193
5.13 Discussion ...................................................................................... 193
6….Is ncRv12659 responsible for the starvation-induced signal attributed to
Rv2660c? ........................................................................................................ 199
6.1 Introduction ........................................................................................ 199
6.2 Hypotheses and specific aims ........................................................... 201
6.3 Comparison of RNA sequencing profiles ........................................... 203
6.4 Mapping of transcript termini by 5’ and 3’ RACE ............................... 203
6.5 Expression of ncRv12659 in clinical isolates ..................................... 208
6.6 Proteomic Analysis during starvation ................................................. 212
6.7 Expression of ncRv12659 during mouse infection ............................. 214
6.8 Over expression of ncRv12659 .......................................................... 217
6.9 Discussion ......................................................................................... 226
7…Concluding Remarks ................................................................................. 229
Appendix I – Media and buffer composition .................................................... 251
Appendix II – Oligonucleotides used in this study ........................................... 253
Appendix III - SNP analysis from high throughput sequencing ....................... 259
Appendix IV – Microarray results for ΔncRv11690 .......................................... 260
Appendix V – Microarray results for over expression of ncRv13661 during
growth on propionate ...................................................................................... 262
Appendix VI - In vivo testing of ΔncRv13661 (DCO 3.21) ............................... 264
11
List of Figures
Figure 1.1 The structure of the M. tuberculosis cell envelope .................................... 22
Figure 1.2 The pathology of the granuloma ................................................................ 26
Figure 1.3 The Differing Physiological States of M. tuberculosis .............................. 27
Figure 1.4 Representation of genomic locations of sRNAs. ....................................... 38
Figure 1.5 Translational inhibition mediated by sRNAs. ........................................... 41
Figure 1.6 Translational activation mediated by sRNAs. ........................................... 43
Figure 1.7 Sequestering of RNAP by 6S RNA ........................................................... 46
Figure 1.8 Experimental Workflow for elucidating the roles of the sRNAs under
investigation. ............................................................................................................... 56
Figure 3.1 Genomic location of sRNA ncRv10243 in the M. tb genome as viewed in
Tuberculist................................................................................................................... 79
Figure 3.2 Expression levels of ncRv10243 in M. tb .................................................. 82
Figure 3.3A Schematic of PCR reactions for screening M. tb SCO and DCO strains 86
Figure 3.3B PCR screening for the construction of the ncRv10243 deletion strain. .. 87
Figure 3.4 qRT-PCR confirmations of ncRv10243 deletion and complementation ... 91
Figure 3.5 Growth of ΔncRv10243 in standard 7H9 media ....................................... 93
Figure 3.6 Growth in the Wayne Model impairs recovery of ΔncRv10243. .............. 96
Figure 3.7 qRT-PCR to confirm the gene expression changes observed in the
exponential microarray.............................................................................................. 102
Figure 3.8 qRT-PCR confirmations of gene expression changes observed in the
starvation microarray ................................................................................................ 103
Figure 3.9 Survival of the ΔncRv10243 in a macrophage model of infection ......... 106
Figure 3.10 Survival of ΔncRv10243 from aerosol infected mice. .......................... 109
Figure 3.11 Expression of ncRv10243 in the granulomatous lesions of Macaques. 113
Figure 4.1 Location and transcript size of ncRv11690 ............................................. 120
Figure 4.2 Expression levels of ncRv11690 in M. tb ................................................ 123
Figure 4.3 PCR screening for the construction of the ncRv11690 deletion strain. ... 126

12
Figure 4.4 qRT-PCR confirmations of ncRv11690 deletion and complementation . 129
Figure 4.5 Growth of ΔncRv11690 in standard 7H9 media ..................................... 131
Figure 4.6 qRT-PCR confirmation of the gene expression changes observed in the
exponential microarray.............................................................................................. 136
Figure 4.7 qRT-PCR of the regulator Rv0891c ......................................................... 138
Figure 4.8 Growth of ncRv11690 under different magnesium concentrations ......... 140
Figure 4.9 Over expression of ncRv11690 in M. tb .................................................. 143
Figure 4.10 Stability of sRNA ncRv11690 +/- Rifampicin. ..................................... 145
Figure 4.11 Survival of the ΔncRv11690 in a macrophage model of infection ....... 152
Figure 4.12 Survival of ΔncRv11690 from aerosol infected mice. .......................... 154
Figure 5.1 Genomic location of ncRv13661 in the M. tb genome as viewed in
Tuberculist (http://tuberculist.epfl.ch/) ..................................................................... 160
Figure 5.2 Structural comparisons of the highly expressed RNAs ........................... 162
Figure 5.3 Expression levels of ncRv13661 in M. tb ................................................ 164
Figure 5.4 PCR screening for the construction of the ncRv13661 deletion strain. ... 167
Figure 5.5 Venn diagram representing the common transcriptional changes between
over expression and deletion of ncRv13661 during growth on 7H9. ....................... 174
Figure 5.6 Venn diagram representing the overlapping transcript changes between
growth on 7H9 and growth on propionate for the ncRv13661 over expression……178
Figure 5.7 Sedimentation of ncRv13661 and RNAP using sucrose gradient
ultracentrifugation shows ncRv13661 does not specifically migrate with intact RNAP
................................................................................................................................... 189
Figure 5.8 Sedimentation of ncRv13661 and M. tb proteins using sucrose gradient
ultracentrifugation ..................................................................................................... 190
Figure 5.9 Recovery of ΔncRv13661 after six weeks in stationary phase. ............... 192
Figure 6.1 Genomic position of sRNA ncRv12659 in the M. tb genome ................. 200
Figure 6.2 RNA seq of the Rv2660c locus as viewed in the genome browser Artemis.
................................................................................................................................... 202

13
Figure 6.2 Mapping of ncRv12659 in M. tb H37Rv ................................................. 205
Figure 6.3 Annotation of the ncRv12659 locus ........................................................ 207
Figure 6.4 RNA profiling of the Rv2660c locus in M. tb clinical isolates ............... 211
Figure 6.5 SRM analysis of tryptic peptides from Rv2660c. (Taken from [155]) ... 213
Figure 6.6 Expression of ncRv12659 during infection ............................................. 216
Figure 6.7 PhiRv2 represented as a circular virion (taken from [155]). ................... 218
Figure 6.8 Analysis of ncRv12659 over expression ................................................. 220
Figure 6.9 Expression analyses by qRT-PCR (taken from [ ..................................... 225
Figure S1 Survival of the ΔncRv13661 in a macrophage model of infection .......... 264
Figure S2 Survival of ΔncRv13661 from aerosol infected mice. ............................. 265

14
List of Tables
Table 1.1 Key Characteristics of the sRNAs chosen for further investigation ........... 55
Table 2.1 Bacterial Strains used in this study ........................................................ 58
Table 2.2 Plasmids used and constructed in this study ......................................... 59
Table 3.2A Genes down regulated > 2-fold in ΔncRv10243 in exponential phase .... 99
Table 3.2B Genes found to be up regulated > 2-fold in ΔncRv10243 after 24hrs
starvation ..................................................................................................................... 99
Table 3.2 Summary of Macaque granuloma status and RNA yield .......................... 112
Table 4.1 Genes up regulated > 2.5-fold in ΔncRv11690 in exponential phase ....... 133
Table 4.2 Genes down regulated > 2.5-fold in ΔncRv11690 in exponential phase .. 134
Table 4.3 Proteins differentially expressed between either wild type and deletion
strains or H37Rv and Complement. .......................................................................... 149
Table 4.4 Proteins differentially expressed between the over expression and vector
control ....................................................................................................................... 150
Table 5.1 SNP analysis of ΔncRv13661 DCOs 1.1, 1.3 and 1.4. ............................. 170
Table 5.2 Genes up regulated > 2-fold upon deletion of ncRv13661 in exponential
phase .......................................................................................................................... 172
Table 5.3 Genes down regulated > 2-fold upon deletion of ncRv13661 in exponential
phase .......................................................................................................................... 173
Table 5.4 Genes up regulated in the over expression strain > 2 fold during growth on
propionate .................................................................................................................. 178
Table 5.5 Genes down regulated > 2-fold upon deletion of ncRv13661 in stationary
phase .......................................................................................................................... 180
Table 5.6 Genes up regulated > 2-fold upon deletion of ncRv13661 in stationary
phase .......................................................................................................................... 181
Table 5.7 Proteins differentially expressed in ΔncRv13661 ..................................... 183
Table 5.8 Proteins up regulated in the ncRv13661 over expression ......................... 185
Table 5.9 Proteins down regulated in the ncRv13661 over expression .................... 186
Table 6.1 Strains used in this study ........................................................................... 209

15
Table 6.2 Gene expression changes by microarray upon over expression of
ncRv12659 ................................................................................................................ 223

16
List of Abbreviations
BMDMs bone marrow derived macrophages
cDNA Complementary Deoxyribonucleic acid
CFU colony forming unit
DCO Double Crossover
dH2O distilled water
DNA Deoxyribonucleic acid
DNase Deoxyribonuclease
dNTPs 2’Deoxynucleoside 5’Triphosphate
HIV human immunodeficiency virus
IFNγ Interferon gamma
KanR Kanamycin Resistance
kb Kilo Base
KDa Kilo Dalton
MCC Methyl Citrate Cycle
MMP Methyl Malonyl Pathway
mRNA Messenger Ribonucleic Acid

17
OD Optical Density
PBS Phosphate Buffered Saline
PCR Polymerase Chain Reaction
qRT-PCR Quantitative Reverse Transcription PCR
RACE Rapid Amplification of cDNA ends
RNA Ribonucleic Acid
rpm Revolutions per minute
rRNA Ribosomal Ribonucleic Acid
SCO Single Crossover
SDM Site Directed Mutagenesis
sRNA Small Ribonucleic Acid
TBS Tris-buffered Saline
TCA Tricarboxylic Acid
X-Gal 5-Bromo-4-chloro-3-β-D-galactoside

18
Introduction
Tuberculosis
Tuberculosis (TB) is one of the world’s biggest and oldest killers among the
infectious diseases. It is an ancient disease, and evidence of tubercular decay
has been found in the skulls and spines of Egyptian mummies showing direct
evidence of TB colonising humans more than 5,000 years ago [4]. Recently,
analysis of whole genome sequences from the Mycobacterium tuberculosis
Complex (MBTC) alongside human mitochondrial genomes has led to the
estimation that TB is actually more than 70,000 years old [5].
Tuberculosis can be caused by various species of mycobacteria but mainly by
Mycobacterium tuberculosis (M. tb). The discovery of M. tb as the cause of TB
infection was famously demonstrated by Robert Koch to the Berlin Physiological
Society in 1882, which contributed greatly to him being awarded the Nobel Prize
in 1905, [6, 7]. In 1993 the WHO declared TB to be a ‘global emergency’ due to
the rapid spread of disease accelerated by HIV, drug resistance and the
movement of people around the world.
The latest estimations by the World Health Organisation (WHO) show that TB is
responsible for killing approximately 1.3 million people a year, and it is
estimated that one third of the world’s population is latently infected with TB [8].
The greatest incidence of disease by far is in Southern Africa where it has
escalated due to its deadly synergy with HIV. TB is a leading cause of death
among those infected with HIV; in 2012 it was estimated that 20% of deaths
among people with HIV/AIDS are due to TB [8].
19
Although the burden of disease falls generally on the developing world, it is
increasingly becoming a problem in lower incidence countries in the west mainly
due to immigration, poverty and homelessness [9]. In the UK, almost three
quarters of TB cases occurred amongst people born outside of the country, but
only 15% of these were recent migrants. In 2013 70% of all TB cases in the UK,
were found to be residents in deprived areas, with almost half of these people
being unemployed. These are similar statistics to the 2003 study by Antoine et
al indicating no change in trend [10].
1.1.1 Mycobacteria and the Mycobacterium tuberculosis
Complex
M. tb is an actinomycete belonging to the family Mycobacteriaceae. This
genus includes the M. tuberculosis Complex (MTBC), Mycobacterium
leprae, and non-tuberculous mycobacteria [11]. The MTBC is made up of
mycobacteria causing TB in human and animal hosts; comprising the
well-known M. tb, Mycobacterium bovis and the vaccine strain M. bovis
Bacille Calmette-Guérin (BCG) as well as Mycobacterium africanum,
Mycobacterium canettii and Mycobacterium microti [12].The members of
the complex differ in host specificity, pathogenicity and a small number of
phenotypic and/or genotypic characteristics
Pathogenic mycobacteria are capable of causing a variety of diseases. In
addition to the well-known human pathogen M. tb, is M. leprae, which
causes leprosy and M. ulcerans which results in Buruli ulcers. Other
mycobacteria can act as opportunistic pathogens of humans as is the
case for M. avium and M. marinum are also common pathogens of birds,

20
and fish, causing granulomatous lesions of the organs or skin
respectively.
Mycobacteria can be divided into two categories of slow and fast
growers. The slow growers such as M. tb take a week or more to grow
on solid agar while the fast growers such as M. smegmatis take 2-3 days
[13]. This equates to a doubling time of approximately 17 hours for M. tb
and 4 hours for M. smegmatis. Environmental mycobacteria are
distinguished from the members of the MTBC and M. leprae by the fact
that they are not obligate pathogens. In general it appears that slow
growers such as M. tb and M. marinum are pathogens whereas fast
growers such as M. smegmatis are environmental species [14].
Chemostat experiments have shown that the control of growth rate in
mycobacteria is not due to acceleration or deceleration of cellular
processes but through the control of particular gene sets [15]. These
genes include transcriptional regulators e.g. hspR and some genes
previously implicated in virulence and persistence (ppsA and ppsB) [15].
It is advantageous for the pathogenic species to be slow growers in order
to establish an infection and transmit to another host. If the disease were
to progress too quickly the host may die before transmission.
It is of note that rapidly growing mycobacteria still grow significantly more
slowly than most bacteria. This could be in part due to differences in
rRNA. The number of ribosomal (rrn) operons varies between species
and a correlation has been observed between the bacterial maximum
growth rate and the number of rrn operons in the genome [16]. The slow

21
growing M. tb contains but one rrn operon, whereas the faster growing
M. smegmatis contains two, rrnA and rrnB [17]. However, if you remove
all but one ribosomal operon from the fast growing species Escherichia
coli (E. coli) a fast doubling time is still maintained [18]. This suggests
that it is not the number of rrn operons that dictates the maximum
doubling time, but in fact the contrary, with the growth rate dictating the
number of rrn required.
M. tb is a gram positive bacterium that is distinct from other gram positive
bacteria as it possesses an acid fast cell wall that contributes to its
hydrophobic nature. This complex cell envelope is rich in lipids
containing mycolic acids (Figure 1.1) and accounts for 60% of the dry
weight of the bacteria [19]. It is this lipid rich layer that is believed to
confer resistance to killing through acidic and alkaline compounds,
antibiotics, and free radicals [20] and it has been shown that these lipids
are critical for virulence [21].

22
Figure 1.1 The structure of the M. tuberculosis cell envelope
CF = cord factor, GMM = glucose monomycolate, PAT =polyacyltrehalose,
LOS = lipooligosaccharides, PDIM = phthiocerol dimycoserosates,
PheGP = phenolic glycolipids, SGL = sulphoglycolipids, GroMM = glycerol
monomycolate.

23
The pathogenesis of tuberculosis
M. tb predominantly presents as a pulmonary infection in humans, with the
ability to lie dormant in the body for decades. It is transmitted through the
inhalation of aerosolised droplets and once the bacteria are inside the lung, they
are taken up by alveolar macrophages [22, 23]. Upon phagocytosis of the
bacteria an induction of a localised proinflammatory response leads to the
recruitment of mononuclear cells from neighbouring blood vessels. This is the
initial step that leads to the granuloma formation that is a common feature of
tuberculosis. The granuloma consists of centrally infected macrophages
surrounded by foamy giant cells and macrophages with a mantle of
lymphocytes [24]. The bacteria reside in the macrophages through an ability to
block phagosome maturation and to resist damage by free radicals, thereby
allowing them to replicate freely. This strategy is part of the success story of
tuberculosis as it is these cells that are supposed to sustain an effective initial
barrier to bacterial infection (Figure 1.2).
In an immuno-competent individual this aggregation of immune cells prevents
the spread of infection. The granuloma serves both to prevent dissemination of
the bacteria and to provide an environment for cross talk between immune cells.
During this stage there are usually no symptoms and the host is not infectious.
If immunity is weakened such as in the case of HIV infection, the granulomatous
lesion fails to contain the mycobacteria. These lesions can contain large
numbers of bacteria (>109 bacilli), and their rupture can result in the
dissemination of M. tb to other organs through the circulatory system. Active

24
disease then develops and the patient becomes infectious, spreading the
disease by aerosol [25].
It had long been accepted that M. tb resides exclusively within membrane-
enclosed vacuoles within the macrophage. Some experiments in the 1980’s and
1990’s discovered M. tb free of the phagosomal membrane after a few days of
infection. There is now a growing debate on the localisation of the bacterium
within the phagosome, reviewed in [26]. Translocation of the bacilli into the
cytosol has been observed by several groups [27-29]. In the study by Van der
Wel et al. involving infections of human monocyte-derived dendritic cells and
macrophages, it was observed that M. tb containing phagosomes fused with
lysosomes and then gradually the bacteria translocate to the cytosol after 2
days infection [29]. The results were interpreted as evidence that the cytosol
was more permissive to bacterial growth than the endosome. These findings
are quite controversial as this phenomenon has not been observed by all
groups.
The infectious life cycle of TB is complex, it must adopt various growth states in
order to transmit, infect and also remain latent for years undetected in many
hosts. For this reason, M. tb has been found to exist in many states on a
spectrum ranging from an active, to persistent or dormant (latent) TB infection
[30], Figure 1.3. The term dormant refers to bacteria, which are in a non-
replicating drug-resistant state. These bacteria are viable but unable to form
colonies directly or immediately on plating but which can be resuscitated to form
colonies under appropriate conditions [31, 32]. Persistence refers to genetically
drug-susceptible bacteria that can survive indefinitely within the host despite

25
continued exposure to the drug in question [33]. Separate granulomatous
lesions within the lung of one individual can have different fates, with some
lesions being active while others are sterile [34], and in fact the population
within the granuloma itself could be phenotypically heterogeneous. A greater
understanding of the mechanisms controlling the life cycle of M. tb will enhance
future drug development and allow both dormant and actively replicating
bacteria to be targeted in concert.

26
Figure 1.2 The pathology of the granuloma taken from (Russell 2007)
Aerosolised droplets are delivered to the lung where the first infected cells are the
alveolar macrophages. The infected macrophage then invades the adjoining
epithelium where a proinflammatory response then leads to the recruitment of
monocytes from neighbouring blood vessels. A granuloma develops with
macrophages, giant cells and foamy macrophages. In many of these lesions, the
cells are separated by a fibrous layer of extracellular matrix.

27
Figure 1.3 The Differing Physiological States of M. tuberculosis
LTBI = Latent tuberculosis infection, rpfs = resuscitation promoting factors.

28
Tuberculosis therapy
Most of the first line drugs still used today were discovered decades ago and
drug resistance is increasing. Multidrug-resistant tuberculosis (MDR-TB) is a
form of TB caused by bacteria that do not respond to at least isoniazid and
rifampicin, which are the two most powerful front line drugs. 450,000 cases of
MDR-TB were reported in 2012 [8]. Extensively drug-resistant TB (XDR-TB)
cases also exist, in these cases the patient presents with resistance not only to
the front line drugs rifampicin, isoniazid, ethambutol and pyrazinamide, but also
to some of the most effective second-line anti-TB drugs. Second line drugs
include, fluoroquinolones, and the injectables; capreomycin, kanamycin or
amikacin. Totally drug resistant tuberculosis (TDR-TB) cases have also been
characterised with in vitro resistance to all first and second line drugs tested,
(isoniazid, rifampicin, streptomycin, ethambutol, pyrazinamide, ethionamide,
para-aminosalicylic acid, cycloserine, ofloxacin, amikacin, ciprofloxacin,
capreomycin, and kanamycin). These TDR-TB bacilli have been found to be
morphologically different from other M. tb with variations in shape, cell division
and thickness of cell wall [35]. Resistant strains exhibit different fitness profiles
when grown in competition with different susceptible strains. Drug-resistant
strains often demonstrate decreased competitive ability against susceptible
strains in the absence of the drug [36] [37]. The problem of drug resistance
hampering treatment has led to an urgent need for new therapies.
Part of the problem with drug resistance stems from the prolonged treatment
period required to cure the patient. The long treatment period coupled with
potential side effects of the drugs lead to non-compliance followed by the

29
emergence of drug resistance. The current regime for active pulmonary disease
is a 6 month course of four antimicrobial drugs, consisting of isoniazid (an
inhibitor of mycolic acid synthesis) and rifampicin (an inhibitor of RNA synthesis)
[38] for 6 months. Pyrazinamide (an inhibitor of trans-translation [39]) and
ethambutol (an inhibitor of cell wall synthesis) must be taken in addition to
isoniazid and rifampicin for the first two months of treatment [38]. MDR-TB and
XDR-TB patients require an even longer treatment period with a combination of
first line and second line drugs.
Vaccination
The only vaccine currently in use for M. tb is BCG, which was developed at the
Pasteur Institute by Albert Calmette and Camille Guérin, who attenuated a
mycobacterium related to M. tb (M. bovis), by passaging it for 13 years and
monitoring its decrease in virulence [40]. In 1921, the vaccine was administered
to infants in France, where it reduced mortality by approximately 90%. Since
this time BCG has become widely used due to its low cost and safety.
Unfortunately the BCG vaccine has had limited efficacy in the developing world,
especially against the pulmonary form. It is thought that this is due to prior
sensitisation to environmental mycobacteria. In order for more effective
vaccines to be designed we need to gain a better understanding of M. tb and its
host response during infection [41].
Gene Regulation
The M. tuberculosis genome consists of ~4,000 protein encoding genes whose
expression is controlled by 13 sigma factors, responsible for global regulation of
gene transcription. During exponential growth, bacteria constitutively express

30
so-called ‘housekeeping’ genes, which possess promoters that are recognised
by primary group 1 sigma factors such as σ70 [42]. This house keeping sigma
factor homologue is termed SigA in M. tb [43].
When the bacteria sense stress, for example low oxygen (hypoxia) and low pH,
which may be encountered in the different host environments, they must adapt
to these stresses quickly. One common strategy adopted is to replace the
primary sigma factor that is associated with the core RNA polymerase (RNAP)
with an alternative sigma factor. This changes the promoter specificity of the
RNAP and thereby allows expression of a different set of genes [44]. This
conventional form of transcriptional regulation is complemented by
approximately 200 transcription factors in M. tb. One such example is that of
CarD which interacts directly with the β subunit of RNAP [45]. These
transcription factors dictate the expression of subsets of genes through direct
interaction with either the DNA or RNAP.
The central dogma of molecular biology is the concept that information flows
from DNA to RNA to protein, and it is this, which determines the cellular
phenotype. Gradually this simplified idea is becoming more and more out dated
as the understanding of the role of RNA in the cell grows. It has long been
understood that tRNA, mRNA, and rRNA are fundamental parts of all bacterial
cells. They are necessary for translation, but in addition to these transcripts are
also small RNAs (sRNAs). The complementary network of sRNAs, capable of
acting at the transcriptional and post transcriptional level has challenged the
central dogma. There is now a growing appreciation of the abundance of
sRNAs and their importance in cell processes.

31
sRNAs are short RNA transcripts (typically consisting of ~50-250 nucleotides)
which are not translated [46]. These sRNAs are capable of interacting with
mRNA and proteins, either as RNA alone or in association with proteins as part
of a ribonucleoprotein (RNP) complex. Many roles have been described for
sRNAs including transcriptional regulation, RNA processing and modification,
mRNA stability and translation as well as protein degradation and translocation
[47].
Identification of sRNAs
Non-coding RNAs were initially identified by the detection of highly abundant
sRNAs through direct labelling and sequencing. This led to the discoveries of
housekeeping RNAs such as RNaseP, tmRNA and 4.5S RNA, which are
involved in tRNA maturation, ribosome rescue and protein translocation
respectively.
To date, E. coli and Salmonella typhimurium (Salmonella) have by far the most
identified sRNAs, with over 80 having been described [48-50] for E. coli and
approximately 280 identified for Salmonella [51, 52]. A mixture of techniques
have been used to find sRNAs, from in silico prediction and bioinformatic based
approaches [53] to cloning and sequence based methods.
Even when the complete genome sequence of an organism is known, new
sRNAs can be overlooked because there are no specific classes of sRNAs that
can be found based solely on sequence. In 2001 a combination of techniques
were employed to look for new sRNAs in E. coli [54]. The sequences of
intergenic regions longer than 180bp were compared to Salmonella and

32
Klebsiella pneumonia by NCBI Unfinished Microbial Genomes database using
the BLAST program [55]. Sequences with greater than 80 nucleotides
conservation were then filtered based on their orientation and distance in
relation to the flanking ORFs. Finally the remaining potential sRNAs were
examined for promoters, terminators and inverted repeat regions. These
predictions were compared with microarray data and resulted in a possible 59
sRNAs of which 17 were confirmed by northern blot and considered to be new
sRNAs [54].
An alternative approach using bioinformatics to identify sRNAs has been taken
to conduct genome-wide annotations for putative sRNA genes in the intergenic
regions of eleven pathogens using the sRNAPredict2 program [56]. In total,
more than 2700 sRNAs were revealed as unannotated candidate sRNA loci in
the diverse bacteria, although these remain to be experimentally confirmed.
One unbiased method to investigate the sRNA component of an organism is to
clone and directly sequence short bacterial transcripts by parallel RNA
sequencing. This approach was adopted with the pathogen Vibrio cholerae, in
which they discovered 500 new putative intergenic sRNAs and 127 putative
antisense sRNAs from the growth conditions examined [57].
Most recent work employs new technologies such as high-throughput RNA
sequencing (RNA seq) and high-density tiling arrays to detect the expression of
sRNAs in both pathogenic and non-pathogenic species [58, 59].
Many sRNAs were identified in Salmonella by the co-immunoprecipitation (coIP)
with the epitope-tagged RNA chaperone Hfq. High throughput sequencing
analysis from RNA co-immunoprecipitated with either the epitope-tagged Hfq or

33
the control coIP, identified new sRNAs doubling the number of sRNAs
previously known to be expressed in Salmonella [60].
Hfq
Approximately half of all sequenced bacterial genomes encode an Hfq
homologue. The Hfq protein is highly conserved in prokaryotes and belongs to
the Sm protein family whose members are known to be involved in RNA
interactions [61, 62]. Hfq is an RNA chaperone known to bind to both sRNA and
mRNA, facilitating their pairing.
The protein forms a hexameric ring structure which contains at least two RNA
binding faces [63, 64]. One face binds to single stranded A/U-rich regions (i.e.
sRNA and mRNA) [65], the other to polyA (i.e. mRNA) [66]. Hfq has been
shown to play a central role in sRNA–mRNA interactions facilitating the short
and imperfect base pairing between the sRNAs and their mRNA targets. Förster
resonance energy transfer studies (FRET) showed that Hfq promotes both RNA
annealing and strand exchange by binding rapidly to both the sRNA DsrA and
rpoS mRNA [67]. Strand exchange occurs as the internal structure of rpoS is
disrupted and pairing occurs with DsrA resulting in the Shine-Dalgarno
sequence of the mRNA rpoS becoming exposed.
In Gram-negative pathogens deletion of Hfq often leads to a loss of virulence,
which is attributed in part to loss of proper sRNA function [58, 68]. However, Hfq
is not always required for proper sRNA function. For instance, there is no
homologue in the Actinomycetes-Deinococcus-Cyanobacteria [49, 69], of which
M. tb is a member. There is conflicting evidence as to whether Hfq is required
for virulence in Staphylococcus aureus. One study found that deletion of Hfq

34
had no effect on the expression of virulence genes, nor was the protein highly
expressed [70]. A later study however found 116 genes to be differentially
expressed in an Hfq mutant, and 49 of these were shown to bind Hfq by
immunoprecipitation [71]. It was concluded from the latter study that the
differences in Hfq phenotype observed, could be due to strain variation as the
initial study strain lacked Hfq expression [71].
The lack of a homologue for Hfq in M. tb could possibly be due to the existence
of a functional analogue. Due to the lack of sequence homology this would be
very difficult to identify. Alternatively, it could simply be that M. tb lacks the
requirement for such a protein. It could be that there is more extended base
pairing between the sRNA and the mRNA. Or a higher percentage of G or C
bases present in the binding sequence would be expected to result in more
stable conformations. The high GC content of M. tb (67%) could favour this
theory as the low frequency of AU-rich stretches provide fewer potential binding
sites that are known to mediate Hfq interactions [72].
It is possible that other proteins could contribute to base-pairing sRNA function
thereby substituting for the lack of an Hfq homologue. In B. subtilis three
proteins (FbpA-FbpC) have been identified as possible RNA chaperones
needed for the FsrA sRNA to regulate sdhC expression [73]. However these are
specific for one RNA and not global regulators as is the case for Hfq.
The YbeY protein found in most bacteria was suggested as a possible
candidate as an Hfq analog. This protein in M. tb is Rv2367c and shares
structural similarities with eukaryotic Argonaute proteins which are known to
bind small non-coding RNAs [74]. The E. coli YbeY has been shown to be a

35
strand-specific endoribonuclease, playing key roles in 70S ribosome quality
control and 16S ribosomal RNA maturation [75]. In addition, deletion of YbeY
results in similar phenotypes to those of a Hfq mutant [76] demonstrating that
YbeY plays a role in sRNA regulation in bacteria that is of equal importance to
that of Hfq.
In addition to binding RNAs, Hfq is also thought to interact with components of
the ribosome and degradosome [77].
1.8 The Degradosome and RNases.
The degradosome is an RNA degrading complex that consists of key RNA
enzymes that are responsible for RNA degradation processes. In E. coli the
complex is comprised of RNase E, RNA helicase B, enolase, and the
exoribonuclease polynucleotide phosphorylase (PNPase) [78-82]. RNase E is
present in many bacteria, including mycobacteria [83], however the components
of the degradosome are not conserved between species. Very little is known
about the degradosome and RNA metabolism in mycobacteria. M. tb possesses
RNaseE but it was found to interact with only some of the degradosome
components identified in enteric bacteria [83].
It is known from other bacteria that RNase E functions as a scaffold for the
assembly of the RNA degrading complex and acts as an endoribonuclease
being the primary instigator of transcript degradation. Once RNase E has
initiated cleavage, degradation of the RNA quickly follows [84]. However, RNA
maturation is also a function of RNase E, cleaving precursors of structured
RNAs resulting in processed transcripts that are not marked for decay [85].
In Salmonella there exist two pathways for the degradation of sRNA MicA
which controls the outer membrane porins (OMPs) OmpA and LamB. Turnover

36
of this sRNA is either through RNase E cleaving the unpaired MicA, or by the
endoribonuclease RNase III, which cleaves MicA in complex with its target
mRNA due to the enzyme specificity for double stranded RNA [86].
The mechanism for RNase III has similarity to the eukaryotic RNAi system
where the double stranded enzymes Dicer and Drosha play an important role
[86-88]. M. tb possesses an RNaseIII enzyme which has been shown in S.
aureus to be important in antisense regulation [89] the maturation of rRNAs and
tRNAs, and regulating the turnover of mRNAs and sRNAs [90].
In a co-IP study, RNase III was shown to have a positive effect on protein
synthesis with RNase III–mediated cleavage in the 5′UTR enhancing the
stability and translation of cspA mRNA, which encodes a major cold-shock
protein. Moreover, RNase III cleaved overlapping 5′UTRs of divergently
transcribed genes to generate leaderless mRNAs, resulting in a new
mechanism for co-regulating neighbouring genes [90].
Another RNase of significant importance as a post-transcriptional regulator of
sRNAs is the 3’-5’ exoribonuclease PNPase. PNPase has been found to
stabilize several sRNAs in E. coli including RhyB, SgrS, CyaR [91], and its
action is growth phase dependent [92]. When a sRNA is not associated with
Hfq, it is degraded in a target independent pathway. As the 3’ ends to the sRNA
are exposed when not bound by Hfq PNPase degradation can occur [92].
1.9 Regulation of Gene Expression by sRNAs in bacteria
sRNAs can be divided into two types, trans-encoded/intergenic and cis-
encoded/antisense. Cis-encoded sRNAs are located on the opposite strand to a
coding region and have extensive complementarity (>75 nucleotides) to their

37
targets [50]. Trans-encoded sRNAs are located in intergenic regions of the
chromosome and can regulate multiple mRNAs across the genome (Figure
1.4). Due to their interaction with multiple targets they have limited
complementarity (10-30 nucleotides) to the mRNA and form imperfect base-
pairing interactions [50]. The sRNA pairing with the mRNA can result in the
enhancement or repression of translation. In addition to effects on translation,
several trans-encoded sRNAs have also been shown to bind proteins to
modulate their activity [69, 93].
The first sRNAs were observed in E. coli in the 1970’s with the discovery of
4.5S and 10S, although no function was ascertained at the time [94, 95]. The
next sRNA discovery was in the 1980’s when the plasmid-encoded antisense
RNA, termed RNA I, was discovered and found to control plasmid copy number
in E. coli [96, 97]. Studies by the Tomizawa and Stougard groups led to the
understanding of the importance of secondary structure that allows RNA/RNA
duplex formation [98-100]. At the same time the idea that an RNA transcript
could interact with an mRNA from a distal gene was also proposed [101, 102].

38
Figure 1.4 Representation of genomic locations of sRNAs.
Cis-encoded sRNAs are found antisense to the mRNA target and possess a high
degree of complementarity. Trans-encoded sRNAs are found at different locations
on the genome, regulate multiple targets and therefore have limited
complementarity. Ribosome Binding Site (RBS)

39
1.9.1 Translational Repression
MicF was the first example of a trans-encoded RNA, it was found to
negatively regulate the translation of the outer membrane protein OmpF in
E. coli [102]. Since this discovery, additional outer membrane proteins,
OmpA and OmpC have also been shown to be regulated at the
translational level by sRNAs MicA and MicC [103, 104]. The sRNAs MicA
and MicC act to inhibit translation by binding to the mRNA (with imperfect
base pairing complementarity), to mask the ribosome binding site (RBS)
and prevent the mRNA being loaded into the ribosome [105] see Figure
1.5. sRNAs in E. coli such as MicA, MicC, Spot42 and OxyS sRNAs were
shown by in vitro toeprinting experiments to directly interfere with 30S
ribosome binding of their target mRNAs OmpA, OmpC, galK and fhlA
[104, 106-108]. Toeprinting is a method used to study the formation of
ribosomal initiation complexes in bacteria, which allows visualisation of
how mRNA conformational changes alter ribosome binding at the initiation
site in vitro. This differs from the method of DNA foot printing where the
sequence specificity of DNA-binding proteins in vitro is ascertained.
E. coli is not the only organism in which this mode of action has been
observed.
sRNAs RNAIII and SR1 in the Gram-positive bacteria S. aureus and
Bacillus subtilis, respectively, have also been shown to inhibit translation
[87, 109].
As more work on sRNA regulatory mechanisms is performed, variations
on the basic theme of translational repression have been discovered.
Binding of sRNAs to mRNAs outside the RBS can still inhibit translation

40
[110-113]. Two such mechanisms include the recruitment of Hfq to bind at
a site overlapping the ribosome binding site blocking access to the
ribosome [114] or by binding to mRNA sequences that apparently act as
translational enhancer elements [115, 116]
Regardless of the precise regulatory mechanism, sRNA-mediated
translational repression often results in mRNA degradation by an RNase E
degradosome-dependent pathway. The ribosomes protect the mRNA from
RNase E degradation by masking the RNase E recognition sites [117],
thus sRNA inhibition of translation unmasks these sites and leaves target
mRNAs susceptible to ribonuclease attack [118].
However, translational inhibition is not always coupled to mRNA
degradation. It has been observed that mutations abolishing RNase E-
dependent turnover of sRNA targets can have no impact on translational
repression [119-121]. There are also some cases where sRNA-mediated
translational repression has no significant effect on mRNA levels [107].
This mode of regulation allows for differential regulation of genes within
the same operon. Such is the case in E. coli, the spot42 sRNA targets the
RBS of galK within the galETKM polycistronic mRNA (which is involved in
galactose metabolism) to prevent translation initiation of galK without
affecting the other genes of the operon [107].
The reverse is also true, with cases where sRNAs do not directly affect
translation but target mRNAs for degradation [122, 123].

41
Figure 1.5 Translational inhibition mediated by sRNAs.
Translational Inhibition by sRNAs typically involves base pairing to the mRNA to
occlude the ribosome binding site of the mRNA. This prevents ribosome
association and thus represses translation. Such as is the case for the sRNA
Spot42 which binds to its mRNA targets with imperfect complementarity under
glucose stress [107].

42
1.9.2 Translational Activation
sRNAs are capable of not only repressing translation but also activating
translation. The E. coli sRNAs DsrA and RprA are induced under low
temperature and surface stress, respectively. DsrA and RprA bind to the
mRNA of rpoS, (the stress sigma factor) and increase translation through
a change in secondary structure of rpoS to reveal an otherwise masked
ribosome binding site [93, 124, 125]. The rpoS mRNA has a long highly
structured 5’ untranslated region (UTR), which can fold to mask the
ribosome binding site. Upon pairing of the sRNA with the mRNA the
secondary structure is opened to allow access to the RBS (see Figure
1.6). This form of regulation, as with translational repression, is not limited
to monocistronic mRNAs. Examples of discordant operon regulation by
activation also exist. GlmZ sRNA increases translation of glmS in the
glmUS operon by influencing the action of another sRNA GlmY, in a
hierarchical fashion [126, 127]. First GlmZ, together with the chaperone
Hfq activates translation of the glmS mRNA through the opening of a stem
loop secondary structure to reveal the ribosome binding site. Secondly
GlmY acts to stabilise the GlmZ sRNA by sequestering the RNA-
processing protein YhbJ, thereby indirectly activating expression of glmS
by increasing the levels of the sRNA GlmZ [47, 128].

43
Figure 1.6 Translational activation mediated by sRNAs.
Long 5’ UTRs of mRNA can fold into auto-inhibitory stem loop structures, which
prevent ribosome access. Interaction of a sRNA with the mRNA results in
translation activation by dissolving the fold-back structure, for example rpoS
mRNA and the sRNA DsrA [129].
44
1.10 6S RNA
Although the most common mode of action for sRNAs is through base
pairing, some sRNAs bind proteins to inhibit their (regulatory) activities.
The best studied example is that of E. coli 6S RNA, which binds the
housekeeping form of RNA polymerase (70-RNAP) (reviewed in [130]).
This sRNA was first identified in 1967 but its function was not discovered
until more than 30 years later.
Co-migration studies demonstrated that 6S sediments with RNAP in
glycerol gradients [131] binding tightly to the σ70 but not the σs holoenzyme
[132]. The secondary structure of 6S RNA mimics that of DNA during
transcription initiation (i.e. an open promoter complex) competing for
RNAP, blocking access of the DNA promoter to the RNAP active site [130]
thereby broadly down regulating transcription (Figure 1.7). However,
down-regulation is only observed for a subset of 70 –controlled genes
when 6S is expressed indicating that 70 -RNAP activity is modified in a
fine tuning manner and not just inhibited.
In E. coli 6S RNA has been shown to regulate transcription of relA, which
encodes a guanosine (penta) tetraphosphate (p) ppGpp synthase. The
decreasing availability of amino acids upon entry into stationary phase is
mainly sensed by RelA. The uncharged tRNAs accumulate as a result of
decreasing amino acid pools causing RelA to be activated and
synthesizes ppGpp.ppGpp binds to RNAP along with the transcription
factor DksA [133] to alter transcription of genes with σ(70)-dependent
promoters sensitive to ppGpp such as genes involved in amino acid

45
biosynthesis and rRNA. In gram negative bacteria RelA and SpoT are
responsible for the production of (p)ppGpp, but in M. tb only the single
homolog RelA produces (p)ppGpp [134]. The mechanism of rRNA control
in mycobacteria, which lack DksA is unknown but the essential protein
CarD has been identified as a regulator of rRNA transcription [135]. It has
been observed in E. coli that induction of relA leads to increased ppGpp
levels in early stationary phase in cells lacking 6S [136].
Deletion of 6S RNA in E. coli has no obvious detrimental effects during
exponential growth but is important for optimal survival during stationary
phase growth when 6S accumulates within the cell [137]. During outgrowth
from stationary phase, under conditions of nutritional up shift when NTPs
are no longer limiting, the 6S RNA acts as a template for a short product
RNA (pRNA). These pRNAs of 14-20 nucleotides destabilize the 6S RNA-
RNAP complex, which leads to the ejection of the pRNA-6S RNA hybrid
[138] thereby recycling the RNAP for re use.

46
Figure 1.7 Sequestering of RNAP by 6S RNA
6S RNA acts as a mimic of the DNA in open promoter conformation suppressing
housekeeping transcription by binding to σ⁷⁰ RNA polymerase holoenzyme (core
polymerase + σ⁷⁰) causing widespread down regulation of σ⁷⁰ genes.

47
1.11 Dual Function sRNAs
sRNAs are in general considered to be non-coding. However, examples do
exist of sRNAs that can both regulate mRNA through base pairing, and encode
proteins. In E. coli the 227bp sRNA SgrS helps cells recover from glucose
phosphate stress. SgrS negatively regulates translation and stability of the
mRNA ptsG, which encodes a major sugar phosphate transporter, by a base
pairing mechanism that requires Hfq [139]. It was found that the sRNA
contained a small open reading frame (ORF) of 43 amino acids encoding SgrT
[140]. SgrT is encoded upstream of the nucleotides involved in base pairing and
is translated under glucose phosphate stress, inhibiting the glucose transporter
PtsG. [140]. It was concluded that SgrT reinforces the regulation of SgrS by
independently down regulating glucose uptake by interacting directly with PtsG
protein to inhibit its activity, possibly by plugging the transporter [140].
1.12 Riboswitches
A 5’ UTR is the region from the transcriptional start site to the translational start
site of a gene. It is in this region that riboswitches and RNA thermo sensors are
usually found. Riboswitches can bind small molecules, which result in an
alternative secondary structure of the RNA. This change in structure can lead to
either transcriptional or translational repression or activation of the downstream
sequence by blocking or revealing the RBS. [141].
Homology searches using the consensus sequence and structural model for the
coenzyme B12 class of riboswitches revealed that M. tb contains two such

48
riboswitches. This type of riboswitch is often found upstream of genes involved
in the synthesis and transport of cobalamin. One example is that of the B12
riboswitch found upstream of MetE, which codes for the B12-dependent
methionine synthase [142]. The other B12 riboswitch is found upstream of the
operon containing PPE2, cobQ1 and cobU.
In addition to the above riboswitches M. tb also contains two copies of the
magnesium sensing riboswitch known as an Mbox. One is found upstream of
Rv1535 [3, 143] which is up regulated in response to magnesium starvation
[144]. The other Mbox is found upstream of a putative operon containing four
PE-PPE genes. The B. subtilis Mbox when bound to Mg2+ results in attenuation
of transcription, and this is the likely mechanism in M. tb. Rv1535 is also co-
transcribed with a downstream riboswitch that binds uncharged tRNAs, (TBox)
[145] this TBox is in the 5’UTR of ileS a tRNA synthase.
Gene expression has also recently been demonstrated to be directly affected by
c-di-AMP-responsive riboswitches in the 5’ UTR’s of many mRNAs in bacteria.
The important resuscitation promoting factor (rpfA) was identified as having one
such riboswitch in M. tb [146].
1.13 sRNAs in Mycobacterium tuberculosis pathogenesis
Many sRNAs are post-transcriptional regulators of gene expression induced in
response to external stimuli or stress and they have been found to be
differentially regulated under a variety of growth conditions [54]. Stress
conditions that have been shown to induce sRNA expression include low iron
[147, 148], low temperature [149], changes in glucose concentration [107],

49
changes in glucose-phosphate levels [49], and outer membrane stress under
the control of σE [108]. This additional layer of control that complements
transcriptional regulation affords the bacteria a method of rapid response to
stress.
Regulation of sRNAs has been implicated in the stress response and virulence
of many pathogens other than M. tb including Listeria monocytogenes, S.
aureus, and Salmonella [58, 150-152]. It is therefore reasonable to expect that
sRNAs play a role in the pathogenesis of M. tb.
Until the accessibility of high-throughput sequencing and tiling arrays, the
complete potential contribution of non-coding RNA to gene regulation in M. tb
could not be appreciated. This was due to the fact that techniques such as
traditional microarrays focused on annotated, mainly protein coding genes. It
had been firmly established from studies in other bacteria that transcriptional
control alone was not solely responsible for gene regulation. A post-
transcriptional regulatory network exists that is dependent on sRNAs.
The contribution of sRNAs to gene regulation in M. tb was first assessed in
2009 with the discovery of nine putative sRNAs found by cDNA cloning [153].
This approach was also taken by another group with the model organism BCG.
The study revealed 34 novel sRNAs with putative homologues for many of the
sRNAs identified found to exist in M. tb and M. smegmatis [2] .
In 2011 Arnvig et al, using high throughput sequencing technology found the M.
tb genome to contain an abundance of non-coding RNA, including 5’ and 3’
UTRs, antisense transcripts and intergenic sRNAs, [3]. Some of these have

50
shown markedly varied expression profiles in M. tb under different in vitro
growth phases and stress conditions [153]. For example: M. tb sRNA
ncRv11733 (MTS1338), is highly expressed during stationary phase, nutrient
starvation and infection [154]; ncRv12659 is induced by nutrient starvation and
during mouse infection [155]; and ncRv13661 (MTS2823) is elevated in
stationary phase bacteria and infection [3].
Of the 20 intergenic sRNAs that have been identified and confirmed by northern
blotting [153, 155, 156] some are unique to the M. tb complex while others are
more widely conserved in mycobacteria and actinomycetes [154].
Mcr7 is the first sRNA in M. tb to be assigned a function. Mcr7 is expressed
under the control of PhoP, and the sRNA binds to the 5’ end of the tatC mRNA
preventing ribosome loading and therefore translation. Proteomic analysis has
shown the sRNA to have a role in Tat-dependent secretion of well-known
tuberculosis antigens such as Ag85 complex. It was shown that this control was
at the post transcriptional level and no impact on the amounts of mRNA was
observed [156]. This sRNA completed the link between the PhoPR two-
component system and Tat-dependent secretion, demonstrating the importance
of mcr7 in the virulence of M. tb.
The adaptation of M. tb to environmental changes during the course of infection
has mostly been monitored at the level of gene expression. To date gene
expression studies have concentrated on the expression of mRNA [157, 158],
and largely in tissue culture systems [159] and animal models [160] that do not
completely replicate all features of M. tb infection in humans. Two studies have
assessed the issue of in vivo adaptation. Garton et al., assessed sputum prior
51
to patient treatment using PCR based microarrays [161]. Another study looked
at the transcripts associated with proteins from infected human lungs [162].
While these studies were very informative, they were concentrated on mRNA
and annotated ORFs, so the contribution of sRNAs remains unknown.
Recent work has shown that some M. tb sRNAs are highly induced in M. tb
infected mouse lungs [3, 155] and ongoing studies aim to identify the specific
functions of these sRNAs both in vitro and in vivo.
1.14 Defining sRNA Regulons
The low conservation of sRNAs across bacteria and their reduced
complementarity to mRNA targets make it difficult to predict sRNA targets.
However, algorithms such as targetRNA2 can aid in the identification of
possible targets [163]. TargetRNA2 works by taking the sequence of a sRNA
and searching for targets within a specified genome. Features that are taken
into account are conservation of the sRNA in other (related) bacteria, the
secondary structure of the sRNA, the secondary structure of each candidate
mRNA target, and the hybridization energy between the sRNA and each
putative mRNA target [163, 164]. The latest version now also allows for
integration of RNA seq and microarray data into the prediction of targets by
considering differential gene expression therefore improving the accuracy of
target identifications.
However, part of the search criteria for sRNA targets relies on conservation of
sRNAs in other bacteria, this can make target searches difficult. For example,
the E. coli RhyB [147] and the Pseudomonas aeruginosa functional homologues
[165] share very little sequence similarity.

52
Experimental and computational approaches have been used to define currently
known sRNA regulons. The experimental approaches have included studies of
sRNA dependent changes in gene expression (microarrays, RNA seq or
comparative protein analyses), changes in reporter gene expression or altered
growth phenotypes. Both direct targets of sRNAs, along with downstream
effects will be detected by approaches that assess altered gene expression
complicating the elucidation of sRNA function.
Due to the complete sequence of the M. tb genome being available, global
analysis of gene expression has become routinely possible through both
microarray and RNA seq. Microarrays use gene specific hybridisation probes to
quantify the relative abundance of specific transcripts and have been used to
assess responses of M. tb to different environmental conditions and stages of
infection [166] along with strain comparisons [167]. This method has the
advantage of being relatively cheap in comparison with RNA seq. The data
obtained from RNA seq has the advantage over most microarray technology in
providing much more precise and higher resolution levels of transcripts [168].
However, microarrays and RNA seq should be viewed as hypothesis-generating
tools from which possible regulons can be inferred [169]; possible interacting
partners must be tested in detail by more definitive methods such as
electrophoretic mobility shift assays (EMSA) or reporters.
1.15 non coding RNA Nomenclature in M. tb
The identification of sRNAs in M. tb in recent years has led to a number of
different methods of nomenclature. The first identification of non-coding RNA
(ncRNA) in M. tb resulted in annotation referring to the sequenced clone from

53
which they were identified e. g B11, C8 and F6 [153]. Later reports numbered
the sRNAs by chronological order [2] or by intergenic regions [3, 170], both with
different prefixes. This lack of consistency led to a need for a defined method of
annotation for ncRNA in M. tb. It was suggested that ncRNA were annotated
with a prefix of 'nc' for non-coding, followed by a locus identifier that indicates
the sRNA location in relation to neighbouring ORFs [171]. sRNAs in this study
will be referred to using the new nomenclature.

54
1.16 Hypotheses & Aims
The focus of this study is to determine the roles of selected sRNAs in M. tb
pathogenesis, by identifying their function and mode of regulation. Four
candidate sRNAs were selected for study and these are detailed in each
individual chapter. A summary of their characteristics can be found in Table 1.1
The hypotheses under investigation are
That sRNAs will control a set of genes in response to a specific stimulus.
That sRNAs are important in pathogenesis.
To address the hypothesis that sRNAs have regulons and are important in
pathogenesis the project aims to
Identify genes or proteins that are regulated directly or indirectly by the
sRNAs under investigation.
Identify the expression conditions of the selected sRNAs both in vitro and
in vivo.
Characterise the phenotypes of M. tb strains in which the sRNAs are
inactivated or over expressed.
Figure 1.8 details the experimental plans to achieve the aims listed above.

55
sRNA Method of
identification
Known
Induction
Conditions
Notable
Features
ncRv10243 cDNA cloning
(Arnvig, 2009)
Starvation and
Acid stress
Over expression
in M. tb results in
slow growth
ncRv11690 cDNA cloning
(Arnvig, 2009)
Exponential and
Stationary
Phase
Over expression
in M. tb is lethal
ncRv13661 RNA seq (Arnvig,
2011)
Stationary
Phase and
Mouse infection
Most abundant
RNA after
ribosomal RNA
ncRv12659 RNA seq (Arnvig,
2011)
Stationary
phase
Cis-encoded
sRNA found
antisense to
Rv2660c locus
induced during
starvation
Table 1.1 Key Characteristics of the sRNAs chosen for further investigation

56
Figure 1.8 Experimental Workflow for elucidating the roles of the sRNAs
under investigation.

57
Materials and Methods
Full composition of all media and buffers are listed in Appendix I.
2.1 Bacterial Strains and Growth Media
Mycobacterial strains were grown on 7H11 agar plus 10 % OADC (Becton
Dickinson). Liquid cultures were grown in standard Middlebrook 7H9
medium supplemented with 0.5% glycerol, 10% Middlebrook ADC (Becton
Dickinson) and 0.05% Tween-80 at 37°C in a roller bottle (Nalgene) rolling at
2 rpm or 50 ml falcon tubes (Corning) in an SB3 Tube Rotator (Stewart) at
28 rpm. For propionate utilisation experiments glycerol, ADC and Tween
were replaced with 0.1% sodium propionate 0.5% Albumin fraction V and
0.05% Tyloxapol respectively. Kanamycin was added where required at 25
µg/ml and X-Gal where required at 50 µg/ml.
Escherichia coli (E. coli) strain DH5was used for plasmid construction and
grown in Luria-Bertani (LB) Agar or Broth using kanamycin at 50 µg/ml and
X-Gal where necessary at 200 µg/ml. Details of all strains and plasmids
used and constructed in this study are listed in Tables 2.1 and 2.2
respectively.

58
Strain or Plasmid Relevant Characteristics Source or
Reference
M. tuberculosis
strain
M. tuberculosis wildtype H37Rv used for
the construction of all mutant strains
[172]
M. tuberculosis
strain
Clinical isolates N0031, N0052, N0072,
N0145, N0153
[173]
M. bovis strain M. bovis BCG Pasteur NIMR
DH5α sub cloning
efficiency cells
E. coli cloning strain
Genotype F– Φ80lacZΔM15 Δ(lacZYA-
argF) U169 recA1 endA1 hsdR17 (rK–,
mK+) phoA supE44 λ– thi-1 gyrA96
relA
Invitrogen
Table 2.1 Bacterial Strains used in this study

59
Table 2.2 Plasmids used and constructed in this study
Strain or
Plasmid
Relevant Characteristics Source or
Reference
pBackbone Mycobacterial suicide vector
(kanamycinR and ampicillinR)
Gopaul, (2002)
pGOAL17 Plasmid containing the sacB/lacZ
cassette (ampicillinR)
Parish &
Stoker, (2000)
pKP186 Integrating mycobacterial cloning
vector that does not contain integrase
(kanamycinR)
Rickman et al.,
(2005)
PBSInt Mycobacterial suicide vector containing
integrase, electroporated in conjunction
with pKP186 and its derivatives.
Springer et al.,
(2001)
pMSC12659 ncRv12659 expressed from native
promoter
Houghton et
al., (2013)
pKA302 pMV261 derived replicating over
expression vector containing M.
smegmatis rrnB (-200/-8)
Arnvig et al.,
(2009)
pKA303 pMV261 derived replicating over
expression vector containing M.
smegmatis rrnB (-80/-8)
Arnvig et al.,
(2011)
pKA305 XbaI-ClaI fragment from pKA302
cloned into pKP186 giving rise to an
integrating over expression vector.
Dr. Kristine
Arnvig,
unpublished.
pKA306 XbaI-ClaI fragment from pKA303
cloned into pKP186 giving rise to an
integrating over expression vector.
Dr. Kristine
Arnvig,
unpublished.
pJHP01 Targeting plasmid for removal of
ncRv12659 in M. tuberculosis
pBackbone containing ncRv12659 5′
and 3′ flanking regions, and the
sacB/lacZ cassette.
This Study

60
Strain or
Plasmid
Relevant Characteristics Source or
Reference
pJHP02 Targeting plasmid for removal of
ncRv13661 in M. tuberculosis
pBackbone containing ncRv13661 5′
and 3′ flanking regions, and the
sacB/lacZ cassette
This Study
pJHP03 Targeting plasmid for removal of
ncRv11690 in M. tuberculosis
pBackbone containing ncRv11690 5′
and 3′ flanking regions, and the
sacB/lacZ cassette
This Study
pJHP04 Targeting plasmid for removal of
ncRv10243 in M. tuberculosis
pBackbone containing ncRv10243 5′
and 3′ flanking regions, and the
sacB/lacZ cassette
This Study
pJHP05 ncRv13661 complementing plasmid.
pKP186 derivative containing 625bp
coordinates 4100449-4101296.
This Study
pJHP06 ncRv10243 complementing plasmid.
pKP186 derivative containing 448bp
coordinates 293428-293876.
This Study
pJHP07 ncRv11690 complementing plasmid.
pKP186 derivative containing 381bp
coordinates1914888-1915269.
This Study
pJHP09 pKA305 derivative containing XbaI-ClaI
fragment cut from pKA302 containing
G2 (Arnvig et al., 2009)
This Study
pJHP10 pKA306 derivative containing XbaI-ClaI
fragment cut from pKA303 containing
G2 (Arnvig et al., 2009)
This Study

61
2.2 Recombinant DNA techniques
All general molecular cloning techniques were carried out according to
standard methods (Sambrook 2001), using commercially available
kits/enzymes where stated.
2.2.1 Polymerase chain reaction (PCR)
For PCR reactions where the product was required for downstream use a
proofreading DNA polymerase was used. Primers were designed using
the DNAstar lasergene program primer select, and synthesised by
Sigma-Aldrich. All primers used in the study are listed in Appendix II.
PCR Reactions were performed in a final volume of 50 μl consisting of 1
x Pfx buffer, 1 x PCR Enhancer Solution, 1 mM MgSO4, 300 μM each
dNTP (Promega), 300 nM each primer (Sigma-Aldrich) and 2.5U of Pfx
enzyme (Invitrogen).
Colony PCR’s were performed in a final volume of 20 µl 1 x REDTaq
ReadyMix PCR mix, which includes 1.5 mM MgCl2, 200 μM each dNTP
and 1.5 U Taq DNA polymerase (Sigma-Aldrich), 5 % DMSO, 300 nM
each primer, a single colony resuspended in the PCR mix as template or
1-2 µl of an instagene matrix preparation (BioRad) from M. tb.
DNA amplification was performed in an Applied Biosystems Veriti Cycler
using a touchdown cycle. Cycles consisted of denaturation at 95°C for 5
minutes followed by touchdown cycles from 65°C to 56°C for 30 seconds
followed by extension at either 68°C (for proofreading DNA polymerase)
or 72°C (for non-proofreading DNA polymerase) for one minute per
kilobase of product. 25 cycles were performed with the lowest annealing

62
temperature and completed with a final extension for 7 minutes. PCR
products were analysed by agarose gel electrophoresis.
2.2.2 Agarose Gel Electrophoresis
DNA was separated on 0.8-2% agarose gels using 1 X TBE with 0.5
µg/ml ethidium bromide (Bio-Rad) to allow visualisation of the DNA.
1 x loading buffer was added to samples where necessary (30% glycerol,
0.25% bromophenol blue, 0.25% xylene cyanol) and run alongside 10 µl
of a 1 kilobase ladder (Hyperladder I, Bioline). Gels were run at 100 V
until the DNA had migrated sufficiently by observation of the Dye Fronts.
DNA was visualised on a UV transilluminator (BioDoc-It Imaging
System).
2.2.3 DNA Gel Extraction and PCR purification
DNA fragments were isolated using QIAquick Gel Extraction Kit (Qiagen)
either straight from the PCR reaction or following agarose gel
electrophoresis according to the manufacturer’s instructions. Agarose
pieces containing DNA were excised over a UV light box and solubilised
in a binding buffer. This was bound to a silica membrane on a spin
column and contaminants washed away. DNA was eluted in 30 µl of
dH20.
2.2.4 Plasmid DNA Extraction
Plasmid DNA was extracted from 5 ml of stationary phase E. coli cultures
using the QIAprep Spin Miniprep Kit (Qiagen) according to

63
manufacturer’s instructions. Cells were lysed under alkaline conditions
with SDS to denature proteins and DNA, and to solubilise phospholipids
of the cell membrane. Lysates were neutralised and adjusted to high salt
conditions resulting in contaminants precipitating out and plasmid DNA
staying in solution. Plasmid DNA was adsorbed to a silica membrane on
a spin column and contaminants were washed away. DNA was eluted in
50 µl of dH20.
2.2.5 Restriction endonuclease digestion of DNA
Restriction digestion of DNA was performed in 30 µl reactions for 30
minutes at 37°C using FastDigest Enzymes (Fermentas). Reactions
contained 1 µl of each enzyme, 1 X FastDigest buffer (Fermentas), and 1
µg of DNA. For vector digests reactions also contained Antarctic
Phosphatase (Fermentas) to prevent vector re-ligation. The reaction was
inactivated by incubation at 65°C for 20 minutes.
2.2.6 Ligation of DNA
Ligations were performed using the Roche Rapid Ligation Kit according
to manufacturer’s instructions. Briefly 20 µl reactions containing 1 x
Ligation buffer, 1 µl Ligase and 1:3 ratio of vector: insert DNA. Ligations
were performed at room temperature for 15 minutes.
2.2.7 Transformation of chemically competent E. coli
2 µl of ligated DNA was transformed into 25 µl E. coli chemically
competent sub cloning efficiency cells DH5α (Invitrogen). DNA and cells

64
were mixed and placed on ice for 30 minutes. Cells were heat shocked
for 45 seconds at 42°C and placed back on ice for 2 minutes. Cells were
allowed to recover at 37°C before plating on to selective media.
2.2.8 Sequencing of plasmid DNA
All plasmid constructions were sequenced to verify their identity. 100
ng/µl of construct was supplied to BioSource Sequencing Ltd with vector
specific sequencing primers.
2.2.9 Site directed mutagenesis (SDM)
SDM oligonucleotides were designed with the desired mutation in the
middle with approximately 20 nucleotides of complementary sequence
both sides and a melting temperature of approximately 78°C. Primers
were synthesised and purified using HPLC by Sigma. PCR amplifications
were performed in 50 µl reactions volumes containing Pfx Amplification
buffer, 1 X Enhancer buffer, 0.3 mM dNTPs, 100 ng of each
oligonucleotide, 1 mM MgSO4, 100 ng template plasmid DNA and 2.5 U
Pfx (Invitrogen). The reaction mixture was incubated in a PCR
thermocycler (Veriti applied biosystems) with an initial denaturation step
at 95 °C for one minute followed by 18 to 25 cycles of 95 °C for 50
seconds, an annealing step of 60 °C for 50 seconds and a 68oC
extension temperature for two minutes per kb of plasmid and then
completed by a final extension at 68°C for seven minutes. Original
template methylated DNA was then digested by addition of 1 µl DpnI
(Fast Digest, Fermentas) and incubated at 37°C for 15 minutes. DNA

65
was then ethanol precipitated and the resulting plasmid transformed into
chemically competent E. coli Supercompetent cells (Bioline)
2.3 DNase treatment and purification of RNA
Contaminating DNA was removed from RNA preparations using Turbo
DNase (Ambion) according to the manufacturer’s guidelines. Briefly, 10 µg
of RNA was treated with 2 µl of Turbo DNase for a total of 1 hour as
described in the protocol for a heavily contaminated sample. DNase was
removed from the sample using acidified phenol: chloroform pH4.5 (Ambion)
at a 1:1 ratio, vortexed and centrifuged at 17,100 xg for 10 minutes. The
aqueous phase was removed and RNA precipitated with 1/10 volume of 3 M
sodium acetate and 2.5 x volume of ethanol.
2.4 cDNA synthesis
First Strand cDNA synthesis was performed using superscript III Reverse
Transcriptase (Invitrogen) according to the manufacturer’s instructions using
a reaction temperature of 50 ºC for 30 minutes followed by 55 ºC for 30
minutes.
2.5 qRT-PCR
Primers (supplied by Sigma-Aldrich) were designed using the Applied
Biosystems software Primer Express and sequences listed in Appendix II.
After cDNA synthesis, 1:100 and 1:10,000 dilutions were prepared. Each 20
µl qRT-PCR reaction, contained 1 x SYBRgreen (Applied Biosystems) 900
nm each primer and 5 µl of template cDNA of appropriate dilution. A

66
standard curve of genomic DNA was generated for each experiment to allow
absolute quantitation. All genes were normalised to 16S measured using a
1:10,000 dilution of cDNA. mRNA or sRNA was quantified using a 1:100
dilution.
2.6 Northern Blotting
Northern blots were performed using 6-8% denaturing acrylamide gels
(Appendix I). Depending on the abundance of the sRNA a total of 500 ng-10
µg RNA was loaded per well. Each sample contained 1 x Gel loading buffer
II (Ambion8547) and was heated at 80 °C for 2 minutes before loading. 10 µl
of RNA marker low (Abnova) for size determination was loaded alongside
the samples. The RNA was transferred onto Ambion’s brightstar membrane
for 1 hour in 0.5 x TBE by electroblotting at 1.5 mA per cm2 of membrane.
After transfer the RNA was crosslinked to the membrane by UV before
visualising using 0.3 M sodium acetate containing 0.03% methylene blue.
Membranes were pre hybridised with Ultrahyb Buffer (Ambion) for at least
30 minutes at 65 °C before the addition of the riboprobe. Riboprobes were
made using oligo templates and the mirVana miRNA probe construction kit
(Ambion) and left to incubate with the membrane overnight. Membranes
were washed twice with 2 X SSC + 0.1% SDS, once with 0.2 X SSC + 0.1%
SDS and once with 2 x SSC. Membranes were visualised using a
phosphoimager screen and storm860 scanner.

67
2.7 Rapid Amplification of cDNA ends (RACE)
2.7.1 5’ Rapid Amplification of cDNA ends (RACE)
5’ RACE was performed using the GeneRacer kit (Invitrogen). 5 µg of M.
tb RNA was treated with tobacco acid pyrophosphatase to digest the
triphosphate group at the 5´ end of all transcripts, generating 5´-
monophosphorylated transcripts. The GeneRacer™ RNA Oligo RNA was
added to 0.25 μg GeneRacer RNA Oligo and heated at 65 ºC for 5
minutes. The 10 μl ligation reaction was performed in 1 x ligase buffer,
with 10 nm ATP, 40 U RNaseOut and 5 U T4 RNA ligase; samples were
incubated at 37 ºC for 1 hour. RNA was extracted with acidified phenol:
chloroform and ethanol precipitated with 2.5 volumes with 1/10 3 M
sodium acetate. RNA was re-suspended in DEPC-treated H2O, to which
100 ng random primers and 0.5 mM each dNTP were added, and
incubated at 65ºC for 5 minutes.
The reverse transcription (RT) reaction was performed with the addition
of primer mixture, 1 x First Strand buffer, 5 mM DTT, 40 U RNaseOut
and 200 U SuperScript III RT. Incubation was initially at 25 ºC for 5
minutes followed by 1 hour at 50 ºC. RT was inactivated at 70 ºC for 15
minutes, 2 U RNase H was added to remove the RNA/DNA Hybrids and
incubated for 20 minutes at 37 ºC.
cDNA was amplified using the GeneRacer 5’ Primer and a gene-specific
reverse primer (GSP), using Platinum Pfx DNA polymerase. The PCR
was conducted as a touchdown, starting with a high annealing
temperature and decreasing one degree each cycle. Cycle parameters
were an initial 94 ºC denaturation step, 5 cycles of 94 ºC for 30 seconds

68
and 72 ºC for 1 minute/kb DNA, 5 cycles of 94 ºC for 30 seconds and 70
ºC for 1 minute/kb DNA followed by 25 cycles of 94 ºC for 30 seconds,
65 ºC for 30 seconds and 68 ºC for 1 minute/kb DNA. The cycle finished
with an elongation step of 68 ºC for 10 minutes. Only cDNA containing
the GeneRacer™ sequences will be PCR amplified.
PCR products were analysed by agarose gel electrophoresis, gel
extracted, TOPO cloned and sequenced. Transcriptional start sites were
identified as directly adjacent to the GeneRacer RNA Oligo sequence.
2.7.2 3’ RACE
5 µg of M. tb RNA was poly-A tailed using 1 x poly-A polymerase buffer,
2 U poly-A polymerase, 10 nM ATP, and water to 25 µl. The reaction was
incubated for 1 hour at 37 °C. 50 µM oligo d (T) primer from the
GeneRacer kit was added to the poly-A tailed RNA before precipitating
with 1/10 volume of 3 M sodium acetate, and 3 x volume of ethanol.
Reverse transcription was performed on the resulting RNA using
Superscript III using a reaction temperature of 50ºC for 30 minutes
followed by 55 ºC for 30 minutes.
cDNA was amplified using the GeneRacer 3’ Primer and a gene-specific
reverse primer (GSP), using Platinum Pfx DNA polymerase. The PCR
was conducted as a touchdown, starting at 68°C and decreasing one
degree each cycle. Cycle parameters were an initial 94 ºC denaturation
step, 5 cycles of 94 ºC for 30 seconds and 72 ºC for 1 minute/kb DNA, 5
cycles of 94 ºC for 30 seconds and 68 ºC for 1 minute/kb DNA followed
by 25 cycles of 94 ºC for 30 seconds, 62 ºC for 30 seconds and 68 ºC for
1 minute/kb DNA. The cycle finished with an elongation step of 68 ºC for
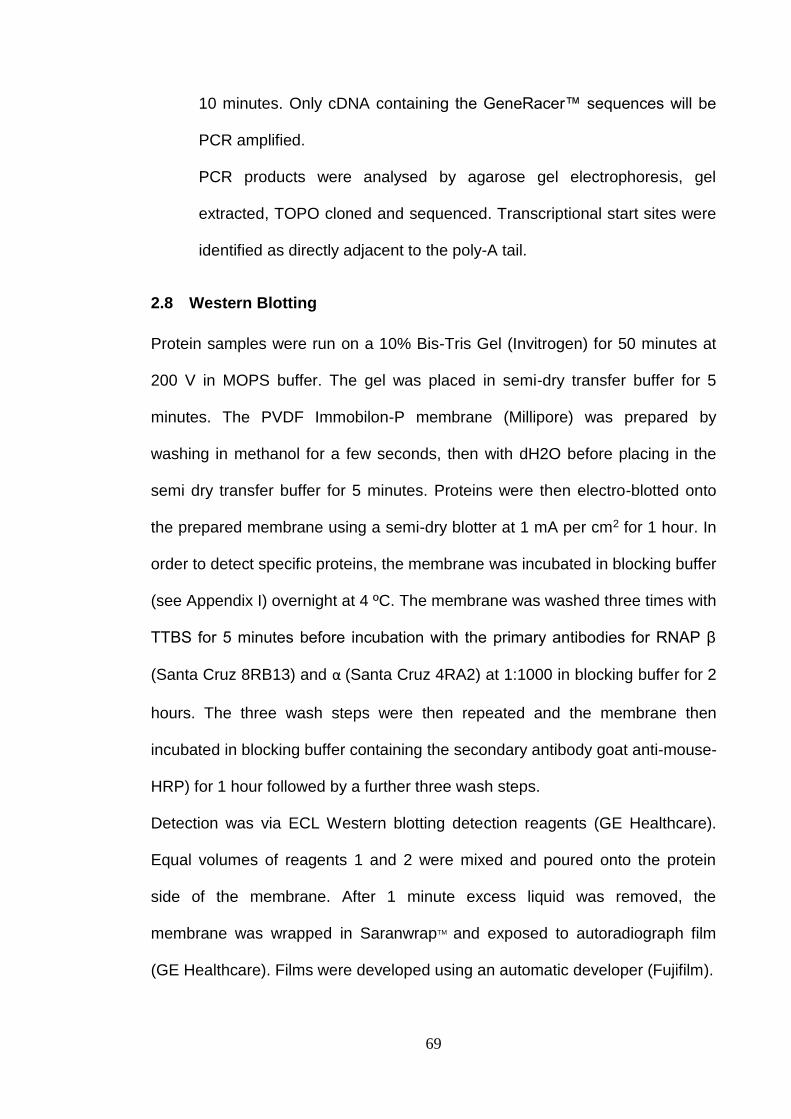
69
10 minutes. Only cDNA containing the GeneRacer™ sequences will be
PCR amplified.
PCR products were analysed by agarose gel electrophoresis, gel
extracted, TOPO cloned and sequenced. Transcriptional start sites were
identified as directly adjacent to the poly-A tail.
2.8 Western Blotting
Protein samples were run on a 10% Bis-Tris Gel (Invitrogen) for 50 minutes at
200 V in MOPS buffer. The gel was placed in semi-dry transfer buffer for 5
minutes. The PVDF Immobilon-P membrane (Millipore) was prepared by
washing in methanol for a few seconds, then with dH2O before placing in the
semi dry transfer buffer for 5 minutes. Proteins were then electro-blotted onto
the prepared membrane using a semi-dry blotter at 1 mA per cm2 for 1 hour. In
order to detect specific proteins, the membrane was incubated in blocking buffer
(see Appendix I) overnight at 4 ºC. The membrane was washed three times with
TTBS for 5 minutes before incubation with the primary antibodies for RNAP β
(Santa Cruz 8RB13) and α (Santa Cruz 4RA2) at 1:1000 in blocking buffer for 2
hours. The three wash steps were then repeated and the membrane then
incubated in blocking buffer containing the secondary antibody goat anti-mouse-
HRP) for 1 hour followed by a further three wash steps.
Detection was via ECL Western blotting detection reagents (GE Healthcare).
Equal volumes of reagents 1 and 2 were mixed and poured onto the protein
side of the membrane. After 1 minute excess liquid was removed, the
membrane was wrapped in SaranwrapTM and exposed to autoradiograph film
(GE Healthcare). Films were developed using an automatic developer (Fujifilm).

70
2.9 Mycobacterial Specific Techniques
All manipulations of M. tb were performed in Containment level III facilities in a
Class I hood.
2.9.1 Preparation of mycobacterial competent cells
Rolling cultures of mycobacteria were grown to OD600nm of 1.0, 0.1
volumes of 2 M glycine were added and the culture left incubating
overnight. The next day the cells were collected by centrifugation at
2,100 xg for 10 minutes at 4°C. They were subsequently washed three
times with 0.5 x volume of cold 10% glycerol finally resuspending in 1/10
of the original culture volume. Cells were then electroporated according
to published protocols (Jacobs et al., 1991).
2.9.2 RNA Isolation
Exponential phase cultures were harvested at an optical density
(OD600nm) of between 0.5-0.8, whilst stationary phase cultures were
harvested 1 week after OD had reached 1.0. When ready, cultures were
cooled rapidly with addition of ice and pelleted at 2,100 xg for 10
minutes. RNA was isolated from the pellet using the FastRNA Pro Blue
Kit from MP Biomedicals following the manufacturer’s instructions. RNA
concentration was measured by ND-1000 spectrophotometer (nanodrop)
and RNA integrity measured by the 2100 Bioanalyzer using a Nano chip.
2.9.3 Genomic DNA Extraction
Half a plate of confluent M. tb was scraped into 300 µl of TE Buffer and
heat killed at 80°C for 1 hour. Cells were lysed using lysozyme and

71
lipase at a final concentration of 2 mg/ml each for 2 hours at 37°C with
the addition of DNase-free RNase. Samples were snap frozen on dry ice
and ethanol before incubating at 75 °C for 10 minutes. Proteinase K was
added to a final concentration of 0.5 mg/ml with SDS at 0.5% and
incubated for 1 hour at 50°C. DNA was extracted with phenol:
chloroform: isoamyl alcohol. The sample was spun to separate the
phases and then the aqueous phase was twice extracted with chloroform
only. DNA was then precipitated with 1/50 volume 5 M NaCl and 2.5
volumes of ethanol.
2.9.4 Instagene Preparations of M. tb
Quick DNA preparations from M. tb suitable for PCR were achieved
using the BioRad Instagene Matrix solution. The matrix adsorbs cell lysis
products that could interfere with the PCR reaction. A loopful of bacteria
was picked into 200 µl of Instagene Matrix solution, vortexed, and heated
at 56°C for 15 minutes. Finally the each sample is then boiled at 98°C for
8 minutes before spinning at 17,100 xg to remove the cell debris.
Approximately 2 µl of the resulting supernatant can then be used in a 50
µl PCR reaction
2.9.5 M. tb Cell Free Extract
M. tb exponential phase cultures were grown to an OD600 of between 0.5-
0.8, whilst stationary phase cultures were grown for 1 week after OD600
had reached 1.0. The cultures were pelleted at 2,100 xg for 10 minutes
washed twice in PBS before re-suspending in buffer. Cells were lysed in
a fast prep instrument at a setting of 6.0 for 30 seconds three times using

72
150-212 micron glass beads. Lysates were centrifuged at 17,100 xg for
10 minutes and the cleared lysate filtered using a 0.22 µM filter
(Millipore) for removal from Cat III.
2.9.6 Sample Preparation for Proteomic Analysis
M. tb was grown to exponential phase and stationary phase as detailed
in M. tb cell free extract. The cultures were pelleted at 2,100 xg for 10
minutes and washed twice with PBS. Cultures were re-suspended in the
same original culture volume of PBS and incubated at 37ºC. At time
points 0, 24 and 96 hours 30 mls of cell suspension were pelleted at
2,100 xg before lysing of cells as detailed in M. tb cell free extract. The
following Lysis Buffer was used; 0.1 M Ammonium bicarbonate buffer
containing 8 M Urea and 0.2% Rapigest (Waters).
Samples were sent to ETH, Zurich Institute of Molecular Systems Biology
and analysed by Olga Schubert by Mass Spectroscopy.
2.9.7 Sucrose Gradients
M. tb was grown to exponential phase and stationary phase as detailed
in M. tb cell free extract. Cultures were then treated with 50nM 4-thio
uridine and incubated overnight for incorporation. Cells were
concentrated into 10 mls by centrifugation at 2,100 xg. The concentrated
cells were then placed in a petri dish on ice and cross-linked with ultra
violet light 3 times at 1200. Cell pellets were collected at 2,100 xg
ribolysed 3 times in a chilled rotor at setting of 6.0 for 30 seconds in a
volume of 600 µl. Lysis was performed in the following lysis buffer: 20

73
mM Tris, 150 mM KCl, 10 mM MgCl2, 1 mM DTT, and 10 µl of Superase
Inhibitor (Ambion). The sucrose gradient buffers contained Roche
complete protease inhibitor cocktail, 20 mM Tris, 150 mM KCl, 10 mM
MgCl2 and 1 mM DTT. 400 µl of lysate was layered carefully onto the top
of a 5-30% sucrose gradient in Ultra-Clear tubes and spun in a SW41
rotor for 16.5 hours at 154,000 xg at 4ºC.
600 µl fractions were collected by AKTA connected to a 254 nm and 280
nm filter. Each fraction was divided into 300 µl for RNA extraction and
300 µl for protein extraction as detailed in 2.9.8 and 2.9.9.
2.9.8 RNA extraction from sucrose gradient fractions
RNA was extracted from each fraction using acidified phenol: chloroform
pH4.5 (Ambion) at a 1:1 ratio, vortexed and spun down at 17,100 xg for
10 minutes. The aqueous phase was removed and RNA precipitated with
1/10 volume of 3 M sodium acetate and 2.5 x volume of ethanol.
2.9.9 Protein extraction from sucrose gradient fractions
Protein was extracted by adding 1 x volume 50 mM Tris pH8.0 and 25%
final volume of Pyrogallol Red-molybdate. Solution was left to precipitate
overnight at 4°C and centrifuged at maximum speed of 17,100 xg for 20
minutes to collect the precipitate. The supernatant was aspirated and
discarded immediately due to pellet instability.

74
2.9.10 Creating Deletion Strains in M. tb
Allelic replacement techniques were used to generate M. tb knockout
mutants as per published protocol [174]. Briefly, approximately 1kb
flanking each region of deletion was cloned into suicide vector
pBackbone containing a kanamycin resistance cassette and a
LacZ/SacB fragment to allow for selection of single crossover and double
cross over events.
2.9.11 Macrophage Infection
Bone marrow derived macrophages (BMDMs) were generated from 6-8
week old Balb/C mice in RPMI-1640 (Gibco) containing 10% foetal calf
serum, 20 µM L-glutamine, 1 mM sodium pyruvate, 10 µM HEPES and
50 nM β-mercaptoethanol. The cells were then grown and differentiated
in complete RPMI-1640 supplemented with 20% L929 cell supernatant
for 6 days at 37°C in 5% CO2. The differentiated cells were seeded at a
density of 2 x 10⁵ cells/well in 1 ml complete RPMI-1640 supplemented
with 5% L929 cell supernatant and incubated overnight prior to infection.
M. tb strains for infection were grown to an OD600 of 0.5-0.8 and inocula
prepared by washing and resuspending the cultures in PBS, to produce a
single cell suspension. This was used to infect BMDMs at a multiplicity of
infection (MOI) of 0.1:1. After 4 hr, the cells were washed to remove all
extracellular bacilli, and medium was replaced and incubation continued.
Macrophages were lysed with water-0.05% Tween 80 to release
intracellular bacteria after 4, 24, 72, 120 and 168 hr post-infection. Bacilli
were serially diluted in PBS-Tween and plated on 7H11 with OADC.

75
Plates were incubated for 3-4 weeks to obtain counts of surviving
bacteria.
2.9.12 Aerosol infection of mice with M. tb
Strains of M. tb for infection were grown to mid log in 7H9 and then
supplied to Angela Rodgers (a trained animal licensee) for infection of
the mice. Groups of 6–8 week old Balb/C mice were infected by low-dose
aerosol exposure with M. tb using a Glas-Col (Terre Haute, IN) aerosol
generator calibrated to deliver approximately 100 bacteria into the lungs.
Bacterial counts from the lungs (n = 5) at each time point were
determined by plating serial dilutions of individual lung homogenates on
duplicate plates of 7H11. CFUs were counted after 3–4 weeks incubation
at 37°C.
Balb/C mice were bred and housed under specific pathogen free
conditions at the Medical Research Council, National Institute for Medical
Research. Protocols for experiments were performed, under project
license number 80/2236, in accordance with Home Office (United
Kingdom) requirements and the Animal Scientific Procedures Act, 1986.
2.9.13 Microarray Analysis
Microarray Analysis was performed using arrays on ncRv13661,
ncRv10243, and ncRv11690 mutants against H37Rv wild type using
RNA extracted from exponential phase cultures. Over expression of
ncRv11690 and ncRv12659 was also compared against vector control
under exponential conditions. Whole genome M. tb microarray slides

76
were purchased from Agilent Technologies through the Bacterial
Microarray Group at St. George's (BμG@S), University of London. For
cDNA synthesis 2 µg of RNA was labelled individually with both Cy-3 and
Cy-5 dyes (GE Healthcare) using Superscript III reverse transcriptase
(Invitrogen). Dye swaps were performed and the cDNA hybridized to an
8-Chamber Agilent slide at 65°C for 16 hours before washing the slide
with Oligo aCGH Wash Buffer 1 (Agilent) for 5 minutes at room
temperature and Oligo aCGH Wash Buffer 2 (Agilent) for 1 minute at
37°C. Slides were stabilized using Agilent's Stabilisation and Drying
Solution according to manufacturer's instructions.
Slides were scanned at 5 microns using an Agilent Technologies
Microarray Scanner at BμG@S. Txt files created by the Agilent scanner
were analysed using Genespring 12.0 filtering on flags and expression.
T-test against zero was performed and p-value selected as p<0.05,
correcting for multiple comparisons using Benjamini-Hochberg. The array
design is available in BμG@Sbase (Accession No. A-BUGS-41;
http://bugs.sgul.ac.uk/A-BUGS-41) and also ArrayExpress (Accession
No. A-BUGS-41).

77
Investigating a function for the starvation induced sRNA ncRv10243
3.1 Introduction
The sRNA originally termed F6 was first identified from cDNA cloning of size
fractionated total RNA from M. tb. Out of 192 clones, 3 possessed the intergenic
region between fadA2 and fadE5 containing F6 (Figure 3.1), which was isolated
from both exponential and stationary growth phases [153]. This study showed
by 5’ and 3’ RACE that a primary transcript of 102 nucleotides existed. Northern
blotting revealed a shorter ~55 nucleotide transcript of greater abundance which
could be due to processing of the primary transcript. In the same study, reverse
transcription PCR (RT-PCR) showed this sRNA to be co transcribed with the
upstream gene fadA2.
F6 was also identified from a screen in BCG by using a dual approach of cDNA
cloning and in silico prediction to identify novel sRNAs, and was termed Mcr14.
The two names for the same sRNA arose due to the lack of guidelines for sRNA
annotation. To avoid confusion a new nomenclature has been suggested [171]
and from now on F6 will be referred to as ncRv10243 as per the new guidelines.
When ncRv10243 was first discovered, a putative SigF promoter was identified
upstream of the 5′ end [153]. This was later confirmed by ChIP-on-chip with
SigF which was found to give a very strong signal at the sRNA promoter [175].
Although ncRv10243 and fadA2 were found to be co transcribed, no expression
of the sRNA is observed in a SigF deletion strain by northern blotting indicating
that the co transcription observed by RT-PCR was probably read-through from
the fadA2 promoter (Houghton & Arnvig unpublished).
SigF was initially found in BCG to be a stationary phase response sigma factor
that is also induced upon cold shock and nitrogen depletion. However in M. tb

78
only nutrient starvation shows some induction of sigF. This non-essential sigma
factor is conserved in most mycobacteria, and deletion leads to an attenuation
in mice and guinea pig models of infection [176-178]. sRNA ncRv10243 is also
highly conserved in pathogenic mycobacteria, with the 3′ end being less well-
conserved in non-pathogenic mycobacteria.
As bacterial gene expression is differentially regulated in response to stress, it
can be useful to model the stresses encountered within the mycobacterial host
environment in order to assess whether a particular gene product could be
important for pathogenesis. Initial studies of ncRv10243 expression showed a
two-fold induction in response to acid stress [153] indicating that this sRNA
could indeed be important for pathogenesis, as is the case for other pathogens
[151]. In particular M. tb encounter acid stress upon phagosome lysosome
fusion [179], or through acidification of the phagosome when macrophages are
stimulated by IFN-γ [180].
In M. tb over expression of ncRv10243 resulted in extremely slow growth with
pin prick colonies visible only after 3–4 weeks. The expression of ncRv10243
did not result in any apparent growth defects in M. smegmatis although the 5’
end and central loop containing part of this sRNA are conserved [153].

79
Figure 3.1 Genomic location of sRNA ncRv10243 in the M. tb genome as viewed in Tuberculist
(http://tuberculist.epfl.ch/)

80
3.2 Hypotheses and Specific Aims
It is difficult to speculate on possible targets for trans-encoded sRNAs but
genome locations can give clues. As well as being co-transcribed with
fadA2, whose transcription is down regulated in macrophages [181],
ncRv10243 is located within a region encoding enzymes involved in lipid
metabolism.
Phenotypic changes resulting from experimental manipulation of sRNA
expression levels provide an alternative route to target identification. In
this study we aimed to take an unbiased approach to identifying the
function and possible regulons of ncRv10243 by removing the
chromosomal copy from M. tb and performing gene expression analysis.
This approach was taken due to the previously observed deleterious
phenotype of over expression [153].
Many sRNAs regulate their targets by masking the ribosome binding sites
in order to inhibit ribosome entry on mRNA (see Section 1). Since the half-
life of bacterial mRNAs is strongly affected by the association with
ribosomes [182], translation inhibition is often coupled to the decay of the
repressed target, e.g., by accelerating RNase E-mediated mRNA
turnover. Therefore if a sRNA that represses translation of an mRNA is no
longer expressed, the abundance of that message would be increased.
Microarrays can be used to assess the relative abundance of mRNAs in
both wildtype and deletion strains in order to identify possible sRNA
targets.

81
3.3. In vitro and In vivo expression levels of ncRv10243
ncRv10243 had previously been shown to be up regulated two-fold in
response to acid stress [153]. In order to identify additional stimuli for
ncRv10243, quantitative RT-PCR (qRT-PCR) was performed as described
in section 2.8, to assess the expression conditions from a variety of growth
conditions. RNA extracts from M. tb H37Rv were prepared from
exponential phase cultures, starvation cultures, and M. tb isolated from the
lungs of infected mice at 21 days post infection Figure 3.2. The qRT-PCR
primers used can be found in Appendix II.
The results show that while ncRv10243 is well expressed in exponential
phase, it is up regulated 6-fold in response to infection of mice lungs, and
even further up regulated in response to 96 hours starvation in PBS (20-
fold on average) when compared to exponential phase expression.

82
Figure 3.2 Expression levels of ncRv10243 in M. tb
ncRv10243 expression levels were measured using qRT-PCR, in each instance
ncRv10243 levels are expressed relative to 16S rRNA control. ncRv10243 is a
well expressed sRNA in exponential phase that is up regulated upon (96 hours)
starvation in PBS. Analysis of M. tb RNA from the lungs of three week infected
mice showed ncRv10243 to also be up regulated in response to infection. Data
represents the mean and standard deviations of three biological replicates for each
condition.

83
3.4 Creation of a ncRv10243 deletion strain
This study set out to identify possible targets of ncRv10243 through the
creation of a deletion strain in which the sRNA is entirely removed from the
chromosome. Creation of a deletion strain relies on allelic exchange by
which homologous recombination causes the chromosomal copy of a
gene or genes to be replaced by a mutated/modified version of the gene.
The mutation was introduced by using a non-replicating suicide vector [7]
in a two-step process. Initially, a single cross-over (SCO) recombinant was
isolated from the electroporation of M. tb with the targeting construct.
These colonies were screened to verify a successful recombination event
and only SCO candidates subjected to counter-selection in order to obtain
double crossovers (DCO) generated by a second recombination event.
PCRs to screen both SCO and DCO are represented in Figure 3.3A. The
markers sacB and lacZ on the targeting construct allow for blue/white
screening of colonies and make counter-selection for sucrose sensitivity
possible, this ease of screening and selection thereby greatly increases
the efficiency of creating deletion mutations in M. tb [183].
3.4.1 Design and creation of the deletion plasmid
In order to delete ncRv10243 from the chromosome of M. tb the strategy
was to remove the sRNA from the chromosome in an unmarked manner.
This is to avoid possible effects of an antibiotic cassette which are
unrelated to the sRNA. For homologous recombination to occur between
the deletion plasmid and the bacterial chromosome, approximately 1.5 kbp
from either side of ncRv10243 was cloned sequentially into the suicide
vector pBackbone before removing the sRNA by site directed mutagenesis

84
(SDM). From the 5’ flank the bases from coordinates 292520-293605 were
first PCR amplified and then cloned, followed by the 3’ flank
encompassing the bases from coordinates 293709-294600.
In addition to the Kanamycin resistance (KanR) cassette already included
in the pBackbone plasmid, was the inclusion of the sacB/lacZ cassette.
The sacB gene encodes for levansucrase, responsible for hydrolysis of
sucrose to glucose, and the lacZ gene encodes for β-galactosidase, which
hydrolyses X-Gal in the media to a blue precipitate.
3.4.2 Screening of single and double crossover candidates
The SCO selection uses KanR and blue/white screening. Blue colonies on
Kanamycin media indicate that the cells express β-galactosidase and are
resistant to kanamycin and therefore a possible single recombination
event has occurred. After removal of selective pressure by streaking onto
non-selective media, SCO candidates can be resuspended and plated to
single colonies on 7H11 containing sucrose, which is toxic when sacB is
expressed. A second recombination event will generate DCOs in which
the plasmid backbone containing the KanR and sacB genes are lost along
with the wildtype region targeted for deletion. The result is that the cells
are now kanamycin sensitive and sucrose resistant.
After electroporation with the targeting plasmid into M. tb H37Rv, cells
were plated onto 7H11 containing Kanamycin and X-Gal. After incubation,
4 blue colonies were screened by PCR to identify true SCOs from random
integrations Figure 3.3B. As the region of deletion in this instance was only
~150bp, it was difficult to differentiate wildtype bands from SCO bands.
Therefore the resulting PCR products were gel extracted and sent for

85
sequencing. Sequencing revealed 1 SCO, which was then streaked onto
non-selective 7H11 for the second recombination event to occur. Full loss
of the backbone of the deletion plasmid was confirmed by streaking out
onto 7H11 plus Kanamycin and X-Gal, and also 7H11 without antibiotic,
plus X-Gal. Only 1 Colony (#4) from DCO selection was white and
Kanamycin sensitive. This DCO candidate was screened by PCR
amplification and sequencing of the PCR product, which confirmed the
deletion of the sRNA from the M. tb genome.

86
Figure 3.3A Schematic of PCR reactions for screening M. tb SCO and DCO
strains
Diagram indicates the three PCR reactions used to distinguish between a) wild
type M. tb, b) single crossovers of either orientation or c) double crossovers.
Primer pairs are gene specific, numbered according to the target region and
designated either pair2 or pair3. Primer sequences can be found in Appendix II.
PCR screening was performed on Instagene preparations from streaked out
colonies. PCR reactions are designed so that orientation of a crossover event can
be identified. Importantly a random integration can be discerned from a SCO as
phenotypically they result in the same characteristics on agar.

87
Figure 3.3B PCR screening for the construction of the ncRv10243 deletion
strain.
PCR reactions were designed using the strategy outlined in Figure 3.3A. Expected
sizes of products for each primer pair are indicated. Due to the small size of
deletion, these PCR products were consequently gel extracted as detailed in
section 2.2.3 and sequenced directly. SCO = single crossover; DCO = double
crossover; M = Bioline Hyperladder I DNA marker.

88
3.5 Complementation of the ncRv10243 mutant
As the aim of this study was to characterise the phenotype of a
ΔncRv10243 deletion strain, it was essential to complement the loss of the
sRNA by replacing the lost chromosomal copy.
In order to achieve this the sRNA and its promoter were PCR amplified
along with a portion of upstream and downstream sequence (for
coordinates see table 2.2), before cloning into pKP186. The resulting
plasmid pJHP06 was electroporated into the mutant strain and presence
selected for using kanamycin 7H11 agar. Presence of the complementing
plasmid was confirmed by PCR from Instagene preparations.
The complementing strain should in theory have the same phenotype as
wildtype M. tb H37Rv and any non-complemented phenotypes could be
due to a secondary mutation elsewhere in the genome or to an antisense
effect as a result of the ncRv10243 promoter transcribing across and into
fadE5. The ΔncRv10243 strain was also whole genome sequenced to
identify any possible mutations that would result in a change of expression
or amino acid.
3.6 Full Genome sequencing of the ncRv10243 mutant
High Quality genomic DNA was extracted from the mutant and the
parental H37Rv strain (as per Section 2.4). Sequencing libraries were
prepared from both strains and sequenced by the HTS sequencing facility
at NIMR. The resulting reads were aligned to the H37Rv reference
genome by Graham Rose (NIMR) and single nucleotide polymorphisms
(SNPs) were identified. There are two types of SNPs; a synonymous SNP,
which does not change protein function as the nucleotide change does not

89
result in an amino acid replacement, and a nonsynonymous SNP, which
has the potential to alter protein function as the nucleotide change results
in an amino acid substitution in the protein.
Alignment of the genomic sequence of ΔncRv10243 identified 6 SNPs in
the DCO selected for use (Appendix III). Two of these were due to the
XbaI site being inserted into the chromosome from the removal of the
sRNA. Two SNPs were found in Rv0279c PE_PGRS4, which is a repeat
region and therefore could be excluded from analysis due to unreliability.
There was 1 nonsynonymous SNP in Rv2541; a hypothetical alanine rich
protein, and finally an intergenic SNP at coordinate 4178146 between
Rv3728 and Rv3729. As no known function for these regions exist it is
impossible to predict the effect of such SNPs on the phenotype of M. tb.
However, if a phenotype was observed in the deletion strain and it cannot
be complemented, it is a possibility that it could be due to these mutations.
3.7 Assessment of ncRv10243 expression in deletion and
complement strains
To confirm the removal of the sRNA and to assess the degree of
complementation achieved, RNA extracts were prepared from H37Rv,
ΔncRv10243, and the complemented strain. cDNA was prepared after
removal of contaminating DNA, and expression of ncRv10243 was
assessed by qRT-PCR as detailed in the materials and methods section
2.7. Reverse transcriptase negative reactions (RT-) were prepared and
assessed in parallel with reverse transcriptase positive reactions (RT+).
RT- absolute values were subtracted from RT+ absolute values before
normalising to 16S. This allows for any contribution from DNA

90
contamination to be removed from the final calculation. The normalisation
results in a value of relative expression to 16S and provides an internal
control for differences in efficiency of first strand cDNA synthesis. 16S was
chosen as a suitable gene for normalisation due to its lack of variation in
abundance. qRT-PCR showed that ncRv10243 was undetectable in the
ΔncRv10243 strain (Figure 3.4). There was no statistical significance in
the expression level of ncRv10243 between the wild type and complement
strain (Figure 3.5; Unpaired t-test, p>0.05).

91
Figure 3.4 qRT-PCR confirmations of ncRv10243 deletion and
complementation
Each strain was grown to exponential phase in standard 7H9 media and RNA then
extracted. qRT-PCR was performed as described in section 2.8. In each instance
sRNA expression is expressed relative to 16S, an rRNA control. Data represents
the averages and standard deviations of three biological replicates for each strain.

92
3.8 In vitro phenotype analysis of growth compared to wildtype
In the first instance the ΔncRv10243 strain was assessed for an in vitro
growth phenotype by comparing growth of the deletion strain against
wildtype and complement strain. Cultures were grown to exponential
phase (OD600 ~0.6) in 7H9 media, and these cultures were used to
inoculate fresh media to an OD600 = 0.05. The OD600 was monitored until a
plateau of growth was reached. No significant difference was observed
between the doubling times of the three strains (Figure 3.5) as assessed
by Linear regression analysis, p>0.05, showing that deletion of ncRv10243
has no effect on in vitro growth of M. tb under these conditions.
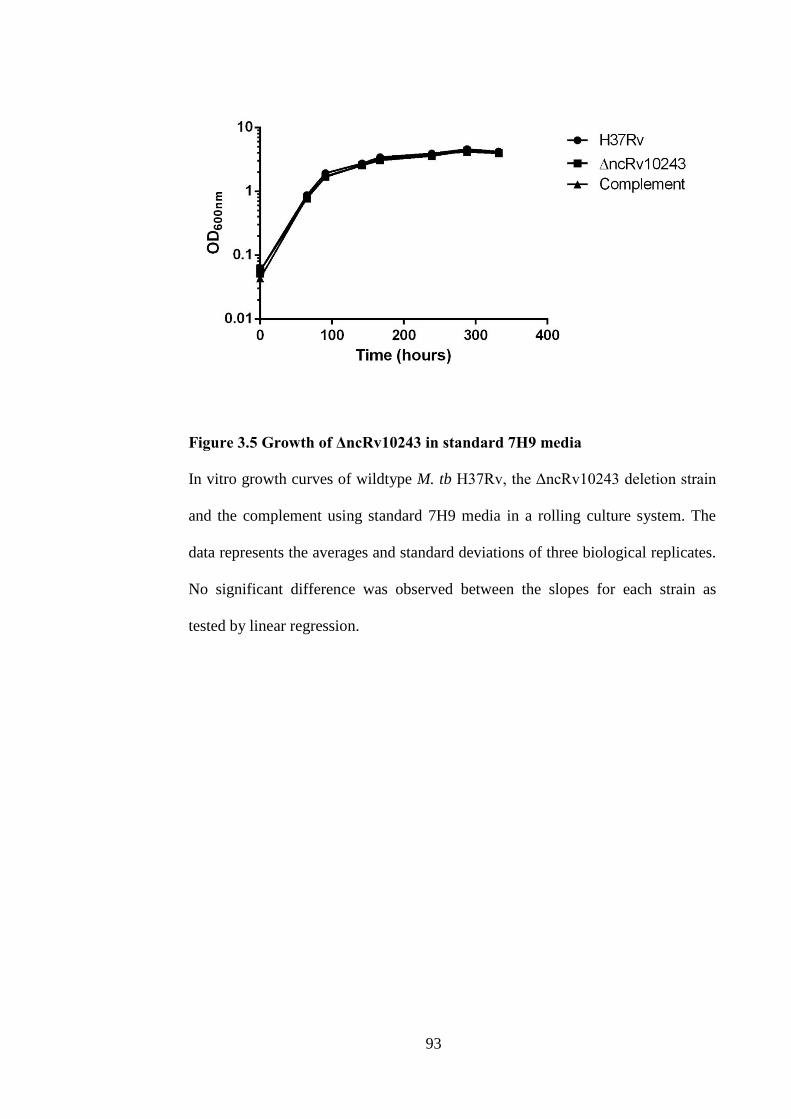
93
Figure 3.5 Growth of ΔncRv10243 in standard 7H9 media
In vitro growth curves of wildtype M. tb H37Rv, the ΔncRv10243 deletion strain
and the complement using standard 7H9 media in a rolling culture system. The
data represents the averages and standard deviations of three biological replicates.
No significant difference was observed between the slopes for each strain as
tested by linear regression.

94
3.9 Growth is inhibited in the Wayne Model
ncRv10243 is known to be under the control of SigF [175] a sigma factor
which is induced in the Wayne model, developed by Lawrence Wayne as
a simple in vitro model of dormancy for M. tb through oxygen limitation
[30].The lack of growth defect observed in the deletion strain when grown
under standard in vitro conditions along with the induction of SigF in the
Wayne model, led to the hypothesis that a growth defect would be
observed under low oxygen tensions (hypoxia). When grown in sealed
tubes with slow stirring, tubercle bacilli cease replicating when oxygen
concentrations decrease to the micro-aerobic level (1% oxygen saturation,
~100 hours), at which time/stage they enter a state of non-replicating
persistence (NRP-1). With continued incubation the oxygen levels
decrease to anaerobic levels (0.06% oxygen saturation, ~200 hours)
inducing the second state, NRP-2. To allow for differences in respiration
rate, depletion of oxygen for each strain is monitored by a methylene blue
indicator tube set up for each strain at the start of incubation. Upon
depletion of oxygen the methylene blue becomes reduced and turns from
blue to colourless. After 14 days, cultures were plated onto 7H11 agar for
assessment of survival. Plates were incubated for 3 weeks and colony
forming units (CFU) counted. In addition, the anaerobic cells were
assessed for their ability to be resuscitated. This was done by diluting the
cultures to OD600 = 0.05 in fresh media and monitoring growth (OD600).
Enumeration of bacteria was necessary to ensure that an equal number of
bacteria were inoculated into the growth curves to ensure an accurate
phenotype would be observed.
95
There was no significant difference in CFU after incubation in the Wayne
model between the wildtype H37Rv strain and either the ΔncRv10243 or
the complemented strain indicating equal numbers of bacteria per unit of
OD (Figure 3.6A). This validated the recovery experiment showing that an
equal number of bacteria were used in the inoculation of fresh media.
The growth curve however identified that the ΔncRv10243 strain was
impaired for recovery following growth in the Wayne model. This
phenotype was partially restored in the complemented strain resulting in
an intermediate phenotype (i.e. between the wildtype and ΔncRv10243)
(Figure 3.6B). It is also possible that the mutant possesses a longer lag
phase that the wildtype or complementing strain as the difference in OD’s
after 300 hours is less marked than at 200 hours post recovery.
The attenuation seen in the Wayne model demonstrates that ncRv10243
is important in recovery from the Wayne model, and is required for the
resuscitation of the bacteria in order to recommence active growth.

96
Figure 3.6 Growth in the Wayne Model impairs recovery of ΔncRv10243.
Wildtype M. tb H37Rv, ΔncRv10243 and complement strains were grown in the
Wayne model until NRP-2 was reached. Cultures were serially diluted and plated
for enumeration of viable bacteria. (A) Number of viable bacteria after incubation
in the Wayne model. Significance was tested by One-way ANOVA p>0.05. All
cultures were then adjusted to an OD600nm = 0.05 in fresh media and the growth
measured over 14 days (B). All data represents the averages and standard
deviation of three biological replicates. It was observed that there was a
significant difference between the recovery of the wildtype and that of the
deletion strain, as tested by linear regression analysis p>0.05. A significant
difference was also observed between the slopes for wildtype and complement
although the growth observed was an intermediate phenotype of the two.

97
3.10 Transcriptional Microarray analysis in exponential phase and
starvation.
Microarrays can be used as a screening tool to allow comparative analysis
of the entire transcriptome in an organism simultaneously. As the targets
of ncRv10243 were unknown, an initial unbiased approach was taken to
generate a hypothesis as to the functional role of ncRv10243. Since
ncRv10243 is strongly induced in starvation as a consequence of SigF
induction it was anticipated that deletion of ncRv10243 would result in an
altered starvation transcriptome.
Starvation differs from stationary phase markedly. Stationary phase is
often due to a growth-limiting factor such as the depletion of an nutrients,
and/or the formation of an inhibitory product for example propionate. This
results in the growth rate and death rate being equal and this state is
reached gradually. Starvation in the model used here however, is the
complete deprivation of all nutrients by washing and replacing culture
media with PBS. RNA was isolated from exponential cultures as well as
from starved cultures (24 hours in PBS was used instead of 96 hours as
the latter results in poor RNA quality). Differential gene expression from
exponential and starved cultures was investigated by transcriptomics.
cDNA microarrays were used to analyse any differences in global gene
expression between ncRv10243 and H37Rv.
Briefly, RNA from wild type and mutant was reverse-transcribed and the
cDNA labelled before mixing and competitively hybridising against an
array. Three biological replicates for each strain were prepared and they
were carried out in technical duplicate (dye-swaps) to account for any bias

98
in the labelling efficiencies of the Cy-dyes. A t-test against zero was
performed for each data set and changes were considered to be
significant if the p-value was less than 0.05 and changed 2-fold or greater.
Tables 3.2A and 3.3B show the gene changes observed in the exponential
and starvation microarray respectively. Of the genes found to be
differentially expressed in both arrays only one, Rv0169 is known to be
differentially expressed under starvation conditions. It would have been
expected that if ncRv10243 were part of the starvation response that
genes known to be involved would be altered in the deletion strain.

99
Gene
Number
Gene
Name
Gene Product Fold
Change
P-value
Rv0694
lldD1
L-lactate dehydrogenase 2.53
0.008
Rv1130
prpD Methyl citrate dehydratase 2.12
0.017
Rv0169
mce1A Unknown but thought to be
involved in host cell invasion
2.08
0.021
Rv0693
pqqE
coenzyme PQQ synthesis
protein E
2.0
0.031
Table 3.2A Genes down regulated > 2-fold in ΔncRv10243 in exponential
phase
Gene
Number
Gene
Name
Gene Product Fold
Change
P-value
Rv0440
groEL2 60 kDa chaperonin 2 4.08
0.035
Rv3418c
groES 10 kDa chaperonin GroES 3.38 0.049
Rv0991c
Unknown 2.81
0.032
Rv0990c
Unknown 2.52
0.037
Table 3.2B Genes found to be up regulated > 2-fold in ΔncRv10243 after
24hrs starvation

100
3.10.1 Confirmation of Microarrays by qRT-PCR
Microarray results were confirmed by qRT-PCR using RNA extracted from
three biological replicates of each strain. The complement was included in
the analysis in order to assess whether the changes in gene expression
could be complemented. qRT-PCR was performed according to section
2.8 and the primers used can be found in Appendix II. Results are shown
in Figure 3.7 and 3.8.
All mRNA observed in the exponential microarray showed no statistical
significant difference between wild type and deletion strain when tested by
qRT-PCR. However, the complement was significantly different to wild
type for Rv1130 although ncRv10243 expression between the strains was
not significantly different.
Genes indicated to be differentially expressed between wild type M. tb and
ΔncRv10243 in the starvation microarray were groES, groEL2, Rv0990c
and Rv0991c which were all found to be up regulated. All but Rv0990c
could be confirmed by qRT-PCR and found to be at least partially
complemented in each case. The transcriptional regulator Rv0990c, could
not be confirmed by qRT-PCR but has been previously shown to be co
transcribed with Rv0991c [184], which was confirmed as up regulated.
GroES, groEL2 and Rv0991c are all heat shock proteins known to be
under the control of the repressor HrcA (Rv2374c) [185]. The up regulation
of all of these genes suggests an indirect effect from a change in this
regulator. It was hypothesised that expression of the repressor could be
affected in the mutant.

101
hrcA was measured by qRT-PCR in all strains to identify if the mRNA was
changed in the mutant, but had been lost in the filtering analysis of the
microarray. Expression levels of hrcA were not found to be significantly
different between any of the 3 strains Figure 3.8.

102
Figure 3.7 qRT-PCR to confirm the gene expression changes observed in the
exponential microarray.
qRT-PCR was performed as detailed in section 2.8. Each Figure shows the
expression level of the gene normalised to 16S. All data represents the mean and
standard deviation of three biological replicates for each strain. Significance tested
with one-way ANOVA and only the complement found to be significantly
different from the wildtype in Rv1130 expression p> 0.05.

103
Figure 3.8 qRT-PCR confirmations of gene expression changes observed in
the starvation microarray
qRT-PCR was performed as detailed in section 2.8. Each bar shows the
expression level of the gene normalised to 16S. All data represents the mean and
standard deviation of three biological replicates for each strain. * = p value
>0.05 with significance tested with one-way ANOVA.

104
3.11 Analysis of the ΔncRv10243 proteome
The possibility that the altered expression of the heat shock family genes
in the mutant could be as a result of post transcriptional regulation of the
repressor HrcA. This was investigated by proteomic analysis of whole cell
extracts and analysed by mass spectrometry. If ncRv10243 was
responsible for altered expression of heat shock family genes through
regulation of HrcA translation then a decrease in the protein abundance
would be observed.
Whole cell extracts from 96 hour starved cultures of H37Rv, ΔncRv10243
and the complement were prepared in triplicate and analysed using mass
spectrometry by Olga Shubert. Peptide abundance was further analysed
using MSstats and fold-changes > = 1 or -1 (in log2 scale) with a p-value <
0.01 were considered statistically significant.
No statistically significant changes were observed in protein abundance
between the wildtype and the deletion strain suggesting that the increase
in the mRNA transcripts observed in the microarray did not result in
increased translation. The observation that HrcA abundance was not
significantly reduced leads to the remaining conclusion that ncRv10243
could be acting to sequester the repressor HrcA by binding the protein, or
by directly targeting mRNA and stabilising them. This hypothesis remains
to be tested in future work.
3.12 in vivo Analysis of ΔncRv10243 compared to wildtype M. tb
M. tb is an intracellular pathogen that is subjected to a variety of stresses
within the host, including but not limited to oxidative stress and nutrient

105
deprivation. Due to the fact that ncRv10243 is induced under oxidative
stress, starvation, and infection in addition to being impaired for recovery
from the Wayne model, the effect of its deletion on M. tb in vivo survival
was assessed. It was expected that the deletion strain would be impaired
for growth due to previous in vitro phenotypes being observed. It is also of
note that loss of the alternative sigma factor SigF, which controls
ncRv10243, was found to decrease the virulence of M. tb in mice, as well
as disease associated tissue damage in mice and guinea pigs [176] [177]
[178].
3.12.1 Deletion of ncRv10243 had no effect on the ability of M. tb to
survive within either naïve or activated macrophages.
The ΔncRv10243 strain, wildtype M. tb H37Rv and complement strains,
were used to infect both naïve and activated murine BMDMs (as detailed
in section 2.13). Macrophages were pre-activated with 10 ng/ml IFN-γ and
incubated overnight and infected alongside naive macrophages at an MOI
of 0.1:1 (bacteria: macrophages). The infection was allowed to continue
for 7 days with five time points. At each time point the macrophages were
lysed and plated for CFUs. For both the naive and activated macrophages,
there were no significant differences between the three strains (Figure
3.9). This would suggest that ncRv10243 does not result in attenuation in
the mouse macrophage model. A lack of attenuation has been observed in
a study of a sigF mutant in human monocyte derived macrophages [176].
However, the macrophage model of infection does not completely
replicate the conditions encountered by the bacteria in the more
complicated whole animal models of infection.

106
Figure 3.9 Survival of the ΔncRv10243 in a macrophage model of infection
Survival of Wild type M. tb H37Rv, ΔncRv10243, and complementing strains
within naive and IFN-γ activated BMDM over a time course of infection.
Significance was tested with One-way ANOVA p>0.05. Data is the mean and
standard deviation of triplicate infections. Data is representative of 3 independent
experiments.

107
3.12.2 Deletion of ncRv10243 does not affect the ability of M. tb to
survive in a mouse model of infection.
In order to assess the role of ncRv10243 in pathogenesis in a more
complete model of infection, wildtype M. tb H37Rv, ncRv10243, and the
complemented strain were used in a mouse model of infection. Balb/C
mice were infected with approximately 100 CFU via the aerosol route and
the infection followed for 143 days. At time points 0, 30, 78, 100 and 143
days, lungs and spleens were harvested for bacterial enumeration. No
significant difference was observed in CFUs between the wildtype M. tb
H37Rv and ΔncRv10243 at any of the time points (Figure 3.11).
The lack of an obvious phenotype observed during the mouse infection
does not necessarily mean that ncRv10243 does not play a role during
infection and pathogenesis. A phenotype for the sigF mutant (the sigma
factor known to control ncRv10243) was only detected through a time to
death experiment in mice, along with observations on differences in
histology of the lungs of guinea pigs and spleen size in mice [176-178]. No
difference in the spleen size was noted for the deletion strain group at any
time point during the infection.
It is of note that a mouse model of infection does not replicate that of an
M. tb infection in a human host. This is mainly apparent in the lack of
ability of the mouse to form granulomas. Granulomas provide a unique
niche for M. tb in which the environment is hypoxic and nutrients are
limited. As these are conditions upon which ncRv10243 is induced, it is
still possible that ncRv10243 plays a role in pathogenesis during

108
granuloma formation that could not be replicated in this study. A study in
guinea pigs which do develop defined granulomatous lesions may provide
an alternative phenotype.

109
Figure 3.10 Survival of ΔncRv10243 from aerosol infected mice.
Survival of wildtype M. tb H37Rv, ΔncRv10243, and complement within the
lungs and spleens of Balb/C mice. The data represents the averages and standard
deviations from 5 mice per time point. Significance was tested with Two-way
ANOVA.

110
3.12.3 ncRv10243 is expressed in M. tb isolated from the
granulomas of infected macaques.
To address the importance of ncRv10243 for M. tb residing within the
granuloma, expression levels of ncRv10243 were measured by qRT-
PCR from M. tb within macaque granuloma samples (kindly supplied by
JoAnne Flynn). Cynamologous macaques were infected with a low dose
of M. tb (Erdman strain) and infection monitored by Positron emission
tomography–computed tomography (PET/CT) imaging and identified
granulomas of interest were consequently surgically removed. The
samples were immediately flash frozen for RNA and paired samples
were plated for CFU estimation. RNA was extracted from the M. tb
isolated from the granulomas by homogenisation. A summary of the
samples can be found in table 3.2.
Although the level of RNA retrieved from the samples was relatively low
and contained a large percentage of host RNA (as observed on the
Bioanalyzer), qRT-PCR showed ncRv10243 to be detectable in all the 8
samples tested, Figure 3.11. Expression levels observed were found to
be comparable with that observed in the mouse even in instances where
the estimated CFU’s were zero. This indicates that ncRv10243 is
important in persistence within the granuloma due to expression in
bacteria that are not actively replicating, or cells which lack the ability to
be resuscitated. It is possible that the primers had some non-specific
binding to macaque sequence producing non-specific amplification.
However, qRT-PCR primers were tested on human leukocyte RNA prior

111
to use and found to result in no amplification. In addition RT- samples for
each granuloma also resulted in no amplification.
It was observed that the different types of lesions did not cluster for
ncRv10243 expression indicating that the populations within the
classified granuloma were not homogeneous.

112
Macaque
Granuloma
No.
Status-CFU Total RNA yield (ng)
3 Active - 24250 161
4 Active - 282000 831
5 Latent likely sterile 301
6 Latent likely sterile 311
7 Latent -3315 381
8 Latent -0 151
9 4 wk -580000 60
10 4 wk - 211250 641
Table 3.2 Summary of Macaque granuloma status and RNA yield
RNA was extracted from M. tb Erdman present in the granulomas of low dose
aerosol infected cynomolgus macaques. Granulomas were scored on their status
by observations using PET/CT imaging.

113
Figure 3.11 Expression of ncRv10243 in the granulomatous lesions of
Macaques.
qRT-PCR was performed as detailed in section 2.8. Each bar shows the
expression level of ncRv10243 normalised to 16S for each individual granuloma.
Expression level of ncRv10243 in the mouse has been included for comparison.

114
3.13 Discussion
ncRv10243 is a well expressed sRNA in exponential phase that has
previously been observed to be up regulated in stationary phase [153]. It
was known that this sRNA is under the control of sigF [153, 175] but no
function for the sRNA had been determined. In this study we aimed to
further assess the expression conditions of this sRNA and to identify a
functional role.
Induction of sRNA ncRv10243 was observed to be up regulated during
early murine infection (21 days post infection) and upon 96 hours
starvation in PBS indicating that this sRNA is important for pathogenesis
and in particular could be important for survival within the granuloma.
During early infection bacteria are actively replicating and the innate
immunity controls the growth of the bacteria through the use of
macrophages where upon the M. tb is subjected to stresses such as high
levels of the bactericidal compound nitric oxide. Around 21 days adaptive
immunity begins and bacterial growth plateaus in the mouse. M. tb within
the granuloma are deprived of nutrients; therefore, bacilli must shift their
metabolism to conserve energy up regulating enzymes essential for
survival during starvation and hypoxia.
It is assumed that during nutrient starvation conditions; mycobacteria
utilize lipids as a sole source of energy [186]. In general, a global
metabolic shift is observed when bacilli undergo starvation conditions
[187, 188].
M. tb has the ability to survive inside the host environment for decades in
a latent state before reactivation. This can be modelled in vitro using the

115
Wayne model of dormancy. The ΔncRv10243 deletion strain was tested in
the Wayne model due to the fact that slower growth was observed when
oxygen was previously limiting. As predicted the ΔncRv10243 deletion
strain was indeed impaired for recovery from the Wayne model (Figure
3.7) but not for growth to NRP-2 (data not shown). As no differences were
observed in the level of CFU’s post incubation it would indicate that the
bacteria were alive but unable to replicate as efficiently in the deletion
strain.
Previously it has been observed that the sigma factor which controls
expression of ncRv10243 is induced in the Wayne model [189]. SigF was
first described in BCG as a stationary phase response sigma factor that is
also induced upon cold shock in BCG [189], heat shock, acidic pH and
oxidative stress in M. smegmatis, and nutrient starvation in M. tb [187].
Therefore it is hardly surprising that these are also conditions that induce
the expression of ncRv10243.
Microarray investigations of an M. tb ΔsigF mutant revealed that Rv3418c
(groES, which codes for 10-kDa chaperonin) and Rv0991c (a hypothetical
protein) were down regulated under exponential phase conditions [176].
24 hour starvation microarrays on the ΔncRv10243 strain showed up
regulation of groES and Rv0991c along with Rv0440 (groEL2, which
codes for 60kDa chaperonin2) as well as Rv0990c the downstream gene
of Rv0991c. All of these genes except Rv0990c were confirmed by qRT-
PCR as being significantly different between the wildtype M. tb strain and
the ΔncRv10243 deletion strain.

116
These genes have been shown to belong to the GroE/Hsp60 heat-shock
protein family. The GroE chaperonin complex consisting of GroEL and
GroES is involved in preventing cellular proteins from misfolding after
temperature increase. Up regulation of this family of genes had previously
been observed in a ΔhspR/ΔhrcA mutant in M. tb where they
characterised the heat shock response [185].
The heat-shock repressor HrcA acts as the main regulator for the heat
shock protein family, controlling its targets through the binding site,
controlling inverted repeat of chaperone expression (CIRCE), [185]. The
CIRCE binding site can be found in the 5’UTRs of groES, groEL2 and
Rv0991c which is thought to be co transcribed with the adjacent Rv0990c.
GroEL2 is preceded by two CIRCE-like elements and both groES and
Rv0991c by one. In addition to acting as a transcriptional repressor HrcA
has also been shown to play a role in post-transcriptional control of mRNA
stability. In B. subtilis it was demonstrated that CIRCE elements at the 5’
end of a transcript resulted in low stability [190], this was also observed in
Rhodobacter capsulatus which does not possess a HrcA protein [191].
Therefore it is likely that the heat shock response in M. tb is controlled
both transcriptionally and post-transcriptionally via the CIRCE element. If
regulation of the GroE chaperonin was controlled by ncRv10243 it could
be achieved by sequestering HrcA to relieve transcriptional repression.
sRNAs binding directly to proteins has been previously reported, for
example the CsrB family of sRNAs contain multiple binding sites for the
protein CsrA [192]. CsrB RNA functions as a CsrA antagonist by
sequestering this protein which functions as an RNA binding protein which

117
usually prevents translation and thereby activates mRNA decay through
endonuclease attack.
As no change in hrcA was found by qRT-PCR to evidence this, proteomic
analysis of whole cell extracts comparing wildtype M. tb H37Rv and the
ΔncRv10243 deletion strain were analysed. No difference in abundance of
HrcA was observed at the proteomic level leading to the possibility that
ncRv10243 directly targets GroES, GroEL and Rv0991c by binding to their
5’ ends around the CIRCE element increasing stability of the mRNA. It is
also possible that loss of ncRv10243 has some as yet unidentified effect
that results in an increase in unfolded proteins resulting in a canonical
heat shock response.
As ncRv10243 was found to be induced by nutrient starvation in response
to sigF induction, it was reasoned that the ΔncRv10243 deletion strain
would be attenuated for growth in vivo. Infection of BMDM for 7 days and
BALB/c mice for 143 days revealed no attenuation of the ΔncRv10243
deletion strain. Studies of a sigF mutant however showed that ΔsigF can
achieve high CFU counts in mice but is attenuated in causing tissue
damage and in producing lethality in mice [176, 177].
Using an intravenous infection of mice a time-to-death study was
conducted using the ΔsigF mutant. The mutant strain infected mice were
able to survive for 334 days whereas the wildtype infected mice lasted
only 184 days [176]. This could explain why no phenotype was observed
for the ΔncRv10243 deletion strain. Another possibility is that attenuation
could have been observed in a different animal system of infection such as
the guinea pig model. Mice lack the ability to form granulomas which acts

118
as a starvation based environment. It was noted that when a ΔsigF mutant
was used to infect guinea pigs by the aerosol route it exhibited ill-defined
lung granulomas [178] suggesting that sigF responses are important for
the bacterial interaction with the host.
Adaptation to nutrient deprivation is essential for long-term survival of
persistent bacteria. M. tb is capable of surviving under non growing
starvation conditions for up to 2 years in vitro while maintaining the ability
to be resuscitated [193]. In M. smegmatis carbon, nitrogen, and
phosphorus-starved organisms have been shown to retain viability for over
650 days [194]. Therefore correct adaptation to starvation enables
bacteria to survive until conditions become more favourable.
Due to ncRv10243 being identified as important for recovery from the
Wayne model, it is possible that the lack of identified targets in this study
could be due to the conditions studied. ncRv10243 could be required for
the recovery from stress and therefore be accumulated within the bacteria
until such time as it is required. This could explain why no targets or strong
phenotype was observed for the deletion strain despite over expression of
ncRv10243 in M. tb leading to reduced growth. However, when
ncRv10243 is over expressed in M. smegmatis there is no obvious
phenotype despite a homolog being present.

119
4 The constitutively expressed sRNA ncRv11690, may
play a role in regulation of EsxA secretion
4.1 Introduction
The sRNA ncRv11690 was originally identified through cDNA cloning of
size fractionated RNA and termed G2 after the corresponding clone [153].
It is a trans-encoded sRNA found in the intergenic region between lprJ (a
probable lipoprotein) and tyrS (an essential tRNA synthase), Figure 4.1a).
Further characterisation of the sRNA to identify 5’ and 3’ ends by RACE
led to the calculation of a full-length transcript of 229bp with a possible
SigC promoter upstream of one of the 5’ ends. Northern blotting shows a
predominant transcript of 65 bp indicating substantial processing of this
sRNA, Figure 4.1B.
Very little was known about ncRv11690 and no possible function had been
elucidated. It was known however that this sRNA was conserved only
within the M. tuberculosis complex inferring a role in pathogenesis. If this
sRNA was indeed also under the control of SigC this would also infer a
role in pathogenesis as a SigC deletion mutant was shown to play a
central role in the lethality of M. tb infected mice [195].
Functional characterisation was attempted through over expression in M.
tb which proved lethal with two different strength promoters. This
prompted the over expression in M. smegmatis, which resulted in defective
growth, especially in liquid medium [153]. This phenotype was observed in
spite of the fact that no obvious homologue of this sRNA is present in the
faster growing mycobacterial strain indicating that possible targets are
conserved.

120
Figure 4.1 Location and transcript size of ncRv11690
a) Genomic position of sRNA ncRv11690 in the M. tb genome as viewed in Tuberculist (http://tuberculist.epfl.ch/) b) transcript size of
sRNA ncRv11690 by northern blotting (adapted from Arnvig 2009) M = marker, E = exponential phase, S = stationary phase.

121
4.2 Hypotheses and specific aims
As mentioned previously in 3.2, it is difficult to speculate on possible targets for
trans-encoded sRNAs. ncRv11690 is not co transcribed with any other genes
as it is divergent to both flanking genes on the genome. Therefore, as with
sRNA ncRv10243, an unbiased approach was taken in order to identify possible
mRNA targets and therefore elucidate the function of ncRv11690.
As experimental manipulation of sRNA expression levels can provide an
alternative route to target identification, the aim of the study was to create both
a sRNA deletion strain and an integrating over expression strain. These strains
would then be used to perform gene expression analysis by microarray, which
would allow the assessment of the relative abundance of mRNA in both the
wildtype/vector controls and ncRv11690 deletion/over expression strain.
In addition to this we planned to assess the virulence of M. tb upon removal of
ncRv11690 from the genome. As this sRNA is potentially under the control of
SigC, which was shown to be important in virulence, we predicted that
ncRv11690 would also play a role in virulence of M. tb.
Results
4.3 In vitro and In vivo expression levels of ncRv11690
ncRv11690 was known to be a well-expressed sRNA in exponential phase. This
study showed that the sRNA is equally well expressed by M. tb in the infected
lungs of mice after 21 days of infection an early point of infection where the
bacteria are actively replicating. The sRNA was also observed in this study to
be down regulated in both stationary phase and starvation. This would indicate

122
that the sRNA is involved in active growth of the bacteria. However, northern
blot analysis shows induction of the sRNA in stationary phase, identifying a
discrepancy between the two techniques. This is most likely due to the location
of the probes for each technique.

123
Figure 4.2 Expression levels of ncRv11690 in M. tb
ncRv11690 expression levels were measured using qRT-PCR, in each instance
ncRv11690 levels are expressed relative to 16S rRNA control. Data represents the
mean and standard deviations of three biological replicates for each condition.
Expression during stationary phase, mouse infection and 96 hours starvation are
significantly different from exponential phase expression when compared by One-
way ANOVA, p<0.05.

124
4.4 Creation of a ncRv11690 deletion strain
This study set out to identify possible targets of ncRv11690 through the
creation of a deletion strain in which the sRNA and its promoter are entirely
removed from the chromosome. The deletion strategy was as described by
[183] which uses a non-replicating suicide vector [7] in a two-step process
as described in section 2.9.10 and 3.4. Briefly, a single cross-over (SCO)
recombinant is isolated from the electroporation of M. tb with the targeting
construct. SCO are then subjected to counter-selection in order to obtain
double crossovers (DCO) generated by a second recombination event. The
markers sacB and lacZ on the targeting construct allow for blue/white
screening of colonies and make counter-selection for sucrose sensitivity
possible [183] .
4.4.2 Design and creation of the deletion plasmid
In order to remove ncRv11690 from the chromosome of M. tb the aim was
to remove the entire sRNA and its promoter. For homologous
recombination to occur between the deletion plasmid and the bacterial
chromosome, approximately 1kb of each of the 5’ and 3’ flanking regions
must be included. The targeting constructed was created in this instance
by cloning a large fragment of approximately 2.5 kbp encompassing
coordinates 1913940-1916496 and the sRNA and its promoter removed
by site directed mutagenesis (SDM). This created a deletion strain lacking
coordinates 1914961-1915183.
The PCR strategy for screening both SCO and DCO candidates are
represented in Figure 3.3A.

125
4.4.3 Screening of single and double crossover candidates
After electroporation with the targeting plasmid into M. tb H37Rv, cells
were plated onto 7H11 containing Kanamycin and X-Gal for selection of
SCO’s. After incubation, 4 blue colonies were screened by PCR to identify
true SCOs from random integrations (Figure 4.3). As the region of deletion
in this instance was only ~206bp, it was difficult to differentiate wildtype
bands from SCO bands. Therefore the resulting PCR products were gel
extracted and sent for sequencing. Sequencing revealed 1 SCO, which
was then streaked onto non selective 7H11 for the second recombination
event to occur. Full loss of the backbone of the deletion plasmid was
confirmed by streaking colonies onto both 7H11 plus Kanamycin and X-
Gal, and also 7H11 without antibiotic, plus X-Gal. 8 colonies from DCO
selection were white and Kanamycin sensitive. These DCO candidates
were screened by PCR amplification and sequencing, which showed
colony number 5, 6, 8, 11 and 12 to contain the deletion of the sRNA from
the M. tb genome (Figure 4.3).

126
Figure 4.3 PCR screening for the construction of the ncRv11690 deletion
strain.
PCR reactions were designed using the strategy outlined in Figure 3.3A. Expected
sizes of products for each primer pair are indicated. Due to the small size of
deletion, these PCR products were consequently gel extracted as detailed in
section 2.2.3 and sequenced directly. SCO = single crossover; DCO = double
crossover; M = Bioline Hyperladder I DNA marker.

127
4.5 Complementation of the ncRv11690 mutant
As the aim of this study was to characterise the phenotype of a
ΔncRv11690 strain, it was essential to complement the loss of the sRNA by
replacing the chromosomal copy with one supplied on a plasmid. The
resulting strain should in theory have the same phenotype as wild type M. tb
H37Rv.
The sRNA was amplified by PCR with a portion of upstream and
downstream region to include any possible regulatory elements and then
cloned into the KanR plasmid pKP186. The double crossover was
electroporated with the complementing plasmid along with a plasmid that
separately supplies the integrase. Presence of the plasmid was confirmed
by PCR analysis of Instagene preparations.
4.6 Full Genome sequencing of the ncRv11690 mutant
High Quality genomic DNA was extracted from the mutant and the parental
H37Rv strain (as per Section 2.4). Sequencing libraries were prepared from
both strains and sequenced by the HTS sequencing facility at NIMR. The
resulting reads were aligned to the H37Rv reference genome by Graham
Rose (NIMR) and single nucleotide polymorphisms (SNPs) were identified.
Alignment of the genomic sequence of ΔncRv11690 identified 1
synonymous SNP in the conserved hypothetical protein Rv1691 (Appendix
III). As this was a synonymous SNP, this does not result in a change of the
amino acid coded for by the sequence, and therefore should not affect
function of the protein.

128
4.7 Assessment of ncRv11690 expression in deletion and
complement strains
To confirm the removal of the sRNA and to assess the degree of
complementation achieved, RNA extracts were prepared from H37Rv,
ΔncRv11690, and the complemented strain. The cDNA was prepared as
previously described in 3.7 and assessed by qRT-PCR before normalising
to 16S. qRT-PCR showed that ncRv11690 was undetectable in the
ΔncRv11690 strain (Figure 4.4). There was no statistical significance in the
expression level of ncRv11690 between the wildtype and complement strain
(Figure 4.4; Unpaired t-test, p>0.05).

129
Figure 4.4 qRT-PCR confirmations of ncRv11690 deletion and
complementation
Each strain was grown to exponential phase in standard 7H9 media and RNA then
extracted. qRT-PCR was performed as described in section 2.8. In each instance
sRNA expression is expressed relative to 16S, an rRNA control. Data represents
the averages and standard deviations of three biological replicates for each strain.
Significance was tested by One-way ANOVA and the complement found to be
significantly different from the wildtype with expression on average 2.5 fold that
of the wildtype.

130
4.8 In vitro phenotype analysis of growth compared to wildtype
In the first instance the ΔncRv11690 strain was assessed for an in vitro
growth phenotype by comparing growth of the deletion strain against
wildtype and complement strain. Cultures were grown to exponential phase
(OD600 ~0.6) in 7H9 media, and these cultures were used to inoculate fresh
media to an OD600 = 0.05. The OD600 was monitored until a plateau of
growth was reached. No significant difference was observed between the
doubling times of the three strains (Figure 4.5) as assessed by Linear
regression analysis, p>0.05, showing that deletion of ncRv11690 has no
effect on in vitro growth of M. tb. under these conditions.
131
Figure 4.5 Growth of ΔncRv11690 in standard 7H9 media
In vitro growth curves of wildtype M. tb H37Rv, the ΔncRv11690 deletion strain
and the complement using standard 7H9 media in a rolling culture system. The
data represents the averages and standard deviations of three biological replicates.
There was no siginificant difference between the growth of the strains as tested by
linear regression analysis.

132
4.9 Transcriptional Microarray analysis in exponential phase
As the targets of ncRv11690 were unknown, an initial unbiased approach
was taken to generate a hypothesis as to the functional role of
ncRv11690. An M. tb whole genome microarray, generated by the
Bacterial Microarray Group at St. George’s containing 4,410 gene-specific
PCR products was used. Since ncRv11690 is most highly expressed in
exponential phase, RNA was isolated from mid log cultures for
investigation by transcriptomics.
cDNA microarrays were used to analyse global gene expression changes
between the ΔncRv11690 and wildtype H37Rv as described in section
2.15 of the materials and methods.
Briefly, 2µg of RNA from wild type and mutant was reverse transcribed to
generate cy3 or cy5 labelled cDNA before competitively hybridising
against an array. Three biological replicates for each strain were prepared
in technical duplicate (dye-swaps) to account for any bias in the labelling
efficiencies of the Cy-dyes. Gene expression changes were considered to
be significant if the p-value was less than 0.05 and the fold change was 2
or above. 65 genes in total were found to be differentially expressed in the
ΔncRv11690 and those greater than 2.5 fold are shown in Tables 4.1 and
4.2. The remainder of the list can be found in Appendix IV.

133
Gene No. Gene
Name
Gene Product Fold
Change
P-value
Rv1535 Unknown protein 3.95 0.048
Rv2699c Conserved Hypothetical protein 3.53 0.048
Rv3528c Unknown protein 3.48 0.046
Rv2299c htpG Probable chaperone protein 2.97 0.045
Rv0097 Possible oxidoreductase 2.97 0.042
Rv2582 ppiB Probable peptidyl-prolyl cis-trans isomerise B 2.94 0.041
Rv0634B rpmG2 50S ribosomal protein L33 RpmG2 2.79 0.042
Rv0846c Probable oxidase 2.73 0.048
Rv2520c Conserved membrane protein 2.73 0.046
Rv0761c adhB Possible zinc-containing alcohol
dehydrogenase NAD dependent
2.66 0.048
Rv2289 cdh Probable CDP-diacylglycerol pyrophosphatase 2.63 0.042
Rv2288 Hypothetical protein 2.63 0.048
Rv2429 ahpD Alkyl hydroperoxide reductase D protein 2.59 0.05
Rv2000 Unknown protein 2.59 0.042
Rv1885c MtCM Chorismate mutase 2.55 0.042
Rv1515c Conserved hypothetical protein 2.54 0.048
Rv3790 dprE1 Decaprenylphosphoryl-beta-D-ribose 2'-
oxidase
2.53 0.041
Rv1754c Conserved protein 2.53 0.042
Table 4.1 Genes up regulated > 2.5-fold in ΔncRv11690 in exponential phase

134
Gene
No.
Gene
Name
Gene Product Fold
Change
P-value
Rv3229c desA3 Possible linoleoyl-CoA desaturase 6.70 0.048
Rv3841 bfrB Bacterioferritin 2.94 0.048
Table 4.2 Genes down regulated > 2.5-fold in ΔncRv11690 in exponential phase

135
4.9.1 Confirmation of Microarrays by qRT-PCR
A selection of genes was chosen for confirmation of the
microarray results by qRT-PCR using RNA extracted from three
biological replicates of each strain. The complement was included
in the analysis in order to assess whether the changes in gene
expression could be complemented. qRT-PCR was performed
according to section 2.8 and the primers used can be found in
Appendix II. Results are shown in Figure 4.6.
It was apparent from the genes identified in the microarray that
there was a trend for genes linked to metal ions, with mRNA from
both the Zur and Fur regulons. Furthermore the most up regulated
gene Rv1535 is known to up regulated in response to magnesium
starvation. This induction is due to the possession of a
magnesium responsive riboswitch.
Two genes known to be involved in molybdopterin synthesis
Rv3116 and Rv2338c were also shown to be down regulated
greater than 2 fold (Appendix IV). Genes of interest were selected
for confirmation by qRT-PCR including those with the highest fold
changes (desA3, Rv1535 and Rv3841)
From the genes selected for confirmation five were shown to be
significantly different in the ΔncRv11690 strain compared to the
wildtype as tested by one-way ANOVA. These included desA3,
Rv1535, Rv3841, Rv0761c and Rv0846c. Three genes were
found to be either fully or partially restored to wildtype levels in the
complement. These were desA3, Rv1535 and Rv3841.
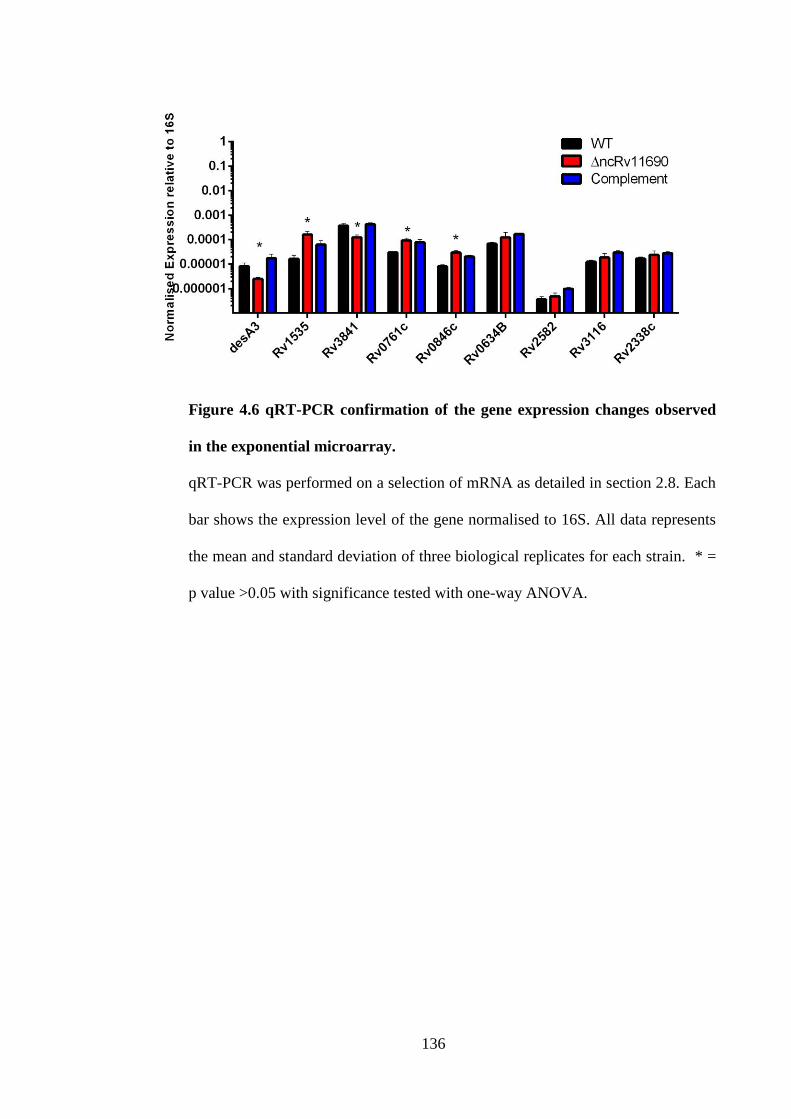
136
Figure 4.6 qRT-PCR confirmation of the gene expression changes observed
in the exponential microarray.
qRT-PCR was performed on a selection of mRNA as detailed in section 2.8. Each
bar shows the expression level of the gene normalised to 16S. All data represents
the mean and standard deviation of three biological replicates for each strain. * =
p value >0.05 with significance tested with one-way ANOVA.

137
Due to the relatively large numbers of genes shown to be affected in the
microarray a common regulator was searched for using the TbDb systems
biology database. The TbDb database allows the identification of DNA binding
sites for regulators that could affect transcription of mRNA. Therefore if the
sRNA was affecting the abundance of a regulator, as opposed to individually
targeting an mRNA, then the gene changes observed in the microarray would
be due to indirect effects of action on the regulator by the sRNA and not direct
targeting.
Regulator candidates generated by TbDb were compared to the microarray
results, which identified Rv0891c as a possible regulator of Rv1535 [196]. This
mRNA was identified in the microarray as being 2.48 fold down regulated.
Therefore mRNA levels were measured to confirm the result (Figure 4.7).
Expression of Rv0891c was not found to be significantly different between the
mutant and the wildtype. As the level of expression is low in all strains this could
have resulted in a false positive in the microarray. It is also possible that the
sRNA is acting post transcriptionally on Rv0891c in such a way that minimal
effects on the abundance of the mRNA are observed.

138
Figure 4.7 qRT-PCR of the regulator Rv0891c
qRT-PCR was performed as detailed in section 2.8. Each bar shows the
expression level of the Rv0891c normalised to 16S. Data represents the mean and
standard deviation of three biological replicates for each strain. Significance was
tested with one-way ANOVA.

139
4.10 ΔncRv11690 is not susceptible to changes in magnesium
concentration.
The observation that Rv1535 was up regulated upon deletion of
ncRv11690 could indicate that the sRNA is involved in regulating bacterial
homeostasis under magnesium deprivation. This hypothesis is borne from
the knowledge that Rv1535 is up regulated in response to magnesium
starvation due to the possession of a magnesium responsive riboswitch.
The up regulation that was observed in the microarray could be interpreted
as the deletion strain sensing magnesium starvation conditions. If
ncRv11690 is responsible for regulating magnesium concentrations that
results in an effect on Rv1535, then the deletion strain could be impaired
for survival in media lacking magnesium. This hypothesis was tested by
growing the wild type H37Rv along in parallel with the ncRv11690 deletion
strain and complement in a minimal media (Sautons) with or without the
addition of magnesium. No growth defect was observed with or without
magnesium in the minimal media indicating that the deletion strain was not
suffering from magnesium starvation.
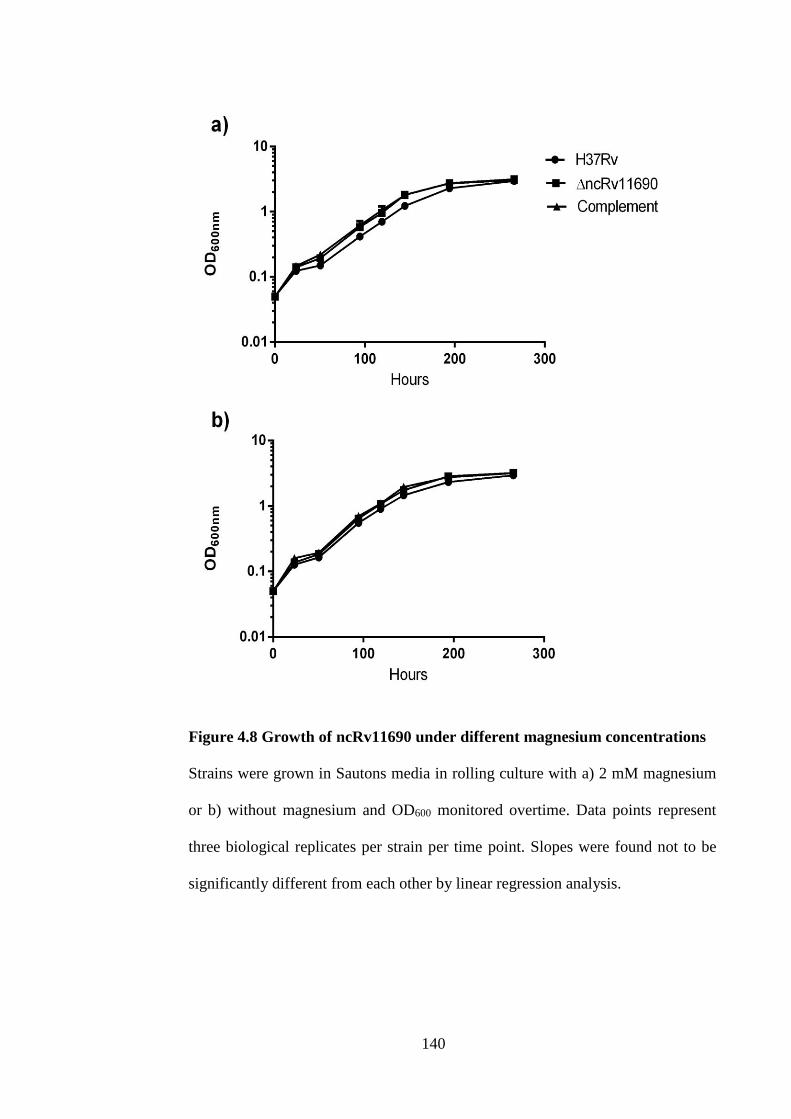
140
Figure 4.8 Growth of ncRv11690 under different magnesium concentrations
Strains were grown in Sautons media in rolling culture with a) 2 mM magnesium
or b) without magnesium and OD600 monitored overtime. Data points represent
three biological replicates per strain per time point. Slopes were found not to be
significantly different from each other by linear regression analysis.

141
4.11 Over expression of ncRv11690.
In order to gain further insight into the function of ncRv11690, over expression
was attempted on an integrating vector in order to achieve a lower level of
expression. The promoter, sRNA and synthetic terminator were digested from
previous replicating over expression constructs [153] and ligated into the
integrating plasmid pKP186. This gave rise to pJHP09 and pJHP10, which were
the integrating strong and weak constructs respectively.
The original over expression in a replicating vector proved lethal in M. tb.
However, when the sRNA under the rrnB promoter was placed on an integrating
vector, expression was reduced to such an extent that over expression was no
longer lethal in wildtype H37Rv M. tb. This indicated that a tolerance threshold
for the sRNA exists.
No obvious growth defect for any of the strains was observed, and acid fast
staining of the over expression revealed no differences in cell morphology by
light microscopy. RNA was isolated from both the over expression and the
vector control during exponential growth and used to measure the expression
level of ncRv11690 Figure 4.9.
It was observed that over expression of ncRv11690 was achieved to an
astounding 22,000-fold that of wildtype vector control when expressed from the
stronger rrnB promoter in pKA305. ncRv11690 expression increases therefore
from 0.001% that of ribosomal RNA to approximately 20%. Over expression of
this sRNA was still achieved to a large extent in the plasmid with the weaker
promoter (pKA306), achieving approximately 18,000-fold over expression when
compared to vector control. This would indicate that the expression of
ncRv11690 in the replicating over expression background would have reached

142
or possibly exceeded that of rRNA. This is due to the fact that the plasmid
based on pMV261 possessed an estimated copy number of five. Such a high
level of expression would indicate that the sRNA was very stable and/or the
degradosome (responsible for degradation of the sRNA) was probably
saturated. This led us to investigate the stability of ncRv11690.

143
Figure 4.9 Over expression of ncRv11690 in M. tb
ncRv11690 expression levels were measured using qRT-PCR and in each instance
are expressed relative to 16S rRNA control. Each bar represents the mean of three
biological replicates. Vector controls and over expression strains found to differ
significantly from each other as tested by t-test, p<0.05.
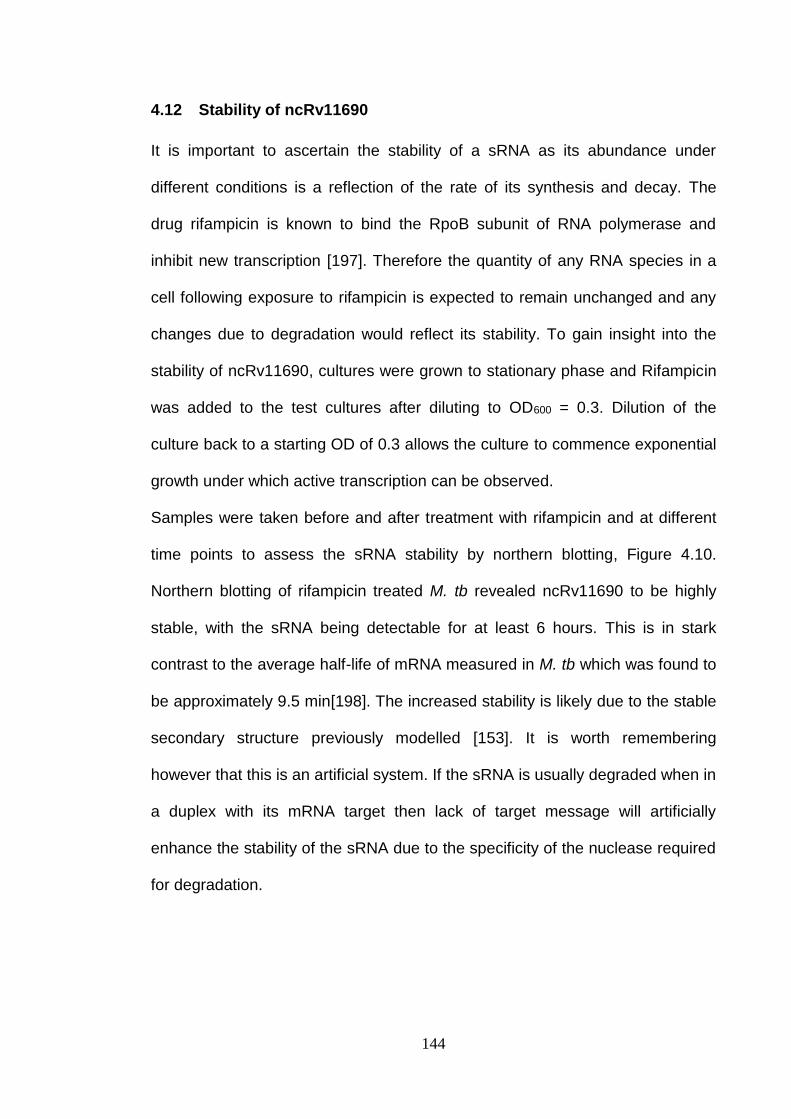
144
4.12 Stability of ncRv11690
It is important to ascertain the stability of a sRNA as its abundance under
different conditions is a reflection of the rate of its synthesis and decay. The
drug rifampicin is known to bind the RpoB subunit of RNA polymerase and
inhibit new transcription [197]. Therefore the quantity of any RNA species in a
cell following exposure to rifampicin is expected to remain unchanged and any
changes due to degradation would reflect its stability. To gain insight into the
stability of ncRv11690, cultures were grown to stationary phase and Rifampicin
was added to the test cultures after diluting to OD600 = 0.3. Dilution of the
culture back to a starting OD of 0.3 allows the culture to commence exponential
growth under which active transcription can be observed.
Samples were taken before and after treatment with rifampicin and at different
time points to assess the sRNA stability by northern blotting, Figure 4.10.
Northern blotting of rifampicin treated M. tb revealed ncRv11690 to be highly
stable, with the sRNA being detectable for at least 6 hours. This is in stark
contrast to the average half-life of mRNA measured in M. tb which was found to
be approximately 9.5 min[198]. The increased stability is likely due to the stable
secondary structure previously modelled [153]. It is worth remembering
however that this is an artificial system. If the sRNA is usually degraded when in
a duplex with its mRNA target then lack of target message will artificially
enhance the stability of the sRNA due to the specificity of the nuclease required
for degradation.
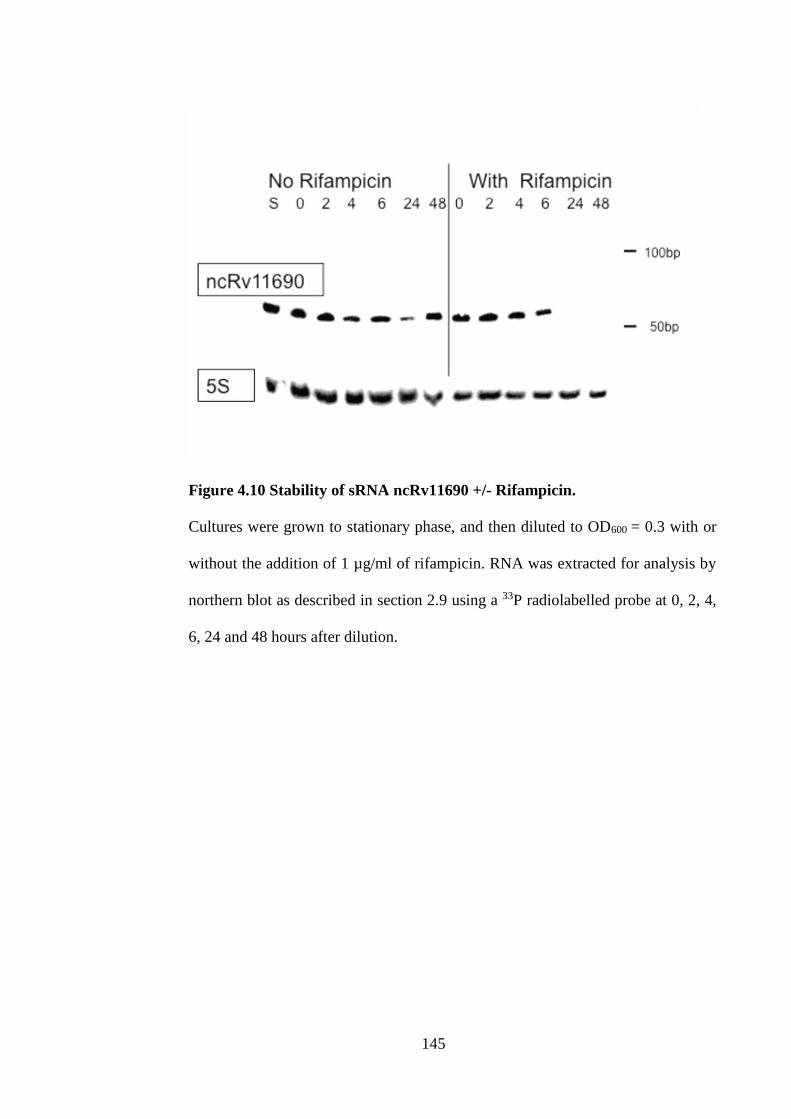
145
Figure 4.10 Stability of sRNA ncRv11690 +/- Rifampicin.
Cultures were grown to stationary phase, and then diluted to OD600 = 0.3 with or
without the addition of 1 µg/ml of rifampicin. RNA was extracted for analysis by
northern blot as described in section 2.9 using a 33P radiolabelled probe at 0, 2, 4,
6, 24 and 48 hours after dilution.

146
4.13 Analysis of the ncRv11690 expression proteomes
As sRNAs are known to act on the post-transcriptional level it was of
importance to assess the relative abundance of proteins within the various
expression strains in order to identify targets of ncRv11690. It was expected
that any changes observed in both the over expression and the deletion strain
would represent targets for ncRv11690. To test this whole cell extracts were
isolated from triplicate exponential phase cultures of H37Rv, ΔncRv11690,
complement, ncRv11690 over expression and vector control. Samples were
sent to Olga Schubert who performed Mass spectrometry and further analysed
the results for statistical significance using MSstats. Protein abundance was
considered to be significantly different with a fold change greater than 1 or -1 in
log2 scale and with a p value less than 0.01.
18 proteins were found to be differentially expressed between the deletion strain
and H37Rv. However, all of these changes were also observed in a comparison
of the complement against the wildtype H37Rv, indicating that these changes
were not due to the loss of ncRv11690. The induction of DosR and genes
belonging to the DosR regulon were observed to be up regulated indicating that
the bacteria were under stress.
Analysis of the over expression strain revealed 10 proteins to be differentially
expressed between the over expression and vector control strains. 8 proteins
were up regulated while 2 were down regulated. Four of these proteins
(Rv2007c, Rv3134c, Rv3131 and Rv2629) were also observed to be up
regulated in the deletion strain analysis and therefore unlikely to be a specific
effect of ncRv11690 expression.

147
Of the six remaining proteins 3 belong to the functional classification of cell wall
and cell processes. These are Rv3866; an Esx-1 secretion associated protein,
Rv1496; a possible arginine/ornithine transport system ATPase, and Rv2576c;
a possible conserved membrane protein. The observed up regulation of Rv3866
along with the down regulation of Rv2576c could suggest a change in the cell
wall upon over expression.

148
Protein Δ/H37Rv
Fold
Change
(Log2)
Complement/
H37Rv
Fold change
(Log2)
Δ/
H37Rv
p value
Complement/
H37Rv
p value
Rv2007c 6.75 7.17 <0.001 <0.001
Rv2031c 6.54 7.04 <0.001 <0.001
Rv0079 5.32 5.64 0.001 0.003
Rv2626c 5.07 5.09 <0.001 <0.001
Rv3134c 4.72 5.37 <0.001 <0.001
Rv0569 4.56 5.56 0.001 0.008
Rv2030c 4.51 4.91 <0.001 <0.001
Rv1738 4.2 4.93 <0.001 0.001
Rv2623 4.01 4.68 <0.001 <0.001
Rv2032 3.56 4.3 <0.001 0.001
Rv2005c 3.18 3.89 <0.001 <0.001
Rv2629 3.16 3.66 <0.001 <0.001
Rv3131 3.07 3.54 <0.001 <0.001
Rv1996 2.86 3.69 <0.001 <0.001
Rv3133c 2.53 2.91 <0.001 0.003
Rv2383c 1.56 1.52 <0.001 <0.001
Rv0081 1.46 1.48 0.004 0.009
Rv3271c -0.74 -1.38 <0.001 0.008
Rv3213c -0.77 -1.09 <0.001 0.009

149
Table 4.3 Proteins differentially expressed between either wild type and
deletion strains or H37Rv and Complement.
Whole cell extracts from exponential phase cultures were analysed by mass
spectrometry for differential protein expression. Statistical significance was set at
a fold change >1 or -1 in log2 scale with a p value < 0.01

150
Protein
Rv number
Gene name Over
expression/vector
Fold change (Log2)
Over
expression/vector
p value
Rv2007c fdxA 3.65 0.002
Rv3134c USP 2.90 <0.001
Rv3131 tgs 1.91 0.001
Rv2482c plsB2 1.83 0.006
Rv0458 1.27 0.004
Rv2629 1.22 0.008
Rv3866 espG1 1.19 0.001
Rv1496 1.07 0.005
Rv2576c -1.02 0.008
Rv2782c pepR -2.25 <0.001
Table 4.4 Proteins differentially expressed between the over expression and
vector control
Whole cell extracts from exponential phase cultures were analysed by mass
spectrometry for differential protein expression. Statistical significance was set at
a fold change >1 or -1 in log2 scale with a p value < 0.01

151
4.14 in vivo Analysis of ΔncRv11690 compared to wildtype M. tb
As ncRv11690 was shown to be well expressed during the early infection of
Balb/C mice (Figure 4.2) the possibility that ncRv11690 may play a role in
pathogenesis was investigated using in vivo models.
4.14.1 Deletion of ncRv11690 had no effect on the ability of M. tb to
survive within either naïve or activated macrophages.
To investigate the function of ncRv11690 during very early infection we
used a cell based model. Both naïve and IFN-γ activated macrophages
were infected with wild type H37Rv, and ΔncRv11690 at an MOI of 0.1:1
and the progress of infection was followed, (Figure 4.11).
The wild type H37Rv strain reproducibly replicated to levels
corresponding to an increase of approximately 2 logs in naive
macrophages during the course of the experiment. Growth and survival
of the ΔncRv11690 strain was very similar to that of the wild type with no
significant difference detected at any time point.
Growth of both H37Rv and ΔncRv11690 within IFN-γ activated
macrophages was less than that observed in naive macrophages. An
increase of approximately 1 log would indicate successful activation of
the macrophages due to the control of proliferation. However, there was
only a significant difference between the two strains at 120 hours, which
was not replicated at later time points. This would suggest that
ΔncRv11690 is not attenuated for growth in either naive or activated
macrophages.

152
Figure 4.11 Survival of the ΔncRv11690 in a macrophage model of infection
Survival of Wild type M. tb H37Rv, ΔncRv11690, and complementing strains
within naive and IFN-γ activated BMDM over a time course of infection.
Significance was tested with Two-way ANOVA p>0.05. Data is the mean and
standard deviation of triplicate infections.

153
4.14.2 Deletion of ncRv11690 had no effect on the ability of M. tb to
survive in a mouse model of infection
The lack of an attenuation for the mutant strain in macrophages led to
the assessment of the importance of the sRNA in establishing an
infection in mice. Groups of mice were infected by the aerosol route as
described in section 2.8.12, with 5 mice per strain sacrificed at each time
point for bacterial enumeration.
Infection of the mice showed that the ncRv11690 deletion strain was not
defective in its ability to establish or maintain an infection (Figure 4.12).
The first infection hinted at an increase in virulence in the later time
points for the ΔncRv11690 strain. However, when the infection was
repeated this was not observed.
ncRv11690 in this model of infection does not result in attenuation as
measured by CFUs. It remains possible though, that ncRv11690 may still
play a role in pathogenesis that does not result in lowered CFUs.

154
Figure 4.12 Survival of ΔncRv11690 from aerosol infected mice.
Survival of wildtype M. tb H37Rv, ΔncRv11690, and complement within the
lungs and spleens of BALB/C mice. The data represents the averages and standard
deviations from 5 mice per time point and is representative of two independent
experiments. Significance was tested with one-way ANOVA.

155
4.15 Discussion
This study set out to address the role of ncRv11690 in the pathogenicity of M. tb
by targeting ncRv11690 for inactivation in the wildtype strain H37Rv. Through
expression and infection studies the aim was to elucidate a function for
ncRv11690 and assess the virulence of the deletion strain.
Successful deletion of ncRv11690 from the M. tb chromosome revealed the
sRNA to be non-essential in vitro despite the sRNA being well expressed in
exponential phase. ncRv11690 expression has been observed to be highest in
exponential growth and during mouse infection. It is down regulated upon
stationary phase and starvation. This suggested that the sRNA was important
for active growth. In vitro growth in 7H9 however, revealed that the deletion
strain was not attenuated for growth under standard conditions. This could
suggest that the precise induction conditions are yet to be determined.
Many sRNAs are induced in response to stress [93, 199] yet ncRv11690 is
down regulated in both stationary phase and starvation. Therefore in order to
explore the possible function of ncRv11690 gene expression microarrays were
used.
Transcriptional Analysis of ncRv11690 under exponential conditions revealed
desA3 and Rv3841 to be down regulated. These genes are from the Zur and
IdeR transcriptional regulons respectively [200-202]. These regulons are known
to control zinc and iron homeostasis indicating an effect on the intracellular
metal concentrations in ΔncRv11690. This was further evidenced in the up

156
regulation of Rv1535 which possesses a magnesium responsive riboswitch that
results in up regulation upon magnesium starvation [154].
Two major mechanisms are involved in metal ion homeostasis and resistance.
Firstly the uptake or efflux of heavy metal ions across the membrane [203],
secondly the specific chelating of the metals by intracellular chaperones, e.g.
metallothioneins [204]. These genes are tightly controlled by the metal sensing
transcriptional regulators such as Zur and IdeR which bind iron and then
interact with the DNA to control transcription of target genes [205, 206].
Iron is an essential nutrient for most pathogens, and iron limitation at infection
sites is an important means of host defence. Expression of a number of M. tb
genes are regulated in response to reduced iron levels [205, 207, 208].
Importantly M. tb virulence has been observed to be reduced in strains that lack
the ability to adapt to iron limitation [207, 209, 210].
The ability of the mutant to survive under magnesium starvation conditions was
tested to assess the ability of the strain to adapt. No attenuation of the
ncRv11690 deletion strain was observed however indicating that it was not
suffering from magnesium starvation. The ability of the ΔncRv11690 strain to
adapt to iron limiting conditions was not tested in this study but could be
included in further studies. However, the reduction of BfrB is most likely
compensated for by an increase in expression of the homologue BfrA and
therefore unlikely to result in attenuation.
Global analysis of the proteome from the deletion strain during exponential
phase showed ncRv11690 deletion resulted in no statistically significant

157
changes. This would indicate that the induction conditions required for
ncRv11690 function were not met under the conditions examined. Analysis of
the over expression proteome however, identified three proteins involved in cell
wall and cell processes. Rv3866, an ESX-1 secretion associated protein was
found to be up regulated while the membrane protein Rv2576c was down
regulated. ESX-1 secretion is important for intracellular survival and virulence
and is responsible for the secretion of ESAT-6 and CFP-10. The major virulence
determinant and ESX-1 substrate, EsxA, arrests phagosome maturation and
lyses cell membranes, resulting in tissue damage that ultimately results in
spread of the disease.
The EsxA inhibitor BBH7 affects M. tb metal-ion homeostasis and revealed zinc
stress as an activating signal for EsxA secretion [211]. Interestingly in a
bioinformatic search for targets using TARGETRNA2, predicted base pairing to
occur upstream of Rv3870 (eccCa1) a conserved ESX component; at bases-12
to -28. This would suggest regulation by translational inhibition. However, target
prediction did not identify any of the mRNA highlighted in either the
transcriptomic or proteomic analyses.
If ncRv11690 is involved in the regulation of EsxA this could explain why DesA3
from the Zur regulon [200] was found to be down regulated (6.7 fold) upon
deletion of ncRv11690.
Deletion of ncRv11690 did not result in attenuation in the macrophage or mouse
model of infection when measured by CFUs. It is still possible though that the
pathogenicity of the M. tb deletion strain was altered. Attenuation of some
mutants has only become apparent when tested using a time to death study in

158
mice, as observed with a sigF mutant [177]. Differences in virulence can also be
observed under different host genetic backgrounds. Traditionally, Balb/C mice
and C57BL6 mice have been regarded as Th2- and Th1-skewed strains,
respectively. Th1 cells are associated with cell-mediated immunity and
characteristically produce IL-2, IFN-γ, and TNF-β. Th2 cells regulate humoral
immunity, can moderate Th1 responses [212], and produce cytokines IL-4, IL-5,
and the anti-inflammatory cytokine IL-10. Therefore the Balb/C mice used for
the ΔncRv11690 could influence the M. tb phenotype observed, and therefore it
is possible that were the infection to be repeated with C5BL6 mice or immune
deficient SCID mice, that a different phenotype could have been observed.

159
5 Deletion of ncRv13661, the most abundant sRNA in M. tb has
pleiotropic effects on transcription
5.1 Introduction
MTS2823 (or ncRv13661 according to the new nomenclature), was discovered
through the full transcriptome analysis of M. tb by RNA seq [3]. It is located
between Rv3661 and Rv3662c (genome co-ordinates 4100669 - 4100988)
Figure 5.1, and was observed to have the highest reads per kilobase of
transcript per million reads mapped (RPKM) excluding that of rRNA peaks in
exponentially growing cultures. Its expression during stationary phase is
increased a further 10-fold reaching approximately 50,000 RPKM in contrast to
the most highly expressed mRNA with an RPKM of 6,566 [3].
The abundance of ncRv13661 suggests that this sRNA may be interacting with
some major machinery of the cell such as the ribosome or RNAP rather than
with low copy number mRNAs. Highly abundant RNAs of known function
include for example, 16S and 23S. These are components of the ribosome
known as ribosomal RNAs, and are highly conserved between different species
of bacteria and archaea [213]. Another abundant regulatory RNA is 6S, which
interacts with RNAP under certain conditions to control transcription as
described in section 1.10.
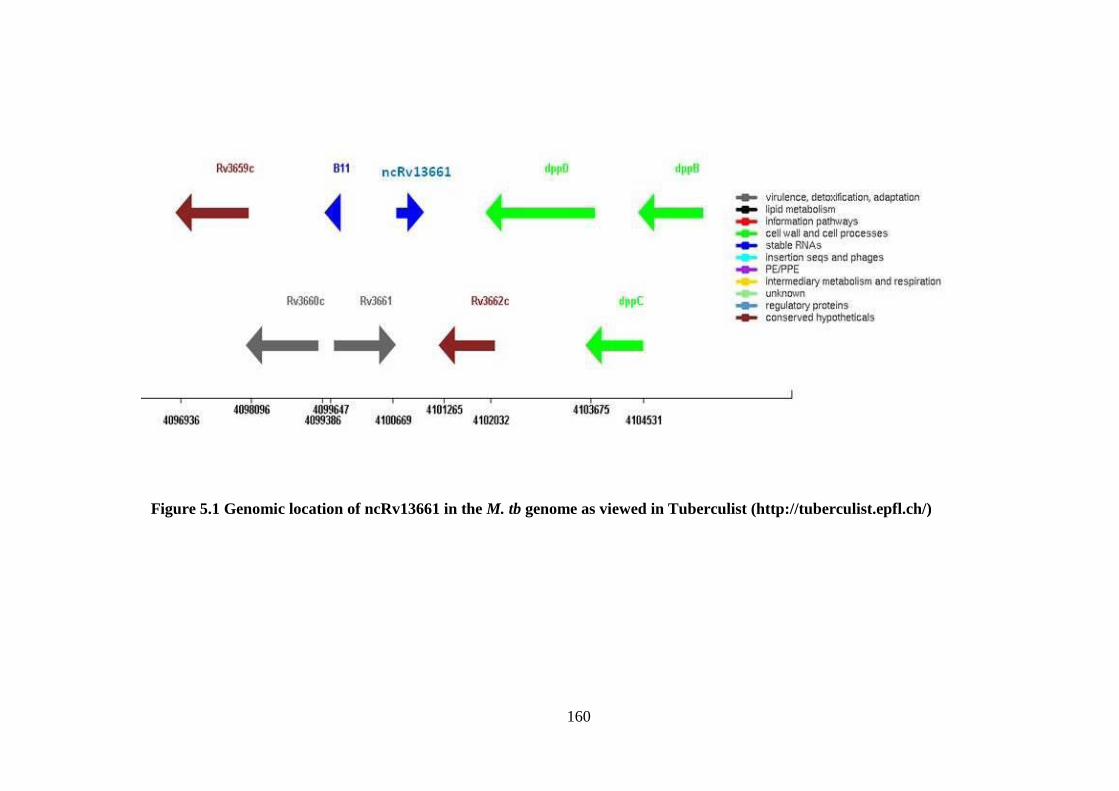
160
Figure 5.1 Genomic location of ncRv13661 in the M. tb genome as viewed in Tuberculist (http://tuberculist.epfl.ch/)

161
E. coli 6S RNA was the first sRNA shown to inhibit transcription by binding
directly to the housekeeping holoenzyme form of RNAP. It is ubiquitously
expressed although it is most abundant in stationary phase. No homologue for
6S RNA has been found in M. tb. Structural analysis of ncRv13661 revealed
some similarity to the canonical 6S RNA, but failed to match the criteria of a
genuine 6S homologue [214]. Ms1, the corresponding sequence in M.
smegmatis, was initially identified in a bioinformatic screen for 6S RNA but was
also found to lack key structural characteristics of 6S RNA [214]. Figure 5.2
shows the predicted secondary structures of the M. tb sRNA alongside 6S RNA
from E. coli for comparison. During the preparation of this thesis, Ms1 was
reported to interact with the RNAP core enzyme [215]. This is in contrast to the
conventional binding of 6S RNA to the σ70 holoenzyme that has been observed
in other bacteria [132]. These findings suggest that ncRv13661 may have a
functional role related to that of 6S RNA.
Over expression of ncRv13661 in M. tb during exponential phase, resulted in a
small but significant growth defect [3]. Transcriptional profiling identified down
regulation of a panel of genes including those encoding key methylcitrate cycle
enzymes PrpC, PrpD and Icl1. The methylcitrate cycle plays an important role in
preventing accumulation of toxic intermediates generated during -oxidation of
odd chain fatty acids and growth on cholesterol [216]. The down regulation of
these genes suggests that ncRv13661 may be involved in control of lipid
metabolism in M. tb.

162
Figure 5.2 Structural comparisons of the highly expressed RNAs
Predicted structure ncRv13661 compared to the canonical 6S RNA structure. Both
RNAs are long double-stranded hairpins. However, ncRv13661 has one central
bubble that is pinched whereas 6S RNA contains two large central bubbles.

163
5.2 Hypothesis and specific aims
The abundance of ncRv13661 suggests that rather than base-pairing with
specific target mRNAs, it may be performing a regulatory role in conjunction
with the major machinery of the cell such as the ribosome or RNAP. Initial
transcriptional profiling of an over expressing strain suggests that ncRv13661
may function in the regulation of lipid metabolism. To test the hypothesis that it
performs a role resembling that of 6S RNA in transcriptional reprogramming
during transition to a non-replicating state, ncRv13661 was assessed for
potential interactions with major protein complexes and effects on cell viability
and gene expression were characterised in a strain from which ncRv13661 had
been deleted.
Results
5.3 Expression of ncRv13661
The abundance of ncRv13661 during exponential growth is approximately 2%
that of 16S ribosomal RNA when measured by qRT-PCR. This increased to 20-
30% of rRNA in stationary phase and in response to starvation. In a mouse
infection model, the level of ncRv13661 was found to be equivalent to that of
ribosomal RNA at a three-week time point (Figure 5.3). Over expression of
ncRv13661 was measured to be 25% that of rRNA during exponential phase in
7H9 media.

164
Figure 5.3 Expression levels of ncRv13661 in M. tb
ncRv13661 expression levels were measured using qRT-PCR, in each instance
levels are expressed relative to 16S rRNA control. RNA was isolated from
exponential phase, stationary phase (one week after OD600 = 1.0), 96 hours
starvation in PBS and from M. tb in the lungs of three week infected mice. Data
represents the mean and standard deviations of three biological replicates for each
condition. Expression levels differ significantly from each other for each growth
phase as tested by One-way ANOVA.
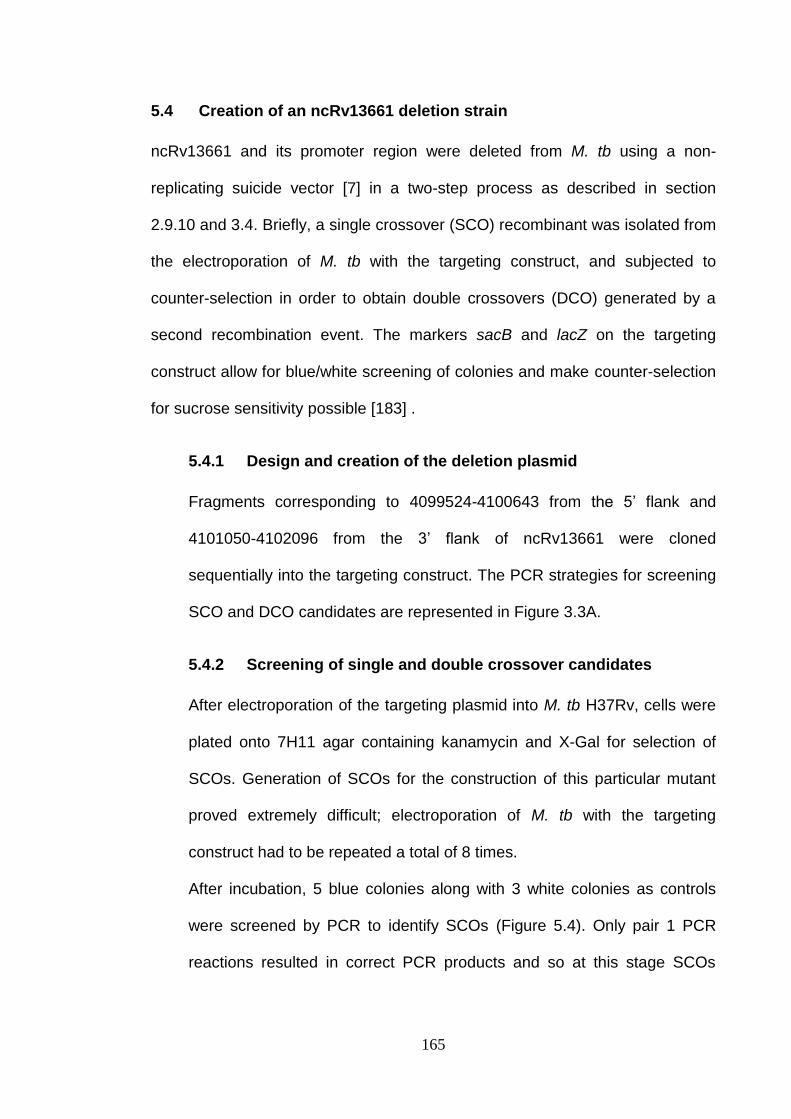
165
5.4 Creation of an ncRv13661 deletion strain
ncRv13661 and its promoter region were deleted from M. tb using a non-
replicating suicide vector [7] in a two-step process as described in section
2.9.10 and 3.4. Briefly, a single crossover (SCO) recombinant was isolated from
the electroporation of M. tb with the targeting construct, and subjected to
counter-selection in order to obtain double crossovers (DCO) generated by a
second recombination event. The markers sacB and lacZ on the targeting
construct allow for blue/white screening of colonies and make counter-selection
for sucrose sensitivity possible [183] .
5.4.1 Design and creation of the deletion plasmid
Fragments corresponding to 4099524-4100643 from the 5’ flank and
4101050-4102096 from the 3’ flank of ncRv13661 were cloned
sequentially into the targeting construct. The PCR strategies for screening
SCO and DCO candidates are represented in Figure 3.3A.
5.4.2 Screening of single and double crossover candidates
After electroporation of the targeting plasmid into M. tb H37Rv, cells were
plated onto 7H11 agar containing kanamycin and X-Gal for selection of
SCOs. Generation of SCOs for the construction of this particular mutant
proved extremely difficult; electroporation of M. tb with the targeting
construct had to be repeated a total of 8 times.
After incubation, 5 blue colonies along with 3 white colonies as controls
were screened by PCR to identify SCOs (Figure 5.4). Only pair 1 PCR
reactions resulted in correct PCR products and so at this stage SCOs

166
could not be distinguished from random integrations, and all potential
candidates were taken to the next stage of selection.
SCOs 1 to 5 were plated onto non-selective 7H11 for the second
recombination event to occur. After plating on selective media, four of the
SCO parents generated potential DCOs that were white and kanamycin
sensitive. Five colonies of potential DCOs from each SCO parent were
screened by PCR amplification and clone 3.21 was characterised by
whole genome sequencing.
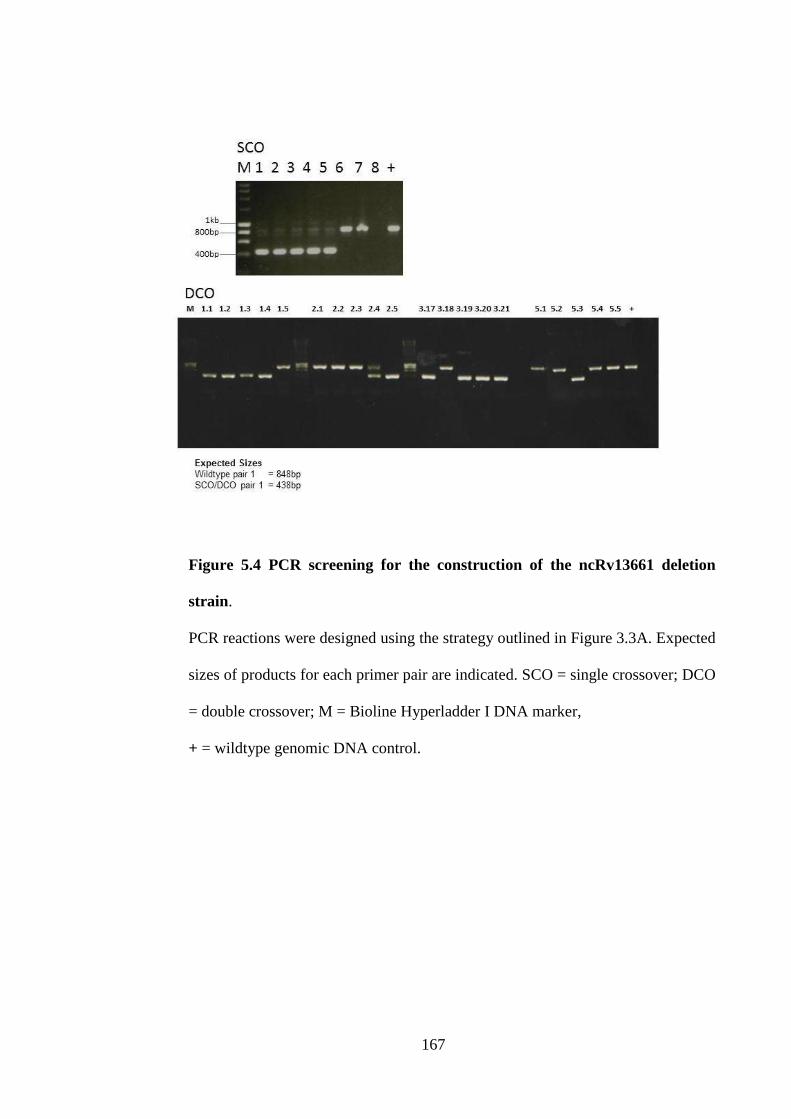
167
Figure 5.4 PCR screening for the construction of the ncRv13661 deletion
strain.
PCR reactions were designed using the strategy outlined in Figure 3.3A. Expected
sizes of products for each primer pair are indicated. SCO = single crossover; DCO
= double crossover; M = Bioline Hyperladder I DNA marker,
+ = wildtype genomic DNA control.

168
5.4.3 Whole genome sequencing of DCO 3.21
High quality genomic DNA was extracted from the DCO 3.21 and from the
parental H37Rv strain to confirm the deletion and to identify any possible
background mutations. Sequencing libraries were prepared from both strains
and sequenced by the HTS sequencing facility at NIMR. The resulting reads
were aligned to the H37Rv reference genome by Graham Rose (NIMR)
(Appendix III). SNPs in repeat regions such as PE_PGRS were discarded due
to unreliability along with 2 SNPs created by deletion of the sRNA. This left
seven SNPs which mapped to various regions in the genome. Three SNPs
mapped to Rv2940c (mycocerosic acid synthase, mas); two were synonymous
and one was nonsynonymous, causing a change from TTC to TTT at position
3278390 and two changes at positions 3278390 and 3278391 resulting in a
change from GTG to GGC. Shotgun proteome analysis of DCO 3.21 by Olga
Schubert (ETH Zurich) recorded a 6-fold reduction in Mas (p-value 0.0243 by t
test), suggesting that the mutation had a deleterious effect on protein stability.
Mas is a polyketide synthase that is responsible for the synthesis of methyl-
branched lipids, mycocerosates [217, 218], which are esterified with phthiocerol
to generate PDIMs, complex cell wall lipids implicated in the virulence of M. tb
[219-222]. Spontaneous PDIM mutations have previously been shown to confer
an in vitro growth advantage for H37Rv [223]. Four other SNPs were identified
in intergenic regions of the genome with two mapping upstream of a second
polyketide synthase, pks3, at positions 1313338 and 1313339, though there
was no detectable effect on the level of pks3 expression measured by
microarray profiling (not shown).

169
SCOs 1-3 and DCO’s 1.1-1.4, 2.5, 3.17-3.21 and 5.2 were checked for
mutations in mas by PCR amplification of a 2kb region surrounding the 3
previously identified SNPs. Consequently these PCR products were sequenced
for screening of mutations. It was found that SCO 1 and DCO 1.1, 1.3 and 1.4
were the only clones without any mas mutations present. As this method only
identifies SNPs in a small region of mas and this screening does not identify
other possible regions of mutation further sequencing was required. For this
reason whole genome sequencing was performed on DCOs 1.1, 1.3 and 1.4.
5.4.4 Whole genome sequencing of DCO 1.1-1.4
High quality genomic DNA was extracted from the DCOs 1.1, 1.3 and 1.4 along
with the parental strain to identify any possible background mutations.
Sequencing libraries were prepared from all strains and sequenced by the HTS
sequencing facility at NIMR. The resulting reads were aligned to the H37Rv
reference genome by Teresa Cortes (NIMR) Table 5.1. As with the previous
analysis, the SNPs identified in repeat regions were discarded along with 2
SNPs created by deletion of the sRNA.
This left 1 non synonymous SNP in Rv2692c (a glycosyl transferase) that was
present in all strains and a synonymous SNP in Rv3661 that was present in
DCOs 1.1 and 1.3 only. Due to DCO 1.4 containing only 1 SNP in Rv2692c this
clone was selected for further investigation and electroporated with the
complementing plasmid. DCO 1.4 was not observed to result in any difference
in expression of Rv2692c on the transcript level (Tables 5.2 and 5.3) or protein
level Table 5.7. The possibility that this SNP could affect enzyme function
however cannot be excluded. Therefore for all experiments the complement
was included for comparison and confirmation of ncRv13661 specific effects.

170
Table 5.1 SNP analysis of ΔncRv13661 DCOs 1.1, 1.3 and 1.4.
SNP position H37Rv 1_1 1_3 1_4 Gene Synonym Orientation Change Type annotation
336718 A C M M Rv0279c
PE_PGRS4 - F786V nonsynonymous
SNV
PE-PGRS
467501 T G G G Rv0388c PPE9 - S167S synonymous
SNV
PPE
3314422 G A A A Rv2962c - - T234I nonsynonymous
SNV
glycosyl
transferase
3934733 G G C G Rv3508 PE_PGRS54 + PE-PGRS
3934734 G G A G Rv3508 PE_PGRS54 + PE-PGRS
3949383 C G C C Rv3514 PE_PGRS57 + A1197G nonsynonymous
SNV
PE-PGRS
4100432 T A A T Rv3661 - + T262T synonymous
SNV
hypothetical
protein

171
5.5 Transcriptional profiling of DCO 1.4
The transcription profile of ΔncRv13661 DCO 1.4 in exponential culture
was compared to the wildtype parent by oligonucleotide microarray
analysis using Cy dye-labelled cDNA. 78 probes, corresponding to 48
genes, were identified as being differentially expressed by greater than 2-
fold between wildtype and ΔncRv13661 (Tables 5.2 and 5.3).
The 23 transcripts present at higher abundance in the absence of
ncRv13661 including the methylcitrate cycle genes prpC and prpD that
were previously found at decreased abundance when ncRv13661 was
over expressed during exponential growth. Six genes from the arginine
biosynthesis operon (Rv1652-Rv1659) were also up regulated in
ΔncRv13661. The arginine operon is regulated by the ArgR repressor
[224] and is markedly down regulated in the starvation model. Rv1813c
which is known to be in both the MprAB and DosRST regulons was found
to be up regulated [225]. Five genes from the mas/pks15 locus (Rv2940 to
Rv2947c) were up regulated in the knockout, though conversely ppsD
(Rv2934) was down regulated. Other down regulated genes included the
mmpSL5 transporter and the associated transcriptional regulator Rv0678
[226]. qRT-PCR validation of the microarrays for the highest ranking
transcripts led to the observation that only the up regulated genes could
be confirmed and generally complemented (Table 5.2). This pattern of
expression would be in agreement with only down regulation observed for
the over expression of ncRv13661. A comparison of the over expression
and deletion microarrays can be found in Figure 5.5.

172
Gene Gene Name FC Δ/WT
Average of
probes
p-value Fold change
by qRT-PCR
Δ/WT
Fold Change
by qRT-PCR
Comp/WT
Rv1130 prpD 2.7 0.009 5.8 2.3
Rv1131 prpC 2.7 0.018 3.6 1.6
Rv2931 ppsA 2.4 0.011 2.6 1.2
Rv1813c - 2.3 0.016 3.1 1.4
Rv2948c fadD22 2.3 0.007 3 1.3
Rv3919c gidB 2.3 0.01
Rv1656 argF 2.2 0.007
Rv1657 argR 2.2 0.004
Rv2949c - 2.2 0.005
Rv3920c - 2.2 0.011
TBFG_13135
- 2.2 0.017
Rv1047 - 2.1 0.012
Rv1653 argJ 2.1 0.007
Rv1654 argB 2.1 0.005
Rv1655 argD 2.1 0.007
Rv1658 argG 2.1 0.009
Rv2189c - 2.1 0.005
Rv2632 ppsB 2.1 0.009
Rv2947c pks15 2.1 0.016
Rv2666 - 2 0.032
Rv2782c - 2 0.007
Rv2940c Mas 2 0.002
Table 5.2 Genes up regulated > 2-fold upon deletion of ncRv13661 in
exponential phase

173
Gene Gene Name FC Δ /WT
Average of
probes
p-value Fold change by
qRT-PCR
Δ /WT
Fold Change
by qRT-PCR
Comp/WT
MT3762 ncRv13661 147.5 <0.001
Rv1935c echA13 11.9 0.005 1.1
Rv2598 - 5.6 0.005 1.1
Rv0676c mmpL5 2.5 0.007 1.9 2.2
Rv0678 2.5 0.009 1.5 2.3
Rv2428 ahpC 2.5 0.005 2.2 1.9
Rv2934 ppsD 2.4 0.006 1.1 0.6
Rv0677c mmpS5 2.3 0.005
Rv1592c - 2.3 0.005 2.0 3.0
Rv2913c - 2.3 0.005
MT1627 2.2 0.006
Rv1039c ppe15 2.2 0.02
Rv1040c PE8 2.2 0.023
Rv2429 ahpD 2.2 0.005
Rv0096 PPE1 2.1 0.009
Rv0410c pknG 2.1 0.007
Rv1218c - 2.1 0.004
Rv2244 acpM 2.1 0.007
Rv2386c Mbtl 2.1 0.014
Rv2780 Ald 2.1 0.034
Rv3534c hsaF 2.1 0.007
Rv0097 2 0.007
Rv0440 groL2 2 0.011
Table 5.3 Genes down regulated > 2-fold upon deletion of ncRv13661 in
exponential phase

174
Figure 5.5 Venn diagram representing the common transcriptional changes
between over expression and deletion of ncRv13661 during growth on 7H9.

175
5.6 Transcriptional profiling during growth on propionate
The concordance between down regulation of methylcitrate cycle genes in
response to over expression of ncRv13661 and up regulation in the
deletion strain could reflect a direct effect of the sRNA on the individual
mRNA transcripts or an indirect effect mediated by a metabolic change.
The prpDC operon (Rv1130-1131) is subject to conventional regulation by
the adjacent Rv1129c transcription factor (which is in turn regulated by
SigE) and is induced during growth on propionate. To determine whether
growth on propionate would override control by the sRNA, the effect of
ncRv13661 over expression was assessed by microarray profiling of
propionate cultures.
In total 114 probes on the array were found to be differentially expressed
between the vector control and the over expression strain with a fold
change of 2.5 or greater. This amounted to a change in the mRNA levels
of 78 genes (Appendix V). As previously observed during growth on
glycerol/glucose [3], the majority of the probes were found to be down
regulated in the over expression strain (Appendix V). 29 mRNA were
found to overlap with the previous published over expression of
ncRv13661 in 7H9 (Figure 5.6). Surprisingly neither prpDC nor icl1 was
present in the list of genes with altered expression, as ncRv13661 was
previously found to down regulate the genes involved in the methyl citrate
cycle. Both assays did identify among others down regulation for sigB, G
and sigE along with the anti-sigma factor E (rseA) and Rv1406 (fmt)
(Appendix V). In addition there were a large number of genes that were
down regulated involved in DNA replication and repair. As the overlap
176
between these arrays is not extensive, it would suggest that ncRv13661 is
not targeting a specific set of mRNAs through a standard base pairing
mechanism.
In contrast to growth in glycerol/glucose, 41 probes (25 genes) were up
regulated when ncRv13661 was over expressed in propionate cultures
(Table 5.3). Several of the up regulated genes overlapped with genes that
were down regulated in the knockout. In addition to mmpSL5, these
include a second transporter operon, Rv1216c-Rv1218c, that is regulated
by the adjacent transcription factor encoded by Rv1219c (raaS) [227]. Up
regulation of the raaS operon is an indication of intracellular accumulation
of fatty acyl-CoA molecules [227].

177
Figure 5.6 Venn diagram representing the overlapping transcript changes between
growth on 7H9 and growth on propionate for the ncRv13661 over expression.

178
Gene Gene Name FC OE/Vector
Average of probes
p-value qRT-PCR Fold
Change
MT3630 ncRv13528 2.2 0.049
MT3762 ncRv13661 35.2 0.006 30
Rv0118c oxcA 2.7 0.006
Rv0166 fadD5 2.3 0.031
Rv0167 yrbE1A 2.2 0.028
Rv0169 mce1A 2.2 0.046
Rv0280 PPE3 2.3 0.017
Rv0631c recC 5.9 0.048
Rv0676c mmpL5 2.3 0.024
Rv0677c mmpS5 2.5 0.017
Rv0678 - 2.5 0.006
Rv0696 - 2.1 0.037
Rv0697 - 2.0 0.008
Rv0867c rpfA 3.7 0.022
Rv0885 - 2.2 0.013
Rv1216c - 2.6 0.014
Rv1217c - 3.4 0.016 4.7
Rv1218c - 2.8 0.009 3.5
Rv1219c raaS 2.7 0.009 3.4
Rv1856c - 2.2 0.017
Rv2035 - 2.1 0.018
Rv2406c - 2.1 0.014
Rv2485c lipQ 2.3 0.014
Rv2780 ald 2.2 0.016
Rv3197A whiB7 2.1 0.031
Table 5.4 Genes up regulated in the over expression strain > 2 fold during
growth on propionate

179
5.7 Transcriptional profiling during stationary phase
The abundance of ncRv13661 increases 10-fold during transition to
stationary phase and it might be anticipated that sRNA deletion would
result in a more extensive transcriptional phenotype. To address this,
microarrays were performed to see if this was the case. In fact, only 40
genes were differentially expressed in a comparison of stationary phase
ΔncRv13661 and wildtype cultures (Tables 5.5 and 5.6). Only two genes
were differentially regulated in both stationary phase and exponential
culture; Rv1935 (echA13) and Rv2598. Both genes registered a large fold-
change that could not be confirmed by qRT-PCR due to very low baseline
expression. Two genes that were down regulated in ΔncRv13661 –
Rv0631c (recC) and Rv0867c (rpfA) – were reciprocally up regulated
when ncRv13661 was over expressed (Table 5.4). The highest ranking
changes were selected for confirmation by qRT-PCR and fold changes
shown in Table 5.5. Fold changes observed by qRT-PCR were not
significant for the majority of genes and were low in comparison to those
gained in the microarray due to a low baseline expression. Rv2140c and
Rv0721 (rpsE) were found to be significantly different by t-test but could
not be complemented. Again this pattern is inconsistent with a model in
which ncRv13661 targets a discrete set of mRNAs.

180
Gene Gene Name FC Δ/WT
Average of probes
p value Fold change by
qRT-PCR
Δ/WT
Fold change by
qRT-PCR
Comp/WT
MT3762 ncRv13661 206.4 0.006
Rv0086 hycQ 2.5 0.034
Rv0270 fadD2 3.6 0.006 1.87 0.4
Rv0631c recC 3.4 0.034
Rv0721 rpsE 2.2 0.017 1.4 2.4
Rv0845 - 2.2 0.026
Rv0860 fadB 3.4 0.016
Rv0867c rpfA 12.8 0.01 1.25 0.8
Rv0940c - 2 0.034
Rv0941c - 2.4 0.018
Rv0942 - 2.2 0.025
Rv1252c lprE 17 0.006 1.2 0.4
Rv1284 - 2.1 0.019
Rv1446c opcA 2.2 0.035
Rv1572c - 2.5 0.037
Rv1870c - 2.3 0.035
Rv1935c echA13 19.2 0.021
Rv1937 - 2.9 0.036
Rv2140c TB18.6 3.4 0.008 2.8 4.8
Rv2342 - 29.6 0.001 1.7 0.4
Rv2598 - 79.2 0.012
Rv2692 ceoC 6.6 0.006 1.3 1.2
Rv2725c hflX 3.6 0.036 1.4 0.4
Rv2884 - 3.1 >0.001 2.72 0.1
Rv3110 moaB1 2.2 0.033
Rv3146 nuoB 3.2 0.018
Rv3389c htdY 2.2 0.043
Rv3662c - 2.2 0.03
Table 5.5 Genes down regulated > 2-fold upon deletion of ncRv13661 in
stationary phase

181
Gene Gene Name FC Δ/WT Average of
probes
p value
Rv0289 espG3 2.1 0.012
Rv0290 eccD3 2.7 0.048
Rv0791c - 2.2 0.018
Rv1255c - 2.2 0.03
Rv1256c cyp130 3.2 0.024
Rv2053c fxsA 2.1 0.011
Rv2601A vapB41 2.3 0.022
Rv2602 vapC41 2.3 0.013
Rv2710 sigB 2.1 0.029
Rv3051c nrdE 2 0.016
TBFG_11168
Rv1146 3.3 0.007
Table 5.6 Genes up regulated > 2-fold upon deletion of ncRv13661 in
stationary phase
182
5.8 Proteomic analysis of deletion strain during growth on 7H9
Proteomic analysis of whole cell extracts was analysed from exponential
phase cultures of the deletion strain, complement and H37Rv in order to
ascertain if the changes in the transcriptional profile resulted in altered
translation. Only 4 proteins were found to be differentially expressed
between H37Rv and ΔncRv13661. Up regulation of prpD in the deletion
strain, along with 3 proteins from the transcriptional unit Rv2930-papA5
were found to be down regulated in the deletion strain. None of these
changes could be complemented meaning that either a mutation existed in
the deletion strain, or the replacement of ncRv13661 on a plasmid was
insufficient to allow full complementation. This is demonstrated by the
complementation that was achieved on the transcriptional level for prpD.

183
Protein ΔncRv13661/
H37Rv
Fold Change
(log2)
Comp/
H37Rv
Fold Change
(log2)
ΔncRv13661/
H37Rv
P value
Comp/H37Rv
P value
Rv1130- prpD 3.54 3.67 0.005 0.004
Rv2939- papA5 -1.06 -1.03 0.001 0.001
Rv2935- ppsE -1.90 -1.68 <0.001 <0.001
Rv2933- ppsC -3.06 -2.68 <0.001 <0.001
Table 5.7 Proteins differentially expressed in ΔncRv13661
Whole cell extracts were prepared and analysed by mass spectrometry and fold
changes of deletion strain against either H37Rv or complement was generated by
analysis with MSstats.

184
5.9 Proteomic analysis of over expression during growth on 7H9
Due to the lack of translational effects in the deletion strain it was of
interest to ascertain the translational effects of over expression. Over
expression of ncRv13661 in exponential phase leads to a massive down
regulation of genes involved in exponential growth [3]. It was hypothesised
that the transcriptional changes would be reflected in the proteome
resulting in a large number of proteins being less abundant in the over
expression strain.
Whole cell extracts were analysed by shotgun proteomics and significance
was set at a fold change of 0.75 (log2 scale) with a p value of <0.01.
Twenty proteins were differentially expressed between vector and over
expression. As expected, more proteins were down regulated than up
regulated with only four proteins being up regulated; Rv2576c, Rv3842c
(glpQ1), Rv3241c and Rv1865c. Of these, Rv3241c was up regulated 1.26
fold and has been identified as a hibernation factor in M. smegmatis
named RafS (for ribosome associated factor during stasis) [228]. Of the
down regulated proteins, half belong to the classification information
pathways. There was a large representative of genes involved in DNA
repair including Rv2592c (ruvB), Rv1638 (uvrA) and Rv2737c (recA), with
recA being one of the most down regulated genes.

185
Protein Over
expression/vector
Fold Change
(log2)
Over
expression/vector
p value
Rv2576c 1.51 0.003
Rv3842c-glpQ1 1.33 0.002
Rv3241c 1.26 <0.001
Rv1865c 1.09 0.005
Table 5.8 Proteins up regulated in the ncRv13661 over expression
Whole cell extracts were prepared and analysed by mass spectrometry and fold
changes of over expression against vector control were generated by analysis with
MSstats.

186
Protein Over
expression/vector
Fold Change (log2)
Over
expression/vector
p value
Rv1638-uvrA -0.75 <0.001
Rv0412c -0.79 0.005
Rv2790c-ltp1 -0.82 0.001
Rv3161c -0.84 0.004
Rv0182c-sigG -0.84 0.001
Rv2592c-ruvB -0.86 0.001
Rv3888c -0.91 <0.001
Rv1316-ogt -0.92 <0.001
Rv1279 -0.95 <0.001
Rv1833c -0.98 0.004
Rv0404-
fadD30
-1.0 <0.001
Rv1406-fmt -1.06 <0.001
Rv1527c-pks5 -1.07 <0.001
Rv2737c-recA -1.23 <0.001
Rv0263c -1.4 0.004
Table 5.9 Proteins down regulated in the ncRv13661 over expression
Whole cell extracts were prepared and analysed by mass spectrometry and fold
changes of over expression against vector control were generated by analysis with
MSstats.
187
5.10 Mechanism of regulation by ncRv13661
Transcriptional profiling of ncRv13661 deletion and over expression
strains suggest that the sRNA has a pleiotropic effect on up- and down
regulation of multiple mRNA transcripts and that the particular set of
transcripts varies during different phases of growth and during growth on
different carbon sources. Together with the stoichiometric argument that
ncRv13661 is present at a vastly higher copy number than the regulated
transcripts, data from transcription profiling are consistent with a model in
which ncRv13661 acts in conjunction with some central cellular machinery
rather than as a conventional mRNA base pairing sRNA. To test this
hypothesis, density gradient sedimentation was used to screen for
evidence of interactions between ncRv13661 and protein complexes.
Hnilicova et al have recently reported that Ms1, the M. smegmatis
homologue of ncRv13661, co migrates with RNA polymerase during
density gradient fractionation, suggesting a parallel with 6S RNA [215].
Whole cell extracts from stationary phase cultures of M. tb were
fractionated by centrifugation in 5-35% sucrose gradients at 30,000 rpm
for 16.5 hours and ncRv13661 and RNAP were localised in resulting
fractions by Northern blot and Western blot staining (Figure 5.7). Both
molecules migrated as distinct peaks in the upper half of the gradient but,
in contrast to the report of Hnilicova et al, the two peaks were not
coincident; with ncRv13661 reaching a maximum in fraction 10, just above
RNAP in fractions 11 and 12.

188
Two peaks for RpoB were observed on the western blot and this could
reflect the different sedimentation rates of both free RpoB and that in
complex with the rest of RNAP. It is also possible that there is more than
one form of RNAP present, with core and holoenzyme having different
sedimentation patterns.
Alternatively, if ncRv13661 does not interact with RNAP it is possible that
ncRv13661 interacts with some other multimolecular machinery within the
cell; other abundant sRNAs interact with ribosomes (ssrA), signal
recognition particle (ffs) and RNase P (rnpB), for example. In light of the
transcriptional responses described above, it would be attractive to
envisage a role in multienzyme complexes. To test this hypothesis,
ncRv13661 fractions from the density gradient were screened for other
major protein components. A major band was visualised by Coomassie
staining (Figure 5.8) and characterised by mass spectrometry; it was
identified as the alpha-crystallin chaperone HspX (Rv2031c). To test the
possibility that ncRv13661 forms a complex with HspX, density gradient
fractionation was repeated using an extract from the ΔncRv13661 strain.
The migration pattern of HspX was identical in the absence of the sRNA,
suggesting that the native alpha-crystallin multimer [229] is fortuitously co-
sedimenting with ncRv13661 rather than forming a protein: RNA complex.

189
Figure 5.7 Sedimentation of ncRv13661 and RNAP using sucrose gradient
ultracentrifugation shows ncRv13661 does not specifically migrate with
intact RNAP
Following sucrose gradient ultracentrifugation of whole cell extracts, the gradient
was fractionated into 600µl fractions. Each fraction was split and RNA and
protein were isolated. Northern blots with 33P were used to detect ncRv13661 and
5S (middle and top panel), while Western blots were used to detect α and β
subunits of RNAP (bottom panel). ncRv13661 Appears as multiple bands on the
northern blot indicating extensive processing and/or degradation

190
Figure 5.8 Sedimentation of ncRv13661 and M. tb proteins using sucrose
gradient ultracentrifugation
Following sucrose gradient ultracentrifugation of whole cell extracts, the gradient
was fractionated into 600µl fractions. Each fraction was split and RNA and
protein were isolated. Northern blots with 33P were used to detect ncRv13661.
Isolated protein was run on an SDS-PAGE with a cell free extract control
alongside dual precision marker plus before staining using Coomassie.

191
5.11 Role of ncRv13661 in cell viability
It was previously shown that over expression of ncRv13661 resulted in a
decreased growth rate for H37Rv in regular 7H9 culture medium [3]. In
contrast, deletion of ncRv13661 had no detectable effect on exponential
growth. To test whether loss of ncRv13661 had an effect on stationary
phase survival of M. tb, cultures of wild type and ΔncRv13661 were
maintained over a six-week period, diluted into fresh medium and allowed
to re-grow. No difference was observed in the pattern of re-growth (Figure
5.9).

192
Figure 5.9 Recovery of ΔncRv13661 after six weeks in stationary phase.
In vitro growth curves of wildtype M. tb H37Rv, the ΔncRv13661 deletion strain
and the complement using standard 7H9 media after six weeks in stationary
phase. The data represents the averages and standard deviations of three biological
replicates. There was no statistical difference between the growth of the strains as
assessed by linear regression analysis.

193
5.12 Effects of ncRv13661 deletion on in vivo survival
It was of interest to determine whether deletion of ncRv13661 had an
effect on the ability of M. tb to grow in macrophages or in a mouse model.
A series of experiments to test this were set up with the original DCO 3.21
prior to identification of the mas mutation. The results of these
experiments are shown in Appendix VI; no differences were observed in
CFUs in either model. While these experiments are clearly flawed by the
use of a PDIM mutant, we reasoned that any effect of this mutation was
likely to reduce rather than enhance virulence, and that the negative result
was strong evidence that deletion of ncRv13661 in a clean background
was unlikely to impair virulence. For this reason we decided not to repeat
the experiments with DCO 1.4. It is however possible that modulation of
the lipid profiles could result in an increase in virulence and/or a change in
the pathology of the ncRv13661 deletion strain as has been observed for
other pathogen deletion strains [230, 231]. Therefore, if the experiment
were to be repeated in the future it would be important to monitor the
pathology of the lungs and spleen.
5.13 Discussion
Initial functional characterisation of the sRNA ncRv13661 by over
expression, showed a transcriptional response very similar to that of a
persister model due to the observation that a large number of genes
involved in exponential growth were down regulated [3].
The current study identified transcriptional responses implicating
ncRv13661 in long-term mycobacterial survival in agreement with previous

194
work on the over expression strain. Transcriptomic analysis of the over
expression strain would indicate that ncRv13661 contributes to the change
in carbon flux associated with transition from replicating to non-replicating
culture as seen by Shi and colleagues [232]. It is proposed that
ncRv13661 blocks fatty acid degradation for energy and growth promotion
and diverts carbon units to form complex storage lipids. When this is
activated by over expression in exponential phase, propionate is driven
away from the methylcitrate cycle by prpCD down regulation [3] which
results in the accumulation of fatty acyl-CoAs. This accumulation of acyl-
CoAs causes the activation of raaS. RaaS is a transcriptional regulator
that has been shown to be important in the long-term survival of M. tb
[227] and has been identified along with its regulon more than once in this
study. RaaS has been shown to improve mycobacterial survival after
treatment with ethambutol [227], a drug that targets cell wall biosynthesis.
The ATP-dependent efflux pump Rv1218c under the control of the
repressor RaaS was found to be up regulated in the over expression strain
during growth on propionate and co-ordinately down regulated in the
deletion strain indicating that ncRv13661 is involved in persistence
through regulation of the cell wall constituents. The repressor RaaS has
been shown to use the acyl-CoA oleoyl-CoA as a ligand [227] although it
is possible that longer acyl-coAs or complex lipids which contain fatty
acids could fit into the binding pocket affecting the DNA binding activity of
RaaS. Mycobacteria are able to produce and export many lipids containing
fatty acids [233, 234], and interestingly DrrC which may be regulated by
RaaS has been implicated in the export of PDIM’s in M. tb.
195
The mycolic acid containing PDIM’s are an important constituent of the M.
tb cell envelope. The complex structure of the cell envelope protects
against degradation by host enzymes and the action of antibiotics, and
toxic molecules produced by the host [235]. The mycobacterial cell
envelope is lipid rich and includes the major lipid constituents the mycolic
acids [236]. In this study we demonstrated that ncRv13661 has been
shown to affect the expression of PDIM associated genes, ppsA-D. The
complementation of these changes was not always observed and genome
sequencing revealed that the first deletion strain obtained had mutations in
mas, undoubtedly affecting the PDIM profile in the strain. The second
mutant that was isolated, lacked mas mutations but possessed a mutation
in a glycosyl transferase which is involved in mycothiol biosynthesis. The
apparent role for ncRv13661 in the regulation of cell wall lipids added to
the SNPs identified make it difficult to isolate specific effects of deletion.
The lack of ncRv13661 could have resulted in compensatory mutations
occurring in the genome before the complementing plasmid could be
electroporated in. It is also possible that a ncRv13661 deletion strain could
only be obtained in a PDIM altered background. Loss of PDIM in
laboratory strains of M. tb is quite common and arise in the absence of
selection pressure, and so complementation is important for assessing
deletion specific effects [237]. It is of note however that other sRNA
deletion strains were made in parallel during this study using the same
electrocompetent cells and/or parental strain and none of those were
found to contain SNP’s involved in PDIM synthesis, indicating that this
could be a specific trait of the M. tb lacking ncRv13661.

196
Proteomic analysis of the over expression strain showed a down
regulation of proteins involved in DNA repair, with one of the most down
regulated proteins being Rv2737c (recA). In both M. tb and E. coli recA is
involved in homologous recombination and is controlled by the repressor
lexA [238]. LexA also regulates ruvAB (also identified as down regulated)
[239-241]. Interestingly lexA was shown to bind upstream of ncRv13661 in
a CHIP seq analysis of lexA binding sites [239]. In a target search for
mRNA regulated by ncRv13661 using TargetRNA2, recA was identified as
the top candidate for sRNA binding with predicted pairing at the 5’ end of
recA at nucleotides 3-18 [164]. This would be indicative of translation
repression of RecA by prevention of ribosome binding. Down regulation of
DNA damage repair mechanisms upon ncRv13661 deletion could suggest
that fewer lesions are being generated due to a slower rate of RNAP.
Sucrose gradient ultracentrifugation revealed that ncRv13661 did not co
migrate with intact RNAP contradicting the findings of Hnilicova and co-
workers. The deletion of ncRv13661 also did not result in an impaired
ability to recover from stationary phase further indicating that it does not
function in a 6S manner. The possibility exists however that ncRv13661
could interact with a subpopulation of RNAP. It is difficult to exclude the
possibility that ncRv13661 could interact with some particular form of
RNAP. The stoichiometry for RNAP core to ribosomes is approximately
1:1. RpoZ and sigma factors have half of that copy number and therefore if
ncRv13661 was interacting with a subpopulation of RNAP, it would only be
with ~10% of the copies making detection difficult. In contrast when 6S is
induced in late stationary phase the majority of Eσ70 is found in a complex

197
with 6S RNA [132, 137, 138]. When nutrient availability increases the
RNAP can then be recycled upon exit from stationary phase by the
generation of pRNAs ejecting 6S from the Eσ70 complex [136].
The ability to recommence growth after periods of non-replicating
persistence is not only mediated by interactions with RNAP but also by
interactions with the ribosome. Down regulation of translation without the
need for altering ribosomal numbers have great energy benefits for
bacteria. A hibernation-promoting factor rafS (Rv3241c) was identified as
being up regulated in the over expression strain and its homologue in M.
smegmatis (MSMEG_1878) has been shown to associate to the ribosome
during hypoxic and carbon starved stasis [228]. It is possible that
ncRv13661 could associate with Rv3241c to increase translation as a
mechanism for ribosome stabilisation. Importantly the expression
conditions of Rv3241c are also those known to induce the expression of
ncRv13661.
In addition to hibernation factors, the survival of M. tb during times of
nutrient deprivation is aided by mechanisms such as the stringent
response [134]. RelA and CarD act in the stringent response to down
regulate ribosomal RNA synthesis and RNA ribosomal protein genes to
conserve energy at times when nutrients are limiting [135]. The two
component system MprAB also allows the regulation of numerous stress
responsive genes [242]. When activated, MprAB regulates expression of
>200 genes, directly regulating sigma factors sigB and sigE, and the α-
crystallin-like gene acr2.

198
In addition to the potential mRNA base pairing interaction with recA, a
further role for ncRv13661 must exist. The high level of expression of
ncRv13661 during infection and stress conditions suggest that this sRNA
is performing a central function, expressed to a high level in preparation
for its regulatory requirement. It is possible that ncRv13661 is acting in a
stress response mechanism such as the stringent response by some as
yet unidentified mechanism.

199
6 Is ncRv12659 responsible for the starvation-induced signal
attributed to Rv2660c?
6.1 Introduction
ncRv12659 (originally termed MTS2048) was identified through the recent
study into the transcriptome of M. tb [3, 171]. It is encoded opposite the
hypothetical protein Rv2660c and flanked by a hypothetical protein and a
probable integrase Figure 6.1.
Rv2660c has been reported to be the most highly up regulated gene during
starvation using a PCR-based microarray [187]. In addition to this it has
also been reported to be up regulated in response to hypoxia-induced non-
replicating persistence, and the enduring hypoxic response [243, 244]. It is
envisaged that inclusion of antigens expressed by persisting populations in
vaccines will result in protection against reactivation of the disease.
H56 is a TB subunit vaccine currently under clinical trials [245]. It was
designed to include antigens that are associated with long-term infection
and it has been shown that the H56 vaccine gives the best protection of any
vaccine to date. H56 contains Rv2660c in addition to Ag85B and ESAT-6,
which are two antigens secreted in the acute phase of infection. The
increased efficacy of this vaccine over others is considered to be due to the
addition of the "latency-associated protein" Rv2660c.

200
Figure 6.1 Genomic position of sRNA ncRv12659 in the M. tb genome

201
6.2 Hypotheses and specific aims
Due to the overlapping of ncRv12659 with the Rv2660c locus we aimed to
characterise the sRNA and assess its contribution to the antigen in the
H56 vaccine. As a potential cis-encoded RNA it should function to regulate
the target for which it is antisense. Early work has suggested that the
starvation-induced signal attributed to Rv2660c arises from the plus strand
and not that of Rv2660c encoded on the minus strand (Figure 6.2).

202
Figure 6.2 RNA seq of the Rv2660c locus as viewed in the genome browser
Artemis.
The forward strand is represented in green and the antisense strand in red. The top
panel shows expression of ncRv12659 during exponential phase and the bottom
panel in stationary phase. Both growth phases lack any detectable expression of
Rv2660c on the opposite strand.

203
Results
6.3 Comparison of RNA sequencing profiles
Rv2660c was originally highlighted as the most up regulated transcript in
the microarray analysis of M. tb starved for 24 and 96 hours in PBS [187].
It was annotated as a hypothetical protein directly adjacent to a prophage
element termed PhiRv2. This prophage is one of two possessed by
H37Rv; it is inserted into the valU tRNA gene and is present in many
strains of M. tb. Some of the prophage genes of PhiRv2 including the
phage integrase Rv2659c, were also observed to be up regulated in the
starvation microarray study [187].
Expression from both strands was investigated by RNA seq profiling
comparing exponential growth and 24 hours starvation in PBS. Strand-
specific sequencing showed that transcription did indeed occur on the
forward strand and not the reverse strand where Rv2660c is annotated
Figure 6.2A. RNA seq library construction and bioinformatic analysis was
carried out by Teresa Cortes.
6.4 Mapping of transcript termini by 5’ and 3’ RACE
The sRNA transcript was mapped by 5’ and 3’ RACE as described in
section 2.7 in order to obtain the boundaries of the transcript and establish
origin of the sequence. 5’ RACE identified a transcriptional start site (TSS)
at position 2980911 which lies between the TSS of the integrase Rv2659c
and the boundary of the phage marked by the attR duplication. This was
confirmed by RNA sequencing based TSS mapping [246]. It was also
observed that the peak height of ncRv12659 was increased in response to
204
starvation as seen in the TSS mapping performed by Teresa Cortes
Figure 6.2B.
3’RACE identified seven 3’ ends from eight sequenced clones. The
primary co-ordinate was at position 2981083 which was identified twice.
Other termini were mapped to positions 2981010, 2981011, 2981026,
2981047, 2981055 and 2981077. However, this did not lead to the
identification of any canonical intrinsic terminators such as a stem loop
followed by a poly-U stretch. These co-ordinates establish the transcript as
being 173 nucleotides in length.
In order to confirm the transcript size, northern blotting was performed on
RNA extracted from both exponential and stationary phase cultures of M.
tb as described in section 2.6. Northern blot analysis revealed that the
largest prominent transcript was approximately 170 nucleotides in length
confirming the RACE results Figure 6.2C. Multiple smaller transcripts were
observed on the blot including a dominant one of 120 nucleotides in
stationary phase. Due to the identification of a single TSS these smaller
transcripts and also possibly the primary transcript are formed as a result
of processing at the post-transcriptional level.

205
Figure 6.2 Mapping of ncRv12659 in M. tb H37Rv (taken from [150])
A. Total RNA seq visualised in the genome browser Artemis. Forward strand
reads are blue and reverse strand reads are red. Yellow boxed section on the map
of the locus represents the valU tRNA insertion point. B. Transcription start site
(TSS) mapping shows the ncRv12659 transcript to begin 62 nucleotides
downstream of the TSS of Rv2659c. C. Northern blot analysis of ncRv12659.
Expression of ncRv12659 in RNA extracted from (e) exponential and (s)
stationary phase cultures of M. tb H37Rv using 20µg of total RNA.

206
Using these coordinates, the transcript ncRv12659 was revealed as
consisting of 60 nucleotides of PhiRv2 sequence, followed by 28
nucleotides of duplication from the 3’ end of the valU in addition to 85
nucleotides of host M. tb sequence, Figure 6.3. Further analysis of the
region reveals that the 61 bp sequence succeeding the sRNA is duplicated
at the attL end of PhiRv2, annotated as Rv2645.
Annotations in Tuberculist [247] are based on predictions and therefore a
search for alternative annotations in this region was undertaken. It was
found that in Mycobacterium canettii there is an open reading frame
annotated to the forward strand which has homology to part of a protein
sequence found in Salmonella typhimurium (VBIMycCan 278382_3386)
which is marked in blue in Figure 6.3.

207
Figure 6.3 Annotation of the ncRv12659 locus (taken from [155])
Sequence detail surrounding ncRv12659 which detail relevant annotations
referred to in the text. Repeat regions are shown in yellow. Locations of qRT-PCR
primers used in the study are indicated.

208
6.5 Expression of ncRv12659 in clinical isolates
Analysis of the genomic region of ncRv12659 revealed that the sRNA
consisted in part of phage sequence. This suggested that ncRv12659
would only be expressed in strains where the PhiRv2 region was present.
This also led to the hypothesis that in PhiRv2 positive strains the creation
of an antisense RNA may have led to the silencing of the complementary
strand Rv2660c and this repression could be relieved in PhiRv2 negative
strains.
To test these theories RNA profiles of five clinical isolates, along with the
PhiRv2 negative BCG vaccine strain were compared. N0072 and N0153
were selected as being PhiRv2 negative while N0031, N0052 and N0145
were selected as PhiRv2 positive, (a summary of which can be found in
Table6.1).

209
Strain Lineage PhiRv2 TSS RNAseq Northern qRT-PCR
M. tb H37Rv 4 + Y Y Y Y
M. tb N0031 2 + N (Y) N N
M. tb N0052 2 + N Y Y N
M. tb N0072 1 - N (Y) Y Y
M. tb N0145 2 + (Y) Y N N
M. tb N0153 1 - Y Y N N
M. bovis BCG 6 - (Y) (Y) Y N
Table 6.1 Strains used in this study (adapted from [155])
Y/N indicates yes/no for whether experimental methods were applied to that particular strain, with brackets indicating
that the experiment was performed but the data is not shown.

210
RNA seq profiles of the PhiRv2 positive strains showed no detectable
signals from the reverse strand Figure 6.4A. Interestingly, the N0052 strain
showed a higher level of expression of ncRv12659. The RNA seq profile of
the PhiRv2 negative strain N0153 showed that a low number of reads
which could be mapped to the region downstream of the tRNA valU Figure
6.4B.
Northern blots were performed in order to confirm the RNA seq findings,
probing for the 3’ end of the transcript to ensure that detection was
possible in both PhiRv2 positive and negative backgrounds, Figure 6.4C.
A faint signal of approximately 300 nucleotides was seen however in the
PhiRv2 negative background probably corresponding to the unprocessed
tRNA transcript. It was observed that there was no signal attributable to
Rv2660c in either a PhiRv2 positive or negative background

211
Figure 6.4 RNA profiling of the Rv2660c locus in M. tb clinical isolates (taken
from [150])
A. RNA seq profiles of PhiRv2 positive strains indicating no detectable
transcriptional signal of Rv2660c. Reads are normalised to the total number of
reads
B. RNA seq profiles of PhiRv2 negative isolate shows no Rv2660c
transcript even in the absence of a competing antisense ncRv12659 RNA. Only a
transcript initiated from the tRNA promoter is evidenced.
C. Northern blot analysis. 20 µg of total RNA from each isolate was used to
probe for ncRv12659 at the 3’ end to allow detection in the PhiRv2 negative
background.

212
6.6 Proteomic Analysis during starvation
Due to the original up regulation of Rv2660c observed during starvation,
protein extracts were analysed to determine expression at the proteomic
level. Both exponential and stationary phase cultures were prepared and
protein extracts made as described in section 2.8.6. This protocol was
optimised for selected reaction monitoring (SRM), which allows the
detection of low abundance proteins within mixed populations by mass
spectrometry [248]. SRM results in 70% of the proteome being detectable
within unfractionated cell lysates from liquid culture, with the detection limit
being below 10 copies per cell [249, 250].
With this level of sensitivity we failed to detect any of the three tryptic
peptides belonging to Rv2660c that are compatible with the analysis. It is
of note that synthetic peptides ran as controls could be detected further
indicating the absence of Rv2660c, Figure 6.5.
Taken together the absence of both a detectable transcript and
corresponding protein for the hypothetical Rv2660c from either
exponential or starved cultures, can only lead to the conclusion that the
previously observed starvation signal is attributable to the sRNA
ncRv12659 and has little or no contribution from Rv2660c.

213
Figure 6.5 SRM analysis of tryptic peptides from Rv2660c. (Taken from
[155])
SRM traces over 96 hours of a PBS starvation experiment show three tryptic
peptides from Rv2660c and a peptide derived from Rv3457c which acts as a
positive control.
The first column shows the SRM signals of the synthetic reference peptides
spiked into the first time point. The other three columns show the SRM signals in
samples without reference peptides spiked in. No signal for the targeted peptides
was detected.

214
6.7 Expression of ncRv12659 during mouse infection
Due to the success of the H56 vaccine it was important to assess the
expression of ncRv12659 during infection using the mouse model
employed in the H56 vaccine study [245].
Mice were infected with either the PhiRv2 positive H37Rv or the PhiRv2
negative N0072 for 31 days. Subsequently mice were sacrificed and RNA
extracted from the lung tissues and then assessed by qRT-PCR in a
comparison with in vitro cultures. Two primer sets were used in order to
distinguish between the PhiRv2 positive ncRv12659 RNA, and the PhiRv2
negative tRNA. These were termed the 5’ and 3’ amplicons.
The 5’ amplicon consisted of a forward primer within the PhiRv2 derived
part of the sequence and hence would only be detected in the presence of
the PhiRv2 region such as in H37Rv. The 3’ amplicon contains primers
downstream of the tRNA repeat and is therefore present in both PhiRv2
positive and negative strains Figure 6.6. The 5’ amplicon baseline was set
at the level of background detectable in the PhiRv2 negative background
as this level was considered noise in the absence of target sequence.
Expression of the 5’ amplicon was found to increase 50 fold in response to
starvation and 6 fold in response to infection when compared against
exponential phase levels in M. tb H37Rv, Figure 6.6.
The 3’ amplicon was observed at much lower levels than the 5’ amplicon
with a 2 fold reduction observed in comparison to the 5’amplicon for
H37Rv in exponential phase. During starvation and infection the 3’
amplicon dropped below baseline Figure 6.6. In the PhiRv2 negative
N0072 samples the 3’ amplicon was detected at very low levels in

215
exponential phase and reduced further under starvation conditions
indicating that read through from the tRNA operon has a minimal
contribution to the signals observed and importantly only the PhiRv2
promoter is induced by starvation. Due to the nature of the qRT-PCR
design, the amplicons observed also show that there is no detectable
Rv2660c transcript in the PhiRv2 negative N0072 strain during infection.

216
Figure 6.6 Expression of ncRv12659 during infection (taken from [150])
qRT-PCR was performed on RNA extracted from in vitro culture in exponential
and starvation phase in addition to extraction from the lung tissue of infected
mice. Both 5’ and 3’ amplicons were measured as depicted in the schematic. Data
represents the mean and standard deviation of three biological replicates
H37Rv N0072

217
6.8 Over expression of ncRv12659
M. tb H37Rv contains two prophage elements PhiRv1 and PhiRv2 both
possessing a similar arrangement of integrase and repressor like proteins;
with inward and outward facing promoters, Figure 6.7.
PhiRv2 is a prophage element and therefore lacks the full complement of
genes to act as an active phage within M. tb. However, analysis with other
temperate bacteriophages shows that the promoter of ncRv12659 is
probably responsible for driving expression of the phage genes in its
circular chromosome, Figure 6.7.
For 51 amino acids from the phage gene ORF of Rv2647 structural
homology was identified for a potential binding site of a korB repressor
from plasmid RP4 [251]. Repeat sequences of 14 nucleotides were
identified upstream of several phage genes which represent potential
repressor binding sites, and are represented by red boxes in Figure 6.7.

218
Figure 6.7 PhiRv2 represented as a circular virion (taken from [155]).
After phage integration into the M. tb genome at the valU tRNA gene the
promoter upstream of Rv2645 drives outward expression of the sRNA. Potential
repressor binding sites are shown in red.

219
As the sRNA is a mixture of both host and phage sequence in addition to
the conservation of the sequence within the lysogen it was hypothesised
that ncRv12659 could have a functional impact on M. tb, especially in light
of the activation of the promoter under starvation conditions. To test this
hypothesis an over expression strain was constructed using a replicating
plasmid that contained the sRNA under its own promoter called
pMSC12659. This plasmid contained portions of downstream and
upstream sequence in order to include any regulatory elements including
potential termination signals (base pairs 1-471 in Figure 6.4).
The plasmid was electroporated into both the PhiRv2 positive H37Rv and
PhiRv2 negative N0072. Following successful transformation, cultures
were grown to exponential phase and RNA extracted. Analysis of the
samples by qRT-PCR showed that over expression of ncRv12659 was
around 1000-fold in both strains, reaching around 10% of 16S rRNA levels
Figure 6.8A. This resulted in a small but significant reduction in the growth
rate of both strains Figure 6.8B.
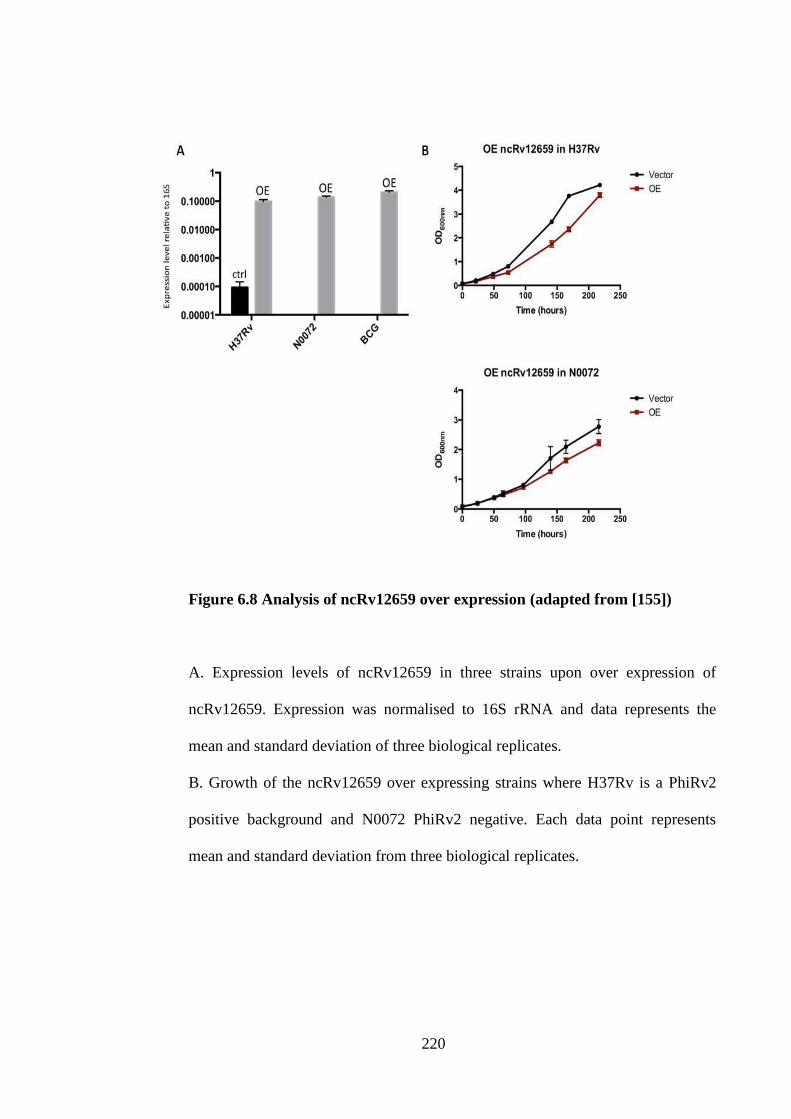
220
Figure 6.8 Analysis of ncRv12659 over expression (adapted from [155])
A. Expression levels of ncRv12659 in three strains upon over expression of
ncRv12659. Expression was normalised to 16S rRNA and data represents the
mean and standard deviation of three biological replicates.
B. Growth of the ncRv12659 over expressing strains where H37Rv is a PhiRv2
positive background and N0072 PhiRv2 negative. Each data point represents
mean and standard deviation from three biological replicates.
221
In order to assess the function of ncRv12659, microarray analysis was
performed on the H37Rv strain harbouring the over expression using
Oligonucleotide arrays, as described in section 2.8.13 using AMADID
027543. A fold change cut off of 2 with a p-value of 0.05 was initially
selected and this resulted in differential expression of more than 100
probes. In order to focus our search we increased the fold change to 4
with a p-value of 0.05. This resulted in 27 probes of which 6 corresponded
to sequence contained in the over expression construct and so were
discarded from the analysis. This left 21 probes which corresponded to 11
genes Table 6.2. Thirteen of the probes identified could be aligned with
Rv0257. These repeat loci have been linked to hypothetical protein
products in various genomic locations, although frame shifts present
indicate that the coding capacity is not conserved between each locus.

222
Gene
Name
Fold Change
OE/WT
Average of
probes
Regulation Repeat
Locus
MT1650.1 113.3 113 Up 4
MT1560.1 80.5 80 Up 3
MT0270.2 50.3 50 Up 1
Rv1137c 31.8 32 Up 2
Rv3613c 8.3 8 Up 6
MT2423.1 95.8 6 Up 5
MT2423.1 81.5 - - -
MT2423.1 62.6 - - -
Rv0257 90.4 6 Up 1
Rv0257 86.2 - - -
Rv0257 21.9 - - -
Rv3612c 5.8 6 Up 6
Rv3612c 5.7 - - -
Rv2659c 4.5 4 Up N/A
Rv2659c 3.8 - - -
Rv2658c 4.6 4 Up N/A
Rv2658c 3.8 - - -
Rv2658c 3.6 - - -
Rv3229c 4 7 Down N/A
Rv3229c 8 - - -
Rv3229c 9 - - -

223
Table 6.2 Gene expression changes by microarray upon over expression of
ncRv12659 (adapted from [155])

224
Five probes associated with the PhiRv2 region were identified in the array
with an observed up regulation of Rv2659c and Rv2658c 4 and 5-fold
respectively, Figure 6.9A. Although over expression resulted in a reduction
in growth rate, only one gene, Rv3229c was observed to be down
regulated more than 4 fold. Analysis by qRT-PCR confirmed down
regulation with a fold change of 8.2.
As desA3 was the only down regulated gene observed, the PhiRv2
negative strains N0072 and BCG were also used to construct over
expression strains using pMSC12659 to determine if this was a phage
specific phenomenon. Analysis of desA3 in the different backgrounds
revealed a reduced down regulation of between1.5 - 2 fold in the PhiRv2
negative background of N0072 and BCG, Figure 6.9B. This would suggest
that the greater down regulation observed in the PhiRv2 positive H37Rv is
due to the presence of PhiRv2 genes other than ncRv12659.

225
Figure 6.9 Expression analyses by qRT-PCR (taken from [155])
A. Expression level in the over expression strain compared to the empty vector
control. Data represents mean and standard deviation of three biological
replicates.
B. Expression levels of desA3 in three different PhiRv2 backgrounds over
expressing ncRv12659. Data represents mean and standard deviation of three
biological replicates. All expression was normalised to 16S rRNA.
226
6.9 Discussion
Both RNA seq and northern blot analysis have demonstrated that the
transcriptional signals previously assigned to Rv2660c are in fact that of a
sRNA encoded on the opposite strand of the DNA. This observation has
also been observed by others [252]. By assessing a variety of culture
conditions and strains we have failed to detect expression of Rv2660c on
either the transcript or proteomic level.
Investigations by other groups either during long term starvation [253] or
high coverage proteomic mapping [250, 254] also failed to detect Rv2660c
on the proteomic level. Only one group have suggested detection of
Rv2660c peptides from BCG but only two out of thousands of mass
spectra were detected leaving the existence of Rv2660c questionable but
highly unlikely.
The sRNA was created by the insertion of PhiRv2 into the genome of M. tb
and it is therefore only found in strains which are PhiRv2 positive. Due to
the loss of many of the genes required for a complete virion it would
suggest that PhiRv2 infected an early ancestor. Subsequent selective
pressures on M. tb have caused specific genes to be deleted which
include tail proteins, and hence only the cryptic prophage remains.
The starvation induction of the sRNA ncRv12659 along with the phage
integrase Rv2659c is likely due to the release of a repressor that allows
the initiation of phage lysis of the cell. The determinants for lysis and
lysogeny have been shown by others to be closely linked to nutrient
availability to the host and could explain why the induction of ncRv12659
is so marked in response to starvation [255-257].

227
ncRv12659 was observed to accumulate during infection with the
observation that this was only at the 5’ end of the transcript suggesting
processing, early termination, and or a lack of stability for the 3’ end of the
transcript. It is possible that the tRNA portion of the sequence stabilises
the transcript by increasing its secondary structure.
ncRv12659 is not the only sRNA that has been observed to accumulate
during infection [3]. However, the starvation induction of this transcript
provides a useful marker for cells that are starved for either nutrients or
oxygen and which may be fated to become persisters [187, 243, 244].
Both phage and host sequence are present in the sRNA transcript and it
was therefore possible that over expression of ncRv12659 could result in
an effect on the physiology of M. tb. Over expression did result in a
reduction of growth although the transcriptional changes observed showed
down regulation of only one gene, desA3.
Of the up regulated genes, those belonging to the phage were the most
significantly changed along with probes for a novel repeat region. The
induction of the phage integrase Rv2659c along with the strong over
expression of ncRv12659 could be the result of a repressor being
sequestered due to multiple binding sites being available. The novel
repeat regions contained no upstream sequence similarity and their
functions, whether coding or non-coding are yet to be identified.
The findings of this study suggest that the 5’ end of ncRv12659 is a useful
starvation marker for analysis of M. tb during infection, although this is
limited to PhiRv2 positive strains. It seems unlikely that the up regulation

228
of this starvation induced locus would play a direct role in increasing the
efficacy of the H56 vaccine.
This raises the question that if Rv2660c is a misannotation, how does its
inclusion in the vaccine enhance protection? It is possible that the
recombinant Rv2660c protein elicits a T cell response which results in a
cross reaction between an unidentified M. tb antigen. This theory is
supported by the finding that T cells isolated from infected individuals
show responses to stimulation with Rv2660c [258]. Interestingly, a greater
response was elicited from T cells isolated from latently infected
individuals as opposed to those with active disease [258].
It also remains possible although unlikely; that there is a specific and as
yet unidentified condition under which Rv2660c is induced. If this was the
case, this expression condition could provide the key to understanding
latent infection. It is important to understand how Rv2660c improves the
efficacy of the H56 vaccine. Further studies could also help explain why
another vaccine candidate containing antigen 85A failed to induce
protection [259, 260].

229
7 Concluding Remarks
The majority of documented sRNAs regulate through base-pairing with a
target mRNA resulting in a change in translation and/or stability of the
mRNA. It was for this reason that transcriptomic and proteomic profiles
were studied upon generation of sRNA deletion mutants. It was expected
that microarrays would indicate increases or decreases in mRNA stability,
whereas proteomic analysis would show if regulation resulted in translation
repression or activation.
Unfortunately the sRNAs selected in this study did not result in clear defined
mechanisms of action using these techniques. This study generated mutant
strains of the 4 candidate sRNAs and assessed their transcriptomic and
proteomic profiles in order to identify their regulatory targets. This approach
did not result in the clear identification of targets as hoped. Transcriptomic
and proteomic profiles for both ncRv11690 and ncRv10243 deletion strains
in particular lacked any discernible targets. A summary of the findings of
these studies can be found in Table 7.1

230
sRNA Key Findings
ncRv10243 sRNA is non- essential under the conditions tested.
Expression is induced in mouse infection and starvation
Deletion results in a heat shock signature after 24hrs starvation
ΔncRv10243 is impaired in recovery from the Wayne Model
ΔncRv10243 is not attenuated in a macrophage or mouse model of
infection.
ncRv11690 sRNA is non- essential under the conditions tested.
ΔncRv11690 transcriptional changes indicate a role in metal ion
homeostasis
Over expression results changes in cell wall and cell wall process
proteins involved in regulation of EsxA
ΔncRv11690 is not attenuated in a macrophage or mouse model of
infection
ncRv13661 sRNA is non- essential under the conditions tested.
Transcriptional responses implicate involvement in long term
persistence by diverting carbon from fatty acid degradation to storage
lipids
Efflux pump Rv1218c is concordantly regulated in deletion and over
expression strain indicating involvement in regulation of cell wall
constituents
Deletion affects expression of PDIM associated genes ppsA-D.
Over expression results in a down regulation of DNA repair proteins of
which one (recA) is a predicted target.
ncRv13661 does not exclusively co migrate with RNAP and is therefore
not acting as a 6S homologue.
ΔncRv13661 is not attenuated in a macrophage or mouse model of
infection
ncRv12659 Induced by starvation and mouse infection
Rv2660c is not starvation induced
Over expression in PhiRv2 positive background results in up regulation
of phage genes
Would be a useful biomarker for starvation in vivo
Table 7.1 Summary of the key findings of the studies on each sRNA

231
There is only one sRNA in M. tb with an identified target to date. This sRNA
is mcr7 which was identified in CHIP seq analysis using PhoP. By using
target prediction and proteomic analysis of the secretome mcr7 was
identified as regulating tatC, through translational repression. This search
for a target of mcr7 was very much aided in its focus due to unpublished
results from the group suggesting that secretion of Tat-dependent
substrates was affected in the phoP mutant strain [156]. Importantly, RNA
seq analysis of the PhoP mutant in the same study did not identify any
differences in the expression levels of tatC. If a mcr7 mutant was analysed
using the methods employed in this study target identification would not
have been possible. The knowledge of a well-defined system allowing very
specific investigation of the secretome aided in the target identification for
mcr7. This highlights the difficulties in studying sRNAs which is further
hindered in M. tb where functional identification for a large number of
proteins is yet to be ascertained. The characterisation of the functional mcr7
in M. tb confirms that sRNA regulation in this important pathogen is
comparable to other bacteria. It would therefore seem that the disappointing
end points in this study were as a result of the limitations of the tools
employed and not poor choice of candidates for investigation.
The findings of the mcr7 study and the proteomic analysis of the
ncRv11690 over expression occurred at the end of this project and
therefore secretome analysis was not possible. Due to the implication of
ncRv11690 in the regulation of the virulence factor EsxA this was
unfortunate as such analysis could have proved highly informative.
Obviously secretome analysis would not yield the answers to all sRNA

232
functions but the lessons learned from these studies shows alternate
investigation to transcriptional analysis needs to be focused upon.
An approach would be to test viability of mutants in a variety of stress
conditions such as the Wayne model, where a phenotype was observed for
the ncRv10243. Such survival experiments might be likely to reveal true
induction conditions for the sRNA in question and allow target identification.
In addition analysis of mutant strains by sucrose gradient ultracentrifugation
can be employed to look at interacting protein partners through proteomic
analysis of co-sedimented proteins. Full fractional analysis of mutant
compared to wildtype could show differential sedimentation of proteins.
If it were possible to identify essential sRNAs in M. tb these would be ideal
candidates for study. However, lack of knowledge on essentiality of these
RNAs prevents this selection process at present. Due to the size of sRNAs
it is difficult to assess essentiality by transposon mapping, as is the case for
protein coding genes. If a sRNA lacks a transposon it could simply be due
to the lack of attaining one due to its size. It is known from studies in
Salmonella however, that few sRNAs are known to be essential.
Many sRNAs have been identified from studies of E. coli and Salmonella
which possess the RNA chaperone Hfq. The importance of Hfq has been
demonstrated in these bacteria by the pleiotropic effects of deletion. These
phenotypes include decreased motility, attenuation in host cell invasion and
decreased replication within macrophages [261, 262]. The strong
phenotypes observed led to coIP studies with Hfq employing microarray or
233
RNA sequencing technologies to identify sRNAs [60, 263]. In addition to this
many sRNAs originally identified in E. coli were found to be present in
Salmonella by sequence conservation, and confirmed later in the coIP
experiments. This represents another limitation in the study of sRNAs in M.
tb which lacks the chaperone Hfq preventing this approach from being
adopted.
One method of identification employed has been the ‘reverse target search’
approach in which sRNAs were systematically deleted in Salmonella and
resulting strains screened for the appropriate phenotype. All outer
membrane proteins in Salmonella had known sRNA regulators except
OmpX. Due to the lack of an identified sRNA regulator for OmpX 35 sRNA
deletion strains were created and assessed for effects on OmpX synthesis.
This screen identified the Hfq-dependent CyaR sRNA as an OmpX
repressor [264]. This approach has major limitations for application to other
targets and bacteria. The likelihood of RNA regulation of this outer
membrane protein (OMP) was extremely high due to all other OMP having
sRNA regulators identified. In addition this extremely laborious process of
creating 35 deletion strains especially in a slow growing strain would not
viable. The creation of deletion mutants in M. tb requires at least 6 months
and is not a high throughput technique.
Despite the increase in our knowledge of sRNAs, their contribution to
virulence has been much less well established though examples have been
demonstrated [58, 265, 266]. Phenotypic investigations for roles of sRNAs
and mRNAs deletions in infection have traditionally relied on CFU readouts

234
to infer virulence. The role of sRNAs in infection is in its infancy but there
have been few published studies that have employed RNA seq to monitor
the response of the host cell to infection [267]. Exceptions include a study
into the eukaryotic miRNA response to bacteria using either macrophage or
HeLA cells and enriching for the miRNA fraction. Dual RNA seq would
provide a much greater depth of understanding of the complex interplay
between bacteria and host [268]. Cytokine readouts from host infections
could also provide a route to functional characterisation [269].
sRNAs involved in Hfq-mediated interactions are generally degraded along
with their mRNA target [13]. In contrast, we observed accumulation rather
than degradation of M. tb sRNAs in both stationary phase and starvation
induction model. Even higher levels of sRNA accumulation were observed
in the lungs of infected mice as seen with other sRNAs [3], with ncRv13661
achieving levels equal to 16S rRNA. This might suggest that the RNA
degradation pathways in mycobacteria are distinct from other bacteria such
as the model organism E. coli.
The lack of phenotypes observed for the sRNA deletion strains along with
small changes in mRNA target abundance leads to the conclusion that the
sRNAs selected in this study (with the exception of ncRv13661) are either
involved in the fine tuning the stress response under particular induction
conditions or the specific induction conditions are yet to be identified.
Assays where CFU measurements are used to measure survival of a
particular stress are very limited. It is difficult to observe changes in specific
stress experiments where more global protein-mediated responses can
235
mask that of the sRNA. This is especially evident in a whole animal infection
model where the pathogenesis of M. tb does not rely on the expression of a
single response but a coordinated array of responses and as such possess
a plasticity that allows the maintenance of virulence. Few cases of deletion
strains lead to attenuation and it is these candidate targets that drive drug
development and discovery.
However, it is important to understand the riboregulation occurring within M.
tb for pathways involved in pathogenesis. This greater level of
understanding of the biology of M. tb could lead to better targeted therapies
and rational drug design. The increasing drug resistance in cases of
tuberculosis make this all the more important. In fact RNAs could already
represent valid targets as antimicrobials. Riboswitches in particular are
being pursued as targets due to a high degree of sensitivity and specificity
for their ligands [270]. Recently, one compound targeting the guanine
riboswitch of S. aureus was shown to successfully reduce bacterial load in
animals after infection [271].

236
References
1. Gottesman, S., et al., Small RNA regulators and the bacterial response to stress.
Cold Spring Harb Symp Quant Biol, 2006. 71: p. 1-11.
2. DiChiara, J.M., et al., Multiple small RNAs identified in Mycobacterium bovis
BCG are also expressed in Mycobacterium tuberculosis and Mycobacterium
smegmatis. Nucleic Acids Res, 2010. 38(12): p. 4067-78.
3. Arnvig, K.B., et al., Sequence-based analysis uncovers an abundance of non-
coding RNA in the total transcriptome of Mycobacterium tuberculosis. PLoS
Pathog, 2011. 7(11): p. e1002342.
4. Daniel, T.M., The history of tuberculosis. Respir Med, 2006. 100(11): p. 1862-
70.
5. Schmidt, M., P. Zheng, and N. Delihas, Secondary structures of Escherichia coli
antisense micF RNA, the 5'-end of the target ompF mRNA, and the RNA/RNA
duplex. Biochemistry, 1995. 34(11): p. 3621-31.
6. Brown, L., Robert Koch. Bull N Y Acad Med, 1932. 8(9): p. 558-84.
7. Smith, I., Mycobacterium tuberculosis pathogenesis and molecular determinants
of virulence. Clin Microbiol Rev, 2003. 16(3): p. 463-96.
8. WHO. World Health Organisation: Tuberculosis Global Facts. 2014 Accessed
on Sept 4th 2014]; Available from:
www.who.int/mediacentre/factsheets/fs104/en/.
9. Antoine, D., H. Maguire, and A. Story, Epidemiology and response to the
growing problem of tuberculosis in London. Euro Surveill, 2006. 11(3): p. 25-8.
10. England, P.H. Tuberculosis in the UK 2014 report. 2014 Accessed on Sept 4th
2014]; PHE publications gateway number: 2014353:[Available from:
https://www.gov.uk/government/uploads/system/uploads/attachment_data/file/3
60335/TB_Annual_report__4_0_300914.pdf.
11. Jagielski, T., et al., Current methods in the molecular typing of Mycobacterium
tuberculosis and other mycobacteria. Biomed Res Int, 2014. 2014: p. 645802.
12. Zink, A.R., et al., Characterization of Mycobacterium tuberculosis complex
DNAs from Egyptian mummies by spoligotyping. J Clin Microbiol, 2003. 41(1):
p. 359-67.
13. Jacobs, W.R., Jr., et al., Genetic systems for mycobacteria. Methods Enzymol,
1991. 204: p. 537-55.
14. Primm, T.P., C.A. Lucero, and J.O. Falkinham, 3rd, Health impacts of
environmental mycobacteria. Clin Microbiol Rev, 2004. 17(1): p. 98-106.
15. Beste, D.J., et al., The genetic requirements for fast and slow growth in
mycobacteria. PLoS One, 2009. 4(4): p. e5349.
16. Gonzalez-y-Merchand, J.A., et al., Strategies used by pathogenic and
nonpathogenic mycobacteria to synthesize rRNA. J Bacteriol, 1997. 179(22): p.
6949-58.
17. Bercovier, H., O. Kafri, and S. Sela, Mycobacteria possess a surprisingly small
number of ribosomal RNA genes in relation to the size of their genome. Biochem
Biophys Res Commun, 1986. 136(3): p. 1136-41.
18. Asai, T., et al., Construction and initial characterization of Escherichia coli
strains with few or no intact chromosomal rRNA operons. J Bacteriol, 1999.
181(12): p. 3803-9.
19. Cole, S.T., Tuberculosis and the tubercle bacillus. 2005, Washington, DC: ASM
Press. xii, 584 p.

237
20. Madigan, M.T., Brock biology of microorganisms. 13th ed. 2012, San Francisco:
Benjamin Cummings. xxviii, 1043, 77 p.
21. Bhatt, A., et al., Deletion of kasB in Mycobacterium tuberculosis causes loss of
acid-fastness and subclinical latent tuberculosis in immunocompetent mice. Proc
Natl Acad Sci U S A, 2007. 104(12): p. 5157-62.
22. Leemans, J.C., et al., Depletion of alveolar macrophages exerts protective
effects in pulmonary tuberculosis in mice. J Immunol, 2001. 166(7): p. 4604-11.
23. Wolf, A.J., et al., Mycobacterium tuberculosis infects dendritic cells with high
frequency and impairs their function in vivo. J Immunol, 2007. 179(4): p. 2509-
19.
24. Russell, D.G., Who puts the tubercle in tuberculosis? Nat Rev Microbiol, 2007.
5(1): p. 39-47.
25. Kaufmann, S.H., Protection against tuberculosis: cytokines, T cells, and
macrophages. Ann Rheum Dis, 2002. 61 Suppl 2: p. ii54-8.
26. Welin, A. and M. Lerm, Inside or outside the phagosome? The controversy of
the intracellular localization of Mycobacterium tuberculosis. Tuberculosis
(Edinb), 2012. 92(2): p. 113-20.
27. Watson, R.O., P.S. Manzanillo, and J.S. Cox, Extracellular M. tuberculosis
DNA targets bacteria for autophagy by activating the host DNA-sensing
pathway. Cell, 2012. 150(4): p. 803-15.
28. Simeone, R., et al., Phagosomal rupture by Mycobacterium tuberculosis results
in toxicity and host cell death. PLoS Pathog, 2012. 8(2): p. e1002507.
29. van der Wel, N., et al., M. tuberculosis and M. leprae translocate from the
phagolysosome to the cytosol in myeloid cells. Cell, 2007. 129(7): p. 1287-98.
30. Wayne, L.G. and C.D. Sohaskey, Nonreplicating persistence of mycobacterium
tuberculosis. Annu Rev Microbiol, 2001. 55: p. 139-63.
31. Barer, M.R. and C.R. Harwood, Bacterial viability and culturability. Adv
Microb Physiol, 1999. 41: p. 93-137.
32. Kell, D.B., et al., Viability and activity in readily culturable bacteria: a review
and discussion of the practical issues. Antonie Van Leeuwenhoek, 1998. 73(2):
p. 169-87.
33. Mc, C.R., et al., Ineffectiveness of isoniazid in modifying the phenomenon of
microbial persistence. Am Rev Tuberc, 1957. 76(6): p. 1106-9.
34. Lin, P.L., et al., Sterilization of granulomas is common in active and latent
tuberculosis despite within-host variability in bacterial killing. Nat Med, 2014.
20(1): p. 75-9.
35. Velayati, A.A., et al., Totally drug-resistant tuberculosis strains: evidence of
adaptation at the cellular level. Eur Respir J, 2009. 34(5): p. 1202-3.
36. Naidoo, C.C. and M. Pillay, Increased in vitro fitness of multi- and extensively
drug-resistant F15/LAM4/KZN strains of Mycobacterium tuberculosis. Clin
Microbiol Infect, 2014. 20(6): p. O361-9.
37. Gagneux, S., et al., The competitive cost of antibiotic resistance in
Mycobacterium tuberculosis. Science, 2006. 312(5782): p. 1944-6.
38. Webb, V.D., J., Antibiotics and antibiotic resistance in Mycobacteria, in
Mycobacteria: Molecular biology and Virulence, C.D. Ratledge, J., Editor.
1999, Blackwell Science.
39. Shi, W., et al., Pyrazinamide inhibits trans-translation in Mycobacterium
tuberculosis. Science, 2011. 333(6049): p. 1630-2.

238
40. Calmette, A., et al., Report of the Technical conference for the study of
vaccination against tuberculosis by means of BCFG, held at the Pasteur
Institute, Paris, October 15th-18th, 1928. 1929, Geneva,: Imp. d'Ambilly. 147 p.
41. Andersen, P. and T.M. Doherty, The success and failure of BCG - implications
for a novel tuberculosis vaccine. Nat Rev Microbiol, 2005. 3(8): p. 656-62.
42. Borukhov, S. and E. Nudler, RNA polymerase holoenzyme: structure, function
and biological implications. Curr Opin Microbiol, 2003. 6(2): p. 93-100.
43. Gomez, M., et al., sigA is an essential gene in Mycobacterium smegmatis. Mol
Microbiol, 1998. 29(2): p. 617-28.
44. Kazmierczak, M.J., M. Wiedmann, and K.J. Boor, Alternative sigma factors and
their roles in bacterial virulence. Microbiol Mol Biol Rev, 2005. 69(4): p. 527-
43.
45. Weiss, L.A., et al., Interaction of CarD with RNA polymerase mediates
Mycobacterium tuberculosis viability, rifampin resistance, and pathogenesis. J
Bacteriol, 2012. 194(20): p. 5621-31.
46. Liu, J.M. and A. Camilli, A broadening world of bacterial small RNAs. Curr
Opin Microbiol, 2010. 13(1): p. 18-23.
47. Reichenbach, B., et al., The small RNA GlmY acts upstream of the sRNA GlmZ
in the activation of glmS expression and is subject to regulation by
polyadenylation in Escherichia coli. Nucleic Acids Res, 2008. 36(8): p. 2570-
80.
48. Wassarman, K.M., 6S RNA: a small RNA regulator of transcription. Curr Opin
Microbiol, 2007. 10(2): p. 164-8.
49. Gottesman, S., The small RNA regulators of Escherichia coli: roles and
mechanisms*. Annu Rev Microbiol, 2004. 58: p. 303-28.
50. Waters, L.S. and G. Storz, Regulatory RNAs in bacteria. Cell, 2009. 136(4): p.
615-28.
51. Kroger, C., et al., The transcriptional landscape and small RNAs of Salmonella
enterica serovar Typhimurium. Proc Natl Acad Sci U S A, 2012. 109(20): p.
E1277-86.
52. Kroger, C., et al., An infection-relevant transcriptomic compendium for
Salmonella enterica Serovar Typhimurium. Cell Host Microbe, 2013. 14(6): p.
683-95.
53. Gottesman, S., et al., Small RNA regulators of translation: mechanisms of action
and approaches for identifying new small RNAs. Cold Spring Harb Symp Quant
Biol, 2001. 66: p. 353-62.
54. Wassarman, K.M., et al., Identification of novel small RNAs using comparative
genomics and microarrays. Genes Dev, 2001. 15(13): p. 1637-51.
55. Altschul, S.F., et al., Basic local alignment search tool. J Mol Biol, 1990.
215(3): p. 403-10.
56. Livny, J., et al., Identification of 17 Pseudomonas aeruginosa sRNAs and
prediction of sRNA-encoding genes in 10 diverse pathogens using the
bioinformatic tool sRNAPredict2. Nucleic Acids Res, 2006. 34(12): p. 3484-93.
57. Liu, J.M., et al., Experimental discovery of sRNAs in Vibrio cholerae by direct
cloning, 5S/tRNA depletion and parallel sequencing. Nucleic Acids Res, 2009.
37(6): p. e46.
58. Papenfort, K. and J. Vogel, Regulatory RNA in bacterial pathogens. Cell Host
Microbe, 2010. 8(1): p. 116-27.
59. Romby, P. and E. Charpentier, An overview of RNAs with regulatory functions
in gram-positive bacteria. Cell Mol Life Sci, 2010. 67(2): p. 217-37.

239
60. Sittka, A., et al., Deep sequencing analysis of small noncoding RNA and mRNA
targets of the global post-transcriptional regulator, Hfq. PLoS Genet, 2008.
4(8): p. e1000163.
61. Sun, X., I. Zhulin, and R.M. Wartell, Predicted structure and phyletic
distribution of the RNA-binding protein Hfq. Nucleic Acids Res, 2002. 30(17):
p. 3662-71.
62. Moller, T., et al., Hfq: a bacterial Sm-like protein that mediates RNA-RNA
interaction. Mol Cell, 2002. 9(1): p. 23-30.
63. Wagner, E.G., Cycling of RNAs on Hfq. RNA Biol, 2013. 10(4): p. 619-26.
64. Vogel, J. and B.F. Luisi, Hfq and its constellation of RNA. Nat Rev Microbiol,
2011. 9(8): p. 578-89.
65. Schumacher, M.A., et al., Structures of the pleiotropic translational regulator
Hfq and an Hfq-RNA complex: a bacterial Sm-like protein. EMBO J, 2002.
21(13): p. 3546-56.
66. Brennan, R.G. and T.M. Link, Hfq structure, function and ligand binding. Curr
Opin Microbiol, 2007. 10(2): p. 125-33.
67. Arluison, V., et al., Spectroscopic observation of RNA chaperone activities of
Hfq in post-transcriptional regulation by a small non-coding RNA. Nucleic
Acids Res, 2007. 35(3): p. 999-1006.
68. Chao, Y. and J. Vogel, The role of Hfq in bacterial pathogens. Curr Opin
Microbiol, 2010. 13(1): p. 24-33.
69. Gottesman, S., Micros for microbes: non-coding regulatory RNAs in bacteria.
Trends Genet, 2005. 21(7): p. 399-404.
70. Bohn, C., C. Rigoulay, and P. Bouloc, No detectable effect of RNA-binding
protein Hfq absence in Staphylococcus aureus. BMC Microbiol, 2007. 7(10): p.
10.
71. Liu, Y., et al., Hfq is a global regulator that controls the pathogenicity of
Staphylococcus aureus. PLoS One, 2010. 5(9).
72. Jousselin, A., L. Metzinger, and B. Felden, On the facultative requirement of the
bacterial RNA chaperone, Hfq. Trends Microbiol, 2009. 17(9): p. 399-405.
73. Gaballa, A., et al., The Bacillus subtilis iron-sparing response is mediated by a
Fur-regulated small RNA and three small, basic proteins. Proc Natl Acad Sci U
S A, 2008. 105(33): p. 11927-32.
74. Pandey, S.P., et al., A highly conserved protein of unknown function in
Sinorhizobium meliloti affects sRNA regulation similar to Hfq. Nucleic Acids
Res, 2011. 39(11): p. 4691-708.
75. Jacob, A.I., et al., Conserved bacterial RNase YbeY plays key roles in 70S
ribosome quality control and 16S rRNA maturation. Mol Cell, 2013. 49(3): p.
427-38.
76. Pandey, S.P., et al., Central role for RNase YbeY in Hfq-dependent and Hfq-
independent small-RNA regulation in bacteria. BMC Genomics, 2014. 15: p.
121.
77. Morita, T., K. Maki, and H. Aiba, RNase E-based ribonucleoprotein complexes:
mechanical basis of mRNA destabilization mediated by bacterial noncoding
RNAs. Genes Dev, 2005. 19(18): p. 2176-86.
78. Marcaida, M.J., et al., The RNA degradosome: life in the fast lane of adaptive
molecular evolution. Trends Biochem Sci, 2006. 31(7): p. 359-65.
79. Vanzo, N.F., et al., Ribonuclease E organizes the protein interactions in the
Escherichia coli RNA degradosome. Genes Dev, 1998. 12(17): p. 2770-81.
240
80. Callaghan, A.J., et al., Studies of the RNA degradosome-organizing domain of
the Escherichia coli ribonuclease RNase E. J Mol Biol, 2004. 340(5): p. 965-79.
81. Py, B., et al., A protein complex mediating mRNA degradation in Escherichia
coli. Mol Microbiol, 1994. 14(4): p. 717-29.
82. Silva, I.J., et al., Importance and key events of prokaryotic RNA decay: the
ultimate fate of an RNA molecule. Wiley Interdiscip Rev RNA, 2011. 2(6): p.
818-36.
83. Kovacs, L., et al., Mycobacterial RNase E-associated proteins. Microbiol
Immunol, 2005. 49(11): p. 1003-7.
84. Arraiano, C.M., et al., The critical role of RNA processing and degradation in
the control of gene expression. FEMS Microbiol Rev, 2010. 34(5): p. 883-923.
85. Carpousis, A.J., The RNA degradosome of Escherichia coli: an mRNA-
degrading machine assembled on RNase E. Annu Rev Microbiol, 2007. 61: p.
71-87.
86. Viegas, S.C., et al., Regulation of the small regulatory RNA MicA by
ribonuclease III: a target-dependent pathway. Nucleic Acids Res, 2011. 39(7):
p. 2918-30.
87. Huntzinger, E., et al., Staphylococcus aureus RNAIII and the endoribonuclease
III coordinately regulate spa gene expression. EMBO J, 2005. 24(4): p. 824-35.
88. Boisset, S., et al., Staphylococcus aureus RNAIII coordinately represses the
synthesis of virulence factors and the transcription regulator Rot by an antisense
mechanism. Genes Dev, 2007. 21(11): p. 1353-66.
89. Lasa, I., et al., Genome-wide antisense transcription drives mRNA processing in
bacteria. Proc Natl Acad Sci U S A, 2011. 108(50): p. 20172-7.
90. Lioliou, E., et al., Global regulatory functions of the Staphylococcus aureus
endoribonuclease III in gene expression. PLoS Genet, 2012. 8(6): p. e1002782.
91. De Lay, N. and S. Gottesman, Role of polynucleotide phosphorylase in sRNA
function in Escherichia coli. RNA, 2011. 17(6): p. 1172-89.
92. Andrade, J.M., et al., The crucial role of PNPase in the degradation of small
RNAs that are not associated with Hfq. RNA, 2012. 18(4): p. 844-55.
93. Majdalani, N., C.K. Vanderpool, and S. Gottesman, Bacterial small RNA
regulators. Crit Rev Biochem Mol Biol, 2005. 40(2): p. 93-113.
94. Griffin, B.E., Separation of 32P-labelled ribonucleic acid components. The use
of polyethylenimine-cellulose (TLC) as a second dimension in separating
oligoribonucleotides of '4.5 S' and 5 S from E. coli. FEBS Lett, 1971. 15(3): p.
165-168.
95. Ikemura, T. and J.E. Dahlberg, Small ribonucleic acids of Escherichia coli. I.
Characterization by polyacrylamide gel electrophoresis and fingerprint
analysis. J Biol Chem, 1973. 248(14): p. 5024-32.
96. Tomizawa, J., et al., Inhibition of ColE1 RNA primer formation by a plasmid-
specified small RNA. Proc Natl Acad Sci U S A, 1981. 78(3): p. 1421-5.
97. Stougaard, P., S. Molin, and K. Nordstrom, RNAs involved in copy-number
control and incompatibility of plasmid R1. Proc Natl Acad Sci U S A, 1981.
78(10): p. 6008-12.
98. Tomizawa, J., Control of ColE1 plasmid replication: the process of binding of
RNA I to the primer transcript. Cell, 1984. 38(3): p. 861-70.
99. Tomizawa, J.I. and T. Itoh, The importance of RNA secondary structure in
CoIE1 primer formation. Cell, 1982. 31(3 Pt 2): p. 575-83.

241
100. Gerhart, E., H. Wagner, and K. Nordstrom, Structural analysis of an RNA
molecule involved in replication control of plasmid R1. Nucleic Acids Res,
1986. 14(6): p. 2523-38.
101. Mizuno, T., [Regulation of gene expression by a small RNA transcript
(micRNA): osmoregulation in E. coli]. Seikagaku, 1984. 56(2): p. 113-9.
102. Mizuno, T., M.Y. Chou, and M. Inouye, A unique mechanism regulating gene
expression: translational inhibition by a complementary RNA transcript
(micRNA). Proc Natl Acad Sci U S A, 1984. 81(7): p. 1966-70.
103. Udekwu, K.I., et al., Hfq-dependent regulation of OmpA synthesis is mediated
by an antisense RNA. Genes Dev, 2005. 19(19): p. 2355-66.
104. Chen, S., et al., MicC, a second small-RNA regulator of Omp protein expression
in Escherichia coli. J Bacteriol, 2004. 186(20): p. 6689-97.
105. Storz, G., J.A. Opdyke, and A. Zhang, Controlling mRNA stability and
translation with small, noncoding RNAs. Curr Opin Microbiol, 2004. 7(2): p.
140-4.
106. Argaman, L. and S. Altuvia, fhlA repression by OxyS RNA: kissing complex
formation at two sites results in a stable antisense-target RNA complex. J Mol
Biol, 2000. 300(5): p. 1101-12.
107. Moller, T., et al., Spot 42 RNA mediates discoordinate expression of the E. coli
galactose operon. Genes Dev, 2002. 16(13): p. 1696-706.
108. Udekwu, K.I. and E.G. Wagner, Sigma E controls biogenesis of the antisense
RNA MicA. Nucleic Acids Res, 2007. 35(4): p. 1279-88.
109. Heidrich, N., I. Moll, and S. Brantl, In vitro analysis of the interaction between
the small RNA SR1 and its primary target ahrC mRNA. Nucleic Acids Res,
2007. 35(13): p. 4331-46.
110. Darfeuille, F., et al., An antisense RNA inhibits translation by competing with
standby ribosomes. Mol Cell, 2007. 26(3): p. 381-92.
111. Sharma, C.M., et al., A small RNA regulates multiple ABC transporter mRNAs
by targeting C/A-rich elements inside and upstream of ribosome-binding sites.
Genes Dev, 2007. 21(21): p. 2804-17.
112. Bouvier, M., et al., Small RNA binding to 5' mRNA coding region inhibits
translational initiation. Mol Cell, 2008. 32(6): p. 827-37.
113. Holmqvist, E., et al., Two antisense RNAs target the transcriptional regulator
CsgD to inhibit curli synthesis. EMBO J, 2010. 29(11): p. 1840-50.
114. Desnoyers, G. and E. Masse, Noncanonical repression of translation initiation
through small RNA recruitment of the RNA chaperone Hfq. Genes Dev, 2012.
26(7): p. 726-39.
115. Bandyra, K.J., et al., The seed region of a small RNA drives the controlled
destruction of the target mRNA by the endoribonuclease RNase E. Mol Cell,
2012. 47(6): p. 943-53.
116. Desnoyers, G., M.P. Bouchard, and E. Masse, New insights into small RNA-
dependent translational regulation in prokaryotes. Trends Genet, 2013. 29(2): p.
92-8.
117. Dreyfus, M., Killer and protective ribosomes. Prog Mol Biol Transl Sci, 2009.
85: p. 423-66.
118. Prevost, K., et al., Small RNA-induced mRNA degradation achieved through
both translation block and activated cleavage. Genes Dev, 2011. 25(4): p. 385-
96.

242
119. Morita, T., Y. Mochizuki, and H. Aiba, Translational repression is sufficient for
gene silencing by bacterial small noncoding RNAs in the absence of mRNA
destruction. Proc Natl Acad Sci U S A, 2006. 103(13): p. 4858-63.
120. Rice, J.B. and C.K. Vanderpool, The small RNA SgrS controls sugar-phosphate
accumulation by regulating multiple PTS genes. Nucleic Acids Res, 2011. 39(9):
p. 3806-19.
121. Rice, J.B., D. Balasubramanian, and C.K. Vanderpool, Small RNA binding-site
multiplicity involved in translational regulation of a polycistronic mRNA. Proc
Natl Acad Sci U S A, 2012. 109(40): p. E2691-8.
122. Desnoyers, G., et al., Small RNA-induced differential degradation of the
polycistronic mRNA iscRSUA. EMBO J, 2009. 28(11): p. 1551-61.
123. Pfeiffer, V., et al., Coding sequence targeting by MicC RNA reveals bacterial
mRNA silencing downstream of translational initiation. Nat Struct Mol Biol,
2009. 16(8): p. 840-6.
124. Morfeldt, E., et al., Activation of alpha-toxin translation in Staphylococcus
aureus by the trans-encoded antisense RNA, RNAIII. EMBO J, 1995. 14(18): p.
4569-77.
125. Prevost, K., et al., The small RNA RyhB activates the translation of shiA mRNA
encoding a permease of shikimate, a compound involved in siderophore
synthesis. Mol Microbiol, 2007. 64(5): p. 1260-73.
126. Kalamorz, F., et al., Feedback control of glucosamine-6-phosphate synthase
GlmS expression depends on the small RNA GlmZ and involves the novel protein
YhbJ in Escherichia coli. Mol Microbiol, 2007. 65(6): p. 1518-33.
127. Urban, J.H., et al., A conserved small RNA promotes discoordinate expression of
the glmUS operon mRNA to activate GlmS synthesis. J Mol Biol, 2007. 373(3):
p. 521-8.
128. Urban, J.H. and J. Vogel, Two seemingly homologous noncoding RNAs act
hierarchically to activate glmS mRNA translation. PLoS Biol, 2008. 6(3): p.
e64.
129. Majdalani, N., et al., DsrA RNA regulates translation of RpoS message by an
anti-antisense mechanism, independent of its action as an antisilencer of
transcription. Proc Natl Acad Sci U S A, 1998. 95(21): p. 12462-7.
130. Wassarman, K.M., 6S RNA: a regulator of transcription. Mol Microbiol, 2007.
65(6): p. 1425-31.
131. Wassarman, K.M. and G. Storz, 6S RNA regulates E. coli RNA polymerase
activity. Cell, 2000. 101(6): p. 613-23.
132. Trotochaud, A.E. and K.M. Wassarman, A highly conserved 6S RNA structure is
required for regulation of transcription. Nat Struct Mol Biol, 2005. 12(4): p.
313-9.
133. Paul, B.J., et al., DksA: a critical component of the transcription initiation
machinery that potentiates the regulation of rRNA promoters by ppGpp and the
initiating NTP. Cell, 2004. 118(3): p. 311-22.
134. Primm, T.P., et al., The stringent response of Mycobacterium tuberculosis is
required for long-term survival. J Bacteriol, 2000. 182(17): p. 4889-98.
135. Stallings, C.L., et al., CarD is an essential regulator of rRNA transcription
required for Mycobacterium tuberculosis persistence. Cell, 2009. 138(1): p.
146-59.
136. Cavanagh, A.T., J.M. Sperger, and K.M. Wassarman, Regulation of 6S RNA by
pRNA synthesis is required for efficient recovery from stationary phase in E. coli
and B. subtilis. Nucleic Acids Res, 2012. 40(5): p. 2234-46.

243
137. Trotochaud, A.E. and K.M. Wassarman, 6S RNA function enhances long-term
cell survival. J Bacteriol, 2004. 186(15): p. 4978-85.
138. Wassarman, K.M. and R.M. Saecker, Synthesis-mediated release of a small RNA
inhibitor of RNA polymerase. Science, 2006. 314(5805): p. 1601-3.
139. Vanderpool, C.K. and S. Gottesman, Involvement of a novel transcriptional
activator and small RNA in post-transcriptional regulation of the glucose
phosphoenolpyruvate phosphotransferase system. Mol Microbiol, 2004. 54(4):
p. 1076-89.
140. Wadler, C.S. and C.K. Vanderpool, A dual function for a bacterial small RNA:
SgrS performs base pairing-dependent regulation and encodes a functional
polypeptide. Proc Natl Acad Sci U S A, 2007. 104(51): p. 20454-9.
141. Nahvi, A., et al., Genetic control by a metabolite binding mRNA. Chem Biol,
2002. 9(9): p. 1043.
142. Warner, D.F., et al., A riboswitch regulates expression of the coenzyme B12-
independent methionine synthase in Mycobacterium tuberculosis: implications
for differential methionine synthase function in strains H37Rv and CDC1551. J
Bacteriol, 2007. 189(9): p. 3655-9.
143. Walters, S.B., et al., The Mycobacterium tuberculosis PhoPR two-component
system regulates genes essential for virulence and complex lipid biosynthesis.
Mol Microbiol, 2006. 60(2): p. 312-30.
144. Gripenland, J., et al., RNAs: regulators of bacterial virulence. Nat Rev
Microbiol, 2010. 8(12): p. 857-66.
145. Vitreschak, A.G., et al., Comparative genomic analysis of T-box regulatory
systems in bacteria. RNA, 2008. 14(4): p. 717-35.
146. Nelson, J.W., et al., Riboswitches in eubacteria sense the second messenger c-
di-AMP. Nat Chem Biol, 2013. 9(12): p. 834-9.
147. Masse, E. and S. Gottesman, A small RNA regulates the expression of genes
involved in iron metabolism in Escherichia coli. Proc Natl Acad Sci U S A,
2002. 99(7): p. 4620-5.
148. Masse, E., C.K. Vanderpool, and S. Gottesman, Effect of RyhB small RNA on
global iron use in Escherichia coli. J Bacteriol, 2005. 187(20): p. 6962-71.
149. Sledjeski, D.D., A. Gupta, and S. Gottesman, The small RNA, DsrA, is essential
for the low temperature expression of RpoS during exponential growth in
Escherichia coli. EMBO J, 1996. 15(15): p. 3993-4000.
150. Padalon-Brauch, G., et al., Small RNAs encoded within genetic islands of
Salmonella typhimurium show host-induced expression and role in virulence.
Nucleic Acids Res, 2008. 36(6): p. 1913-27.
151. Romby, P., F. Vandenesch, and E.G. Wagner, The role of RNAs in the
regulation of virulence-gene expression. Curr Opin Microbiol, 2006. 9(2): p.
229-36.
152. Papenfort, K., et al., SigmaE-dependent small RNAs of Salmonella respond to
membrane stress by accelerating global omp mRNA decay. Mol Microbiol,
2006. 62(6): p. 1674-88.
153. Arnvig, K.B. and D.B. Young, Identification of small RNAs in Mycobacterium
tuberculosis. Mol Microbiol, 2009. 73(3): p. 397-408.
154. Arnvig, K. and D. Young, Non-coding RNA and its potential role in
Mycobacterium tuberculosis pathogenesis. RNA Biol, 2012. 9(4): p. 427-36.
155. Houghton, J., et al., A Small RNA Encoded in the Rv2660c Locus of
Mycobacterium tuberculosis Is Induced during Starvation and Infection. Plos
One, 2013. 8(12).

244
156. Solans, L., et al., The PhoP-dependent ncRNA Mcr7 modulates the TAT
secretion system in Mycobacterium tuberculosis. PLoS Pathog, 2014. 10(5): p.
e1004183.
157. Waddell, S.J. and P.D. Butcher, Microarray analysis of whole genome
expression of intracellular Mycobacterium tuberculosis. Curr Mol Med, 2007.
7(3): p. 287-96.
158. Waddell, S.J., P.D. Butcher, and N.G. Stoker, RNA profiling in host-pathogen
interactions. Curr Opin Microbiol, 2007. 10(3): p. 297-302.
159. Li, A.H., et al., Contrasting transcriptional responses of a virulent and an
attenuated strain of Mycobacterium tuberculosis infecting macrophages. PLoS
One. 5(6): p. e11066.
160. Lin, P.L., et al., Quantitative comparison of active and latent tuberculosis in the
cynomolgus macaque model. Infect Immun, 2009. 77(10): p. 4631-42.
161. Garton, N.J., et al., Cytological and transcript analyses reveal fat and lazy
persister-like bacilli in tuberculous sputum. PLoS Med, 2008. 5(4): p. e75.
162. Rachman, H., et al., Unique transcriptome signature of Mycobacterium
tuberculosis in pulmonary tuberculosis. Infect Immun, 2006. 74(2): p. 1233-42.
163. Kery, M.B., et al., TargetRNA2: identifying targets of small regulatory RNAs in
bacteria. Nucleic Acids Res, 2014. 42(Web Server issue): p. W124-9.
164. Tjaden, B., TargetRNA: a tool for predicting targets of small RNA action in
bacteria. Nucleic Acids Res, 2008. 36(Web Server issue): p. W109-13.
165. Wilderman, P.J., et al., Identification of tandem duplicate regulatory small RNAs
in Pseudomonas aeruginosa involved in iron homeostasis. Proc Natl Acad Sci U
S A, 2004. 101(26): p. 9792-7.
166. Schnappinger, D., G.K. Schoolnik, and S. Ehrt, Expression profiling of host
pathogen interactions: how Mycobacterium tuberculosis and the macrophage
adapt to one another. Microbes Infect, 2006. 8(4): p. 1132-40.
167. Smollett, K.L., L.F. Dawson, and E.O. Davis, SigG does not control gene
expression in response to DNA damage in Mycobacterium tuberculosis H37Rv. J
Bacteriol. 193(4): p. 1007-11.
168. Wang, Z., M. Gerstein, and M. Snyder, RNA-Seq: a revolutionary tool for
transcriptomics. Nat Rev Genet, 2009. 10(1): p. 57-63.
169. Kendall, S.L., et al., What do microarrays really tell us about M. tuberculosis?
Trends Microbiol, 2004. 12(12): p. 537-44.
170. Pelly, S., W.R. Bishai, and G. Lamichhane, A screen for non-coding RNA in
Mycobacterium tuberculosis reveals a cAMP-responsive RNA that is expressed
during infection. Gene, 2012. 500(1): p. 85-92.
171. Lamichhane, G., K.B. Arnvig, and K.A. McDonough, Definition and annotation
of (myco)bacterial non-coding RNA. Tuberculosis (Edinb), 2013. 93(1): p. 26-9.
172. Cole, S.T., et al., Deciphering the biology of Mycobacterium tuberculosis from
the complete genome sequence. Nature, 1998. 393(6685): p. 537-44.
173. Comas, I., et al., Human T cell epitopes of Mycobacterium tuberculosis are
evolutionarily hyperconserved. Nat Genet, 2010. 42(6): p. 498-503.
174. Hinds, J., et al., Enhanced gene replacement in mycobacteria. Microbiology,
1999. 145 ( Pt 3): p. 519-27.
175. Hartkoorn, R.C., et al., Genome-wide definition of the SigF regulon in
Mycobacterium tuberculosis. J Bacteriol, 2012. 194(8): p. 2001-9.
176. Chen, P., et al., Construction and characterization of a Mycobacterium
tuberculosis mutant lacking the alternate sigma factor gene, sigF. Infect Immun,
2000. 68(10): p. 5575-80.

245
177. Geiman, D.E., et al., Attenuation of late-stage disease in mice infected by the
Mycobacterium tuberculosis mutant lacking the SigF alternate sigma factor and
identification of SigF-dependent genes by microarray analysis. Infect Immun,
2004. 72(3): p. 1733-45.
178. Karls, R.K., et al., Examination of Mycobacterium tuberculosis sigma factor
mutants using low-dose aerosol infection of guinea pigs suggests a role for SigC
in pathogenesis. Microbiology, 2006. 152(Pt 6): p. 1591-600.
179. Sturgill-Koszycki, S., et al., Lack of acidification in Mycobacterium phagosomes
produced by exclusion of the vesicular proton-ATPase. Science, 1994.
263(5147): p. 678-81.
180. Russell, D.G., Mycobacterium tuberculosis: here today, and here tomorrow. Nat
Rev Mol Cell Biol, 2001. 2(8): p. 569-77.
181. Schnappinger, D., et al., Transcriptional Adaptation of Mycobacterium
tuberculosis within Macrophages: Insights into the Phagosomal Environment. J
Exp Med, 2003. 198(5): p. 693-704.
182. Deana, A. and J.G. Belasco, Lost in translation: the influence of ribosomes on
bacterial mRNA decay. Genes Dev, 2005. 19(21): p. 2526-33.
183. Parish, T. and N.G. Stoker, Use of a flexible cassette method to generate a
double unmarked Mycobacterium tuberculosis tlyA plcABC mutant by gene
replacement. Microbiology, 2000. 146 ( Pt 8): p. 1969-75.
184. Abomoelak, B., et al., Characterization of a novel heat shock protein (Hsp22.5)
involved in the pathogenesis of Mycobacterium tuberculosis. J Bacteriol, 2011.
193(14): p. 3497-505.
185. Stewart, G.R., et al., Dissection of the heat-shock response in Mycobacterium
tuberculosis using mutants and microarrays. Microbiology, 2002. 148(Pt 10): p.
3129-38.
186. Archuleta, R.J., P. Yvonne Hoppes, and T.P. Primm, Mycobacterium avium
enters a state of metabolic dormancy in response to starvation. Tuberculosis
(Edinb), 2005. 85(3): p. 147-58.
187. Betts, J.C., et al., Evaluation of a nutrient starvation model of Mycobacterium
tuberculosis persistence by gene and protein expression profiling. Mol
Microbiol, 2002. 43(3): p. 717-31.
188. Murphy, D.J. and J.R. Brown, Identification of gene targets against dormant
phase Mycobacterium tuberculosis infections. BMC Infect Dis, 2007. 7: p. 84.
189. DeMaio, J., et al., A stationary-phase stress-response sigma factor from
Mycobacterium tuberculosis. Proc Natl Acad Sci U S A, 1996. 93(7): p. 2790-4.
190. Homuth, G., A. Mogk, and W. Schumann, Post-transcriptional regulation of the
Bacillus subtilis dnaK operon. Mol Microbiol, 1999. 32(6): p. 1183-97.
191. Jager, S., A. Jager, and G. Klug, CIRCE is not involved in heat-dependent
transcription of groESL but in stabilization of the mRNA 5'-end in Rhodobacter
capsulatus. Nucleic Acids Res, 2004. 32(1): p. 386-96.
192. Babitzke, P. and T. Romeo, CsrB sRNA family: sequestration of RNA-binding
regulatory proteins. Curr Opin Microbiol, 2007. 10(2): p. 156-63.
193. Nyka, W., Studies on the effect of starvation on mycobacteria. Infect Immun,
1974. 9(5): p. 843-50.
194. Smeulders, M.J., et al., Adaptation of Mycobacterium smegmatis to stationary
phase. J Bacteriol, 1999. 181(1): p. 270-83.
195. Sun, R., et al., Mycobacterium tuberculosis ECF sigma factor sigC is required
for lethality in mice and for the conditional expression of a defined gene set.
Mol Microbiol, 2004. 52(1): p. 25-38.

246
196. Galagan, J.E., et al., The Mycobacterium tuberculosis regulatory network and
hypoxia. Nature, 2013. 499(7457): p. 178-83.
197. Campbell, E.A., et al., Structural mechanism for rifampicin inhibition of
bacterial rna polymerase. Cell, 2001. 104(6): p. 901-12.
198. Rustad, T.R., et al., Global analysis of mRNA stability in Mycobacterium
tuberculosis. Nucleic Acids Res, 2013. 41(1): p. 509-17.
199. Storz, G., S. Altuvia, and K.M. Wassarman, An abundance of RNA regulators.
Annu Rev Biochem, 2005. 74: p. 199-217.
200. Maciag, A., et al., Global analysis of the Mycobacterium tuberculosis Zur
(FurB) regulon. J Bacteriol, 2007. 189(3): p. 730-40.
201. Gold, B., et al., The Mycobacterium tuberculosis IdeR is a dual functional
regulator that controls transcription of genes involved in iron acquisition, iron
storage and survival in macrophages. Mol Microbiol, 2001. 42(3): p. 851-65.
202. Prakash, P., et al., Computational prediction and experimental verification of
novel IdeR binding sites in the upstream sequences of Mycobacterium
tuberculosis open reading frames. Bioinformatics, 2005. 21(10): p. 2161-6.
203. Solioz, M. and C. Vulpe, CPx-type ATPases: a class of P-type ATPases that
pump heavy metals. Trends Biochem Sci, 1996. 21(7): p. 237-41.
204. Robinson, N.J., S.K. Whitehall, and J.S. Cavet, Microbial metallothioneins. Adv
Microb Physiol, 2001. 44: p. 183-213.
205. Rodriguez, G.M., et al., ideR, An essential gene in mycobacterium tuberculosis:
role of IdeR in iron-dependent gene expression, iron metabolism, and oxidative
stress response. Infect Immun, 2002. 70(7): p. 3371-81.
206. Pohl, E., R.K. Holmes, and W.G. Hol, Crystal structure of the iron-dependent
regulator (IdeR) from Mycobacterium tuberculosis shows both metal binding
sites fully occupied. J Mol Biol, 1999. 285(3): p. 1145-56.
207. De Voss, J.J., et al., Iron acquisition and metabolism by mycobacteria. J
Bacteriol, 1999. 181(15): p. 4443-51.
208. Wong, D.K., et al., Identification of fur, aconitase, and other proteins expressed
by Mycobacterium tuberculosis under conditions of low and high concentrations
of iron by combined two-dimensional gel electrophoresis and mass
spectrometry. Infect Immun, 1999. 67(1): p. 327-36.
209. De Voss, J.J., et al., The salicylate-derived mycobactin siderophores of
Mycobacterium tuberculosis are essential for growth in macrophages. Proc Natl
Acad Sci U S A, 2000. 97(3): p. 1252-7.
210. Manabe, Y.C., et al., Attenuation of virulence in Mycobacterium tuberculosis
expressing a constitutively active iron repressor. Proc Natl Acad Sci U S A,
1999. 96(22): p. 12844-8.
211. Rybniker, J., et al., Anticytolytic screen identifies inhibitors of mycobacterial
virulence protein secretion. Cell Host Microbe, 2014. 16(4): p. 538-48.
212. Mosmann, T.R. and S. Sad, The expanding universe of T-cell subsets: Th1, Th2
and more. Immunol Today, 1996. 17(3): p. 138-46.
213. Coenye, T. and P. Vandamme, Intragenomic heterogeneity between multiple 16S
ribosomal RNA operons in sequenced bacterial genomes. FEMS Microbiol Lett,
2003. 228(1): p. 45-9.
214. Panek, J., et al., The suboptimal structures find the optimal RNAs: homology
search for bacterial non-coding RNAs using suboptimal RNA structures. Nucleic
Acids Res, 2011. 39(8): p. 3418-26.
215. Hnilicova, J., et al., Ms1, a novel sRNA interacting with the RNA polymerase
core in mycobacteria. Nucleic Acids Res, 2014. 42(18): p. 11763-76.

247
216. Upton, A.M. and J.D. McKinney, Role of the methylcitrate cycle in propionate
metabolism and detoxification in Mycobacterium smegmatis. Microbiology,
2007. 153(Pt 12): p. 3973-82.
217. Rainwater, D.L. and P.E. Kolattukudy, Fatty acid biosynthesis in
Mycobacterium tuberculosis var. bovis Bacillus Calmette-Guerin. Purification
and characterization of a novel fatty acid synthase, mycocerosic acid synthase,
which elongates n-fatty acyl-CoA with methylmalonyl-CoA. J Biol Chem, 1985.
260(1): p. 616-23.
218. Azad, A.K., et al., Targeted replacement of the mycocerosic acid synthase gene
in Mycobacterium bovis BCG produces a mutant that lacks mycosides. Proc Natl
Acad Sci U S A, 1996. 93(10): p. 4787-92.
219. Camacho, L.R., et al., Identification of a virulence gene cluster of
Mycobacterium tuberculosis by signature-tagged transposon mutagenesis. Mol
Microbiol, 1999. 34(2): p. 257-67.
220. Cox, J.S., et al., Complex lipid determines tissue-specific replication of
Mycobacterium tuberculosis in mice. Nature, 1999. 402(6757): p. 79-83.
221. Rousseau, C., et al., Production of phthiocerol dimycocerosates protects
Mycobacterium tuberculosis from the cidal activity of reactive nitrogen
intermediates produced by macrophages and modulates the early immune
response to infection. Cell Microbiol, 2004. 6(3): p. 277-87.
222. Yu, J., et al., Both phthiocerol dimycocerosates and phenolic glycolipids are
required for virulence of Mycobacterium marinum. Infect Immun, 2012. 80(4):
p. 1381-9.
223. Kirksey, M.A., et al., Spontaneous phthiocerol dimycocerosate-deficient
variants of Mycobacterium tuberculosis are susceptible to gamma interferon-
mediated immunity. Infect Immun, 2011. 79(7): p. 2829-38.
224. Makarova, K.S., A.A. Mironov, and M.S. Gelfand, Conservation of the binding
site for the arginine repressor in all bacterial lineages. Genome Biol, 2001.
2(4): p. RESEARCH0013.
225. Bretl, D.J., et al., MprA and DosR coregulate a Mycobacterium tuberculosis
virulence operon encoding Rv1813c and Rv1812c. Infect Immun, 2012. 80(9): p.
3018-33.
226. Milano, A., et al., Azole resistance in Mycobacterium tuberculosis is mediated
by the MmpS5-MmpL5 efflux system. Tuberculosis (Edinb), 2009. 89(1): p. 84-
90.
227. Turapov, O., et al., Antimicrobial treatment improves mycobacterial survival in
nonpermissive growth conditions. Antimicrob Agents Chemother, 2014. 58(5):
p. 2798-806.
228. Trauner, A., et al., The dormancy regulator DosR controls ribosome stability in
hypoxic mycobacteria. J Biol Chem, 2012. 287(28): p. 24053-63.
229. Cunningham, A.F. and C.L. Spreadbury, Mycobacterial stationary phase
induced by low oxygen tension: cell wall thickening and localization of the 16-
kilodalton alpha-crystallin homolog. J Bacteriol, 1998. 180(4): p. 801-8.
230. McAdam, R.A., et al., Characterization of a Mycobacterium tuberculosis H37Rv
transposon library reveals insertions in 351 ORFs and mutants with altered
virulence. Microbiology, 2002. 148(Pt 10): p. 2975-86.
231. D'Souza, C.A., et al., Cyclic AMP-dependent protein kinase controls virulence
of the fungal pathogen Cryptococcus neoformans. Mol Cell Biol, 2001. 21(9): p.
3179-91.
248
232. Shi, L., et al., Carbon flux rerouting during Mycobacterium tuberculosis growth
arrest. Mol Microbiol, 2010. 78(5): p. 1199-215.
233. Nazarova, E.V., et al., Role of lipid components in formation and reactivation of
Mycobacterium smegmatis "nonculturable" cells. Biochemistry (Mosc), 2011.
76(6): p. 636-44.
234. Kaur, D., et al., Chapter 2: Biogenesis of the cell wall and other glycoconjugates
of Mycobacterium tuberculosis. Adv Appl Microbiol, 2009. 69: p. 23-78.
235. Daffe, M. and P. Draper, The envelope layers of mycobacteria with reference to
their pathogenicity. Adv Microb Physiol, 1998. 39: p. 131-203.
236. Barry, C.E., 3rd, et al., Mycolic acids: structure, biosynthesis and physiological
functions. Prog Lipid Res, 1998. 37(2-3): p. 143-79.
237. Domenech, P. and M.B. Reed, Rapid and spontaneous loss of phthiocerol
dimycocerosate (PDIM) from Mycobacterium tuberculosis grown in vitro:
implications for virulence studies. Microbiology, 2009. 155(Pt 11): p. 3532-43.
238. Movahedzadeh, F., M.J. Colston, and E.O. Davis, Determination of DNA
sequences required for regulated Mycobacterium tuberculosis RecA expression
in response to DNA-damaging agents suggests that two modes of regulation
exist. J Bacteriol, 1997. 179(11): p. 3509-18.
239. Smollett, K.L., et al., Global analysis of the regulon of the transcriptional
repressor LexA, a key component of SOS response in Mycobacterium
tuberculosis. J Biol Chem, 2012. 287(26): p. 22004-14.
240. Rand, L., et al., The majority of inducible DNA repair genes in Mycobacterium
tuberculosis are induced independently of RecA. Mol Microbiol, 2003. 50(3): p.
1031-42.
241. Wade, J.T., et al., Genomic analysis of LexA binding reveals the permissive
nature of the Escherichia coli genome and identifies unconventional target sites.
Genes Dev, 2005. 19(21): p. 2619-30.
242. He, H., et al., MprAB is a stress-responsive two-component system that directly
regulates expression of sigma factors SigB and SigE in Mycobacterium
tuberculosis. J Bacteriol, 2006. 188(6): p. 2134-43.
243. Rustad, T.R., et al., The enduring hypoxic response of Mycobacterium
tuberculosis. PLoS One, 2008. 3(1): p. e1502.
244. Voskuil, M.I., K.C. Visconti, and G.K. Schoolnik, Mycobacterium tuberculosis
gene expression during adaptation to stationary phase and low-oxygen
dormancy. Tuberculosis (Edinb), 2004. 84(3-4): p. 218-27.
245. Aagaard, C., et al., A multistage tuberculosis vaccine that confers efficient
protection before and after exposure. Nat Med. 17(2): p. 189-94.
246. Cortes, T., et al., Genome-wide mapping of transcriptional start sites defines an
extensive leaderless transcriptome in Mycobacterium tuberculosis. Cell Rep,
2013. 5(4): p. 1121-31.
247. Camus, J.C., et al., Re-annotation of the genome sequence of Mycobacterium
tuberculosis H37Rv. Microbiology, 2002. 148(Pt 10): p. 2967-73.
248. Picotti, P. and R. Aebersold, Selected reaction monitoring-based proteomics:
workflows, potential, pitfalls and future directions. Nat Methods, 2012. 9(6): p.
555-66.
249. Picotti, P., et al., Full dynamic range proteome analysis of S. cerevisiae by
targeted proteomics. Cell, 2009. 138(4): p. 795-806.
250. Schubert, O.T., et al., The Mtb proteome library: a resource of assays to
quantify the complete proteome of Mycobacterium tuberculosis. Cell Host
Microbe, 2013. 13(5): p. 602-12.

249
251. Kelley, L.A. and M.J. Sternberg, Protein structure prediction on the Web: a
case study using the Phyre server. Nat Protoc, 2009. 4(3): p. 363-71.
252. Uplekar, S., et al., High-resolution transcriptome and genome-wide dynamics of
RNA polymerase and NusA in Mycobacterium tuberculosis. Nucleic Acids Res,
2013. 41(2): p. 961-77.
253. Albrethsen, J., et al., Proteomic profiling of Mycobacterium tuberculosis
identifies nutrient-starvation-responsive toxin-antitoxin systems. Mol Cell
Proteomics, 2013. 12(5): p. 1180-91.
254. Kelkar, D.S., et al., Proteogenomic analysis of Mycobacterium tuberculosis by
high resolution mass spectrometry. Mol Cell Proteomics, 2011. 10(12): p. M111
011627.
255. Los, M., et al., Effective inhibition of lytic development of bacteriophages
lambda, P1 and T4 by starvation of their host, Escherichia coli. BMC
Biotechnol, 2007. 7: p. 13.
256. Williams, M.D., J.A. Fuchs, and M.C. Flickinger, Null mutation in the stringent
starvation protein of Escherichia coli disrupts lytic development of
bacteriophage P1. Gene, 1991. 109(1): p. 21-30.
257. Slominska, M., P. Neubauer, and G. Wegrzyn, Regulation of bacteriophage
lambda development by guanosine 5'-diphosphate-3'-diphosphate. Virology,
1999. 262(2): p. 431-41.
258. Govender, L., et al., Higher human CD4 T cell response to novel
Mycobacterium tuberculosis latency associated antigens Rv2660 and Rv2659 in
latent infection compared with tuberculosis disease. Vaccine, 2010. 29(1): p. 51-
7.
259. Tameris, M.D., et al., Safety and efficacy of MVA85A, a new tuberculosis
vaccine, in infants previously vaccinated with BCG: a randomised, placebo-
controlled phase 2b trial. Lancet, 2013. 381(9871): p. 1021-8.
260. Tameris, M., et al., Lessons learnt from the first efficacy trial of a new infant
tuberculosis vaccine since BCG. Tuberculosis (Edinb), 2013. 93(2): p. 143-9.
261. Sittka, A., et al., The RNA chaperone Hfq is essential for the virulence of
Salmonella typhimurium. Mol Microbiol, 2007. 63(1): p. 193-217.
262. Ansong, C., et al., Global systems-level analysis of Hfq and SmpB deletion
mutants in Salmonella: implications for virulence and global protein
translation. PLoS One, 2009. 4(3): p. e4809.
263. Sittka, A., et al., Deep sequencing of Salmonella RNA associated with
heterologous Hfq proteins in vivo reveals small RNAs as a major target class
and identifies RNA processing phenotypes. RNA Biol, 2009. 6(3): p. 266-75.
264. Papenfort, K., et al., Systematic deletion of Salmonella small RNA genes
identifies CyaR, a conserved CRP-dependent riboregulator of OmpX synthesis.
Mol Microbiol, 2008. 68(4): p. 890-906.
265. Toledo-Arana, A., F. Repoila, and P. Cossart, Small noncoding RNAs
controlling pathogenesis. Curr Opin Microbiol, 2007. 10(2): p. 182-8.
266. Chabelskaya, S., O. Gaillot, and B. Felden, A Staphylococcus aureus small RNA
is required for bacterial virulence and regulates the expression of an immune-
evasion molecule. PLoS Pathog, 2010. 6(6): p. e1000927.
267. Schulte, L.N., et al., Analysis of the host microRNA response to Salmonella
uncovers the control of major cytokines by the let-7 family. EMBO J, 2011.
30(10): p. 1977-89.
268. Westermann, A.J., S.A. Gorski, and J. Vogel, Dual RNA-seq of pathogen and
host. Nat Rev Microbiol, 2012. 10(9): p. 618-30.

250
269. Sebastiani, G., et al., Host immune response to Salmonella enterica serovar
Typhimurium infection in mice derived from wild strains. Infect Immun, 2002.
70(4): p. 1997-2009.
270. Lunse, C.E., A. Schuller, and G. Mayer, The promise of riboswitches as
potential antibacterial drug targets. Int J Med Microbiol, 2014. 304(1): p. 79-
92.
271. Ster, C., et al., Experimental treatment of Staphylococcus aureus bovine
intramammary infection using a guanine riboswitch ligand analog. J Dairy Sci,
2013. 96(2): p. 1000-8.

251
Appendix I – Media and buffer composition
L-Broth/Agar
10 g Tryptone
5 g Yeast Extract
10 g NaCl
15 g Agar (if required; Difco, Becton Dickinson)
dH2O to 1 litre
Autoclave at 121 ºC for 15 minutes
Mycobacteria 7H9 Broth
2.35 g Mycobacteria 7H9 Broth Base (Sigma-Aldrich)
4 ml Glycerol
2.5 ml 20% Tween80
dH2O to 900 ml
Autoclave at 121 ºC for 15 minutes
Add 100 ml ADC Supplement (Becton Dickinson)
Mycobacteria 7H11 Agar
21 g Mycobacteria 7H11 Agar Powder (Sigma-Aldrich)
5 ml Glycerol
dH2O to 900 ml
Autoclave at 121 ºC for 15 minutes
Add 100 ml OADC Supplement (Becton Dickinson)
Sautons Medium
0.5 g KH2PO4
+/- 0.5 g MgSO4 where required
4.0 g L-asparagine
60 ml glycerol
0.05 g Ferric ammonium sulphate
2.0 g Citric acid
0.1 ml 1 % ZnSO4.7H2O dH2O to 1 litre
Adjust to pH 7.0
Filter sterilized (0.22 µM)
SSC Buffer (20x)
175.2 g NaCl
88.2 g Tris: Sodium Citrate
dH2O to 1 litre
Adjust to pH 7.0-7.2
TBE Buffer (10X)
121.1 g Tris Base
61.83 g Boric acid
18.6 g EDTA
dH2O to 1 litre
Adjust to pH 8.0
252
TE Buffer
1.211 g Tris Base
0.372 g EDTA
dH2O to 1 litre
Adjust to pH 8.3
PBS
8 g NaCl
0.2 g KCl
1.44 g Na2HPO4
0.25 g KH2PO4
dH2O to 1 litre
Adjust to pH 7.5
TBS (5X)
12.1 g Tris
146.2 g NaCl
750 ml dH2O
Adjust to pH 7.5 and make up to 1 litre.
TTBS (5X)
200 ml 5X TBS
800 ml dH2O
1 ml Tween20
Adjust to pH 7.5 and make up to 1 litre.
Semi-dry transfer buffer
2.9g Glycine
5.8 g Tris Base
1.85 ml 20% SDS
750 ml dH2O
Check pH is 8.3
200 ml Methanol and make up to 1 litre.

253
Appendix II – Oligonucleotides used in this study
Primers used for cloning deletion constructs
Primer Name Sequence (5’-3’) Description
2823_3’F CGGAATTCAGTGACCGTTTGGCC ncRv13661
targeting plasmid
2823_3’R CGACTAGTCCCGCCAGTTGCTTC ncRv13661
targeting plasmid
2823_5’F GTAGATATCGCAATGGAAAGCAC ncRv13661
targeting plasmid
2823_5’R GCCGAATTCTGCGAAAGTTACGA ncRv13661
targeting plasmid
G2KOnewFHind
CGCGGCCGCCGACTCACCAATGGG
ncRv11690
targeting plasmid
G2KOnewRNot
CAAGCTTGTCAACGCCTGCTCCAGTTGC
ncRv11690
targeting plasmid
G2SDMF GGATGATGACCCGTTGTCTCTAGACCCTACC
GCCCAGCG
ncRv11690
targeting plasmid
G2SDMR CGCTGGGCGGTAGGGTCTAGAGACAACGGG
TCATCATCC
ncRv11690
targeting plasmid
F6RevXbaI
GGTCTAGACGAGTGATCGGG
ncRv10243
targeting plasmid
F6ForXbaI
GGTCTAGATGGGCTTGCCC
ncRv10243
targeting plasmid
F6RevSDM GGGGCAAGCCCAAAAAGATCTAGACCGAGT
GATCGGGTACCC
ncRv10243
targeting plasmid
F6ForSDM GGGTACCCGATCACTCGGTCTAGATCTTTTT
GGGCTTGCCCC
ncRv10243
targeting plasmid
Primers used for cloning complementing constructs
Primer Name Sequence (5’-3’) Description
2823compF GGGGATCCGCGCCCTAGCCGCC
ncRv13661
complementing plasmid
2823compR GGGAAGCTTTGTCGATTGCCGAGTCGTTG ncRv13661
complementing plasmid
F6compF GAAAAGCTTGCCGCTGTTGACCAG
ncRv10243
complementing plasmid
F6compR CGGATCCCTGCGCGGGCTGA
ncRv10243
complementing plasmid
G2compF CGGAAGCTTAACCCGCCAAAGATAAGTCA ncRv11690
complementing plasmid
G2compR
CGA TCT AGA ACG TCC TCG ACG TCC TCG
GGT
ncRv11690
complementing plasmid

254
Primers used for PCR screening of SCO and DCO colonies
Primer Name Description Sequence (5’-3’)
F6pair2F ncRv10243 deletion
screening
CCGGCGGCCAAGGTGTG
F6pair2R ncRv10243 deletion
screening
ACGGCGTCAAGCGGTTCATTAC
F6pair3F ncRv10243 deletion
screening
GTGGGCGGTGCGGTGCTCAAACA
F6pair3R ncRv10243 deletion
screening
GGGCCTGCGTGCGCTCTACCTCTA
G2pair2F ncRv11690 deletion
screening
GCAGCTCGCGGCACCACCAAACAC
G2pair2R ncRv11690 deletion
screening
GCGCGGCCCGGGAAACCTCTG
G2pair3F ncRv11690 deletion
screening
AGCGCAGGTCGTGGCCAATGTAGG
G2pair3R ncRv11690 deletion
screening
ACGGCACCAAGTTCGGCAAATCAA
2823pair2F ncRv13661 deletion
screening
CGCCGCGCCGTGCTGAAGTC
2823pair2R ncRv13661 deletion
screening
GCTGCGCCCGGAGGTATTGGTGT
2823pair3F ncRv13661 deletion
screening
CCACCGCGACCCCCGATGACC
2823pair3R ncRv13661 deletion
screening
CGACCCGCTGGCTCCGCTAATGG
Oligonucleotides used for probe creation for northern blotting
Riboprobe Name Sequence (5’-3’)
2823nrt gcacccacgcggagtcatagccacgataacggcagaaCCTGTCTC
G2nrt atcgatgcatccccaccccatccctcgagataagCCTGTCTC
F6nrt cggatagccccgtgttgttgtctgaCCTGTCTC
2048nrtLONG gacctgcggtttcatccacaaaatctgggctgcgtgaactaaatgtCCTGTCTC
2660nrtLONG aacctttcggtggttgcaccgagtcagttcacatttagttcacgcagcCCTGTCTC

255
Primers used for qRT-PCR in ncRv10243 investigation
Primer Name Sequence (5-3’)
16sTqmF TCCCGGGCCTTGTACACA
16sTqmR CCACTGGCTTCGGGTGTTA
F6TqmF GGATAGCCCCGTGTTGTTG
F6TqmR GGGATTGCCCCGCATT
Rv0693TqmF CGATCCCGGCGAGTTG
Rv0693TqmR TGCGTTCCAGTTCGTCGAT
Rv0694TqmF GGAGGCTGCCGAAATCG
Rv0694TqmF CGACCGTGATTCCCTTTTCA
Rv1130TqmF TGAAGTGATCGTGGACGAACTG
Rv1130TqmR CTGTTCAACGGGTTCCACTACA
Rv0169TqmF CGGGCTGGGCGATAAGTT
Rv0169TqmR GCGAATTGAGGTCATCCAGAA
Rv0440TqmF CGTCGTCCTGGAAAAGAAGTG
Rv0440TqmR GGTCTTCTTGGCTACCTCTTTGAC
Rv3418cTqmF CGTTGCGGAGGGTGACA
Rv3418cTqmR TCCTCGCCGTTGTACTTGATC
Rv0990cTqmF GGCCGCGCACGATCT
Rv0990cTqmR CGTTTTTCCAGCCTGACATCA
Rv0991cTqmF TTCAAAGGCACCGGCTTCTA
Rv0991cTqmR TGGTCTGGCTCTTGGACTTCTT

256
Primers used for qRT-PCR in ncRv11690 investigation
Primer Name Sequence (5’- 3’)
G2TqmF CTTCAGCGGGGGGCTTAT
G2TqmR ATCTTATCTCGAGGGATGGGG
DesA3TqmF GGCGCTGCGGTTCATG
DesA3TqmR CAGGTCCGGATAGAGGTGATG
Rv1535TqmF GACGCGCAGCCTTTCG
Rv1535TqmR CCACAACGCGGCGTAGAG
Rv3841TqmF TGCAATGATGCTCGTGCAA
Rv3841TqmR TCTACGCCGGGAATTTCG
Rv0791cTqmF ACATCCAGGGCACCATCTTC
Rv0761cTqmR CCGGCCTTATACATCGACAAC
Rv0846cTqmF CGACTGAGCCAGGCCACTA
Rv0846cTqmR GCCGTCCGTCCAATCG
Rv0634BTqmF CACCGTAACTACATCACCAAAAAGA
Rv0634BTqmR CGCAATTCGGGCAGAACT
Rv2582TqmF CCGATTAGCCTGTGCTTTCG
Rv2582TqmR CGTTCGAGTTTGCGTTTGG
Rv3116TqmF GCCCGCCGAGTTCGA
Rv3116TqmR TCGCCTTTGGGTATCAAGATG
Rv2338cTqmF TGTCGCAACCTTGGATTGATT
Rv2338cTqmR GCGATTGCAACGCGACTAT
Rv0891cTqmF GATGTTGGCCGATGTGAGTTC
Rv0891cTqmR CGTCTAATCCCTGGTTGGCTAT

257
Primers used for qRT-PCR in ncRv13661 exponential phase investigation
Primer Name Sequence (5’-3’)
2823TqmF GGCGCCCAGCATGGT
2823TqmR CATCTGCTGTTCGCAATTACG
Rv1130TqmF TGAAGTGATCGTGGACGAACTG
Rv1130TqmR CTGTTCAACGGGTTCCACTACA
Rv1131TqmF CGGGATCTTGCCCAACCT
Rv1131TqmR GAAGCTGGCGATGTCGAATC
Rv2931TqmF CTGCGAGTGCCTGAGAAAGAG
Rv2931TqmR GAATCGCCATTGCCATAAGG
Rv1813cTqmF CGCCAACGGTTCGATGTC
Rv1813cTqmR CAATCGCCCCGTAATGGATA
Rv2948cTqmF GCATAGGTTTGCCGTTGTTGA
Rv2948cTqmR CGCCACGCACCAATTTC
Rv1935cTqmF CGGCACTGCTGATCAAGGA
Rv1935cTqmR AGCTGGTGGATCTTGAAGCAA
Rv2598TqmF CTACCACCTCCAATCCCATACC
Rv2598TqmR CGCGTGCAGCGTTCAC
Rv0676cTqmF CGCCCATGCGTTTTACG
Rv0676cTqmR CCCCCAAAAGTCCTGCAA
Rv0678TqmF TGATCCAATTTGGGTTCATTGA
Rv0678TqmR GCCCGGATGCGTTCAC
Rv2428TqmF TGCTAACCATTGGCGATCAA
Rv2428TqmR ACAGGTCACCGCCGATGA
Rv2934TqmF AAGGCGCGTCCTTGCAT
Rv2934TqmR CGAATAGTGTCAGCGTTGTTGAG
Rv1592TqmF TGACCCAAATGGAGCTGTTG
Rv1592TqmR GGTACTGATACCGCCCATCCT

258
Primers used for qRT-PCR in ncRv13661 stationary phase investigation
Primer Name Sequence (5’-3’)
Rv0270TqmF TCGACCAGCTGGAGAAAACC
Rv0270TqmR CCGGATACGAACACGATCTTC
Rv0721TqmF GTCGCTGGGCAGTGACAAC
Rv0721TqmR GACGTCCTCTATCGGCAAACC
Rv0867cTqmF CCTTGCCACCGATTTGGA
Rv0867cTqmR TTCTTCGTATAGGCGATGTTCGA
Rv1252cTqmF GCCCGATACCTATGGGTTCA
Rv1252cTqmR CGTCAATGCCACCGTGTCT
Rv2140cTqmF GCGGTGAAGGTCGAAAAGC
Rv2140cTqmR CGTGCTGGAACAGGTTGAATC
Rv2692TqmF CCGCAACGAGTGGCTGTT
Rv2692TqmR TGACGGCCTCTTCGATCAG
Rv2725cTqmF GGCTGTGCAGGTTAAGGTTATTG
Rv2725cTqmR GCATGCTGGGCAAAGATGT
Rv2884TqmF GCTCACCGAATTCAAACTCATG
Rv2884TqmR GCCGAGTCCGGGTGAAC
Rv2342TqmF CGTGGCCAGGTCGATGAT
Rv2342TqmR CAGGGTCACAAACCCAGCAT
Primers used for qRT-PCR in ncRv13661 propionate growth investigation
Primer Name Sequence (5’-3’)
Rv1217cTqmF TGGGTGCGGTCGGAATC
Rv1217cTqmR GCCGAATCACCGTGAGGAT
Rv1218cTqmF AAGCGCTGTGCGAAAAGG
Rv1218cTqmR CGTCTAGTGAACCGCTTTCGA
Rv1219cTqmF ATGGCCGAGATCGAATCCT
Rv1219cTqmR CGCCGGATTGCATGCT
Primers used for qRT-PCR in ncRv12659 investigation
Primer Name Sequence (5-3’)
16sTqmF TCCCGGGCCTTGTACACA
16sTqmR CCACTGGCTTCGGGTGTTA
5’q12659F CACCGGCCCACTAGTGAAAC
5’q12659R GGATGAAACCGCAGGTCAA
3’q12659F TGACCTGCGGTTTCATCCA
3'q12659R TGCACCGAGTCAGTTCACATTTA
2658cTqmF CGAAGCTTCACGAGCTGAGA
2658cTqmR GCGCCTCTGCTATTGATGGA
2659cTqmF GGCTGAAGCAGCGTGGAAT
2659cTqmR TTGTCCAGCAGTTTGCGATAGT
Rv3229cTqmF GGCGCTGCGGTTCATG
Rv3229cTqmR CAGGTCCGGATAGAGGTGATG

259
Appendix III
SNP analysis from High throughput sequencing of gDNA extracted from M. tb strains
SNP type coding_type codon_change aminoacid_change gene gene_name H37Rv_allele * derived_allele * H37Rv ΔncRv11690B ΔncRv10243 ΔncRv13661
293606 intergenic - - - - - G T G G T G
293607 intergenic - - - - - A C A A C A
337959 coding nonsynonymous aTc/aGc I372S Rv0279c PE_PGRS4 A C C C C A
1212228 coding synonymous ggA/ggC G223 Rv1087 PE_PGRS21 A C A A A C
1313338 intergenic - - - - - A G A A A G
1313339 intergenic - - - - - A C A A A C
1780588 coding synonymous cgC/cgG R130 Rv1575 Rv1575 C G G G G C
1916491 coding synonymous gcG/gcA A181 Rv1691 Rv1691 G A G A G G
2864730 coding nonsynonymous Cgg/Tgg R102W Rv2541 Rv2541 C T C C T C
3054724 coding nonsynonymous Agc/Ggc S271G Rv2741 PE_PGRS47 A G G G G A
3278306 coding synonymous ttC/ttT F1470 Rv2940c mas G A G G G A
3278390 coding synonymous gtT/gtC V1442 Rv2940c mas A G A A A G
3278391 coding nonsynonymous gTt/gGt V1442G Rv2940c mas A C A A A C
3550149 intergenic - - - - - G A G G G A
4101048 intergenic - - - - - G A G G G A
4101049 intergenic - - - - - T G T T T G
4178146 intergenic - - - - - C T C C T C
17
JHD2 JHD3 JHD4 JHD5
SNPs number: 3 1 7 12
* bases are relative to the forward strand, but the codon_change column is strand correct

260
Appendix IV – Microarray results for ΔncRv11690
ID Corrected p-value p-value
Fold change regulation
MtH37Rv-0097 (1I1) 0.04241779 5.99E-04 2.97 down
MtH37Rv-0098 (1J1) 0.04769973 9.11E-04 2.24 down
MtH37Rv-0128 (8J2) 0.04241779 6.56E-04 2.27 down
MtH37Rv-0310c (2I18) 0.04241779 2.90E-04 2.05 down
MtH37Rv-0348 (2I22) 0.04241779 5.34E-04 2.21 down
MtH37Rv-0465c (1B21) 0.04241779 5.51E-04 2.05 down
MtH37Rv-0467 (9O14) 0.04567742 7.71E-04 2.36 down
MtH37Rv-0565c (9M17) 0.049999036 0.001881779 2.12 down
MtH37Rv-0634B (11F14) 0.04241779 2.64E-04 2.79 down
MtH37Rv-0644c (9O22) 0.04769973 0.001017182 2.17 down
MtH37Rv-0760c (3N19) 0.04241779 3.97E-04 2.07 down
MtH37Rv-0761c (3O19) 0.04769973 0.00104955 2.66 down
MtH37Rv-0846c (4K3) 0.04769973 0.001120128 2.73 down
MtH37Rv-0854 (4I4) 0.04121322 8.95E-05 2.07 down
MtH37Rv-0888 (4O6) 0.048158832 0.001643126 2.23 down
MtH37Rv-0891c (4I7) 0.04075228 1.43E-05 2.48 down
MtH37Rv-0925c (4I10) 0.04121322 8.96E-05 2.17 down
MtH37Rv-1008 (5E5) 0.04241779 3.51E-04 2.07 down
MtH37Rv-1078 (5F11) 0.04241779 6.45E-04 2.29 down
MtH37Rv-1374c (5N1) 0.04769973 0.00120875 2.04 down
MtH37Rv-1490 (5O11) 0.04769973 0.001425657 2.11 down
MtH37Rv-1498c (5N12) 0.04241779 3.01E-04 2.41 down
MtH37Rv-1515c (5C14) 0.04769973 0.001143594 2.54 down
MtH37Rv-1535 (10A22) 0.04769973 0.001074942 3.95 down
MtH37Rv-1724c (7J21) 0.04964896 0.001846333 2.34 down
MtH37Rv-1749c (7K23) 0.04769973 0.001240551 2.03 down
MtH37Rv-1754c (7O23) 0.04241779 3.32E-04 2.53 down
MtH37Rv-1860 (7F8) 0.04241779 3.33E-04 2.50 down
MtH37Rv-1885c (7C11) 0.04241779 4.51E-04 2.55 down
MtH37Rv-1980c (6O6) 0.04241779 6.31E-04 2.30 down
MtH37Rv-2000 (6L14) 0.04241779 5.45E-04 2.59 down
MtH37Rv-2001 (6M14) 0.04241779 4.91E-04 2.43 down
MtH37Rv-2140c (6I19) 0.04121322 1.57E-04 2.08 down
MtH37Rv-2185c (6N23) 0.04241779 5.42E-04 2.16 down
MtH37Rv-2281 (5K21) 0.048893973 0.001685406 2.16 down
MtH37Rv-2288 (8O13) 0.04769973 9.55E-04 2.63 down
MtH37Rv-2289 (5P21) 0.041673273 1.76E-04 2.63 down
MtH37Rv-2299c (5P22) 0.045126397 7.14E-04 2.97 down
MtH37Rv-2332 (6A2) 0.04241779 2.67E-04 2.1 down
MtH37Rv-2338c (6G2) 0.04769973 8.80E-04 2.00 down
MtH37Rv-2429 (6D10) 0.04964896 0.001792336 2.59 down
MtH37Rv-2520c (8P21) 0.04567742 7.60E-04 2.73 down
MtH37Rv-2529 (6E19) 0.04769973 0.001481529 2.10 down
MtH37Rv-2560 (6C22) 0.04121322 1.46E-04 2.42 down
MtH37Rv-2563 (8M23) 0.04121322 9.75E-05 2.18 down
MtH37Rv-2582 (6E24) 0.04121322 4.36E-05 2.94 down
MtH37Rv-2699c (10F4) 0.04769973 9.20E-04 3.53 down
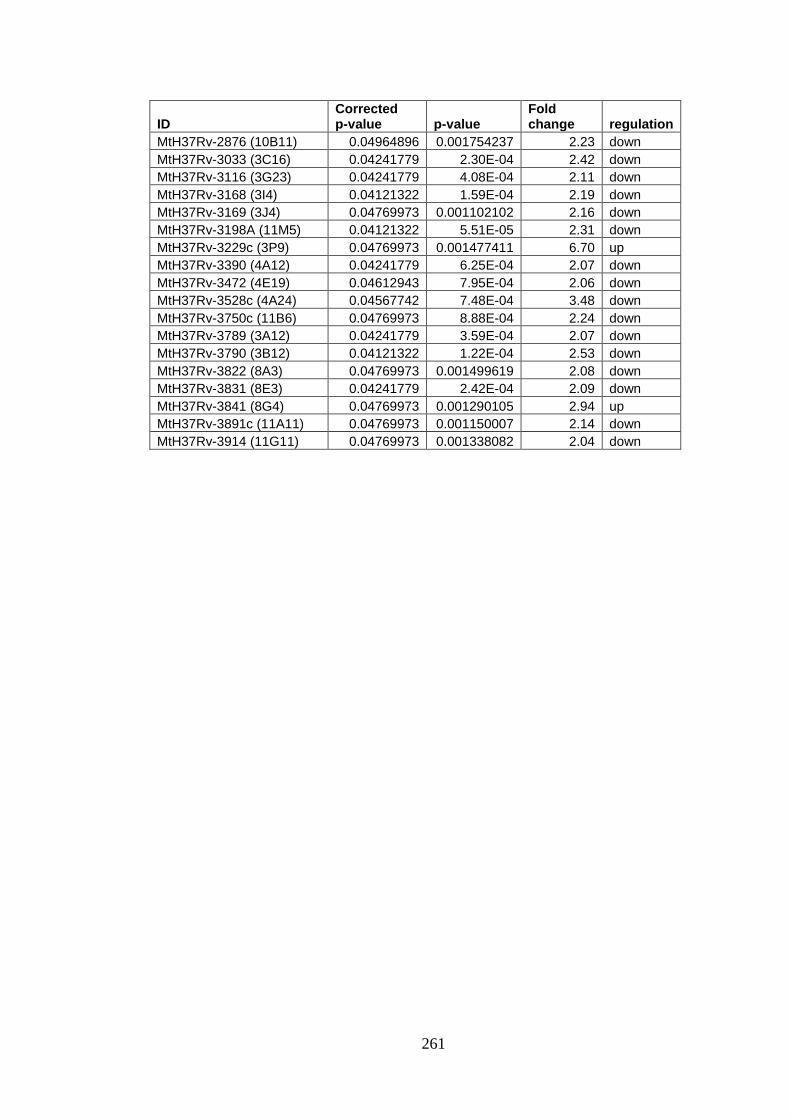
261
ID Corrected p-value p-value
Fold change regulation
MtH37Rv-2876 (10B11) 0.04964896 0.001754237 2.23 down
MtH37Rv-3033 (3C16) 0.04241779 2.30E-04 2.42 down
MtH37Rv-3116 (3G23) 0.04241779 4.08E-04 2.11 down
MtH37Rv-3168 (3I4) 0.04121322 1.59E-04 2.19 down
MtH37Rv-3169 (3J4) 0.04769973 0.001102102 2.16 down
MtH37Rv-3198A (11M5) 0.04121322 5.51E-05 2.31 down
MtH37Rv-3229c (3P9) 0.04769973 0.001477411 6.70 up
MtH37Rv-3390 (4A12) 0.04241779 6.25E-04 2.07 down
MtH37Rv-3472 (4E19) 0.04612943 7.95E-04 2.06 down
MtH37Rv-3528c (4A24) 0.04567742 7.48E-04 3.48 down
MtH37Rv-3750c (11B6) 0.04769973 8.88E-04 2.24 down
MtH37Rv-3789 (3A12) 0.04241779 3.59E-04 2.07 down
MtH37Rv-3790 (3B12) 0.04121322 1.22E-04 2.53 down
MtH37Rv-3822 (8A3) 0.04769973 0.001499619 2.08 down
MtH37Rv-3831 (8E3) 0.04241779 2.42E-04 2.09 down
MtH37Rv-3841 (8G4) 0.04769973 0.001290105 2.94 up
MtH37Rv-3891c (11A11) 0.04769973 0.001150007 2.14 down
MtH37Rv-3914 (11G11) 0.04769973 0.001338082 2.04 down
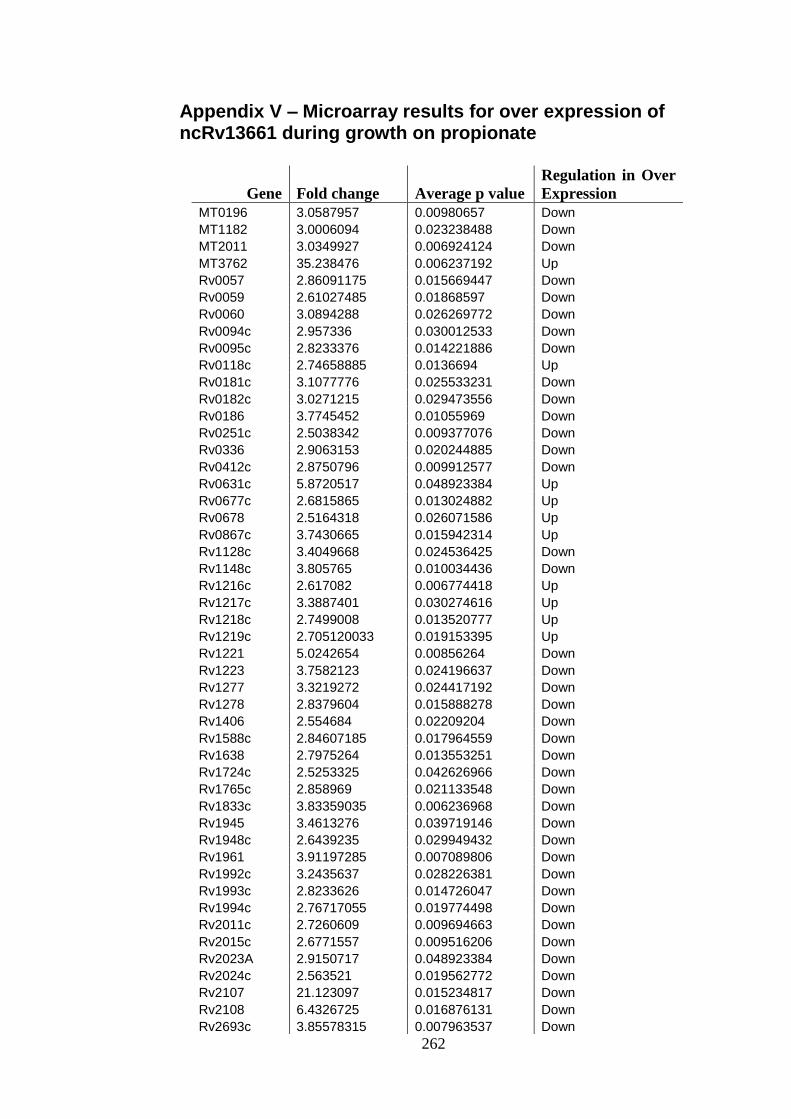
262
Appendix V – Microarray results for over expression of ncRv13661 during growth on propionate
Gene Fold change Average p value
Regulation in Over
Expression
MT0196 3.0587957 0.00980657 Down
MT1182 3.0006094 0.023238488 Down
MT2011 3.0349927 0.006924124 Down
MT3762 35.238476 0.006237192 Up
Rv0057 2.86091175 0.015669447 Down
Rv0059 2.61027485 0.01868597 Down
Rv0060 3.0894288 0.026269772 Down
Rv0094c 2.957336 0.030012533 Down
Rv0095c 2.8233376 0.014221886 Down
Rv0118c 2.74658885 0.0136694 Up
Rv0181c 3.1077776 0.025533231 Down
Rv0182c 3.0271215 0.029473556 Down
Rv0186 3.7745452 0.01055969 Down
Rv0251c 2.5038342 0.009377076 Down
Rv0336 2.9063153 0.020244885 Down
Rv0412c 2.8750796 0.009912577 Down
Rv0631c 5.8720517 0.048923384 Up
Rv0677c 2.6815865 0.013024882 Up
Rv0678 2.5164318 0.026071586 Up
Rv0867c 3.7430665 0.015942314 Up
Rv1128c 3.4049668 0.024536425 Down
Rv1148c 3.805765 0.010034436 Down
Rv1216c 2.617082 0.006774418 Up
Rv1217c 3.3887401 0.030274616 Up
Rv1218c 2.7499008 0.013520777 Up
Rv1219c 2.705120033 0.019153395 Up
Rv1221 5.0242654 0.00856264 Down
Rv1223 3.7582123 0.024196637 Down
Rv1277 3.3219272 0.024417192 Down
Rv1278 2.8379604 0.015888278 Down
Rv1406 2.554684 0.02209204 Down
Rv1588c 2.84607185 0.017964559 Down
Rv1638 2.7975264 0.013553251 Down
Rv1724c 2.5253325 0.042626966 Down
Rv1765c 2.858969 0.021133548 Down
Rv1833c 3.83359035 0.006236968 Down
Rv1945 3.4613276 0.039719146 Down
Rv1948c 2.6439235 0.029949432 Down
Rv1961 3.91197285 0.007089806 Down
Rv1992c 3.2435637 0.028226381 Down
Rv1993c 2.8233626 0.014726047 Down
Rv1994c 2.76717055 0.019774498 Down
Rv2011c 2.7260609 0.009694663 Down
Rv2015c 2.6771557 0.009516206 Down
Rv2023A 2.9150717 0.048923384 Down
Rv2024c 2.563521 0.019562772 Down
Rv2107 21.123097 0.015234817 Down
Rv2108 6.4326725 0.016876131 Down
Rv2693c 3.85578315 0.007963537 Down

263
Gene Fold change
Average p value
Regulation in Over
Expression
Rv2710 2.8844397 0.013936628 Down
Rv2717c 3.7130489 0.023848809 Down
Rv2719c 2.864418833 0.013706735 Down
Rv2734 2.8250954 0.017285895 Down
Rv2742c 3.17499335 0.017598349 Down
Rv2934 2.5031354 0.048960336 Down
Rv2974c 2.9324815 0.010789794 Down
Rv3017c 4.145676 0.003636259 Down
Rv3191c 4.200498 0.01055969 Down
Rv3201c 2.8019693 0.016812492 Down
Rv3223c 2.6593902 0.017057654 Down
Rv3252c 2.6010687 0.027826516 Down
Rv3269 2.8918612 0.00440765 Down
Rv3270 2.7440443 0.017680854 Down
Rv3370c 2.63619445 0.020636477 Down
Rv3463 2.8282888 0.008852384 Down
Rv3466 2.5057275 0.00440765 Down
Rv3585 2.5827568 0.012668396 Down
Rv3639c 3.3419392 0.03373858 Down
Rv3640c 4.40455655 0.024131601 Down
Rv3641c 5.045832667 0.029639102 Down
Rv3644c 2.7123706 0.008372897 Down
Rv3776 3.0363762 0.01542011 Down
Rv3839 3.7717898 0.049165383 Down
TBFG_11172 4.214123 0.02545547 Down
TBMG_04080 3.3390186 0.042626966 Down
TBMG_04100 3.1477306 0.00980657 Down
TBMG_04100 2.8947976 0.009516206 Down

264
Appendix VI - In vivo testing of ΔncRv13661 (DCO 3.21)
Figure S1 Survival of the ΔncRv13661 in a macrophage model of infection
Survival of Wildtype M. tb H37Rv, ΔncRv13661, and complementing strain
within naive a) and IFN-γ activated BMDM b) over a time course of infection.
Significance was tested with One-way ANOVA p>0.05. Data is the mean and
standard deviation of triplicate infections.

265
Figure S2 Survival of ΔncRv13661 from aerosol infected mice.
Survival of wildtype M. tb H37Rv, ΔncRv13661, and complement within the
lungs and spleens of Balb/C mice. The data represents the averages and standard
deviations from 5 mice per time point. Significance was tested with Two-way
ANOVA.