Mycobacterium tuberculosis nitrogen assimilation and host colonization require aspartate
21
1 Aspartate is required for Mycobacterium tuberculosis nitrogen 1 assimilation and host colonization 2 3 4 Alexandre Gouzy 1,2 , Gérald Larrouy-Maumus 3 , Ting-Di Wu 4,5 , Antonio Peixoto 1,2 , 5 Florence Levillain 1,2 , Geanncarlo Lugo-Villarino 1,2 , Jean-Luc Gerquin-Kern 4,5 , Luiz 6 Pedro Sório de Carvalho 3 , Yannick Poquet 1,2 & Olivier Neyrolles 1,2 * 7 8 1 Centre National de la Recherche Scientifique, Institut de Pharmacologie et de Biologie 9 Structurale, Toulouse, France 10 2 Université de Toulouse, Université Paul Sabatier, Institut de Pharmacologie et de Biologie 11 Structurale, Toulouse, France 12 3 Mycobacterial Research Division, MRC National Institute for Medical Research, London, 13 UK 14 4 Institut Curie, Laboratoire de Microscopie Ionique, Orsay, France 15 5 INSERM U759, Orsay, France 16 17 * E-mail: [email protected] 18 19 20 21 22 23 24 25 26 27 28 29
Transcript of Mycobacterium tuberculosis nitrogen assimilation and host colonization require aspartate

1
Aspartate is required for Mycobacterium tuberculosis nitrogen 1 assimilation and host colonization 2 3 4 Alexandre Gouzy1,2, Gérald Larrouy-Maumus3, Ting-Di Wu4,5, Antonio Peixoto1,2, 5 Florence Levillain1,2, Geanncarlo Lugo-Villarino1,2, Jean-Luc Gerquin-Kern4,5, Luiz 6 Pedro Sório de Carvalho3, Yannick Poquet1,2 & Olivier Neyrolles1,2 * 7 8 1Centre National de la Recherche Scientifique, Institut de Pharmacologie et de Biologie 9 Structurale, Toulouse, France 10 2Université de Toulouse, Université Paul Sabatier, Institut de Pharmacologie et de Biologie 11 Structurale, Toulouse, France 12 3Mycobacterial Research Division, MRC National Institute for Medical Research, London, 13 UK 14 4Institut Curie, Laboratoire de Microscopie Ionique, Orsay, France 15 5INSERM U759, Orsay, France 16 17 *E-mail: [email protected] 18 19 20 21 22 23 24 25 26 27 28 29

2
Abstract 1 Here we identify the amino acid transporter AnsP1 as the unique aspartate importer in the 2 human pathogen Mycobacterium tuberculosis. Metabolomic analysis of a mutant inactivated 3 in AnsP1 revealed the transporter is essential for M. tuberculosis to assimilate nitrogen from 4 aspartate, and to grow with aspartate as sole nitrogen source. Virulence of the AnsP1 mutant 5 is impaired in vivo, revealing aspartate is a primary nitrogen source required for host 6 colonization by the tuberculosis bacillus. 7 8 Main 9
Mycobacterium tuberculosis, the causative agent of tuberculosis (TB), is still responsible 10 for nearly 1.5 million deaths annually, and new drugs and vaccines are needed to achieve 11 eradication in the decades to come. In this context, a better understanding of M. tuberculosis 12 metabolic requirements during host colonization may help identify targets for novel 13 antimicrobials. For instance, flexible catabolic pathways allowing utilization of host-derived 14 fatty acids, cholesterol and glucose, were reported to provide M. tuberculosis with multiple 15 carbon and energy sources, and to play a key part in mycobacterial physiology and virulence1-16 5. Inhibitors of such pathways represent today one of the most promising therapeutic 17 approaches for TB in combination with the current set of antibiotics5. 18
In addition to carbon, nitrogen is an essential component of biomolecules, including amino 19 acids, nucleotides and organic cofactors. While M. tuberculosis carbon metabolism has been 20 intensively studied over the past years, nitrogen sources used by the pathogen during infection 21 have yet to be identified6. Recent studies have substantiated past observations establishing 22 amino acids (asparagine, in particular) as the favorite in vitro nitrogen source for M. 23 tuberculosis in comparison to inorganic nitrogen donors (e.g. ammonia or nitrates)6-9. In the 24 present study, we asked whether asparagine (or any other related amino acid) could indeed 25 serve as a nitrogen source, and ultimately, play a role in the physiology and virulence of the 26 TB bacillus. To address this question, we reasoned that elements involved in the acquisition 27 of amino acids, such as the putative asparagine transporter AnsP1/Rv2127 (ref. 10) might be 28 ideal target candidates to shed light on this process. Using a combination of microbial 29 genetics, metabolomics, mass spectrometry imaging and in vivo exploration, we now provide 30 unequivocal evidence that AnsP1 is an essential transporter in the assimilation of nitrogen 31

3
from aspartate, alluding that aspartate-dependent pathways may enhance the fitness of M. 1 tuberculosis during colonization of its host. 2 3
We chose to inactivate the AnsP1-encoding gene (Supplementary Fig. 1) largely due to the 4 strong potential of AnsP1 to be an asparagine transporter in M. tuberculosis10, as reflected by 5 the 55% identity and 70% similarity to the Salmonella enterica asparagine transporter AnsP11. 6 Yet, when we evaluated the capacity of the ansP1-knock out (KO) mutant to grow in minimal 7 medium containing asparagine or other structurally related amino acids (i.e. glutamine and 8 glutamate) as sole nitrogen sources, there was no significant growth defect as compared to the 9 wild-type strain (Fig. 1a). This result suggested that AnsP1 is either irrelevant for the 10 transport of these amino acids or compensated by unknown transporters with redundant 11 substrate affinities. Notwithstanding, we found that the ansP1-KO strain was strikingly 12 unable to grow with aspartate as sole nitrogen source, a phenotype that was fully reversed 13 upon genetic complementation of the mutant with a cosmid encompassing the ansP1 region 14 of the genome (Fig. 1a,b). This surprising phenotype was observed either when aspartate was 15 given from the start of the culture (Fig. 1a), or when the nitrogen source was switched to 16 aspartate after initial bacterial replication (Fig. 1c), indicating AnsP1 is continuously required 17 for growth on aspartate. We excluded a possible toxic effect of aspartate to the ansP1-KO 18 mutant because i/ the loss of viability of the mutant over time was not different in the 19 presence of aspartate compared to that in a culture medium void of any nitrogen source (Fig. 20 1d), and ii/ the growth of the mutant normally resumed upon addition of a second nitrogen 21 source (i.e. asparagine), to an aspartate-containing culture medium (Fig. 1e). Beyond the 22 essential role as a nitrogen source, we tested the capacity of aspartate to support 23 mycobacterial growth when provided as a sole carbon and energy source. In line with a 24 previous report12, we found aspartate failed to foment mycobacterial growth when 25 provided as sole carbon and energy source even in the presence of ammonium as a nitrogen 26 source, unless glycerol was included (as a carbon source) to the medium (Fig. 1f). 27 Nevertheless, our metabolomics analysis of bacteria grown on U-13C-aspartate revealed 28 the presence of 13C in various metabolites, including α-ketoglutarate for instance 29 (Supplementary Fig. 2). In fact, the addition of glycerol enhanced the carbon 30 incorporation from aspartate (Supplementary Fig. 2), indicating a synergistic utilization 31 of carbon sources in M. tuberculosis, as we previously reported2. Finally, as proof-of-32 principle, we demonstrated AnsP1 is an aspartate importer using 14C-labeled aspartate in a 33 standard amino acid transport assay (Fig. 1g). Collectively, our results show AnsP1 is the 34

4
unique aspartate importer in M. tuberculosis, and this amino acid transporter is strictly 1 required for growth of the pathogen with aspartate as sole nitrogen source, although 2 aspartate-derived carbon can enter the mycobacterial carbon flux to some extends. 3
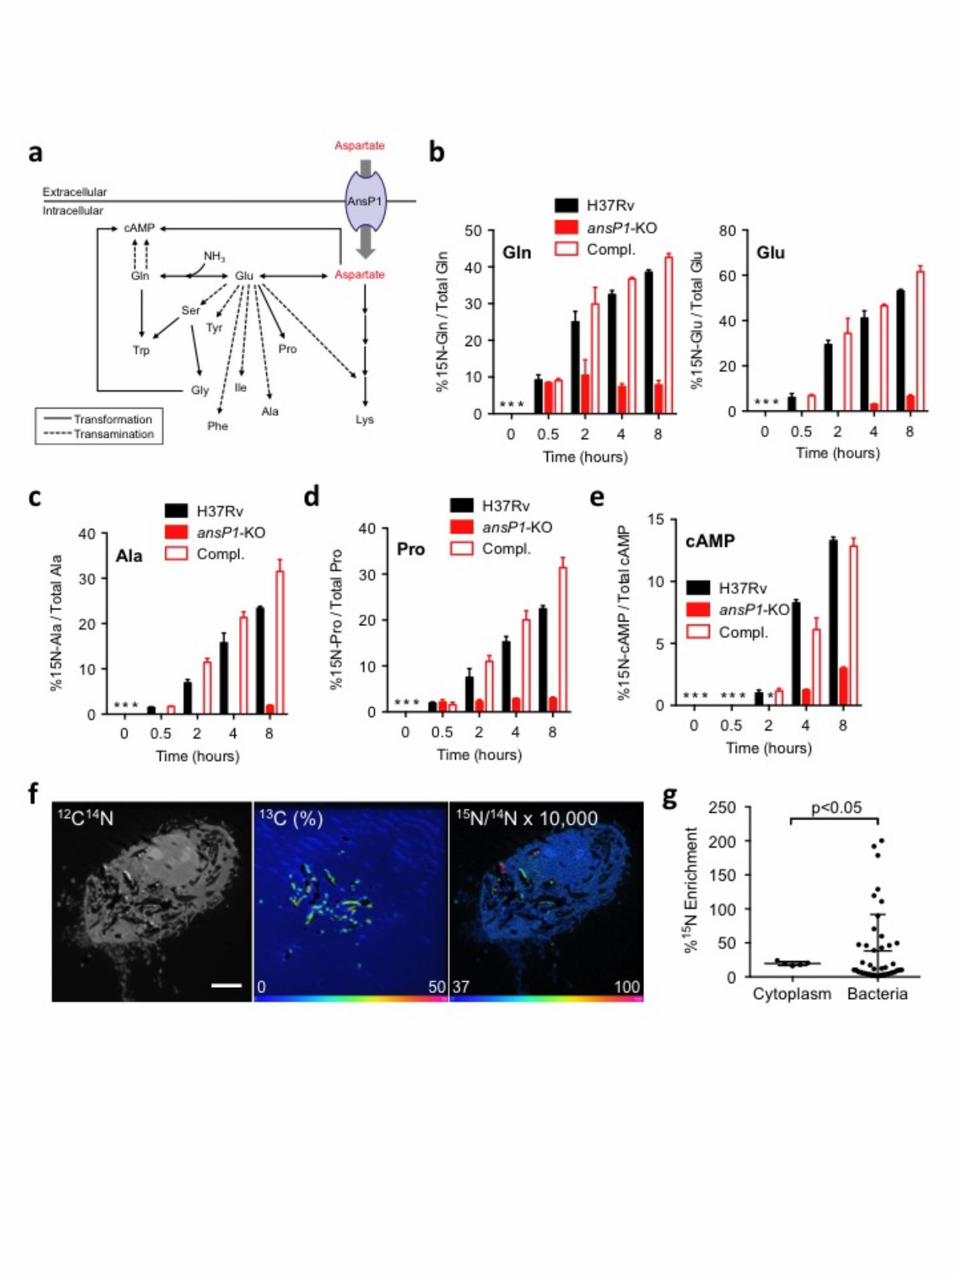
To further explore the contribution of aspartate to nitrogen assimilation in M. tuberculosis, 4 we conducted a series of metabolomic investigations, using stable isotopic labeling. The 15N 5 incorporation from 15N-labeled aspartate into the mycobacterial N-containing metabolome 6 (defined here as all extractable N-containing small molecules present in the bacterium), was 7 followed by liquid chromatography accurate time-of-flight mass spectrometry (TOF-MS; Fig. 8 2a & Supplementary Fig. 3a). In M. tuberculosis H37Rv, the 15N assimilation was first 9 observed in glutamine and glutamate, two amino acids that play an important role in nitrogen 10 assimilation and storage (Fig. 2b). This result is in agreement with previous studies showing 11 nitrogen incorporation takes place first in these two major nitrogen-acceptor and -donor 12 species in bacteria13,14. In the ansP1-KO mutant, however, the nitrogen transfer from 13 aspartate into glutamine and glutamate was diminished and completely abolished, 14 respectively, a phenotype that was reversed by genetic complementation (Fig. 2b). This 15 deficiency in nitrogen assimilation was specific to aspartate as nitrogen-donor given that the 16 ansP1-KO mutant was able to incorporate it from 15N2-asparagine at a rate similar to those 17 observed for the wild-type and complemented strains (Supplementary Fig. 3b). Similar to 18 glutamine and glutamate, the mutant strain was impaired in nitrogen incorporation into 19 secondary N-containing metabolites resulting either from transamination reactions (Fig. 2a), 20 such as alanine (Fig. 2c), serine, tyrosine, phenylalanine and isoleucine (Supplementary Fig. 21 4a), or from other N-incorporation reactions (Fig. 2a), such as proline (Fig. 2d), glycine, 22 lysine and tryptophan (Supplementary Fig. 4b). As expected, the 15N-labeling of nucleosides, 23 that are biosynthetically more distant from aspartate, such as cyclic adenosine monophosphate 24 (cAMP), could not be detected in the mutant strain (Fig. 2a,e). Therefore, our results 25 unequivocally demonstrate that aspartate-derived nitrogen is fully assimilated in M. 26 tuberculosis, and this process is exclusively AnsP1-dependent. 27
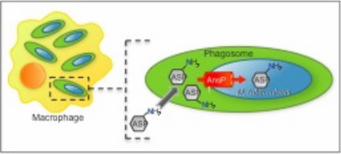
In order to assess the physiological relevance of our findings, we next asked whether M. 28 tuberculosis could access aspartate inside its natural cellular niche, namely the macrophage. 29 Indeed, M. tuberculosis is a facultative intracellular pathogen that resists innate antimicrobial 30 mechanisms and thrives inside macrophages and other phagocytes15. To address this 31 question, we used an ionic micro-probe based on dynamic secondary ion mass 32 spectroscopy (D-SIMS), a powerful technology that allows spatial imaging of elemental 33 and isotopic distribution with high resolution16. Murine macrophages were infected for 20 34
5
hrs with 13C-labeled M. tuberculosis H37Rv, and pulsed with 15N-aspartate for 4 hrs before 1 fixation and analysis. The 13C-labeled bacteria were unambiguously localized inside infected 2 cells (Fig. 2f, middle panel). Aspartate-derived 15N signal was found distributed in spots (Fig. 3 2f, right panel), and a correlation analysis showed every 15N-containing spots co-localized 4 with a spot from a bacterium. Interestingly, a fraction of intracellular bacteria presented a 15N 5 enrichment higher than that observed in the host cell cytoplasm, as compared to the 6 background natural isotopic signal observed in the resin (Fig. 2g, Supplementary Fig. 5). 7 Analysis of multiple cells indicated that at least ~35% of the mycobacterial phagosomes 8 were reproducibly enriched in 15N, as compared to the host cell cytoplasm. These results 9 strongly suggested M. tuberculosis could access aspartate inside host macrophages. The 10 bimodal distribution of 15N-aspartate accumulation within the M. tuberculosis vacuoles 11 (Fig. 2g & Supplementary Fig. 5b) is reminiscent of the distribution observed for 12 various maturation markers to the mycobacterial phagosomes17,18. Such heterogeneity 13 likely reflects variability of the metabolic status of the phagocytosed bacteria. Whether 14 aspartate accumulates differentially to the vacuoles depending on various cellular 15 parameters (e.g. differentiation program, activation status) remains to be elucidated. 16
To validate the pertinence of our findings during the infection context, we first tested 17 the ability of the ansP1-KO mutant to proliferate inside macrophages. Since aspartate is 18 accessible as a nitrogen source in the mycobacterial phagosome, we were surprised to 19 find no growth defect for the mutant strain in either resting or activated macrophages 20 (Supplementary Fig. 6). To further investigate the role of Ansp1 in survival in vivo, we 21 conducted infection experiments in immune-deficient (SCID) or -competent (C57BL/6) 22 animals. Contrary to our in vitro approach with macrophages, we observed the virulence 23 of the ansP1-KO mutant was severely compromised both in immuno-deficient SCID (Fig. 3a) 24 and immuno-competent C57BL/6 (Fig. 3b) mice, as compared to the wild-type and 25 complemented strains. Consistent with the reduced bacterial load observed in animals infected 26 with the mutant strain, immuno-histopathology analysis revealed this strain induces smaller 27 granulomas than its wild-type and complemented counterparts (Fig. 3c,d) further evidencing 28 that Ansp1 is involved in M. tuberculosis virulence. The apparent discrepancy between our 29 models of infection most likely reflects the complexity of the nutritional environment 30 and immune-mediated pressure encountered by the bacteria in vivo, as compared to the 31 less physiological conditions encountered in the in vitro culture systems. 32
33
6
Collectively, our results indicate AnsP1 is required for M. tuberculosis virulence, most 1 likely because it allows the bacteria to capture aspartate and incorporate nitrogen from host 2 tissues. Importantly, we found that M. tuberculosis can access aspartate inside host cells. In 3 line with our findings, aspartate was found among the most abundant molecules in M. 4 tuberculosis infection sites in a guinea pig model19. While nitrate- and urea-derived 5 ammonium are often considered important potential sources of nitrogen for M. tuberculosis 6 during infection20, amino acids are usually underestimated from this point of view. 7 Interestingly, however, M. tuberculosis mutants inactivated in urea hydrolysis (ureC mutant) 8 or nitrate reduction (narG mutant) pathways are not attenuated in mice21,22. Although urea and 9 nitrate can participate in mycobacterial resistance to acidic or hypoxic stresses22,23, these 10 results suggest these compounds most likely do not constitute major nitrogen donors in vivo. 11 In this context, our results reveal for the first time that amino acids serve as an important 12 nitrogen source for M. tuberculosis during infection. 13
A limited number of M. tuberculosis amino acid transporters have been studied so far6. 14 Here we show that AnsP1 is the unique aspartate transporter in this pathogen. This finding is 15 unexpected because AnsP1 belongs to the family of Amino Acid Transporters (AAT, 16 2.A.3.1 family24) and is not homologous to classical bacterial Dicarboxylate Amino 17 Acid:Cation Symporter (DAACS, 2.A.23 family25) usually involved in aspartate uptake. 18 Of note, we found the AnsP1 homologue AnsP2 (Supplementary Fig. 7a) cannot 19 compensate for AnsP1 deficiency in aspartate transport, since a mutant inactivated in 20 the ansP2 gene is able to grow on aspartate as sole nitrogen source (Supplementary Fig. 21 7b). The role of AnsP2 and of the other M. tuberculosis putative amino acid transporters in 22 mycobacterial physiology and virulence remains to be elucidated. Furthermore, the AnsP1 23 transporter is duplicated in the obligate pathogen Mycobacterium leprae, the causative agent 24 of leprosy (Supplementary Fig. 7a), and all the other amino acid transporters found in M. 25 tuberculosis are either deleted or pseudogenized in this species26. This suggests an important 26 role for aspartate utilization in pathogenicity of the leprosy bacillus as well. 27
In conclusion, we propose aspartate is a primary nitrogen source for M. tuberculosis during 28 infection, and AnsP1 as an essential aspartate transporter that ultimately enhances this 29 pathogen’s fitness within its host. A number of important and non-redundant pathways 30 involved in the synthesis of nucleotides, cofactors, coenzyme A, and amino acids rely on 31 aspartate as initial nitrogen provider. We envision such aspartate-dependent pathways may 32 constitute a novel “chink in the armor” for TB and possibly leprosy bacilli to be targeted for 33 therapeutic purposes. 34

7
Acknowledgments 1 We thank Claude Gutierrez and Denis Hudrisier for carefully reading the manuscript and 2 helpful suggestions. We thank Laurence Lepourry and Flavie Moreau for technical assistance 3 with mouse infections. We thank Alan Benard for providing mouse cells, and Roland Brosch 4 for providing the I257 cosmid. We thank Yannick Verkindère (YV Photographiste, Toulouse, 5 France) for help with graphical work. We thank the PICT-IBiSA imaging facility in the 6 Institut Curie. This work was supported by Agence Nationale de la Recherche (ANR, 7 Contracts SLC-TB & TB-HITS), MRC (MC_UP_A253_1111), and the EU FP7 programme 8 NEWTBVAC (Contract n° 241745). This work also benefited from the TRI RIO Optical 9 Imaging Platform at IPBS (Genotoul, Toulouse, France) supported by grants from the Région 10 Midi-Pyrénées (CPER), the Grand Toulouse community, the ARC (ARC Equipement 11 N°8505), the CNRS and the EU through the FEDER program. AG and GLV hold a 12 fellowship from the Fondation pour la Recherche Médicale (FRM). The funders had no role 13 in study design, data collection and analysis, decision to publish, or preparation of the 14 manuscript. 15
16 Author’s contribution 17 AG, JLGK, LPSDC, YP and ON designed the experiments. AG, GLM and TDW performed 18 the experiments, with technical assistance from AP, FL, and JLGK. AG, GLM, TDW, AP, 19 JLGK, LPSDC, YP and ON analyzed the results. AG, GLM, GLV, LPSDC, YP and ON 20 wrote the manuscript. 21 22 Competing financial interests 23 The authors declare no competing financial interests. 24 25 26 27

8
Figure legends 1 Figure 1. AnsP1 is essential for M. tuberculosis growth on aspartate as sole nitrogen 2 source. 3 (a-f) Growth of M. tuberculosis H37Rv, the ansP1-KO mutant and the ansP1-KO 4 complemented (Compl.) strains in various conditions. Growth was measured by 5 monitoring turbidity (a-c, e, f) or CFU scoring (d); data represent mean ±s.d. of triplicate 6 samples and are representative of at least three independent experiments. (a) Bacteria were 7 grown in minimal medium containing 5 mM asparagine (Asn), aspartate (Asp), glutamine 8 (Gln) or glutamate (Glu), as sole nitrogen sources. (b) Bacteria were grown in minimal 9 medium containing 5 mM aspartate as sole nitrogen source. (c) Bacteria were grown for 5 10 days in minimal medium containing 5 mM asparagine (Asn) as sole nitrogen source, after 11 what asparagine was replaced by 5 mM aspartate (Asp) for the rest of the experiment. (d) 12 Bacteria were grown for 30 days in minimal medium void of any nitrogen source (w/o N 13 source) or supplemented with 5 mM aspartate (Asp) as sole nitrogen source. (e) Bacteria were 14 grown as in (d), and asparagine was added to the culture medium to a final concentration of 5 15 mM after 30 days of bacterial growth. (f) Bacteria were grown in minimal medium containing 16 50 mM aspartate (Asp) only, 50 mM aspartate and 15 mM ammonium (Asp+NH4
+), or 50 17 mM aspartate and 10 g/L glycerol (Asp+Gro), as nitrogen or carbon sources. (g) 14C-aspartate 18 uptake assay with M. tuberculosis H37Rv, the ansP1-KO mutant and its complemented 19 strains (Compl.). Bacteria previously grown in 7H9 with 5 mM aspartate, were harvested and 20 resuspended in an uptake buffer containing a mix of 14C-radiolabeled and non-labeled 21 aspartate to obtain a final concentration of 20 μM aspartate. Bacteria were incubated at 37°C 22 and samples were removed; bacteria-associated 14C radioactivity was quantified at the 23 indicated time points. Data are expressed as the number of disintegrations per minute (DPM) 24 per total protein concentration (14C-Asp (DPM).μg protein-1), represent mean ±s.d. of 25 triplicate samples, are representative of three independent experiments, and were analyzed 26 using the Student’s t test; *, P<0.05; **, P<0.01. 27 28 Figure 2. AnsP1 is essential for Mycobacterium tuberculosis nitrogen assimilation from 29 aspartate. 30 (a) Schematic representation of nitrogen incorporation pathways from aspartate into various 31 N-containing metabolites resulting from transamination (dotted line) and/or transformation 32 (plain lines) reactions. (b-e) Frequency of 15N-glutamine and 15N-glutamate (b), 15N-alanine 33

9
(c), 15N-proline (d) and 15N-cAMP (e), detected in the presence of 15N-aspartate (2 mM) in 1 either M. tuberculosis wild type (H37Rv), the ansP1-KO mutant, or its complemented strain 2 (Compl.). In (b-e), data represent mean±s.d. of triplicate samples and are representative of at 3 least two independent experiments. *, no signal detected. Any signal below 5-10% 4 corresponds to background noise. (f) 13C-labeled bacteria were used to infect mouse bone 5 marrow-derived macrophages (BMM) at a multiplicity of infection of 10 bacteria per 6 cell for 4 hrs, after which cells were washed and pulsed with fresh medium. At 20 hrs 7 post-infection, cells were pulsed for 4 hrs with 2 mM 15N-aspartate, and 13C and 15N 8 isotope compositions were analyzed by dynamic secondary ion mass spectrometry (D-9 SIMS). Images display a representative infected cell, as derived from D-SIMS. Left 10 panel is the as recorded 12C14N- image showing the histological aspect of the cell (scale 11 bar represents 5 µm). The central panel represents the 13C atomic fraction map (in %) 12 of the corresponding area, which allows the identification of the mycobacteria within the 13 cell. The image is displayed in HSI (Hue-Saturation-Intensity) color scale with linear 14 scale bar. Highly labeled bacteria appear purple, those moderately labeled in yellowish-15 green, all contrast with the natural background level in blue. The right panel, also 16 displayed in HIS color scale, shows the 15N/14N ratio image indicating the 15N-aspartate 17 uptake. For enhanced visibility, the ratio was multiplied by 1x10⁴. The 15N/14N ratio at 18 natural 15N abundance appears blue. (g) Quantification of 15N isotope enrichment 19 (compared to the resin) in surface areas chosen in the cell cytoplasm (n=5), and intracellular 20 13C labeled bacteria (n=43). Data represent mean ±s.d. and were analyzed using the Student’s 21 t test. The 15N-enriched phagosomes, arbitrarily defined as those vacuoles with a 15N 22 enrichment above mean+3s.d. of that observed in the host cell cytoplasm, represent 23 34.9% of all phagosomes. 24 25 Figure 3. AnsP1 is involved in Mycobacterium tuberculosis virulence. 26 (a) Immuno-deficient SCID mice (n=7) were infected intranasally with 500 CFUs of M. 27 tuberculosis wild-type (H37Rv), the ansP1-KO mutant or its complemented strain (Compl.) , 28 and survival was monitored over time. Data are representative of two independent 29 experiments, and were analyzed using the Kaplan-Meier method. (b) C57BL/6 mice were 30 infected intranasally with 500 CFUs of M. tuberculosis wild-type (H37Rv), ansP1-KO or its 31 complemented strain (Compl.). At day 21 and 42 after infection, the mice were sacrificed, and 32 their lung and spleen homogenates were plated onto agar for CFU scoring. Each dot 33

10
corresponds to one animal. Data were analyzed using the Student’s t test and are 1 representative of three independent experiments. (c) Immuno-histological analysis of the 2 lungs of C57BL/6 mice infected for 21 days with M. tuberculosis H37Rv (left panel), the 3 ansP1-KO mutant (middle panel) or the complemented mutant (right panel). Images represent 4 Z-stacks of 30 μm sections showing F4/80 in blue (macrophages), CD4 (T cells) in green and 5 Gr1 in red (neutrophils, monocytes). Bar represents 100 μm (d) Granuloma size was 6 calculated as the surface area occupied by F4/80 positive cells (dotted white lines in (c)) for 4 7 independent granulomas. Data were analyzed using the Student’s t test. In (c) and (d), data are 8 representative of two independent experiments. NS, not significant. 9 10

11
Online Methods 1 Mycobacteria and classic culture conditions 2 Mycobacteria were grown at 37°C in Middlebrook 7H9 medium (Difco) supplemented with 3 10% albumin-dextrose-catalase supplement (Difco) and 0.05% Tween-80 (Sigma), or on 4 Middlebrook 7H11 agar medium (Difco) supplemented with 10% oleic acid-albumin-5 dextrose-catalase supplement (OADC, Difco). When required, kanamycine or hygromycine 6 were added to the culture media to a final concentration of 50 μg/ml. 7 8 Construction of ansP1-KO and ansP2-KO mutants and complemented strains 9 ansP1-KO and ansP2-KO mutant strains of Mycobacterium tuberculosis H37Rv containing 10 disrupted ansP1 (Rv2127)::KanR or ansP2 (Rv0346c)::KanR alleles were constructed by 11 allelic exchange using a recombineering method27. H37Rv:pJV53 was grown in 7H9-ADC-12 Tween80 in the presence of hygromycin until mid-log phase and induced by 0.2% acetamide 13 (Sigma) overnight at 37°C. After induction, electrocompetent bacteria were prepared. 14 Electroporation was performed with linearized digestion fragments of kanamycine resistant 15 cassette-interrupted genes flanking with homologous regions (400-700 pb length). After 72 h 16 incubation at 37 °C, bacteria were plated onto 7H11-OADC agar medium in the presence of 17 kanamycin. For complemented strain construction, the pYUB412-derived integrative cosmid 18 I257 encompassing the region 2,377.9-2,415.5 kb in the genome of M. tuberculosis H37Rv, 19 and containing a hygromycin resistance cassette28 was used. Mutation and complementation 20 events were verified by PCR and sequencing using the following primers: P1, 5’-21 TTCGTCGGCGAACCCACCTTTCCCG-3’, and P2, 5’-TCATCAAGTCACCGGCACCGT 22 GGAA-3’, for the ansP1-KO strain; P3, 5’-CGGGTACTTGGGATGGGCCG TCACA-3’, 23 and P4, 5’-GTGACCAGCACTATGGGCAGCAGA-3’, for the ansP2-KO strain. 24 25 Macrophages & infection procedure 26 Bone marrow cells were flushed from the femurs and tibias of 6-8 weeks old female C57BL/6 27 mice, and cultured in Petri dishes (2.106 cells/dish) in RPMI 1640 GlutaMax (GIBCO) 28 supplemented with 10% fetal calf serum (FCS, Pan-Biotech) and 20 ng/ml macrophage 29 colony-stimulating factor (M-CSF, Peprotech) at 37°C in the presence of 5% CO2. At day 6, 30 cells were transferred to 24-well plastic plates (2.105 cells/well). For macrophage activation, 31 cells were incubated with 10 ng/ml interferon-gamma (IFNγ, Peprotech) over night prior 32 infection. Infection was performed in triplicate at a multiplicity of infection of 0.1 bacterium 33 per cell for 4 h at 37°C. Cells were then washed 2 times with DPBS before addition of fresh 34
12
medium. At day 0, 2, 5 and 7, cells were lysed in 0.01% Triton X-100 (Sigma), and serial 1 dilutions of the lysates were plated onto 7H11-OADC agar medium for CFU scoring. 2 3 Mouse infection 4 All animal experiments were performed in animal facilities that meet all legal requirements in 5 France and by qualified personnel in such a way to minimize discomfort for the animals. All 6 procedures including animal studies were conducted in strict accordance with French laws 7 and regulations in compliance with the European community council directive 68/609/EEC 8 guidelines and its implementation in France. All protocols were reviewed and approved by the 9 Comité d'Ethique Midi-Pyrénées (reference MP/04/26/07/03). Six- to eight-week-old female 10 C57BL/6 or SCID mice were anesthetized with a cocktail of ketamine (60 mg/kg; Merial) and 11 xylasine (10 mg/kg; Bayer) and infected intranasally with 500 CFUs of the various 12 mycobacterial strains in 25 μl of PBS-0.01% Tween 80. After infection, SCID mice were 13 sacrificed when first signs of hurt were observed. For C57BL/6 mice, at time 21 and 42 days 14 post-infection, mice were sacrificed and lung and spleen homogenates were plated onto 7H11 15 agar plates for CFU scoring. In parallel, lungs of infected mice were filled with 2% low 16 melting agarose and fixed for 24 hours in a Periodate-Lysine-Paraformaldehyde (PLP) 17 fixative. After fixation, lungs were incubated in serial incubations in sucrose solutions (10, 20 18 and 30%). Finally, lungs were sectioned (30 μm) and stained for confocal microscopy with 19 F4/80 Pacific Blue, CD4 Alexa 488 and Gr1 Alexa 647 (Biolegend). Z stacks were acquired 20 in an Olympus FV1000 confocal microscope and analyzed in Imaris software (Bitplane). 21 22 M. tuberculosis growth in minimal media 23 Bacteria were grown in Sauton’s modified medium containing 0.05% Tween-80, 0.5 g/L 24 KH2PO4, 0.5 g/L MgSO4, 2 g/L citric acid, 10 g/L glycerol and 5 mM aspartate, asparagine, 25 glutamate, glutamine or ammonium sulfate (pH 6.5-7.0). In media prepared for carbon 26 assimilation, aspartate and ammonium sulfate were added at a final concentration of 50 mM 27 and 15 mM, respectively, Tween-80 was replaced by 0.05 % tyloxapol (Sigma) and citrate 28 was omitted. Cultures were performed in triplicate in glass tubes and bacterial growth was 29 monitored by plating onto 7H11-OADC agar medium and CFU scoring, or by measuring 30 turbidity (in McFarland units) over time using a Densimat apparatus (BioMerieux). 31 32 33 34
13
14C-Aspartate uptake experiment 1 Aspartate uptake experiments were carried out as described before for asparagine with minor 2 modification8. Bacteria were grown in Middlebrook 7H9 containing 0.05% Tween 80 and 3 aspartate (5mM) at 37°C. Bacteria were harvested by centrifugation when an OD600 of 0.5 4 was reached. Bacterial pellets were washed twice in uptake buffer [50 mM Tris-HCl pH 6.9, 5 15 mM KCl, 10 mM (NH4)2SO4, 0.05% Tween 80] and resuspended in the same buffer. 6 Radiolabeled 14C-aspartate (PerkinElmer, Purity: 97 atom % 14C) and non-labeled aspartate 7 (Sigma) were mixed and added to cell suspensions to obtain a final concentration of 20 μM 8 aspartate. The mixtures were incubated at 37°C and 250 µl of samples were removed at the 9 indicated time points. Bacteria were collected on a 0.45 μm Spin-X centrifuge tube filter 10 (Costar) by mixing with an equal volume of 10% paraformaldehyde (PFA, Polyscience, Inc) 11 containing 0.1 M LiCl (Sigma). Filters radioactivity was determined in a liquid scintillation 12 counter (Packard). The uptake rate was expressed in desintegration per minute (DPM) per 13 total protein concentration (14C-Asp (DPM).μg protein-1). 14 15 Metabolite extraction experiments 16 Bacteria were cultivated to an OD600 of 1 in 7H9-0.05% Tween-80. Bacteria were centrifuged 17 and resuspended in DPBS (3-fold concentration). 1 mL was transferred to a filter (Fisher) 18 mounted on a filtration device (Fisher) and connected to a trap and vacuum line. Filters were 19 transferred to solid media containing 0.5 g/L KH2PO4, 0.5 g/L MgSO4, 2 g/L citric acid, 10 20 g/L glycerol, aspartate (2mM) and 1.5% agar (Invitrogen) prepared in tap water and 21 neutralized to pH 6.5-7.0 with NaOH before autoclaving. Plates were incubated for 5 days at 22 37°C. Three filters were used per strain and time point. For labeling experiments, filters were 23 transferred on equivalent plates where aspartate was replaced by 15N-aspartate (2 mM, Sigma, 24 Purity 98 atom % 15N) and incubated for 0.5, 2, 4 or 8 hours at 37°C. For U-13C 25 incorporation experiments, bacteria were cultivated in the same conditions without 26 citric acid and with or without glycerol (10 g/L); next, aspartate was replaced by 13C 27 aspartate (2 mM, Sigma, Purity 98 atom % 13C). 15N incorporation from asparagine was 28 evaluated following the same procedure, except that aspartate was replaced by 29 asparagine and that 7H10 was used instead of solid minimal medium; in this case, 15N2-30 asparagine (Sigma, Purity 98 atom % 15N) was used. At each time point, filters were 31 plunged into 1 mL acetonitrile/methanol/water (2:2:1, v/v/v) mixture at -40°C. Bacteria were 32 then broken by glass beads using a bead-beater (5 min at 30 m/s). After centrifugation, 33
14
supernatants were collected and filtered through a Spin-X column 0.2 µm at 14,000 rpm for 1 15 minutes. Extracts were stored at -80ºC before analysis. 2 3 Liquid chromatography-mass spectrometry 4 Aqueous normal phase liquid chromatography was performed using an Agilent 1200 LC 5 system equipped with a solvent degasser, binary pump, temperature-controlled auto-sampler 6 (set at 4°C) and temperature-controlled column compartment (set at 20°C), containing a 7 Cogent Diamond Hydride Type C silica column (150 mm × 2.1 mm; dead volume 315 µl), 8 from Microsolv Technology Corporation. Flow-rate of 0.4 ml/min was used. Elution of polar 9 metabolites was carried out using gradient 3 (ref. 29). Briefly, solvent A consists in deionized 10 water (Resistivity ~ 18 MΩ cm), 0.2% acetic acid and solvent B consists in acetonitrile and 11 0.2% acetic acid, and the gradient as follows: 0 min 85% B; 0-2 min 85% B; 2-3 min to 80% 12 B; 3-5 min 80% B; 5-6 min to 75% B; 6-7 min 75% B; 7-8 min to 70% B; 8-9 min 70% B; 9-13 10 min to 50% B; 10-11 min 50% B; 11-11.1 min to 20% B; 11.1-14 min hold 20% B. 14 Accurate mass spectrometry was carried out using an Agilent Accurate Mass 6230 TOF 15 apparatus. Dynamic mass axis calibration was achieved by continuous infusion, post-16 chromatography, of a reference mass solution using an isocratic pump connected to a 17 Multimode ionization source, operated in the positive-ion mode. ESI capillary and fragmentor 18 voltages were set at 3,500 V and 100 V, respectively. The nebulizer pressure was set at 40 psi 19 and the nitrogen drying gas flow rate was set at 10 L/min. The drying gas temperature was 20 maintained at 250°C. The MS acquisition rate was 1.5 spectra/sec and m/z data ranging from 21 80-1,200 were stored. This instrument routinely enabled accurate mass spectral measurements 22 with an error of less than 5 parts-per-million (ppm), mass resolution ranging from 10,000-23 25,000 over the m/z range of 121-955 atomic mass units, and a 100,000-fold dynamic range 24 with picomolar sensitivity. Data were collected in the centroid mode in the 4 GHz (extended 25 dynamic range) mode. Detected m/z were deemed to be identified metabolites on the basis of 26 unique accurate mass-retention time identifiers for masses exhibiting the expected distribution 27 of accompanying isotopomers2. Typical variation in abundance for most of the metabolites 28 stayed between 5 and 10% under these experimental conditions. 29 30 Stable isotope labeling analysis 31 Under the experimental conditions described above, M+1 arising from 15N incorporation can 32 be readily distinguished from M+1 arising from natural abundance 13C or from 13C labeling, 33 therefore allowing direct monitoring of 15N labeling and 13C labeling. The extent of 15N or 13C 34

15
labeling for each metabolite was determined by dividing the summed peak height ion 1 intensities of all 15N or 13C labeled species by the ion intensity of both labeled and unlabeled 2 species, expressed in percent. 3 4 Secondary ion mass spectrometry 5 For 13C labeling, bacteria were grown in minimal medium containing 0.5 g/L KH2PO4, 0.5 6 g/L MgSO4, 15 mM NH4SO4, 10 g/L 13C3-glycerol (Sigma, Purity: 99 atom % 13C) 7 supplemented with 0.05% tyloxapol (Sigma) and neutralized to pH 6.5-7.0 with NaOH before 8 filtration. IFN�-activated macrophages, plated on cover glasses, were infected at a 9 multiplicity of infection of 10 bacteria per cell with 13C labeled-bacteria for 4 hours. At 20h 10 post-infection, the culture medium was replaced by fresh RPMI containing 10% FCS and 2 11 mM 15N-aspartate. After 4h at 37°C, cells were fixed with 4% PFA, 2.5% Glutaraldehyde in 12 a 0.1 M cacodylate buffer (pH 7.4) and dehydrated through successive 30%, 50%, 70%, 90% 13 and 100% ethanol baths. Cells were then directly included in Epoxy resin prior to D-SIMS 14 analysis. Epoxy resin was prepared by mixing 4.63 mL of EMBed-812 (Sigma) and 3.70 15 mL of Epoxy embedding medium-hardener DDSA (Sigma) at room temperature under 16 agitation until homogeneity was freached. Then, 1.39 mL of Epoxy embedding medium-17 hardener MNA (Sigma) was added to the mix prior the addition of 280 μL N,N-18 Dimethylbenzylamine (Sigma). Once dehydrated, cover glasses containing cells were 19 incubated with Ethanol:Epoxy resin (2:1) for one hour, Ethanol:Epoxy resin (1:2) for 20 one hour, before final incubation in pure Epoxy resin for one hour. Epoxy resin was 21 then replaced by fresh Epoxy resin before incubation of the samples overnight at room 22 temperature. Polymerization of Epoxy resin was performed at 65°C during 12 hours. 23 150-nm thin section were deposited on clean Silicon chips and were inserted into a 24 NanoSIMS-50 Ion microprobe (CAMECA, Gennevilliers, France) operating in scanning 25 mode16. For the present study, by using a Cs+ primary ion beam tightly focused to a 26 typical probe size of ≈85 nm (distance between 16%-84% of peak intensity from a line 27 scan), five secondary ion species (12C–, 13C–, 12C14N–, 12C15N–, 31P–) were monitored 28 simultaneously. The primary beam steps over the surface of the sample to create images 29 of the selected ion species. The identification of bacteria location was highlighted by high 30 13C content while the aspartate uptake was revealed by 15N enrichment. After careful 31 Cs+ ion implantation to get steady state ion emission, the acquisition was carried out 32 using multiframe mode. The primary beam intensity was 1 pA and the raster size was 33 from 20 to 35 μm in order to image a whole cell with an image definition of 512 x 512 34
16
pixels. With a Dwell time of 2 ms per pixel, up to 15 frames were acquired and the total 1 analysis time was 2 hours. Image treatment was performed using ImageJ software30. 2 First, multiframe images were properly aligned using CN- images as reference before a 3 summed image was obtained for each ion species. A map of 13C atomic fraction was 4 deduced from 12C- and 13C- images. In parallel, ROI's (region of interest) were manually 5 defined based on the 13C- map so as to outline individual bacterium for data extraction. 6 For 15N/14N ratio quantification, a sample containing no labelled cells was used as 7 working reference for adjusting the detectors. Further, a check was performed on the 8 resin area surrounding the observed cells. The final 13C map, as well as the one for 9 15N/14N ratio, are displayed in Hue-Saturation-Intensity (HSI) mode. These HSI color 10 images were generated using OpenMIMS, an ImageJ plugin developped by Claude 11 Lechene's Laboratory31. 12 13 14 15 16 17

17
References 1 2 1. McKinney, J.D. et al. Nature 406, 735-8 (2000). 3 2. de Carvalho, L.P. et al. Chem Biol 17, 1122-31 (2010). 4 3. Marrero, J., Trujillo, C., Rhee, K.Y. & Ehrt, S. PLoS Pathog 9, e1003116 (2013). 5 4. Pandey, A.K. & Sassetti, C.M. Proc Natl Acad Sci U S A 105, 4376-80 (2008). 6 5. Rhee, K.Y. et al. Trends Microbiol 19, 307-14 (2011). 7 6. Cook, G.M. et al. Adv Microb Physiol 55, 81-182, 318-9 (2009). 8 7. Lyon, R.H., Hall, W.H. & Costas-Martinez, C. J Bacteriol 117, 151-6 (1974). 9 8. Song, H. et al. Mol Microbiol 80, 900-18 (2011). 10 9. Song, H. & Niederweis, M. J Bacteriol 194, 956-64 (2012). 11 10. Cole, S.T. et al. Nature 393, 537-44 (1998). 12 11. Jennings, M.P., Anderson, J.K. & Beacham, I.R. Microbiology 141 ( Pt 1), 141-6 13 (1995). 14 12. Youmans, A.S. & Youmans, G.P. J Bacteriol 65, 96-9 (1953). 15 13. Reitzer, L. Annu Rev Microbiol 57, 155-76 (2003). 16 14. Yuan, J., Fowler, W.U., Kimball, E., Lu, W. & Rabinowitz, J.D. Nat Chem Biol 2, 529-17 30 (2006). 18 15. Russell, D.G. Immunol Rev 240, 252-68 (2011). 19 16. Guerquin-Kern, J.L., Wu, T.D., Quintana, C. & Croisy, A. Biochim Biophys Acta 1724, 20 228-38 (2005). 21 17. Clemens, D.L. & Horwitz, M.A. J Exp Med 181, 257-70 (1995). 22 18. Xu, S. et al. J Immunol 153, 2568-78 (1994). 23 19. Somashekar, B.S. et al. J Proteome Res 10, 4186-95 (2011). 24 20. Amon, J., Titgemeyer, F. & Burkovski, A. J Mol Microbiol Biotechnol 17, 20-9 25 (2009). 26 21. Aly, S. et al. J Pathol 210, 298-305 (2006). 27 22. Lin, W. et al. Infect Immun 80, 2771-9 (2012). 28 23. Khan, A. & Sarkar, D. Microbiology 158, 301-7 (2012). 29 24. Jack, D.L., Paulsen, I.T. & Saier, M.H. Microbiology 146 ( Pt 8), 1797-814 (2000). 30 25. Saier, M.H., Jr. Microbiology 146 ( Pt 8), 1775-95 (2000). 31 32 33 34