Immune Response to Mycobacterium tuberculosis and Identification of Molecular Markers of Disease
12
Immune Response to Mycobacterium tuberculosis and Identification of Molecular Markers of Disease Mercedes Gonzalez-Juarrero 1 , Luke C. Kingry 1,2 , Diane J. Ordway 1 , Marcela Henao-Tamayo 1 , Marisa Harton 1 , Randall J. Basaraba 1 , William H. Hanneman 3 , Ian M. Orme 1 , and Richard A. Slayden 1,2 2 Rocky Mountain Regional Center of Excellence, 1 Department of Microbiology, Immunology and Pathology, and 3 Department of Environmental and Radiological Health Sciences, Colorado State University, Fort Collins, Colorado The complex molecular events that occur within the host during the establishment of a Mycobacterium tuberculosis infection are poorly defined, thus preventing identification of predictive markers of disease progression and state. To identify such molecular markers during M. tuberculosis infection, global changes in transcriptional response in the host were assessed using mouse whole genome arrays. Bacterial load in the lungs, the lesions associated with infection, and gene expression profiling was performed by compar- ing normal lung tissue to lungs from mice collected at 20, 40, and 100 days after aerosol infection with the H37Rv strain of M. tuberculosis. Quantitative, whole lung gene expression identified signature profiles defining different signaling pathways and immunological responses characteristic of disease progression. This includes genes representing members of the interferon-associated gene families, chemokines and cytokines, MHC, and NOS2, as well as an array of cell surface markers associated with the activation of T cells, macro- phages, and dendritic cells that participate in immunity to M. tuberculosis infection. More importantly, several gene transcripts encoding proteins that were not previously associated with the host response to M. tuberculosis infection, and unique molecular markers associated with disease progression and state, were identified. Keywords: tuberculosis; transcriptional response; immunity Tuberculosis is a world health problem, with reports estimating that as much as one third of world’s population is infected with the tubercle bacilli, and 2 million people die every year as a result. The prevalence and incidence of tuberculosis worldwide remain high despite the intense efforts by the World Heath Organization– sponsored directly observed therapy campaign and the avail- ability of routine diagnostic methods, a vaccine, and effective chemotherapy. Disease management has been hindered by the inability to objectively assess disease state, thus preventing a rational guide for patient management aimed at reducing the rate of relapse and spread. The characterization of the complex- ities of the immune response at different stages of infection, and identification of informative molecular markers, is one of the most difficult aspects of understanding pathogenesis and disease progression and in developing new strategies and tools to di- agnose and treat disease. Pulmonary exposure to Mycobacterium tuberculosis elicits both host innate and adaptive immune responses, yet the bacteria are still capable of establishing chronic infections. Much of the information about the immune response to infection and host susceptibility has been compiled from various techniques, in- cluding passive cell transfer (1–3), the use of mice with targeted gene disruptions (4, 5), as well as PCR, enzyme-linked immuno- sorbent assay, and flow cytometric methods (6, 7). Several studies have reported the transcriptional responses to M. tuberculosis infection, but none have analyzed global transcriptional changes in the host genes at different stages of chronic pulmonary infection with M. tuberculosis (8–14). This has resulted in limited knowledge of the dynamic transcriptional changes that occur during infection and disease progression. These data are needed to better understand the differences in host response at various stages of disease and to correlate these transcriptional changes with lesion morphology and disease progression. Thus, more comprehensive and global studies focusing on the host response to infection with M. tuberculosis have the potential to identify previously unrecognized immune mechanisms that better corre- late with disease progression and signature profiles that are pre- dictive of protection. In the present work, transcriptional profiling of uninfected mouse lungs and lungs harvested during development of disease (Day 20 through Day 100 of the infection) allowed for the correlation of the host immune response with the bacterial load and resulting pathology. The results of this study provide a global view of the dynamic changes in the host response throughout the progression of disease and identified gene transcripts expressing molecules that were poorly associated with the host response to M. tuberculosis infection. In addition to defining the trends in the immune response during pulmonary infection, molecular mark- ers of disease progression were identified. Together, this work characterizes the host response at different stages of disease and can be used as a foundation for further characterization of molecular mechanisms controlling disease progression as well as further development of molecular markers that best correlate with disease state or responses to vaccines and chemotherapy. MATERIALS AND METHODS Low Dose Aerosol Infection Six- to eight-week-old specific pathogen–free female C57BL/6 mice (Jackson Laboratories, Bar Harbor, ME) were infected with M. tuber- culosis H37Rv by low-dose aerosol exposure using a Glass-Col (Terre CLINICAL RELEVANCE This work characterizes the global host response at differ- ent stages of disease and can be used as a foundation for further development of molecular markers that best cor- relate with disease state or responses to vaccines and chemotherapy. (Received in original form July 8, 2008 and in final form August 22, 2008) This work was supported by NIH AI-055298 (to R.A.S.) and AI-44072 (to I.M.O.). This work was supported by resources and services provided by the Genomics Proteomics Core of the Rocky Mountain Regional Center of Excellence U54 AI065357. Correspondence and requests for reprints should be addressed to Richard A. Slayden, Ph.D., Rocky Mountain Regional Center of Excellence and Department of Microbiology, Immunology and Pathology, Colorado State University, Fort Collins, CO 80523-1682. E-mail: [email protected] This article has an online supplement, which is accessible from this issue’s table of contents at www.atsjournals.org Am J Respir Cell Mol Biol Vol 40. pp 398–409, 2009 Originally Published in Press as DOI: 10.1165/rcmb.2008-0248OC on September 11, 2008 Internet address: www.atsjournals.org
-
Upload
independent -
Category
Documents
-
view
2 -
download
0
Transcript of Immune Response to Mycobacterium tuberculosis and Identification of Molecular Markers of Disease

Immune Response to Mycobacterium tuberculosis andIdentification of Molecular Markers of Disease
Mercedes Gonzalez-Juarrero1, Luke C. Kingry1,2, Diane J. Ordway1, Marcela Henao-Tamayo1, Marisa Harton1,Randall J. Basaraba1, William H. Hanneman3, Ian M. Orme1, and Richard A. Slayden1,2
2Rocky Mountain Regional Center of Excellence, 1Department of Microbiology, Immunology and Pathology, and 3Department of Environmental
and Radiological Health Sciences, Colorado State University, Fort Collins, Colorado
The complex molecular events that occur within the host during theestablishment of a Mycobacterium tuberculosis infection are poorlydefined, thus preventing identification of predictive markers ofdisease progression and state. To identify such molecular markersduring M. tuberculosis infection, global changes in transcriptionalresponse in the host were assessed using mouse whole genomearrays. Bacterial load in the lungs, the lesions associated withinfection, and gene expression profiling was performed by compar-ing normal lung tissue to lungs from mice collected at 20, 40, and 100days after aerosol infection with the H37Rv strain of M. tuberculosis.Quantitative, whole lung gene expression identified signatureprofiles defining different signaling pathways and immunologicalresponses characteristic of disease progression. This includes genesrepresenting members of the interferon-associated gene families,chemokines and cytokines,MHC, and NOS2, as well as an array of cellsurface markers associated with the activation of T cells, macro-phages, and dendritic cells that participate in immunity to M.tuberculosis infection. More importantly, several gene transcriptsencoding proteins that were not previously associated with the hostresponse to M. tuberculosis infection, and unique molecular markersassociated with disease progression and state, were identified.
Keywords: tuberculosis; transcriptional response; immunity
Tuberculosis is a world health problem, with reports estimatingthat as much as one third of world’s population is infected with thetubercle bacilli, and 2 million people die every year as a result.The prevalence and incidence of tuberculosis worldwide remainhigh despite the intense efforts by the World Heath Organization–sponsored directly observed therapy campaign and the avail-ability of routine diagnostic methods, a vaccine, and effectivechemotherapy. Disease management has been hindered by theinability to objectively assess disease state, thus preventinga rational guide for patient management aimed at reducing therate of relapse and spread. The characterization of the complex-ities of the immune response at different stages of infection, andidentification of informative molecular markers, is one of themost difficult aspects of understanding pathogenesis and diseaseprogression and in developing new strategies and tools to di-agnose and treat disease.
Pulmonary exposure to Mycobacterium tuberculosis elicitsboth host innate and adaptive immune responses, yet the bacteriaare still capable of establishing chronic infections. Much of theinformation about the immune response to infection and hostsusceptibility has been compiled from various techniques, in-cluding passive cell transfer (1–3), the use of mice with targetedgene disruptions (4, 5), as well as PCR, enzyme-linked immuno-sorbent assay, and flow cytometric methods (6, 7). Several studieshave reported the transcriptional responses to M. tuberculosisinfection, but none have analyzed global transcriptional changesin the host genes at different stages of chronic pulmonaryinfection with M. tuberculosis (8–14). This has resulted in limitedknowledge of the dynamic transcriptional changes that occurduring infection and disease progression. These data are neededto better understand the differences in host response at variousstages of disease and to correlate these transcriptional changeswith lesion morphology and disease progression. Thus, morecomprehensive and global studies focusing on the host responseto infection with M. tuberculosis have the potential to identifypreviously unrecognized immune mechanisms that better corre-late with disease progression and signature profiles that are pre-dictive of protection.
In the present work, transcriptional profiling of uninfectedmouse lungs and lungs harvested during development of disease(Day 20 through Day 100 of the infection) allowed for thecorrelation of the host immune response with the bacterial loadand resulting pathology. The results of this study provide a globalview of the dynamic changes in the host response throughout theprogression of disease and identified gene transcripts expressingmolecules that were poorly associated with the host response toM. tuberculosis infection. In addition to defining the trends in theimmune response during pulmonary infection, molecular mark-ers of disease progression were identified. Together, this workcharacterizes the host response at different stages of disease andcan be used as a foundation for further characterization ofmolecular mechanisms controlling disease progression as wellas further development of molecular markers that best correlatewith disease state or responses to vaccines and chemotherapy.
MATERIALS AND METHODS
Low Dose Aerosol Infection
Six- to eight-week-old specific pathogen–free female C57BL/6 mice(Jackson Laboratories, Bar Harbor, ME) were infected with M. tuber-culosis H37Rv by low-dose aerosol exposure using a Glass-Col (Terre
CLINICAL RELEVANCE
This work characterizes the global host response at differ-ent stages of disease and can be used as a foundation forfurther development of molecular markers that best cor-relate with disease state or responses to vaccines andchemotherapy.
(Received in original form July 8, 2008 and in final form August 22, 2008)
This work was supported by NIH AI-055298 (to R.A.S.) and AI-44072 (to I.M.O.).
This work was supported by resources and services provided by the Genomics
Proteomics Core of the Rocky Mountain Regional Center of Excellence U54
AI065357.
Correspondence and requests for reprints should be addressed to Richard A.
Slayden, Ph.D., Rocky Mountain Regional Center of Excellence and Department
of Microbiology, Immunology and Pathology, Colorado State University, Fort
Collins, CO 80523-1682. E-mail: [email protected]
This article has an online supplement, which is accessible from this issue’s table of
contents at www.atsjournals.org
Am J Respir Cell Mol Biol Vol 40. pp 398–409, 2009
Originally Published in Press as DOI: 10.1165/rcmb.2008-0248OC on September 11, 2008
Internet address: www.atsjournals.org

Haute, IN) aerosol generator calibrated to deliver 50 to 100 viablebacteria into the lungs. Bacterial load in the lungs of representative miceat each time point were determined by plating serial dilutions of organhomogenates on Middlebrook 7H11 medium and enumeration ofcolony-forming units after incubation at 378C for 3 weeks.
Histologic Analysis
Lungs from mice (n 5 5) in the same groups were harvested for histologicanalysis on Days 0, 20, 40, and 100 of the infection. The accessory lunglobe from each mouse was fixed with 10% formalin in phosphate-buffered saline (PBS). Sections from these tissues were stained usinghematoxylin and eosin. All sections were scored by a board certifiedveterinary pathologist, blinded to treatment groups. Lesion scores werebased on percent lung involvement as well as specific morphologicfeatures like lesion necrosis and proportion of various cell types thatmake up the granulomatous inflammatory responses. All pictures weretaken with a DP70 Olympus camera (Olympus, Center Valley, PA).
Transcriptional Analysis
Global expression analysis was performed using Affymetrix mousegenome 430 2.0 array. For analysis, uninfected mice and mice at 20, 40,and 100 days of the infection (n 5 15 per group) were killed, and the lungswere excised and subjected to homogenization in Trizol. Nucleic acidswere partitioned from other cellular products by addition of chloroform(1:2, vol/vol) and centrifugation at 13,000 3 g for 20 minutes at 48C. Theresulting aqueous layer was removed and total RNA was precipitatedwith isopropanol (1:1,vol/vol). DNase treatment was used to removeDNA contamination, and total RNA was purified using an RNeasyminiprep kit (Qiagen, Valencia, CA). RNA from five mice per biologicalgroup was pooled for labeling, resulting in replicates representinguninfected mice and mice at 20, 40, and 100 days of infection. Globalexpression analysis was performed using Affymetrix mouse genome4302.0 gene chips (Affymetrix, Santa Clara, CA). RNA labeling andhybridization was per standard protocols provided by Affymetrix.
Data reduction and analysis of uninfected mice compared with miceat 20, 40, and 100 days of the infection was performed using Genesiftersoftware (geospiza, Seattle, WA) (15), and Benjamini and Hochberg wasused for adjusting the P value from a comparison test based on thenumber of tests performed. A principal component analysis (PCA)comparing uninfected mice and mice at 20, 40, and 100 d of the infectionwas performed to determine the similarity of the gene response toinfection at each time point. PCA is a statistical method of analysis fordetermining the key variables in a multidimensional data set that explainthe differences in the observations, and can be used to simplify theanalysis and visualization of multidimensional data sets (16, 17). Hier-archical clustering and self-organizing mapping (SOM) was used toidentify patterns and partitioning to separate data into discrete groups.Quantitative real-time PCR analysis was performed in triplicate fromthree biologically independent samples of total RNA from the lungs ofuninfected mice and from mice 20, 40, and 100 days after challenge. Thefold increase in signal over the 18S housekeeping gene was determinedusing the DDct calculation.
RESULTS
Progress of Disease and Development of Lung Pathology
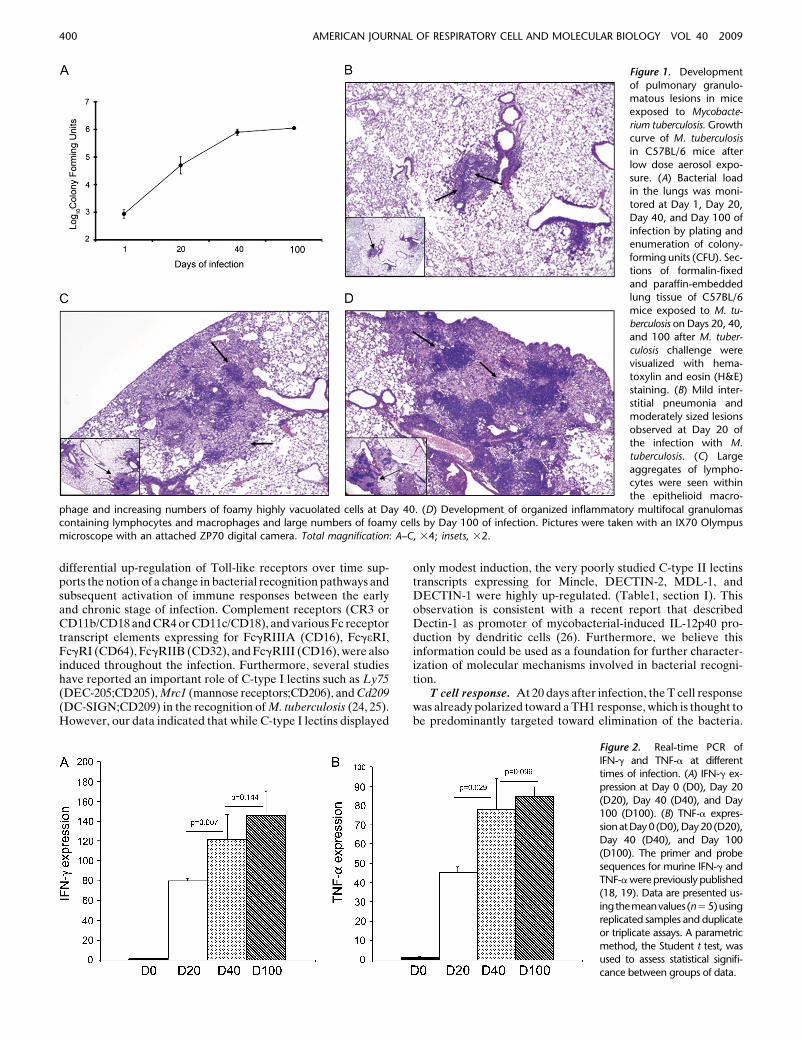
C57BL/6 mice were infected with a low dose aerosol of M.tuberculosis H37Rv to determine the host response at differenttime intervals after infection. The bacterial burden, pathology,and host transcriptional response was determined at 20, 40, and100 days of the infection. Consistent with previous observations,after aerosol exposure the bacteria in the lungs grew in anexponential manner for 20 days, after which time the number ofcultivable bacteria remained constant, giving rise to a character-istic chronic infection (Figure 1A) (20). Examination of thehistopathology revealed that lung lesions were mild at Day 20and mostly restricted to peribronchial and perivascular paren-chyma (Figure 1B). As the infection progressed, lesions de-veloped into organized structures containing large aggregates oflymphocytes and epithelioid macrophages, with increasing num-bers of highly vacuolated cells (referred to as foamy cells) (Figure
1C). By Day 100 of the infection, lesions were extensive andconsisted of coalescing foci of mixed inflammation containingpredominately lymphocytes, macrophages, and numerous foamycells (Figure 1D). During the acute (Day 20), subacute (Day 40),and chronic stages of infection (Days 40 and 100), histologicfindings illustrate the dynamic nature of the immune and in-flammatory responses as the disease progresses. To furtherconfirm that the infection in this study was consistent withprevious reports, we verified that IFN-g and TNF-a expressionincreased over the course of infection (Figure 2). This informa-tion allows us to make a connection between the stage ofinfection, development of lesions, and activation of the hostadaptive immune response.
Global Changes in the Transcriptional Response during the
Chronic State of Infection
The global transcriptional response in the lungs of mice to M.tuberculosis infection was assessed through whole mouse genomeDNA microarray analysis. Compared with uninfected C57BL/6mice (Day 0), a total of 3,308 open reading frames (ORFs), dis-played a 1.5-fold or greater change in expression (P value , 0.05)in the lungs from infected C57BL/6 mice over a 100-day infection(see Table E1 in the online supplement for a complete list of data).This represents altered expression of approximately 9% of theannotated transcripts in the mouse genome. To determine thesimilarity of the gene response to infection at each time point, weused the principal components analysis (PCA) to cluster thetranscriptional response of uninfected mice and of mice at Day 20,Day 40, and Day 100 after exposure and visualized the analysiswith a scatter plot (Figure 3A). This multivariate techniquereduces the complexity of the transcriptional response data andpreserves closeness between biological data sets, so that timepoints residing in close proximity in many dimensions areconfigured close to each other in the scatter plot. Accordingly,data analysis indicated that the overall host transcriptionalresponse in the lungs during M. tuberculosis infection wassignificantly different between uninfected mice and mice after20 days, 40 days, or 100 days of infection, with the later time pointsbeing highly concordant. The global ontology profile of thedifferentially expressed genes revealed that there is a dynamicchange in genes involved in cellular metabolism and physiology,and genes involved in regulation and response to stimulationbeing the next dominant response (Figure 3B). Ontology analysisof the transcriptional response of immune-specific genes sub-stantiate this global analysis because genes associated withstimulus and physiologic processes are the most altered inexpression, followed by cellular metabolism, regulation, anddevelopment (Figure 3C). Together, global analysis demon-strates that there is a large transcriptional response and that theresponse is progressive from Day 20, to Days 40 and 100, and inparticular a massive induction of genes involved in host defense,including both cell-mediated and humoral responses.
Trends in the Host Immune Response to Infection with
M. tuberculosis over 100 Days
Host–pathogen interaction. M. tuberculosis infection in thelungs elicited components of the innate immune response in-volved in bacterial recognition. The Toll-like Receptor tlr2 andCD14 were induced at 20 days after infection and remainedelevated throughout the infection, whereas tlr1, tlr13, tlr4, andtlr12 were only induced at 40 and 100 days after infection (Table 1,section I). These data are in agreement with previous reportsindicating the importance of the TLR2 (21, 22) in recognition ofM. tuberculosis. Although TLR4 have also been reported in thisprocess (9, 23), our study suggests that these receptors, as well astlr12 and tlr13, only become expressed late in infection. The
Gonzalez-Juarrero, Kingry, Ordway, et al.: Host Transcriptional Responses to M. tuberculosis 399
differential up-regulation of Toll-like receptors over time sup-ports the notion of a change in bacterial recognition pathways andsubsequent activation of immune responses between the earlyand chronic stage of infection. Complement receptors (CR3 orCD11b/CD18 and CR4 or CD11c/CD18), and various Fc receptortranscript elements expressing for FcgRIIIA (CD16), FcgeRI,FcgRI (CD64), FcgRIIB (CD32), and FcgRIII (CD16), were alsoinduced throughout the infection. Furthermore, several studieshave reported an important role of C-type I lectins such as Ly75(DEC-205;CD205), Mrc1 (mannose receptors;CD206), and Cd209(DC-SIGN;CD209) in the recognition of M. tuberculosis (24, 25).However, our data indicated that while C-type I lectins displayed
only modest induction, the very poorly studied C-type II lectinstranscripts expressing for Mincle, DECTIN-2, MDL-1, andDECTIN-1 were highly up-regulated. (Table1, section I). Thisobservation is consistent with a recent report that describedDectin-1 as promoter of mycobacterial-induced IL-12p40 pro-duction by dendritic cells (26). Furthermore, we believe thisinformation could be used as a foundation for further character-ization of molecular mechanisms involved in bacterial recogni-tion.
T cell response. At 20 days after infection, the T cell responsewas already polarized toward a TH1 response, which is thought tobe predominantly targeted toward elimination of the bacteria.
Figure 1. Development
of pulmonary granulo-matous lesions in mice
exposed to Mycobacte-
rium tuberculosis. Growthcurve of M. tuberculosis
in C57BL/6 mice after
low dose aerosol expo-
sure. (A) Bacterial loadin the lungs was moni-
tored at Day 1, Day 20,
Day 40, and Day 100 of
infection by plating andenumeration of colony-
forming units (CFU). Sec-
tions of formalin-fixed
and paraffin-embeddedlung tissue of C57BL/6
mice exposed to M. tu-
berculosis on Days 20, 40,and 100 after M. tuber-
culosis challenge were
visualized with hema-
toxylin and eosin (H&E)staining. (B) Mild inter-
stitial pneumonia and
moderately sized lesions
observed at Day 20 ofthe infection with M.
tuberculosis. (C) Large
aggregates of lympho-cytes were seen within
the epithelioid macro-
phage and increasing numbers of foamy highly vacuolated cells at Day 40. (D) Development of organized inflammatory multifocal granulomascontaining lymphocytes and macrophages and large numbers of foamy cells by Day 100 of infection. Pictures were taken with an IX70 Olympus
microscope with an attached ZP70 digital camera. Total magnification: A–C, 34; insets, 32.
Figure 2. Real-time PCR of
IFN-g and TNF-a at differenttimes of infection. (A) IFN-g ex-
pression at Day 0 (D0), Day 20
(D20), Day 40 (D40), and Day100 (D100). (B) TNF-a expres-
sionatDay0 (D0),Day20 (D20),
Day 40 (D40), and Day 100
(D100). The primer and probesequences for murine IFN-g and
TNF-a were previously published
(18, 19). Data are presented us-
ingthemeanvalues (n5 5)usingreplicated samples and duplicate
or triplicate assays. A parametric
method, the Student t test, wasused to assess statistical signifi-
cance between groups of data.
400 AMERICAN JOURNAL OF RESPIRATORY CELL AND MOLECULAR BIOLOGY VOL 40 2009

The main cytokine of this pathway, IFN-g, was induced through-out the infection along with 19 known IFN-regulated genes. Inaddition, the induction of IFN-g–associated GTPases (Ifi47, Ifit1,Ifi35, Ifi44, Ifit2, Ifit3, Ifit4, igtp) and two members of the IFN-signaling pathway (Stat1 and Irf7) was observed. Importantly,ifi27, ifi44, ifit1, ifit3, ift3, and irf7 were induced at 20 days afterinfection, but were down-regulated as the infection progressed(Table 1, section II). Altogether, these data indicated that despitean increased expression of the IFN-g, there was not a correspond-ing increase in the activation of the IFN-g pathway throughoutthe 100 days of infection. This information suggests that the IFN-gpathway reaches a (maximal) saturation level of activation duringlater chronic infection which is not enhanced by continuedstimulation.
The soluble mediator TNF-a with strong inflammatory andapoptotic capacity synergizes with IFN-g during the TH1 re-sponse (27). While TNF-a transcriptional activity as determinedby microarray analysis was modest, other TNF-a–associatedgenes were induced during infection. Specifically, TNF family–like genes Tnfaip2, Tnfaip3, Tnfrsf, Tnfrsf1b, Tnfrsf9, Tnfsf12,Tnip1, Traf1, Traf3, Traf3ip3, and Trafd1 were induced, sub-stantiating the contribution of TNF-a in the inflammatory processin response to M. tuberculosis infection (Table 1, section II).
Antimycobacterial activity and arrest of bacterial growth.The cytokines IFN-g stimulated the production of effectormolecules such as inducible nitric oxide synthase (iNOS) andthe phagocyte oxidase (phox) which are the major source ofantimicrobial reactive nitrogen and oxygen intermediaries, re-spectively, known to kill intracellular M. tuberculosis (28–31).Specifically, nos2 (iNOS) was induced throughout infection whilencf1 (p47 Phox), ncf2 (p60 Phox), ncf4 (p40 Phox) induction beinglimited to day 20 and day 40 of infection (Table 1-III). Similarly,there were substantial changes of several transcripts encodingchelators of proteins also known to influence bacterial growth.Thus, the transcriptional response of type II arginase, (arg),lactotransferrin and indoleaminepyrrole 2,3 dioxygenase (IDO)which are known to deplete the environment of arginine, iron andtryptophan respectively were also upregulated (32–34). Thehypoxia-responsive factor, HIF1a was upregulated. While HIF-1a is induced under hypoxic conditions, there are oxygen-in-dependent mechanisms that can also induce HIF-1a expression.This is consistent with the fact that M. tuberculosis lesions in micefail to develop hypoxia as do other species (35). However, alongwith it, the induction of Lip1 (lysosomal acid lipase 1), Laptm5
(lysosomal-associated protein transmembrane), the Cd68 (mac-rosial lysosoamyl glycoprotein), the Cd53 (membrane late endo-somes) and the Rab proteins whose expression are known tofavor a niche for bacteria survival were also observed (36, 37)(Table 1- III). Together, these data indicate that as the infectionprogresses, the host-bacterial interaction is a dynamic processresulting in a limitation of available nutrients and development ofan adequate niche capable of promoting bacterial survival.
Cellular activation mechanisms and differentiation of im-mune cell populations. Activation markers associated withantigen-presenting cells and with T cells were also inducedthrough the course of the infection. Leukocyte specific antigensCD2, CD45 and CD52, and T cell–specific markers CD3g, CD3d,CD4, CD8b, CD8a, and CD44, IL7r, or CD5 associated withactivation of memory T cells were induced by Day 20 andcontinued to be transcriptionally active throughout the infection.Importantly, other genes encoding proteins with either unknownor poorly described roles in tuberculosis immunity displayedaltered expression as well. Specifically, the signaling lymphocyteactivating molecule (Slam)-related receptors (SRR) Slamf6,Slamf7, and Slamf8 (CD150) and CD244 (2B4) molecules andits ligand Cd48 molecules were induced during infection. Similartrends were observed for Cd274 (also known as B7-H1 and PD-L1), a co signaling molecule involved in regulating T cell immu-nity in vivo (Table 1, section IV).
The main killing mechanism of CD8 T cells is throughsecretion of cytotoxic granules (38). An interesting observationwas that among the nine granzymes included in this study, thegene encoding Granzyme K (Gzmk) and the gene encoding theperforin gene Prf1 were highly up-regulated in response toinfection (Table 1, section IV). While previous work in themurine model of tuberculosis reported a nonessential role ofperforin and granzyme cytotoxic granules during the course of theinfection (38), GzmK was not included in these studies. In-terestingly, recent reports described that circulating levels ofGzmK are significantly elevated in virus-infected patients andthat it triggers rapid cell death independently of caspase activa-tion similar to GzmA (39, 40).
Genes encoding the markers CD40, CD83, CD86, and class IIMHC antigens associated with activation of lung-resident antigencell presentation were also up-regulated. Although previousreports describe decreased production of MHC class II antigensduring an M. tuberculosis infection, this disagreement isexplained by the fact that down-regulation of MHC antigen
Figure 3. Analysis of gene expression ontology of global response and physiology of immune responses. (A) Principal component analysis and
scatter plot of the transcriptional response of uninfected mice (D0) and of mice at Day 20 (D20), Day 40 (D40), and Day 100 (D100) of infectionwith M. tuberculosis. (B) Global ontology profile and (C) ontology of the immune associated genes. Data displayed are (A) based on 1,310 genes and
(B) based on 183 immune discriminant genes (1.5-fold or greater alteration; P values , 0.01).
Gonzalez-Juarrero, Kingry, Ordway, et al.: Host Transcriptional Responses to M. tuberculosis 401
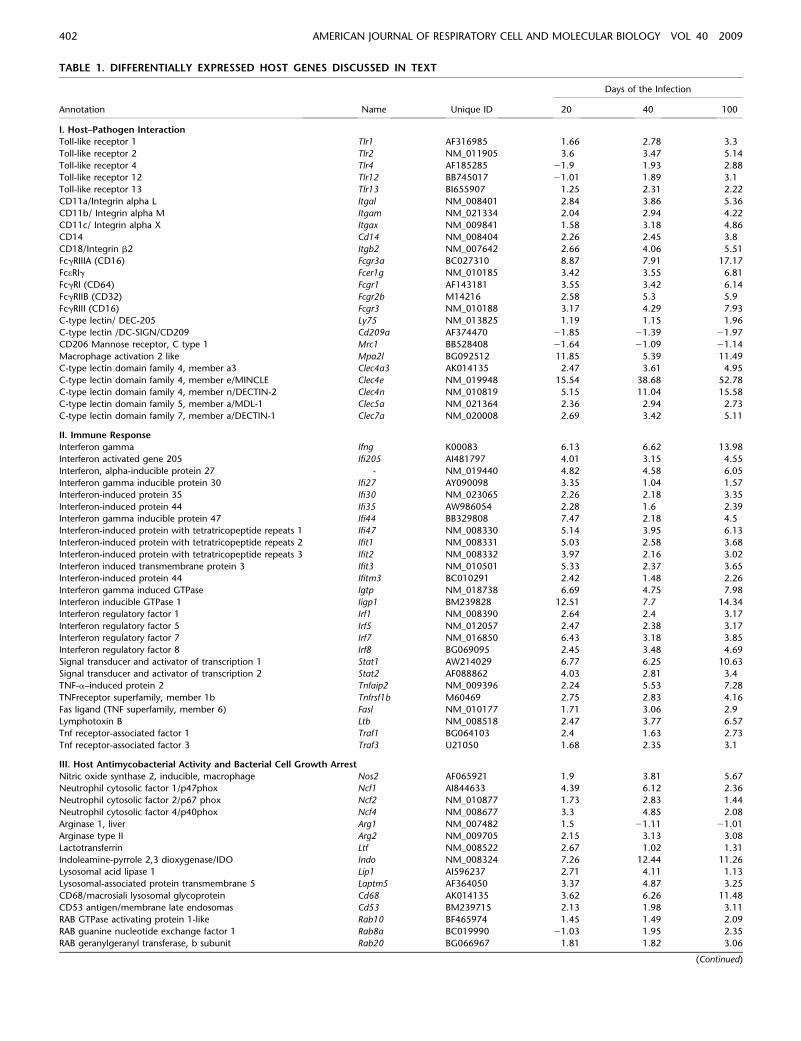
TABLE 1. DIFFERENTIALLY EXPRESSED HOST GENES DISCUSSED IN TEXT
Days of the Infection
Annotation Name Unique ID 20 40 100
I. Host–Pathogen Interaction
Toll-like receptor 1 Tlr1 AF316985 1.66 2.78 3.3
Toll-like receptor 2 Tlr2 NM_011905 3.6 3.47 5.14
Toll-like receptor 4 Tlr4 AF185285 21.9 1.93 2.88
Toll-like receptor 12 Tlr12 BB745017 21.01 1.89 3.1
Toll-like receptor 13 Tlr13 BI655907 1.25 2.31 2.22
CD11a/Integrin alpha L Itgal NM_008401 2.84 3.86 5.36
CD11b/ Integrin alpha M Itgam NM_021334 2.04 2.94 4.22
CD11c/ Integrin alpha X Itgax NM_009841 1.58 3.18 4.86
CD14 Cd14 NM_008404 2.26 2.45 3.8
CD18/Integrin b2 Itgb2 NM_007642 2.66 4.06 5.51
FcgRIIIA (CD16) Fcgr3a BC027310 8.87 7.91 17.17
FceRIg Fcer1g NM_010185 3.42 3.55 6.81
FcgRI (CD64) Fcgr1 AF143181 3.55 3.42 6.14
FcgRIIB (CD32) Fcgr2b M14216 2.58 5.3 5.9
FcgRIII (CD16) Fcgr3 NM_010188 3.17 4.29 7.93
C-type lectin/ DEC-205 Ly75 NM_013825 1.19 1.15 1.96
C-type lectin /DC-SIGN/CD209 Cd209a AF374470 21.85 21.39 21.97
CD206 Mannose receptor, C type 1 Mrc1 BB528408 21.64 21.09 21.14
Macrophage activation 2 like Mpa2l BG092512 11.85 5.39 11.49
C-type lectin domain family 4, member a3 Clec4a3 AK014135 2.47 3.61 4.95
C-type lectin domain family 4, member e/MINCLE Clec4e NM_019948 15.54 38.68 52.78
C-type lectin domain family 4, member n/DECTIN-2 Clec4n NM_010819 5.15 11.04 15.58
C-type lectin domain family 5, member a/MDL-1 Clec5a NM_021364 2.36 2.94 2.73
C-type lectin domain family 7, member a/DECTIN-1 Clec7a NM_020008 2.69 3.42 5.11
II. Immune Response
Interferon gamma Ifng K00083 6.13 6.62 13.98
Interferon activated gene 205 Ifi205 AI481797 4.01 3.15 4.55
Interferon, alpha-inducible protein 27 - NM_019440 4.82 4.58 6.05
Interferon gamma inducible protein 30 Ifi27 AY090098 3.35 1.04 1.57
Interferon-induced protein 35 Ifi30 NM_023065 2.26 2.18 3.35
Interferon-induced protein 44 Ifi35 AW986054 2.28 1.6 2.39
Interferon gamma inducible protein 47 Ifi44 BB329808 7.47 2.18 4.5
Interferon-induced protein with tetratricopeptide repeats 1 Ifi47 NM_008330 5.14 3.95 6.13
Interferon-induced protein with tetratricopeptide repeats 2 Ifit1 NM_008331 5.03 2.58 3.68
Interferon-induced protein with tetratricopeptide repeats 3 Ifit2 NM_008332 3.97 2.16 3.02
Interferon induced transmembrane protein 3 Ifit3 NM_010501 5.33 2.37 3.65
Interferon-induced protein 44 Ifitm3 BC010291 2.42 1.48 2.26
Interferon gamma induced GTPase Igtp NM_018738 6.69 4.75 7.98
Interferon inducible GTPase 1 Iigp1 BM239828 12.51 7.7 14.34
Interferon regulatory factor 1 Irf1 NM_008390 2.64 2.4 3.17
Interferon regulatory factor 5 Irf5 NM_012057 2.47 2.38 3.17
Interferon regulatory factor 7 Irf7 NM_016850 6.43 3.18 3.85
Interferon regulatory factor 8 Irf8 BG069095 2.45 3.48 4.69
Signal transducer and activator of transcription 1 Stat1 AW214029 6.77 6.25 10.63
Signal transducer and activator of transcription 2 Stat2 AF088862 4.03 2.81 3.4
TNF-a–induced protein 2 Tnfaip2 NM_009396 2.24 5.53 7.28
TNFreceptor superfamily, member 1b Tnfrsf1b M60469 2.75 2.83 4.16
Fas ligand (TNF superfamily, member 6) Fasl NM_010177 1.71 3.06 2.9
Lymphotoxin B Ltb NM_008518 2.47 3.77 6.57
Tnf receptor-associated factor 1 Traf1 BG064103 2.4 1.63 2.73
Tnf receptor-associated factor 3 Traf3 U21050 1.68 2.35 3.1
III. Host Antimycobacterial Activity and Bacterial Cell Growth Arrest
Nitric oxide synthase 2, inducible, macrophage Nos2 AF065921 1.9 3.81 5.67
Neutrophil cytosolic factor 1/p47phox Ncf1 AI844633 4.39 6.12 2.36
Neutrophil cytosolic factor 2/p67 phox Ncf2 NM_010877 1.73 2.83 1.44
Neutrophil cytosolic factor 4/p40phox Ncf4 NM_008677 3.3 4.85 2.08
Arginase 1, liver Arg1 NM_007482 1.5 21.11 21.01
Arginase type II Arg2 NM_009705 2.15 3.13 3.08
Lactotransferrin Ltf NM_008522 2.67 1.02 1.31
Indoleamine-pyrrole 2,3 dioxygenase/IDO Indo NM_008324 7.26 12.44 11.26
Lysosomal acid lipase 1 Lip1 AI596237 2.71 4.11 1.13
Lysosomal-associated protein transmembrane 5 Laptm5 AF364050 3.37 4.87 3.25
CD68/macrosiali lysosomal glycoprotein Cd68 AK014135 3.62 6.26 11.48
CD53 antigen/membrane late endosomas Cd53 BM239715 2.13 1.98 3.11
RAB GTPase activating protein 1-like Rab10 BF465974 1.45 1.49 2.09
RAB guanine nucleotide exchange factor 1 Rab8a BC019990 21.03 1.95 2.35
RAB geranylgeranyl transferase, b subunit Rab20 BG066967 1.81 1.82 3.06
(Continued)
402 AMERICAN JOURNAL OF RESPIRATORY CELL AND MOLECULAR BIOLOGY VOL 40 2009

TABLE 1. (CONTINUED)
Days of the Infection
Annotation Name Unique ID 20 40 100
RAB guanine nucleotide exchange factor 1 Rab24 NM_009000 1.17 1.48 2.3
Rab geranylgeranyl transferase, a subunit Rab32 NM_026405 1.46 2.7 2.76
IV. Immune Cell Populations and Cellular Activation
CD2 Cd2 NM_013486 2.13 2.06 2.58
CD45 Ptprc BM239436 2.26 2.25 4.39
CD52 antigen Cd52 NM_013706 3.68 3.86 8.1
CD3g antigen, Cd3g BB398671 4.02 5.63 7.13
CD3d antigen Cd3d M58149 3.88 3.56 5.31
CD4 Cd4 NM_013487 2.12 3.21 4.16
CD8b1 Cd8b1 NM_013488 2.19 2.36 3.14
Cd8a Cd8a BB154331 1.66 2.73 2.28
CD5 antigen cd5 NM_007650 3.23 4.06 6.6
CD44 Cd44 U12434 1.88 1.93 4.01
CD127/Interleukin 7 receptor) Il7r AI573431 2.01 3.01 5.1
CD150 (SLAM family member 8) Slamf8 U34882 7.72 16.54 28.39
CD319 (SLAM family member 7) Slamf7 X67128 2.71 2.64 4.95
CD150 (SLAM family member 6) Slamf6 X66083 2.65 2.77 4.14
CD177 Cd177 BC024587 4.18 3.57 4.66
CD244 (2B4-SRR) Cd244 AK016183 2.56 1.83 2.5
CD247 Cd247 AF248636 2.32 1.55 2.55
CD274 antigen PD-L1 (B7-H1 or CD274), Cd274 BC027283 7.77 7.12 10.63
CD300A antigen Cd300a BE634960 2.26 2.86 3.7
CD300 antigen like family member F Cd300lf AK017904 2.51 1.97 4.62
Granzyme A Gzma NM_010370 3.24 1.74 2.05
Granzyme B Gzmb NM_013542 3.13 2.64 2.8
Granzyme K Gzmk AB032200 6.98 8.91 13.5
Lymphocyte antigen 6 complex, locus I Ly6i AF232024 15.86 16.43 28.53
Immunoresponsive gene 1 Irg1 L38281 20.78 12.68 25.21
V. Inflammatory Response
IL-1b Il1b BC011437 3.27 2.18 3.3
IL-2 Il2 AF065914 21.14 21.04 21.09
IL-10 Il10 NM_010548 1.52 1.12 1.23
IL-12b Il12b AF128214 1.24 2.73 2.14
IL-15 Il15 NM_008357 1.08 1.6 2.13
IL-16 Il16 BC026894 2.14 2.35 2.98
IL-21 Il21 NM_021782 2.07 1.36 1.94
IL18bp Il18bp AF110803 4.44 7.7 12.3
IL-4i Il4i1 NM_010215 1.6 2.56 3.81
Interleukin 10 receptor, alpha/CD210 Il10ra NM_008348 21.02 2.85 3.29
Interleukin 12 receptor, beta 1/CD212 Il12rb1 NM_008353 1.92 2.09 3.19
Interleukin 12 receptor, beta 2/CD212 Il12rb2 NM_008354 2.16 1.21 21.04
Interleukin 13 receptor, alpha 1/CD213A Il13ra1 S80963 1.71 2.38 2.15
Interleukin 17 receptor A/CD217 Il17ra AK010040 2.44 2.06 3.02
Interleukin 18 receptor accessory protein Il18rap AV247387 2.24 2.42 2.31
Interleukin 1 receptor antagonist Il1rn M57525 3.82 4.16 8.19
Interleukin 2 receptor, alpha chain/CD25 Il2ra AF054581 21.01 1.08 1
Interleukin 2 receptor, beta chain/CD122 Il2rb M28052 4.44 2.78 4.56
Interleukin 2 receptor, gamma chain/CD132 Il2rg L20048 2.04 2.77 4.05
Interleukin 3 receptor, alpha chain/CD213 Il3ra NM_008369 1.43 1.31 2.03
Interleukin 7 receptor/CD127 Il7r AI573431 2.01 3.01 5.1
Chemokine (C-C motif) ligand 2 Ccl2 AF065933 2.07 1.21 1.64
Chemokine (C-C motif) ligand 5 Ccl5 NM_013653 7.21 16.02 21.76
Chemokine (C-C motif) ligand 7 Ccl7 AF128193 2.94 1.53 2.61
Chemokine (C-C motif) ligand 8 Ccl8 NM_021443 16.46 15.72 32.95
Chemokine (C-C motif) ligand 12 Ccl12 U50712 2.59 2 2.73
Chemokine (C-C motif) ligand 19 Ccr1 AV231648 4.25 3.15 4.01
Chemokine (C-C motif) receptor 2 Ccr2 BB148128 2.47 2.39 3.47
Chemokine (C-C motif) receptor 5 Ccr5 D83648 4.08 5.22 7.91
Chemokine (C-C motif) receptor 7 Cxcl1 NM_008176 2.54 3.6 6.59
Chemokine (C-X-C motif) ligand 5 Cxcl5 NM_009141 3.97 1.91 4.58
Chemokine (C-X-C motif) ligand 9 Cxcl9 NM_008599 54.11 72.14 122.61
Chemokine (C-X-C motif) ligand 10 Cxcl10 NM_021274 17.33 14.98 18.95
Chemokine (C-X-C motif) ligand 13 Cxcl13 AF030636 2.9 3.75 5.97
Chemokine (C-X-C motif) ligand 16 Cxcl16 BC019961 2.93 4.14 7.83
Chemokine (C-X-C motif) receptor 3 Cxcr3 NM_009910 4.56 5.08 7
Chemokine (C-X-C motif) receptor 6 Cxcr6 AF301018 5.38 7.75 10.67
Serum amyloid A 3 Saa3 NM_011315 57.97 47.09 76.47
Caspase 1 Casp1 BC008152 2.47 2.96 4.25
(Continued)
Gonzalez-Juarrero, Kingry, Ordway, et al.: Host Transcriptional Responses to M. tuberculosis 403

production during M. tuberculosis is a post-translational event(41–43).
Members of the Ly-6 superfamily (Ly-6SF), specifically Ly-6i,were highly up-regulated (Table 1, section IV). Although the roleof Ly6i is unknown, it has been proposed as a maturation markerfor T and B lymphocytes as well as for subsets of monocytes andgranulocytes (44). The Immunoresponsive gene1 (Irg1) washighly up-regulated as well. Although its function is also un-known, it has been proposed to act as an adhesion molecule bybinding cell surface ligands. Several studies have identifieda peculiar regulation of the Irg1 gene in M. tuberculosis–infectedmacrophages (8) (Table 1, section IV).
Inflammatory response: soluble factors and cellular infiltra-tion. While interleukins were induced, interleukin receptorswere altered to a larger degree in general. Specifically, interleu-kins 1b, IL-12b, IL-15, IL-16, and IL-21 were induced during thecourse of infection (Table1, section V). Interestingly, IL-18bpand the Il4I1 involved with the regulation of interleukin expres-sion and functions were highly up-regulated at all time points.IL-1 is a major mediator of inflammation and, in general, initiatesand/or amplifies a wide variety of effects associated with innateimmunity and host responses to microbial invasion and tissueinjury. In addition, TNF and IL-6 and the interleukin receptorsIl12rb2, Il17ra, Il18rap, Il1rapl2, Il1rn, Il2rb, Il2rg, and Il7r wereinduced early in infection, while Il10ra, Il13ra1, and Il3ra in-duction was limited to later stages of infection (Table 1, sectionV).
The extent of the inflammatory process is support by inductionof chemokines. Among the four chemokine families studied (theC-, XCL, C-x-C, and the C-C), some members of the C-x-C andC-C families were highly up-regulated (Table 1, section V). Theseincluded the chemokines Cxcl9, Cxcl4, Cxcl10, Cxcl13, andCxcl16, and receptors for this family, the CxCr3 and CxCr6(Table 1, section V). In particular, the chemokine CXCL9, whichis known to be induced by IFN-g, and which recruits activatedTH1 CD4 cells as well as monocytes, was significantly inducedduring infection (45–49). This is consistent with the observedincreased serum levels of this chemokine in patients withpulmonary tuberculosis (50). A secondary role of chemokines isthe promotion of angiogenesis. Other molecules, includingCXCL10, CXCL13, CXCR3, CCL5, CCR1, and CCR5, have allbeen identified as acting as T cell recruitment molecules (51–56).A further molecule identified here, CXCL16, is induced byTNF-a and plays a pleiotropic role both by acting as a recruitingmolecule and by influencing (via CXCR6) local blood vessel
integrity (57, 58). This probably represents a mechanism wherebythe host attempts to maintain the local vasculature despite theconsolidating effects of the developing granuloma. Of the C-Cmotif (CCL) family of chemokines, Ccl8 (MCP-2) had the highestexpression, followed by Ccl5 (RANTES). Other chemokinesfrom the same group, Ccl12, Ccl19 (MIP-3), and Ccl4, also hadincreased expression. Interestingly, among the family of recep-tors used by these chemokine families, only the CCr5 was greatlyup-regulated (and, to a lesser extent, the Ccr2 and Ccr7 recep-tors).
Saa3, which belongs to the SAA family of proteins andencodes the serum amyloid protein A3 (SAA3), an acute-phaseprotein, displayed increased expression. The role of serumamyloid is to facilitate phagocytosis of dying cells, thus ensuringtheir swift disposal. This acute phase protein is primarily regu-lated by IL-1 and TNF, and serves an important tissue-specificfunction in the lung during both bacterial infection and tissueremodeling (59). Other genes involved in inflammation (as well asin apoptosis) are the caspases family; however, among the 14caspases analyzed in this study, only caspases 1 and 4 hadincreased expression, whereas caspases 6, 9, and 14 displayedreduced expression (Table 1, section V).
Immunosupression. One of the most significantly inducedgenes was serpina 3 g, a member of the mouse serpins family(Table1, section VI). Serpins are serine proteinase inhibitors thatare irreversible suicide inhibitors of protease enzymes regulatingprocesses of coagulation, fibrinolysis, complement activation,angiogenesis, apoptosis, inflammation, and neoplasia (60). Animportant cytokine family to be included under this title is thetransforming growth factor family. Within this family, only Tgfb1and Tgfbi (but not Tgfb 2 Tgfb 3) were progressively inducedduring the infection, whereas TGF-a (Tgfa), a molecule withpotent cell proliferative capacity, was up-regulated at 20 days andreduced thereafter. Another gene transcript encoding IDO washighly up-regulated. IDO has recently been described in themechanism of deactivation and conversion of dendritic cells intoregulatory and immunosuppressive dendritic type of cells (33).The immunoglobulin-like receptors CD72 and FcgRIIB thatcounter-balances chemokine signaling (61, 62); that negativelyregulate B cell receptor signaling (50, 63, 64); and CD274, theligand for CD273, a member of the B7 family and regarded as an‘‘exhaustion molecule,’’ were also up-regulated during infection.CD273 was originally described in viral infections (65, 66), but wehave recently shown CD273 expression on CD8 cells thataccumulate in the lungs during chronic tuberculosis infection
TABLE 1. (CONTINUED)
Days of the Infection
Annotation Name Unique ID 20 40 100
Caspase 4, Casp4 NM_007609 3.54 2.89 4.53
Caspase 7 Casp7 NM_007611 1.89 2.09 2.41
VI. Immunosupression
TGF-a Tgfa M92420 3.56 1.54 21.51
TGF-b1 Tgfb1 NM_011577 2.84 4.54 5.39
TGF-b–induced Tgfbi NM_009369 4.03 3.12 3.84
CD274 antigen PD-L1 Cd274 BC027283 7.77 7.12 10.63
CD72 antigen/ antibodyy switching Cd72 BC003824 3.59 3.97 6.5
Indoleamine-pyrrole 2,3 dioxygenase/IDO Indo NM_008324 7.26 12.44 11.26
BCL2-antagonist/killer 1 Bak1 NM_007523 3.31 2.98 3.89
Bcl2-associated X protein Bax BC018228 1.42 1.66 2.21
B-cell leukemia/lymphoma 10 Bcl10 AF100339 2.17 2.02 2.56
B-cell leukemia/lymphoma 2 Bcl2 BM119782 1.62 21.04 2.05
B-cell leukemia/lymphoma 2 related protein A1a Bcl2a1a L16462 3.51 3.97 6.41
B-cell leukemia/lymphoma 3 Bcl3 NM_033601 2.47 2.69 3.69
All open reading frames were analyzed statistically using Genesifter software. All open reading frames listed have P values , 0.05.
404 AMERICAN JOURNAL OF RESPIRATORY CELL AND MOLECULAR BIOLOGY VOL 40 2009

(unpublished data). The tetraspanin CD151 is a cell-surfacemolecule known interfere with cell adhesion via interaction withthe laminin-binding integrin a3b1. Other transcripts within theBcl-2 family and close homologs were also changed during theinfection. It is known that activation of transcription factors suchas Bcl-xL promote cell survival, while other relatives such as Baxantagonize this function (67). We identified up-regulation of bothproapoptotic (Bax, Bak) as well as antiapoptotic (Bcl-2, Bcl-XL)transcription factors, specifically Bcl2-A1, which is known toprevent apoptosis (Table 1, section VI).
To confirm the transcriptional response of immunologicallysignificant genes identified in the global analysis, the transcrip-tional response of the cytokines IL-1b, IL-2, IL-4, IL-10, IL-13,IL-15, Tnf, infg, and Tgfb1 and the chemokines ccl2 (MCP-1),ccl5 (RANTES), and cxcl10, and nos2 where accessed in un-infected and at Days 20, 40, and 100 after challenge by quantitativereal-time PCR (Table 2). Analysis revealed that the microarraydata and the real-time PCR was 82% concordant. Although thevalues obtained by microarray analysis for IL-10, IL-13, andIFN-g were different from those determined quantitative real-time PCR, the overall trends over the course of infection weresimilar. This information allows us to make a connection betweenthe stage of infection, development of lesions, and activation ofthe host adaptive immune response.
Transcriptional Differences between Day 20, Day 40, and
Day 100
Inspection of the transcriptional response of genes encoding im-mune function revealed some interesting trends at early com-pared with later states of disease. Anxa11 (Annexin 11), Hrh1(Histamine receptor H1), Ppap2b (Phosphatidic acid phospha-tase type 2B), Cd2ap (CD2-associated protein), Itgb1 (Integrin b
1), Fnrb (fibronectin receptor b), Tcrb-J (T cell receptor b, joiningregion), Cyp4a10 (Cytochrome P450), and TGFfa (Transforminggrowth factor a, TGF-a) were all induced at Day 20 but repressedat later time points (Table 3). The other trends are those genesthat were repressed early in infection but induced by Day 40 andDay 100. In this group are Gpr35 (G protein–coupled receptor35), Tlr4 (Toll-like receptor 4) and Tlr12 (Toll-like receptor 12),Ly6 d (Lymphocyte antigen 6 complex, locus D), Ly9 (Lympho-cyte antigen 9, CD229), Il10ra (Interleukin 10 receptor, a), Hk3(Hexokinase 3), Trem2 (Triggering receptor expressed on mye-loid cells 2), and many members of the immunoglobulin family(see below). Importantly, later stages of disease was characterized
by B cell and antibody expression. Specifically, the B cell–specificgenes cd5, Cd19, Cd22, Cd79a, CD5, CD19, CD22, CD79a,CD79b, and CD52 were increased at 40 days after infection andremained transcriptionally active to time of killing (Table 3). Thisobservation is consistent with our previous findings indicatingthat the B lymphocytes in the granulomatous lesions appear inclusters similar to those found in the germinal center andconstitute the predominant type of lymphocyte infiltration duringpulmonary chronic infection with M. tuberculosis (68). Themarker CD72 associated with regulatory B cell function, andantibody switching was also up-regulated during the course of theinfection (67). In addition, Bcl10 and Bcl3 associated with B celldifferentiation and proliferation were also induced late in in-fection. Importantly, this study revealed that there was a negativeregulation or no changes in the expression of immunoglobulingenes at 20 days after infection, but after 40 days, the immuno-globulin heavy and light chain families—namely igh-6, Igj, Igh-VJ558, Igk-V32, IgkV28, Igk-V1, Igl-V1 specific for heavy chain ofIgM, join and kappa chain variable protein, and heavy lambdachain, respectively—were significantly induced. In some instan-ces at 100 days after infection, Igh-6, Igk-V32, and Igj wereinduced as much as 10 to 30 times. Altogether, when analyzing theB cell response during this infection, we identified a phenotype ofgenes expressing for IL-21, CD22, CD52, and CD5 and activationof transcription factors from the BcL family such as Bcl 10 and Bcl3, which are factors reported for the progression of particularforms of B cell lymphomas (67).
Identification of Molecular Markers of Disease State
and Progression
While trends in the immune response were identified for differenttimes of disease, there is a need for the identification of molecularmarkers of disease state and progression. Knowing molecularmarkers provides a means to monitor disease progression,particularly during treatment. Accordingly, tandem-SOM analy-sis was performed to identify molecular markers characteristic ofdisease state and progression. These features can be used toinform disease state and progression. When the host transcrip-tional response to infection was analyzed using SOM, the 1,854genes were grouped into 20 global SOM-groups (gSOM) (Figure4A). This analysis generally clustered genes induced at Day 40 orDay 100 into groups 0 to 2, genes induced at Day 20 into groups 11and 12, and genes induced at Days 40 and 100 and at Days 20, 40,and 100 into groups 14 to 19 based on expression trends. However,
TABLE 2. QUANTITATIVE REAL-TIME PCR ANALYSIS OF SELECT IMMUNOLOGICALLY SIGNIFICANT GENES AT DAY 20, DAY 40,AND DAY 100 OF INFECTION WITH Mycobacterium tuberculosis
Biological Name Gene
Day 20 Day 40 Day 100
MA qPCR MA qPCR MA qPCR
Interleukin 1b IL-1b 3.27 1.84 6 0.24 2.18 2.98 6 0.38 3.3 4.04 6 0.12
Interleukin 2 IL-2 21.14 20.79 6 0.59 21.04 20.73 6 1.21 21.09 21.30 6 0.29
Interleukin 4 IL-4 21.17 20.80 6 1.31 1.12 21.66 6 1.51 1.1 20.21 6 0.73
Interleukin 10 IL-10 1.52 20.93 6 0.63 1.12 20.91 6 0.33 1.23 20.54 6 0.51
Interleukin 13 IL-13 1.13 20.95 6 0.82 1.09 21.19 6 0.52 21.4 21.26 6 0.64
Interleukin 15 IL-15 1.08 21.60 6 0.49 1.6 21.10 6 0.59 2.13 0.66 6 0.40
Monocyte Chemotactic Protein 1 Ccl2 2.07 0.84 6 0.25 1.21 20.30 6 0.64 1.64 20.48 6 0.50
Rantes Ccl5 7.21 0.22 6 0.70 16.02 2.11 6 0.25 21.76 2.39 6 0.26
Interferon activated gene 10 Cxcl10 7.92 4.97 6 0.13 7.71 6.58 6 0.28 8.05 6.39 6 0.36
Interferon gamma Ifng 6.13 21.08 6 0.41 6.62 20.45 6 0.52 13.98 0.90 6 0.17
Nitric oxide synthase 2, inducible, macrophage Nos2 1.9 5.74 6 0.11 3.81 9.94 6 0.17 5.67 9.17 6 0.29
Transforming growth factor, beta 1 Tgfb1 2.84 0.26 6 0.37 4.54 1.42 6 0.51 5.39 2.47 6 0.16
Tumor necrosis factor Tnf 21.18 3.43 6 0.63 1.14 5.98 6 0.42 21.05 5.72 6 0.41
Definition of abbreviations: MA, microarray; qPCR, quantitative real-time PCR.
Quantitative real-time PCR analysis was performed in triplicate from three biologically independent samples of total RNA from the lungs of uninfected mice and from
mice at 20, 40, and 100 d after challenge. Values represent fold changes from uninfected controls corrected to 18s rRNA.
Gonzalez-Juarrero, Kingry, Ordway, et al.: Host Transcriptional Responses to M. tuberculosis 405

to achieve more resolution, further grouping was accomplishedby subjecting genes from these groups to another round of SOManalysis (sSOM) that, when inspected, revealed five discriminantgroups (Figure 4B). These discriminant groups correspond toDay 20 (discriminant group 1; mean expression 5 2.3), Day 40(discriminant group 2; mean expression 5 2.4), Day 100 (dis-criminant group 3; mean expression 5 2.7), Days 40 and 100(discriminant group 4; mean expression 5 2.6 [D40], 2.6 [D100]),and Days 20, 40, and 100 (discriminant group 5; mean expres-sion 5 5.4 [D20], 14.1 [D40], 20.8 [D100]). This analysis resultedin the identification of 712 genes that can serve as predictivemarkers for disease state and can be used to inform diseaseprogression (Table E2).
CONCLUSIONS
One of the most challenging questions in M. tuberculosis researchis the dynamic interplay between the host and pathogen. Muchwork has been performed to define the immune response toinfection, and while these studies have provided a wealth of
information, it is difficult to truly analyze the host response toinfection in an unbiased way. An approach often used to visualizeglobal trends in the response to infection is the use of wholegenome microarrays. Accordingly, we used this post-genomicapproach to identify global trends of the host response toinfection with M. tuberculosis and to identify molecular markersof disease progression. The results of this study are consistent witha massive mobilization of IFN-g–related genes, transcriptionfactors, inflammatory signals dominated by a strong chemokineprofile, and activated T cell and macrophage cell responses duringthe chronic phase of the disease process, and are in keeping withthe established demonstration of an ongoing activation of pro-tective immunity associated with strong inflammatory processduring the chronic infection (20). The trends in the responseswere progressively increased over time and were still in progressduring the late chronic stage of infection. However, the tran-scriptional response indicated that the host response to M.tuberculosis infection at 20 days was different than that at 40and 100 days after infection. Presumably, the early modulatedgenes are host responses related to M. tuberculosis–induced
TABLE 3. TRANSCRIPTIONAL DIFFERENCES BETWEEN DAY 20, DAY 40, AND DAY 100 OF INFECTION WITH Mycobacterium tuberculosis
Days of the Infection
Annotation Name Unique ID 20 40 100
Annexin A11 Anxa11 AU019881 2.21 21.73 23.31
Cytochrome P450, family 4, subfamily a, polypeptide 10 Cyp4a10 BC013476 2.28 21.02 21.14
Early B-cell factor 3 Ebf3 NM_010096 2.07 21.06 21.18
Fibroblast growth factor 7 Fgf7 AK015893 2.81 21.19 21.17
G protein–coupled receptor 22 Gpr22 BB232423 2.26 21.01 21.21
Heparan sulfate 6-O-sulfotransferase 2 Hs6st2 AW536432 2.17 1.14 21.05
Histamine receptor H 1 Hrh1 AF388053 2.03 21.4 21.36
Histone cluster 1, H3a Hist1h3a NM_013550 2.54 21.24 21.12
Histone cluster 1, H4i — BC019757 2.01 1.12 21.11
Integrin alpha V — AK011583 2.32 21.17 21.14
Interleukin 12 receptor, beta 2 Il12rb2 NM_008354 2.16 1.21 21.04
Phosphatidic acid phosphatase type 2B Ppap2b BB312387 2.07 21.25 21.03
Pre B-cell leukemia transcription factor 3 Pbx3 BG066541 2.22 21.15 21.04
Procollagen, type V, alpha 3 Col5a3 AB040491 2 1.07 21.25
Surfactant associated protein C — AV169310 2.7 24.68 21.44
Transforming growth factor alpha Tgfa M92420 3.56 1.54 21.51
Triggering receptor expressed on myeloid cells 1 Trem1 NM_021406 2.28 21.07 21.15
G protein–coupled receptor 35 Gpr35 NM_022320 21.09 2.28 2.86
Toll-like receptor 4 Tlr4 AF185285 21.9 1.93 2.88
Lymphocyte antigen 6 complex, locus D Ly6d NM_010742 22.96 1.59 3.09
Toll-like receptor 12 Tlr12 BB745017 21.01 1.89 3.1
Solute carrier family 7, member 6 opposite strand Slc7a6os AK010254 21.04 1.91 3.15
Hexokinase 3 Hk3 BB334625 21.02 2.2 3.2
Lymphocyte antigen 9 Ly9 NM_008534 21.56 2.09 3.26
Interleukin 10 receptor, alpha Il10ra NM_008348 21.02 2.85 3.29
Triggering receptor expressed on myeloid cells 2 Trem2 NM_031254 21.04 2.24 3.42
Membrane-spanning 4-domains, subfamily A, member 1 Ms4a1 BB236617 21.35 1.98 4.05
CD86 antigen Cd86 NM_019388 21.11 3.04 4.98
CD5 antigen cd5 NM_007650 3.23 4.06 6.6
CD19 antigen Cd19 NM_009844 21.13 1.79 2.38
CD22 antigen Cd22 AF102134 1.69 2.88 4.71
CD5 antigen-like Cdl5 NM_009690 1.35 2.14 3.35
CD72 antigen/antibody switching Cd72 BC003824 3.59 3.97 6.5
Cd79a/B cell receptor Cd79a NM_007655 1.22 2.31 4.62
Cd79b/B cell receptor Cd79b NM_008339 1.05 1.46 2.8
CD52 antigen Cd52 NM_013706 3.68 3.86 8.1
B-cell leukemia/lymphoma 10 Bcl10 AF100339 2.17 2.02 2.56
B-cell leukemia/lymphoma 3 Bcl3 NM_033601 2.47 2.69 3.69
Immunoglobulin heavy chain 6 (heavy chain of IgM) Igh-6 BC025447 2.84 16.05 36.19
Immunoglobulin joining chain Igj BC006026 21.2 3.8 10.61
Immunoglobulin kappa chain variable 1-135 Igkv1-135 BF301241 1.06 2.56 4.34
Immunoglobulin kappa chain variable 28 (V28) Igk-V28 BI107286 1.52 4.67 13.08
Immunoglobulin kappa chain variable 32 (V32) Igk-V32 U25103 2.34 5.52 10.48
Immunoglobulin lambda chain, variable 1 Igl-V1 AK008145 21.19 4.3 13.39
All open reading frames were analyzed statistically using Genesifter software. All open reading frames listed have P values , 0.05.
406 AMERICAN JOURNAL OF RESPIRATORY CELL AND MOLECULAR BIOLOGY VOL 40 2009

primary changes rather than a more complex scenario formed byconcomitant M. tuberculosis–induced inflammation and antiin-flammatory host responses as observed at Days 40 and 100.
Visualization of bacterial growth, pathology, and the PCAanalysis revealed that although the bacterial load reaches a pla-teau around 20 days after exposure, the pathology and hostresponse continues to progress. These data confirm that theprogressive inflammatory response in the subacute and chronicstages of infection in mice is independent of the total number ofcultureable bacilli. The solid or nonnecrotic lesions that typifyexperimental M. tuberculosis infection in mice reflect the earlytuberculosis lesions of humans. However, in the chronic stages ofinfection, lesions in most susceptible and resistant strains of micefail to progress to necrosis and cavitation, where bacilli are oftenextracellular admixed with degenerate cells and necrotic cellulardebris. While no one animal model consistently develops thespectrum of lesions seen in the naturally occurring disease inhumans, comparative studies including those in mice revealimportant clues in the complex pathogenesis of tuberculosis andthe host response to infection.
The overall message derived from this study is that limitingbacterial replication occurs at the cost of progressive and poorlyregulated cellular influx that compromises lung function and isthus detrimental in the chronic stages of infection. While there arelimitations to the mouse model, the overall general trendsobserved therein are likely to be similar to the response in otherhosts, including humans, thus allowing for the characterization ofimmune response to infection and the identification of molecularmarkers of disease progression. These markers may prove usefulfor discerning disease progression and development and charac-terization of vaccines with increased efficacy against M. tubercu-losis infection. Indeed, the availability of molecular markersindicative of early, middle, and chronic infection may providea foundation for tools that can be used to follow disease andresponse to chemotherapy. Overall, knowledge of the globalresponse to M. tuberculosis at different stages of disease providesmuch-needed knowledge for antigen discovery, and vaccinedevelopment, and can be applied to other clinically relevantresearch questions, including the identification of markers thatcan be used to monitor the success or failure of therapy.
Conflict of Interest Statement: None of the authors has a financial relationshipwith a commercial entity that has an interest in the subject of this manuscript.
Acknowledgments: The authors thank Dr. Alan Schenkel for critical reading andcomments of the manuscript.
References
1. Lefford MJ. Transfer of adoptive immunity to tuberculosis in mice.Infect Immun 1975;11:1174–1181.
2. Orme IM, Collins FM. Protection against Mycobacterium tuberculosisinfection by adoptive immunotherapy: requirement for T cell-deficientrecipients. J Exp Med 1983;158:74–83.
3. Orme IM. The kinetics of emergence and loss of mediator T lympho-cytes acquired in response to infection with Mycobacterium tubercu-losis. J Immunol 1987;138:293–298.
4. Cooper AM, Dalton DK, Stewart TA, Griffin JP, Russell DG, Orme IM.Disseminated tuberculosis in interferon gamma gene-disrupted mice.J Exp Med 1993;178:2243–2247.
5. Flynn JL, Chan J, Triebold KJ, Dalton DK, Stewart TA, Bloom BR. Anessential role for interferon gamma in resistance to Mycobacteriumtuberculosis infection. J Exp Med 1993;178:2249–2254.
6. Irwin SM, Izzo AA, Dow SW, Skeiky YA, Reed SG, Alderson MR,Orme IM. Tracking antigen-specific CD8 T lymphocytes in the lungsof mice vaccinated with the mtb72f polyprotein. Infect Immun 2005;73:5809–5816.
7. Serbina NV, Flynn JL. Early emergence of CD8(1) T cells primed forproduction of type 1 cytokines in the lungs of Mycobacteriumtuberculosis-infected mice. Infect Immun 1999;67:3980–3988.
8. Shi S, Blumenthal A, Hickey CM, Gandotra S, Levy D, Ehrt S.Expression of many immunologically important genes in Mycobacte-rium tuberculosis-infected macrophages is independent of both TLR2and TLR4 but dependent on IFN-falphagfbetag receptor and stat1.J Immunol 2005;175:3318–3328.
9. Jang S, Uematsu S, Akira S, Salgame P. IL-6 and IL-10 induction fromdendritic cells in response to Mycobacterium tuberculosis is predomi-nantly dependent on TLR2-mediated recognition. J Immunol 2004;173:3392–3397.
10. kanazawa N, Tashiro K, Inaba K, Miyachi Y. Dendritic cell immunoac-tivating receptor, a novel C-type lectin immunoreceptor, acts as anactivating receptor through association with fc receptor fgammagchain. J Biol Chem 2003;278:32645–32652.
11. Rachman H, Strong M, Ulrichs T, Grode L, Schuchhardt J, MollenkopfH, Kosmiadi GA, Eisenberg D, Kaufmann SH. Unique transcriptomesignature of Mycobacterium tuberculosis in pulmonary tuberculosis.Infect Immun 2006;74:1233–1242.
Figure 4. Identification of molecular markers of disease state and progression. Tandem self-organizing mapping (tandem-SOM) analysis was
performed to categorize genes and identify discriminant groups of disease state and progression. (A) gSOM analysis of transcriptional active genesdifferentially regulated . 1.5-fold (P , 0.01). This analysis distributed genes into 20 groups (0–19). (B) Discriminant groups identified from
sSOM analysis. Discriminant groups correspond to Day 20 (discriminant group 1; mean expression 5 2.3), Day 40 (discriminant group 2; mean
expression 5 2.4), Day 100 (discriminant group 3; mean expression 5 2.7), Days 40 and 100 (discriminant group 4; mean expression 5 2.6 [D40],2.6 [D100]), and Days 20, 40, and 100 (discriminant group 5; mean expression 5 5.4 [D20], 14.1 [D40], 20.8 [D100]).
Gonzalez-Juarrero, Kingry, Ordway, et al.: Host Transcriptional Responses to M. tuberculosis 407

12. Jacobsen M, Repsilber D, Gutschmidt A, Neher A, Feldmann K,
Mollenkopf H, Ziegler A, Kaufmann S. Candidate biomarkers fordiscrimination between infection and disease caused by mycobacte-rium tuberculosis. J Mol Med 2007;85:613–621.
13. Rosseau S, Hocke A, Mollenkopf H, Schmeck B, Suttorp N, Kaufmann
SH, Zerrahn J. Comparative transcriptional profiling of the lungreveals shared and distinct features of Streptococcus pneumoniae andinfluenza a virus infection. Immunology 2007;120:380–391.
14. Mollenkopf HJ, Hahnke K, Kaufmann SH. Transcriptional responses in
mouse lungs induced by vaccination with Mycobacterium bovis BCGand infection with Mycobacterium tuberculosis. Microbes Infect 2006;8:136–144.
15. Available from: geospiza, Seattle, WA at: http://www.genesifter.net/web/.16. Raychaudhuri S, Stuart JM, Altman RB. Principal components analysis
to summarize microarray experiments: Application to sporulationtime series. Pac Symp Biocomput 2000;455–466.
17. Yeung KY, Ruzzo WL. Principal component analysis for clustering gene
expression data. Bioinformatics 2001;17:763–774.18. Khader SA, Pearl JE, Sakamoto K, Gilmartin L, Bell GK, Jelley-Gibbs
DM, Ghilardi N, deSauvage F, Cooper AM. IL-23 compensates for theabsence of IL-12p70 and is essential for the IL-17 response duringtuberculosis but is dispensable for protection and antigen-specific IFN-gamma responses if IL-12p70 is available. J Immunol 2005;175:788–795.
19. Gonzalez-Juarrero M, Hattle JM, Izzo A, Junqueira-Kipnis AP, Shim
TS, Trapnell BC, Cooper AM, Orme IM. Disruption of granulocytemacrophage-colony stimulating factor production in the lungs se-verely affects the ability of mice to control Mycobacterium tubercu-losis infection. J Leukoc Biol 2005;77:914–922.
20. Rhoades ER, Frank AA, Orme IM. Progression of chronic pulmonary
tuberculosis in mice aerogenically infected with virulent Mycobacte-rium tuberculosis. Tuber Lung Dis 1997;78:57–66.
21. Kincaid EZ, Wolf AJ, Desvignes L, Mahapatra S, Crick DC, Brennan
PJ, Pavelka MS Jr, Ernst JD. Codominance of TLR2-dependent andTLR-independent modulation of MHC class II in Mycobacteriumtuberculosis infection in vivo. J Immunol 2007;179:3187–3195.
22. Underhill DM, Ozinsky A, Smith KD, Aderem A. Toll-like receptor-2
mediates mycobacteria-induced proinflammatory signaling in macro-phages. Proc Natl Acad Sci USA 1999;96:14459–14463.
23. Pompei L, Jang S, Zamlynny B, Ravikumar S, McBride A, Hickman SP,
Salgame P. Disparity in IL-12 release in dendritic cells and macro-phages in response to Mycobacterium tuberculosis is due to use ofdistinct tlrs. J Immunol 2007;178:5192–5199.
24. Schierloh P, Yokobori N, Aleman M, Landoni V, Geffner L, Musella
RM, Castagnino J, Baldini M, Abbate E, de la Barrera SS, et al.Mycobacterium tuberculosis-induced gamma interferon production bynatural killer cells requires cross talk with antigen-presenting cellsinvolving toll-like receptors 2 and 4 and the mannose receptor intuberculous pleurisy. Infect Immun 2007;75:5325–5337.
25. Schlesinger LS, Kaufman TM, Iyer S, Hull SR, Marchiando LK.
Differences in mannose receptor-mediated uptake of lipoarabino-mannan from virulent and attenuated strains of Mycobacteriumtuberculosis by human macrophages. J Immunol 1996;157:4568–4575.
26. Rothfuchs AG, Bafica A, Feng CG, Egen JG, Williams DL, Brown GD,
Sher A. Dectin-1 interaction with Mycobacterium tuberculosis leadsto enhanced IL-12p40 production by splenic dendritic cells. J Immu-nol 2007;179:3463–3471.
27. Hickman SP, Chan J, Salgame P. Mycobacterium tuberculosis induces
differential cytokine production from dendritic cells and macrophageswith divergent effects on naive T cell polarization. J Immunol 2002;168:4636–4642.
28. Ehrt S, Schnappinger D, Bekiranov S, Drenkow J, Shi S, Gingeras TR,
Gaasterland T, Schoolnik G, Nathan C. Reprogramming of themacrophage transcriptome in response to interferon-gamma and My-cobacterium tuberculosis: Signaling roles of nitric oxide synthase-2 andphagocyte oxidase. J Exp Med 2001;194:1123–1140.
29. MacMicking JD, Taylor GA, McKinney JD. Immune control of tuber-
culosis by IFN-fgammag-inducible lrg-47. Science 2003;302:654–659.30. Cooper AM, Pearl JE, Brooks JV, Ehlers S, Orme IM. Expression of the
nitric oxide synthase 2 gene is not essential for early control ofMycobacterium tuberculosis in the murine lung. Infect Immun 2000;68:6879–6882.
31. Ehlers S, Kutsch S, Benini J, Cooper A, Hahn C, Gerdes J, Orme I, Martin C,
Rietschel ET. Nos2-derived nitric oxide regulates the size, quantity andquality of granuloma formation in Mycobacterium avium-infected micewithout affecting bacterial loads. Immunology 1999;98:313–323.
32. Johann AM, Barra V, Kuhn AM, Weigert A, von Knethen A, Brune B.
Apoptotic cells induce arginase II in macrophages, thereby attenuat-ing no production. FASEB J 2007;21:2704–2712.
33. Popov A, Schultze JL. IDO-expressing regulatory dendritic cells in
cancer and chronic infection. J Mol Med 2008;86:145–160.34. Fenhalls G, Stevens L, Moses L, Bezuidenhout J, Betts JC. Helden Pv,
Lukey PT, Duncan K. In situ detection of Mycobacterium tuberculosistranscripts in human lung granulomas reveals differential geneexpression in necrotic lesions. Infect Immun 2002;70:6330–6338.
35. Via LE, Lin PL, Ray SM, Carrillo J, Allen SS, Eum SY, Taylor K, Klein
E, Manjunatha U, Gonzales J, et al. Tuberculous granulomas arehypoxic in guinea pigs, rabbits, and nonhuman primates. InfectImmun 2008;76:2333–2340.
36. Vergne I, Fratti RA, Hill PJ, Chua J, Belisle J, Deretic V. Mycobacte-
rium tuberculosis phagosome maturation arrest: Mycobacterial phos-phatidylinositol analog phosphatidylinositol mannoside stimulatesearly endosomal fusion. Mol Biol Cell 2004;15:751–760.
37. Sun J, Deghmane AE, Soualhine H, Hong T, Bucci C, Solodkin A,
Hmama Z. Mycobacterium bovis BCG disrupts the interaction of rab7with rilp contributing to inhibition of phagosome maturation. JLeukoc Biol 2007;82:1437–1445.
38. Cooper AM, D’Souza C, Frank AA, Orme IM. The course of Myco-
bacterium tuberculosis infection in the lungs of mice lacking expres-sion of either perforin- or granzyme-mediated cytolytic mechanisms.Infect Immun 1997;65:1317–1320.
39. Zhao T, Zhang H, Guo Y, Fan Z. Granzyme k directly processes bid to
release cytochrome c and endonuclease g leading to mitochondria-dependent cell death. J Biol Chem 2007;282:12104–12111.
40. Bade B, Lohrmann J, ten Brinke A, Wolbink AM, Wolbink GJ, ten
Berge IJ, Virchow JC Jr, Luttmann W, Hack CE. Detection of solublehuman granzyme k in vitro and in vivo. Eur J Immunol 2005;35:2940–2948.
41. Wojciechowski W, DeSanctis J, Skamene E, Radzioch D. Attenuation
of MHC class II expression in macrophages infected with Myco-bacterium bovis bacillus calmette-geurin involves class II trans-activator and depends on the nramp1 gene. J Immunol 1999;163:2688–2696.
42. Pai RK, Convery M, Hamilton TA, Boom WH, Harding CV. Inhibition
of IFN-fgammag-induced class II transactivator expression by a 19-kda lipoprotein from Mycobacterium tuberculosis: a potential mech-anism for immune evasion. J Immunol 2003;171:175–184.
43. Pennini ME, Pai RK, Schultz DC, Boom WH, Harding CV. Mycobac-
terium tuberculosis 19-kda lipoprotein inhibits IFN-fgammag-inducedchromatin remodeling of MHC2ta by TLR2 and MAPK signaling.J Immunol 2006;176:4323–4330.
44. Pflugh DL, Maher SE, Bothwell AL. Ly-6i, a new member of the murine
ly-6 superfamily with a distinct pattern of expression. J Immunol 2000;165:313–321.
45. Coma G, Pena R, Blanco J, Rosell A, Borras FE, Este JA, Clotet B,
Ruiz L, Parkhouse RM, Bofill M. Treatment of monocytes withinterleukin (IL)-12 plus IL-18 stimulates survival, differentiation andthe production of CXC chemokine ligands (CXCL)8, CXCL9 andCXCL10. Clin Exp Immunol 2006;145:535–544.
46. Okuda J, Arikawa Y, Takeuchi Y, Mahmoud MM, Suzaki E, Kataoka K,
Suzuki T, Okinaka Y, Nakai T. Intracellular replication of Edward-siella tarda in murine macrophage is dependent on the type IIIsecretion system and induces an up-regulation of anti-apoptotic NF-[kappa]B target genes protecting the macrophage from staurosporine-induced apoptosis. Microb Pathog 2006;41:226–240.
47. Teixeira AL Jr, Cardoso F, Souza AL, Teixeira MM. Increased serum
concentrations of monokine induced by interferon-gamma/CXCL9and interferon-gamma-inducible protein 10/CXCL-10 in Sydenham’schorea patients. J Neuroimmunol 2004;150:157–162.
48. Proost P, Verpoest S, Van de Borne K, Schutyser E, Struyf S, Put W,
Ronsse I, Grillet B, Opdenakker G, Van Damme J. Synergisticinduction of CXCL9 and CXCL11 by Toll-like receptor ligands andinterferon-gamma in fibroblasts correlates with elevated levels ofCXCR3 ligands in septic arthritis synovial fluids. J Leukoc Biol 2004;75:777–784.
49. Fulkerson PC, Zimmermann N, Brandt EB, Muntel EE, Doepker MP,
Kavanaugh JL, Mishra A, Witte DP, Zhang H, Farber JM, et al.Negative regulation of eosinophil recruitment to the lung by thechemokine monokine induced by IFN-gamma (MIG, CXCL9). ProcNatl Acad Sci USA 2004;101:1987–1992.
50. Alessandri AL, Souza AL, Oliveira SC, Macedo GC, Teixeira MM,
Teixeira AL. Concentrations of CXCL8, CXCL9 and STNFR1 in
408 AMERICAN JOURNAL OF RESPIRATORY CELL AND MOLECULAR BIOLOGY VOL 40 2009

plasma of patients with pulmonary tuberculosis undergoing treat-ment. Inflamm Res 2006;55:528–533.
51. Valbuena G, Bradford W, Walker DH. Expression analysis of the T-cell-targeting chemokines CXCL9 and CXCL10 in mice and humans withendothelial infections caused by rickettsiae of the spotted fever group.Am J Pathol 2003;163:1357–1369.
52. Ogawa N, Ping L, Zhenjun L, Takada Y, Sugai S. Involvement of theinterferon-gamma-induced T cell-attracting chemokines, interferon-gamma-inducible 10-kd protein (CXCL10) and monokine inducedby interferon-gamma (CXCL9), in the salivary gland lesions ofpatients with Sjogren’s syndrome. Arthritis Rheum 2002;46:2730–2741.
53. Yoneyama H, Narumi S, Zhang Y, Murai M, Baggiolini M, Lanzavec-chia A, Ichida T, Asakura H, Matsushima K. Pivotal role of dendriticcell-derived cxcl10 in the retention of T helper cell 1 lymphocytes insecondary lymph nodes. J Exp Med 2002;195:1257–1266.
54. Stiles LN, Hosking MP, Edwards RA, Strieter RM, Lane TE. Differen-tial roles for cxcr3 in CD41 and CD81 T cell trafficking followingviral infection of the CNS. Eur J Immunol 2006;36:613–622.
55. Quandt J, Dorovini-Zis K. The beta chemokines ccl4 and ccl5 enhanceadhesion of specific CD41 T cell subsets to human brain endothelialcells. J Neuropathol Exp Neurol 2004;63:350–362.
56. Ubogu EE, Callahan MK, Tucky BH, Ransohoff RM. Determinants ofCCL5-driven mononuclear cell migration across the blood-brainbarrier: implications for therapeutically modulating neuroinflamma-tion. J Neuroimmunol 2006;179:132–144.
57. Fahy OL, Townley SL, McColl SR. Cxcl16 regulates cell-mediatedimmunity to Salmonella enterica serovar enteritidis via promotion ofgamma interferon production. Infect Immun 2006;74:6885–6894.
58. Morgan AJ, Guillen C, Symon FA, Huynh TT, Berry MA, Entwisle JJ,Briskin M, Pavord ID, Wardlaw AJ. Expression of cxcr6 and its
ligand cxcl16 in the lung in health and disease. Clin Exp Allergy 2005;35:1572–1580.
59. Thorn CF, Lu ZY, Whitehead AS. Regulation of the human acute phaseserum amyloid a genes by tumour necrosis factor-a, interleukin-6 andglucocorticoids in hepatic and epithelial cell lines. Scand J Immunol2004;59:152–158.
60. Gettins PG. Keeping the serpin machine running smoothly. Genome Res2000;10:1833–1835.
61. Zhang H, Meng F, Chu CL, Takai T, Lowell CA. The src family kinaseshck and fgr negatively regulate neutrophil and dendritic cell chemo-kine signaling via PIR-b. Immunity 2005;22:235–246.
62. Pereira S, Zhang H, Takai T, Lowell CA. The inhibitory receptor PIR-b negatively regulates neutrophil and macrophage integrin signaling.J Immunol 2004;173:5757–5765.
63. Yamazaki T, Nagumo H, Hayashi T, Sugane K, Agematsu K. CD72-mediated suppression of human naive B cell differentiation by down-regulating x-box binding protein 1. Eur J Immunol 2005;35:2325–2334.
64. Parnes JR, Pan C. CD72, a negative regulator of B-cell responsiveness.Immunol Rev 2000;176:75–85.
65. Reignat S, Webster GJ, Brown D, Ogg GS, King A, Seneviratne SL,Dusheiko G, Williams R, Maini MK, Bertoletti A. Escaping high viralload exhaustion: CD8 cells with altered tetramer binding in chronichepatitis B virus infection. J Exp Med 2002;195:1089–1101.
66. Doherty PC. Immune exhaustion: Driving virus-specific CD81 T cells todeath. Trends Microbiol 1993;1:207–209.
67. Hardy RR, Hayakawa K. B cell development pathways. Annu RevImmunol 2001;19:595–621.
68. Gonzalez-Juarrero M, Turner OC, Turner J, Marietta P, Brooks JV,Orme IM. Temporal and spatial arrangement of lymphocytes withinlung granulomas induced by aerosol infection with Mycobacteriumtuberculosis. Infect Immun 2001;69:1722–1728.
Gonzalez-Juarrero, Kingry, Ordway, et al.: Host Transcriptional Responses to M. tuberculosis 409