Molecular Epidemiology of Mycobacterium tuberculosis ...
15
Genes 2022, 13, 475. https://doi.org/10.3390/genes13030475 www.mdpi.com/journal/genes Article Molecular Epidemiology of Mycobacterium tuberculosis Complex Strains in Urban and Slum Settings of Nairobi, Kenya Glennah Kerubo 1,2, *, Perpetua Ndungu 3 , Yassir Adam Shuaib 1,4 , Evans Amukoye 5 , Gunturu Revathi 6 , Susanne Homolka 1 , Samuel Kariuki 7,† , Matthias Merker 1,8,9,† and Stefan Niemann 1,8, * ,† 1 Molecular and Experimental Mycobacteriology, Research Center Borstel, 23845 Borstel, Germany; [email protected] (Y.A.S.); [email protected] (S.H.); [email protected] (M.M.) 2 School of Medicine, Kenyatta University, Nairobi 43844-00100, Kenya 3 Jomo Kenyatta University of Agriculture and Technology, Nairobi 62000-00200, Kenya; [email protected] 4 College of Veterinary Medicine, Sudan University of Science and Technology, Khartoum North 13321, Sudan 5 Centre for Respiratory Disease Research, Kenya Medical Research Institute, Nairobi 54840-00200, Kenya; [email protected] 6 Aga Khan University Hospital, Nairobi 30270-00100, Kenya; [email protected] 7 Centre for Microbiology Research, Kenya Medical Research Institute, Nairobi 54840-00200, Kenya; [email protected] 8 German Center for Infection Research (DZIF), Partner site Hamburg-Lübeck-Borstel-Riems, 23845 Borstel, Germany 9 Evolution of the Resistome, Research Center Borstel, 23845 Borstel, Germany * Correspondence: [email protected] (G.K.); [email protected] (S.N.) † Equal contribution. Abstract: Kenya is a country with a high tuberculosis (TB) burden. However, knowledge on the genetic diversity of Mycobacterium tuberculosis complex (MTBC) strains and their transmission dy- namics is sparsely available. Hence, we used whole-genome sequencing (WGS) to depict the genetic diversity, molecular markers of drug resistance, and possible transmission clusters among MTBC strains in urban and slum settings of Nairobi. We analyzed 385 clinical MTBC isolates collected between 2010 and 2015 in combination with patients’ demographics. We showed that the MTBC population mainly comprises strains of four lineages (L1-L4). The two dominating lineages were L4 with 55.8% (n = 215) and L3 with 25.7% (n = 99) of all strains, respectively. Genome-based cluster analysis showed that 30.4% (117/385) of the strains were clustered using a ≤5 single-nucleotide pol- ymorphism (SNP) threshold as a surrogate marker for direct patient-to-patient MTBC transmission. Moreover, 5.2% (20/385) of the strains were multidrug-resistant (MDR), and 50.0% (n = 10) were part of a genome-based cluster (i.e., direct MDR MTBC transmission). Notably, 30.0% (6/20) of the MDR strains were resistant to all first-line drugs and are part of one molecular cluster. Moreover, TB patients in urban living setting had 3.8 times the odds of being infected with a drug-resistant strain as compared to patients from slums (p-value = 0.002). Our results show that L4 strains are the main causative agent of TB in Nairobi and MDR strain transmission is an emerging concern in urban settings. This emphasizes the need for more focused infection control measures and contact tracing of patients with MDR TB to break the transmission chains. Keywords: tuberculosis; Mycobacterium tuberculosis; whole-genome sequencing; molecular epidemiology, Nairobi 1. Introduction Tuberculosis (TB) is still a major cause of morbidity and mortality worldwide, espe- cially in Sub-Saharan Africa [1–3]. In 2020, TB was responsible for 9.9 million new cases, of which 25% were in the World Health organization ( WHO) African region [1]. Kenya is Citation: Kerubo, G.; Ndungu, P.; Shuaib, Y.A.; Amukoye, E.; Revathi, G.; Homolka, S.; Kariuki, S.; Merker, M.; Niemann, S. Molecular Epidemiology of Mycobacterium tuberculosis Complex Strains in Urban and Slum Settings of Nairobi, Kenya. Genes 2022, 13, 475. https:// doi.org/10.3390/genes13030475 Academic Editor: Silvia Turroni Received: 7 February 2022 Accepted: 2 March 2022 Published: 8 March 2022 Publisher’s Note: MDPI stays neu- tral with regard to jurisdictional claims in published maps and institu- tional affiliations. Copyright: © 2022 by the authors. Li- censee MDPI, Basel, Switzerland. This article is an open access article distributed under the terms and con- ditions of the Creative Commons At- tribution (CC BY) license (https://cre- ativecommons.org/licenses/by/4.0/).
-
Upload
khangminh22 -
Category
Documents
-
view
5 -
download
0
Transcript of Molecular Epidemiology of Mycobacterium tuberculosis ...

Genes 2022, 13, 475. https://doi.org/10.3390/genes13030475 www.mdpi.com/journal/genes
Article
Molecular Epidemiology of Mycobacterium tuberculosis
Complex Strains in Urban and Slum Settings of Nairobi, Kenya
Glennah Kerubo 1,2,*, Perpetua Ndungu 3, Yassir Adam Shuaib 1,4, Evans Amukoye 5, Gunturu Revathi 6,
Susanne Homolka 1, Samuel Kariuki 7,†, Matthias Merker 1,8,9,† and Stefan Niemann 1,8,*,†
1 Molecular and Experimental Mycobacteriology, Research Center Borstel, 23845 Borstel, Germany;
[email protected] (Y.A.S.); [email protected] (S.H.); [email protected] (M.M.) 2 School of Medicine, Kenyatta University, Nairobi 43844-00100, Kenya 3 Jomo Kenyatta University of Agriculture and Technology, Nairobi 62000-00200, Kenya;
[email protected] 4 College of Veterinary Medicine, Sudan University of Science and Technology,
Khartoum North 13321, Sudan 5 Centre for Respiratory Disease Research, Kenya Medical Research Institute, Nairobi 54840-00200, Kenya;
[email protected] 6 Aga Khan University Hospital, Nairobi 30270-00100, Kenya; [email protected] 7 Centre for Microbiology Research, Kenya Medical Research Institute, Nairobi 54840-00200, Kenya;
[email protected] 8 German Center for Infection Research (DZIF), Partner site Hamburg-Lübeck-Borstel-Riems,
23845 Borstel, Germany 9 Evolution of the Resistome, Research Center Borstel, 23845 Borstel, Germany
* Correspondence: [email protected] (G.K.); [email protected] (S.N.)
† Equal contribution.
Abstract: Kenya is a country with a high tuberculosis (TB) burden. However, knowledge on the
genetic diversity of Mycobacterium tuberculosis complex (MTBC) strains and their transmission dy-
namics is sparsely available. Hence, we used whole-genome sequencing (WGS) to depict the genetic
diversity, molecular markers of drug resistance, and possible transmission clusters among MTBC
strains in urban and slum settings of Nairobi. We analyzed 385 clinical MTBC isolates collected
between 2010 and 2015 in combination with patients’ demographics. We showed that the MTBC
population mainly comprises strains of four lineages (L1-L4). The two dominating lineages were L4
with 55.8% (n = 215) and L3 with 25.7% (n = 99) of all strains, respectively. Genome-based cluster
analysis showed that 30.4% (117/385) of the strains were clustered using a ≤5 single-nucleotide pol-
ymorphism (SNP) threshold as a surrogate marker for direct patient-to-patient MTBC transmission.
Moreover, 5.2% (20/385) of the strains were multidrug-resistant (MDR), and 50.0% (n = 10) were part
of a genome-based cluster (i.e., direct MDR MTBC transmission). Notably, 30.0% (6/20) of the MDR
strains were resistant to all first-line drugs and are part of one molecular cluster. Moreover, TB
patients in urban living setting had 3.8 times the odds of being infected with a drug-resistant strain
as compared to patients from slums (p-value = 0.002). Our results show that L4 strains are the main
causative agent of TB in Nairobi and MDR strain transmission is an emerging concern in urban
settings. This emphasizes the need for more focused infection control measures and contact tracing
of patients with MDR TB to break the transmission chains.
Keywords: tuberculosis; Mycobacterium tuberculosis; whole-genome sequencing; molecular
epidemiology, Nairobi
1. Introduction
Tuberculosis (TB) is still a major cause of morbidity and mortality worldwide, espe-
cially in Sub-Saharan Africa [1–3]. In 2020, TB was responsible for 9.9 million new cases,
of which 25% were in the World Health organization ( WHO) African region [1]. Kenya is
Citation: Kerubo, G.; Ndungu, P.;
Shuaib, Y.A.; Amukoye, E.; Revathi,
G.; Homolka, S.; Kariuki, S.; Merker,
M.; Niemann, S. Molecular
Epidemiology of Mycobacterium
tuberculosis Complex Strains in
Urban and Slum Settings of Nairobi,
Kenya. Genes 2022, 13, 475. https://
doi.org/10.3390/genes13030475
Academic Editor: Silvia Turroni
Received: 7 February 2022
Accepted: 2 March 2022
Published: 8 March 2022
Publisher’s Note: MDPI stays neu-
tral with regard to jurisdictional
claims in published maps and institu-
tional affiliations.
Copyright: © 2022 by the authors. Li-
censee MDPI, Basel, Switzerland.
This article is an open access article
distributed under the terms and con-
ditions of the Creative Commons At-
tribution (CC BY) license (https://cre-
ativecommons.org/licenses/by/4.0/).

Genes 2022, 13, 475 2 of 15
among the highest TB burden countries with an incidence of 259/100,000 population,
which is twice as much as the global average [1–3]. The total number of new and relapse
TB case notifications was 71,646 [1]. The HIV/AIDS epidemic and the emergence of drug-
resistant Mycobacterium tuberculosis complex (MTBC) strains complicated the effective
control of TB in the country [4,5]. Additionally, the emergence of SARS-CoV-2 is expected
to have a long-lasting impact leading to an increase in the burden of TB in Kenya due to
the disruption of TB health care services in 2020 [6,7]. Moreover, the lack of resources to
carry out proper and definitive diagnosis of TB fuels the country’s TB epidemic as TB
diagnosis is solely performed using smear microscopy in Kenya. This technique has a var-
iable sensitivity and does not allow for resistance prediction or differentiation between
infections due to MTBC and non-tuberculous mycobacteria (NTM) [8,9]. TB cases are
therefore treated using empirical treatment which may foster the development and trans-
mission of resistant MTBC strains by long periods of infectivity [10].
In Kenya, knowledge on genetic drug resistance markers of MTBC strains is inade-
quate, especially in potential transmission hotspots, such as the capital Nairobi. Molecular
epidemiological studies have suggested that transmission is a major driver of drug sus-
ceptible and drug resistant TB epidemics, not only in Eastern Europe but also in Africa
[10–13]. Indeed, MTBC transmission is one of the major constraints that hinder TB control,
particularly in poor settings (e.g., slums) where the risk of transmission is high due to
overcrowding [1,13]. Evidence has disclosed high TB prevalence in slums in Kenya [14]
and other African countries, such as South Africa [15,16]. Furthermore, patients in slums
may have limited access to TB treatment centers.
Here, we collated MTBC strains from two patient cohorts in Nairobi to analyze dif-
ferences in the genetic diversity, transmission dynamics, and molecular drug resistance
profiles of MTBC strains circulating in slum and urban settings.
2. Materials and Methods
2.1. Study Design and Setting
We enrolled self-presented presumptive TB patients in this cross-sectional study who
had respiratory symptoms and were smear-positive from 13 randomly selected health
centers located in Nairobi and its surroundings (Figure S1, Table S1). The first cohort (n =
204) was enrolled between May 2010 and May 2013, and the second cohort (n = 275) was
enrolled from September 2014 to May 2015. Three of the health care centers selected are
TB referral centers (Table S1), of which one center is located in slums (i.e., highly popu-
lated or informal settlements with weak building quality, inadequate housing or very
small living spaces, and squalid conditions which are often associated with poverty) and
serves up to 200 patients per week. Each patient was required to give a spot (i.e., collected
at the time of first visit of the patient to clinic/laboratory) and an early morning sputum
sample for analysis. Both spot and early morning samples were pooled and used for mi-
crobiological analysis. Demographic data were gathered using a structured questionnaire,
and each recruited patient was assigned a unique personal identifier that was used
throughout the study period.
2.2. Laboratory Procedures
2.2.1. Sputum Decontamination, Mycobacterial Culture, and DNA Extraction
All specimens were processed and decontaminated following the standard N-acetyl-
L-cysteine-–sodium hydroxide (NALC-NaOH) method for digestion, decontamination,
and concentration [17]. The sediment was resuspended in about 1 to 2 mL phosphate
buffer (pH 6.8) and mixed thoroughly. A smear was prepared for acid-fast staining [9,18].
Mycobacterial cultures were performed by adding 0.25 mL of the suspended decon-
taminated samples into the BACTEC MGIT 960 (Becton Dickinson, New Jersey, CA, USA)
and onto solid Löwenstein–Jensen (LJ) culture media [19].

Genes 2022, 13, 475 3 of 15
DNA extraction from mycobacterial colonies was carried out using the cetyl trime-
thylammonium bromide (CTAB) method as described by Somerville et al. [20]. The DNA
was reconstituted with molecular grade water and stored at −20 °C until it was sent to the
Molecular and Experimental Mycobacteriology Laboratory, Research Centre Borstel in
Germany, where molecular characterization of the MTBC strains was conducted.
2.2.2. Whole-Genome Sequencing
DNA libraries for whole-genome sequencing (WGS) were prepared with the Nextera
(XT) kit from Illumina (San Diego, USA) according to the manufacturer’s instructions [21].
Pooled DNA libraries were then loaded into NextSeq Reagent cartridges for sequencing
on a NextSeq system (Illumina, San Diego, CA, USA). Resulting sequencing reads were
submitted to the European Nucleotide Archive under the project accession number
PRJEB50767 and subsequently mapped to the H37Rv reference genome (GenBank ID:
NC_000962.3) by Burrows–Wheeler alignment (BWA) tool aiming for a minimum of 50-
fold average genome-wide coverage [22,23]. We considered single nucleotide polymor-
phisms (SNPs) with at least 4 reads in both forward and reverse orientation, 4 reads calling
the allele with at least a Phred score of 30, and 75% allele frequency for a concatenated
sequence alignment. SNP positions that had reliable base call (as described above) in at
least 95% of the strains were concatenated to a sequence alignment. SNPs from repetitive
regions were excluded, including those which occurred within a window of 12 base pairs
in neighboring strains [23].
A web tool was used for detecting isolates that harbored more than one phylogenetic
lineage (i.e., mixed infections or laboratory contaminations) [24]. These samples/isolates
were not considered in subsequent analysis.
2.3. Data Analysis
2.3.1. Phylogenetic Reconstruction and WGS-Based Cluster Inference
On the basis of concatenated sequence data, the most suitable substitution model for
the dataset was implemented using the maximum likelihood ratio test (Jmodel test) [25].
A maximum likelihood tree was calculated based on the concatenated sequence alignment
using FastTree [26] with a general time-reversible (GTR) substitution model (best accord-
ing to Jmodel test), 1000 resamples, and γ 20 likelihood optimization to account for the
rate of heterogeneity among sites. The phylogenetic tree was inspected and rooted with
FigTree software (Institute of Evolutionary Biology, University of Edinburgh, Edinburgh,
Scotland). Graphical presentation was performed with Evolview [27]. The concatenated
sequence data were also used to calculate maximum parsimony trees using BioNumerics
software version 7.6 (Applied Maths, BioMérieux, Sint-Martens-Latem, Belgium). Ge-
nome clusters were defined by grouping all sequenced isolates within a maximum dis-
tance of ≤12 and ≤5 SNPs between one strain and the neighboring strain [28,29].
2.3.2. Molecular Drug Resistance Prediction
Genes associated with drug resistance mechanisms were individually investigated
and not considered for phylogenetic approaches [24].
The SNP dataset was examined for known resistance-conferring mutations against
first-line and second-line antibiotics [24]. In brief, for rifampicin (RIF) resistance, muta-
tions that confer resistance on the rpoB gene were analyzed. Other RNA-polymerase
genes, i.e., rpoA and rpoC, were analyzed with regard to putative compensatory mutations.
We also investigated katG, inhA, ndh, and fabG1 genes for mutations that confer resistance
to isoniazid (INH). We screened pncA and rpsA genes for mutations conferring resistance
to pyrazinamide (PZA), and embB, embC, and embA genes for mutations associated with
ethambutol (EMB) resistance. In the case of streptomycin (STR) resistance, the rpsL, rrs,
and gidB genes were investigated for mutations conferring resistance. For isolates that

Genes 2022, 13, 475 4 of 15
were MDR (i.e., resistance towards INH and RIF), genes conferring resistance against sec-
ond-line drugs were examined. The gyrA and gyrB genes were investigated for resistance
against fluoroquinolones (FQs), while the rrs gene was studied for resistance against ami-
noglycosides. In addition, tlyA and thyA genes were analyzed for capreomycin (CAP) and
para-aminosalicylic acid (PAS) resistance, respectively. For ethionamide (Eto) resistance,
ethA and fabG1 genes were studied [24].
2.3.3. Statistics
Demographic data were entered, cleaned, and analyzed using the SPSS statistical
software package, version 20 (SPSS Inc., Chicago, IL, USA). Chi-square test and Fisher
exact test were used to compare categorical variables. All variables were tested using lo-
gistic regression analysis. A p-value ≤ 0.05 was considered significant.
2.4. Ethical Considerations
This study was approved by the Scientific and Ethical Review Unit of Kenya Medical
Research Institute (SSC Protocol No. 2830). All patients recruited into the study were re-
quired to sign a written informed consent for collection and analysis of samples and de-
mographic and clinical data. If the patient was illiterate or less than 18 years old, a care-
taker was requested for consent. All the information collected from cases was kept confi-
dential. All patient identifiers were removed prior to data analysis. During the study, any
diagnosed TB cases (i.e., smear-positive) were registered at the health centers and treated
according to the National Tuberculosis and Leprosy Programme (NTLP) guidelines [30].
The NTLP guidelines state that all patients who have not been on TB therapy previ-
ously should have a two-month initial phase of treatment consisting of INH, RIF, PZA,
and EMB followed by a continuation phase of EMB and INH for six months or INH and
RIF for four months [30]. For retreatment TB patients, the intensive phase is three months
of daily injections of STR and swallowing of INH, RIF, PZA, and EMB, followed by five
months of continuation phase with INH, RIF, and EMB [30].
3. Results
3.1. Study Population
A total of 479 sputum samples were collected from smear-positive patients in health
centers in Nairobi and its surroundings (Figure S1). Based on hospital records, the re-
cruited patients comprised 10%–20% of all patients who received a diagnosis of TB during
the study period.
After excluding individuals with missing data, we found that the overall mean age
of the investigated patients was 31.7 ± 8.3 years. Moreover, we observed that most of the
enrolled individuals (64.4%, 246/382) were males and were newly diagnosed TB cases
(85.3%, 326/382). Most of the study cases were from health centers located in non-slum
areas (i.e., urban or developed areas with well-constructed houses, commercial buildings,
roads, and bridges) (55.8%, 215/385), while 44.2% (170/385) were from health centers lo-
cated in slums (informal settlements) (Table S1).
Out of all collected sputum specimens, 48/479 (10.0%) were either culture-negative
or contaminated (Figure 1). Furthermore, 31 isolates were subsequently excluded from
the analysis due to quality issues or the identification of more than one strain (n = 15) in
the DNA isolate. The final analysis comprised 385/479 (80.4%) WGS datasets, each repre-
senting one isolate per patient (Figure 1).
Genes 2022, 13, 475 5 of 15
Figure 1. Workflow for the study “Molecular epidemiology of Mycobacterium tuberculosis complex
strains in urban and slum settings of Nairobi, Kenya”. TB = tuberculosis, Cohort A = patients en-
rolled in 2010, Cohort B = patients enrolled in 2014–2015, WGS = whole-genome sequencing, spp. =
species.
Comparison of the two patient cohorts (i.e., 2010 cohort vs. 2014–2015 cohort) re-
vealed significant differences between the proportions of drug-susceptible and drug-re-
sistant strains (X2 = 25.3, p-value ≤0.001), the proportions of clustered and not clustered
strains based on ≤5 SNP threshold (X2 = 14.2, p-value ≤ 0.001), and the proportions of male
and female sex (X2 = 4.97, p-value = 0.026) after excluding individuals with missing infor-
mation from the analysis (Table 1). Furthermore, the proportions of patients residing in
urban and slum living conditions differed significantly between the two cohorts (X2 =
178.2, p-value ≤ 0.001). While in the 2010 cohort 91.7% (166/181) of the patients came from
urban areas, only 24.0% (49/204) of the patients from the 2014-2015 cohort were living in
an urban setting (Table 1).
Genes 2022, 13, 475 6 of 15
Table 1. Comparison of the two patient cohorts investigated by using chi-square test in Nairobi,
Kenya (2010–2015).
Variable No. Cohort A Cohort B X2 p-Value
Lineage 7.70 0.103
L1 (EAI) 14 9 (5.0%) 5 (2.5%)
L2 (Beijing) 56 30 (16.6%) 26 (12.7%)
L3 (Delhi/CAS) 99 52 (28.7%) 47 (23.0%)
L4 (Euro-American) 215 89 (49.2%) 126 (61.8%)
M. bovis 1 1 (0.5%) 0 (0.00%)
DST 25.3 <0.001 a
Susceptible 348 151 (83.4%) 197 (96.6%)
MDR 20 20 (11.1%) 0 (0.00%)
Non-MDR 17 10 (5.5%) 7 (3.4%)
d12 3.08 0.079
Clustered 218 111 (61.3%) 107 (52.5%)
Not clustered 167 70 (38.7%) 97 (47.5%)
d5 14.2 <0.001 a
Clustered 117 72 (39.8%) 45 (22.1%)
Not clustered 268 109 (60.2%) 159 (77.9%)
TB history 0.11 0.747
New 326 152 (84.0%) 174 (85.3%)
Retreatment 56 28 (15.5%) 28 (15.5%)
NA * 3 1 (0.5%) 2 (1.0%)
Age group 0.11 0.917
≤30 166 63 (34.8%) 103 (50.5%)
>30 161 62 (34.3%) 99 (48.5%)
NA * 58 56 (30.9%) 2 (1.0%)
Sex 4.97 0.026 a
Male 246 105 (58.0%) 141 (69.1%)
Female 136 75 (41.4%) 61 (29.9%)
NA * 3 1 (0.6%) 2 (1.0%)
Sampling area 178.2 <0.001 a
Urban 215 166 (91.7%) 49 (24.0%)
Slum 170 15 (8.3%) 155 (76.0%)
Total 385 181 (47.0%) 204 (53.0%) ─ ─
No. = number, A = cohort 2010, B = cohort 2014–2015, DST = drug susceptibility testing, MDR =
simultaneous resistance towards isoniazid and rifampicin, non-MDR = resistance towards drugs
other than isoniazid and rifampicin, d12 = genetic distance of ≤12 single-nucleotide polymorphisms
(SNPs), d5 = genetic distance of ≤5 SNPs, NA = not available, * = variable (individuals with missing
data) excluded from analysis, a = variable with a chi-square p-value of ≤ 0.05.
3.2. MTBC Population Structure
We performed WGS successfully on 400 MTBC strains. We excluded 15 samples/da-
tasets from the final analysis because of the identification of more than one strain and built
a maximum likelihood phylogeny upon a concatenated sequence alignment comprising
18,167 SNPs to investigate the MTBC population structure using 385 strains (Figure 2).
Phylogenetic lineages (Ls) were inferred from canonical SNPs specific for certain MTBC
sublineages based on a recently introduced SNP barcode classification [31,32]. Strains of
L4 (Euro-American super-lineage, n = 215/385, 55.8%) were predominant, followed by
strains of L3 (Delhi/CAS, n = 99/385, 25.7%), strains of L2 (Beijing, n= 56/385, 14.5%), and
strains of L1 (East African Indian, n = 14/385, 3.6%). There was one M. bovis strain identi-
fied (Figure 2).

Genes 2022, 13, 475 7 of 15
Strains of L4 (the Euro-American super-lineage) were further classified into several
sublineages as described previously [31,32]. Strains of the Latin American Mediterranean
(LAM) genotype (n = 70/215, 32.5%) comprised the MTBC sublineages 4.3.2, 4.3.4.1, 4.3.4.2,
and 4.3.4.2.1 and were most frequent, followed by S-type (4.4.1.1, n = 55/215, 25.5%), Turk-
ish (TUR) (4.2.2, n = 27/215, 12.6 %), and Haarlem (4.1.2 and 4.1.2.1, n = 18/215, 8.4%) (Fig-
ure S2). Other sublineages identified include Kenya H37Rv-like (4.8, n = 13/215, 6%),
Uganda I (4.6.1.1, n = 7/215, 3.2%), Uganda II (4.6.1.2 n = 10/215, 4.6%), X-type (4.1.1.1, n =
7/215, 3.2%), Cameroon (4.6.2 n = 6/215, 2.8%), Ghana (4.1 n = 1/215, 0.5%), and undefined
Euro-American (4.0, n = 1/215, 0.5%) (Figure S2).
Figure 2. MTBC population structure in urban and slum areas of Nairobi, Kenya. Maximum likeli-
hood tree based on 18,167 concatenated single-nucleotide polymorphisms (SNPs) using a general
time-reversible substitution model. Colored bars code for (inner to outer ring) M. bovis and MTBC
lineages (L1–4); genotypic DST results stratified to MDR, non-MDR, and fully susceptible; sampling
location; and clustered and non-clustered strains (SNP distance ≤12 and ≤5). DST = drug suscepti-
bility testing, MDR = multidrug-resistant (simultaneous resistance towards isoniazid and rifam-
picin); Pre-XDR= pre-extensively drug-resistant (an MDR which is also resistant to any fluoroquin-
olone), MTBC = Mycobacterium tuberculosis complex.
3.3. Genome-Based Drug Resistance Prediction
Overall, 37 out of the 385 (9.6%) MTBC isolates investigated were found to be re-
sistant to at least one of the first-line drugs, of which 20 (5.2%) were MDR. Monodrug

Genes 2022, 13, 475 8 of 15
resistance to INH, RIF, or PZA was observed in 15 (3.9%), 1 (0.3%), and 1 (0.3%) of the
MTBC strains, respectively (Table S1).
A detailed analysis of variants in resistance-associated genes revealed that 9.1%
(35/385) of the strains had mutations conferring resistance to INH, with the Ser315Thr in
the katG gene being the dominant observed mutation (60.0%, 21/35) (Table 2). The -15 c/t
mutation in the fabG-inhA promoter region was the second most dominant INH resistance
determinant (22.8%, 8/35). Variants in the rpoB gene that confer resistance to RIF were
found in 21 (5.5%) strains, with the Ser450Leu mutation being the most common (52.3%,
11/21) (Table 2). Moreover, mutations at codon 445 leading to His445Tyr, His445Arg, and
His445Asp amino acid substitutions were observed in seven (33.3%) strains.
The most common mutation mediating STR resistances was the Lys43Arg (69.2%,
9/13) at the rpsL gene, followed by the 513 a/c (23.0%, 3/13) mutation in the rrs gene. Eleven
strains were resistant to EMB, with Met306Ile being the frequent mutation observed in the
embB gene (63.6%, 7/11) (Table 2). The pncA gene was analyzed for mutations conferring
resistance to PZA. The Lys96Thr mutation was found to be the most common (50.0%,
6/12).
Only one strain was found with a fluoroquinolone resistance mediating mutation in
the gyrA gene (Asp94Gly, 1/385, 0.3%). This strain was hence defined as pre-extensively
drug-resistant (XDR) which is an MDR and resistant to any fluoroquinolone. There were
no resistance markers identified for other second-line anti-TB drugs.
Table 2. Detected mutations that mediate resistance to first-line anti-TB drugs in 37 resistant MTBC
strains in urban and slum areas of Nairobi, Kenya (2010–2015).
Drug Gene Mutation Codon Change Total
INH
katG Ser315Thr agc/aCc 21
Ser315Arg agc/aGa 2
fabG1-inhA -15 c/t C→T 8
inhA Leu203Leu ctg/ctA 2
Ile194Thr atc/aCc 2
RIF rpoB
Gln432Pro Caa/cCa 2
His 445Tyr Cac/Tac 5
His 445Arg Cac/cGc 1
His445Asp Cac/Gac 1
Ser450Leu Tcg/tTg 11
Leu452Pro Ctg/cCg 1
STR
rpsL Lys43Arg Aag/aGg 9
gidB Ala138Val Gcg/gTg 1
rrs 513 a/c A→C 3
EMB embB
Met306Ile Atg/atA 7
Met306Val Atg/Gtg 2
Asp328Gly Gat/gGt 1
Asp354Ala Gac/Aac 1
PZA pncA
Gln10Pro cag/cCg 1
His57Asp cac/Gac 1
Asp63Gly gac/gGc 2
Lsy96Thr aag/aCg 6
Thr135Pro acc/Ccc 1
Gln141_ cag/tag 1
FQs gyrA Asp94Gly gac/Cac 1
INH = isoniazid, RIF = rifampicin, STR, streptomycin, EMB = ethambutol, PZA = pyrazinamide, FQs
= fluoroquinolones.
Genes 2022, 13, 475 9 of 15
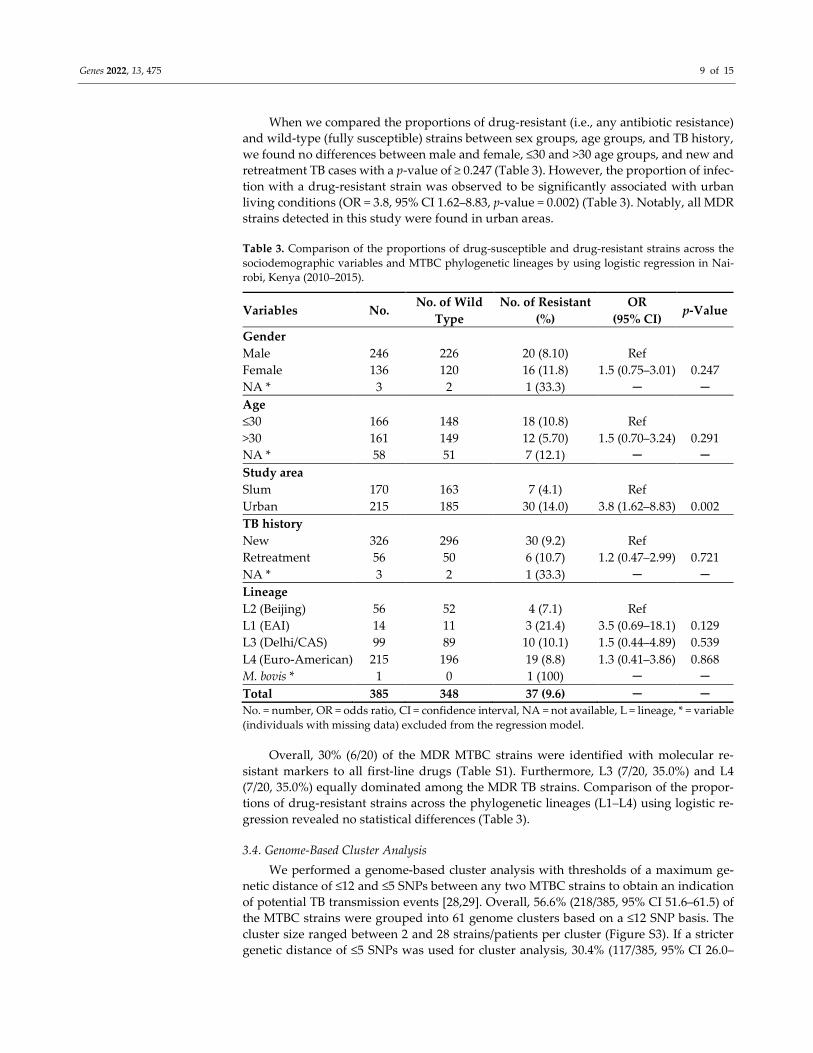
When we compared the proportions of drug-resistant (i.e., any antibiotic resistance)
and wild-type (fully susceptible) strains between sex groups, age groups, and TB history,
we found no differences between male and female, ≤30 and >30 age groups, and new and
retreatment TB cases with a p-value of ≥ 0.247 (Table 3). However, the proportion of infec-
tion with a drug-resistant strain was observed to be significantly associated with urban
living conditions (OR = 3.8, 95% CI 1.62–8.83, p-value = 0.002) (Table 3). Notably, all MDR
strains detected in this study were found in urban areas.
Table 3. Comparison of the proportions of drug-susceptible and drug-resistant strains across the
sociodemographic variables and MTBC phylogenetic lineages by using logistic regression in Nai-
robi, Kenya (2010–2015).
Variables No. No. of Wild
Type
No. of Resistant
(%)
OR
(95% CI) p-Value
Gender
Male 246 226 20 (8.10) Ref
Female 136 120 16 (11.8) 1.5 (0.75–3.01) 0.247
NA * 3 2 1 (33.3) ─ ─
Age
≤30 166 148 18 (10.8) Ref
>30 161 149 12 (5.70) 1.5 (0.70–3.24) 0.291
NA * 58 51 7 (12.1) ─ ─
Study area
Slum 170 163 7 (4.1) Ref
Urban 215 185 30 (14.0) 3.8 (1.62–8.83) 0.002
TB history
New 326 296 30 (9.2) Ref
Retreatment 56 50 6 (10.7) 1.2 (0.47–2.99) 0.721
NA * 3 2 1 (33.3) ─ ─
Lineage
L2 (Beijing) 56 52 4 (7.1) Ref
L1 (EAI) 14 11 3 (21.4) 3.5 (0.69–18.1) 0.129
L3 (Delhi/CAS) 99 89 10 (10.1) 1.5 (0.44–4.89) 0.539
L4 (Euro-American) 215 196 19 (8.8) 1.3 (0.41–3.86) 0.868
M. bovis * 1 0 1 (100) ─ ─
Total 385 348 37 (9.6) ─ ─
No. = number, OR = odds ratio, CI = confidence interval, NA = not available, L = lineage, * = variable
(individuals with missing data) excluded from the regression model.
Overall, 30% (6/20) of the MDR MTBC strains were identified with molecular re-
sistant markers to all first-line drugs (Table S1). Furthermore, L3 (7/20, 35.0%) and L4
(7/20, 35.0%) equally dominated among the MDR TB strains. Comparison of the propor-
tions of drug-resistant strains across the phylogenetic lineages (L1–L4) using logistic re-
gression revealed no statistical differences (Table 3).
3.4. Genome-Based Cluster Analysis
We performed a genome-based cluster analysis with thresholds of a maximum ge-
netic distance of ≤12 and ≤5 SNPs between any two MTBC strains to obtain an indication
of potential TB transmission events [28,29]. Overall, 56.6% (218/385, 95% CI 51.6–61.5) of
the MTBC strains were grouped into 61 genome clusters based on a ≤12 SNP basis. The
cluster size ranged between 2 and 28 strains/patients per cluster (Figure S3). If a stricter
genetic distance of ≤5 SNPs was used for cluster analysis, 30.4% (117/385, 95% CI 26.0–

Genes 2022, 13, 475 10 of 15
35.2) of the strains were grouped into 41 clusters ranging from 2 to 21 strains/patients
(Figure S4).
Stratifying by phylogenetic MTBC lineage showed that L2 strains had the highest
genome clustering rate using both ≤12 and ≤5 SNP distance (66.1% and 35,7%), followed
by L4 (57.2% and 34,4%). L2 and L4 strains further had a higher odds ratio to be in a mo-
lecular cluster (L2, OR 2.1, p-value= 0.051 and L4 OR 1.9, p-value = 0.019) using a SNP
threshold of ≤5 (Table 4). This indicates that L2 and L4 strains are more effectively trans-
mitted as compared to L3 strains. However, a statistical difference was only observed for
the strict threshold of ≤5 SNP genetic distance (Table 4).
Among the strains of the L4 MTBC sublineages, strains of the L4.4.1.1 (S-type) sub-
lineage formed the largest genome cluster comprising 28 strains/patients. Overall, L4.4.1.1
(S-type) (OR 2.19, p = 0.001), L4.1.1.1 (X-type) (OR 2.7, p = 0.028), and L4.8 (Kenya H37Rv-
like) (OR 2.12, p = 0.017) were significantly associated with molecular clusters.
Table 4. Comparison of the proportions of clustered and not clustered strains across the detected
MTBC phylogenetic lineages by using logistic regression in Nairobi, Kenya (2010–2015).
Variable No. d12 d5
NC C (%) OR (95% CI) p-Value NC C (%) OR (95% CI) p-Value
Lineage
L3 (Delhi/CAS) 99 45 54 (54.5%) Ref 78 21 (21.2%) Ref
L2 (Beijing) 56 19 37 (66.1%) 1.6 (0.82–3.20) 0.163 36 20 (35.7%) 2.1 (1.00–4.28 0.051
L4 (Euro-American) 215 92 123 (57.2%) 1.1 (0.69–1.80) 0.658 141 74 (34.4%) 1.9 (1.12–3.41) 0.019
L1 (EAI) * 14 10 4 (28.6%) ─ ─ 12 2 (14.3%) ─ ─
M. bovis * 1 0 0 (0.00%) ─ ─ 0 0 (0.00%) ─ ─
Total 385 166 218 (56.6) ─ ─ 267 117 (30.5) ─ ─
No. = number, d12 = genetic distance of ≤12 single-nucleotide polymorphisms (SNPs), d5 = genetic
distance ≤ 5 SNPs, NC = number of not clustered, C = number of clustered, OR = odds ratio, CI =
confidence interval, NA = not available, * = variable excluded from the regression model.
3.5. Transmission of MDR MTBC Strains
Based on ≤12 and ≤5 SNP genetic distances, 60% (12/20, three clusters) and 50%
(10/20, three clusters) of MDR strains were clustered, respectively (Figure S5). Within the
genomic clusters, MDR strains showed identical resistance-conferring mutations in the
katG gene. In the rpoB gene, most strains (11/20, 55.0%) carried the rpoB mutation
Ser450Leu as well as katG Ser315Thr (18/20, 90%). The largest MDR cluster (with both
thresholds, ≤12 and ≤5 SNPs) comprised six L4.4.1.1 (S-type) strains that all shared the
following resistance-conferring mutations: katG Ser315Thr, rpoB Ser450Leu, pncA
Lys96Thr, rpsL Lsy43Arg, and embB Met306Ile. One of the strains of this cluster already
evolved to pre-XDR. All patients within this MDR cluster were from urban living areas in
Nairobi.
4. Discussion
In this study, we elucidated the MTBC population structure and transmission events
in Nairobi, Kenya, by using WGS. We showed that pulmonary TB is dominantly caused
by strains of L4 and L3 and noted a substantial cluster rate which points towards ongoing
transmission of MTBC strains. Moreover, all patients infected with MDR strains were
from urban areas of Nairobi. We further found a cluster that consists of strains that are
resistant to all first-line anti-TB drugs, with one of them already evolved to pre-XDR.
These findings emphasize the need for more focused infection control measures and con-
tact tracing of patients with MDR TB to break the transmission chains.
We revealed that the MTBC population comprises strains of four lineages in Nairobi,
namely L1-L4 and one M. bovis strain. Strains of L4 and L3 are the main causative agents
of TB comprising 55.8% and 25.7% of the investigated strains, respectively. These findings

Genes 2022, 13, 475 11 of 15
mirror reports from neighboring countries, such as Ethiopia [33], Tanzania [34], and
Uganda [35] but are in contrast to the findings from Shuaib et al. [12] and Ejo et al. [36] in
Eastern Sudan and Northwest Ethiopia where L3 strains were the main etiological agent
of TB.
We found that strains of the LAM (L4.3.1, L4.3.3, and L4.3.4) sublineages are the most
prevalent in Nairobi in comparison with strains of other L4 sublineages. Stucki et al. [37]
have identified strains of certain sublineages of L4, such as LAM (L4.3), Haarlem (L4.1.2),
and PGG3 (L4.10), as generalists as these strains can cause TB in all host genetic back-
grounds globally. Therefore, the high prevalence of the strains of the generalist LAM sub-
lineage might explain the dominance of L4 strains in Nairobi in Kenya. Another possible
explanation for the success of L4 might be related to the observation that some L4 strains
are capable of evading the host immune response and rapidly progressing to TB disease
and thus are more often transmitted [15,36].
As mentioned before, L3 strains were the second most prevalent causative agent of
TB in Nairobi. It’s been previously suggested that L3 strains have an evolutionary origin
in South Asia. However, L3 strains have frequently been isolated from TB patients in East
and North Africa [12,34,36,38], and one could speculate if these strains have co-evolved
with and adapted to their East African hosts and consequently developed specific biolog-
ical/phenotypic traits in this particular host population [12]. The high prevalence of L3
strains in Kenya could also be related to recent and/or past movements of people from the
Indian subcontinent (i.e., migration, tourism, and trade).
In this study, we found that L2 strains comprised 14.5% of the investigated strains,
which is higher than former reports where the prevalence of L2 strains was 8.4% in 2004
[39]. This upward trend indicates that strains of this lineage are also successfully trans-
mitted in the population. Moreover, the reported proportion of L2 strains in the present
study is higher than that in other countries of the region, including Sudan (0.6%) [12],
Tanzania (4.1%) [34], Uganda (1.2%) [38], and Ethiopia (0.5%) [40]. It is known that L2
strains have their origin in East Asia, where they are responsible for multiple TB epidem-
ics [10,41]. The expansion of L2 strains on the African continent has been suggested to be
associated with increased transmission, high virulence, and a rapid progression to dis-
ease, rather than with drug resistance [10,41]. In addition, labor migration has been dis-
cussed as a possible factor explaining the increasing prevalence of L2 strains, mainly in
East African countries [41].
We found evidence of direct patient-to-patient MTBC transmission as one-third (i.e.,
30.4%) of the isolates/patients were associated with genomic clusters using a ≤5 SNP
threshold in this study. Surprisingly, the transmission of TB is significantly higher in ur-
ban areas than in slum areas of Nairobi using both ≤12 and ≤5 SNP distances (34.9% in
urban areas vs. 24.7% in slum areas, Exp(B) = 1.6, p-value = 0.032). This indicates that a
higher risk of being infected due to transmission is related to a certain hotspot. Comparing
the cluster rate across all phylogenetic lineages showed that L2 and L4 strains had an in-
creased odds ratio of being in a molecular cluster (d5: L2, OR 2.1, p-value = 0.051 and L4
OR 1.9, p-value = 0.019). Additionally, among the strains of L4 MTBC sublineages, strains
of the S-type, X-type, and Kenya H37Rv-like are likely more successful, i.e., have a higher
odds to be in a molecular cluster. The observed cluster rate in Nairobi is comparable to
the cluster rates reported in other high TB burden countries, such as Sudan [12], South
Africa [16], and Ethiopia [42].
Early detection of resistance to anti-TB drugs is important for successful treatment
and control of MDR TB [43]. In this study, 9.6% of the strains were found to be resistant
to at least one first-line anti-TB drug, with 5.2% being MDR strains. This proportion of
MDR strains is higher than those previously reported in Kenya [44,45] and in other coun-
tries, e.g., Uganda (1.7%) [46]. Nevertheless, in Sudan (9.0%) [12] and Tanzania (6.3%) [47],
higher proportions of MDR strains have been reported. The variations in resistance rates
observed in our study and the previous studies in Kenya could be due to the study design
and sample size obtained [44,45]. Information on susceptibility patterns of strains against

Genes 2022, 13, 475 12 of 15
anti-TB drugs is essential for the control and surveillance of TB. Therefore, early diagnosis
and treatment, improving treatment outcomes, and expanding diagnostic capacity for
mycobacterial culture and drug susceptibility testing are crucial to limit the spread of drug
resistant MTBC strains, especially MDR. In the case of the MDR and RR TB cases, rapid
detection of resistance, e.g., by GeneXpert, followed by extended phenotypic drug sus-
ceptibility testing is essential for patient isolation and establishment of second-line anti-
TB therapy. Otherwise, prolonged periods of ineffective treatment will likely allow con-
tinuous transmission of MDR cases with disastrous consequences for TB control in the
future.
Furthermore, we found a high cluster rate among MDR strains (60% based on ≤12
SNP threshold and 50% based on ≤5 SNP threshold) in combination with an increased risk
of infections with drug-resistant strains in urban living areas in Nairobi. This is in line
with a recent Kenya TB prevalence survey that indicated that the majority of TB cases are
found in urban areas [14]. Therefore, successful control of TB in these settings should focus
on addressing the influence of associated social and economic factors as well as strengthen
TB control measures including contact tracing, early TB case detection, and adherence to
treatment.
One limitation of our study is the lack of comprehensive epidemiological and clinical
data, such as HIV status, diabetes, and other comorbidities, as well as treatment outcome.
This limited a detailed analysis of epidemiological and clinical factors associated with re-
cent transmission of MTBC strains (i.e., by using number of clustered strains as surrogate).
Another limitation is the sampling bias of the two cohorts. Higher proportions of MDR
and clustered strains were collected mainly from TB patients living in urban areas in the
2010 study cohort. This could have biased the association between any drug resistance
and urban settings in the combined analysis.
5. Conclusions
Our study demonstrates that TB is predominantly caused by L4 strains in the urban
and slum settings of Nairobi, Kenya. WGS analysis provides a better understanding of
transmission dynamics of MTBC strains and their molecular drug resistance determi-
nants. We found a cluster of strains that are resistant to all first-line anti-TB drugs. One of
the strains of this molecular cluster has already evolved to a pre-XDR genotype via the
acquisition of FQ resistance. Importantly, we observed that all MDR strains are associated
with urban living environments and half of them are linked to direct patient-to-patient
transmission, highlighting the urgent need to increase efforts to identify MDR TB cases
and trace patient contacts to contain the spread of the disease in Nairobi. Adoption of the
use of WGS may further allow for improved disease surveillance in high TB burden coun-
tries. Moreover, additional facilities in which molecular diagnosis of TB and drug suscep-
tibility testing can be performed are required.
Supplementary Materials: The following supporting information can be downloaded at:
www.mdpi.com/article/10.3390/genes13030475/s1, Figure S1. Sectional map of Nairobi, Kenya; Fig-
ure S2. Phylogenetic tree showing MTBC lineage classification of all analyzed MTBC isolates in ur-
ban and slum settings of Nairobi, Kenya; Figure S3. Phylogenetic tree showing <12 SNP clusters in
urban and slum settings of Nairobi, Kenya; Figure S4. Phylogenetic tree showing <5 SNP clusters in
urban and slum settings of Nairobi, Kenya; Figure S5. Phylogenetic tree showing genotypic drug
resistance in urban and slum settings of Nairobi, Kenya; Table S1. Study Variables.
Author Contributions: Conceptualization, G.K., P.N., S.K. and S.N.; methodology, G.K., P.N. and
Y.A.S.; software, S.H., S.K., M.M. and S.N.; validation, S.H., S.K., M.M. and S.N.; formal analysis,
G.K., P.N. and Y.A.S.; investigation, G.K. and P.N.; resources, E.A., G.R., S.K. and S.N.; data cura-
tion, G.K., P.N., Y.A.S., S.H., S.K., M.M. and S.N.; writing—original draft preparation, G.K., Y.A.S.
and M.M.; writing—review and editing, G.K., P.N., Y.A.S., E.A., G.R., S.H., S.K., M.M. and S.N.;
visualization, G.K. and Y.A.S.; supervision, S.H., S.K., M.M. and S.N.; project administration, G.K.
and P.N.; funding acquisition, G.K., P.N. and S.N. All authors have read and agreed to the published
version of the manuscript.

Genes 2022, 13, 475 13 of 15
Funding: The first author (G.K.) is a DAAD (German: Deutscher Akademischer Austauschdienst)
stipend recipient, funding program No. A/13/93800. Parts of this work have been supported by
Deutsche Forschungsgemeinschaft (DFG, German Research Foundation) under Germany’s Excel-
lence Strategy EXC 22167-390884018, the Leibniz Science Campus EvoLUNG, and the German Cen-
ter for Infection Research.
Institutional Review Board Statement: Ethical approval to conduct the study was granted by the
Kenya Medical Research Institute Ethical Review Committee (No. KEMRI/RES/7/3/1).
Informed Consent Statement: Only pulmonary TB patients attending the TB clinic and who will-
ingly consented to the study were recruited. In the case of illiterate individuals, consent was sought
from their guardians.
Data Availability Statement: Generated raw sequencing reads in this study were submitted to the
European Nucleotide Archive (ENA) under the project accession number (PRJEB50767).
Acknowledgments: The authors would like to thank all the patients who participated in this study
as well as Edward Otieno and Lucy Nyang’au for helping with sample collection. We also thank the
laboratory staff at the Molecular and Experimental Mycobacteriology Laboratory for their great as-
sistance with the molecular work. In particular, we are grateful to Tanja Ubben, Julia Zallet, Tanja
Struve-Sonnenschein, and Vanessa Mohr for providing excellent technical assistance.
Conflicts of Interest: The authors declare no conflict of interest.
References
1. WHO. Global Tuberculosis Report 2021; World Health Organization: Geneva, Switzerland, 2021; p. 232.
2. Glaziou, P.; Sismanidis, C.; Floyd, K.; Raviglione, M. Global epidemiology of tuberculosis. Cold Spring Harb. Perspect. Med. 2014,
5, a017798. https://doi.org/10.1101/cshperspect.a017798.
3. Kipruto, H.; Mung’atu, J.; Ogila, K.; Adem, A.; Mwalili, S.; Masini, E.; Kibuchi, E. The epidemiology of tuberculosis in Kenya,
a high TB HIV burden country (2000-2013). Int. J. Public Health Epidemiol. Res. 2015, 1, 002–013.
4. Kwan, C.K.; Ernst, J.D. HIV and tuberculosis: A deadly human syndemic. Clin. Microbiol. Rev. 2011, 24, 351–376.
https://doi.org/10.1128/CMR.00042-10.
5. Campbell, P.J.; Morlock, G.P.; Sikes, R.D.; Dalton, T.L.; Metchock, B.; Starks, A.M.; Hooks, D.P.; Cowan, L.S.; Plikaytis, B.B.;
Posey, J.E. Molecular detection of mutations associated with first- and second-line drug resistance compared with conventional
drug susceptibility testing of Mycobacterium tuberculosis. Antimicrob. Agents Chemother. 2011, 55, 2032–2041.
https://doi.org/10.1128/AAC.01550-10.
6. Cilloni, L.; Fu, H.; Vesga, J.F.; Dowdy, D.; Pretorius, C.; Ahmedov, S.; Nair, S.A.; Mosneaga, A.; Masini, E.; Sahu, S.; et al. The
potential impact of the COVID-19 pandemic on the tuberculosis epidemic a modelling analysis. EClinicalMedicine 2020, 28,
100603. https://doi.org/10.1016/j.eclinm.2020.100603.
7. McQuaid, C.F.; Vassall, A.; Cohen, T.; Fiekert, K.; White, R.G. The impact of COVID-19 on TB: A review of the data. Int. J. Tuberc.
Lung Dis. 2021, 25, 436–446. https://doi.org/10.5588/ijtld.21.0148.
8. Singhal, R.; Myneedu, V.P. Microscopy as a diagnostic tool in pulmonary tuberculosis. Int J. Mycobacteriol. 2015, 4, 1–6.
https://doi.org/10.1016/j.ijmyco.2014.12.006.
9. Shuaib, Y.A.; Khalil, E.A.G.; Schaible, U.E.; Wieler, L.H.; Bakheit, M.A.M.; Mohamed-Noor, S.E.; Abdalla, M.A.; Homolka, S.;
Andres, S.; Hillemann, D.; et al. Smear Microscopy for Diagnosis of Pulmonary Tuberculosis in Eastern Sudan. Tuberc. Res.
Treat. 2018, 2018, 8038137. https://doi.org/10.1155/2018/8038137.
10. Merker, M.; Blin, C.; Mona, S.; Duforet-Frebourg, N.; Lecher, S.; Willery, E.; Blum, M.G.; Rusch-Gerdes, S.; Mokrousov, I.;
Aleksic, E.; et al. Evolutionary history and global spread of the Mycobacterium tuberculosis Beijing lineage. Nat. Genet. 2015,
47, 242–249. https://doi.org/10.1038/ng.3195.
11. Merker, M.; Barbier, M.; Cox, H.; Rasigade, J.P.; Feuerriegel, S.; Kohl, T.A.; Diel, R.; Borrell, S.; Gagneux, S.; Nikolayevskyy, V.;
et al. Compensatory evolution drives multidrug-resistant tuberculosis in Central Asia. Elife 2018, 7.
https://doi.org/10.7554/eLife.38200.
12. Shuaib, Y.A.; Khalil, E.A.G.; Wieler, L.H.; Schaible, U.E.; Bakheit, M.A.; Mohamed-Noor, S.E.; Abdalla, M.A.; Kerubo, G.;
Andres, S.; Hillemann, D.; et al. Mycobacterium tuberculosis Complex Lineage 3 as Causative Agent of Pulmonary
Tuberculosis, Eastern Sudan. Emerg. Infect. Dis. 2020, 26, 427–436. https://doi.org/10.3201/eid2603.191145.
13. Kompala, T.; Shenoi, S.V.; Friedland, G. Transmission of tuberculosis in resource-limited settings. Curr. Hiv/aids Rep. 2013, 10,
264–272. https://doi.org/10.1007/s11904-013-0164-x.
14. Enos, M.; Sitienei, J.; Ong'ang'o, J.; Mungai, B.; Kamene, M.; Wambugu, J.; Kipruto, H.; Manduku, V.; Mburu, J.; Nyaboke, D.;
et al. Kenya tuberculosis prevalence survey 2016: Challenges and opportunities of ending TB in Kenya. PLoS ONE 2018, 13,
e0209098. https://doi.org/10.1371/journal.pone.0209098.
Genes 2022, 13, 475 14 of 15
15. Wiens, K.E.; Woyczynski, L.P.; Ledesma, J.R.; Ross, J.M.; Zenteno-Cuevas, R.; Goodridge, A.; Ullah, I.; Mathema, B.; Djoba
Siawaya, J.F.; Biehl, M.H.; et al. Global variation in bacterial strains that cause tuberculosis disease: A systematic review and
meta-analysis. BMC Med. 2018, 16, 196. https://doi.org/10.1186/s12916-018-1180-x.
16. Middelkoop, K.; Mathema, B.; Myer, L.; Shashkina, E.; Whitelaw, A.; Kaplan, G.; Kreiswirth, B.; Wood, R.; Bekker, L.G.
Transmission of tuberculosis in a South African community with a high prevalence of HIV infection. J. Infect. Dis. 2015, 211, 53–
61. https://doi.org/10.1093/infdis/jiu403.
17. Ganoza, C.A.; Ricaldi, J.N.; Chauca, J.; Rojas, G.; Munayco, C.; Agapito, J.; Palomino, J.C.; Guerra, H. Novel hypertonic saline-
sodium hydroxide (HS-SH) method for decontamination and concentration of sputum samples for Mycobacterium tuberculosis
microscopy and culture. J. Med. Microbiol. 2008, 57, 1094–1098. https://doi.org/10.1099/jmm.0.2008/001339-0.
18. Basavaraj, A.; Chandanwale, A.; Patil, A.; Kadam, D.; Joshi, S.; Gupte, N.; McIntire, K.; Jain, D.; Dalal, H.; Badave, R.; et al.
Tuberculosis Risk among Medical Trainees, Pune, India. Emerg. Infect. Dis. 2016, 22, 541–543.
https://doi.org/10.3201/eid2203.151673.
19. GLI. Mycobacteriology Laboratory Manual; WHO: Geneva, Swizerland, 2014.
20. Somerville, W.; Thibert, L.; Schwartzman, K.; Behr, M.A. Extraction of Mycobacterium tuberculosis DNA: A question of
containment. J. Clin. Microbiol. 2005, 43, 2996–2997. https://doi.org/10.1128/JCM.43.6.2996-2997.2005.
21. Baym, M.; Kryazhimskiy, S.; Lieberman, T.D.; Chung, H.; Desai, M.M.; Kishony, R. Inexpensive multiplexed library preparation
for megabase-sized genomes. PLoS ONE 2015, 10, e0128036. https://doi.org/10.1371/journal.pone.0128036.
22. Li, H.; Durbin, R. Fast and accurate long-read alignment with Burrows-Wheeler transform. Bioinformatics 2010, 26, 589–595.
https://doi.org/10.1093/bioinformatics/btp698.
23. Kohl, T.A.; Utpatel, C.; Schleusener, V.; De Filippo, M.R.; Beckert, P.; Cirillo, D.M.; Niemann, S. MTBseq: A comprehensive
pipeline for whole genome sequence analysis of Mycobacterium tuberculosis complex isolates. PeerJ 2018, 6, e5895.
https://doi.org/10.7717/peerj.5895.
24. Feuerriegel, S.; Schleusener, V.; Beckert, P.; Kohl, T.A.; Miotto, P.; Cirillo, D.M.; Cabibbe, A.M.; Niemann, S.; Fellenberg, K.
PhyResSE: A Web Tool Delineating Mycobacterium tuberculosis Antibiotic Resistance and Lineage from Whole-Genome
Sequencing Data. J. Clin. Microbiol. 2015, 53, 1908–1914. https://doi.org/10.1128/JCM.00025-15.
25. Posada, D. jModelTest: Phylogenetic model averaging. Mol. Biol. Evol. 2008, 25, 1253–1256.
https://doi.org/10.1093/molbev/msn083.
26. Price, M.N.; Dehal, P.S.; Arkin, A.P. FastTree 2—approximately maximum-likelihood trees for large alignments. PLoS ONE
2010, 5, e9490. https://doi.org/10.1371/.
27. He, Z.; Zhang, H.; Gao, S.; Lercher, M.J.; Chen, W.H.; Hu, S. Evolview v2: An online visualization and management tool for
customized and annotated phylogenetic trees. Nucleic Acids Res. 2016, 44, W236-241. https://doi.org/10.1093/nar/gkw370.
28. Walker, T.M.; Ip, C.L.C.; Harrell, R.H.; Evans, J.T.; Kapatai, G.; Dedicoat, M.J.; Eyre, D.W.; Wilson, D.J.; Hawkey, P.M.; Crook,
D.W.; et al. Whole-genome sequencing to delineate Mycobacterium tuberculosis outbreaks: A retrospective observational study.
Lancet Infect. Dis. 2013, 13, 137–146. https://doi.org/10.1016/s1473-3099(12)70277-3.
29. Meehan, C.J.; Moris, P.; Kohl, T.A.; Pecerska, J.; Akter, S.; Merker, M.; Utpatel, C.; Beckert, P.; Gehre, F.; Lempens, P.; et al. The
relationship between transmission time and clustering methods in Mycobacterium tuberculosis epidemiology. EBioMedicine
2018, 37, 410–416. https://doi.org/10.1016/j.ebiom.2018.10.013.
30. MARCH. DLTLD Guidelines on Management of Leprosy and Tuberculosis; Ministry of Public Health and Sanitation: Nairobi, Kenya,
2009; p. 108.
31. Coll, F.; McNerney, R.; Guerra-Assuncao, J.A.; Glynn, J.R.; Perdigao, J.; Viveiros, M.; Portugal, I.; Pain, A.; Martin, N.; Clark,
T.G. A robust SNP barcode for typing Mycobacterium tuberculosis complex strains. Nat. Commun 2014, 5, 4812.
https://doi.org/10.1038/ncomms5812.
32. Niemann, S.; Merker, M.; Kohl, T.; Supply, P. Impact of Genetic Diversity on the Biology of Mycobacterium tuberculosis
Complex Strains. Microbiol. Spectr. 2016, 4, 1-18. https://doi.org/10.1128/microbiolspec.TBTB2-0022-2016.
33. Nuru, A.; Mamo, G.; Worku, A.; Admasu, A.; Medhin, G.; Pieper, R.; Ameni, G. Genetic Diversity of Mycobacterium
tuberculosis Complex Isolated from Tuberculosis Patients in Bahir Dar City and Its Surroundings, Northwest Ethiopia. Biomed.
Res. Int. 2015, 2015, 174732. https://doi.org/10.1155/2015/174732.
34. Mbugi, E.V.; Katale, B.Z.; Siame, K.K.; Keyyu, J.D.; Kendall, S.L.; Dockrell, H.M.; Streicher, E.M.; Michel, A.L.; Rweyemamu,
M.M.; Warren, R.M.; et al. Genetic diversity of Mycobacterium tuberculosis isolated from tuberculosis patients in the Serengeti
ecosystem in Tanzania. Tuberculosis 2015, 95, 170–178. https://doi.org/10.1016/j.tube.2014.11.006.
35. Asiimwe, B.B.; Ghebremichael, S.; Kallenius, G.; Koivula, T.; Joloba, M.L. Mycobacterium tuberculosis spoligotypes and drug
susceptibility pattern of isolates from tuberculosis patients in peri-urban Kampala, Uganda. BMC Infect. Dis. 2008, 8, 101.
https://doi.org/10.1186/1471-2334-8-101.
36. Ejo, M.; Torrea, G.; Uwizeye, C.; Kassa, M.; Girma, Y.; Bekele, T.; Ademe, Y.; Diro, E.; Gehre, F.; Rigouts, L.; et al. Genetic
diversity of the Mycobacterium tuberculosis complex s.strains from newly diagnosed tuberculosis patients in Northwest
Ethiopia reveals a predominance of East-African-Indian and Euro-American lineages. Int J. Infect. Dis. 2021, 103, 72–80.
https://doi.org/10.1016/j.ijid.2020.11.129.
37. Stucki, D.; Brites, D.; Jeljeli, L.; Coscolla, M.; Liu, Q.; Trauner, A.; Fenner, L.; Rutaihwa, L.; Borrell, S.; Luo, T.; et al.
Mycobacterium tuberculosis lineage 4 comprises globally distributed and geographically restricted sublineages. Nat. Genet.
2016, 48, 1535–1543. https://doi.org/10.1038/ng.3704.

Genes 2022, 13, 475 15 of 15
38. Bazira, J.; Asiimwe, B.B.; Joloba, M.L.; Bwanga, F.; Matee, M.I. Mycobacterium tuberculosis spoligotypes and drug susceptibility
pattern of isolates from tuberculosis patients in South-Western Uganda. BMC Infect. Dis. 2011, 11, 81.
39. Githui, W.A.; Jordaan, A.M.; Juma, E.S.; Kinyanjui, P.; Karimi, F.G.; Kimwomi, J.; Meme, H.; Mumbi, P.; Streicher, E.M.; Warren,
R.; et al. Identification of MDR-TB BeijingW and other Mycobacterium tuberculosis genotypes in Nairobi, Kenya. Int J. Tuberc.
Lung Dis. 2004, 8, 352–360.
40. Yimer, S.A.; Norheim, G.; Namouchi, A.; Zegeye, E.D.; Kinander, W.; Tonjum, T.; Bekele, S.; Mannsaker, T.; Bjune, G.; Aseffa,
A.; et al. Mycobacterium tuberculosis lineage 7 strains are associated with prolonged patient delay in seeking treatment for
pulmonary tuberculosis in Amhara Region, Ethiopia. J. Clin. Microbiol. 2015, 53, 1301–1309. https://doi.org/10.1128/JCM.03566-
14.
41. Rutaihwa, L.K.; Menardo, F.; Stucki, D.; Gygli, S.M.; Ley, S.D.; Malla, B.; Feldmann, J.; Borrell, S.; Beisel, C.; Middelkoop, K.; et
al. Multiple Introductions of Mycobacterium tuberculosis Lineage 2–Beijing Into Africa Over Centuries. Front. Ecol. Evol. 2019,
7, 1–12; https://doi.org/10.3389/fevo.2019.00112.
42. Mekonnen, A.; Merker, M.; Collins, J.M.; Addise, D.; Aseffa, A.; Petros, B.; Ameni, G.; Niemann, S. Molecular epidemiology and
drug resistance patterns of Mycobacterium tuberculosis complex isolates from university students and the local community in
Eastern Ethiopia. PLoS ONE 2018, 13, e0198054. https://doi.org/10.1371/journal.pone.0198054.
43. Cain, K.P.; Marano, N.; Kamene, M.; Sitienei, J.; Mukherjee, S.; Galev, A.; Burton, J.; Nasibov, O.; Kioko, J.; De Cock, K.M. The
movement of multidrug-resistant tuberculosis across borders in East Africa needs a regional and global solution. PLoS Med.
2015, 12, e1001791. https://doi.org/10.1371/journal.pmed.1001791.
44. Ogaro, T.D.; Githui, W.; Kikuvi, G.; Okari, J.; Wangui, E.; Asiko, V. Anti-tuberculosis drug resistance in Nairobi, Kenya. African
J. Health Sci. 2012, 20, 21–27.
45. Obonyo, L.; Amukoye, E.; Zipporah, P. First line anti-tuberculosis drug resistance among human immunodeficiency virus
infected patients attending Maryland Comprehensive Care Centre, Mathare 4a, Nairobi, Kenya. IJSBAR 2014, 15, 661–668.
46. Kateregga, N.; Atuheire, C.; Ntambi, S.; Ocaka, D.; G., N.; Wampande, E. Prevalence of multidrug resistant Mycobacterium
tuberculosis and risk factors among youth attending MDR-TB unit in Mulago hospital. J. Bacteriol. Mycol. 2018, 5, 1088.
47. Hoza, A.S.; Mfinanga, S.G.M.; Konig, B. Anti-TB drug resistance in Tanga, Tanzania: A cross sectional facility-base prevalence
among pulmonary TB patients. Asian Pac. J. Trop Med. 2015, 8, 907–913. https://doi.org/10.1016/j.apjtm.2015.10.014.