Human T cell epitopes of Mycobacterium tuberculosis are evolutionarily hyperconserved
Upload
khangminh22Category
view
0download
0
1
Biochemical and drug targeting studies of
Mycobacterium tuberculosis cholesterol oxidase P450
enzymes
A thesis submitted to the University of Manchester for the degree of Doctor of
Philosophy in the Faculty of Life Sciences.
2015
Cecilia Nwadiuto Amadi
2
Table of contents
Title page 1
Table of contents 2
List of figures 10
List of tables 18
Abbreviations 20
Abstract 24
Declaration and copyright statement 25
Dedication 27
Acknowledgement 28
Chapter 1- Introduction 29
1.1 Tuberculosis: An Update 29
1.1.1 An ‘Ancient and Modern’ disease 29
1.1.2 The Tuberculosis Burden 31
1.1.3 Signs and Symptoms of Tuberculosis 32
1.1.4 Transmission of Tuberculosis: Latent TB Versus Active TB 33
1.2 Mycobacterium tuberculosis: A Description of a Debilitating Human Pathogen
37
1.3 Tuberculosis Treatment: Past, Present and Future 40
1.3.1 The Past: Genesis of Anti-Tubercular Drug Discovery 40

3
1.3.2 The Present: Anti-Tubercular Drugs in Current Use 42
1.3.3. The Future: New Tuberculosis Drug Candidates in Development 48
1.3.4 Anti-Tubercular Drug Resistance: A Cause for Therapeutic Failures 59
1.4 The Cytochrome P450 Systems 60
1.4.1 Structure, Function and Mechanism 60
1.4.2 The P450 Catalytic Cycle 67
1.4.3. Cytochrome P450 Redox Partners 72
1.5 The Mycobacterium tuberculosis Cytochrome P450 Enzymes
77
1.5.1 Discovery of Mtb P450s and the Quest for their Physiological Roles 77
1.5.2 The Cholesterol Oxidase P450 Enzymes 81
1.5.2.1 CYP125A1(Rv3545c):Essential for Mtb Viability and Infectivity
88
1.5.2.2 CYP142A1(Rv3518c): Functional Redundancy 91
1.5.2.3 CYP124A1 (Rv2266): A Methyl-Branched Lipid-Hydroxylase 96
1.5.2.4 Cholesterol Catabolism: A Promising Drug Target in Mycobacterium tuberculosis
100
1.5.3. CYP51B1: The First Member of the CYP51 Family Identified in Prokaryotes
103
1.5.4 CYP121A1: An Essential Gene for Mtb Viability 105
1.5.5 CYP130A1 (Rv1256c): Essential for Virulence in Mtb? 107
1.5.6 CYP126A1 (Rv0778) 108
1.5.7 CYP128A1: An Essential Enzyme with a Role in Hydroxylation of Respiratory Menaquinone
109
1.5.8 Other Partially Characterized P450 Systems in Mycobacterium tuberculosis
111
1.5.9 Azole Antibiotics: Non-Selective Inhibitors of Mtb Cytochrome P450 Enzymes
115

4
1.6 Novel Drug Discovery Approaches 118
1.6.1 Fragment Based Drug Discovery (FBDD): A Novel Approach to Development of New P450 Inhibitor Scaffolds
118
1.6.2 High Throughput Screening (HTS) 123
1.7 Justification of Research 126
1.8 Aims of Research 128
Chapter 2 - Materials and Methods 129
2.1 Materials 129
2.2 Methods 129
2.2.1 Preparation of Plasmid DNA for Expression Constructs 129
2.2.1.1 Source and Description 129
2.2.1.2 Plasmid DNA Purification 130
2.2.2 Generation of Glycerol Stocks of E. coli Transformants 132
2.2.3 Expression Trials for CYP124A1 and CYP142A1 P450s 132
2.2.4 Scale up of the Expression of CYP142A1 134
2.2.5 Scale up of the Expression of CYP124A1 135
2.2.6 Protein Purification for CYP124A1 and CYP142A1 136
2.2.7 Assessment of P450 Concentration and Purity 138
2.2.8 Determination of P450 Extinction Coefficients Using the Pyridine Hemochromagen Method
139
2.2.9 UV-Visible Spectroscopic Studies of Mtb P450s 140

5
2.2.9.1 Binding Assays with Substrates and Inhibitors 140
2.2.9.2 Formation of P450 Carbon Monoxide and Nitric Oxide Adducts
141
2.2.10 Isothermal Titration Calorimetry (ITC) Studies on Mtb P450s 143
2.2.11 Guanidinium Chloride Denaturation of CYP142A1 144
2.2.12 Redox Potentiometry Studies on CYP124A1 and CYP142A1 144
2.2.13 Multi-Angle Laser Light Scattering (MALLS) Studies of Mtb P450s 146
2.2.14 Differential Scanning Calorimetry Analysis of Mtb P450s 147
2.2.15 Electron Paramagnetic Resonance (EPR) Spectroscopy of P450s 148
2.2.16 CYP124A1 Steady-State Kinetics 148
2.2.17 P450 Protein Crystallization and Structure Determination 149
2.2.18 CYP142A1 Nano-ESI Mass Spectrometry 151
Chapter 3 - Biochemical and Biophysical Characterization of P450 CYP142A1: An Example of Functional Redundancy in the Mycobacterium tuberculosis cholesterol oxidases?
153
3.1 Introduction 153
3.2 Results and Discussion 158
3.2.1 Expression and Purification of CYP142A1 158
3.2.2 CYP142A1 Substrate Binding Assays 163
3.2.3 Inhibitor Binding Assays 170
3.2.4 Binding Analysis with CYP142A1 Fragment Hits 178
3.2.5 Binding Analysis with Compounds from CYP121A1 Fragment Elaboration Hits
182
6
3.2.6 CYP142A1 Fe(II)-CO Adduct and NO Adduct Formation 187
3.2.7 Determination of an Extinction Coefficient for Mtb CYP142A1 Using the Pyridine Hemochromogen Method
191
3.2.8 Light Scattering (MALLS) Analysis of CYP142A1 194
3.2.9 Electron Paramagnetic Resonance (EPR) Analysis of CYP142A1 199
3.2.9.1 EPR Analysis with Selected CYP142A1 Ligands 199
3.2.9.2 EPR Analysis for CYP142A1 Fragments Hits 202
3.2.9.3 EPR Analysis of CYP142A1 Bound to MEK Compounds 205
3.2.10 Differential Scanning Calorimetry Studies of CYP142A1 207
3.2.11 Guanidinium Chloride Denaturation of CYP142A1 210
3.2.12 Isothermal Titration Calorimetry (ITC) Analysis of CYP142A1 214
3.2.13 Redox Potentiometry of CYP142A1 217
3.2.14 Nanoelectrospray Ionization Mass Spectrometric Analysis of Mtb CYP142A1−Ligand Interactions
223
3.2.14.1 NanoESI Mass Spectra of Ligand-Free CYP142A1 224
3.2.14.2 Interaction of CYP142A1 with DTT 226
3.2.14.3 Interaction of CYP142A1 with Econazole 227
3.2.14.4 Analysis of the Interaction of CYP142A1 with Cholestenone
229
3.2.14.5 Interaction of CYP142A1 with Solvents 232
3.3 Summary 233
Chapter 4 - Biochemical and Biophysical characterization of CYP124A1: A promiscuous enzyme with broad substrate specificity in Mycobacterium tuberculosis
240

7
4.1 Introduction 240
4.2 Results and Discussion 243
4.2.1 Expression and Purification of CYP124A1 243
4.2.2 Spectroscopic Analysis of CYP124A1 251
4.2.2.1 The UV-Visible Spectrum of CYP124A1 251
4.2.2.2 CYP124A1 Optical Titrations with Substrates 252
4.2.2.3 CYP124A1 Inhibitor Binding Assays 259
4.2.2.4 CYP124A1 Fragment Binding Assays 266
4.2.3 CYP124A1 Heme Iron Coordination by Carbon Monoxide and Nitric Oxide
274
4.2.4 Determination of the CYP124A1 Heme Extinction Coefficient 278
4.2.5 Steady-State Kinetic Analysis for CYP124A1 280
4.2.6 Multiangle Laser Light Scattering (MALLS) Analysis of CYP124A1 286
4.2.7 Thermostability Analysis of CYP124A1 by Differential Scanning Calorimetry
287
4.2.8 Determination of the Heme Iron Redox potentials of Ligand-Free and Ligand-Bound CYP124A1
293
4.2.9 Electron Paramagnetic Resonance (EPR) Analysis of CYP124A1 299
4.2.9.1 EPR Analysis with CYP124A1 Substrates and Azole Inhibitors
299
4.2.9.2 CYP124A1 EPR Analysis with Fragments and MEK Compounds
305
4.3 Summary 309
Chapter 5 - Structural Biology of Ligand-Bound Complexes of the Cholesterol Oxidising P450s CYP142A1 and CYP124A1
315
8
5.1 Introduction 315
5.2 Results and Discussion 317
5.2.1 X-ray Crystallographic Studies and Structure Determination for CYP142A1 and CYP124A1
317
5.2.1.1 Crystal Structure of the CYP142A1:Cholestenone Complex 321
5.2.1.2 Crystal structure of the CYP124A1:Cholestenone Complex 327
5.2.1.3 A Comparison of Cholestenone-Bound CYP124A1, CYP125A1 and CYP142A1 Structures
335
5.2.1.4 Crystal Structure of the CYP142A1:Econazole Complex 340
5.2.1.5 Crystal Structures of the CYP142A1 in Complex with Fragment-Based Screening Hits
348
5.3 Summary 360
Chapter 6 - Conclusions and Future Directions 365
6.1 Conclusions 365
6.2 Future directions 372
References 375

9
Appendix 396
Word count: 84,129

10
List of Figures
Chapter 1
Figure 1.1: World map showing tuberculosis high-burden countries 32
Figure 1.2: Tuberculosis transmission 36
Figure 1.3: An electron micrograph of Mycobacterium tuberculosis 37
Figure 1.4: The Mycobacterium tuberculosis cell wall 39
Figure 1.5: Structures of some selected anti-TB drugs in clinical use for Mtb infections
48
Figure 1.6: Chemical structure of PDKA 52
Figure 1.7: Chemical structures of HT1171 and GL5 53
Figure 1.8: Chemical structures of nitroimidazole compounds 56
Figure 1.9: Chemical structure of Bedaquiline - a diarylquinoline TB drug 57
Figure 1.10: Chemical structure of SQ109 58
Figure 1.11: Chemical structure of BTZ043 59
Figure 1.12: Heme B prosthetic group 62
Figure 1.13: Spectral features for cytochrome P450 and its ferrous–carbon monoxide complex
63
Figure 1.14: Typical topology of a cytochrome P450 67
Figure 1.15: Schematic representation of the d-orbital electron configurations for low- and high-spin ferric heme iron
68
Figure 1.16: A schematic representation of the P450 compound I (oxyferryl radical cation species)
70
Figure 1.17: Schematic representation of the catalytic cycle of a cytochrome P450 enzyme
71
Figure 1.18: Schematic representation of a variety of P450 redox systems and P450 fusion proteins
76
Figure 1.19: Evolutionary analysis of Mtb P450s 78
Figure 1.20: Genetic organization of cholesterol metabolising gene clusters in Rhodococcus sp. RHA1 and Mtb: A comparison
83

11
Figure 1.21: The chemical structures of cholesterol and cholest-4-en-3-one
87
Figure 1.22: Cholesterol side chain oxidation reactions 87
Figure 1.23: Structural features of Mtb CYP125A1 in complex with diverse substrates and inhibitor molecules.
90
Figure 1.24: Structural features of CYP142 enzymes from Mtb and M. smegmatis
95
Figure 1.25: CYP124A1 catalyses the -hydroxylation of phytanic acid and other methyl-branched lipids
98
Figure 1.26: Structural features of CYP124A1 from Mtb 99
Figure 1.27: Cholesterol catabolic pathway 100
Figure 1.28: Features of CYP51B1 from Mtb 104
Figure 1.29: CYP121A1 catalyzes the formation of an intramolecular C-C bond between 2 tyrosyl carbon atoms of cyclodityrosine
106
Figure 1.30: Structural features of Mtb CYP121A1 in complex with the substrate (cyclodityrosine) and fluconazole
106
Figure 1.31: Crystal structures of ligand-free and econazole-bound CYP130A1.
108
Figure 1.32: Biosynthesis of the Mtb S881 sulfolipid 111
Figure 1.33: Chemical structures of selected azole antibiotics 117
Figure1.34: A schematic representation of the Fragment Based Drug Discovery (FBDD) Approach
117
Figure 1.35: Application of a FBDD approach to Mtb CYP121. 122
Figure 1.36: A schematic representation of the High Throughput Screening (HTS) approach
125
Figure 1.37: Structures of CYP130A1 with HTS hits (heterocyclic arylamines) bound in the active site
126
Chapter 3
Figure 3.1: Protein purification of the Mtb CYP142A1 from the pET15b/CYP142A1 plasmid
159

12
Figure 3.2: Purification of Mtb CYP142A1 using hydroxyapatite (HA) column chromatography
161
Figure 3.3: Purification of Mtb CYP142A1 using a SuperdexTM S-200 gel filtration column
162
Figure 3.4: Optical titration of CYP142A1 with cholest-4-en-3-one 166
Figure 3.5: Optical titration of CYP142A1 with cholesterol 167
Figure 3.6: Optical binding of CYP142A1 with lanosterol 168
Figure 3.7: CYP142A1 binding titration with econazole 172
Figure 3.8: CYP142A1 binding titration with Miconazole 173
Figure 3.9: CYP142A1 binding titration with clotrimazole 174
Figure 3.10: CYP142A1 binding titration with bifonazole 175
Figure 3.11: CYP142A1 binding titration with sodium cyanide 176
Figure 3.12: Compounds hits from an initial CYP142A1 fragment screen 179
Figure 3.13: CYP142A1 binding titration with NMR170 180
Figure 3.14: CYP142A1 binding titration with NMR540 181
Figure 3.15: CYP142A1 binding titration with NMR623 182
Figure 3.16: Elaborated compounds developed from CYP121A1 fragment hits
184
Figure 3.17: CYP142A1 binding with MEK046 185
Figure 3.18: CYP142A1 binding with MEK065 186
Figure 3.19: UV-visible spectra for gaseous ligand-bound complexes of CYP142A1
191
Figure 3.20: Pyridine hemochromagen spectra for CYP142A1. 193
Figure 3.21: Light scattering (MALLS) data for CYP142A1 in the absence of DTT
196
Figure 3.22: Light scattering (MALLS) data for CYP142A1 in the presence of DTT
197
Figure 3.23: Cysteine residues in CYP142A1 199
Figure 3.24: EPR analysis of CYP142A1 and various ligand complexes. 200
Figure 3.25: EPR analysis of interactions of azole drugs and nitrogen-containing fragments with CYP142A1.
205
13
Figure 3.26: X-band EPR spectra for CYP142A1 in complex with different compounds from the MEK series
207
Figure 3.27: Differential scanning calorimetry analysis of CYP142A1. 209
Figure 3.28: Guanidinium chloride denaturation of ligand-free CYP142A1 213
Figure 3.29: Guanidinium chloride denaturation of cholestenone-bound CYP142A1
214
Figure 3.30: Isothermal titration calorimetric (ITC) binding studies of fragments to CYP142A1
215
Figure 3.31: Redox potentiometry of ligand-free CYP142A1 219
Figure 3.32: Redox potentiometry for cholestenone-bound CYP142A1 221
Figure 3.33: Redox potentiometry for clotrimazole-bound CYP142A1 222
Figure 3.34: NanoESI mass spectra of ligand-free CYP142A1 224
Figure 3.35: NanoESI mass spectrum of 10 μM CYP142A1 with DTT (0-5mM)
226
Figure 3.36: NanoESI mass spectra of 10 μM CYP142A1 with econazole 229
Figure 3.37: NanoESI mass spectra of 10 μM CYP142A1 with cholestenone 231
Figure 3.38: NanoESI mass spectrum of 10 μM CYP142A1 with solvents 232
Chapter 4
Figure 4.1: Nickel affinity chromatography purification of CYP124A1 246
Figure 4.2: Hydroxyapatite (HA) column chromatography purification of CYP124A1
248
Figure 4.3: Purification of Mtb CYP124A1 using a SuperdexTM S-200 gel filtration column
250
Figure 4.4: The UV-visible spectrum for purified, ferric CYP124A1 251
Figure 4.5: Optical titration of CYP124A1 with cholest-4-en-3-one 254
Figure 4.6: Optical titration of CYP124A1 with cholesterol 255
Figure 4.7: Optical titration of CYP124A1 with phytanic acid 256

14
Figure 4.8: Optical titration of CYP124A1 with pristane 256
Figure 4.9: Optical titration of CYP124A1 with geraniol 257
Figure 4.10: Optical titration of CYP124A1 with geranylgeraniol 257
Figure 4.11: Binding of bifonazole to CYP124A1 262
Figure 4.12: Binding of clotrimazole to CYP124A1 262
Figure 4.13: Binding of econazole to CYP124A1 263
Figure 4.14: Binding of miconazole to CYP124A1 264
Figure 4.15: Binding of NMR170 to CYP124A1 266
Figure 4.16: Compounds identified as CYP124A1-specific fragment hits 268
Figure 4.17: Binding of NMR115 to CYP124A1 269
Figure 4.18: Binding of NMR415 to CYP124A1 270
Figure 4.19: Elaborated compounds developed from CYP121A1 fragment hits
272
Figure 4.20: Binding of MEK066 to CYP124A1 273
Figure 4.21: UV-visible absorbance features of CYP124A1 and its carbon monoxide complex
275
Figure 4.22: UV-visible absorbance spectra of CYP124A1 in ferric and ferric-NO bound forms
277
Figure 4.23: The pyridine hemochromogen complex of CYP124A1 280
Figure 4.24: Steady-state kinetic analysis for CYP124A1 using an E. coli redox partner system
283
Figure 4.25: Steady-state kinetic analysis for CYP124A1 using a spinach redox partner system
284
Figure 4.26: MALLS analysis of CYP124A1 286
Figure 4.27: DSC analysis of CYP124A1 in substrate-free and substrate-bound forms
289
Figure 4.28: DSC analysis of CYP124A1 in azole-bound forms 290
Figure 4.29: DSC analysis of CYP124A1 in MEK series-bound forms 291
Figure 4.30: DSC analysis of CYP124A1 in fragment-bound forms 292
Figure 4.31: Redox potentiometry of ligand-free CYP124A1 296
Figure 4.32: Redox potentiometry of phytanic acid-bound CYP124A1 297
15
Figure 4.33: Redox potentiometry of econazole-bound CYP124A1 298
Figure 4.34: EPR spectra of CYP124A1 in ligand-free and sterol-bound forms
303
Figure 4.35: EPR spectra of CYP124A1 in complex with methyl-branched lipids
304
Figure 4.36: EPR spectra of CYP124A1 in complex with azole inhibitors 305
Figure 4.37: EPR analysis of CYP124A1 bound to MEK ligands 308
Figure 4.38: EPR spectra of CYP124A1-specific fragment hits 309
Chapter 5
Figure 5.1: Co-crystals of the CYP142A1:cholestenone complex. 321
Figure 5.2: Overall view of the CYP142A1 cholestenone-bound complex (dimer)
322
Figure 5.3: The CYP142A1 substrate binding channel 324
Figure 5.4: Overview of the CYP142A1-cholestenone binding pocket 325
Figure 5.5: Superimposed structures of ligand-free and cholestenone-bound CYP142A1
326
Figure 5.6: Co-crystals of the CYP124A1:cholestenone complex 327
Figure 5.7: Overall view of the CYP124A1:cholestenone complex 329
Figure 5.8: Superimposed structures of ligand-free and cholestenone-bound forms of CYP124A1
330
Figure 5.9: The CYP124A1 substrate binding channel 331
Figure 5.10: Overview of the CYP124A1-cholestenone binding pocket 332
Figure 5.11: Comparison of cholestenone and phytanic acid binding modes to CYP124A1
334
Figure 5.12: Comparison of CYP125A1, CYP142A1 and CYP124A1 cholestenone binding modes
337
Figure 5.13: The substrate binding channels in the three P450 cholesterol oxidases
338

16
Figure 5.14: Comparison of the cholestenone binding modes for CYP125A1, CYP142A2, CYP142A1 and CYP124A1 with that of the CYP142A2 cholesterol sulfate complex
339
Figure 5.15: Co-crystals of the CYP142A1-econazole complex 342
Figure 5.16: Overall view of CYP142A1 econazole-bound complex 343
Figure 5.17: Overview of the econazole binding pocket in CYP142A1 344
Figure 5.18: Slab view of the CYP142A1 active site channel showing econazole bound to the heme iron
345
Figure 5.19: Superimposed structures of the ligand-free and econazole-bound forms of CYP142A1 showing their secondary structure elements
346
Figure 5.20: Superimposed structures of the CYP125A1 and CYP142A1 econazole complexes
347
Figure 5.21: Superimposed structures of the CYP142A1 and CYP130A1 econazole complexes
348
Figure 5.22: A sample of diamond-shaped CYP142A1 native crystals 350
Figure 5.23: The CYP142A1-NMR623 complex structure 351
Figure 5.24: The CYP142A1-NMR170 complex structure 352
Figure 5.25: Co-crystals of the CYP142A1-NMR491 complex 353
Figure 5.26: The structure of the CYP142A1-NMR491 complex 354
Figure 5.27: Co-crystals of the CYP142A1:1-phenylimidazole complex 354
Figure 5.28: The structure of the CYP142A1:1-phenylimidazole complex 355
Figure 5.29: Superimposed structures of the various CYP142A1-fragment complexes
356
Figure 5.30: Superimposed structures of ligand-free and fragment-bound CYP142A1 enzymes
357
Figure 5.31: Superimposed structures of CYP142A1-fragment complexes with the CYP142A1-econazole complex
358

17
Appendix
Figure S1: CYP142A1 (Rv3518c) DNA sequence 398
Figure S2: Synthetic CYP124A1 (Rv2266) gene (codon optimised for E. coli)
400
Figure S3: The CYP142A1 (Rv3518c) gene region in Mycobacterium tuberculosis
401
Figure S4: The CYP124A1 (Rv2266) gene region in Mycobacterium tuberculosis
402
18
List of Tables
Chapter 1
Table 1.1: Classical anti-tubercular drugs 43
Table 1.2 : New anti-tubercular drugs in different phases of development 50
Table 1.3: The twenty (20) P450 enzymes in Mycobacterium tuberculosis
80
Chapter 2
Table 2.1 Composition of growth media used for protein production and the amounts of components added per litre of medium
134
Chapter 3
Table 3.1: Typical CYP142A1 purification table 162
Table 3.2: Binding spectral characteristics and Kd values for CYP142A1 ligands
187
Table 3.3: DSC data for the thermal unfolding of CYP142A1 210
Table 3.4: Thermodynamic parameters of CYP142A1-fragment interactions derived from ITC and optical titrations
216
Table 3.5: Redox titration data for CYP142A1 223
Chapter 4
Table 4.1: Binding affinity of CYP124A1 with lipid substrates 253
Table 4.2: Binding affinities for CYP124A1 with azole drug inhibitors 261
Table 4.3: Binding affinity for CYP142A1 fragment hits with Mtb 267

19
cholesterol oxidase P450s
Table 4.4: Binding affinity of CYP124A1 for fragment hits 270
Table 4.5: Binding spectral characteristics of Mtb cholesterol oxidases with CYP121A1 elaborated ligands
273
Table 4.6: Steady-state kinetic parameters for substrate-dependent NADPH oxidation by CYP124A1
285
Table 4.7: DSC data for thermal unfolding of CYP124A1 293
Table 4.8: Redox titration data for CYP124A1 299
Chapter 5
Table 5.1: X-ray data collection and refinement statistics for CYP142A1- and CYP124A1- cholestenone complexes
319
Table 5.2: X-ray data collection and refinement statistics for CYP142A1- econazole/fragment complexes
320
Table 5.3: Dissociation constants for the binding of selected azole drugs to Mtb CYP51B1, CYP121A1, CYP124A1, CYP125A1 and CYP142A1
341
20
Abbreviations
°C Degrees Celsius
µ Micro (10-6)
A Absorbance
Å Angstrom (10-10 m)
AIDS Acquired immunodeficiency syndrome
bp Base pair
CO Carbon monoxide
CYP or P450 Cytochrome P450
cYY Cyclo-L-Tyrosine-L-Tyrosine
δ-ALA Delta-aminolevulinic acid
DMSO Dimethyl sulfoxide
DNA Deoxyribonucleic acid
DOTS Direct Observed Therapy Scheme
DSC Differential Scanning Calorimetry
DTT Dithiothreitol
EDTA Ethylenediaminetetraacetic acid
EPR Electron Paramagnetic Resonance
FAD Flavin Adenine Dinucleotide
FDR Ferredoxin reductase
FDX Ferredoxin
FldR/FIdA E. coli flavodoxin reductase/flavodoxin
Fe-S Iron Sulphur
FMN Flavin mononucleotide
g Gram
GdmCl Guanidinium Chloride
HS High-spin
igr Mtb Intracellular growth region
21
INH Isoniazid
ITC Isothermal Titration Calorimetry
IPTG Isopropyl-β-D-1-thiogalactopyranoside
KCl Potassium chloride
Kd Dissociation constant
kDa KiloDalton
kg Kilogram
KPi Potassium phosphate
L Litre
LB Luria-Bertani (Lysogenic Broth) growth medium
LS Low-spin
m Milli (10-3)
M Molar
mce Mammalian cell entry
MALLS Multi Angle Laser Light Scattering
mg Milligram
MDR-TB Multi-drug resistant tuberculosis
MIC Minimum inhibitory concentration
Mtb Mycobacterium tuberculosis
n Nano (10-9)
NAD(H) Nicotinamide adenine dinucleotide (reduced form)
NADP(H) Nicotinamide Adenine Dinucleotide Phosphate (reduced form)
nanoESI-MS Nano-ElectroSpray Ionization-Mass Spectrometry
NHE Normal hydrogen electrode
NMR Nuclear magnetic resonance
nm Nanometre
NO Nitric oxide
OD600 Optical density at 600 nm
22
O/N Overnight
PCR Polymerase Chain Reaction
PEG Polyethylene glycol
P450 Cytochrome P450
P450 BM3 CYP102A1 from Bacillus megaterium
P450cam CYP101A1 from Pseudomonas putida
PCW Periplasmic cell wall
PDIM Phenolphthiocerol-dimycocerosate
Pdr Putidaredoxin reductase
Pdx Putidaredoxin
PIM Phenylimidazole
PMSF Phenylmethanesulfonyl fluoride
PZA Pyrazinamide
RD Region of deletion
RIF Rifampicin
rpm Revolutions per minute
SDS Sodium dodecyl sulphate
SEC Size exclusion chromatography
SOC Super optimal broth with catabolite repression
sp Spinach
TB Tuberculosis
TB Terrific Broth medium
TDM Trehalose-dimycolate
Tm melting temperature
Tet Tetracycline
µg Microgram
µl Microlitre
μM Micromolar

23
UV-Vis UltraViolet-Visible
v/v volume per volume
w/v weight per volume
WHO World Health Organization
XDR-TB Extensively or extremely drug-resistant Mtb
X-rays Electromagnetic radiation with a wavelength in the range of 0.01 to 10 nm
YT Yeast Tryptone medium
ɛ Extinction coefficient

24
Abstract
A thesis submitted to the University of Manchester in 2015, for the degree of Ph.D by Cecilia Nwadiuto Amadi, entitled:
Biochemical and drug targeting studies of Mycobacterium tuberculosis cholesterol oxidase P450 enzymes.
Mycobacterium tuberculosis (Mtb), a deadly pathogen, has scourged mankind for many centuries and has remained a major threat to global world health. Tuberculosis, the disease caused by this bacterium, is a major cause of death in developing nations and there is potential for its re-emergence in developed countries. An alarming rise in cases of multidrug-resistant and extremely-drug resistant tuberculosis (MDR-TB and XDR-TB) that do not respond to the customary first-line antibiotics necessitates the urgent need for development of new anti-TB drugs. Mtb becomes engulfed in human macrophages post infection of the host, but persists in the harsh environment of the human lungs by utilization of host cholesterol as a carbon source. The P450s CYP125A1, CYP142A1 and CYP124A1 are responsible for catalysing the side-chain degradation of cholesterol, which is critical for cholesterol to be used in the Mtb β-oxidation pathway for energy production. This PhD thesis focuses on understanding the structure/mechanism of the Mtb cholesterol 27-oxidases with the aim of facilitating the development of novel inhibitors of these P450s, which are crucial for Mtb to infect the host and to sustain infection. CYP142A1 and CYP124A1 were purified through three chromatographic steps with contaminating proteins successfully removed to give highly pure forms of these enzymes following the final purification step. Spectrophotometric titrations indicate that CYP142A1 and CYP124A1 bind tightly to cholesterol and cholestenone (and also to branched-chain methyl lipids for CYP124A1), highlighting their physiological roles in sterol and fatty acid metabolism, respectively. Binding analyses with a range of azole antibiotics revealed tight binding to bifonazole, clotrimazole, miconazole and econazole, and weak binding to fluconazole. Studies with compounds from a fragment screening library revealed weak binding to fragment hits for the cholesterol oxidases, but much tighter binding to these enzymes was found for ‘elaborated’ hits from a previous fragment screen on the Mtb cyclodipeptide oxidase CYP121A1, indicative of improved ligand potency achieved via ‘fragment merging’ strategies, and of structural similarities between these diverse Mtb P450s. Light scattering data indicate that CYP142A1 exists in dimeric form in solution, but becomes monomeric when treated with DTT; while CYP124A1 is completely monomeric. Crystal structures of CYP142A1 and CYP124A1 in complex with cholestenone, econazole and fragment library hits were determined. CYP142A1 crystal structures with econazole and fragment hits revealed heme coordination via the heterocyclic nitrogen in an azole group, and provide important data towards design of superior inhibitor drugs. The binding of cholestenone within the active site channels of CYP124A1 and CYP142A1 revealed an alignment favourable for C27 hydroxylation of the cholestenone side chain, which supports the physiological roles of CYP142A1 and CYP124A1 (as well as CYP125A1) in host cholesterol catabolism.

25
Declaration
The author declares that no part of the work presented in this thesis has been
submitted in support of an application for another degree or qualification in this or
any other university or other institute of learning.
Copyright Statement
i. The author of this thesis (including any appendices and/or schedules to this
thesis) owns certain copyright or related rights in it (the “Copyright”) and she has
given The University of Manchester certain rights to use such Copyright for any
administrative purposes.
ii. Copies of this thesis, either in full or in extracts and whether in hard or electronic
copy, may be made only in accordance with the Copyright, Designs and Patents Act
1988 (as amended) and regulations issued under it or, where appropriate, in
accordance with licensing agreements which the University has from time to time.
This page must form part of any such copies made.
iii. The ownership of certain Copyright, patents, designs, trademarks and other
intellectual property (the “Intellectual Property”) and any reproductions of
copyright works in the thesis, for example graphs and tables (“Reproductions”),
which may be described in this thesis, may not be owned by the author and may be
owned by third parties. Such Intellectual Property and Reproductions cannot and
must not be made available for use without the prior written permission of the
owner(s) of the relevant Intellectual Property and/or Reproductions.

26
iv. Further information on the conditions under which disclosure, publication and
commercialisation of this thesis, the Copyright and any Intellectual Property and/or
Reproductions described in it may take place is available in the University IP Policy
(see http://documents.manchester.ac.uk/DocuInfo.aspx?DocID=487), in any
relevant Thesis restriction declarations deposited in the University Library, The
University Library’s regulations (see
http://www.manchester.ac.uk/library/aboutus/regulations) and in The University’s
policy on Presentation of Theses.

27
Dedication
This thesis is dedicated to God the father, God the son, God the Holy Spirit. Thank
you Lord for what you have made out of me, this project would not have been
possible without you. It is all about you, Jesus.

28
Acknowledgements I would like to say a big thank you to my supervisor, Professor Andrew Munro for
the opportunity to undertake a PhD in his lab, for his help, support and guidance
throughout the course of my PhD program. Thank you for taking time to teach me
at every step of this work. Special thanks to Dr Kirsty McLean for all that you taught
me in the Laboratory. I would also like to thank Professor David Leys and Dr Colin
Levy for their kind support and guidance through my structural biology work. Dr
Karl Fisher, thank you so much for all the advice and encouragement, they helped
me a lot. Many thanks, Dr Alistair Fielding, for your kind support at the Photon
Science Institute. Furthermore, i appreciate Dr Hazel Girvan, Dr James Belcher, Dr
John Hughes, Dr Binuraj Menon, Marina Golovanova, Michiyo Sakuma and all senior
members of the Munro group for their guidance and help throughout my research
work. To all other members of the Munro group and the entire molecular
enzymology group, I appreciate you all.
My mentor, Professor O.E Orisakwe of the University of Port Harcourt, Nigeria, is
greatly acknowledged ‒ his advice and encouragement stimulated me thus far.
I wish to give a special appreciation to the Nigerian Government and Faculty for the
Future Fellowship from the Schlumberger Foundation for supporting my PhD
studies.
To my family and friends, thanks for your love, support and encouragement. VPA
Manchester church/choir- thanks for being a family away from home. God bless you
all.
29
Chapter 1
Introduction
1.1 Tuberculosis: An Update
1.1.1 An ‘Ancient and Modern’ disease
Tuberculosis (TB) is a disease caused by an intracellular, pathogenic bacterium
known as Mycobacterium tuberculosis (Mtb) and mainly affects the lungs
(pulmonary TB) but can affect other parts of the human body as well (extra-
pulmonary TB) (Russell, 2007). Tuberculosis is an important world health challenge
and has moved up the ladder to become the second leading cause of death globally,
from an infectious, communicable disease, after the human immunodeficiency virus
(HIV). This disease, which has been documented to kill one person every 20
seconds, is predominant in the developing world and has been termed a ‘disease of
poverty’ (Dartois, 2014).
Tuberculosis (TB) remained a mystery disease until the mid-19th century (Chan et
al., 2013). It has scourged mankind for ages and is postulated to have existed more
than 150 million years ago (Daniel, 2006). However, the mystery behind the
tuberculosis disease was unravelled in 1882 when Robert Koch reported the
isolation and cultivation of the causative agent for tuberculosis disease, the
bacterium Mycobacterium tuberculosis (Ho, 2004). Archaeological evidence of early
tuberculosis was found in Egypt and America (Daniel, 2000, Arriaza et al., 1995, Salo
30
et al., 1994). Tuberculosis, also referred to as the ‘white plague’ in early days, was
named by John Bunyan in the 17th century as the ‘captain of all these men of death’
when the disease claimed millions of lives in Europe (Ducati et al., 2006). Other
names include: Consumption, phthisis (meaning ‘wasting away’), scrofula (swollen
glands of the neck), Pott's disease (TB of the bone), and lupus vulgaris (TB of the
skin); but the popular name ‘Tuberculosis’ or ‘TB’ comes from the words 'tubercle
bacillus' a term introduced by Johann L Schönlein to accommodate all the multiple
localizations of this disease. The term ‘tubercle’ refers to a warty outgrowth found
on bones and skin or in the case of TB in the lungs (Das, 2000, Riva, 2014).
Tuberculosis was the major cause of death in Europe and the United States in times
past, although because of the complex forms of symptomatic manifestations, the
disease was often confused with other diseases (Bloom and Murray, 1992). TB
infection resulted in high mortality rates in the past, which were attributed to
absence of drug remedies to tackle the disease. However, the discovery of antibiotic
drugs in the 20th century led to reduction in mortality rates from the disease (Ducati
et al., 2006, Kremer and Besra, 2002).
Even at the start of the 21st century, tuberculosis (TB) resulted in the death of more
than two million people every year, with the highest occurrences of morbidity and
mortality in Sub-Saharan Africa and South East Asia (Kaufmann and McMichael,
2005, Ulrichs and Kaufmann, 2006). To date, TB remains a great threat to global
human health (Johnston et al., 2010). Over two billion people (a third of the world
population) are infected with the latent form of the bacterium and, out of this
population, about 10% will develop active tuberculosis disease in their lifetime.
31
Presently, over two million lives are lost annually due to active tuberculosis
infection (WHO, 2014a, Johnston et al., 2010).
1.1.2 The Tuberculosis Burden
Tuberculosis continues to be one of the deadliest diseases documented in history.
The TB burden can be estimated in terms of incidence (the number of new and
relapse cases of the disease arising in a given time period, usually one year),
prevalence (the number of cases of the disease at a given point in time) and
mortality (the number of deaths caused by TB in a given period of time, usually one
year).
In 2013, the World Health Organization (WHO) documented that about 9 million
people developed the disease and about 1.5 million died from the infection. From
these numbers of deaths, 360 000 patients were HIV positive. The six countries with
the largest number of incident cases in 2013 were India (2.0–2.3 million), China
(0.9–1.1 million), Nigeria (340 000−880 000), Pakistan (370 000−650 000), Indonesia
(410 000−520 000) and South Africa (410 000−520 000) (WHO, 2014a).
The number of TB cases co-infected with HIV was observed to be highest in African
countries. In total, 34% of TB cases were estimated to be co-infected with HIV in
this region, which can be added to the 78% of TB cases among people living with
HIV world-wide. Hence, the African region accounts for about four out of every five
HIV-positive TB cases and TB deaths among patients who were HIV-positive (WHO,
2014a).
32
Figure 1.1: World map showing tuberculosis high-burden countries (green shades). Source: Global Tuberculosis report 2014 (WHO, 2014a).
1.1.3 Signs and Symptoms of Tuberculosis
TB is usually a chronic, slowly progressing disease that often remains undiagnosed
in patients for many years. The disease presents with many symptoms and can
affect many organs, but the most common form in adults is a chronic pulmonary
disease (Young et al., 2008). Typical signs of tuberculosis are chronic or persistent
cough and sputum production (If the disease is at an advanced stage the sputum
will contain blood), fatigue, lack of appetite, weight loss, fever and night sweats.
Infection of other organs causes a wide range of symptoms. Tuberculosis can mimic
many forms of disease and must always be considered if no firm diagnosis has been
made. Although tuberculosis predominantly affects the lungs, it can cause disease
in any organ and must be included within the differential diagnosis of a vast range
of clinical presentations (Lawn and Zumla, 2011). A high index of suspicion for
33
tuberculosis must especially be maintained when caring for patients living with HIV
infection, since risk of tuberculosis is high and diagnosis is problematic (Lawn and
Zumla, 2011).
1.1.4 Transmission of Tuberculosis: Latent TB Versus Active TB
Tuberculosis (TB) is categorised as either ‘Latent TB’ or ‘Active TB’. In Latent TB, the
bacterium is dormant and non-replicating while engulfed in the human
macrophage. The patient is asymptomatic and cannot infect another human. In
Active TB, there is active replication of the bacteria. The patient presents with overt
manifestation of clinical symptoms and the disease at this stage is highly
communicable (Corbett et al., 2003, Kaur et al., 2014). Latent TB with absence of
clinical manifestation comprises about 90% of all cases of tuberculosis infection
(Kondratieva et al., 2014). About 10% of latent infection eventually reactivates to
active TB and becomes contagious. Mechanisms of transition to latency and TB
reactivation are not well understood (Kondratieva et al., 2014).
When Mycobacterium tuberculosis infects the host and reaches its target organs
(the lungs), the bacterium is engulfed by immunological cells (neutrophils and
macrophages) and faces the first line defence mechanism of the host, which
involves the natural and adaptive immune responses. These protective factors
could eradicate the pathogen, but in most cases the bacterium transits to dormancy
or latency, which involves the mobilization of host immune cell populations into
the lung governed by chemokines and cytokines (Kondratieva et al., 2014). This

34
entire process ensures mycobacterial containment at least in the initial stages of
infection (Kondratieva et al., 2014, Monin and Khader, 2014). Latency in
tuberculosis infection is generally accompanied by formation of well-structured
granuloma in the lungs (consisting mainly of leukocytes) which is highly isolated
from the surrounding tissues (Ulrichs and Kaufmann, 2006). Disruption of the
granuloma structure and a rising number of mycobacterial cells result in cavity
formation and active TB disease (Ulrichs and Kaufmann, 2006, Kondratieva et al.,
2014). Research has revealed lung granuloma formation as the hallmark of
pulmonary tuberculosis (Ulrichs and Kaufmann, 2006). Its shape and structure is
characterized by a central necrotic centre enclosed by circular layers of
macrophages, epithelioid cells, multinucleated Langhans giant cells and
lymphocytes (Ulrichs and Kaufmann, 2006, Mariano, 1995). Mtb is contained by a
cellular wall and a fibrotic outer layer, and this stops it from spreading throughout
the host (Ulrichs and Kaufmann, 2006). Latent infection results when the bacterium
is successfully contained within the primary lesion and this is observed as calcified
granulomatous lesions. Transition to active tuberculosis is prevented if this lesion is
maintained or controlled, and this occurs in more than 90% of individuals (Ulrichs
and Kaufmann, 2002, Zhang, 2004).
TB is transmitted through the air when people who have an active Mtb infection
cough, sneeze, or otherwise transmit their saliva through the air (Konstantinos,
2010). Large studies of TB contacts have shown that airborne transmission of Mtb is
promoted by prolonged and close contact with an infectious case, and the key

35
determinant is the amount of time spent sharing room air with a patient who has an
active infection (Richeldi et al., 2004).
Tuberculosis (TB) infection can be established with or without a visible primary
lesion. Such a lesion can be anywhere in the lungs but tends to be sited towards the
base and close to the pleura (Rook et al., 2005). Following exposure to the
bacterium, most humans and animals develop a TH1 cell response and the ability of
peripheral-blood T cells to release interferon gamma in response to secreted
antigens of Mtb is used as a test for exposure (Pathan et al., 2000, Richeldi et al.,
2004). In approximately 90% of infected individuals, this response causes the Mtb
bacilli to remain in the tissues in a latent state, and disease does not occur (Rook et
al., 2005).
In humans, there is a phase of blood-borne spread of approximately 3 weeks after
the bacterium infects initially. The vaccine (Mycobacterium bovis bacillus Calmette–
Guérin (BCG)) might block infection at this stage. A T helper 1 (TH1) cell response
develops rapidly. The infection remains latent in 90-95% of individuals for several
years, but can be reactivated when an individual is immunosuppressed, particularly
through infection with HIV (Rook et al., 2005, Kaur et al., 2014) (Figure 1.2). In
addition, the elderly, malnourished and individuals involved in substance abuse are
at high risk of developing TB (McLean and Munro, 2008). Studies have revealed a
high prevalence of TB and MDR strains in the third world, and co-infection with HIV
is a major problem in sub-Saharan Africa (McLean and Munro, 2008, WHO, 2014a).
36
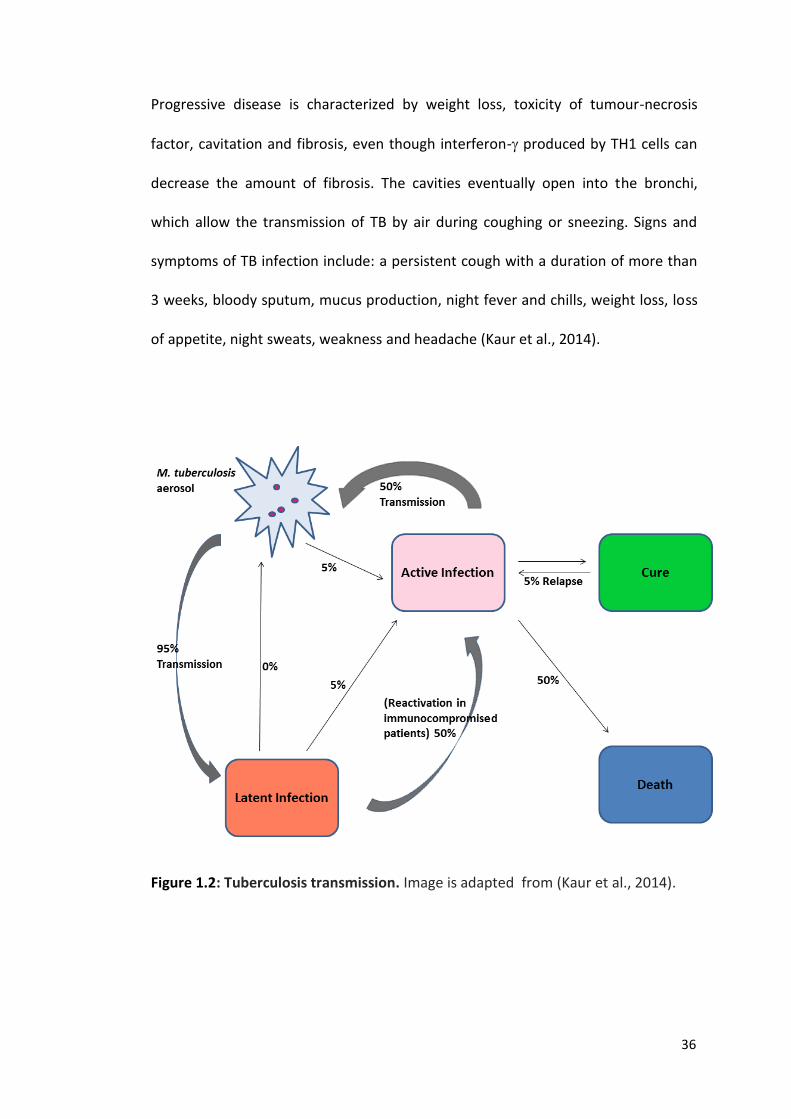
Progressive disease is characterized by weight loss, toxicity of tumour-necrosis
factor, cavitation and fibrosis, even though interferon- produced by TH1 cells can
decrease the amount of fibrosis. The cavities eventually open into the bronchi,
which allow the transmission of TB by air during coughing or sneezing. Signs and
symptoms of TB infection include: a persistent cough with a duration of more than
3 weeks, bloody sputum, mucus production, night fever and chills, weight loss, loss
of appetite, night sweats, weakness and headache (Kaur et al., 2014).
Figure 1.2: Tuberculosis transmission. Image is adapted from (Kaur et al., 2014).

37
1.2 Mycobacterium tuberculosis: A Description of a Debilitating Human Pathogen
Mtb is a rod-shaped, non-motile, acid fast bacillus that causes tuberculosis infection
in humans. It has been documented that one-third of the world’s population is
already latently infected with Mtb, representing a large potential reservoir for
future reactivation of tuberculosis infection, especially in the dispensation of the
human immunodeficiency virus (HIV) pandemic (Dutta and Karakousis, 2014).
Figure 1.3: An electron micrograph of Mycobacterium tuberculosis. The image shows rod-shaped non motile bacteria. [Taken from http://medimoon.com/2012/07/a-new-weapon-could-show-promising-results-against-resistant-tb/ (Hayat, 2012)].
The architectural structure of the Mtb cell wall is quite distinct from the cell wall
structures of both Gram-negative and Gram-positive bacteria. This complex
structure of the Mtb cell wall accounts for its unusually low permeability to
common antibiotics, and for its pathogenicity and resistance to attack by the host

38
(Brennan, 2003, Alderwick et al., 2007). The Mtb cell wall is composed of two major
segments - the upper and lower segments. Outside the cytoplasmic membrane is
peptidoglycan (PG), which is covalently attached to arabinogalactan (AG) (Brennan,
2003). This covalent attachment consists of a cross-linked network of peptidoglycan
(PG) in which some of the muramic acid residues are substituted with the complex
polysaccharide AG. The arabinogalactan, in turn, is attached to the mycolic acids via
long meromycolate and short α-chains (Brennan, 2003, Alderwick et al., 2007). This
entire complex is termed the ‘cell wall core’ or the mycolylarabinogalactan–
peptidoglycan (mAGP) complex, and is essential for Mtb viability (Alderwick et al.,
2007, Dover et al., 2004). Mycolic acids are the major components of the cell wall
protective barrier and play a major role in the survival, virulence and antibiotic
resistance of Mtb (Barry et al., 1998). Drugs that inhibit mycolic acid biosynthesis,
such as isoniazid, ethambutol and pyrazinamide, are still being used as frontline
anti-TB drugs (Ouellet et al., 2010b, Zhang et al., 2005).
The upper segment consists mainly of complex lipids which are esterified with
multiple methyl-branched long-chain fatty acids, surface and trans-membrane
proteins (Brennan, 2003). These complex lipids include the phenolphthiocerol and
phthiocerol dimycocerosates (PDIMs), sulfatides (SLs), diacyltrehaloses (DATs),
triacyltrehaloses (TATs) and polyacyltrehaloses (PATs) which make up the trehalose
ester families (Ouellet et al., 2010b, Jackson et al., 2007). Unique substances
interspersing the cell wall core and associated with the mycolic acids are the
phosphatidylinositol-containing glycolipids, mainly the lipomannans and the
lipoarabinomannans (Hunter and Brennan, 1990).

39
Collectively, these structures provide a thick and robust layer of lipid on the outer
part of the cell that protects the bacterium against antibiotics, toxic substances and
the host’s immune system (Takayama et al., 2005, Ouellet et al., 2010b).
Figure 1.4: The Mycobacterium tuberculosis cell wall. The image was drawn using Microsoft PowerPoint and adapted from Ouellet et al (Ouellet et al., 2010b).
40
1.3 Tuberculosis Treatment: Past, Present and Future
1.3.1 The Past: Genesis of Anti-Tubercular Drug Discovery
The journey to tuberculosis drug discovery over the years has been a frustrating
one. Before the advent of the first anti-TB drug, tuberculosis was generally
considered ‘hopeless’ and ‘incurable’. Management was based mainly on non-
pharmacological approaches such as the use of herbal dressings, dietary
intervention, climatic remedies such as aero-therapy and heliotherapy as well as
physical measures e.g. bleeding and purging (Riva, 2014, Iseman, 2002). In addition,
tuberculosis was also claimed to have been treated with the legendary ‘royal touch’
(Dossey, 2013). There was a belief that English and French monarchs were endowed
with powers to heal TB-infected individuals by touching them in a ceremonious
ritual, where the quote ‘the King touches you, God cures you’ (‘Le Roy te touché et
Dieu te guérit’ in French) was used to validate the legitimacy of the royals and the
divine source of their healing powers (Riva, 2014). However, these measures gave
little or no solution to the cure of tuberculosis, as the disease continued to claim
many lives. The story of the search for the cure for tuberculosis is well summarised
in an educative documentary novel titled “The Greatest Story Never Told”
(Margulis, 2002).
Furthermore, in the 1930s, a major breakthrough came with the discovery of
sulphonamides and penicillin for tuberculosis treatment (Iseman, 2002).
Sulphonamide was discovered by Gerhard Domagk, assisted by chemists from Bayer
in Germany (Diacon et al., 2012b). In 1944, streptomycin was discovered by Selman
41
Waksman in New Jersey and, in the same year, Jorgen Lehman synthesised para-
aminosalicylic acid (PAS) in Sweden (Iseman, 2002). Having proven streptomycin
and PAS to be effective against tuberculosis, the British Medical Research Council
(MRC), through a randomized clinical trial, found that a combination of the two
drugs had synergistic properties (MRC, 1948, Iseman, 2002). Subsequently, the next
important step forward was the discovery of the anti-tubercular activity of isoniazid
in 1951 (Riva, 2014). This chemical compound (isonicotinyl hydrazine) was studied
and demonstrated independently in three different laboratories (Squibb, Hoffmann
La Roche and Bayer) to have a high level of anti-tuberculosis activity in experimental
animals (Riva, 2014). The compound was first synthesized by two Prague chemists:
Hans Meyer and Josef Mally in 1912, and has proved to be the most potent anti-TB
drug discovered in history, as confirmed from various clinical trials (McDermott,
1969). Further studies revealed that the addition of isoniazid to PAS and
streptomycin (‘triple therapy’) reduced drug resistance and improved the
effectiveness of tuberculosis treatment (Riva, 2014).
Challenging experiences gave physicians insights that TB treatments must be
administered using multiple drugs to prevent emergence of resistance, and that
adherence to prolonged treatments for 24 months or more may be required for a
permanent cure of TB disease (Diacon et al., 2012b). Following the success of the
‘triple therapy’, the next hurdle to cross was the reduction of duration of therapy. In
1961, this was made possible by the replacement of PAS by a more effective drug,
ethambutol, discovered by Lederle laboratories in the United States. The duration
of therapy was then reduced from 24 to 18 months (Doster et al., 1973, Riva, 2014).
42
1.3.2 The Present: Anti-Tubercular Drugs in Current Use
Research into identification of new anti-tuberculosis agents progressed with the
discovery of new compounds, mostly used as second-line drugs. These include:
viomycin, cycloserine, terizidone, kanamycin and amikacin, capreomycin and the
thioamides ethionamide and prothionamide (Diacon et al., 2012b). In the same era,
another ‘wonder’ TB compound (rifampicin) was discovered. Rifampicin was derived
from a chemical modification of ‘rifamycin’, which is a family of compounds
identified from the soil bacterium Streptomyces mediterranei (Riva, 2014).
Between 1970 and 1980, the introduction of rifampicin in tuberculosis therapy
enabled the reduction of therapy duration from 18 to 9 months (Riva, 2014). In the
same period, pyrazinamide was discovered and introduced for TB treatment,
leading to a further reduction of treatment duration to six months when combined
with isoniazid and rifampicin (Diacon et al., 2012b). This was then termed the
‘short-course chemotherapy’ (van Ingen et al., 2011). A 6-month directly observed
treatment short-course (DOTS) based on the three compounds isoniazid, rifampicin
and pyrazinamide was the foundation of tuberculosis treatment strategies world-
wide for about 30 years, and recently this was augmented with ethambutol in view
of increasing rates of isoniazid resistance (Diacon et al., 2012b).
43
Class 1 First-line anti-tubercular drugs Isoniazid Rifampin or Rifampicin
Ethambutol Pyrazinamide
Rifabutin
Class 2 Second-line agents (oral bacteriostatic drugs)
Thioamides Ethionamide Protionamide Cycloserine Terizidone
para-Aminosalicylic acid
Class 3 Second-line agents (injectables/parenterals)
Kanamycin Amikacin
Capreomycin Viomycin
Streptomycin*
Class 4 Second-line bactericidal agents (Fluoroquinolones)
Levofloxacin Moxifloxacin
Ofloxacin Gatifloxacin
Class 5 Third-line agents (Drugs with sparse clinical data)
Clofazimine Linezolid
Amoxicillin/clavulanate Thioacetazone Clarithromycin
Imipenem
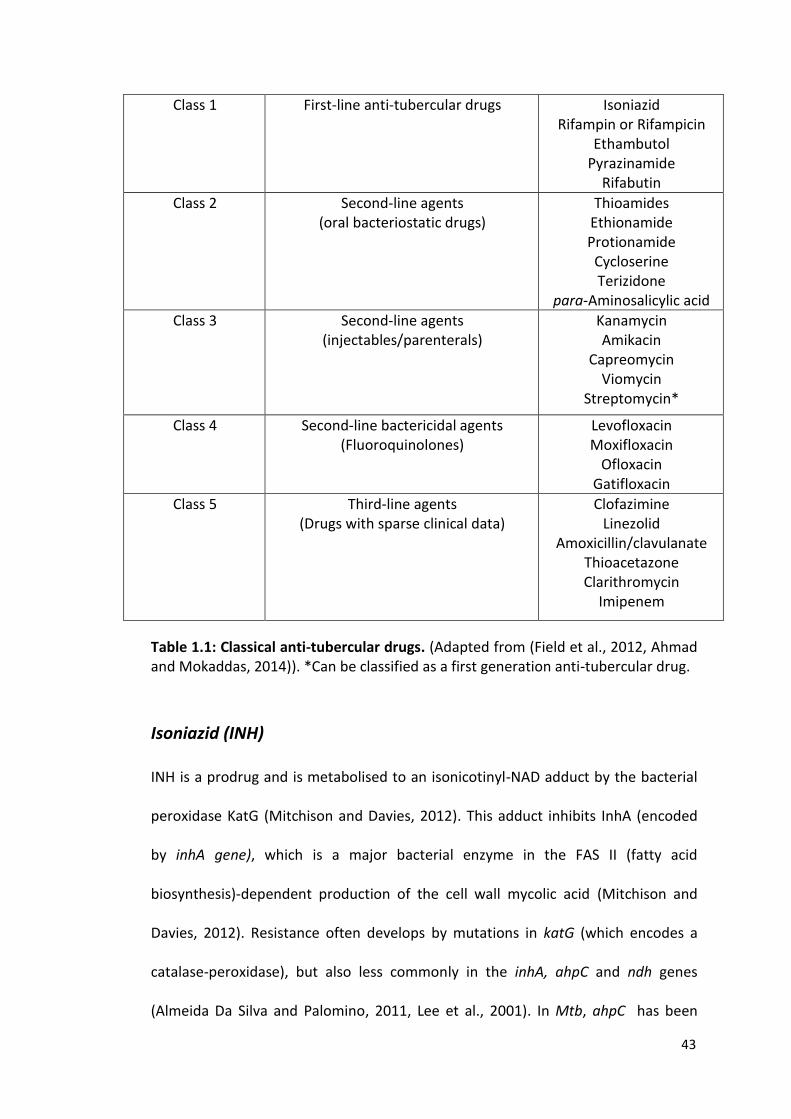
Table 1.1: Classical anti-tubercular drugs. (Adapted from (Field et al., 2012, Ahmad and Mokaddas, 2014)). *Can be classified as a first generation anti-tubercular drug.
Isoniazid (INH)
INH is a prodrug and is metabolised to an isonicotinyl-NAD adduct by the bacterial
peroxidase KatG (Mitchison and Davies, 2012). This adduct inhibits InhA (encoded
by inhA gene), which is a major bacterial enzyme in the FAS II (fatty acid
biosynthesis)-dependent production of the cell wall mycolic acid (Mitchison and
Davies, 2012). Resistance often develops by mutations in katG (which encodes a
catalase-peroxidase), but also less commonly in the inhA, ahpC and ndh genes
(Almeida Da Silva and Palomino, 2011, Lee et al., 2001). In Mtb, ahpC has been
44
shown to encode for an enzyme known as alkyl hydroperoxidase reductase and that
is involved in resistance to reactive oxygen and reactive nitrogen intermediates
(Almeida Da Silva and Palomino, 2011). Mutations in the ndh gene, which encodes
an NADH dehydrogenase, was shown to cause defects in the enzyme activity that
generated an increased NADH/NAD+ ratio and co-resistance to isoniazid and
ethionamide (Lee et al., 2001). Isoniazid, though less potent against non-multiplying
cells, nevertheless has shown high bactericidal activity against dividing bacteria,
with a minimal inhibitory concentration (MIC) value of about 0.05 μg/ml (Mitchison
and Davies, 2012). INH causes peripheral neuritis and convulsions, as it
quantitatively depletes vitamin B6 stores in the body when administered at high
dosage (van der Watt et al., 2011, Mitchison and Davies, 2012). In addition,
hepatotoxicity remains a significant concern in patients treated with isoniazid
(Parekh and Schluger, 2013). A lone treatment with isoniazid is given at a dosage of
300 mg daily or 900 mg twice weekly for a period of nine months. However, when
given in combination with rifampicin, the dose changes to 300 mg isoniazid plus 600
mg rifampicin daily for 3 months (Parekh and Schluger, 2013).
Rifampicin
Rifampicin is a potent inhibitor of bacterial DNA-dependent RNA polymerase. It
binds to the rpoB-encoded portion of the bacterial RNA polymerase, hence
inhibiting the formation of new proteins (Mitchison and Davies, 2012, McLean et
al., 2007a, Almeida Da Silva and Palomino, 2011). It is highly bactericidal in its
action against Mtb throughout the course of treatment, with a MIC of 0.5 μg/ml.
However, its therapeutic margin has been shown to be narrow (Mitchison and

45
Davies, 2012). Rifampicin is administered at a dosage of 450-600 mg daily for a
period of 4 months, and side effects include hepatotoxicity, leukopenia and
thrombocytopenia (Mitchison and Davies, 2012, Parekh and Schluger, 2013).
Resistance to rifampicin is mainly due to rpoB mutations of the β subunit of the
RNA polymerase (Field et al., 2012, Uzun et al., 2002). Irrespective of this resistance
due to mutations, about 12-20% of rifampicin-resistant Mtb strains and some MDR
strains remain sensitive to rifabutin (Uzun et al., 2002, Field et al., 2012, Yoshida et
al., 2010, Cavusoglu et al., 2004), which has shown to be a better option for these
MDR-TB categories (Yew and Leung, 2008). Rifabutin is also effective in tuberculosis
patients living with HIV and who are taking protease inhibitors. This is because of its
mild effect on P450 enzyme induction, unlike rifampicin which causes about 40%
enzyme induction (Mitnick et al., 2009, Nuermberger and Mitchison, 2009).
Cytochrome P450 enzymes are responsible for the metabolism of several drugs
(Ramachandran et al., 2013). Rifampicin markedly lowers the blood levels of
protease inhibitors by inducing human cytochrome P450 CYP3A4 activity
significantly. This could result in reduction of antiretroviral activity which could lead
to the development of acquired drug resistance (Vanhove et al., 1996,
Ramachandran et al., 2013).
Pyrazinamide
Pyrazinamide is an essential front-line drug for TB treatment. Pyrazinamide,
alongside isoniazid and rifampicin, forms the bedrock of modern TB chemotherapy
(Zhang et al., 2003). Pyrazinamide, when combined with other anti-TB drugs, helps

46
to shorten the duration of therapy from 9–12 months to 6 months (Zhang et al.,
2003), because it inactivates a population of partially-dormant Mtb in acidic
environments that are not killed by other anti-TB drugs (Zhang et al., 2003).
Pyrazinamide (PZA) is a prodrug that is converted to its active moiety pyrazinoic acid
(POA) by the Mtb amidase encoded by the pncA gene, and resistance to
pyrazinamide develops from the mutation of pncA (Mitchison and Davies, 2012).
The protonated POA (HPOA) formed accumulates under acid conditions within the
bacterium and causes membrane damage (Zhang et al., 2003, McLean et al., 2007a).
Hence, pyrazinamide inactivates Mtb at acid pH (Zhang et al., 2003). This
dependency on pH has accounted for therapeutic failures with pyrazinamide in the
past (Mitchison and Davies, 2012).
Ethambutol
Ethambutol (EMB) is a bacteriostatic agent used for multi-drug-resistant (MDR)
tuberculosis. It also forms part of a cocktail of first-line anti-TB drugs in many
countries. The most common side effect of ethambutol is retro-bulbar optic neuritis
(RON) (Levy et al., 2015). EMB acts on the arabinosyl transferase EmbCAB to inhibit
cell wall synthesis (Almeida Da Silva and Palomino, 2011). Drug resistance to EMB
usually arises through mutations in the embB gene (Mitchison and Davies, 2012).
Fluoroquinolones
Fluoroquinolones have been shown to be highly effective in the treatment of MDR-
TB (Schluger, 2013). They inhibit DNA gyrase (encoded by the gyrA and gyrB genes

47
for the DNA gyrase A and B subunits) and hence block bacterial DNA synthesis (Field
et al., 2012). This stems from the ability of fluoroquinolones to interfere with action
of the A subunit of the bacterial topoisomerase, which is instrumental for
supercoiling DNA (Almeida Da Silva and Palomino, 2011). Resistance to
fluoroquinolones commonly results from mutations in the gyrA gene (Mitchison and
Davies, 2012). Fluoroquinolones with high potency against Mtb include moxifloxacin
(MFX) and gatifloxacin (GTX), which are also chemically related. Levofloxacin has
also been shown to be effective against Mtb, but slightly less active than
moxifloxacin (MFX) and gatifloxacin (Mitchison and Davies, 2012). The
fluoroquinolones as a class of drug are specifically beneficial in the treatment of
MDR-TB, with significant activity against both replicating extracellular and latent
intracellular Mtb (Mitchison and Davies, 2012, Cole and Riccardi, 2011). They are
mycobactericidal and exhibit lower MICs against Mtb than do other first-line drugs
(Donald and Diacon, 2008). The fluoroquinolones have also been suggested to
reduce the treatment duration in drug-susceptible tuberculosis (Rustomjee et al.,
2008, Conde et al., 2009, Dorman et al., 2009, Kwon et al., 2014).
Injectables (Parenterals)
This group of drugs includes streptomycin, the aminoglycosides (kanamycin,
amikacin) and cyclic peptide antibiotics (capreomycin, viomycin). They show high
potency against MDR-TB disease, second to the fluoroquinolones (Mitchison and
Davies, 2012). These drugs inhibit bacterial protein translation by binding to the 16S
rRNA in the ribosomes (Almeida Da Silva and Palomino, 2011, Mitchison and Davies,
2012, Reeves et al., 2015). Since these four drugs bind to a similar location on the
48
ribosome and share the same drug target, cross-resistance is commonly observed
(Reeves et al., 2015, Campbell et al., 2011, Georghiou et al., 2012). Cross-resistance
is linked with mutations on the 16S rRNA (rrs) sequence, and mainly with the
A1401G, C1402T and G1484T mutations (Maus et al., 2005, Jnawali et al., 2013).
The injectables are frequently used as bactericidal second-line drugs (Ahmad and
Mokaddas, 2014).
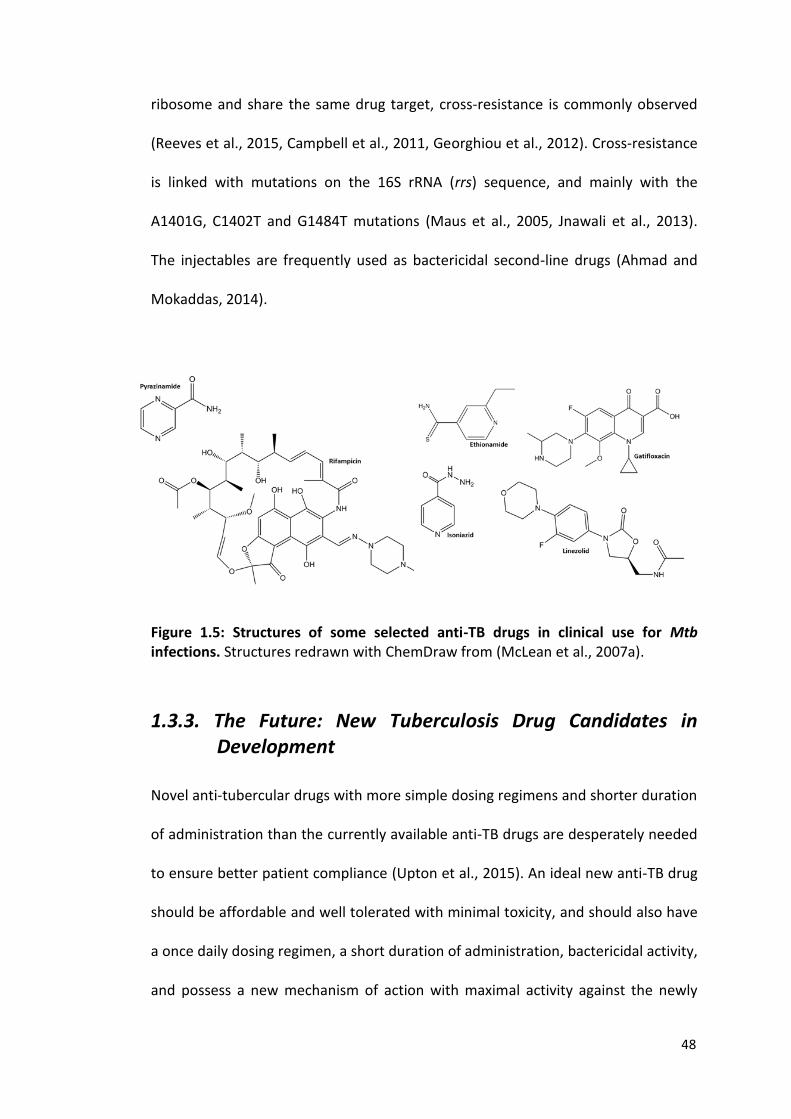
Figure 1.5: Structures of some selected anti-TB drugs in clinical use for Mtb infections. Structures redrawn with ChemDraw from (McLean et al., 2007a).
1.3.3. The Future: New Tuberculosis Drug Candidates in Development
Novel anti-tubercular drugs with more simple dosing regimens and shorter duration
of administration than the currently available anti-TB drugs are desperately needed
to ensure better patient compliance (Upton et al., 2015). An ideal new anti-TB drug
should be affordable and well tolerated with minimal toxicity, and should also have
a once daily dosing regimen, a short duration of administration, bactericidal activity,
and possess a new mechanism of action with maximal activity against the newly
49
emerged multi-drug (MDR-TB) and extensively drug-resistant (XDR-TB) strains of
Mtb (Upton et al., 2015). In addition, new drugs should be orally available and
should not have interactions with existing anti-tuberculous drugs or anti-retrovirals
in cases where there is co-infection with HIV (Leibert et al., 2014).
After decades of drought, more than 50 years after the last TB drug was discovered,
no new anti-TB drugs were approved for development until 2012 (Upton et al.,
2015). However, the recent re-awakening in TB drug development has yielded two
potent drugs in 2012 and 2013 with new mechanisms of action that have been
approved for the treatment of MDR TB. Thus, there has been a recent resurgence of
TB drug discovery (Upton et al., 2015). These new drugs are bedaquiline (Andries et
al., 2005, Palomino and Martin, 2013, Diacon et al., 2012a, Grosset and Ammerman,
2013), a diarylquinoline inhibitor of Mtb ATP synthase; and delamanid, an anti-
tubercular nitroimidazole (Gler et al., 2012).
50
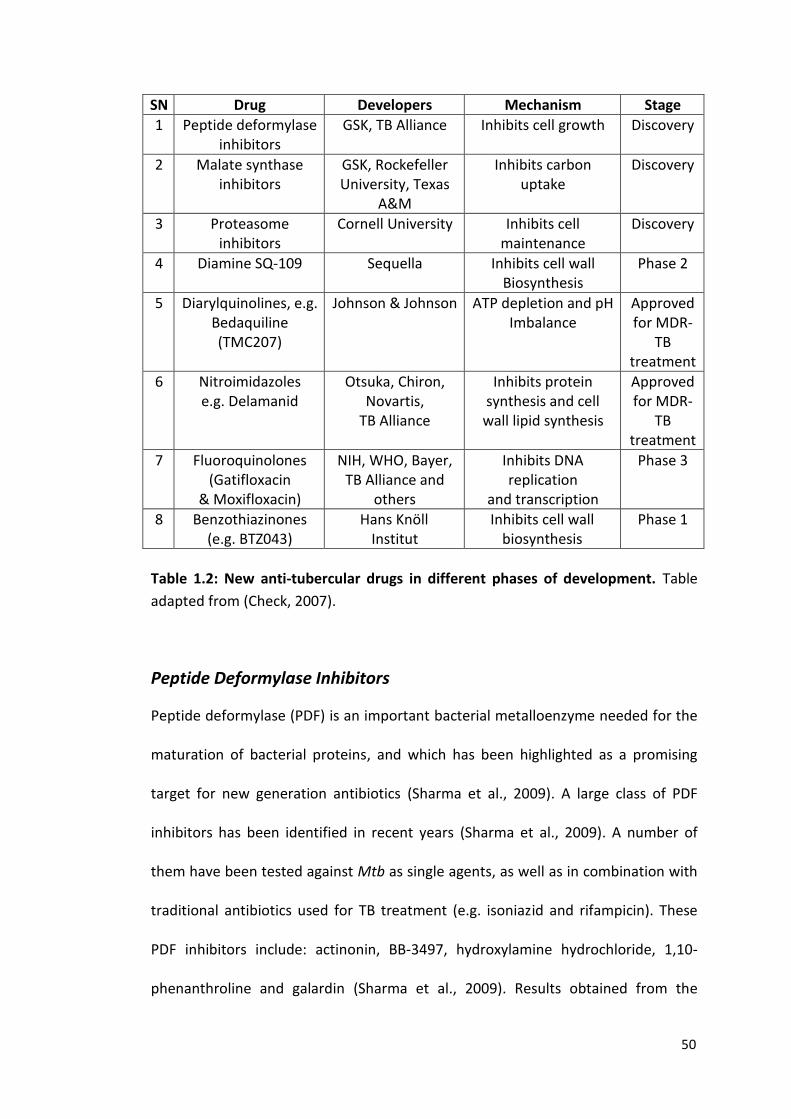
SN Drug Developers Mechanism Stage
1 Peptide deformylase inhibitors
GSK, TB Alliance Inhibits cell growth Discovery
2 Malate synthase inhibitors
GSK, Rockefeller University, Texas
A&M
Inhibits carbon uptake
Discovery
3 Proteasome inhibitors
Cornell University Inhibits cell maintenance
Discovery
4 Diamine SQ-109 Sequella Inhibits cell wall Biosynthesis
Phase 2
5 Diarylquinolines, e.g. Bedaquiline (TMC207)
Johnson & Johnson ATP depletion and pH Imbalance
Approved for MDR-
TB treatment
6 Nitroimidazoles e.g. Delamanid
Otsuka, Chiron, Novartis,
TB Alliance
Inhibits protein synthesis and cell
wall lipid synthesis
Approved for MDR-
TB treatment
7 Fluoroquinolones (Gatifloxacin
& Moxifloxacin)
NIH, WHO, Bayer, TB Alliance and
others
Inhibits DNA replication
and transcription
Phase 3
8 Benzothiazinones (e.g. BTZ043)
Hans Knöll Institut
Inhibits cell wall biosynthesis
Phase 1
Table 1.2: New anti-tubercular drugs in different phases of development. Table
adapted from (Check, 2007).
Peptide Deformylase Inhibitors
Peptide deformylase (PDF) is an important bacterial metalloenzyme needed for the
maturation of bacterial proteins, and which has been highlighted as a promising
target for new generation antibiotics (Sharma et al., 2009). A large class of PDF
inhibitors has been identified in recent years (Sharma et al., 2009). A number of
them have been tested against Mtb as single agents, as well as in combination with
traditional antibiotics used for TB treatment (e.g. isoniazid and rifampicin). These
PDF inhibitors include: actinonin, BB-3497, hydroxylamine hydrochloride, 1,10-
phenanthroline and galardin (Sharma et al., 2009). Results obtained from the

51
relevant study suggested that PDF inhibitors act synergistically with conventional
anti-tubercular drugs (Sharma et al., 2009).
In another study by Pichota and co-workers, the Mtb PDF was validated as a drug
target and the inhibitor LBK-611 and its analogues showed promising results,
indicating that they could serve as a new class of anti-tubercular agents (Pichota et
al., 2008).
Malate Synthase Inhibitors
The glyoxylate shunt is an anaplerotic bypass of the traditional tricarboxylic acid (or
Krebs) cycle which allows the use of carbon from acetyl-coenzyme A (acetyl CoA)
produced by fatty acid metabolism (Bauza et al., 2014). This bypass mechanism is
available in plants, fungi, and prokaryotes, but is lacking in mammals, which
suggests an interesting drug target that can lead to generation of lead compounds
with minimal human toxicity (Myler and Stacy, 2012, Kondrashov et al., 2006, Bauza
et al., 2014). The shunt utilizes two enzymes: isocitrate lyase (ICL), which converts
isocitrate into glyoxylate and succinate; and malate synthase (GlcB), which converts
glyoxylate into malate using one molecule of acetyl CoA (Krieger et al., 2012, Myler
and Stacy, 2012).
The glyoxylate shunt plays a key role in fatty acid metabolism and virulence in Mtb,
which has proved to be important in the survival of pathogenic organisms that are
involved in chronic infections (Krieger et al., 2012, McKinney et al., 2000). Recent
studies by Krieger et al. showed that a Mtb strain with a dysfunctional glyoxylate
52
shunt was unable to establish infection in a mouse model. This led these
researchers to develop a class of compounds, via a structure-guided approach,
known as phenyl-diketo acids (PDKAs) which specifically inhibit malate synthase
(GlcB). The identification of these PDKA derivatives provides an important
validation of GlcB as an attractive drug target in Mtb (McKinney et al., 2000). The
crystal structures of the complexes of GlcB with PDKA inhibitors have been solved
and these guided optimization of the potency of these compounds (Krieger et al.,
2012). The malate synthase inhibitors are still at the discovery stage and work is on-
going to develop these further as TB therapeutics (Bauza et al., 2014).
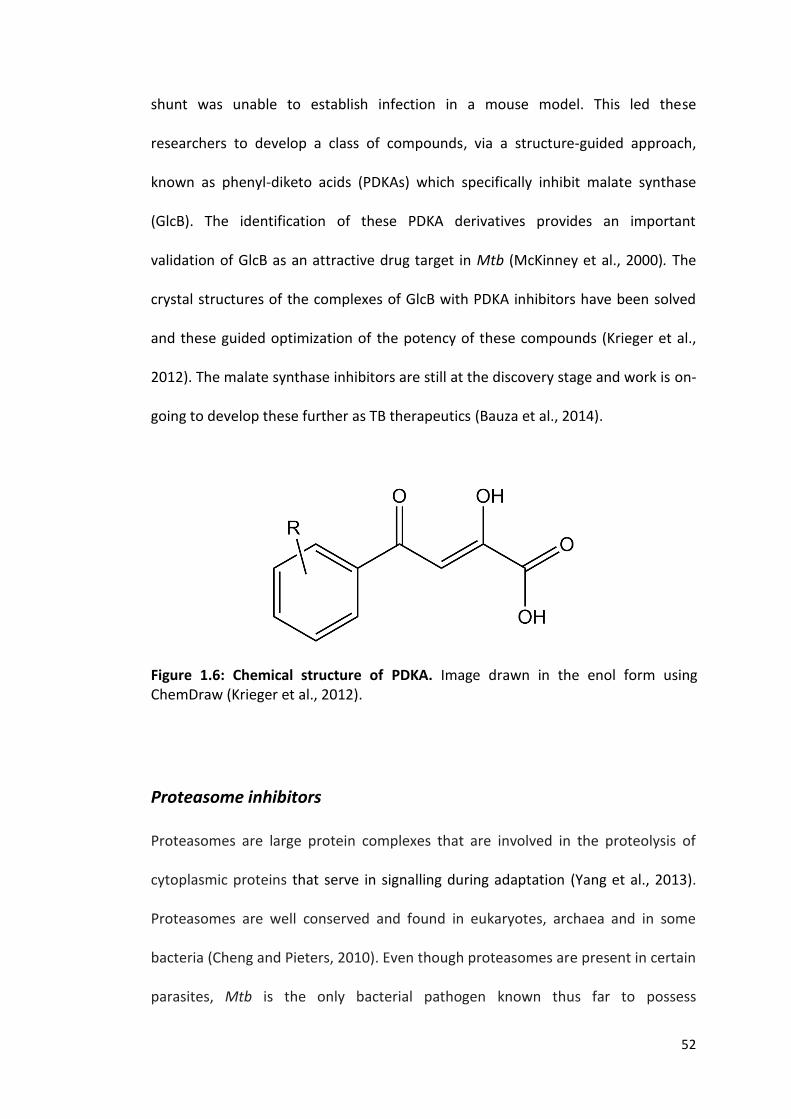
Figure 1.6: Chemical structure of PDKA. Image drawn in the enol form using ChemDraw (Krieger et al., 2012).
Proteasome inhibitors
Proteasomes are large protein complexes that are involved in the proteolysis of
cytoplasmic proteins that serve in signalling during adaptation (Yang et al., 2013).
Proteasomes are well conserved and found in eukaryotes, archaea and in some
bacteria (Cheng and Pieters, 2010). Even though proteasomes are present in certain
parasites, Mtb is the only bacterial pathogen known thus far to possess

53
proteasomes (Cheng and Pieters, 2010). The Mycobacterial proteasome plays
important key roles in the bacterium, such as degradation of certain proteins,
survival of nitro-oxidative stress, and in bacterial persistence (Pearce et al., 2008,
Burns et al., 2009, Gandotra et al., 2007). However, the proteasomes in Mtb have a
similar organization to its eukaryotic variants, which makes them less attractive
drugs targets (Cheng and Pieters, 2010).
The drive to use proteasome inhibitors as anti-TB drugs has been dampened due to
the extensive degree of conservation of the mycobacterial proteasome with the
form present in humans. Hence the development of highly selective proteasome
inhibitors that will evade inherent toxicity has become difficult (Cheng and Pieters,
2010). Nevertheless, two new proteasome inhibitors which could kill non-
replicating Mtb were identified (Yang et al., 2013). These are the 1,3,4-oxathiazol-2-
one compounds HT1171 and GL5 (Figure 1.7). These two compounds have been
shown to be both potent and selective in their activity against the Mtb proteasome,
with low inhibitory effects on the human proteasome (Lin et al., 2009).
Figure 1.7: Chemical structures of HT1171 and GL5. Redrawn with ChemDraw from (Yang et al., 2013, Lin et al., 2009).
54
Nitroimidazoles
The nitroimidazoles are a new class of class of anti-tubercular drugs under
development with rather promising prospects (Upton et al., 2015). A wide range of
nitroimidazole subclasses were shown to be potent against members of the Mtb
complex (Mukherjee and Boshoff, 2011). The nitroimidazoles, for example
metronidazole (Flagyl®), have proven effective in the treatment of bacterial and
protozoal infections in recent years and part of their activity results from the
formation of reactive chemical species following bio-reduction of the drugs within
the target pathogen (Upton et al., 2015).
Delamanid, a nitroimidazo-oxazole (also known as OPC-67683), has reached phase
III trials for the treatment of multidrug-resistant tuberculosis, while PA-824, a
nitroimidazo-oxazine, has also entered phase III trials for drug-sensitive and drug-
resistant tuberculosis (Upton et al., 2015). WHO documents that delamanid can
now be used for treatment of adults with MDR-TB (WHO, 2014b). However,
information on the effects of this new drug remains incomplete, since it has only
recently passed through Phase IIb trial and studies for safety and efficacy, and been
approved for MDR-TB. The WHO strongly hence recommends the acceleration of
Phase III trials in order to generate a more wholesome evidence base to inform
future policy on delamanid (WHO, 2014b). Delamanid, on bio-reduction within Mtb,
blocks the biosynthesis of mycolic acid, which is a major component of the bacterial
cell wall (Matsumoto et al., 2006, Skripconoka et al., 2013). Recent studies have
documented that it is efficacious against Mtb in vitro and in mice, with potency
both as a single drug and as part of drug multi-therapy for MDR-TB in a 2-month

55
research trial that evaluated bacterial CFUs (colony forming units) in serial sputum
samples (Diacon et al., 2011, Gler et al., 2012).
Research has shown the nitroimdazole drug PA-824 to have activity against both
replicating and hypoxic non-replicating Mtb (Somasundaram et al., 2013, Stover et
al., 2000, Singh et al., 2008). It has also been documented that PA-824 shows potent
bactericidal and sterilising activity against active TB infection in mice (Lenaerts et
al., 2005, Tyagi et al., 2005) and guinea pigs (Lenaerts et al., 2005, Dutta et al., 2013,
Garcia-Contreras et al., 2010), and also enormous early bactericidal activity against
tuberculosis disease in humans (Gler et al., 2012). PA-824 is a pro-drug that
becomes activated by nitro-reduction to one or more active compounds (Dutta and
Karakousis, 2014). Apart from inhibiting keto-mycolic acid and protein synthesis,
PA-824 also destroys Mtb through a new mechanism which involves generation of
intracellular nitric oxide (Singh et al., 2008).
TBA-354, a pyridine-containing biaryl compound, was shown to have exceptional
activity against chronic murine tuberculosis and good bioavailability in preliminary
studies carried out in rodents (Upton et al., 2015). Although TBA-354 has a narrow
spectrum of activity, it has bactericidal activity against both replicating and non-
replicating Mtb in vitro, with near-identical potency to that of delamanid and higher
potency than PA-824 (Upton et al., 2015).
56
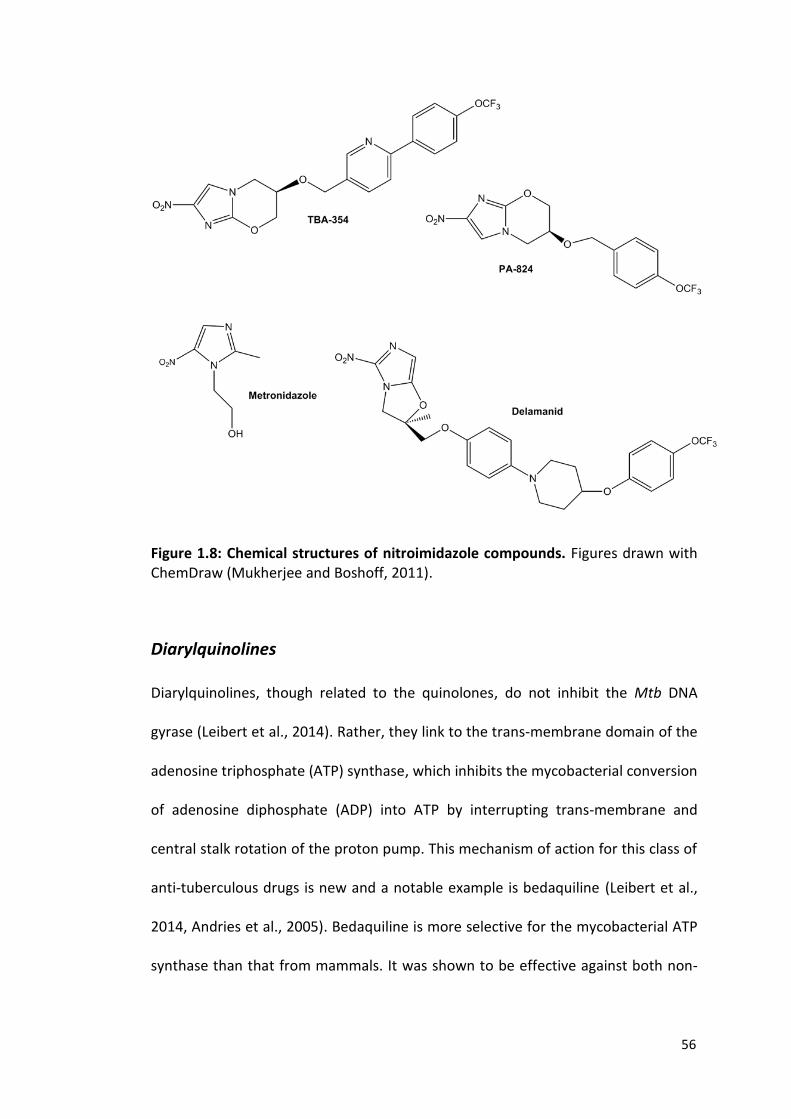
Figure 1.8: Chemical structures of nitroimidazole compounds. Figures drawn with ChemDraw (Mukherjee and Boshoff, 2011).
Diarylquinolines
Diarylquinolines, though related to the quinolones, do not inhibit the Mtb DNA
gyrase (Leibert et al., 2014). Rather, they link to the trans-membrane domain of the
adenosine triphosphate (ATP) synthase, which inhibits the mycobacterial conversion
of adenosine diphosphate (ADP) into ATP by interrupting trans-membrane and
central stalk rotation of the proton pump. This mechanism of action for this class of
anti-tuberculous drugs is new and a notable example is bedaquiline (Leibert et al.,
2014, Andries et al., 2005). Bedaquiline is more selective for the mycobacterial ATP
synthase than that from mammals. It was shown to be effective against both non-

57
resistant and MDR strains of Mtb and other mycobacterial species (Andries et al.,
2005, Haagsma et al., 2009).
Bedaquiline is orally bioavailable with a half-life of 43–64 hours in plasma and 28–
92 hours in tissues (including lung and spleen) (Andries et al., 2005). While
bedaquiline is a promising drug and marks a breakthrough in the quest for novel
anti-tuberculous drugs, its position in TB chemotherapy remains unclear pending a
full Phase III trial and the development of other upcoming new TB drugs (Leibert et
al., 2014). Nevertheless, bedaquiline was granted accelerated approval in December
2012 by the United States Food and Drug Administration (WHO, 2013).
Figure 1.9: Chemical structure of Bedaquiline - a diarylquinoline TB drug. Figure drawn with ChemDraw (WHO, 2013).

58
Diamine SQ109
Diamine SQ109 is a 1,2-ethylenediamine compound and is an analogue of
ethambutol (Kwon et al., 2014). It inhibits protein synthesis by targeting the mycolic
acid transporter MmpL3 in Mtb and was shown to be potent against both drug-
susceptible and drug-resistant Mtb (Sacksteder et al., 2012). It also shows activity
against other mycobacteria (M. bovis and M. bovis BCG) and kills Mtb inside
macrophages with similar efficiency to isoniazid, but with superior activity to
ethambutol (Sacksteder et al., 2012, Jia et al., 2005). Diamine SQ109, which is
currently in phase II clinical trials, acts synergistically when combined together with
bedaquiline (Reddy et al., 2010, Reddy et al., 2012, Sacksteder et al., 2012).
Figure 1.10: Chemical structure of SQ109: Figure drawn using ChemDraw (Onajole et al., 2010).
Benzothiazinones (BTZ043) BTZ043, a nitro-aromatic compound, inhibits the synthesis of decaprenylphospho-
arabinose, which is a precursor of the arabinans in the cell wall of Mtb (Kwon et al.,
2014). It is highly efficacious against drug-susceptible TB, MDR-TB and XDR-TB
(Pasca et al., 2010). It was shown to possess additive effects when combined with

59
rifampin, isoniazid, ethambutol, TMC207, PA-824, moxifloxacin, meropenem (with
or without clavulanate) and SQ109; and synergistic effects with bedaquiline
(Lechartier et al., 2012). Studies showed that BTZ043 displays nanomolar
bactericidal activity both in vitro and in ex vivo models of tuberculosis (Makarov et
al., 2014).
Figure 1.11: Chemical structure of BTZ043: Figure drawn using ChemDraw (Makarov et al., 2014).
1.3.4 Anti-Tubercular Drug Resistance: A Cause for Therapeutic Failures
The increased spread of TB worldwide has been propelled by the emergence of Mtb
strains that have become insensitive to the conventional antibiotics used for TB
treatment (McLean and Munro, 2008, Kaur et al., 2014). Many of these drugs have
been in existence for over 50 years and new therapeutic measures are urgently
needed to replace the older, ineffective drugs (McLean and Munro, 2008). The
slow-replicating nature of Mtb and its ability to persist and remain dormant within
the human macrophage for a long period of time necessitates prolonged therapy
60
duration of anti-TB drugs. This is to ensure complete clearance of the bacterium
from the human body and the restoration of the immune system (McLean and
Munro, 2008).
Presently, the standard therapy regimen lasts between 6–12 months and involves
the administration of four anti-tubercular drugs: namely isoniazid, rifampicin,
pyrazinamide and either streptomycin or ethambutol. However, this long duration
of treatment often leads to non-compliance on the part of the patient, which
contributes to the development of resistant strains of the bacterium (Kaur et al.,
2014, McLean and Munro, 2008). Co-infection with HIV has also been documented
to add to the growing problem of resistance and mutations in the Mtb genome
have worsened the problem of treatment failure in humans and have resulted in
various types of drug resistance (McLean and Munro, 2008). These include multi-
drug resistance (MDR), which signifies Mtb strains resistant to at least two of the
front line drugs (isoniazid and rifampicin), single-drug resistance (SDR), and
extensive drug resistance (XDR). XDR Mtb strains are resistant to isoniazid,
rifampicin, any one of the quinolone antibiotics, and to at least one of the second
line anti-TB drugs kanamycin, capreomycin and amikacin (Kaur et al., 2014).
1.4 The Cytochrome P450 Systems
1.4.1 Structure, Function and Mechanism
The cytochromes P450 (CYPs or P450s) are a large, ubiquitous family of enzymes
found in most organisms. They are found in all biological kingdoms, ranging from

61
archaea, bacteria and fungi through to plants and mammals, with over 14,000 P450
genomic sequences discovered so far (Hrycay and Bandiera, 2012, Cederbaum,
2014). The P450s were first identified in the mammalian liver endoplasmic
reticulum as unusual membranous pigments (Munro et al., 2007b). The highest
levels of P450s in mammals are found in the microsomes of the liver, but they also
are present in microsomes from other organs including kidney, small intestine,
lungs, adrenal cortex, skin, brain, testis, placenta and others (Cederbaum, 2014).
Mitochondria from liver and endocrine tissue also contain P450s. Most P450s
consist of about 400–500 amino acids with a size (molecular mass) of about 50 kDa
(Cederbaum, 2014).They are cysteine thiolate-ligated heme b-binding proteins
(Figure 1.12) and have a diagnostic absorption peak at approximately 450 nm
(hence ‘pigment 450’ or ‘P450’) when the reduced heme iron binds to carbon
monoxide (McLean et al., 2012). This 450 nm peak shifts to about 420 nm (P420) on
protonation of the cysteine thiolate to thiol. Protonation of the thiolate ligand (i.e.
P420 formation in the Fe2+–CO complex) results in enzyme inactivation, but is
reversible in some P450s. (Perera et al., 2003, McLean et al., 2010). The electron
donating property of the cysteine thiolate ligand is crucial for P450 catalysis (Munro
et al., 2007b).

62
Figure 1.12: The heme B prosthetic group. The iron (Fe) atom in the centre is shown in red, bonded to four pyrrole nitrogen atoms shown in blue. Figure was drawn with ChemDraw (Mills, 2006)

63
Figure 1.13: Spectral features for cytochrome P450 and its ferrous–carbon monoxide complex. A typical absorption spectrum for a P450 enzyme (CYP142A1 from Mtb, ∼5 µM enzyme) is shown in its oxidised (ferric) state (black solid line, Amax = 418 nm) and in its dithionite-reduced Fe(II)–CO complex (red solid line, Amax = 450 nm and 420 nm). The major absorption (Soret) band shift to ∼450 nm in the CO complex is a characteristic signature of the cysteinate-coordinated heme iron of P450 enzymes. A small shoulder originating from the inactive (thiol-coordinated) P420 form of CYP142 is seen at ∼420 nm in the spectrum of the Fe(II)–CO complex.
The cytochrome P450 enzymes are involved in the catalysis of different types of
reactions mediated through redox chemistry via their heme prosthetic group (an
iron–porphyrin complex). Among the most common reactions are hydroxylations
and other oxidations of organic substrates (Ortiz de Montellano, 2005). A notable
example is the sequential oxidations of the cholesterol side-chain at the C27
position by the P450s CYP125A1 and CYP142A1 in Mtb, forming first the terminal
alcohol moiety, then the aldehyde, and finally the acid (Garcia-Fernandez et al.,
2013).

64
The most common P450 reaction is mono-oxygenation, in which one oxygen atom
of molecular oxygen is inserted into an organic substrate (which may be compounds
central to metabolic processes, or exogenous/xenobiotic molecules), while the
second oxygen atom is reduced to water. This reaction is supported by two
electrons supplied to the P450 by NAD(P)H, with electron transfer mediated by
redox partner flavoproteins and iron-sulfur proteins (Hrycay and Bandiera, 2012,
Ouellet et al., 2010b). The general mono-oxygenation reaction of P450 enzymes can
be represented by the following equation:
RH + O2 + 2H+ + 2e- → ROH + H2O
This P450 reaction has also been referred to as a mixed function oxidase reaction –
reflecting that both the electron donor and the substrate become oxidised in a
typical P450 reaction (Cederbaum, 2014). RH is the organic substrate and ROH is the
oxidised product. The reducing equivalents (2e-) are supplied either by NADH or
NADPH and delivered by redox partner(s) (Hrycay and Bandiera, 2012). The first of
the two electrons (delivered at distinct points in the catalytic cycle) is used to
reduce ferric P450 heme iron into its ferrous state, ready to bind a dioxygen
molecule (McLean et al., 2005). Studies with P450cam (a camphor hydroxylase) and
P450 BM3 (a fatty acid hydroxylase) revealed that substrate binding, which serves
as a control mechanism, is required for efficient electron transfer to the heme iron
(Daff et al., 1997, McLean et al., 2005). A second electron transfer reaction to the
65
ferrous-oxy P450 heme precedes protonation events that produce a reactive iron-
oxo species that catalyses substrate oxidation.
Reactions including reduction, epoxidation, desaturation, ester cleavage, ring
expansion and dehydration are also typical of P450 enzymes. P450s in plants play
key roles in the synthesis of lignins and alkaloids (Cederbaum, 2014). Human P450s
are involved in reactions such as xenobiotic (e.g. drug) metabolism and in the
synthesis of essential endogenous compounds (e.g. steroids) (Balding et al., 2008,
McLean et al., 2012). A notable illustration is the P450 enzyme CYP3A4, a highly
expressed P450 in humans which is involved in the metabolism of about half of all
drugs that enter the body (Balding et al., 2008). On the other hand, prokaryotic
P450s play key roles in pathways for utilization of exogenous compounds (e.g.
cholesterol) as carbon sources, production of antibiotics, and also make
contributions to pathogen biochemistry (Balding et al., 2008). The eukaryotic
cytochrome P450 enzymes are membrane-bound enzymes, linked to their
respective membranes by an N-terminal hydrophobic anchor region and interacting
with membranous redox partner enzymes. These enzymes supply electrons needed
to reduce the heme-bound dioxygen to form a reactive iron-oxo species used to
convert substrate to mono-oxygenated product, and to reduce the second oxygen
atom to water (McLean et al., 2005). However, their prokaryotic relatives are
cytosolic, soluble enzymes that lack a membrane “anchor” region, and interact with
soluble redox partner proteins. The prokaryotic P450s have numerous functions
that are different from those of the eukaryotic P450 enzymes (McLean et al., 2010).

66
A typical bacterial P450 redox system (known as a class I system) involves a
NAD(P)H-specific FAD-containing reductase and an iron-sulfur protein (or
ferredoxin) that shuttles electrons from the reductase to the P450, and the P450
itself as the terminal oxidase (McLean et al., 2007b). Early bacterial P450s studied
(notably P450cam) were shown to be involved in oxidation reactions, such as the
utilization of camphor as a carbon source for growth in Pseudomonas putida
(Poulos, 2003). Characterization of a wider range of microbial P450s has highlighted
several other important physiological roles, including oxidation of polyketides in
biosynthetic pathways; specific examples including hydroxylation reactions in the
synthesis of erythromycin, and epoxidations in the synthesis of the anticancer
agents epothilones C and D in different microbes (Ogura et al., 2004, McLean et al.,
2010).
P450s generally share low amino acid sequence identity, with P450s sharing ≥40%
identity classified in the same P450 “family” (within the cytochrome P450
“superfamily”) and usually exhibiting similar substrate specificity. Despite wide
variations in amino acid sequence identity, The P450s exhibit strong similarities in
their overall structure, with a number of highly conserved secondary structural
elements. The regions which vary most in the P450 structures are those associated
with diverse ligand binding and catalytic reactions. Variations in P450s structure are
also important to enable distinct redox partner interactions and to allow P450
structural flexibility (Munro et al., 2007b, McLean et al., 2012). The majority of
P450s have been shown, through structural studies, to possess relatively
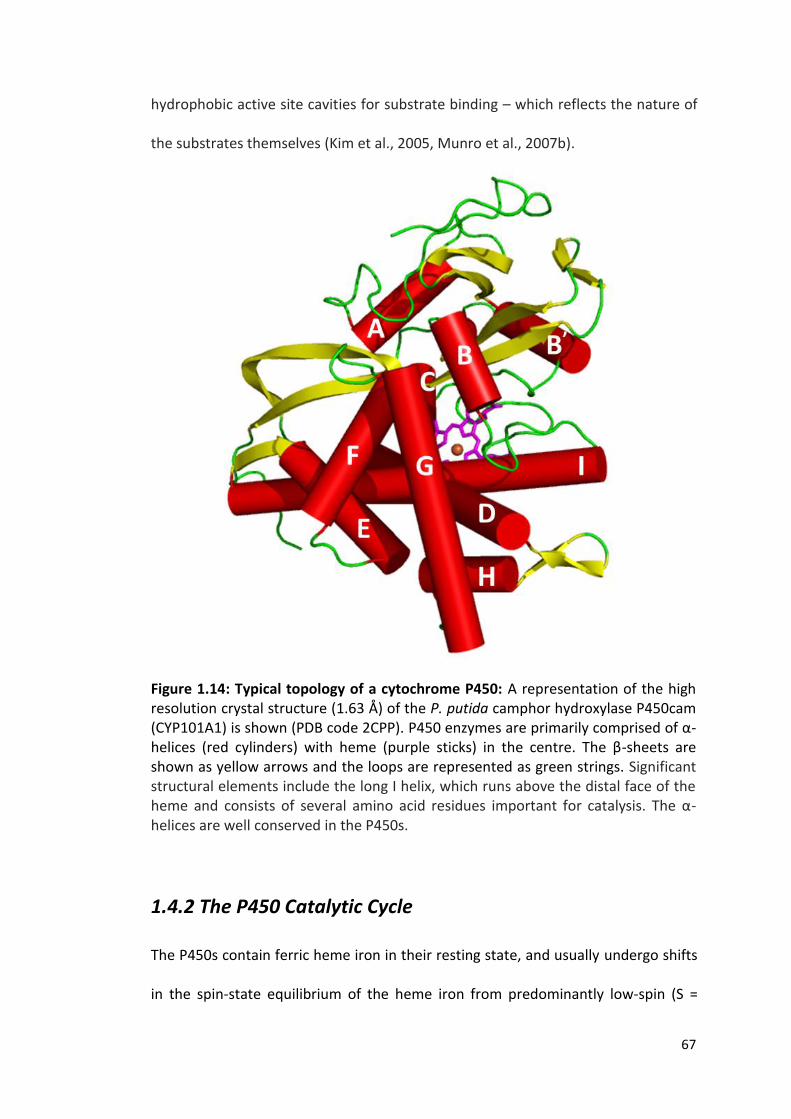
67
hydrophobic active site cavities for substrate binding – which reflects the nature of
the substrates themselves (Kim et al., 2005, Munro et al., 2007b).
Figure 1.14: Typical topology of a cytochrome P450: A representation of the high resolution crystal structure (1.63 Å) of the P. putida camphor hydroxylase P450cam (CYP101A1) is shown (PDB code 2CPP). P450 enzymes are primarily comprised of α-helices (red cylinders) with heme (purple sticks) in the centre. The β-sheets are shown as yellow arrows and the loops are represented as green strings. Significant structural elements include the long I helix, which runs above the distal face of the heme and consists of several amino acid residues important for catalysis. The α-helices are well conserved in the P450s.
1.4.2 The P450 Catalytic Cycle
The P450s contain ferric heme iron in their resting state, and usually undergo shifts
in the spin-state equilibrium of the heme iron from predominantly low-spin (S =
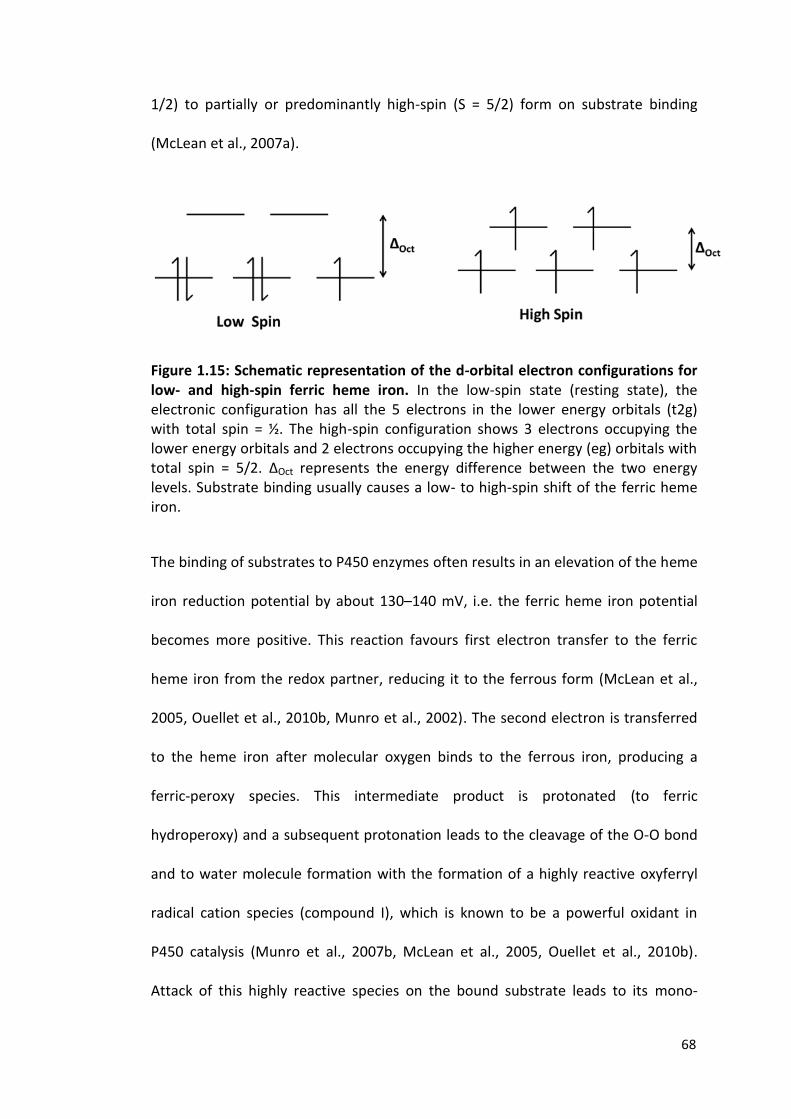
68
1/2) to partially or predominantly high-spin (S = 5/2) form on substrate binding
(McLean et al., 2007a).
Figure 1.15: Schematic representation of the d-orbital electron configurations for low- and high-spin ferric heme iron. In the low-spin state (resting state), the electronic configuration has all the 5 electrons in the lower energy orbitals (t2g) with total spin = ½. The high-spin configuration shows 3 electrons occupying the lower energy orbitals and 2 electrons occupying the higher energy (eg) orbitals with total spin = 5/2. ΔOct represents the energy difference between the two energy levels. Substrate binding usually causes a low- to high-spin shift of the ferric heme iron.
The binding of substrates to P450 enzymes often results in an elevation of the heme
iron reduction potential by about 130–140 mV, i.e. the ferric heme iron potential
becomes more positive. This reaction favours first electron transfer to the ferric
heme iron from the redox partner, reducing it to the ferrous form (McLean et al.,
2005, Ouellet et al., 2010b, Munro et al., 2002). The second electron is transferred
to the heme iron after molecular oxygen binds to the ferrous iron, producing a
ferric-peroxy species. This intermediate product is protonated (to ferric
hydroperoxy) and a subsequent protonation leads to the cleavage of the O-O bond
and to water molecule formation with the formation of a highly reactive oxyferryl
radical cation species (compound I), which is known to be a powerful oxidant in
P450 catalysis (Munro et al., 2007b, McLean et al., 2005, Ouellet et al., 2010b).
Attack of this highly reactive species on the bound substrate leads to its mono-
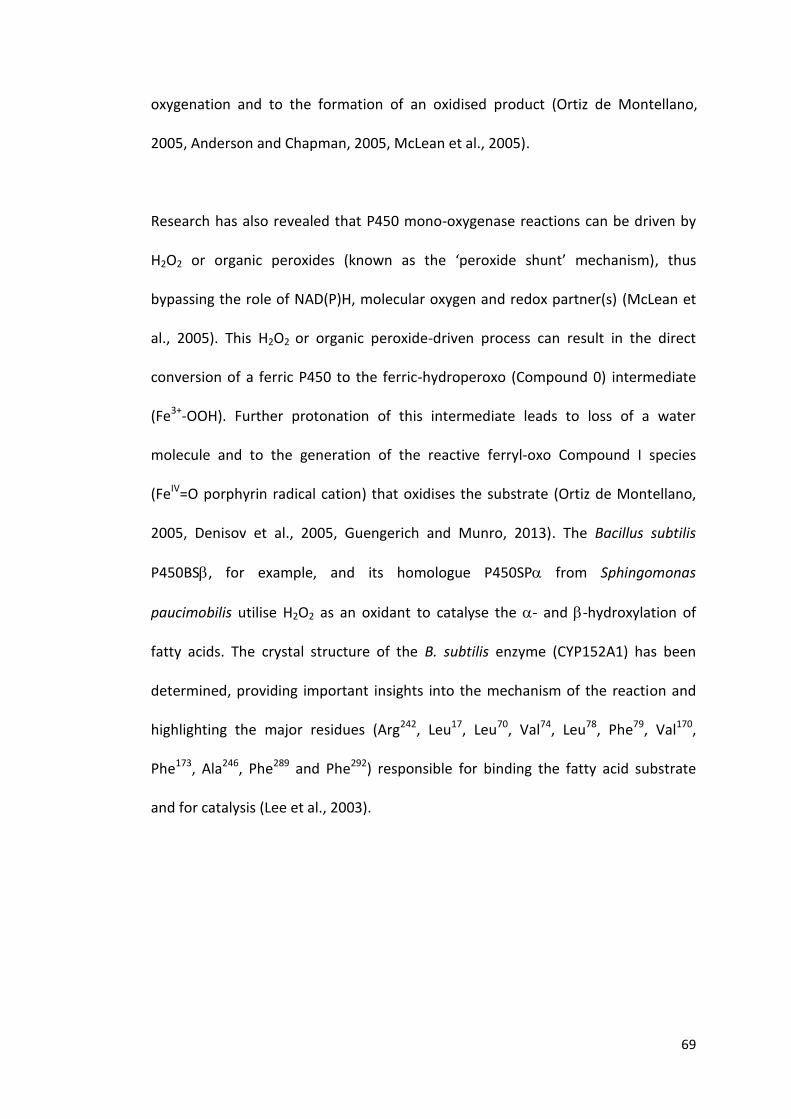
69
oxygenation and to the formation of an oxidised product (Ortiz de Montellano,
2005, Anderson and Chapman, 2005, McLean et al., 2005).
Research has also revealed that P450 mono-oxygenase reactions can be driven by
H2O2 or organic peroxides (known as the ‘peroxide shunt’ mechanism), thus
bypassing the role of NAD(P)H, molecular oxygen and redox partner(s) (McLean et
al., 2005). This H2O2 or organic peroxide-driven process can result in the direct
conversion of a ferric P450 to the ferric-hydroperoxo (Compound 0) intermediate
(Fe3+-OOH). Further protonation of this intermediate leads to loss of a water
molecule and to the generation of the reactive ferryl-oxo Compound I species
(FeIV=O porphyrin radical cation) that oxidises the substrate (Ortiz de Montellano,
2005, Denisov et al., 2005, Guengerich and Munro, 2013). The Bacillus subtilis
P450BS, for example, and its homologue P450SP from Sphingomonas
paucimobilis utilise H2O2 as an oxidant to catalyse the - and -hydroxylation of
fatty acids. The crystal structure of the B. subtilis enzyme (CYP152A1) has been
determined, providing important insights into the mechanism of the reaction and
highlighting the major residues (Arg242, Leu17, Leu70, Val74, Leu78, Phe79, Val170,
Phe173, Ala246, Phe289 and Phe292) responsible for binding the fatty acid substrate
and for catalysis (Lee et al., 2003).
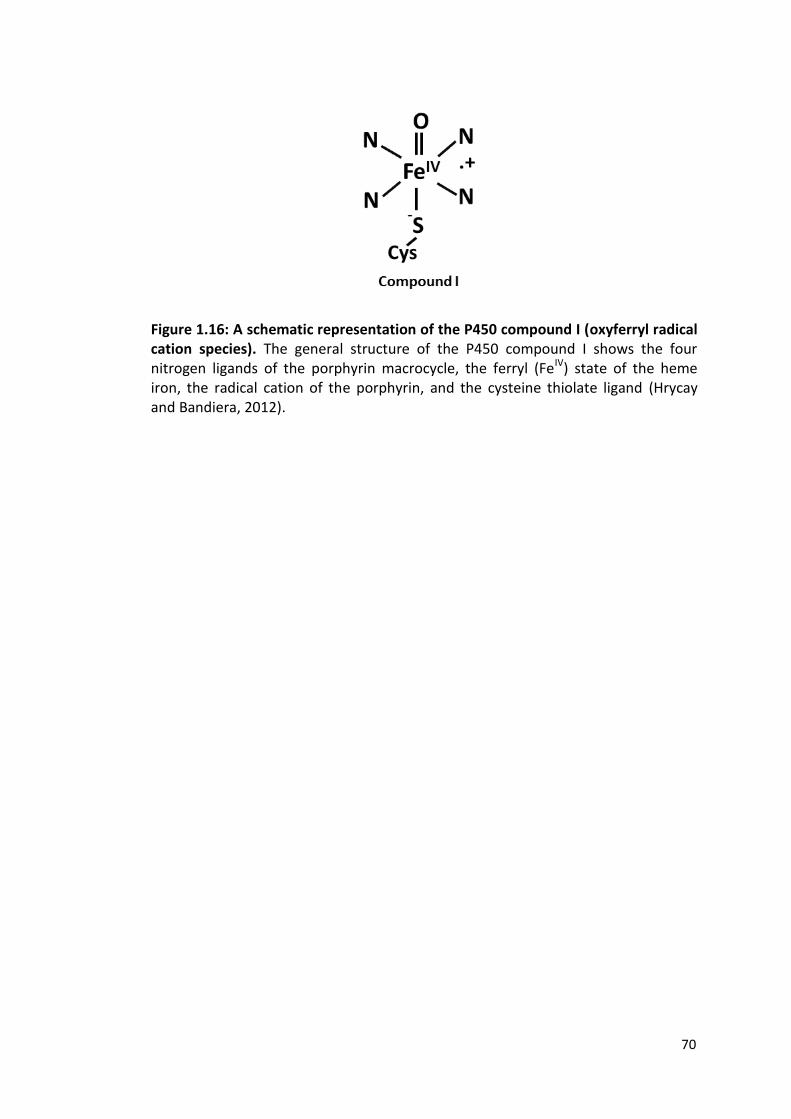
70
Figure 1.16: A schematic representation of the P450 compound I (oxyferryl radical cation species). The general structure of the P450 compound I shows the four nitrogen ligands of the porphyrin macrocycle, the ferryl (FeIV) state of the heme iron, the radical cation of the porphyrin, and the cysteine thiolate ligand (Hrycay and Bandiera, 2012).
71
Figure 1.17: Schematic representation of the catalytic cycle of a cytochrome P450 enzyme. The catalytic metabolism of organic substrates by P450s involves a series of oxidation, reduction and protonation steps. First, the substrate (RH) binds close to the ferric heme iron of the P450 enzyme (displacing a water ligand), and this generates a more positive heme iron potential (in the high-spin form) which favours electron transfer from the redox partner to reduce the heme iron to the ferrous state. The binding of dioxygen to the ferrous heme iron leads to the formation of ferric superoxy species which is reduced and protonated to form a ferric hydroperoxy species (compound 0). The further protonation and subsequent dehydration of the compound 0 species forms a ferryl-oxo intermediate which is known to be a highly reactive oxidant (compound I), and this species catalyses oxygenation (often hydroxylation) of the substrate. The dissociation of the hydroxylated product (R–OH) from the enzyme restores the heme iron to the initial, resting ferric low-spin state. The oxy intermediates in the cycle can collapse via non-productive pathways to produce either superoxide (from the ferric superoxy form), hydrogen peroxide (from compound 0) or water (from compound I). The formation of compound 0 can be productively driven by mixing H2O2 (or organic peroxides) with ferric, substrate-bound P450. This reaction is often not very efficient. The non-productive pathways may occur if electron delivery from redox partners or if protonation events are not timely, or if substrate is improperly positioned for oxidative attack, or is completely absent. Image is adapted from (Munro et al., 2007b).
72
1.4.3. Cytochrome P450 Redox Partners
Most P450s interact with one or more redox partners to acquire their reducing
equivalents (electrons). Important studies on P450 systems, particularly those from
bacterial species, have revealed an extensive diversity in the machinery used to
deliver electrons to the P450s (McLean et al., 2005).
The progression of the P450 reaction cycle depicted in Figure 1.17 requires
consecutive delivery of two electrons to its heme iron at distinct points in its
catalytic cycle (Munro et al., 2007b, Ortiz de Montellano, 2005). These electrons are
provided by the nicotinamide adenine dinucleotide cofactors (NAD(P)H) and their
delivery to the heme iron is mediated by accessory redox partner proteins. Two
primary types of redox systems are involved in shuttling electrons to the heme iron
(Ortiz de Montellano, 2005). The first category, often called class I, employs
ferredoxins (iron–sulfur cluster containing enzymes) or sometimes flavodoxins
(FMN-containing proteins) in conjunction with a separate reductase protein that
uses flavin adenine dinucleotide (FAD) as its cofactor and accepts electrons from
NAD(P)H (Ouellet et al., 2010b). The class I systems are employed by organisms with
soluble P450 enzymes, such as bacteria, but they are also found in higher
organisms, where their reductase and P450 components are associated with the
mitochondrial membrane and involved in reactions associated with steroid
synthesis (Ouellet et al., 2010b, Munro et al., 2007b). Typical prokaryotic class I
redox systems use ferredoxin reductase and ferredoxin (Fdx) partners proteins
(Munro et al., 2007b, Guengerich and Munro, 2013).

73
The second major type of redox system, often called class II (eukaryotic), is
exclusively membrane bound (i.e. P450 and redox partner are bound by an N-
terminal membrane anchor). The reductase (cytochrome P450 reductase or CPR)
possesses two different flavin-binding domains within a single polypeptide (McLean
et al., 2005). The mammalian CPRs are typical of the class II reductase system and
these diflavin reductases, like the class I enzymes, contain a FAD-binding domain
that is structurally similar to the microbial ferredoxin reductases. However, in class
II systems these modules are fused to an FMN-binding (flavodoxin-like) domain,
forming a single CPR redox partner protein (Ouellet et al., 2010b). The CPRs have a
N-terminal membrane anchor on their FMN-binding domain. There are also
examples of P450 enzymes, such as CYP102A1 (P450 BM3) from Bacillus
megaterium, that contain a CPR-like domain fused to the P450 domain (Munro et
al., 2007b, McLean et al., 2005, Ortiz de Montellano, 2005). However, in this case
the P450 and CPR components lack membrane anchors and BM3 is a soluble
enzyme. The systems supporting the Mtb P450s will be representatives of the Class
I system, since there is no CPR encoded in the Mtb genome (Munro et al., 2007b).
Bacterial flavodoxins and ferredoxins are important redox proteins that play key
roles in P450 metabolic pathways (McLean et al., 2005). Ferredoxins are functional
one-electron carriers which bind iron–sulfur cofactors with 2Fe-2S, 3Fe-4S or 4Fe-4S
clusters. The iron ions in the ferredoxins co-ordinate to sulfur atoms from cysteine
residues in the protein and from inorganic sulfide (McLean et al., 2005). Flavodoxins
can carry either one or two electrons and bind an FMN cofactor non-covalently.

74
However, they are frequently isolated in their single-electron reduced semiquinone
form and typically act as single electron donors/acceptors, mainly by electron
transfer from their 2-electron reduced hydroquinone form (McLean et al., 2005).
Studies have revealed that flavodoxins act as surrogates for ferredoxins under
conditions of cellular iron limitation, and hence they are believed to support
functions of selected bacterial P450s (McLean et al., 2005). The catalytic function of
bovine P450c17 (CYP17) was shown to be supported by the E. coli flavodoxin
reductase/flavodoxin system (Jenkins et al., 1997). In a physiologically relevant
example, the cineole metabolizing P450cin (CYP176A1) from Citrobacter braakii was
shown to interact with the host flavodoxin cindoxin, the product of a gene located
adjacent to the P450 on the bacterial chromosome (Hawkes et al., 2002).
The P450cam system utilizes a 2Fe-2S cluster ferredoxin (putidaredoxin) to reduce
the P450, but studies have revealed other microbial P450s that also exploit 3Fe-4S
ferredoxins and probably 4Fe-4S ferredoxins for the electron relay mechanism
(McLean et al., 2005). Supporting examples include the xenobiotic-transforming
P450soy from Streptomyces griseus which uses a 3Fe-4S ferredoxin (Trower et al.,
1992), and a 4Fe-4S ferredoxin shown to support catalytic activity in the fatty acid
oxidising P450 BioI system (Lawson et al., 2004).
It has been documented that flavodoxins are not present in the Mtb genome, but
ferredoxins and ferredoxin-like proteins do exist in the genome. Notable examples
of Mtb P450 redox partners are the ferredoxin products of the Rv1786 gene
(adjacent to the gene for the P450 CYP143A1) and the Rv0764c gene (adjacent to
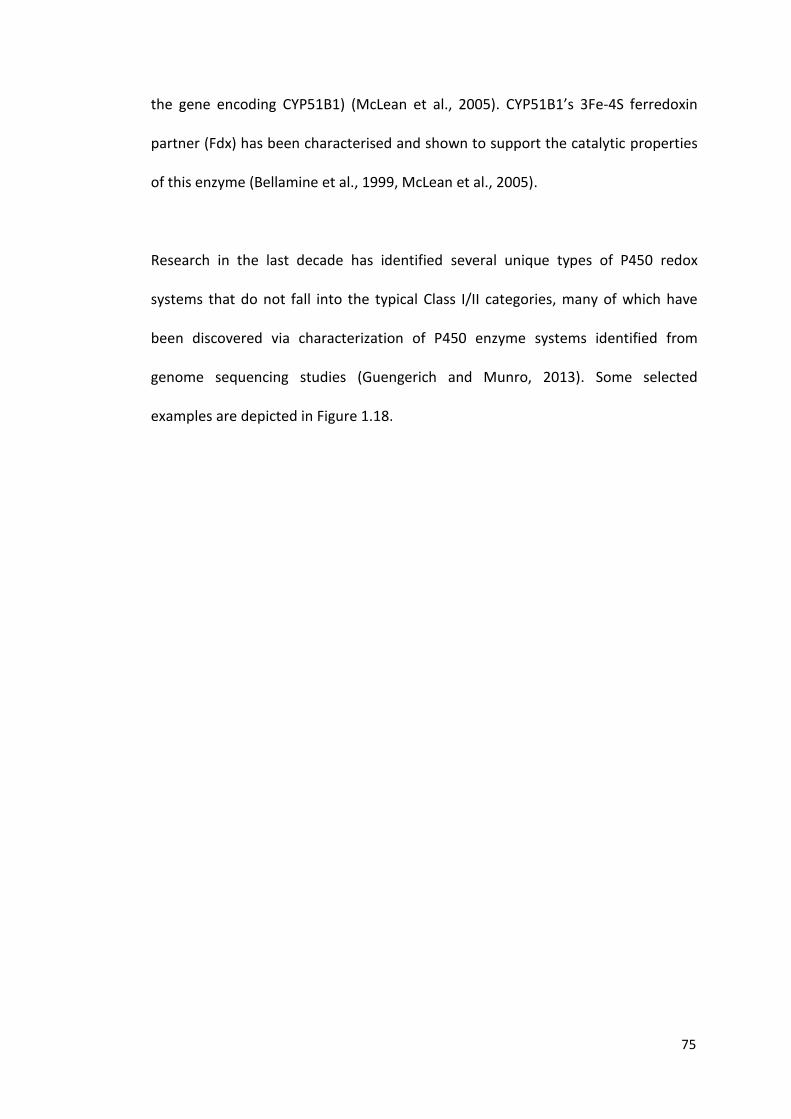
75
the gene encoding CYP51B1) (McLean et al., 2005). CYP51B1’s 3Fe-4S ferredoxin
partner (Fdx) has been characterised and shown to support the catalytic properties
of this enzyme (Bellamine et al., 1999, McLean et al., 2005).
Research in the last decade has identified several unique types of P450 redox
systems that do not fall into the typical Class I/II categories, many of which have
been discovered via characterization of P450 enzyme systems identified from
genome sequencing studies (Guengerich and Munro, 2013). Some selected
examples are depicted in Figure 1.18.
76
Figure 1.18: Schematic representation of a variety of P450 redox systems and P450 fusion proteins. Selected P450 enzymes and their redox partner systems are shown. 1) Fatty acid hydroxylase. For example, P450–CPR fusions of the BM3 type (Munro et al., 2007a). 2) glycosyltransferases (of the GTB-type superfamily) fused to P450s (Breton et al., 2006). 3) Short-chain reductases (SDR) fused to P450s. These enzymes catalyze a wide range of activities including the metabolism of steroids, cofactors, carbohydrates, lipids, aromatic compounds, and amino acids, and act in redox sensing (Kallberg et al., 2010). 4) Esterases fused to P450s: These are esterases and lipases which includes fungal lipases, cholinesterases etc. (Hang et al., 2012). 5) P450s fused to medium chain reductases (MDR) (Persson et al., 2008). 6) P450s fused to Dolichyl-phosphate-mannose-protein mannosyltransferases (PMT_2) (Haft et al., 2012). 7) An ammonium transporter fused to a P450 found in Saccharomyces cerevisiae (Marini et al., 1994). 8) P450s fused to membrane bound O-acyl transferase (MBOAT). A conserved histidine is suggested to be an important active site residue in such enzymes (Hofmann, 2000). 9) P450s fused to a histidine phosphatase (HP) domain, as found in phosphatase proteins that containing a His residue which is phosphorylated during the course of their reaction (Rigden, 2008). (10) SPFH-like superfamily protein fused to P450s, where SPFH indicates stomatin, prohibitin, flotillin and HflK/C type proteins that are often associated with lipid rafts (Tanaka and Tsukihara, 2012).
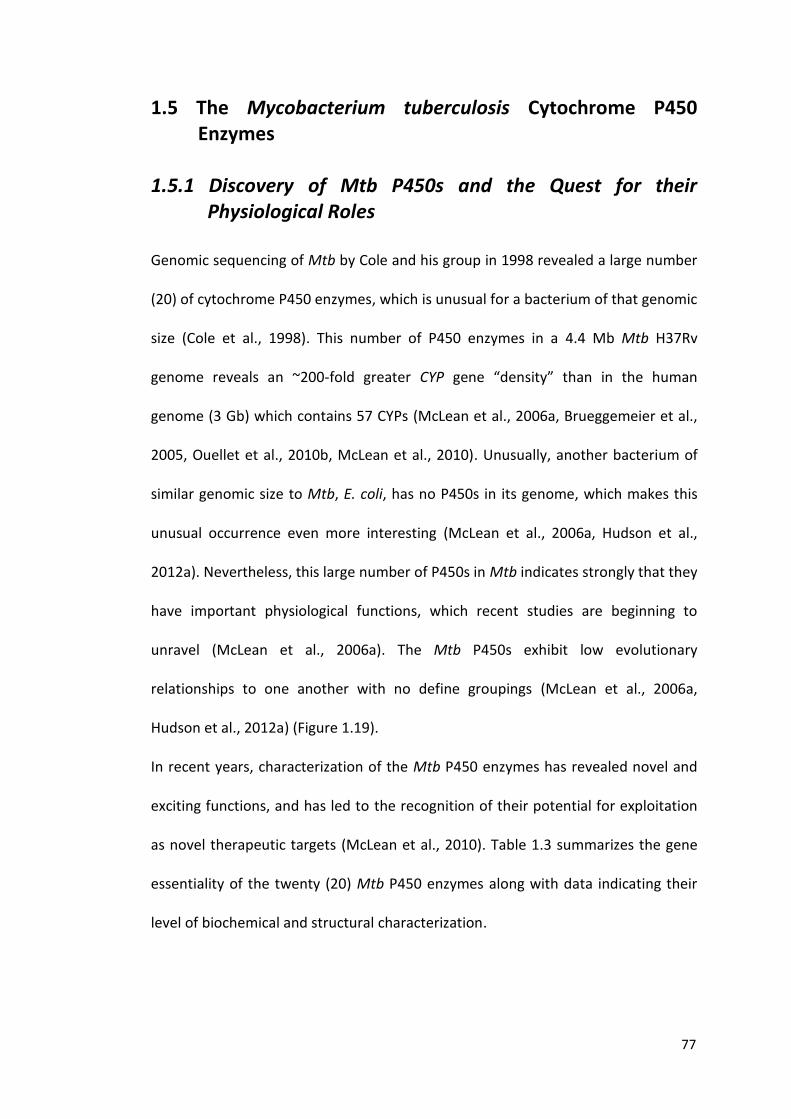
77
1.5 The Mycobacterium tuberculosis Cytochrome P450 Enzymes
1.5.1 Discovery of Mtb P450s and the Quest for their
Physiological Roles Genomic sequencing of Mtb by Cole and his group in 1998 revealed a large number
(20) of cytochrome P450 enzymes, which is unusual for a bacterium of that genomic
size (Cole et al., 1998). This number of P450 enzymes in a 4.4 Mb Mtb H37Rv
genome reveals an ~200-fold greater CYP gene “density” than in the human
genome (3 Gb) which contains 57 CYPs (McLean et al., 2006a, Brueggemeier et al.,
2005, Ouellet et al., 2010b, McLean et al., 2010). Unusually, another bacterium of
similar genomic size to Mtb, E. coli, has no P450s in its genome, which makes this
unusual occurrence even more interesting (McLean et al., 2006a, Hudson et al.,
2012a). Nevertheless, this large number of P450s in Mtb indicates strongly that they
have important physiological functions, which recent studies are beginning to
unravel (McLean et al., 2006a). The Mtb P450s exhibit low evolutionary
relationships to one another with no define groupings (McLean et al., 2006a,
Hudson et al., 2012a) (Figure 1.19).
In recent years, characterization of the Mtb P450 enzymes has revealed novel and
exciting functions, and has led to the recognition of their potential for exploitation
as novel therapeutic targets (McLean et al., 2010). Table 1.3 summarizes the gene
essentiality of the twenty (20) Mtb P450 enzymes along with data indicating their
level of biochemical and structural characterization.
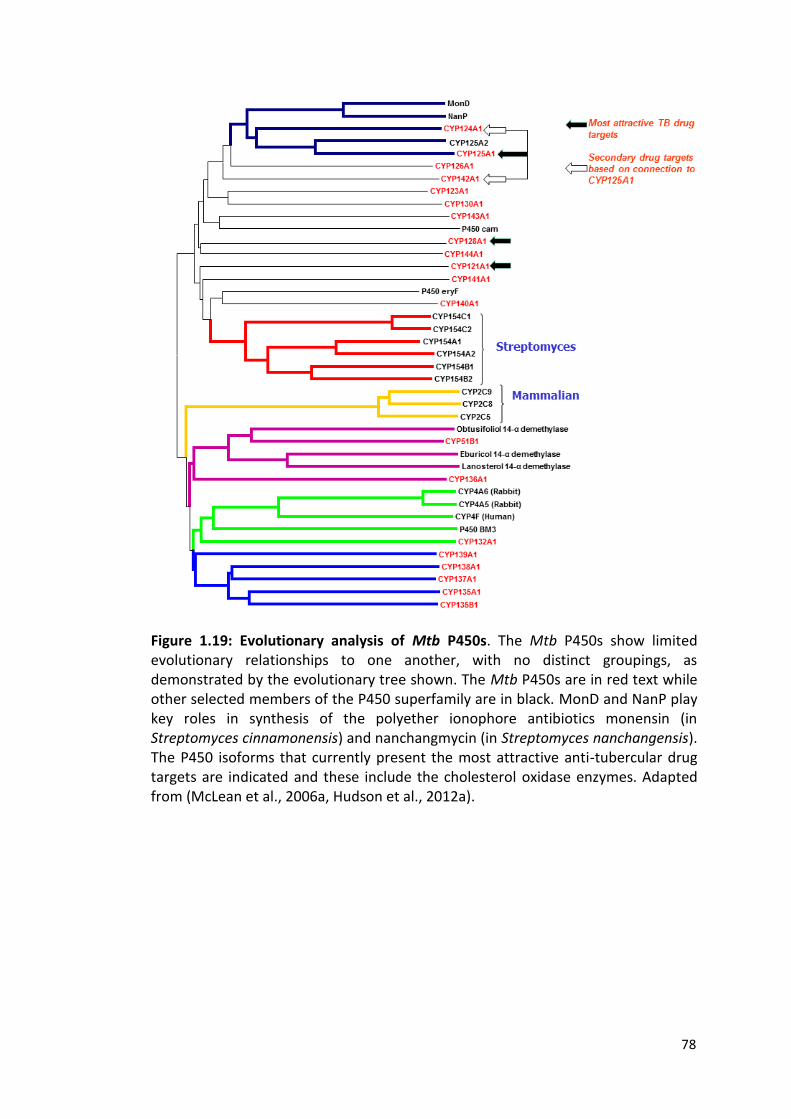
78
Figure 1.19: Evolutionary analysis of Mtb P450s. The Mtb P450s show limited evolutionary relationships to one another, with no distinct groupings, as demonstrated by the evolutionary tree shown. The Mtb P450s are in red text while other selected members of the P450 superfamily are in black. MonD and NanP play key roles in synthesis of the polyether ionophore antibiotics monensin (in Streptomyces cinnamonensis) and nanchangmycin (in Streptomyces nanchangensis). The P450 isoforms that currently present the most attractive anti-tubercular drug targets are indicated and these include the cholesterol oxidase enzymes. Adapted from (McLean et al., 2006a, Hudson et al., 2012a).
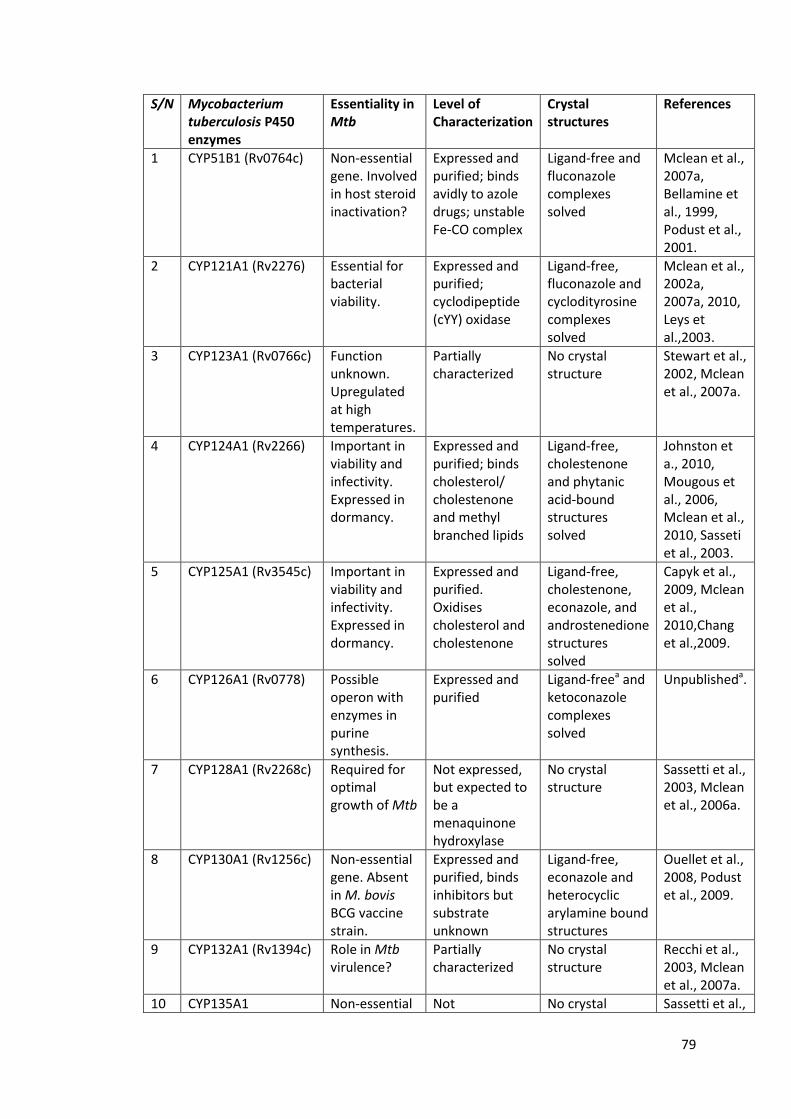
79
S/N Mycobacterium tuberculosis P450 enzymes
Essentiality in Mtb
Level of Characterization
Crystal structures
References
1 CYP51B1 (Rv0764c) Non-essential gene. Involved in host steroid inactivation?
Expressed and purified; binds avidly to azole drugs; unstable Fe-CO complex
Ligand-free and fluconazole complexes solved
Mclean et al., 2007a, Bellamine et al., 1999, Podust et al., 2001.
2 CYP121A1 (Rv2276) Essential for bacterial viability.
Expressed and purified; cyclodipeptide (cYY) oxidase
Ligand-free, fluconazole and cyclodityrosine complexes solved
Mclean et al., 2002a, 2007a, 2010, Leys et al.,2003.
3 CYP123A1 (Rv0766c) Function unknown. Upregulated at high temperatures.
Partially characterized
No crystal structure
Stewart et al., 2002, Mclean et al., 2007a.
4 CYP124A1 (Rv2266) Important in viability and infectivity. Expressed in dormancy.
Expressed and purified; binds cholesterol/ cholestenone and methyl branched lipids
Ligand-free, cholestenone and phytanic acid-bound structures solved
Johnston et a., 2010, Mougous et al., 2006, Mclean et al., 2010, Sasseti et al., 2003.
5 CYP125A1 (Rv3545c) Important in viability and infectivity. Expressed in dormancy.
Expressed and purified. Oxidises cholesterol and cholestenone
Ligand-free, cholestenone, econazole, and androstenedione structures solved
Capyk et al., 2009, Mclean et al., 2010,Chang et al.,2009.
6 CYP126A1 (Rv0778) Possible operon with enzymes in purine synthesis.
Expressed and purified
Ligand-freea and ketoconazole complexes solved
Unpublisheda.
7 CYP128A1 (Rv2268c) Required for optimal growth of Mtb
Not expressed, but expected to be a menaquinone hydroxylase
No crystal structure
Sassetti et al., 2003, Mclean et al., 2006a.
8 CYP130A1 (Rv1256c) Non-essential gene. Absent in M. bovis BCG vaccine strain.
Expressed and purified, binds inhibitors but substrate unknown
Ligand-free, econazole and heterocyclic arylamine bound structures
Ouellet et al., 2008, Podust et al., 2009.
9 CYP132A1 (Rv1394c) Role in Mtb virulence?
Partially characterized
No crystal structure
Recchi et al., 2003, Mclean et al., 2007a.
10 CYP135A1 Non-essential Not No crystal Sassetti et al.,
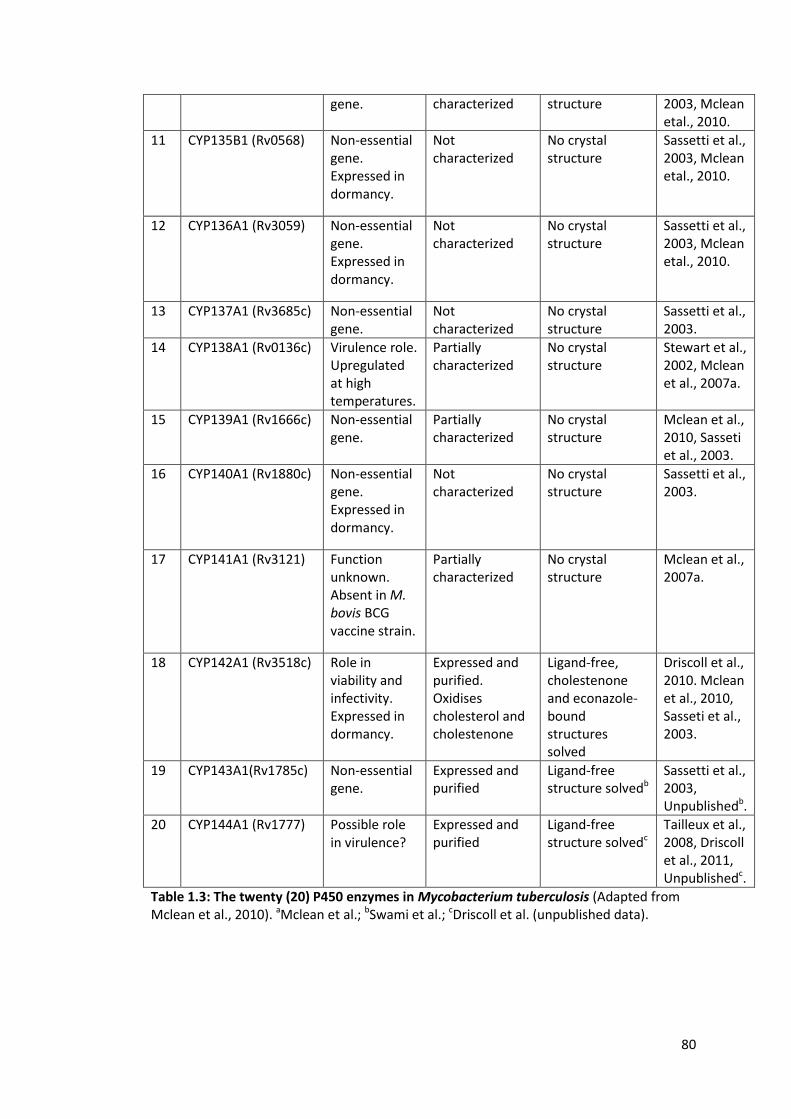
80
gene. characterized structure 2003, Mclean etal., 2010.
11 CYP135B1 (Rv0568) Non-essential gene. Expressed in dormancy.
Not characterized
No crystal structure
Sassetti et al., 2003, Mclean etal., 2010.
12 CYP136A1 (Rv3059) Non-essential gene. Expressed in dormancy.
Not characterized
No crystal structure
Sassetti et al., 2003, Mclean etal., 2010.
13 CYP137A1 (Rv3685c) Non-essential gene.
Not characterized
No crystal structure
Sassetti et al., 2003.
14 CYP138A1 (Rv0136c) Virulence role. Upregulated at high temperatures.
Partially characterized
No crystal structure
Stewart et al., 2002, Mclean et al., 2007a.
15 CYP139A1 (Rv1666c) Non-essential gene.
Partially characterized
No crystal structure
Mclean et al., 2010, Sasseti et al., 2003.
16 CYP140A1 (Rv1880c) Non-essential gene. Expressed in dormancy.
Not characterized
No crystal structure
Sassetti et al., 2003.
17 CYP141A1 (Rv3121) Function unknown. Absent in M. bovis BCG vaccine strain.
Partially characterized
No crystal structure
Mclean et al., 2007a.
18 CYP142A1 (Rv3518c) Role in viability and infectivity. Expressed in dormancy.
Expressed and purified. Oxidises cholesterol and cholestenone
Ligand-free, cholestenone and econazole-bound structures solved
Driscoll et al., 2010. Mclean et al., 2010, Sasseti et al., 2003.
19 CYP143A1(Rv1785c) Non-essential gene.
Expressed and purified
Ligand-free structure solvedb
Sassetti et al., 2003, Unpublishedb.
20 CYP144A1 (Rv1777) Possible role in virulence?
Expressed and purified
Ligand-free structure solvedc
Tailleux et al., 2008, Driscoll et al., 2011, Unpublishedc.
Table 1.3: The twenty (20) P450 enzymes in Mycobacterium tuberculosis (Adapted from Mclean et al., 2010). aMclean et al.; bSwami et al.; cDriscoll et al. (unpublished data).

81
1.5.2 The Cholesterol Oxidase P450 Enzymes
With the growing line of evidence that Mtb lacks the machinery to synthesize
sterols, paradoxically, the gene for CYP51B1 was found to be encoded in the Mtb
genome. CYP51B1 is a P450 enzyme that can catalyze the 14α-demethylation of
lanosterol, which is an important step in cholesterol biosynthesis in eukaryotes to
give the 8,14-diene product (Bellamine et al., 1999). CYP51 enzymes, though well
conserved across the actinobacteria, are apparently non-essential for in vitro cell
viability of these organisms, unlike the eukaryotic CYP51s. The physiological role of
the CYP51B1 enzyme in Mtb and other bacteria remains unknown (Lamb et al.,
2002).
Interestingly, a study carried out by Van der Geize et al. identified a cluster of genes
that are involved in steroid metabolism in Rhodococcus jostii (Van der Geize et al.,
2007). This organism is a soil bacterium that metabolizes a large range of organic
compounds (mainly hydrophobic). It is also a mycolic acid-producing bacterium
within the order Actinomycetales, which includes the mycobacteria (Gurtler et al.,
2004, Van der Geize et al., 2007). Furthermore, genomic sequencing revealed that
approximately 60% of the 3,999 genes of Mtb H37Rv are conserved in R. jostii
RHA1, and these include many genes with unknown functions (McLeod et al., 2006).
Hence these data suggests that rhodococci could form part of a useful model for
many mycobacterial processes (Van der Geize et al., 2007).

82
The large steroid metabolism-associated gene cluster identified in R. jostii was
initially discovered by bioinformatics analyses of genes that were expressed during
growth on cholesterol, and this cluster was also shown to encode the Mtb P450
enzymes CYP142A1 and CYP125A1 (Van der Geize et al., 2007, Driscoll et al., 2010)
(Figure 1.20). Organic compounds such as cholesterol occur widely in plants (albeit
in small amounts), animals and some micro-organisms, and potentially comprise an
essential source of energy for bacteria and fungi that live and feed on dead organic
matter, especially actinomycetes that utilize hydrophobic substrates (Van der Geize
et al., 2007). The sterol genes identified in R. jostii and another Rhodococcus sp.
were shown to be involved in sterol uptake and in sterol side-chain and ring
degradation, and are conserved in related pathogenic actinobacteria, such as Mtb,
M. bovis and M. avium. These pathogens appear to have retained the capacity for
cholesterol metabolism, which they use to enable infectivity and survival in their
hosts (Van der Geize et al., 2007).
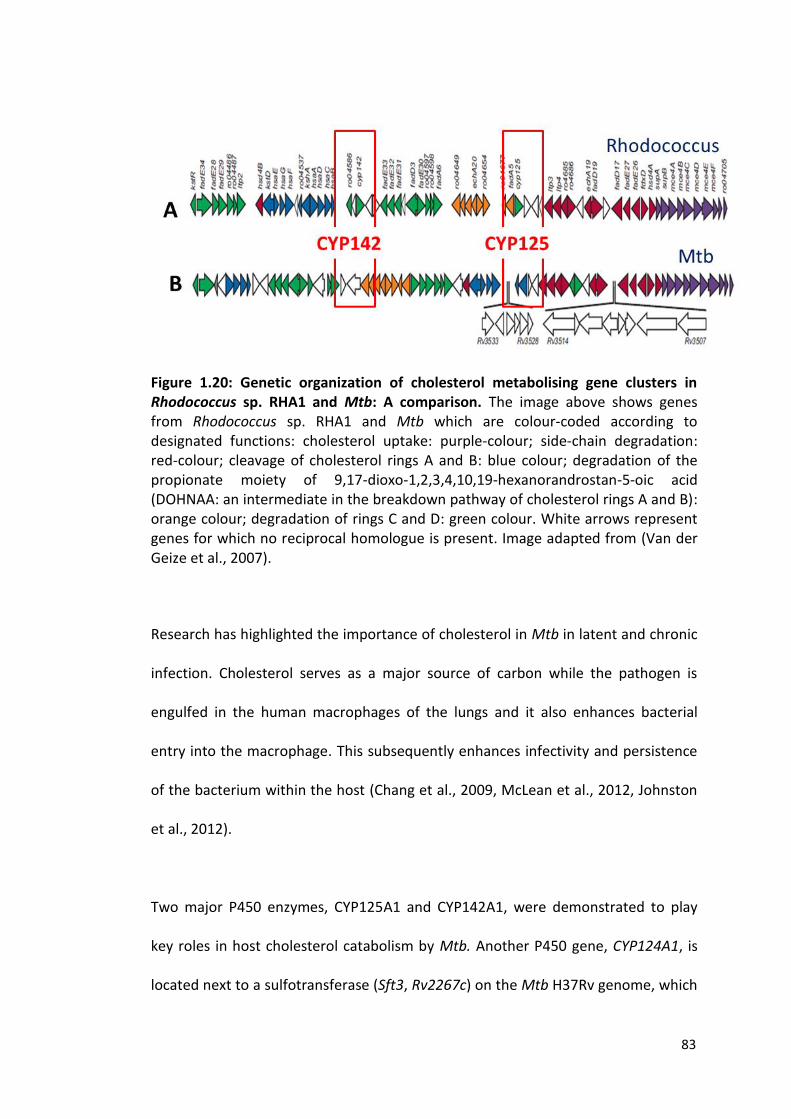
83
Figure 1.20: Genetic organization of cholesterol metabolising gene clusters in Rhodococcus sp. RHA1 and Mtb: A comparison. The image above shows genes from Rhodococcus sp. RHA1 and Mtb which are colour-coded according to designated functions: cholesterol uptake: purple-colour; side-chain degradation: red-colour; cleavage of cholesterol rings A and B: blue colour; degradation of the propionate moiety of 9,17-dioxo-1,2,3,4,10,19-hexanorandrostan-5-oic acid (DOHNAA: an intermediate in the breakdown pathway of cholesterol rings A and B): orange colour; degradation of rings C and D: green colour. White arrows represent genes for which no reciprocal homologue is present. Image adapted from (Van der Geize et al., 2007).
Research has highlighted the importance of cholesterol in Mtb in latent and chronic
infection. Cholesterol serves as a major source of carbon while the pathogen is
engulfed in the human macrophages of the lungs and it also enhances bacterial
entry into the macrophage. This subsequently enhances infectivity and persistence
of the bacterium within the host (Chang et al., 2009, McLean et al., 2012, Johnston
et al., 2012).
Two major P450 enzymes, CYP125A1 and CYP142A1, were demonstrated to play
key roles in host cholesterol catabolism by Mtb. Another P450 gene, CYP124A1, is
located next to a sulfotransferase (Sft3, Rv2267c) on the Mtb H37Rv genome, which
84
in turn is adjacent to the Rv2268 gene encoding the P450 CYP128. CYP128 is
thought to hydroxylate menaquinone, which is then sulfated by Stf3 (Holsclaw et
al., 2008).
CYP124A1 was also identified to metabolise cholesterol, although expression of
CYP124A1 is not induced by cholesterol (McLean et al., 2012, Johnston et al., 2009,
Ouellet et al., 2010b). These three P450 isoforms were shown to catalyse the C-27
(or omega)-hydroxylation of the hydrocarbon side chain of cholesterol to produce
27-hydroxycholesterol, and then to further oxidise the substrate through to the
carboxylic acid via an aldehyde (Figure 1.22) (Johnston et al., 2012, McLean et al.,
2012). This important reaction subsequently enables the β-oxidation of the
cholesterol side chain (McLean et al., 2012). The acid moiety generated from the
reaction then undergoes trans-esterification with coenzyme-A (CoA) in an ATP-
dependent step that prepares the acyl-CoA for β-oxidation. Subsequently, three
rounds of β-oxidation produce one molecule of acetyl-CoA and two propionyl-CoA
equivalents (Johnston et al., 2012, Driscoll et al., 2010).
The major enzyme implicated in the cholesterol side chain degradation is
CYP125A1, while CYP142A1 plays a complementary role with CYP125A1 in certain
mycobacterial strains (Thomas et al., 2011, McLean et al., 2012). This cholesterol
catabolic pathway is conserved in the soil-dwelling relative of Mtb, M. smegmatis,
in which both CYP125A3 and CYP142A2 serve as paralogous enzymes (Frank et al.,
2014, Garcia-Fernandez et al., 2013). These two enzymes share approximately 70%
sequence identity with their Mtb orthologues and activity towards the substrate 4-

85
cholesten-3-one (Frank et al., 2014). Although some mycobacterial variants, such as
the CDC1551 strain of Mtb and M. bovis BCG, have lost a functional CYP142A1 gene,
they still retain the CYP125A1 gene (Klansek et al., 1995, Ouellet et al., 2010a, Capyk
et al., 2009, Frank et al., 2014). Recent studies have revealed that CYP142A1, but
not CYP124A1, fully restores the growth phenotype for a CYP125A1 gene deletion
strain of Mtb (Brzostek et al., 2007). Recent studies in the Mtb vaccine strain M.
bovis BCG revealed CYP125A1 to be up-regulated 7.1-fold during growth in the
presence of cholesterol (McLean et al., 2010). A ∆CYP125 M. bovis BCG strain
showed no growth on cholesterol and accumulated 4-cholesten-3-one during
growth in the presence of cholesterol (McLean et al., 2010).
In Mtb, CYP125A1 is found in a gene cluster known as the intracellular growth
operon (igr), which is essential for the survival of the bacterium in macrophages
(McLean et al., 2012). Even though CYP124A1 and CYP125A1 are closely related and
show remarkable sequence identity (40.7%) over 428 residues, CYP124A1 also
metabolises a wide range of branched chain fatty acids and isoprenoids, while
CYP125A1 has no such activity (Johnston et al., 2009, Johnston et al., 2010, Driscoll
et al., 2010). CYP142A1 is far less related to CYP125A1 (with a sequence identity of
28.0% identity over 397 residues) than is CYP124A1. The comparable sequence
identity between CYP142A1 and CYP124A1 is 35.5% over 392 residues (Driscoll et
al., 2010).
The key steps required for cholesterol utilization by Mtb can be categorised into
four major phases: (1) cholesterol uptake into the Mtb cell, (2) its oxidation to
86
cholest-4-en-3-one, (3) degradation of its side chain and (4) breakdown of the
steroid ring (Ouellet et al., 2011, Johnston et al., 2012). The uptake of cholesterol
into the Mtb cell is carried out by the MCE (mammalian cell entry) proteins and
then cholesterol is oxidized to cholest-4-en-3-one (cholestenone) either by a
cholesterol oxidase (ChoD) or by the 3β-hydroxysteroid dehydrogenase (3β-HSD)
(Johnston et al., 2012, Brzostek et al., 2007, Ouellet et al., 2010a, Ouellet et al.,
2011). The important P450-mediated reaction of cholesterol oxidation is required
for the activation of the side-chain for entry into β-oxidation, and subsequent
steroid ring degradation (Johnston et al., 2012). However, it is not very clear
whether there is a strict order of the cholesterol catabolic pathway in Mtb (Ouellet
et al., 2011). This has been supported by evidence from the literature on
rhodococcal sterol catabolism, which postulated that intermediates of ring and side
chain degradation can be intertwined between the two pathway routes (Rosloniec
et al., 2009). Studies have also shown that in Mtb the blockage of the cholesterol
side chain degradation resulted in the accumulation of cholest-4-en-3-one as a key
metabolite which is bacteriostatic or toxic to the bacterium (Ouellet et al., 2010a).
This suggests that the ring-degrading enzymes (e.g. KsaAB and HsaA-C) act more
efficiently after the side chain has been cleaved off (Ouellet et al., 2011).
The chemical structures of cholesterol and cholest-4-en-3- one are shown in Figure
1.21. The important functions of these cholesterol-hydroxylating P450s for Mtb
infection, persistence and survival makes them promising drug targets and a
potential focus for anti-TB drug development (McLean et al., 2012, Johnston et al.,
2012).

87
Figure 1.21: The chemical structures of cholesterol (A) and cholest-4-en-3-one (B). Figures were drawn using ChemDraw (Mills, 2006).
Figure 1.22: Cholesterol side chain oxidation reactions. The figure shows a schematic illustration of the CYP125/CYP142/CYP124-mediated hydroxylation of cholesterol at the C-27 position to 27-hydroxycholesterol, and the subsequent conversion into cholestenoic acid via an intermediate with an aldehyde moiety (McLean et al., 2012). Image was drawn using ChemDraw (Mills, 2006).
88
1.5.2.1 CYP125A1 (Rv3545c): Essential for Mtb Viability and Infectivity
CYP125A1 has been documented to be the most important P450 drug target in Mtb
(McLean et al., 2010). It is the major P450 enzyme that catalyses the 27-hydroxyl-
ation of the cholesterol and cholestenone side chain, enabling cholesterol/one
degradation for energy generation (Ouellet et al., 2010a, Capyk et al., 2009).
CYP125A1 initially sparked an interest as an Mtb drug target when a gene cluster
was identified in the Rhodococcus sp. RHA1 Strain by Van der Geize and co-workers
in 2007 (Van der Geize et al., 2007). This gene operon was shown to be involved in
cholesterol catabolism, with several of these genes conserved in Mtb (including
CYP125A1 and CYP142A1 in Mtb) (Van der Geize et al., 2007, McLean and Munro,
2008). In Mtb, CYP125A1 is located in the igr operon, which is essential for Mtb
survival in human macrophages (Chang et al., 2009, Garcia-Fernandez et al., 2013).
The crystal structure of the ligand-free CYP125A1 enzyme has been solved at a
resolution of 1.4 Å, revealing a ‘letterbox’-like hydrophobic active site entry cavity
which narrows in a funnel-like manner towards the heme centre (McLean et al.,
2009). In addition, the structures of CYP125A1 in complex with androstenedione,
econazole and cholestenone have also been determined to resolutions of 2.0, 2.2
and 1.58 Å, respectively (McLean et al., 2009). For the econazole and
androstenedione structures, the molecules bound within the letterbox cavity, with
neither of the two compounds able to penetrate the funnel-shaped access tunnel to
the heme (the closest distances to the heme iron were at 12.9 Å and 9.3 Å for

89
androstenedione and econazole, respectively) (McLean et al., 2009).
Androstenedione lacks the aliphatic side chain found in cholesterol and hence
exhibited a binding mode that is not consistent with P450 oxidation (McLean et al.,
2009). This as a result of the narrow nature of the active site, which clearly prevents
the steroid molecule from reaching the heme iron directly (McLean et al., 2009).
However, the androstenedione steroid ring nucleus does occupy the space that
would naturally be occupied by the cholesterol steroid nucleus. Minimal
conformational changes in the P450 were observed upon the binding of
androstenedione and econazole ligands to CYP125A1 (McLean et al., 2009).
The crystal structures of CYP125A1 in complex with sterols reveal substantial
lipophilic interactions with the steroid ring nucleus which help to fix the substrate’s
binding mode and to position the aliphatic side-chain at the correct distance from
the heme iron for its C27-oxidation (Johnston et al., 2012). Cholest-4-en-3-one
(cholestenone) binding to CYP125A1 resulted in conformational changes which are
largely due to repositioning of the N-terminal portion of the I-helix and the H-helix
to envelop the substrate in the active site (Ouellet et al., 2010a). Furthermore, the
N-terminal portion of the I-helix bends to make hydrophobic contacts with the
cholestenone molecule. These conformational changes produced a r.m.s.d of 0.78 Å
between the substrate-free and substrate-bound structures (Ouellet et al., 2010a).

90
Figure 1.23: Structural features of Mtb CYP125A1 in complex with diverse substrates and inhibitor molecules. A: solvent-accessible surface of CYP125A1 (PDB code 2XN8). The colour coding shows the helices in cyan, the sheets in magenta and the loops in pink. The arrow indicates the narrow access site entry for CYP125A1 which can be readily identified by the direct view onto the heme cofactor in red spacefill (McLean et al., 2009). B: cholestenone-bound CYP125A1 (PDB code 2X5W). Cholest-4-en-3-one aligns in the active-site channel with the aliphatic side chain facing the distal surface of the heme cofactor at the C27 position (Ouellet et al., 2010a). C: androstenedione-bound CYP125A1 (PDB code 3IW1). The ligand is in blue-coloured sticks. The image shows a binding mode for androstenedione which is not compatible with P450 oxidation due to absence of the alkyl side chain found in cholestenone (McLean et al., 2009). D: econazole-bound CYP125A1 (PDB code 3IW2). The ligand is in magenta-coloured sticks. The picture shows the binding mode for econazole, which is prevented from migration into the active site by steric constraints due to active site narrowing near the heme, with no heme ligation occurring (McLean et al., 2009). Structures were drawn using PyMol (DeLano, 2002).

91
1.5.2.2 CYP142A1 (Rv3518c): Functional Redundancy
Recent studies revealed a functional redundancy in cholesterol oxidation capacity in
the Mtb H37Rv strain (but not in M. bovis BCG) and further highlighted that a
compensatory mechanism can overcome absence of CYP125A1 in this bacterium
(following inactivation of the CYP125A1 gene) to aid growth on cholesterol (Capyk
et al., 2009). Hence it is worth noting that another P450 gene (CYP142A1, Rv3518c)
is located in the cholesterol gene cluster of Mtb. (Driscoll et al., 2010). In research
carried out by Capyk and co-workers, it was evident that though M. bovis BCG grew
on cholesterol, the M. bovis BCG CYP125 deletion strain did not show any growth,
unless complemented by another CYP125 gene copy (Capyk et al., 2009). However,
the CYP125 deletion strain of Mtb H37Rv still grew on cholesterol, suggesting a
compensatory mechanism in cholesterol 27-hydroxylase activity in this strain
Driscoll et al., 2010). Studies showed that a ∆CYP125 Mtb CDC1551 strain
accumulated cholest-4-en-3-one that was toxic to the cells, suggesting that, in Mtb
CDC1551, CYP125 plays a key role in detoxification of cholest-4-en-3-one by 27-
hydroxylation, leading to its degradation (Capyk et al., 2009). To probe further into
the mystery behind the inability of the M. bovis BCG ∆CYP125 strain to grow on
cholesterol (and the ability of the ∆CYP125A1 Mtb H37Rv strains to grow on
cholesterol), Driscoll et al. noted that Mtb H37Rv had another CYP gene in the
cholesterol operon (but outside the igr region) and hence suggested that CYP142A1
(the Rv3518c gene product) might also metabolize cholesterol/cholest-4-en-3-one,
or catabolize products from these molecules. Results generated from the studies
identified CYP142A1 as a second cholesterol 27-hydroxylase and a possible
92
complementary enzyme in the absence of CYP125A1 (Driscoll et al., 2010). A recent
study has suggested that CYP142A1 may play a key role during Mtb infection by
making extra reservoirs of esterified intracellular cholesterol in the host more
accessible to the pathogen than would ordinarily be available for energy generation
(Frank et al., 2014). The results from this study demonstrated that CYP142A2 from
M. smegmatis (the soil-dwelling counterpart of Mtb) metabolises cholesteryl sulfate
and cholesteryl propionate, whereas CYP125 enzymes metabolise cholesteryl
sulfate at a much slower rate and do not significantly oxidize cholesteryl propionate
(Frank et al., 2014). The crystal structure of CYP142A2 complexed with cholesteryl
sulfate revealed the substrate in a conformation similar to that of the 4-cholesten-
3-one-bound structure solved previously, with the bulky sulfate group projecting
out toward the solvent (Garcia-Fernandez et al., 2013, Frank et al., 2014) (Fig. 4A).
The crystal structure of the ligand-free CYP142A1 has also been solved at a
resolution of 1.6 Å, with the overall fold highly similar to that of Mtb CYP124A1 and
CYP125A1, which also hydroxylate cholesterol and cholestenone (Driscoll et al.,
2010). The active site topologies of CYP142A1 and CYP125A1 are similar, with a
letterbox-shaped entry-exit channel formed by the FG-loop, the BC-loop and the I-
helix N-terminal region. Their active site channel is lined by mainly hydrophobic
residues which curve upwards away from the heme cofactor (Driscoll et al., 2010).
In contrast, the CYP124A1 entry-exit channel is located perpendicular to the heme
and is formed by the FG- and BC-loops in addition to the β1-β2-loop domain
(Driscoll et al., 2010). This may be consistent with the recent suggestion that
CYP142A1 does not oxidize fatty acids or methyl branched lipids, but rather is
involved in the metabolism of the cholesterol side chain (McLean et al., 2010).
93
In Mtb, CYP142A1 appears to serve only (or mainly) as a “back-up” for CYP125A1 in
the side-chain degradation of host cholesterol, while in a ∆CYP125-∆CYP142 mutant
of M. smegmatis, the cholesterol metabolizing property is retained. These findings
suggest the presence of another source of redundancy within the M. smegmatis
genome (Garcia-Fernandez et al., 2013). Studies had earlier revealed that an
unusually high number of CYPs (e.g. 20 CYPs in Mtb H37Rv, 29 CYPs in Rhodococcus
jostii RHA1 and 40 CYPs in M. smegmatis) are found in actinobacterial genomes,
compared to Escherichia coli which has a similar genomic size with Mtb, for
example, and yet possesses no P450 enzymes (Hudson et al., 2012a, Garcia-
Fernandez et al., 2013, Ouellet et al., 2010a). In line with the above facts, M.
smegmatis possesses more CYPs than Mtb H37Rv (Garcia-Fernandez et al., 2013).
Hence an alternative cholesterol catabolic pathway or enzyme encoded within the
M. smegmatis genome could be responsible and one possible suggestion is the
cytochrome P450 encoded by the MSMEG_4829 gene (CYP189A1) (Garcia-
Fernandez et al., 2013). CYP189A1 was shown to be upregulated in both wild-type
and mutant strains of M. smegmatis grown on cholesterol, but it does not have an
orthologue in Mtb (Garcia-Fernandez et al., 2013). However, studies are ongoing to
further characterize this enzyme and the putative role it plays in cholesterol
metabolism. This research could give more insights into the differences in the
cholesterol catabolic pathways between Mtb and M. smegmatis (Garcia-Fernandez
et al., 2013).
CYP142A1 exists in a low-spin resting state with a Soret peak at 418 nm, and hence
differs from CYP125A1 which is typically isolated in an extensively high-spin state

94
(Soret peak at 393 nm). This high-spin state appear to result from the side chain
conformation of the Val-267 in CYP125A1 and the effect that this has on the water
molecule which serves as the sixth axial ligand to the CYP125A1 heme iron (McLean
et al., 2009, Driscoll et al., 2010).
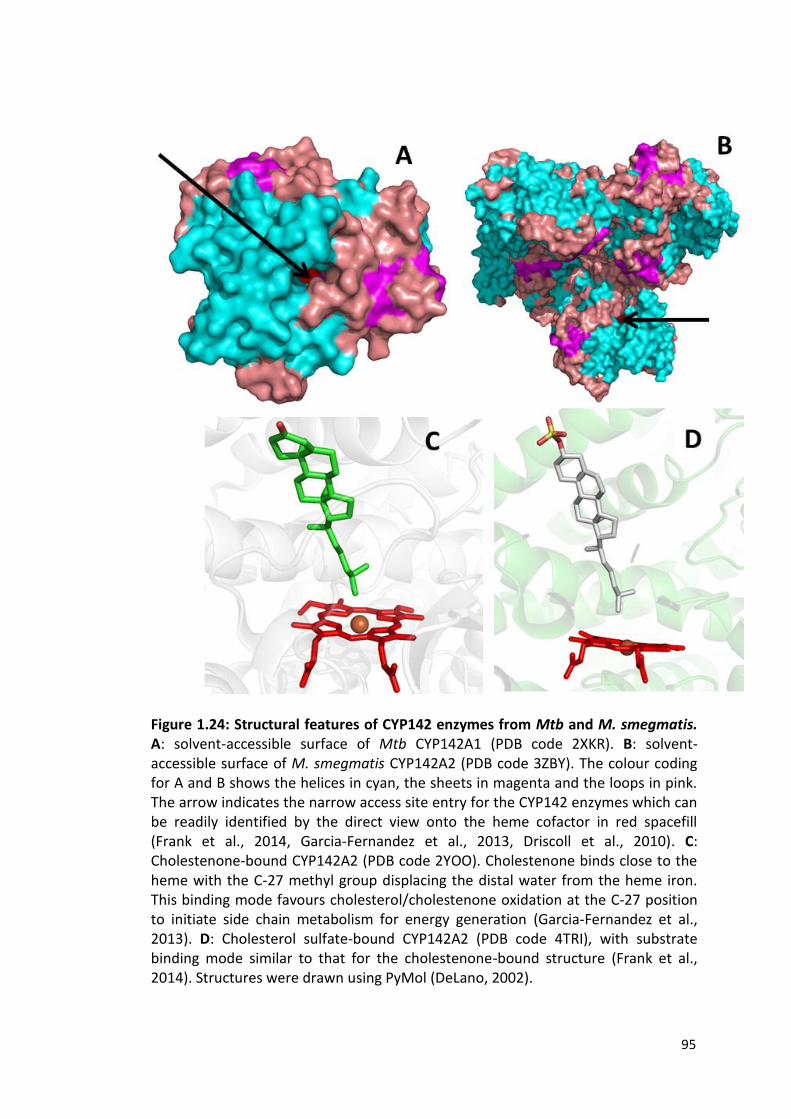
95
Figure 1.24: Structural features of CYP142 enzymes from Mtb and M. smegmatis. A: solvent-accessible surface of Mtb CYP142A1 (PDB code 2XKR). B: solvent-accessible surface of M. smegmatis CYP142A2 (PDB code 3ZBY). The colour coding for A and B shows the helices in cyan, the sheets in magenta and the loops in pink. The arrow indicates the narrow access site entry for the CYP142 enzymes which can be readily identified by the direct view onto the heme cofactor in red spacefill (Frank et al., 2014, Garcia-Fernandez et al., 2013, Driscoll et al., 2010). C: Cholestenone-bound CYP142A2 (PDB code 2YOO). Cholestenone binds close to the heme with the C-27 methyl group displacing the distal water from the heme iron. This binding mode favours cholesterol/cholestenone oxidation at the C-27 position to initiate side chain metabolism for energy generation (Garcia-Fernandez et al., 2013). D: Cholesterol sulfate-bound CYP142A2 (PDB code 4TRI), with substrate binding mode similar to that for the cholestenone-bound structure (Frank et al., 2014). Structures were drawn using PyMol (DeLano, 2002).

96
1.5.2.3 CYP124A1 (Rv2266): A Methyl-Branched Lipid-
Hydroxylase
CYP124 P450s are found in an array of microorganisms, including actinobacteria,
some proteobacteria as well as pathogenic and non-pathogenic mycobacterial
species (Ouellet et al., 2010b, Johnston et al., 2009). This wide occurrence of
CYP124 genes is indicative of an important physiological role (Johnston et al., 2009).
Mtb CYP124A1 is found in a gene cluster containing a sulfotransferase (Sft3 encode
by Rv2267c) that plays a key role in a 3'-phosphoadenosine 5'-phosphosulfate
(PAPS)-dependent sulfation of menaquinone MK-9 DH-2 at the omega-position
(Johnston et al., 2009, Holsclaw et al., 2008, Mougous et al., 2006). The gene
location for CYP124A1 is in the same chromosomal region as those for CYP128A1
(Rv2268c) and CYP121A1 (Rv2276) (McLean et al., 2010). The sulfated product of
menaquinone MK-9 DH-2 (referred to as “S881”) is found in the cell membrane of
Mtb, where it was shown to be involved in virulence in Mtb-infected mice
(Mougous et al., 2006). Recent work has shown that CYP124A1 metabolises a wide
range of substrates with similar chemical structures to menaquinone MK-9 DH-2
(i.e. compounds with repeating methyl branching) (Johnston et al., 2009). The
CYP124A1 reaction involves a hydroxylation reaction at the omega position, with a
significant preference for methyl-branched lipids (Johnston et al., 2009). CYP124A1
binds a range of methyl branched fatty acids (e.g. phytanic acid) with high affinity
and catalyses their hydroxylation at the omega-position (Figure 1.25) (Johnston et
al., 2009). Comparing with the other 20 Mtb P450s, it is evident that CYP125A1 has
the closest similarity to CYP124A1 (38%), followed by CYP126A1 (34%).

97
The crystal structures of Mtb CYP124A1 have been solved in both the ligand-free
and phytanic acid-bound forms (Figure 1.26) (Johnston et al., 2009). The crystal
structure of CYP124A1 in complex with phytanic acid helps reveal the mechanism
by which the active site enables an unfavourable regioselectivity of substrate
oxidation (Johnston et al., 2009). A small hydrophobic space located near the heme
cofactor binds one of the terminal methyl groups such that the other is aligned
close to the heme iron for oxidation (Johnston et al., 2009). As described above,
recent studies have identified CYP124A1, CYP142A1 and CYP125A1 as involved in
the successive oxidations of the aliphatic side chain of cholesterol/cholest-4-en-3-
one at the C-27 position to the alcohol, aldehyde and then the carboxylic acid
(Johnston et al., 2010) (Figure 1.22). Recent studies by Johnston et al have revealed
that all the three P450 isoforms oxidize cholest-4-en-3-one side chain completely to
the carboxylic acid, which is a prerequisite for entry into the β-oxidation pathway
(Johnston et al., 2010). However, out of three isoforms, CYP125A1 is the most
efficient catalyst, followed by CYP142A1 and lastly CYP124A1 (Johnston et al.,
2010).

98
Figure 1.25: CYP124A1 catalyses the -hydroxylation of phytanic acid and other methyl-branched lipids. Image redrawn from (McLean et al., 2010) using chemdraw (Mills, 2006).
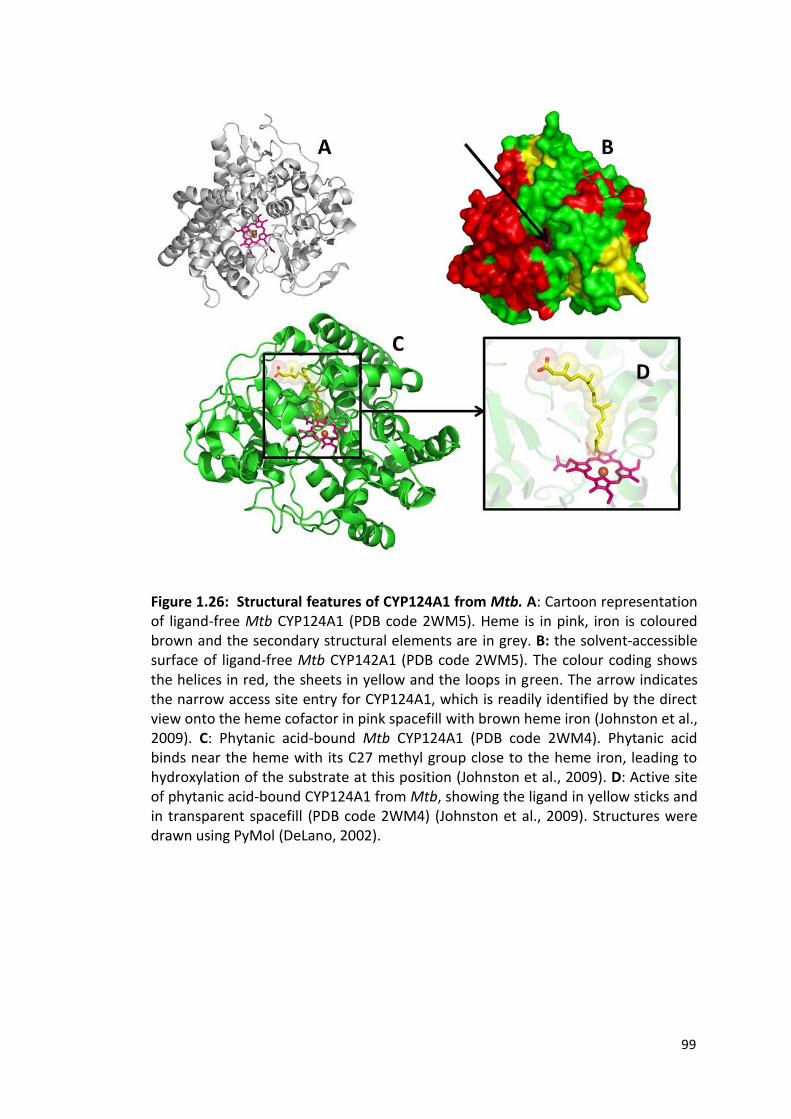
99
Figure 1.26: Structural features of CYP124A1 from Mtb. A: Cartoon representation of ligand-free Mtb CYP124A1 (PDB code 2WM5). Heme is in pink, iron is coloured brown and the secondary structural elements are in grey. B: the solvent-accessible surface of ligand-free Mtb CYP142A1 (PDB code 2WM5). The colour coding shows the helices in red, the sheets in yellow and the loops in green. The arrow indicates the narrow access site entry for CYP124A1, which is readily identified by the direct view onto the heme cofactor in pink spacefill with brown heme iron (Johnston et al., 2009). C: Phytanic acid-bound Mtb CYP124A1 (PDB code 2WM4). Phytanic acid binds near the heme with its C27 methyl group close to the heme iron, leading to hydroxylation of the substrate at this position (Johnston et al., 2009). D: Active site of phytanic acid-bound CYP124A1 from Mtb, showing the ligand in yellow sticks and in transparent spacefill (PDB code 2WM4) (Johnston et al., 2009). Structures were drawn using PyMol (DeLano, 2002).

100
1.5.2.4 Cholesterol Catabolism: A Promising Drug Target in Mycobacterium tuberculosis
Figure 1.27: Cholesterol catabolic pathway. The aliphatic tail of cholesterol is metabolized to the acid by the cholesterol oxidizing P450s and channelled to β-oxidation for energy generation. Sterol ring degration occurs simultaneously with carbon atoms derived from the ring nucleus converted to CO2 via the tricarboxylic acid cycle (TCA), whereas the propionyl-CoA produced from the degradation of the side chain is channelled into mycobacterial lipids, including the virulence factor PDIM. Figure adapted from Ouellet et al., 2011. Even though Mtb, like most bacteria, does not synthesize its own sterols, studies
have revealed that cholesterol is essential for infection of macrophages and for
survival in the latent phase of infection (Ouellet et al., 2011). The inability of Mtb to
make sterols is due to the absence of squalene monooxygenase and oxidosqualene
cyclase, enzymes essential for sterol biosynthesis. Mtb, however, persists in the
101
harsh environment of macrophages in the human lung by utilization of host
cholesterol as a sole source of carbon and energy (Ouellet et al., 2011). Studies have
revealed that high levels of cholesterol in the diet can increase the bio-load of Mtb
in the human lung significantly, which could overwhelm the host defence
mechanisms leading to impaired immunity to the bacterium (Koul et al., 2004, Kim
et al., 2010, Schafer et al., 2009, Martens et al., 2008). Cholesterol is essential for
the phagocytosis of Mtb into macrophages, and Mtb enters the phagocytic cells via
cholesterol-rich membrane microdomains. Furthermore, the bacterium utilises
cholesterol to maintain the host protein coronin 1 (TACO or tryptophan-aspartate-
containing coat protein) on Mtb-infected phagosomes, and this inhibits
phagosome–lysosome fusion (Gatfield and Pieters, 2000, Munoz et al., 2009).
The mechanism by which Mtb takes up host cholesterol is poorly understood.
However, an ABC-like transport system, mce4, that is involved in cholesterol import
into the bacterium was discovered recently (Pandey and Sassetti, 2008). The growth
of mce4 gene deletion strains of Mtb was impaired when cholesterol was utilized as
the primary source of carbon (Pandey and Sassetti, 2008, Ouellet et al., 2011). Using
radio-labelled cholesterol derivatives, it was unambiguously shown that cholesterol
is metabolised by Mtb, with the carbon atoms from the sterol backbone and the
aliphatic side chain channelled to energy generation and lipid synthesis, respectively
(Figure 1.27)(Pandey and Sassetti, 2008, Ouellet et al., 2011). Furthermore, Yang et
al. demonstrated that cholesterol degradation in Mtb elevates the average mass of
the lipid virulence factor phthiocerol dimycocerosate (PDIM), which results from the
102
higher metabolic flux of propionate derived from cholesterol breakdown (Yang et
al., 2009).
In addition to the above, the blockage of cholesterol import in mce4 gene deletion
strains of Mtb significantly reduced Mtb virulence in both activated macrophages
and in a mouse model of infection, further validating the important role of
cholesterol metabolism in chronic infection (Pandey and Sassetti, 2008). Screening
of a transposon mutant library revealed another locus, igr, which is important for
Mtb growth in activated macrophages (Chang et al., 2007). The igr gene locus
comprises six genes, including a cytochrome P450 (CYP125A1), two acyl-CoA
dehydrogenases (fadE28 and fadE29), two conserved hypothetical proteins
(Rv3541c and Rv3542c) and a putative lipid carrier protein (ltp2) (Ouellet et al.,
2011).
Inactivation of the whole igr operon in a subsequent study revealed a pronounced
effect on growth on cholesterol alone or in combination with glycerol, signifying
some level of cell intoxication by cholesterol or its metabolites (Chang et al., 2009).
The mce4 operon is also found in many other actinobacterial species, including
Rhodococcus jostii, M. smegmatis and M. bovis BCG, and these bacteria have also
been shown to utilize cholesterol for growth (Van der Geize et al., 2007, Mohn et
al., 2008, Av-Gay and Sobouti, 2000). Hence, research to date indicates that
cholesterol utilisation by the Mtb bacterium is important for bacterial infectivity
and persistence, and the cholesterol degradation pathway could provide important
therapeutic targets for the development of new anti-tubercular agents (Ouellet et

103
al., 2011). As described above, it seems highly likely that targeting cholesterol
catabolism (and the P450 enzymes involved) in persistent/latent bacteria could hold
the key to a major breakthrough in anti-TB therapy (McLean et al., 2010).
1.5.3. CYP51B1: The First Member of the CYP51 Family Identified in Prokaryotes
The 14α-sterol demethylases (CYP51s) are eukaryotic cytochromes P450 that
catalyse the removal of the 14α-methyl group from lanosterol, 24-methylene
dihydrolanosterol and obtusifoliol in the manufacture of cholesterol, ergosterol and
phytosterols in animals, fungi and plants, respectively (Noshiro et al., 1997, Monk et
al., 2014). Sterol 14α-demethylases have been discovered in plants (e.g. Sorghum
bicolor) and in a large number of eukaryotes, and by the year 2000 the orthologous
nature of a CYP51-like gene from Mtb to the eukaryotic CYP51s was confirmed,
signalling the first potential sterol demethylase in a bacterial genome (Aoyama et
al., 1998, Bellamine et al., 1999, McLean et al., 2010). This was a major
breakthrough given that the fungal CYP51 enzymes (e.g. in Aspergillus spp. and in
Candida albicans) are important drug target enzymes known to be inactivated by
azole-based drugs such as econazole, clotrimazole and ketoconazole (McLean et al.,
2010).
The sterol 14α-demethylase (CYP51) family is the only CYP gene family of P450s
which is widely distributed in different biological kingdoms, being found in animals,
plants, fungi, yeast, lower eukaryotes and bacteria (Noshiro et al., 1997, Lepesheva
and Waterman, 2004, Monk et al., 2014) and is widely considered to be the most
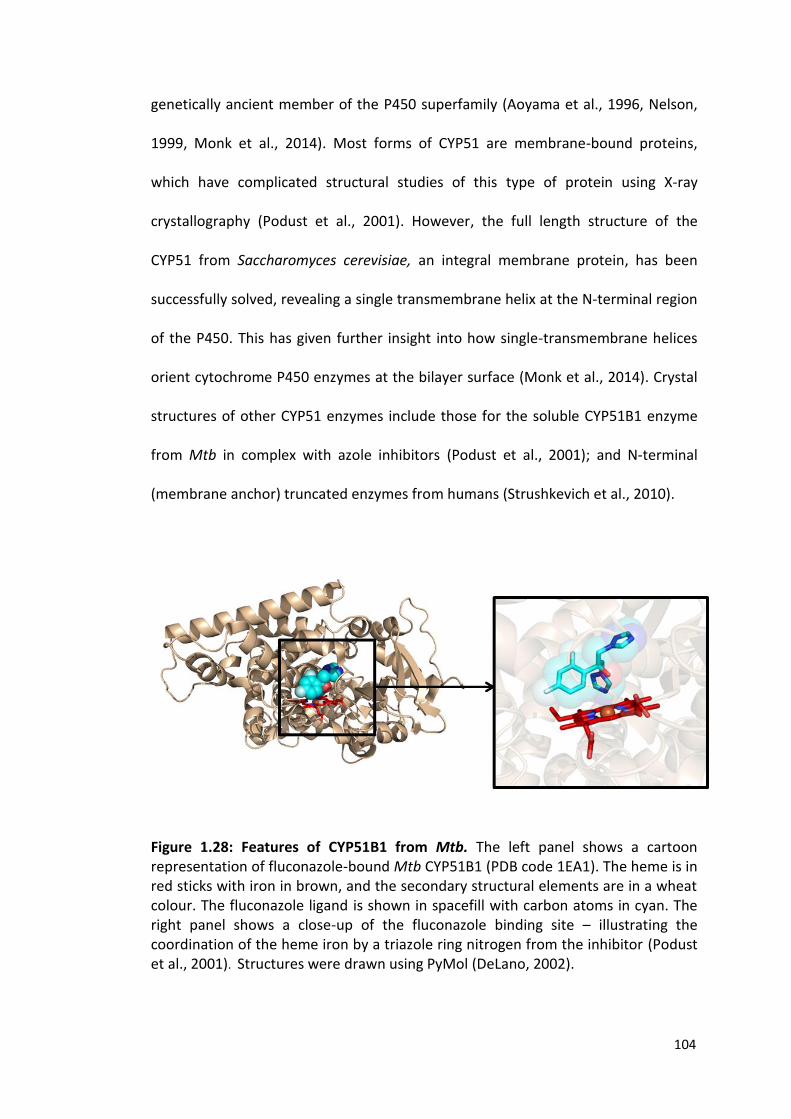
104
genetically ancient member of the P450 superfamily (Aoyama et al., 1996, Nelson,
1999, Monk et al., 2014). Most forms of CYP51 are membrane-bound proteins,
which have complicated structural studies of this type of protein using X-ray
crystallography (Podust et al., 2001). However, the full length structure of the
CYP51 from Saccharomyces cerevisiae, an integral membrane protein, has been
successfully solved, revealing a single transmembrane helix at the N-terminal region
of the P450. This has given further insight into how single-transmembrane helices
orient cytochrome P450 enzymes at the bilayer surface (Monk et al., 2014). Crystal
structures of other CYP51 enzymes include those for the soluble CYP51B1 enzyme
from Mtb in complex with azole inhibitors (Podust et al., 2001); and N-terminal
(membrane anchor) truncated enzymes from humans (Strushkevich et al., 2010).
Figure 1.28: Features of CYP51B1 from Mtb. The left panel shows a cartoon representation of fluconazole-bound Mtb CYP51B1 (PDB code 1EA1). The heme is in red sticks with iron in brown, and the secondary structural elements are in a wheat colour. The fluconazole ligand is shown in spacefill with carbon atoms in cyan. The right panel shows a close-up of the fluconazole binding site – illustrating the coordination of the heme iron by a triazole ring nitrogen from the inhibitor (Podust et al., 2001). Structures were drawn using PyMol (DeLano, 2002).
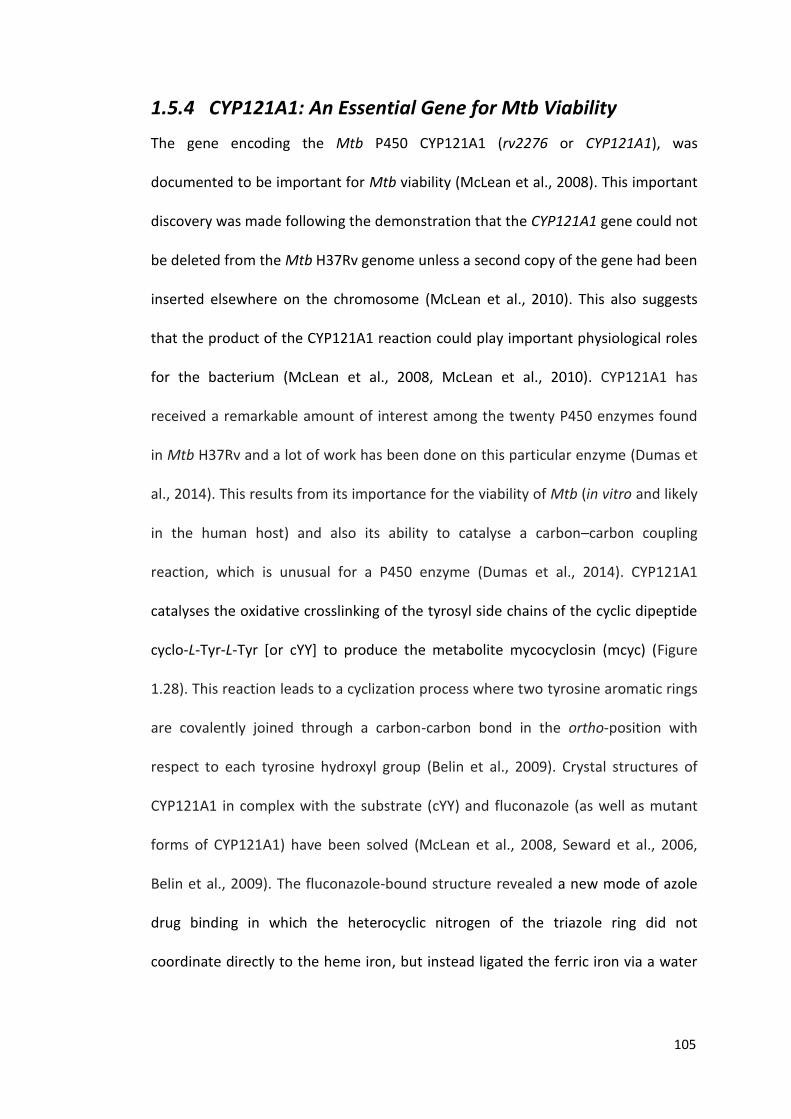
105
1.5.4 CYP121A1: An Essential Gene for Mtb Viability
The gene encoding the Mtb P450 CYP121A1 (rv2276 or CYP121A1), was
documented to be important for Mtb viability (McLean et al., 2008). This important
discovery was made following the demonstration that the CYP121A1 gene could not
be deleted from the Mtb H37Rv genome unless a second copy of the gene had been
inserted elsewhere on the chromosome (McLean et al., 2010). This also suggests
that the product of the CYP121A1 reaction could play important physiological roles
for the bacterium (McLean et al., 2008, McLean et al., 2010). CYP121A1 has
received a remarkable amount of interest among the twenty P450 enzymes found
in Mtb H37Rv and a lot of work has been done on this particular enzyme (Dumas et
al., 2014). This results from its importance for the viability of Mtb (in vitro and likely
in the human host) and also its ability to catalyse a carbon–carbon coupling
reaction, which is unusual for a P450 enzyme (Dumas et al., 2014). CYP121A1
catalyses the oxidative crosslinking of the tyrosyl side chains of the cyclic dipeptide
cyclo-L-Tyr-L-Tyr [or cYY] to produce the metabolite mycocyclosin (mcyc) (Figure
1.28). This reaction leads to a cyclization process where two tyrosine aromatic rings
are covalently joined through a carbon-carbon bond in the ortho-position with
respect to each tyrosine hydroxyl group (Belin et al., 2009). Crystal structures of
CYP121A1 in complex with the substrate (cYY) and fluconazole (as well as mutant
forms of CYP121A1) have been solved (McLean et al., 2008, Seward et al., 2006,
Belin et al., 2009). The fluconazole-bound structure revealed a new mode of azole
drug binding in which the heterocyclic nitrogen of the triazole ring did not
coordinate directly to the heme iron, but instead ligated the ferric iron via a water
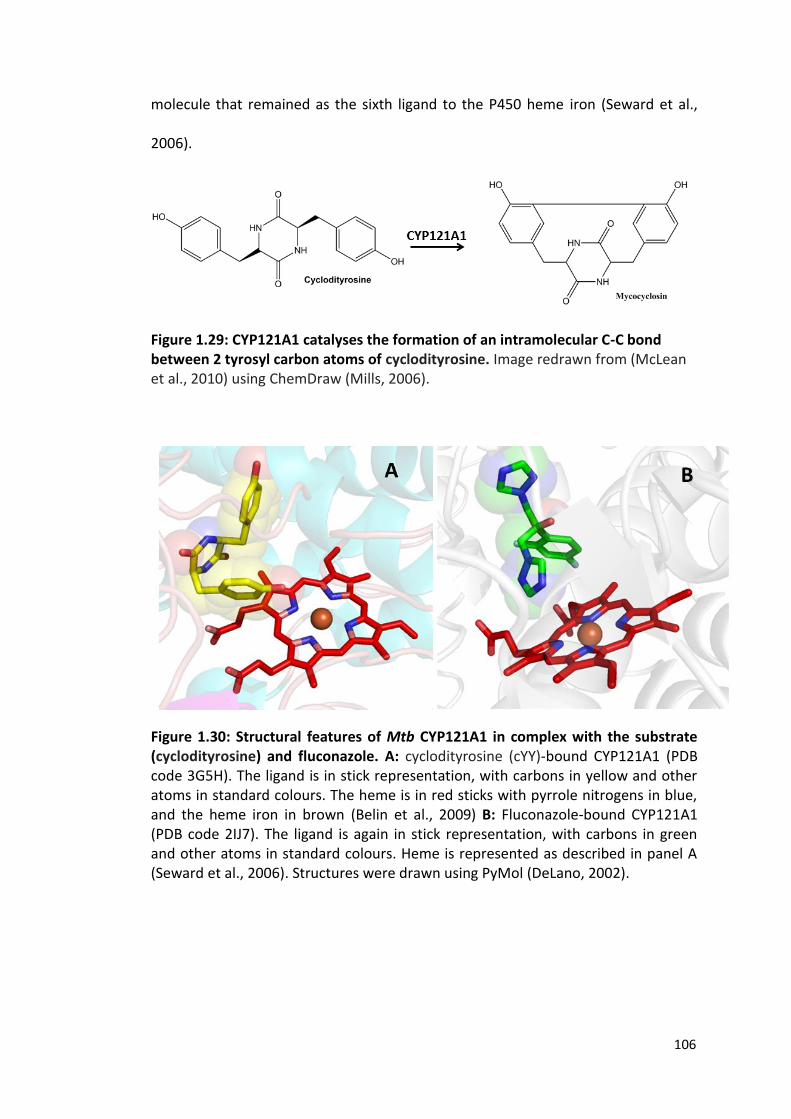
106
molecule that remained as the sixth ligand to the P450 heme iron (Seward et al.,
2006).
Figure 1.29: CYP121A1 catalyses the formation of an intramolecular C-C bond between 2 tyrosyl carbon atoms of cyclodityrosine. Image redrawn from (McLean et al., 2010) using ChemDraw (Mills, 2006).
Figure 1.30: Structural features of Mtb CYP121A1 in complex with the substrate (cyclodityrosine) and fluconazole. A: cyclodityrosine (cYY)-bound CYP121A1 (PDB code 3G5H). The ligand is in stick representation, with carbons in yellow and other atoms in standard colours. The heme is in red sticks with pyrrole nitrogens in blue, and the heme iron in brown (Belin et al., 2009) B: Fluconazole-bound CYP121A1 (PDB code 2IJ7). The ligand is again in stick representation, with carbons in green and other atoms in standard colours. Heme is represented as described in panel A (Seward et al., 2006). Structures were drawn using PyMol (DeLano, 2002).
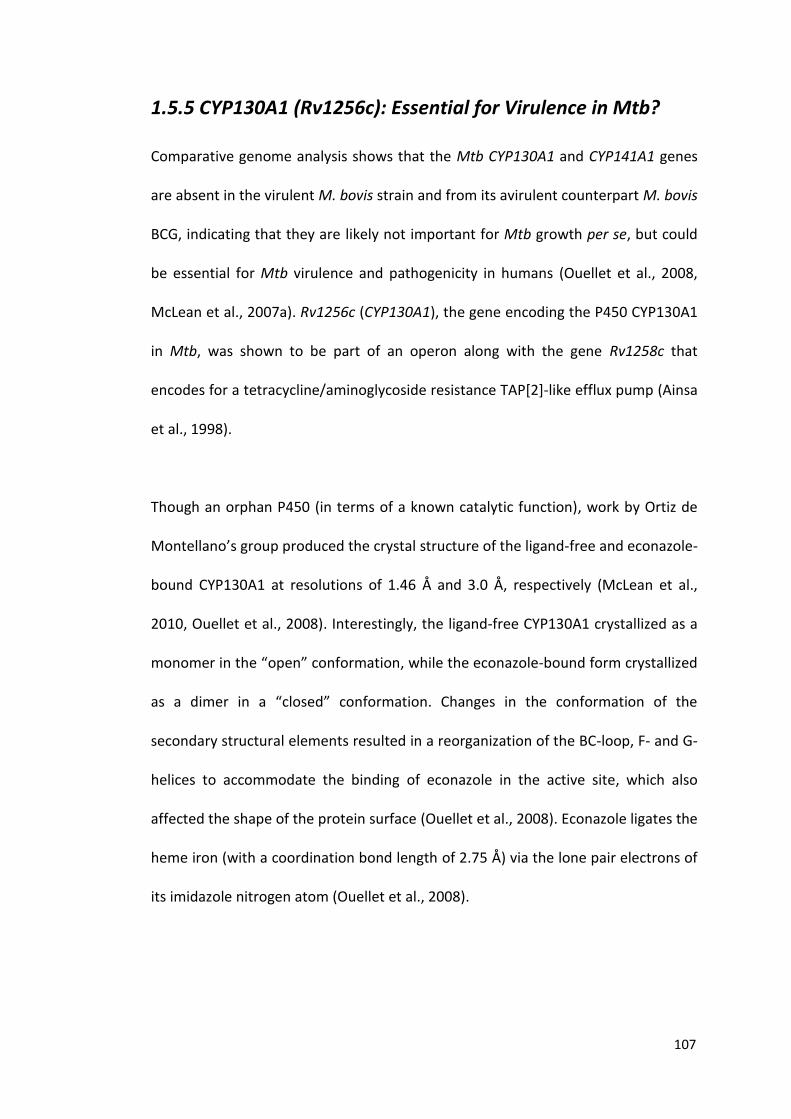
107
1.5.5 CYP130A1 (Rv1256c): Essential for Virulence in Mtb?
Comparative genome analysis shows that the Mtb CYP130A1 and CYP141A1 genes
are absent in the virulent M. bovis strain and from its avirulent counterpart M. bovis
BCG, indicating that they are likely not important for Mtb growth per se, but could
be essential for Mtb virulence and pathogenicity in humans (Ouellet et al., 2008,
McLean et al., 2007a). Rv1256c (CYP130A1), the gene encoding the P450 CYP130A1
in Mtb, was shown to be part of an operon along with the gene Rv1258c that
encodes for a tetracycline/aminoglycoside resistance TAP[2]-like efflux pump (Ainsa
et al., 1998).
Though an orphan P450 (in terms of a known catalytic function), work by Ortiz de
Montellano’s group produced the crystal structure of the ligand-free and econazole-
bound CYP130A1 at resolutions of 1.46 Å and 3.0 Å, respectively (McLean et al.,
2010, Ouellet et al., 2008). Interestingly, the ligand-free CYP130A1 crystallized as a
monomer in the “open” conformation, while the econazole-bound form crystallized
as a dimer in a “closed” conformation. Changes in the conformation of the
secondary structural elements resulted in a reorganization of the BC-loop, F- and G-
helices to accommodate the binding of econazole in the active site, which also
affected the shape of the protein surface (Ouellet et al., 2008). Econazole ligates the
heme iron (with a coordination bond length of 2.75 Å) via the lone pair electrons of
its imidazole nitrogen atom (Ouellet et al., 2008).

108
Figure 1.31: Crystal structures of ligand-free and econazole-bound CYP130A1. A: Features of the econazole-bound CYP130A1 dimer, revealing a “closed” conformation (PDB code 2UVN). Secondary structure elements are in wheat colour, heme is in red and econazole is in green sticks and spheres. B: monomeric features of the ligand-free CYP130A1 revealing an “open” conformation (PDB code 2UUQ) (Ouellet et al., 2008). Structures were drawn using PyMol (DeLano, 2002).
1.5.6 CYP126A1 (Rv0778)
CYP126A1 (encoded by Mtb H37Rv gene rv0778) is located adjacent to important
Mtb genes that encode enzymes involved in purine synthesis, and CYP126A1 is also
part of a gene cluster encoding the adenylosuccinate lyase, PurB (Lew et al., 2011).
However, CYP126A1 also shares about 35% identity with the Mtb cholesterol
hydroxylases CYP124A1 and CYP125A1, and it is highly conserved across both
pathogenic and non-pathogenic strains of actinobacteria, which suggests important
physiological roles that are still unknown (Ouellet et al., 2010b, Hudson et al.,
2014). Recent studies to predict the functional role of CYP126A1 have involved the
use of a novel fragment based screening approach, which is a method for
109
identifying and designing small-molecule ligands as chemical tools and leads for
drug development (Anand et al., 2011, Hudson et al., 2014). Interestingly, the
fragment screening hit rate against CYP126A1 (14%) was significantly higher than
those observed for Mtb CYP121A1 and CYP125A1 (which were only 4% and 1%,
respectively) (Hudson et al., 2012b, Hudson et al., 2013).
1.5.7 CYP128A1: An Essential Enzyme with a Role in
Hydroxylation of Respiratory Menaquinone Mtb synthesizes a wide range of lipids, some of which are involved in immune
response modulation within infected individuals, while others envelop the organism
within a thick and resilient physical barrier (Gokhale et al., 2007, Brennan and Crick,
2007, Schelle and Bertozzi, 2006, Onwueme et al., 2005). Research carried out by
Bertozzi’s group identified several sulfotransferases within the Mtb genome (Schelle
and Bertozzi, 2006, Mougous et al., 2002). S881 is a sulfated metabolite that was
found to be located on the outer cell wall of the bacterium, where it acts as a
negative regulator of virulence in the mouse model of tuberculosis (Mougous et al.,
2006, ten Bokum et al., 2008). It was also revealed that the biosynthesis of S881 is
dependent on the PAPS (3′-phosphoadenosine 5′-phosphosulfate)-dependent
sulfotransferase Stf3 (encoded by Rv2267c) (Mougous et al., 2006, Holsclaw et al.,
2008), which is located in a three gene operon containing CYP128A1 (Holsclaw et
al., 2008, Cole et al., 1998). Subsequently, Holsclaw and co-workers elucidated the
structure of S881 (Figure 1.31), revealing it to be a menaquinone-like molecule (MK-
9 DH-2) containing a linear chain consisting of nine isoprenoid units appended to a
naphthoquinone ring (Ouellet et al., 2010b). Menaquinone is a molecule that was

110
shown to be the major quinol electron carrier in Mtb respiration (McLean et al.,
2010). This then led to a biosynthetic scheme which suggested that CYP128A1 first
hydroxylates the terminal isoprene unit of MK-9 (DH-2) and hence activates it for
nucleophilic PAPS-dependent sulfation (Ouellet et al., 2010b). Sulfation of
menaquinone is suggested to play a key role in Mtb virulence regulation (Holsclaw
et al., 2008) (Figure 1.31).
Attempts to produce CYP128A1 in a soluble form to enable its characterization have
proven unsuccessful to date, even though high levels of its expression have been
reported in E. coli (Ouellet et al., 2010b, McLean et al., 2010). Due to the
hydrophobic nature of its quinol substrate, it was suggested that CYP128A1 could
be associated with the membrane to access this molecule, and hence detergent
solubilization of CYP128A1 may be helpful to enable biochemical characterization of
this P450 and to confirm its physiological role (McLean et al., 2010).
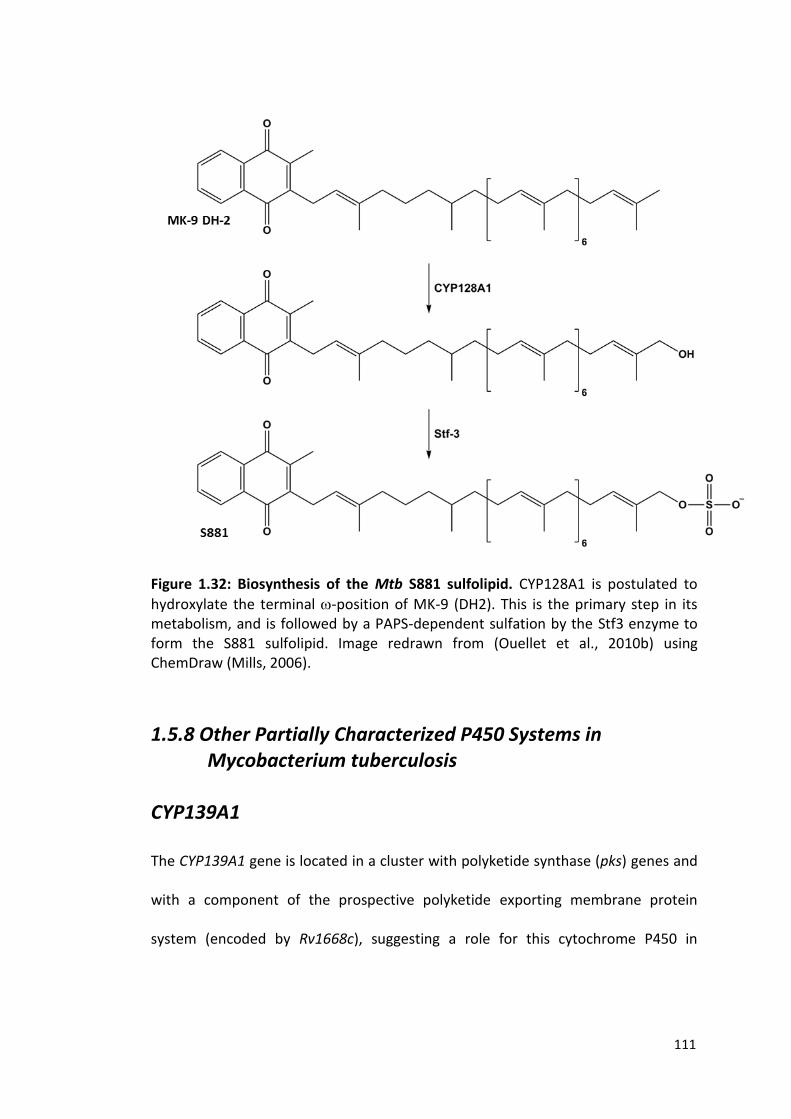
111
Figure 1.32: Biosynthesis of the Mtb S881 sulfolipid. CYP128A1 is postulated to
hydroxylate the terminal -position of MK-9 (DH2). This is the primary step in its metabolism, and is followed by a PAPS-dependent sulfation by the Stf3 enzyme to form the S881 sulfolipid. Image redrawn from (Ouellet et al., 2010b) using ChemDraw (Mills, 2006).
1.5.8 Other Partially Characterized P450 Systems in Mycobacterium tuberculosis
CYP139A1
The CYP139A1 gene is located in a cluster with polyketide synthase (pks) genes and
with a component of the prospective polyketide exporting membrane protein
system (encoded by Rv1668c), suggesting a role for this cytochrome P450 in

112
polyketide metabolism. However, the structure and function of this P450 remain
unknown (McLean et al., 2010).
CYP132A1
CYP132A1 has significant protein sequence similarity to members of a well
characterized cytochrome P450 family (the CYP4 fatty acid oxidases). This similarity
has helped researchers to postulate CYP132A1’s probable function. Presently, there
is no documentation of the characterization of CYP132A1, even though the
CYP132A1 gene was reported as a major target of gene induction for the AraC-type
transcriptional regulator (product of gene Rv1395), which is encoded by a gene
adjacent to CYP132A1 on the chromosome. This suggests a physiological role for
CYP132A1 in bacterial virulence (Recchi et al., 2003). Nevertheless, CYP132A1’s
function and any role in Mtb infectivity or pathogenesis remain to be defined
(McLean et al., 2010).
CYP123A1
CYP123A1 (encoded by the Mtb H37Rv Rv0766c gene) is documented to be highly
conserved among actinobacteria and proteobacteria, and the CYP123A1 gene was
shown to be up-regulated in Mtb at high temperatures (Stewart et al., 2002).
However, other studies also showed CYP123A1 to be down-regulated in a PhoPR
two-component system mutant strain of Mtb (Walters et al., 2006). The PhoPR two-
component system is essential for Mtb virulence. It is a positive transcriptional
113
regulator of genes associated with the synthesis of components in the Mtb cell
envelope (Walters et al., 2006). It is postulated that when Mtb encounters the
harsh environment of the human lung, PhoPR plays an important role in cell
envelope remodelling and also enables Mtb to switch to alternative metabolic
pathways involved in lipid metabolism or synthesis. This enables the bacterium to
successfully persist and survive in the infected host (Walters et al., 2006).
CYP138A1 and CYP141A1
Research has shown that the Mtb CYP141A1 and CYP138A1 genes are up-regulated
following a brief (about 2 h) exposure to lung surfactant, indicating a possible role
for these P450s during the early stages of infection (Schwab et al., 2009).
Furthermore, the CYP141A1 and fprA (Rv3106) genes are found within the Mtb
genome in a location adjacent to a gene cluster involved in molybdopterin cofactor
biosynthesis (Ouellet et al., 2010b). Molybdopterin is required by enzymes involved
in anaerobic metabolism and also for activity of nitrate reductase (Dubnau et al.,
2005). The CYP138A1 gene is also up-regulated during heat shock response at high
temperatures (Stewart et al., 2002). The CYP141A1 protein is a Mtb P450 enzyme
predicted to have important function(s) in the bacterium (McLean et al., 2007a).
The gene sequence of CYP141A1 was used by Darban-Sarokhalil and co-workers as
the basis for design of a PCR-based technique for the rapid detection of Mtb from
respiratory specimens (Darban-Sarokhalil et al., 2011, Rabiee-Faradonbeh et al.,
2014).
114
The CYP141A1 and CYP130A1 genes are absent from the Mtb vaccine strain M.
bovis BCG, and are located in “regions of deletion” (also known as “regions of
difference”; RDs 13 and 12, respectively) in the BCG strain, which are considered to
eliminate key genes involved in Mtb virulence (McLean et al., 2010). The likely
important roles played by CYP130A1 and CYP141A1 in Mtb virulence is thus a major
drive for their enzymatic characterization (McLean et al., 2010).
Other Mycobacterium tuberculosis P450s
Relatively little information is currently available for the remaining Mtb P450
enzymes. CYP136A1 is suggested to be a distant relative of sterol demethylase
(CYP51) enzymes, but such functional assignment and any physiological role
remains unclear (Ouellet et al., 2010b). The CYP137A1 gene is found in a cluster
close to one of the essential WhiB-like transcriptional regulatory proteins, WhiB4.
These are proteins that act in response to cellular redox changes or metabolic shifts
(Soliveri et al., 2000). CYP139A1 is predicted to be eukaryotic-like (i.e. CYP139A1
may be membrane-associated with a potential N-terminal membrane anchor) and
is conserved among pathogenic mycobacterial strains, but is not found in non-
pathogenic strains. The CYP139A1 gene is chromosomally adjacent to a cluster of
polyketide synthase genes (pks17, pks9 and pks11 being the closest) and is also
located adjacent to a gene encoding a predicted macrolide transport protein
(Rv1667c), suggesting a possible role for CYP139A1 in oxidative tailoring of a
nascent polyketide prior to its export from the cell (McLean and Munro, 2008). The
pks gene pks17 alone was reported to be essential in Mtb from data generated by

115
screening a transposon-mutant library (Sassetti et al., 2003). The proteins encoded
by genes pks17 and pks8 were shown to play key roles in the biosynthesis of
methyl-branched unsaturated fatty acids (Dubey et al., 2003). The Mtb genes
CYP143A1 and CYP144A1 are each highly conserved across many pathogenic and
non-pathogenic strains of actinobacteria (Ouellet et al., 2010b). The CYP144A1
gene, along with CYP125A1 and CYP132A1, was identified by transcriptional
profiling to be expressed specifically in Mtb-infected human dendritic cells after 18
hours (Tailleux et al., 2008), opening up an additional connection between virulence
and Mtb P450 enzymes (Ouellet et al., 2010b). CYP143A1 is located in the same
genomic region as CYP144A1, but little is known about their physiological functions.
The CYP143A1 gene is located immediately adjacent to (on the opposite strand) the
ferredoxin encoded by Rv1786, suggesting that these are redox partner proteins.
1.5.9 Azole Antibiotics: Non-Selective Inhibitors of Mtb Cytochrome P450 Enzymes
The druggability of Mtb cytochrome P450 enzymes is validated by the high level of
anti-mycobacterial activity exhibited by azole anti-fungal drugs (Hudson et al.,
2012a). These are compounds with a five-membered nitrogen heterocyclic ring
containing at least one other non-carbon atom which could be nitrogen, sulphur or
oxygen (Figure 1.33). Azole antibiotics were originally developed as antifungals
targeting CYP51, but azole drugs such as econazole and clotrimazole were shown to
be potent against most of the Mtb P450 enzymes tested. For example, CYP121A1,
which is important for Mtb viability, exhibits a very high affinity for some of the
azole drugs, with Kd values in the nanomolar range (McLean et al., 2008). Studies
116
have also shown that the azole antifungal econazole is capable of clearing both
active and latent Mtb infection from infected mice (Ahmad et al., 2006a, Munro et
al., 2013, Byrne et al., 2007, Ahmad et al., 2006c, Ahmad et al., 2006b).
To evaluate the effects of azole inhibitors against Mtb H37Rv, the minimal
inhibitory concentration (MIC) data were determined (Mclean et al., 2008). The
data revealed that econazole (MIC = 8 µg/ml) and miconazole (8 µg/ml) were most
potent, followed by clotrimazole (11 µg/ml and lastly ketoconazole (16 µg/ml). For
M. smegmatis, MIC data obtained were: econazole (MIC <0.1 µg/ml), miconazole
(1.25 µg/ml), clotrimazole (0.1 µg/ml), and ketoconazole (20 µg/ml). Even though
the MIC values for Mtb H37Rv were higher than those obtained previously for M.
smegmatis (Mclean et al., 2002b), the data revealed that the azoles possessed
activity against Mtb.
The azole compounds inhibit P450 catalysis by reversibly ligating the ferric heme
iron via a heterocyclic nitrogen atom (on an imidazole or triazole group) in the sixth
distal ligand position, to give a type-II spectral shift (Soret shift to a longer
wavelength) (Ortiz de Montellano, 2005, Odds et al., 2003). This binding displaces
the weakly bound water ligand on the 6th axial position and hence also prevents
substrate access to the active site (Hudson et al., 2012a). As discussed earlier, the
crystal structures of some Mtb P450 enzymes in complex with azole inhibitors have
been determined.
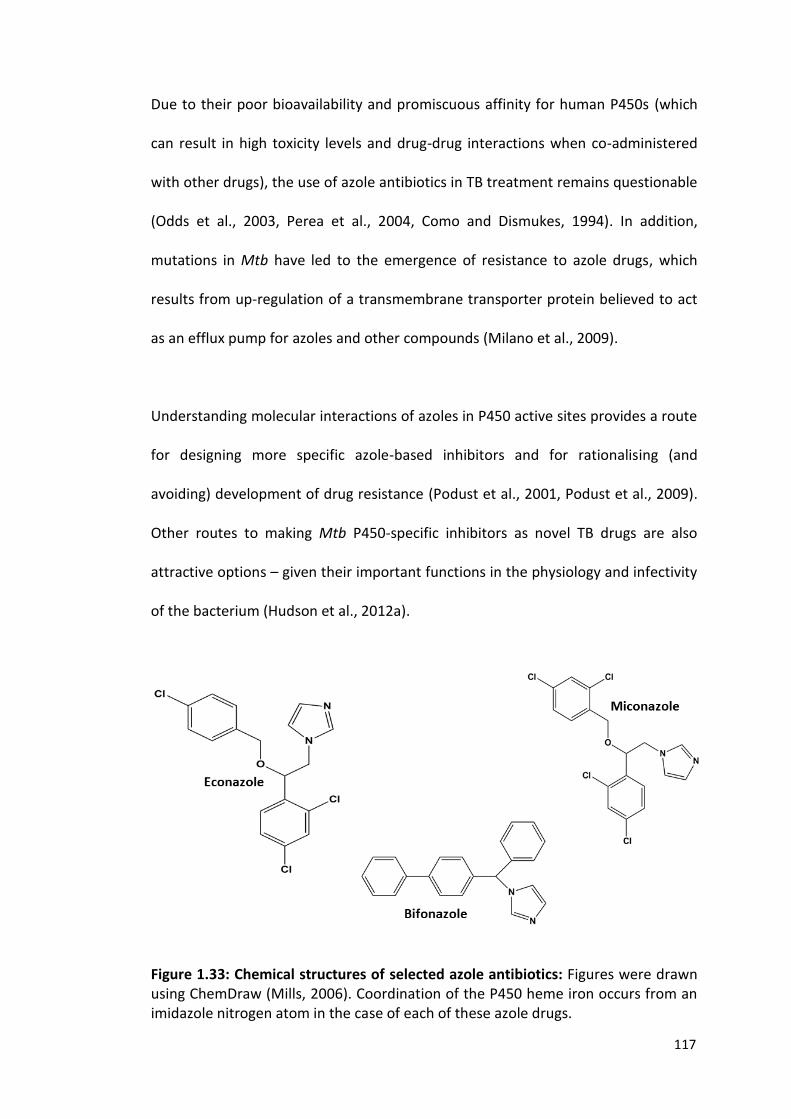
117
Due to their poor bioavailability and promiscuous affinity for human P450s (which
can result in high toxicity levels and drug-drug interactions when co-administered
with other drugs), the use of azole antibiotics in TB treatment remains questionable
(Odds et al., 2003, Perea et al., 2004, Como and Dismukes, 1994). In addition,
mutations in Mtb have led to the emergence of resistance to azole drugs, which
results from up-regulation of a transmembrane transporter protein believed to act
as an efflux pump for azoles and other compounds (Milano et al., 2009).
Understanding molecular interactions of azoles in P450 active sites provides a route
for designing more specific azole-based inhibitors and for rationalising (and
avoiding) development of drug resistance (Podust et al., 2001, Podust et al., 2009).
Other routes to making Mtb P450-specific inhibitors as novel TB drugs are also
attractive options – given their important functions in the physiology and infectivity
of the bacterium (Hudson et al., 2012a).
Figure 1.33: Chemical structures of selected azole antibiotics: Figures were drawn using ChemDraw (Mills, 2006). Coordination of the P450 heme iron occurs from an imidazole nitrogen atom in the case of each of these azole drugs.

118
1.6 Novel Drug Discovery Approaches
1.6.1 Fragment Based Drug Discovery (FBDD): A Novel Approach to Development of New P450 Inhibitor Scaffolds
The desperate need for the development of new TB drugs has become a global
problem. The majority of anti-tubercular drugs currently in use have been in
existence for over 40 years and have been rendered ineffective due to the
emergence of multi-drug (MDR-TB) and extensively drug-resistant (XDR-TB) strains
of Mtb (McLean et al., 2010, Hudson et al., 2012a). The WHO has declared this
situation a “global emergency” and only now, for the first time in many decades, are
there newly developed compounds undergoing clinical and preclinical trials to
tackle this public health problem (Check, 2007).
Fragment-based drug discovery (FBDD) has been introduced in the last decade as a
promising tool for drug discovery and has caused a new awakening in the process of
drug design, with many FBDD compounds being put into clinical trials or approved
for use in recent years (Wang et al., 2015, Erlanson, 2012). The origin of the
concepts behind FBDD can be traced back to pioneering work of two renowned
scientists, Jencks and Ariens, about 30 years ago (Jencks, 1981, Rees et al., 2004,
Erlanson, 2012). It was only in the mid-1990s that experimental techniques became
adequately sensitive and rapid for the concept to be become feasible (Erlanson,
2012). Jencks and Ariens demonstrated that drug-like molecules can be regarded as
the combination of two or more distinct binding epitopes (or fragments) (Rees et
al., 2004). The screening for these discrete binding moieties using small ligand
119
molecules (fragments) generated what is known as the ‘fragment approach’ (Rees
et al., 2004). In this approach, the starting points are very small, weak-binding
molecules (fragments) that are about half the size of typical drugs with molecular
weights between 120-250 Da or 8-18 non-hydrogen atoms (Erlanson, 2012, Rees et
al., 2004). These fragments are then chemically elaborated to create drug leads
(Figure 1.34 and 1.35) (Erlanson, 2012).
There are three major methods for the elaboration of initial fragment hits (Scott et
al., 2012). 1) fragment growing, in which fragments are chemically grown (guided by
data from structural biology that shows their target binding modes) into new
unexplored spaces within/around their binding sites; 2) fragment linking, where two
or more fragments that bind closely within the active site are covalently linked to
one another (while trying to retain their individual binding modes); and 3) fragment
merging, in which the components of fragments that overlap in the binding pocket
are fused together to generate more potent inhibitors (Hudson et al., 2013).

120
Figure 1.34: A schematic representation of the Fragment Based Drug Discovery (FBDD) approach. Fragments are screened against targets of interest, leading to identification of “hits”, which are further linked/grown/merged and optimised to create lead compounds for drug development. Image was drawn using Microsoft PowerPoint, and adapted from (Erlanson, 2012).
Another widely used current method of drug discovery is high-throughput screening
(HTS), in which very large numbers (up to millions) of compounds are collected and
screened against a target of interest (Erlanson, 2012). HTS has been used
successfully in development of many drugs, but has also proved ineffective in many
cases over the years for a number of reasons. These include the fact that the
compounds are expensive to purchase, maintain and screen; and since a set of even
hundreds of thousands or millions of compounds in HTS may not allow for efficient
exploration of chemical space, and hence may even achieve a lower hit rate than
FBDD (Figure 1.36) (Erlanson, 2012). In contrast to the traditional high-throughput
screening, the FBDD has remarkable advantages, such as efficiently covering
121
chemical space (i.e. a relatively small fragment library, usually containing 102 to 103
fragments, can occupy a significantly larger proportion of chemical space compared
with the approximately 105-106 larger molecules (Mw 300–500 Da) as would be
used in a high-throughput screen (HTS) (Hudson et al., 2014, Scott et al., 2012).
Furthermore, FBDD generates a higher hit rate than the HTS, and these fragment
hits must make reasonably strong interactions with the target in order to bind with
sufficient affinity for detection by biophysical methods (e.g. NMR- and calorimetry-
based methods), leading to higher ligand specificity detection (Wang et al., 2015,
Hudson et al., 2014). The magnitude of these interactions is expressed by hits
having high or low ligand efficiency (where ligand efficiency (LE) equals the negative
∆G of binding divided by the number of non-hydrogen atoms (NHA) in the
fragment) (Hopkins et al., 2004, Hudson et al., 2014).
X-ray crystallography plays a key role in both approaches in that it provides precise
three-dimensional detail on the molecules’ binding modes, and hence guides their
subsequent elaboration and validation (Murray and Blundell, 2010). Structure-
based drug design is used in FBDD to increase potency and selectivity, whilst
maintaining drug-like properties (Murray and Blundell, 2010).
FBDD has been applied to some of the 20 Mtb CYPs; however CYP121A1 represents
the first successful P450 enzyme to be successfully studied via fragment-based
approaches (Hudson et al., 2012b). An initial fragment-screening process involving
thermal shift and NMR spectroscopy (for detection of fragment binding), and X-ray
crystallography (to pinpoint fragment binding positions in CYP121A1) identified four

122
fragments that bound within the CYP121A1 active site, including one that bound in
two overlapping orientations. A direct fragment–fragment merging process was
carried out, leading to the discovery of a novel type-II aminoquinoline inhibitor with
high ligand efficiency and affinity (Figure 1.35) (Hudson et al., 2012b).
Figure 1.35: Application of a fragment-based drug discovery approach to Mtb CYP121. A: Identical CYP121 fragments (a non-heme-coordinating triazolylphenol fragment) binding in overlapping orientations (PDB code 4G47) (Hudson et al., 2013). B: The fragments from A chemically “merged”, producing a molecule with slightly lower affinity than the parent fragments (PDB code 4G2G). C: Further optimization of the merged fragment with the addition of a primary amine group gives a compound with improved affinity and ligand efficiency (PDB code 4KTF) (Hudson et al., 2013). For all figures, the parent fragments/merged/optimised hits are shown in sticks with carbon atoms in yellow, oxygen atoms in red and nitrogen atoms in blue. The heme is shown in atom coloured sticks with carbon atoms in magenta. Structures were drawn using PyMol (DeLano, 2002).

123
1.6.2 High Throughput Screening (HTS)
High-throughput screening is a large scale approach to drug discovery. It was first
used in the pharmaceutical industry in the early 1990’s, but has become widely
used in other industries with improved technologies allowing the screening of the
screening of million-compound libraries within 2-3 months (Flotow, 2014). The data
generated from HTS have consistently increased over the years and several drugs
initially identified from HTS approaches are currently in therapeutic use for different
ailments (Macarron et al., 2011).
The rate for HTS success is generally estimated to be ~50% which could b attributed
to is short fall of not allowing efficient exploration of chemical space (Figue 1.36)
(Fox et al., 2006, Bleicher et al., 2003, Erlanson, 2012). However, it has been
documented that other lead discovery strategies (such as fragment screening,
structure-based design or virtual screening) have shown higher success rates than
HTS. Nevertheless, no hit identification method is 100% fruitful. The methods all
have their advantages and disadvantages, but when coupled with good integration
of hit identification approaches the chances of success can be maximised (Fox et al.,
2006). An important advantage of HTS over other screening approaches is that HTS
can be applied to a broader range of targets and/or ligands (Macarron et al., 2011).
Unfortunately, many difficult targets, especially those with inaccessible binding
pockets, have shown low success rates using HTS (Macarron et al., 2011). Another
advantage of HTS is its inherent ability to identify compounds that modulate
biological activity (for example, cell viability, protein translocation or second
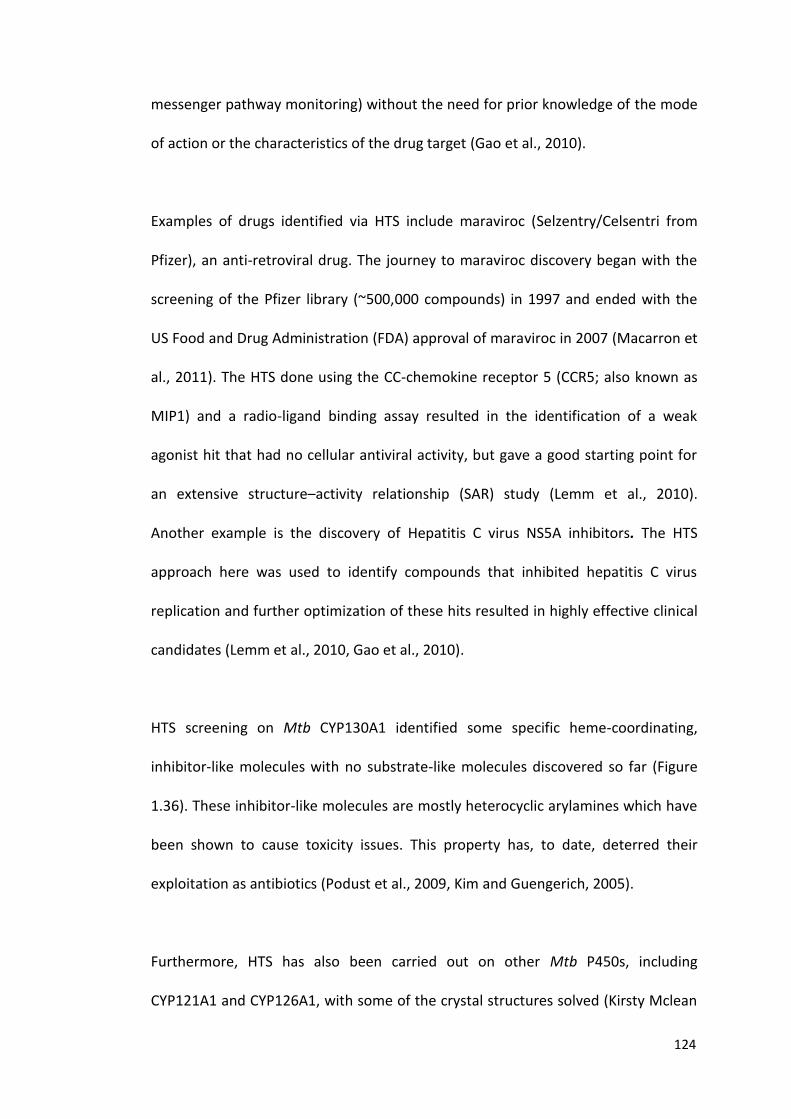
124
messenger pathway monitoring) without the need for prior knowledge of the mode
of action or the characteristics of the drug target (Gao et al., 2010).
Examples of drugs identified via HTS include maraviroc (Selzentry/Celsentri from
Pfizer), an anti-retroviral drug. The journey to maraviroc discovery began with the
screening of the Pfizer library (~500,000 compounds) in 1997 and ended with the
US Food and Drug Administration (FDA) approval of maraviroc in 2007 (Macarron et
al., 2011). The HTS done using the CC-chemokine receptor 5 (CCR5; also known as
MIP1) and a radio-ligand binding assay resulted in the identification of a weak
agonist hit that had no cellular antiviral activity, but gave a good starting point for
an extensive structure–activity relationship (SAR) study (Lemm et al., 2010).
Another example is the discovery of Hepatitis C virus NS5A inhibitors. The HTS
approach here was used to identify compounds that inhibited hepatitis C virus
replication and further optimization of these hits resulted in highly effective clinical
candidates (Lemm et al., 2010, Gao et al., 2010).
HTS screening on Mtb CYP130A1 identified some specific heme-coordinating,
inhibitor-like molecules with no substrate-like molecules discovered so far (Figure
1.36). These inhibitor-like molecules are mostly heterocyclic arylamines which have
been shown to cause toxicity issues. This property has, to date, deterred their
exploitation as antibiotics (Podust et al., 2009, Kim and Guengerich, 2005).
Furthermore, HTS has also been carried out on other Mtb P450s, including
CYP121A1 and CYP126A1, with some of the crystal structures solved (Kirsty Mclean
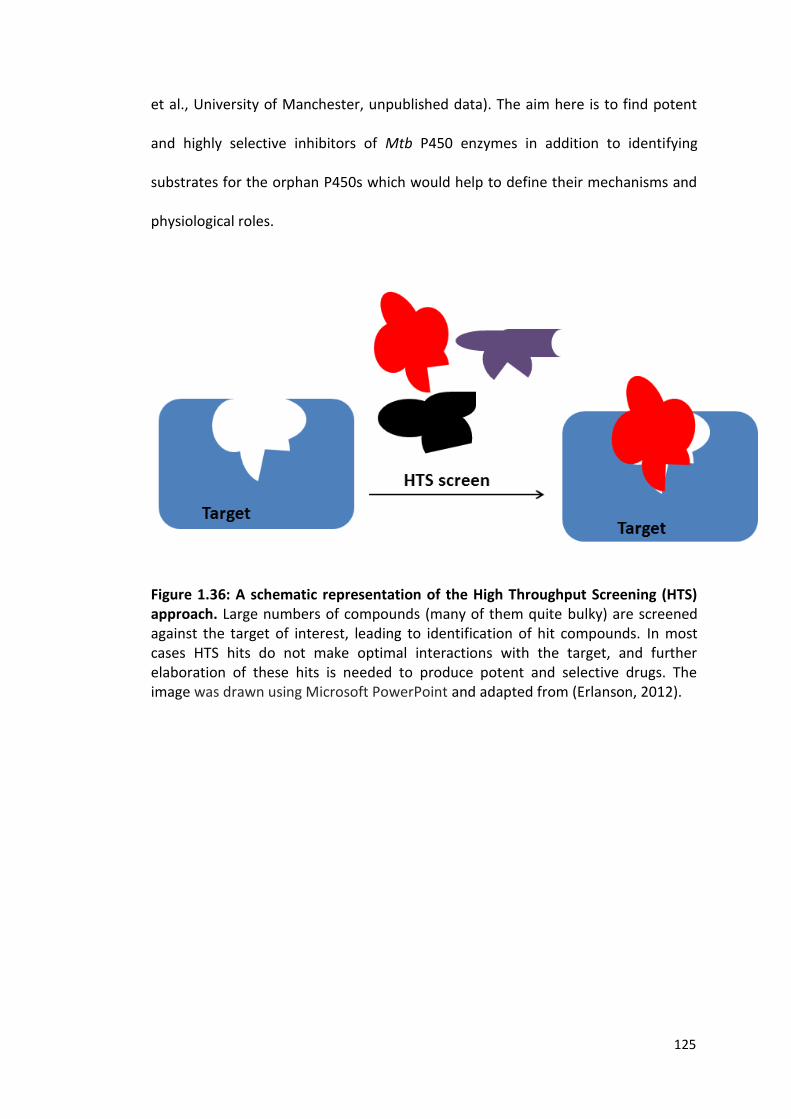
125
et al., University of Manchester, unpublished data). The aim here is to find potent
and highly selective inhibitors of Mtb P450 enzymes in addition to identifying
substrates for the orphan P450s which would help to define their mechanisms and
physiological roles.
Figure 1.36: A schematic representation of the High Throughput Screening (HTS) approach. Large numbers of compounds (many of them quite bulky) are screened against the target of interest, leading to identification of hit compounds. In most cases HTS hits do not make optimal interactions with the target, and further elaboration of these hits is needed to produce potent and selective drugs. The image was drawn using Microsoft PowerPoint and adapted from (Erlanson, 2012).

126
Figure 1.37: Structures of CYP130A1 with HTS hits (heterocyclic arylamines) bound in the active site. A: two molecules of “compound 4” (1-(p-tolyl)-1H-benzo[d]imidazol-5-amine) are shown with carbon atoms in yellow and pink in stick representation (PDB code 2WHF). B: compound 2 (5-amino-2-(4-((4-aminophenyl)thio)phenyl)isoindoline-1,3-dione) is shown in sticks with carbon atoms in cyan (PDB code 2WH8). In both cases, the protein backbone is shown as purple-blue ribbon and the heme is shown with carbon atoms in red (Podust et al., 2009). Structures were drawn using PyMol (DeLano, 2002).
1.7 Justification of Research
Research on tuberculosis has been boosted by the determination of the Mtb H37Rv
genome sequence in 1998 (Cole et al., 1998), which provided a major steps towards
identifying new drug targets and in understanding the complex biology of the Mtb
bacterium (Driscoll et al., 2010). The genome sequence of Mtb H37Rv revealed a
large number of cytochrome P450 enzymes. There are 20 CYP genes in Mtb,
suggesting important physiological roles (McLean et al., 2006b). In addition, Mtb
was also shown to encode the first prokaryotic 14α-sterol demethylase (CYP51B1),
which was characterized in the Munro group (Dunford et al., 2007, McLean et al.,
2006b). An important question was raised as to whether the azole drugs (e.g.

127
clotrimazole, fluconazole and miconazole, which are known anti-fungals targeting
the CYP51s) could also have activity against Mtb (Driscoll et al., 2010, McLean et al.,
2006b). The results obtained were positive, suggesting the possibility that one or
more of the Mtb P450s might be novel drug targets in the bacterium (McLean et al.,
2007a, McLean and Munro, 2008, McLean et al., 2002b).
Research in recent years has led to the expression and structural/biochemical
characterization for a number of the Mtb P450 enzymes, and this has been
complemented by genetic studies that have highlighted absolute or conditional CYP
gene essentiality in some cases. In particular, previously unexpected functions in
sterol demethylation (CYP51B1), cholesterol oxidation (CYPs 124A1, 125A1, 142A1),
novel secondary metabolite synthesis (CYP121A1) and probably in menaquinone
oxidation (CYP128A1) have emerged, all suggesting important cellular functions for
the Mtb P450s that further highlight their potential as targets for therapeutic
intervention (McLean and Munro, 2008, Munro et al., 2003, Ouellet et al., 2010b).
Recent studies have also led to some exciting results with respect to the use of
fragment based screening for targeting the Mtb P450s, with work at Manchester
and at the University of Cambridge producing novel inhibitors of the cyclodipeptide
(cyclo-L-Tyr-L-Tyr) oxidase CYP121A1 (Hudson et al., 2012b, Hudson et al., 2013). In
the case of CYP142A1 (and also for CYPs 125A1/124A1), there is strong evidence
that inhibiting their activities could be important in the killing of latent Mtb - where
metabolism of host cholesterol is essential for the bacterium to survive in the host
(Pandey and Sassetti, 2008, Chang et al., 2009, Yam et al., 2009, Ouellet et al., 2011,
Munoz et al., 2009) (also see section 1.5.2.4). The efficient inhibition of CYP124A1,
128
CYP125A1 and CYP142A1 would completely prevent cholesterol/cholestenone
oxidation by Mtb and likely prevent the bacterium infecting the host macrophage.
Hence, there is a compelling need for this study, in which I have researched further
into the structure, function and drug targeting of the cholesterol oxidases in the
human pathogen Mycobacterium tuberculosis.
1.8 Aims of Research
In this PhD thesis, my work has focused on structure-guided approaches for drug
targeting and selective inhibition of the Mtb cholesterol oxidases.
The key objectives for this thesis include:
Production and biochemical/biophysical characterization of the Mtb
cholesterol oxidases CYP124A1 and CYP142A1.
Determination of crystal structures of the cholesterol oxidases in complex
with substrate and inhibitor molecules in order to rationalise their binding
modes and to analyse molecular determinants of inhibitor binding.
Identification and evaluation of specific inhibitors for the Mtb cholesterol
oxidases using fragment-based screening approaches in collaboration with
researchers at the University of Cambridge.
Provision of novel data on the biochemical and biophysical properties of the
Mtb cholesterol oxidase enzymes.

129
Chapter 2
Materials and Methods
2.1 Materials
E. coli growth media were obtained from ForMedium (Norfolk, UK). Competent
cells of NovaBlue and C41 (DE3) were from Novagen (UK). Protein marker,
restriction endonucleases and other DNA modifying enzymes were obtained from
New England Biolabs (Herts, UK) and were used according to the manufacturer’s
specifications and with the commercial buffer system supplied. NADPH was
obtained from Europa Bioproducts Ltd (Cambridge, UK). All other antibiotics and
other chemicals were either from MP Biomedicals (Cambridge, UK) or Sigma-Aldrich
(Poole, UK) and were of the highest grade available, unless otherwise stated.
2.2 Methods
2.2.1 Preparation of Plasmid DNA for Expression Constructs
2.2.1.1 Source and Description
CYP142A1 (Gene Rv3518)
The CYP142A1 (gene Rv3518 from the Mtb H37Rv genome) from a Mycobacterium
tuberculosis H37Rv cosmid DNA library (from Dr. Roland Brosch, Institut Pasteur,
Paris) was transformed into E. coli Novablue competent cells (Novagen, Darmstadt,
Germany).
130
The Rv3518 gene was expressed using the previously cloned Rv3518 construct in
the pET15b plasmid vector (Novagen), with the gene having been cloned from a
Mtb H37Rv chromosomal cosmid library (BAC clone Rv416) using the forward
primer, upstream (CYP142-NdeF), 5’-
GGAGGATCCATATGACTGAAGCTCCGGACGTGG-3’, and reverse primer, downstream
(CYP142-BamHIR), 5’-CGTTCGGGATCCCTCAGCCCAGCGGCGTGAAC-3’. The letters
underlined in the upstream primer indicate an engineered NdeI restriction-cloning
site, including the initiation codon ATG (bold). The underlined letters in the
downstream primer indicate a BamHI restriction-cloning site, with the stop codon in
bold (Driscoll et al., 2010).
CYP124A1 (Gene Rv2266)
The CYP124A1 (Rv2266) gene was synthesized by Genscript (Piscataway, USA)
following codon optimization for expression in E. coli, and was cloned into pET47b
using the restriction enzymes sites BamHI and HindIII by the supplier.
2.2.1.2 Plasmid DNA Purification
Plasmid DNA for both CYP142A1 and CYP124A1 were purified using standard
protocols. Competent cells of Novablue strains of E. coli were first transformed with
the plasmid DNA and transformants were grown in culture. Subsequently, plasmids
were purified from these cultures using a QIAGEN miniprep kit and the supplier’s
protocol (Qiagen, Manchester UK).
131
Ultra-competent E. coli Novablue cells (Novagen, UK) were taken from a -80oC
freezer and used to inoculate 5 ml of LB (Luria Bertani) medium containing a
selective antibiotic specific for Novablue cells (tetracycline at 12.5 g/ml). This
culture was grown at 37oC at 190 rpm overnight. Working cultures were then grown
from the starter culture to an optical density of 0.4 (OD600 = 0.4) and cells were
harvested by centrifugation in a microfuge tube for 30 s and then resuspended in
50 mM calcium chloride twice (i.e. re-centrifuged and resuspended in 0.5 mL of
fresh 50 mM CaCl2), and then left on ice for 60 minutes. 1 μl of the
CYP142A1/pET15b plasmid (40.2 µg/ml) or the CYP124A1/pET47b (84.1 µg/ml) was
added and the mixture left on ice for another 60 minutes before being subjected to
a heat shock treatment at 42oC for one minute, and then returned to ice for
another 2 minutes. Sterile SOC medium (0.8 ml) was then added and the mixture
left to incubate at 37oC for 60 minutes in a shaking incubator. 100 μl of each E. coli
strain were then plated onto LB agar plates containing 50 μg/ml carbenicillin (for
CYP142A1/pET15b plasmid) or 30 μg/ml kanamycin (for CYP124A1/pET47b) and
incubated overnight at 37oC. The following morning, a single colony was picked
from each plate and used to inoculate LB starter cultures, and these cells were
grown overnight in 5 ml LB medium containing 50 μg/ml carbenicillin (for
CYP142A1) or 30 μg/ml kanamycin (for CYP124A1) at 37oC with agitation at 190
RPM. DNA was extracted using a QIAGEN miniprep kit and protocol (Qiagen,
Manchester UK). The concentration of plasmid DNA used was determined using a
NanoDrop 2000 instrument (Thermo Scientific, Wilmington USA) and the stock
stored in a labelled, sterile Eppendorf tube at -80oC. The constructs used were all
checked for correct CYP gene insertion using 0.8% agarose Tris-Acetate EDTA (TAE)

132
gel electrophoresis with ethidium bromide (0.2 µg/ml), with the DNA resolved by
running the gel at 90 V and by analysis of both undigested plasmid DNA, and
plasmids digested with BamHI and NdeI. To verify that the entire gene was correctly
inserted, a sample was also sent to Source Bioscience (Nottingham, UK) for
sequencing with the T7 primers: T7F - TAA TAC GAC TCA CTA TAG GG and T7R - GCT
AGT TAT TGC TCA GCG G. These data confirmed that the correct genes were
present.
2.2.2 Generation of Glycerol Stocks of E. coli transformants Glycerol stocks of transformant E. coli cells were prepared in order to preserve the
plasmid DNA by storage in expression strains of E. coli. In these cases, 5 ml cultures
of transformed E. coli cells (C41 (DE3)) were grown overnight in medium containing
relevant antibiotics specific for the plasmids. The next day, a freshly re-inoculated
culture in the same medium was grown until an OD600 = 0.4-0.6. Subsequently, 800
µl of cell culture and 200 µl of sterilized 80% glycerol were mixed gently in an
Eppendorf tube and the transformant cell sample was stored at -80°C until
required.
2.2.3 Expression Trials for CYP124A1 and CYP142A1 P450s
E. coli transformant expression trials for the CYP142A1 and CYP124A1 genes were
carried out in 50 ml volumes of 2YT medium supplemented with ampicillin (50
µg/ml) or kanamycin (30 μg/ml) (for CYPs 142A1 and 124A1, respectively) in 250 ml
flasks using various media (Luria-Bertani (LB), 2x yeast tryptone (2YT) and terrific
133
broth (TB)) with different IPTG concentrations (0.1-1.0 mM) and expression
temperatures (18-25°C), both with/without addition of the heme precursor -
aminolevulinic acid (0.1-0.5 mM δ-ALA), using different E. coli expression hosts
(HMS174 (DE3), C41 (DE3), BL21 (DE3) and Rosetta (DE3) Novagen). The CYP142A1
gene was expressed under control of a T7 RNA polymerase/promoter system in
pET15b while CYP124A1 gene was expressed in pET47b using different DE3 lysogen
E. coli strains. Transformed cells were grown at 37°C overnight in LB medium (5 ml)
supplemented with antibiotics selective for each gene, and this culture was used as
an inoculum for 250 ml 2YT medium with the same additives.
In the 250 ml flasks, cells were grown at 37°C for 4 hours, and the growth
temperature was then reduced to 18-25°C prior to a further 4-48 hours growth
following IPTG (0.1-1.0 mM) addition to induce target gene expression, and the
addition of 0.1-0.5 mM δ-ALA at an OD600 of 0.6–0.8. Subsequently, 1 ml samples
were collected and centrifuged at 13,000 rpm for 10 min and 4°C on a benchtop
microfuge (MicrofugeR 22R centrifuge, Beckman Coulter) and the supernatant was
then discarded and the pellet resuspended in 200 μl 50 mM KPi, 250 mM KCl, 10%
glycerol, pH 8 buffer. 12 μl of the normalised cell resuspension was heated with 6 μl
of 3x SDS sample buffer at 95°C for 3 minutes and analysed by SDS-polyacrylamide
gel electrophoresis (SDS-PAGE). Normalised loading volumes for SDS-PAGE analysis
were calculated using the worksheet provided in the pET System Manual
(Novagen). 10 μl of protein marker, broad range (2-212 kDa) (New England Biolabs,
Hitchin UK) was run alongside the samples to determine the relevant P450 protein

134
band mass, and (unless stated otherwise) the same protein marker was used in all
SDS-PAGE gels.
Medium type Composition Amount added
LB 10 g/l Tryptone 5 g/l Yeast Extract 10 g/l NaCl pH 7.0
25 g/l (premixed)
TB 12 g/lTryptone 24 g/l Yeast extract 4 ml glycerol 72 mM K2HPO4, 17 mM KH2PO4, pH 7.0
36 g/l (premixed)
2YT 16 g/l Bacto Tryptone 10 g/l Bacto Yeast Extract 5 g/l NaCl pH to 7.0 with 5N NaOH
31 g/l (premixed)
SOC 20 g/l Tryptone 5 g/l Yeast Extract 10 mM NaCl 2.5 mM KCl 10 mM MgCl2 10 mM MgSO4 20 mM glucose pH 7.0
800 μl premixed SOC added to final volume of 500 μl re-suspended cells.
Table 2.1 Composition of growth media used for protein production and the amounts of components added per litre of medium. All media were sterilised by autoclaving prior to use.
2.2.4 Scale up of the Expression of CYP142A1
From the protein expression trials carried out, the E. coli strain C41 (DE3) and
growth in 2YT medium was observed to produce the greatest proportion and
quantity of soluble CYP142A1 protein. Hence, further expression (to enable P450
purification) was carried out on a larger scale using 2 litre flasks containing 600 ml

135
of 2YT medium. The E. coli strain C41 (DE3) was transformed (as described in
section 2.2.1.2) with the pET15b-CYP142A1 plasmid (hereafter referred to as
pCYP142A1). Single colonies were taken and inoculated into 5 ml LB medium
containing 50 μg/ml carbenicillin and cultures were grown for six hours. 0.5 ml of
the starter culture was then inoculated into 200 ml LB containing the same
antibiotics and culture was continued at 37°C. For protein expression, the
transformed cells were grown in 24 x 2 litre flask cultures in 2xYT medium. Each 2
litre flask contained 600 ml of growth medium supplemented with ampicillin (50
µg/ml), and was inoculated with 6 ml of bacteria from an overnight culture in the
same medium. Cells were then grown at 37°C with agitation (200 rpm) to an OD600
of 0.4; the temperature was then reduced to 22°C and the cultures were grown to
an OD600 of 0.8. Expression was induced by addition of IPTG (0.1 mM) and culture
was continued for a further 20–24 h. The cells were harvested by centrifugation at
6000 g for 10 min at 4°C and stored at -80°C until required.
2.2.5 Scale up of the Expression of CYP124A1
CYP124A1 was expressed using a similar protocol to that for CYP142A1, with some
minor differences. The C41 (DE3) E. coli strain and 2YT medium combination was
found to be best for protein expression. E. coli C41 (DE3) was transformed (as
described in section 2.2.1.2) with the pET47b-CYP124A1 plasmid (hereafter referred
to as pCYP124A1).

136
Each 2 litre flask contained 600 ml of growth medium supplemented with
kanamycin (30 µg/ml), and was inoculated with 6 ml of bacteria from an overnight
culture in the same medium. Cells were then grown at 37°C with agitation (210
rpm) to an OD600 of 0.3; the temperature was then reduced to 25°C and the
cultures were grown to an OD600 of 0.6. Expression was induced by addition of IPTG
(0.5 mM) with addition of 0.5 mM δ-ALA heme precursor. Bacterial cell culture was
continued for a further 30-36 h. The cells were harvested by centrifugation at 6000
g for 15 min at 4°C and the cell pellet stored at -80°C until required.
2.2.6 Protein Purification for CYP124A1 and CYP142A1
The same purification protocol was used for both CYP142A1/CYP124A1. Cell pellets
from approximately 15 litres of culture were resuspended in approximately 400 ml
ice cold 50 mM potassium phosphate (KPi, pH 8.0) containing 250 mM KCl and 10%
glycerol (resuspension buffer). DNase (10 mg/ml from a standardized vial
containing 2,000 Kunitz units of DNase I), lysozyme (10 mg/ml) and 2.5 mM MgCl2
were added, and eight complete EDTA-free protease inhibitor tablet (Roche) were
added while stirring on a magnetic stirrer.
Ultrasonication was carried out with ~15 cycles of 20 seconds on ice with 1 minute
rest periods, using a Bandelin Sonopuls sonicator at 45% full power. The lysate was
centrifuged at 40,000 g for 1 h at 4°C to pellet insoluble material. The supernatant
was retained and loaded onto a nickel-nitrilotriacetic acid (Ni-NTA) column (Qiagen)
for protein purification. The Ni-NTA column was pre-equilibrated with 50 mM KPi
buffer (pH 8.0) containing 250 mM KCl and 10% glycerol (binding buffer), and the
137
supernatant sample allowed to flow through the column under gravity. Flow-
through from the column was collected and analysed by SDS-PAGE. The column was
washed with 10 column volumes of resuspension buffer plus 5 mM imidazole.
Successive washes were then performed with loading buffer containing imidazole
at 20 mM, 40 mM, 60 mM and finally 100 mM. The eluent after each wash was
collected and analysed spectrally (between 240 nm and 800 nm, analysing for P450
heme signals) using a Cary 50 UV-visible scanning spectrophotometer (Varian, UK).
CYP142A1 purity was also established using its Reinheitszahl (Rz) value — i.e. the
ratio of absorbance at the heme Soret peak to the protein absorbance at 280 nm
(A418/A280). Fractions containing CYP142A1 (mainly from the 40-100 mM imidazole
fractions) were pooled, concentrated by ultrafiltration using a Vivaspin 20 ml
ultrafiltration device (Sartorius, 30 kDa MWCO) by centrifugation at 3500 rpm using
a bench top centrifuge (MicrofugeR 22R centrifuge, as before), and then dialysed
into 15 mM KPi (pH 6.5) to remove imidazole (which can act as a ligand to the P450
heme iron).
The pooled samples from the Ni-NTA column were further concentrated to ~5 ml by
ultrafiltration as described above. Further purification was then done using a
hydroxyapatite (HA) column on an AKTA purifier. The purification was done using a
linear gradient of 15 mM KPi, pH 6.5 (Buffer A) and 500 mM KPi pH 6.5 (Buffer B)
over a range of 350 to 500 ml. Fractions from the HA column were analysed by SDS-
PAGE using 12% precast gels (Expedeon, Cambridge UK) and by UV–Vis
spectroscopic analysis. The purest fractions from the HA column purification
containing P450s with A418/A280 ratios >1.0 (for CYP124A1) and >1.5 (for CYP142A1)

138
were pooled. These were then concentrated to ~50 μl by ultrafiltration using a
Vivaspin 2 ml ultrafiltration device (Sartorius, 30 kDa MWCO) at ∼1500 g, and then
subjected to a final purification step on a SuperdexTM S-200 gel (120 ml S200
16/600GL, GE Healthcare) gel filtration column on an AKTA purifier using 10 mM
Tris plus 150 mM NaCl, pH 7.2 as the loading buffer. For CYP142A1 purification, this
buffer was supplemented with 1 mM DTT (dithiothreitol, Melford, Ipswich UK).
Fractions were analysed by SDS-PAGE as described in section 2.2.6. Purity was
confirmed by a single band present on an SDS-polyacrylamide gel and by UV-visible
spectroscopy, where an A418/A280 ratio ≥2 (for CYP142A1) and ≥1.3 (for CYP124A1)
correlated with highly pure enzyme.
2.2.7 Assessment of P450 Concentration and Purity
Protein purity was assessed by SDS-PAGE on 12% pre-cast SDS-PAGE acrylamide
gels (Biorad, UK) run at 350 V for 20 minutes according to the manufacturer’s
protocol. CYP142A1 purity was also verified using its Rz value (A418/A280). Protein
samples (20 μl) were mixed with 20 μl of 2x SDS protein sample buffer/loading
buffer (40% glycerol, 240 mM Tris/HCl pH 6.8, 8% SDS, 0.04% bromophenol blue,
5% beta-mercaptoethanol). The mixture was heated at 95-100°C for 5 minutes to
denature proteins prior to SDS-PAGE. For each well on the gels, 10 μl of protein-
buffer mixture was loaded and the gel cassette placed in the electrophoresis tank.
The samples were then run in 0.1% SDS, 1x running buffer (containing 28.8 g
glycine, 6.04 g Tris base, 2 g SDS, and deionized, distilled water [ddH2O] to a final
volume of 2 litres). Electrophoresis was performed at 350 V for 20 minutes. After

139
the completion of electrophoresis, the SDS-PAGE gel was removed from the tank
and a gel image picture taken with a BioRad Bioimaging instrument (BioRad, UK).
2.2.8 Determination of P450 Extinction Coefficients using the Pyridine Hemochromagen Method
Determination of the Soret extinction coefficient for CYP142A1 was done by the
pyridine hemochromogen method (Berry and Trumpower, 1987). UV–visible
absorbance spectra were recorded for CYP142A1/CYP124A1 solutions (using 5.5
μM enzyme for CYP142A1/5.8 μM enzyme for CYP124A1) in a 1 ml quartz cuvette,
and then 500 µl was removed and retained for later use. An equal volume (500 µl)
of a 40% pyridine stock solution (containing 0.8 mM potassium ferricyanide and 200
mM NaOH) was added and the hemochrome spectrum taken afterwards.
Further spectral changes were recorded after addition of a few grains of sodium
dithionite and until no further spectral changes occurred and peak formation
between 550-570 nm was consistent. The CYP142A1/124A1 concentrations were
calculated using the difference in absorbance at 557 nm between the oxidized and
reduced spectra and by employing a difference extinction coefficient at this
wavelength of ∆A557 = 23.98 mM−1 cm−1.

140
2.2.9 UV-Visible Spectroscopic Studies of Mtb P450s
2.2.9.1 Binding Assays with Substrates and Inhibitors
All ligand binding (for potential substrates and inhibitors) assays were performed by
spectrophotometric titration at 25oC in 100 mM potassium phosphate (KPi), 100
mM KCl buffer, (pH 7.5 for CYP142A1 and pH 7.0 for CYP124A1) using a Cary UV-
visible scanning spectrophotometer (Varian UK) and a 1 cm path length quartz
cuvette, recording spectra between 250 and 800 nm, and typically using a protein
concentration between 2-10 μM. Imidazole and cyanide stocks were made up in the
same buffer, while other azole drugs (clotrimazole, econazole, fluconazole,
bifonazole, ketoconazole, miconazole, and voriconazole) were prepared in
dimethylsulfoxide (DMSO). Cholesterol and cholestenone solutions were made up
in 45% 2-hydroxypropyl-β-cyclodextrin (HPCD, in water), fatty acids solutions were
made in ethanol, while a lanosterol solution was made up in a 9:1 ethanol:HPCD
mixture. Ligands were added in small volumes (typically 0.1-0.5 µl aliquots) from
concentrated stock solutions to the protein in a 1 ml final volume. Spectral
measurements were taken before ligand addition, and following addition of each
aliquot of ligand. The Kd values for each ligand were determined by plotting the
optical change induced after each addition of ligand against the relevant ligand
concentration, and by fitting the data using either the Morrison equation (Equation
1), a standard hyberbolic function (Equation 2) or the Hill equation (equation 3)
using Origin software (OriginLab, Northampton, MA). Equation 1 provides robust
fitting of binding data for tight binding ligands, accounting for the concentration of

141
protein in cases where the Kd value is not substantially greater than the protein
concentration used.
Aobs = (Amax/(2Et) × ((S+Et+Kd)-((S+Et+Kd)2-(4EtS))0.5) (Equation 1)
In Equation 1 (the Morrison equation), Aobs is the observed absorbance change at
ligand concentration S; Amax is the absorbance change at ligand saturation; Et is the
enzyme concentration, and Kd is the dissociation constant for the enzyme-ligand
complex.
Aobs = (Amax*S/(Kd+S)) (Equation 2)
In Equation 2 (the standard hyperbolic function, essentially the Michaelis-Menten
function adapted for ligand binding), Aobs is the observed absorbance change at
ligand concentration S, Amax is the maximal absorbance change observed at ligand
saturation, and Kd is dissociation constant for the binding of the ligand (the
substrate concentration at which Aobs = 0.5 x Amax).
Aobs = (Amax × Sn)/(Kn+Sn) (Equation 3)
In equation 3 (the Hill equation), Aobs is the observed absorbance change at ligand
concentration S, Amax is the absorbance change at ligand saturation, K is the
apparent dissociation constant, and n is the Hill coefficient, a value describing the
apparent extent of cooperativity observed in ligand binding.
142
2.2.9.2 Formation of P450 Carbon Monoxide and Nitric Oxide Adducts
Conversion of the enzyme Fe(II)-CO complex from the “native” (cysteine thiolate-
coordinated) form with a Soret band maximum close to 450 nm (P450) to the
“inactive” form with a maximum near 420 nm (P420, with cysteine thiol
coordination) was monitored spectrophotometrically in the presence and absence
of cholesterol. This was done using a Cary 50 UV visible spectrophotometer under
anaerobic conditions in a glove box (Belle Technology, Weymouth, UK) for ferrous
CO-bound enzymes (McLean et al., 2008, Quaroni et al., 2004).
Solutions of CYP142A1/CYP124A1 (2-6 µM) were prepared in 100 mM KPi
containing 100 mM KCl (pH 7.5 for CYP142A1 and pH 7.0 for CYP124A1). UV/Visible
absorption spectra were recorded on a Cary UV-50 Bio UV/Visible scanning
spectrophotometer using a sealed 1 cm pathlength cuvette with anaerobic buffer at
25°C. Spectra were first recorded for the oxidized species, and subsequently
CYP142A1 (4.4 µM) and CYP124A1 (3.8 µM) were reduced using a small amount of
sodium dithionite and bubbled briefly with carbon monoxide to form the P450-CO
complex. Spectra were then recorded every 10 s for several hours to observe any
changes relating to the P450 “collapse” into the P420 form due to cysteine thiolate
protonation. The stability of the enzyme-CO complex was also examined in the
same way in the presence of cholestenone (1 μM sterol).
Nitric oxide (NO) complexes of CYP142A1 and CYP124A1 were obtained by brief
bubbling of the buffered oxidized enzyme solution with NO gas. This experiment
143
was performed with caution to avoid excessive addition of NO given its ability to
form nitrous acid in solution which would lead to protein denaturation. Spectra
were recorded as described above.
2.2.10 Isothermal Titration Calorimetry (ITC) Studies on Mtb
P450s
Experiments were performed using a VP-ITC calorimeter equipped with the control
and data acquisition/analysis software ORIGIN 7 (MICROCAL Inc., Northampton,
MA). Solutions of the protein and fragments used for ITC titrations were prepared
in 100 mM KPi, 100 mM KCl, pH 7.5 containing 5% DMSO. The protein solution
(CYP142A1 at 62 µM) was placed in the calorimetric cell and titrated with different
concentrations of the fragments in the titration syringe. Twenty injections of 15 l
aliquots of fragments (at different concentrations) were run at 300 seconds
intervals. The titration syringe was continuously stirred at 310 rpm, and the
temperature of the calorimetric cell maintained at 25oC. Injecting the ligand into
buffer alone was also carried out as a reference titration and the resulting heat of
dilution subtracted from the protein-fragment titration. Data were generated by
fitting to a single binding model. ∆G was then determined by the relationship:
∆G=∆H-T∆S (Equation 4)
Where T is the temperature of the experiment in Kelvin (oK = oC + 273.15), ∆G is
Gibbs free energy of reaction, ∆H is the change in enthalpy of the system and ∆S is
the change in entropy of the system.

144
2.2.11 Guanidinium Chloride Denaturation of CYP142A1
Aromatic amino acid (mainly tryptophan) fluorescence measurements of pure
CYP142A1 (5 µM) was carried out by incubating the P450 with increasing
concentrations of guanidinium chloride (GdmCl, 0-6 M) for 30 minutes (i.e. 30 min
incubation period at each [GdmCl]) in the presence and absence of cholestenone.
Fluorescence was measured using a fluorescence spectrophotometer (Varian Cary
Eclipse instrument) at a temperature at 25oC in 100 mM KPi, 100 mM KCl, pH 7.5.
To measure the tryptophan fluorescence, the excitation wavelength was 280 nm
and emission data were collected from 290 to 470 nm. Slit widths for excitation and
emission monochromators were set at 5 nm each. The signal produced by a buffer
solution containing the applied concentrations of GdmHCl without the enzyme was
subtracted from the data sets containing P450 protein, to eliminate background
emission.
The spectra collected were analysed using OriginLab software. The observed
fluorescence changes were plotted against the applied GdmCl concentration. Data
were fitted using a sigmoidal function to determine the midpoint GdmCl
concentration required for 50% loss of protein tertiary structure.
2.2.12 Redox Potentiometry Studies on CYP124A1 and CYP142A1
Redox potentiometry was carried out in a Belle Technology glove box (Weymouth,
UK) under anaerobic conditions in a nitrogen atmosphere (<2 ppm oxygen). Oxygen
was removed from buffers and solutions by bubbling with O2-free nitrogen prior to

145
the experiments. CYP142A1/CYP124A1 enzymes (approx. 700 µM) were applied to
a BioRad PD-10 (GE Healthcare) desalting column in the anaerobic box, pre-
equilibrated with degassed 100 mM KPi, 200 mM KCl, 10% glycerol, pH 7.5 (titration
buffer) to remove oxygen. Titrations were carried out electrochemically in a 5 ml
final volume reaction containing 5-8 µM enzyme using sodium dithionite as the
reductant and potassium ferricyanide as the oxidant in the presence of redox
mediators (2 µM phenazine methosulfate [PMS], 7 μM hydroxynaphthoquinone
[HNQ], 0.3 μM methyl viologen [MV] and 1 μM benzyl viologen [BV]). The enzyme
sample was then left to equilibrate for ~10 minutes after each addition of reductant
before the spectral readings were taken along with the corresponding reduction
potential. Where applicable, ligands were added into the reaction at a saturating
concentration, but avoiding excess additions that might cause protein precipitation
and turbidity. This experiment was performed at 25°C according to the method of
Dutton (Dutton, 1978). Changes in absorbance at the heme Soret peak were plotted
against applied potential, corrected for the potential of the electrode used
(Ag/AgCl) against the standard hydrogen electrode (SHE) as E0 = +220 mV. All data
were fitted using the Nernst equation for the midpoint potential determination for
the heme Fe3+/Fe2+ transition. Data manipulation and analysis were performed
using Origin software (OriginLab, Northampton MA, USA).
146
𝑨 = (𝑨𝒂𝒃𝒔 + 𝑩𝒂𝒃𝒔 ∗ ((𝑬𝟎−𝑬)/𝑹𝑻𝑭))/(𝟏 + 𝟏𝟎((𝑬𝟎−𝑬)/𝑹𝑻𝑭)) (Equation 5)
Nernst equation for a 1-electron redox reaction: A – absorption of the analyte
observed at a given potential, Aabs – absorbance of oxidised P450, Babs – absorbance
of reduced P450, E0 –standard midpoint redox potential of the P450 heme iron
FeIII/FeII transition (or other relevant redox process), E – applied electrode potential
corrected against the normal hydrogen electrode (NHE), RTF – a compound
parameter of the universal gas constant (R), absolute temperature of the system (T)
and the Faraday constant (F).
2.2.13 Multi-Angle Laser Light Scattering (MALLS) Studies of Mtb P450s
MALLS analysis was carried out for CYP142A1 and CYP124A1 to estimate the
molecular weight and homogeneity of the protein. Light scattering data were
collected using a DAWN HELEOS-II laser photometer (laser wavelength 658 nm,
Wyatt, USA) and an Optilab rEX refractometer (Wyatt, USA) with a QELS dynamic
light scattering attachment, following an integrated Superdex 200 gel filtration step
(24 ml S200 10/300GL, GE Healthcare) at a flow rate of approximately 0.75 ml/min.
0.2 ml of 2.5 mg P450 enzyme was run in 10 mM Tris, 150 mM NaCl, pH 7.2. For
CYP142A1, the experiment was done with buffers containing no salt, with 150 mM
NaCl and with 300 mM NaCl, and in the presence and absence of DTT (1 mM). Data
were collected using a k5 cell type and a laser wavelength of 690 nm. Light

147
scattering intensity and eluant refractive index (concentration) were analysed using
ASTRA v5.3.4.13 software to give a weight-averaged molecular mass (MW). MALLS
experiments were carried out by Mrs Marjorie Howard at the Biomolecular
Interactions Facility in the Faculty of Life Sciences, University of Manchester, UK.
2.2.14 Differential Scanning Calorimetry Analysis of Mtb P450s
Differential scanning calorimetry (DSC) studies were performed on a Microcal VP-
DSC calorimeter (MicroCal Inc., Amherst MA, USA). Protein samples of CYP142A1
and CYP124A1 (8 µM) in 100 mM NaCl, 10 mM KPi (pH 7.2) were used for the
experiment for both ligand-free and ligand-bound samples. The buffer (filtered and
degassed) was used to baseline the equipment prior to the actual experiment. The
thermal transitions occurring during the unfolding of the P450 proteins were
recorded between 20-90oC at a 90oC/hour scan rate (10 min pre-scan thermostat).
Data were collected in repeated scans until a consistent reading was obtained.
Data collected were fitted using DSC OriginLab software (Microcal) to determine
melting temperatures or transition midpoints (Tm values), and enthalpy or
calorimetric heat change (ΔH) and van’t Hoff heat change (ΔHvH) values for protein
unfolding transitions.
148
2.2.15 Electron Paramagnetic Resonance (EPR) Spectroscopy of P450s
EPR data for the ligand-free and ligand-bound forms of CYP142A1/CYP124A1 were
obtained using a Bruker ELEXSYS E500/E580 EPR spectrometer (Bruker GmbH,
Rheinstetten, Germany) fitted with an ESR-9 liquid helium flow cryostat (Oxford
Instruments). Spectra were recorded at 10 K with a microwave power of 2.08 mW
and modulation amplitude of 1 mT. Protein samples (200 μM) were prepared in 100
mM KPi, 100 mM KCl, pH 7.5 and ligand concentrations added were at least 10x
their Kd value plus 200 M. The final ligand concentration added was typically 450
µM dissolved in 1.7 µl solvent. The software packages supplied with the EPR
instrument were used to generate the g-values for all samples. EPR spectra were
collected by Dr. Stephen Rigby, Dr. Karl Fisher and Dr. Kirsty McLean (University of
Manchester).
2.2.16 CYP124A1 Steady-State Kinetics
Steady-state kinetic assays were carried out on a Cary UV-50 spectrophotometer
(Agilent) at 340 nm. An electron transport system was set up using CYP124A1,
spinach ferredoxin (spFDX), and E. coli flavodoxin reductase (E. coli FLDR) in the
ratio 1:10:2 (CYP:spFLD:FLDR) i.e. 200 nM CYP:2 µM spFDX:400 nM E. coli FLDR
(used for the spinach system). Another set of experiments was also performed
using CYP124A1, E. coli flavodoxin (E. coli FLD) and E. coli FLDR in the same ratio
(used for the E. coli system). This assay was performed in 1 ml assay buffer
containing a 200 nM final concentration of enzyme with varied substrate
concentrations (0-50 µM) at 25°C. Enzyme rate constants for substrate-induced

149
NADPH oxidation were determined in triplicate at each substrate (cholestenone,
phytanic acid, geraniol, farnesol, geranyl geraniol, and 15 methylpalmitic acid)
concentration. Substrate-dependent consumption of NADPH was followed by the
rate of change in absorbance at 340 nm (340 = 6.21 mM-1 cm-1) and was
monitored over 5 minutes. The data generated were plotted against the relevant
substrate concentration and fitted using the Michaelis-Menten function with Origin
software.
2.2.17 P450 Protein Crystallization and Structure Determination
Following their final size exclusion purification step, CYP142A1/CYP124A1 were
immediately buffer exchanged into 10 mM Tris, pH 7.2, using a 10 DG disposable
chromatography column (Bio-Rad), and concentrated by ultrafiltration to the
concentration required for crystallography. Crystallization trials for CYP142A1 were
carried out using varying concentrations of highly purified CYP142A1 ranging from
10-30 mg/ml in 10 mM Tris pH 7.2 for both ligand-free and ligand-bound enzyme.
The initial screening of crystallization conditions was performed by using a
Molecular Dimensions screening kit (including MorpheusTM, Clear Strategy Screen
ITM, Clear Strategy Screen IITM, PACT premierTM, and JCSG-plusTM) and a Mosquito
nanolitre pipetting robot (TTP Labtech, Melbourn UK) operating with 96-well plates,
and a sitting drop vapour diffusion protocol. Experiments were set up using 400 nl
(200 nl protein drops plus 200 nl drops of mother liquor) sitting drops and trays
were sealed with crystal clear tape (Manco® Inc. Ohio, USA) and stored in a cold

150
room at 4°C. Crystals appeared within 3-14 days from several conditions. Diffraction
quality crystals were obtained by further optimization of the initial conditions and
by micro-seeding using the protocol described by (D'Arcy et al., 2007).
For native CYP142A1, the crystals giving the best diffraction were formed under the
following conditions: 15 mg/ml protein in 0.1 M sodium acetate at a pH range of
4.7–5.0, with 0.1 M potassium thiocyanate, 8-10% PEG 200 (v/v), and 8-12% PEG
550MME (v/v). For econazole-bound CYP142A1 (15 mg/ml protein supplemented
with 1.3 mM econazole), crystals grew from 0.2 M potassium thiocyanate, 0.1 M
bis-Tris propane, pH 6.5, 20% PEG 3350. Crystals of the cholestenone-bound
CYP142A1 (15 mg/ml enzyme supplemented with 1 mM cholestenone) grew from
2.4 M ammonium sulfate, 0.1 M sodium acetate, pH 5.5. For cholestenone-bound
CYP124A1 (10 mg/ml enzyme supplemented with 1 mM cholestenone), crystals
grew from 0.3 M magnesium formate dehydrate, 0.1 M bis-Tris propane, pH 5.5.
For NMR491- and 1-phenylimidazole-bound CYP142A1 (25 mg/ml enzyme
supplemented with 2 mM ligand), crystals grew from 0.2 M magnesium chloride,
0.1 M sodium chloride (pH 5.3-5.6), 6-12% PEG 20K, 8-10% PEG 550 MME. The
NMR170-bound and NMR623-bound CYP142A1 structures were solved by back-
soaking native crystals in 24% PEG 550 MME, 0.1 M sodium acetate at pH 4.5, 0.1 M
potassium thiocyanate.
Crystals were flash-cooled in liquid nitrogen with Paratone N as cryoprotectant.
Diffraction data were collected at the Diamond Light Source (Oxford, UK) by Dr.
Colin Levy (University of Manchester). The data were scaled and integrated using

151
the Xia 2 package (Kabsch, 1993). Structures were solved by molecular replacement
(McCoy et al., 2007) with the previously solved CYP142A1 crystal structure as a
search model (PDB 2XKR). The structures were built using COOT (Emsley and
Cowtan, 2004) in conjunction with MOLPROBITY (Davis et al., 2007) and refined
using Phenix (Adams et al., 2010) to resolutions of 1.70 Å (NMR170-bound
CYP142A1), 1.91 Å (NMR491-bound CYP142A1), 2.0 Å (NMR623-bound CYP142A1),
1.34 Å (1PIM-bound CYP142A1), 2.09Å (cholestenone-bound CYP142A1), 2.12 Å
(econazole-bound CYP142A1) and 2.54 Å (cholestenone-bound CYP124A1).
Diagrams and models in this thesis were made using PyMol™ (DeLano, 2002)
molecular graphics software using CCP4 mesh files and PDB files.
2.2.18 CYP142A1 Nano-ESI Mass Spectrometry
Protein stock solutions (20 μM) were prepared by dilution of purified CYP142A1
(638 μM) in 200 mM ammonium acetate buffer, pH 7.0. Samples were buffer
exchanged by size exclusion chromatography using Micro Biospin 6 columns,
molecular weight cut-off 6 kDa (BioRad, Hemel Hempstead, UK). Azole compounds
and MEK ligands were prepared as stock solutions in d6-DMSO at 0.4-2 mM
concentrations. Cholestenone (0.4-5 mM) stock solutions were prepared in
absolute ethanol and DTT (2-20 mM) was dissolved directly in 200 mM ammonium
acetate buffer, pH 7.0. Ligand-protein samples were prepared by diluting protein
stocks (10 μl) and ligand stocks (0.5 μl) with ammonium acetate buffer (9.5 μl) to
give final concentrations of 10 μM CYP142A1, 10-125 μM ligand and 2.5% v/v d6-
DMSO or ethanol. Samples containing DTT were prepared by diluting protein stocks

152
(10 μl) with stocks of DTT (10 μl) to give a final concentration of 10 μM CYP142A1
and 1-10 mM DTT. Mass spectra were recorded on a Synapt HDMS instrument
(Waters UK Ltd., Manchester, UK). Capillaries for nano-ESI were purchased from
ThermoFisher (Hemel Hempstead, UK). Capillary tips were cut under a stereo
microscope to give inner diameters of 1−5 μm and then loaded with 2.5 μl of
sample solutions. Given below are the general instrumental conditions used to
acquire the reported spectra. However, parameters were recorded and varied over
the course of each experiment to observe the strength of protein-ligand complexes
under different ionising strengths. All measurements were carried out in a positive
ion mode with ion source temperature of 20oC. A capillary voltage of 1.5 kV, cone
voltage of 40 V and extraction cone voltage of 4.8 V was applied to perform
nanoESI. All reported spectra were collected with a trap collision energy 12-30 V,
transfer collision energy 12-30 V, IMS pressure 5.02 × 10⁻¹ mbar, TOF analyser
pressure 1.17 × 10⁻⁶ mbar. External calibration of the spectra was achieved using
caesium iodide at 100 mg ml−1 in water. Data acquisition and processing were
performed using Micromass MassLynx v4.1. Mass differences resulting from ligand
binding were calculated from the unbound protein peak internal to each spectrum.
The unbound protein peak was compared to the relevant 2.5% v/v d6-DMSO or
2.5% v/v ethanol control spectra for consistency. Mass differences were divided by
the molecular weight of the ligand to calculate binding stoichiometry.

153
Chapter 3
Biochemical and Biophysical Characterization of P450 CYP142A1: An Example of Functional Redundancy in the
Mycobacterium tuberculosis Cholesterol Oxidases? 3.1 Introduction
Cholesterol is important in all facets of life and plays a central role in many
physiological processes (McLean et al., 2012). Its homoeostasis is essential for brain
and central nervous system function (McLean et al., 2012). Cholesterol and related
sterols are found everywhere throughout the environment (Garcia-Fernandez
(Garcia-Fernandez et al., 2013). They are present in cytoplasmic membranes and
play key roles as precursors of vitamin D, the bile acids and all the sterol hormones
(Garcia-Fernandez et al., 2013). Cholesterol is an essential molecule with many
roles involving cytochrome P450 enzymes (McLean et al., 2012).
In Mtb, cholesterol functions as an important source of energy during both latent
and chronic infection, and recent data have revealed that Mtb uses P450s to initiate
breakdown of host cholesterol for this purpose (Ouellet et al., 2011, Johnston et al.,
2010). The mycobacterial metabolism of cholesterol goes through two reaction
stages: firstly sterol side-chain activation/degradation and secondly steroid ring
opening (van der Geize and Dijkhuizen, 2004). Three key Mtb P450s are involved in
the first reaction and these are CYP125A1, CYP142A1 and CYP124A1 (hereafter,
referred to as ‘cholesterol oxidases’) (Johnston et al., 2010). These cholesterol
oxidases sequentially metabolise the cholesterol side chain at the C27 position to
154
the carboxylic acid state; first to an alcohol, then to an aldehyde and finally to the
acid moiety (Driscoll et al., 2010). CYP125A1 is the enzyme that plays the major
role in this cholesterol side chain degradation in Mtb CDC1551, but not in the Mtb
H37Rv strain (Johnston et al., 2010). Functional redundancy in cholesterol oxidation
capacity has been previously reported in Mtb H37Rv (but not in M. bovis BCG),
indicating that the H37Rv strain possesses compensatory enzyme(s) that allow it to
survive in the absence of a functional CYP125A1 (Johnston et al., 2010, Capyk et al.,
2009). However, studies by Johnston et al. revealed that a compensatory role in
cholesterol side chain oxidation was played by CYP142A1 through genetic
complementation of a CDC1551 ∆cyp125A1 strain by introduction of the Mtb
CYP142A1 gene (Johnston et al., 2010). Differences in the expression profiles of the
three cholesterol oxidase enzymes in the wild-type Mtb H37Rv strain revealed that,
though all three Mtb strains can oxidize cholesterol, only CYP142A1 (but not
CYP124A1) can complement the defect associated with the absence of CYP125A1
(Johnston et al., 2010). This indicates that CYP142A1 provides a functionally
redundant cholesterol side chain catabolic activity that can fully compensate for
loss or absence of CYP125A1 activity in the H37Rv ∆cyp125A1 strain (Johnston et
al., 2010). To further validate this hypothesis, CYP142A1 and CYP125A1 were shown
to be part of a gene cluster involved in lipid catabolism and suggested to play a
major role in the metabolism of host lipids, including cholesterol (Johnston et al.,
2010, Ouellet et al., 2010b).
In view of the gene location of CYP142A1 and its role in functional redundancy, a
vast amount of knowledge is still needed to unravel the role played by this enzyme
155
in the pathogenicity and survival in the human macrophage during infection and
latency. This chapter hence aims to validate CYP142A1as a cholesterol oxidase using
series of biophysical/biochemical techniques and to evaluate its molecular
interaction with azole/novel inhibitors identified via fragment based screening.
Furthermore, recent studies by Manca et al., 1999 also revealed Mtb CDC1551 to
be less virulent but more immunogenic than the H37Rv strain, in that post-infection
it induces a rapid and vigorous cytokine response which may explain the high
frequency and large size of purified protein derivative (PPD) responses following
exposure to patients infected with the CDC1551 strain (Manca et al., 1999). A
similar differential response was induced on exposure to lipids from the two Mtb
strains. The CDC1551 strain of Mtb differs from the H37Rv strain in having a
mutation that inactivates CYP142 enzyme production. Thus, it is possible that
differences in lipid metabolism due to the presence or absence of CYP142 activity
result in different sterol/lipid profiles that influence the strength of the host
immune response.
The crystal structure of CYP142A1 has previously been solved (Driscoll et al., 2010).
However, in a later chapter of this thesis, the crystal structure of CYP142A1 in
complex with cholestenone will be reported. These studies will provide additional
insights into the cholesterol catabolic role of this enzyme. The results in this chapter
provide a broad analysis of the properties of CYP142A1, employing both biophysical
and biochemical techniques to further characterize an enzyme with a potentially
functionally redundant role in cholesterol catabolism in Mtb H37Rv (i.e. an ability to
156
compensate for deficiencies in CYP125A1 activity and to enable continued Mtb
growth/survival using cholesterol as a carbon source). The data presented here
include studies to investigate the binding affinities of CYP142A1 to a variety of
substrates and inhibitors. Specific inhibitors of CYP142A1 could be used as chemical
tools to reveal how this enzyme relates to Mtb infection, growth and persistence in
the human host. They may also have potential as novel antibiotics that target
CYP142A1 and inhibit Mtb utilization of host cholesterol. Such compounds would
obviously be of even greater potency if they were also active against the other
major Mtb cholesterol 27-oxidase, CYP125A1.
Hence, CYP142A1 interactions with compound hits from fragment-based screening
studies (in collaboration with researchers from the University of Cambridge) were
also analysed, in order to allow for identification of small chemical ligands that bind
specifically to the active site of CYP142A1.
The UV-visible spectrum of a ligand-bound cytochrome P450 enzyme usually
provides a simple and accurate method for the determination of the nature of the
interaction between the ligand and the P450 (Locuson et al., 2007). The binding of
azole inhibitors and other nitrogen heterocycles to P450s usually involves
displacement of a water molecule (weakly ligated as an axial ligand to the heme
iron) by a basic nitrogen on the heterocyclic ring of the inhibitor (McLean et al.,
2002b). This leads to a shift in the Soret absorption maximum spectrum of the P450
to a longer wavelength, also known as a type II shift or a red shift. On the other
hand, the binding of substrates, in addition to displacing off the water molecule on
157
the sixth axial position on the heme, switches the ferric heme iron from being hexa-
cordinated to penta-cordinated. This leads to a shift in the Soret absorption
maximum spectrum of the P450 to a shorter wavelength, also known as a type I
shift or a blue shift.
The structure of CYP142A1 was previously published as a monomer (Driscoll et al.,
2010). However, results from this work revealed that CYP142A1 can dimerize in
solution, and that the dimerization can be disrupted by the reducing agent DTT
(dithiothreitol). Analysis of the stability of CYP142A1 was also crucial for this work,
because this enzyme would be required in its most stable form for crystallographic
studies. Hence, results from stability assays on CYP142A1 are also presented in this
chapter.
The overall aims of the work in this chapter were to provide a detailed study of the
properties of CYP142A1, including analysis of its binding to substrates and
inhibitors, including fragment compounds with a view to developing novel
inhibitors. Further aims were to gain a detailed understanding of the
thermodynamic, hydrodynamic and spectroscopic properties of this P450, including
its aggregation state in solution. In particular, studies were aimed at defining the
coordination state of its heme iron and how this property, along with the overall
thermal stability of CYP142A1, is influenced by ligand binding.
158
3.2 Results and Discussion 3.2.1 Expression and purification of CYP142A1 Preliminary CYP142A1 expression trials were investigated under different cell
growth and induction conditions, and these conditions were optimised as described
in the Materials and Methods (section 2.2.3-2.2.5). The results obtained showed
that more soluble protein was produced from growth in 2YT medium using C41
(DE3)/pET15b-CYP142A1 than was the case in other media and using other E. coli
strains. Furthermore, CYP142A1 was purified to homogeneity via three
chromatographic steps, as described in the Materials and Methods (section 2.2.6).
The first step used was affinity chromatography using a Ni-NTA column, followed by
affinity for Hydroxyapatite (HA) and a final “polishing step” using size exclusion
chromatography. The mechanisms of these chromatographic techniques are
described in more detail in the next chapter.
For nickel affinity purification, CYP142A1 crude cell extract was loaded onto a Ni-
NTA column, and red (heme-containing) protein was seen to bind. Following
loading of the sample and washing the column with the loading buffer, CYP142A1
was eluted with 40 mM, 60 mM and then 100 mM imidazole washes in 50 mM KPi
buffer (pH 8.0), containing 250 mM KCl and 10% glycerol. A large CYP142A1 band
was seen by SDS-PAGE analysis following the wash at 40 mM imidazole, and this
was confirmed by UV-visible spectral results, which showed the highest intensity
Soret peak of the P450 heme at a wavelength of 424 nm, signifying the presence of
substantial amounts of a P450 protein. P450s in their low-spin ferric state typically
have a Soret absorption maximum at ~418 nm, and thus the peak at 424 is likely a
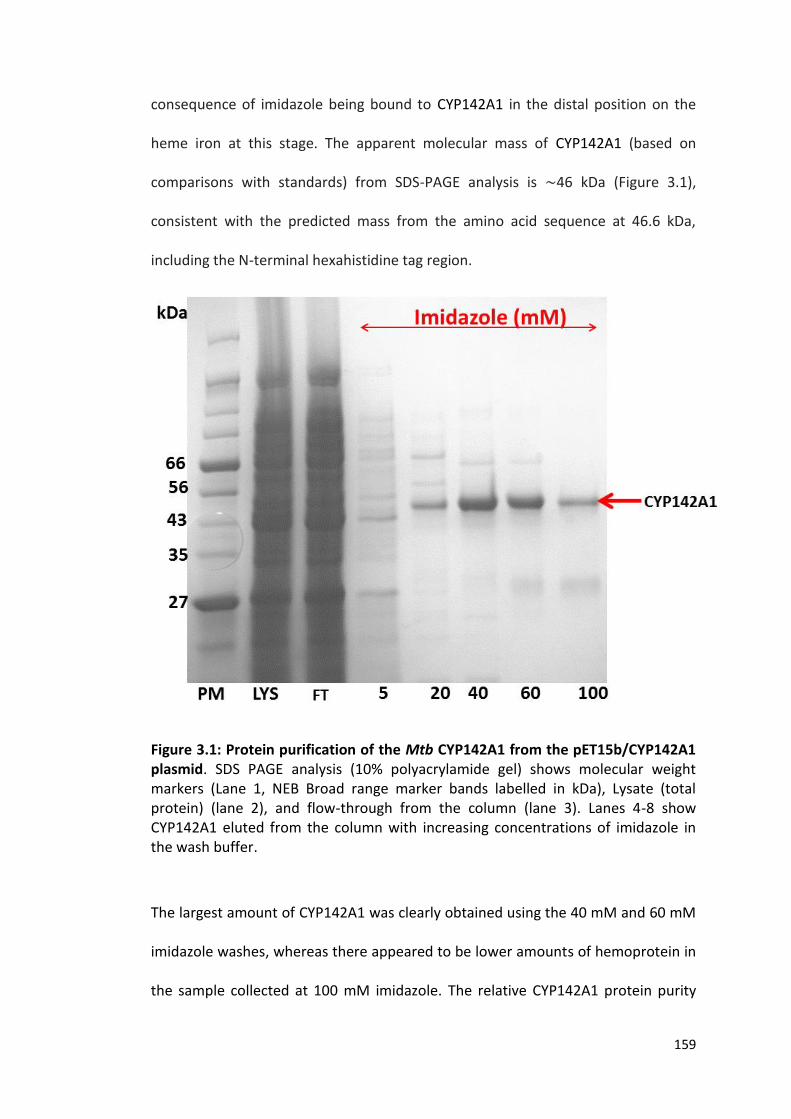
159
consequence of imidazole being bound to CYP142A1 in the distal position on the
heme iron at this stage. The apparent molecular mass of CYP142A1 (based on
comparisons with standards) from SDS-PAGE analysis is ∼46 kDa (Figure 3.1),
consistent with the predicted mass from the amino acid sequence at 46.6 kDa,
including the N-terminal hexahistidine tag region.
Figure 3.1: Protein purification of the Mtb CYP142A1 from the pET15b/CYP142A1 plasmid. SDS PAGE analysis (10% polyacrylamide gel) shows molecular weight markers (Lane 1, NEB Broad range marker bands labelled in kDa), Lysate (total protein) (lane 2), and flow-through from the column (lane 3). Lanes 4-8 show CYP142A1 eluted from the column with increasing concentrations of imidazole in the wash buffer.
The largest amount of CYP142A1 was clearly obtained using the 40 mM and 60 mM
imidazole washes, whereas there appeared to be lower amounts of hemoprotein in
the sample collected at 100 mM imidazole. The relative CYP142A1 protein purity
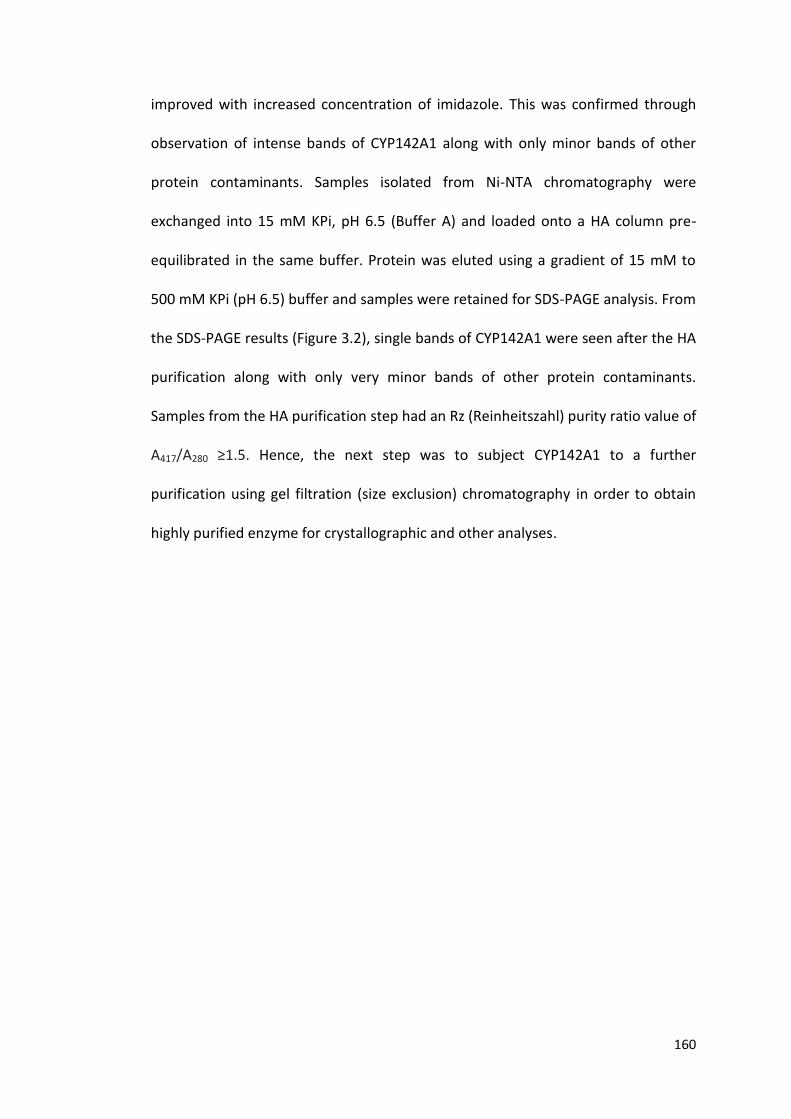
160
improved with increased concentration of imidazole. This was confirmed through
observation of intense bands of CYP142A1 along with only minor bands of other
protein contaminants. Samples isolated from Ni-NTA chromatography were
exchanged into 15 mM KPi, pH 6.5 (Buffer A) and loaded onto a HA column pre-
equilibrated in the same buffer. Protein was eluted using a gradient of 15 mM to
500 mM KPi (pH 6.5) buffer and samples were retained for SDS-PAGE analysis. From
the SDS-PAGE results (Figure 3.2), single bands of CYP142A1 were seen after the HA
purification along with only very minor bands of other protein contaminants.
Samples from the HA purification step had an Rz (Reinheitszahl) purity ratio value of
A417/A280 ≥1.5. Hence, the next step was to subject CYP142A1 to a further
purification using gel filtration (size exclusion) chromatography in order to obtain
highly purified enzyme for crystallographic and other analyses.
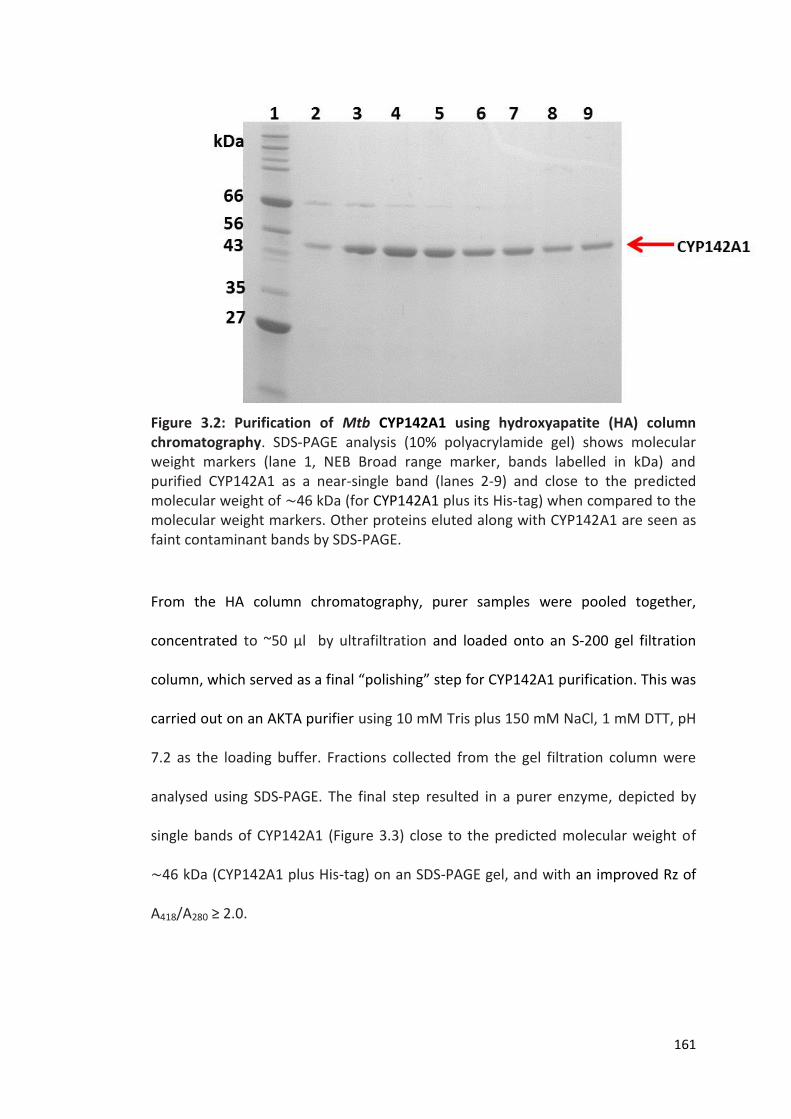
161
Figure 3.2: Purification of Mtb CYP142A1 using hydroxyapatite (HA) column chromatography. SDS-PAGE analysis (10% polyacrylamide gel) shows molecular weight markers (lane 1, NEB Broad range marker, bands labelled in kDa) and purified CYP142A1 as a near-single band (lanes 2-9) and close to the predicted molecular weight of ∼46 kDa (for CYP142A1 plus its His-tag) when compared to the molecular weight markers. Other proteins eluted along with CYP142A1 are seen as faint contaminant bands by SDS-PAGE.
From the HA column chromatography, purer samples were pooled together,
concentrated to ~50 µl by ultrafiltration and loaded onto an S-200 gel filtration
column, which served as a final “polishing” step for CYP142A1 purification. This was
carried out on an AKTA purifier using 10 mM Tris plus 150 mM NaCl, 1 mM DTT, pH
7.2 as the loading buffer. Fractions collected from the gel filtration column were
analysed using SDS-PAGE. The final step resulted in a purer enzyme, depicted by
single bands of CYP142A1 (Figure 3.3) close to the predicted molecular weight of
∼46 kDa (CYP142A1 plus His-tag) on an SDS-PAGE gel, and with an improved Rz of
A418/A280 ≥ 2.0.
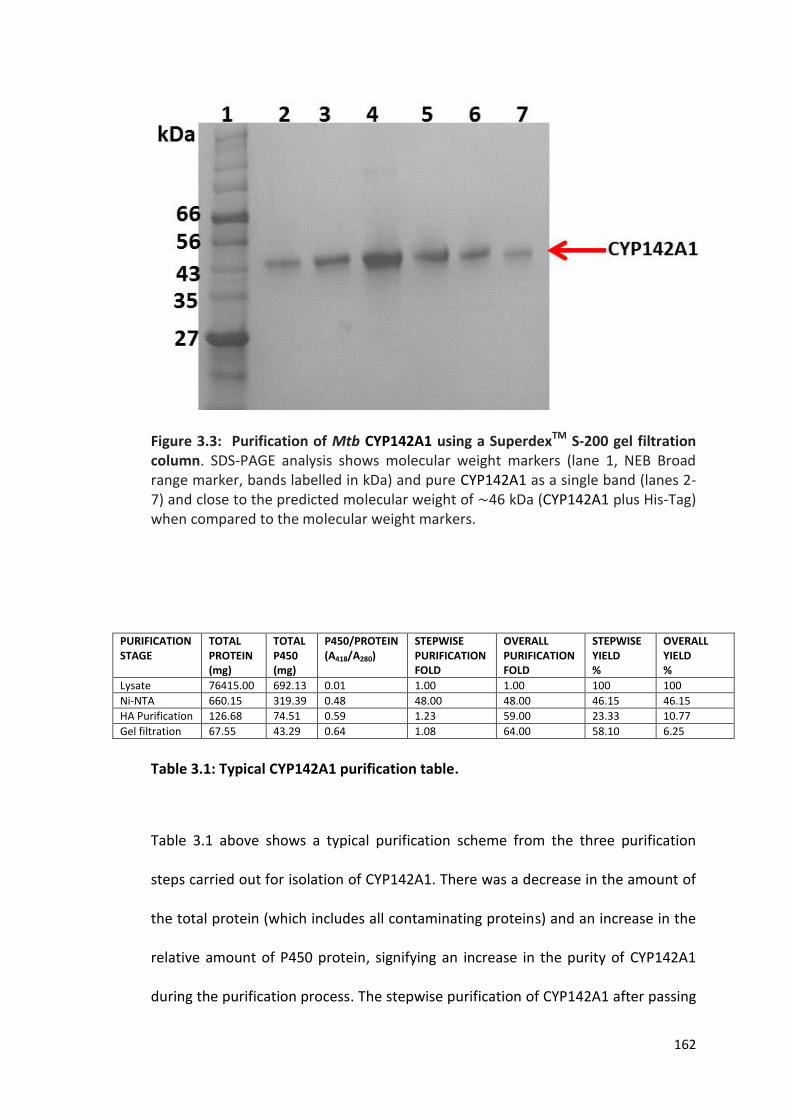
162
Figure 3.3: Purification of Mtb CYP142A1 using a SuperdexTM S-200 gel filtration column. SDS-PAGE analysis shows molecular weight markers (lane 1, NEB Broad range marker, bands labelled in kDa) and pure CYP142A1 as a single band (lanes 2-7) and close to the predicted molecular weight of ∼46 kDa (CYP142A1 plus His-Tag) when compared to the molecular weight markers.
PURIFICATION STAGE
TOTAL PROTEIN (mg)
TOTAL P450 (mg)
P450/PROTEIN (A418/A280)
STEPWISE PURIFICATION FOLD
OVERALL PURIFICATION FOLD
STEPWISE YIELD %
OVERALL YIELD %
Lysate 76415.00 692.13 0.01 1.00 1.00 100 100
Ni-NTA 660.15 319.39 0.48 48.00 48.00 46.15 46.15
HA Purification 126.68 74.51 0.59 1.23 59.00 23.33 10.77
Gel filtration 67.55 43.29 0.64 1.08 64.00 58.10 6.25
Table 3.1: Typical CYP142A1 purification table.
Table 3.1 above shows a typical purification scheme from the three purification
steps carried out for isolation of CYP142A1. There was a decrease in the amount of
the total protein (which includes all contaminating proteins) and an increase in the
relative amount of P450 protein, signifying an increase in the purity of CYP142A1
during the purification process. The stepwise purification of CYP142A1 after passing
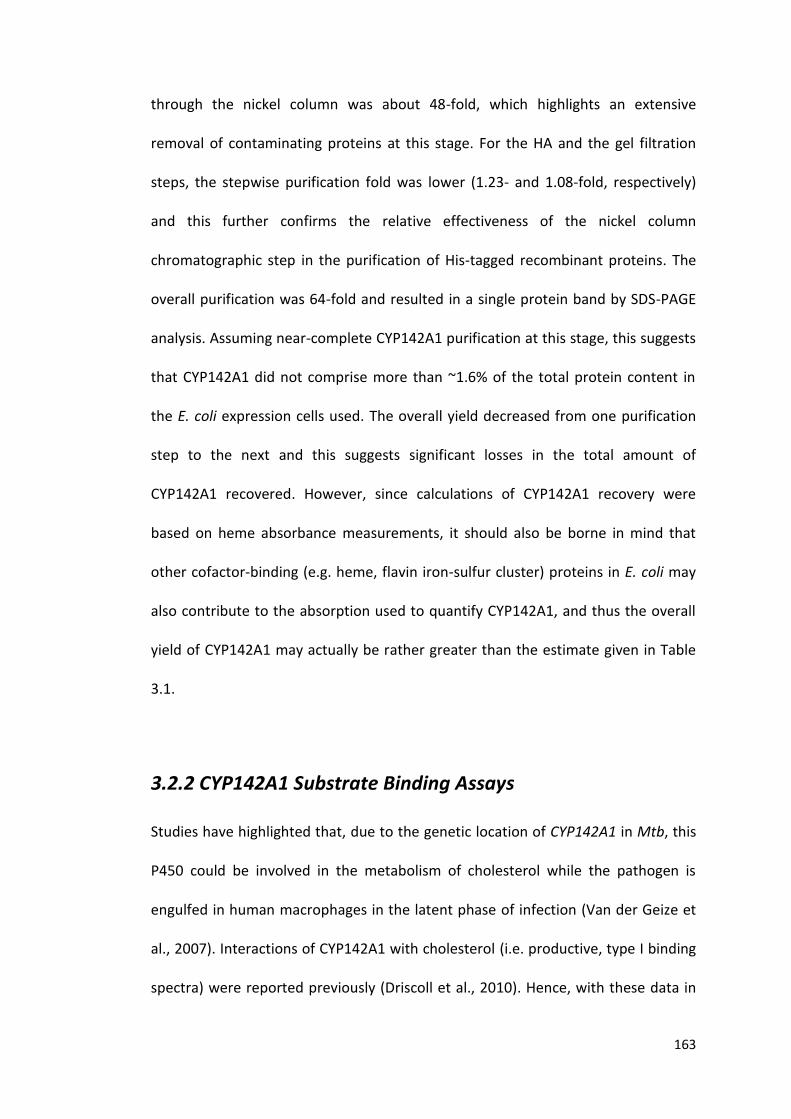
163
through the nickel column was about 48-fold, which highlights an extensive
removal of contaminating proteins at this stage. For the HA and the gel filtration
steps, the stepwise purification fold was lower (1.23- and 1.08-fold, respectively)
and this further confirms the relative effectiveness of the nickel column
chromatographic step in the purification of His-tagged recombinant proteins. The
overall purification was 64-fold and resulted in a single protein band by SDS-PAGE
analysis. Assuming near-complete CYP142A1 purification at this stage, this suggests
that CYP142A1 did not comprise more than ~1.6% of the total protein content in
the E. coli expression cells used. The overall yield decreased from one purification
step to the next and this suggests significant losses in the total amount of
CYP142A1 recovered. However, since calculations of CYP142A1 recovery were
based on heme absorbance measurements, it should also be borne in mind that
other cofactor-binding (e.g. heme, flavin iron-sulfur cluster) proteins in E. coli may
also contribute to the absorption used to quantify CYP142A1, and thus the overall
yield of CYP142A1 may actually be rather greater than the estimate given in Table
3.1.
3.2.2 CYP142A1 Substrate Binding Assays
Studies have highlighted that, due to the genetic location of CYP142A1 in Mtb, this
P450 could be involved in the metabolism of cholesterol while the pathogen is
engulfed in human macrophages in the latent phase of infection (Van der Geize et
al., 2007). Interactions of CYP142A1 with cholesterol (i.e. productive, type I binding
spectra) were reported previously (Driscoll et al., 2010). Hence, with these data in
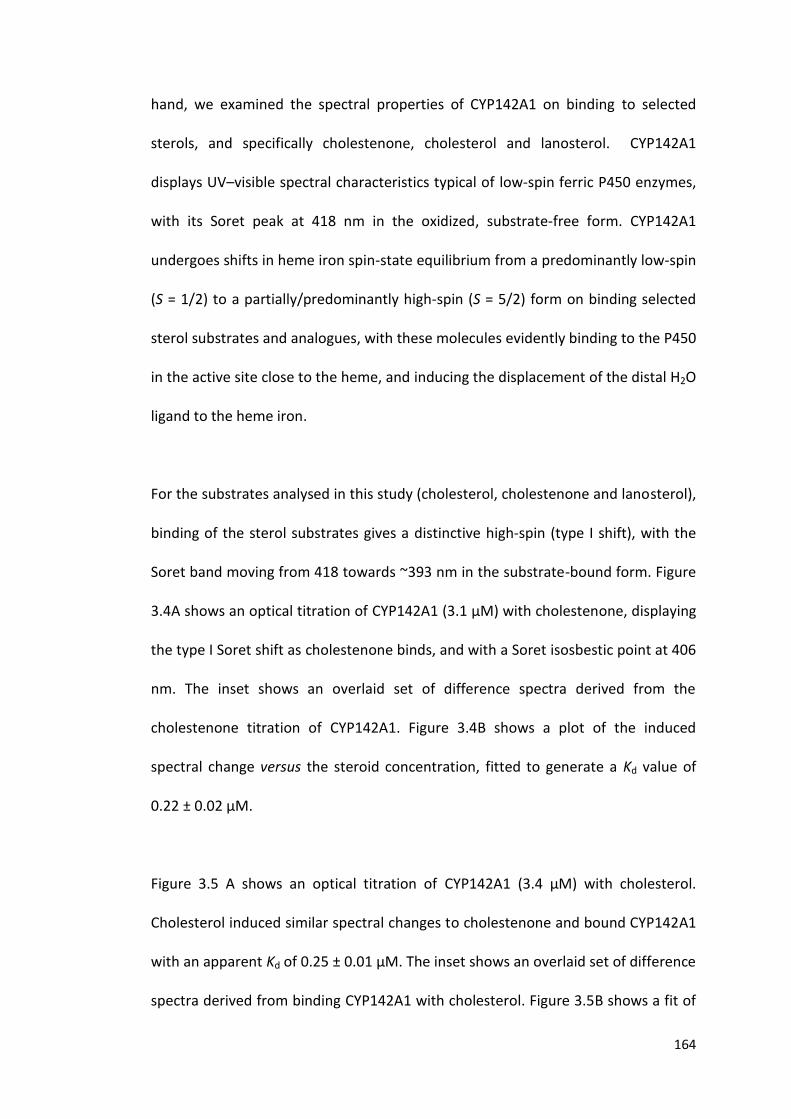
164
hand, we examined the spectral properties of CYP142A1 on binding to selected
sterols, and specifically cholestenone, cholesterol and lanosterol. CYP142A1
displays UV–visible spectral characteristics typical of low-spin ferric P450 enzymes,
with its Soret peak at 418 nm in the oxidized, substrate-free form. CYP142A1
undergoes shifts in heme iron spin-state equilibrium from a predominantly low-spin
(S = 1/2) to a partially/predominantly high-spin (S = 5/2) form on binding selected
sterol substrates and analogues, with these molecules evidently binding to the P450
in the active site close to the heme, and inducing the displacement of the distal H2O
ligand to the heme iron.
For the substrates analysed in this study (cholesterol, cholestenone and lanosterol),
binding of the sterol substrates gives a distinctive high-spin (type I shift), with the
Soret band moving from 418 towards ~393 nm in the substrate-bound form. Figure
3.4A shows an optical titration of CYP142A1 (3.1 μM) with cholestenone, displaying
the type I Soret shift as cholestenone binds, and with a Soret isosbestic point at 406
nm. The inset shows an overlaid set of difference spectra derived from the
cholestenone titration of CYP142A1. Figure 3.4B shows a plot of the induced
spectral change versus the steroid concentration, fitted to generate a Kd value of
0.22 ± 0.02 μM.
Figure 3.5 A shows an optical titration of CYP142A1 (3.4 μM) with cholesterol.
Cholesterol induced similar spectral changes to cholestenone and bound CYP142A1
with an apparent Kd of 0.25 ± 0.01 μM. The inset shows an overlaid set of difference
spectra derived from binding CYP142A1 with cholesterol. Figure 3.5B shows a fit of

165
the induced absorption change versus cholesterol concentration. Due to the low
solubility of cholesterol, the conversion to the high-spin state was not as extensive
when compared to that for cholestenone. As the optical titration continued with
higher concentrations of cholesterol, some reconversion of heme absorption
towards the low-spin state was also observed.
Figure 3.6 shows an optical titration of CYP142A1 (3.5 μM) with lanosterol.
Lanosterol is a substrate for the Mtb sterol demethylase CYP51B1, and for other
eukaryotic lanosterol demethylases - which catalyse a three-step reaction of
oxidative removal of the 14-α-methyl group from lanosterol to form ergosterol
(Lepesheva et al., 2008). The data here also show tight binding of lanosterol to
CYP142A1 but relatively weaker as compared to cholestenone and cholesterol with
a Kd value of 7.50 ± 0.99 μM.
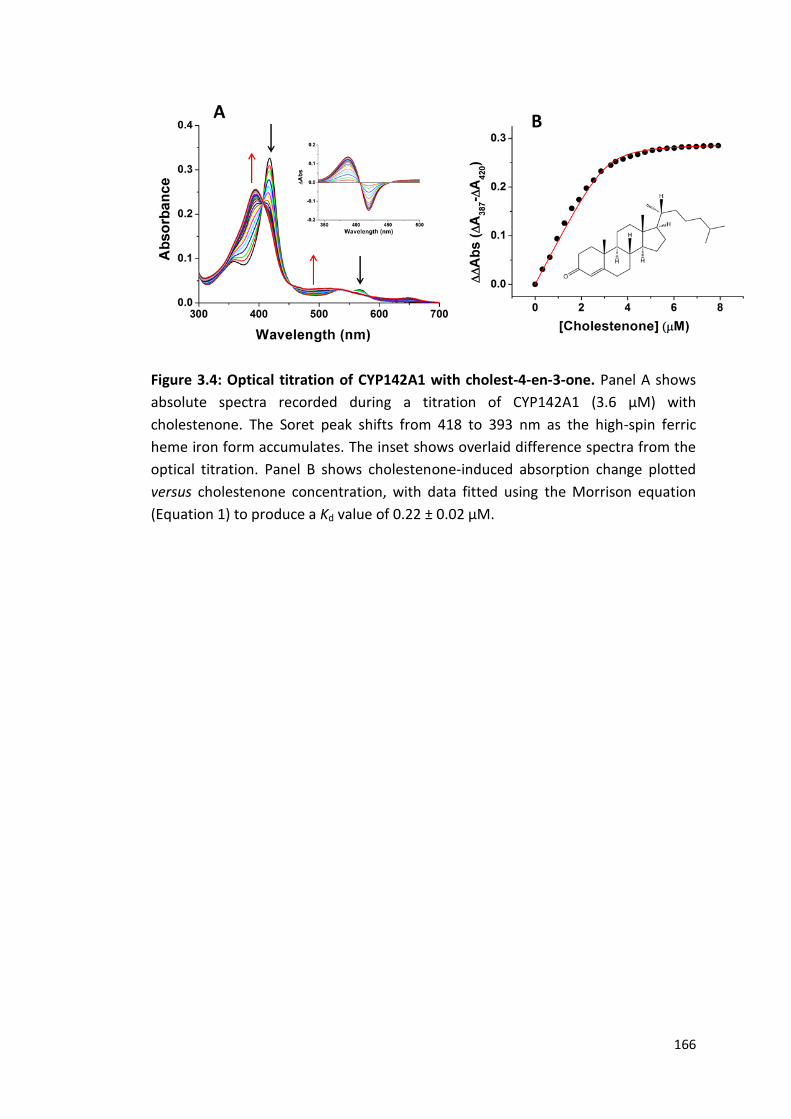
166
Figure 3.4: Optical titration of CYP142A1 with cholest-4-en-3-one. Panel A shows
absolute spectra recorded during a titration of CYP142A1 (3.6 μM) with
cholestenone. The Soret peak shifts from 418 to 393 nm as the high-spin ferric
heme iron form accumulates. The inset shows overlaid difference spectra from the
optical titration. Panel B shows cholestenone-induced absorption change plotted
versus cholestenone concentration, with data fitted using the Morrison equation
(Equation 1) to produce a Kd value of 0.22 ± 0.02 μM.
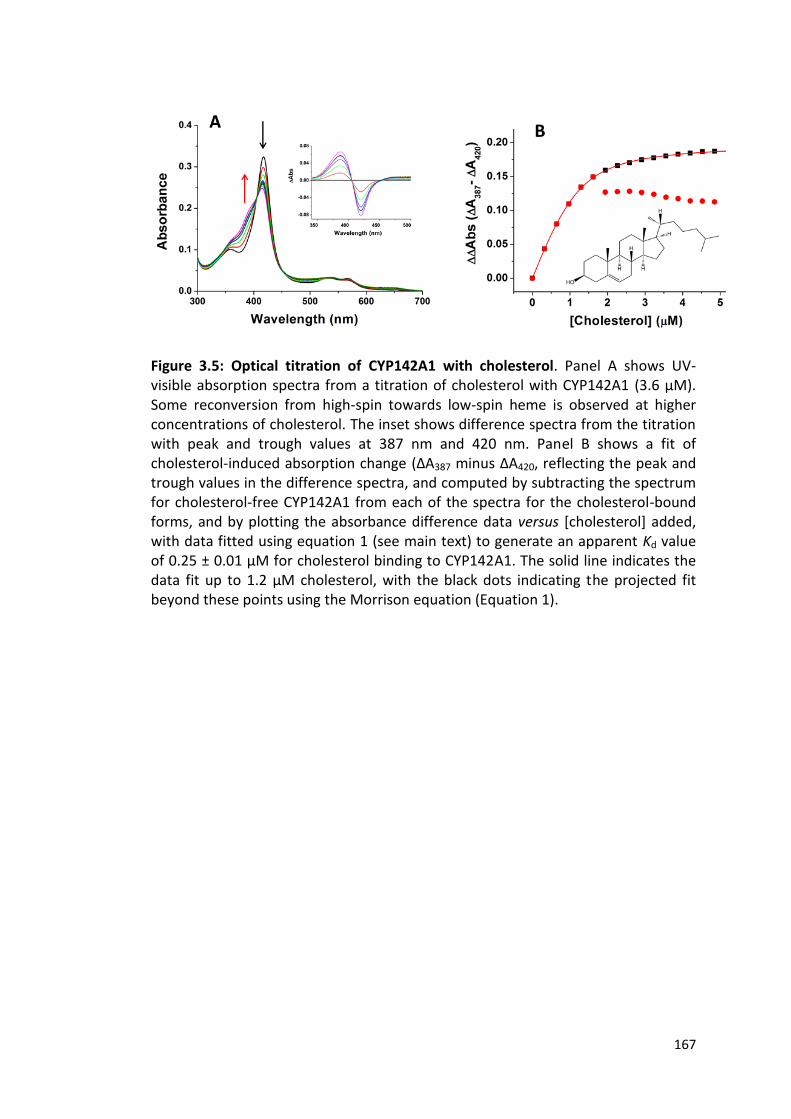
167
Figure 3.5: Optical titration of CYP142A1 with cholesterol. Panel A shows UV-visible absorption spectra from a titration of cholesterol with CYP142A1 (3.6 μM). Some reconversion from high-spin towards low-spin heme is observed at higher concentrations of cholesterol. The inset shows difference spectra from the titration with peak and trough values at 387 nm and 420 nm. Panel B shows a fit of cholesterol-induced absorption change (ΔA387 minus ΔA420, reflecting the peak and trough values in the difference spectra, and computed by subtracting the spectrum for cholesterol-free CYP142A1 from each of the spectra for the cholesterol-bound forms, and by plotting the absorbance difference data versus [cholesterol] added, with data fitted using equation 1 (see main text) to generate an apparent Kd value of 0.25 ± 0.01 μM for cholesterol binding to CYP142A1. The solid line indicates the data fit up to 1.2 μM cholesterol, with the black dots indicating the projected fit beyond these points using the Morrison equation (Equation 1).
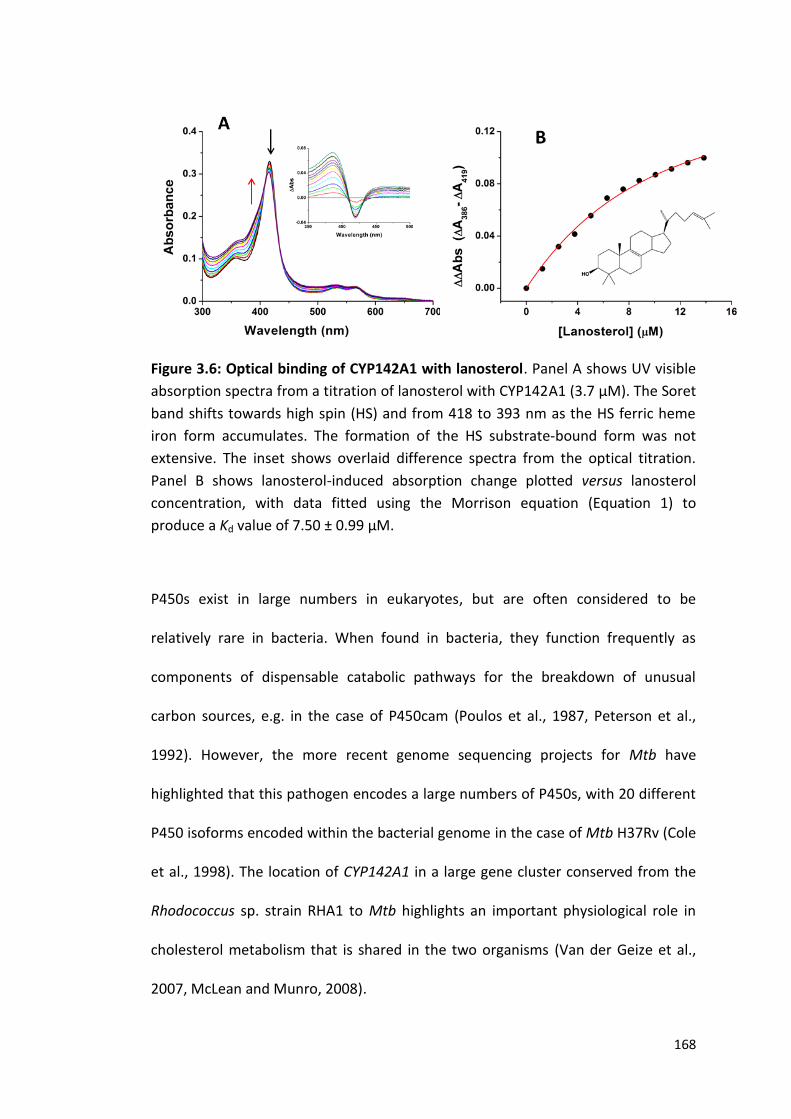
168
Figure 3.6: Optical binding of CYP142A1 with lanosterol. Panel A shows UV visible
absorption spectra from a titration of lanosterol with CYP142A1 (3.7 μM). The Soret
band shifts towards high spin (HS) and from 418 to 393 nm as the HS ferric heme
iron form accumulates. The formation of the HS substrate-bound form was not
extensive. The inset shows overlaid difference spectra from the optical titration.
Panel B shows lanosterol-induced absorption change plotted versus lanosterol
concentration, with data fitted using the Morrison equation (Equation 1) to
produce a Kd value of 7.50 ± 0.99 μM.
P450s exist in large numbers in eukaryotes, but are often considered to be
relatively rare in bacteria. When found in bacteria, they function frequently as
components of dispensable catabolic pathways for the breakdown of unusual
carbon sources, e.g. in the case of P450cam (Poulos et al., 1987, Peterson et al.,
1992). However, the more recent genome sequencing projects for Mtb have
highlighted that this pathogen encodes a large numbers of P450s, with 20 different
P450 isoforms encoded within the bacterial genome in the case of Mtb H37Rv (Cole
et al., 1998). The location of CYP142A1 in a large gene cluster conserved from the
Rhodococcus sp. strain RHA1 to Mtb highlights an important physiological role in
cholesterol metabolism that is shared in the two organisms (Van der Geize et al.,
2007, McLean and Munro, 2008).
169
Studies have demonstrated that cholesterol, which is a major source of carbon for
Mtb during infection, also plays a crucial role in aiding the entry of the pathogen
into human macrophages (McLean et al., 2012, Chang et al., 2009). The P450
enzymes implicated in the early stages of Mtb cholesterol metabolism are
CYP125A1, CYP142A1 and CYP124A1 (Johnston et al., 2010). These P450 isoforms
have also been demonstrated to perform hydroxylation at the cholesterol C27
position and also further sequential oxidations at the same position (for both
cholesterol and cholestenone) via an aldehyde product to form the carboxylic acid
moiety, which prepares the cholesterol side chain for β-oxidation (Ouellet et al.,
2010a, McLean et al., 2009, Capyk et al., 2009, Driscoll et al., 2010). Studies have
also shown that steroid ring metabolism cannot proceed when the sterol has a full-
length aliphatic side chain, and thus these P450s perform a crucial role in initiating
cholesterol breakdown. Capyk et al. carried out a study to compare the growth of
CYP125 gene deletion strains and the wild-type forms of M. bovis BCG and Mtb
H37Rv on cholesterol. While M. bovis BCG grew on cholesterol and cholestenone,
the CYP125 deletion strain failed to grow (Capyk et al., 2009). For Mtb H37Rv,
however, the ∆CYP125A1 strain grew on cholesterol, suggesting a compensatory
mechanism involved in the metabolism of cholesterol in Mtb H37Rv. Recent studies
have also suggested that while CYP125A1 is the major enzyme involved in this side
chain hydroxylation, CYP142A1 could also function as compensatory enzyme
(McLean et al., 2012). In this study, the spectral changes on binding of cholesterol,
cholest-4-en-3-one (cholestenone) and lanosterol to this P450 enzyme were
investigated. Cholestenone and cholesterol exhibited tight binding to CYP142A1,
with Kd values of 0.22 ± 0.02 μM and 0.25 ± 0.01 μM, respectively, and a Soret
170
maximum shift towards a shorter wavelength, consistent with displacement of a
water ligand from the heme iron to form a 5-coordinate high-spin form of the ferric
heme iron. These data further suggest these sterols to be the major substrates for
CYP142A1, which is consistent with results presented in previous studies that
indicate CYP142A1 is a cholesterol hydroxylase. Lanosterol, a major substrate for
CYP51 enzymes (including the Mtb CYP51B1 isoform), was also used in this study to
investigate the behaviour of other sterols with CYP142A1. This also showed a
relatively low Kd value (7.50 ± 0.99 μM) for binding to CYP142A1, thus signifying
that this structurally diverse sterol retains capacity to bind to CYP142A1, albeit with
a Kd value ~30-fold weaker than those for cholesterol and cholestenone. Moreover,
the binding mode for lanosterol results in a much less extensive shift towards the
high-spin state, indicating that while CYP142A1 can bind to all three of these
sterols, it has a clear preference for cholesterol/cholestenone over lansoterol.
3.2.3 Inhibitor Binding Assays CYP142A1 binds to a range of imidazole and triazole antifungals, inducing a type II
(Soret red shift). In this study, on binding CYP142A1 with the azole inhibitors, the
Soret band shifted from 418 ± 1 nm (inhibitor-free) to ~423 ± 1 nm (azole-
saturated). Highest affinity was observed for bifonazole, clotrimazole, miconazole
and econazole (Kd values of 0.55 ± 0.10 μM, 1.14 ± 0.10 μM, 1.42 ± 0.16 μM, and
2.28 ± 0.19 μM, respectively) (Figure 3.7-3.11) (Table 3.2).
For these four tight-binding azoles, the computed spectral changes associated with
azole ligation occurred almost linearly with increasing azole concentrations in the
171
lower concentration range, and then sharply reached a plateau, indicative of tight,
near-stoichiometric binding to the P450. Optical titrations with fluconazole
revealed weaker binding of this azole to CYP142A1, with a Kd value of 309.1 ± 36.3
μM. Ketoconazole bound to CYP142A1 with a higher affinity than fluconazole, with
a Kd value of 11.95 ± 0.64 μM.
The binding of imidazole (283.3 ± 6.4 µM) to CYP142A1 was considerably weaker
than to the other azoles (apart from fluconazole), indicating that the high affinity of
the azole antifungals for CYP142A1 is determined primarily by favourable
interactions between the bulky, polycyclic azole antifungals and the hydrophobic
residues in the largely apolar active site of CYP142A1, rather than being driven
mainly by ligation of the azole group to the ferric heme iron. No significant optical
changes were observed on titration of CYP142A1 with the more polar voriconazole
and the bulky itraconazole, suggesting that these drugs bind much more weakly to
CYP142A1 than do the other azole drugs, or that they cannot penetrate the P450’s
active site. Kd values were determined from fits using the Morrison equation
(equation 1) for tighter binding azoles, and using a standard hyperbolic function
(Michaelis-Menten, equation 2) for weaker binding azoles.
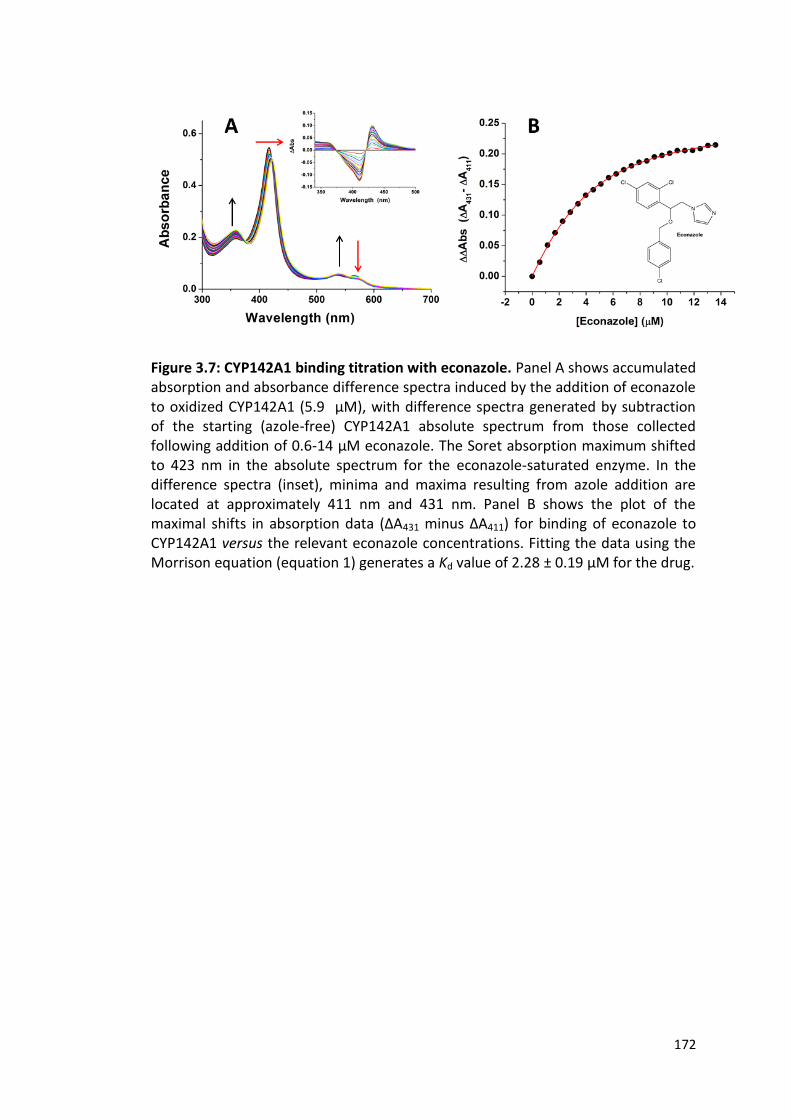
172
Figure 3.7: CYP142A1 binding titration with econazole. Panel A shows accumulated absorption and absorbance difference spectra induced by the addition of econazole to oxidized CYP142A1 (5.9 μM), with difference spectra generated by subtraction of the starting (azole-free) CYP142A1 absolute spectrum from those collected following addition of 0.6-14 μM econazole. The Soret absorption maximum shifted to 423 nm in the absolute spectrum for the econazole-saturated enzyme. In the difference spectra (inset), minima and maxima resulting from azole addition are located at approximately 411 nm and 431 nm. Panel B shows the plot of the maximal shifts in absorption data (∆A431 minus ∆A411) for binding of econazole to CYP142A1 versus the relevant econazole concentrations. Fitting the data using the Morrison equation (equation 1) generates a Kd value of 2.28 ± 0.19 μM for the drug.
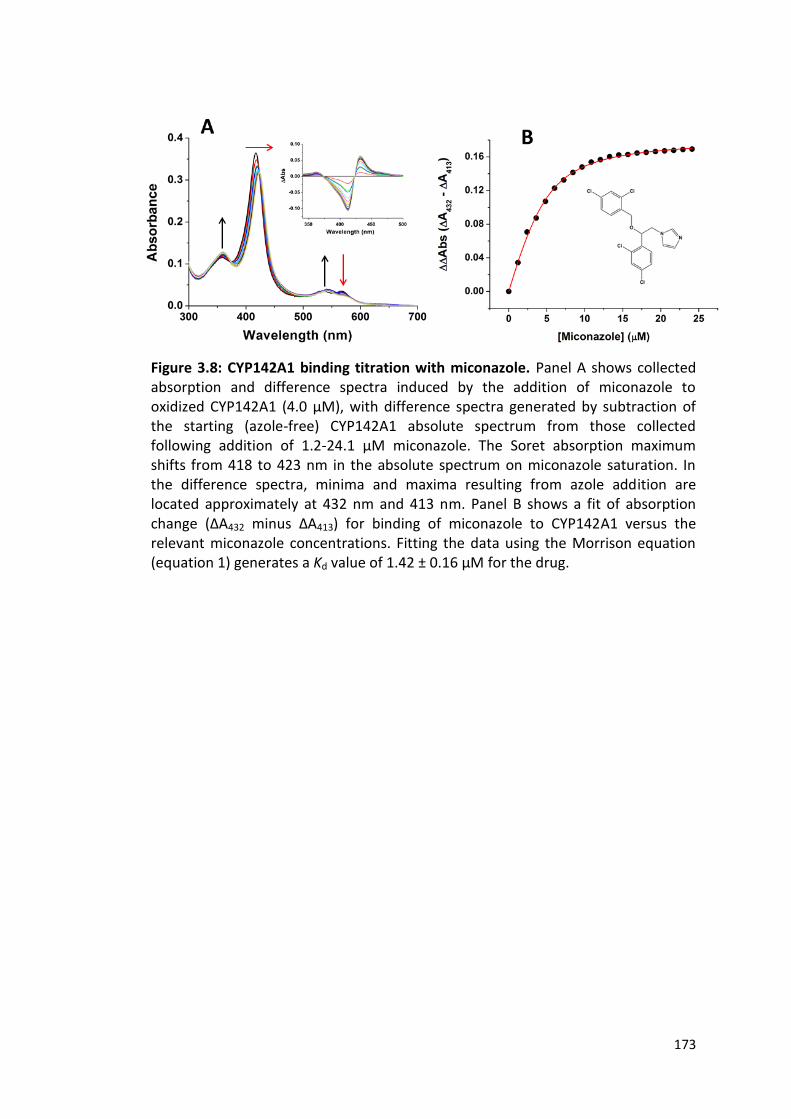
173
Figure 3.8: CYP142A1 binding titration with miconazole. Panel A shows collected absorption and difference spectra induced by the addition of miconazole to oxidized CYP142A1 (4.0 μM), with difference spectra generated by subtraction of the starting (azole-free) CYP142A1 absolute spectrum from those collected following addition of 1.2-24.1 μM miconazole. The Soret absorption maximum shifts from 418 to 423 nm in the absolute spectrum on miconazole saturation. In the difference spectra, minima and maxima resulting from azole addition are located approximately at 432 nm and 413 nm. Panel B shows a fit of absorption change (∆A432 minus ∆A413) for binding of miconazole to CYP142A1 versus the relevant miconazole concentrations. Fitting the data using the Morrison equation (equation 1) generates a Kd value of 1.42 ± 0.16 μM for the drug.

174
Figure 3.9: CYP142A1 binding titration with clotrimazole. Panel A shows collected absorption and difference spectra induced by addition of clotrimazole to oxidized CYP142A1 (5.8 μM), with difference spectra generated by subtraction of the azole-free CYP142A1 spectrum from those collected after addition of 1.5-21.8 μM clotrimazole. The azole drug complex is near-fully formed by ~21.8 μM, with the Soret maximum at 423 nm. In the difference spectra (inset), minima and maxima resulting from azole addition are at ~412 nm and 431 nm. Panel B shows a plot of maximal shift in absorption data (∆A431 minus ∆A412) for CYP142A1 binding to clotrimazole CYP142A1 versus the relevant [clotrimazole]. Fitting using equation 1 gives a Kd value of 1.14 ± 0.10 µM for the drug.
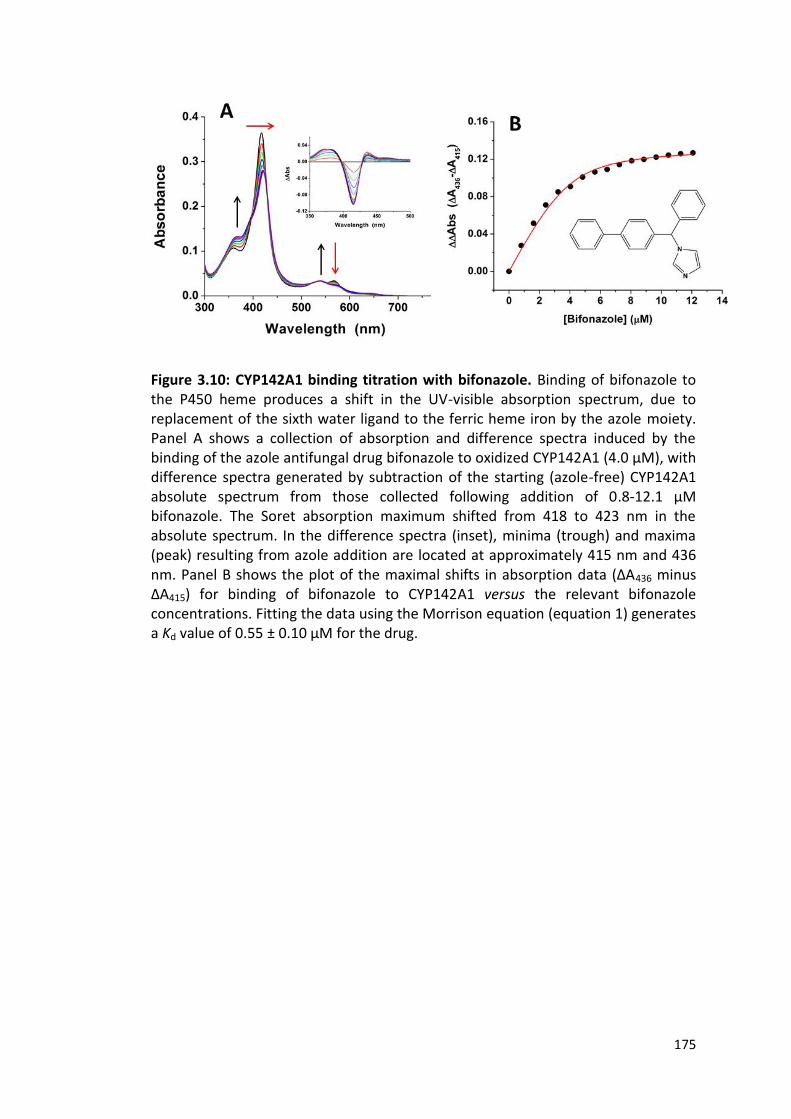
175
Figure 3.10: CYP142A1 binding titration with bifonazole. Binding of bifonazole to the P450 heme produces a shift in the UV-visible absorption spectrum, due to replacement of the sixth water ligand to the ferric heme iron by the azole moiety. Panel A shows a collection of absorption and difference spectra induced by the binding of the azole antifungal drug bifonazole to oxidized CYP142A1 (4.0 μM), with difference spectra generated by subtraction of the starting (azole-free) CYP142A1 absolute spectrum from those collected following addition of 0.8-12.1 μM bifonazole. The Soret absorption maximum shifted from 418 to 423 nm in the absolute spectrum. In the difference spectra (inset), minima (trough) and maxima (peak) resulting from azole addition are located at approximately 415 nm and 436 nm. Panel B shows the plot of the maximal shifts in absorption data (∆A436 minus ∆A415) for binding of bifonazole to CYP142A1 versus the relevant bifonazole concentrations. Fitting the data using the Morrison equation (equation 1) generates a Kd value of 0.55 ± 0.10 μM for the drug.
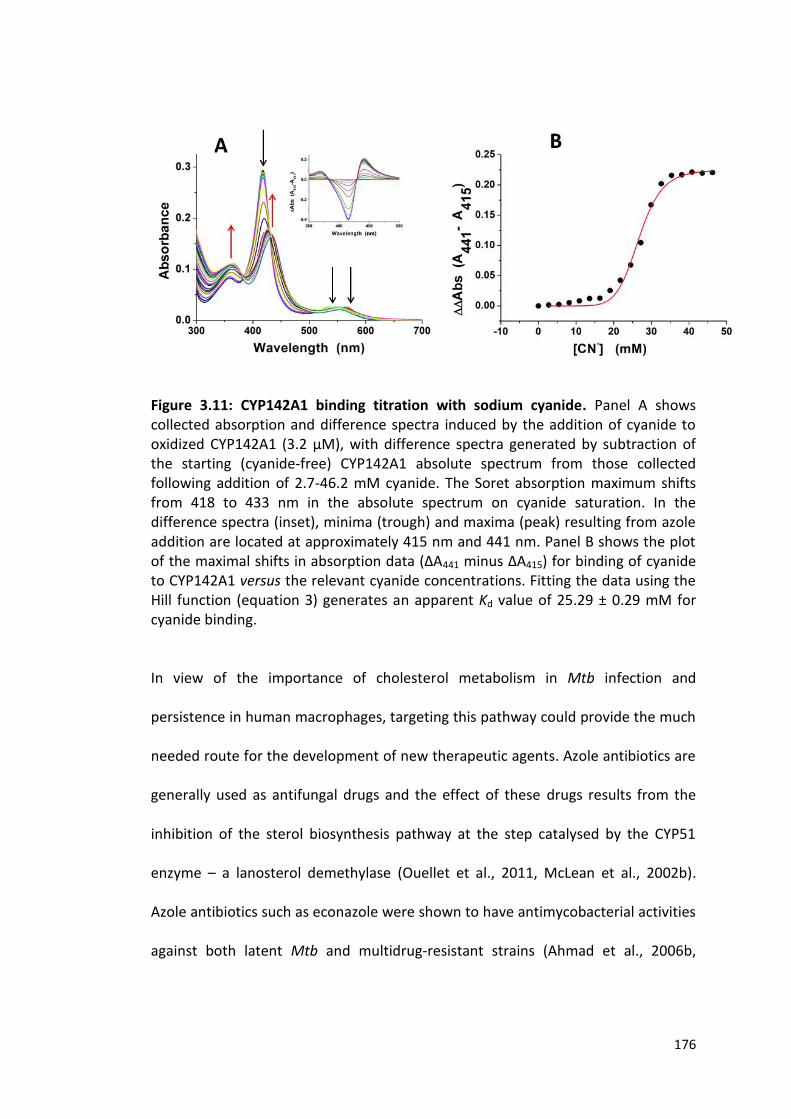
176
Figure 3.11: CYP142A1 binding titration with sodium cyanide. Panel A shows collected absorption and difference spectra induced by the addition of cyanide to oxidized CYP142A1 (3.2 μM), with difference spectra generated by subtraction of the starting (cyanide-free) CYP142A1 absolute spectrum from those collected following addition of 2.7-46.2 mM cyanide. The Soret absorption maximum shifts from 418 to 433 nm in the absolute spectrum on cyanide saturation. In the difference spectra (inset), minima (trough) and maxima (peak) resulting from azole addition are located at approximately 415 nm and 441 nm. Panel B shows the plot of the maximal shifts in absorption data (∆A441 minus ∆A415) for binding of cyanide to CYP142A1 versus the relevant cyanide concentrations. Fitting the data using the Hill function (equation 3) generates an apparent Kd value of 25.29 ± 0.29 mM for cyanide binding.
In view of the importance of cholesterol metabolism in Mtb infection and
persistence in human macrophages, targeting this pathway could provide the much
needed route for the development of new therapeutic agents. Azole antibiotics are
generally used as antifungal drugs and the effect of these drugs results from the
inhibition of the sterol biosynthesis pathway at the step catalysed by the CYP51
enzyme – a lanosterol demethylase (Ouellet et al., 2011, McLean et al., 2002b).
Azole antibiotics such as econazole were shown to have antimycobacterial activities
against both latent Mtb and multidrug-resistant strains (Ahmad et al., 2006b,
177
Ahmad et al., 2006c) and this discovery suggests one or more cytochrome P450
enzymes are likely drug targets.
In this study, CYP142A1 exhibited tight-binding characteristics to a number of azole
drugs, with Kd values in the μM range. This high affinity of azole drugs for CYP142A1
suggests that the enzyme could be a valuable drug target in Mtb. This is consistent
with other azole drug/Mtb P450 interactions that have been characterised to date,
including those with CYP121A1 (McLean et al., 2002b), CYP144A1 (Driscoll et al.,
2011) and CYP130A1 (Ouellet et al., 2008). The tightest binding azole drug
interactions obtained for CYP142A1 were with bifonazole, clotrimazole, miconazole
and econazole, while the weakest detectable binding was with fluconazole. The
order of potency of the azole drugs (see MIC data in section 1.5.9) correlated with
their Kd values for binding to the Mtb CYP142A1 enzyme (Table 3.2), suggesting
that this P450 is a valuable drug target.
The cyanide ion acts as an ionic ligand and binds preferentially to the ferric iron (III)
form of P450s. In the resting state of the enzyme, the 3+ charge of the ferric heme
iron (Fe3+) matches that of the three negative ions provided by two of the porphyrin
nitrogens and the thiolate ligand, but in the reduced state of the enzyme the
negative charges exceed the two positive charges of the Fe2+ species. Hence
cyanide binds more readily, but still weakly, to the ferrous species of cytochrome
P450 enzymes (Correia and Ortiz de Montellano, 2005).

178
From the titration carried out in this study, a sigmoidal cyanide titration plot was
obtained, and data were best fitted using the Hill equation (Eq. 3), with an apparent
Hill coefficient of 8.68 ± 0.70. While it is not possible to infer too much from the Hill
coefficient itself, these data do suggest that some form of binding “cooperativity”
occurs with cyanide, and an apparent binding constant (Kd or KH) of 25.29 ± 0.29
mM was obtained, signifying very weak binding to CYP142A1. The sigmoidal curve
obtained could result from multiple binding sites for cyanide on CYP142A1.
Possibly, the binding of sodium ions in the CYP142A1 active site ultimately shields
repulsive interactions with the cyanide anion, enabling it to ligate the heme iron.
This model might explain the unusual sigmoidal dependence of heme ligation on
the concentration of sodium cyanide.
3.2.4 Binding Analysis with CYP142A1 Fragment Hits
Fragment based drug discovery is a novel approach for developing small-molecule
ligands as chemical tools and leads for drug development (Scott et al., 2012). It
involves a structure-based design and synthesis of specific and potent ligands from
weak-binding low molecular weight ligand (fragment) molecules with molecular
weights less than ~250 Da (Hudson et al., 2014). An initial fragment screening (using
fluorescence-based protein stability thermal shift and heme binding assays)
performed on CYP142A1 using a fragment library of 720 fragments generated six
fragment hits. These hits are named: NMR170, NMR540, NMR623, NMR089,
NMR491 and NMR099. Hit validation studies were then carried out using UV-Vis
spectroscopy, electron paramagnetic resonance (EPR) spectroscopy, Isothermal
titration calorimetry (ITC) and X-ray crystallography. Selected results from the UV-

179
Vis spectroscopy studies are shown below. UV-Vis spectroscopy revealed a
substrate-like type I optical shift for fragment NMR099, and inhibitor-like type II
shifts for the five others – indicating direct interaction with the heme iron.
Dissociation constants for the fragments ranged from NMR491 (0.68 µM) to
NMR099 (6.8 mM) (Table 3.2).
NMR540, NMR623, NMR089, NMR491 and NMR099 were observed to bind weakly
to CYP142A1, which is expected for fragments at the first stage of the screening
process. The aim of the fragment based drug discovery approach is to develop
highly potent inhibitors from small ligands which exhibit low affinity for the drug
targets, but bind in distinct parts of the enzyme active site (Hudson et al., 2012b).
These initial fragments hits can then be developed further via structure-based
fragment elaboration and optimization to generate inhibitors with high affinity and
potency for the enzyme target (Hudson et al., 2013, Hudson et al., 2012b).
Figure 3.12: Compounds hits from an initial CYP142A1 fragment screen
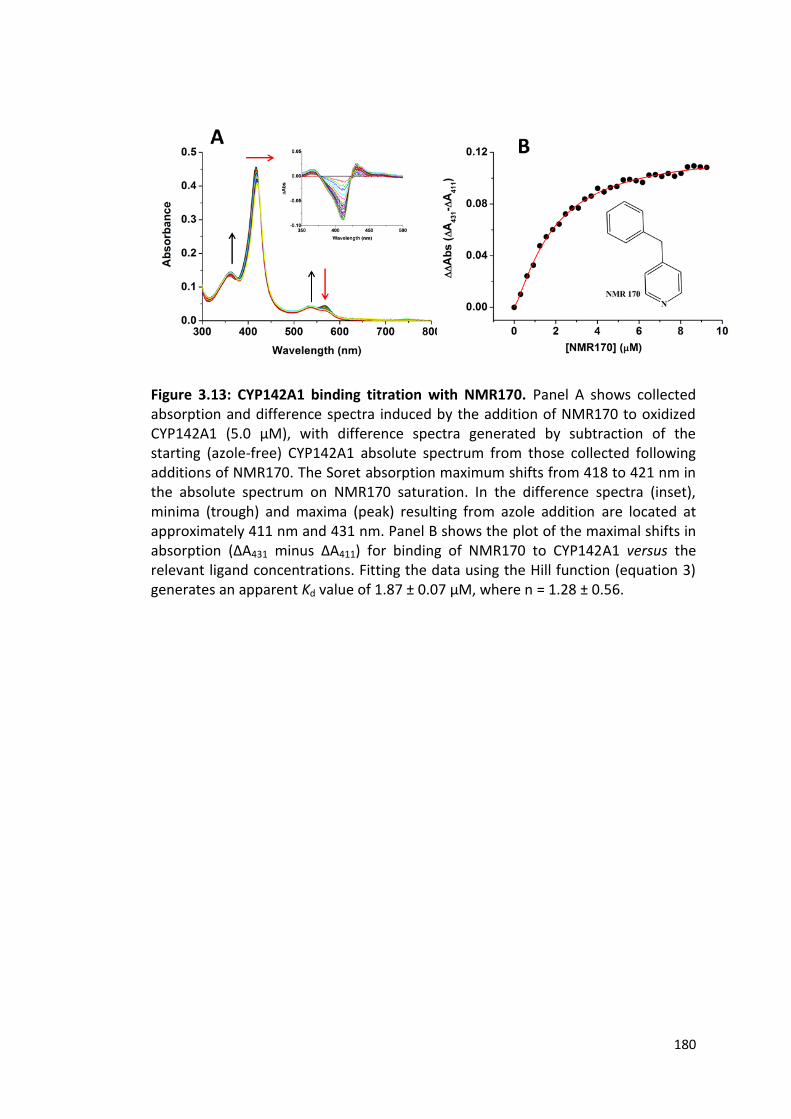
180
Figure 3.13: CYP142A1 binding titration with NMR170. Panel A shows collected absorption and difference spectra induced by the addition of NMR170 to oxidized CYP142A1 (5.0 μM), with difference spectra generated by subtraction of the starting (azole-free) CYP142A1 absolute spectrum from those collected following additions of NMR170. The Soret absorption maximum shifts from 418 to 421 nm in the absolute spectrum on NMR170 saturation. In the difference spectra (inset), minima (trough) and maxima (peak) resulting from azole addition are located at approximately 411 nm and 431 nm. Panel B shows the plot of the maximal shifts in absorption (∆A431 minus ∆A411) for binding of NMR170 to CYP142A1 versus the relevant ligand concentrations. Fitting the data using the Hill function (equation 3) generates an apparent Kd value of 1.87 ± 0.07 µM, where n = 1.28 ± 0.56.

181
Figure 3.14: CYP142A1 binding titration with NMR540. Panel A shows collected absorption and difference spectra induced by the addition of NMR540 to oxidized CYP142A1 (3.8 μM), with difference spectra generated by subtraction of the starting (azole-free) CYP142A1 absolute spectrum from those collected following sequential additions of NMR540. The Soret absorption maximum shifts from 418 to 420 nm in the absolute spectrum on NMR540 saturation. In the difference spectra (inset), minima (trough) and maxima (peak) resulting from azole addition are located at approximately 411 nm and 432 nm. Panel B shows the plot of the maximal shifts in absorption data (∆A432 minus ∆A411) for binding of NMR540 to CYP142A1 versus the relevant NMR540 concentrations. Fitting the data using the hyperbolic function (equation 2) generates a Kd value of 107.46 ± 7.35 µM for NMR540.
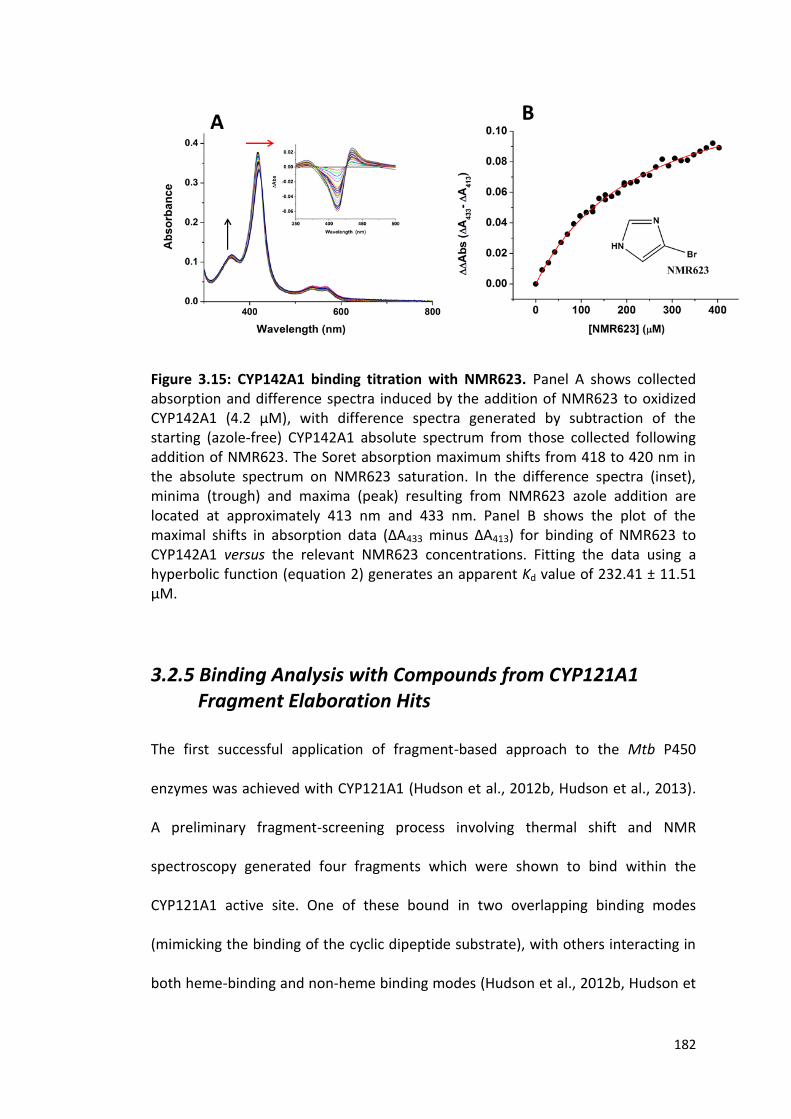
182
Figure 3.15: CYP142A1 binding titration with NMR623. Panel A shows collected absorption and difference spectra induced by the addition of NMR623 to oxidized CYP142A1 (4.2 μM), with difference spectra generated by subtraction of the starting (azole-free) CYP142A1 absolute spectrum from those collected following addition of NMR623. The Soret absorption maximum shifts from 418 to 420 nm in the absolute spectrum on NMR623 saturation. In the difference spectra (inset), minima (trough) and maxima (peak) resulting from NMR623 azole addition are located at approximately 413 nm and 433 nm. Panel B shows the plot of the maximal shifts in absorption data (∆A433 minus ∆A413) for binding of NMR623 to CYP142A1 versus the relevant NMR623 concentrations. Fitting the data using a hyperbolic function (equation 2) generates an apparent Kd value of 232.41 ± 11.51 µM.
3.2.5 Binding Analysis with Compounds from CYP121A1 Fragment Elaboration Hits
The first successful application of fragment-based approach to the Mtb P450
enzymes was achieved with CYP121A1 (Hudson et al., 2012b, Hudson et al., 2013).
A preliminary fragment-screening process involving thermal shift and NMR
spectroscopy generated four fragments which were shown to bind within the
CYP121A1 active site. One of these bound in two overlapping binding modes
(mimicking the binding of the cyclic dipeptide substrate), with others interacting in
both heme-binding and non-heme binding modes (Hudson et al., 2012b, Hudson et
183
al., 2013). A fragment–fragment merging approach was used to develop these
further and this led to the discovery of a novel type-II aminoquinoline inhibitor with
high ligand efficiency (LE, where LE = -∆G of binding/number of non-hydrogen
atoms (NHA) in the ligand) and about four times higher affinity than the natural
CYP121A1 substrate cYY (Hudson et al., 2012b). This novel inhibitor was also shown
to be the highest affinity ligand developed using fragment-based approaches
against any cytochrome P450 enzyme (Hudson et al., 2013). Further studies
involving structural biology and synthetic chemistry have continued around this
CYP121A1-specific inhibitor and these have led to the development of other ligands
that bind to other Mtb P450s. A number of these ligands were shown to bind the
cholesterol oxidases CYP124A1, 125A1 and 124A1. These are named MEKs 046,
047, 065, 066, 076, 077 and 050f2. Their structures are shown in Figure 3.15. Out of
the seven compounds, three appeared to stand out in terms of affinity for these
cholesterol oxidases, and these are MEKs 047, 065 and 066. MEK046 showed a type
II spectral shift (inhibitor-like), while MEK065 and MEK066 showed type I shifts
(substrate-like) with partial conversion (~25% conversion) to a high-spin state. The
Kd values ranged from 3.24 µM (MEK046) to 35.30 µM (MEK066). MEKs 047, 050f2,
076 and 077 gave weak (about 1 nm shift) or no spectral shifts for these enzymes at
all.
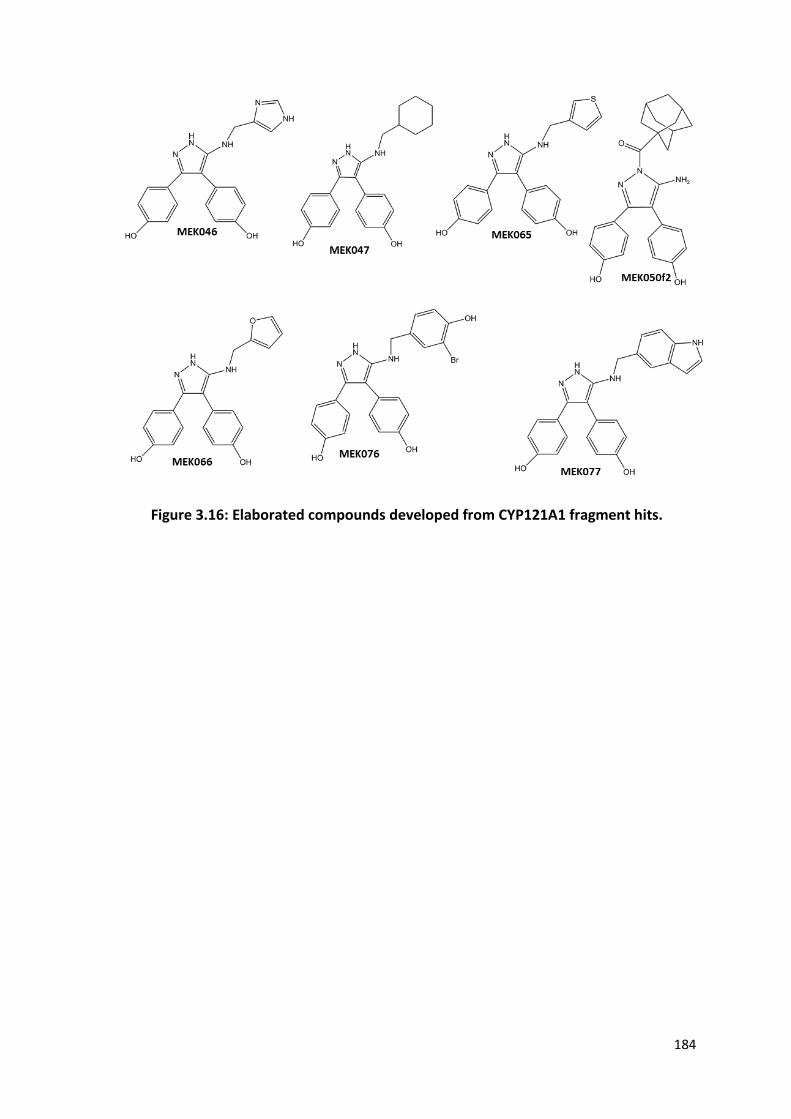
184
Figure 3.16: Elaborated compounds developed from CYP121A1 fragment hits.
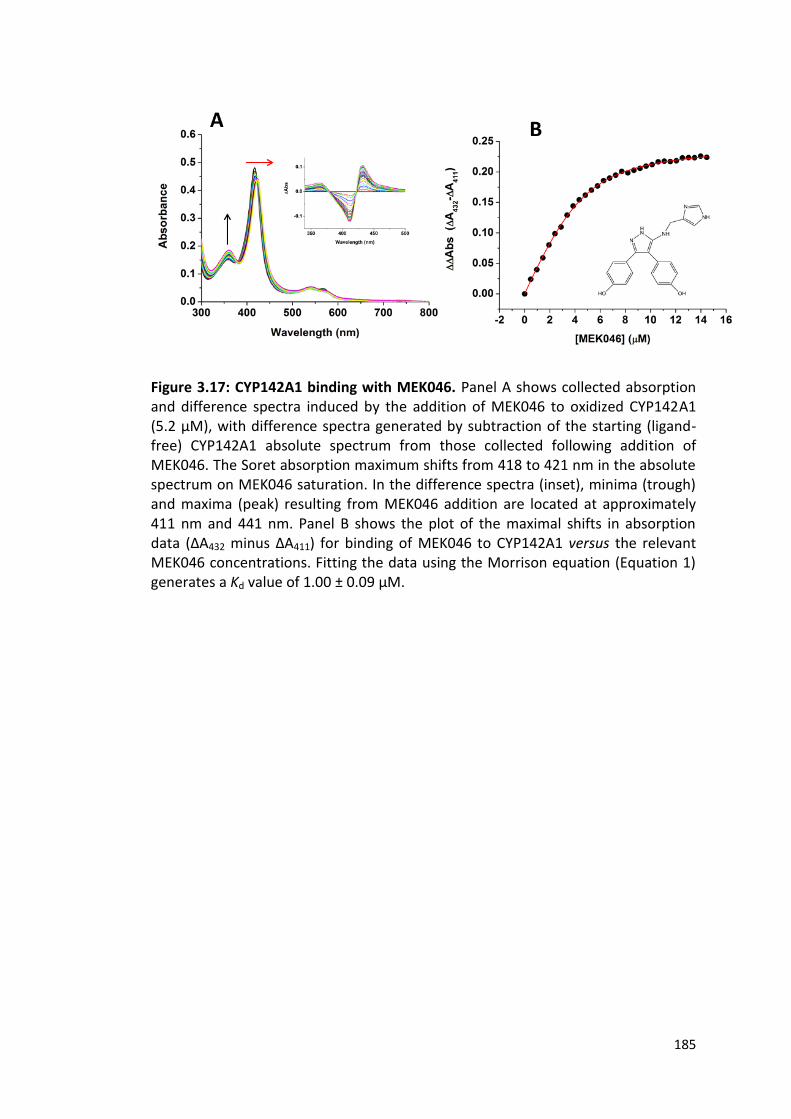
185
Figure 3.17: CYP142A1 binding with MEK046. Panel A shows collected absorption and difference spectra induced by the addition of MEK046 to oxidized CYP142A1 (5.2 μM), with difference spectra generated by subtraction of the starting (ligand-free) CYP142A1 absolute spectrum from those collected following addition of MEK046. The Soret absorption maximum shifts from 418 to 421 nm in the absolute spectrum on MEK046 saturation. In the difference spectra (inset), minima (trough) and maxima (peak) resulting from MEK046 addition are located at approximately 411 nm and 441 nm. Panel B shows the plot of the maximal shifts in absorption data (∆A432 minus ∆A411) for binding of MEK046 to CYP142A1 versus the relevant MEK046 concentrations. Fitting the data using the Morrison equation (Equation 1) generates a Kd value of 1.00 ± 0.09 µM.

186
Figure 3.18: CYP142A1 binding with MEK065. Panel A shows collected absorption and difference spectra induced by the addition of MEK065 to oxidized CYP142A1 (5.2 μM), with difference spectra generated by subtraction of the starting (ligand-free) CYP142A1 absolute spectrum from those collected following addition of MEK065. The Soret absorption maximum shifts from 418 to 405 nm in the absolute spectrum on MEK065 saturation. In the difference spectra (inset), minima (trough) and maxima (peak) resulting from MEK065 addition are located at approximately 420 nm and 387 nm. Panel B shows the plot of the maximal shifts in absorption data (∆A387 minus ∆A420) for binding of MEK065 to CYP142A1 versus the relevant ligand concentrations. Fitting the data using the Morrison equation (equation 1) generates a Kd value of 3.13 ± 0.10 µM.

187
S/N Ligand Kd Value (µM) Type of shift
1 Cholestenone 0.22 ± 0.02 I
2 Cholesterol 0.25 ± 0.01 I
3 Lanosterol 7.50 ± 0.99 I
4 Econazole 2.28 ± 0.19 II
5 Miconazole 1.42 ± 0.16 II
6 Clotrimazole 1.14 ± 0.10 II
7 Bifonazole 0.55 ± 0.10 II
8 Ketoconazole 11.95 ± 0.64 II
9 Fluconazole 309.2 ± 36.3 II
10 Imidazole 283.3 ± 6.4 II
11 1-Phenylimidazole 23.20 ± 3.84 II
12 Sodium cyanide 25290 ± 290 II
13 NMR170 1.87 ± 0.07 II
14 NMR491 0.68 ± 0.14 II
15 NMR540 107.46 ± 7.35 II
16 NMR623 232.41 ± 11.51 II
17 NMR089 377.4 ± 9.3 II
18 NMR099 7214 ± 332 I
19 MEK046 1.00 ± 0.09 II
20 MEK065 3.13 ± 0.10 I
21 MEK066 35.30 ± 3.80 I
Table 3.2: Binding spectral characteristics and Kd values for CYP142A1 ligands. Kd values were determined as described in the Materials and Methods (section 2.2.9).
3.2.6 CYP142A1 Fe(II)-CO Adduct and NO-Adduct Formation
Formation of a carbon monoxide adduct is a diagnostic signature for cytochrome
P450 enzymes (Driscoll et al., 2010). These enzymes exhibit a characteristic shift in
the Soret peak to approximately 450 nm (ferrous-CO complex) on reduction and
binding with carbon monoxide (Omura and Sato, 1964). This characteristic Soret
shift is as a result of the retention of the thiolate proximal ligand to the heme iron
(Cys339 in CYP142A1) (Driscoll et al., 2010), while a shift to ~420 nm is indicative of
the protonation of the thiolate ligand, resulting in the formation of a cysteine thiol
as the proximal ligand. In this P420 state, the enzyme is inactive (McLean et al.,
188
2008, Omura and Sato, 1964). A study carried out by Driscoll et al. to check the
effect of pH on the stability of the CYP142A1 CO-adduct revealed that the P450
form of CYP142A1 is most stable at pH 7 and highly unstable at pH values less than
6 and greater than 8, which is marked by the formation of the P420 form (Driscoll et
al., 2010).
In this study, the UV-Vis absorption spectrum for carbon monoxide binding to
CYP142A1 was recorded between 250 and 700 nm. It shows features typical of a
heme-containing protein. In its resting state, CYP142A1 exhibited a UV-Vis
spectrum characteristic of Fe(III) (ferric) P450s in their low-spin, hexacoordinated
state, with a Soret peak at 418 nm and α and β bands at 564 and 532 nm,
respectively. Upon reduction with dithionite and after bubbling with CO, the Soret
peak shifted to 450 nm, as expected for a P450 Fe(II)-CO complex (Omura and Sato,
1964). This complex was stable for several minutes in the absence and presence of
the substrate cholestenone (Figure 3.19) and did not convert to a P420 complex,
which absorbs maximally at around 420 nm and arises from protonation of the
cysteine thiolate to a thiol form. A final P420:P450 peak height ratio of
approximately 1:3 was obtained. The same ratio was observed in the presence and
absence of the natural substrate cholestenone (Figure 3.19).
Previous studies carried out on the Mtb P450 CYP51B1 revealed the propensity of
the enzyme to convert from the thiolate to the thiol proximal cysteinate ligand on
reduction of the heme iron. However, this process was found to be retarded in the

189
presence of a substrate analogue (estriol) (Driscoll et al., 2011, McLean et al.,
2006b, Aoyama et al., 1998). Previously, it was postulated that the P420 Fe2+-CO
species reflects an ‘inactivated’ form of the enzyme (i.e. that ferric form of the
same enzyme preparation may have thiol coordination and be catalytically inactive)
but this has been counteracted by follow-up studies reported for CYP121A1 and the
P450epoK enzyme from Sorangium cellulosum (Dunford et al., 2007, Ogura et al.,
2004). These results revealed that the P450-CO adduct in the P450epoK enzyme is
restored to the P450 state from the P420 form on binding with its epothilone
substrate. In addition, CYP121A1 can also be reversibly converted between the
P420/P450 forms by titrating the reduced/CO-bound forms in the pH range from
6.1 to 10.5 (Dunford et al., 2007). Hence, these results are indicative of the
reversibility of the P450/P420 transition and also the relevance of substrate binding
in the stabilization of the catalytically active thiolate-coordinated heme state
(Driscoll et al., 2011).
At the early stage of Mtb infection, nitric oxide (.NO) generated by host
macrophages inhibits heme-containing terminal cytochrome oxidases, inactivates
iron/sulfur proteins, and mobilises entry into the latent phase (Ouellet et al., 2009).
A study carried out by Ouellet et al. revealed that nitric oxide binds tightly to
CYP125A1 and CYP142A1 at sub-micromolar concentration, but binds with lower
affinity to CYP130A1 and CYP51A1 (Ouellet et al., 2009). However, the ferrous NO-
P450 adducts formed with CYP125A1 and CYP142A1 decomposed back to their
ferric P450 resting forms within minutes of exposure to oxygen, while the ferrous

190
CYP130A1 and CYP51B1 adducts remained bound almost irreversibly to NO (Ouellet
et al., 2009). This study suggested that, at physiological concentrations of
approximately 1 M, nitric oxide could inhibit the activity of CYP130A1 and
CYP51A1, whereas the cholesterol hydroxylases CYP125A1 and CYP142A1 are more
resistant (Ouellet et al., 2009).
In this study, the formation of a ferric CYP142A1-nitric oxide adduct was monitored
over a period of 30 minutes. The brief bubbling of nitric oxide gas into solutions of
ferric CYP142A1 prepared under strictly anaerobic conditions resulted in the
formation of nitrosyl complexes characterized by Soret, α and β bands located at
433, 572, and 541 nm, respectively. This complex, however, remained stable over a
period of 30 minutes without significant decomposition, which further agrees with
the study carried out by Ouellet et al. (Ouellet et al., 2009). The NO-bound
CYP142A1 spectral features (Soret at 433 nm with strong alpha and beta band
development) are typical of those for other characterized Mtb P450s, e.g.
CYP130A1, CYP51B1 and the cholesterol 27-hydroxylase CYP125A1 (Ouellet et al.,
2010b, McLean et al., 2009).
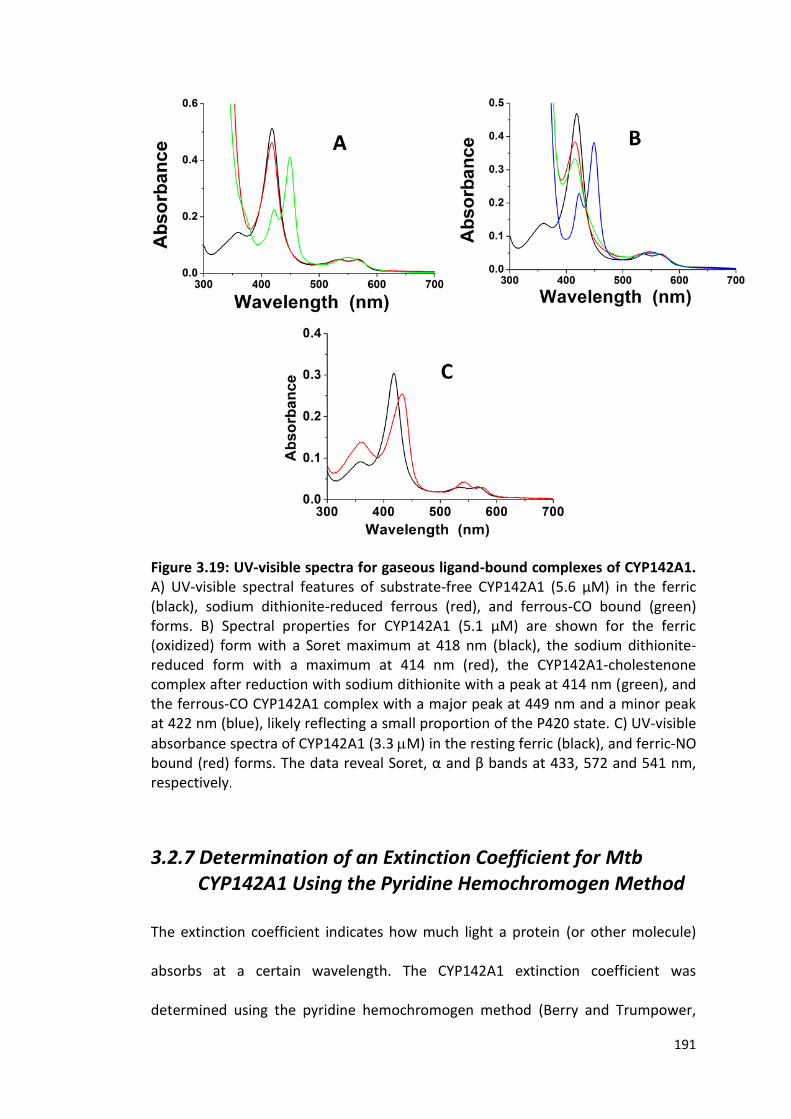
191
Figure 3.19: UV-visible spectra for gaseous ligand-bound complexes of CYP142A1. A) UV-visible spectral features of substrate-free CYP142A1 (5.6 µM) in the ferric (black), sodium dithionite-reduced ferrous (red), and ferrous-CO bound (green) forms. B) Spectral properties for CYP142A1 (5.1 µM) are shown for the ferric (oxidized) form with a Soret maximum at 418 nm (black), the sodium dithionite-reduced form with a maximum at 414 nm (red), the CYP142A1-cholestenone complex after reduction with sodium dithionite with a peak at 414 nm (green), and the ferrous-CO CYP142A1 complex with a major peak at 449 nm and a minor peak at 422 nm (blue), likely reflecting a small proportion of the P420 state. C) UV-visible
absorbance spectra of CYP142A1 (3.3 M) in the resting ferric (black), and ferric-NO bound (red) forms. The data reveal Soret, α and β bands at 433, 572 and 541 nm, respectively.
3.2.7 Determination of an Extinction Coefficient for Mtb CYP142A1 Using the Pyridine Hemochromogen Method
The extinction coefficient indicates how much light a protein (or other molecule)
absorbs at a certain wavelength. The CYP142A1 extinction coefficient was
determined using the pyridine hemochromogen method (Berry and Trumpower,
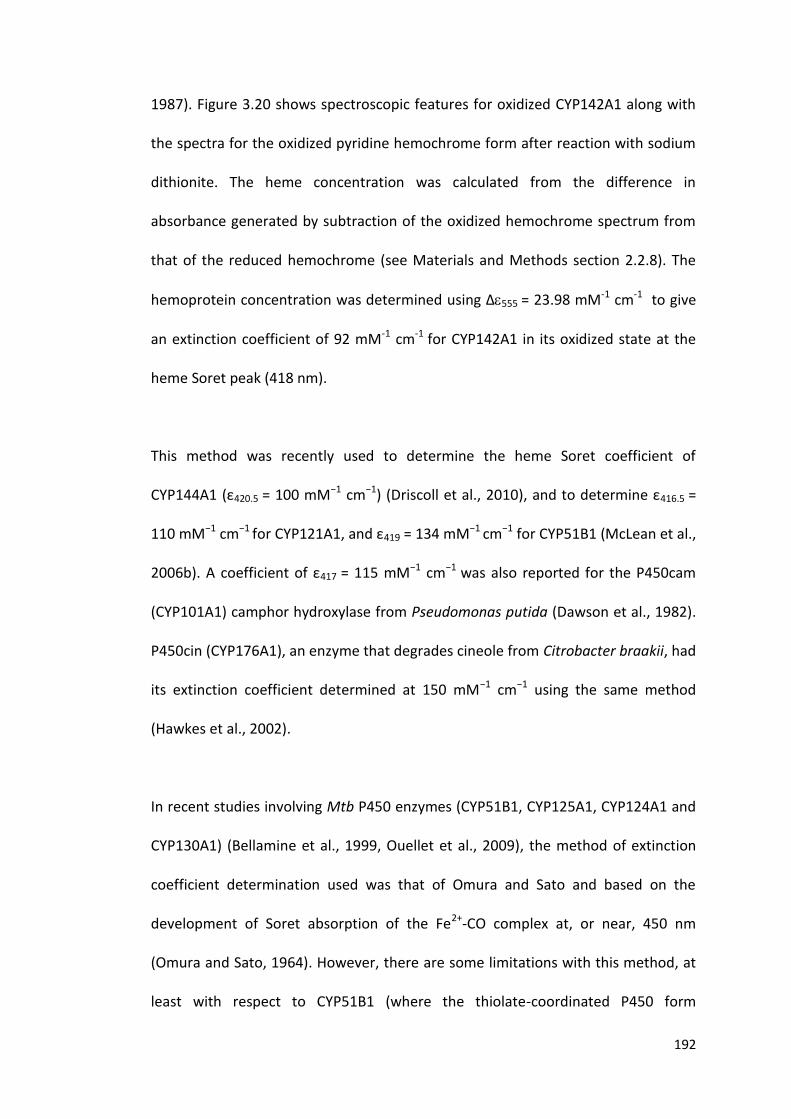
192
1987). Figure 3.20 shows spectroscopic features for oxidized CYP142A1 along with
the spectra for the oxidized pyridine hemochrome form after reaction with sodium
dithionite. The heme concentration was calculated from the difference in
absorbance generated by subtraction of the oxidized hemochrome spectrum from
that of the reduced hemochrome (see Materials and Methods section 2.2.8). The
hemoprotein concentration was determined using ∆555 = 23.98 mM-1 cm-1 to give
an extinction coefficient of 92 mM-1 cm-1 for CYP142A1 in its oxidized state at the
heme Soret peak (418 nm).
This method was recently used to determine the heme Soret coefficient of
CYP144A1 (ε420.5 = 100 mM−1 cm−1) (Driscoll et al., 2010), and to determine ε416.5 =
110 mM−1 cm−1 for CYP121A1, and ε419 = 134 mM−1 cm−1 for CYP51B1 (McLean et al.,
2006b). A coefficient of ε417 = 115 mM−1 cm−1 was also reported for the P450cam
(CYP101A1) camphor hydroxylase from Pseudomonas putida (Dawson et al., 1982).
P450cin (CYP176A1), an enzyme that degrades cineole from Citrobacter braakii, had
its extinction coefficient determined at 150 mM−1 cm−1 using the same method
(Hawkes et al., 2002).
In recent studies involving Mtb P450 enzymes (CYP51B1, CYP125A1, CYP124A1 and
CYP130A1) (Bellamine et al., 1999, Ouellet et al., 2009), the method of extinction
coefficient determination used was that of Omura and Sato and based on the
development of Soret absorption of the Fe2+-CO complex at, or near, 450 nm
(Omura and Sato, 1964). However, there are some limitations with this method, at
least with respect to CYP51B1 (where the thiolate-coordinated P450 form
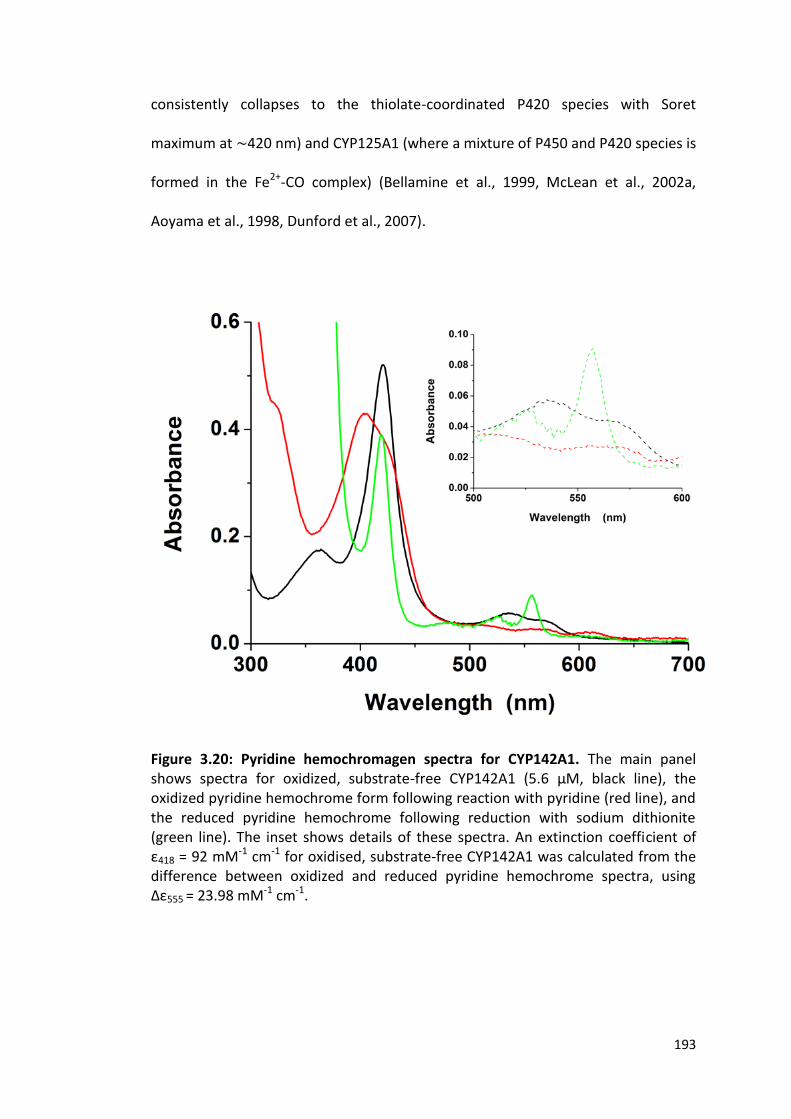
193
consistently collapses to the thiolate-coordinated P420 species with Soret
maximum at ∼420 nm) and CYP125A1 (where a mixture of P450 and P420 species is
formed in the Fe2+-CO complex) (Bellamine et al., 1999, McLean et al., 2002a,
Aoyama et al., 1998, Dunford et al., 2007).
Figure 3.20: Pyridine hemochromagen spectra for CYP142A1. The main panel shows spectra for oxidized, substrate-free CYP142A1 (5.6 μM, black line), the oxidized pyridine hemochrome form following reaction with pyridine (red line), and the reduced pyridine hemochrome following reduction with sodium dithionite (green line). The inset shows details of these spectra. An extinction coefficient of ε418 = 92 mM-1 cm-1 for oxidised, substrate-free CYP142A1 was calculated from the difference between oxidized and reduced pyridine hemochrome spectra, using Δε555 = 23.98 mM-1 cm-1.

194
3.2.8 Light Scattering (MALLS) Analysis of CYP142A1
In order to examine the aggregation state of the pure CYP142A1 enzyme, size
exclusion chromatography (SEC) coupled to MALLS (multiangle laser light
scattering) analysis was performed. A pure sample of CYP142A1 was resolved by
SEC on a Superdex 200 gel filtration column before passing through MALLS and
refractive index (RI) detectors.
One of the most important parameters for characterizing macromolecules such as
proteins, polysaccharides, oligonucleotides, and antibodies is their molecular
weight and/or molecular weight distribution. Different techniques have been used
to investigate protein aggregation. These techniques include: size exclusion
chromatography (SEC) (Carpenter et al., 1999), native gel electrophoresis, analytical
ultracentrifugation, circular dichroism, fluorescence spectroscopy, Fourier
transform/IR spectroscopy, UV spectroscopy and light blockage tests, and visual
inspection (Arakawa and Kita, 2000, Charman et al., 1993, Zuo et al., 2003, Borchert
et al., 1986, Wang, 1999). Among these different techniques, SEC is a simple and
fast method for determination of the molecular weight of a protein based on its
elution profile (Ye, 2006). Light scattering studies were performed on CYP142A1 to
determine its molecular weight and homogeneity. This was carried out as a crucial
step leading to crystallographic studies. Studies were done with buffers containing
no salt, 150 mM NaCl and 300 mM NaCl, both in the presence and absence of 1 mM
DTT (dithiothreitol), as described in the Materials and Methods section (section
2.2.13).
195
In the absence of DTT and NaCl, MALLS data show one peak with a higher than
expected molecular weight prediction of 61 kDa, and eluting earlier than expected
from the column at between ~12.2-13.8 ml. This high molecular weight and broad
elution profile suggests a mixture of monomer and dimer (Figure 3.21A). Results
with 150 mM NaCl in the buffer showed two peaks, with the smaller peak giving a
molecular weight of 94.2 kDa (dimer) and the larger peak giving a molecular weight
of 45.9 kDa (monomer) (Figure 3.21B). A similar result was obtained when the salt
concentration was increased to 300 mM, with protein eluting much later at about
13.0-15.8 ml of buffer (Figure 3.20C).
When treated with DTT (1 mM), CYP142A1 was completely monomeric in both the
presence and absence of salt. The apparent molecular weight was close to the
predicted mass of 46.6 kDa from the CYP142A1 amino acid sequence. However, a
higher apparent molecular weight species was observed in the absence of salt
(Figure 3.22 A-D). These results indicate that DTT plays a major role in the
elimination of the dimeric species, likely through reduction of a disulfide bridge
across two CYP142A1 monomers. Elution volume was also delayed with increased
salt concentration, similar to the phenomenon observed in the absence of DTT
(Figure 3.21).
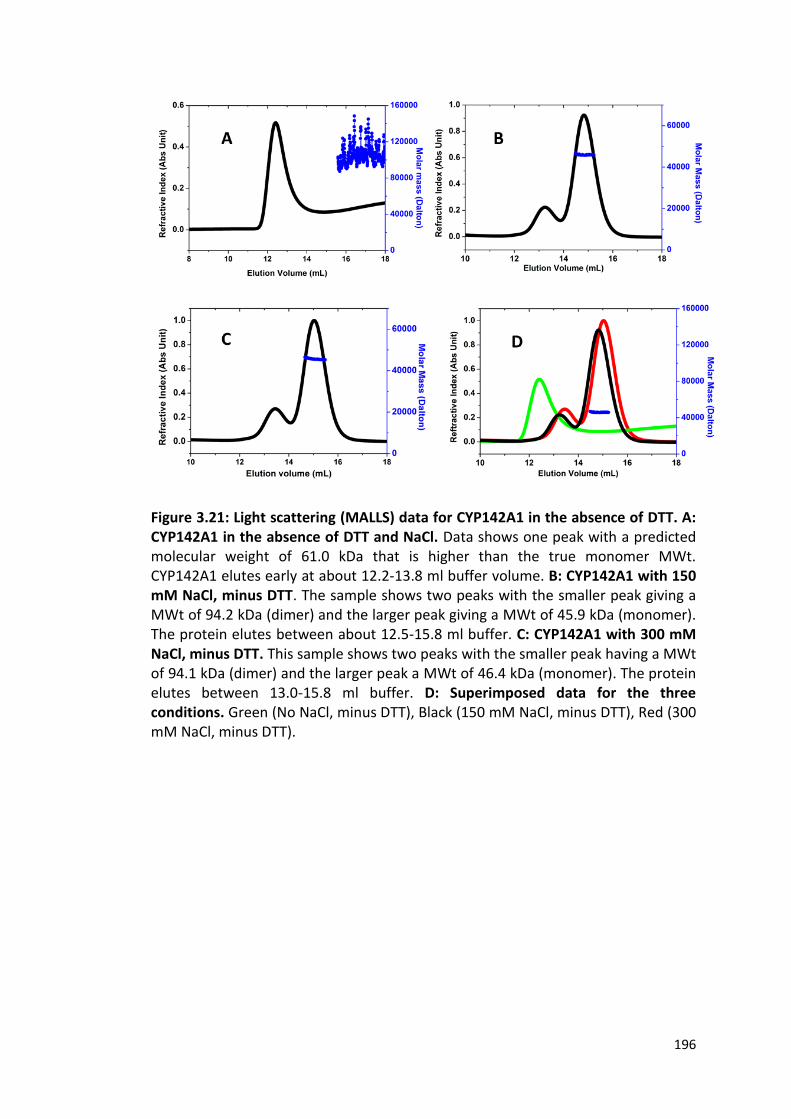
196
Figure 3.21: Light scattering (MALLS) data for CYP142A1 in the absence of DTT. A: CYP142A1 in the absence of DTT and NaCl. Data shows one peak with a predicted molecular weight of 61.0 kDa that is higher than the true monomer MWt. CYP142A1 elutes early at about 12.2-13.8 ml buffer volume. B: CYP142A1 with 150 mM NaCl, minus DTT. The sample shows two peaks with the smaller peak giving a MWt of 94.2 kDa (dimer) and the larger peak giving a MWt of 45.9 kDa (monomer). The protein elutes between about 12.5-15.8 ml buffer. C: CYP142A1 with 300 mM NaCl, minus DTT. This sample shows two peaks with the smaller peak having a MWt of 94.1 kDa (dimer) and the larger peak a MWt of 46.4 kDa (monomer). The protein elutes between 13.0-15.8 ml buffer. D: Superimposed data for the three conditions. Green (No NaCl, minus DTT), Black (150 mM NaCl, minus DTT), Red (300 mM NaCl, minus DTT).
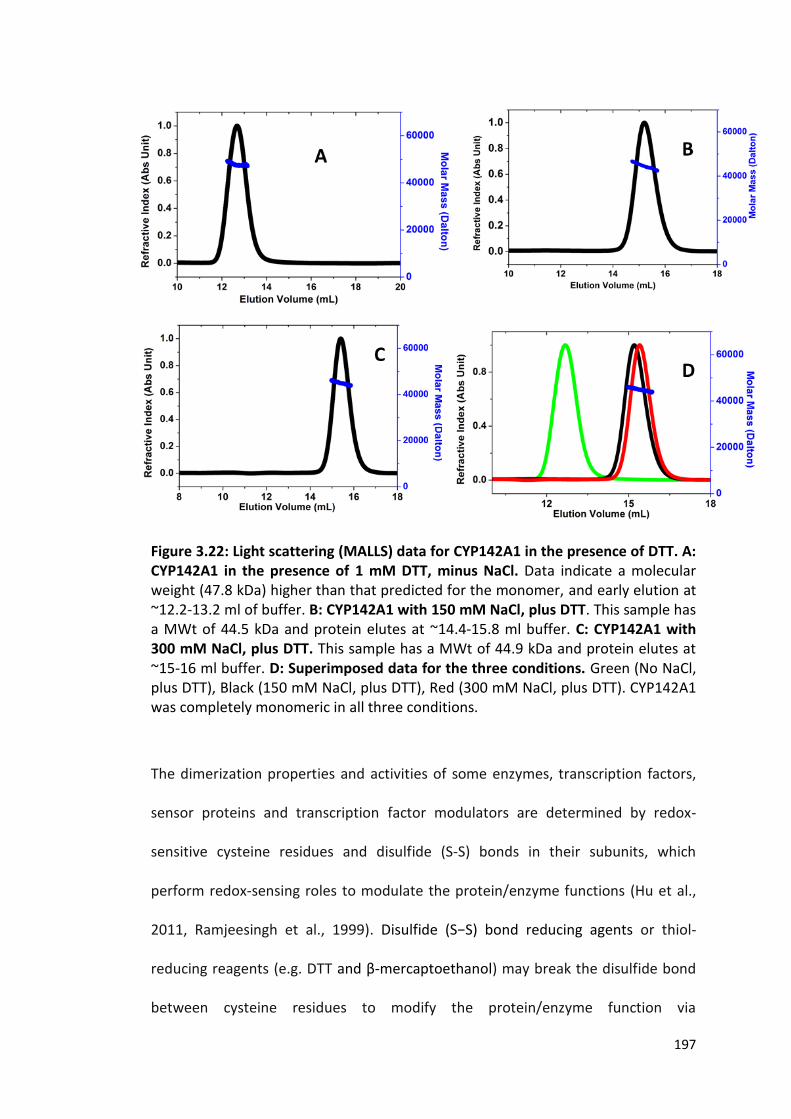
197
Figure 3.22: Light scattering (MALLS) data for CYP142A1 in the presence of DTT. A: CYP142A1 in the presence of 1 mM DTT, minus NaCl. Data indicate a molecular weight (47.8 kDa) higher than that predicted for the monomer, and early elution at ~12.2-13.2 ml of buffer. B: CYP142A1 with 150 mM NaCl, plus DTT. This sample has a MWt of 44.5 kDa and protein elutes at ~14.4-15.8 ml buffer. C: CYP142A1 with 300 mM NaCl, plus DTT. This sample has a MWt of 44.9 kDa and protein elutes at ~15-16 ml buffer. D: Superimposed data for the three conditions. Green (No NaCl, plus DTT), Black (150 mM NaCl, plus DTT), Red (300 mM NaCl, plus DTT). CYP142A1 was completely monomeric in all three conditions.
The dimerization properties and activities of some enzymes, transcription factors,
sensor proteins and transcription factor modulators are determined by redox-
sensitive cysteine residues and disulfide (S-S) bonds in their subunits, which
perform redox-sensing roles to modulate the protein/enzyme functions (Hu et al.,
2011, Ramjeesingh et al., 1999). Disulfide (S−S) bond reducing agents or thiol-
reducing reagents (e.g. DTT and β-mercaptoethanol) may break the disulfide bond
between cysteine residues to modify the protein/enzyme function via

198
conformational or other changes (Hu et al., 2011, Ramjeesingh et al., 1999). These
compounds reduce and break the disulfide (S−S) bonds and leave their cysteine
residues in a reduced (SH) state (Hu et al., 2011).
Studies have revealed that some Mtb P450s, like CYP121A1 and CYP125A1, exist as
monomeric species (Driscoll et al., 2011) while others appear to be dimers, e.g. Mtb
CYP130A1 (Ouellet et al., 2008). The Bacillus megaterium flavocytochrome P450
BM3 (CYP102A1, BM3) enzyme is also dimeric. In BM3, a soluble P450:P450
reductase (CPR) fusion protein dimerizes to enable electron exchange between
monomers to activate fatty acid hydroxylation (Neeli et al., 2005, Kitazume et al.,
2007). Oligomers of a P450 were also reported in the case of CYP3A4 (Davydov et
al., 1999). In the present study, however, the tendency of CYP142A1 to dimerize in
solution is likely to be as a result of the presence of intermolecular disulphide bonds
between cysteine residues on the protein surface of CYP142A1. As shown in Figure
3.23, analysis of the crystal structure of CYP142A1 reveals Cys296 and Cys316 to be
exposed on the P450 surface. It is thus likely that disulfide bond(s) can form
between pairs of these residues on different monomers to form dimeric species.
Cleavage of the disulfide bond(s) on DTT treatment then results in the formation of
monomeric species.

199
Figure 3.23: Cysteine residues in CYP142A1. A CYP142A1 transparent surface representation is shown, with cysteine residues (in yellow spacefill) shown on the surface protein surface and within the macromolecule. Two cysteine residues are clearly present on the surface of CYP142A1 (Cys296 and Cys316), while most are buried inside the molecule. It is likely that partial dimerization of CYP142A1 occurs through disulfide bonds between these cysteines (from different monomers) and that DTT treatment breaks the disulfide bonds to restore the monomeric state.
3.2.9 Electron Paramagnetic Resonance (EPR) Analysis of CYP142A1
3.2.9.1 EPR analysis with selected CYP142A1 ligands
EPR is a technique used to study molecules (e.g. proteins) with unpaired electrons,
and can provide important information about the state of ferric heme (and other
EPR active cofactors) as well as e.g. providing details of the interactions of
substrates and inhibitors with heme and other cofactors in proteins and enzymes
(Andersson and Barra, 2002). EPR spectra were recorded (as described in Materials
and Methods, section 2.2.15) to probe CYP142A1 heme iron coordination and the
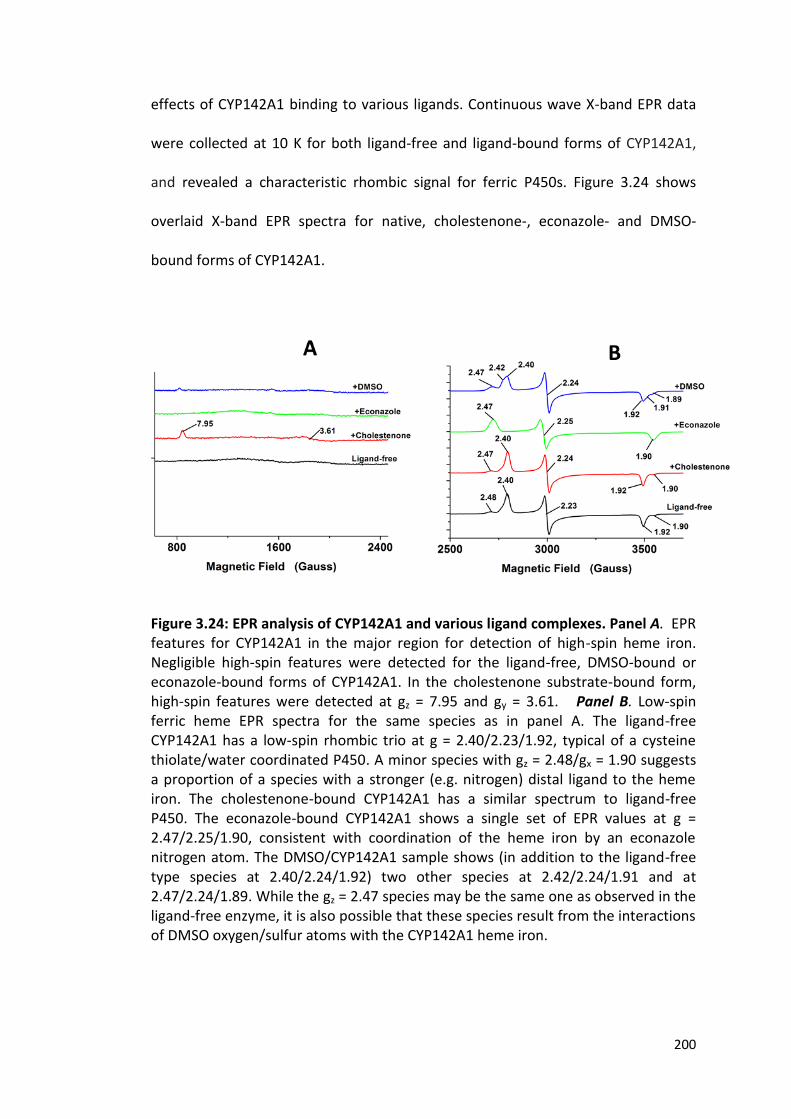
200
effects of CYP142A1 binding to various ligands. Continuous wave X-band EPR data
were collected at 10 K for both ligand-free and ligand-bound forms of CYP142A1,
and revealed a characteristic rhombic signal for ferric P450s. Figure 3.24 shows
overlaid X-band EPR spectra for native, cholestenone-, econazole- and DMSO-
bound forms of CYP142A1.
Figure 3.24: EPR analysis of CYP142A1 and various ligand complexes. Panel A. EPR features for CYP142A1 in the major region for detection of high-spin heme iron. Negligible high-spin features were detected for the ligand-free, DMSO-bound or econazole-bound forms of CYP142A1. In the cholestenone substrate-bound form, high-spin features were detected at gz = 7.95 and gy = 3.61. Panel B. Low-spin ferric heme EPR spectra for the same species as in panel A. The ligand-free CYP142A1 has a low-spin rhombic trio at g = 2.40/2.23/1.92, typical of a cysteine thiolate/water coordinated P450. A minor species with gz = 2.48/gx = 1.90 suggests a proportion of a species with a stronger (e.g. nitrogen) distal ligand to the heme iron. The cholestenone-bound CYP142A1 has a similar spectrum to ligand-free P450. The econazole-bound CYP142A1 shows a single set of EPR values at g = 2.47/2.25/1.90, consistent with coordination of the heme iron by an econazole nitrogen atom. The DMSO/CYP142A1 sample shows (in addition to the ligand-free type species at 2.40/2.24/1.92) two other species at 2.42/2.24/1.91 and at 2.47/2.24/1.89. While the gz = 2.47 species may be the same one as observed in the ligand-free enzyme, it is also possible that these species result from the interactions of DMSO oxygen/sulfur atoms with the CYP142A1 heme iron.
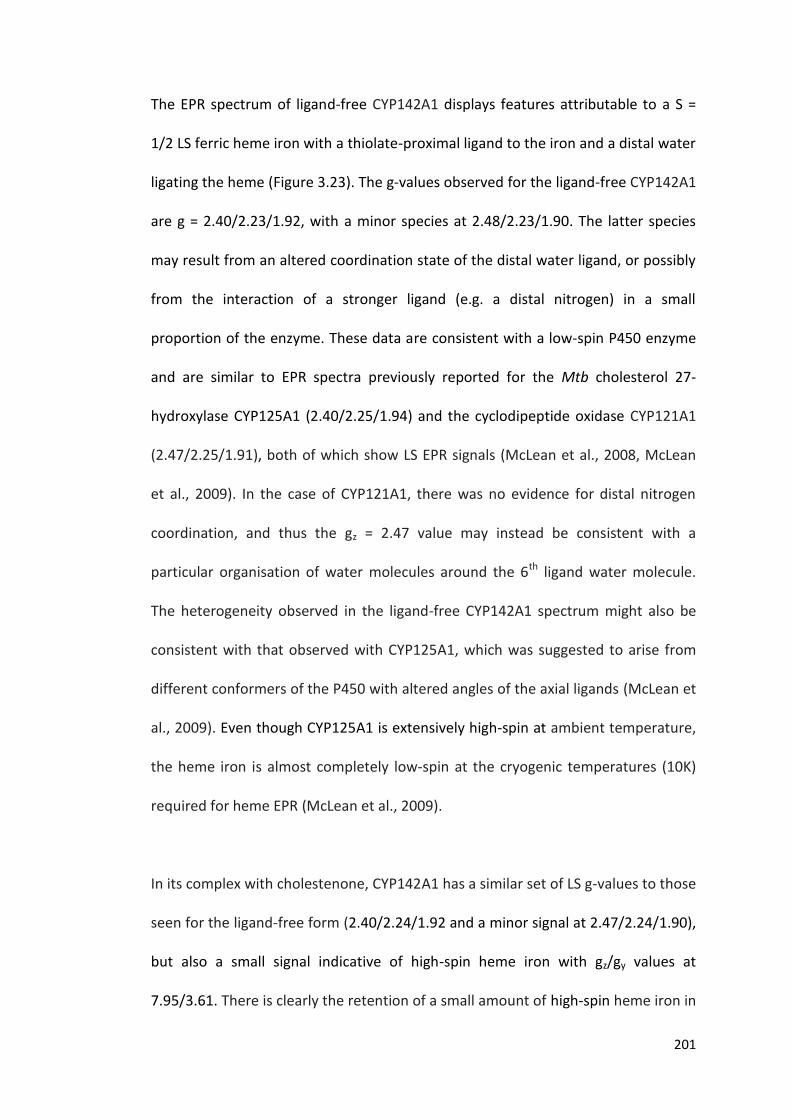
201
The EPR spectrum of ligand-free CYP142A1 displays features attributable to a S =
1/2 LS ferric heme iron with a thiolate-proximal ligand to the iron and a distal water
ligating the heme (Figure 3.23). The g-values observed for the ligand-free CYP142A1
are g = 2.40/2.23/1.92, with a minor species at 2.48/2.23/1.90. The latter species
may result from an altered coordination state of the distal water ligand, or possibly
from the interaction of a stronger ligand (e.g. a distal nitrogen) in a small
proportion of the enzyme. These data are consistent with a low-spin P450 enzyme
and are similar to EPR spectra previously reported for the Mtb cholesterol 27-
hydroxylase CYP125A1 (2.40/2.25/1.94) and the cyclodipeptide oxidase CYP121A1
(2.47/2.25/1.91), both of which show LS EPR signals (McLean et al., 2008, McLean
et al., 2009). In the case of CYP121A1, there was no evidence for distal nitrogen
coordination, and thus the gz = 2.47 value may instead be consistent with a
particular organisation of water molecules around the 6th ligand water molecule.
The heterogeneity observed in the ligand-free CYP142A1 spectrum might also be
consistent with that observed with CYP125A1, which was suggested to arise from
different conformers of the P450 with altered angles of the axial ligands (McLean et
al., 2009). Even though CYP125A1 is extensively high-spin at ambient temperature,
the heme iron is almost completely low-spin at the cryogenic temperatures (10K)
required for heme EPR (McLean et al., 2009).
In its complex with cholestenone, CYP142A1 has a similar set of LS g-values to those
seen for the ligand-free form (2.40/2.24/1.92 and a minor signal at 2.47/2.24/1.90),
but also a small signal indicative of high-spin heme iron with gz/gy values at
7.95/3.61. There is clearly the retention of a small amount of high-spin heme iron in

202
the cholestenone-bound form, despite the very low temperature used (10 K),
suggesting that the binding mode of the steroid is one in which the axial water
ligand is effectively displaced by the substrate and a proportion of high-spin heme
iron is maintained even at cryogenic temperatures. In its complex with econazole,
CYP142A1 shows a homogeneous set of g-values (2.47/2.25/1.90) indicative of the
replacement of the water ligand by the azole nitrogen. Interestingly, this contrasts
with data generated for econazole-bound Mtb CYP144A1, in which there was
heterogeneity, with g-values at 2.62 (minor)/2.45 (major), 2.26 and 1.89 (Driscoll et
al., 2011), suggesting a more complete coordination of the CYP142A1 heme iron by
econazole. Other recent studies showed near-identical g-values for the fluconazole
complex of Mtb CYP51B1 (2.45, 2.26, 1.90) with that for the CYP121A1-fluconazole
complex (McLean et al., 2008, McLean and Munro, 2008).
The addition of the solvent DMSO produced a perturbation of the CYP142A1 LS EPR
spectrum, with two sets of g-values being near-identical to those for the ligand-free
CYP142A1, but a third set (2.42/2.24/1.91) being distinct. These data may indicate
that the DMSO affects the solvent environment around the heme iron, or could
possibly reflect direct interactions with DMSO solvent oxygen and/or sulfur atoms
with the heme iron (Kuper et al., 2012).
3.2.9.2 EPR analysis for CYP142A1 fragments hits
EPR analysis also carried out on CYP142A1 complexes with fragments generated
from fragment based screening studies (Figure 3.25). These fragments are NMR170,

203
NMR491, NMR623, NMR540, and NMR089. This study is a follow-up to the UV-Vis
spectroscopy analyses presented earlier (section 3.2.4) to study the interactions of
these compounds with the P450. These fragments are imidazoles or substituted
imidazoles (NMR’s 540, 089, 491 and 623), or pyridine ring-containing (NMR540).
They thus have potential to interact with the CYP142A1 heme iron via nitrogen
atom interactions (and potentially either directly with the heme iron or via a water
molecule on the sixth axial position, as observed for fluconazole with CYP121A1)
(Seward et al., 2006). EPR data generated for CYP142A1 binding to these fragments
were compared with those for their interactions with three different azole
inhibitors (clotrimazole, 1-PIM and 2-PIM). From results obtained, heterogeneity of
low-spin EPR spectral features was observed for most of the fragments, with low-
spin EPR spectra observed in all cases. CYP142A1 in complex with 1-PIM gives a
homogeneous set of g-values (gz = 2.47, gy = 2.25, gx = 1.89) indicative of the
replacement of the water ligand by the imidazole nitrogen. NMR491, NMR089,
NMR540, NMR170, 2-PIM and clotrimazole all showed splitting of the g-values for
their CYP142A1 complexes, suggesting heterogeneity and the presence of 2-3 low-
spin species with different distal coordination states of the heme iron. For example,
CYP142A1 in complex with 2-PIM exhibits three sets of g-values at 2.51/2.24/1.88
and 2.47/2.24/1.89 (major) and at 2.40/2.24/1.90. The final form may be similar to
the ligand-free form (possibly with 2-PIM influencing the environment of the distal
water ligand), while the other two (major) species likely originate from the
coordination of the heme iron by the imidazole group, possibly with altered
geometries of Fe-azole bonding, or (for the gz = 2.47 species) a species where the 2-
PIM interacts indirectly with the CYP142A1 heme iron via the distal water that

204
remains as the heme 6th ligand, as was revealed in a recent study on the structure
of the CYP121A1-fluconazole complex (Seward et al., 2006). Among the other
azoles and fragments tested, the pyridine-containing NMR170 clearly coordinates
to the CYP142A1 heme iron in two states, with g-values of 2.54/2.25/1.87 and
2.47/2.24/1.89, while 1-phenylimidazole gives a relatively homogeneous heme-
coordinated species at 2.47/2.25/1.89. The substituted imidazole NMR623 also
gives a relatively homogeneous EPR spectrum, with the main species having g-
values of 2.44/2.25/1.90, and with a minor species at 2.57/2.25/1.85.
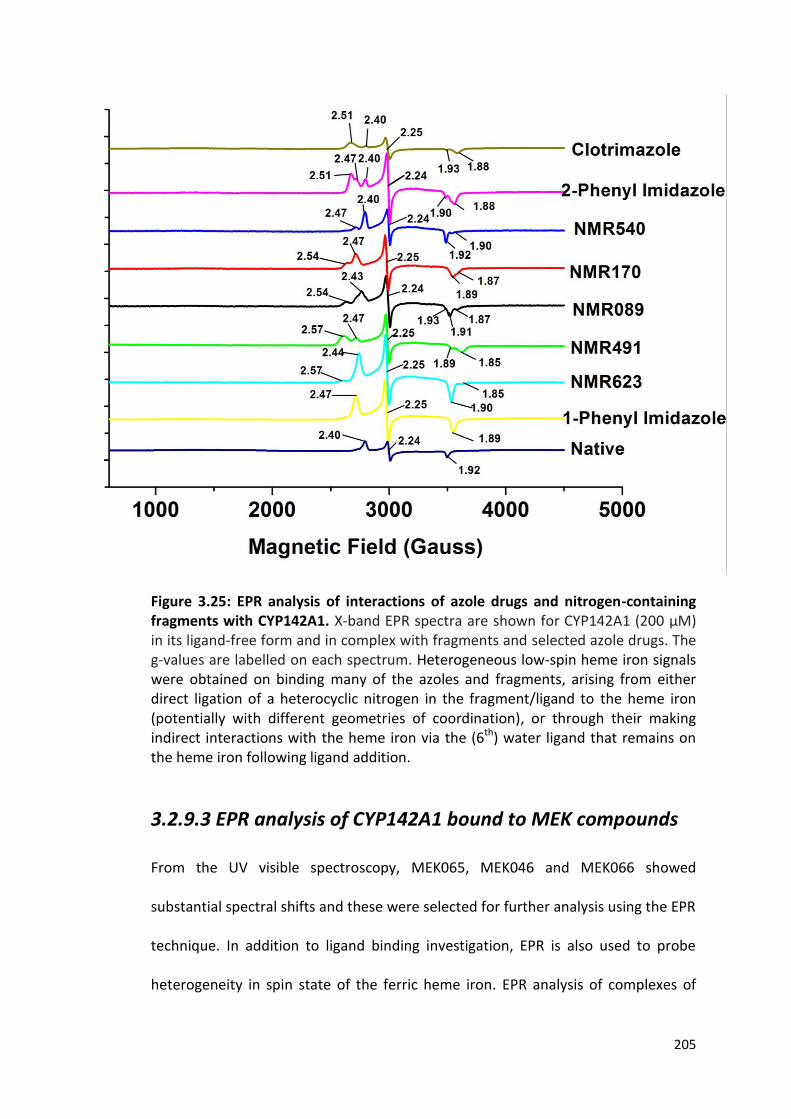
205
Figure 3.25: EPR analysis of interactions of azole drugs and nitrogen-containing fragments with CYP142A1. X-band EPR spectra are shown for CYP142A1 (200 μM) in its ligand-free form and in complex with fragments and selected azole drugs. The g-values are labelled on each spectrum. Heterogeneous low-spin heme iron signals were obtained on binding many of the azoles and fragments, arising from either direct ligation of a heterocyclic nitrogen in the fragment/ligand to the heme iron (potentially with different geometries of coordination), or through their making indirect interactions with the heme iron via the (6th) water ligand that remains on the heme iron following ligand addition.
3.2.9.3 EPR analysis of CYP142A1 bound to MEK compounds
From the UV visible spectroscopy, MEK065, MEK046 and MEK066 showed
substantial spectral shifts and these were selected for further analysis using the EPR
technique. In addition to ligand binding investigation, EPR is also used to probe
heterogeneity in spin state of the ferric heme iron. EPR analysis of complexes of
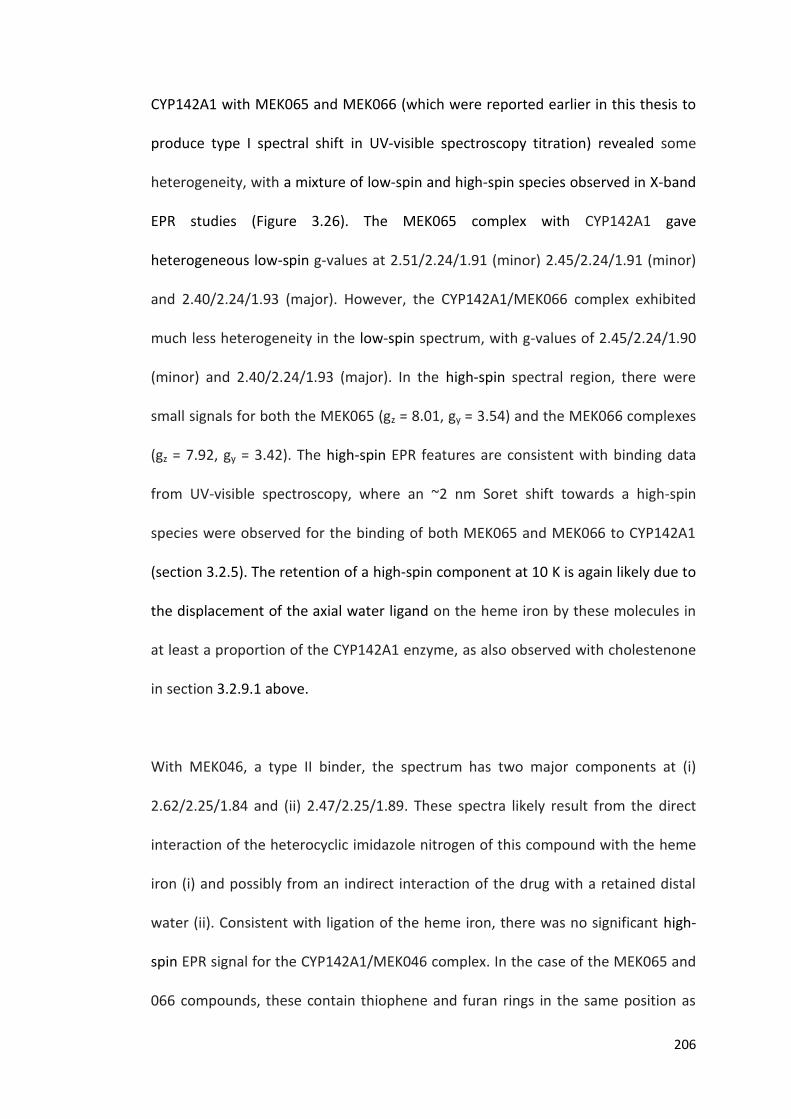
206
CYP142A1 with MEK065 and MEK066 (which were reported earlier in this thesis to
produce type I spectral shift in UV-visible spectroscopy titration) revealed some
heterogeneity, with a mixture of low-spin and high-spin species observed in X-band
EPR studies (Figure 3.26). The MEK065 complex with CYP142A1 gave
heterogeneous low-spin g-values at 2.51/2.24/1.91 (minor) 2.45/2.24/1.91 (minor)
and 2.40/2.24/1.93 (major). However, the CYP142A1/MEK066 complex exhibited
much less heterogeneity in the low-spin spectrum, with g-values of 2.45/2.24/1.90
(minor) and 2.40/2.24/1.93 (major). In the high-spin spectral region, there were
small signals for both the MEK065 (gz = 8.01, gy = 3.54) and the MEK066 complexes
(gz = 7.92, gy = 3.42). The high-spin EPR features are consistent with binding data
from UV-visible spectroscopy, where an ~2 nm Soret shift towards a high-spin
species were observed for the binding of both MEK065 and MEK066 to CYP142A1
(section 3.2.5). The retention of a high-spin component at 10 K is again likely due to
the displacement of the axial water ligand on the heme iron by these molecules in
at least a proportion of the CYP142A1 enzyme, as also observed with cholestenone
in section 3.2.9.1 above.
With MEK046, a type II binder, the spectrum has two major components at (i)
2.62/2.25/1.84 and (ii) 2.47/2.25/1.89. These spectra likely result from the direct
interaction of the heterocyclic imidazole nitrogen of this compound with the heme
iron (i) and possibly from an indirect interaction of the drug with a retained distal
water (ii). Consistent with ligation of the heme iron, there was no significant high-
spin EPR signal for the CYP142A1/MEK046 complex. In the case of the MEK065 and
066 compounds, these contain thiophene and furan rings in the same position as
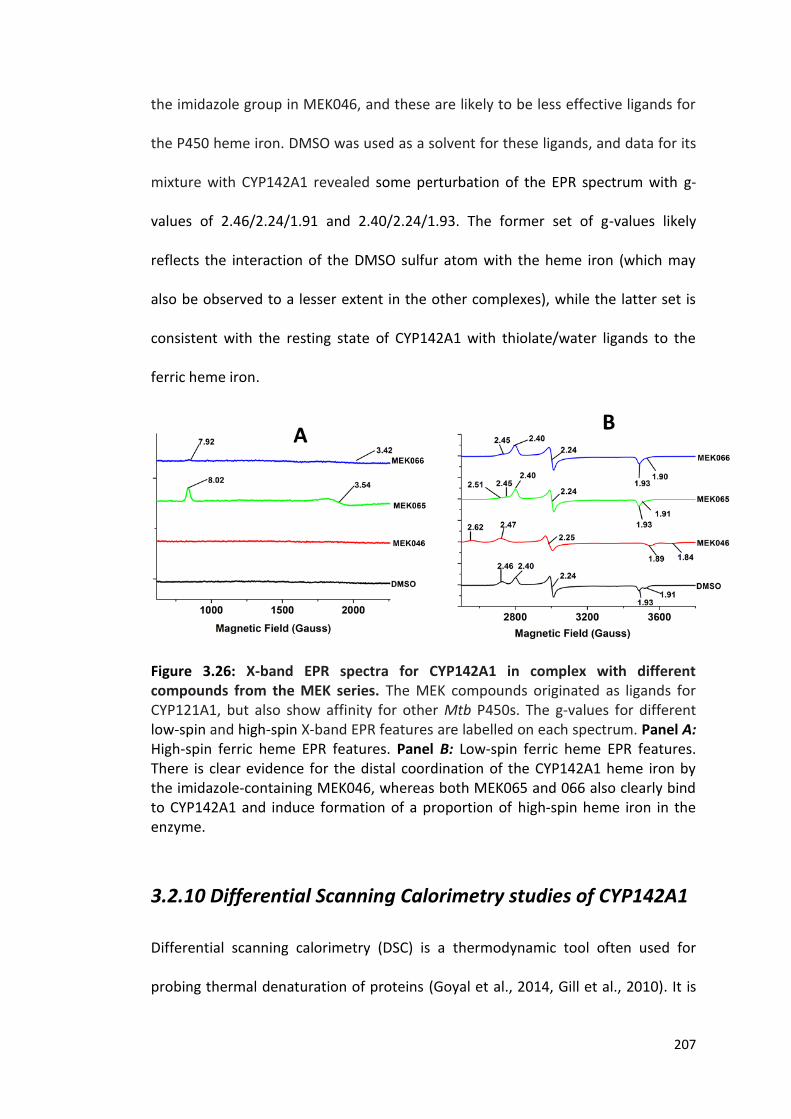
207
the imidazole group in MEK046, and these are likely to be less effective ligands for
the P450 heme iron. DMSO was used as a solvent for these ligands, and data for its
mixture with CYP142A1 revealed some perturbation of the EPR spectrum with g-
values of 2.46/2.24/1.91 and 2.40/2.24/1.93. The former set of g-values likely
reflects the interaction of the DMSO sulfur atom with the heme iron (which may
also be observed to a lesser extent in the other complexes), while the latter set is
consistent with the resting state of CYP142A1 with thiolate/water ligands to the
ferric heme iron.
Figure 3.26: X-band EPR spectra for CYP142A1 in complex with different compounds from the MEK series. The MEK compounds originated as ligands for CYP121A1, but also show affinity for other Mtb P450s. The g-values for different low-spin and high-spin X-band EPR features are labelled on each spectrum. Panel A: High-spin ferric heme EPR features. Panel B: Low-spin ferric heme EPR features. There is clear evidence for the distal coordination of the CYP142A1 heme iron by the imidazole-containing MEK046, whereas both MEK065 and 066 also clearly bind to CYP142A1 and induce formation of a proportion of high-spin heme iron in the enzyme.
3.2.10 Differential Scanning Calorimetry studies of CYP142A1
Differential scanning calorimetry (DSC) is a thermodynamic tool often used for
probing thermal denaturation of proteins (Goyal et al., 2014, Gill et al., 2010). It is
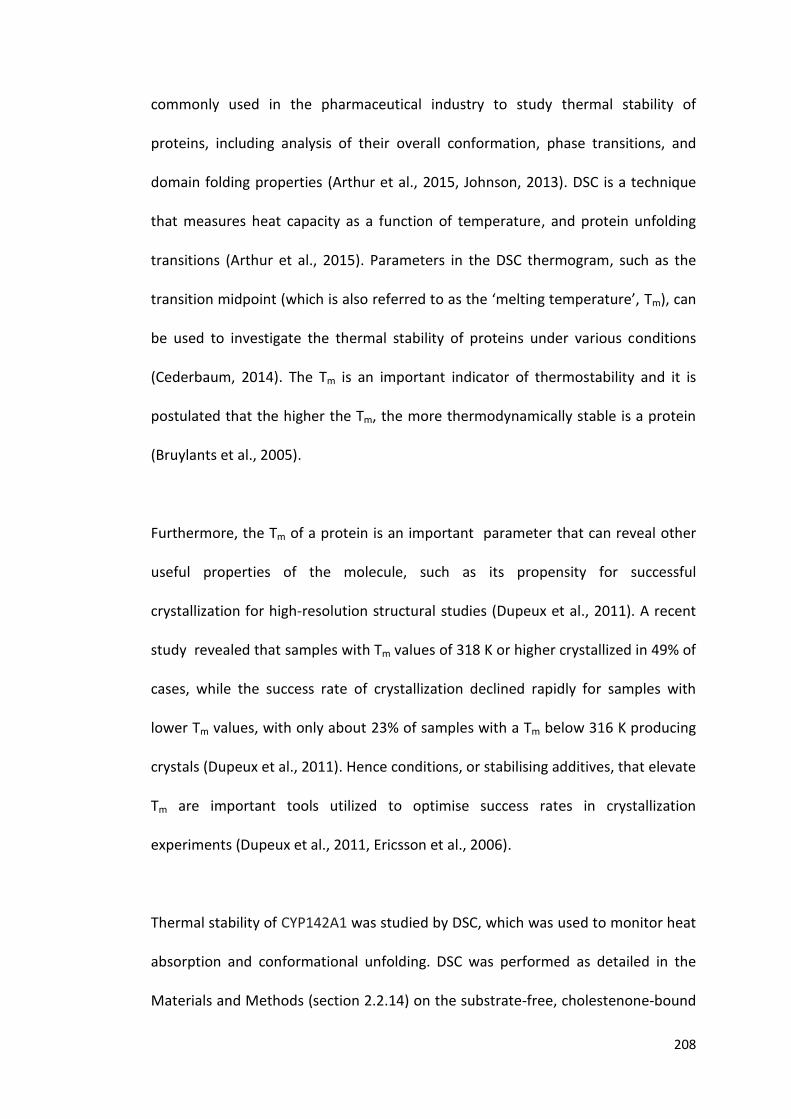
208
commonly used in the pharmaceutical industry to study thermal stability of
proteins, including analysis of their overall conformation, phase transitions, and
domain folding properties (Arthur et al., 2015, Johnson, 2013). DSC is a technique
that measures heat capacity as a function of temperature, and protein unfolding
transitions (Arthur et al., 2015). Parameters in the DSC thermogram, such as the
transition midpoint (which is also referred to as the ‘melting temperature’, Tm), can
be used to investigate the thermal stability of proteins under various conditions
(Cederbaum, 2014). The Tm is an important indicator of thermostability and it is
postulated that the higher the Tm, the more thermodynamically stable is a protein
(Bruylants et al., 2005).
Furthermore, the Tm of a protein is an important parameter that can reveal other
useful properties of the molecule, such as its propensity for successful
crystallization for high-resolution structural studies (Dupeux et al., 2011). A recent
study revealed that samples with Tm values of 318 K or higher crystallized in 49% of
cases, while the success rate of crystallization declined rapidly for samples with
lower Tm values, with only about 23% of samples with a Tm below 316 K producing
crystals (Dupeux et al., 2011). Hence conditions, or stabilising additives, that elevate
Tm are important tools utilized to optimise success rates in crystallization
experiments (Dupeux et al., 2011, Ericsson et al., 2006).
Thermal stability of CYP142A1 was studied by DSC, which was used to monitor heat
absorption and conformational unfolding. DSC was performed as detailed in the
Materials and Methods (section 2.2.14) on the substrate-free, cholestenone-bound
209
and clotrimazole-bound forms of the enzyme. The results showed that CYP142A1
displays single unfolding transitions for both the ligand-free and ligand-bound
forms of the enzyme. Cholestenone increased the CYP142A1 Tm value by
approximately 5 oC, while clotrimazole increased the Tm value by approximately 3
oC. This is indicative of stabilization (albeit to a small extent) of the P450 when
complexed with these ligands.
Figure 3.27: Differential scanning calorimetry analysis of CYP142A1. The black line is for the raw data and the red line is for the data fit, showing the protein unfolding transition events illustrated by changes in heat capacity with applied temperature The thermal unfolding profile is shown for a sample of 8 μM CYP142A1 in 10 mM KPi, 100 mM NaCl, pH7.2 buffer. The data were baselined and concentration corrected, and data were fitted using a non-2-state function using Microcal software (OriginLab). A: Ligand-free CYP142A1 with a Tm of 53.29 ± 0.06 oC. B: Cholestenone-bound CYP142A1 with a Tm of 58.43 ± 0.06 oC. C: Clotrimazole-bound CYP142A1 with a Tm of 56.06 ± 0.06 oC.
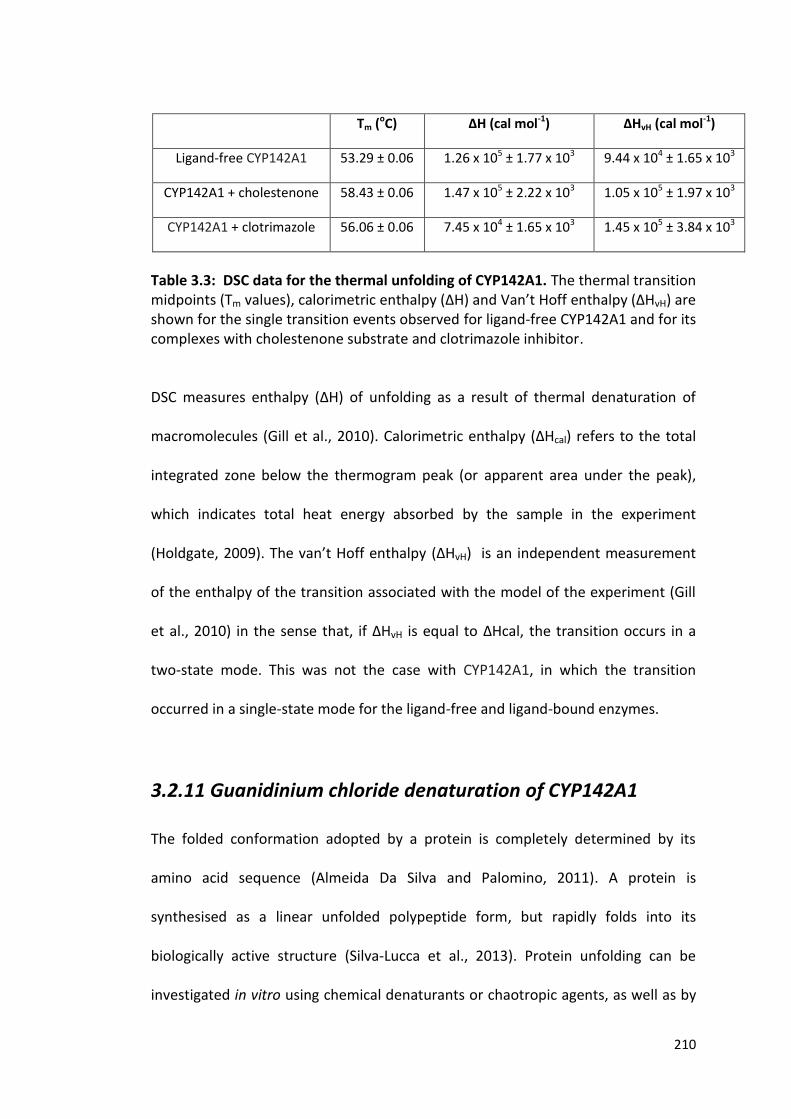
210
Tm (oC) ∆H (cal mol-1) ΔHvH (cal mol-1)
Ligand-free CYP142A1 53.29 ± 0.06 1.26 x 10⁵ ± 1.77 x 10³ 9.44 x 10⁴ ± 1.65 x 10³
CYP142A1 + cholestenone 58.43 ± 0.06 1.47 x 10⁵ ± 2.22 x 10³ 1.05 x 10⁵ ± 1.97 x 10³
CYP142A1 + clotrimazole 56.06 ± 0.06 7.45 x 10⁴ ± 1.65 x 10³ 1.45 x 10⁵ ± 3.84 x 10³
Table 3.3: DSC data for the thermal unfolding of CYP142A1. The thermal transition midpoints (Tm values), calorimetric enthalpy (ΔH) and Van’t Hoff enthalpy (ΔHvH) are shown for the single transition events observed for ligand-free CYP142A1 and for its complexes with cholestenone substrate and clotrimazole inhibitor.
DSC measures enthalpy (∆H) of unfolding as a result of thermal denaturation of
macromolecules (Gill et al., 2010). Calorimetric enthalpy (∆Hcal) refers to the total
integrated zone below the thermogram peak (or apparent area under the peak),
which indicates total heat energy absorbed by the sample in the experiment
(Holdgate, 2009). The van’t Hoff enthalpy (ΔHvH) is an independent measurement
of the enthalpy of the transition associated with the model of the experiment (Gill
et al., 2010) in the sense that, if ΔHvH is equal to ∆Hcal, the transition occurs in a
two-state mode. This was not the case with CYP142A1, in which the transition
occurred in a single-state mode for the ligand-free and ligand-bound enzymes.
3.2.11 Guanidinium chloride denaturation of CYP142A1
The folded conformation adopted by a protein is completely determined by its
amino acid sequence (Almeida Da Silva and Palomino, 2011). A protein is
synthesised as a linear unfolded polypeptide form, but rapidly folds into its
biologically active structure (Silva-Lucca et al., 2013). Protein unfolding can be
investigated in vitro using chemical denaturants or chaotropic agents, as well as by

211
using pH or temperature variations. Chaotropic agents such as guanidinium chloride
(GdmCl) or urea are frequently used to study protein unfolding/refolding, even
though the unfolding mechanism remains unclear. These studies are commonly
followed by methods including far UV-CD (to follow secondary structural change)
and protein fluorescence assays (to measure changes in protein tertiary structure)
(Almeida Da Silva and Palomino, 2011). Intrinsic fluorescence emission provides a
sensitive and effective tool to characterize proteins by monitoring tryptophan
residues that are very sensitive to the polarity of the environment. The wavelength
at the emission peak (λmax) and the fluorescence intensity can be used to study
protein unfolding/refolding and to determine conformational changes (Eftink,
1998).
In this study, experiments were carried out to investigate CYP142A1
unfolding/denaturation using increasing concentrations of GdmCl in the presence
and absence of the substrate cholestenone, followed using fluorescence assays.
Aromatic amino acid fluorescence (with excitation at ~280 nm, close to the
absorbance peak for tryptophan) provides emission spectra reporting on protein
tertiary structure. Structural perturbations induced by GdmCl were monitored by
following fluorescence changes from aromatic amino acids (mainly tryptophans) in
the emission spectra (in the range from ~300-450 nm). During GdmCl-dependent
denaturation of CYP142A1, changes in both the fluorescence emission intensity and
the max of fluorescence were observed. CYP142A1 (5 µM) was incubated with
increasing concentrations of GdmCl (0-6 M) for 30 minutes in both the absence and

212
presence of cholestenone (60 µM). Experiments were performed as described in
the Materials and Methods (section 2.2.11).
The effects of GdmCl on the fluorescence emission spectra of CYP142A1 are shown
in Figure 3.28. The intrinsic fluorescence emission spectrum of resting, substrate-
free CYP142A1 has a maximum (λmax) at 330 nm, which is red shifted to 358 nm and
accompanied by a pronounced increase in fluorescence intensity as the
concentration of GdmCl is increased. This indicates protein unfolding and the
exposure of tryptophan residues to a more polar environment. To better examine
the conformational changes induced by GdmCl on CYP142A1 in the absence and
presence of cholestenone, the percentage of unfolded CYP142A1 (taken as the ratio
of fluorescence emission near the maximum for the unfolded enzyme at 358 nm,
divided by the emission near the maximum for the native enzyme at 333 nm – i.e.
F358/F333) was plotted against the relevant GdmCl concentration and the data fitted
using a sigmoidal (Hill) function. From the fits, the midpoint values of 1.72 ± 0.05 M
GdmCl (plus cholestenone) and 1.77 ± 0.04 M GdmHCl (minus cholestenone) were
determined (Figure 3.28).
The sigmoidal curves suggest that cooperative conformational changes are induced
during GdmHCl unfolding. These data, however, showed that cholestenone had no
significant tertiary structural stabilization effect on CYP142A1 against the
denaturant. In the absence of cholestenone (Figure 3.28), the fluorescence intensity
decreased with increasing concentrations of GdmCl until ~1.75 M, and then
increased at higher concentrations of the denaturant. However, in the presence of

213
cholestenone (Figure 3.29), the fluorescence intensity increased continuously with
increasing GdmCl concentrations, suggesting that some conformational changes (or
other structural reorganization of the enzyme) are induced by binding of the
substrate. In both cases, there was a shift of the fluorescence emission maximum
(λmax) to a longer wavelength (red shift) as the proteins unfolded.
Figure 3.28: Guanidinium chloride denaturation of ligand-free CYP142A1. Panel A. Intrinsic fluorescence emission spectra recorded after incubation of CYP142A1 (5
M) with increasing concentrations of GdmCl (0-6 M) for 30 minutes in the absence of cholestenone. The emission spectral maximum is red shifted from 330 to 358 nm with increasing concentrations of GdmCl and as the protein unfolds. Panel B. shows a data plot for the percentage unfolded CYP142A1 (from the ratio of fluorescence values at 358 nm and 333 nm – F358/F333) as the concentration of GdmCl is increased. The data were fitted using the Hill function to give a midpoint value of 1.77 ± 0.04 M GdmCl (n = 2.73 ± 0.15).
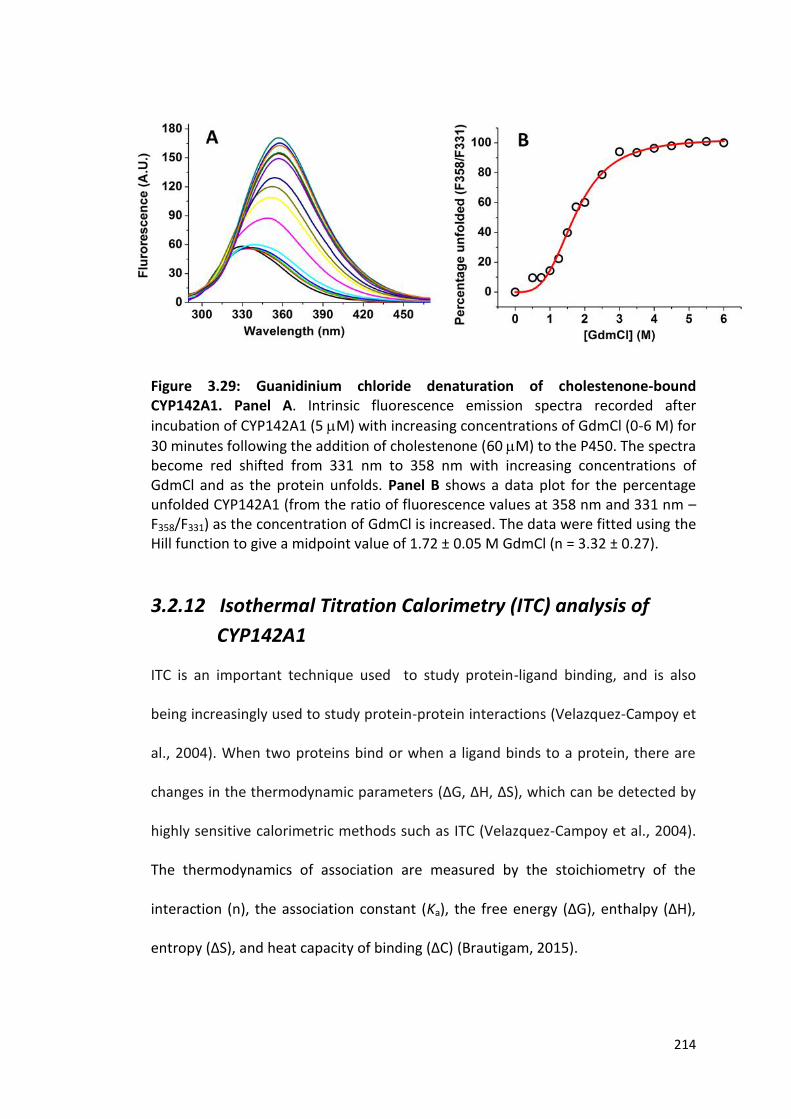
214
Figure 3.29: Guanidinium chloride denaturation of cholestenone-bound CYP142A1. Panel A. Intrinsic fluorescence emission spectra recorded after
incubation of CYP142A1 (5 M) with increasing concentrations of GdmCl (0-6 M) for
30 minutes following the addition of cholestenone (60 M) to the P450. The spectra become red shifted from 331 nm to 358 nm with increasing concentrations of GdmCl and as the protein unfolds. Panel B shows a data plot for the percentage unfolded CYP142A1 (from the ratio of fluorescence values at 358 nm and 331 nm – F358/F331) as the concentration of GdmCl is increased. The data were fitted using the Hill function to give a midpoint value of 1.72 ± 0.05 M GdmCl (n = 3.32 ± 0.27).
3.2.12 Isothermal Titration Calorimetry (ITC) analysis of
CYP142A1
ITC is an important technique used to study protein-ligand binding, and is also
being increasingly used to study protein-protein interactions (Velazquez-Campoy et
al., 2004). When two proteins bind or when a ligand binds to a protein, there are
changes in the thermodynamic parameters (∆G, ∆H, ∆S), which can be detected by
highly sensitive calorimetric methods such as ITC (Velazquez-Campoy et al., 2004).
The thermodynamics of association are measured by the stoichiometry of the
interaction (n), the association constant (Ka), the free energy (ΔG), enthalpy (ΔH),
entropy (ΔS), and heat capacity of binding (ΔC) (Brautigam, 2015).

215
Figure 3.30: Isothermal titration calorimetric (ITC) binding studies of fragments to
CYP142A1. The calorimetric enthalpy changes (upper panels) and the resulting binding
isotherms (lower panels) are shown for titrations of CYP142A1 with NMR491 (A), 1-
phenylimidazole (B), NMR170 (C), NMR623 (D), and NMR540 (E). The data were best
fitted using a one-step binding model. The binding parameters obtained are detailed in
Table 3.4.
Binding of fragments to CYP142A1 was investigated by ITC to probe the
thermodynamics of protein-fragment interactions. The experiment was performed
as described in the Materials and Methods (section 2.2.10). Out of all the fragments
tested in the study, the experiment proved successful with five of the fragment hits
and the data for these are presented in Figure 3.30. The data were best fitted using
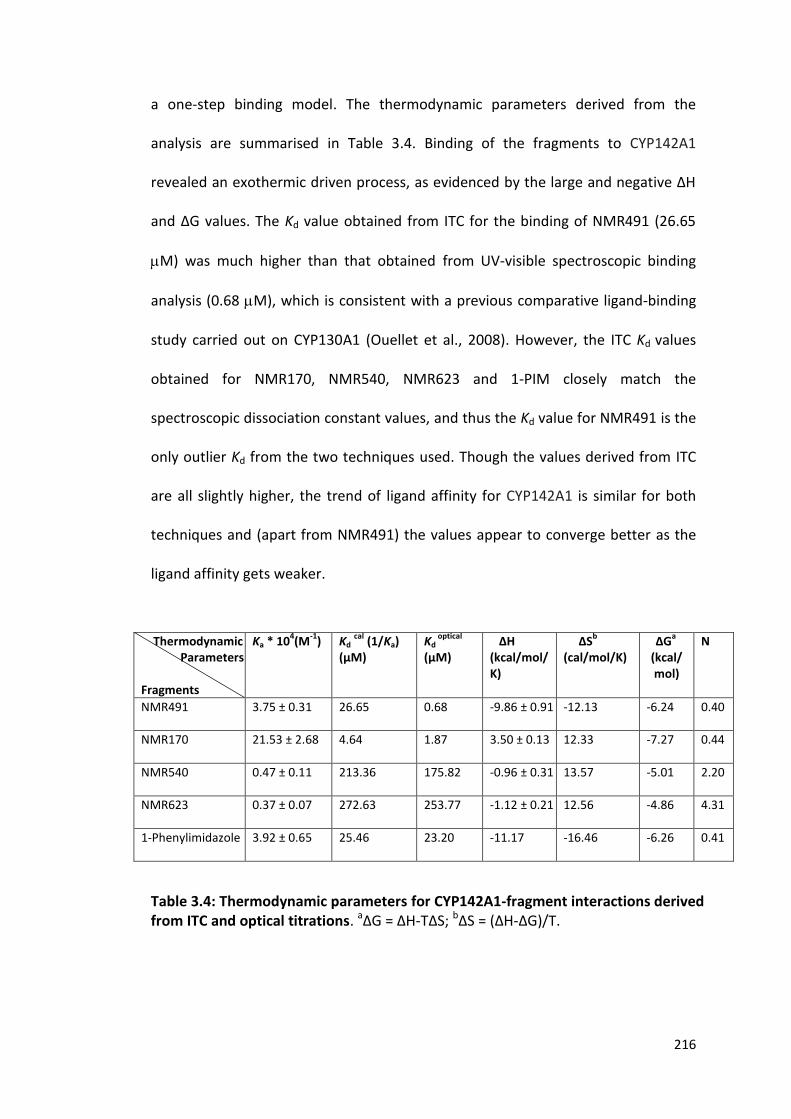
216
a one-step binding model. The thermodynamic parameters derived from the
analysis are summarised in Table 3.4. Binding of the fragments to CYP142A1
revealed an exothermic driven process, as evidenced by the large and negative ∆H
and ∆G values. The Kd value obtained from ITC for the binding of NMR491 (26.65
M) was much higher than that obtained from UV-visible spectroscopic binding
analysis (0.68 M), which is consistent with a previous comparative ligand-binding
study carried out on CYP130A1 (Ouellet et al., 2008). However, the ITC Kd values
obtained for NMR170, NMR540, NMR623 and 1-PIM closely match the
spectroscopic dissociation constant values, and thus the Kd value for NMR491 is the
only outlier Kd from the two techniques used. Though the values derived from ITC
are all slightly higher, the trend of ligand affinity for CYP142A1 is similar for both
techniques and (apart from NMR491) the values appear to converge better as the
ligand affinity gets weaker.
Thermodynamic Parameters Fragments
Ka * 104(M
-1) Kd
cal (1/Ka)
(µM) Kd
optical
(µM) ∆H (kcal/mol/K)
∆Sb
(cal/mol/K)
∆Ga
(kcal/mol)
N
NMR491 3.75 ± 0.31 26.65 0.68 -9.86 ± 0.91 -12.13 -6.24 0.40
NMR170 21.53 ± 2.68 4.64 1.87 3.50 ± 0.13 12.33 -7.27 0.44
NMR540 0.47 ± 0.11 213.36 175.82 -0.96 ± 0.31 13.57 -5.01 2.20
NMR623 0.37 ± 0.07 272.63 253.77 -1.12 ± 0.21 12.56 -4.86 4.31
1-Phenylimidazole 3.92 ± 0.65 25.46 23.20 -11.17 -16.46 -6.26 0.41
Table 3.4: Thermodynamic parameters for CYP142A1-fragment interactions derived from ITC and optical titrations. a∆G = ∆H-T∆S; b∆S = (∆H-∆G)/T.

217
3.2.13 Redox potentiometry of CYP142A1
The cytochrome P450 enzymes contain ferric heme iron in their resting states, and
a change in spin-state equilibrium of the heme iron from predominantly low-spin (S
= 1/2) to predominantly high-spin (S = 5/2) occurs on substrate binding in most
cases (McLean et al., 2007a). This is as a result of the displacement of the 6th
(water) ligand to the heme iron (Driscoll et al., 2011). Substrate binding to P450
enzymes in this way mostly leads to an elevation of the heme iron reduction
potential by about 130-140 mV, meaning that the ferric heme iron potential
becomes more positive. This positive shift in potential facilitates/accelerates heme
iron reduction by the NAD(P)H-dependent redox partner enzymes as a
consequence of a greater driving force for electron transfer to the heme iron (Daff
et al., 1997).
This is an important regulatory process, allowing efficient heme reduction only
when the P450 is substrate-bound, and avoiding production of damaging oxygen
radicals (H2O2 and superoxide). Figure 3.31 shows spectral data from a redox
titration of CYP142A1 in the ligand-free form. On reduction of the heme iron from
Fe3+ to Fe2+, there is a decrease in heme absorption with a blue shift from 418 nm to
~405 nm, and the merging of the α and β bands at longer wavelength.
Previous redox potentiometry studies performed on ligand-free Mtb CYP51B1
showed a Soret shift to a longer wavelength from 419 nm to 423 nm, and with a
significant feature developing at 558.5 nm for the reduced enzyme (McLean et al.,

218
2006b). CYP144A1 also exhibited similar features with a Soret shift from 420.5 nm
to 425 nm (Driscoll et al., 2011). The spectral changes revealed by CYP144A1 and
CYP51B1 on heme reduction are indicative of the heme iron becoming thiol-
coordinated in the ferrous state (McLean et al., 2006b, Driscoll et al., 2011).
However, in contrast to the above results, redox titration of CYP121A1 revealed a
shift in the Soret band from 416.5 nm to 407 nm on heme reduction and similar
results were obtained from P450 BM3 and P450cam enzymes, indicating the
retention of heme thiolate coordination in the ferrous enzyme (McLean et al., 2008,
Daff et al., 1997, Sligar and Gunsalus, 1976). The spectral changes observed for
CYP142A1 on heme reduction with dithionite are thus consistent with the heme
iron retention of cysteine thiolate coordination in the ferrous enzyme (Figure
3.31A).
Figure 3.31 panel B shows a fit of the CYP142A1 heme absorbance at 418 nm versus
applied potential data, using the Nernst equation. This produces a CYP142A1 midpoint
potential of −394 ± 4 mV versus the normal hydrogen electrode (NHE). This value is
somewhat more negative than the values determined for some other Mtb P450s e.g.
CYP144A1 (−355 ± 5 mV), CYP51B1 (−375 ± 5 mV) and CYP125A1 (−303 ± 5 mV).
However, the midpoint potential obtained for ligand-free CYP142A1 (−394 ± 4 mV) is
consistent with the values determined for CYP121A1 and for some of its mutants, which
were all found to be more negative than -400 mV (McLean et al., 2008).

219
Figure 3.31: Redox potentiometry of ligand-free CYP142A1. The main panel shows spectra from a redox titration of ligand-free CYP142A1 (∼8.5 μM). The arrows indicate the direction of absorption changes occurring during the reductive phase of the titration, as the ferric heme iron is reduced to the ferrous form. The ferric heme Soret band at 418 nm (black solid line) decreases in intensity and shifts to 405 nm (red solid line) in the ferrous state. In the visible region, an absorption band develops at 550 nm on heme reduction with a merging of the α and β bands. The Inset shows a plot of heme absorbance change at 418 nm against the applied potential (versus the normal hydrogen electrode, NHE), and with the data fitted using the Nernst equation to produce a midpoint potential of −394 ± 4 mV for the heme iron Fe3+/Fe2+ transition.
Figure 3.32 (main panel) shows spectral data from a redox titration of CYP142A1
complexed with cholestenone. On reduction of the heme iron from Fe3+ to Fe2+,
there is a decrease in heme absorption with a red shift from 393 nm to 405 nm. The
Figure 3.32 inset shows a plot of the heme absorbance at 393 nm versus applied
potential, with data fitted using the Nernst equation, producing a CYP142A1
midpoint potential of −150 ± 4 mV versus NHE. When compared to the midpoint
220
potential for the ligand-free CYP142A1 (−394 ± 4 mV), the large potential change
(~240 mV) between the low-spin (substrate-free, SF) and high-spin (substrate-
bound, SB) forms reflects a major change in heme iron spin-state on cholestenone
binding and a tightly regulated redox system. Studies have revealed that the redox
potential for CYP51B1 is −375 ± 5 mV in the ligand-free form and this is elevated to
−225 ± 8 mV for the estriol-bound form (giving a difference of 150 mV), in which
the estriol-bound protein becomes extensively high-spin (McLean et al., 2006b).
The ligand-free cholesterol hydroxylase CYP125A1 has a more positive heme
potential of −303 ± 5 mV, consistent with the more HS nature of this Mtb P450
(McLean et al., 2009). In addition, the midpoint redox potential of the P450 BM3
heme iron is −427 mV in the ligand-free form elevating to −289 mV when
complexed with the substrate arachidonic acid, giving a difference of 138 mV (Ost
et al., 2001). The much larger potential change (~250 mV) between the low-spin
(SF) and high-spin (SB) forms of CYP142A1 is, however, unusual and the precise
reasons for this magnitude of change are unclear.
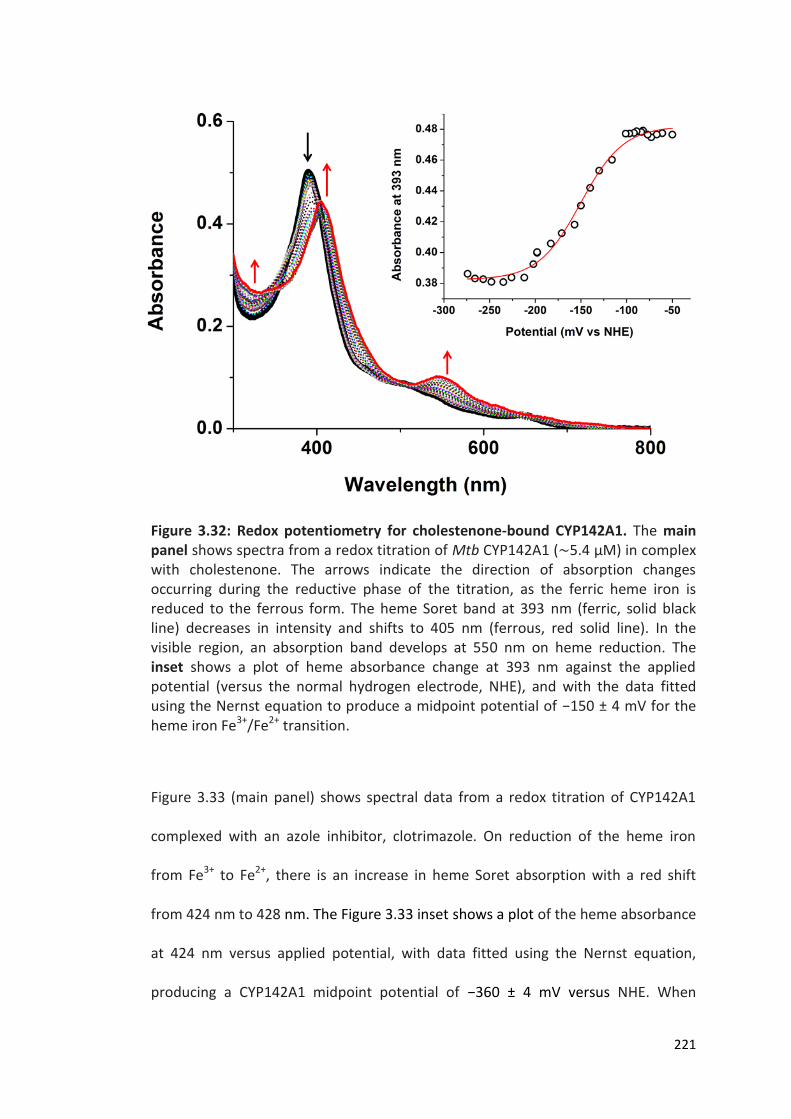
221
Figure 3.32: Redox potentiometry for cholestenone-bound CYP142A1. The main panel shows spectra from a redox titration of Mtb CYP142A1 (∼5.4 μM) in complex with cholestenone. The arrows indicate the direction of absorption changes occurring during the reductive phase of the titration, as the ferric heme iron is reduced to the ferrous form. The heme Soret band at 393 nm (ferric, solid black line) decreases in intensity and shifts to 405 nm (ferrous, red solid line). In the visible region, an absorption band develops at 550 nm on heme reduction. The inset shows a plot of heme absorbance change at 393 nm against the applied potential (versus the normal hydrogen electrode, NHE), and with the data fitted using the Nernst equation to produce a midpoint potential of −150 ± 4 mV for the heme iron Fe3+/Fe2+ transition.
Figure 3.33 (main panel) shows spectral data from a redox titration of CYP142A1
complexed with an azole inhibitor, clotrimazole. On reduction of the heme iron
from Fe3+ to Fe2+, there is an increase in heme Soret absorption with a red shift
from 424 nm to 428 nm. The Figure 3.33 inset shows a plot of the heme absorbance
at 424 nm versus applied potential, with data fitted using the Nernst equation,
producing a CYP142A1 midpoint potential of −360 ± 4 mV versus NHE. When
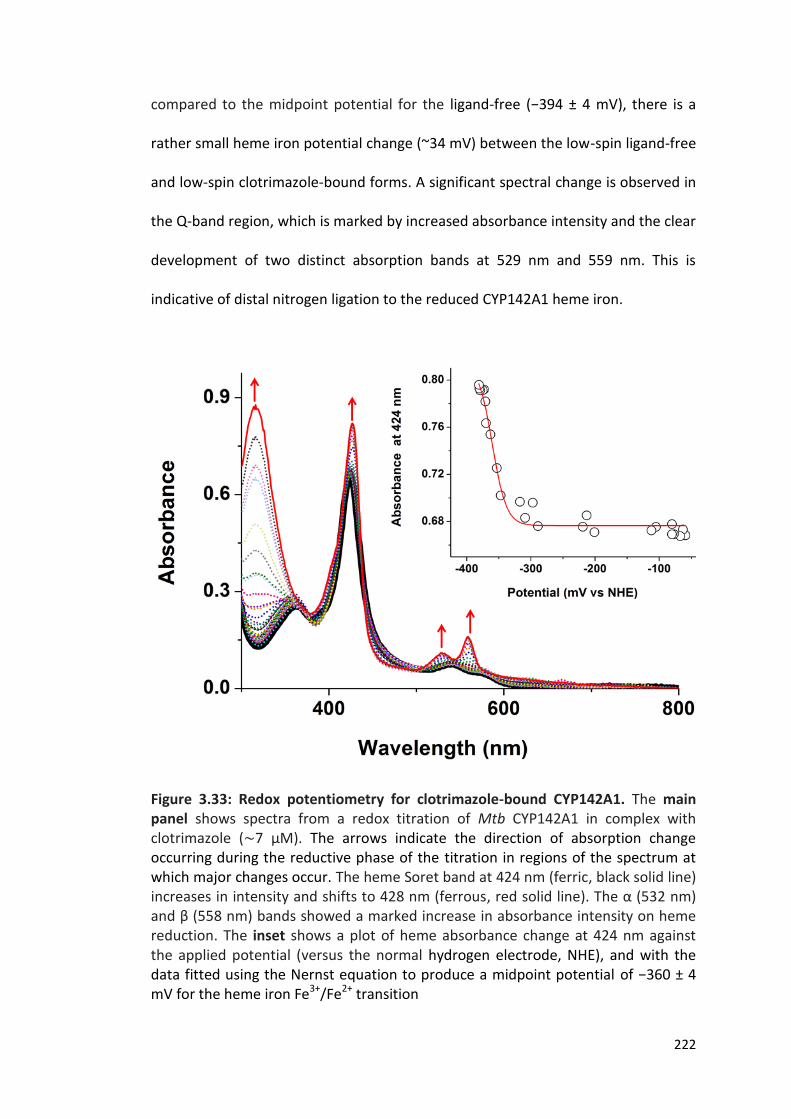
222
compared to the midpoint potential for the ligand-free (−394 ± 4 mV), there is a
rather small heme iron potential change (~34 mV) between the low-spin ligand-free
and low-spin clotrimazole-bound forms. A significant spectral change is observed in
the Q-band region, which is marked by increased absorbance intensity and the clear
development of two distinct absorption bands at 529 nm and 559 nm. This is
indicative of distal nitrogen ligation to the reduced CYP142A1 heme iron.
Figure 3.33: Redox potentiometry for clotrimazole-bound CYP142A1. The main panel shows spectra from a redox titration of Mtb CYP142A1 in complex with clotrimazole (∼7 μM). The arrows indicate the direction of absorption change occurring during the reductive phase of the titration in regions of the spectrum at which major changes occur. The heme Soret band at 424 nm (ferric, black solid line) increases in intensity and shifts to 428 nm (ferrous, red solid line). The α (532 nm) and β (558 nm) bands showed a marked increase in absorbance intensity on heme reduction. The inset shows a plot of heme absorbance change at 424 nm against the applied potential (versus the normal hydrogen electrode, NHE), and with the data fitted using the Nernst equation to produce a midpoint potential of −360 ± 4 mV for the heme iron Fe3+/Fe2+ transition
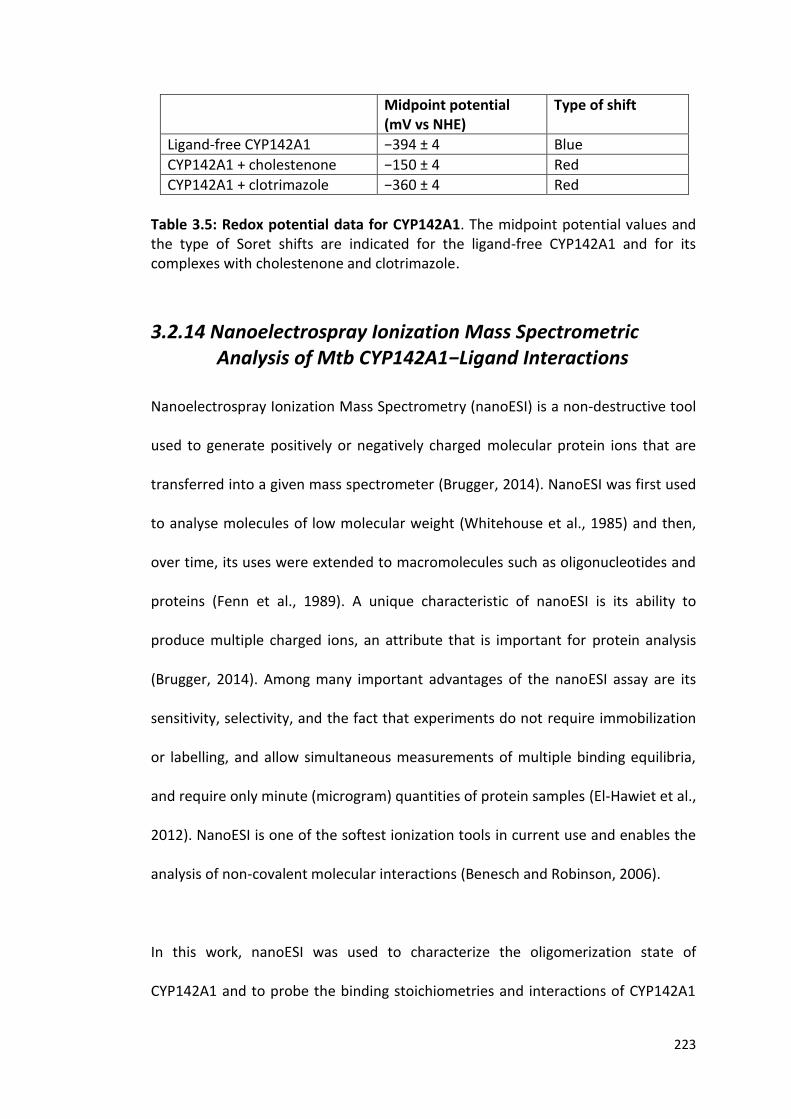
223
Midpoint potential (mV vs NHE)
Type of shift
Ligand-free CYP142A1 −394 ± 4 Blue
CYP142A1 + cholestenone −150 ± 4 Red
CYP142A1 + clotrimazole −360 ± 4 Red
Table 3.5: Redox potential data for CYP142A1. The midpoint potential values and the type of Soret shifts are indicated for the ligand-free CYP142A1 and for its complexes with cholestenone and clotrimazole.
3.2.14 Nanoelectrospray Ionization Mass Spectrometric
Analysis of Mtb CYP142A1−Ligand Interactions Nanoelectrospray Ionization Mass Spectrometry (nanoESI) is a non-destructive tool
used to generate positively or negatively charged molecular protein ions that are
transferred into a given mass spectrometer (Brugger, 2014). NanoESI was first used
to analyse molecules of low molecular weight (Whitehouse et al., 1985) and then,
over time, its uses were extended to macromolecules such as oligonucleotides and
proteins (Fenn et al., 1989). A unique characteristic of nanoESI is its ability to
produce multiple charged ions, an attribute that is important for protein analysis
(Brugger, 2014). Among many important advantages of the nanoESI assay are its
sensitivity, selectivity, and the fact that experiments do not require immobilization
or labelling, and allow simultaneous measurements of multiple binding equilibria,
and require only minute (microgram) quantities of protein samples (El-Hawiet et al.,
2012). NanoESI is one of the softest ionization tools in current use and enables the
analysis of non-covalent molecular interactions (Benesch and Robinson, 2006).
In this work, nanoESI was used to characterize the oligomerization state of
CYP142A1 and to probe the binding stoichiometries and interactions of CYP142A1
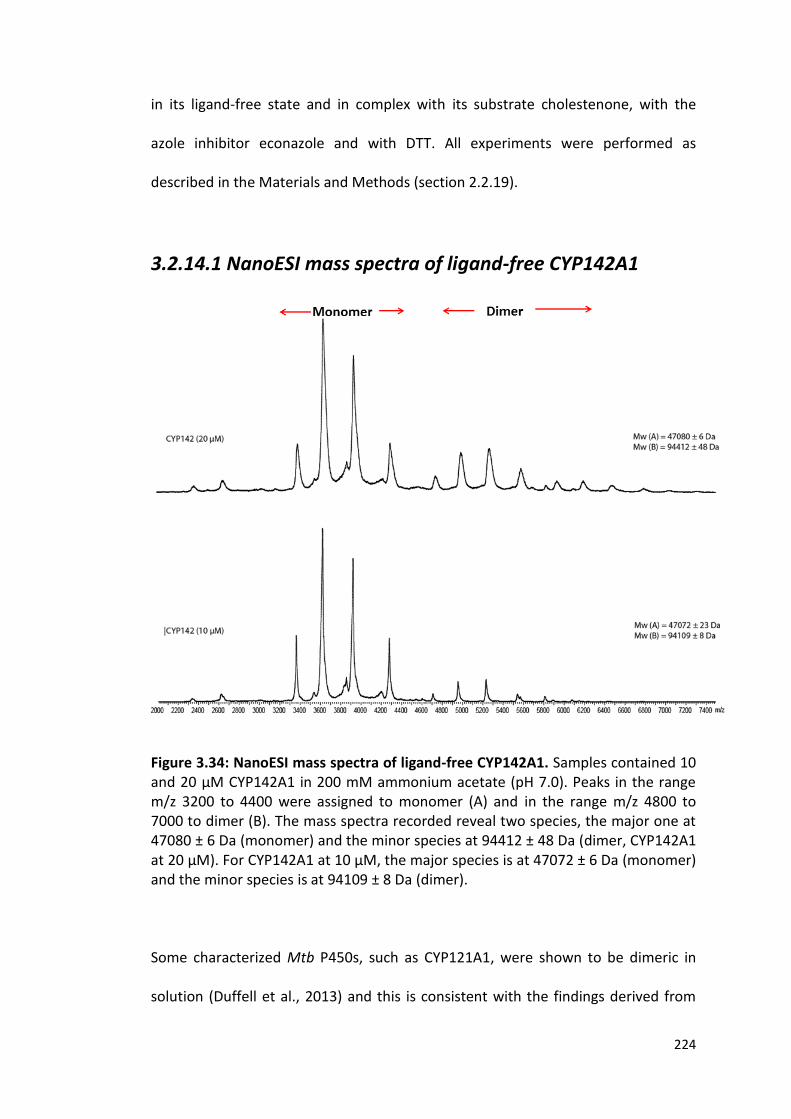
224
in its ligand-free state and in complex with its substrate cholestenone, with the
azole inhibitor econazole and with DTT. All experiments were performed as
described in the Materials and Methods (section 2.2.19).
3.2.14.1 NanoESI mass spectra of ligand-free CYP142A1
Figure 3.34: NanoESI mass spectra of ligand-free CYP142A1. Samples contained 10 and 20 μM CYP142A1 in 200 mM ammonium acetate (pH 7.0). Peaks in the range m/z 3200 to 4400 were assigned to monomer (A) and in the range m/z 4800 to 7000 to dimer (B). The mass spectra recorded reveal two species, the major one at 47080 ± 6 Da (monomer) and the minor species at 94412 ± 48 Da (dimer, CYP142A1 at 20 µM). For CYP142A1 at 10 µM, the major species is at 47072 ± 6 Da (monomer) and the minor species is at 94109 ± 8 Da (dimer).
Some characterized Mtb P450s, such as CYP121A1, were shown to be dimeric in
solution (Duffell et al., 2013) and this is consistent with the findings derived from
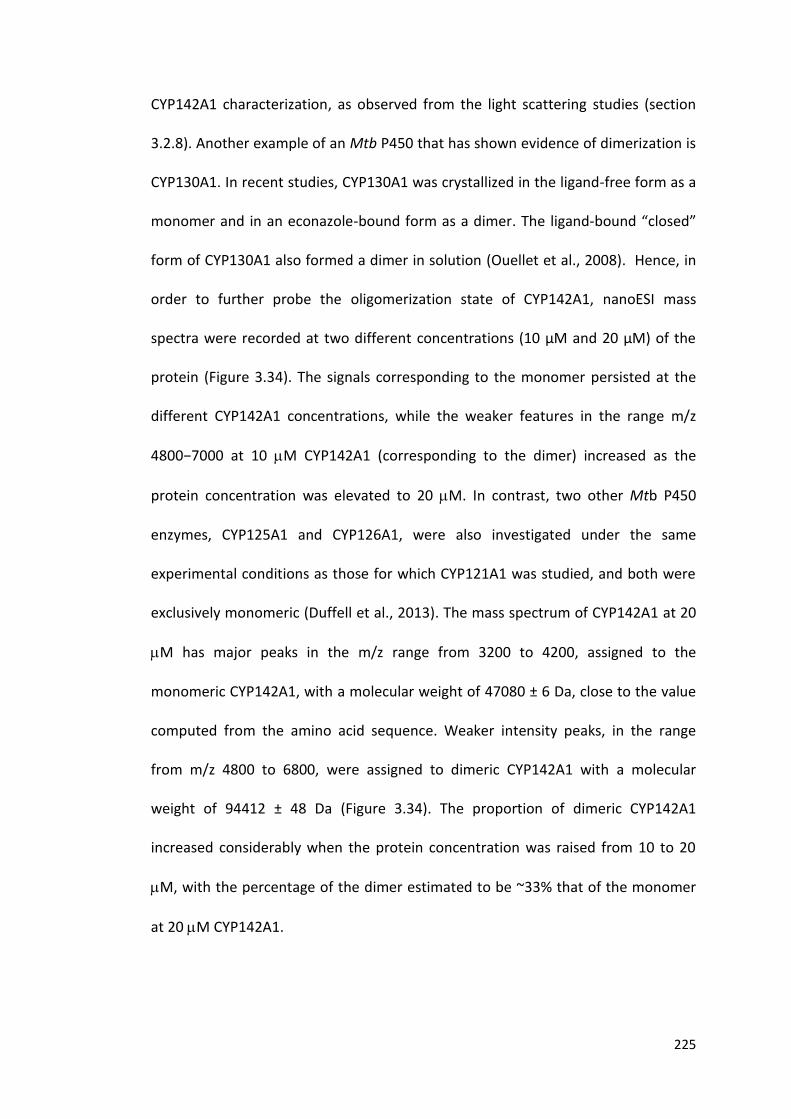
225
CYP142A1 characterization, as observed from the light scattering studies (section
3.2.8). Another example of an Mtb P450 that has shown evidence of dimerization is
CYP130A1. In recent studies, CYP130A1 was crystallized in the ligand-free form as a
monomer and in an econazole-bound form as a dimer. The ligand-bound “closed”
form of CYP130A1 also formed a dimer in solution (Ouellet et al., 2008). Hence, in
order to further probe the oligomerization state of CYP142A1, nanoESI mass
spectra were recorded at two different concentrations (10 µM and 20 µM) of the
protein (Figure 3.34). The signals corresponding to the monomer persisted at the
different CYP142A1 concentrations, while the weaker features in the range m/z
4800−7000 at 10 M CYP142A1 (corresponding to the dimer) increased as the
protein concentration was elevated to 20 M. In contrast, two other Mtb P450
enzymes, CYP125A1 and CYP126A1, were also investigated under the same
experimental conditions as those for which CYP121A1 was studied, and both were
exclusively monomeric (Duffell et al., 2013). The mass spectrum of CYP142A1 at 20
M has major peaks in the m/z range from 3200 to 4200, assigned to the
monomeric CYP142A1, with a molecular weight of 47080 ± 6 Da, close to the value
computed from the amino acid sequence. Weaker intensity peaks, in the range
from m/z 4800 to 6800, were assigned to dimeric CYP142A1 with a molecular
weight of 94412 ± 48 Da (Figure 3.34). The proportion of dimeric CYP142A1
increased considerably when the protein concentration was raised from 10 to 20
M, with the percentage of the dimer estimated to be ~33% that of the monomer
at 20 M CYP142A1.
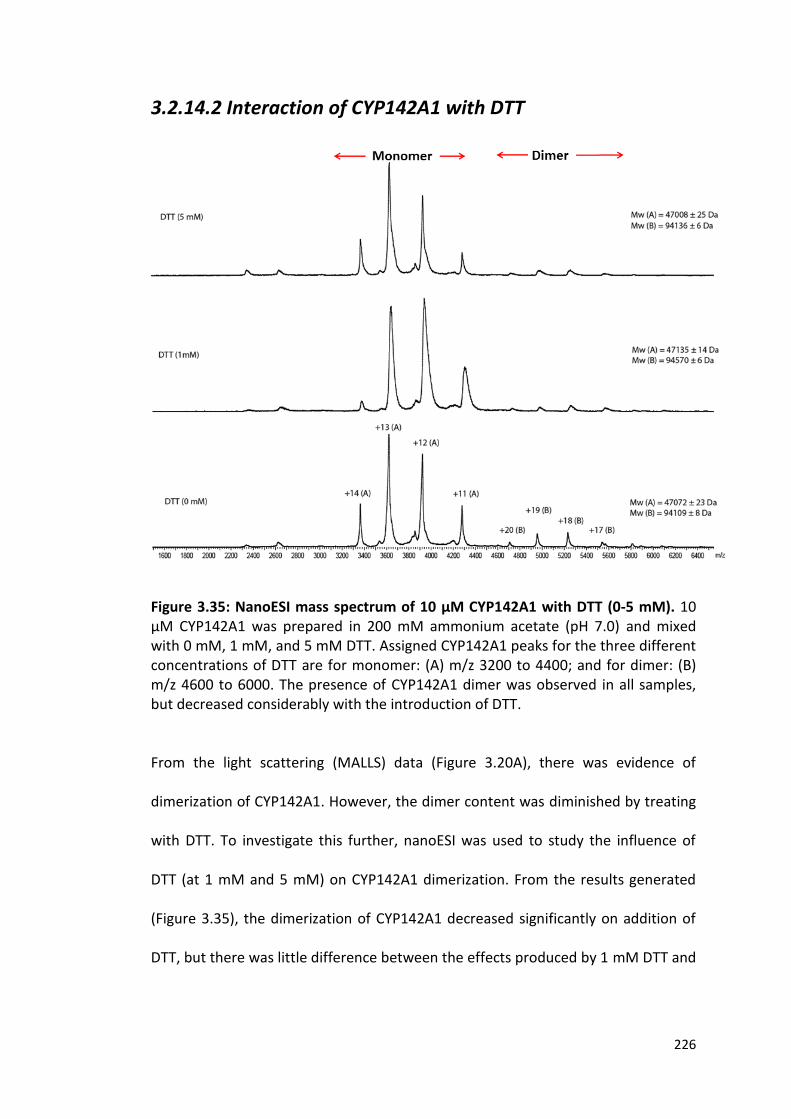
226
3.2.14.2 Interaction of CYP142A1 with DTT
Figure 3.35: NanoESI mass spectrum of 10 μM CYP142A1 with DTT (0-5 mM). 10 μM CYP142A1 was prepared in 200 mM ammonium acetate (pH 7.0) and mixed with 0 mM, 1 mM, and 5 mM DTT. Assigned CYP142A1 peaks for the three different concentrations of DTT are for monomer: (A) m/z 3200 to 4400; and for dimer: (B) m/z 4600 to 6000. The presence of CYP142A1 dimer was observed in all samples, but decreased considerably with the introduction of DTT. From the light scattering (MALLS) data (Figure 3.20A), there was evidence of
dimerization of CYP142A1. However, the dimer content was diminished by treating
with DTT. To investigate this further, nanoESI was used to study the influence of
DTT (at 1 mM and 5 mM) on CYP142A1 dimerization. From the results generated
(Figure 3.35), the dimerization of CYP142A1 decreased significantly on addition of
DTT, but there was little difference between the effects produced by 1 mM DTT and
227
5 mM DTT. However, the reduction in the percentage of CYP142A1 dimer present
was from approximately 13% dimer in absence of DTT to 7% dimer at 5 mM DTT.
3.2.14.3 Interaction of CYP142A1 with Econazole
The interactions of CYP142A1 with two different concentrations (10 and 50 µM) of
a known azole inhibitor (econazole) were also investigated. CYP142A1 was directly
mixed with econazole in the form of stock solutions in 100% DMSO. The influence
of DMSO (2.5%) on the quality of the spectra was also analysed (Figure 3.36). The
dimerization of CYP142A1 was almost negligible when complexed with econazole,
but a significant proportion of dimer was evident in the presence of DMSO, possibly
indicating that changes in structural conformation which favour the dissociation of
the dimer occur in the presence of econazole. In addition, it is worth noting that the
presence of DMSO alone did not have any obvious impact on the measured masses.
Econazole complexes with CYP142A1 by ligating to the P450 heme iron via an
imidazole nitrogen atom on the molecule. The nanoESI MS data revealed that
econazole bound to CYP142A1 in a proportion of the molecules. There was also
some influence on the aggregation state of the enzyme, as the proportion of
CYP142A1 dimer was diminished to some extent in the samples to which econazole
was added (Figures 3.36). The molecular weight of econazole is ~382 Da and hence
a deduction of this value from 47436 ± 2 Da (for example, in the case of the 50 M
econazole complex) gives a figure approximately that of the molecular weight of
the ligand-free CYP142A1 (~47054 Da). This finding is consistent between the data
sets obtained using two different concentrations of econazole. The recorded

228
spectra for the monomeric CYP142A1 ligand complex revealed a splitting of the
peaks associated with both unbound and econazole-bound monomeric forms.
Signals associated with CYP142A1 dimer are almost absent for the econazole-bound
CYP142A1 (with more dimer seen in the DMSO-only sample). This observation is
consistent with the results obtained for CYP121A1 in recent studies, where stronger
binding azoles such as clotrimazole or miconazole cause dissociation of the dimers
present (Duffell et al., 2013).

229
Figure 3.36: NanoESI mass spectra of 10 μM CYP142A1 with econazole. 10 μM CYP142A1 was mixed with 2.5% DMSO, and either 10 μM or 50 μM econazole in 200 mM ammonium acetate (pH 7). Peaks in the range m/z = 42700 to 5400 were assigned to monomer. Red dots indicate the unbound monomers and green dots represent econazole-bound monomers. Dimeric features are almost absent for the econazole-bound CYP142A1. At 50 µM econazole, the ligand-free monomer has a Mw = 47046 ± 1 Da and the ligand-bound monomer a Mw = 47436 ± 2 Da. The difference in mass (390 Da) is consistent with that of econazole (382 Da), within the error range of the experiment. At 10 µM econazole, the ligand-free monomer has a Mw = 47058 ± 38 Da and the ligand-bound monomer a Mw = 47489 ± 24 Da. In the presence of DMSO only (at 2.5% v/v), the ligand-free monomer has a Mw = 47058 ± 16 Da, similar to that for ligand-free CYP142A1.
3.2.14.4 Analysis of the Interaction of CYP142A1 with Cholestenone.
Cholestenone and cholesterol are substrates for CYP142A1 and Mtb utilises these
substrates as a major source of energy during chronic and latent infection (Ouellet
et al., 2011). CYP142A1 (alongside CYP125A1 and CYP124A1) catalyses the C27

230
hydroxylation of the cholestenone/cholesterol side chain via a three step reaction,
first to an alcohol, then to an aldehyde and finally to the carboxylic acid moiety
(Johnston et al., 2010). Binding assays for CYP142A1 with cholestenone reveal a
heme iron high-spin shift associated with a Soret band shift to lower wavelength (a
‘blue shift’). This shift in the heme iron spin-state is accompanied by the substrate-
dependent displacement of the axial water ligand on the heme iron.
In this experiment 0-125 μM cholestenone was added to a 10 μM solution of
CYP142A1. Data revealed mainly monomeric species (ligand-free and cholestenone-
bound) with a proportion of dimeric peaks. Peaks in the range from m/z 3400 to
4400 correspond to the monomer. The molecular weight of cholestenone is ~385
Da and hence a deduction of this value from 47424 ± 40 Da (for the 125 M
cholestenone-bound monomer form), for example, gives a figure approximating to
the molecular weight of the ligand-free CYP142A1 (~47036 ± 3 Da). This finding is
consistent for the data sets obtained at three different concentrations of
cholestenone. The spectra for CYP142A1 at each cholestenone concentration
revealed a splitting of the peaks into unbound and cholestenone-bound monomer
forms. Weak peaks representing dimeric species are evident with each of the
cholestenone-bound CYP142A1 forms, and with the cholestenone-free sample that
contains only ethanol (used as solvent for cholestenone). The results obtained here
for CYP142A1 points to important differences with recent studies carried out using
CYP121A1, and where both monomeric and dimeric CYP121A1 azole ligand-bound
peaks were observed (Duffell et al., 2013).
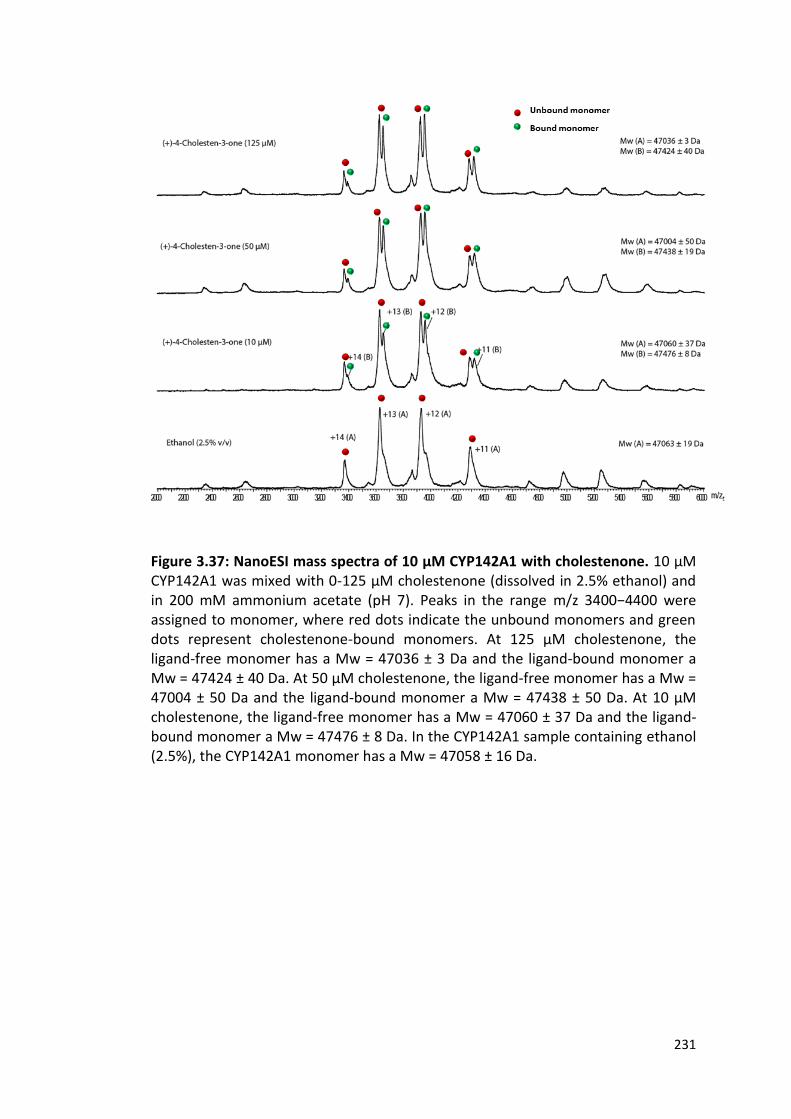
231
Figure 3.37: NanoESI mass spectra of 10 μM CYP142A1 with cholestenone. 10 μM CYP142A1 was mixed with 0-125 μM cholestenone (dissolved in 2.5% ethanol) and in 200 mM ammonium acetate (pH 7). Peaks in the range m/z 3400−4400 were assigned to monomer, where red dots indicate the unbound monomers and green dots represent cholestenone-bound monomers. At 125 µM cholestenone, the ligand-free monomer has a Mw = 47036 ± 3 Da and the ligand-bound monomer a Mw = 47424 ± 40 Da. At 50 µM cholestenone, the ligand-free monomer has a Mw = 47004 ± 50 Da and the ligand-bound monomer a Mw = 47438 ± 50 Da. At 10 µM cholestenone, the ligand-free monomer has a Mw = 47060 ± 37 Da and the ligand-bound monomer a Mw = 47476 ± 8 Da. In the CYP142A1 sample containing ethanol (2.5%), the CYP142A1 monomer has a Mw = 47058 ± 16 Da.

232
3.2.14.5 Interaction of CYP142A1 with Solvents.
Figure 3.38: NanoESI mass spectrum of 10 μM CYP142A1 with solvents. 10 μM CYP142A1 was mixed with 200 mM ammonium acetate (pH 7.0), and with buffer plus 1% ethanol and 2.5% DMSO. Assigned peaks for DMSO: monomer (A) m/z 4200 to 5400; dimer (B) m/z 6200 to 7400; for ethanol: monomer (A) m/z 3400 to 4400; dimer (B) m/z 4400 to 5400; and for buffer alone: monomer (A) m/z 3400 to 4400; dimer (B) m/z 4800 to 5800. The presence of dimer was observed for all solvents but was minimal with DMSO as compared with buffer and ethanol. In order to evaluate the effects of selected solvents (DMSO and ethanol, used to
solubilise various ligands during the course of experiments done in this thesis),
nanoESI experiments were carried out to investigate whether interactions with the
solvents alone influenced the propensity of CYP142A1 to undergo changes in
aggregation state. It was found that CYP142A1 dimers formed in the presence of
both DMSO (2.5% v/v) and ethanol (1% v/v), but that the largest proportion of
233
dimer was seen in ethanol, while lower (and quite similar) amounts of dimer were
present in the CYP142A1 samples containing buffer alone (200 mM ammonium
acetate, pH 7), or buffer containing DMSO. Thus, addition of ethanol appears to
have an effect in promoting (to a small extent) the formation of CYP142A1 dimers.
3.3 Summary
CYP142A1, a cholesterol 27-oxidase enzyme that likely plays a compensatory role
with CYP125A1 in host cholesterol/cholestenone oxidation, was expressed using an
E. coli expression system and purified to homogeneity via three chromatographic
steps. Results obtained from the expression and purification trials showed that
CYP142A1 was expressed best in 2YT medium after 24 hours of culture in C41 (DE3)
transformant cells. Purification of CYP142A1 was quite efficient, as most of the
contaminants were eliminated in the initial purification step (using a Ni-NTA
column), while remaining protein contaminants were successfully removed on
passing the material collected from the affinity purification stage through first a
hydroxyapatite column, and then by using size exclusion (gel filtration)
chromatography. The effectiveness of the purification regime was confirmed based
on the analyses of eluates from these columns using SDS-PAGE and UV-visible
spectrophotometric analyses, with CYP142A1 appearing as single bands on SDS-
PAGE gels, and with an A418/A280 (heme/protein or Rz) ratio ≥ 1.9.
The extinction coefficient for the low-spin ferric heme in the resting state of
CYP142A1 was determined using the pyridine hemochromogen method (Berry and

234
Trumpower, 1987). This experiment resulted in the determination of an absorbance
coefficient of ε418 = 92 mM−1 cm−1 at the Soret peak for the oxidised enzyme.
Carbon monoxide binding to CYP142A1 revealed features typical of a heme-
containing P450 protein. A CYP142A1 CO-adduct was formed with a Soret
maximum at ~450 nm, as expected for a P450 Fe(II)-CO complex with retention of
cysteine thiolate proximal ligation to the heme iron (Omura and Sato, 1964). The
CYP142A1 ferrous-CO complex was stable for several minutes in both the absence
and the presence of the substrate cholestenone, and did not convert to a P420
complex (which absorbs at ~420 nm and arises from protonation of the cysteine
thiolate to a thiol form). Thus, CYP142A1 forms a stable ferrous-CO adduct that
does not require substrate for the retention of its native (thiolate-ligated) state.
The Mtb genome sequence revealed a large number (20) of cytochrome P450
enzymes (Cole et al., 1998), some of which participate in cholesterol metabolism
(Ouellet et al., 2011). CYP125A1, CYP142A1 and CYP124A1 can all initiate oxidative
degradation of the cholesterol side chain, a critical first step in its breakdown that
ultimately enables energy generation via the β-oxidation pathway (Ouellet et al.,
2011). Optical titrations with cholestenone, cholesterol and lanosterol show that
CYP142A1 binds tightly to each of the first two sterols (and more weakly to
lanosterol) consistent with a physiological role for CYP142A1 in
cholesterol/cholestenone metabolism. CYP142A1 also binds tightly to a range of
azole antifungal drugs, and some of these azoles have been shown to clear Mtb
infection in mice, with econazole being the most effective among drugs tested
(Ahmad et al., 2006c). Many of these azoles were also shown to bind tightly to

235
other Mtb P450 enzymes, and to be effective in preventing the growth of Mtb and
other mycobacterial cells in vitro (McLean et al., 2002b, McLean et al., 2008). The
order of potency of the azole drugs against Mtb H37Rv (econazole and miconazole
at 8 g ml-1, clotrimazole at 11 g ml-1 and ketoconazole at 16 g ml-1) (section
1.5.9) correlates quite well with their Kd values for binding to the Mtb CYP142A1
enzyme (2.28 M, 1.42 M, 1.14 M and 11.95 M, respectively) (Table 3.2),
conforming that the CYP142A1 has high affinity for the most effective anti-Mtb
azoles, and lower affinity for the one (ketoconazole) with the weakest MIC. It also
has a weak Kd value for fluconazole (Kd = 309 M); a drug known to be ineffective
against Mtb. These data are consistent with CYP142A1 being an important azole
drug target in Mtb, presumably through the crucial role that it plays in host
cholesterol/cholestenone metabolism.
Preliminary fragment based screening with CYP142A1 conducted at the University
of Cambridge generated 6 hits from a fragment chemical library (named NMR089,
099, 170, 491, 540 and 623), and the interactions of these molecules with the P450
were studied further using biochemical and biophysical techniques. Validation of
CYP142A1 ligand binding to these compounds was done using UV-visible
spectroscopy, electron paramagnetic resonance (EPR) spectroscopy, isothermal
titration calorimetry (ITC) and crystallography (further results are given in chapter
4). UV-visible spectroscopy revealed a substrate-like type I optical shift for fragment
NMR099, and inhibitor-like type II shifts for the five others – indicating direct
interaction with heme iron. Dissociation constants (Kd values) for the fragments
236
ranged from NMR491 (0.68 µM) to NMR099 (7.2 mM). ITC confirmed compound
binding in the same rank order as seen from the optical binding studies.
EPR was done to probe CYP142A1 heme coordination and
substrate/inhibitor/fragment binding. X-band EPR data at 10 K for ligand-free and
fragment-bound forms of CYP142A1 revealed characteristic rhombic signals for
ferric P450s. Heterogeneous low-spin heme iron signals were obtained on binding
azole inhibitors/fragments, arising from either direct ligation of a heterocyclic
nitrogen in the fragment/ligand to the heme iron, or through their making indirect
interactions with heme iron via a (6th) water ligand that remains on the iron
following ligand addition. A mixture of low-spin and high-spin features was
obtained for cholestenone binding, indicating a displacement of the water ligand in
the sixth axial position. EPR provides important confirmatory information for
binding of these molecules to CYP142A1. Data from differential scanning
calorimetry (DSC) also revealed that the binding of cholestenone increased the
CYP142A1 Tm value by approximately 5 oC, while clotrimazole increased the Tm
value by approximately 3 oC. This is indicative of the stabilization of the P450 when
complexed with these ligands.
Redox potentiometry studies were done for CYP142A1 in cholestenone-bound,
clotrimazole-bound and ligand-free forms. Many P450s have low-spin ferric heme
iron in their resting state, but convert to high-spin ferric heme iron on binding
substrates, with loss of the 6th (water) ligand to the heme iron causing heme iron
(3d orbital) electronic reorganization (Ouellet et al., 2010b). This causes a large shift

237
in heme potential, enabling electron transfer to heme iron from NAD(P)H-
dependent redox partners (Daff et al., 1997) .
This is an important regulatory process, allowing heme iron reduction to occur
efficiently only when substrate is bound, avoiding production of damaging oxygen
radicals. For substrate-free CYP142A1, reduction of heme iron induces a change in
the absorbance maximum of the ferric heme Soret band from 418 nm to ~405 nm
(with a midpoint potential of -394 ± 4 mV vs NHE). For the cholestenone substrate-
bound form, the Soret shift on heme reduction is from 393 nm to ~405 nm (with a
midpoint potential of -150 ± 4 mV vs NHE). For the clotrimazole-bound CYP142A1,
the Soret band shifted from 424 nm to ~428 nm with a midpoint potential of -360 ±
4 mV. In these experiments, anaerobic reductive titration of CYP142A1 forms was
undertaken, and heme absorbance changes at wavelengths reflecting large changes
between the oxidised and reduced forms of CYP142A1 were plotted versus applied
potential, and data were fitted using the Nernst function in order to determine
midpoint potentials for the CYP142A1 heme Fe3+/Fe2+ couples in the substrate-free
and cholestenone-bound forms of CYP142A1 as -394 mV and -150 mV (vs NHE),
respectively. The large potential change (~244 mV) between the low-spin (SF) and
high-spin (SB) forms reflects at least in part a major change in heme iron spin-state
on cholestenone binding and is indicative of a tightly regulated redox system. The
particularly large change in potential may also indicate a further level of regulation
– e.g. through structural changes in the heme environment that occur on substrate
binding. Re-oxidation of the reduced P450 samples demonstrated reversibility and
also that CYP142A1 retains its cysteine thiolate ligand to the heme iron on return to
238
the ferric state. Light scattering (MALLS) data revealed CYP142A1 to have a
substantial component of dimeric P450 in the absence of the reducing agent DTT.
On addition of DTT, the P450 became almost completely monomeric. This
treatment enabled CYP142A1 to be crystallized in the ligand-free and ligand-bound
forms (see results in chapter 5). The oligomerization of CYP142A1 was further
investigated with nanoESI mass spectrometry. With this technique, the proportion
of CYP142A1 dimer was found to increase as the concentration of CYP142A1 was
elevated from 10 µM to 20 µM. Under these conditions, treatment with different
DTT concentrations diminished the proportion of dimer present, but did not cause a
complete conversion to the monomeric state. In contrast, the CYP142A1 complex
with econazole showed complete conversion to a monomeric state. This was not
the case for cholestenone, and a proportion of the dimeric form was retained in the
presence of the substrate. It appears likely that the binding of econazole favours
dissociation of the CYP142A1 dimer.
Protein stability studies were also done on substrate-free and cholestenone-bound
CYP142A1 using guanidinium chloride (GdmCl) as a denaturant. Protein
denaturation by GdmCl was monitored using tryptophan fluorescence.
Fluorescence (with excitation at ~280 nm) provides emission spectra that report on
the protein tertiary structure, with structural perturbations evident from changes in
the fluorescence intensity from aromatic amino acids (mainly tryptophans) in the
P450, and from changes in the emission maximum in the range from ~340 nm
upwards. CYP142A1 was progressively denatured with increasing [GdmCl].
Cholestenone binding had little effect in stabilizing CYP142A1 to denaturation by
239
GdmCl, perhaps indicating that dissociation of the substrate occurs at a low
concentration of GdmCl. However, the stabilising effects of the substrate are
evident from DSC studies, where an ~5 oC increase in Tm with cholestenone was
observed.
Collectively, results in this chapter provide a substantial body of work describing
fundamental biochemical, spectroscopic and thermodynamic properties of Mtb
CYP142A1. In results presented in Chapter 4, the catalytic and biophysical
properties of CYP124A1, the third member of the cholesterol oxidase family, will be
discussed.
240
Chapter 4
Biochemical and Biophysical characterization of CYP124A1: A
promiscuous enzyme with broad substrate specificity in
Mycobacterium tuberculosis
4.1 Introduction
Similarly to CYP142A1, CYP124A1 can also oxidize the aliphatic side chain of
cholesterol/cholestenone to the carboxylic acid state by sequential metabolism to
the alcohol, then to the aldehyde, and ultimately to the acid (Johnston et al., 2010).
However, in addition to this function, CYP124A1 has also been shown to possess
broad substrate specificity, including activity towards branched chain lipids
(Johnston et al., 2009). To date there is no evidence for the essentiality of the
CYP124A1 gene in Mtb, and a Mtb H37Rv CYP124A1 transposon mutant can grow in
vitro. However, given the relevance of this P450 to sterol and other lipid oxidation
reactions in Mtb, it is suspected that that CYP124A1 may be important for growth
of the bacterium in the host macrophage.
Mycobacterium tuberculosis, the human pathogen that causes tuberculosis,
generates sulfated metabolites associated with virulence. However, these
metabolites have remained poorly characterized for several years (Mougous et al.,
2006). One of these metabolites is a methyl-branched lipid known as S881 which
was shown to be associated with the cell wall of Mtb and also involved in the
negative modulation of virulence in Mtb infected mouse models (Johnston et al.,
2009, Holsclaw et al., 2008). Studies have also highlighted that such sulfated

241
metabolites function as signalling molecules between pathogenic bacteria and their
hosts (Holsclaw et al., 2008).
CYP124A1 (Rv2266) is located in the same gene region as CYP128A1 and CYP121A1.
One of the genes in this cluster (Sft3, Rv2267c) encodes a sulfotransferase enzyme
(Johnston et al., 2009, McLean et al., 2010). This sulfotransferase was shown to
catalyze the 3’-phosphoadenosine-5’-phosphosulfate (PAPS)-dependent sulfation of
menaquinone MK-9 DH-2 (a compound with repeated methyl branching) at the -
position (Holsclaw et al., 2008, Mougous et al., 2006). Sulfotransferases are also
known to mediate the transfer of a sulfuryl group from PAPS to a carbohydrate, or
to a tyrosine residue within a protein (Mougous et al., 2002). CYP128A1 (the
product of Rv2268c) is thought to hydroxylate the -position of menaquinone MK-9
DH-2 before its Sft3-dependent sulfation to the S881product, which is involved in
virulence in Mtb (Holsclaw et al., 2008, Mougous et al., 2006, Johnston et al., 2009).
Menaquinone MK-9 DH-2 is the major quinol electron carrier of Mtb and thus its
sulfation may be a process by which its respiratory function is regulated (Holsclaw
et al., 2008).
It is postulated that the utilization of host cholesterol by CYP125A1 (and CYP142A1)
enables Mtb persistence and survival in the cholesterol-rich macrophage (Ouellet et
al., 2010a, Johnston et al., 2010, Pandey and Sassetti, 2008). Hence a drug that can
inhibit the cholesterol catabolic pathway could be an important candidate for
eliminating non-replicating, latent Mtb. CYP124A1, in addition to being a methyl-
branched lipid -hydroxylase, was also shown by Johnston et al. to oxidize
242
cholesterol at the C27 position (Johnston et al., 2009, Johnston et al., 2010). Studies
have shown that CYP124A1 and CYP142A1 possess the same sterol 27-oxidase
activity and can complement the growth defect of a ∆CYP125 Mtb strain on
cholesterol. Thus, these duo may present additional promising secondary drug
targets against latent Mtb (Johnston et al., 2010). CYP124 genes are conserved
across a wide spectrum of organisms ranging from pathogenic to non-pathogenic
mycobacterial species, actinobacteria and some proteobacteria, suggesting multiple
and important physiological and catalytic roles for this enzyme (Ouellet et al., 2008,
Johnston et al., 2009).
In this chapter, results from the biochemical and biophysical characterization of
CYP124A1 are presented, with the aim of providing further insights into the
substrate specificity of this enzyme and defining which substrates have greatest
affinity for the P450. Binding assays for CYP124A1 were carried out using a wide
range of substrates include cholesterol, cholestenone, fatty acids and other long-
alkyl-chain lipids. These studies were done to validate its substrate selectivity and
to characterize its hydroxylase and oxidase activities with diverse substrates.
Studies were also done to analyse the interactions of CYP124A1 with selected azole
inhibitors and other compounds emanating from fragment based screening studies;
the latter providing the basis for a future fragment merging/linking programme by
which CYP124A1-specific inhibitors could be generated. Results from these
experiments are aimed at providing further insights into the druggability of this
enzyme and its potential as a novel drug target for existing azole drugs and for
novel types of inhibitors. Further aims of the research in this chapter include the

243
spectroscopic analysis of CYP124A1 to provide further understanding of the modes
of binding of substrates and inhibitors with the P450, and the determination of the
influence of substrate binding on the heme iron potential in CYP124A1 to establish
how effective substrate binding is in elevating the heme iron potential to enable
reduction of CYP124A1 and progression of the catalytic cycle.
4.2 Results and Discussion
4.2.1 Expression and Purification of CYP124A1
The CYP124A1 (Rv2266) gene was codon-optimised and synthesised by Genscript
(Piscataway, USA), and cloned into the expression vector pET47b using BamHI and
HindIII restriction sites. The pET47b vector contains an N-terminal His6-tag, which
allows recombinant proteins to be purified by nickel affinity column
chromatography. Gene expression is under the control of a T7lac promoter. The
pET47b vector carries the gene for kanamycin resistance, which allows for antibiotic
selection of cells carrying the plasmid.
Expression trials for the CYP124A1/pET47b construct was done using various
different conditions, as detailed in the Materials and Methods (section 2.2.3) and
these included different E. coli strains, growth media, IPTG induction conditions,
inclusion or absence of ∆ALA post-induction of CYP124A1 expression, and various
growth temperature conditions. These conditions were optimized and the best
condition for CYP124A1 expression was chosen. Hence, CYP124A1 was best
expressed using E. coli C41 (DE3) cells grown in 2YT medium supplemented with
kanamcyin (30 μg/ml). The other E. coli strains that were tested were the DE3
244
lysogens BL21 (DE3), Rosetta 2 (DE3), C41 (DE3) and HMS174 (DE3). The DE3
lysogen strains encode the T7 RNA polymerase gene needed for recombinant
protein expression from the T7 promoter on the plasmid. This gene is under the
control of the lacUV5 promoter, and expression is induced by the addition of IPTG.
The construct CYP124A1/pET47b was transformed into these three E. coli DE3
strains and CYP124A1 expression trials were conducted. Addition of IPTG
(isopropyl-β,D-thiogalactopyranoside) regulates the lacUV5 promoter which
controls expression of the T7 polymerase gene, specifically by binding to the
inhibitory Lac repressor protein and displacing it from its DNA target, enabling the
RNA polymerase to bind. IPTG enables the expression of the recombinant protein
by acting as a stable analogue of lactose to bind and displace the Lac repressor from
its operator binding site (Studier and Moffatt, 1986, Wang et al., 1989).
Following growth of CYP124A1-producing transformant cells, the cells were
collected and disrupted, and the P450 was purified to homogeneity via three
chromatographic steps using the same protocol as for the CYP142A1 purification, as
detailed in the Materials and Methods (section 2.2.6). The first step was affinity
chromatography using a Ni-NTA (nickel) column, followed by a further affinity step
using a hydroxyapatite (HA) column, and then a final polishing step using size
exclusion chromatography.
245
A) Nickel Column Purification
A DNA sequence specifying a string of six to nine histidine residues is frequently
used in plasmid expression vectors to enable purification of recombinant proteins.
This results in the expression of recombinant proteins with a 6xHis or other poly-
His tag fused to the protein’s N- or C-terminus (Smith et al., 1988). Immobilized
Metal-Affinity Chromatography (IMAC) (e.g. nickel column chromatography) is an
effective separation technique that is utilized in the purification of proteins both
with natural surface-exposed histidine residues and for recombinant proteins with
engineered histidine tags or other histidine clusters (Gaberc-Porekar and Menart,
2001).
This purification technique uses covalently bound chelating compounds or metal
ions immobilized on solid chromatographic media to serve as affinity ligands for
target proteins, making use of coordinative binding to relevant amino acid residues
exposed on the protein surface (Gaberc-Porekar and Menart, 2001). Recombinant
proteins with engineered histidine-tags can usually be purified easily because the
string of histidine residues binds to several types of immobilized metal ions,
including nickel, cobalt and copper, under specific buffer conditions. Subsequently,
the fraction or protein of interest is eluted by e.g. varying the pH of the washing
buffer, or by addition of high concentrations of imidazole (Block et al., 2009).
CYP124A1 purification with nickel column chromatography was successful, with
most of the contaminant proteins being removed with the flow-through. Purified

246
CYP124A1 samples were eluted with 40 mM imidazole as described above, and
were pooled together and subjected to the next purification step using
hydroxyapatite column chromatography.
Figure 4.1: Nickel affinity chromatography purification of CYP124A1. The image shows a 12% (w/v) SDS-PAGE gel showing (from left to right): Protein marker (PM) - NEB protein ladder with bands labelled in kDa (10-250 kDa), Flow-through from the column (FT), and Buffer wash (BF). Lanes 4-9 show CYP124A1 eluted from the column with increasing concentrations of imidazole in the wash buffer.
B) Hydroxyapatite (HA) Column Purification
Hydroxyapatite chromatography is also referred to as a “pseudo-affinity
chromatography’’ or "mixed-mode" ion exchange, since the strength and selectivity
of the interaction depends on the structural features of both the chromatographic
material and the retained substance (Hilbrig and Freitag, 2012). Hydroxyapatite
(HA), a calcium and phosphate based inorganic material, has the stoichiometric
formula of Ca10(PO4)6(OH)2 (Hilbrig and Freitag, 2012).
247
The mechanism of HA chromatography is complex, because it involves non-specific
interactions between positively charged calcium ions and negatively charged
phosphate ions (on the stationary phase HA resin) with negatively charged carboxyl
groups and positively charged amino groups in the protein. A buffer with increasing
phosphate concentration is typically used for elution of the protein of interest.
Hence, while acidic proteins bind through C (calcium)-sites, basic proteins bind
through P (phosphate)-sites on the hydroxyapatite (Cummings et al., 2009). With
HA chromatography, most weakly bound proteins are purified with low ionic
strength buffers with low phosphate concentrations as low as 1 mM. More strongly
adsorbed or HA-bound proteins are often eluted with higher concentrations of
phosphate, or even using NaCl or KCl salts (Cummings et al., 2009).
CYP124A1 was purified using HA column chromatography immediately after the
nickel column chromatography, and this resulted in the elimination of most of the
contaminating proteins left after the nickel affinity step. Samples isolated from
nickel chromatography were exchanged into 15 mM KPi, pH 7.0 (Buffer A) and
loaded onto a HA column pre-equilibrated in the same buffer. Protein was eluted
using a gradient of 15 mM to 500 mM KPi (pH 7.0) buffer. Purer fractions of eluates
from the HA column (as evidenced from SDS PAGE analysis) were then pooled
together and subjected to a final polishing step using size exclusion
chromatography.

248
Figure 4.2: Hydroxyapatite (HA) column chromatography purification of CYP124A1. A 12% (w/v) SDS-PAGE gel is shown, with lanes (from left to right) containing: Protein marker (lane 1; NEB protein ladder bands labelled in kDa (10-250 kDa)), Lanes 2-5 show CYP124A1 eluted from the column with increasing potassium phosphate buffer strength. CYP124A1 bands shown are close to the predicted molecular weight of ∼50.52 kDa (for CYP124A1 plus the His-tag) when compared to the molecular weight markers. Other proteins eluted along with CYP124A1 are seen as faint contaminant bands on SDS-PAGE.
C) Size exclusion or Gel filtration column chromatography
Size exclusion or gel filtration chromatography is a technique used for the
separation of molecules, e.g. proteins and peptides, based on their size (Duong-Ly
and Gabelli, 2014). Furthermore, gel filtration chromatography can also be used to
resolve oligomeric forms of proteins and to exchange the buffer of a sample for a
different one, often referred to as a desalting column in the latter case (Duong-Ly
and Gabelli, 2014).

249
The matrix of the gel filtration column consists of porous beads, and the size of the
bead pores defines the size of macromolecules that may be separated (Bollag,
1994). Molecules that that are too large to enter the bead pores are “excluded,”
and thus separate out from the column first, while small molecules, which can enter
the sieves in the matrix of the stationary phase, elute much later. This is because
large molecules that do not enter the bead pores have a smaller volume to pass
through, and they are the first molecules to elute from the column (Bollag, 1994,
Duong-Ly and Gabelli, 2014).
Immediately after the HA column purification, CYP124A1 was subjected to a final
polishing step using gel filtration chromatography. In this case, highly pure protein
was resolved, as shown on the SDS-PAGE gel depicted below (Figure 4.3).

250
Figure 4.3: Purification of Mtb CYP124A1 using a SuperdexTM S-200 gel filtration column. SDS-PAGE analysis shows molecular weight markers (lane 1, NEB protein ladder with bands labelled in kDa (10-250 kDa) and pure CYP124A1 as a single band in lanes 2-3) and close to the predicted molecular weight of ∼50.52 kDa (CYP124A1 plus His-Tag) when compared to the molecular weight marker.
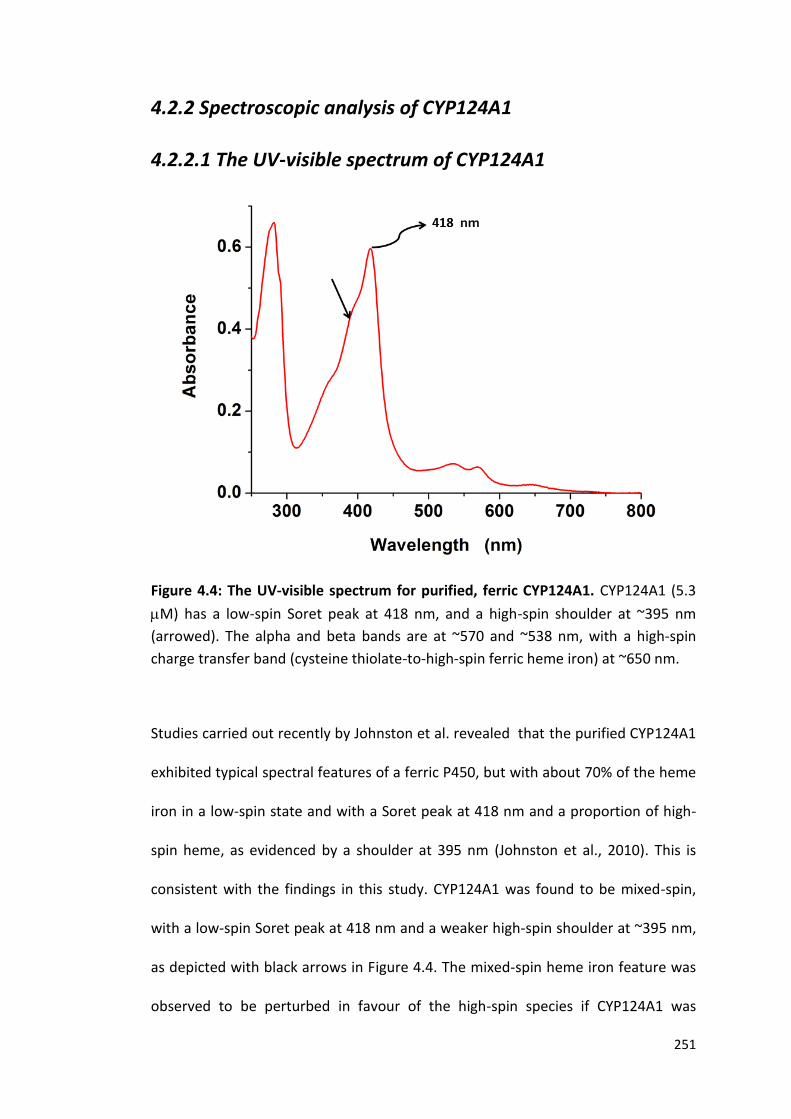
251
4.2.2 Spectroscopic analysis of CYP124A1
4.2.2.1 The UV-visible spectrum of CYP124A1
Figure 4.4: The UV-visible spectrum for purified, ferric CYP124A1. CYP124A1 (5.3
M) has a low-spin Soret peak at 418 nm, and a high-spin shoulder at ~395 nm
(arrowed). The alpha and beta bands are at ~570 and ~538 nm, with a high-spin
charge transfer band (cysteine thiolate-to-high-spin ferric heme iron) at ~650 nm.
Studies carried out recently by Johnston et al. revealed that the purified CYP124A1
exhibited typical spectral features of a ferric P450, but with about 70% of the heme
iron in a low-spin state and with a Soret peak at 418 nm and a proportion of high-
spin heme, as evidenced by a shoulder at 395 nm (Johnston et al., 2010). This is
consistent with the findings in this study. CYP124A1 was found to be mixed-spin,
with a low-spin Soret peak at 418 nm and a weaker high-spin shoulder at ~395 nm,
as depicted with black arrows in Figure 4.4. The mixed-spin heme iron feature was
observed to be perturbed in favour of the high-spin species if CYP124A1 was
252
continuously frozen and thawed. It is speculated that this phenomenon may be due
to structural perturbations induced and their effects on the high-spin/low-spin
equilibrium that is likely mediated by the displacement and replacement of the 6th
water ligand to the ferric heme iron. In recent studies, Mtb CYP125A1 was reported
to be extensively high-spin in its native, resting state (McLean et al., 2009). Based
on evolutionary relationships, there is a quite close similarity between CYP124A1
and CYP125A1 (40.7% identity over 428 residues) (Driscoll et al., 2010) and
structural similarities in the heme environment could account for the similarity in
their spin-state equilibrium. However, this is in contrast to the spectral features
displayed by CYP142A1, in which the ferric heme is extensively low-spin (Johnston
et al., 2010).
4.2.2.2 CYP124A1 optical titrations with substrates
On the basis of the genetic location of CYP124A1 in an operon containing a
sulfotransferase (Stf3) involved in the sulfation of the respiratory menaquinone MK-
9, it was speculated that CYP124A1 could be involved in the metabolism of
substrates with a similar structure (Johnston et al., 2009). Johnston et al. also
demonstrated that CYP124A1 is among the three key P450 enzymes involved in
sequential oxidation reactions of cholesterol side chain at the C27 position
(Johnston et al., 2010).
In this study, CYP124A1 was tested for binding with cholesterol, cholestenone and a
series of methyl-branched lipids. The results show that CYP124A1 binds tightly to
each of these substrates, giving further insights into the likely functionality of
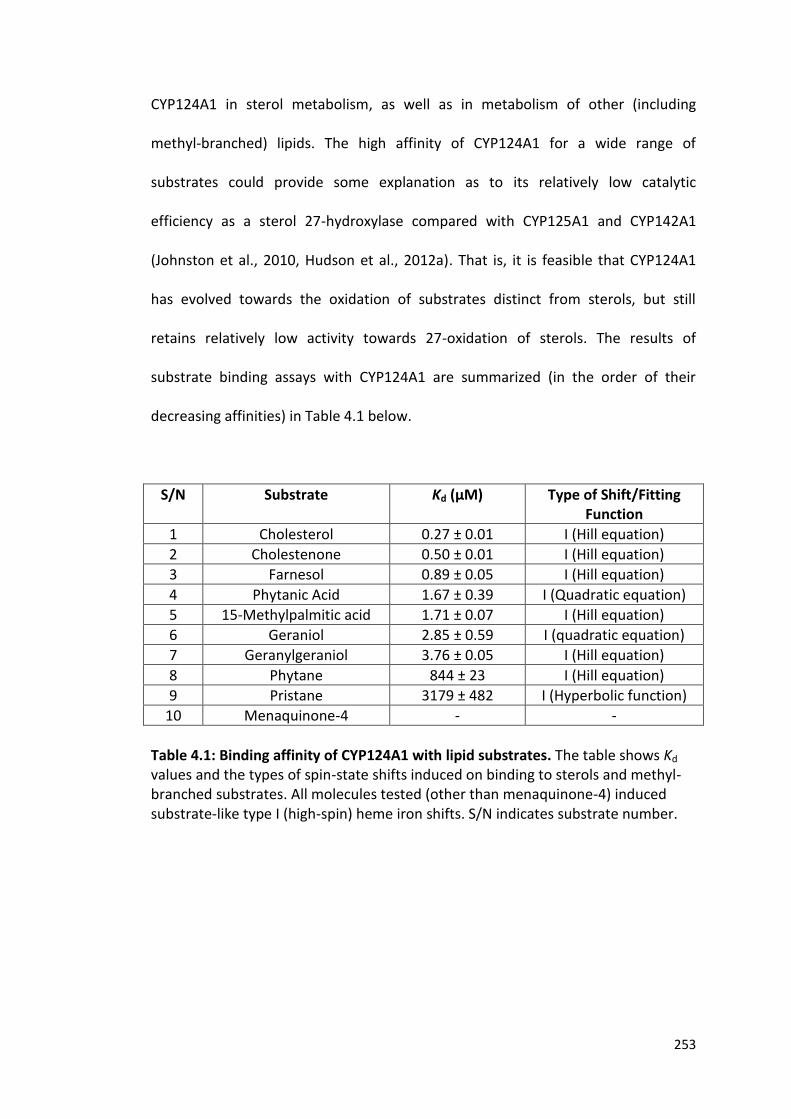
253
CYP124A1 in sterol metabolism, as well as in metabolism of other (including
methyl-branched) lipids. The high affinity of CYP124A1 for a wide range of
substrates could provide some explanation as to its relatively low catalytic
efficiency as a sterol 27-hydroxylase compared with CYP125A1 and CYP142A1
(Johnston et al., 2010, Hudson et al., 2012a). That is, it is feasible that CYP124A1
has evolved towards the oxidation of substrates distinct from sterols, but still
retains relatively low activity towards 27-oxidation of sterols. The results of
substrate binding assays with CYP124A1 are summarized (in the order of their
decreasing affinities) in Table 4.1 below.
S/N Substrate Kd (μM) Type of Shift/Fitting Function
1 Cholesterol 0.27 ± 0.01 I (Hill equation)
2 Cholestenone 0.50 ± 0.01 I (Hill equation)
3 Farnesol 0.89 ± 0.05 I (Hill equation)
4 Phytanic Acid 1.67 ± 0.39 I (Quadratic equation)
5 15-Methylpalmitic acid 1.71 ± 0.07 I (Hill equation)
6 Geraniol 2.85 ± 0.59 I (quadratic equation)
7 Geranylgeraniol 3.76 ± 0.05 I (Hill equation)
8 Phytane 844 ± 23 I (Hill equation)
9 Pristane 3179 ± 482 I (Hyperbolic function)
10 Menaquinone-4 - -
Table 4.1: Binding affinity of CYP124A1 with lipid substrates. The table shows Kd values and the types of spin-state shifts induced on binding to sterols and methyl-branched substrates. All molecules tested (other than menaquinone-4) induced substrate-like type I (high-spin) heme iron shifts. S/N indicates substrate number.

254
Figure 4.5: Optical titration of CYP124A1 with cholest-4-en-3-one. Panel A shows
absolute spectra recorded during titration of CYP142A1 (3.4 μM) with cholest-4-en-
3-one. The Soret peak shifts from 418 to 393 nm as the high-spin ferric heme iron
form accumulates. The inset shows overlaid difference spectra from the optical
titration. Panel B shows the cholest-4-en-3-one-induced absorption change plotted
versus cholest-4-en-3-one concentration, with data fitted using the Hill equation to
give a Kd value of 0.50 ± 0.01 μM, n = 1.51 ± 0.02.
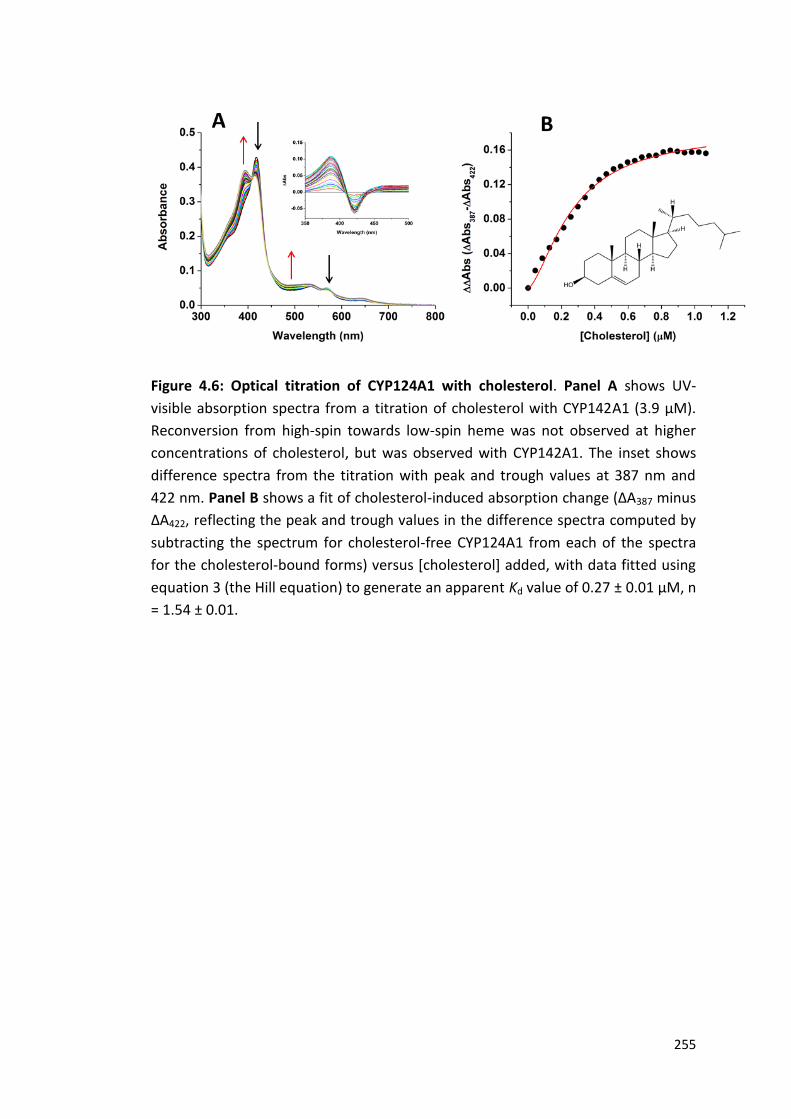
255
Figure 4.6: Optical titration of CYP124A1 with cholesterol. Panel A shows UV-
visible absorption spectra from a titration of cholesterol with CYP142A1 (3.9 μM).
Reconversion from high-spin towards low-spin heme was not observed at higher
concentrations of cholesterol, but was observed with CYP142A1. The inset shows
difference spectra from the titration with peak and trough values at 387 nm and
422 nm. Panel B shows a fit of cholesterol-induced absorption change (ΔA387 minus
ΔA422, reflecting the peak and trough values in the difference spectra computed by
subtracting the spectrum for cholesterol-free CYP124A1 from each of the spectra
for the cholesterol-bound forms) versus [cholesterol] added, with data fitted using
equation 3 (the Hill equation) to generate an apparent Kd value of 0.27 ± 0.01 μM, n
= 1.54 ± 0.01.
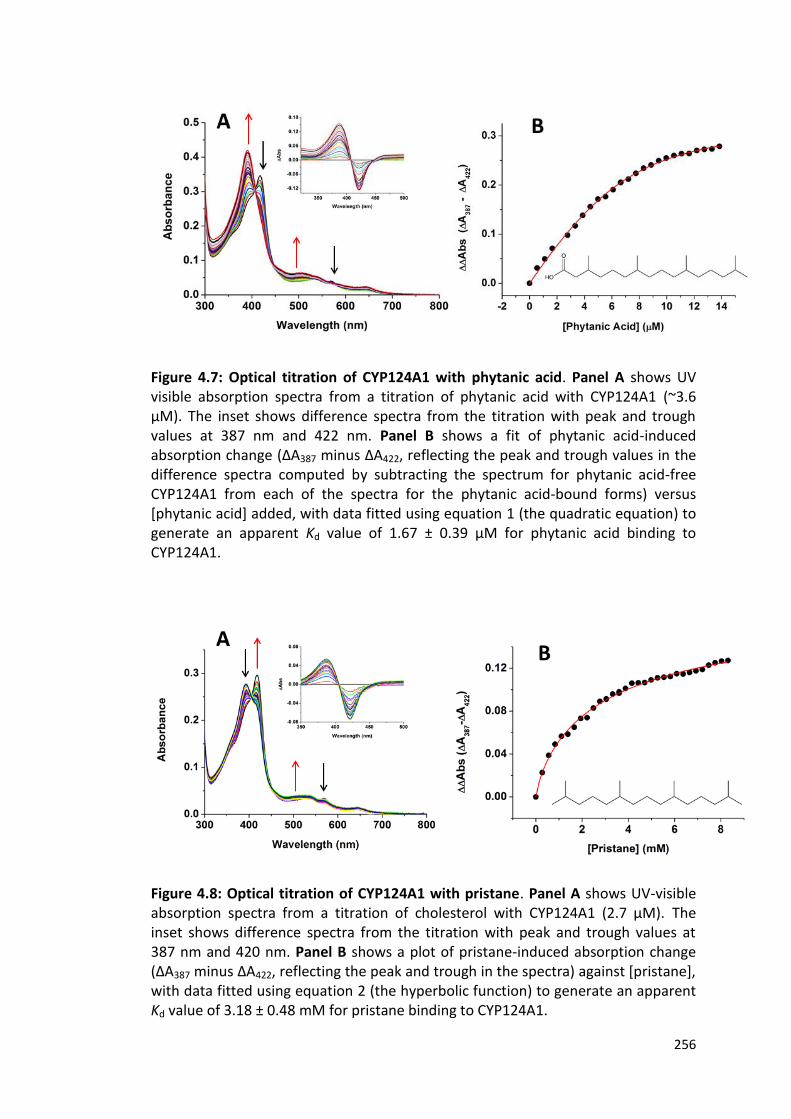
256
Figure 4.7: Optical titration of CYP124A1 with phytanic acid. Panel A shows UV visible absorption spectra from a titration of phytanic acid with CYP124A1 (~3.6 μM). The inset shows difference spectra from the titration with peak and trough values at 387 nm and 422 nm. Panel B shows a fit of phytanic acid-induced absorption change (ΔA387 minus ΔA422, reflecting the peak and trough values in the difference spectra computed by subtracting the spectrum for phytanic acid-free CYP124A1 from each of the spectra for the phytanic acid-bound forms) versus [phytanic acid] added, with data fitted using equation 1 (the quadratic equation) to generate an apparent Kd value of 1.67 ± 0.39 µM for phytanic acid binding to CYP124A1.
Figure 4.8: Optical titration of CYP124A1 with pristane. Panel A shows UV-visible absorption spectra from a titration of cholesterol with CYP124A1 (2.7 μM). The inset shows difference spectra from the titration with peak and trough values at 387 nm and 420 nm. Panel B shows a plot of pristane-induced absorption change (ΔA387 minus ΔA422, reflecting the peak and trough in the spectra) against [pristane], with data fitted using equation 2 (the hyperbolic function) to generate an apparent Kd value of 3.18 ± 0.48 mM for pristane binding to CYP124A1.
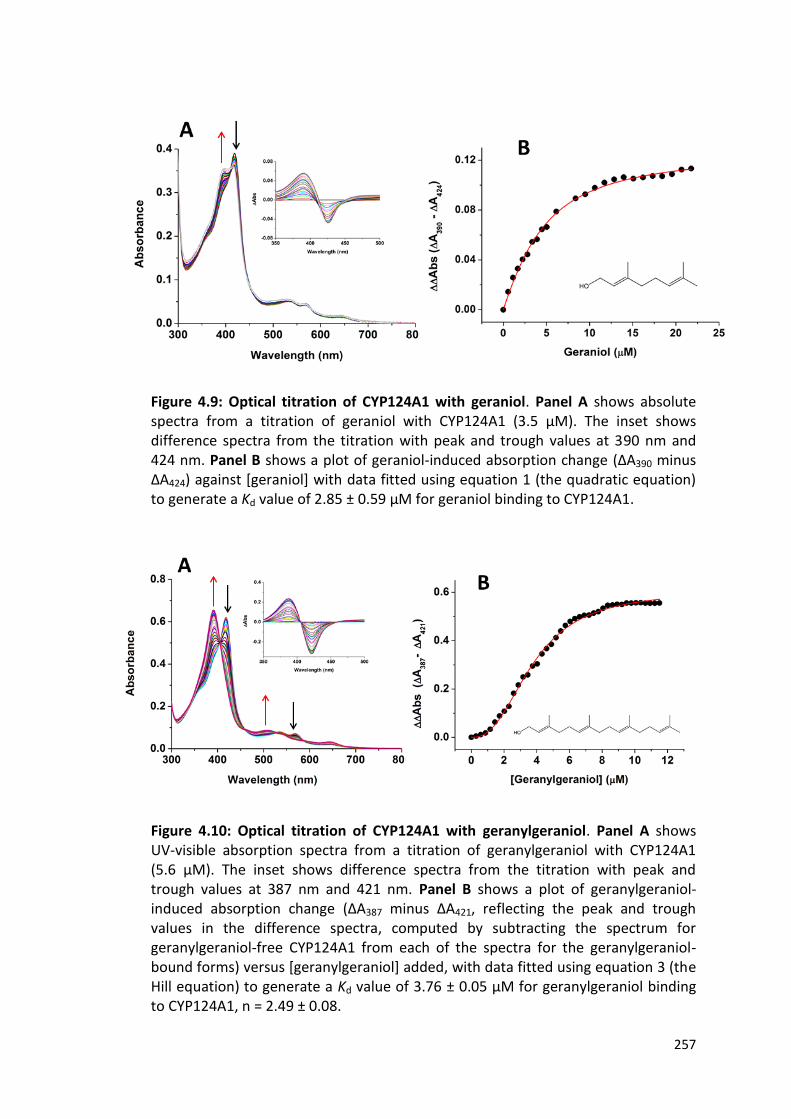
257
Figure 4.9: Optical titration of CYP124A1 with geraniol. Panel A shows absolute spectra from a titration of geraniol with CYP124A1 (3.5 μM). The inset shows difference spectra from the titration with peak and trough values at 390 nm and 424 nm. Panel B shows a plot of geraniol-induced absorption change (ΔA390 minus ΔA424) against [geraniol] with data fitted using equation 1 (the quadratic equation) to generate a Kd value of 2.85 ± 0.59 µM for geraniol binding to CYP124A1.
Figure 4.10: Optical titration of CYP124A1 with geranylgeraniol. Panel A shows UV-visible absorption spectra from a titration of geranylgeraniol with CYP124A1 (5.6 μM). The inset shows difference spectra from the titration with peak and trough values at 387 nm and 421 nm. Panel B shows a plot of geranylgeraniol-induced absorption change (ΔA387 minus ΔA421, reflecting the peak and trough values in the difference spectra, computed by subtracting the spectrum for geranylgeraniol-free CYP124A1 from each of the spectra for the geranylgeraniol-bound forms) versus [geranylgeraniol] added, with data fitted using equation 3 (the Hill equation) to generate a Kd value of 3.76 ± 0.05 µM for geranylgeraniol binding to CYP124A1, n = 2.49 ± 0.08.

258
Substrate binding to cytochrome P450 enzymes typically generates an absorbance
shift of the Soret peak from a higher wavelength to a lower wavelength (i.e. a shift
from ferric low-spin to high-spin). This is also referred to as a ‘blue-shift’ and is
associated with the displacement of the 6th ligand water molecule coordinated to
the heme iron (Denisov et al., 2005).
The binding of cholestenone to CYP124A1 resulted in a near-full conversion of the
heme iron to high-spin. However, the addition of cholesterol to CYP124A1 gave a
less extensive conversion to high-spin, although no reconversion or reversal of the
spectral shift towards low-spin was observed. The difference in extent of shift might
be associated with small differences in solubility of these compounds in aqueous
buffer. Both compounds are only sparingly soluble in water. Binding of cholesterol
to CYP142A1 and CYP125A1 was shown to give a partial conversion towards high-
spin (Ouellet et al., 2010a, Driscoll et al., 2010, McLean et al., 2009, Capyk et al.,
2009). An earlier study by Johnston et al. documented a partial reversal of the high-
spin spectral shift on binding CYP124A1 with cholesterol, and hence the affinity of
CYP124A1 for cholesterol could not be determined accurately (Johnston et al.,
2010). However, in this study, no reconversion back towards low-spin was observed
in the cholesterol titration with CYP124A1, and hence it was possible to determine
the affinity of CYP124A1 for cholesterol.
The Kd values of CYP124A1 for cholestenone, cholesterol and other lipids were
obtained from fitting UV-visible spectral titration data (Figures 4.5 - 4.10). The
binding curves were best fitted using sigmoidal or Michaelis-Menten/quadratic

259
equations (see Materials and Methods, section 2.2.9.1) depending on the nature of
the dependence of the induced absorption change versus substrate concentration.
The apparent Kd values are listed in Table 4.1 in order of their affinities for
CYP124A1. From the results obtained, CYP124A1 displayed highest affinity for
cholesterol (Kd = 0.27 ± 0.01 µM) and cholestenone (Kd = 0.50 ± 0.01 µM), and the
weakest affinity for pristane (Kd = 3.18 ± 0.48 mM), while menaquinone-4 showed
no detectable binding. The data collected indicate a preference of CYP124A1 for
cholestenone and cholesterol over the methyl branched lipids. It is tempting at this
point to say that cholestenone and cholesterol could really be the natural
substrates for this enzyme, rather than the methyl branched lipids. In addition to
cholestenone, near-full conversion of CYP124A1 to the high-spin state was also
observed with some of the other lipids tested, irrespective of their weaker Kd
values. These lipids include phytanic acid, 15-methyl palmitic acid, farnesol,
geranylgeraniol and phytane, and these data suggest that these lipids bind close to
the heme iron and should be good substrates for CYP124A1, irrespective of their
weaker binding affinities compared to the sterol substrates. However, it should be
noted that all of the non-sterol substrates tested that did induce CYP124A1 high-
spin heme iron development (other than pristane [Kd = 3179 M] and phytane [Kd =
844 M]) have Kd values of <5 M.
4.2.2.3 CYP124A1 inhibitor binding assays
Like many characterized cytochrome P450 enzymes, CYP124A1 binds tightly to a
range of azole inhibitor drugs, some of which are known to bind to other Mtb P450s
260
and to clear Mtb infection in mice (Ahmad et al., 2006c, Balding et al., 2008). These
azole compounds ligate the heme iron via their heterocyclic (usually imidazole or
triazole) nitrogen and this produces characteristic type II Soret spectral shifts (also
known as ‘red shifts’), usually leading to formation of a peak between 425 and 435
nm and a broad trough at about 390–410 nm in absorption difference spectra,
indicative of azole coordination to the heme iron through a nitrogen atom
(Jefcoate, 1978).
CYP124A1 was assayed with a range of azole inhibitors and the results are
summarised in Table 4.2. Unexpectedly, bifonazole bound as a Type I ligand and
showed the highest affinity towards CYP124A1 among the drugs tested (Kd = 0.19 ±
0.02 µM), with approximately 80% conversion to the high-spin state. Previous work
showed that its binding induced a near-complete high-spin conversion (Johnston et
al., 2009) and these findings are consistent with the results derived from this study.
The other azole drugs assayed exhibited type II shifts with CYP124A1, with
voriconazole showing the weakest affinity. Voriconazole also exhibits weak binding
affinity for CYP121A1 and CYP144A1 (Driscoll et al., 2011, McLean et al., 2002b).
Econazole and miconazole exhibited an odd binding spectrum that seems to show
that the heme initially goes high-spin, before converting to a new inhibitor-ligated
low-spin species. For posaconazole, no detectable heme perturbation was
observed, possibly due to this very large drug (molecular mass = 700.8 g/mol) being
unable to access the CYP124A1 active site. For fluconazole, no spectral shift was
again observed. Fluconazole is relatively water soluble compared to the other
clinically used azoles. The same is true for voriconazole — which also displayed

261
weak binding to CYP124A1 (Kd = 959 ± 47 µM). The order of potency of the azole
drugs (section 1.5.9) correlated with their Kd values for binding to the Mtb
CYP124A1 enzyme (see Table 4.2), suggesting this P450 to be an important drug
target.
I/N Inhibitor Kd (μM) MIC value for Mtb H37Rv (µg ml-1) (Mclean et al., 2008)
Type of Shift
1 Bifonazole 0.19 ± 0.02 - I
2 Clotrimazole 4.76 ± 0.13 11.0 II
3 Econazole 18.6 ± 0.5 8.0 II
4 Miconazole 19.6 ± 0.3 8.0 II
5 Ketoconazole 70.9 ± 3.7 16.0 II
6 1-Phenylimidazole 335 ± 13 - II
7 Voriconazole 959 ± 47 - II
8 Fluconazole - - ND
9 Posaconazole - - ND
Table 4.2: Binding affinities for CYP124A1 with azole drug inhibitors. Kd values for CYP124A1 ligand binding and the resulting heme iron absorbance changes (type I or type II) are shown. ND = no spectral change detected. I/N indicates inhibitor number.
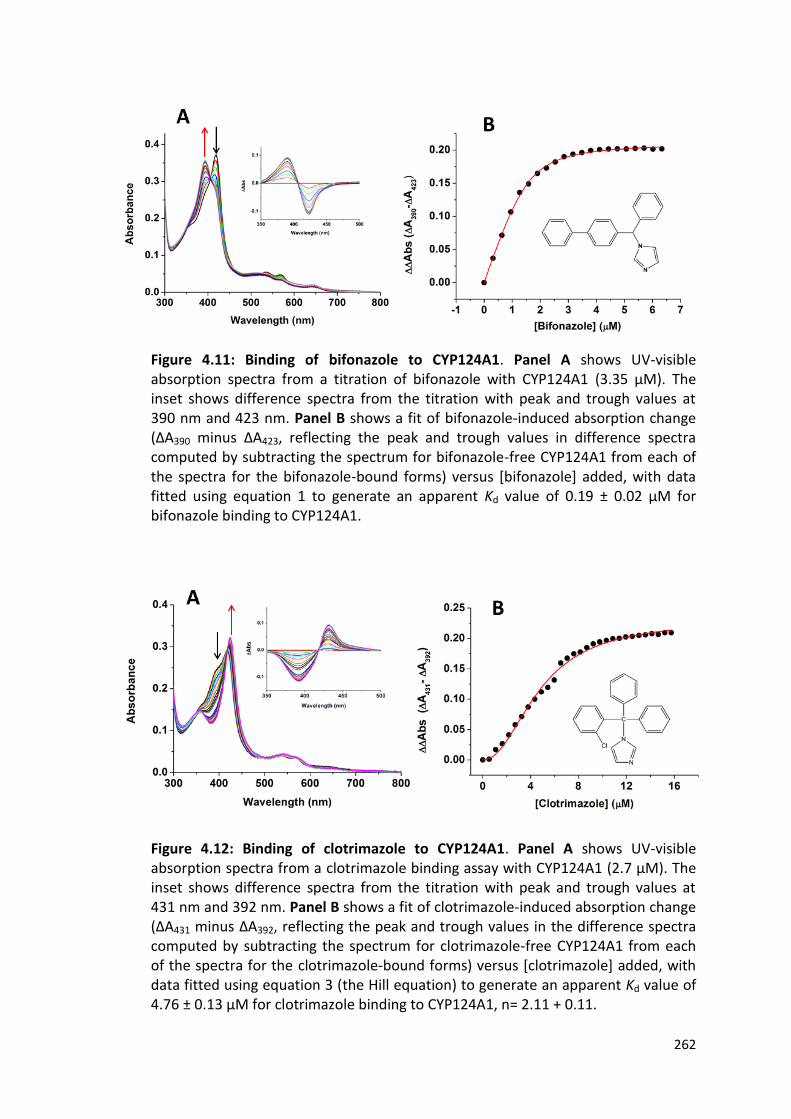
262
Figure 4.11: Binding of bifonazole to CYP124A1. Panel A shows UV-visible absorption spectra from a titration of bifonazole with CYP124A1 (3.35 μM). The inset shows difference spectra from the titration with peak and trough values at 390 nm and 423 nm. Panel B shows a fit of bifonazole-induced absorption change (ΔA390 minus ΔA423, reflecting the peak and trough values in difference spectra computed by subtracting the spectrum for bifonazole-free CYP124A1 from each of the spectra for the bifonazole-bound forms) versus [bifonazole] added, with data fitted using equation 1 to generate an apparent Kd value of 0.19 ± 0.02 µM for bifonazole binding to CYP124A1.
Figure 4.12: Binding of clotrimazole to CYP124A1. Panel A shows UV-visible absorption spectra from a clotrimazole binding assay with CYP124A1 (2.7 μM). The inset shows difference spectra from the titration with peak and trough values at 431 nm and 392 nm. Panel B shows a fit of clotrimazole-induced absorption change (ΔA431 minus ΔA392, reflecting the peak and trough values in the difference spectra computed by subtracting the spectrum for clotrimazole-free CYP124A1 from each of the spectra for the clotrimazole-bound forms) versus [clotrimazole] added, with data fitted using equation 3 (the Hill equation) to generate an apparent Kd value of 4.76 ± 0.13 µM for clotrimazole binding to CYP124A1, n= 2.11 + 0.11.

263
Figure 4.13: Binding of econazole to CYP124A1. Panel A shows UV visible absorption spectra from a titration of econazole with CYP124A1 (3.8 μM). The inset shows difference spectra from the titration with peak and trough values at 428 nm and 389 nm. Panel B shows a fit of cholesterol-induced absorption change (ΔA428 minus ΔA389, reflecting the peak and trough values in difference spectra computed by subtracting the spectrum for econazole-free CYP124A1 from each of the spectra for the econazole-bound forms) versus [econazole] added, with data fitted using equation 3 (the Hill equation) to generate an apparent Kd value of 18.56 ± 0.50 µM for econazole binding to CYP124A1, n = 3.53 + 0.31.
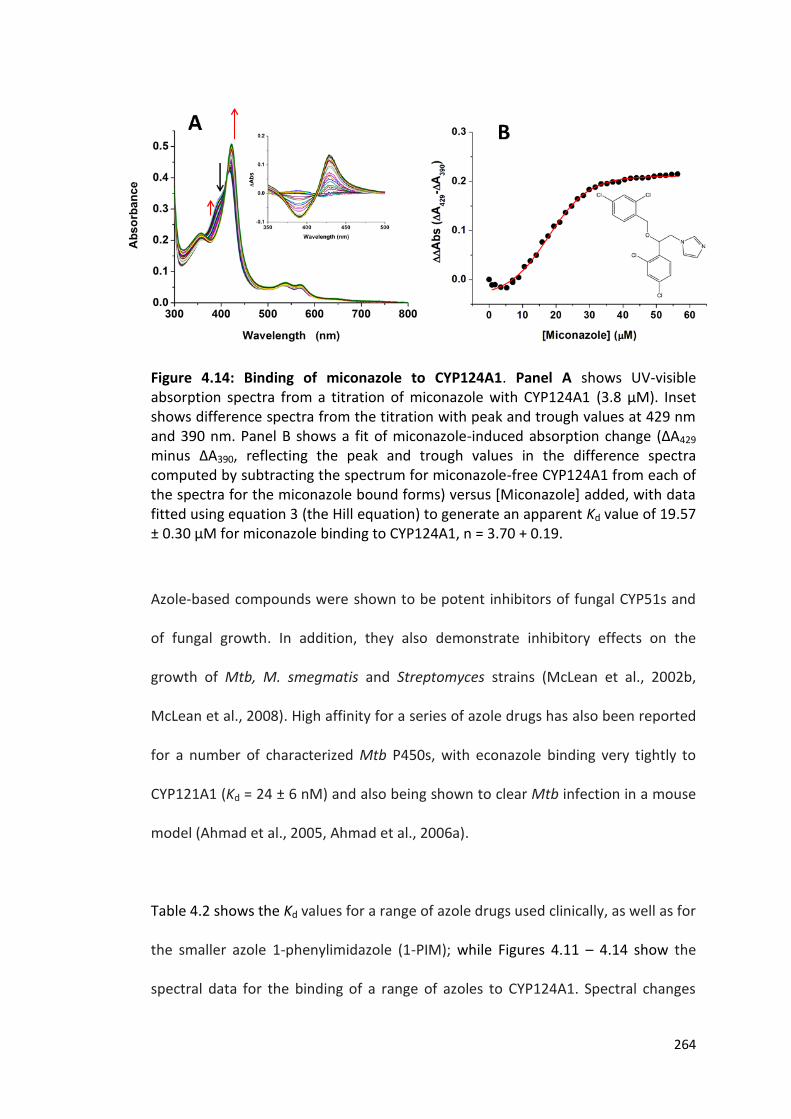
264
Figure 4.14: Binding of miconazole to CYP124A1. Panel A shows UV-visible absorption spectra from a titration of miconazole with CYP124A1 (3.8 μM). Inset shows difference spectra from the titration with peak and trough values at 429 nm and 390 nm. Panel B shows a fit of miconazole-induced absorption change (ΔA429 minus ΔA390, reflecting the peak and trough values in the difference spectra computed by subtracting the spectrum for miconazole-free CYP124A1 from each of the spectra for the miconazole bound forms) versus [Miconazole] added, with data fitted using equation 3 (the Hill equation) to generate an apparent Kd value of 19.57 ± 0.30 µM for miconazole binding to CYP124A1, n = 3.70 + 0.19.
Azole-based compounds were shown to be potent inhibitors of fungal CYP51s and
of fungal growth. In addition, they also demonstrate inhibitory effects on the
growth of Mtb, M. smegmatis and Streptomyces strains (McLean et al., 2002b,
McLean et al., 2008). High affinity for a series of azole drugs has also been reported
for a number of characterized Mtb P450s, with econazole binding very tightly to
CYP121A1 (Kd = 24 ± 6 nM) and also being shown to clear Mtb infection in a mouse
model (Ahmad et al., 2005, Ahmad et al., 2006a).
Table 4.2 shows the Kd values for a range of azole drugs used clinically, as well as for
the smaller azole 1-phenylimidazole (1-PIM); while Figures 4.11 – 4.14 show the
spectral data for the binding of a range of azoles to CYP124A1. Spectral changes

265
consistent with coordination of the CYP124A1 heme iron by the azoles (type II Soret
shifts to ∼422 nm) were observed for all drugs with the exception of bifonazole,
which instead showed a type I (substrate-like) shift and was also the tightest binder.
Other drugs (including clotrimazole with a Kd at 4.76 ± 0.13 μM, econazole at 18.56
± 0.50 μM and miconazole at 19.57 ± 0.30 μM) bound relatively tightly compared to
other azoles tested. However, the affinities for these azoles are not as high as those
for other Mtb cytochrome P450s studied, such as CYP121A1 (McLean et al., 2008);
CYP125A1 (McLean et al., 2009), CYP142A1 and CYP144A1 (Driscoll et al., 2011,
Driscoll et al., 2010).

266
4.2.2.4 CYP124A1 fragment binding assays
A) Analysis of CYP124A1 interactions with CYP142A1-specific
fragment hits
Figure 4.15: Binding of NMR170 to CYP124A1. Panel A shows UV-visible absorption spectra from a binding titration of NMR170 with CYP124A1 (3.3 μM). The inset shows difference spectra from the titration with peak and trough values at 422 nm and 390 nm. Panel B shows a fit of NMR170-induced absorption change (ΔA422 minus ΔA390, reflecting the peak and trough values in difference spectra computed by subtracting the spectrum for NMR170-free CYP124A1 from each of the spectra for the NMR170 bound forms) versus [NMR170] added, with data fitted using equation 1 (the quadratic equation) to generate a Kd value of 19.57 ± 0.30 µM for NMR170 binding to CYP124A1.
CYP124A1 was also assayed against fragments generated from fragment-based
screening studies conducted at the University of Cambridge. Fragments are small,
weak-binding molecules with low molecular weight (typically <250 Da) (Murray and
Blundell, 2010). Fragment-based drug design is a relatively new technique that
involves developing small molecule ligands as chemical tools and leads for drug
development (Scott et al., 2012). Initial fragment screening at Cambridge generated
6 specific hits for CYP142A1 (Table 4.3) and 4 specific hits for CYP124A1 (Table 4.4).
Interestingly, the CYP142A1-specific hits were found to bind all the three

267
cholesterol oxidases (CYP125A1, CYP124A1 and CYP142A1), indicating a good start
point for the development of specific inhibitors that are selective for each of these
three P450 isoforms and which could completely block host cholesterol utilization
by Mtb. Table 4.3 below compares the relative affinities of these fragments for the
three Mtb P450 isoforms.
Fragment CYP142A1 (Kd, µM)
Type of
shift
CYP124A1 (Kd, µM)
Type of shift
CYP125A1 (Kd, µM)
Type of shift
NMR491 0.68 ± 0.14 II 72.3 ± 1.9 II 4325 ± 285
II
NMR170 1.87 ± 0.07 II 43.3 ± 1.2
II 127 ± 5
II
NMR 540 176 ± 61 II 340 ± 220
II 3730 ± 380
II
NMR623 254 ± 47 II 2920 ± 250
II ND ND
NMR089 377 ± 10 II 3990 ± 160
II ND ND
NMR099 7215 ± 330 I 12100 ± 330
II ND ND
Table 4.3: Binding affinity for CYP142A1 fragment hits with Mtb cholesterol oxidase P450s. The data show Kd values determined from optical titrations, and the heme Soret absorption shifts induced in each case. All fragments (except NMR099 with CYP142A1) demonstrate type II binding, this being indicative of interactions between the fragments and the heme iron of the P450s. ND = no binding detected. These compounds showed highest affinity for CYP142A1 and weakest affinity for
CYP125A1. NMR491, NMR170 and NMR540 were observed to bind to all of these
cholesterol oxidase P450s. This is a desirable characteristic, since we aim to develop
highly potent and selective inhibitors which can completely block host cholesterol
utilization by Mtb.

268
B) Studies with CYP124A1-specific fragment hits
Four fragments were generated specifically for CYP124A1. These are named:
NMR415, NMR115, NMR356 and NMR515 (Figure 4.16). The relevant spectral data
and binding titration analyses are detailed in Table 4.4. The tightest binder was
NMR415 and the weakest binding was seen with NMR356. No spectral shifts were
observed with NMR515. The three fragments that showed weak binding gave type
II spectral shifts, indicative of direct coordination to the heme iron by the small
chemical ligands.
Figure 4.16: Compounds identified as CYP124A1-specific fragment hits.

269
Figure 4.17: Binding of NMR115 to CYP124A1. Panel A shows UV visible absorption spectra from a titration of NMR115 with CYP124A1 (~4.35 μM). The inset shows difference spectra from the titration with peak and trough values at 430 nm and 394 nm. Panel B shows a fit of NMR115-induced absorption change (ΔA430 minus ΔA394, reflecting the peak and trough values in the difference spectra, computed by subtracting the spectrum for NMR115-free CYP124A1 from each of the spectra for the NMR115-bound forms) versus [NMR115] added, with data fitted using equation 3 (the Hill equation) to generate a Kd value of 716.3 ± 14.5 µM for NMR115 binding to CYP124A1, n = 2.45 ± 0.11.
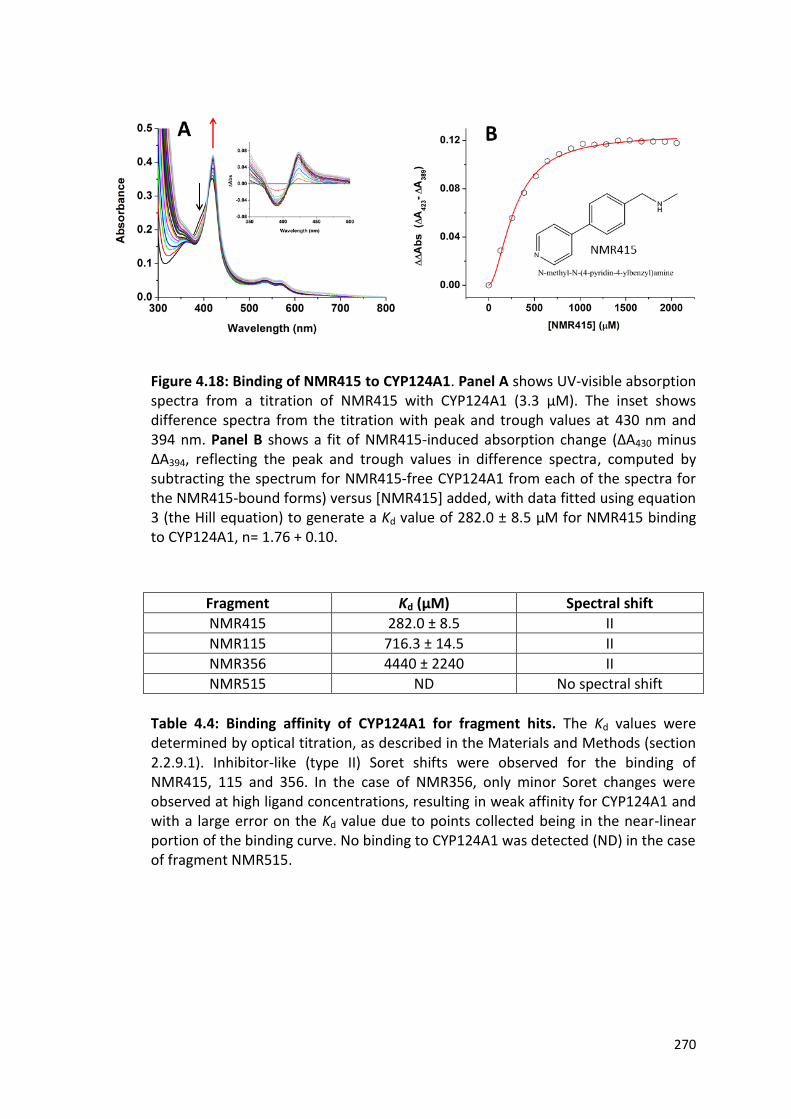
270
Figure 4.18: Binding of NMR415 to CYP124A1. Panel A shows UV-visible absorption spectra from a titration of NMR415 with CYP124A1 (3.3 μM). The inset shows difference spectra from the titration with peak and trough values at 430 nm and 394 nm. Panel B shows a fit of NMR415-induced absorption change (ΔA430 minus ΔA394, reflecting the peak and trough values in difference spectra, computed by subtracting the spectrum for NMR415-free CYP124A1 from each of the spectra for the NMR415-bound forms) versus [NMR415] added, with data fitted using equation 3 (the Hill equation) to generate a Kd value of 282.0 ± 8.5 µM for NMR415 binding to CYP124A1, n= 1.76 + 0.10.
Fragment Kd (µM) Spectral shift
NMR415 282.0 ± 8.5 II
NMR115 716.3 ± 14.5 II
NMR356 4440 ± 2240 II
NMR515 ND No spectral shift
Table 4.4: Binding affinity of CYP124A1 for fragment hits. The Kd values were determined by optical titration, as described in the Materials and Methods (section 2.2.9.1). Inhibitor-like (type II) Soret shifts were observed for the binding of NMR415, 115 and 356. In the case of NMR356, only minor Soret changes were observed at high ligand concentrations, resulting in weak affinity for CYP124A1 and with a large error on the Kd value due to points collected being in the near-linear portion of the binding curve. No binding to CYP124A1 was detected (ND) in the case of fragment NMR515.
271
C) Binding analysis with compounds from CYP121A1 fragment elaborated hits.
The first successful fragment-based approach to targeting Mtb cytochrome P450
enzymes was achieved with CYP121A1 (the gene for which is essential for Mtb
viability) (Hudson et al., 2013). Initial fragment screening for CYP121A generated 26
hits, giving a 46% validated hit rate (Hudson et al., 2012b). A parallel fragment
screen was also carried out against the Mtb CYP125A1 cholesterol/cholestenone
C27 monooxygenase, which produced a total of nine hits (Hudson et al., 2012b).
Surprisingly, only a single hit common to both CYPs was observed, suggesting a high
level of isoform selectivity, even at the fragment-screening level (Hudson et al.,
2012b).
The CYP121A1 specific hits generated were further validated and elaborated (via a
combination of synthetic chemistry and using data from structural biology studies)
to generate more potent compounds with higher affinity for CYP121A1 (Hudson et
al., 2012b). A fragment–fragment merging approach was used to generate these
compounds with higher affinity and selectivity, and this provided an excellent
scaffold for development of further type II CYP121A1 inhibitors. The findings from
this work lay the groundwork for the application of fragment-based drug design to
other members of the cytochrome P450 superfamily. CYP121A1 inhibitors
generated from this study were also assayed against the other Mtb P450s
CYP142A1, CYP125A1 and CYP124A1 in my PhD work, and interestingly they were
found to bind with differing affinities. These compounds are shown in Figure 4.19
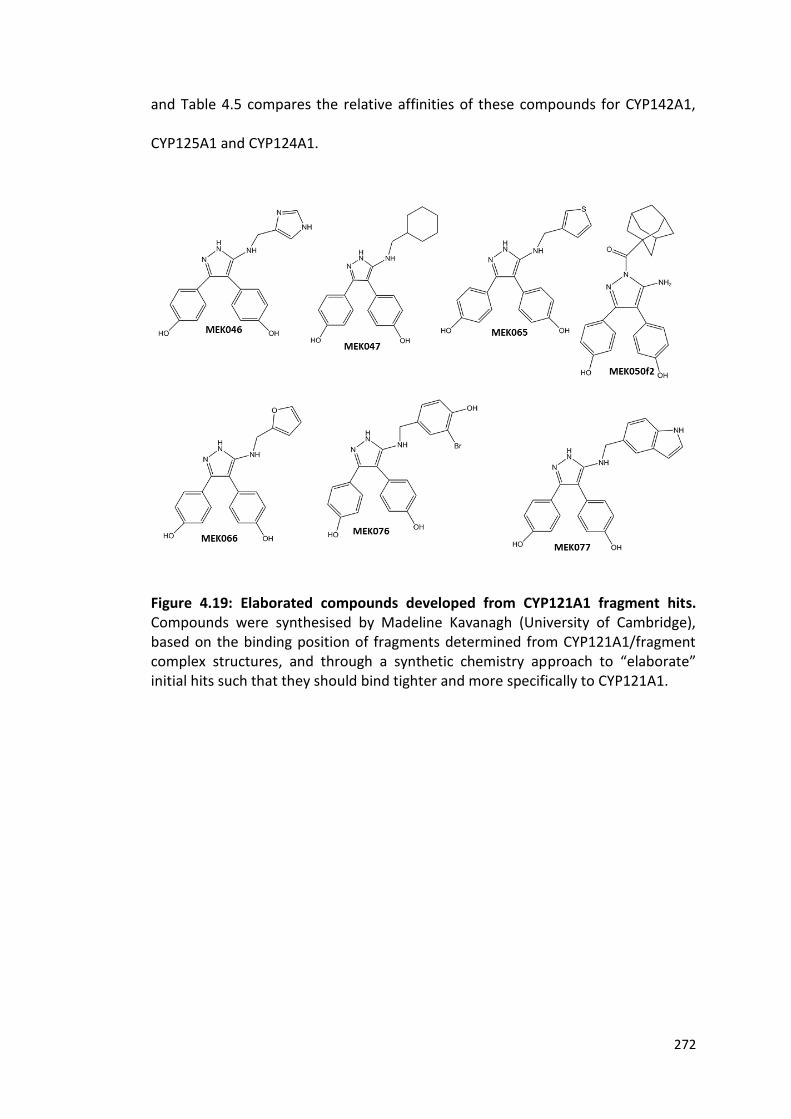
272
and Table 4.5 compares the relative affinities of these compounds for CYP142A1,
CYP125A1 and CYP124A1.
Figure 4.19: Elaborated compounds developed from CYP121A1 fragment hits. Compounds were synthesised by Madeline Kavanagh (University of Cambridge), based on the binding position of fragments determined from CYP121A1/fragment complex structures, and through a synthetic chemistry approach to “elaborate” initial hits such that they should bind tighter and more specifically to CYP121A1.

273
Figure 4.20: Binding of MEK066 to CYP124A1. Panel A shows UV-visible absorption spectra from a titration of MEK066 with CYP124A1 (3.2 μM). The inset shows difference spectra from the titration with peak and trough values at 423 nm and 388 nm. Panel B shows a fit of MEK066-induced absorption change (ΔA423 minus ΔA388, reflecting the peak and trough values in the difference spectra, computed by subtracting the spectrum for MEK066-free CYP124A1 from each of the spectra for the MEK066-bound forms) versus [MEK066] added, with data fitted using equation 3 (the Hill equation) to generate a Kd value of 293.1 ± 8.9 µM for MEK066 binding to CYP124A1, n= 2.44 ± 0.14.
Ligand CYP142A1 (Kd, µM)
Type of shift
CYP124A1 (Kd, µM)
Type of shift
CYP125A1 (Kd, µM)
Type of shift
MEK046 3.24 ± 0.07
II 38.0 ± 2.6 II 86.4 ± 5.1 II
MEK065 5.62 ± 0.09
I 89.6 ± 6.3 Rev I ND ND
MEK066 35.3 ± 3.8 I 293.1 ± 8.9
Rev I ND ND
MEK076 1 nm shift I ND ND ND ND
MEK077 1 nm shift I ND ND ND ND
MEK047 1 nm shift I ND ND ND ND
MEK050f2 1 nm shift I ND ND ND ND
Table 4.5: Binding spectral characteristics of Mtb cholesterol oxidases with CYP121A1 elaborated ligands. Kd values were determined as described in the Materials and Methods (section 2.2.9.1). For fragments MEK076, 077, 047 and 050f2, minor type I (high-spin) shifts were observed only with CYP142A1. ND = no binding detected by P450 heme optical titration.
274
From the results obtained, CYP142A1 bound tightest to the three MEK compounds
for which Kd values could be determined, while CYP125A1 bound weakest and
showed measurable affinity only for MEK046. CYP142A1 gave type I spectral shifts
(substrate-like) with MEK065 and MEK066, while CYP124A1 showed a reverse type I
spectral shift with these compounds, with the high-spin heme signal at 395 nm
diminished and the low-spin peak at 418 nm increased. MEK046 gave an inhibitor-
like (Soret red shift) with both CYP124A1 and CYP142A1. Since CYP125A1 exists in
the high-spin form, it was not possible to observe the spin shift particularly if the
compound were to give a type I shift; hence only MEK046 gave an observable type
II spectral shift (inhibitor-like). MEK076, MEK077, MEK047 and MEK050F2 showed
either very weak binding (with small type I shifts of ~1 nm) in the case of CYP142A1,
or no binding at all that could be detected optically for the CYP124A1 and
CYP125A1 enzymes.
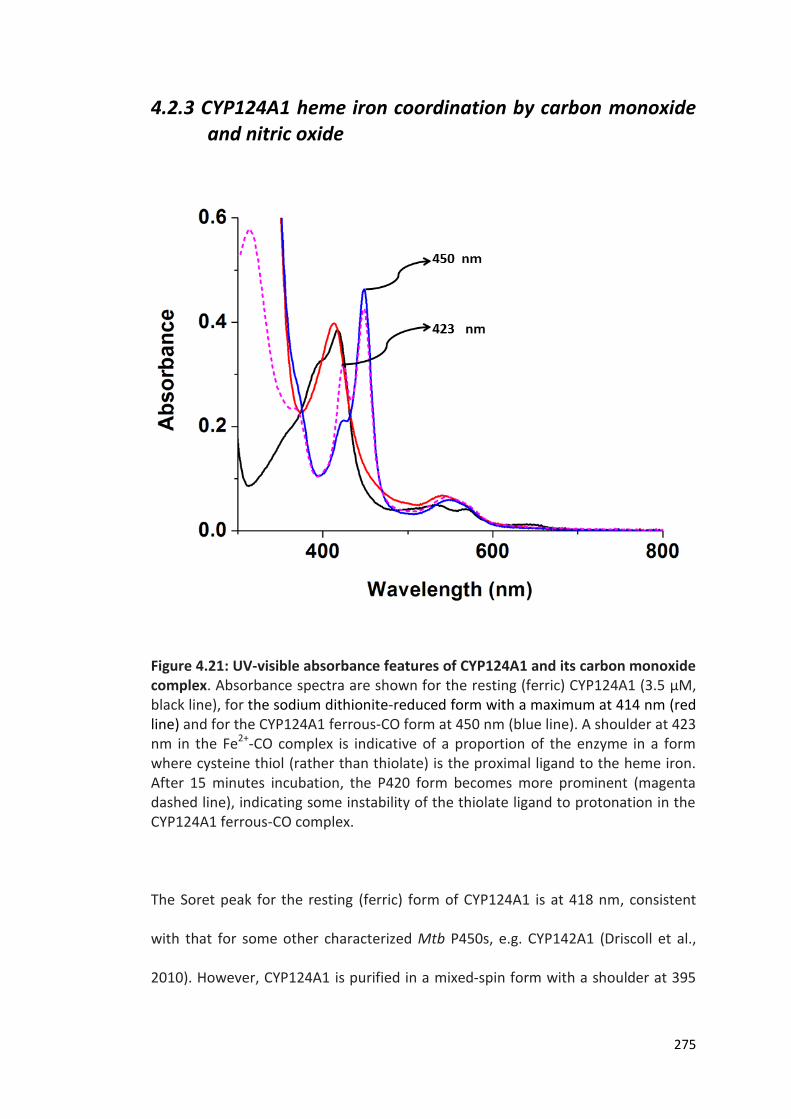
275
4.2.3 CYP124A1 heme iron coordination by carbon monoxide and nitric oxide
Figure 4.21: UV-visible absorbance features of CYP124A1 and its carbon monoxide complex. Absorbance spectra are shown for the resting (ferric) CYP124A1 (3.5 μM, black line), for the sodium dithionite-reduced form with a maximum at 414 nm (red line) and for the CYP124A1 ferrous-CO form at 450 nm (blue line). A shoulder at 423 nm in the Fe2+-CO complex is indicative of a proportion of the enzyme in a form where cysteine thiol (rather than thiolate) is the proximal ligand to the heme iron. After 15 minutes incubation, the P420 form becomes more prominent (magenta dashed line), indicating some instability of the thiolate ligand to protonation in the CYP124A1 ferrous-CO complex. The Soret peak for the resting (ferric) form of CYP124A1 is at 418 nm, consistent
with that for some other characterized Mtb P450s, e.g. CYP142A1 (Driscoll et al.,
2010). However, CYP124A1 is purified in a mixed-spin form with a shoulder at 395

276
nm. For comparison, other Mtb P450 enzymes have their low-spin Soret peaks at
416.5 nm (CYP121A1) (McLean et al., 2002a), 419 nm (the sterol 14α-demethylase
CYP51B1) (McLean et al., 2006b, Bellamine et al., 1999), and 418 nm (CYP130A1)
(Ouellet et al., 2008).
A fundamental signature of P450 enzymes is their ability to form a ferrous-CO
adduct on binding of carbon monoxide to ferrous heme iron, with a Soret shift to an
absorbance maximum near 450 nm for the cysteine thiolate coordinated enzyme
(McLean et al., 2009). For CYP124A1, the Fe2+-CO complex spectrum gave a
maximum at 450 nm immediately after the Fe2+-CO complex was formed, with a
shoulder at 423 nm. However, after 15 minutes the 423 nm (P420) species
increased in intensity while the 450 nm (P450) species decreased. The formation of
the P420 form results from protonation of the proximal cysteinate ligand to a thiol.
In previous studies, similar phenomena have been observed whereby the
equilibrium between P450 and P420 changes over periods of minutes. This was
observed previously with Mtb CYP125A1, and also with CYP51B1, where rapid P450
collapse to P420 could be retarded by addition of estriol substrate (McLean et al.,
2009, McLean et al., 2006b).
The P420 Fe2+-CO species was commonly referred to as an “inactivated” form of a
cytochrome P450 enzyme, but further studies on CYP121A1, CYP142A1 and the
P450epoK enzyme from Sorangium cellulosum have shown the P450/P420
equilibrium to be reversible. In CYP142A1, the P420 form could be reconverted into
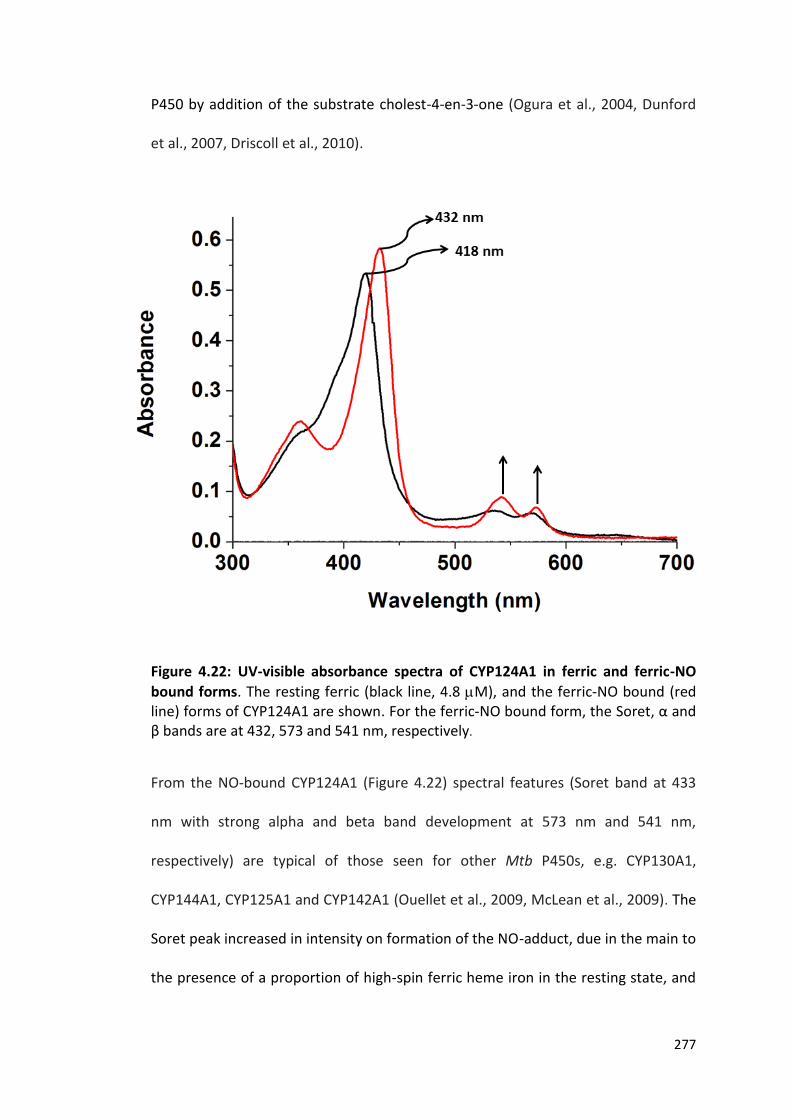
277
P450 by addition of the substrate cholest-4-en-3-one (Ogura et al., 2004, Dunford
et al., 2007, Driscoll et al., 2010).
Figure 4.22: UV-visible absorbance spectra of CYP124A1 in ferric and ferric-NO
bound forms. The resting ferric (black line, 4.8 M), and the ferric-NO bound (red line) forms of CYP124A1 are shown. For the ferric-NO bound form, the Soret, α and β bands are at 432, 573 and 541 nm, respectively.
From the NO-bound CYP124A1 (Figure 4.22) spectral features (Soret band at 433
nm with strong alpha and beta band development at 573 nm and 541 nm,
respectively) are typical of those seen for other Mtb P450s, e.g. CYP130A1,
CYP144A1, CYP125A1 and CYP142A1 (Ouellet et al., 2009, McLean et al., 2009). The
Soret peak increased in intensity on formation of the NO-adduct, due in the main to
the presence of a proportion of high-spin ferric heme iron in the resting state, and

278
the conversion to a homogeneous species in the ferric-NO complex (which is likely
formally ferrous-NO+). Similar spectral features were observed for the NO complex
of CYP125A1, which is mainly high-spin in its ferric resting state (McLean et al.,
2009).
Nitric oxide was documented to be an inhibitor of Mtb cytochrome P450 enzymes
(Ouellet et al., 2009). Nitric oxide radical produced by host macrophages inhibit
heme-containing terminal oxidases, inactivate iron-sulfur proteins, and enhance
bacterial entry into latency during the preliminary growth/infection stage of Mtb
(Ouellet et al., 2009).
4.2.4 Determination of the CYP124A1 heme extinction coefficient
CYP124A1 hemoprotein concentration was estimated using the pyridine
hemochromogen method. A sample of ferric CYP124A1 (subsequently determined
as 4.9 μM) was mixed with pyridine and subsequently reduced using sodium
dithionite, as detailed in the Materials and Methods (section 2.2.8). Using the
method of Berry and Trumpower (Berry and Trumpower, 1987), the extinction
coefficient was calculated as ε418 = 110 mM−1 cm−1 for the oxidized, ligand-free
CYP124A1 enzyme. This coefficient takes into consideration that CYP124A1 is
purified in a partially high-spin state, and that the high-spin proportion is quite
consistent. Thus, the coefficient at 418 nm estimates the additional contribution
that the high-spin component would make if CYP124A1 was essentially completely

279
low-spin. The extinction coefficients of some other Mtb P450 enzymes have
determined using the pyridine hemochromogen method. These include CYP144A1
at ε420.5 = 100 mM−1 cm−1 (Driscoll et al., 2011), CYP121A1 and CYP51B1 at ε416.5 =
110 mM−1 cm−1 and ε419 = 134 mM−1 cm−1, respectively (McLean et al., 2006b). An
extinction coefficient of ε417 = 115 mM−1 cm−1 was also determined for P450cam
(CYP101A1), a camphor hydroxylase from Pseudomonas putida (Dawson et al.,
1982). The data obtained for CYP124A1 are comparable with the extinction
coefficients of these previously characterized P450s.
The extinction coefficient for CYP124A1 was previously determined by Johnston et
al. to be 91 mM-1 cm-1, using the method developed by Omura and Sato and which
is based on the development of Soret absorption of the Fe2+-CO complex at, or
near, 450 nm (Omura and Sato, 1964). However, as shown in Figure 4.21 above, this
method has limitations with respect to the thiolate-coordinated CYP124A1 P450
form progressively collapsing into the thiol-coordinated P420 species with a Soret
maximum at ∼423 nm. This phenomenon was also observed with CYP51B1, albeit it
occurring more rapidly than with CYP124A1 (Bellamine et al., 1999, Aoyama et al.,
1998). However, the binding of estriol to CYP51B1 did retard considerably the rate
of P450-to-P420 collapse in CYP51B1 (McLean et al., 2006b). In the case of
CYP125A1, a mixture of P450 and P420 species is formed in the Fe2+–CO complex,
and a relatively stable equilibrium is formed (McLean et al., 2009).
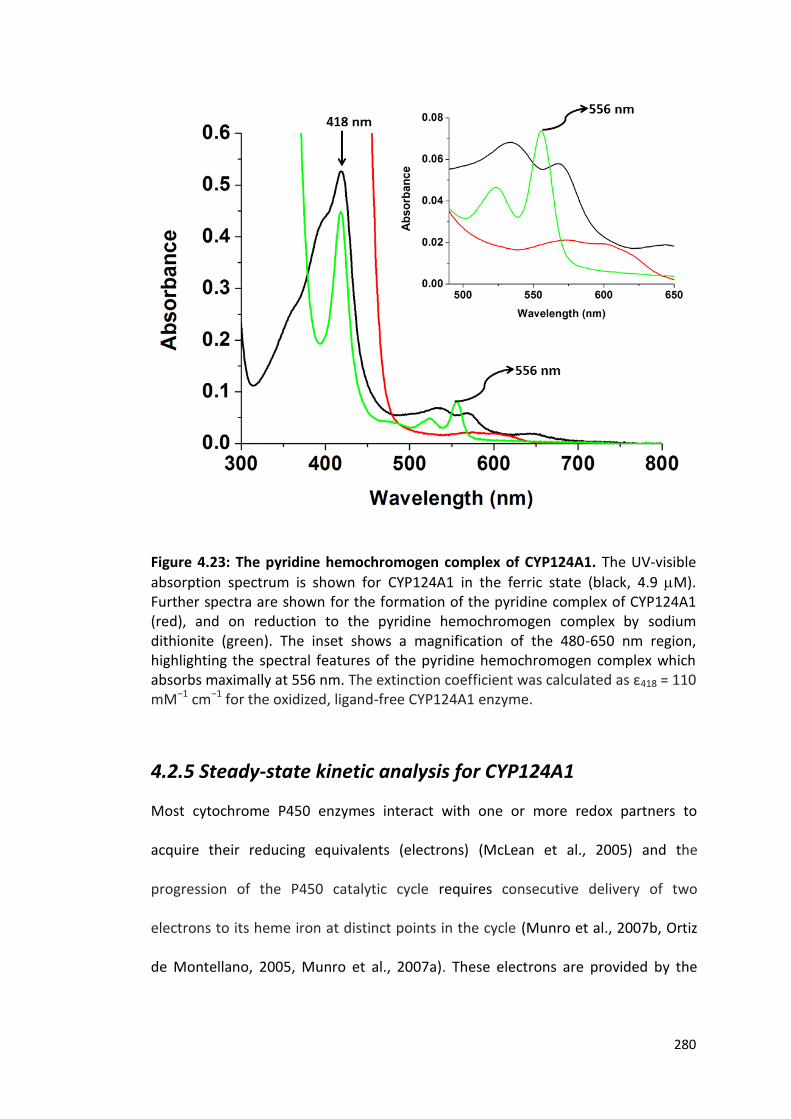
280
Figure 4.23: The pyridine hemochromogen complex of CYP124A1. The UV-visible
absorption spectrum is shown for CYP124A1 in the ferric state (black, 4.9 M). Further spectra are shown for the formation of the pyridine complex of CYP124A1 (red), and on reduction to the pyridine hemochromogen complex by sodium dithionite (green). The inset shows a magnification of the 480-650 nm region, highlighting the spectral features of the pyridine hemochromogen complex which absorbs maximally at 556 nm. The extinction coefficient was calculated as ε418 = 110 mM−1 cm−1 for the oxidized, ligand-free CYP124A1 enzyme.
4.2.5 Steady-state kinetic analysis for CYP124A1
Most cytochrome P450 enzymes interact with one or more redox partners to
acquire their reducing equivalents (electrons) (McLean et al., 2005) and the
progression of the P450 catalytic cycle requires consecutive delivery of two
electrons to its heme iron at distinct points in the cycle (Munro et al., 2007b, Ortiz
de Montellano, 2005, Munro et al., 2007a). These electrons are provided by the
281
nicotinamide adenine dinucleotide cofactors (NAD(P)H) and their delivery to the
heme iron is mediated by accessory redox partner proteins.
In view of the high affinity of CYP124A1 for a wide variety of substrates, steady-
state kinetic analysis was performed to investigate the apparent rate of substrate
turnover by reconstituting the P450 with spinach ferredoxin (spFDX) and E. coli
flavodoxin reductase (E. coli FLDR) redox partners, hereafter referred to as the
‘spinach system’ in this work. Another set of experiments was also performed
reconstituting CYP124A1 with E. coli flavodoxin (E. coli FLD) and E. coli FLDR
(referred to as the E. coli system in this work). Experiments were carried out as
detailed in the Materials and Methods (section 2.2.17). Substrate-dependent
NADPH oxidation was monitored on additions of varying amounts of the substrate
cholestenone and of the methyl-branched lipids (15-methylpalmitic acid, phytanic
acid, farnesol, geraniol, and geranylgeraniol). These redox systems were shown to
support cholesterol/cholest-4-en-3-one oxidation by Mtb CYP125A1 and CYP142A1
(Driscoll et al., 2010, McLean et al., 2009), However, a comparison of the two
systems was needed to ascertain which system supports the faster substrate-
dependent NADPH oxidation by CYP124A1.
Figure 4.24 shows hyperbolic dependence of NADPH oxidation rate on substrate
concentration for a 1:10:2 (200 nM CYP: 2 M E. coli FLD: 400 nM E. coli FLDR)
reaction mixture, while Figure 4.25 shows hyperbolic dependence of NADPH
oxidation rate on substrate concentration for a 1:10:2 (200 nM CYP: 2 M spFDX:
400 nM E. coli FLDR) mixture. Table 4.6 shows a summary of the kinetic data
282
derived from these experiments. The spinach system produced higher kcat values
(40-122 min-1) relative to the E. coli system, suggestive of a higher catalytic
efficiency with the spinach ferredoxin present. The highest kcat values were
observed for phytanic acid 122.6 ± 5.4 min-1) and cholestenone (120.3 ± 1.7 min-1)
substrates with the spinach system. Phytanic acid showed the highest kcat values
with both redox partner systems, suggesting that this is a good substrate for
CYP124A1. With the spinach system, geraniol showed the lowest Km (0.46 ± 0.10
µM), but also the lowest kcat (40.4 ± 1.5 min-1); while geranylgeraniol showed the
lowest Km (0.33 ± 0.09 µM) and a modest kcat (28.3 ± 1.2 min-1) with the E. coli
system. However, the spinach system failed to function efficiently with
geranylgeraniol. The reason for this is unknown.
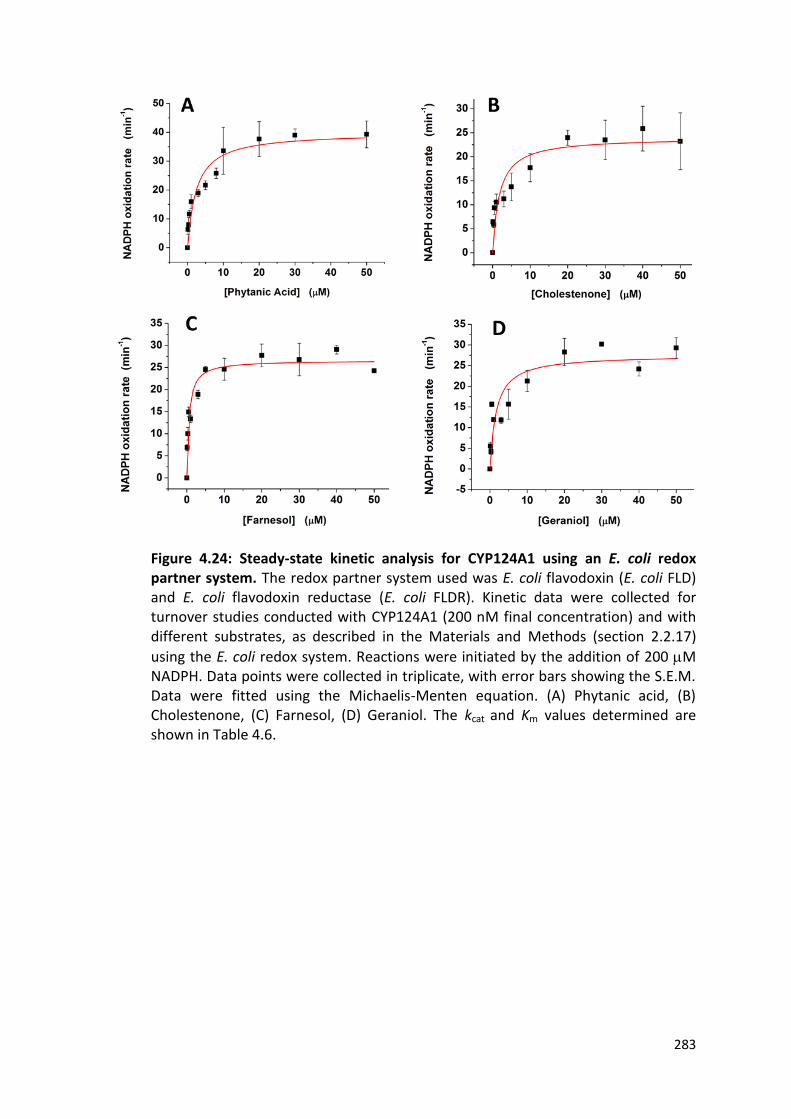
283
Figure 4.24: Steady-state kinetic analysis for CYP124A1 using an E. coli redox partner system. The redox partner system used was E. coli flavodoxin (E. coli FLD) and E. coli flavodoxin reductase (E. coli FLDR). Kinetic data were collected for turnover studies conducted with CYP124A1 (200 nM final concentration) and with different substrates, as described in the Materials and Methods (section 2.2.17)
using the E. coli redox system. Reactions were initiated by the addition of 200 M NADPH. Data points were collected in triplicate, with error bars showing the S.E.M. Data were fitted using the Michaelis-Menten equation. (A) Phytanic acid, (B) Cholestenone, (C) Farnesol, (D) Geraniol. The kcat and Km values determined are shown in Table 4.6.

284
Figure 4.25: Steady-state kinetic analysis for CYP124A1 using the spinach redox system. The redox partner system used was spinach ferredoxin (spFDX) and E. coli flavodoxin reductase (E. coli FLDR). Kinetic data were collected for turnover studies conducted with CYP124A1 (200 nM final concentration) and with different substrates, as described in the Materials and Methods (section 2.2.17) using the
spinach redox system. Reactions were initiated by the addition of 200 M NADPH. Data points were collected in triplicate, with error bars showing the S.E.M. Data were fitted using the Michaelis-Menten equation. (A) Phytanic acid, (B) Cholestenone, (C) Farnesol, (D) Geraniol. The kcat and Km values determined are shown in Table 4.6.
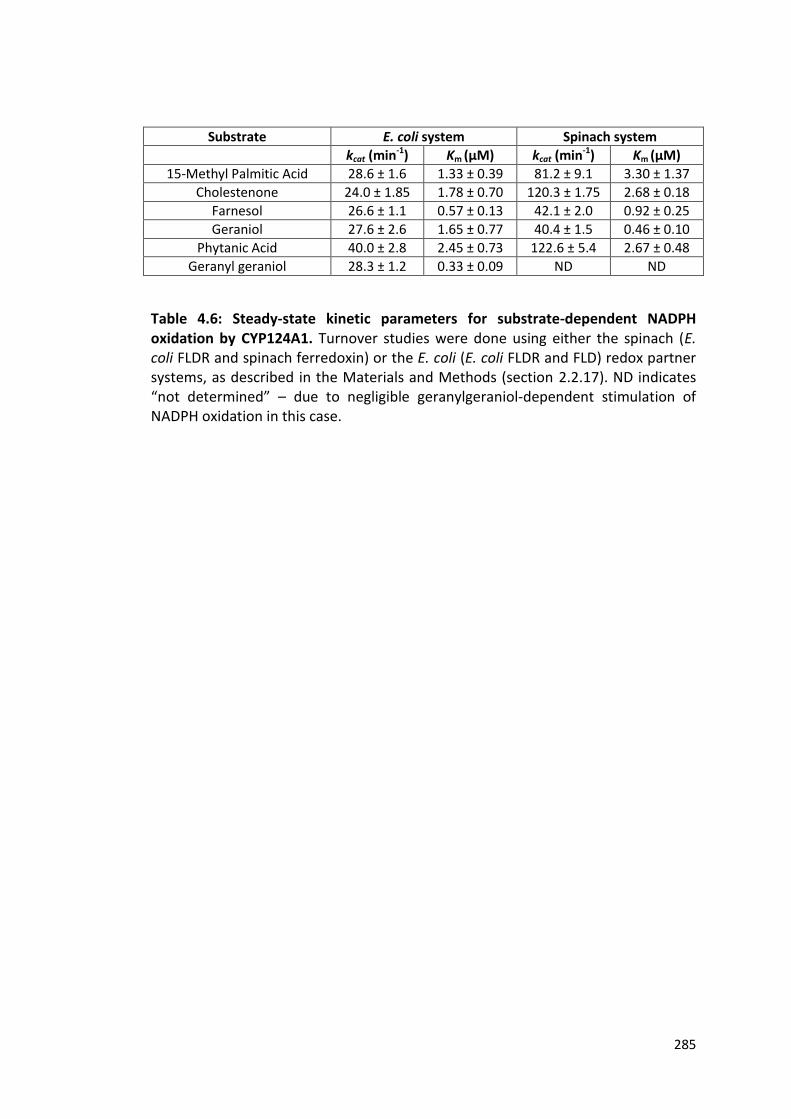
285
Substrate E. coli system Spinach system
kcat (min-1) Km (µM) kcat (min-1) Km (µM)
15-Methyl Palmitic Acid 28.6 ± 1.6 1.33 ± 0.39 81.2 ± 9.1 3.30 ± 1.37
Cholestenone 24.0 ± 1.85 1.78 ± 0.70 120.3 ± 1.75 2.68 ± 0.18
Farnesol 26.6 ± 1.1 0.57 ± 0.13 42.1 ± 2.0 0.92 ± 0.25
Geraniol 27.6 ± 2.6 1.65 ± 0.77 40.4 ± 1.5 0.46 ± 0.10
Phytanic Acid 40.0 ± 2.8 2.45 ± 0.73 122.6 ± 5.4 2.67 ± 0.48
Geranyl geraniol 28.3 ± 1.2 0.33 ± 0.09 ND ND
Table 4.6: Steady-state kinetic parameters for substrate-dependent NADPH oxidation by CYP124A1. Turnover studies were done using either the spinach (E. coli FLDR and spinach ferredoxin) or the E. coli (E. coli FLDR and FLD) redox partner systems, as described in the Materials and Methods (section 2.2.17). ND indicates “not determined” – due to negligible geranylgeraniol-dependent stimulation of NADPH oxidation in this case.
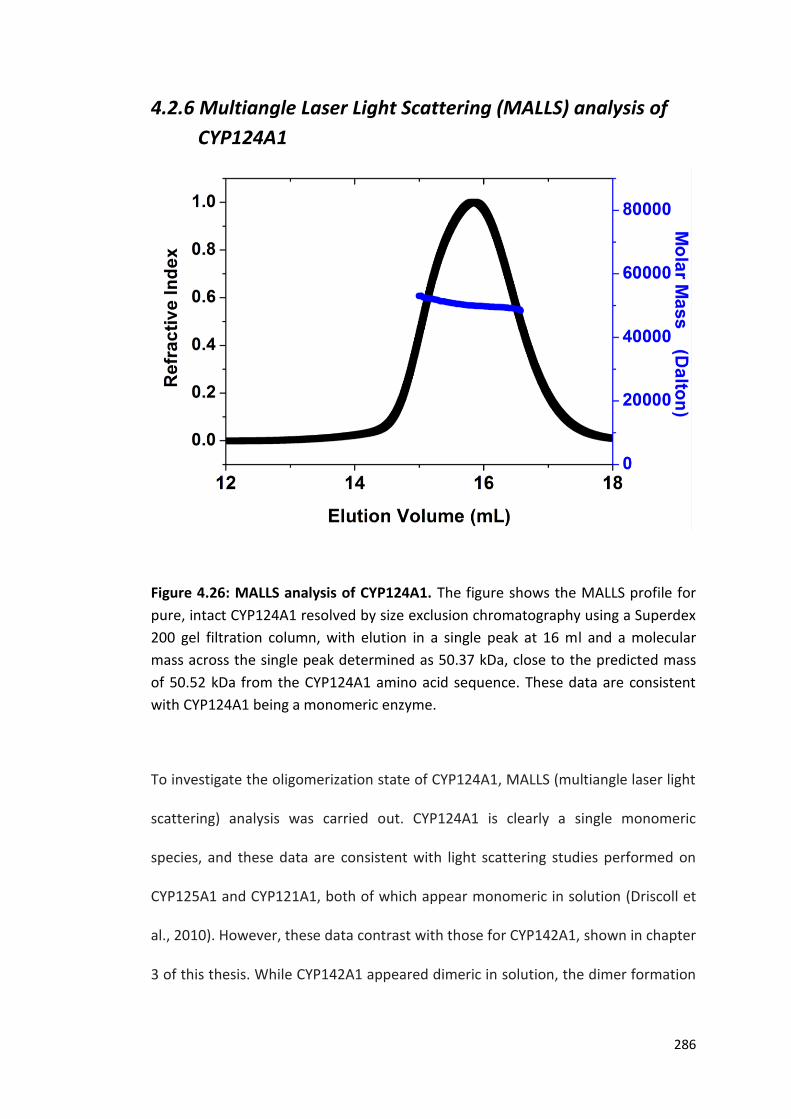
286
4.2.6 Multiangle Laser Light Scattering (MALLS) analysis of
CYP124A1
Figure 4.26: MALLS analysis of CYP124A1. The figure shows the MALLS profile for
pure, intact CYP124A1 resolved by size exclusion chromatography using a Superdex
200 gel filtration column, with elution in a single peak at 16 ml and a molecular
mass across the single peak determined as 50.37 kDa, close to the predicted mass
of 50.52 kDa from the CYP124A1 amino acid sequence. These data are consistent
with CYP124A1 being a monomeric enzyme.
To investigate the oligomerization state of CYP124A1, MALLS (multiangle laser light
scattering) analysis was carried out. CYP124A1 is clearly a single monomeric
species, and these data are consistent with light scattering studies performed on
CYP125A1 and CYP121A1, both of which appear monomeric in solution (Driscoll et
al., 2010). However, these data contrast with those for CYP142A1, shown in chapter
3 of this thesis. While CYP142A1 appeared dimeric in solution, the dimer formation
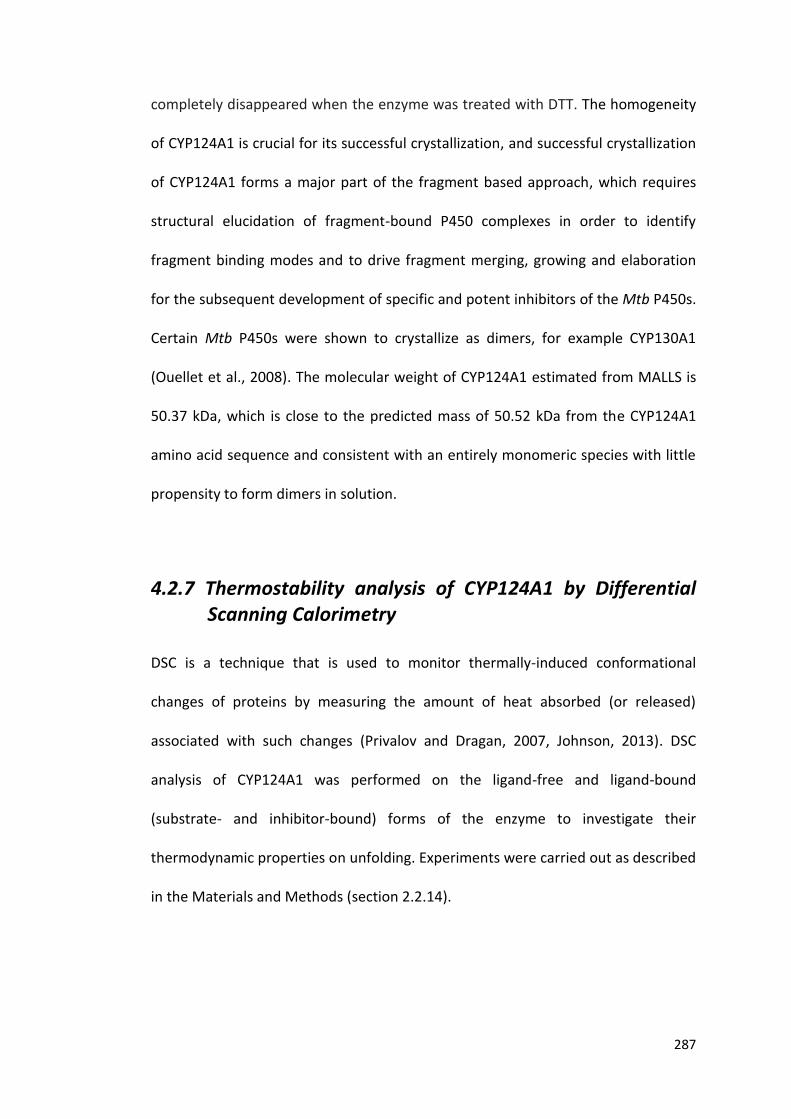
287
completely disappeared when the enzyme was treated with DTT. The homogeneity
of CYP124A1 is crucial for its successful crystallization, and successful crystallization
of CYP124A1 forms a major part of the fragment based approach, which requires
structural elucidation of fragment-bound P450 complexes in order to identify
fragment binding modes and to drive fragment merging, growing and elaboration
for the subsequent development of specific and potent inhibitors of the Mtb P450s.
Certain Mtb P450s were shown to crystallize as dimers, for example CYP130A1
(Ouellet et al., 2008). The molecular weight of CYP124A1 estimated from MALLS is
50.37 kDa, which is close to the predicted mass of 50.52 kDa from the CYP124A1
amino acid sequence and consistent with an entirely monomeric species with little
propensity to form dimers in solution.
4.2.7 Thermostability analysis of CYP124A1 by Differential
Scanning Calorimetry DSC is a technique that is used to monitor thermally-induced conformational
changes of proteins by measuring the amount of heat absorbed (or released)
associated with such changes (Privalov and Dragan, 2007, Johnson, 2013). DSC
analysis of CYP124A1 was performed on the ligand-free and ligand-bound
(substrate- and inhibitor-bound) forms of the enzyme to investigate their
thermodynamic properties on unfolding. Experiments were carried out as described
in the Materials and Methods (section 2.2.14).

288
The results (Figure 4.27) obtained revealed minor effects of ligand binding on the
thermodynamic properties (unfolding midpoint temperatures, or Tm values) of
CYP124A1. A summary of the thermodynamic parameters derived from the DSC
experiments is given in Table 4.7. The bifonazole and NMR115-bound CYP124A1
showed two unfolding transitions (Tm values) at 60.31 °C (Tm2, minor) and 53.68 °C
(Tm1, major) for bifonazole and (Tm values) at 54.38 °C (Tm2, major) and 60.43 °C
(Tm1, minor) for NMR115. However, the type II inhibitors (econazole, miconazole,
MEK046 and NMR415) produced a considerable increase in Tm by a value of ~3 to 6
oC, indicating a much more stabilizing effect induced by these type II azoles. The
significant effect on protein stability induced by binding of miconazole may result
from its decreasing the conformational flexibility of CYP124A1 and favouring a
single major conformation, including its influence in providing a new (nitrogen) 6th
ligand to the heme iron. On the other hand, the substrate cholestenone increased
the Tm of CYP124A1 by ~1.4 oC (to 54.31 ± 0.05 oC); while phytanic acid (a methyl
branched lipid) increased the Tm by ~2 oC (to 54.91 ± 0.08 oC), indicating a less
extensive extent of thermal stabilization mediated by binding of substrates to
CYP124A1.

289
Figure 4.27: DSC analysis of CYP124A1 in substrate-free and substrate-bound forms. DSC experiments are shown for CYP124A1 (8 µM) in the absence of ligand (A), and when bound to cholestenone (30 µM) (B), and phytanic acid (30 µM) (C). Data were collected for 8 μM protein samples using a reference sample containing identical buffer and ligand. Final traces were baseline and concentration corrected, and fitted to a non-2-State equation. The unfolding transition midpoints (Tm values), enthalpy (ΔH) and Van’t Hoff enthalpy (ΔHvH) are summarised in Table 4.7.
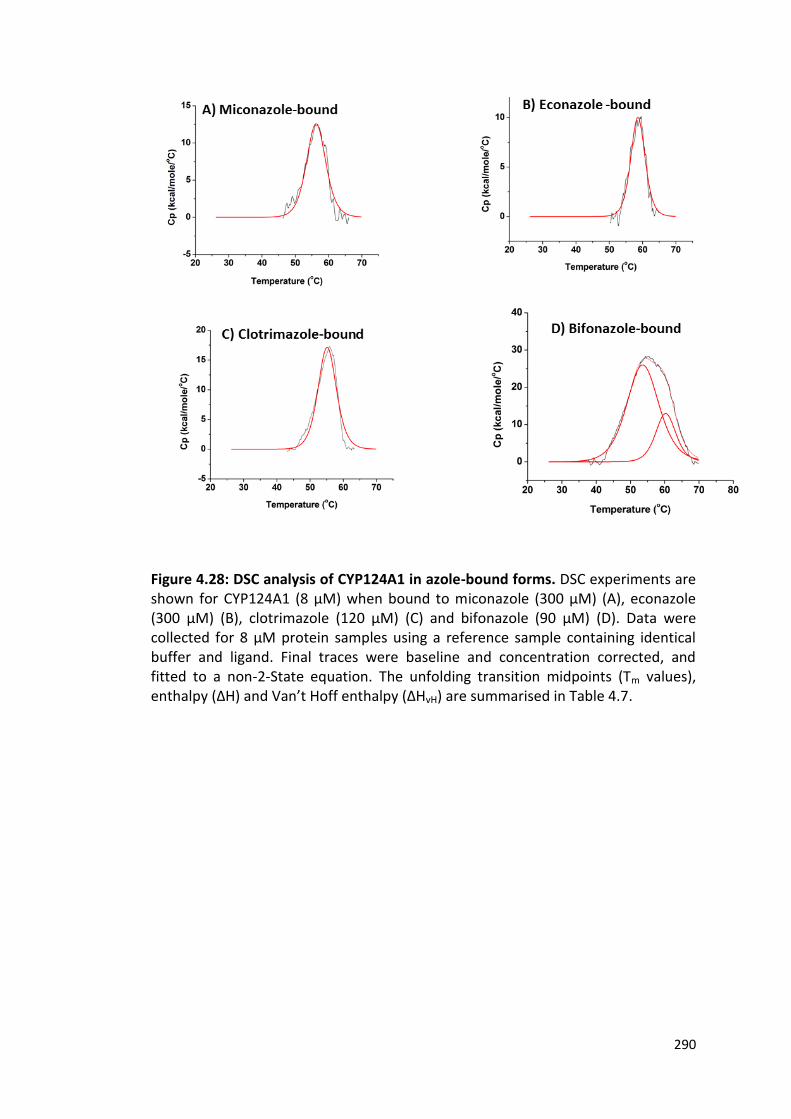
290
Figure 4.28: DSC analysis of CYP124A1 in azole-bound forms. DSC experiments are shown for CYP124A1 (8 µM) when bound to miconazole (300 µM) (A), econazole (300 µM) (B), clotrimazole (120 µM) (C) and bifonazole (90 µM) (D). Data were collected for 8 μM protein samples using a reference sample containing identical buffer and ligand. Final traces were baseline and concentration corrected, and fitted to a non-2-State equation. The unfolding transition midpoints (Tm values), enthalpy (ΔH) and Van’t Hoff enthalpy (ΔHvH) are summarised in Table 4.7.
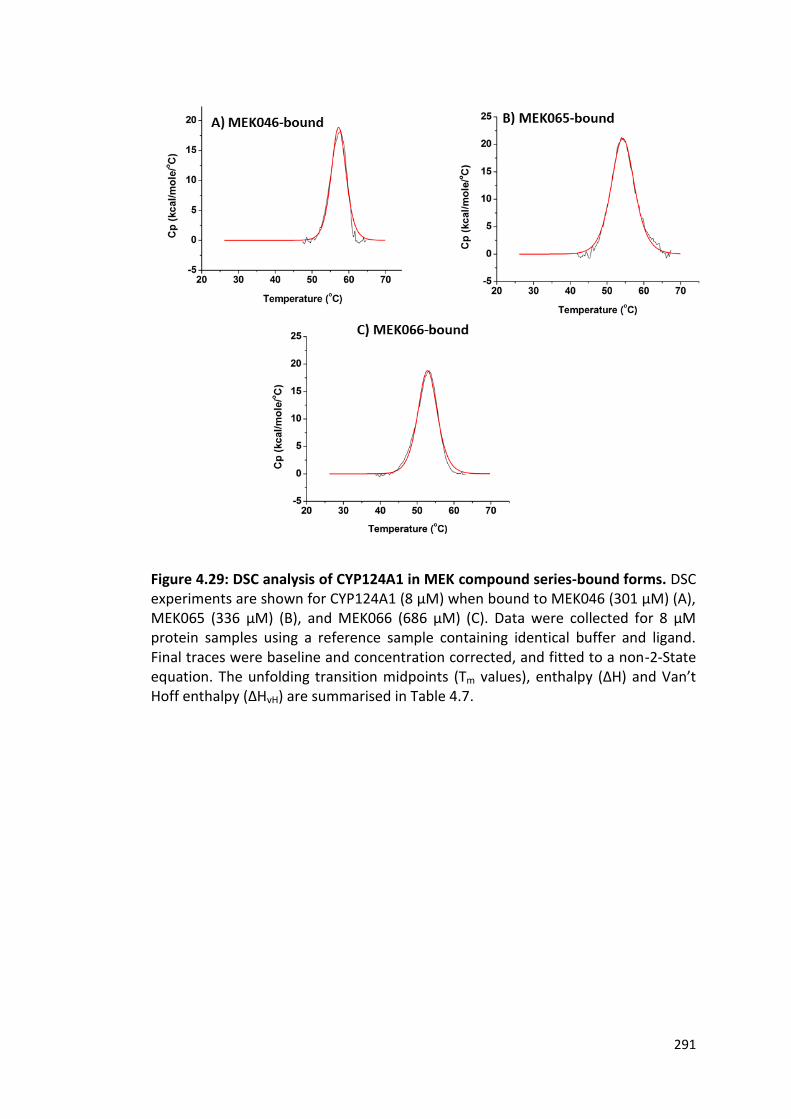
291
Figure 4.29: DSC analysis of CYP124A1 in MEK compound series-bound forms. DSC experiments are shown for CYP124A1 (8 µM) when bound to MEK046 (301 µM) (A), MEK065 (336 µM) (B), and MEK066 (686 µM) (C). Data were collected for 8 μM protein samples using a reference sample containing identical buffer and ligand. Final traces were baseline and concentration corrected, and fitted to a non-2-State equation. The unfolding transition midpoints (Tm values), enthalpy (ΔH) and Van’t Hoff enthalpy (ΔHvH) are summarised in Table 4.7.

292
Figure 4.30: DSC analysis of CYP124A1 in fragment-bound forms. DSC experiments are shown for CYP124A1 (8 µM) when bound to NMR115 (2 mM) (A), NMR415 (1 mM) (B), and MEK066 (50 µM) (C). Data were collected for 8 μM protein samples using a reference sample containing identical buffer and ligand. Final traces were baseline and concentration corrected, and fitted to a non-2-State equation. The unfolding transition midpoints (Tm values), enthalpy (ΔH) and Van’t Hoff enthalpy (ΔHvH) are summarised in Table 4.7.

293
CYP124A1 sample Tm (oC) ∆H ( cal mol-1) ∆HvH ( cal mol-1)
Ligand-free CYP124A1
52.89 ± 0.04 1.30 x 10⁵ ± 9.91 x 10² 6.95 x 10⁴ ± 6.58 x 10²
CYP124A1+ cholestenone
54.31 ± 0.05 1.08 x 10⁵ ± 1.37 x 10³ 9.72 x 10⁴ ± 1.54 x 10³
CYP124A1 + phytanic acid
54.91 ± 0.08 7.87 x 10⁴ ± 1.44 x 10³ 8.14 x 10⁴ ± 1.86 x 10³
CYP124A1 + econazole
58.62 ± 0.05 5.69 x 10⁴ ± 1.06 x 10³ 1.54 x 10⁵ ± 3.59 x 10³
CYP124A1 + Miconazole
56.29 ± 0.06 9.64 x 10⁴ ± 1.8 x 10³ 1.13 x 10⁵ ± 2.61 x 10³
CYP124A1 + clotrimazole
55.18 ± 0.06 1.26 x 10⁵ ± 2.27 x 10³ 1.17 x 10⁵ ± 2.63 x 10³
CYP124A1 + bifonazole
a) 53.68 ± 0.23 b) 60.31 ± 0.17
a) 3.24 x 10⁵ ± 1.52 x 10⁴
b) 1.02 x 10⁵ ± 1.45 x 10⁴ a) 6.82 x 10⁴ ± 1.48 x 10³ b) 1.13 x 10⁵ ± 7.44 x 10³
CYP124A1 + MEK046 57.24 0.04 1.01 x 10⁵ ± 1.51 x 10³ 1.62 x 10⁵ ± 3.04 x 10³
CYP124A1 + MEK065 54.34± 0.02 1.77 x 10⁵ ± 1.14 x 10³ 1.02 x 10⁵ ± 8.12 x 10²
CYP124A1 + MEK066 52.86 ± 0.03 1.32 x 10⁵ ± 1.14 x 10³ 1.2 x 10⁵ ± 1.29 x 10³
CYP124A1 + NMR115
a) 60.43± 0.23 b) 54.38±0.12
a) 3.05 x 10⁴ ± 3.98 x 10³
b) 6.04 x 10⁴ ± 4.07 x 10³ a) 1.48 x 10⁵ ± 1.49 x 10⁴
b) 1.13 x 10⁵ ± 5.47 x 10³
CYP124A1 + NMR415
57.88± 0.05 8.87 x 10⁴ ± 1.83 x 10³ 1.57 x 10⁵ ± 4.03 x 10³
Table 4.7: DSC data for thermal unfolding of CYP124A1. The thermal transition midpoints (Tm values), calorimetric enthalpy (ΔH) and Van’t Hoff enthalpy (ΔHvH) are shown for the individual thermal transition events observed in ligand-free CYP124A1 and various ligand-bound forms of CYP124A1.
4.2.8 Determination of the heme iron redox potentials of
ligand-free and ligand-bound CYP124A1
Redox titrations were carried out for ligand-free, phytanic acid-bound and
econazole-bound forms of CYP124A1 in order to obtain the midpoint potentials for
the heme iron Fe3+/Fe2+ couples (versus NHE). A redox titration with ligand-free
CYP124A1 revealed a shift in the Soret peak from 419 nm (ferric) to 410 nm
(ferrous), with a decrease in intensity of absorption at the reduced peak. Previous
work on CYP121A1 showed a similar shift from 416.5 nm to 407 nm on heme

294
reduction, indicative of the retention of heme thiolate coordination in the ferrous
(reduced) enzyme (McLean et al., 2008).
The inset to Figure 4.28 shows a fit of the redox titration absorbance versus
potential data using the Nernst equation, producing a ligand-free CYP124A1
midpoint potential of -337 ± 4 mV versus NHE. This value is rather more positive
than that for CYP121A1 (−467 ± 5 mV) (McLean et al., 2008), but more negative
than the value obtained for CYP125A1 (−303 ± 5 mV) (McLean et al., 2009),
although this P450 has substantial high-spin content in its resting state. CYP124A1's
potential is in the same range as that for CYP142A1 (−394 ± 4 mV) (see chapter 3 of
this thesis) and P450 BM3 (−427 ± 4 mV) (Ost et al., 2001).
Phytanic acid binding to CYP124A1 generates a substantial shift in the ferric heme
iron spin-state equilibrium toward high-spin (Figure 4.29), and such shifts in spin-
state equilibrium are often accompanied with elevation of the heme iron potential;
i.e. the heme iron develops a more positive potential and becomes easier to reduce
(Bui et al., 2012, Sligar and Gunsalus, 1976). The binding of phytanic acid to
CYP124A1 (Figure 4.29) induced a substantial increase in the heme potential from -
337 ± 4 mV to -230 ± 5 mV, a difference of 107 mV. This difference in potential
between the substrate-free and substrate-bound forms of CYP124A1 is consistent
with the extent of potential change observed for other P450 enzymes that have
been analyzed in their substrate-free and substrate-bound from. These include
CYP51B1 (150 mV positive shift for the Fe3+/Fe2+ couple) (McLean et al., 2006b), and
P450 BM3 (138 mV) (Ost et al., 2001). In prokaryotic P450 enzymes, an electronic
reorganization (in the ferric iron 3d orbitals, from low- to high-spin) is associated
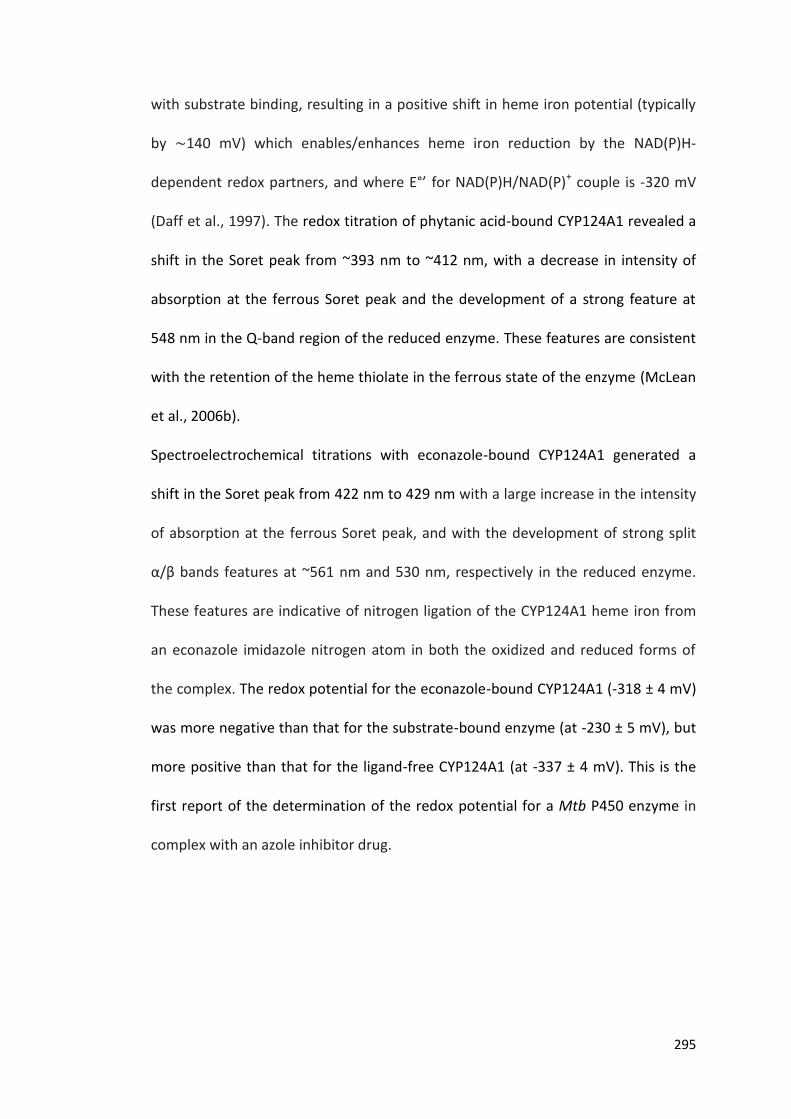
295
with substrate binding, resulting in a positive shift in heme iron potential (typically
by ∼140 mV) which enables/enhances heme iron reduction by the NAD(P)H-
dependent redox partners, and where E°’ for NAD(P)H/NAD(P)+ couple is -320 mV
(Daff et al., 1997). The redox titration of phytanic acid-bound CYP124A1 revealed a
shift in the Soret peak from ~393 nm to ~412 nm, with a decrease in intensity of
absorption at the ferrous Soret peak and the development of a strong feature at
548 nm in the Q-band region of the reduced enzyme. These features are consistent
with the retention of the heme thiolate in the ferrous state of the enzyme (McLean
et al., 2006b).
Spectroelectrochemical titrations with econazole-bound CYP124A1 generated a
shift in the Soret peak from 422 nm to 429 nm with a large increase in the intensity
of absorption at the ferrous Soret peak, and with the development of strong split
α/β bands features at ~561 nm and 530 nm, respectively in the reduced enzyme.
These features are indicative of nitrogen ligation of the CYP124A1 heme iron from
an econazole imidazole nitrogen atom in both the oxidized and reduced forms of
the complex. The redox potential for the econazole-bound CYP124A1 (-318 ± 4 mV)
was more negative than that for the substrate-bound enzyme (at -230 ± 5 mV), but
more positive than that for the ligand-free CYP124A1 (at -337 ± 4 mV). This is the
first report of the determination of the redox potential for a Mtb P450 enzyme in
complex with an azole inhibitor drug.
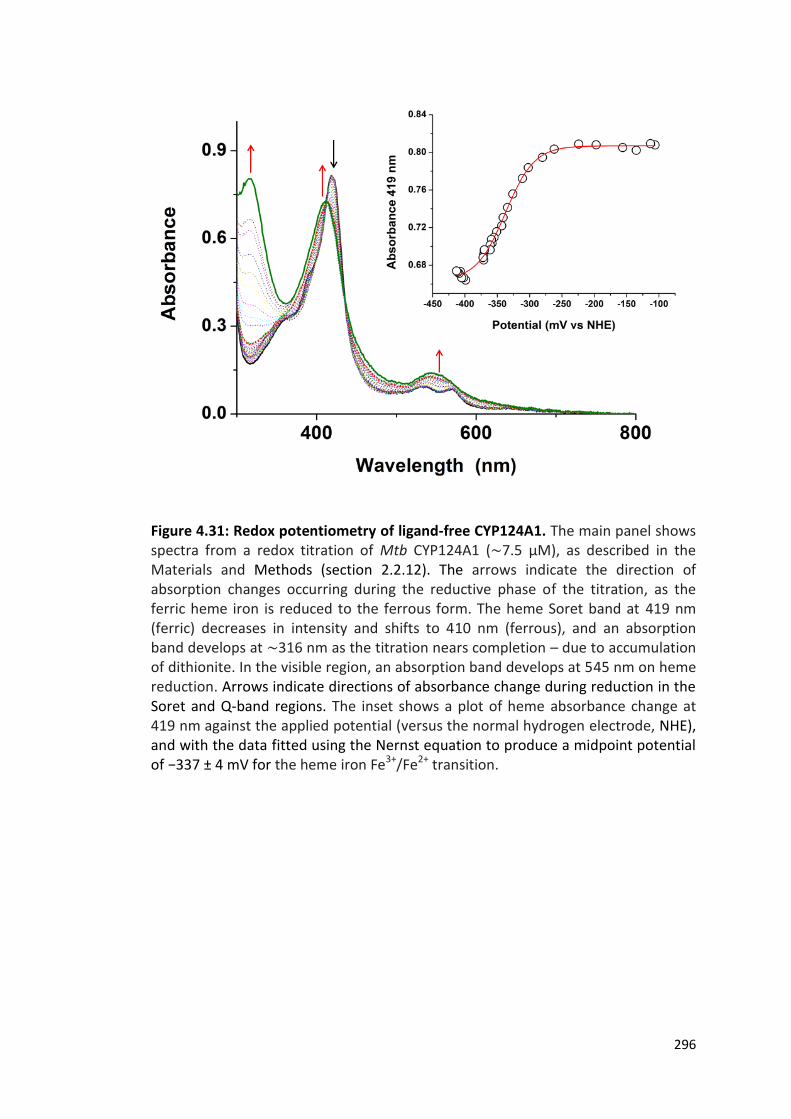
296
Figure 4.31: Redox potentiometry of ligand-free CYP124A1. The main panel shows spectra from a redox titration of Mtb CYP124A1 (∼7.5 μM), as described in the Materials and Methods (section 2.2.12). The arrows indicate the direction of absorption changes occurring during the reductive phase of the titration, as the ferric heme iron is reduced to the ferrous form. The heme Soret band at 419 nm (ferric) decreases in intensity and shifts to 410 nm (ferrous), and an absorption band develops at ∼316 nm as the titration nears completion – due to accumulation of dithionite. In the visible region, an absorption band develops at 545 nm on heme reduction. Arrows indicate directions of absorbance change during reduction in the Soret and Q-band regions. The inset shows a plot of heme absorbance change at 419 nm against the applied potential (versus the normal hydrogen electrode, NHE), and with the data fitted using the Nernst equation to produce a midpoint potential of −337 ± 4 mV for the heme iron Fe3+/Fe2+ transition.
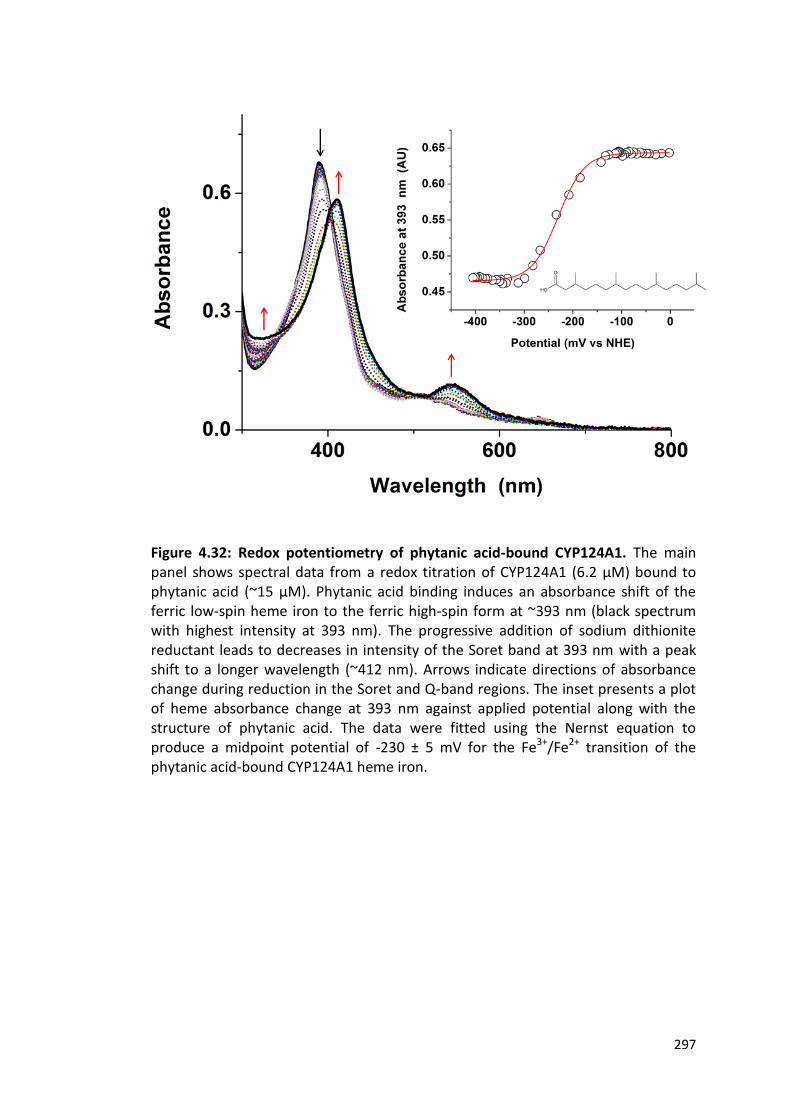
297
Figure 4.32: Redox potentiometry of phytanic acid-bound CYP124A1. The main panel shows spectral data from a redox titration of CYP124A1 (6.2 μM) bound to phytanic acid (~15 μM). Phytanic acid binding induces an absorbance shift of the ferric low-spin heme iron to the ferric high-spin form at ~393 nm (black spectrum with highest intensity at 393 nm). The progressive addition of sodium dithionite reductant leads to decreases in intensity of the Soret band at 393 nm with a peak shift to a longer wavelength (~412 nm). Arrows indicate directions of absorbance change during reduction in the Soret and Q-band regions. The inset presents a plot of heme absorbance change at 393 nm against applied potential along with the structure of phytanic acid. The data were fitted using the Nernst equation to produce a midpoint potential of -230 ± 5 mV for the Fe3+/Fe2+ transition of the phytanic acid-bound CYP124A1 heme iron.

298
Figure 4.33: Redox potentiometry of econazole-bound CYP124A1. The main panel shows spectral data from the redox titration of CYP124A1 (7.5 μM) bound to econazole (~90 μM). Econazole binding induces an absorbance shift of the Soret peak to a longer wavelength (from 419 nm to 422 nm). The progressive addition of sodium dithionite reductant leads to increases in intensity of the Soret band with a further red shift of the peak to 429 nm. Increases in absorbance at ~330 nm are indicative of gradual dithionite accumulation towards the end of the titration. Arrows indicate directions of absorbance change during reduction in the Soret and Q-band regions (at 561 nm and 530 nm). The inset shows a plot of heme absorbance change at 429 nm against applied potential. The data were fitted using the Nernst equation to produce a midpoint potential of -318 ± 4 mV for the Fe3+/Fe2+ transition of the econazole-bound CYP124A1 heme iron. The structure of econazole is also shown in the inset.

299
CYP124A1 sample Midpoint potential vs NHE (mV)
Type of Soret shift
Ligand-free CYP124A1 -337 ± 4 Blue
CYP124A1 + phytanic acid -230 ± 5 Red
CYP124A1 + econazole -318 ± 4 Red
Table 4.8: Redox titration data for CYP124A1. The table shows the midpoint redox potential values for the CYP124A1 heme iron Fe3+/Fe2+ transition in ligand-free and substrate-/inhibitor-bound forms, and the type of Soret shifts occurring during heme iron reduction.
4.2.9 Electron Paramagnetic Resonance (EPR) analysis of CYP124A1
4.2.9.1 EPR analysis with CYP124A1 substrates and azole
inhibitors.
Electron paramagnetic resonance (EPR) is a useful technique for studying transition
metal ions in biological systems (Lowe, 1992). It can also be used to study
aggregation state and heme coordination of metalloproteins. The effects of binding
substrate- and inhibitor-like molecules on the heme coordination of CYP124A1
were investigated. Figure 4.34 shows the EPR spectra for CYP124A1 in the ligand-
free form and in complex with cholesterol, cholestenone and HPCD. Continuous-
wave (CW) X-band EPR data for the various ferric forms of CYP142A1 show the
characteristic rhombic resonance pattern of P450 enzymes, consistent with data
derived from previous studies (Driscoll et al., 2011, McLean et al., 2008).
The ligand-free CYP124A1 EPR spectrum revealed a mixture of low-spin and high-
spin ferric species, consistent with data obtained from UV-visible spectroscopy,
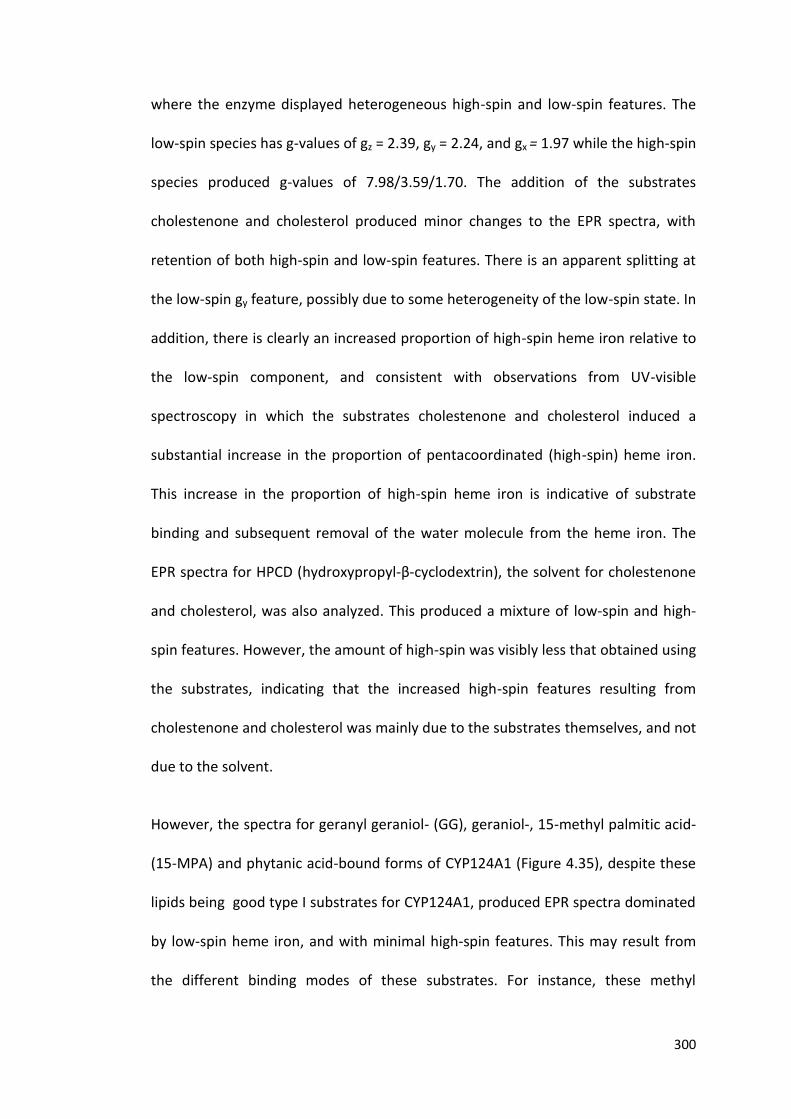
300
where the enzyme displayed heterogeneous high-spin and low-spin features. The
low-spin species has g-values of gz = 2.39, gy = 2.24, and gx = 1.97 while the high-spin
species produced g-values of 7.98/3.59/1.70. The addition of the substrates
cholestenone and cholesterol produced minor changes to the EPR spectra, with
retention of both high-spin and low-spin features. There is an apparent splitting at
the low-spin gy feature, possibly due to some heterogeneity of the low-spin state. In
addition, there is clearly an increased proportion of high-spin heme iron relative to
the low-spin component, and consistent with observations from UV-visible
spectroscopy in which the substrates cholestenone and cholesterol induced a
substantial increase in the proportion of pentacoordinated (high-spin) heme iron.
This increase in the proportion of high-spin heme iron is indicative of substrate
binding and subsequent removal of the water molecule from the heme iron. The
EPR spectra for HPCD (hydroxypropyl-β-cyclodextrin), the solvent for cholestenone
and cholesterol, was also analyzed. This produced a mixture of low-spin and high-
spin features. However, the amount of high-spin was visibly less that obtained using
the substrates, indicating that the increased high-spin features resulting from
cholestenone and cholesterol was mainly due to the substrates themselves, and not
due to the solvent.
However, the spectra for geranyl geraniol- (GG), geraniol-, 15-methyl palmitic acid-
(15-MPA) and phytanic acid-bound forms of CYP124A1 (Figure 4.35), despite these
lipids being good type I substrates for CYP124A1, produced EPR spectra dominated
by low-spin heme iron, and with minimal high-spin features. This may result from
the different binding modes of these substrates. For instance, these methyl

301
branched-lipids may bind more distant from the heme iron compared to
cholestenone, and this could impact greatly on the retention of high-spin heme iron
under the conditions of EPR data collection at 10 K. However, farnesol, phytane and
pristane produced an increase in the proportion of high-spin heme iron relative to
the low-spin component. Form UV-Vis spectroscopy, phytane and pristane showed
low affinity for CYP124A1 as compared to other fatty acids tested; however, this
was not reproduced under the conditions of EPR data collection at 10 K. Addition of
the solvent ethanol (at a final concentration of 1%) perturbs the EPR spectrum and
gives almost complete low-spin signals with g-values of 2.39/2.24/1.93, similar to
the data obtained for geraniol and 15-methyl palmitic acid. This could indicate that
ethanol solvent may have minimal effects on the environment around the heme
iron and the result obtained is due to the effect of the substrates and not the
solvent. EPR studies by Lipscomb on P450cam reported that the signal at g = 1.97 is
unique for a substrate-bound enzyme in which the substrate displaces the water
molecule coordinating the heme iron (Lipscomb, 1980). This postulation is
consistent with data obtained in this study, which revealed CYP124A1 showing a g =
1.97 signal when in complex with cholestenone, cholesterol and some branched-
chain fatty acids. The 1.97/1.98 signal, though present in all the spectra (including
for native CYP124A1 and the solvent control) was found to increase in proportion
with those enzyme-substrate complexes with greater high-spin content. This was
evident for the spectra obtained for cholestenone-, cholesterol-, pristane-, phytane-
, farnesol- and phytanic acid-bound forms of CYP124A1. The proportion of the
1.97/1.98 signal, however, decreased in the enzyme-inhibitor complexes and in
CYP124A1 complexes with substrates that showed more low-spin features.
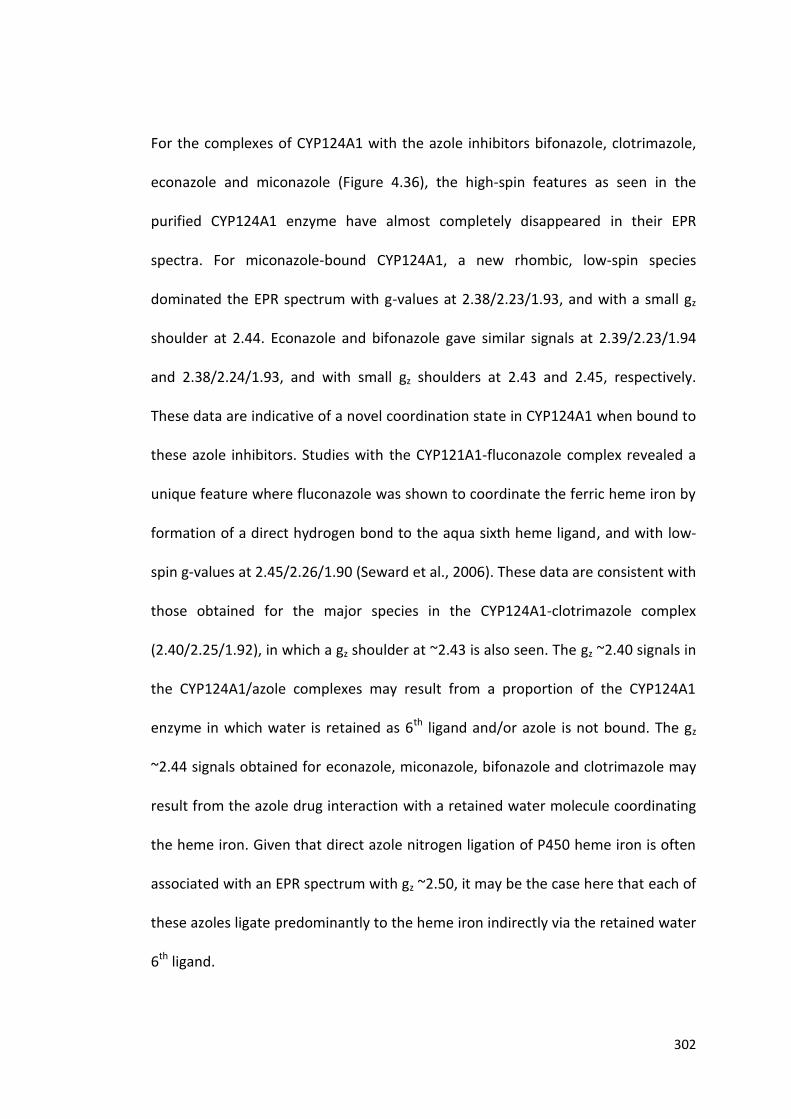
302
For the complexes of CYP124A1 with the azole inhibitors bifonazole, clotrimazole,
econazole and miconazole (Figure 4.36), the high-spin features as seen in the
purified CYP124A1 enzyme have almost completely disappeared in their EPR
spectra. For miconazole-bound CYP124A1, a new rhombic, low-spin species
dominated the EPR spectrum with g-values at 2.38/2.23/1.93, and with a small gz
shoulder at 2.44. Econazole and bifonazole gave similar signals at 2.39/2.23/1.94
and 2.38/2.24/1.93, and with small gz shoulders at 2.43 and 2.45, respectively.
These data are indicative of a novel coordination state in CYP124A1 when bound to
these azole inhibitors. Studies with the CYP121A1-fluconazole complex revealed a
unique feature where fluconazole was shown to coordinate the ferric heme iron by
formation of a direct hydrogen bond to the aqua sixth heme ligand, and with low-
spin g-values at 2.45/2.26/1.90 (Seward et al., 2006). These data are consistent with
those obtained for the major species in the CYP124A1-clotrimazole complex
(2.40/2.25/1.92), in which a gz shoulder at ~2.43 is also seen. The gz ~2.40 signals in
the CYP124A1/azole complexes may result from a proportion of the CYP124A1
enzyme in which water is retained as 6th ligand and/or azole is not bound. The gz
~2.44 signals obtained for econazole, miconazole, bifonazole and clotrimazole may
result from the azole drug interaction with a retained water molecule coordinating
the heme iron. Given that direct azole nitrogen ligation of P450 heme iron is often
associated with an EPR spectrum with gz ~2.50, it may be the case here that each of
these azoles ligate predominantly to the heme iron indirectly via the retained water
6th ligand.
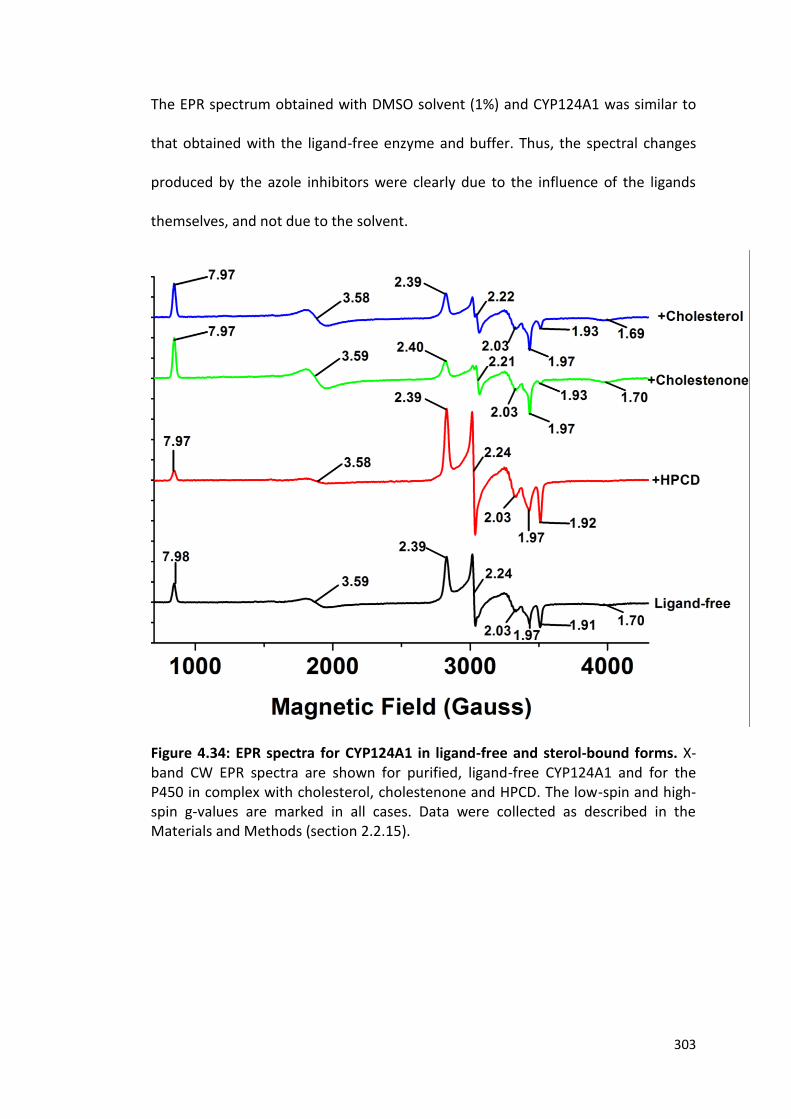
303
The EPR spectrum obtained with DMSO solvent (1%) and CYP124A1 was similar to
that obtained with the ligand-free enzyme and buffer. Thus, the spectral changes
produced by the azole inhibitors were clearly due to the influence of the ligands
themselves, and not due to the solvent.
Figure 4.34: EPR spectra for CYP124A1 in ligand-free and sterol-bound forms. X-band CW EPR spectra are shown for purified, ligand-free CYP124A1 and for the P450 in complex with cholesterol, cholestenone and HPCD. The low-spin and high-spin g-values are marked in all cases. Data were collected as described in the Materials and Methods (section 2.2.15).
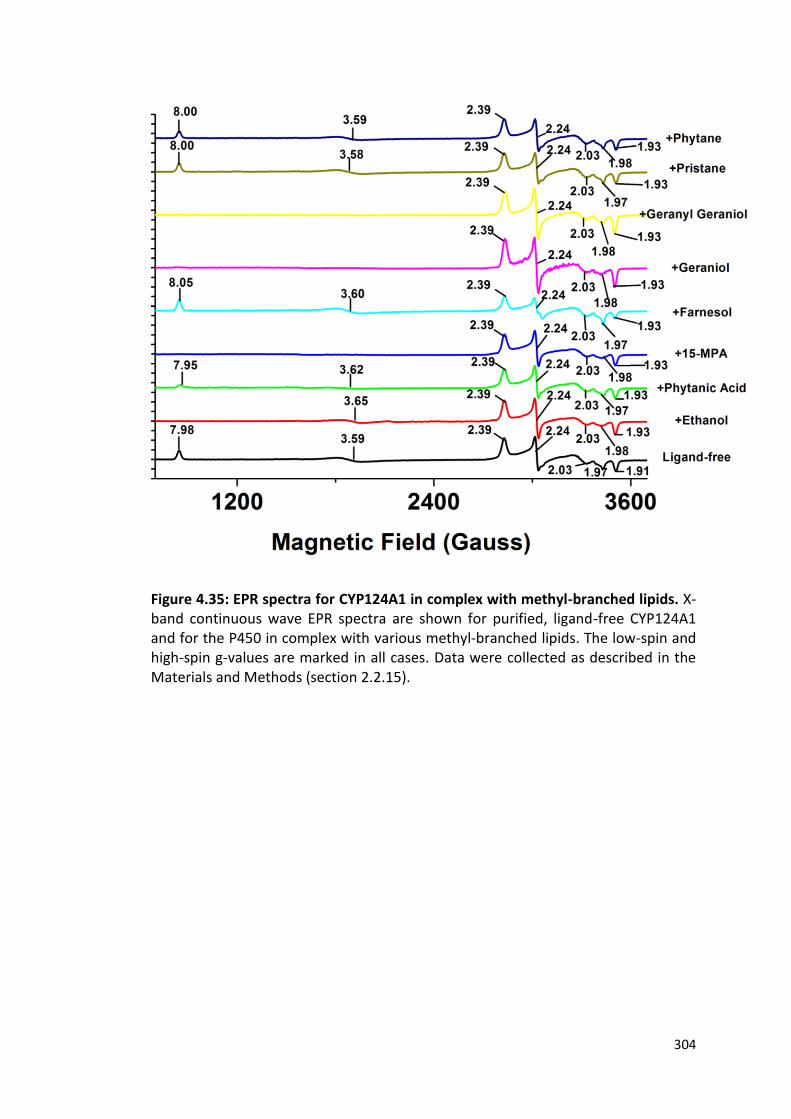
304
Figure 4.35: EPR spectra for CYP124A1 in complex with methyl-branched lipids. X-band continuous wave EPR spectra are shown for purified, ligand-free CYP124A1 and for the P450 in complex with various methyl-branched lipids. The low-spin and high-spin g-values are marked in all cases. Data were collected as described in the Materials and Methods (section 2.2.15).
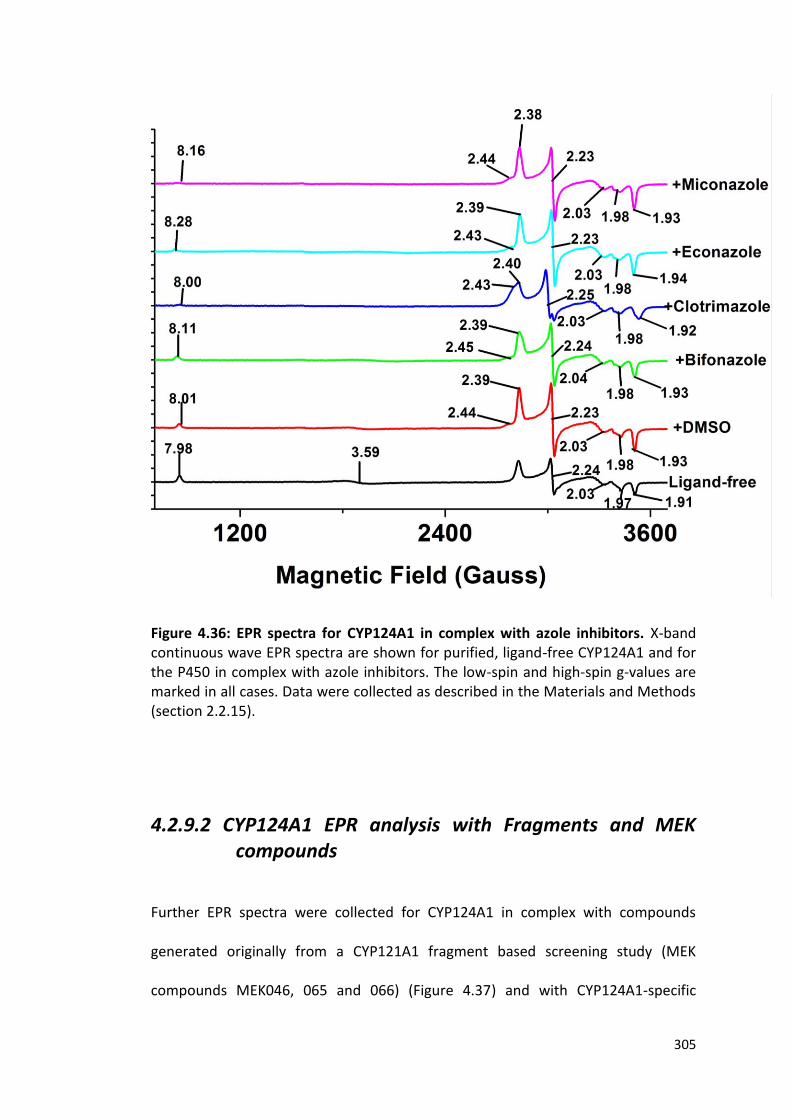
305
Figure 4.36: EPR spectra for CYP124A1 in complex with azole inhibitors. X-band continuous wave EPR spectra are shown for purified, ligand-free CYP124A1 and for the P450 in complex with azole inhibitors. The low-spin and high-spin g-values are marked in all cases. Data were collected as described in the Materials and Methods (section 2.2.15).
4.2.9.2 CYP124A1 EPR analysis with Fragments and MEK
compounds
Further EPR spectra were collected for CYP124A1 in complex with compounds
generated originally from a CYP121A1 fragment based screening study (MEK
compounds MEK046, 065 and 066) (Figure 4.37) and with CYP124A1-specific
306
fragment hits (NMR115, NMR356, NMR415 and NMR515) (Figure 4.38). MEK065-
and MEK066-bound CYP124A1 EPR spectra revealed a mixture of low-spin and high-
spin species, similar to that seen with ligand-free CYP124A1, but with a slightly
lower proportion of the high-spin component. This is consistent with the data
obtained from UV-visible spectroscopy, where these compounds showed a reverse-
type I (R-I) spectral shift, converting high-spin ferric heme iron towards low-spin.
The EPR spectrum for MEK065 in complex with CYP124A1 gave ferric low-spin g-
values at 2.38/2.24/1.93, with minor high-spin features at gz = 8.13 and gy = 3.45.
The CYP124A1/MEK066 complex exhibited a similar spectrum to that for MEK065,
again with minor HS features.
The EPR spectrum for the CYP124A1/MEK046 was distinct from those for the
MEK065/066 complexes. In this case there was a splitting of the gz values, with
components at 2.50/2.25/1.89 (major) and 2.43/2.25/1.91. The gz = 2.50
component is likely due to nitrogen ligation of the heme iron from the MEK046
compound – probably from its pendant imidazole group (see Figure 4.19). Typical gz
values for histidine- or imidazole-coordinated P450s lie in the range from 2.65-2.5
(Dawson et al., 1982). DMSO was used as solvent for these ligands and an EPR
spectrum was also collected for CYP124A1 with DMSO. There was minimal
perturbation of the EPR spectrum in this case, and the g-values were similar to
those for the ligand-free CYP124A1 with pronounced high-spin features with g-
values of gz = 8.0 and gy = 3.57, and a low-spin species with g-values of
2.39/2.23/1.93.
307
The EPR data for CYP124A1-fragment complexes revealed significant heterogeneity
in spin states. The spectrum for CYP124A1-NMR515 complex revealed a mixture of
low-spin and high-spin species. Two low-spin species are observed for the NMR515
and NMR415 complexes with CYP124A1. The NMR515-CYP124A1 species has
heterogeneous low-spin features with g-values at 2.39/2.23/1.93 (major) and
2.44/2.23/2.00 (minor); while the NMR415-CYP124A1 species also shows
heterogeneous low-spin features with g-values at 2.38/2.24/1.90 (major) and
2.47/2.24/1.93 (minor). As with the azole drugs, these data likely reflect the
interactions of ligand nitrogens with the heme iron (directly or indirectly). While
NMR415 showed the highest affinity (among the fragment series) for CYP124A1
from UV-Vis spectroscopic titrations, NMR515 showed no detectable spectral shift
in UV-Vis titrations with this P450; but showed clear perturbation of the CYP124A1
EPR spectrum at 10 K. In the case of both NMR415 and NMR515, it is postulated
that the low-spin species with the higher gz value reflect the direct interaction of
the pyridine and pyrazole nitrogens, respectively, with the CYP124A1 heme iron.
The low-spin species with the lower gz value instead likely involve indirect
interactions of the drugs via a water molecule retained as the 6th ligand on the
CYP124A1 heme iron. The CYP124A1 complex with NMR356 showed almost
complete low-spin features with no splitting of the gz species, similar to the data
obtained for the CYP124A1-clotrimazole complex. It is possible here that this
reflects the direct coordination of the heme iron by the isoquinoline nitrogen in
NMR356. The NMR115-CYP124A1 complex showed almost complete low-spin
features with the major species at 2.39/2.21/1.93 as well with a minor species seen
as shoulder at gz = 2.46. Again, the former (major) species may reflect indirect (via

308
H2O) heme iron coordination, while the latter (minor) species may result from
direct coordination of the heme iron by the NMR115 pyrazole nitrogen.
Figure 4.37: EPR analysis of CYP124A1 bound to MEK ligands. The figure shows both the high-spin and low-spin heme iron regions of the X-band EPR spectrum, with small high-spin features seen for the MEK065/066 complexes – consistent with these drugs causing a reverse type I (R-I) shift in UV-visible titration studies. The heme-coordinating MEK046 removes the entire high-spin component. DMSO solvent alone shows retention of the high-spin component seen in ligand-free CYP124A1, consistent with DMSO not having a major influence on the CYP124A1 spectrum in its own right. Low-spin features for the MEK065/066 complexes are similar to those for ligand-free CYP124A1, as is the spectrum for the DMSO-bound form. The MEK046 spectrum shows a large signal at 2.50/2.25/1.89 – consistent with direct coordination of heme iron via a MEK046 imidazole nitrogen atom. Data were collected as described in the Materials and Methods (section 2.2.15).

309
Figure 4.38: EPR spectra of CYP124A1 bound to specific fragment hits. X-band continuous wave EPR spectra are shown for purified, ligand-free CYP124A1 and for the P450 in complex with selected fragment hits. The low-spin and high-spin g-values are marked in all cases. Data were collected as described in the Materials and Methods (section 2.2.15).
4.3 Summary
The identification of novel sulfated metabolites associated with virulence in
Mycobacterium tuberculosis lipid extracts has driven research towards
identification and characterization of enzymes responsible for the sulfation of these
molecules (Holsclaw et al., 2008). The location of CYP124A1 (rv2266) within the
genome of Mtb is adjacent to a region encoding both CYP128A1 (the product of
gene rv2268c, that hydroxylates menaquinone) and Rv2267c (product of rv2267c,
the sulfotransferase that generates the sulfated menaquinone by transfer of a
310
sulfate group to the hydroxylated menaquinone). As such, characterization of
CYP124A1 may shed more light on the roles of these enzymes in the metabolism of
methyl-branched lipids and other sterols (Johnston et al., 2009). Further, the genes
CYP121A1 (rv2276) and rv2275 are located close by and play important roles in the
synthesis of a cyclic dipeptide (cYY) and its oxidative crosslinking. Thus, this region
of the Mtb genome is particularly important with respect to oxidative catalysis
involving P450 enzymes (Belin et al., 2009, Vetting et al., 2010).
In this chapter, I report the expression, biophysical and biochemical
characterization of CYP124A1. Optimal protein expression was achieved using the
C41 (DE3) E. coli strain with transformant cells grown in 2YT medium, and
CYP124A1 purification to homogeneity was done via three chromatographic steps,
similarly to the method used for CYP142A1. Optical titrations revealed a high
affinity for cholesterol, cholestenone and methyl branched lipids, further validating
its role as a cholesterol oxidase and a methyl-branched lipid hydroxylase. This wide
spectrum of substrate specificity is indicative of important physiological and
catalytic roles in Mtb. CYP124A1 also demonstrated affinity for a range of azole
inhibitors, some of which have been shown to clear Mtb infection in a mouse model
(Ahmad et al., 2006c). The order of potency of the azole inhibitors (section 1.5.9)
for binding to the Mtb CYP124A1 enzyme (Table 4.2) showed a similar pattern to
that observed with CYP142A1 with clotrimazole (Kd = 4.78 M, MIC = 11 g ml-1 for
Mtb H37Rv) having the tightest Kd among drugs with validated MIC values; followed
by econazole and miconazole (Kd = 18.6 and 19.6 M, respectively; with MIC = 8 g
ml-1 for Mtb H37Rv in both cases) and ketoconazole (Kd = 71 M, MIC = 16 g ml-1

311
for Mtb H37Rv ). The general affinity of binding of these azole drugs to CYP124A1 is
weaker than seen for CYP142A1, but the pattern of affinity continues to resemble
that of CYP142A1 with fluconazole binding substantially more weakly than these
other azoles to CYP124A1, to the extent that neglible heme absorbance shift is
observed with fluconazole. The structurally related triazole voriconazole also binds
very weakly to CYP124A1 (Kd = 959 M). However, bifonazole binds much tigher (Kd
= 0.19 M), albeit it causing a type I (substrate-like) shift rather than inhibiting
CYP124A1 by heme iron coordination. Thus, CYPs 142A1 and 124A1 show a similar
pattern of affinity for various azoles with validated MIC values for Mtb H37Rv, likely
consistent with their similar active site architecture that allows
cholesterol/cholestenone binding in both cases.
One of the aims of the fragment based screening approach used in our studies of
Mtb P450 enzymes is to identify commonalities among the cholesterol oxidase
P450 enzymes which could be exploited to develop potent and specific inhibitors
that recognize the CYP124A1, CYP125A1 and CYP142A1 P450 isoforms. These
inhibitors potentially could block completely the utilization of host cholesterol for
energy generation by Mtb during infection. Interestingly, in this work, fragments
that bind each of the three P450 isoforms were identified, and these could be
considered a starting point for fragment merging/linking/growing to produce more
potent inhibitors.
A typical spectrum for CYP124A1 is that of a low-spin, hexa-coordinated P450
enzyme with its Soret peak at 418 nm in its native resting state, but with a shoulder

312
at ~394 nm indicative of the presence of a proportion of a high-spin species. This
proportion of high-spin was taken into account when the extinction coefficient was
determined for CYP124A1. Formation of a ferrous-CO adduct is a characteristic
property for P450 enzymes, and this adduct has an absorption maximum close to
450 nm – providing the basis for the nomenclature of this enzyme superfamily
(Omura and Sato, 1964). CYP124A1 formed a CO-adduct at 450 nm (thiolate-
coordinated P450) which was moderately unstable and partially collapsed towards
the P420 form (thiol-coordinated) after a period of several minutes, indicating the
sensitivity of the proximal cysteinate ligand to protonation in the ferrous-CO state.
Steady-state kinetics for CYP124A1 were analysed using a series of substrates, and
the rate constants for substrate-dependent NADPH oxidation were determined
using two sets of redox partners, referred to as the ‘E. coli’ (E. coli flavodoxin
reductase and flavodoxin) and ‘Spinach’ (E. coli flavodoxin reductase and spinach
ferredoxin) systems in this project. The kinetics of NADPH oxidation were faster
using the spinach system, with phytanic acid showing the highest kcat values from
both redox partner systems, suggesting that this should be the best substrate
tested for CYP124A1.
Light scattering analysis showed CYP124A1 to be essentially completely monomeric
in solution. This is an important and desirable property for its successful
crystallization. Stability studies were also performed with DSC, in order to probe the
robustness of the enzyme and its stabilization by the binding of ligands/substrates.
The Tm value for ligand-free CYP124A1 was determined to be 52.9 oC. The type II
313
inhibitors (econazole, miconazole, MEK046 and NMR415) produced a considerable
increase in Tm by values of ~3 to 6 oC, indicating a considerable stabilizing effect
induced by the binding of these type II azoles. However, the substrates
cholestenone and phytanic acid showed lower stabilizing effects on CYP124A1, with
Tm increases of ~2 oC.
The midpoint heme iron potential for the ligand-free CYP124A1 P450 enzyme was
found to be quite negative (-337 ± 4 mV), and the Soret band was seen to shift to
shorter wavelength on heme iron reduction (a blue shift, and consistent with
retention of the cysteine thiolate ligation). The CYP124A1 redox potential was
elevated by ~107 mV on binding the substrate phytanic acid, a result consistent
with that observed for a number of other P450 enzymes on binding their substrates
(Ost et al., 2001, McLean et al., 2006b). This elevation in potential enables the P450
to accept electrons from NAD(P)H-dependent redox partners. The redox potential
for the econazole-bound CYP124A1 (-318 ± 4 mV) was more negative than that for
the substrate-bound enzyme, but more positive than that for the ligand-free
enzyme, despite the fact that econazole-bound CYP124A1 has a nitrogen ligand in
the distal position on the heme iron, and that this is not displaced on heme iron
reduction.
EPR analysis confirmed heterogeneity in the CYP124A1 heme iron spin-state, as also
observed by UV-visible spectroscopy. The ligand-free CYP124A1 enzyme displayed
mixed-spin character at both cryogenic temperatures (needed for EPR) and at
ambient temperature (for UV-visible spectroscopy). Interestingly, the binding of

314
some methyl-branched lipid substrates (geranyl geraniol (GG), geraniol, 15-methyl
palmitic acid (15-MPA) and phytanic acid) diminished the high-spin content of
CYP124A1 in EPR analysis (despite increasing high-spin content by UV-visible
spectroscopy at ambient temperature). In contrast, EPR analysis of the
CYP124A1/cholestenone and cholesterol complexes showed some enhancement of
the high-spin content, suggesting different binding modes of these substrates to
CYP124A1. However, retention of a substantial high-spin component in substrate-
bound P450s by EPR can vary considerably between different P450s with different
substrates, due primarily to the fact that these studies are typically done at ~10 K
and since the P450 high-spin/low-spin equilibrium is dependent on temperature.
With the azole inhibitors econazole, clotrimazole and miconazole, CYP124A1 high-
spin content was essentially completely removed, and a new low-spin EPR
spectrum appeared that was consistent with distal nitrogen ligation of the heme
iron, as also inferred from binding studies by UV-visible spectroscopy at ambient
temperature. This is also consistent with the data obtained with the CYP124A1-
specific fragments hits NMR115, NMR356 and NMR415.
Collectively, these studies on CYP124A1 have provided novel data on its
thermodynamic, spectroscopic and catalytic features, including quantification of
the productive interactions of this P450 with a variety of substrates, inhibitors and
ligands identified from fragment screening studies. In the next chapter, this work is
extended into analysis of the structural properties of both CYP124A1 and CYP142A1
enzymes in complex with novel substrates and other ligands.
315
Chapter 5
Structural biology of ligand-bound complexes of the
cholesterol oxidising P450s CYP142A1 and CYP124A1
5.1 Introduction
Structural biology has emerged as an important tool for the design of new
therapeutics (Malito et al., 2015). A combination of synthetic chemistry and
structural biology of CYP121A1 has played a major role in the fragment based drug
design of potent inhibitors against this enzyme (Hudson et al., 2012b) and this
approach has been extended to other Mtb P450 isoforms. The use of X-ray
crystallography for determining protein structure, for understanding protein
function and for structure-guided design of small-molecule drugs is well
documented, and includes several significant success stories with a large number of
protein structures now available in the protein data bank (PDB) (Malito et al., 2015,
Scapin, 2013). However, despite significant technical advances, the generation of
high-quality crystals for protein X-ray crystallography undoubtedly remains the
major bottleneck in structure determination (Malito et al., 2015).
From the previous chapters in this thesis, CYP124A1 and CYP142A1 were shown to
bind cholesterol/cholestenone (and methyl-branched lipids for CYP124A1) with
high affinities, consistent with their role in sterol metabolism and (for CYP124A1)
oxidation of branched chain lipids. Data presented in chapters 3 and 4 demonstrate
the purification of both of these P450s, leading to the production of highly pure
P450 forms suitable for crystallization both in their ligand-free and ligand-bound

316
states. In this chapter, additional data was sought from structural biology (X-ray
crystallography) to provide further insights into the three dimensional structures of
these P450s and how they adapt on binding substrate and inhibitors. These data
would be crucial in ongoing efforts to generate effective inhibitors of the Mtb
cholesterol/cholestenone metabolising P450s using a fragment based approach. For
this reason, crystallographic trials were undertaken using cholestenone as well as
the tight-binding azole inhibitor econazole and a variety of fragment molecules.
Both cholestenone and cholesterol are excellent substrates for CYP124A1 and
CYP142A1, and these molecules are considered to be the natural substrates used in
vivo by both CYP142A1 and CYP125A1, as well as being good substrates for
CYP124A1 (Johnston et al., 2010). The pathway for Mtb-dependent catabolism of
cholesterol/cholestenone is shown in Figure 1.27 in Chapter 1 (Ouellet et al., 2011).
For those Mtb P450s implicated in cholesterol oxidation, crystals structures are
available for CYP124A1, CYP125A1 and CYP142A1. The crystal structures of
CYP125A1 in complex with cholestenone (Ouellet et al., 2010a) and econazole
(McLean et al., 2009) were determined. In the case of CYP124A1, both ligand-free
and phytanic acid-bound forms have been solved previously by Johnston et al.
(Johnston et al., 2009) but, prior to the start of this project, the structure of the
complex with cholest-4-en-3-one (cholestenone) was not resolved. In the case of
CYP142A1, the ligand-free structure was resolved in our group. However, efforts to
obtain a ligand-bound form of the enzyme were unsuccessful, due to the binding of
a PEG molecule present in the mother liquor (Driscoll et al., 2010).

317
Structural studies at both the amino acid sequence and tertiary structure level have
provided important insights into the common function and evolutionary origins of
these Mtb cholesterol-oxidase P450 enzymes. It is likely that the differences in
substrate specificity between these enzymes are a consequence of the disparity in
the shape and chemical composition of their respective active sites (Driscoll et al.,
2010). A superimposition of CYP142A1 with the cholestenone-bound CYP125A1
complex (PDB code 2X5W) (Ouellet et al., 2010a) reveals that the active site of
CYP142A1 could provide sufficient space for a cholesterol-like substrate, oriented in
a similar position as that observed in CYP125A1 (Driscoll et al., 2010). However, it
was suggested that it was unlikely for cholesterol to bind to CYP124A1 in the same
orientation, due to the non-complementary shape of the entry of the active site
channel. In this chapter, work is done to explore the structural properties of
different ligand- and substrate-bound complexes of CYP124A1 and CYP142A1.
These studies are aimed at providing a more in-depth understanding of substrate
binding in the Mtb P450s that are implicated in cholesterol oxidation.
5.2 Results and Discussion 5.2.1 X-ray Crystallographic Studies and Structure
Determination for CYP142A1 and CYP124A1 CYP142A1 and CYP124A1 were purified to homogeneity via three chromatographic
steps as described in the Materials and Methods (sections 2.2.6). These steps were
necessary for successful crystallization and structure determination. In this study,
the crystal structures of CYP142A1 in complex with cholestenone, econazole and
318
fragment hits were determined, as well as that of CYP124A1 in complex with
cholestenone.
The X-ray data for the complexes were scaled and integrated using the Xia 2
package (Kabsch, 1993). Structures were solved by molecular replacement (McCoy
et al., 2007) with the previously solved CYP142A1 crystal structure as a search
model (PDB 2XKR). The structures were built using COOT (Emsley and Cowtan,
2004) in conjunction with MOLPROBITY (Davis et al., 2007) and refined using Phenix
(Adams et al., 2010). The data collection and refinement statistics are shown in
Table 5.1 and 5.2.

319
Data collection CYP142A1:
cholestenone
CYP124A1:
cholestenone
Space group P21212 P212121
Cell dimensions
a, b, c (Å) 65.81 128.13
146.60
46.96 81.35
148.21
Resolution (Å) 58.7-2.09
(2.12-2.09)
74.11-2.65
(2.72-2.65)
Rmeas 0.224 (1.464) 0.163 (0.984)
I/σI 6.0 (1.3) 11.9 (2.2)
Completeness (%) 99.89 (100) 99.86 (97.6)
Redundancy 6.6 7.1
Refinement
No. of reflections 74167 16309
Rwork/Rfree 0.216/0.246
(0.314/0.347)
0.218/0.257
(0.343/0.375)
No. atoms 6811 3510
B-factors (Å2) 28.45 40.2
R.m.s. deviations
Bond lengths (Å) 0.03 0.013
Bond angles (°) 0.802 1.543
Table 5.1: X-ray data collection and refinement statistics for CYP142A1- and CYP124A1- cholestenone complexes

320
Data collection CYP142A1: econazole CYP142A1:NMR623 CYP142A1:NMR170 CYP142A1:NMR491 CYP142A1:1-
phenylimidazole
Space group C222 P212121 P212121 P212121 P212121
Cell dimensions
a, b, c (Å) 117.90 185.22 57.58 55.71 65.77 131.81 55.52 65.72 130.57 56.04 65.74 129.44 55.62 65.62
129.06
Resolution (Å) 30.77-2.12
(2.15-2.12)
22.4-2.00
(2.059-2.00)
65.285-1.70
(1.73-1.70)
58.64-1.91
(1.94-1.91)
51.12 – 1.34
(1.355-1.34)
Rmeas 0.085 (0.670) 0.062 (0.701) 0.057 (0.756) 0.102 (0.748) 0.099 (0.753)
I/Σi 11.4 (2.1) 21.6 (3.4) 22.3 (2.7) 14.1 (2.7) 10.5 (2.4)
Completeness (%) 99.89 (100) 99.86 (97.6) 99.89 (100) 99.86 (97.6) 99.89 (100)
Redundancy 3.4 8.9 8.6 6.6 5.9
Refinement
No. of reflections 67981 33457 53352 37809 105716
Rwork/Rfree 0.1926/0.2246
(0.2633/0.2905)
0.181/0.221
(0.233/0.289)
0.169/0.199
(0.253/0.311)
0.169/0.196
(0.265/0.337)
0.188/0.207
(0.276/0.288)
No. atoms 7582 3405 3597 8054 3672
B-factors (Å2) 29.281 38.85 25.61 14.059 13.35
R.m.s. deviations
Bond lengths (Å) 0.008 0.006 0.007 0.008 0.007
Bond angles (°) 1.089 0.982 1.055 1.066 1.158
Table 5.2: X-ray data collection and refinement statistics for CYP142A1- econazole/fragment complexes
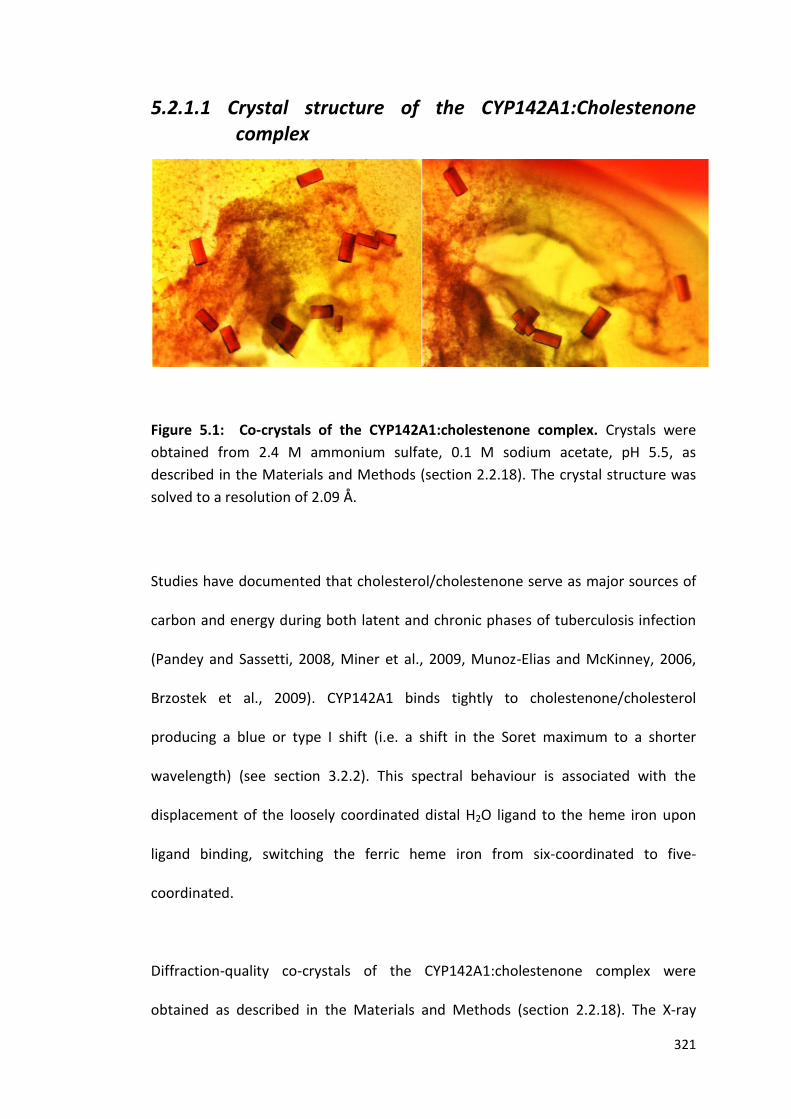
321
5.2.1.1 Crystal structure of the CYP142A1:Cholestenone complex
Figure 5.1: Co-crystals of the CYP142A1:cholestenone complex. Crystals were
obtained from 2.4 M ammonium sulfate, 0.1 M sodium acetate, pH 5.5, as
described in the Materials and Methods (section 2.2.18). The crystal structure was
solved to a resolution of 2.09 Å.
Studies have documented that cholesterol/cholestenone serve as major sources of
carbon and energy during both latent and chronic phases of tuberculosis infection
(Pandey and Sassetti, 2008, Miner et al., 2009, Munoz-Elias and McKinney, 2006,
Brzostek et al., 2009). CYP142A1 binds tightly to cholestenone/cholesterol
producing a blue or type I shift (i.e. a shift in the Soret maximum to a shorter
wavelength) (see section 3.2.2). This spectral behaviour is associated with the
displacement of the loosely coordinated distal H2O ligand to the heme iron upon
ligand binding, switching the ferric heme iron from six-coordinated to five-
coordinated.
Diffraction-quality co-crystals of the CYP142A1:cholestenone complex were
obtained as described in the Materials and Methods (section 2.2.18). The X-ray

322
crystal structure of the CYP142A1: cholestenone complex was determined to a
resolution of 2.09 Å. The asymmetric unit contains a CYP142A1 dimer with
cholestenone molecules (Figure 5.2) positioned in an orientation relative to the
heme which is similar to that of the previously published cholestenone structures in
complex with CYP125A1 (Ouellet et al., 2010a) (PDB code 2X5W), CYP142A2
(Garcia-Fernandez et al., 2013) (PDB code 2YOO), and CYP142A2 in complex with
cholesterol sulfate (Frank et al., 2014) (PDB code 4TRI) (see Figures 5.3 and 5.4).
Figure 5.2: Overall view of the CYP142A1 cholestenone-bound complex (dimer). The crystal structure of CYP142A1 is shown in complex with cholestenone, with the H-, G- and I-helices coloured in blue, green and pink, respectively. Cholestenone is highlighted in cyan and yellow spacefill with the heme prosthetic groups in red spacefill. Cholestenone is bound within the active site tunnel with the aliphatic side-chain
facing the distal surface of the heme cofactor, and the 3-keto group pointing
towards the protein surface (Figure 5.3). The active site cavity becomes more

323
narrow directly above the heme (i.e. at the catalytic site), to tightly accommodate
the aliphatic side-chain of cholestenone. Cholestenone bound in the active site
makes contact with a series of hydrophobic and polar amino acid residues, as
depicted in Figure 5.4.
It has been documented that the crystal structures of CYP125A1 reveal an active
site entirely enclosed within the protein interior (McLean et al., 2009). However,
this is in contrast to the active site of the cholestenone-bound CYP142A1, where
the carbonyl/keto group of cholestenone remains exposed to the bulk solvent
(Figure 5.3). This difference in topology could explain compensatory or additional
roles linked to CYP142A1 with respect to this P450 metabolizing a pool of sterol
derivatives that are inaccessible to CYP125A1 (Frank et al., 2014). CYP142A1
positions cholestenone such that the aliphatic side chain -terminal carbon is in
close proximity to the heme iron, an alignment favourable for C27-hydroxylation.
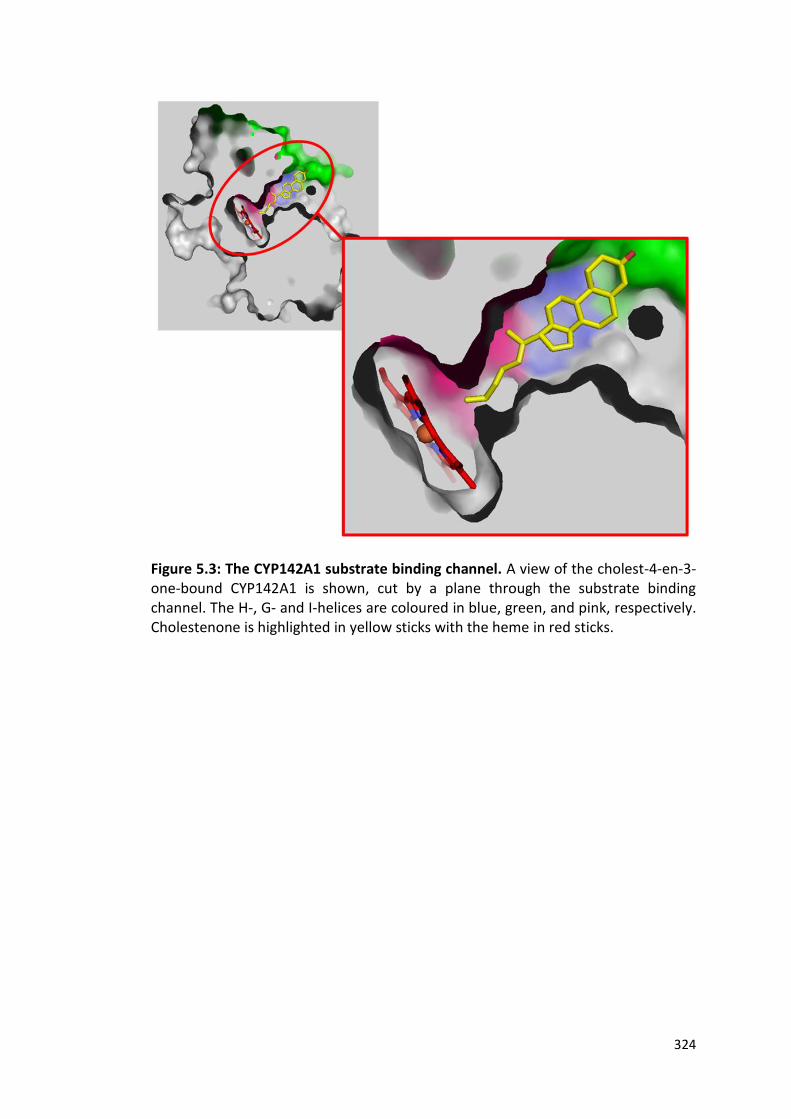
324
Figure 5.3: The CYP142A1 substrate binding channel. A view of the cholest-4-en-3-one-bound CYP142A1 is shown, cut by a plane through the substrate binding channel. The H-, G- and I-helices are coloured in blue, green, and pink, respectively. Cholestenone is highlighted in yellow sticks with the heme in red sticks.

325
Figure 5.4: Overview of the CYP142A1-cholestenone binding pocket. Key residues contacting the cholestenone substrate are shown in atom coloured sticks. The heme cofactor is shown with red sticks. For clarity, main chain atoms have been removed. The distances between the C26/C27 terminal carbons and the heme iron are approximately 5.8 Å and 4.3 Å, respectively.
Two terminal methyl groups of the alkyl side chain are positioned at 4.3 Å and 5.8 Å
from the heme iron centre, and interact with Ile76 and Ile65. The alkyl side chain is
positioned well for CYP142A1-mediated oxidation, which is a critical step for
cholestenone ring degradation and for subsequent β-oxidation reactions to
catabolise the steroid (Ouellet et al., 2011). The keto group of cholestenone resides

326
at the more hydrophilic end of the substrate binding tunnel and is surrounded by
the residues Met176, Pro179, Thr175 and Gly69.
Figure 5.5: Superimposed structures of ligand-free and cholestenone-bound CYP142A1. The structures are shown with the common P450 secondary structure elements labelled. The protein backbone is depicted by coloured ribbon, with cholestenone in green spacefill and the heme in red sticks. The I-, G- and H-helices (grey for ligand-free and blue for cholestenone-bound forms) undergo conformational change upon substrate binding.
A protein conformational change is observed upon cholestenone binding (Figure
5.5) and includes repositioning of the I-, G- and H-helices to accommodate the
substrate in the active site and to establish hydrophobic contacts with the ligand.
The substrate-induced reorganization of secondary structure elements is largely
confined to the regions typically involved in P450 ligand binding (Poulos and
Johnson, 2005).

327
Substrate-bound CYP142A1 reveals a more open conformation than the substrate-
free form, with the G-, H- and I-helices positioned further from the protein core to
accommodate the substrate molecule. This is consistent with similar structural
reorganizations observed for cholestenone-bound CYP142A2 (Garcia-Fernandez et
al., 2013) and cholestenone-bound CYP125A1 (Ouellet et al., 2010a).
5.2.1.2 Crystal structure of the CYP124A1:Cholestenone complex
CYP124A1 oxidizes methyl-branched chain lipids (Johnston et al., 2009).
Cholesterol/cholestenone has a terminal methyl-branched side chain similar to the
methylated fatty acid substrates of CYP124A1, and a superimposition of the
substrate-bound CYP124A1 structure with CYP142A1 reveals a similar active site
conformation (Driscoll et al., 2010).
Figure 5.6: Co-crystals of the CYP124A1:cholestenone complex. Crystals were
obtained from 0.3 M magnesium formate dihydrate, 0.1 M bis-Tris propane, pH 5.5
as described in the Materials and Methods (section 2.2.18). The crystal structure
was solved to a resolution of 2.54 Å.

328
Diffraction-quality co-crystals of cholestenone bound-CYP124A1 where generated
as described in the Materials and Methods (section 2.2.18). The X-ray crystal
structure of the CYP124A1–cholestenone complex was determined to a resolution
of 2.54 Å. The crystal structure of the CYP124A1:cholestenone complex provides
important insight into how the enzyme catalyses -hydroxylation. A cholestenone
ligand is observed bound to protein in a similar binding orientation as that
previously observed for phytanic acid in complex with CYP124A1 (PDB code 2WM4)
(Johnston et al., 2009) (Figure 5.11). However, this means that CYP124A1 displays a
slightly different binding mode for cholestenone relative to the other cholestenone-
Mtb P450 complexes reported (Figure 5.14). The cholestenone-bound Mtb
CYP124A1 structure reveals a more ‘open’ conformation than the substrate-free
enzyme, which is due to the repositioning of the F-, G-, D- and I-helices (Figure 5.8).
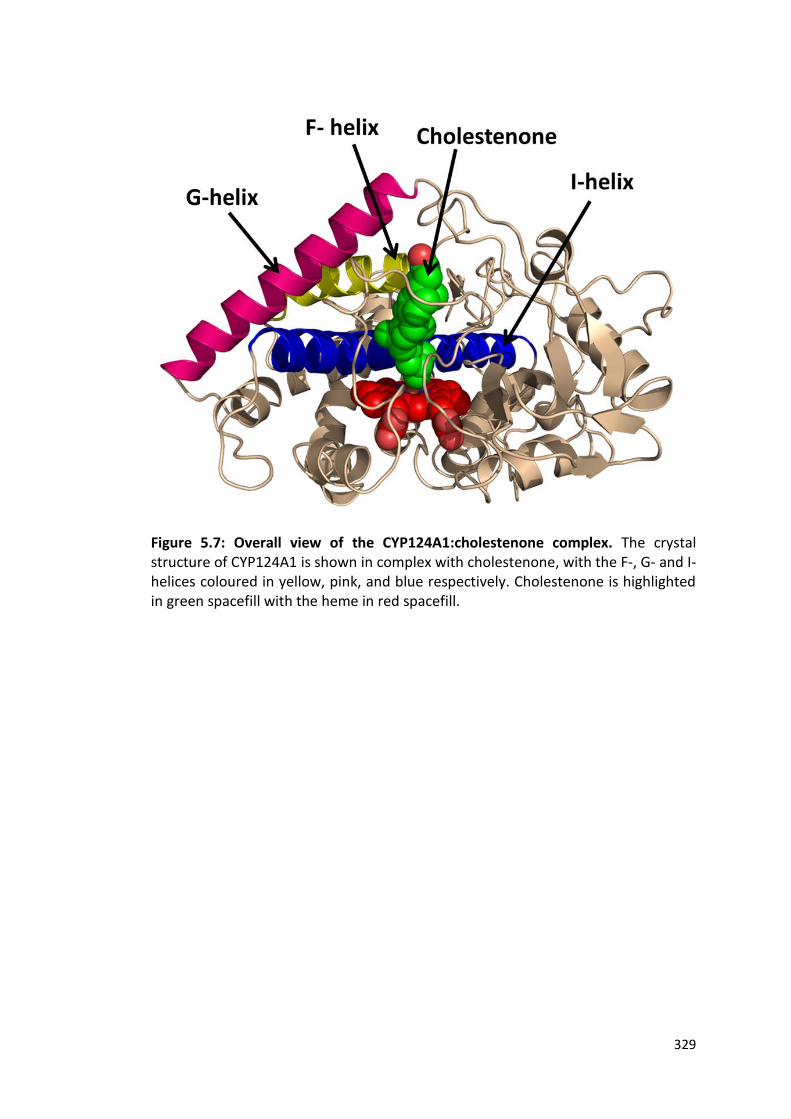
329
Figure 5.7: Overall view of the CYP124A1:cholestenone complex. The crystal structure of CYP124A1 is shown in complex with cholestenone, with the F-, G- and I-helices coloured in yellow, pink, and blue respectively. Cholestenone is highlighted in green spacefill with the heme in red spacefill.

330
Figure 5.8: Superimposed structures of ligand-free and cholestenone-bound forms of CYP124A1. The structures are shown with the common P450 secondary structure elements labelled. The protein backbone is depicted by coloured ribbons, with the cholestenone in cyan spacefill and the heme in red sticks. The pink (ligand-free) and grey (cholestenone-bound) structural elements undergo conformational change upon substrate binding.

331
Figure 5.9: The CYP124A1 substrate binding channel. A view of the CYP124A1:cholestenone complex active site region is shown, cut by a plane through the substrate-binding channel. Cholestenone is represented with green sticks with the heme in red spheres. The F-, G- and I-helices are highlighted in blue, yellow, and pink respectively.

332
Figure 5.10: Overview of the CYP124A1-cholestenone binding pocket. Key residues contacting the cholestenone moiety are shown in atom coloured sticks, the heme cofactor is shown with red sticks and pyrrole nitrogens in blue. The cholestenone is in green with its keto group in red. For clarity, main chain atoms have been removed. The distances between the C26/C27 terminal carbons and the heme iron are approximately 6.3 Å and 4.1 Å, respectively.
The active site of the cholestenone-bound CYP124A1 reveals a channel enclosed
within the protein interior, consistent with that previously documented for
CYP125A1 (McLean et al., 2009). This could be attributed to the evolutionary
relationships between CYP124A1 and CYP125A1; two P450s that share relatively
high sequence identity (40.7%) identity over 428 residues (Driscoll et al., 2010).
333
Cholestenone-binding generates a conformational reorganization of those
secondary structural elements typically involved in the formation of the active site
and substrate-recognition region in P450s. This reorganization is typified by a ‘kink’
or ‘bend’ in the F-, G- and I -helices to enclose the substrate in the active site
(Figure 5.8).
The terminal methyl groups of cholestenone are at 4.1 Å and 6.3 Å away from the
high-spin heme iron, and thus appropriately positioned for -oxidation (Figure
5.10). The reorganization of the secondary structure elements on substrate binding
provides many hydrophobic interactions with the substrate. The I-helix positions
several hydrophobic residues to bind the cholestenone (Leu285, Leu286, Ile284,
Val288, Thr293, Thr294 and Ala297), while the movement of the F-helix relocates
Ile219 and Leu220 to bind the substrate, and Phe231 and Phe234 from the G-helix
also bind cholestenone at its carbonyl group.
Figure 5.11 shows overlaid structures of the cholestenone-bound and phytanic acid-
bound forms of CYP124A1. The distances between the heme iron and the carbon
atoms of the substrates’ branched methyl groups are 3.90 Å and 6.16 Å
(cholestenone) and 3.82 Å and 5.88 Å (phytanic acid), and this proximity is
consistent with the closer methyl groups (in each case) being oxidised by the
reactive iron-oxo (compound I) species in CYP124A1. These observed binding
modes of the substrates are also consistent with the -regiospecificity observed
previously by Johnston et al. (Johnston et al., 2009). The CYP124A1 active site is
relatively narrow, indicative of only one substrate binding conformation and hence
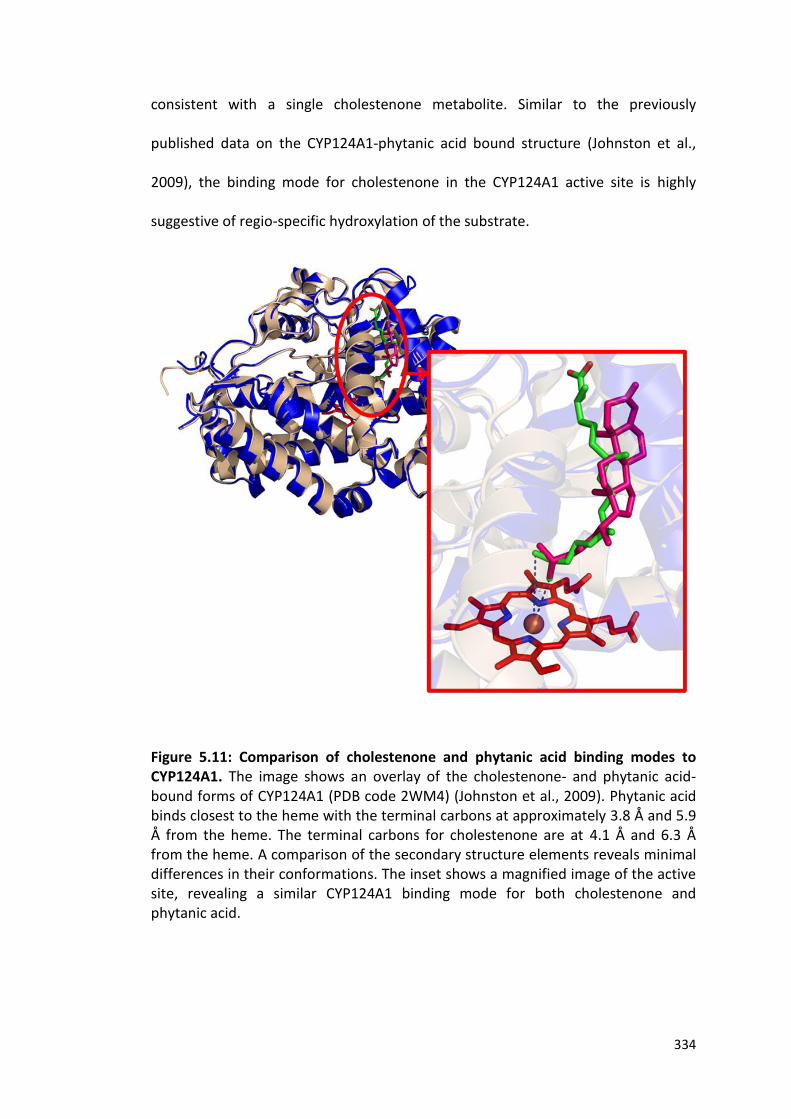
334
consistent with a single cholestenone metabolite. Similar to the previously
published data on the CYP124A1-phytanic acid bound structure (Johnston et al.,
2009), the binding mode for cholestenone in the CYP124A1 active site is highly
suggestive of regio-specific hydroxylation of the substrate.
Figure 5.11: Comparison of cholestenone and phytanic acid binding modes to CYP124A1. The image shows an overlay of the cholestenone- and phytanic acid-bound forms of CYP124A1 (PDB code 2WM4) (Johnston et al., 2009). Phytanic acid binds closest to the heme with the terminal carbons at approximately 3.8 Å and 5.9 Å from the heme. The terminal carbons for cholestenone are at 4.1 Å and 6.3 Å from the heme. A comparison of the secondary structure elements reveals minimal differences in their conformations. The inset shows a magnified image of the active site, revealing a similar CYP124A1 binding mode for both cholestenone and phytanic acid.

335
5.2.1.3 A comparison of cholestenone-bound CYP124A1, CYP125A1 and CYP142A1 structures
It has been documented that cholesterol/cholestenone is an important source of
energy and carbon for Mtb during both chronic and latent infection (Pandey and
Sassetti, 2008, Chang et al., 2009, Johnston et al., 2010, Yam et al., 2009). A major
stage in the cholesterol degradation pathway is the three-step oxidation of the
cholesterol aliphatic side chain to form the carboxylic acid by CYP125A1 and
CYP142A1. This product is subsequently degraded from both ends of the molecule,
with the involvement of the β-oxidation pathway in the degradation of cholesterol
side chain for energy generation (Ouellet et al., 2011, McLean et al., 2010). All three
P450s (CYPs 124A1, 125A1 and 142A1) can oxidize cholesterol/cholestenone.
However, only the CYP142A1 gene (not CYP124A1) was able complement the defect
associated with the deletion of the CYP125A1 gene from the Mtb CDC1551 strain in
studies in which CYP124A1 and CYP142A1 genes were independently integrated
into the deletion strain under the control of the strong, constitutive hsp60 gene
promoter (Johnston et al., 2010).
A superimposed structure of the three P450 isoforms reveals that CYP125A1 and
CYP142A1 bind cholestenone in a very similar orientation, but that CYP124A1
binding to cholestenone is slightly different (Figure 5.12). Figures 5.13 and 5.14
show comparative binding modes for cholestenone in CYPs 124A1, 125A1 and
142A1 (Figure 5.13) and for cholestenone (and cholesteryl sulfate) binding in
CYP124A1, 125A1, 142A1 and 142A2 (Figure 5.14). In Figure 5.14, the
Mycobacterium smegmatis mc(2) CYP142A2 complexes with both cholestenone and

336
cholesterol sulfate are shown. The data in both Figures demonstrate a different
binding mode for cholestenone in the CYP124A1 enzyme compared to the
CYP125A1 and CYP142A1/A2 P450 enzymes.
As the terminal carbon provides a pro-chiral centre for cholestenone, oxidation of
one methyl group will lead to the 27(S) as opposed to the 27(R) stereochemistry for
the other. The crystal structures suggest that the CYP142A1 complex with
cholestenone is in the pro-S-form, while the CYP124A1 cholestenone complex is in a
pro-R-form. The CYP125A1:cholestenone complex structure places both methyl
groups relatively close to the heme iron, making it more difficult to confidently
predict product stereochemistry. Studies have shown that CYP142A1-driven
cholestenone oxidation results in generation of the 26/27(S)-product, whereas
CYP125A1 produces the opposite stereochemistry (Johnston et al., 2010).

337
Figure 5.12: Comparison of CYP125A1, CYP142A1 and CYP124A1 cholestenone binding modes. CYP125A1 and its bound cholestenone are in green (PDB code 2X5W), while the CYP142A1 and CYP124A1 complexes are in magenta and yellow, respectively. Oxidation of one of the two terminal methyl carbons on the pro-chiral centre will generate an R- or S-product, depending on which methyl group is oxidized. CYP125A1 and CYP142A1 bind cholestenone in a similar orientation, while CYP124A1 binds cholestenone in a different orientation.

338
Figure 5.13: The substrate binding channels in the three P450 cholesterol oxidases. Views are given representing overlays of the three cholestenone ligands (coloured in green sticks (CYP125A1), purple sticks (CYP142A1) and yellow sticks (CYP124A1)) in the active site channels of CYP124A1, CYP142A1 and CYP125A1 (coloured the same way). While CYP125A1 and CYP142A1 exhibit a very similar overall shape, and as a consequence have very similar conformations for the bound ligand, the CYP124A1 active site channel displays a marked kink, accommodated by a more bent conformation of the bound cholestenone.
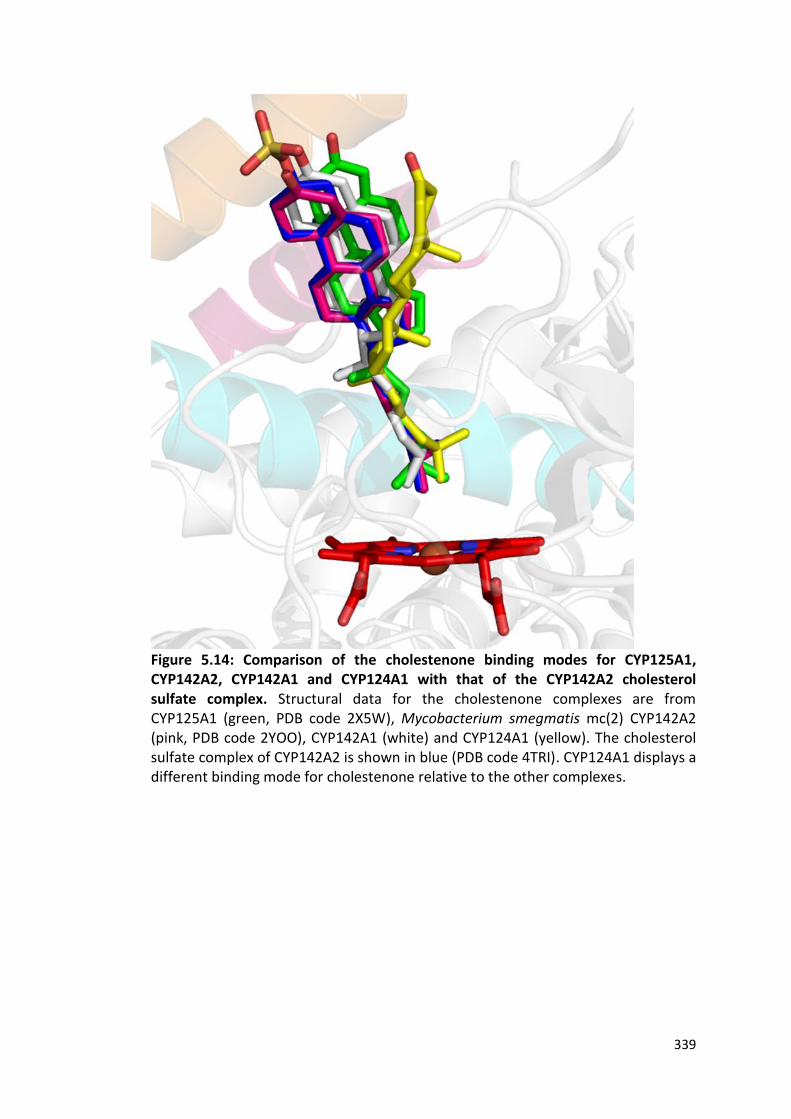
339
Figure 5.14: Comparison of the cholestenone binding modes for CYP125A1, CYP142A2, CYP142A1 and CYP124A1 with that of the CYP142A2 cholesterol sulfate complex. Structural data for the cholestenone complexes are from CYP125A1 (green, PDB code 2X5W), Mycobacterium smegmatis mc(2) CYP142A2 (pink, PDB code 2YOO), CYP142A1 (white) and CYP124A1 (yellow). The cholesterol sulfate complex of CYP142A2 is shown in blue (PDB code 4TRI). CYP124A1 displays a different binding mode for cholestenone relative to the other complexes.

340
5.2.1.4 Crystal structure of the CYP142A1: Econazole complex
Imidazole and triazole-based drugs are potent cytochrome P450 inhibitors that are
widely used as antifungals, and also possess strong anti-mycobacterial activity
(Seward et al., 2006).
Econazole is an antifungal drug with a potent activity against both latent and
multidrug-resistant forms of tuberculosis, and has been shown to clear Mtb
infection in mouse models (Ahmad et al., 2006c, Ahmad et al., 2006a). Mtb
cytochrome P450 enzymes, including CYP142A1, are therefore possible therapeutic
targets for the azole-based antifungal antibiotics. CYP142A1 exhibits high affinity
for a number of antifungal drugs, including econazole, miconazole, clotrimazole,
and bifonazole (see Table 5.1). However, the azole binding affinities for CYP142A1
are typically lower than those observed for two other structurally characterized
Mtb P450 enzymes: CYP121A1 (McLean et al., 2002b, McLean et al., 2002a) and
CYP51B1 (Guardiola-Diaz et al., 2001, Bellamine et al., 1999, McLean et al., 2002b)
(see Table 5.1). The crystal structures of some Mtb P450s in complex with
econazole have been solved, including the heterocyclic arylamine-binding
CYP130A1 (Ouellet et al., 2008) and CYP125A1 (McLean et al., 2009).
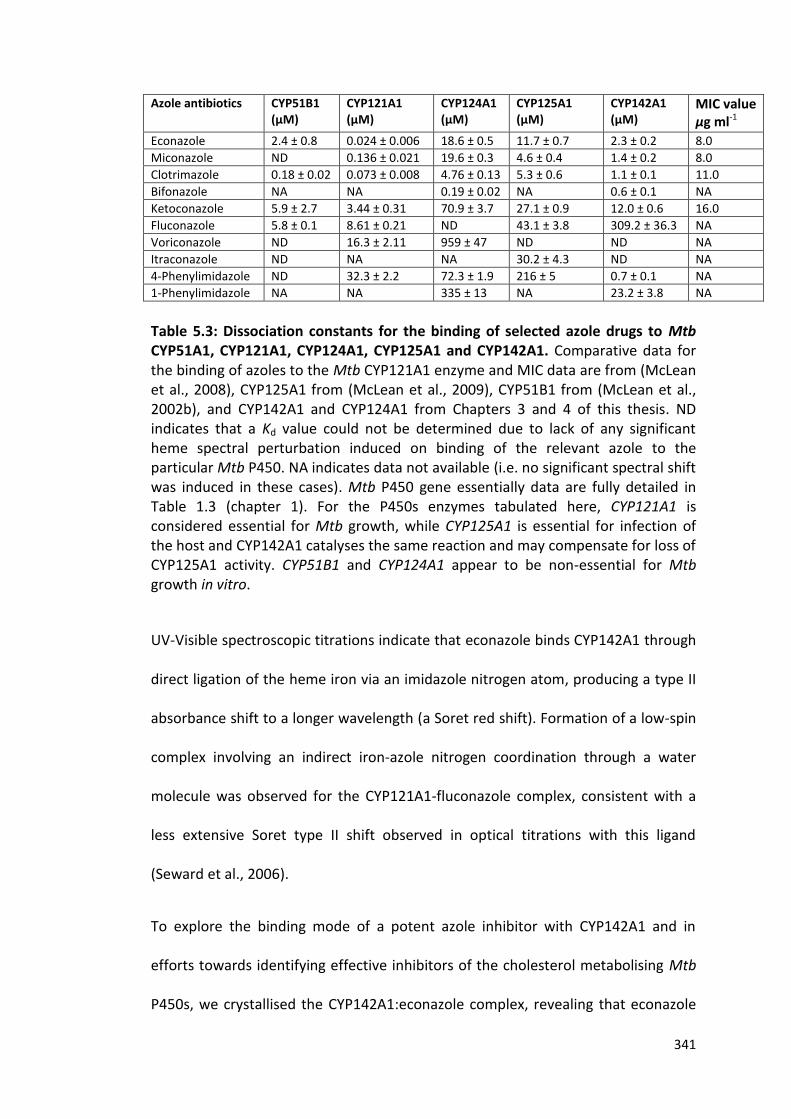
341
Azole antibiotics CYP51B1 (µM)
CYP121A1 (µM)
CYP124A1 (µM)
CYP125A1 (µM)
CYP142A1 (µM)
MIC value µg ml-1
Econazole 2.4 ± 0.8 0.024 ± 0.006 18.6 ± 0.5 11.7 ± 0.7 2.3 ± 0.2 8.0
Miconazole ND 0.136 ± 0.021 19.6 ± 0.3 4.6 ± 0.4 1.4 ± 0.2 8.0
Clotrimazole 0.18 ± 0.02 0.073 ± 0.008 4.76 ± 0.13 5.3 ± 0.6 1.1 ± 0.1 11.0
Bifonazole NA NA 0.19 ± 0.02 NA 0.6 ± 0.1 NA
Ketoconazole 5.9 ± 2.7 3.44 ± 0.31 70.9 ± 3.7 27.1 ± 0.9 12.0 ± 0.6 16.0
Fluconazole 5.8 ± 0.1 8.61 ± 0.21 ND 43.1 ± 3.8 309.2 ± 36.3 NA
Voriconazole ND 16.3 ± 2.11 959 ± 47 ND ND NA
Itraconazole ND NA NA 30.2 ± 4.3 ND NA
4-Phenylimidazole ND 32.3 ± 2.2 72.3 ± 1.9 216 ± 5 0.7 ± 0.1 NA
1-Phenylimidazole NA NA 335 ± 13 NA 23.2 ± 3.8 NA
Table 5.3: Dissociation constants for the binding of selected azole drugs to Mtb CYP51A1, CYP121A1, CYP124A1, CYP125A1 and CYP142A1. Comparative data for the binding of azoles to the Mtb CYP121A1 enzyme and MIC data are from (McLean et al., 2008), CYP125A1 from (McLean et al., 2009), CYP51B1 from (McLean et al., 2002b), and CYP142A1 and CYP124A1 from Chapters 3 and 4 of this thesis. ND indicates that a Kd value could not be determined due to lack of any significant heme spectral perturbation induced on binding of the relevant azole to the particular Mtb P450. NA indicates data not available (i.e. no significant spectral shift was induced in these cases). Mtb P450 gene essentially data are fully detailed in Table 1.3 (chapter 1). For the P450s enzymes tabulated here, CYP121A1 is considered essential for Mtb growth, while CYP125A1 is essential for infection of the host and CYP142A1 catalyses the same reaction and may compensate for loss of CYP125A1 activity. CYP51B1 and CYP124A1 appear to be non-essential for Mtb growth in vitro.
UV-Visible spectroscopic titrations indicate that econazole binds CYP142A1 through
direct ligation of the heme iron via an imidazole nitrogen atom, producing a type II
absorbance shift to a longer wavelength (a Soret red shift). Formation of a low-spin
complex involving an indirect iron-azole nitrogen coordination through a water
molecule was observed for the CYP121A1-fluconazole complex, consistent with a
less extensive Soret type II shift observed in optical titrations with this ligand
(Seward et al., 2006).
To explore the binding mode of a potent azole inhibitor with CYP142A1 and in
efforts towards identifying effective inhibitors of the cholesterol metabolising Mtb
P450s, we crystallised the CYP142A1:econazole complex, revealing that econazole
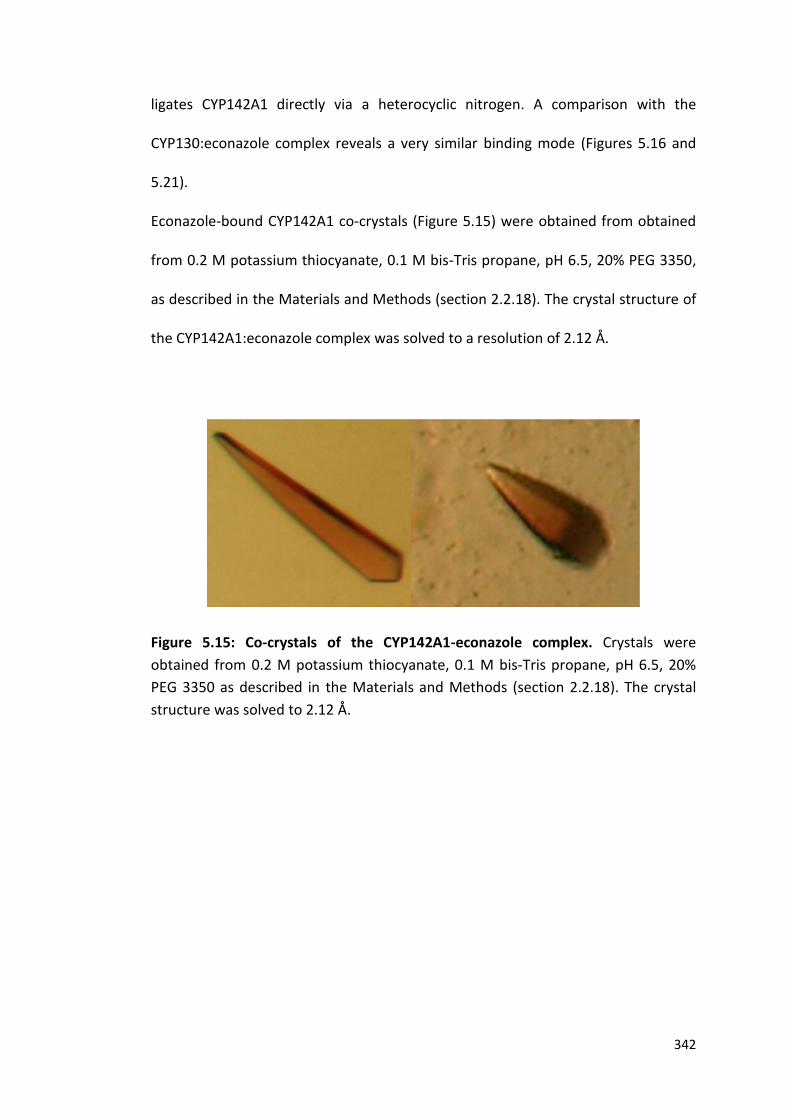
342
ligates CYP142A1 directly via a heterocyclic nitrogen. A comparison with the
CYP130:econazole complex reveals a very similar binding mode (Figures 5.16 and
5.21).
Econazole-bound CYP142A1 co-crystals (Figure 5.15) were obtained from obtained
from 0.2 M potassium thiocyanate, 0.1 M bis-Tris propane, pH 6.5, 20% PEG 3350,
as described in the Materials and Methods (section 2.2.18). The crystal structure of
the CYP142A1:econazole complex was solved to a resolution of 2.12 Å.
Figure 5.15: Co-crystals of the CYP142A1-econazole complex. Crystals were
obtained from 0.2 M potassium thiocyanate, 0.1 M bis-Tris propane, pH 6.5, 20%
PEG 3350 as described in the Materials and Methods (section 2.2.18). The crystal
structure was solved to 2.12 Å.
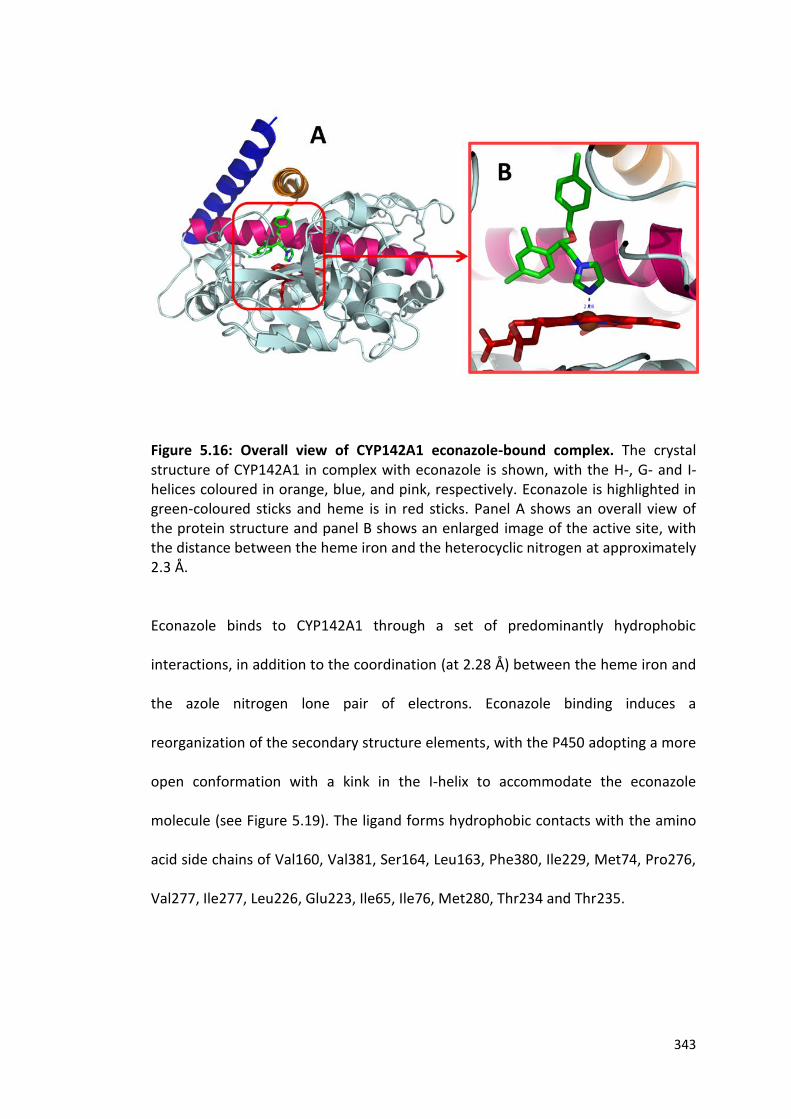
343
Figure 5.16: Overall view of CYP142A1 econazole-bound complex. The crystal structure of CYP142A1 in complex with econazole is shown, with the H-, G- and I-helices coloured in orange, blue, and pink, respectively. Econazole is highlighted in green-coloured sticks and heme is in red sticks. Panel A shows an overall view of the protein structure and panel B shows an enlarged image of the active site, with the distance between the heme iron and the heterocyclic nitrogen at approximately 2.3 Å.
Econazole binds to CYP142A1 through a set of predominantly hydrophobic
interactions, in addition to the coordination (at 2.28 Å) between the heme iron and
the azole nitrogen lone pair of electrons. Econazole binding induces a
reorganization of the secondary structure elements, with the P450 adopting a more
open conformation with a kink in the I-helix to accommodate the econazole
molecule (see Figure 5.19). The ligand forms hydrophobic contacts with the amino
acid side chains of Val160, Val381, Ser164, Leu163, Phe380, Ile229, Met74, Pro276,
Val277, Ile277, Leu226, Glu223, Ile65, Ile76, Met280, Thr234 and Thr235.
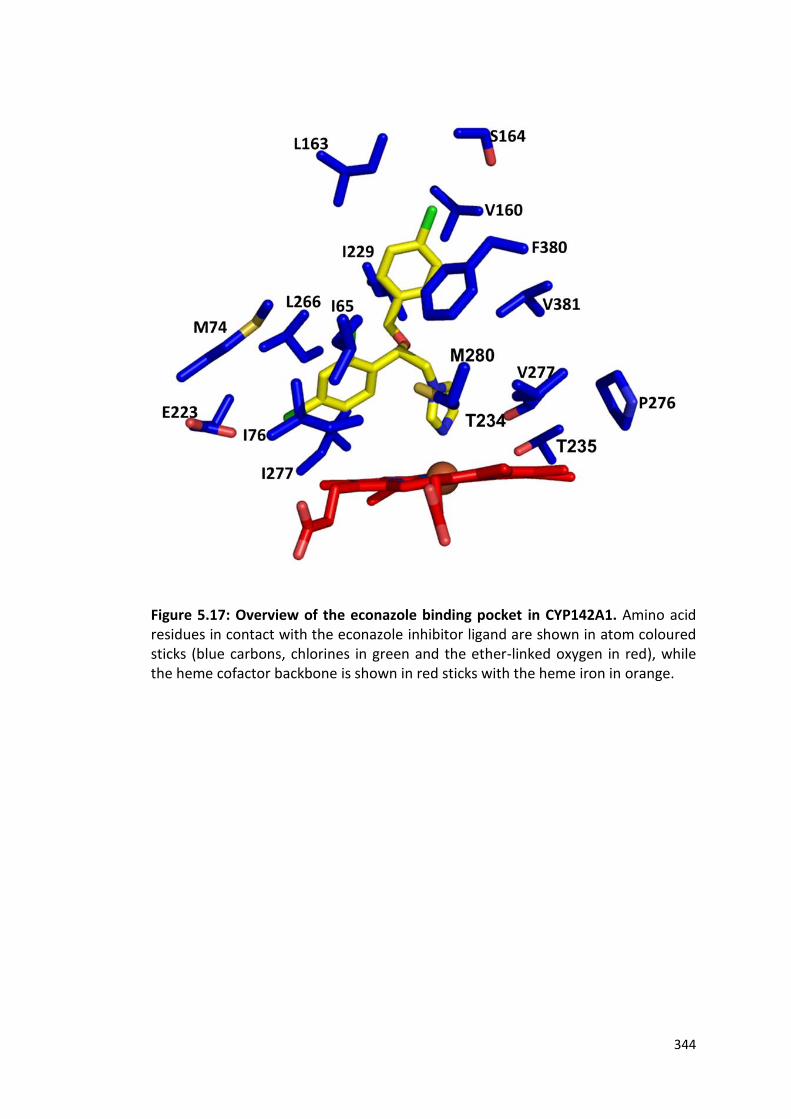
344
Figure 5.17: Overview of the econazole binding pocket in CYP142A1. Amino acid residues in contact with the econazole inhibitor ligand are shown in atom coloured sticks (blue carbons, chlorines in green and the ether-linked oxygen in red), while the heme cofactor backbone is shown in red sticks with the heme iron in orange.
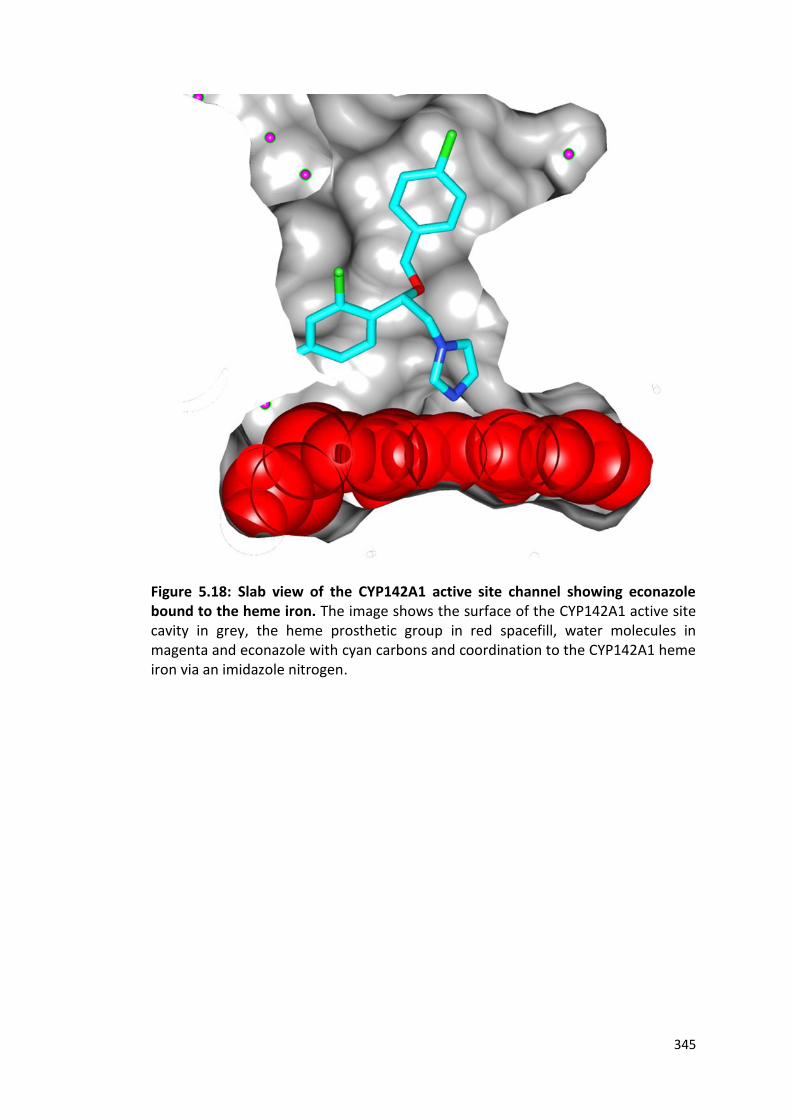
345
Figure 5.18: Slab view of the CYP142A1 active site channel showing econazole bound to the heme iron. The image shows the surface of the CYP142A1 active site cavity in grey, the heme prosthetic group in red spacefill, water molecules in magenta and econazole with cyan carbons and coordination to the CYP142A1 heme iron via an imidazole nitrogen.

346
Figure 5.19: Superimposed structures of the ligand-free and econazole-bound forms of CYP142A1 showing their secondary structure elements. Several secondary structure elements in CYP142A1 undergo conformational changes upon econazole inhibitor binding. The secondary structure of the ligand-free enzyme is shown in green while the econazole-bound enzyme is in grey. Econazole is depicted in spacefill with carbons in purple, and heme is in red sticks with pyrrole nitrogens in blue. Structural changes associated with the binding of econazole are particularly clear in this view for the G-, H- and I-helix regions.
The crystal structure of CYP125A1 in complex with econazole was previously
published by (McLean et al., 2009). A comparison of the binding modes of
econazole to CYP125A1 and CYP142A1 reveals large differences. In CYP125A1,
econazole was prevented from binding directly to the heme by steric constraints
attributable to the funnel shape of the active site near the heme (McLean et al.,
2009) (Figure 5.20). In contrast to the CYP125A1-econazole complex (where
econazole was positioned at ~9.3 Å from the heme), the econazole molecule bound

347
to CYP142A1 ligates the heme iron directly with a distance of only 2.3 Å between
the heme iron and the heterocyclic nitrogen ligand.
Figure 5.20: Superimposed structures of the CYP125A1 and CYP142A1 econazole
complexes. The image shows the binding modes of econazole to CYP125A1 (PDB
code 3IW2) and CYP142A1. The CYP125A1-econazole structure is shown in blue,
while the CYP142A1-econazole structure is in violet. Econazole ligates to the
CYP142A1 heme iron directly via a heterocyclic nitrogen, while CYP125A1 binds
econazole in a position distant from the heme.
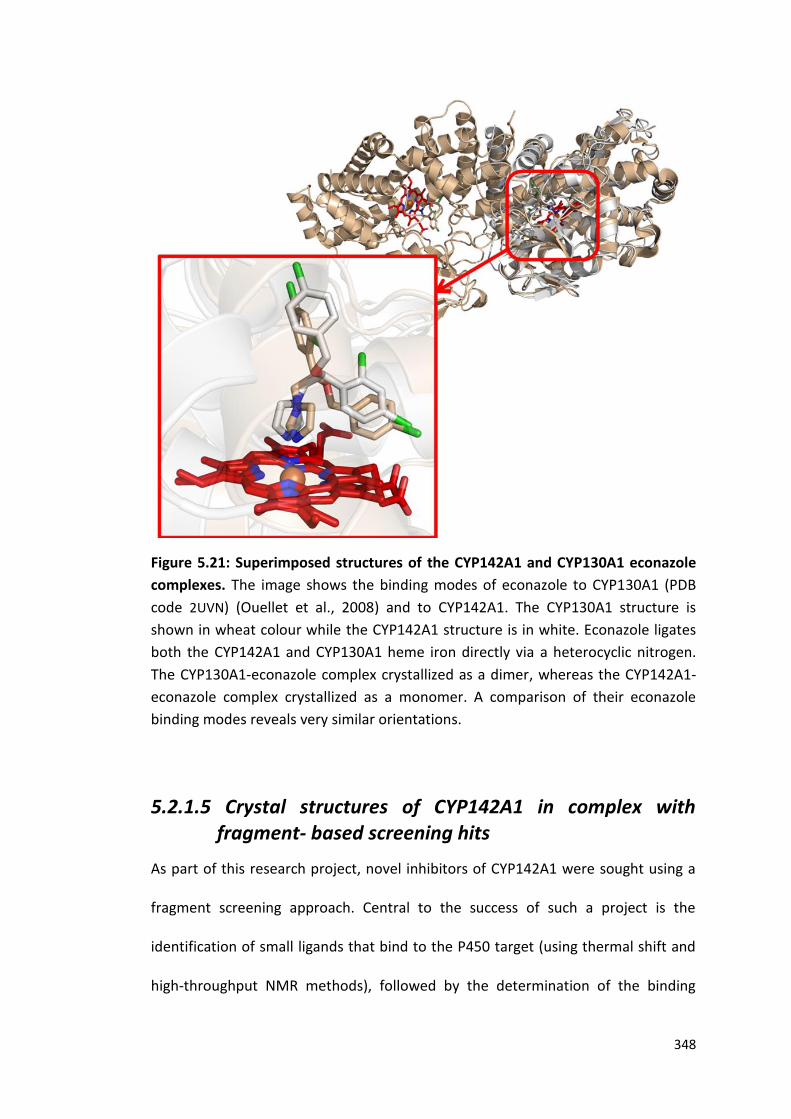
348
Figure 5.21: Superimposed structures of the CYP142A1 and CYP130A1 econazole
complexes. The image shows the binding modes of econazole to CYP130A1 (PDB
code 2UVN) (Ouellet et al., 2008) and to CYP142A1. The CYP130A1 structure is
shown in wheat colour while the CYP142A1 structure is in white. Econazole ligates
both the CYP142A1 and CYP130A1 heme iron directly via a heterocyclic nitrogen.
The CYP130A1-econazole complex crystallized as a dimer, whereas the CYP142A1-
econazole complex crystallized as a monomer. A comparison of their econazole
binding modes reveals very similar orientations.
5.2.1.5 Crystal structures of CYP142A1 in complex with fragment- based screening hits
As part of this research project, novel inhibitors of CYP142A1 were sought using a
fragment screening approach. Central to the success of such a project is the
identification of small ligands that bind to the P450 target (using thermal shift and
high-throughput NMR methods), followed by the determination of the binding

349
modes of compound “hits” – done here using X-ray crystallographic methods
(Fischer and Hubbard, 2009). The identification of the binding modes of small
ligands in the target proteins then enable strategies such as fragment linking,
merging or chemical elaboration to be done to generate next-phase molecules with
improved affinity for the protein. Ligand-free crystals for CYP142A1 were obtained
as described in the Materials and Methods (section 2.2.18). These crystals were
used to soak small molecule ligands that were identified from fragment-based
screening with CYP142A1 (done with collaborators at the University of Cambridge),
to determine the respective binding modes and to enable further elaboration of
these ligands. A crystal soaking strategy was considered the best option, since most
of these ligands possessed weak affinity for CYP142A1 (see section 3.2.4).
Diffraction quality ligand-free crystals of CYP142A1 were obtained from 0.1 M
sodium acetate in a pH range of 4.7–5.0 with 0.1 M potassium thiocyanate, 8-10%
PEG 200 (v/v), and 8-12% PEG 550MME (v/v), using 15 mg/ml enzyme as described
in the Materials and Methods (section 2.2.18). However, this resulted in the
generation of crystals with PEG200 (from the mother liquor) bound to the heme
cofactor. This problem was overcome by back-soaking native crystals in 24% PEG
550 MME, 0.1 M sodium acetate (pH 4.5), 0.1 M potassium thiocyanate.
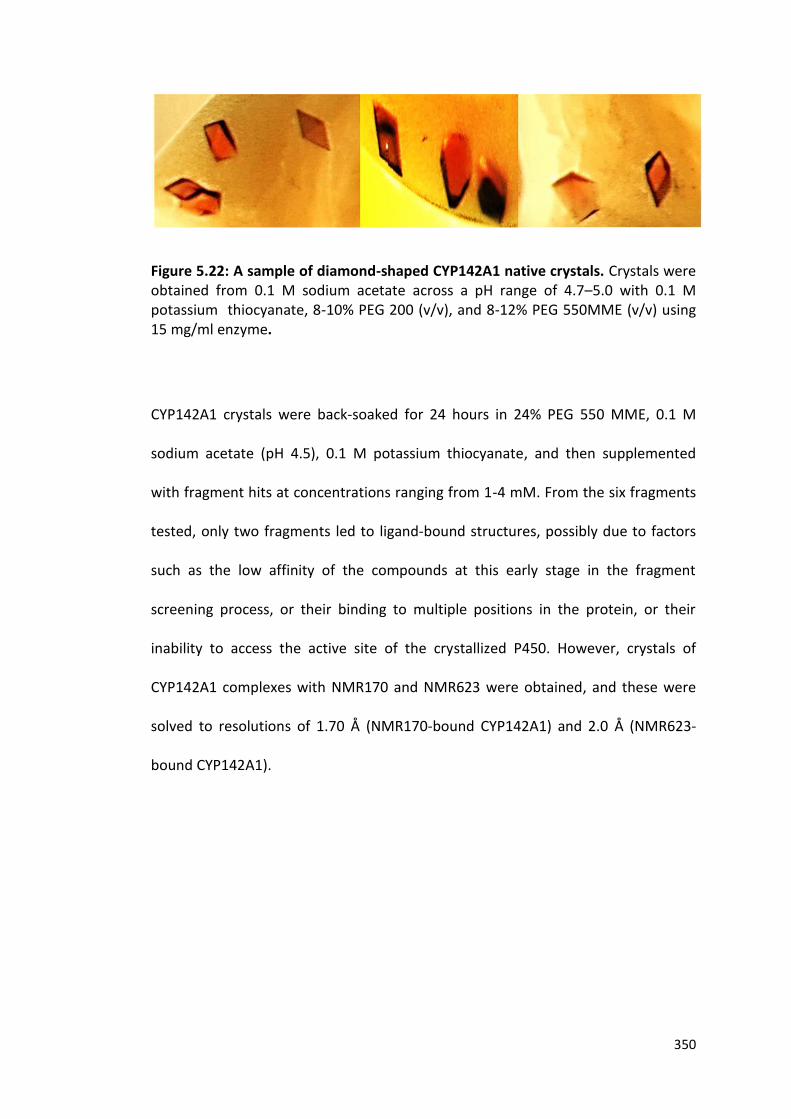
350
Figure 5.22: A sample of diamond-shaped CYP142A1 native crystals. Crystals were obtained from 0.1 M sodium acetate across a pH range of 4.7–5.0 with 0.1 M potassium thiocyanate, 8-10% PEG 200 (v/v), and 8-12% PEG 550MME (v/v) using 15 mg/ml enzyme.
CYP142A1 crystals were back-soaked for 24 hours in 24% PEG 550 MME, 0.1 M
sodium acetate (pH 4.5), 0.1 M potassium thiocyanate, and then supplemented
with fragment hits at concentrations ranging from 1-4 mM. From the six fragments
tested, only two fragments led to ligand-bound structures, possibly due to factors
such as the low affinity of the compounds at this early stage in the fragment
screening process, or their binding to multiple positions in the protein, or their
inability to access the active site of the crystallized P450. However, crystals of
CYP142A1 complexes with NMR170 and NMR623 were obtained, and these were
solved to resolutions of 1.70 Å (NMR170-bound CYP142A1) and 2.0 Å (NMR623-
bound CYP142A1).
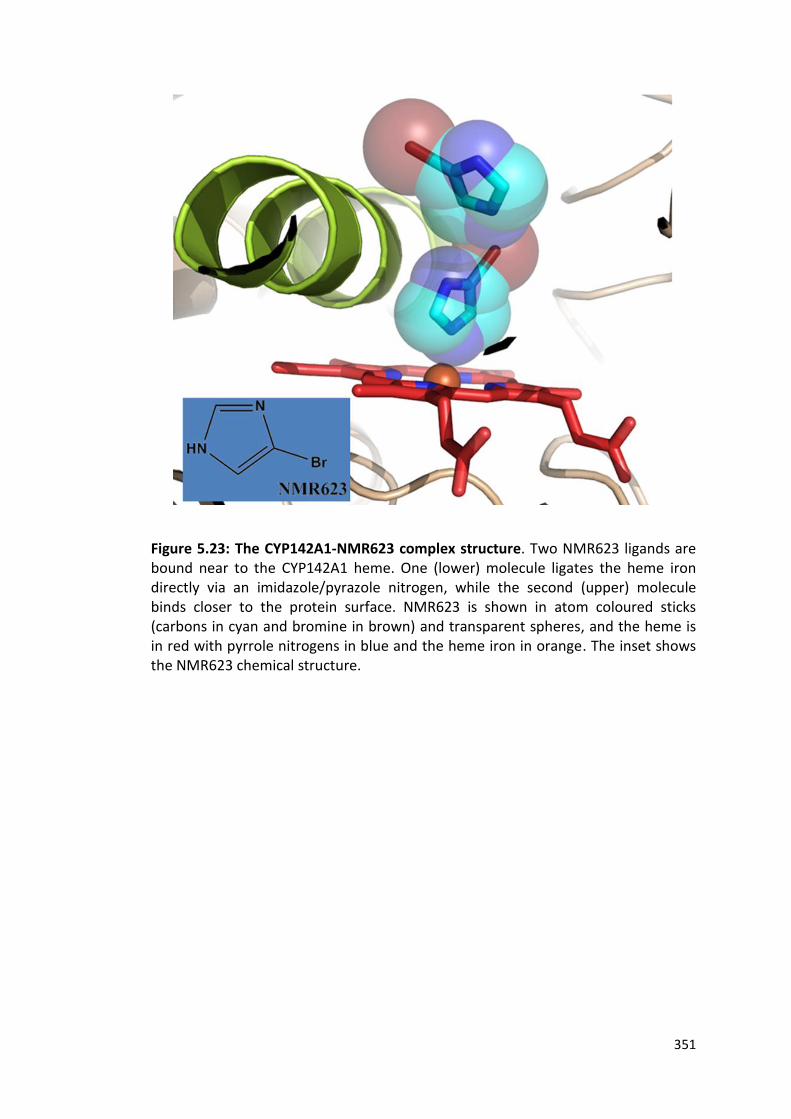
351
Figure 5.23: The CYP142A1-NMR623 complex structure. Two NMR623 ligands are bound near to the CYP142A1 heme. One (lower) molecule ligates the heme iron directly via an imidazole/pyrazole nitrogen, while the second (upper) molecule binds closer to the protein surface. NMR623 is shown in atom coloured sticks (carbons in cyan and bromine in brown) and transparent spheres, and the heme is in red with pyrrole nitrogens in blue and the heme iron in orange. The inset shows the NMR623 chemical structure.

352
Figure 5.24: The CYP142A1-NMR170 complex structure. Two NMR170 ligands are bound close to the heme in the active site. One NMR170 molecule ligates the heme directly via a pyridine nitrogen atom, while the second molecule binds further up the active site. NMR170 is depicted in yellow sticks (with the nitrogen in blue) and transparent spheres; heme is in pink (with pyrrole nitrogens in blue and the iron in orange) and the I-helix is shown in light purple. The inset shows the NMR170 chemical structure.
In view of the failure to obtain CYP142A1 complexes by soaking pre-formed P450
crystals with four of the fragments, these remaining fragments were subjected to
co-crystallization trials with CYP142A1, which yielded two additional complexes
with the fragments NMR491 and 1-phenylimidazole.
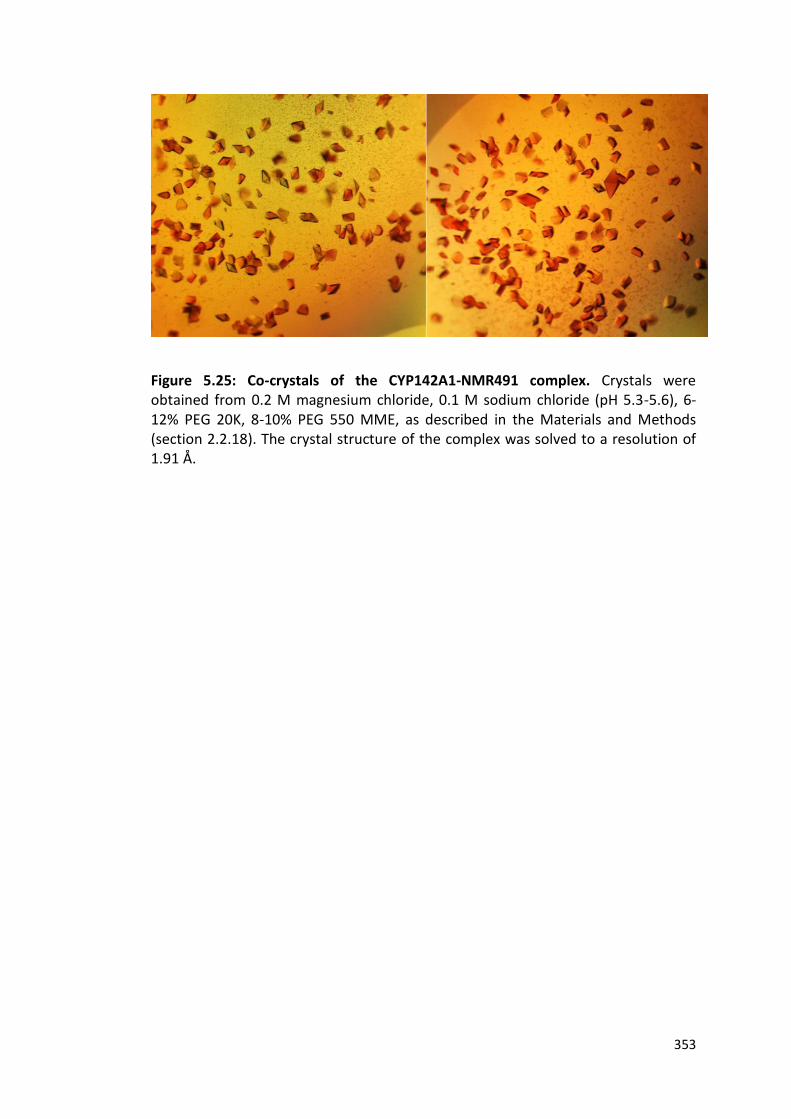
353
Figure 5.25: Co-crystals of the CYP142A1-NMR491 complex. Crystals were obtained from 0.2 M magnesium chloride, 0.1 M sodium chloride (pH 5.3-5.6), 6-12% PEG 20K, 8-10% PEG 550 MME, as described in the Materials and Methods (section 2.2.18). The crystal structure of the complex was solved to a resolution of 1.91 Å.

354
Figure 5.26: The structure of the CYP142A1-NMR491 complex. A single NMR491 ligand is bound to the heme iron via an imidazole nitrogen. NMR491 is depicted in wheat-coloured stick and transparent spheres, with imidazole nitrogens in blue. The heme is in purple with pyrrole nitrogens in blue and heme iron in orange, and the CYP142A1 I-helix is in yellow. The inset shows the NMR491 chemical structure.
Figure 5.27: Co-crystals of the CYP142A1:1-phenylimidazole complex. Crystals were obtained from 0.2 M magnesium chloride, 0.1 M Na acetate (pH 5.3-5.6), 6-12% PEG 20K, 8-14% PEG 550 MME, as described in the Materials and Methods (section 2.2.18). The crystal structure was solved to a resolution of 1.34 Å.
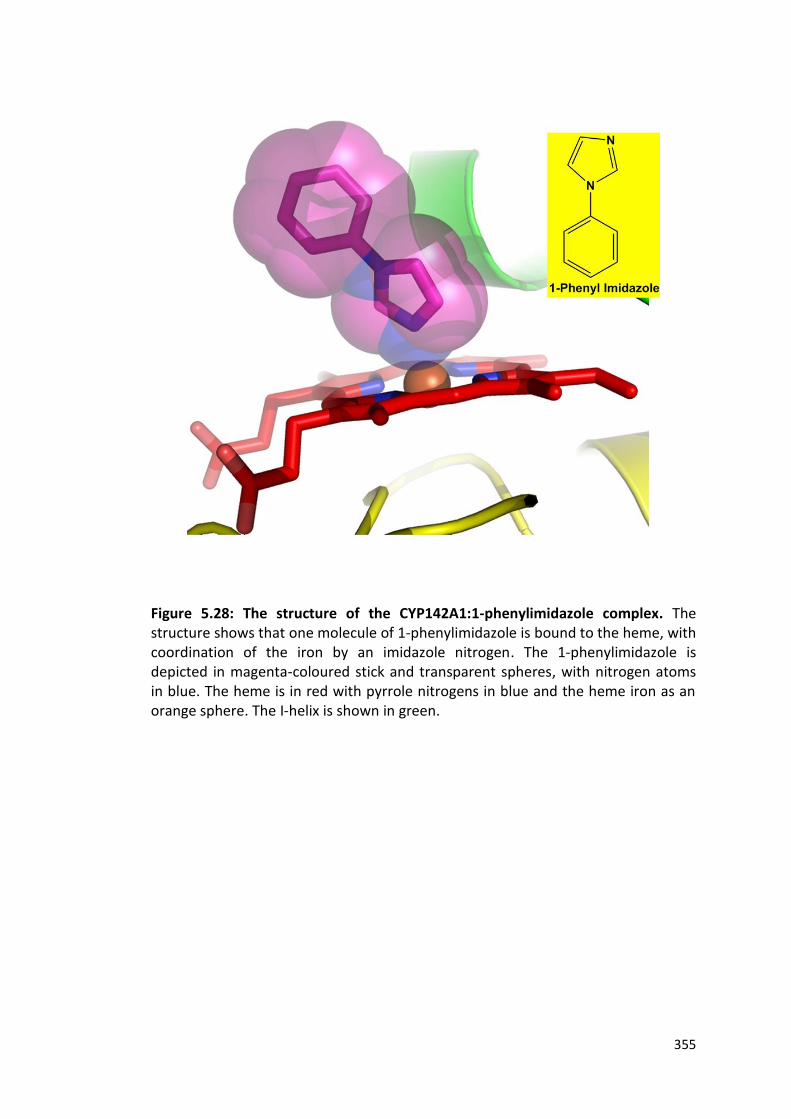
355
Figure 5.28: The structure of the CYP142A1:1-phenylimidazole complex. The structure shows that one molecule of 1-phenylimidazole is bound to the heme, with coordination of the iron by an imidazole nitrogen. The 1-phenylimidazole is depicted in magenta-coloured stick and transparent spheres, with nitrogen atoms in blue. The heme is in red with pyrrole nitrogens in blue and the heme iron as an orange sphere. The I-helix is shown in green.
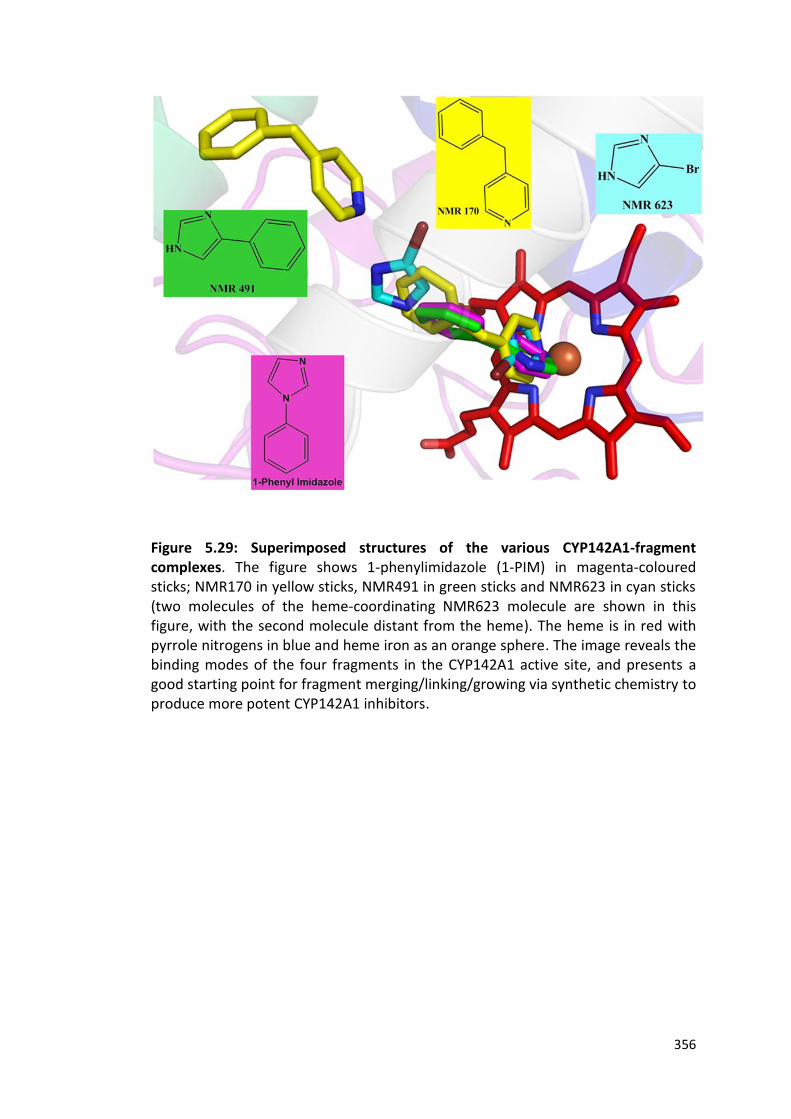
356
Figure 5.29: Superimposed structures of the various CYP142A1-fragment complexes. The figure shows 1-phenylimidazole (1-PIM) in magenta-coloured sticks; NMR170 in yellow sticks, NMR491 in green sticks and NMR623 in cyan sticks (two molecules of the heme-coordinating NMR623 molecule are shown in this figure, with the second molecule distant from the heme). The heme is in red with pyrrole nitrogens in blue and heme iron as an orange sphere. The image reveals the binding modes of the four fragments in the CYP142A1 active site, and presents a good starting point for fragment merging/linking/growing via synthetic chemistry to produce more potent CYP142A1 inhibitors.
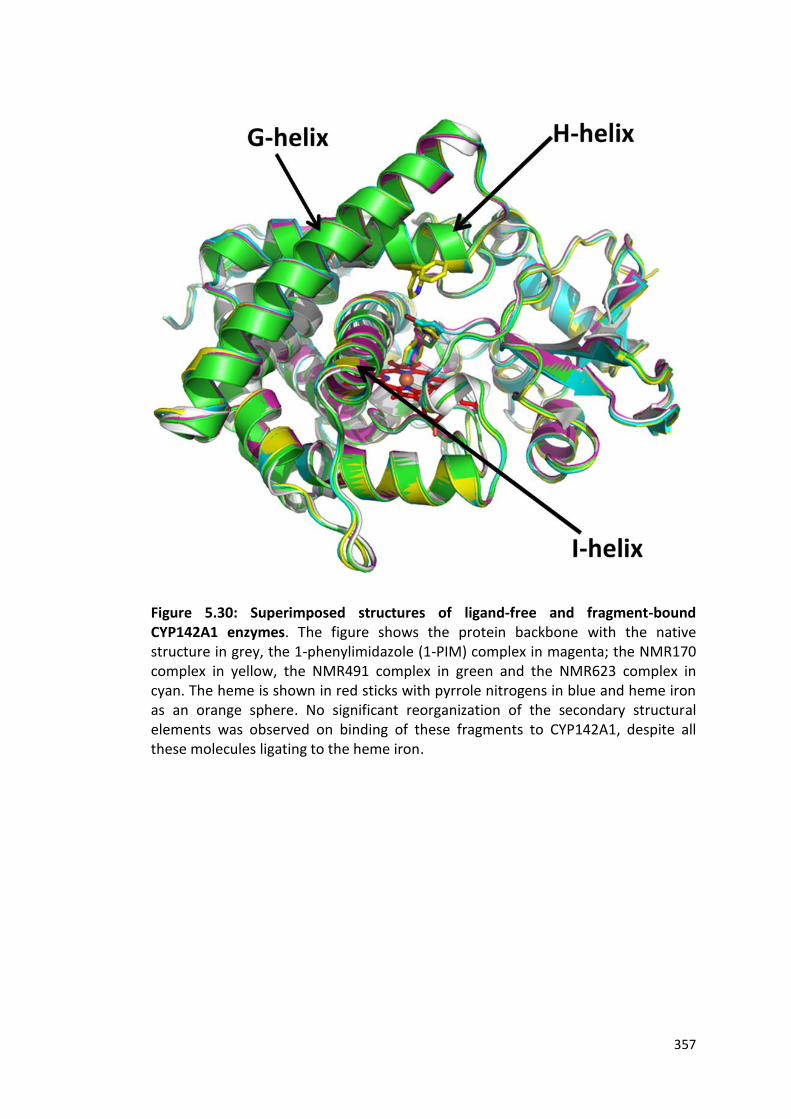
357
Figure 5.30: Superimposed structures of ligand-free and fragment-bound CYP142A1 enzymes. The figure shows the protein backbone with the native structure in grey, the 1-phenylimidazole (1-PIM) complex in magenta; the NMR170 complex in yellow, the NMR491 complex in green and the NMR623 complex in cyan. The heme is shown in red sticks with pyrrole nitrogens in blue and heme iron as an orange sphere. No significant reorganization of the secondary structural elements was observed on binding of these fragments to CYP142A1, despite all these molecules ligating to the heme iron.
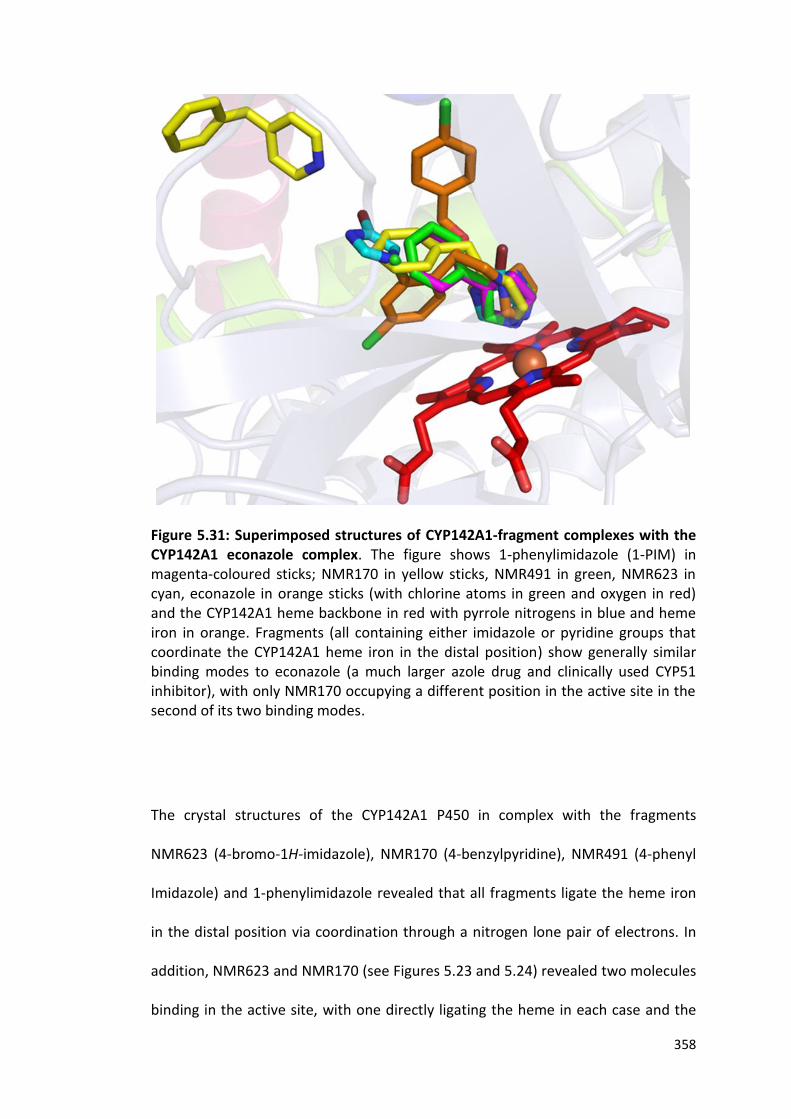
358
Figure 5.31: Superimposed structures of CYP142A1-fragment complexes with the CYP142A1 econazole complex. The figure shows 1-phenylimidazole (1-PIM) in magenta-coloured sticks; NMR170 in yellow sticks, NMR491 in green, NMR623 in cyan, econazole in orange sticks (with chlorine atoms in green and oxygen in red) and the CYP142A1 heme backbone in red with pyrrole nitrogens in blue and heme iron in orange. Fragments (all containing either imidazole or pyridine groups that coordinate the CYP142A1 heme iron in the distal position) show generally similar binding modes to econazole (a much larger azole drug and clinically used CYP51 inhibitor), with only NMR170 occupying a different position in the active site in the second of its two binding modes.
The crystal structures of the CYP142A1 P450 in complex with the fragments
NMR623 (4-bromo-1H-imidazole), NMR170 (4-benzylpyridine), NMR491 (4-phenyl
Imidazole) and 1-phenylimidazole revealed that all fragments ligate the heme iron
in the distal position via coordination through a nitrogen lone pair of electrons. In
addition, NMR623 and NMR170 (see Figures 5.23 and 5.24) revealed two molecules
binding in the active site, with one directly ligating the heme in each case and the
359
other binding in the active site further from the heme (for NMR170), or at the
protein surface (for NMR623). This is possibly a consequence of the high
concentrations of fragment ligands used during the soaking experiments. However,
NMR491 and 1-phenylimidazole (both obtained through co-crysallisation, see
Figures 5.26 and 5.28) show only one molecule binding for each compound and
with a similar binding mode observed for the two compounds (involving a direct
coordination of the heme iron). While the second binding mode for the NMR623
fragment is at a superficial site on the P450, the second molecule on NMR170 binds
in the active site cavity in a position away from the heme iron. This is a useful
finding in terms of developing a fragment linking/merging/building strategy, since
the binding modes of the other fragment ligands are clustered around the
CYP142A1 heme (see below). In previous fragment screening studies with Mtb
CYP121A1, a phenolic fragment was found to bind in two adjacent positions in the
active site (Hudson et al., 2012b). These positions mapped closely onto the space
occupied by the cyclic dipeptide substrate cyclo-L-tyr-L-tyr, and these data also
point to how fragment screening can be used to probe physiological roles in
enzymes. No significant conformational reorganization in the CYP142A1
polypeptide chain was associated with the binding of the fragments to the P450
(Figure 5.30).
Even though a relatively large gap is observed between the two molecules of
NMR170 bound in the CYP142A1 complex (Figure 5.24), further studies using
synthetic chemistry could still generate second generation molecules that bridge
this gap using an appropriate linker in order to generate more potent inhibitors and
360
tighter binding ligands. Overlapping fragments were found in the heme-binding
active site position, and these provide a rational start point for fragment
elaboration involving a linking/merging/growing strategy via synthetic chemistry to
produce specific inhibitors as probes for CYP142A1 function both in vitro and in
vivo. As mentioned above, this chemical elaboration strategy has previously been
successfully applied to CYP121A1 (Hudson et al., 2012b, Hudson et al., 2014).
Interestingly, these fragments were found to bind all the three cholesterol oxidases
(CYP125A1, CYP124A1 and CYP142A1) (see Tables 4.2 and 4.3) , indicating a good
start point for the development of potent inhibitors that are effective against each
of these three cholesterol oxidising Mtb P450s, and hence could completely block
host cholesterol utilization by Mtb.
An overlay of the structures of CYP142A1-fragment complexes (bound to small
azole- and pyridine-based inhibitors) with the CYP142A1-econazole complex (a
much larger azole inhibitor) (Figure 5.31) reveals a similar binding mode and
proximity to the heme iron for each of these molecules, and provides important
insights into the selective inhibition and druggability of this enzyme that could be
achieved by the further development of the fragment screening strategy.
5.3 Summary
CYP125A1, CYP142A1 and CYP124A1 are involved in the C27 oxidation of the
aliphatic side chain of cholesterol/cholestenone, a critical step leading to
cholesterol utilization for energy generation during both latent and chronic
361
infection in the human host (Ouellet et al., 2011, Johnston et al., 2010). In this
chapter, the crystal structures of various CYP124A1 and CYP142A1 ligand
complexes were determined, including structures of complexes with the substrate
(cholestenone, with CYP124A1) and with azole (and pyridine) inhibitors, including
econazole (with CYP142A1), a drug shown to be effective in clearing Mtb infections
in a mouse model (Ahmad et al., 2006c). Cholestenone was found to bind to
CYP142A1 in an orientation that is similar to that seen in other, previously resolved
mycobacterial P450 structures (i.e. the CYP125A1 and CYP142A2 complexes)
(Ouellet et al., 2010a, Frank et al., 2014, Garcia-Fernandez et al., 2013). However,
the crystal structure of CYP124A1 bound to cholestenone revealed a different
cholestenone binding orientation, due to its narrow active site channel. It was
previously postulated by Driscoll et al. that it may be unlikely for
cholesterol/cholestenone to bind to CYP124A1 in the same orientation as seen in
the other cholesterol-metabolizing P450 enzymes, due to the distinct shape of the
entry of the active site channel (Driscoll et al., 2010). The cholestenone molecules
bound within the active sites of CYP124A1 and CYP142A1 make contacts with
hydrophobic residues. A superimposition of the substrate-free and substrate-bound
structures revealed conformational changes in the secondary structure elements,
mainly in the I-, G- and F-helices, in order to accommodate the substrate in the
active sites of these enzymes. Cholestenone binds to CYP124A1 and CYP142A1 with
its aliphatic tail positioned directly above the heme in an orientation favourable for
C27 hydroxylation, while the keto group projects outwards to the solvent-accessible
surface. A comparison of the active site channels of the three different types of Mtb
cholesterol hydroxylases revealed that the substrate-binding tunnel for CYP142A1

362
provides more space as it approaches towards the protein surface when compared
to CYP125A1 and CYP124A1. This indicates the possibility of binding multiple
cholesterol derivatives, and suggests that CYP142A1 enzymes may play an essential
role during Mtb infection by providing access to more diverse cholesterol
derivatives that otherwise would not be available to the pathogen, as postulated by
Frank et al. (Frank et al., 2014).
Structural data presented in this chapter validate further the biophysical binding
experiments, nanoESI-MS and EPR data. From the nano ESI-MS data, the dimeric
features of CYP142A1 were almost completely eliminated on incubation with DTT
and econazole, but retained with cholestenone. These data are comparable to the
results derived from the structural studies which showed econazole to bind
CYP142A1, while cholestenone binds CYP142A1 in a dimer and CYP124A1 binds
cholestenone in a monomer.
Azole antibiotics are known to be rather non-selective, but potent inhibitors of Mtb
P450 enzymes, and some of these azoles have been shown to clear Mtb infection in
mice (Ahmad et al., 2006c, Ahmad et al., 2006a). The crystal structure of CYP142A1
in complex with econazole revealed a direct heme iron coordination via a
heterocyclic (imidazole) nitrogen, consistent with the canonical mechanism of P450
enzyme inhibition by azole drugs. An interesting observation was that the crystal
structure of the CYP125A1:econazole complex showed that the drug could not
penetrate deep enough into the active site to interact with the heme as a result of
the narrowing of its funnel-shaped access channel to the heme, and instead bound
363
in a mode in which the imidazole moiety was orientated away from the active site
(McLean et al., 2009). These data point to interesting differences in the structural
organization of the CYP142A1 and CYP125A1 enzymes that might help to
understand subtle differences in their catalytic properties.
Initial fragment based screening identified six fragments hits for CYP142A1.
Interestingly, these fragments also bind the other two Mtb cholesterol oxidase
P450s (CYP124A1 and CYP125A1) albeit with lower affinity (see Tables 4.2 and 4.3).
Crystal structures for four of the fragments were resolved in complex with
CYP142A1 in this study, and these are NMR491, NMR623, NMR170 and 1-
phenylimidazole (1-PIM). For NMR170 and NMR623, two molecules were found to
bind in different positions to CYP142A1 (one ligating the heme iron in each case),
while single NMR491 and 1-PIM molecules were bound coordinated to the
CYP142A1 heme iron. It is worth noting that each of these fragments are heme-
binders and ligate the heme iron directly via a heterocyclic nitrogen in an imidazole
or pyridine ring; as also observed for the much larger econazole inhibitor. The
crystallographic data for CYP142A1 and CYP124A1 in complex with substrates and
inhibitors are confirmatory of ligand-binding data presented in Chapters 3 and 4. In
the case of cholestenone, this substrate induces a low- to high-spin shift (type I) in
the ferric heme iron in both these P450s, consistent with a binding mode in which
the 6th water ligand to the heme iron is displaced. This is confirmed from the
structural data for the cholestenone complexes in both cases. Similarly, econazole
coordinates the heme iron to induce a red (long wavelength) shift of the Soret
maximum in both CYP124A1 and CYP142A1, which is consistent with an imidazole
364
nitrogen displacing the 6th water ligand. This phenomenon is observed clearly in the
crystal structure of the CYP142A1/econazole complex. Similarly, CYP142A1 heme
iron distal coordination by the imidazole or pyridine nitrogens of the fragment
molecules NMR170, NMR491, NMR623 and 1-phenylimidazole is inferred from UV-
visible and EPR studies, and is again confirmed in the crystal structures of the
CYP142A1 complexes with these molecules. Binding data for the various substrates
and inhibitors (including fragments) used in structural studies are presented in
Table 3.2 and Tables 4.1-4.3 in Chapters 3 and 4 of this thesis. The fragment-based
approach used in this work aims at developing potent and selective inhibitors for
important drug targets such as the Mtb P450 enzymes (Hudson et al., 2012b,
Hudson et al., 2014). With the binding modes of these fragments determined, a
door is opened for further chemical elaboration via merging/linking/growing
strategies in order to develop novel inhibitors that could completely block host
cholesterol utilization/metabolism by Mycobacterium tuberculosis.
365
Chapter 6
Conclusions and Future Directions
6.1 Conclusions
This PhD research provides a comprehensive study of the biochemical, biophysical
and structural properties of the cholesterol oxidase P450 enzymes in Mycobacterium
tuberculosis.
A cholesterol catabolism gene cluster was discovered recently in the genome of the
Mtb-related actinobacterium Rhodococcus jostti RHA1 (Van der Geize et al., 2007).
Interestingly, many of these genes were also found to be conserved in Mtb, among
which are genes that code for proteins involved in both cholesterol uptake and
degradation (including CYP125A1 and CYP142A1), suggesting that Mtb can utilize
cholesterol for growth during infection (Ouellet et al., 2011). The
cholesterol/branched chain fatty acid binding CYP124A1, on the other hand, is
located in the same gene operon as CYP128A1 and CYP121A1. One of the other
genes in this cluster (Sft3, Rv2267c) encodes a sulfotransferase enzyme involved in
the sulfation of menaquinone MK-9 DH-2 at the -position (Johnston et al., 2009).
The hydroxylation of menaquinone at the -position by CYP128A1 enables the Sft3-
catalysed sulfation at this position. Interestingly CYP124A1 was found to metabolize
substrates with chemical structures similar to menaquinone and these are
substrates with repeated methyl branching, which includes
cholesterol/cholestenone (Johnston et al., 2010, Johnston et al., 2009).

366
These P450 isoforms (CYPs 125A1/142A1/124A1) have been shown to be involved
in the C27 hydroxylation of cholesterol side chain subsequent to cholesterol ring
degradation necessary for energy generation, bacterial survival and infectivity in
Mtb (Ouellet et al., 2011, Johnston et al., 2010). In the absence of these P450
enzymes, the cholesterol metabolite cholestenone accumulates and exerts a
bacteriostatic effect (Ouellet et al., 2011). CYP125A1 is the primary enzyme
involved in cholesterol catabolism, while CYP142A1 functions as a compensatory
enzyme to the cholesterol 27-oxidase CYP125A1 in some Mtb strains. CYP124A1 is
found in both pathogenic and non-pathogenic mycobacterial species and shows a
broad lipid substrate specificity. These P450 enzymes were demonstrated to be
promising drug targets for new generations of anti-tuberculosis drugs. Targeting
these three enzymes and the cholesterol degradation pathway in Mtb could
provide a much needed new route to killing the bacterium.
CYP142A1 may play a “redundant” role in Mtb cholesterol metabolism, where it can
serve as a back-up enzyme for CYP125A1 (Johnston et al., 2010). However, it may
also catalyse sterol metabolism reactions that are complementary to those
performed by CYP125A1. Even though all three of the P450s can oxidize the
cholesterol side chain, only CYP142A1, but not CYP124A1, can substitute for
CYP125A1 when its gene is inactivated in Mtb (Johnston et al., 2010). From my
work, the crystal structures of CYP124A1 and CYP142A1 in complex with
cholestenone revealed a close proximity of the aliphatic side chain of the sterol to
367
the heme iron centre, consistent with their role as cholesterol/cholestenone C27
oxidases.
CYP124A1 and CYP142A1 were successfully purified via three chromatographic
steps, with CYP142A1 being predominantly low-spin and CYP124A1 purified in a
mixed-spin form. Binding assays carried out on the three P450 isoforms revealed
tight binding to sterols, and to branched-chain lipids (for CYP124A1) consistent with
their proposed physiological roles. Studies have revealed azole antifungals to be
potent inhibitors of mycobacterial P450 enzymes, with econazole shown to clear
Mtb infection in mice (Ahmad et al., 2006a). Affinity for selected azole antibiotics
and novel inhibitors from fragment-based screening was also established for the
cholesterol-metabolising P450s, consistent with other previously characterized Mtb
P450s (McLean et al., 2002b, Seward et al., 2006, Hudson et al., 2014). Specific
inhibitors of the cholesterol oxidase P450 enzymes could be used as chemical tools
to reveal how the activities of these enzymes relate to Mtb infection, growth and
persistence in the human host.
CYP142A1 and CYP124A1 exhibit fundamental characteristics of P450 enzymes with
respect to cysteine thiolate coordination of the heme iron and affinity for molecules
such as carbon monoxide (CO) and nitric oxide (NO). The characteristic signature for
P450 enzymes is that they display a shift in the Soret peak to approximately 450 nm
(in the ferrous-CO complex) on heme iron reduction and binding with carbon
monoxide. This “P450” spectrum is a result of the retention of the thiolate proximal
368
ligand to the heme iron when CO binds trans to the cysteinate ligand (Omura and
Sato, 1964). The carbon monoxide adduct for CYP142A1 was stable for over 30
minutes in both the absence and the presence of the substrate cholestenone and
did not convert to a P420 (cysteine thiol-coordinated) complex, which absorbs
maximally at around 420 nm. However, this was in contrast to CYP124A1 where the
423 nm (P420) species gradually increased in intensity while the 450 nm (P450)
species continuously decreased in intensity over 15 minutes.
Electron paramagnetic resonance (EPR) spectroscopy was done to probe CYP142A1
and CYP124A1 heme coordination and ligand binding. X-band EPR data collected at
10 K for ligand-free and ligand-bound forms of the enzymes revealed a
characteristic rhombic signal for ferric, thiolate-coordinated P450s, consistent with
conclusions made from UV-visible absorbance spectra. Heterogeneous low-spin
heme iron signals were obtained on binding fragments and azole inhibitors to the
P450s, arising from either direct ligation of a heterocyclic nitrogen in the
fragment/ligand to heme iron, or through their making indirect interactions with
heme iron via a retained water ligand coordinating the heme iron in the 6th
position. EPR data for CYP142A1/CYP124A1 complexed with relevant substrates
demonstrated a heterogeneous mixture of high-spin and low-spin features,
consistent with data obtained from previously characterized P450s (McLean et al.,
2008, Driscoll et al., 2011). The high-spin species result from the displacement of
the water ligand coordinating to the heme iron in the 6th axial position following the
binding of the substrate. EPR provides important confirmatory information for the

369
binding of inhibitor and substrate molecules to CYP142A1 and CYP124A1, in
addition to providing insights into their modes of binding.
The structure of ligand-free CYP142A1 was previously published as a monomer
(Driscoll et al., 2010). However, results from light scattering analysis revealed that
CYP142A1 can dimerize in solution, and this dimerization could be disrupted with
the reducing agent DTT (dithiothreitol). Appropriately treated CYP124A1 was found
to be completely monomeric in solution, appearing as a single species through
MALLS analysis with an apparent molecular weight of 50.37 kDa, close to the
predicted mass of 50.52 kDa from the CYP124A1 amino acid sequence. The stability
parameters of a protein give important indications of its probability for successful
crystallization to enable high-resolution structural studies (Dupeux et al., 2011).
Studies have revealed that samples with Tm values of 318 K (45 oC) or higher
crystallized in 49% of cases, while the success rate of crystallization declined rapidly
for samples with lower Tm values (Dupeux et al., 2011). Thermal stability studies of
CYP142A1 and CYP124A1 generated Tm values of 53.29 ± 0.06 oC and 52.89 ± 0.04
oC, respectively, which can be taken as positive indications for successful
crystallizability of these P450s.
The heme iron mid-point redox potential values for CYP142A1 and CYP124A1 were
consistent with values previously reported for other characterized P450 enzymes
(McLean et al., 2008, Ost et al., 2001, Driscoll et al., 2011). Ligand-free CYP142A1
has a more negative mid-point potential (−394 ± 4 mV) than the ligand-free
CYP124A1 (−337 ± 4 mV). Substrate binding to P450 enzymes usually induces
370
significant shifts in heme iron spin-state equilibrium toward the high-spin ferric
state, and such shifts in spin-state equilibrium are typically associated with the
heme iron developing a more positive potential and becoming easier to reduce
(Daff et al., 1997, Bui et al., 2012). Cholestenone binding to CYP142A1 produced a
large heme iron potential change (~244 mV) between the low-spin (substrate-free)
and high-spin (substrate-bound) forms, indicative of a tightly regulated redox
system. The extent of substrate-induced potential change is rather greater than
observed for other P450s (e.g. ~140 mV for P450 BM3 and P450cam), and might
reflect the impact of changes to heme environment or structural arrangements in
addition to the change in heme iron spin-state on substrate binding to CYP142A1.
The CYP124A1 redox potential was elevated by ~107 mV on binding the substrate
phytanic acid, a result consistent with that observed for a number of other P450
enzymes on substrate binding (Ost et al., 2001, McLean et al., 2006b). Azole binding
to CYP124A1 and CYP142A1 resulted in a more heme iron negative potential (−360
± 4 mV for the CYP142A1-clotrimazole complex and −318 ± 4 mV CYP124A1-
econazole complex) than found for their respective substrate-bound forms,
although these are slightly more positive potentials than found in the ligand-free
forms of the enzymes.
Structural data for the CYP142A1 and CYP124A1 enzymes revealed active site
architecture that favours the binding of a sterol molecule. Significant reorganization
of various secondary structural elements were observed on substrate- and
inhibitor-binding, and this was most evident at the I-, G- and H-helices. The
cholestenone complex of CYP142A1 showed that the positioning of the
371
cholestenone molecule within the substrate binding channel is similar to that
observed in the crystal structures of other mycobacterial P450 enzymes that have
been solved in complex with cholestenone (Frank et al., 2014, Garcia-Fernandez et
al., 2013). Cholestenone binds in an orientation that favours C27-hydroxylation,
consistent with recent data reporting the catalytic properties of the enzyme
(Johnston et al., 2010, Ouellet et al., 2010a, Ouellet et al., 2011). A superimposed
structure of the three Mtb cholesterol oxidase P450 isoforms reveals that
CYP125A1 and CYP142A1 bind cholestenone in a very similar orientation, but that
CYP124A1 binding to cholestenone is slightly different, resulting from its distinctive
active site cavity. Crystal structures of CYP142A1 in complex with econazole and
fragment hits revealed direct heme ligation by azole nitrogens, and in the case of
the fragments NMR170 and NMR623 two molecules were bound to the P450, with
one ligating the heme iron and the other bound more distant from the heme. The
binding modes of CYP142A1-specific hits were also determined in my studies. By
combining structural biology with synthetic chemistry, the “linking” of such
molecules that bind to different regions of the CYP142A1 active site could enable
production of highly specific P450 ligands to be used as chemical probes for the
Mtb cholesterol oxidase enzymes and/or as leads for new drug development for TB.
The results presented in this thesis are mainly for two of the cholesterol
metabolizing P450 enzymes in Mtb (CYP124A1 and CYP142A1) and more
importantly these enzymes are among the 20 P450s that are potential drug targets.
The biochemical, biophysical and structural data presented provide important clues
about their in vivo function. The substrate specificity data presented here, together

372
with the molecular interactions of novel inhibitors from fragment based screening
and the crystal structures of the various ligand-bound complexes, provide a scaffold
for design and development of specific inhibitors for the Mtb cholesterol oxidases
and of other Mtb P450 enzymes.
In conclusion, these studies have provided fundamental new data on the
spectroscopic, ligand-binding, kinetic, thermodynamic, hydrodynamic and
structural properties of two Mtb P450s pivotal to the metabolism of sterols (and
branched chain lipids in the case of CYP124A1). Substantial new data are presented
in all these areas, with novel structural data being particularly important in
understanding how CYP142A1 and CYP124A1 interact with the substrate
cholestenone, and (for CYP142A1) how various inhibitors interact with this P450
and how a fragment based screening approach could be useful in the production of
new inhibitors and probes for the function of CYP142A1 (and of the related Mtb
cholesterol oxidases CYP125A1 and CYP124A1). Such an approach will complement
ongoing fragment screening work on Mtb CYP121A1 and CYP144A1 and could lead
to development of novel therapeutics against Mtb.
6.2 Future directions
Work done in this thesis led to the identification of small chemicals (“fragments”)
that bind to the CYP124A1 and CYP142A1 P450s. Fragments are generally weak
binding ligands with low affinity for their targets; although the recognition of their
binding is frequently due to their occupancy of a specific binding “pocket” in the

373
target enzyme (Hudson et al., 2014). In this study, the design/identification of new
inhibitors common to the three Mtb cholesterol oxidases was undertaken using
fragment based screening approaches, and in collaboration with researchers at the
University of Cambridge. Fragments hits were validated against the cholesterol
oxidases and crystal structures of fragments in complex with CYP142A1 were
determined for some of the fragment “hits”. Further progress in this area could be
made by using fragment linking/merging/growing strategies to improve the potency
and affinities of next-generation molecules developed from the fragment hits.
Through synergistic studies using protein crystallography to define binding modes
for fragments and synthetic chemistry to link neighbouring fragments; potent
inhibitors should be sought and their ability to inhibit CYPs 124A1/125A1/CYP142A1
determined, along with their effects on growth of mycobacterial strains.
Binding assays were also done for CYP124A1-specific fragment hits. However,
crystallisation trials with CYP124A1 and these fragments were not successful,
possibly due to low affinity of the fragment hits. Future work on this enzyme should
progress studies to identify the binding modes of fragment hits by X-ray
crystallography (using both co-crystallisation and crystal-soaking approaches). Once
the CYP124A1 binding modes for sufficient numbers of fragments have been
determined, the same approaches detailed above for CYP142A1 could be followed
until highly specific and potent inhibitors are developed. These should be tested at
each stage for their ability to bind to CYP124A1 (and the other Mtb cholesterol
oxidases) and to inhibit enzymatic activity (Kd and Ki values), as well as for their anti-
Mtb activity (MIC values), with the aim being to generate new, potent drugs that

374
are effective against drug-resistant strains of Mtb. For CYP125A1, while structural
data are available, protein crystal packing results in occlusion of the substrate
binding site – impairing the soaking of inhibitory fragments into the active site, and
thus preventing determination of their binding modes. Protein engineering on
CYP125A1 should enable its crystallization in a form with a more open active site
that will enable fragments (various hits have already been identified) to be soaked
into the active site. Co-crystallization of CYP125A1 with fragments should also be
done to expedite identification of fragment binding modes and to progress
CYP125A1 inhibitor development. The overall aim is to build novel types of P450
isoform-specific inhibitors that inactivate CYP142A1, 124A1 and 125A1, and that
can effectively inhibit host cholesterol utilization and human infection by Mtb.
375
References
ADAMS, P. D., AFONINE, P. V., BUNKOCZI, G., CHEN, V. B., DAVIS, I. W., ECHOLS, N., HEADD, J. J., HUNG, L.-W., KAPRAL, G. J., GROSSE-KUNSTLEVE, R. W., MCCOY, A. J., MORIARTY, N. W., OEFFNER, R., READ, R. J., RICHARDSON, D. C., RICHARDSON, J. S., TERWILLIGER, T. C. & ZWART, P. H. 2010. PHENIX: a comprehensive Python-based system for macromolecular structure solution. Acta Crystallographica Section D-Biological Crystallography. 66: 213-221.
AHMAD, S. & MOKADDAS, E. 2014. Current status and future trends in the diagnosis and treatment of drug-susceptible and multidrug-resistant tuberculosis. J Infect Public Healt. 7: 75-91.
AHMAD, Z., SHARMA, S. & KHULLER, G. K. 2005. In vitro and ex vivo antimycobacterial potential of azole drugs against Mycobacterium tuberculosis H37Rv. FEMS Microbiol Let. 251: 19-22.
AHMAD, Z., SHARMA, S. & KHULLER, G. K. 2006a. Azole antifungals as novel chemotherapeutic agents against murine tuberculosis. FEMS Microbiol Lett. 261: 181-186.
AHMAD, Z., SHARMA, S. & KHULLER, G. K. 2006b. The potential of azole antifungals against latent/persistent tuberculosis. FEMS Microbiol Lett. 258: 200-203.
AHMAD, Z., SHARMA, S., KHULLER, G. K., SINGH, P., FAUJDAR, J. & KATOCH, V. M. 2006c. Antimycobacterial activity of econazole against multidrug-resistant strains of Mycobacterium tuberculosis. Int J Antimicrob Agent. 28: 543-544.
AINSA, J. A., BLOKPOEL, M. C., OTAL, I., YOUNG, D. B., DE SMET, K. A. & MARTIN, C. 1998. Molecular cloning and characterization of Tap, a putative multidrug efflux pump present in Mycobacterium fortuitum and Mycobacterium tuberculosis. J Bacteriol. 180: 5836-5843.
ALDERWICK, L. J., BIRCH, H. L., MISHRA, A. K., EGGELING, L. & BESRA, G. S. 2007. Structure, function and biosynthesis of the Mycobacterium tuberculosis cell wall: arabinogalactan and lipoarabinomannan assembly with a view to discovering new drug targets. Biochem Soc Trans. 35: 1325-1328.
ALMEIDA DA SILVA, P. E. & PALOMINO, J. C. 2011. Molecular basis and mechanisms of drug resistance in Mycobacterium tuberculosis: classical and new drugs. J Antimicrob Chemother. 66:1417-1430.
ANAND, P., SANKARAN, S., MUKHERJEE, S., YETURU, K., LASKOWSKI, R., BHARDWAJ, A., BHAGAVAT, R., BRAHMACHARI, S. K. & CHANDRA, N. 2011. Structural annotation of Mycobacterium tuberculosis proteome. PLoS One. 6: e27044.
ANDERSON, J. L. & CHAPMAN, S. K. 2005. Ligand probes for heme proteins. Dalton Trans. 1:13-24.
ANDERSSON, K. K. & BARRA, A. L. 2002. The use of high field/frequency EPR in studies of radical and metal sites in proteins and small inorganic models. Spectrochim Acta A Mol Biomol Spectrosc. 58: 1101-1112.
ANDRIES, K., VERHASSELT, P., GUILLEMONT, J., GOHLMANN, H. W., NEEFS, J. M., WINKLER, H., VAN GESTEL, J., TIMMERMAN, P., ZHU, M., LEE, E., WILLIAMS, P., DE CHAFFOY, D., HUITRIC, E., HOFFNER, S., CAMBAU, E., TRUFFOT-PERNOT, C., LOUNIS, N. & JARLIER, V. 2005. A diarylquinoline drug active on the ATP synthase of Mycobacterium tuberculosis. Science.307: 223-227.
AOYAMA, Y., HORIUCHI, T., GOTOH, O., NOSHIRO, M. & YOSHIDA, Y. 1998. CYP51-like gene of Mycobacterium tuberculosis actually encodes a P450 similar to eukaryotic CYP51. J Biochem.124: 694-696.
376
AOYAMA, Y., NOSHIRO, M., GOTOH, O., IMAOKA, S., FUNAE, Y., KUROSAWA, N., HORIUCHI, T. & YOSHIDA, Y. 1996. Sterol 14-demethylase P450 (P45014DM*) is one of the most ancient and conserved P450 species. J Biochem. 119: 926-933.
ARAKAWA, T. & KITA, Y. 2000. Protection of bovine serum albumin from aggregation by Tween 80. J Pharm Sci, 89, 646-651.
ARRIAZA, B. T., SALO, W., AUFDERHEIDE, A. C. & HOLCOMB, T. A. 1995. Pre-Columbian tuberculosis in northern Chile: molecular and skeletal evidence. American journal of physical anthropology. 98: 37-45.
ARTHUR, K. K., DINH, N. & GABRIELSON, J. P. 2015. Technical decision making with higher order structure data: utilization of differential scanning calorimetry to elucidate critical protein structural changes resulting from oxidation. J Pharm Sci. 104: 1548-1554.
AV-GAY, Y. & SOBOUTI, R. 2000. Cholesterol is accumulated by mycobacteria but its degradation is limited to non-pathogenic fast-growing mycobacteria. Can J Microbiol. 46: 826-831.
BALDING, P. R., PORRO, C. S., MCLEAN, K. J., SUTCLIFFE, M. J., MARECHAL, J. D., MUNRO, A. W. & DE VISSER, S. P. 2008. How do azoles inhibit cytochrome P450 enzymes? A density functional study. J Phys Chem A. 112: 12911-12918.
BARRY, C. E., 3RD, LEE, R. E., MDLULI, K., SAMPSON, A. E., SCHROEDER, B. G., SLAYDEN, R. A. & YUAN, Y. 1998. Mycolic acids: structure, biosynthesis and physiological functions. Prog Lipid Res. 37:143-179.
BAUZA, A., QUINONERO, D., DEYA, P. M. & FRONTERA, A. 2014. Long-range effects in anion-pi interactions: their crucial role in the inhibition mechanism of Mycobacterium tuberculosis malate synthase. Chemistry. 20: 6985-6990.
BELIN, P., LE DU, M. H., FIELDING, A., LEQUIN, O., JACQUET, M., CHARBONNIER, J. B., LECOQ, A., THAI, R., COURCON, M., MASSON, C., DUGAVE, C., GENET, R., PERNODET, J. L. & GONDRY, M. 2009. Identification and structural basis of the reaction catalyzed by CYP121, an essential cytochrome P450 in Mycobacterium tuberculosis. Proc Natl Acad Sci U S A. 106: 7426-7431.
BELLAMINE, A., MANGLA, A. T., NES, W. D. & WATERMAN, M. R. 1999. Characterization and catalytic properties of the sterol 14alpha-demethylase from Mycobacterium tuberculosis. Proc Natl Acad Sci U S A. 96: 8937-8942.
BENESCH, J. L. & ROBINSON, C. V. 2006. Mass spectrometry of macromolecular assemblies: preservation and dissociation. Curr Opin Struct Biol. 16: 245-251.
BERRY, E. A. & TRUMPOWER, B. L. 1987. Simultaneous determination of hemes a, b, and c from pyridine hemochrome spectra. Anal Biochem. 161: 1-15.
BLEICHER, K. H., BOHM, H. J., MULLER, K. & ALANINE, A. I. 2003. Hit and lead generation: beyond high-throughput screening. Nat Rev Drug Discov. 2: 369-378.
BLOCK, H., MAERTENS, B., SPRIESTERSBACH, A., BRINKER, N., KUBICEK, J., FABIS, R., LABAHN, J. & SCHAFER, F. 2009. Immobilized-metal affinity chromatography (IMAC): a review. Methods Enzymol. 463: 439-473.
BLOOM, B. R. & MURRAY, C. J. 1992. Tuberculosis: commentary on a reemergent killer. Science. 257: 1055-1064.
BOLLAG, D. M. 1994. Gel-filtration chromatography. Methods Mol Biol. 36: 1-9. BORCHERT, S. J., ABE, A., ALDRICH, D. S., FOX, L. E., FREEMAN, J. E. & WHITE, R. D. 1986.
Particulate matter in parenteral products: a review. J Parenter Sci Technol. 40: 212-241.
BRAUTIGAM, C. A. 2015. Fitting two- and three-site binding models to isothermal titration calorimetric data. Methods. 76: 124-136.
BRENNAN, P. J. 2003. Structure, function, and biogenesis of the cell wall of Mycobacterium tuberculosis. Tuberculosis (Edinb). 83: 91-97.

377
BRENNAN, P. J. & CRICK, D. C. 2007. The cell-wall core of Mycobacterium tuberculosis in the context of drug discovery. Curr Top Med Chem.7: 475-488.
BRETON, C., SNAJDROVA, L., JEANNEAU, C., KOCA, J. & IMBERTY, A. 2006. Structures and mechanisms of glycosyltransferases. Glycobiology. 16: 29R-37R.
BRUEGGEMEIER, R. W., HACKETT, J. C. & DIAZ-CRUZ, E. S. 2005. Aromatase inhibitors in the treatment of breast cancer. Endocr Rev. 26: 331-345.
BRUGGER, B. 2014. Lipidomics: analysis of the lipid composition of cells and subcellular organelles by electrospray ionization mass spectrometry. Annu Rev Biochem. 83: 79-98.
BRUYLANTS, G., WOUTERS, J. & MICHAUX, C. 2005. Differential scanning calorimetry in life science: Thermodynamics, stability, molecular recognition and application in drug design. Current Medicinal Chemistry. 12: 2011-2020.
BRZOSTEK, A., DZIADEK, B., RUMIJOWSKA-GALEWICZ, A., PAWELCZYK, J. & DZIADEK, J. 2007. Cholesterol oxidase is required for virulence of Mycobacterium tuberculosis. FEMS Microbiol Lett. 275: 106-112.
BRZOSTEK, A., PAWELCZYK, J., RUMIJOWSKA-GALEWICZ, A., DZIADEK, B. & DZIADEK, J. 2009. Mycobacterium tuberculosis is able to accumulate and utilize cholesterol. J Bacteriol. 191: 6584-6591.
BUI, S. H., MCLEAN, K. J., CHEESMAN, M. R., BRADLEY, J. M., RIGBY, S. E., LEVY, C. W., LEYS, D. & MUNRO, A. W. 2012. Unusual spectroscopic and ligand binding properties of the cytochrome P450-flavodoxin fusion enzyme XplA. J Biol Chem. 287: 19699-19714.
BURNS, K. E., LIU, W. T., BOSHOFF, H. I., DORRESTEIN, P. C. & BARRY, C. E., 3RD 2009. Proteasomal protein degradation in Mycobacteria is dependent upon a prokaryotic ubiquitin-like protein. J Biol Chem. 284:3069-3075.
BYRNE, S. T., DENKIN, S. M., GU, P., NUERMBERGER, E. & ZHANG, Y. 2007. Activity of ketoconazole against Mycobacterium tuberculosis in vitro and in the mouse model. J Med Microbiol. 56: 1047-1051.
CAMPBELL, P. J., MORLOCK, G. P., SIKES, R. D., DALTON, T. L., METCHOCK, B., STARKS, A. M., HOOKS, D. P., COWAN, L. S., PLIKAYTIS, B. B. & POSEY, J. E. 2011. Molecular detection of mutations associated with first- and second-line drug resistance compared with conventional drug susceptibility testing of Mycobacterium tuberculosis. Antimicrob Agents Chemother. 55: 2032-2041.
CAPYK, J. K., KALSCHEUER, R., STEWART, G. R., LIU, J., KWON, H., ZHAO, R., OKAMOTO, S., JACOBS, W. R., JR., ELTIS, L. D. & MOHN, W. W. 2009. Mycobacterial cytochrome P450 125 (CYP125) catalyzes the terminal hydroxylation of C27 steroids. J Biol Chem. 284: 35534-35542.
CARPENTER, J. F., KENDRICK, B. S., CHANG, B. S., MANNING, M. C. & RANDOLPH, T. W. 1999. Inhibition of stress-induced aggregation of protein therapeutics. Methods Enzymol. 309: 236-255.
CAVUSOGLU, C., KARACA-DERICI, Y. & BILGIC, A. 2004. In-vitro activity of rifabutin against rifampicin-resistant Mycobacterium tuberculosis isolates with known rpoB mutations. Clin Microbiol Infect. 10:662-665.
CEDERBAUM, A. I. 2014. Molecular mechanisms of the microsomal mixed function oxidases and biological and pathological implications. Redox Biol. 4c: 60-73.
CHAN, B., KHADEM, T. M. & BROWN, J. 2013. A review of tuberculosis: Focus on bedaquiline. American journal of health-system pharmacy : AJHP : official journal of the American Society of Health-System Pharmacists. 70: 1984-1994.
CHANG, J. C., HARIK, N. S., LIAO, R. P. & SHERMAN, D. R. 2007. Identification of Mycobacterial genes that alter growth and pathology in macrophages and in mice. J Infect Dis. 196: 788-795.
378
CHANG, J. C., MINER, M. D., PANDEY, A. K., GILL, W. P., HARIK, N. S., SASSETTI, C. M. & SHERMAN, D. R. 2009. igr Genes and Mycobacterium tuberculosis cholesterol metabolism. J Bacteriol. 191: 5232-5239.
CHARMAN, S. A., MASON, K. L. & CHARMAN, W. N. 1993. Techniques for assessing the effects of pharmaceutical excipients on the aggregation of porcine growth hormone. Pharm Res. 10: 954-962.
CHECK, E. 2007. After decades of drought, new drug possibilities flood TB pipeline. Nat Med. 13: 266.
CHENG, Y. & PIETERS, J. 2010. Novel proteasome inhibitors as potential drugs to combat tuberculosis. J Mol Cell Biol. 2: 173-175.
COLE, S. T., BROSCH, R., PARKHILL, J., GARNIER, T., CHURCHER, C., HARRIS, D., GORDON, S. V., EIGLMEIER, K., GAS, S., BARRY, C. E., 3RD, TEKAIA, F., BADCOCK, K., BASHAM, D., BROWN, D., CHILLINGWORTH, T., CONNOR, R., DAVIES, R., DEVLIN, K., FELTWELL, T., GENTLES, S., HAMLIN, N., HOLROYD, S., HORNSBY, T., JAGELS, K., KROGH, A., MCLEAN, J., MOULE, S., MURPHY, L., OLIVER, K., OSBORNE, J., QUAIL, M. A., RAJANDREAM, M. A., ROGERS, J., RUTTER, S., SEEGER, K., SKELTON, J., SQUARES, R., SQUARES, S., SULSTON, J. E., TAYLOR, K., WHITEHEAD, S. & BARRELL, B. G. 1998. Deciphering the biology of Mycobacterium tuberculosis from the complete genome sequence. Nature. 393: 537-544.
COLE, S. T. & RICCARDI, G. 2011. New tuberculosis drugs on the horizon. Curr Opin Microbiol. 14: 560-566.
COMO, J. A. & DISMUKES, W. E. 1994. Oral azole drugs as systemic antifungal therapy. N Engl J Med. 330: 263-272.
CONDE, M. B., EFRON, A., LOREDO, C., DE SOUZA, G. R., GRACA, N. P., CEZAR, M. C., RAM, M., CHAUDHARY, M. A., BISHAI, W. R., KRITSKI, A. L. & CHAISSON, R. E. 2009. Moxifloxacin versus ethambutol in the initial treatment of tuberculosis: a double-blind, randomised, controlled phase II trial. Lancet. 373: 1183-1189.
CORBETT, E. L., WATT, C. J., WALKER, N., MAHER, D., WILLIAMS, B. G., RAVIGLIONE, M. C. & DYE, C. 2003. The growing burden of tuberculosis: global trends and interactions with the HIV epidemic. Archives of internal medicine. 163: 1009-1021.
CORREIA, M. A. & ORTIZ DE MONTELLANO, P. R. 2005. Inhibition of cytochrome P450 enzymes. In: PR, O. D. M. (ed.) Cytochrome P450 Structure, Mechanism and Biochemistry. New York: Kluwer Academic/Plenum Publishers.
CUMMINGS, L. J., SNYDER, M. A. & BRISACK, K. 2009. Protein chromatography on hydroxyapatite columns. Methods Enzymol. 463: 387-404.
D'ARCY, A., VILLARD, F. & MARSH, M. 2007. An automated microseed matrix-screening method for protein crystallization. Acta Crystallogr D Biol Crystallogr. 63: 550-554.
DAFF, S. N., CHAPMAN, S. K., TURNER, K. L., HOLT, R. A., GOVINDARAJ, S., POULOS, T. L. & MUNRO, A. W. 1997. Redox control of the catalytic cycle of flavocytochrome P-450 BM3. Biochemistry. 36: 13816-13823.
DANIEL, T. M. 2000. The origins and precolonial epidemiology of tuberculosis in the Americas: can we figure them out? The international journal of tuberculosis and lung disease : the official journal of the International Union against Tuberculosis and Lung Disease. 4: 395-400.
DANIEL, T. M. 2006. The history of tuberculosis. Respiratory medicine. 100: 1862-1870. DARBAN-SAROKHALIL, D., FOOLADI, A. A., BAMERI, Z., NASIRI, M. J. & FEIZABADI, M. M.
2011. Cytochrome CYP141: a new target for direct detection of Mycobacterium tuberculosis from clinical specimens. Acta Microbiol Immunol Hung. 58: 211-217.
DARTOIS, V. 2014. The path of anti-tuberculosis drugs: from blood to lesions to mycobacterial cells. Nat Rev Microbiol. 12: 159-167.

379
DAS, R. K. 2000. Tuberculosis--historical landmarks. Journal of the Indian Medical Association. 98: 112-114.
DAVIS, I. W., LEAVER-FAY, A., CHEN, V. B., BLOCK, J. N., KAPRAL, G. J., WANG, X., MURRAY, L. W., ARENDALL, W. B., 3RD, SNOEYINK, J., RICHARDSON, J. S. & RICHARDSON, D. C. 2007. MolProbity: all-atom contacts and structure validation for proteins and nucleic acids. Nucleic Acids Res. 35: W375-383.
DAVYDOV, D. R., HUI BON HOA, G. & PETERSON, J. A. 1999. Dynamics of protein-bound water in the heme domain of P450BM3 studied by high-pressure spectroscopy: comparison with P450cam and P450 2B4. Biochemistry. 38: 751-761.
DAWSON, J. H., ANDERSSON, L. A. & SONO, M. 1982. Spectroscopic investigations of ferric cytochrome P-450-CAM ligand complexes. Identification of the ligand trans to cysteinate in the native enzyme. J Biol Chem. 257: 3606-3617.
DELANO, W. L. 2002. The PyMOL Molecular Graphics System. DeLano Scientific, San Carlos, CA, USA. http://www.pymol.org.
DENISOV, I. G., MAKRIS, T. M., SLIGAR, S. G. & SCHLICHTING, I. 2005. Structure and chemistry of cytochrome P450. Chem Rev. 105: 2253-2277.
DIACON, A. H., DAWSON, R., HANEKOM, M., NARUNSKY, K., VENTER, A., HITTEL, N., GEITER, L. J., WELLS, C. D., PACCALY, A. J. & DONALD, P. R. 2011. Early bactericidal activity of delamanid (OPC-67683) in smear-positive pulmonary tuberculosis patients. Int J Tuberc Lung Dis. 15: 949-954.
DIACON, A. H., DONALD, P. R., PYM, A., GROBUSCH, M., PATIENTIA, R. F., MAHANYELE, R., BANTUBANI, N., NARASIMOOLOO, R., DE MAREZ, T., VAN HEESWIJK, R., LOUNIS, N., MEYVISCH, P., ANDRIES, K. & MCNEELEY, D. F. 2012a. Randomized pilot trial of eight weeks of bedaquiline (TMC207) treatment for multidrug-resistant tuberculosis: long-term outcome, tolerability, and effect on emergence of drug resistance. Antimicrob Agents Chemother. 56: 3271-3276.
DIACON, A. H., VON GROOTE-BIDLINGMAIER, F. & DONALD, P. R. 2012b. From magic mountain to table mountain. Swiss Med Wkly. 142: w13665.
DONALD, P. R. & DIACON, A. H. 2008. The early bactericidal activity of anti-tuberculosis drugs: a literature review. Tuberculosis. 88: S75-83.
DORMAN, S. E., JOHNSON, J. L., GOLDBERG, S., MUZANYE, G., PADAYATCHI, N., BOZEMAN, L., HEILIG, C. M., BERNARDO, J., CHOUDHRI, S., GROSSET, J. H., GUY, E., GUYADEEN, P., LEUS, M. C., MALTAS, G., MENZIES, D., NUERMBERGER, E. L., VILLARINO, M., VERNON, A. & CHAISSON, R. E. 2009. Substitution of moxifloxacin for isoniazid during intensive phase treatment of pulmonary tuberculosis. Am J Respir Crit Care Med. 180:273-280.
DOSSEY, L. 2013. The royal touch: a look at healing in times past. Explore (NY). 9: 121-7. DOSTER, B., MURRAY, F. J., NEWMAN, R. & WOOLPERT, S. F. 1973. Ethambutol in the initial
treatment of pulmonary tuberculosis. U.S. Public Health Service tuberculosis therapy trials. Am Rev Respir Dis. 107: 177-190.
DOVER, L. G., CERDENO-TARRAGA, A. M., PALLEN, M. J., PARKHILL, J. & BESRA, G. S. 2004. Comparative cell wall core biosynthesis in the mycolated pathogens, Mycobacterium tuberculosis and Corynebacterium diphtheriae. FEMS Microbiol Rev. 28:225-250.
DRISCOLL, M. D., MCLEAN, K. J., CHEESMAN, M. R., JOWITT, T. A., HOWARD, M., CARROLL, P., PARISH, T. & MUNRO, A. W. 2011. Expression and characterization of Mycobacterium tuberculosis CYP144: common themes and lessons learned in the Mtb P450 enzyme family. Biochim Biophys Acta. 1814: 76-87.
DRISCOLL, M. D., MCLEAN, K. J., LEVY, C., MAST, N., PIKULEVA, I. A., LAFITE, P., RIGBY, S. E., LEYS, D. & MUNRO, A. W. 2010. Structural and biochemical characterization of

380
Mycobacterium tuberculosis CYP142: evidence for multiple cholesterol 27-hydroxylase activities in a human pathogen. J Biol Chem.285: 38270-38282.
DUBEY, V. S., SIRAKOVA, T. D., CYNAMON, M. H. & KOLATTUKUDY, P. E. 2003. Biochemical function of msl5 (pks8 plus pks17) in Mycobacterium tuberculosis H37Rv: biosynthesis of monomethyl branched unsaturated fatty acids. J Bacteriol. 185: 4620-4625.
DUBNAU, E., CHAN, J., MOHAN, V. P. & SMITH, I. 2005. Responses of mycobacterium tuberculosis to growth in the mouse lung. Infect Immun. 73: 3754-3757.
DUCATI, R. G., RUFFINO-NETTO, A., BASSO, L. A. & SANTOS, D. S. 2006. The resumption of consumption-a review on tuberculosis. Memorias do Instituto Oswaldo Cruz. 101: 697-714.
DUFFELL, K. M., HUDSON, S. A., MCLEAN, K. J., MUNRO, A. W., ABELL, C. & MATAK-VINKOVIC, D. 2013. Nanoelectrospray ionization mass spectrometric study of Mycobacterium tuberculosis CYP121-ligand interactions. Anal Chem. 85: 5707-5714.
DUMAS, V. G., DEFELIPE, L. A., PETRUK, A. A., TURJANSKI, A. G. & MARTI, M. A. 2014. QM/MM study of the C-C coupling reaction mechanism of CYP121, an essential cytochrome P450 of Mycobacterium tuberculosis. Proteins. 82: 1004-1021.
DUNFORD, A. J., MCLEAN, K. J., SABRI, M., SEWARD, H. E., HEYES, D. J., SCRUTTON, N. S. & MUNRO, A. W. 2007. Rapid P450 heme iron reduction by laser photoexcitation of Mycobacterium tuberculosis CYP121 and CYP51B1. Analysis of CO complexation reactions and reversibility of the P450/P420 equilibrium. J Biol Chem. 282: 24816-24824.
DUONG-LY, K. C. & GABELLI, S. B. 2014. Gel filtration chromatography (size exclusion chromatography) of proteins. Methods Enzymol. 541: 105-114.
DUPEUX, F., ROWER, M., SEROUL, G., BLOT, D. & MARQUEZ, J. A. 2011. A thermal stability assay can help to estimate the crystallization likelihood of biological samples. Acta Crystallogr D Biol Crystallogr. 67: 915-919.
DUTTA, N. K., ALSULTAN, A., GNIADEK, T. J., BELCHIS, D. A., PINN, M. L., MDLULI, K. E., NUERMBERGER, E. L., PELOQUIN, C. A. & KARAKOUSIS, P. C. 2013. Potent rifamycin-sparing regimen cures guinea pig tuberculosis as rapidly as the standard regimen. Antimicrob Agents Chemother. 57: 3910-3916.
DUTTA, N. K. & KARAKOUSIS, P. C. 2014. PA-824 is as effective as isoniazid against latent tuberculosis infection in C3HeB/FeJ mice. Int J Antimicrob Agents. 44: 564-566.
DUTTON, P. L. 1978. Redox potentiometry: determination of midpoint potentials of oxidation-reduction components of biological electron-transfer systems. Methods Enzymol. 54: 411-435.
EFTINK, M. R. 1998. The use of fluorescence methods to monitor unfolding transitions in proteins. Biochemistry (Mosc). 63: 276-284.
EL-HAWIET, A., SHOEMAKER, G. K., DANESHFAR, R., KITOVA, E. N. & KLASSEN, J. S. 2012. Applications of a catch and release electrospray ionization mass spectrometry assay for carbohydrate library screening. Anal Chem. 84: 50-58.
EMSLEY, P. & COWTAN, K. 2004. Coot: model-building tools for molecular graphics. Acta Crystallogr D Biol Crystallogr. 60: 2126-2132.
ERICSSON, U. B., HALLBERG, B. M., DETITTA, G. T., DEKKER, N. & NORDLUND, P. 2006. Thermofluor-based high-throughput stability optimization of proteins for structural studies. Anal Biochem. 357: 289-298.
ERLANSON, D. A. 2012. Introduction to fragment-based drug discovery. Top Curr Chem. 317: 1-32.
FENN, J. B., MANN, M., MENG, C. K., WONG, S. F. & WHITEHOUSE, C. M. 1989. Electrospray ionization for mass spectrometry of large biomolecules. Science. 246: 64-71.

381
FIELD, S. K., FISHER, D., JARAND, J. M. & COWIE, R. L. 2012. New treatment options for multidrug-resistant tuberculosis. Ther Adv Respir Dis. 6:255-268.
FISCHER, M. & HUBBARD, R. E. 2009. Fragment-based ligand discovery. Mol Interv. 9: 22-30.
FLOTOW, H. 2014. The use of high-throughput screening in identifying chemotherapeutic agents for gastric cancer. Future Med Chem. 6: 2103-2112.
FOX, S., FARR-JONES, S., SOPCHAK, L., BOGGS, A., NICELY, H. W., KHOURY, R. & BIROS, M. 2006. High-throughput screening: update on practices and success. J Biomol Screen. 11: 864-869.
FRANK, D. J., MADRONA, Y. & ORTIZ DE MONTELLANO, P. R. 2014. Cholesterol ester oxidation by mycobacterial cytochrome P450. J Biol Chem. 289: 30417-30425.
GABERC-POREKAR, V. & MENART, V. 2001. Perspectives of immobilized-metal affinity chromatography. J Biochem Biophys Methods. 49: 335-360.
GANDOTRA, S., SCHNAPPINGER, D., MONTELEONE, M., HILLEN, W. & EHRT, S. 2007. In vivo gene silencing identifies the Mycobacterium tuberculosis proteasome as essential for the bacteria to persist in mice. Nat Med. 13: 1515 -1520.
GAO, M., NETTLES, R. E., BELEMA, M., SNYDER, L. B., NGUYEN, V. N., FRIDELL, R. A., SERRANO-WU, M. H., LANGLEY, D. R., SUN, J. H., O'BOYLE, D. R., 2ND, LEMM, J. A., WANG, C., KNIPE, J. O., CHIEN, C., COLONNO, R. J., GRASELA, D. M., MEANWELL, N. A. & HAMANN, L. G. 2010. Chemical genetics strategy identifies an HCV NS5A inhibitor with a potent clinical effect. Nature. 465: 96-100.
GARCIA-CONTRERAS, L., SUNG, J. C., MUTTIL, P., PADILLA, D., TELKO, M., VERBERKMOES, J. L., ELBERT, K. J., HICKEY, A. J. & EDWARDS, D. A. 2010. Dry powder PA-824 aerosols for treatment of tuberculosis in guinea pigs. Antimicrob Agents Chemother. 54: 1436-1442.
GARCIA-FERNANDEZ, E., FRANK, D. J., GALAN, B., KELLS, P. M., PODUST, L. M., GARCIA, J. L. & ORTIZ DE MONTELLANO, P. R. 2013. A highly conserved mycobacterial cholesterol catabolic pathway. Environ Microbiol. 15: 2342-2359.
GATFIELD, J. & PIETERS, J. 2000. Essential role for cholesterol in entry of mycobacteria into macrophages. Science. 288: 1647-1650.
GEORGHIOU, S. B., MAGANA, M., GARFEIN, R. S., CATANZARO, D. G., CATANZARO, A. & RODWELL, T. C. 2012. Evaluation of genetic mutations associated with Mycobacterium tuberculosis resistance to amikacin, kanamycin and capreomycin: a systematic review. PLoS One. 7: e33275.
GILL, P., MOGHADAM, T. T. & RANJBAR, B. 2010. Differential scanning calorimetry techniques: applications in biology and nanoscience. J Biomol Tech. 21: 167-193.
GLER, M. T., SKRIPCONOKA, V., SANCHEZ-GARAVITO, E., XIAO, H., CABRERA-RIVERO, J. L., VARGAS-VASQUEZ, D. E., GAO, M., AWAD, M., PARK, S. K., SHIM, T. S., SUH, G. Y., DANILOVITS, M., OGATA, H., KURVE, A., CHANG, J., SUZUKI, K., TUPASI, T., KOH, W. J., SEAWORTH, B., GEITER, L. J. & WELLS, C. D. 2012. Delamanid for multidrug-resistant pulmonary tuberculosis. N Engl J Med. 366: 2151-2160.
GOKHALE, R. S., SAXENA, P., CHOPRA, T. & MOHANTY, D. 2007. Versatile polyketide enzymatic machinery for the biosynthesis of complex mycobacterial lipids. Nat Prod Rep. 24: 267-277.
GOYAL, M., CHAUDHURI, T. K. & KUWAJIMA, K. 2014. Irreversible denaturation of maltodextrin glucosidase studied by differential scanning calorimetry, circular dichroism, and turbidity measurements. PLoS One. 9: e115877.
GROSSET, J. H. & AMMERMAN, N. C. 2013. Dose-ranging activity of the newly registered antituberculosis drug bedaquiline (TMC207). Expert Rev Anti Infect Ther. 11: 649-651.
382
GUARDIOLA-DIAZ, H. M., FOSTER, L. A., MUSHRUSH, D. & VAZ, A. D. 2001. Azole-antifungal binding to a novel cytochrome P450 from Mycobacterium tuberculosis: implications for treatment of tuberculosis. Biochem Pharmacol. 61: 1463-1470.
GUENGERICH, F. P. & MUNRO, A. W. 2013. Unusual cytochrome p450 enzymes and reactions. J Biol Chem. 288: 17065-17073.
GURTLER, V., MAYALL, B. C. & SEVIOUR, R. 2004. Can whole genome analysis refine the taxonomy of the genus Rhodococcus? FEMS Microbiol Rev. 28: 377-403.
HAAGSMA, A. C., ABDILLAHI-IBRAHIM, R., WAGNER, M. J., KRAB, K., VERGAUWEN, K., GUILLEMONT, J., ANDRIES, K., LILL, H., KOUL, A. & BALD, D. 2009. Selectivity of TMC207 towards mycobacterial ATP synthase compared with that towards the eukaryotic homologue. Antimicrob Agents Chemother. 53: 1290-1292.
HAFT, D. H., PAYNE, S. H. & SELENGUT, J. D. 2012. Archaeosortases and exosortases are widely distributed systems linking membrane transit with posttranslational modification. J Bacteriol. 194: 36-48.
HANG, B. J., HONG, Q., XIE, X. T., HUANG, X., WANG, C. H., HE, J. & LI, S. P. 2012. SulE, a sulfonylurea herbicide de-esterification esterase from Hansschlegelia zhihuaiae S113. Appl Environ Microbiol. 78: 1962-1968.
HAWKES, D. B., ADAMS, G. W., BURLINGAME, A. L., ORTIZ DE MONTELLANO, P. R. & DE VOSS, J. J. 2002. Cytochrome P450(cin) (CYP176A), isolation, expression, and characterization. J Biol Chem. 277: 27725-27732.
HAYAT, K. 2012. Interim guidance of WHO on the use of Bedaquiline to manage MDR-TB. Electron micrograph of Mycobacterium tuberculosis. http://medimoon.com/2012/07/a-new-weapon-could-show-promising-results-against-resistant-tb/. Accessed May 21,2015.
HILBRIG, F. & FREITAG, R. 2012. Isolation and purification of recombinant proteins, antibodies and plasmid DNA with hydroxyapatite chromatography. Biotechnol J. 7: 90-102.
HO, M. J. 2004. Sociocultural aspects of tuberculosis: a literature review and a case study of immigrant tuberculosis. Social science & medicine. 59: 753-762.
HOFMANN, K. 2000. A superfamily of membrane-bound O-acyltransferases with implications for wnt signaling. Trends Biochem Sci. 25: 111-112.
HOLSCLAW, C. M., SOGI, K. M., GILMORE, S. A., SCHELLE, M. W., LEAVELL, M. D., BERTOZZI, C. R. & LEARY, J. A. 2008. Structural characterization of a novel sulfated menaquinone produced by stf3 from Mycobacterium tuberculosis. ACS Chem Biol. 3: 619-624.
HOPKINS, A. L., GROOM, C. R. & ALEX, A. 2004. Ligand efficiency: a useful metric for lead selection. Drug Discov Today. 9: 430-431.
HRYCAY, E. G. & BANDIERA, S. M. 2012. The monooxygenase, peroxidase, and peroxygenase properties of cytochrome P450. Arch Biochem Biophys. 522: 71-89.
HU, J., ZHANG, Z., SHEN, W. J., NOMOTO, A. & AZHAR, S. 2011. Differential roles of cysteine residues in the cellular trafficking, dimerization, and function of the high-density lipoprotein receptor, SR-BI. Biochemistry. 50: 10860-10875.
HUDSON, S. A., MASHALIDIS, E. H., BENDER, A., MCLEAN, K. J., MUNRO, A. W. & ABELL, C. 2014. Biofragments: an approach towards predicting protein function using biologically related fragments and its application to Mycobacterium tuberculosis CYP126. Chembiochem. 15: 549-555.
HUDSON, S. A., MCLEAN, K. J., MUNRO, A. W. & ABELL, C. 2012a. Mycobacterium tuberculosis cytochrome P450 enzymes: a cohort of novel TB drug targets. Biochem Soc Trans. 40: 573-579.
HUDSON, S. A., MCLEAN, K. J., SURADE, S., YANG, Y. Q., LEYS, D., CIULLI, A., MUNRO, A. W. & ABELL, C. 2012b. Application of fragment screening and merging to the discovery
383
of inhibitors of the Mycobacterium tuberculosis cytochrome P450 CYP121. Angew Chem Int Ed Engl. 51: 9311-9316.
HUDSON, S. A., SURADE, S., COYNE, A. G., MCLEAN, K. J., LEYS, D., MUNRO, A. W. & ABELL, C. 2013. Overcoming the limitations of fragment merging: rescuing a strained merged fragment series targeting Mycobacterium tuberculosis CYP121. ChemMedChem. 8: 1451-1456.
HUNTER, S. W. & BRENNAN, P. J. 1990. Evidence for the presence of a phosphatidylinositol anchor on the lipoarabinomannan and lipomannan of Mycobacterium tuberculosis. J Biol Chem. 265: 9272-9279.
ISEMAN, M. D. 2002. Tuberculosis therapy: past, present and future. Eur Respir J Suppl. 36: 87s-94s.
JACKSON, M., STADTHAGEN, G. & GICQUEL, B. 2007. Long-chain multiple methyl-branched fatty acid-containing lipids of Mycobacterium tuberculosis: biosynthesis, transport, regulation and biological activities. Tuberculosis. 87: 78-86.
JEFCOATE, C. R. 1978. Measurement of substrate and inhibitor binding to microsomal cytochrome P450 by optical-difference spectroscopy. Methods Enzymol. 52: 258-279.
JENCKS, W. P. 1981. On the attribution and additivity of binding energies. Proc Natl Acad Sci U S A. 78: 4046-4050.
JENKINS, C. M., GENZOR, C. G., FILLAT, M. F., WATERMAN, M. R. & GOMEZ-MORENO, C. 1997. Negatively charged anabaena flavodoxin residues (Asp144 and Glu145) are important for reconstitution of cytochrome P450 17alpha-hydroxylase activity. J Biol Chem. 272: 22509-22513.
JIA, L., TOMASZEWSKI, J. E., HANRAHAN, C., COWARD, L., NOKER, P., GORMAN, G., NIKONENKO, B. & PROTOPOPOVA, M. 2005. Pharmacodynamics and pharmacokinetics of SQ109, a new diamine-based antitubercular drug. Br J Pharmacol. 144:80-87.
JNAWALI, H. N., YOO, H., RYOO, S., LEE, K. J., KIM, B. J., KOH, W. J., KIM, C. K., KIM, H. J. & PARK, Y. K. 2013. Molecular genetics of Mycobacterium tuberculosis resistant to aminoglycosides and cyclic peptide capreomycin antibiotics in Korea. World J Microbiol Biotechnol. 29: 975-982.
JOHNSON, C. M. 2013. Differential scanning calorimetry as a tool for protein folding and stability. Arch Biochem Biophys. 531: 100-109.
JOHNSTON, J. B., KELLS, P. M., PODUST, L. M. & ORTIZ DE MONTELLANO, P. R. 2009. Biochemical and structural characterization of CYP124: a methyl-branched lipid omega-hydroxylase from Mycobacterium tuberculosis. Proc Natl Acad Sci U S A. 106: 20687-20692.
JOHNSTON, J. B., OUELLET, H. & ORTIZ DE MONTELLANO, P. R. 2010. Functional redundancy of steroid C26-monooxygenase activity in Mycobacterium tuberculosis revealed by biochemical and genetic analyses. J Biol Chem. 285: 36352-36360.
JOHNSTON, J. B., SINGH, A. A., CLARY, A. A., CHEN, C. K., HAYES, P. Y., CHOW, S., DE VOSS, J. J. & ORTIZ DE MONTELLANO, P. R. 2012. Substrate analog studies of the omega-regiospecificity of Mycobacterium tuberculosis cholesterol metabolizing cytochrome P450 enzymes CYP124A1, CYP125A1 and CYP142A1. Bioorg Med Chem. 20: 4064-4081.
KABSCH, W. 1993. Automatic processing of rotation diffraction data from crystals of initially unknown symmetry and cell constants. Journal of Applied Crystallography. 26: 795-800.
KALLBERG, Y., OPPERMANN, U. & PERSSON, B. 2010. Classification of the short-chain dehydrogenase/reductase superfamily using hidden Markov models. FEBS J. 277: 2375-2386.
384
KAUFMANN, S. H. & MCMICHAEL, A. J. 2005. Annulling a dangerous liaison: vaccination strategies against AIDS and tuberculosis. Nat Med. 11: S33-44.
KAUR, M., GARG, T. & NARANG, R. K. 2014. A review of emerging trends in the treatment of tuberculosis. Artificial cells, nanomedicine, and biotechnology. 3: 1-7.
KIM, D. & GUENGERICH, F. P. 2005. Cytochrome P450 activation of arylamines and heterocyclic amines. Annu Rev Pharmacol Toxicol. 45: 27-49.
KIM, D., WU, Z. L. & GUENGERICH, F. P. 2005. Analysis of coumarin 7-hydroxylation activity of cytochrome P450 2A6 using random mutagenesis. J Biol Chem. 280: 40319-40327.
KIM, M. J., WAINWRIGHT, H. C., LOCKETZ, M., BEKKER, L. G., WALTHER, G. B., DITTRICH, C., VISSER, A., WANG, W., HSU, F. F., WIEHART, U., TSENOVA, L., KAPLAN, G. & RUSSELL, D. G. 2010. Caseation of human tuberculosis granulomas correlates with elevated host lipid metabolism. EMBO Mol Med. 2: 258-274.
KITAZUME, T., HAINES, D. C., ESTABROOK, R. W., CHEN, B. & PETERSON, J. A. 2007. Obligatory intermolecular electron-transfer from FAD to FMN in dimeric P450BM-3. Biochemistry. 46: 11892-11901.
KLANSEK, J. J., YANCEY, P., ST CLAIR, R. W., FISCHER, R. T., JOHNSON, W. J. & GLICK, J. M. 1995. Cholesterol quantitation by GLC: artifactual formation of short-chain steryl esters. J Lipid Res. 36: 2261-2266.
KONDRASHOV, F. A., KOONIN, E. V., MORGUNOV, I. G., FINOGENOVA, T. V. & KONDRASHOVA, M. N. 2006. Evolution of glyoxylate cycle enzymes in Metazoa: evidence of multiple horizontal transfer events and pseudogene formation. Biol Direct. 1: 31.
KONDRATIEVA, T., AZHIKINA, T., NIKONENKO, B., KAPRELYANTS, A. & APT, A. 2014. Latent tuberculosis infection: what we know about its genetic control? Tuberculosis. 94: 462-468.
KONSTANTINOS, A. 2010. Testing for tuberculosis. Australian Prescriber. 33: 12-18. KOUL, A., HERGET, T., KLEBL, B. & ULLRICH, A. 2004. Interplay between mycobacteria and
host signalling pathways. Nat Rev Microbiol. 2: 189-202. KREMER, L. & BESRA, G. S. 2002. Re-emergence of tuberculosis: strategies and treatment.
Expert opinion on investigational drugs. 11: 153-157. KRIEGER, I. V., FREUNDLICH, J. S., GAWANDI, V. B., ROBERTS, J. P., SUN, Q., OWEN, J. L.,
FRAILE, M. T., HUSS, S. I., LAVANDERA, J. L., IOERGER, T. R. & SACCHETTINI, J. C. 2012. Structure-guided discovery of phenyl-diketo acids as potent inhibitors of Mtb malate synthase. Chem Biol. 19: 1556-1567.
KUPER, J., TEE, K. L., WILMANNS, M., ROCCATANO, D., SCHWANEBERG, U. & WONG, T. S. 2012. The role of active-site Phe87 in modulating the organic co-solvent tolerance of cytochrome P450 BM3 monooxygenase. Acta Crystallogr Sect F Struct Biol Cryst Commun. 68: 1013-1017.
KWON, Y. S., JEONG, B. H. & KOH, W. J. 2014. Tuberculosis: clinical trials and new drug regimens. Curr Opin Pulm Med. 20: 280-286.
LAMB, D. C., FOWLER, K., KIESER, T., MANNING, N., PODUST, L. M., WATERMAN, M. R., KELLY, D. E. & KELLY, S. L. 2002. Sterol 14alpha-demethylase activity in Streptomyces coelicolor A3(2) is associated with an unusual member of the CYP51 gene family. Biochem J. 364: 555-562.
LAWN, S. D. & ZUMLA, A. I. 2011. Tuberculosis. Lancet. 387:57-72. LAWSON, R. J., LEYS, D., SUTCLIFFE, M. J., KEMP, C. A., CHEESMAN, M. R., SMITH, S. J.,
CLARKSON, J., SMITH, W. E., HAQ, I., PERKINS, J. B. & MUNRO, A. W. 2004. Thermodynamic and biophysical characterization of cytochrome P450 BioI from Bacillus subtilis. Biochemistry. 43: 12410-12426.

385
LECHARTIER, B., HARTKOORN, R. C. & COLE, S. T. 2012. In vitro combination studies of benzothiazinone lead compound BTZ043 against Mycobacterium tuberculosis. Antimicrob Agents Chemother. 56: 5790-5793.
LEE, A. S., TEO, A. S. & WONG, S. Y. 2001. Novel mutations in ndh in isoniazid-resistant Mycobacterium tuberculosis isolates. Antimicrob Agents Chemother. 45: 2157-2159.
LEE, D. S., YAMADA, A., SUGIMOTO, H., MATSUNAGA, I., OGURA, H., ICHIHARA, K., ADACHI, S., PARK, S. Y. & SHIRO, Y. 2003. Substrate recognition and molecular mechanism of fatty acid hydroxylation by cytochrome P450 from Bacillus subtilis. Crystallographic, spectroscopic, and mutational studies. J Biol Chem. 278: 9761-9767.
LEIBERT, E., DANCKERS, M. & ROM, W. N. 2014. New drugs to treat multidrug-resistant tuberculosis: the case for bedaquiline. Ther Clin Risk Manag. 10: 597-602.
LEMM, J. A., O'BOYLE, D., 2ND, LIU, M., NOWER, P. T., COLONNO, R., DESHPANDE, M. S., SNYDER, L. B., MARTIN, S. W., ST LAURENT, D. R., SERRANO-WU, M. H., ROMINE, J. L., MEANWELL, N. A. & GAO, M. 2010. Identification of hepatitis C virus NS5A inhibitors. J Virol. 84: 482-491.
LENAERTS, A. J., GRUPPO, V., MARIETTA, K. S., JOHNSON, C. M., DRISCOLL, D. K., TOMPKINS, N. M., ROSE, J. D., REYNOLDS, R. C. & ORME, I. M. 2005. Preclinical testing of the nitroimidazopyran PA-824 for activity against Mycobacterium tuberculosis in a series of in vitro and in vivo models. Antimicrob Agents Chemother. 49: 2294-2301.
LEPESHEVA, G. I., HARGROVE, T. Y., KLESHCHENKO, Y., NES, W. D., VILLALTA, F. & WATERMAN, M. R. 2008. CYP51: A major drug target in the cytochrome P450 superfamily. Lipids. 43: 1117-1125.
LEPESHEVA, G. I. & WATERMAN, M. R. 2004. CYP51-the omnipotent P450. Mol Cell Endocrinol. 215: 165-170.
LEVY, M., RIGAUDIERE, F., DE LAUZANNE, A., KOEHL, B., MELKI, I., LORROT, M. & FAYE, A. 2015. Ethambutol-related Impaired Visual Function in Childrens Less than 5 Years of Age Treated for a Mycobacterial Infection: Diagnosis and Evolution. Pediatr Infect Dis J. 34: 346-350.
LEW, J. M., KAPOPOULOU, A., JONES, L. M. & COLE, S. T. 2011. TubercuList-10 years after. Tuberculosis (Edinb). 91:1-7.
LIN, G., LI, D., DE CARVALHO, L. P., DENG, H., TAO, H., VOGT, G., WU, K., SCHNEIDER, J., CHIDAWANYIKA, T., WARREN, J. D., LI, H. & NATHAN, C. 2009. Inhibitors selective for mycobacterial versus human proteasomes. Nature. 461: 621-626.
LIPSCOMB, J. D. 1980. Electron paramagnetic resonance detectable states of cytochrome P-450cam. Biochemistry. 19: 3590-3599.
LOCUSON, C. W., HUTZLER, J. M. & TRACY, T. S. 2007. Visible spectra of type II cytochrome P450-drug complexes: evidence that "incomplete" heme coordination is common. Drug Metab Dispos. 35: 614-622.
LOWE, D. J. 1992. ENDOR and EPR of metalloproteins. Prog Biophys Mol Biol. 57: 1-22. MACARRON, R., BANKS, M. N., BOJANIC, D., BURNS, D. J., CIROVIC, D. A., GARYANTES, T.,
GREEN, D. V., HERTZBERG, R. P., JANZEN, W. P., PASLAY, J. W., SCHOPFER, U. & SITTAMPALAM, G. S. 2011. Impact of high-throughput screening in biomedical research. Nat Rev Drug Discov. 10: 188-195.
MAKAROV, V., LECHARTIER, B., ZHANG, M., NERES, J., VAN DER SAR, A. M., RAADSEN, S. A., HARTKOORN, R. C., RYABOVA, O. B., VOCAT, A., DECOSTERD, L. A., WIDMER, N., BUCLIN, T., BITTER, W., ANDRIES, K., POJER, F., DYSON, P. J. & COLE, S. T. 2014. Towards a new combination therapy for tuberculosis with next generation benzothiazinones. EMBO Mol Med. 6:372-383.
386
MALITO, E., CARFI, A. & BOTTOMLEY, M. J. 2015. Protein Crystallography in Vaccine Research and Development. Int J Mol Sci. 16: 13106-13140.
MANCA, C., TSENOVA, L., BARRY, C. E., BERGTOLD, A., FREEMAN, S., HASLETT, P. A. J., MUSSER, J. M., FREEDMAN, V. H. & KAPLAN, G. 1999. Mycobacterium tuberculosis CDC1551 induces a more vigorous host response in vivo and in vitro, but is not more virulent than other clinical isolates. J Immunol. 162 : 6740-6746.
MARGULIS, L. 2002. Frank Ryan: Tuberculosis: the greatest story never told. International Microbiology. 5: 151-152.
MARIANO, M. 1995. The experimental granuloma. A hypothesis to explain the persistence of the lesion. Rev Inst Med Trop Sao Paulo. 37: 161-176.
MARINI, A. M., VISSERS, S., URRESTARAZU, A. & ANDRE, B. 1994. Cloning and expression of the MEP1 gene encoding an ammonium transporter in Saccharomyces cerevisiae. EMBO. 13: 3456-3463.
MARTENS, G. W., ARIKAN, M. C., LEE, J., REN, F., VALLERSKOG, T. & KORNFELD, H. 2008. Hypercholesterolemia impairs immunity to tuberculosis. Infect Immun. 76: 3464-3472.
MATSUMOTO, M., HASHIZUME, H., TOMISHIGE, T., KAWASAKI, M., TSUBOUCHI, H., SASAKI, H., SHIMOKAWA, Y. & KOMATSU, M. 2006. OPC-67683, a nitro-dihydro-imidazooxazole derivative with promising action against tuberculosis in vitro and in mice. PLoS Med. 3: e466.
MAUS, C. E., PLIKAYTIS, B. B. & SHINNICK, T. M. 2005. Molecular analysis of cross-resistance to capreomycin, kanamycin, amikacin, and viomycin in Mycobacterium tuberculosis. Antimicrob Agents Chemother. 49: 3192-3197.
MCCOY, A. J., GROSSE-KUNSTLEVE, R. W., ADAMS, P. D., WINN, M. D., STORONI, L. C. & READ, R. J. 2007. Phaser crystallographic software. J Appl Crystallogr. 40: 658-674.
MCDERMOTT, W. 1969. The story of INH. J Infect Dis. 119: 678-683. MCKINNEY, J. D., HONER ZU BENTRUP, K., MUNOZ-ELIAS, E. J., MICZAK, A., CHEN, B., CHAN,
W. T., SWENSON, D., SACCHETTINI, J. C., JACOBS, W. R., JR. & RUSSELL, D. G. 2000. Persistence of Mycobacterium tuberculosis in macrophages and mice requires the glyoxylate shunt enzyme isocitrate lyase. Nature. 406: 735-738.
MCLEAN, K. J., BELCHER, J., DRISCOLL, M. D., FERNANDEZ, C. C., LE VAN, D., BUI, S., GOLOVANOVA, M. & MUNRO, A. W. 2010. The Mycobacterium tuberculosis cytochromes P450: physiology, biochemistry & molecular intervention. Future Med Chem. 2: 1339-13353.
MCLEAN, K. J., CARROLL, P., LEWIS, D. G., DUNFORD, A. J., SEWARD, H. E., NEELI, R., CHEESMAN, M. R., MARSOLLIER, L., DOUGLAS, P., SMITH, W. E., ROSENKRANDS, I., COLE, S. T., LEYS, D., PARISH, T. & MUNRO, A. W. 2008. Characterization of active site structure in CYP121. A cytochrome P450 essential for viability of Mycobacterium tuberculosis H37Rv. J Biol Chem. 283: 33406-33416.
MCLEAN, K. J., CHEESMAN, M. R., RIVERS, S. L., RICHMOND, A., LEYS, D., CHAPMAN, S. K., REID, G. A., PRICE, N. C., KELLY, S. M., CLARKSON, J., SMITH, W. E. & MUNRO, A. W. 2002a. Expression, purification and spectroscopic characterization of the cytochrome P450 CYP121 from Mycobacterium tuberculosis. J Inorg Biochem. 91: 527-541.
MCLEAN, K. J., CLIFT, D., LEWIS, D. G., SABRI, M., BALDING, P. R., SUTCLIFFE, M. J., LEYS, D. & MUNRO, A. W. 2006a. The preponderance of P450s in the Mycobacterium tuberculosis genome. Trends Microbiol. 14: 220-228.
MCLEAN, K. J., DUNFORD, A. J., NEELI, R., DRISCOLL, M. D. & MUNRO, A. W. 2007a. Structure, function and drug targeting in Mycobacterium tuberculosis cytochrome P450 systems. Arch Biochem Biophys. 464,:228-240.
387
MCLEAN, K. J., GIRVAN, H. M. & MUNRO, A. W. 2007b. Cytochrome P450/redox partner fusion enzymes: biotechnological and toxicological prospects. Expert Opin Drug Metab Toxicol. 3: 847-863.
MCLEAN, K. J., HANS, M. & MUNRO, A. W. 2012. Cholesterol, an essential molecule: diverse roles involving cytochrome P450 enzymes. Biochem Soc Trans. 40: 587-593.
MCLEAN, K. J., LAFITE, P., LEVY, C., CHEESMAN, M. R., MAST, N., PIKULEVA, I. A., LEYS, D. & MUNRO, A. W. 2009. The Structure of Mycobacterium tuberculosis CYP125: molecular basis for cholesterol binding in a P450 needed for host infection. J Biol Chem. 284: 35524-35533.
MCLEAN, K. J., MARSHALL, K. R., RICHMOND, A., HUNTER, I. S., FOWLER, K., KIESER, T., GURCHA, S. S., BESRA, G. S. & MUNRO, A. W. 2002b. Azole antifungals are potent inhibitors of cytochrome P450 mono-oxygenases and bacterial growth in mycobacteria and streptomycetes. Microbiology.148: 2937-2949.
MCLEAN, K. J. & MUNRO, A. W. 2008. Structural biology and biochemistry of cytochrome P450 systems in Mycobacterium tuberculosis. Drug Metab Rev. 40: 427-446.
MCLEAN, K. J., SABRI, M., MARSHALL, K. R., LAWSON, R. J., LEWIS, D. G., CLIFT, D., BALDING, P. R., DUNFORD, A. J., WARMAN, A. J., MCVEY, J. P., QUINN, A. M., SUTCLIFFE, M. J., SCRUTTON, N. S. & MUNRO, A. W. 2005. Biodiversity of cytochrome P450 redox systems. Biochem Soc Trans. 33: 796-801.
MCLEAN, K. J., WARMAN, A. J., SEWARD, H. E., MARSHALL, K. R., GIRVAN, H. M., CHEESMAN, M. R., WATERMAN, M. R. & MUNRO, A. W. 2006b. Biophysical characterization of the sterol demethylase P450 from Mycobacterium tuberculosis, its cognate ferredoxin, and their interactions. Biochemistry. 45: 8427-8443.
MCLEOD, M. P., WARREN, R. L., HSIAO, W. W., ARAKI, N., MYHRE, M., FERNANDES, C., MIYAZAWA, D., WONG, W., LILLQUIST, A. L., WANG, D., DOSANJH, M., HARA, H., PETRESCU, A., MORIN, R. D., YANG, G., STOTT, J. M., SCHEIN, J. E., SHIN, H., SMAILUS, D., SIDDIQUI, A. S., MARRA, M. A., JONES, S. J., HOLT, R., BRINKMAN, F. S., MIYAUCHI, K., FUKUDA, M., DAVIES, J. E., MOHN, W. W. & ELTIS, L. D. 2006. The complete genome of Rhodococcus sp. RHA1 provides insights into a catabolic powerhouse. Proc Natl Acad Sci U S A. 103: 15582-15587.
MRC 1948. Streptomycin treatment of pulmonary tuberculosis : a Medical Research Council Investigation. Br Med J. 2: 769-782.
MILANO, A., PASCA, M. R., PROVVEDI, R., LUCARELLI, A. P., MANINA, G., RIBEIRO, A. L., MANGANELLI, R. & RICCARDI, G. 2009. Azole resistance in Mycobacterium tuberculosis is mediated by the MmpS5-MmpL5 efflux systeMtb (Edinb). 89: 84-90.
MILLS, N. 2006. ChemDraw Ultra 10.0. J. Am. Chem. Soc. 128: 13649–13650. MINER, M. D., CHANG, J. C., PANDEY, A. K., SASSETTI, C. M. & SHERMAN, D. R. 2009. Role of
cholesterol in Mycobacterium tuberculosis infection. Indian J Exp Biol. 47: 407-11. MITCHISON, D. & DAVIES, G. 2012. The chemotherapy of tuberculosis: past, present and
future. Int J Tuberc Lung Dis. 16: 724-732. MITNICK, C. D., MCGEE, B. & PELOQUIN, C. A. 2009. Tuberculosis pharmacotherapy:
strategies to optimize patient care. Expert Opin Pharmacother. 10: 381-401. MOHN, W. W., VAN DER GEIZE, R., STEWART, G. R., OKAMOTO, S., LIU, J., DIJKHUIZEN, L. &
ELTIS, L. D. 2008. The actinobacterial mce4 locus encodes a steroid transporter. J Biol Chem. 283: 35368-35374.
MONIN, L. & KHADER, S. A. 2014. Chemokines in tuberculosis: the good, the bad and the ugly. Semin Immunol. 26: 552-558.
MONK, B. C., TOMASIAK, T. M., KENIYA, M. V., HUSCHMANN, F. U., TYNDALL, J. D., O'CONNELL, J. D., 3RD, CANNON, R. D., MCDONALD, J. G., RODRIGUEZ, A., FINER-MOORE, J. S. & STROUD, R. M. 2014. Architecture of a single membrane spanning
388
cytochrome P450 suggests constraints that orient the catalytic domain relative to a bilayer. Proc Natl Acad Sci U S A. 111: 3865-3870.
MOUGOUS, J. D., GREEN, R. E., WILLIAMS, S. J., BRENNER, S. E. & BERTOZZI, C. R. 2002. Sulfotransferases and sulfatases in mycobacteria. Chem Biol. 9: 767-776.
MOUGOUS, J. D., SENARATNE, R. H., PETZOLD, C. J., JAIN, M., LEE, D. H., SCHELLE, M. W., LEAVELL, M. D., COX, J. S., LEARY, J. A., RILEY, L. W. & BERTOZZI, C. R. 2006. A sulfated metabolite produced by stf3 negatively regulates the virulence of Mycobacterium tuberculosis. Proc Natl Acad Sci U S A. 103: 4258-4263.
MUKHERJEE, T. & BOSHOFF, H. 2011. Nitroimidazoles for the treatment of TB: past, present and future. Future Med Chem. 3: 1427-1454.
MUNOZ, S., RIVAS-SANTIAGO, B. & ENCISO, J. A. 2009. Mycobacterium tuberculosis entry into mast cells through cholesterol-rich membrane microdomains. Scand J Immunol. 70: 256-263.
MUNOZ-ELIAS, E. J. & MCKINNEY, J. D. 2006. Carbon metabolism of intracellular bacteria. Cell Microbiol. 8: 10-22.
MUNRO, A. W., GIRVAN, H. M., MASON, A. E., DUNFORD, A. J. & MCLEAN, K. J. 2013. What makes a P450 tick? Trends Biochem Sci. 38: 140-150.
MUNRO, A. W., GIRVAN, H. M. & MCLEAN, K. J. 2007a. Cytochrome P450--redox partner fusion enzymes. Biochim Biophys Acta. 1770: 345-359.
MUNRO, A. W., GIRVAN, H. M. & MCLEAN, K. J. 2007b. Variations on a (t)heme--novel mechanisms, redox partners and catalytic functions in the cytochrome P450 superfamily. Nat Prod Rep. 24 ; 585-609.
MUNRO, A. W., LEYS, D. G., MCLEAN, K. J., MARSHALL, K. R., OST, T. W., DAFF, S., MILES, C. S., CHAPMAN, S. K., LYSEK, D. A., MOSER, C. C., PAGE, C. C. & DUTTON, P. L. 2002. P450 BM3: the very model of a modern flavocytochrome. Trends Biochem Sci. 27: 250-257.
MUNRO, A. W., MCLEAN, K. J., MARSHALL, K. R., WARMAN, A. J., LEWIS, G., ROITEL, O., SUTCLIFFE, M. J., KEMP, C. A., MODI, S., SCRUTTON, N. S. & LEYS, D. 2003. Cytochromes P450: novel drug targets in the war against multidrug-resistant Mycobacterium tuberculosis. Biochem Soc Trans. 31: 625-630.
MURRAY, C. W. & BLUNDELL, T. L. 2010. Structural biology in fragment-based drug design. Curr Opin Struct Biol. 20: 497-507.
MYLER, P. J. & STACY, R. 2012. A new drug for an old bug. Chem Biol. 19: 1499-1500. NEELI, R., GIRVAN, H. M., LAWRENCE, A., WARREN, M. J., LEYS, D., SCRUTTON, N. S. &
MUNRO, A. W. 2005. The dimeric form of flavocytochrome P450 BM3 is catalytically functional as a fatty acid hydroxylase. FEBS Lett. 579: 5582-5588.
NELSON, D. R. 1999. Cytochrome P450 and the individuality of species. Arch Biochem Biophys.369: 1-10.
NOSHIRO, M., AOYAMA, Y., KAWAMOTO, T., GOTOH, O., HORIUCHI, T. & YOSHIDA, Y. 1997. Structural and evolutionary studies on sterol 14-demethylase P450 (CYP51), the most conserved P450 monooxygenase: I. Structural analyses of the gene and multiple sizes of mRNA. J Biochem. 122: 1114-11121.
NUERMBERGER, E. & MITCHISON, D. A. 2009. Once-weekly treatment of tuberculosis with the diarylquinoline R207910: a real possibility. Am J Respir Crit Care Med. 179: 2-3.
ODDS, F. C., BROWN, A. J. & GOW, N. A. 2003. Antifungal agents: mechanisms of action. Trends Microbiol. 11: 272-279.
OGURA, H., NISHIDA, C. R., HOCH, U. R., PERERA, R., DAWSON, J. H. & ORTIZ DE MONTELLANO, P. R. 2004. EpoK, a cytochrome P450 involved in biosynthesis of the anticancer agents epothilones A and B. Substrate-mediated rescue of a P450 enzyme. Biochemistry. 43: 14712-14721.

389
OMURA, T. & SATO, R. 1964. The carbon monoxide-binding pigment of liver microsomes. II. solubilization, purification, and properties. J Biol Chem. 239: 2379-2385.
ONAJOLE, O. K., GOVENDER, P., VAN HELDEN, P. D., KRUGER, H. G., MAGUIRE, G. E., WIID, I. & GOVENDER, T. 2010. Synthesis and evaluation of SQ109 analogues as potential anti-tuberculosis candidates. Eur J Med Chem. 45: 2075-2079.
ONWUEME, K. C., VOS, C. J., ZURITA, J., FERRERAS, J. A. & QUADRI, L. E. 2005. The dimycocerosate ester polyketide virulence factors of mycobacteria. Prog Lipid Res. 44: 259-302.
ORTIZ DE MONTELLANO, P. R. 2005. Cytochrome P450:Structure, Mechanism and Biochemistry, Kluwer Academic/Plenum Publishers, New York.
OST, T. W., MILES, C. S., MUNRO, A. W., MURDOCH, J., REID, G. A. & CHAPMAN, S. K. 2001. Phenylalanine 393 exerts thermodynamic control over the heme of flavocytochrome P450 BM3. Biochemistry. 40: 13421-13429.
OUELLET, H., GUAN, S., JOHNSTON, J. B., CHOW, E. D., KELLS, P. M., BURLINGAME, A. L., COX, J. S., PODUST, L. M. & DE MONTELLANO, P. R. 2010a. Mycobacterium tuberculosis CYP125A1, a steroid C27 monooxygenase that detoxifies intracellularly generated cholest-4-en-3-one. Mol Microbiol. 77: 730-742.
OUELLET, H., JOHNSTON, J. B. & DE MONTELLANO, P. R. 2011. Cholesterol catabolism as a therapeutic target in Mycobacterium tuberculosis. Trends Microbiol. 19: 530-539.
OUELLET, H., JOHNSTON, J. B. & ORTIZ DE MONTELLANO, P. R. 2010b. The Mycobacterium tuberculosis cytochrome P450 system. Arch Biochem Biophys. 493: 82-95.
OUELLET, H., LANG, J., COUTURE, M. & ORTIZ DE MONTELLANO, P. R. 2009. Reaction of Mycobacterium tuberculosis cytochrome P450 enzymes with nitric oxide. Biochemistry.48: 863-872.
OUELLET, H., PODUST, L. M. & DE MONTELLANO, P. R. 2008. Mycobacterium tuberculosis CYP130: crystal structure, biophysical characterization, and interactions with antifungal azole drugs. J Biol Chem. 283: 5069-5080.
PALOMINO, J. C. & MARTIN, A. 2013. TMC207 becomes bedaquiline, a new anti-TB drug. Future Microbiol. 8: 1071-1080.
PANDEY, A. K. & SASSETTI, C. M. 2008. Mycobacterial persistence requires the utilization of host cholesterol. Proc Natl Acad Sci U S A. 105: 4376-4380.
PAREKH, M. J. & SCHLUGER, N. W. 2013. Treatment of latent tuberculosis infection. Ther Adv Respir Dis. 7: 351-356.
PASCA, M. R., DEGIACOMI, G., RIBEIRO, A. L., ZARA, F., DE MORI, P., HEYM, B., MIRRIONE, M., BRERRA, R., PAGANI, L., PUCILLO, L., TROUPIOTI, P., MAKAROV, V., COLE, S. T. & RICCARDI, G. 2010. Clinical isolates of Mycobacterium tuberculosis in four European hospitals are uniformly susceptible to benzothiazinones. Antimicrob Agents Chemother. 54: 1616-1618.
PATHAN, A. A., WILKINSON, K. A., WILKINSON, R. J., LATIF, M., MCSHANE, H., PASVOL, G., HILL, A. V. & LALVANI, A. 2000. High frequencies of circulating IFN-gamma-secreting CD8 cytotoxic T cells specific for a novel MHC class I-restricted Mycobacterium tuberculosis epitope in Mtb-infected subjects without disease. European journal of immunology. 30: 2713-2721.
PEARCE, M. J., MINTSERIS, J., FERREYRA, J., GYGI, S. P. & DARWIN, K. H. 2008. Ubiquitin-like protein involved in the proteasome pathway of Mycobacterium tuberculosis. Science. 322: 1104-1107.
PEREA, J. R., DIAZ DE RADA, B. S., QUETGLAS, E. G. & JUAREZ, M. J. 2004. Oral versus intravenous therapy in the treatment of systemic mycosis. Clin Microbiol Infect. 10: 96-106.
PERERA, R., SONO, M., SIGMAN, J. A., PFISTER, T. D., LU, Y. & DAWSON, J. H. 2003. Neutral thiol as a proximal ligand to ferrous heme iron: implications for heme proteins that
390
lose cysteine thiolate ligation on reduction. Proc Natl Acad Sci U S A. 100: 3641-3646.
PERSSON, B., HEDLUND, J. & JORNVALL, H. 2008. Medium- and short-chain dehydrogenase/reductase gene and protein families : the MDR superfamily. Cell Mol Life Sci. 65: 3879-3894.
PETERSON, J. A., LU, J. Y., GEISSELSODER, J., GRAHAM-LORENCE, S., CARMONA, C., WITNEY, F. & LORENCE, M. C. 1992. Cytochrome P-450terp. Isolation and purification of the protein and cloning and sequencing of its operon. J Biol Chem. 267: 14193-14203.
PICHOTA, A., DURAISWAMY, J., YIN, Z., KELLER, T. H., ALAM, J., LIUNG, S., LEE, G., DING, M., WANG, G., CHAN, W. L., SCHREIBER, M., MA, I., BEER, D., NGEW, X., MUKHERJEE, K., NANJUNDAPPA, M., TEO, J. W., THAYALAN, P., YAP, A., DICK, T., MENG, W., XU, M., KOEHN, J., PAN, S. H., CLARK, K., XIE, X., SHOEN, C. & CYNAMON, M. 2008. Peptide deformylase inhibitors of Mycobacterium tuberculosis: synthesis, structural investigations, and biological results. Bioorg Med Chem Lett. 18: 6568-65672.
PODUST, L. M., OUELLET, H., VON KRIES, J. P. & DE MONTELLANO, P. R. 2009. Interaction of Mycobacterium tuberculosis CYP130 with heterocyclic arylamines. J Biol Chem. 284: 25211-25219.
PODUST, L. M., POULOS, T. L. & WATERMAN, M. R. 2001. Crystal structure of cytochrome P450 14alpha -sterol demethylase (CYP51) from Mycobacterium tuberculosis in complex with azole inhibitors. Proc Natl Acad Sci U S A. 98: 3068-3073.
POULOS, T. L. 2003. The past and present of P450cam structural biology. Biochem Biophys Res Commun. 312: 35-39.
POULOS, T. L., FINZEL, B. C. & HOWARD, A. J. 1987. High-resolution crystal structure of cytochrome P450cam. J Mol Biol. 195: 687-700.
POULOS, T. L. & JOHNSON, E. F. 2005. Structures of cytochrome P450 enzymes. In: ORTIZ DE MONTELLANO, P. R. (ed.) Cytochrome P450. Structure, Mechanism, and Biochemistry. New York: Kluwer Academic/Plenum Publishers.
PRIVALOV, P. L. & DRAGAN, A. I. 2007. Microcalorimetry of biological macromolecules. Biophys Chem. 126: 16-24.
QUARONI, L. G., SEWARD, H. E., MCLEAN, K. J., GIRVAN, H. M., OST, T. W., NOBLE, M. A., KELLY, S. M., PRICE, N. C., CHEESMAN, M. R., SMITH, W. E. & MUNRO, A. W. 2004. Interaction of nitric oxide with cytochrome P450 BM3. Biochemistry. 43: 16416-16431.
RABIEE-FARADONBEH, M., DARBAN-SAROKHALIL, D., FEIZABADI, M. M., ALVANDI, A., MOMTAZ, H., SOLEIMANI, N. & GHOLIPOUR, A. 2014. Cloning of the Recombinant Cytochrome P450 CYP141 Protein of Mycobacterium tuberculosis as a Diagnostic Target and Vaccine Candidate. Iran Red Crescent Med J. 16: e18001.
RAMACHANDRAN, G., BHAVANI, P. K., HEMANTH KUMAR, A. K., SRINIVASAN, R., RAJA, K., SUDHA, V., VENKATESH, S., CHANDRASEKARAN, C. & SWAMINATHAN, S. 2013. Pharmacokinetics of rifabutin during atazanavir/ritonavir co-administration in HIV-infected TB patients in India. Int J Tuberc Lung Dis. 17: 1564-1568.
RAMJEESINGH, M., HUAN, L. J., GARAMI, E. & BEAR, C. E. 1999. Novel method for evaluation of the oligomeric structure of membrane proteins. Biochem J. 342: 119-123.
RECCHI, C., SCLAVI, B., RAUZIER, J., GICQUEL, B. & REYRAT, J. M. 2003. Mycobacterium tuberculosis Rv1395 is a class III transcriptional regulator of the AraC family involved in cytochrome P450 regulation. J Biol Chem. 278: 33763-33773.
REDDY, V. M., DUBUISSON, T., EINCK, L., WALLIS, R. S., JAKUBIEC, W., LADUKTO, L., CAMPBELL, S. & NACY, C. A. 2012. SQ109 and PNU-100480 interact to kill Mycobacterium tuberculosis in vitro. J Antimicrob Chemother. 67: 1163-1166.

391
REDDY, V. M., EINCK, L., ANDRIES, K. & NACY, C. A. 2010. In vitro interactions between new antitubercular drug candidates SQ109 and TMC207. Antimicrob Agents Chemother. 54: 2840-2846.
REES, D. C., CONGREVE, M., MURRAY, C. W. & CARR, R. 2004. Fragment-based lead discovery. Nat Rev Drug Discov. 3: 660-672.
REEVES, A. Z., CAMPBELL, P. J., WILLBY, M. J. & POSEY, J. E. 2015. Disparities in capreomycin resistance levels associated with the rrs A1401G mutation in clinical isolates of Mycobacterium tuberculosis. Antimicrob Agents Chemother. 59: 444-449.
RICHELDI, L., EWER, K., LOSI, M., BERGAMINI, B. M., ROVERSI, P., DEEKS, J., FABBRI, L. M. & LALVANI, A. 2004. T cell-based tracking of multidrug resistant tuberculosis infection after brief exposure. American journal of respiratory and critical care medicine, 170: 288-295.
RIGDEN, D. J. 2008. The histidine phosphatase superfamily: structure and function. Biochem J. 409: 333-348.
RIVA, M. A. 2014. From milk to rifampicin and back again: history of failures and successes in the treatment for tuberculosis. J Antibiot. 67: 661-665.
ROOK, G. A., DHEDA, K. & ZUMLA, A. 2005. Immune responses to tuberculosis in developing countries: implications for new vaccines. Nature reviews. Immunology. 5: 661-7.
ROSLONIEC, K. Z., WILBRINK, M. H., CAPYK, J. K., MOHN, W. W., OSTENDORF, M., VAN DER GEIZE, R., DIJKHUIZEN, L. & ELTIS, L. D. 2009. Cytochrome P450 125 (CYP125) catalyses C26-hydroxylation to initiate sterol side-chain degradation in Rhodococcus jostii RHA1. Mol Microbiol. 74: 1031-1043.
RUSSELL, D. G. 2007. Who puts the tubercle in tuberculosis? Nat Rev Microbiol. 5: 39-47. RUSTOMJEE, R., LIENHARDT, C., KANYOK, T., DAVIES, G. R., LEVIN, J., MTHIYANE, T., REDDY,
C., STURM, A. W., SIRGEL, F. A., ALLEN, J., COLEMAN, D. J., FOURIE, B. & MITCHISON, D. A. 2008. A Phase II study of the sterilising activities of ofloxacin, gatifloxacin and moxifloxacin in pulmonary tuberculosis. Int J Tuberc Lung Dis. 12: 128-138.
SACKSTEDER, K. A., PROTOPOPOVA, M., BARRY, C. E., 3RD, ANDRIES, K. & NACY, C. A. 2012. Discovery and development of SQ109: a new antitubercular drug with a novel mechanism of action. Future Microbiol. 7: 823-837.
SALO, W. L., AUFDERHEIDE, A. C., BUIKSTRA, J. & HOLCOMB, T. A. 1994. Identification of Mycobacterium tuberculosis DNA in a pre-Columbian Peruvian mummy. Proceedings of the National Academy of Sciences of the United States of America. 91: 2091-2094.
SASSETTI, C. M., BOYD, D. H. & RUBIN, E. J. 2003. Genes required for mycobacterial growth defined by high density mutagenesis. Mol Microbiol. 48: 77-84.
SCAPIN, G. 2013. Molecular replacement then and now. Acta Crystallogr D Biol Crystallogr. 69: 2266-2275.
SCHAFER, G., GULER, R., MURRAY, G., BROMBACHER, F. & BROWN, G. D. 2009. The role of scavenger receptor B1 in infection with Mycobacterium tuberculosis in a murine model. PLoS One. 4: e8448.
SCHELLE, M. W. & BERTOZZI, C. R. 2006. Sulfate metabolism in mycobacteria. Chembiochem. 7: 1516-1524.
SCHLUGER, N. W. 2013. Fluoroquinolones in the treatment of tuberculosis: which is best? Am J Respir Crit Care Med. 188: 768-769.
SCHWAB, U., ROHDE, K. H., WANG, Z., CHESS, P. R., NOTTER, R. H. & RUSSELL, D. G. 2009. Transcriptional responses of Mycobacterium tuberculosis to lung surfactant. Microb Pathog. 46:185-193.
SCOTT, D. E., COYNE, A. G., HUDSON, S. A. & ABELL, C. 2012. Fragment-based approaches in drug discovery and chemical biology. Biochemistry. 51: 4990-5003.

392
SEWARD, H. E., ROUJEINIKOVA, A., MCLEAN, K. J., MUNRO, A. W. & LEYS, D. 2006. Crystal structure of the Mycobacterium tuberculosis P450 CYP121-fluconazole complex reveals new azole drug-P450 binding mode. J Biol Chem. 281: 39437-39443.
SHARMA, A., SHARMA, S., KHULLER, G. K. & KANWAR, A. J. 2009. In vitro and ex vivo activity of peptide deformylase inhibitors against Mycobacterium tuberculosis H37Rv. Int J Antimicrob Agents. 34: 226-230.
SILVA-LUCCA, R. A., ANDRADE, S. S., FERREIRA, R. S., SAMPAIO, M. U. & OLIVA, M. L. 2013. Unfolding studies of the cysteine protease baupain, a papain-like enzyme from leaves of Bauhinia forficata: effect of pH, guanidine hydrochloride and temperature. Molecules. 19: 233-246.
SINGH, R., MANJUNATHA, U., BOSHOFF, H. I., HA, Y. H., NIYOMRATTANAKIT, P., LEDWIDGE, R., DOWD, C. S., LEE, I. Y., KIM, P., ZHANG, L., KANG, S., KELLER, T. H., JIRICEK, J. & BARRY, C. E., 3RD 2008. PA-824 kills non-replicating Mycobacterium tuberculosis by intracellular NO release. Science. 322: 1392-1395.
SKRIPCONOKA, V., DANILOVITS, M., PEHME, L., TOMSON, T., SKENDERS, G., KUMMIK, T., CIRULE, A., LEIMANE, V., KURVE, A., LEVINA, K., GEITER, L. J., MANISSERO, D. & WELLS, C. D. 2013. Delamanid improves outcomes and reduces mortality in multidrug-resistant tuberculosis. Eur Respir J. 41: 1393-1400.
SLIGAR, S. G. & GUNSALUS, I. C. 1976. A thermodynamic model of regulation: modulation of redox equilibria in camphor monoxygenase. Proc Natl Acad Sci U S A. 73: 1078-1082.
SMITH, M. C., FURMAN, T. C., INGOLIA, T. D. & PIDGEON, C. 1988. Chelating peptide-immobilized metal ion affinity chromatography. A new concept in affinity chromatography for recombinant proteins. J Biol Chem.263: 7211-7215.
SOLIVERI, J. A., GOMEZ, J., BISHAI, W. R. & CHATER, K. F. 2000. Multiple paralogous genes related to the Streptomyces coelicolor developmental regulatory gene whiB are present in Streptomyces and other actinomycetes. Microbiology. 146: 333-343.
SOMASUNDARAM, S., ANAND, R. S., VENKATESAN, P. & PARAMASIVAN, C. N. 2013. Bactericidal activity of PA-824 against Mycobacterium tuberculosis under anaerobic conditions and computational analysis of its novel analogues against mutant Ddn receptor. BMC Microbiol. 13: 218.
STEWART, G. R., WERNISCH, L., STABLER, R., MANGAN, J. A., HINDS, J., LAING, K. G., YOUNG, D. B. & BUTCHER, P. D. 2002. Dissection of the heat-shock response in Mycobacterium tuberculosis using mutants and microarrays. Microbiology. 148: 3129-3138.
STOVER, C. K., WARRENER, P., VANDEVANTER, D. R., SHERMAN, D. R., ARAIN, T. M., LANGHORNE, M. H., ANDERSON, S. W., TOWELL, J. A., YUAN, Y., MCMURRAY, D. N., KREISWIRTH, B. N., BARRY, C. E. & BAKER, W. R. 2000. A small-molecule nitroimidazopyran drug candidate for the treatment of tuberculosis. Nature. 405: 962-966.
STRUSHKEVICH, N., USANOV, S. A. & PARK, H. W. 2010. Structural basis of human CYP51 inhibition by antifungal azoles. J Mol Biol. 397: 1067-1078.
STUDIER, F. W. & MOFFATT, B. A. 1986. Use of bacteriophage T7 RNA polymerase to direct selective high-level expression of cloned genes. J Mol Biol. 189: 113-130.
TAILLEUX, L., WADDELL, S. J., PELIZZOLA, M., MORTELLARO, A., WITHERS, M., TANNE, A., CASTAGNOLI, P. R., GICQUEL, B., STOKER, N. G., BUTCHER, P. D., FOTI, M. & NEYROLLES, O. 2008. Probing host pathogen cross-talk by transcriptional profiling of both Mycobacterium tuberculosis and infected human dendritic cells and macrophages. PLoS One. 3: e1403.
TAKAYAMA, K., WANG, C. & BESRA, G. S. 2005. Pathway to synthesis and processing of mycolic acids in Mycobacterium tuberculosis. Clin Microbiol Rev. 18: 81-101.
393
TANAKA, H. & TSUKIHARA, T. 2012. Structural studies of large nucleoprotein particles, vaults. Proc Jpn Acad Ser B Phys Biol Sci. 88: 416-433.
TEN BOKUM, A. M., MOVAHEDZADEH, F., FRITA, R., BANCROFT, G. J. & STOKER, N. G. 2008. The case for hypervirulence through gene deletion in Mycobacterium tuberculosis. Trends Microbiol. 16: 436-441.
THOMAS, S. T., VANDERVEN, B. C., SHERMAN, D. R., RUSSELL, D. G. & SAMPSON, N. S. 2011. Pathway profiling in Mycobacterium tuberculosis: elucidation of cholesterol-derived catabolite and enzymes that catalyze its metabolism. J Biol Chem. 286: 43668-43678.
TROWER, M. K., LENSTRA, R., OMER, C., BUCHHOLZ, S. E. & SARIASLANI, F. S. 1992. Cloning, nucleotide sequence determination and expression of the genes encoding cytochrome P-450soy (soyC) and ferredoxinsoy (soyB) from Streptomyces griseus. Mol Microbiol. 6: 2125-2134.
TYAGI, S., NUERMBERGER, E., YOSHIMATSU, T., WILLIAMS, K., ROSENTHAL, I., LOUNIS, N., BISHAI, W. & GROSSET, J. 2005. Bactericidal activity of the nitroimidazopyran PA-824 in a murine model of tuberculosis. Antimicrob Agents Chemother. 49: 2289-93.
ULRICHS, T. & KAUFMANN, S. H. 2002. Mycobacterial persistence and immunity. Front Biosci. 7: d458-d469.
ULRICHS, T. & KAUFMANN, S. H. 2006. New insights into the function of granulomas in human tuberculosis. J Pathol. 208: 261-269.
UPTON, A. M., CHO, S., YANG, T. J., KIM, Y., WANG, Y., LU, Y., WANG, B., XU, J., MDLULI, K., MA, Z. & FRANZBLAU, S. G. 2015. In Vitro and In Vivo Activities of the Nitroimidazole TBA-354 against Mycobacterium tuberculosis. Antimicrob Agents Chemother. 59: 136-144.
UZUN, M., ERTURAN, Z. & ANG, O. 2002. Investigation of cross-resistance between rifampin and rifabutin in Mycobacterium tuberculosis complex strains. Int J Tuberc Lung Dis. 6: 164-165.
VAN DER GEIZE, R. & DIJKHUIZEN, L. 2004. Harnessing the catabolic diversity of rhodococci for environmental and biotechnological applications. Curr Opin Microbiol. 7: 255-261.
VAN DER GEIZE, R., YAM, K., HEUSER, T., WILBRINK, M. H., HARA, H., ANDERTON, M. C., SIM, E., DIJKHUIZEN, L., DAVIES, J. E., MOHN, W. W. & ELTIS, L. D. 2007. A gene cluster encoding cholesterol catabolism in a soil actinomycete provides insight into Mycobacterium tuberculosis survival in macrophages. Proc Natl Acad Sci U S A. 104: 1947-1952.
VAN DER WATT, J. J., HARRISON, T. B., BENATAR, M. & HECKMANN, J. M. 2011. Polyneuropathy, anti-tuberculosis treatment and the role of pyridoxine in the HIV/AIDS era: a systematic review. Int J Tuberc Lung Dis. 15:722-728.
VAN INGEN, J., AARNOUTSE, R. E., DONALD, P. R., DIACON, A. H., DAWSON, R., PLEMPER VAN BALEN, G., GILLESPIE, S. H. & BOEREE, M. J. 2011. Why Do We Use 600 mg of Rifampicin in Tuberculosis Treatment? Clin Infect Dis. 52: e194-e199.
VANHOVE, G. F., SCHAPIRO, J. M., WINTERS, M. A., MERIGAN, T. C. & BLASCHKE, T. F. 1996. Patient compliance and drug failure in protease inhibitor monotherapy. JAMA. 276: 1955-1956.
VELAZQUEZ-CAMPOY, A., LEAVITT, S. A. & FREIRE, E. 2004. Characterization of protein-protein interactions by isothermal titration calorimetry. Methods Mol Biol. 261: 35-54.
VETTING, M. W., HEGDE, S. S. & BLANCHARD, J. S. 2010. The structure and mechanism of the Mycobacterium tuberculosis cyclodityrosine synthetase. Nat Chem Biol. 6: 797-799.
394
WALTERS, S. B., DUBNAU, E., KOLESNIKOVA, I., LAVAL, F., DAFFE, M. & SMITH, I. 2006. The Mycobacterium tuberculosis PhoPR two-component system regulates genes essential for virulence and complex lipid biosynthesis. Mol Microbiol. 60: 312-330.
WANG, M., SCOTT, W. A., RAO, K. R., UDEY, J., CONNER, G. E. & BREW, K. 1989. Recombinant bovine alpha-lactalbumin obtained by limited proteolysis of a fusion protein expressed at high levels in Escherichia coli. J Biol Chem. 264: 21116-21121.
WANG, T., WU, M. B., CHEN, Z. J., CHEN, H., LIN, J. P. & YANG, L. R. 2015. Fragment-based drug discovery and molecular docking in drug design. Curr Pharm Biotechnol. 16: 11-25.
WANG, W. 1999. Instability, stabilization, and formulation of liquid protein pharmaceuticals. Int J Pharm. 185: 129-188.
WHITEHOUSE, C. M., DREYER, R. N., YAMASHITA, M. & FENN, J. B. 1985. Electrospray interface for liquid chromatographs and mass spectrometers. Anal Chem. 57: 675-679.
WHO 2013. The contribution of bedaquiline to the treatment of MDRTB. http://www.who.int/tb/challenges/mdr/BF_BDQ_Summary.pdf?ua=1. (Acessed January 19th, 2015). Geneva. Switzerland.
WHO 2014a. Global tuberculosis report 2014. www.who.int. (Accessed December 22, 2014). Geneva,Switzerland.
WHO 2014b. The use of delamanid in the treatment of multidrug-resistant tuberculosis. Interim policy guidance.http://www.who.int/tb/features_archive/delamanid/en/. Accessed May 18, 2015. World Health Organization, Geneva, Switzerland.
YAM, K. C., D'ANGELO, I., KALSCHEUER, R., ZHU, H., WANG, J. X., SNIECKUS, V., LY, L. H., CONVERSE, P. J., JACOBS, W. R., JR., STRYNADKA, N. & ELTIS, L. D. 2009. Studies of a ring-cleaving dioxygenase illuminate the role of cholesterol metabolism in the pathogenesis of Mycobacterium tuberculosis. PLoS Pathog. 5: e1000344.
YANG, J., PI, W., XIONG, L., ANG, W., YANG, T., HE, J., LIU, Y., CHANG, Y., YE, W., WANG, Z., LUO, Y. & WEI, Y. 2013. 3H-1,2,4-Dithiazol-3-one compounds as novel potential affordable antitubercular agents. Bioorg Med Chem Lett. 23: 1424-1427.
YANG, X., NESBITT, N. M., DUBNAU, E., SMITH, I. & SAMPSON, N. S. 2009. Cholesterol metabolism increases the metabolic pool of propionate in Mycobacterium tuberculosis. Biochemistry. 48: 3819-3821.
YE, H. 2006. Simultaneous determination of protein aggregation, degradation, and absolute molecular weight by size exclusion chromatography-multiangle laser light scattering. Anal Biochem. 356: 76-85.
YEW, W. W. & LEUNG, C. C. 2008. Management of multidrug-resistant tuberculosis: Update 2007. Respirology. 13: 21-46.
YOSHIDA, S., SUZUKI, K., IWAMOTO, T., TSUYUGUCHI, K., TOMITA, M., OKADA, M. & SAKATANI, M. 2010. Comparison of rifabutin susceptibility and rpoB mutations in multi-drug-resistant Mycobacterium tuberculosis strains by DNA sequencing and the line probe assay. J Infect Chemother. 16: 360-363.
YOUNG, D. B., PERKINS, M. D., DUNCAN, K. & BARRY, C. E., 3RD 2008. Confronting the scientific obstacles to global control of tuberculosis. J Clin Invest. 118: 1255-1265.
ZHANG, M., YUE, J., YANG, Y. P., ZHANG, H. M., LEI, J. Q., JIN, R. L., ZHANG, X. L. & WANG, H. H. 2005. Detection of mutations associated with isoniazid resistance in Mycobacterium tuberculosis isolates from China. J Clin Microbiol. 43:5477-5482.
ZHANG, Y. 2004. Persistent and dormant tubercle bacilli and latent tuberculosis. Front Biosci. 9: 1136-1156.
ZHANG, Y., WADE, M. M., SCORPIO, A., ZHANG, H. & SUN, Z. 2003. Mode of action of pyrazinamide: disruption of Mycobacterium tuberculosis membrane transport and energetics by pyrazinoic acid. J Antimicrob Chemother. 52: 790-795.
395
ZUO, S., HELLMAN, U. & LUNDAHL, P. 2003. On the oligomeric state of the red blood cell glucose transporter GLUT1. Biochim Biophys Acta. 1618: 8-16.

396
Appendix
ATGGGCAGCAGCCATCATCATCATCATCACAGCAGCGGCCTGGTGCCGCGCGGCAGCCATAT
GACTGAAGCTCCGGACGTGGATCTGGCCGACGGCAACTTCTACGCCAGCCGCGAGGCGCGGG
CCGCGTACCGGTGGATGCGGGCCAACCAACCGGTGTTCCGCGATCGCAACGGCCTGGCGGCC
GCGTCGACGTACCAGGCGGTGATCGACGCCGAACGTCAACCCGAGCTGTTCTCCAACGCCGG
CGGCATCCGCCCCGACCAGCCCGCCCTGCCGATGATGATCGACATGGACGATCCCGCACATC
TGTTGCGGCGCAAGCTGGTTAACGCCGGCTTCACCCGCAAGCGGGTGAAGGACAAGGAGGCG
TCGATTGCCGCGCTGTGTGACACCCTGATCGACGCCGTGTGCGAACGCGGCGAGTGTGACTT
CGTGCGGGACCTGGCCGCGCCGCTACCGATGGCGGTGATCGGCGACATGCTCGGGGTGCGTC
CAGAGCAGCGGGACATGTTCTTGCGGTGGTCCGACGATCTGGTGACATTCCTCAGTTCGCAT
GTGTCTCAAGAGGATTTCCAGATCACCATGGACGCCTTCGCGGCCTACAACGACTTCACCCG
GGCCACCATTGCGGCACGGCGAGCGGACCCCACCGACGACCTGGTCAGCGTGCTGGTGAGTT
CCGAAGTTGACGGCGAGCGGCTAAGCGACGACGAGCTGGTCATGGAGACGCTGCTGATCCTG
ATCGGCGGCGACGAGACCACGCGGCATACCTTGAGCGGTGGTACCGAGCAGCTGCTGCGCAA
CCGTGACCAGTGGGACCTGCTGCAGCGCGACCCGTCGTTGCTGCCCGGGGCCATCGAGGAGA
TGCTACGTTGGACCGCCCCGGTAAAGAACATGTGCCGGGTGTTGACCGCGGATACCGAGTTT
CACGGCACGGCGTTGTGTGCCGGCGAGAAGATGATGCTGCTCTTCGAGTCGGCGAACTTCGA
CGAGGCGGTTTTCTGTGAACCGGAAAAGTTTGATGTTCAGCGAAATCCAAACAGCCACTTGG
CGTTTGGCTTCGGCACGCATTTCTGCCTGGGCAATCAGCTGGCCCGGTTGGAGCTGTCGTTG
ATGACGGAACGGGTGTTGCGGCGGCTACCCGACCTGCGGTTGGTCGCCGATGACTCCGTGTT
GCCGCTGCGGCCGGCGAACTTTGTCAGCGGCCTGGAATCCATGCCGGTGGTGTTCACGCCGA
GCCCGCCGCTGGGCTGAGGGATCC
GGCTGCTAACAAAGCCCGAAAGGAAGCTGAGTTGGCTGCTGCCACCGCTGAGCAATAACTAG
CATAACCCCTTGGGGCCTCTAAACGGGTCTTGAGGGGTTTTTTGCTGAAAGGAGGAACTATA
TCCGGATATCCCGCAAGAGGCCCGGCAGTACCGGCATAACCAAGCCTATGCCTACAGCATCC
AGGGTGACGGTGCCGAGGATGACGATGAGCGCATTGTTAGATTTCATACACGGTGCCTGACT
GCGTTAGCAATTTAACTGTGATAAACTACCGCATTAAAGCTTATCGATGATAAGCTGTCAAA
CATGAGAATTCTTGAAGACGAAAGGGCCTCGTGATACGCCTATTTTTATAGGTTAATGTCAT
GATAATAATGGTTTCTTAGACGTCAGGTGGCACTTTTCGGGGAAATGTGCGCGGAACCCCTA
TTTGTTTATTTTTCTAAATACATTCAAATATGTATCCGCTCATGAGACAATAACCCTGATAA
ATGCTTCAATAATATTGAAAAAGGAAGAGTATGAGTATTCAACATTTCCGTGTCGCCCTTAT
TCCCTTTTTTGCGGCATTTTGCCTTCCTGTTTTTGCTCACCCAGAAACGCTGGTGAAAGTAA
AAGATGCTGAAGATCAGTTGGGTGCACGAGTGGGTTACATCGAACTGGATCTCAACAGCGGT
AAGATCCTTGAGAGTTTTCGCCCCGAAGAACGTTTTCCAATGATGAGCACTTTTAAAGTTCT
GCTATGTGGCGCGGTATTATCCCGTGTTGACGCCGGGCAAGAGCAACTCGGTCGCCGCATAC
ACTATTCTCAGAATGACTTGGTTGAGTACTCACCAGTCACAGAAAAGCATCTTACGGATGGC
ATGACAGTAAGAGAATTATGCAGTGCTGCCATAACCATGAGTGATAACACTGCGGCCAACTT
ACTTCTGACAACGATCGGAGGACCGAAGGAGCTAACCGCTTTTTTGCACAACATGGGGGATC
ATGTAACTCGCCTTGATCGTTGGGAACCGGAGCTGAATGAAGCCATACCAAACGACGAGCGT
GACACCACGATGCCTGCAGCAATGGCAACAACGTTGCGCAAACTATTAACTGGCGAACTACT
TACTCTAGCTTCCCGGCAACAATTAATAGACTGGATGGAGGCGGATAAAGTTGCAGGACCAC
TTCTGCGCTCGGCCCTTCCGGCTGGCTGGTTTATTGCTGATAAATCTGGAGCCGGTGAGCGT
GGGTCTCGCGGTATCATTGCAGCACTGGGGCCAGATGGTAAGCCCTCCCGTATCGTAGTTAT
CTACACGACGGGGAGTCAGGCAACTATGGATGAACGAAATAGACAGATCGCTGAGATAGGTG
CCTCACTGATTAAGCATTGGTAACTGTCAGACCAAGTTTACTCATATATACTTTAGATTGAT
TTAAAACTTCATTTTTAATTTAAAAGGATCTAGGTGAAGATCCTTTTTGATAATCTCATGAC
CAAAATCCCTTAACGTGAGTTTTCGTTCCACTGAGCGTCAGACCCCGTAGAAAAGATCAAAG
GATCTTCTTGAGATCCTTTTTTTCTGCGCGTAATCTGCTGCTTGCAAACAAAAAAACCACCG
CTACCAGCGGTGGTTTGTTTGCCGGATCAAGAGCTACCAACTCTTTTTCCGAAGGTAACTGG
CTTCAGCAGAGCGCAGATACCAAATACTGTCCTTCTAGTGTAGCCGTAGTTAGGCCACCACT
TCAAGAACTCTGTAGCACCGCCTACATACCTCGCTCTGCTAATCCTGTTACCAGTGGCTGCT
GCCAGTGGCGATAAGTCGTGTCTTACCGGGTTGGACTCAAGACGATAGTTACCGGATAAGGC
GCAGCGGTCGGGCTGAACGGGGGGTTCGTGCACACAGCCCAGCTTGGAGCGAACGACCTACA
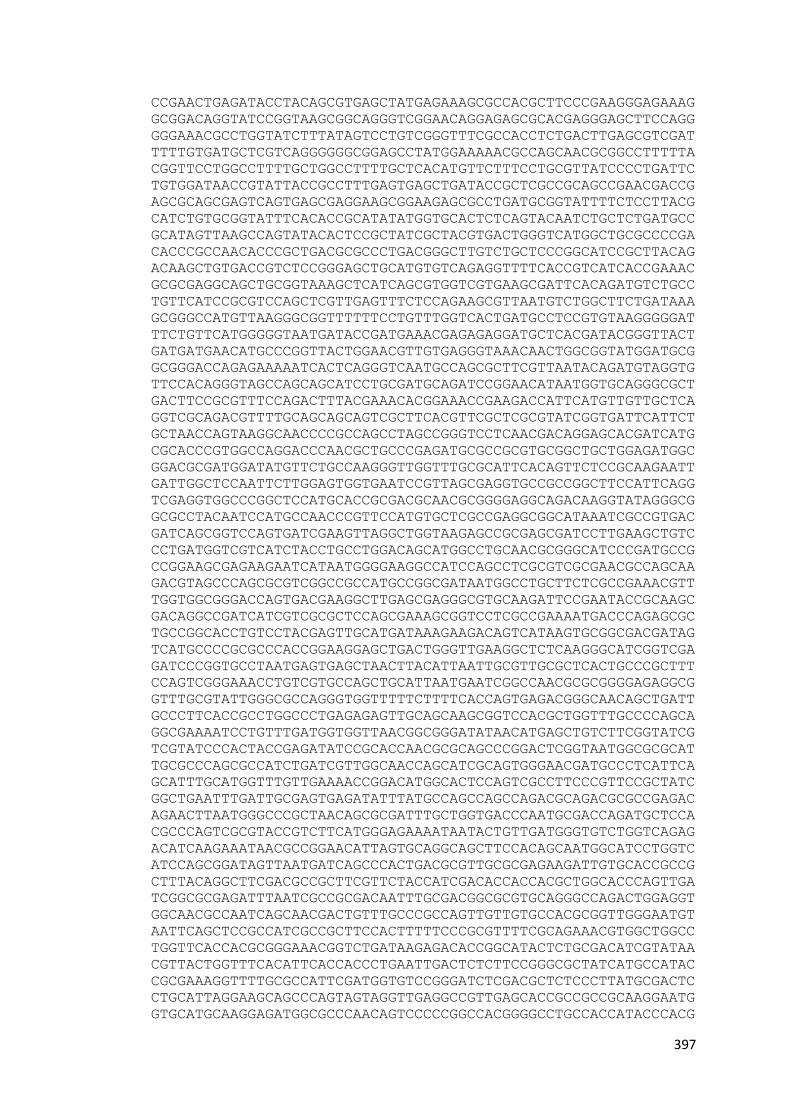
397
CCGAACTGAGATACCTACAGCGTGAGCTATGAGAAAGCGCCACGCTTCCCGAAGGGAGAAAG
GCGGACAGGTATCCGGTAAGCGGCAGGGTCGGAACAGGAGAGCGCACGAGGGAGCTTCCAGG
GGGAAACGCCTGGTATCTTTATAGTCCTGTCGGGTTTCGCCACCTCTGACTTGAGCGTCGAT
TTTTGTGATGCTCGTCAGGGGGGCGGAGCCTATGGAAAAACGCCAGCAACGCGGCCTTTTTA
CGGTTCCTGGCCTTTTGCTGGCCTTTTGCTCACATGTTCTTTCCTGCGTTATCCCCTGATTC
TGTGGATAACCGTATTACCGCCTTTGAGTGAGCTGATACCGCTCGCCGCAGCCGAACGACCG
AGCGCAGCGAGTCAGTGAGCGAGGAAGCGGAAGAGCGCCTGATGCGGTATTTTCTCCTTACG
CATCTGTGCGGTATTTCACACCGCATATATGGTGCACTCTCAGTACAATCTGCTCTGATGCC
GCATAGTTAAGCCAGTATACACTCCGCTATCGCTACGTGACTGGGTCATGGCTGCGCCCCGA
CACCCGCCAACACCCGCTGACGCGCCCTGACGGGCTTGTCTGCTCCCGGCATCCGCTTACAG
ACAAGCTGTGACCGTCTCCGGGAGCTGCATGTGTCAGAGGTTTTCACCGTCATCACCGAAAC
GCGCGAGGCAGCTGCGGTAAAGCTCATCAGCGTGGTCGTGAAGCGATTCACAGATGTCTGCC
TGTTCATCCGCGTCCAGCTCGTTGAGTTTCTCCAGAAGCGTTAATGTCTGGCTTCTGATAAA
GCGGGCCATGTTAAGGGCGGTTTTTTCCTGTTTGGTCACTGATGCCTCCGTGTAAGGGGGAT
TTCTGTTCATGGGGGTAATGATACCGATGAAACGAGAGAGGATGCTCACGATACGGGTTACT
GATGATGAACATGCCCGGTTACTGGAACGTTGTGAGGGTAAACAACTGGCGGTATGGATGCG
GCGGGACCAGAGAAAAATCACTCAGGGTCAATGCCAGCGCTTCGTTAATACAGATGTAGGTG
TTCCACAGGGTAGCCAGCAGCATCCTGCGATGCAGATCCGGAACATAATGGTGCAGGGCGCT
GACTTCCGCGTTTCCAGACTTTACGAAACACGGAAACCGAAGACCATTCATGTTGTTGCTCA
GGTCGCAGACGTTTTGCAGCAGCAGTCGCTTCACGTTCGCTCGCGTATCGGTGATTCATTCT
GCTAACCAGTAAGGCAACCCCGCCAGCCTAGCCGGGTCCTCAACGACAGGAGCACGATCATG
CGCACCCGTGGCCAGGACCCAACGCTGCCCGAGATGCGCCGCGTGCGGCTGCTGGAGATGGC
GGACGCGATGGATATGTTCTGCCAAGGGTTGGTTTGCGCATTCACAGTTCTCCGCAAGAATT
GATTGGCTCCAATTCTTGGAGTGGTGAATCCGTTAGCGAGGTGCCGCCGGCTTCCATTCAGG
TCGAGGTGGCCCGGCTCCATGCACCGCGACGCAACGCGGGGAGGCAGACAAGGTATAGGGCG
GCGCCTACAATCCATGCCAACCCGTTCCATGTGCTCGCCGAGGCGGCATAAATCGCCGTGAC
GATCAGCGGTCCAGTGATCGAAGTTAGGCTGGTAAGAGCCGCGAGCGATCCTTGAAGCTGTC
CCTGATGGTCGTCATCTACCTGCCTGGACAGCATGGCCTGCAACGCGGGCATCCCGATGCCG
CCGGAAGCGAGAAGAATCATAATGGGGAAGGCCATCCAGCCTCGCGTCGCGAACGCCAGCAA
GACGTAGCCCAGCGCGTCGGCCGCCATGCCGGCGATAATGGCCTGCTTCTCGCCGAAACGTT
TGGTGGCGGGACCAGTGACGAAGGCTTGAGCGAGGGCGTGCAAGATTCCGAATACCGCAAGC
GACAGGCCGATCATCGTCGCGCTCCAGCGAAAGCGGTCCTCGCCGAAAATGACCCAGAGCGC
TGCCGGCACCTGTCCTACGAGTTGCATGATAAAGAAGACAGTCATAAGTGCGGCGACGATAG
TCATGCCCCGCGCCCACCGGAAGGAGCTGACTGGGTTGAAGGCTCTCAAGGGCATCGGTCGA
GATCCCGGTGCCTAATGAGTGAGCTAACTTACATTAATTGCGTTGCGCTCACTGCCCGCTTT
CCAGTCGGGAAACCTGTCGTGCCAGCTGCATTAATGAATCGGCCAACGCGCGGGGAGAGGCG
GTTTGCGTATTGGGCGCCAGGGTGGTTTTTCTTTTCACCAGTGAGACGGGCAACAGCTGATT
GCCCTTCACCGCCTGGCCCTGAGAGAGTTGCAGCAAGCGGTCCACGCTGGTTTGCCCCAGCA
GGCGAAAATCCTGTTTGATGGTGGTTAACGGCGGGATATAACATGAGCTGTCTTCGGTATCG
TCGTATCCCACTACCGAGATATCCGCACCAACGCGCAGCCCGGACTCGGTAATGGCGCGCAT
TGCGCCCAGCGCCATCTGATCGTTGGCAACCAGCATCGCAGTGGGAACGATGCCCTCATTCA
GCATTTGCATGGTTTGTTGAAAACCGGACATGGCACTCCAGTCGCCTTCCCGTTCCGCTATC
GGCTGAATTTGATTGCGAGTGAGATATTTATGCCAGCCAGCCAGACGCAGACGCGCCGAGAC
AGAACTTAATGGGCCCGCTAACAGCGCGATTTGCTGGTGACCCAATGCGACCAGATGCTCCA
CGCCCAGTCGCGTACCGTCTTCATGGGAGAAAATAATACTGTTGATGGGTGTCTGGTCAGAG
ACATCAAGAAATAACGCCGGAACATTAGTGCAGGCAGCTTCCACAGCAATGGCATCCTGGTC
ATCCAGCGGATAGTTAATGATCAGCCCACTGACGCGTTGCGCGAGAAGATTGTGCACCGCCG
CTTTACAGGCTTCGACGCCGCTTCGTTCTACCATCGACACCACCACGCTGGCACCCAGTTGA
TCGGCGCGAGATTTAATCGCCGCGACAATTTGCGACGGCGCGTGCAGGGCCAGACTGGAGGT
GGCAACGCCAATCAGCAACGACTGTTTGCCCGCCAGTTGTTGTGCCACGCGGTTGGGAATGT
AATTCAGCTCCGCCATCGCCGCTTCCACTTTTTCCCGCGTTTTCGCAGAAACGTGGCTGGCC
TGGTTCACCACGCGGGAAACGGTCTGATAAGAGACACCGGCATACTCTGCGACATCGTATAA
CGTTACTGGTTTCACATTCACCACCCTGAATTGACTCTCTTCCGGGCGCTATCATGCCATAC
CGCGAAAGGTTTTGCGCCATTCGATGGTGTCCGGGATCTCGACGCTCTCCCTTATGCGACTC
CTGCATTAGGAAGCAGCCCAGTAGTAGGTTGAGGCCGTTGAGCACCGCCGCCGCAAGGAATG
GTGCATGCAAGGAGATGGCGCCCAACAGTCCCCCGGCCACGGGGCCTGCCACCATACCCACG
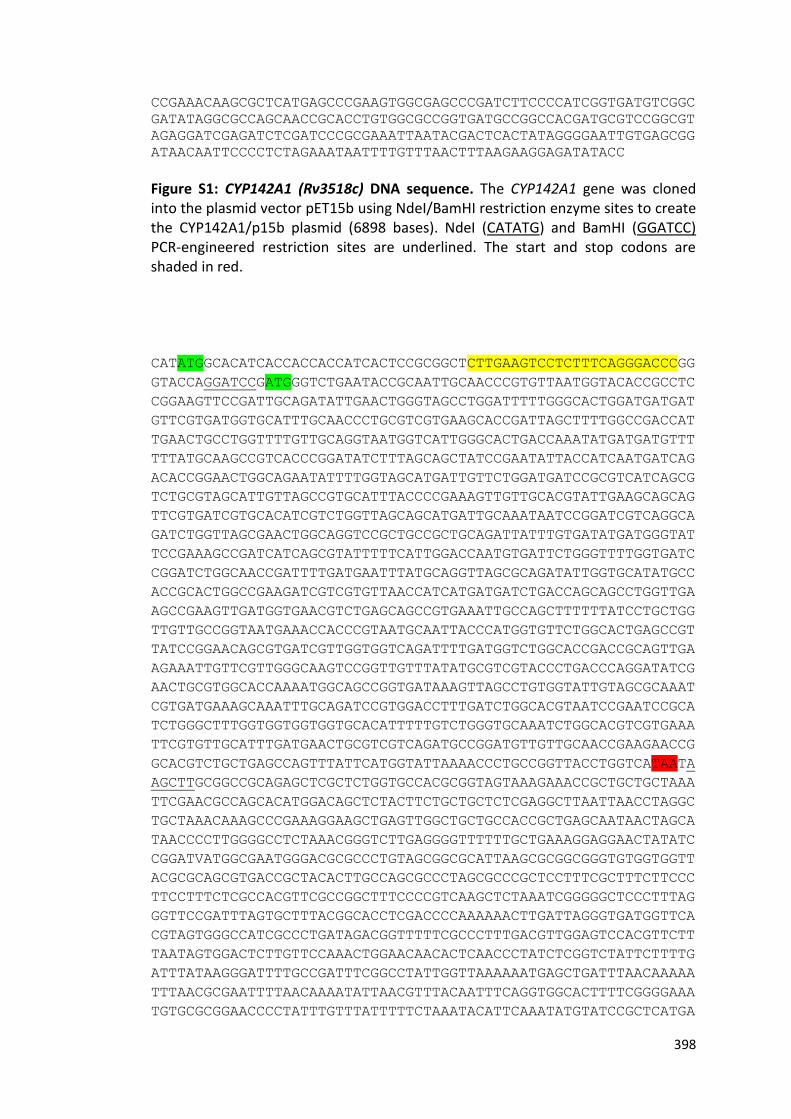
398
CCGAAACAAGCGCTCATGAGCCCGAAGTGGCGAGCCCGATCTTCCCCATCGGTGATGTCGGC
GATATAGGCGCCAGCAACCGCACCTGTGGCGCCGGTGATGCCGGCCACGATGCGTCCGGCGT
AGAGGATCGAGATCTCGATCCCGCGAAATTAATACGACTCACTATAGGGGAATTGTGAGCGG
ATAACAATTCCCCTCTAGAAATAATTTTGTTTAACTTTAAGAAGGAGATATACC
Figure S1: CYP142A1 (Rv3518c) DNA sequence. The CYP142A1 gene was cloned into the plasmid vector pET15b using NdeI/BamHI restriction enzyme sites to create the CYP142A1/p15b plasmid (6898 bases). NdeI (CATATG) and BamHI (GGATCC) PCR-engineered restriction sites are underlined. The start and stop codons are shaded in red.
CATATGGCACATCACCACCACCATCACTCCGCGGCTCTTGAAGTCCTCTTTCAGGGACCCGG
GTACCAGGATCCGATGGGTCTGAATACCGCAATTGCAACCCGTGTTAATGGTACACCGCCTC
CGGAAGTTCCGATTGCAGATATTGAACTGGGTAGCCTGGATTTTTGGGCACTGGATGATGAT
GTTCGTGATGGTGCATTTGCAACCCTGCGTCGTGAAGCACCGATTAGCTTTTGGCCGACCAT
TGAACTGCCTGGTTTTGTTGCAGGTAATGGTCATTGGGCACTGACCAAATATGATGATGTTT
TTTATGCAAGCCGTCACCCGGATATCTTTAGCAGCTATCCGAATATTACCATCAATGATCAG
ACACCGGAACTGGCAGAATATTTTGGTAGCATGATTGTTCTGGATGATCCGCGTCATCAGCG
TCTGCGTAGCATTGTTAGCCGTGCATTTACCCCGAAAGTTGTTGCACGTATTGAAGCAGCAG
TTCGTGATCGTGCACATCGTCTGGTTAGCAGCATGATTGCAAATAATCCGGATCGTCAGGCA
GATCTGGTTAGCGAACTGGCAGGTCCGCTGCCGCTGCAGATTATTTGTGATATGATGGGTAT
TCCGAAAGCCGATCATCAGCGTATTTTTCATTGGACCAATGTGATTCTGGGTTTTGGTGATC
CGGATCTGGCAACCGATTTTGATGAATTTATGCAGGTTAGCGCAGATATTGGTGCATATGCC
ACCGCACTGGCCGAAGATCGTCGTGTTAACCATCATGATGATCTGACCAGCAGCCTGGTTGA
AGCCGAAGTTGATGGTGAACGTCTGAGCAGCCGTGAAATTGCCAGCTTTTTTATCCTGCTGG
TTGTTGCCGGTAATGAAACCACCCGTAATGCAATTACCCATGGTGTTCTGGCACTGAGCCGT
TATCCGGAACAGCGTGATCGTTGGTGGTCAGATTTTGATGGTCTGGCACCGACCGCAGTTGA
AGAAATTGTTCGTTGGGCAAGTCCGGTTGTTTATATGCGTCGTACCCTGACCCAGGATATCG
AACTGCGTGGCACCAAAATGGCAGCCGGTGATAAAGTTAGCCTGTGGTATTGTAGCGCAAAT
CGTGATGAAAGCAAATTTGCAGATCCGTGGACCTTTGATCTGGCACGTAATCCGAATCCGCA
TCTGGGCTTTGGTGGTGGTGGTGCACATTTTTGTCTGGGTGCAAATCTGGCACGTCGTGAAA
TTCGTGTTGCATTTGATGAACTGCGTCGTCAGATGCCGGATGTTGTTGCAACCGAAGAACCG
GCACGTCTGCTGAGCCAGTTTATTCATGGTATTAAAACCCTGCCGGTTACCTGGTCATAATA
AGCTTGCGGCCGCAGAGCTCGCTCTGGTGCCACGCGGTAGTAAAGAAACCGCTGCTGCTAAA
TTCGAACGCCAGCACATGGACAGCTCTACTTCTGCTGCTCTCGAGGCTTAATTAACCTAGGC
TGCTAAACAAAGCCCGAAAGGAAGCTGAGTTGGCTGCTGCCACCGCTGAGCAATAACTAGCA
TAACCCCTTGGGGCCTCTAAACGGGTCTTGAGGGGTTTTTTGCTGAAAGGAGGAACTATATC
CGGATVATGGCGAATGGGACGCGCCCTGTAGCGGCGCATTAAGCGCGGCGGGTGTGGTGGTT
ACGCGCAGCGTGACCGCTACACTTGCCAGCGCCCTAGCGCCCGCTCCTTTCGCTTTCTTCCC
TTCCTTTCTCGCCACGTTCGCCGGCTTTCCCCGTCAAGCTCTAAATCGGGGGCTCCCTTTAG
GGTTCCGATTTAGTGCTTTACGGCACCTCGACCCCAAAAAACTTGATTAGGGTGATGGTTCA
CGTAGTGGGCCATCGCCCTGATAGACGGTTTTTCGCCCTTTGACGTTGGAGTCCACGTTCTT
TAATAGTGGACTCTTGTTCCAAACTGGAACAACACTCAACCCTATCTCGGTCTATTCTTTTG
ATTTATAAGGGATTTTGCCGATTTCGGCCTATTGGTTAAAAAATGAGCTGATTTAACAAAAA
TTTAACGCGAATTTTAACAAAATATTAACGTTTACAATTTCAGGTGGCACTTTTCGGGGAAA
TGTGCGCGGAACCCCTATTTGTTTATTTTTCTAAATACATTCAAATATGTATCCGCTCATGA

399
ATTAATTCTTAGAAAAACTCATCGAGCATCAAATGAAACTGCAATTTATTCATATCAGGATT
ATCAATACCATATTTTTGAAAAAGCCGTTTCTGTAATGAAGGAGAAAACTCACCGAGGCAGT
TCCATAGGATGGCAAGATCCTGGTATCGGTCTGCGATTCCGACTCGTCCAACATCAATACAA
CCTATTAATTTCCCCTCGTCAAAAATAAGGTTATCAAGTGAGAAATCACCATGAGTGACGAC
TGAATCCGGTGAGAATGGCAAAAGTTTATGCATTTCTTTCCAGACTTGTTCAACAGGCCAGC
CATTACGCTCGTCATCAAAATCACTCGCATCAACCAAACCGTTATTCATTCGTGATTGCGCC
TGAGCGAGACGAAATACGCGATCACTGTTAAAAGGACAATTACAAACAGGAATCGAATGCAA
CCGGCGCAGGAACACTGCCAGCGCATCAACAATATTTTCACCTGAATCAGGATATTCTTCTA
ATACCTGGAATGCTGTTTTGCCGGGGATCGCAGTGGTGAGTAACCATGCATCATCAGGAGTA
CGGATAAAATGCTTGATGGTCGGAAGAGGCATAAATTCCGTCAGCCAGTTTAGTCTGACCAT
CTCATCTGTAACATCATTGGCAACGCTACCTTTGCCATGTTTCAGAAACAACTCTGGCGCAT
CGGGCTTCCCATACAATCGATAGATTGTCGCACCTGATTGCCCGACATTATCGCGAGCCCAT
TTATACCCATATAAATCAGCATCCATGTTGGAATTTAATCGCGGCCTAGAGCAAGACGTTTC
CCGTTGAATATGGCTCATAACACCCCTTGTATTACTGTTTATGTAAGCAGACAGTTTTATTG
TTCATGACCAAAATCCCTTAACGTGAGTTTTCGTTCCACTGAGCGTCAGACCCCGTAGAAAA
GATCAAAGGATCTTCTTGAGATCCTTTTTTTCTGCGCGTAATCTGCTGCTTGCAAACAAAAA
AACCACCGCTACCAGCGGTGGTTTGTTTGCCGGATCAAGAGCTACCAACTCTTTTTCCGAAG
GTAACTGGCTTCAGCAGAGCGCAGATACCAAATACTGTCCTTCTAGTGTAGCCGTAGTTAGG
CCACCACTTCAAGAACTCTGTAGCACCGCCTACATACCTCGCTCTGCTAATCCTGTTACCAG
TGGCTGCTGCCAGTGGCGATAAGTCGTGTCTTACCGGGTTGGACTCAAGACGATAGTTACCG
GATAAGGCGCAGCGGTCGGGCTGAACGGGGGGTTCGTGCACACAGCCCAGCTTGGAGCGAAC
GACCTACACCGAACTGAGATACCTACAGCGTGAGCTATGAGAAAGCGCCACGCTTCCCGAAG
GGAGAAAGGCGGACAGGTATCCGGTAAGCGGCAGGGTCGGAACAGGAGAGCGCACGAGGGAG
CTTCCAGGGGGAAACGCCTGGTATCTTTATAGTCCTGTCGGGTTTCGCCACCTCTGACTTGA
GCGTCGATTTTTGTGATGCTCGTCAGGGGGGCGGAGCCTATGGAAAAACGCCAGCAACGCGG
CCTTTTTACGGTTCCTGGCCTTTTGCTGGCCTTTTGCTCACATGTTCTTTCCTGCGTTATCC
CCTGATTCTGTGGATAACCGTATTACCGCCTTTGAGTGAGCTGATACCGCTCGCCGCAGCCG
AACGACCGAGCGCAGCGAGTCAGTGAGCGAGGAAGCGGAAGAGCGCCTGATGCGGTATTTTC
TCCTTACGCATCTGTGCGGTATTTCACACCGCATATATGGTGCACTCTCAGTACAATCTGCT
CTGATGCCGCATAGTTAAGCCAGTATACACTCCGCTATCGCTACGTGACTGGGTCATGGCTG
CGCCCCGACACCCGCCAACACCCGCTGACGCGCCCTGACGGGCTTGTCTGCTCCCGGCATCC
GCTTACAGACAAGCTGTGACCGTCTCCGGGAGCTGCATGTGTCAGAGGTTTTCACCGTCATC
ACCGAAACGCGCGAGGCAGCTGCGGTAAAGCTCATCAGCGTGGTCGTGAAGCGATTCACAGA
TGTCTGCCTGTTCATCCGCGTCCAGCTCGTTGAGTTTCTCCAGAAGCGTTAATGTCTGGCTT
CTGATAAAGCGGGCCATGTTAAGGGCGGTTTTTTCCTGTTTGGTCACTGATGCCTCCGTGTA
AGGGGGATTTCTGTTCATGGGGGTAATGATACCGATGAAACGAGAGAGGATGCTCACGATAC
GGGTTACTGATGATGAACATGCCCGGTTACTGGAACGTTGTGAGGGTAAACAACTGGCGGTA
TGGATGCGGCGGGACCAGAGAAAAATCACTCAGGGTCAATGCCAGCGCTTCGTTAATACAGA
TGTAGGTGTTCCACAGGGTAGCCAGCAGCATCCTGCGATGCAGATCCGGAACATAATGGTGC
AGGGCGCTGACTTCCGCGTTTCCAGACTTTACGAAACACGGAAACCGAAGACCATTCATGTT
GTTGCTCAGGTCGCAGACGTTTTGCAGCAGCAGTCGCTTCACGTTCGCTCGCGTATCGGTGA
TTCATTCTGCTAACCAGTAAGGCAACCCCGCCAGCCTAGCCGGGTCCTCAACGACAGGAGCA
CGATCATGCTAGTCATGCCCCGCGCCCACCGGAAGGAGCTGACTGGGTTGAAGGCTCTCAAG
GGCATCGGTCGAGATCCCGGTGCCTAATGAGTGAGCTAACTTACATTAATTGCGTTGCGCTC
ACTGCCCGCTTTCCAGTCGGGAAACCTGTCGTGCCAGCTGCATTAATGAATCGGCCAACGCG
CGGGGAGAGGCGGTTTGCGTATTGGGCGCCAGGGTGGTTTTTCTTTTCACCAGTGAGACGGG
CAACAGCTGATTGCCCTTCACCGCCTGGCCCTGAGAGAGTTGCAGCAAGCGGTCCACGCTGG
TTTGCCCCAGCAGGCGAAAATCCTGTTTGATGGTGGTTAACGGCGGGATATAACATGAGCTG
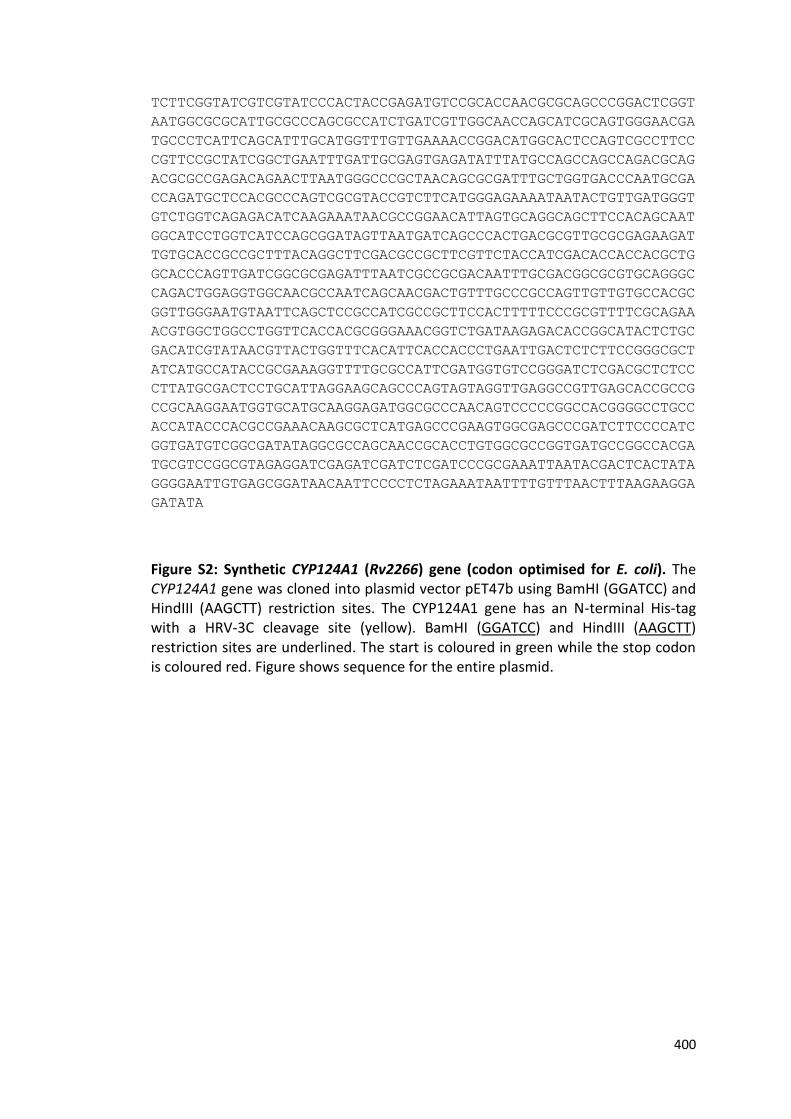
400
TCTTCGGTATCGTCGTATCCCACTACCGAGATGTCCGCACCAACGCGCAGCCCGGACTCGGT
AATGGCGCGCATTGCGCCCAGCGCCATCTGATCGTTGGCAACCAGCATCGCAGTGGGAACGA
TGCCCTCATTCAGCATTTGCATGGTTTGTTGAAAACCGGACATGGCACTCCAGTCGCCTTCC
CGTTCCGCTATCGGCTGAATTTGATTGCGAGTGAGATATTTATGCCAGCCAGCCAGACGCAG
ACGCGCCGAGACAGAACTTAATGGGCCCGCTAACAGCGCGATTTGCTGGTGACCCAATGCGA
CCAGATGCTCCACGCCCAGTCGCGTACCGTCTTCATGGGAGAAAATAATACTGTTGATGGGT
GTCTGGTCAGAGACATCAAGAAATAACGCCGGAACATTAGTGCAGGCAGCTTCCACAGCAAT
GGCATCCTGGTCATCCAGCGGATAGTTAATGATCAGCCCACTGACGCGTTGCGCGAGAAGAT
TGTGCACCGCCGCTTTACAGGCTTCGACGCCGCTTCGTTCTACCATCGACACCACCACGCTG
GCACCCAGTTGATCGGCGCGAGATTTAATCGCCGCGACAATTTGCGACGGCGCGTGCAGGGC
CAGACTGGAGGTGGCAACGCCAATCAGCAACGACTGTTTGCCCGCCAGTTGTTGTGCCACGC
GGTTGGGAATGTAATTCAGCTCCGCCATCGCCGCTTCCACTTTTTCCCGCGTTTTCGCAGAA
ACGTGGCTGGCCTGGTTCACCACGCGGGAAACGGTCTGATAAGAGACACCGGCATACTCTGC
GACATCGTATAACGTTACTGGTTTCACATTCACCACCCTGAATTGACTCTCTTCCGGGCGCT
ATCATGCCATACCGCGAAAGGTTTTGCGCCATTCGATGGTGTCCGGGATCTCGACGCTCTCC
CTTATGCGACTCCTGCATTAGGAAGCAGCCCAGTAGTAGGTTGAGGCCGTTGAGCACCGCCG
CCGCAAGGAATGGTGCATGCAAGGAGATGGCGCCCAACAGTCCCCCGGCCACGGGGCCTGCC
ACCATACCCACGCCGAAACAAGCGCTCATGAGCCCGAAGTGGCGAGCCCGATCTTCCCCATC
GGTGATGTCGGCGATATAGGCGCCAGCAACCGCACCTGTGGCGCCGGTGATGCCGGCCACGA
TGCGTCCGGCGTAGAGGATCGAGATCGATCTCGATCCCGCGAAATTAATACGACTCACTATA
GGGGAATTGTGAGCGGATAACAATTCCCCTCTAGAAATAATTTTGTTTAACTTTAAGAAGGA
GATATA
Figure S2: Synthetic CYP124A1 (Rv2266) gene (codon optimised for E. coli). The CYP124A1 gene was cloned into plasmid vector pET47b using BamHI (GGATCC) and HindIII (AAGCTT) restriction sites. The CYP124A1 gene has an N-terminal His-tag with a HRV-3C cleavage site (yellow). BamHI (GGATCC) and HindIII (AAGCTT) restriction sites are underlined. The start is coloured in green while the stop codon is coloured red. Figure shows sequence for the entire plasmid.
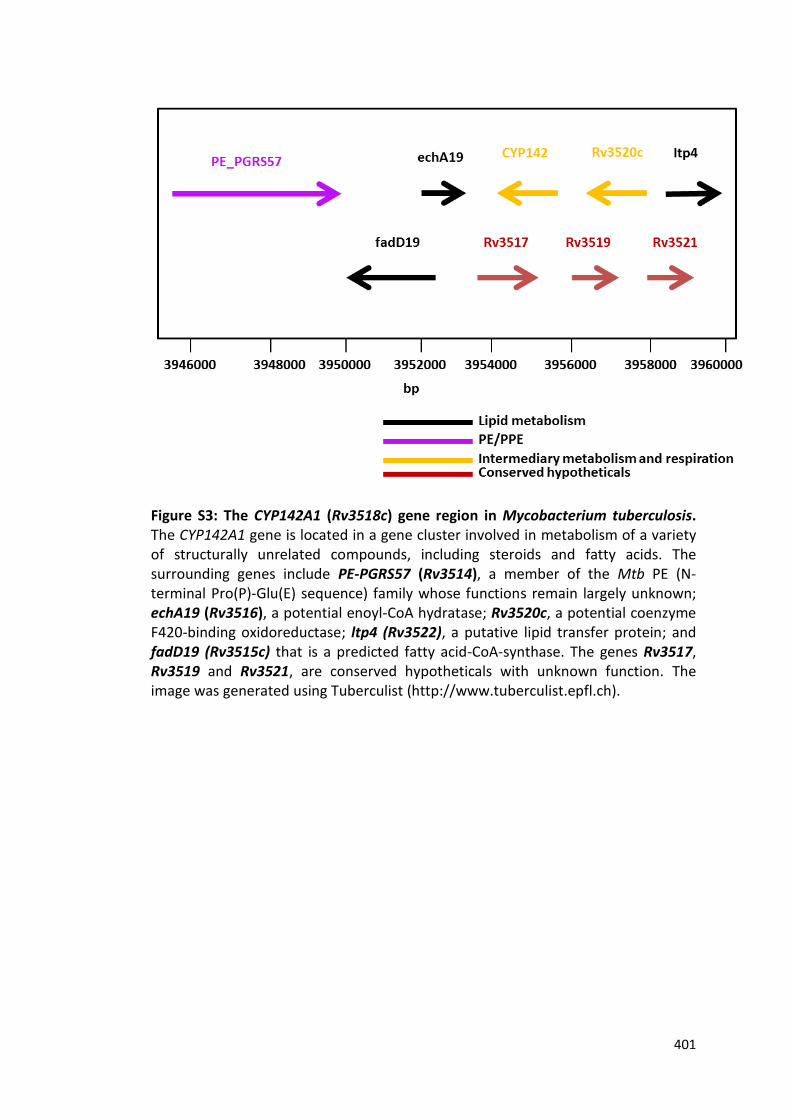
401
Figure S3: The CYP142A1 (Rv3518c) gene region in Mycobacterium tuberculosis. The CYP142A1 gene is located in a gene cluster involved in metabolism of a variety of structurally unrelated compounds, including steroids and fatty acids. The surrounding genes include PE-PGRS57 (Rv3514), a member of the Mtb PE (N-terminal Pro(P)-Glu(E) sequence) family whose functions remain largely unknown; echA19 (Rv3516), a potential enoyl-CoA hydratase; Rv3520c, a potential coenzyme F420-binding oxidoreductase; ltp4 (Rv3522), a putative lipid transfer protein; and fadD19 (Rv3515c) that is a predicted fatty acid-CoA-synthase. The genes Rv3517, Rv3519 and Rv3521, are conserved hypotheticals with unknown function. The image was generated using Tuberculist (http://www.tuberculist.epfl.ch).

402
Figure S4: The CYP124A1 (Rv2266) gene region in Mycobacterium tuberculosis. The CYP124A1 gene is located among a gene cluster that also contains a menaquinone sulfotransferase (Sft3, Rv2267c) and the P450 CYP128A1 which is involved in the hydroxylation of menaquinone MK-9 at the omega-position, leading to its sulfation by the Rv2267c gene product. Other flanking genes include Rv2262c which encodes a conserved hypothetical protein possibly involved in lipid metabolism; and Rv2264c which encodes a conserved hypothetical Pro-rich protein that has a highly Pro-, Thr-rich C-terminus and which is predicted to be an outer membrane protein. Its function remains unknown. The lppN (Rv2270) gene is a predicted lipoprotein. Rv2263 is a putative NADP(H)-dependent oxidoreductase. Rv2265 encodes a likely conserved integral membrane protein. Rv2267c encodes a conserved hypothetical protein of unknown function, as does Rv2269c. The image was generated using tuberculist (http://www.tuberculist.epfl.ch).
Copyright © 2022 FDOKUMEN