structure-function properties of pea protein- derived peptides ...
Upload
independentCategory
view
1download
0
ARTICLE
Circular dichroism spectra of b-peptides: sensitivity to molecularstructure and effects of motional averaging
Received: 5 December 2002 / Revised: 13 February 2003 /Accepted: 13 February 2003 / Published online: 16 September 2003� EBSA 2003
Abstract Circular dichroism spectra of two b-peptides,i.e. peptides composed of b-amino acids, calculatedusing ensembles of configurations obtained by moleculardynamics simulation are presented. The calculationswere based on 200 ns simulations of a b-heptapeptide inmethanol at 298 K and 340 K and a 50 ns simulation ofa b-hexapeptide in methanol at 340 K. In the simula-tions the peptides sampled both folded (helical) andunfolded structures. Trajectory structures with commonbackbone conformations were identified and groupedinto clusters. The CD spectra were calculated for indi-vidual structures, based on peptide-group dipole tran-sition moments obtained from semi-empirical molecularorbital theory and using the so-called matrix method.The single-structure spectra were then averaged overentire trajectories and over clusters of structures. Al-though certain features of the experimental CD spectraof the b-peptides are reproduced by the trajectory-average spectra, there exist clear differences between thetwo sets of spectra in both wavelength and peak inten-sities. The analysis of individual contributions to theaverage spectra shows that, in general, the interpretationof a CD signal in terms of a single structure is notpossible. Moreover, there is a large variation in the CD
spectra calculated for a set of individual structures thatbelong to the same cluster, even when a structurally tightclustering criterion is used. This indicates that the CDspectra of these peptides are very sensitive to small localstructural differences.
Keywords Circular dichroism Æ Cluster analysis ÆComputer simulation Æ Molecular dynamics ÆPeptide folding
Introduction
b-Peptides, i.e. peptides composed of b-amino acids,have recently been a subject of intense investigationusing both experimental (Borman 1997; Gademann et al.1999a, 1999b, 2000; Gellman 1998; Hamuro et al. 1999;Hintermann and Seebach 1997; Iverson 1997; Porteret al. 2000a, 2000b; Seebach et al. 1998b; Werder et al.1999) and theoretical (Applequist et al. 1998; Applequistand Bode 2000; Bode and Applequist 1997; Chandr-asekhar et al. 2001; Daura et al. 1997, 1998, 1999b, 2001;Mohle et al. 1999; Wu and Wang 1998, 1999) tech-niques. Structural studies performed on a variety ofb-peptides have shown that, like peptides of a-aminoacids, b-peptides may adopt stable secondary structuresin solution (Abele et al. 1998; Appella et al. 1996, 1997,1999; Chung et al. 1998; Gung et al. 1999; Krauthauseret al. 1997; Seebach et al. 1996a, 1996b, 1997, 1998a,1998c, 1999). The b-heptapeptide and b-hexapeptideshown in Fig. 1 were the first cases reported of b-pep-tides consisting of non-cyclic b-amino acids that foldinto a left-handed 314 helix (Seebach et al. 1996a) andright-handed 12/10 helix (Rueping et al. 2002; Seebachet al. 1997, 1998a), respectively. The structures of thesepeptides in methanol solution were determined by NMRspectroscopy and correlated with certain features of thecorresponding CD spectra (Seebach et al. 2000a). Toinvestigate the relation between the spectroscopic ob-servables and the underlying ensemble of molecular
Eur Biophys J (2003) 32: 661–670DOI 10.1007/s00249-003-0303-1
Xavier Daura Æ Dirk Bakowies Æ Dieter Seebach
Jorg Fleischhauer Æ Wilfred F. van Gunsteren
Peter Kruger
X. Daura Æ D. Bakowies Æ W. F. van Gunsteren (&) Æ P. KrugerLaboratory of Physical Chemistry,Swiss Federal Institute of Technology Zurich,ETH-Honggerberg, 8093 Zurich, SwitzerlandE-mail: [email protected]: +41-1-6321039
D. SeebachLaboratory of Organic Chemistry,Swiss Federal Institute of Technology Zurich,ETH-Honggerberg, 8093 Zurich, Switzerland
J. Fleischhauer Æ P. KrugerInstitut fur Organische Chemie, RWTH Aachen,52074 Aachen, Germany
Present address: X. DauraInstitucio Catalana de Recerca i Estudis Avancats (ICREA)and Institute of Biotechnology and Biomedicine,Universitat Autonoma de Barcelona, 08193 Bellaterra, Spain

configurations, various molecular dynamics (MD)simulations of up to 200 ns length were performed forthe b-heptapeptide (Daura et al. 1997, 1998) and theb-hexapeptide (Daura et al. 1999b) in methanol fortemperatures ranging from 298 K to 360 K. These sim-ulations showed a thermodynamic equilibrium betweenthe folded conformation, i.e. a 314 helix for the heptamerand a 12/10 helix for the hexamer, and a variety of un-folded conformations, as a function of temperature. Thegenerated ensembles of configurations reproduce accu-rately the data derived from NMR measurements,namely interproton distances and J coupling constants.It was also shown that NMR-derived data are less sen-sitive to the underlying ensemble than commonlythought; in fact, the same data are compatible withvarious different distributions of configurations (Burgiet al. 2001; Daura et al. 1999a). Here, some of the pre-viously generated trajectories (Daura et al. 1998, 1999b)are used to compute CD spectra for the two peptides.
The CD spectrum corresponding to a particularconfiguration of a molecule can be calculated withquantum mechanical methods. Small molecules caneither be treated at the semi-empirical level (e.g. CNDO/S)(Del Bene and Jaffe 1968a, 1968b) or at the ab initiolevel (e.g. CIS, configuration interaction with singleexcitations) (Foresman et al. 1992). More approximatemodels are required for larger systems containing severalchromophore groups. A popular approach is the dipoleinteraction model introduced by DeVoe and Applequist(Applequist 1973; DeVoe 1964, 1965). For polypeptides,proteins, and polynucleotides the perturbation theory ofTinoco (Tinoco 1960, 1962; Woody and Tinoco 1967)and the so-called matrix method of Bayley et al. (1969)are chiefly used. These methods are of approximate
nature due to the independent chromophore assumptioninvolved in generating the excited-state wave functions.Nevertheless, the experimental CD spectra of a smallnumber of proteins have been reproduced successfully(Bode and Applequist 1998; Woody 1995, 1996). Mostcalculations reported in the literature are based on singlestructures, for example X-ray structures of proteins. In afew cases, however, calculations have been performedfor structures from a simulation trajectory (Bringmannet al. 2001; Fleischhauer et al. 1994). These studies haveshown that small structural changes in relative positionand orientation of the chromophores may have sizeableeffects on the calculated CD spectrum, particularly inthe near-UV range of protein spectra. If the backbone isvery flexible (as for peptides), a significant variation mayalso be observed for the far-UV CD.
The CD calculations presented here are based on200 ns MD simulations of the b-heptapeptide H-b3-HVal-b3-HAla-b3-HLeu-(S,S)-b3-HAla(aMe)-b3-HVal-b3-HAla-b3-HLeu-OH (Fig. 1A) in methanol at 298 Kand 340 K, and a 50 ns simulation of the b-hexapep-tide H-b2-HVal-b3-HAla-b2-HLeu-b3-HVal-b2-HAla-b3-HLeu-OH (Fig. 1C) in methanol at 340 K. In thesimulations the peptides sampled both folded (helical)and unfolded structures. A computer program wasused to identify trajectory structures with a commonbackbone conformation and group them into clustersof similar structure. The CD spectra were calculatedfor individual structures, based on peptide-group di-pole transition moments obtained from semi-empiricalmolecular orbital theory and using the matrix method.The single-structure spectra were then averaged overentire trajectories and over clusters of structures. Theresulting curves are compared to experimental spectra.
Fig. 1 A Structural formula ofthe b3-heptapeptide. B Modelstructure derived from NMRdata for the b-heptapeptide inmethanol at 298 K (Seebachet al. 1996a). C Structuralformula of the b2,b3-hexapeptide. D Model structurederived from NMR data for theb-hexapeptide in methanol at298 K (Seebach et al. 1998a).E Model structure derived fromNMR data of the b-hexapeptidein pyridine at 298 K (Seebachet al. 1997)
662

Our analysis focuses on the sensitivity of calculatedsingle-structure CD spectra to small geometrical dif-ferences and of calculated average CD spectra tovariations in the underlying ensemble of conforma-tions. There is no agreement between calculated andexperimental spectra for the b-heptapeptide and onlyfair agreement for the b-hexapeptide. Several short-comings of the theoretical model may account for thedifferences between the calculated and observed spec-tra; these are discussed in some detail.
Methods
Molecular dynamics simulation
The MD simulations were performed using the GROMOS96package (Scott et al. 1999; van Gunsteren et al. 1996) and theGROMOS96 43A1 force field (van Gunsteren et al. 1996). Thedynamics of the two peptides in methanol were studied at 298 K(b-heptapeptide, 200 ns) and 340 K (b-heptapeptide, 200 ns;b-hexapeptide, 50 ns), at 1 atm pressure under periodic boundaryconditions. The temperature and pressure were maintained byweak coupling to an external bath (Berendsen et al. 1984) withrelaxation times of 0.1 ps and 0.5 ps, respectively. To generate theinitial configuration of one of the systems, a 314-helical structureof the b-heptapeptide was placed in a periodic rectangular boxwith 962 methanol molecules. For the other system, a fully ex-tended conformation of the b-hexapeptide and 1435 methanolmolecules were placed in a periodic truncated-octahedron box.The shortest distance between the peptide and the box wall wasinitially 1.4 nm in both systems. The SHAKE algorithm(Ryckaert et al. 1977) was used to constrain all bond lengths tominimum-energy values. A twin-range cut-off of 0.8 nm/1.4 nmwas used for all non-bonded interactions. Further details on thesimulation setup for the two systems have been given elsewhere(Daura et al. 1997, 1998, 1999b).
Cluster analysis
A conformational clustering analysis was performed on sets ofpeptide structures taken at 10-ps intervals from the trajectories,using the backbone atom-positional root-mean-square difference(RMSD) as similarity criterion. For the b-heptapeptide the clusteranalysis was performed over four sets of data, corresponding tothe initial 10, 20, 50, and 200 ns of simulation. For the b-hexa-peptide, only one set, covering the entire simulation (50 ns), wasused. Two different groups of backbone atoms were consideredfor the translational and rotational superposition of structuresand the calculation of RMSD values. In the first case (N–Cb–Ca–C), all but the first and last residues of the peptide chains wereused. In the second case (O–C–N–H), all the peptide groups wereconsidered. The RMSD similarity cut-off or maximum clusterradius used in the clustering analysis was 0.1 nm for the b-hep-tapeptide and 0.08 nm for the b-hexapeptide. The value waschosen proportional to the number of residues and approximatelyequal to the maximum atom-positional RMSD between the var-ious NMR model structures derived for each peptide. The clus-tering algorithm has been described elsewhere (Daura et al.1999c). Important features of this algorithm are that it favoursthe most populated cluster and that it ensures a minimum atom-positional RMSD between centres of clusters equal to the RMSDsimilarity cut-off. It also results in many clusters having only onemember. In general, these single-member clusters are not isolatedin the RMSD space but lie at the border of other clusters. Theyresult from the hard constraint that no member of a clustermay be further away from the central member than a specifieddistance.
Calculation of CD spectra
Circular dichroism (Woody 1996) is the difference in absorption ofleft and right circularly polarized light of given wavelength k, asexpressed by the extinction coefficients:
De kð Þ ¼ eleft kð Þ � eright kð Þ ð1ÞThe rotational strength of an electronic transition 0 fi a is re-
lated to the integrated intensity of a single band in the absorptionspectrum:
R0a /Z
De kð Þk
dk ð2Þ
and is given as the product of the electric and magnetic dipoletransition moments:
R0a ¼ Im w0h 2lej jwai wah 2lmj jw0ið Þ ð3ÞFor real-valued wavefunctions this will be a real number, as the
electric dipole integral is real and the magnetic dipole integral ispurely imaginary. While the calculation of rotational strengths is inprinciple straightforward, it appears impractical for all but thesmallest molecules, given that the treatment of excited states wa willrequire high-level wavefunctions including electron correlation.Even the use of semi-empirical treatments specifically designed forthe calculation of electronic spectra appears out of reach for mol-ecules as large as proteins or for sizeable collections of differentgeometries of medium-sized molecules, as in this study.
The independent chromophore approximation (Woody 1996)assumes non-overlapping charge distributions of all chromophoresin the molecule, and treats the interaction between them either byperturbation theory (Tinoco 1962) or by exciton theory (Bayleyet al. 1969). The latter, known as the matrix method, is wellestablished for the calculation of CD spectra for protein structures.This approach uses a basis set of polymer (molecule) wavefunctionswhich are written as products of n monomer (chromophore)wavefunctions. Only single excitations within a monomer i are re-tained (0 fi a), neglecting double and higher excitations as well ascharge-transfer excitations:
Uia ¼ /10/20 . . . /ia . . . /n0 ð4ÞThe excited state wavefunction is linear-combined from this
basis set, and the corresponding expansion coefficients are deter-mined in a variational sense from the eigenvalue problem
Hw ¼ Ew :
wk ¼Xn
i¼1
Xmi
a¼1Ck;iaUia ð5Þ
H ¼Xn
i¼1Hi þ
Xn
i�j
Vij ð6Þ
In matrix notation, the hamiltonian contains as diagonal matrixelements the energies eia of all mi excitations in monomer i and asoff-diagonal matrix elements the Coulomb interactions Vi0a,j0b
between monomer transition charge densities:
Hkk ¼ wkh H�� ��wki ¼
Xn
i¼1
Xmi
a¼1C2
k;ia /iah Hi
�� ��/iai ð7Þ
Hkl ¼ wkh H�� ��wli ¼
Xn
i¼1
Xmi
a¼1
Xn
j¼1
Xmj
b¼1Ck;iaCl;jb /i0/iah Vij
�� ��/j0/jb
�ð8Þ
hia;ia � eia ¼ /iah Hi
�� ��/iai ð9Þ
hia;jb � Vi0a;j0b ¼ /i0/iah Vij
�� ��/j0/jb
�ð10Þ
The matrix h with elements hia,jb is diagonalized, yielding theexpansion coefficients Ck,ia as eigenvectors and the compositeexcitation energies as eigenvalues. The rotational strengths are thenreadily evaluated from Eq. (3) using the expansion coefficients and
663

the transition dipole moments /0h 2lej j/ai and /0h 2lmj j/ai of themonomers. For approximate wavefunctions, the rotationalstrength is origin-dependent in its original form (Eq. 3), but it maybe rewritten in the commonly used dipole velocity form which re-moves this origin dependence (Woody 1996).
In practice, monomer excitation energies are parameters ob-tained either from calculation or experiment and should accountfor solvent effects, while monomer transition charge densities arerepresented as sets of monopoles, fitted to densities obtained fromsemi-empirical (Kurapkat et al. 1997; Woody and Sreerama 1999)or ab initio (Besley and Hirst 1999; Hirst 1998b) calculations.Finally, electric and magnetic transition dipole moments of themonomers are typically obtained from calculation, but orientationsare sometimes taken from experiment (Woody and Sreerama 1999).Once all these parameters are derived, the polymer calculation in-volves no further quantum mechanical treatment; it is in fact lim-ited to simple matrix algebra, rendering the calculation of CDspectra a computationally trivial task even for very large systems.
In the present study, we use the dipole velocity form of therotational strength and a parameter set previously applied to CDcalculations for bovine pancreatic ribonuclease (Kurapkat et al.1997). The parameter set has been obtained from CNDO/S
calculations on acetamide, augmented by experimental excitationenergies that are poorly reproduced at the semi-empirical level oftheory. Each of the amide fragments (peptide groups) of the hexa-and heptapeptide is represented by the planar amide fragment ofacetamide, which is translated and rotated in a linear least-squaressense so as to best match the positions of the C, O, and N atoms onthe peptide. The terminal amino and carboxylate groups are notincluded in the calculation since their motional flexibility willdiminish their influence on the overall CD spectrum. The aliphaticside chains will not contribute to the CD signal either, which leavesthe main chain amide fragments as the only chromophoresexplicitly treated in the calculation. For each of these monomers,three excitations are considered: np* (from the oxygen lone pair,220 nm), NV1, and NV2 (both pp*, 190 and 140 nm). All calcu-lations have been performed using the program MATMAC (Fle-ischhauer et al. 1991), which computes the molar ellipticity h, aquantity proportional to D� (Woody 1996), for each transition andadds Gaussians to yield the final spectrum in the range150–250 nm. Further technical details of the calculations may befound elsewhere (Kurapkat et al. 1997).
CD calculations have been performed for single structuresobtained from NMR models, energy minimization, or MD simu-lation, clusters of structures obtained from MD simulation asdescribed above, or sets of structures covering particular segmentsof the MD simulations. The experimental CD spectra were takenfrom the group of Seebach (Gademann et al. 1999c; Seebach et al.1996a, 1997).
Results
b3-Heptapeptide
The experimental CD spectra collected for the b-hepta-peptide at three different temperatures, 293, 298, and333 K, the calculated CD spectrum for the 314-helicalNMR model structure, and the average CD spectra,calculated over 50 ns and 200 ns time spans from themolecular dynamics trajectories at 298 K and 340 K, areshown in Fig. 2A. Clearly, the average calculated spec-tra do not reproduce the experimental curves. It isarguable whether the mismatch is indicating a shift to-wards shorter wavelengths of the calculated spectrumwith respect to the experimental one or a signal inver-sion. The intensity of the peaks is smaller in the calcu-lated average spectra and diminishes, almost vanishes, asa larger number of conformations enters the ensemble,that is, as the temperature is increased from 298 K to340 K. The calculated CD spectrum, on the other hand,is similar whether averaged over 50 ns or 200 ns at anyof the two temperatures. The calculated spectrum of theNMR model structure is very close to both calculated
Fig. 2 A Experimental and calculated CD spectra of the b-hepta-peptide in methanol. Black solid: experimental CD spectrum at298 K (Seebach et al. 1996a); black dashed and black dotted:experimental CD spectra at 293 K and 333 K, respectively, from anindependent measurement (Gademann et al. 1999c); red: CDspectrum calculated for the 314-helical NMR model structure (seeFig. 1B); green solid: average CD spectrum from the first 50 ns ofthe MD simulation at 298 K; blue solid: average CD spectrum fromthe entire 200 ns MD simulation at 298 K; green dashed: averageCD spectrum from the first 50 ns of the MD simulation at 340 K;blue dashed: average CD spectrum from the entire 200 ns MDsimulation at 340 K. B CD spectra of the 314-helical conformationof the b-heptapeptide calculated from the MD simulation inmethanol at 340 K. Black: CD spectrum calculated for the NMRmodel structure (see Fig. 1B); brown: average CD spectrum ofcluster number 1 (clustering based on the six O–C–N–H peptidegroups, 134 structures or cluster members) from the initial 10 ns(1000 structures) of the MD simulation; blue: average CD spectrumof cluster number 1 (clustering based on the six O–C–N–H peptidegroups, 983 members) from the initial 20 ns (2000 structures) of theMD simulation; green solid: average CD spectrum of clusternumber 1 (clustering based on the six O–C–N–H peptide groups,2084 members) from the initial 50 ns (5000 structures) of the MDsimulation; red solid: average CD spectrum of cluster number 1(clustering based on the six O–C–N–H peptide groups, 5630members) from the entire 200 ns (20,000 structures) MD simula-tion; green dashed: average CD spectrum of cluster number 1(clustering based on the N–Cb–Ca–C backbone atoms of residues 2to 6, 2503 members) from the initial 50 ns of the MD simulation;red dashed: average CD spectrum of cluster number 1 (clusteringbased on the N–Cb–Ca–C backbone atoms of residues 2 to 6, 7175members) from the entire 200 ns MD simulation. In all cases theclustering has been performed using an atom-positional RMSDsimilarity cut-off of 0.1 nm
664

average spectra at 298 K. This is not surprising, sincethe 314-helical conformation is representative for 95%(200 ns) to 97% (first 50 ns) of the ensemble at thistemperature. At 340 K, the population of the helixranges from 35% (200 ns) to 50% (first 50 ns) and theinclusion of new conformations results in both a shift ofthe peaks and a reduction of the signal intensity. Thereduction of peak intensities at higher temperature isalso apparent in the experimental spectra, although to amuch smaller extent.
Figure 2B shows the dependence of the average cal-culated CD spectrum for a particular cluster (confor-mation) on the simulation time range over which theaverage has been calculated and on the backbone atomsused for the clustering. As expected, the average spec-trum for cluster 1 (the most populated cluster, featuring
the 314 helix in all cases) is basically the same whetherthe clustering has been performed on the first 10, 20, 50,or 200 ns of the simulation at 340 K. It is also relativelyinsensitive to the selection of backbone atoms, N–Cb–Ca–C or O–C–N–H, for the clustering of structures.Similar observations have been made for other highlypopulated clusters at any of the two temperatures (re-sults not shown). A plausible explanation for this wouldbe that all the structures belonging to one cluster cor-respond to the same conformation and share the samebasic CD spectrum. As a consequence, the averagespectrum would be largely independent of the number ofmembers of the cluster, which varies with simulationlength. This explanation is simple but inappropriate, asFig. 3 demonstrates that 2084 highly different single-structure CD spectra contribute to the average spectrumshown in Fig. 2B (green solid line). Note that all 2084structures correspond to the same global fold and stillgive rise to very different calculated spectra. Thissurprising observation has been made for other highlypopulated clusters as well (results not shown).
In order to reduce the structural differences within acluster even further, we have repeated the clusteringprocedure for structures obtained from the first 50 ns ofthe simulation at 340 K, now using an RMSD similaritycut-off of 0.03 nm for the O, C, N, and H atoms of thesix peptide groups. The new cluster 1 contains 34members, with CD spectra shown in Fig. 4A andbackbone structures shown in Fig. 5A. The results pointto an extreme sensitivity of the CD-spectrum calcula-tions to the exact relative positions and orientations ofthe chromophores. Another example of this is given inFigs. 4B and 5B, which show the spectrum and back-bone structure of the NMR model before and afterenergy minimization, respectively.
b2,b3-Hexapeptide
For this b-hexapeptide, two different NMR modelstructures were derived, based on data obtained formethanol (Fig. 1D) and pyridine (Fig. 1E) as solvent.Later, a molecular dynamics simulation study (Dauraet al. 1999b) suggested that the model shown in Fig. 1E(12/10 helix) is also representative for the most popu-lated conformation in methanol, while the model shownin Fig. 1D satisfies NOE constraints of both a 12/10
Fig. 4A, B Calculated CD spectra of structurally very similar indi-vidual structures of the b-heptapeptide. A Calculated CD spectra ofthe 34 members of cluster number 1 (314 helix) from the first 50 nsof the simulation in methanol at 340 K (clustering based on the sixO–C–N–H peptide groups using an atom-positional RMSDsimilarity cut-off of 0.03 nm). B Black: CD spectrum calculatedfor the NMR model structure (see Fig. 1B); red: CD spectrumcalculated for the energy minimized NMR model structure (initialstructure in the simulation at 298 K)
Fig. 3 Calculated CD spectra for the 2084 member structures ofcluster number 1 (314 helix) from the first 50 ns of the MDsimulation of the b-heptapeptide in methanol at 340 K. Theclustering is based on the six peptide groups (N, H, C, O atoms) ofthe molecule, using an atom-positional RMSD similarity cut-off of0.1 nm
665

helix and a 314 helix. Indeed, both folds are observed inthe simulation.
The experimental CD spectrumof theb-hexapeptide at298 K, the calculated CD spectra for the two modelstructures shown in Figs. 1D and 1E, and the average CDspectrum calculated over the 50 ns of the moleculardynamics trajectory at 340 K are shown in Fig. 6A. Un-like for the b-heptapeptide (see Fig. 2A), we observe asatisfactory agreement with experiment for the calculatedposition of the characteristic positive peak at around200 nm. The calculated average CD spectrum for 340 K(blue line) is again characterized by low-intensity peaks,indicating sizeable contributions from non-12/10-helicalconformations at elevated temperature.
Of the two calculated CD spectra corresponding tothe NMR model structures of the peptide in methanoland pyridine, the one for the pyridine model (greenline in Fig. 6A; see Fig. 1E) is clearly closer to theexperimental spectrum for the peptide in methanol. Ifa single-structure CD spectrum was representativefor the experimental spectrum, this result would sup-port the previous conclusion that the 12/10 helix mightbe the most populated conformer in methanol and thatthe model shown in Fig. 1D was an artifact of the NMRstructure calculation.
Figure 6B illustrates that the calculated CD spectrumof the central member structure of a cluster is not nec-essarily representative for the average spectrum of thecluster, and that two distinct structures may have similarspectra. For example, the central member structure ofcluster 4 (green solid line), which does not conform tothe 12/10-helical pattern, has a similar spectrum to thatof the model 12/10 helix shown in Fig. 1E (Fig. 6A,
green line). The observation that b-peptides with dif-ferent folds may have very similar CD spectra has re-cently also been made by Seebach et al. (2000b), usingNMR and CD spectroscopy, and Glattli et al. (2002),using the computational methods described here. On theother hand, the CD spectrum of the central memberstructure of cluster 4 is very different from the averagespectrum of the same cluster (Fig. 6B, green solid lineand green dashed line, respectively).
The variance in the calculated spectra for the memberstructures of a cluster is also remarkable in the case ofthe b-hexapeptide. The distribution of the CD spectrafor cluster 1 (12/10 helix) is very similar (data notshown) to the one for the heptapeptide shown in Fig. 3.Averaging over the distribution results in the CD spec-trum shown in Fig. 6B (red dashed line). Nevertheless,while the CD spectrum for a single structure within acluster appears to be rather unpredictable (i.e. verysensitive to the exact coordinates), the average spectrumof a cluster seems to be characteristic for the confor-mation. Thus, the average spectrum corresponding tothe 314 helix has the same features whether calculated forthe b-hexapeptide (Fig. 6B, blue dashed line) or the b-heptapeptide (Fig. 2A).
The influence of the fitting procedureon the calculated spectrum
For the calculation of CD spectra we use the indepen-dent chromophore approximation with theoreticaldata obtained for idealized geometries of peptide-bondunits. This procedure requires the superposition of theidealized (planar) peptide-bond units onto the chromo-phore groups of the molecule. In particular, the MAT-MAC program performs a least-squares translationaland rotational fit of the C, O, and N atoms of theparametrized amide fragment onto the correspondingatoms in the peptide.
However, the assumption of amide planarity intro-duces some arbitrariness into the fitting procedure. Inpractice, deviations from planarity can be quite sub-stantial, and the details of the fitting procedure matter.We have tested the implications for the calculated CDspectra by comparing the results obtained with threealternative fitting procedures: (residue-number pointerin parenthesis): (1) projection of O(i) (preserving the C–O bond distance) onto the plane defined by Ca(i), C(i),and N(i+1), followed by the fitting based on C(i), O(i),and N(i+1) performed by MATMAC; (2) projection ofO(i) (preserving the C–O bond distance) onto the planedefined by C(i), N(i+1), and Cb(i+1), followed by thefitting based on C(i), O(i), and N(i+1) performed byMATMAC; (3) fitting of the idealized geometry ofacetamide onto the Ca(i), C(i), O(i), N(i+1), andH(i+1) atoms of the peptide.
The single-structure and average spectra corre-sponding to cluster 1 of the b-heptapeptide at 340 K(same cluster as in Fig. 4A) have been calculated using
Fig. 5A, B Structures of the b-heptapeptide corresponding to theCD spectra in Fig. 4. A Superposition of the 34 members of clusternumber 1 (314 helix) from the first 50 ns of the simulation inmethanol at 340 K (clustering based on the six O–C–N–H peptidegroups using an atom-positional RMSD similarity cut-off of0.03 nm); only the backbone atoms including the peptide groups(chromophores) are shown. B Superposition of the NMR modelstructure before and after steepest descent energy minimizationwithin the GROMOS96 43A1 force field (van Gunsterenet al. 1996)
666

each of the four different fitting schemes. The results areshown in Fig. 7A (average) and Figs. 7B–D (singlestructure). Clearly, the spectra of some of the individualstructures vary with the fitting procedure. Compared tothe differences between various structures within thesame cluster, however, these effects appear rather small.The averaged spectra (Fig. 7A) are thus rather insensi-tive to the details of the fitting procedure.
Discussion
CD spectra of two b-peptides at two temperatures havebeen calculated based on molecular configurations ob-tained from molecular dynamics simulation. The CDspectra have been averaged over entire MD trajectoriesand over sets of similar structures (clusters in atom-positional RMSD space) for comparison to experimen-tally measured spectra. The trajectory-average spectrumfor the b-hexapeptide at 340 K shows the characteristicpositive peak at around 200 nm. In contrast, the tra-jectory-average spectra for the b-heptapeptide at 298 Kand 340 K do not reproduce any of the features of theexperimental spectra. In both cases, peak intensities arelow compared to experimental values.
Surprisingly, the calculated single-structure CDspectra are extremely sensitive to small structural varia-tions. Even the details of the geometric fitting procedure
applied to superimpose the parametrized acetamidemodel with the peptide bonds have a notable effect onthe spectrum. Consequently, the calculated CD spec-trum of the central member structure of a cluster is notnecessarily representative for the average spectrum ofthe cluster.
The unsatisfactory agreement between calculated andexperimental spectra for the b-heptapeptide warrantssome discussion of possible sources of error. Themethod of calculation is clearly very approximate, and,although successfully applied to protein crystal struc-tures in the past, may fail in other cases. The principleshortcomings include the following. First, transitioncharge densities derived from semi-empirical CNDO/Scalculations may be inaccurate, especially if the corre-sponding excitation energy is only poorly reproduced atthe same level of theory (Hirst 1998a). This particularlyapplies to the np* transition (CNDO/S: k=340 nm;experimentally: 220 nm). Second, the direction of thetransition dipole moment vector appears to have a largeinfluence on the resulting spectrum (Woody andSreerama 1999), and differences between CNDO/S (foracetamide) and experiment (for N-acetylglycine) aresizeable (Clark 1995; Kurapkat et al. 1997). Third, theindependent chromophore approximation does not al-low for charge transfer between monomers, which maybe inappropriate especially for NV1 excitations of poly-a-peptides (Goldmann et al. 2001). This problem shouldbe less significant for b-peptides, which are character-ized by a larger distance between chromophores.Fourth, the monomer parameters were derived forapplication to a-peptides in aqueous solution. A morespecific parametrization for b-peptides and methanol assolvent is desirable. Fifth, the monomer parameterswere derived for planar peptide units. However, thermalmotion generates OCNH angles which deviate fromplanarity. While the amount of distortion may beexaggerated by the GROMOS force field in some cases,the uncertainty remains whether transition charge den-sities and dipole moment orientations, in particular, aretransferable to non-planar peptide geometries. Notethat non-planar amides will give rise to an intrinsic CDcontribution reflecting their local chirality, while thiscontribution vanishes for planar amide units withorthogonal electric and magnetic transition dipole mo-ment orientations (see Eq. 3). The question of parame-ter transferability should be distinguished from the
Fig. 6A, B Experimental and calculated CD spectra of the b-hexa-peptide in methanol. A Black: experimental CD spectrum at 298 K(Seebach et al. 1998a); red: CD spectrum calculated for the modelstructure derived from NMR data in methanol (see Fig. 1D); green:CD spectrum calculated for the model structure derived fromNMR data in pyridine (see Fig. 1E); blue: average CD spectrumfrom the entire 50 ns MD simulation at 340 K. B Black:experimental CD spectrum at 298 K; red solid: CD spectrumcalculated for the central member structure of cluster number 1 (12/10 helix, from time point=6.96 ns); red dashed: average CDspectrum of cluster number 1 (633 members); green solid: CDspectrum calculated for the central member structure of clusternumber 4 (low free energy unfolded, i.e. non-12/10-helicalstructure, from time point=1.78 ns); green dashed: average CDspectrum of cluster number 4 (181 members); blue solid: CDspectrum calculated for the central member structure of clusternumber 14 (314 helix, from time point=25.01 ns); blue dashed:average CD spectrum of cluster number 14 (56 members). Theclustering is based on the five peptide groups (N, H, C, O atoms) ofthe molecule, using an atom-positional RMSD similarity cut-off of0.08 nm
667
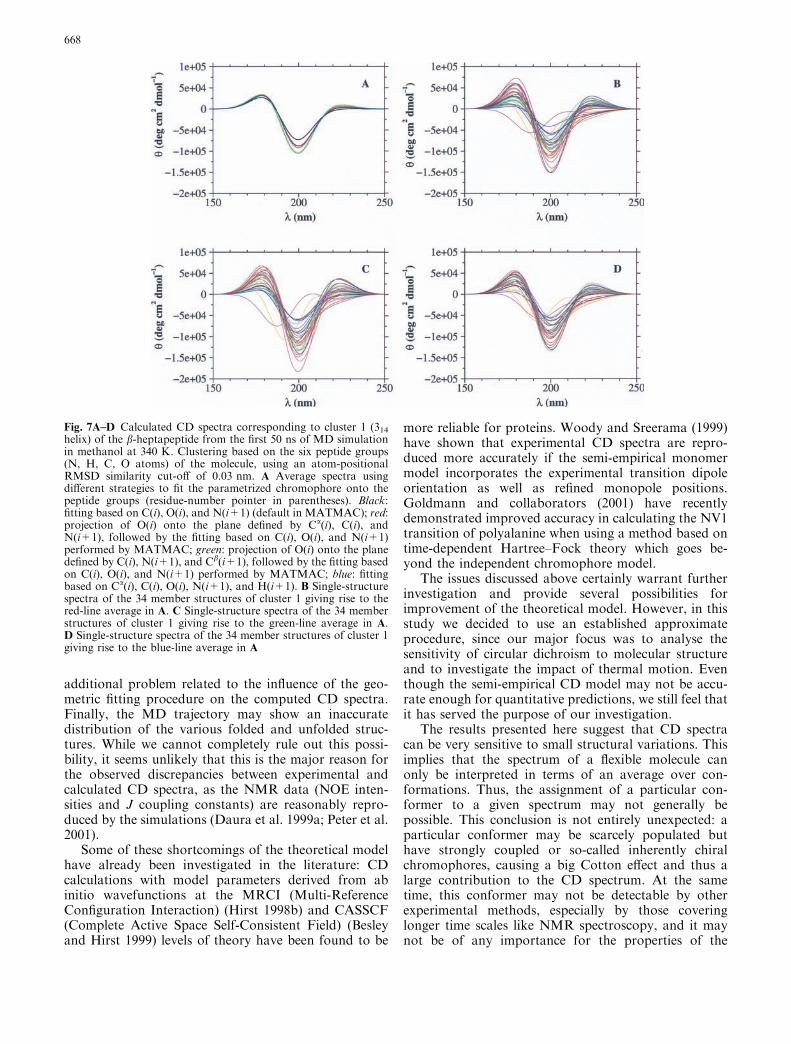
additional problem related to the influence of the geo-metric fitting procedure on the computed CD spectra.Finally, the MD trajectory may show an inaccuratedistribution of the various folded and unfolded struc-tures. While we cannot completely rule out this possi-bility, it seems unlikely that this is the major reason forthe observed discrepancies between experimental andcalculated CD spectra, as the NMR data (NOE inten-sities and J coupling constants) are reasonably repro-duced by the simulations (Daura et al. 1999a; Peter et al.2001).
Some of these shortcomings of the theoretical modelhave already been investigated in the literature: CDcalculations with model parameters derived from abinitio wavefunctions at the MRCI (Multi-ReferenceConfiguration Interaction) (Hirst 1998b) and CASSCF(Complete Active Space Self-Consistent Field) (Besleyand Hirst 1999) levels of theory have been found to be
more reliable for proteins. Woody and Sreerama (1999)have shown that experimental CD spectra are repro-duced more accurately if the semi-empirical monomermodel incorporates the experimental transition dipoleorientation as well as refined monopole positions.Goldmann and collaborators (2001) have recentlydemonstrated improved accuracy in calculating the NV1transition of polyalanine when using a method based ontime-dependent Hartree–Fock theory which goes be-yond the independent chromophore model.
The issues discussed above certainly warrant furtherinvestigation and provide several possibilities forimprovement of the theoretical model. However, in thisstudy we decided to use an established approximateprocedure, since our major focus was to analyse thesensitivity of circular dichroism to molecular structureand to investigate the impact of thermal motion. Eventhough the semi-empirical CD model may not be accu-rate enough for quantitative predictions, we still feel thatit has served the purpose of our investigation.
The results presented here suggest that CD spectracan be very sensitive to small structural variations. Thisimplies that the spectrum of a flexible molecule canonly be interpreted in terms of an average over con-formations. Thus, the assignment of a particular con-former to a given spectrum may not generally bepossible. This conclusion is not entirely unexpected: aparticular conformer may be scarcely populated buthave strongly coupled or so-called inherently chiralchromophores, causing a big Cotton effect and thus alarge contribution to the CD spectrum. At the sametime, this conformer may not be detectable by otherexperimental methods, especially by those coveringlonger time scales like NMR spectroscopy, and it maynot be of any importance for the properties of the
Fig. 7A–D Calculated CD spectra corresponding to cluster 1 (314helix) of the b-heptapeptide from the first 50 ns of MD simulationin methanol at 340 K. Clustering based on the six peptide groups(N, H, C, O atoms) of the molecule, using an atom-positionalRMSD similarity cut-off of 0.03 nm. A Average spectra usingdifferent strategies to fit the parametrized chromophore onto thepeptide groups (residue-number pointer in parentheses). Black:fitting based on C(i), O(i), and N(i+1) (default in MATMAC); red:projection of O(i) onto the plane defined by Ca(i), C(i), andN(i+1), followed by the fitting based on C(i), O(i), and N(i+1)performed by MATMAC; green: projection of O(i) onto the planedefined by C(i), N(i+1), and Cb(i+1), followed by the fitting basedon C(i), O(i), and N(i+1) performed by MATMAC; blue: fittingbased on Ca(i), C(i), O(i), N(i+1), and H(i+1). B Single-structurespectra of the 34 member structures of cluster 1 giving rise to thered-line average in A. C Single-structure spectra of the 34 memberstructures of cluster 1 giving rise to the green-line average in A.D Single-structure spectra of the 34 member structures of cluster 1giving rise to the blue-line average in A
668

corresponding compound (see the books by Berovaet al. 2000 on CD spectroscopy, and Eliel and Wilen1994 on stereochemistry).
References
Abele S, Guichard G, Seebach D (1998) (S)-b3-Homolysine- and(S)-b3-homoserine-containing b-peptides: CD spectra in aque-ous solution. Helv Chim Acta 81:2141–2156
Appella DH, Christianson LA, Karle IL, Powell DR, Gellman SH(1996) b-Peptide foldamers: robust helix formation in a newfamily of b-amino acid oligomers. J Am Chem Soc 118:13071–13072
Appella DH, Christianson LA, Klein DA, Powell DR, Huang X,Barchi JJ, Gellman SH (1997) Residue-based control of helixshape in b-peptide oligomers. Nature 387:381–384
Appella DH, Barchi JJ Jr, Durell SR, Gellman SH (1999) For-mation of short, stable helices in aqueous solution by b-aminoacid hexamers. J Am Chem Soc 121:2309–2310
Applequist J (1973) Polarizability theory of optical rotation.J Chem Phys 58:4251–4259
Applequist J, Bode KA (2000) Fully extended poly(b-amino acid)chains: translational helices with unusual theoretical p-p*absorption and circular dichroic spectra. J Phys Chem A104:7129–7132
Applequist J, BodeKA,AppellaDH, Christianson LA,Gellman SH(1998) Theoretical and experimental circular dichroic spectra ofthe novel helical foldamer poly[(1R,2R)-trans-2-aminocyclop-entanecarboxylic acid]. J Am Chem Soc 120:4891–4892
Bayley PM, Nielsen EB, Schellman JA (1969) The rotatory prop-erties of molecules containing 2 peptide groups: theory. J PhysChem 73:228–243
Berendsen HJC, Postma JPM, van Gunsteren WF, DiNola A,Haak JR (1984) Molecular dynamics with coupling to anexternal bath. J Chem Phys 81:3684–3690
Berova N, Nakanishi K, Woody RW (2000) Circular dichroism:principles and application. Wiley-VCH, New York
Besley NA, Hirst JD (1999) Theoretical studies toward quantitativeprotein circular dichroism calculations. J Am Chem Soc121:9636–9644
Bode KA, Applequist J (1997) Poly(b-amino acid) helices. Theo-retical p-p* absorption and circular dichroic spectra. Macro-molecules 30:2144–2150
Bode KA, Applequist J (1998) Globular protein ultraviolet circulardichroic spectra. Calculation from crystal structures via thedipole interaction model. J Am Chem Soc 120:10938–10946
Borman S (1997) b-Peptides: nature improved? Chem Eng News75:32–35
Bringmann G, Muhlbacher J, Repges C, Fleischhauer J (2001)MD-based CD calculations for the assignment of the absoluteaxial configuration of the naphthylisoquinoline alkaloid dion-cophylline A. J Comput Chem 22:1273–1278
Burgi R, Pitera J, van Gunsteren WF (2001) Assessing the effect ofconformational averaging on the measured values of observ-ables. J Biomol NMR 19:305–320
Chandrasekhar J, Saunders M, Jorgensen WL (2001) Efficientexploration of conformational space using the stochastic searchmethod: application to b-peptide oligomers. J Comput Chem22:1646–1654
Chung YJ, Christianson LA, Stanger HE, Powell DR, Gellman SH(1998) A b-peptide reverse turn that promotes hairpin forma-tion. J Am Chem Soc 120:10555–10556
Clark LB (1995) Polarization assignments in the vacuum UVspectra of the primary amide, carboxyl, and peptide groups.J Am Chem Soc 117:7974–7986
Daura X, van Gunsteren WF, Rigo D, Jaun B, Seebach D (1997)Studying the stability of a helical b-heptapeptide by moleculardynamics simulations. Chem Eur J 3:1410–1417
Daura X, Jaun B, Seebach D, van Gunsteren WF, Mark AE (1998)Reversible peptide folding in solution by molecular dynamicssimulation. J Mol Biol 280:925–932
Daura X, Antes I, van Gunsteren WF, Thiel W, Mark AE (1999a)The effect of motional averaging on the calculation of NMR-derived structural properties. Proteins Struct Funct Genet36:542–555
Daura X, Gademann K, Jaun B, Seebach D, van Gunsteren WF,Mark AE (1999b) Peptide folding: when simulation meetsexperiment. Angew Chem Int Ed 38:236–240
Daura X, van Gunsteren WF, Mark AE (1999c) Folding-unfoldingthermodynamics of a b-heptapeptide from equilibrium simula-tions. Proteins Struct Funct Genet 34:269–280
Daura X, Gademann K, Schafer H, Jaun B, Seebach D, vanGunsteren WF (2001) The b-peptide hairpin in solution: con-formational study of a b-hexapeptide in methanol by NMRspectroscopy and MD simulation. J Am Chem Soc 123:2393–2404
Del Bene J, Jaffe HH (1968a) Use of CNDO method in spectros-copy. 2. 5-membered rings. J Chem Phys 48:4050
Del Bene J, Jaffe HH (1968b) Use of CNDO method in spectros-copy. 1. Benzene, pyridine and diazines. J Chem Phys 48:1807
DeVoe H (1964) Optical properties of molecular aggregates. 1.Classical model of electronic absorption+refraction. J ChemPhys 41:393–400
DeVoe H (1965) Optical properties of molecular aggregates. 2.Classical theory of refraction absorption and optical activity ofsolutions and crystals. J Chem Phys 43:3199–3208
Eliel EL, Wilen SH (1994) Stereochemistry of organic compounds.Wiley, New York
Fleischhauer J, Kramer B, Zobel E, Koslowski A (1991) MAT-MAC: matrix and Tinoco method Aachen. Aachen, Germany
Fleischhauer J, Grotzinger J, Kramer B, Kruger P, Wollmer A,Woody RW, Zobel E (1994) Calculation of the circular-dichroism spectrum of cyclo(L-Tyr- L-Tyr) based on a molec-ular-dynamics simulation. Biophys Chem 49:141–152
Foresman JB, Head-Gordon M, Pople JA, Frisch MJ (1992)Toward a systematic molecular-orbital theory for excited-states.J Phys Chem 96:135–149
Gademann K, Ernst M, Hoyer D, Seebach D (1999a) Synthesis andbiological evaluation of a cyclo-b-tetrapeptide as a somato-statin analogue. Angew Chem Int Ed 38:1223–1226
Gademann K, Hintermann T, Schreiber JV (1999b) b-Peptides:twisting and turning. Curr Med Chem 6:905–925
Gademann K, Jaun B, Seebach D, Perozzo R, Scapozza L, FolkersG (1999c) Temperature-dependent NMR and CD spectra ofb-peptides: on the thermal stability of b-peptide helices – is thefolding process of b-peptides non-cooperative? Helv Chim Acta82:1–11
Gademann K, Ernst M, Seebach D, Hoyer D (2000) The cyclo-b-tetrapeptide (b-HPhe-b-HThr-b-HLys-b-HTrp): synthesis,NMR structure in methanol solution, and affinity for humansomatostatin receptors. Helv Chim Acta 83:16–33
Gellman SH (1998) Foldamers: a manifesto. Acc Chem Res31:173–180
Glattli A, Daura X, Seebach D, Van Gunsteren WF (2002) Canone derive the conformational preference of a b-peptide from itsCD spectrum? J Am Chem Soc 124:12972–12978
Goldmann E, Sanford AA, Mukamel S (2001) Electronic excita-tions of polyalanine; test of the independent chromophoreapproximation. Phys Chem Chem Phys 3:2893–2903
GungBW, ZouD, StalcupAM,Cottrell CE (1999) Characterizationof a water-soluble, helical b-peptide. J Org Chem 64:2176–2177
Hamuro Y, Schneider JP, DeGrado WF (1999) De novo design ofantibacterial b-peptides. J Am Chem Soc 121:12200–12201
Hintermann T, Seebach D (1997) The biological stability ofb-peptides: no interactions between a- and b-peptidic struc-tures? Chimia 51:244–247
Hirst JD (1998a) Improving protein circular dichroism calculationsthrough better ab initio models of the amide chromophore.Enantiomer 3:215–220
669

Hirst JD (1998b) Improving protein circular dichroism calculationsin the far-ultraviolet through reparametrizing the amide chro-mophore. J Chem Phys 109:782–788
Iverson BL (1997) Betas are brought into the fold. Nature 385:113–115
Krauthauser S, Christianson LA, Powell DR, Gellman SH (1997)Antiparallel sheet formation in b-peptide foldamers: effects ofb-amino acid substitution on conformational preference. J AmChem Soc 119:11719–11720
Kurapkat G, Kruger P, Wollmer A, Fleischhauer J, Kramer B,Zobel E, Koslowski A, Botterweck H, Woody RW (1997)Calculations of the CD spectrum of bovine pancreatic ribonu-clease. Biopolymers 41:267–287
Mohle K, Gunther R, Thormann M, Sewald N, Hofmann HJ(1999) Basic conformers in b-peptides. Biopolymers 50:167–184
Peter C, Daura X, van Gunsteren WF (2001) Calculation of NMR-relaxation parameters for flexible molecules from moleculardynamics simulations. J Biomol NMR 20:297–310
Porter EA, Wang X, Lee H-S, Weisblum B, Gellman SH (2000a)Non-haemolytic b-amino-acid oligomers. Nature 405:298
Porter EA, Wang X, Lee H-S, Weisblum B, Gellman SH (2000b)Antibiotics – non-haemolytic b-amino-acid oligomers. Nature404:565–565
Rueping M, Schreiber JV, Lelais G, Jaun B, Seebach D (2002)Mixed b2/b3-hexapeptides and b2/b3-nonapeptides folding to(P)-helices with alternating twelve- and ten-membered hydro-gen-bonded rings. Helv Chim Acta 85:2577–2593
Ryckaert JP, Ciccotti G, Berendsen HJC (1977) Numerical inte-gration of the Cartesian equations of motion of a system withconstraints: molecular dynamics of n-alkanes. J Comput Phys23:327–341
Scott WRP, Hunenberger PH, Tironi IG, Mark AE, Billeter SR,Fennen J, Torda AE, Huber T, Kruger P, van Gunsteren WF(1999) The GROMOS biomolecular simulation programpackage. J Phys Chem A 103:3596–3607
Seebach D, Ciceri PE, Overhand M, Jaun B, Rigo D, Oberer L,Hommel U, Amstutz R, Widmer H (1996a) Probing the helicalsecondary structure of short-chain b-peptides. Helv Chim Acta79:2043–2066
Seebach D, Overhand M, Kuhnle FNM, Martinoni B, Oberer L,Hommel U, Widmer H (1996b) b-Peptides: synthesis by Arndt-Eistert homologation with concomitant peptide coupling.Structure determination by NMR and CD spectroscopy and byX-ray crystallography. Helical secondary structure of a b-hex-peptide in solution and its stability towards pepsin. Helv ChimActa 79:913–941
Seebach D, Gademann K, Schreiber JV, Matthews JL, HintermannT, Jaun B, Oberer L, Hommel U, Widmer H (1997) ’Mixed’ b-peptides: a unique helical secondary structure in solution. HelvChim Acta 80:2033–2038
Seebach D, Abele S, Gademann K, Guichard G, Hintermann T,Jaun B, Matthews JL, Schreiber JV (1998a) b2- and b3-peptideswith proteinaceous side chains: synthesis and solution
structures of constitutional isomers, a novel helical secondarystructure and the influence of solvation and hydrophobicinteractions on folding. Helv Chim Acta 81:932–982
Seebach D, Abele S, Schreiber JV, Martinoni B, Nussbaum AK,Schild H, Schulz H, Hennecke H, Woessner R, Bitsch F (1998b)Biological and pharmacokinetic studies with b-peptides. Chimia52:734–739
Seebach D, Abele S, Sifferlen T, Hanggi M, Gruner S, Seiler P(1998c) Preparation and structure of b-peptides consisting ofgeminally disubstituted b2,2- and b3,3-amino acids: a turn motiffor b-peptides. Helv Chim Acta 81:2218–2243
Seebach D, Abele S, Gademann K, Jaun B (1999) Pleated sheetsand turns of b-peptides with proteinogenic side chains. AngewChem Int Ed 38:1595–1597
Seebach D, Schreiber JV, Abele S, Daura X, van Gunsteren WF(2000a) Structure and conformation of b-oligopeptide deriva-tives with simple proteinogenic side chains: circular dichroismand molecular dynamics investigations. Helv Chim Acta 83:34–57
Seebach D, Sifferlen T, Mathieu PA, Hane AM, Krell CM, Bier-baum DJ, Abele S (2000b) CD spectra in methanol of b-oli-gopeptides consisting of b-amino acids with functionalized sidechains, with alternating configuration, and with geminal back-bone substituents – fingerprints of new secondary structures?Helv Chim Acta 83:2849–2864
Tinoco I (1960) Optical and other electronic properties of poly-mers. J Chem Phys 33:1332–1338
Tinoco I (1962) Theoretical aspects of optical activity. 2. Polymers.Adv Chem Phys 4:113–160
van Gunsteren WF, Billeter SR, Eising AA, Hunenberger PH,Kruger P, Mark AE, Scott WRP, Tironi IG (1996) Biomolec-ular simulation: the GROMOS96 manual and user guide.Hochschulverlag, ETH Zurich/BIOMOS, Zurich/Groningen
Werder M, Hauser H, Abele S, Seebach D (1999) b-Peptides asinhibitors of small-intestinal cholesterol and fat absorption.Helv Chim Acta 82:1774–1783
Woody RW (1995) Absorption and circular dichroism. In: Sauer K(ed) Biochemical spectroscopy, vol 246. Academic Press, SanDiego, pp 34–71
Woody RW (1996) Theory of circular dichroism of proteins. In:Fasman DG (ed) Circular dichroism and the conformationalanalysis of biomolecules. Plenum Press, New York, pp 25–67
Woody RW, Sreerama N (1999) Comment on ‘‘improving proteincircular dichroism calculations in the far-ultraviolet throughreparametrizing the amide chromophore’’, J Chem Phys109:782 (1998). J Chem Phys 111:2844–2845
Woody RW, Tinoco I (1967) Optical rotation of oriented helices. 3.Calculation of rotatory dispersion and circular dichroism ofa- and 310-helix. J Chem Phys 46:4927–
Wu YD, Wang DP (1998) Theoretical studies of b-peptide models.J Am Chem Soc 120:13485–13493
Wu YD, Wang DP (1999) Theoretical study on side-chain controlof the 14-helix and the 10/12-helix of b-peptides. J Am ChemSoc 121:9352–9362
670
Copyright © 2022 FDOKUMEN