Ground penetrating radar investigations of the geological ...
Upload
khangminh22Category
view
1download
0
Cell-penetrating peptides for enhanced oral delivery of
nanoformulations
Sarah Streck
A thesis submitted in the fulfilment of the requirements for the degree of
Doctor of Philosophy
at the University of Otago, Dunedin,
New Zealand.
November 2019
ii
Abstract
Introduction: Oral drug delivery systems such as polymeric nanoparticles are used to
improve therapies that utilize biomacromolecules like proteins and peptides. Surface
modifications of polymeric nanoparticles play a crucial role in the interactions with the
intestinal epithelium. Cell-penetrating peptides (CPPs) are short cationic amino acid sequences
that can be utilized to enhance interactions between polymeric nanoparticles and cells. In this
thesis, surface-modified polymeric nanoparticles are prepared using a nanoprecipitation method
and a zero-length crosslinking reaction for the covalent conjugation of CPPs to polymeric
nanoparticles. Three CPPs with a distinct architecture, namely the short RRH, the long linear
TAT and the branched bTAT were exploited. Further, the nanoparticles were characterised and
the influence of the CPP architecture on cellular uptake was investigated.
Methods: A bulk nanoprecipitation and a microfluidics method were compared for the
formulation of uniform poly-lactic-co-glycolic acid (PLGA) nanoparticles using a design of
experiments study. CPP-tagged PLGA nanoparticles were formulated using a post-
microfluidics and an in situ microfluidics conjugation approach developed for the first time.
The physiochemical characteristics and morphology of PLGA and CPP-tagged PLGA
nanoparticles were analysed with dynamic light scattering, laser Doppler electrophoresis,
Fourier-transform infrared spectroscopy and transmission electron microscopy (TEM). The
distribution of CPPs on PLGA nanoparticles was further elucidated with small angle X-ray
scattering (SAXS) after gold labelling of the CPP-tagged PLGA nanoparticles. PLGA and
CPP-tagged PLGA nanoparticles were prepared using a fluorophore-labelled PLGA for in vitro
cell culture studies. The cell toxicity and interactions of the fluorophore-labelled PLGA and
CPP-tagged PLGA nanoparticles with HeLa and Caco-2 cells were investigated using flow
cytometry and confocal laser scanning microscopy.

iii
Results: PLGA nanoparticles intended for oral drug delivery and formulated with
microfluidics showed a size of 151.2 ± 1.2 nm (PDI 0.149 ± 0.014) and had superior size
characteristics in comparison to the bulk nanoprecipitation method resulting in PLGA
nanoparticles with a size of 184.0 ± 3.9 nm (PDI 0.110 ± 0.007). The covalent conjugation of
CPPs with different architectures tuned the surface charge of CPP-tagged PLGA nanoparticles
from negative to slightly positive (-24 to +5 mV). This trend in change of surface charge was
observed for both preparation methods, the post-microfluidics and the in situ microfluidics
conjugation approach. After analysis with TEM and SAXS, it was found that the distribution
of CPPs on PLGA nanoparticles depends on the preparation approach. The in situ microfluidics
conjugation approach showed a distribution of the CPPs throughout the PLGA nanoparticles,
whereas the post-microfluidics conjugation approach indicated a surface arrangement of the
CPPs on the PLGA nanoparticle surface. In vitro cell culture studies using HeLa and Caco-2
cells revealed association rather than uptake of the CPP-tagged PLGA nanoparticles.
Conclusion: Microfluidics and CPPs of different architecture were successfully
utilized for the formulation of surface-modified polymeric nanoparticles with a tuneable surface
charge. For nanoparticle-cell interactions to occur e.g. at the nano-bio interface, the surface
charge of nanoparticles plays a crucial role. Further investigation of nanoparticle-cell
interactions can aid to gain a better understanding of how the well-characterised CPP-tagged
PLGA nanoparticles presented in this thesis can influence cellular uptake.

iv
To my family

v
Acknowledgements
It all began on an icy winter day in July 2016 and now a little bit more than three years
later I am finishing this thesis. This journey would not have been possible without the constant
support and guidance from my supervisor Assoc. Prof. Arlene McDowell and my co-
supervisors Prof. Hanne Mørck Nielsen and Prof. Thomas Rades.
First of all, I would like to say thanks to Arlene for her supervision, generous time and
motivation over the past years. Looking back at this PhD journey it was so much more than
just lab research. I was very fortunate to have had the possibility to demonstrate for
undergraduate students, meet professors and researchers, go to conferences, participate in
various competitions and learn about what it means to be part of an academic world. All this
would not have been possible without Arlene’s encouragement and her trust in me that I am
capable of doing it. With Arlene’s help, I have grown so much as a researcher and on a personal
level. I’m very grateful to have had the chance to do my PhD under her supervision here at
Otago.
I would like to thank Thomas and Hanne for sharing their enthusiasms and knowledge
about research during our countless skype meetings over the past three years and for providing
the opportunity to do part of my PhD research in Copenhagen. It was a great experience
companied by a great summer and the opportunity to see my family and friends. I also want to
say thanks to Hanne’s Lab group and everyone else on the 4th floor for their support to help me
find my way around the lab and department, strawberry cake, ice cream (with strawberries) and
shared lunches. Thanks to Ditlev for maintaining the cells and helping me with the in vitro
experiments.
I would like to express my gratitude to Prof. Ben Boyd for his valuable advice and input
on my PhD, the encouragement to get things done, for looking after me at conferences and

vi
hosting me at MIPS. A huge thank you goes to Ben’s Lab group for sharing my short stay at
the synchrotron with me, great Argentinian and Korean BBQs and a bit of karaoke to make my
stay in Melbourne fantastic. In particular, thanks to Linda and Andy for their help with the lab
work and writing papers.
Many thanks to Hannah for sharing the long hours we spent in the office and the lab,
but also for introducing me to the Vietnamese cuisine. Thanks to Henriette, Sanjay and Alisa
for actively taking part in my thesis research and their help with the FTIR analysis, HPLC
analysis and in vitro studies with our care-intensive cells (aka our babies). I would like to thank
Pummy, Bettina, Sumit, and all postgraduates and visiting students for the scientific and
sometimes less scientific conversations and for recreational activities outside the School.
I would like to thank Joel Tyndall my facilitator, Sarah Hook, Greg Walker and Natalie
Medlicott and all academics, administrative, research and technical staff of the School of
Pharmacy for their help. I want to acknowledge the financial support I received from the School
of Pharmacy and the Division of Health Sciences.
I would like to thank Dr Torsten Kleffmann and Diana Carne from the Centre for Protein
Research, University of Otago for help and advice with MALDI-TOF and the staff from Otago
Micro and Nanoscale imaging facility, especially Richard Easingwood for the support and
thoughtful TEM training.
Last but not least, I would like to thank my family and friends. My parents, Mum
(Mäuschen) and Dad, for letting me go to chase my dream at the other end of the world. Antonio
for always being there for me. My brother, Gregor and his boys Neo, Elias and Jona, for their
never-ending interest about my adventures in New Zealand. Thanks to my prodrug girls
(Kirstin, Karen Janina and Katha) and all my friends in Dunedin, especially Jean, Yim, Som,
other Jean, Belinda and Johnson for living with me and distracting me from work.

vii
List of Publications
Refereed journal articles
S. Streck, H. Neumann, H. Mørck Nielsen, T. Rades and A. McDowell (2019). Comparison
of bulk and microfluidics methods for the formulation of poly-lactic-co-glycolic acid (PLGA)
nanoparticles modified with cell-penetrating peptides of different architectures. International
Journal of Pharmaceutics: X, 1, 100030. [Impact Factor 4.213]
S. Streck, A. J. Clulow, H. Mørck Nielsen, T. Rades, B. J. Boyd and A. McDowell (2019). The
distribution of cell-penetrating peptides on polymeric nanoparticles prepared using
microfluidics and elucidated with small angle X-ray scattering. Journal of Colloid and
Interface Science, 555, 438-48. [Impact Factor 6.361]
S. Streck, L. Hong, B. J. Boyd and A. McDowell (2019). Microfluidics for the production of
nanomedicines: Considerations for polymer and lipid-based systems. Pharmaceutical
Nanotechnology, 7, 1-21.
S. Streck, S. Schmidt-Rasmussen Nielsen, D. Birch, T. Rades, N. S. Hatzakis, A. McDowell
and H. Mørck Nielsen (manuscript in preparation). Interaction of cell-penetrating peptide-
modified polymeric nanoparticles with the nano-bio interface evaluated using single particle
tracking. Bioconjugate Chemistry
Conference contributions (Oral presentations)
S. Streck, A. J. Clulow, H. Neumann, H. Mørck Nielsen, T. Rades, B. J. Boyd, A. McDowell
(2018). The application of light scattering techniques to investigate surface distribution of cell-

viii
penetrating peptides on polymeric nanoparticles. Globalization of Pharmaceutics Education
Network (GPEN) Conference 2018, Singapore
S. Streck, H. Mørck Nielsen, T. Rades and A. McDowell (2018). MALDI-TOF-MS to
investigate covalent binding between cell-penetrating peptides and polymeric nanoparticles.
Centre for Protein Research User Meeting, Department of Biochemistry, University of Otago,
Dunedin, New Zealand
S. Streck, H. Mørck Nielsen, T. Rades and A. McDowell (2016). Nanoformulations decorated
with cell-penetrating peptides for enhanced delivery of therapeutics. School of Pharmacy
Research Day, University of Otago, Dunedin, New Zealand
S. Streck, H. Mørck Nielsen, T. Rades and A. McDowell (2016). Microfluidics: an efficient
approach to formulate uniform poly(lactic-co-glycolic) acid nanoparticles. D4 Conference,
Dunedin, New Zealand
S. Streck, S. Schmidt-Rasmussen Nielsen, D. Birch, T. Rades, N. S. Hatzakis, H. Mørck
Nielsen, A. McDowell (2019). Does the architecture of cell-penetrating peptides influence cell
interactions? 10th International Nanomedicine Conference 2019, Sydney, Australia
S. Streck, H. Neumann, A. J. Clulow, H. Mørck Nielsen, T. Rades, B. J. Boyd, A. McDowell
(2018). Designing the arrangement of cell-penetrating peptides on polymeric nanoparticles
using microfluidics. 9th International Nanomedicine Conference 2018, Sydney, Australia

ix
Conference contributions (Poster presentations)
S. Streck, A. J. Clulow, H. Neumann, H. Mørck Nielsen, T. Rades, B. J. Boyd, A. McDowell
(2018). Investigation of the surface distribution of the cell-penetrating peptide TAT on
polymeric nanoparticles produced with microfluidics. 1st Controlled Release Asia (CRA)
Meeting 2018, Singapore
S. Streck, H. Mørck Nielsen, T. Rades, B. J. Boyd and A. McDowell (2018). Probing the
surface characteristics of polymeric nanoparticles decorated with cell-penetrating peptides. 31st
Australian colloid and surface science student conference (ACSSSC) 2018, Warrnambool,
Australia
S. Streck, H. Mørck Nielsen, T. Rades and A. McDowell (2017). Designing CPP-tagged
PLGA nanoparticles using microfluidics. Drug Delivery Australia Conference 2017,
Wollongong, Australia
S. Streck, A. Goutach, A. J. Clulow, H. Mørck Nielsen, T. Rades, B. J. Boyd and A. McDowell
(2019). Microfluidics for the Formulation of Polymeric Nanoparticles Functionalized with
Cell-Penetrating Peptides to Enhance Delivery of Biomacromolecules. CRS Annual Meeting
2019, Valencia, Spain
Awards
Division of Health Sciences International Engagement Grant, University of Otago ($2,000.00),
August 2017
Bursary to attend D4 Conference 2016, Dunedin New Zealand, November 2016
Selected and sponsored GPEN student representative from the University of Otago

x
Table of Contents
Abstract ................................................................................................................................. ii
Acknowledgements ............................................................................................................... v
List of Publications ............................................................................................................. vii
Table of Contents .................................................................................................................. x
List of Figures ..................................................................................................................... xv
List of Tables ....................................................................................................................... xx
List of Abbreviations ........................................................................................................ xxii
1 Chapter One .................................................................................................................... 25
Nanoparticles as oral drug delivery systems .......................................................... 26
Polymeric delivery systems ...................................................................................... 27
Poly(lactic-co-glycolic acid) ............................................................................. 28
Preparation of polymeric nanoparticles ................................................................. 30
Bulk preparation methods ................................................................................. 30
Nanoprecipitation .............................................................................................. 34
Microfluidics ..................................................................................................... 37
1.3.3.1 Types of microfluidics mixer ..................................................................... 38
1.3.3.2 Optimisation of size and charge of polymeric nanoparticles ..................... 41
Modifications of polymeric nanoparticles .............................................................. 44
Influence of size on cellular uptake and biodistribution ................................... 45
Effective surface charge .................................................................................... 46
Surface modification ......................................................................................... 47
Cell-penetrating peptides ......................................................................................... 49
Classification and specific properties of CPPs ................................................. 49
1.5.1.1 Sequence-modified cell-penetration peptides ............................................ 52
Interactions between cell-penetrating peptides and cells .................................. 55

xi
Association of cell-penetrating peptides with cargos ....................................... 59
Thesis aims ................................................................................................................ 63
2 Chapter Two ................................................................................................................... 65
Introduction .............................................................................................................. 66
Design of experiments ...................................................................................... 66
Design of experiments for bulk and microfluidics preparation of nanoparticles..
........................................................................................................................... 69
Optimisation of size of polymeric nanoparticles .............................................. 71
Conjugation of biomacromolecules and polymers ........................................... 73
Chapter aims ..................................................................................................... 77
Materials.................................................................................................................... 78
Methods ..................................................................................................................... 79
Design of experiments to optimize the preparation of PLGA nanoparticles using
a bulk nanoprecipitation method ....................................................................... 79
Preparation of polymeric nanoparticles using microfluidics ............................ 80
Design of experiments study for microfluidics preparation of PLGA
nanoparticles ..................................................................................................... 81
Bulk nanoprecipitation method for preparation of PLGA nanoparticles .......... 82
Microfluidics method for the preparation of PLGA nanoparticles ................... 83
Preparation of surface-modified PLGA nanoparticles ...................................... 83
Mass spectrometry assessment of cell-penetrating peptides ............................. 84
Characterization of PLGA and CPP-tagged PLGA nanoparticles .................... 85
Investigation of covalent binding between CPPs and PLGA conjugates ......... 85
Conjugation efficiency of CPPs tagged to PLGA nanoparticles ...................... 86
Validation of RP-HPLC method for CPPs........................................................ 87
Statistical analysis ............................................................................................. 88
Results and Discussion ............................................................................................. 89

xii
Optimal PLGA and stabilizer concentration for the formulation of PLGA
nanoparticles determined by design of experiments (DoE) .............................. 89
Tuning the size and polydispersity of PLGA nanoparticles using microfluidics
and design of experiments ................................................................................ 91
Quality assessment of cell-penetrating peptides ............................................... 94
Characterization of PLGA nanoparticles .......................................................... 96
Investigation of binding between CPPs and PLGA polymer.......................... 100
Characteristics of CPP-tagged PLGA nanoparticles depends on the CPP
architecture ...................................................................................................... 101
Validation of RP-HPLC methods ................................................................... 104
Conjugation efficiency of CPPs with different architectures on PLGA
nanoparticles ................................................................................................... 108
Conclusion ............................................................................................................... 111
3 Chapter Three ............................................................................................................... 112
Introduction ............................................................................................................ 113
Characterisation of polymeric nanoparticles using small angle X-ray scattering .
......................................................................................................................... 113
Imaging of nanoparticles to reveal morphology ............................................. 118
Functionalisation of polymeric nanoparticles using microfluidics ................. 120
Chapter aims ................................................................................................... 123
Materials.................................................................................................................. 124
Methods ................................................................................................................... 124
In situ microfluidics conjugation for the preparation of CPP-tagged PLGA
nanoparticles and Au-labelled CPP-tagged nanoparticles .............................. 124
Conjugation efficiency of CPPs after in situ microfluidics preparation of CPP-
tagged PLGA nanoparticles ............................................................................ 126
Post-microfluidics conjugation for the preparation of CPP-tagged PLGA
nanoparticles and Au-labelled CPP-tagged PLGA nanoparticles ................... 127

xiii
Characterization of nanoformulations............................................................. 127
Transmission electron microscopy ................................................................. 127
Small angle X-ray scattering ........................................................................... 128
Statistical analysis ........................................................................................... 128
Results and Discussion ........................................................................................... 129
Conjugation approaches for preparation of CPP-tagged PLGA nanoparticles .....
......................................................................................................................... 129
Characteristics of CPP-tagged PLGA nanoparticles depends on the CPP
architecture ...................................................................................................... 129
Conjugation efficiency of CPPs with different architecture on PLGA
nanoparticles ................................................................................................... 132
Characterization of Au-labelled CPP-tagged PLGA nanoparticles ................ 133
TEM micrographs show the distribution of CPP on PLGA nanoparticles ..... 135
Investigation of CPP distribution on PLGA nanoparticles using SAXS ........ 139
Structural distribution of CPPs ....................................................................... 144
Conclusion ................................................................................................................ 146
4 Chapter Four ................................................................................................................ 147
Introduction ............................................................................................................ 148
Interactions of nanoparticles at the nano-bio interface ................................... 148
The intestinal epithelium as a barrier for nanoparticle uptake ........................ 152
Chapter aims ................................................................................................... 158
Materials.................................................................................................................. 159
Methods ................................................................................................................... 160
Preparation of CPP-tagged PLGA-FPR nanoparticles using microfluidics ... 160
Characterization of CPP-tagged PLGA-FPR nanoparticles ........................... 160
Culturing of HeLa and Caco-2 cells ............................................................... 161
Toxicity of nanoformulations in HeLa and Caco-2 cells ................................ 162

xiv
Cell integrity of Caco-2 cell monolayer.......................................................... 163
Uptake of nanoparticles using flow cytometry for HeLa and Caco-2 cells .... 163
Qualitative cell uptake study using confocal laser scanning microscopy for HeLa
and Caco-2 cells .............................................................................................. 165
Statistical analysis ........................................................................................... 166
Results and Discussion ........................................................................................... 167
Characterization of CPP-tagged PLGA-FPR nanoparticles ........................... 167
4.4.1.1 Physicochemical properties of nanoparticles in ultra-pure water ............ 167
4.4.1.2 Physicochemical properties of nanoparticles in cell culture buffer ......... 169
Interaction of nanoformulations with HeLa cells ........................................... 172
4.4.2.1 Cell viability of HeLa cells ...................................................................... 172
4.4.2.2 Quantification of cellular uptake of nanoparticles in HeLa cells ............ 175
4.4.2.3 Qualification of cellular uptake of nanoparticles in HeLa cells .............. 177
Interaction of nanoformulations with Caco-2 cells ......................................... 181
4.4.3.1 Cell viability and cell integrity of Caco-2 cells ....................................... 181
4.4.3.2 Quantification of cellular uptake of nanoparticles in Caco-2 cells .......... 184
4.4.3.3 Qualification of cellular uptake in Caco-2 cells ...................................... 189
Conclusion ............................................................................................................... 192
5 Chapter Five .................................................................................................................. 194
Introduction and general summary ...................................................................... 195
Application of research in the wider research area ............................................ 196
Future direction: Defining the surface of nanoparticles ..................................... 199
Future direction: Improvement of in vitro studies .............................................. 202
References.............................................................................................................................. 204
Appendix ............................................................................................................................... 226

xv
List of Figures
Figure 1.1. Structure and reaction of cyclic monomers used for the synthesis of PLGA and the
structure of monomers after hydrolysis of the PLGA polymer (Avgoustakis, 2008; Makadia and
Siegel, 2011). ............................................................................................................................ 29
Figure 1.2. Schematic description of w/o/w double emulsion solvent evaporation (A) and o/w
single emulsion solvent evaporation (B) method for the preparation of polymeric nanoparticles
(Crucho and Barros, 2017). ...................................................................................................... 32
Figure 1.3. Schematic of the bulk nanoprecipitation method for the preparation of polymeric
nanoparticles (A) and assembly of polymeric nanoparticles (B) during preparation using the
nanoprecipitation method (Crucho and Barros, 2017; Karnik et al., 2008). ............................ 35
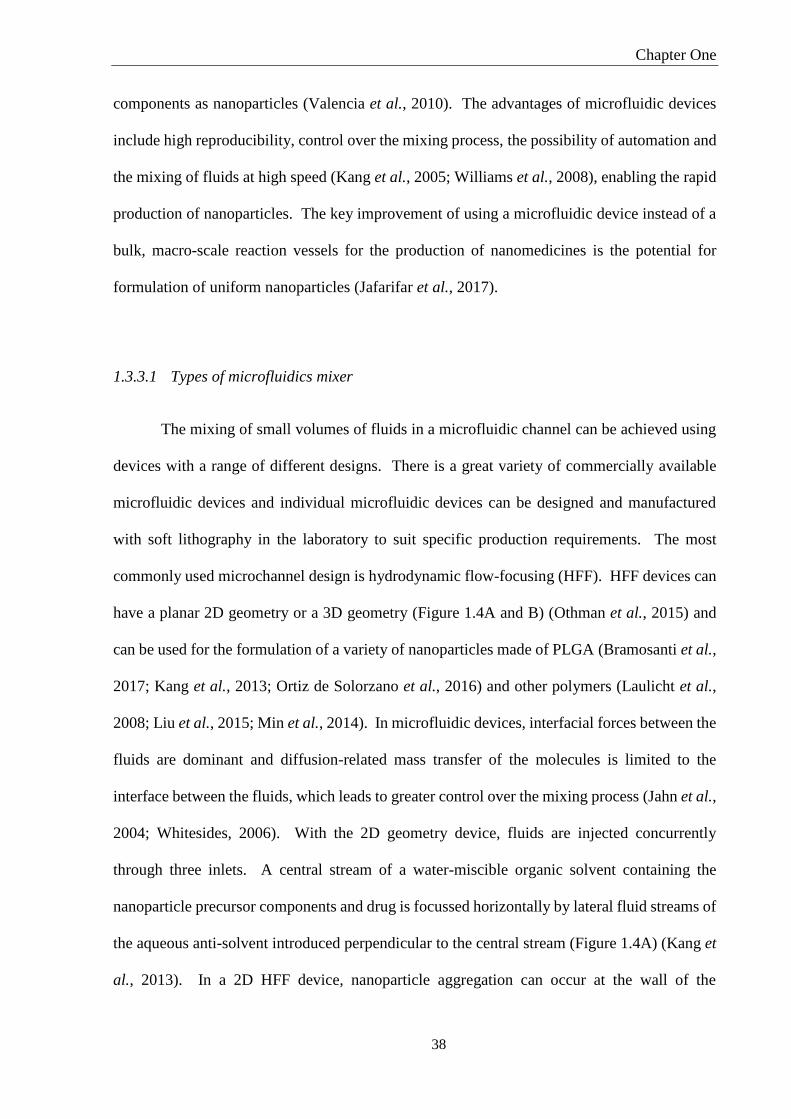
Figure 1.4. Illustration of the flow pattern of fluids in different microfluidic devices used for
the formulation of nanoparticles. (A) 2D and (B) 3D hydrodynamic flow-focusing
microchannel, (C) droplet-based microchannel and (D) microchannel with a staggered
herringbone mixer (SHM) channel design (Streck et al., 2019c). ............................................ 39
Figure 1.5. The influence of size, charge and surface modification on the physicochemical
properties of polymeric nanoparticles (Fenton et al., 2018; Torchilin, 2014). CPPs = cell-
penetrating peptides, PEG = polyethylene glycol. ................................................................... 47
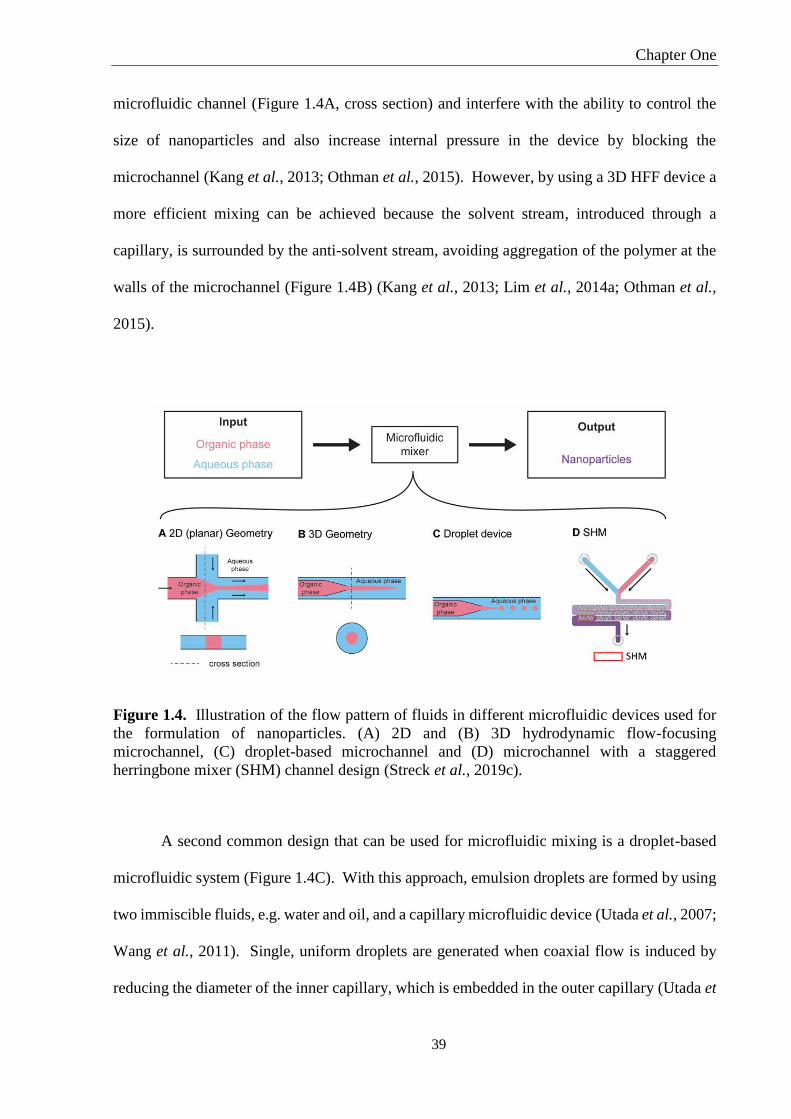
Figure 1.6. Classification of cell-penetrating peptides after modification of their sequence by
adding branches, dimers, scaffolds and creating networks and dendrimers (Angeles-Boza et al.,
2010; Brock et al., 2018; Eggimann et al., 2014; Foerg et al., 2007; Jeong et al., 2016; Saleh et
al., 2010; Yoo et al., 2017; Zhao et al., 2014a). CPP = cell-penetrating peptide. .................. 53
Figure 1.7. Cellular uptake mechanisms of cell-penetrating peptides adapted from Guidotti et
al. (2017) with permission from Elsevier. ................................................................................ 56
Figure 1.8. Possible cell-penetrating peptide cargos and schematic of non-covalent (A) and
covalent (B) interactions between polymeric nanoparticles and CPPs (Guidotti et al., 2017;
Streck et al., 2019c) (With permission from Elsevier). CPP = cell-penetrating peptide......... 60
Figure 2.1. Schematic representations of two-level factorial design (A), central composite
design (B) and Box-Behnken design (C) for three different input factors (Hanrahan and Lu,
2006; Mandenius and Brundin, 2008). ..................................................................................... 68
Figure 2.2. Influence of input factors on the output responses for the preparation of PLGA
nanoparticles using a bulk nanoprecipitation method (Bairagi et al., 2018; Patel et al., 2016;
Sonam et al., 2014; Tefas et al., 2015; Vuddanda et al., 2015; Yadav and Sawant, 2010). PDI
= polydispersity index, EE = encapsulation efficiency. ........................................................... 69

xvi
Figure 2.3. Generalized correlation between microfluidics-related parameters and the size of
the resulting polymeric nanoparticles formulated with PLGA (10 mg/mL, co-polymer ratio
75:25 and 50:50) and PEG-PLGA (10 to 30 mg/mL) (Lim et al., 2014a; Min et al., 2014;
Morikawa et al., 2018). Arrows indicate an increase in flow rate or flow rate ratio (Streck et
al., 2019c). ................................................................................................................................ 72
Figure 2.4. Schematic of maleimide reaction (A), EDC/sulfo-NHS zero-length crosslinking
reaction (B) and streptavidin-biotin affinity reaction (C) for the surface conjugation of
nanoparticles (Hermanson, 2013c; Nam et al., 2002; Xu et al., 2013a). ................................. 75
Figure 2.5. Illustration of the architecture of the short (RRH), the long linear (TAT) and the
branched CPP (bTAT: modified TAT backbone and three RRH branches). Amino acid single
letter codes have been used for each peptide (R = arginine, H = histidine, G = glycine, K =
lysine, Q = glutamine) (Streck et al., 2019a). .......................................................................... 79
Figure 2.6. Microfluidic cartridge used for the NanoAssemblr® Benchtop Device (A) and
depth profile of herringbone feature (B) found within the microchannel (not to scale).
Schematic of herringbone feature was adapted from Belliveau et al. (2012). The SHM section
of the microchannel is 2.5 cm long and can hold a volume of 0.0004 mL. ............................. 81
Figure 2.7. Response surface plots for the size (nm) (A) and polydispersity index (PDI) (B) of
nanoparticles as a function of PLGA and PVA concentration for preparation of PLGA
nanoparticles using the bulk nanoprecipitation method (Streck et al., 2019a)......................... 90
Figure 2.8. Response surface plots for the responses size (A) and PDI (B) as a function of the
total flow rate (mL/min) and the flow rate ratio (aqueous:organic) for preparation of PLGA
nanoparticles using the microfluidics method (Streck et al., 2019b). ...................................... 92
Figure 2.9. Mass spectra of the RRH (A), TAT (B) and bTAT (C) obtained with matrix assisted
laser desorption ionisation-time of flight mass spectrometry analysis. .................................... 95
Figure 2.10. Transmission electron micrographs of unmodified PLGA (A) and TAT-tagged
PLGA nanoparticles (B) prepared using a bulk nanoprecipitation method and unmodified
PLGA (C), RRH- (D), TAT- (E) and bTAT-tagged PLGA nanoparticles (F) prepared using the
microfluidics method (Streck et al., 2019a). ............................................................................ 99
Figure 2.11. Fourier-transform infrared spectra of PLGA polymer, the individual cell-
penetrating peptides (RRH, TAT, bTAT) and PLGA-CPP conjugates (Streck et al., 2019a).
................................................................................................................................................ 100
Figure 2.12. Size, polydispersity index (A) and zeta potential (B) of PLGA nanoparticles and
CPP-tagged PLGA nanoparticles with different concentrations of CPPs (RRH, TAT, bTAT),
prepared using the post-microfluidics conjugation approach. Size is displayed as circles and

xvii
triangles represent polydispersity (Streck et al., 2019a). Data are means SD (n = 3
independent batches). *p-value < 0.05 for the comparison of CPP-tagged PLGA nanoparticles
with PLGA nanoparticles, ns = not significant. ..................................................................... 102
Figure 2.13. Representative RP-HPLC chromatograms of RRH (100 µg/mL) (A), TAT (100
µg/mL) (B) and bTAT (100 µg/mL) (C) eluted with the individual RP-HPLC methods for each
CPP. ........................................................................................................................................ 105
Figure 3.1. Schematic of the sample set up for small angle X-ray scattering with the detection
of scattering patterns (A) and a small angle X-ray scattering plot showing information about
the sample structure deduced from the scattering curve (B) (Li et al., 2016; Luo et al., 2019b).
2θ = scattering angle, I (q) = scattering intensity, q = scattering vector. ............................... 115
Figure 3.2. Functionalisation of polymeric nanoparticles using a pre-microfluidics (A)
(Kamaly et al., 2016; Liu et al., 2010; Valencia et al., 2013), an in situ microfluidics (B) or a
post-microfluidics (C) (Kolishetti et al., 2010) conjugation approach (Streck et al., 2019c).
................................................................................................................................................ 121
Figure 3.3. Comparison of the in situ microfluidics (A) and the post-microfluidics (B)
conjugation approaches for the formulation of Au-labelled CPP-tagged PLGA nanoparticles.
Label-free CPP-tagged PLGA nanoparticles (i) and Au-labelled CPP-tagged PLGA
nanoparticles (ii) were produced using the in situ microfluidics (A) conjugation approach. The
microchannel diagram, with the red box indicating the herringbone structure, was modified
from Belliveau et al. (2012) (Streck et al., 2019b). SHM = staggered herringbone mixer, ACN
= acetonitrile. .......................................................................................................................... 126
Figure 3.4. Size, polydispersity (A) and zeta potential (B) of PLGA nanoparticles and CPP-
tagged PLGA nanoparticles with different concentrations of the CPPs (RRH, TAT and bTAT),
prepared using the in situ microfluidics conjugation approach. Size is displayed as circles and
triangles represent polydispersity. Data are means SD (n = 3 independent batches). *p-value
< 0.05 for the comparison of CPP-tagged PLGA nanoparticles with PLGA nanoparticles, ns =
not significant. ........................................................................................................................ 131
Figure 3.5. Representative micrographs of Au-labelled RRH-tagged PLGA nanoparticles
prepared using the post-microfluidics (A) and the in situ microfluidics conjugation approach
(B) (Streck et al., 2019b). ....................................................................................................... 135
Figure 3.6. Transmission electron micrograph of Au-labelled RRH-tagged PLGA
nanoparticles (A) and inserts of free individual AuNPs (1) and a RRH-tagged PLGA
nanoparticle with surface-bound AuNPs (2). The hexagonal formation of the AuNPs is

xviii
indicated by the red dashed line and the red arrows indicate how the distance between AuNPs
was measured (Streck et al., 2019b). ...................................................................................... 137
Figure 3.7. Representative micrographs of Au-labelled TAT- and bTAT-tagged PLGA
nanoparticles prepared using the post-microfluidics (A, C) and the in situ microfluidics
conjugation approach (B, D). ................................................................................................. 138
Figure 3.8. Small angle X-ray scattering profiles of AuNPs (black data points) and PLGA
nanoparticles tagged with CPPs of different architectures (RRH, TAT and bTAT) (red data
points). Panels A-C show Au-labelled CPP-tagged PLGA nanoparticles prepared with the post-
microfluidics conjugation approach (purple data points) and panels D-F were produced using
the in situ microfluidics conjugation approach (green data points) (Streck et al., 2019b). AuNPs
= gold nanoparticles and MF = microfluidics. ....................................................................... 141
Figure 3.9. Schematic overview of proposed CPP distribution of Au-labelled CPP-tagged
PLGA nanoparticles and the corresponding distribution of label-free CPP-tagged PLGA
nanoparticles prepared using a post-microfluidics conjugation (A) or an in situ microfluidics
conjugation (B) approach (Streck et al., 2019b). NP = nanoparticle. ................................... 145
Figure 4.1. Schematic representation of the in vitro Sedimentation, Diffusion, Dissolution, and
Dosimetry model applied to polymeric nanoparticles including the sedimentation and diffusion
of the drug-loaded polymeric nanoparticles (A), the dissolution of the polymer and drug release
(B) and the interaction/uptake of drug/nanoparticles at the cell surface (C) (Thomas et al.,
2018). ...................................................................................................................................... 151
Figure 4.2. Cell viability of HeLa cells after 1 h incubation with PLGA-FPR and CPP-tagged
PLGA-FPR nanoparticles prepared using the post-microfluidics (A) or in situ microfluidics (B)
conjugation approach and CPP solutions with different concentrations (C). The black line
indicates 100% as negative control. Data are means ± SEM (n = 3). NPs = nanoparticles. . 174
Figure 4.3. Fluorescence intensity measured in HeLa cells after 1 h incubation with different
dilutions of PLGA-FPR and CPP-tagged PLGA-FPR nanoparticles prepared using the post-
microfluidics (A) or the in situ microfluidics (B) conjugation approach. Control cells were
incubated with cell culture buffer. Data are means ± SEM (n = 3). * p-value < 0.05 for
comparison between PLGA-FPR and TAT-tagged PLGA-FPR nanoparticles. NPs =
nanoparticles. .......................................................................................................................... 177
Figure 4.4. Confocal images of HeLa cells incubated for 1 h with PLGA-FPR (A), RRH- (B),
TAT- (C) and bTAT-tagged PLGA-FPR nanoparticles (D) prepared using the post-
microfluidics conjugation approach. ...................................................................................... 179

xix
Figure 4.5. Confocal images of HeLa cells incubated for 1 h with PLGA-FPR (A), RRH- (B),
TAT- (C) and bTAT-tagged PLGA-FPR nanoparticles (D) prepared using the in situ
microfluidics conjugation approach. ...................................................................................... 180
Figure 4.6. Cell viability graphs of Caco-2 cells after 2 h incubation with PLGA-FPR and
CPP-tagged PLGA-FPR nanoparticles prepared using the post-microfluidics conjugation
approach (A) and CPP solutions with different concentrations (B). The black line indicates
100% as negative control. Data are means ± SEM (n = 3). NPs = nanoparticles. ............... 183
Figure 4.7. Uptake of PLGA-FPR and CPP-tagged PLGA-FPR nanoparticles prepared using
the post-microfluidics conjugation approach in Caco-2 cells after incubation for different time
points (0.5, 2 and 6 h) (A) and cell viability assessed with propidium iodide staining (B). Data
are means ± SEM (n = 3). NPs = nanoparticles. ................................................................... 186
Figure 4.8. Comparison of uptake of PLGA-FPR and CPP-tagged PLGA-FPR nanoparticles
after heparin treatment and no heparin treatment in Caco-2 cells after incubation for 2 h. Cells
were either washed with heparin (20 µg/mL in DPBS, pH 7.4) or washed with DPBS (pH 7.4)
without heparin. Data are means ± SEM (n = 3). * p-value < 0.05 for comparison between
samples prepared with or without heparin treatment. NPs = nanoparticles. ......................... 188
Figure 4.9. Representative confocal images of Caco-2 cell monolayer incubated for 2 h with
PLGA-FPR (A), RRH- (B), TAT- (C) and bTAT-tagged PLGA-FPR nanoparticles (D)
prepared using the post-microfluidics conjugation approach. The white arrow is pointing
towards red fluorescence of PLGA-FPR nanoparticles or CPP-tagged PLGA-FPR
nanoparticles. .......................................................................................................................... 190

xx
List of Tables
Table 1.1. Summary of bulk preparation methods for the formulation of polymeric
nanoparticles. PLGA = poly (lactic-co-glycolic acid), PCL = poly(ε-caprolactone), PLA =
poly-L-lactic acid, PLLA-PEG = poly-L-lactic acid-poly (ethylene glycol), w/o = water/oil,
w/o/w = water/oil/water. ........................................................................................................... 31
Table 1.2. Summary of cell-penetrating peptides commonly used in pharmaceutical research.
.................................................................................................................................................. 51
Table 2.1. Input parameters for the DoE study to optimize the formulation of PLGA
nanoparticles using a bulk nanoprecipitation method (Streck et al., 2019a). ........................... 80
Table 2.2. Input parameters for the DoE study for the formulation of PLGA nanoparticles using
microfluidics (Streck et al., 2019b). FRR = flow rate ratio, TFR = total flow rate. ................ 82
Table 2.3. Summary of results for the statistical analysis of the size and polydispersity index
models for the bulk nanoprecipitation method to produce PLGA nanoparticles (Streck et al.,
2019a). ...................................................................................................................................... 91
Table 2.4. Summary of results for the statistical analysis of the size and polydispersity index
models for the microfluidics method to produce PLGA nanoparticles (Streck et al., 2019b). 94
Table 2.5. Characterization of PLGA and TAT-tagged PLGA nanoparticles prepared with the
optimized parameters for the bulk nanoprecipitation method and with the microfluidics method
(Streck et al., 2019a). Data are means ± SD (n = 3 independent batches). * p-value < 0.05 in
comparison to the respective bulk method. .............................................................................. 97
Table 2.6. Measured concentration (µg/mL), coefficient of variation (CV, %) and accuracy of
standard curves obtained for the validation of RP-HPLC methods for RRH, TAT and bTAT.
Data are means ± SD (n = 3). ................................................................................................. 106
Table 2.7. Measured concentration (µg/mL), coefficient of variation (CV, %) and accuracy for
intra- and inter-day values of quality control samples of RRH, TAT and bTAT for the validation
of RP-HPLC methods. Data are means ± SD (n = 3). QC = quality control sample. .......... 107
Table 2.8. The limit of quantification and the limit of detection for the three different RP-
HPLC assays to quantify the concentration of each of the CPPs (Streck et al., 2019a). ....... 108
Table 2.9. Conjugation efficiencies and the equivalent concentrations of the CPPs tagged to
PLGA nanoparticles (NPs) using different concentrations of CPPs prepared with a post-
microfluidics conjugation approach (Streck et al., 2019a). Data are means SD (n = 3
independent batches). * p-value < 0.05 in comparison to the conjugation efficiency of 8.6 mM
TAT. ....................................................................................................................................... 110
xxi
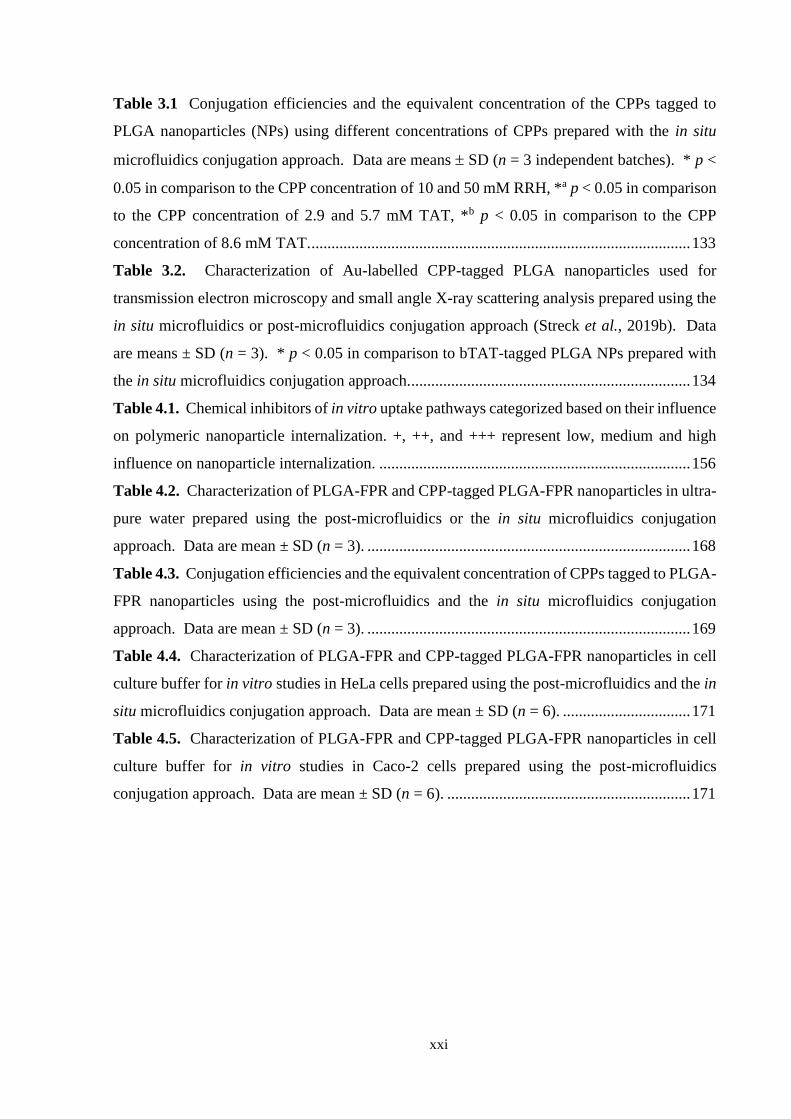
Table 3.1 Conjugation efficiencies and the equivalent concentration of the CPPs tagged to
PLGA nanoparticles (NPs) using different concentrations of CPPs prepared with the in situ
microfluidics conjugation approach. Data are means SD (n = 3 independent batches). * p <
0.05 in comparison to the CPP concentration of 10 and 50 mM RRH, *a p < 0.05 in comparison
to the CPP concentration of 2.9 and 5.7 mM TAT, *b p < 0.05 in comparison to the CPP
concentration of 8.6 mM TAT. ............................................................................................... 133
Table 3.2. Characterization of Au-labelled CPP-tagged PLGA nanoparticles used for
transmission electron microscopy and small angle X-ray scattering analysis prepared using the
in situ microfluidics or post-microfluidics conjugation approach (Streck et al., 2019b). Data
are means ± SD (n = 3). * p < 0.05 in comparison to bTAT-tagged PLGA NPs prepared with
the in situ microfluidics conjugation approach....................................................................... 134
Table 4.1. Chemical inhibitors of in vitro uptake pathways categorized based on their influence
on polymeric nanoparticle internalization. +, ++, and +++ represent low, medium and high
influence on nanoparticle internalization. .............................................................................. 156
Table 4.2. Characterization of PLGA-FPR and CPP-tagged PLGA-FPR nanoparticles in ultra-
pure water prepared using the post-microfluidics or the in situ microfluidics conjugation
approach. Data are mean ± SD (n = 3). ................................................................................. 168
Table 4.3. Conjugation efficiencies and the equivalent concentration of CPPs tagged to PLGA-
FPR nanoparticles using the post-microfluidics and the in situ microfluidics conjugation
approach. Data are mean ± SD (n = 3). ................................................................................. 169
Table 4.4. Characterization of PLGA-FPR and CPP-tagged PLGA-FPR nanoparticles in cell
culture buffer for in vitro studies in HeLa cells prepared using the post-microfluidics and the in
situ microfluidics conjugation approach. Data are mean ± SD (n = 6). ................................ 171
Table 4.5. Characterization of PLGA-FPR and CPP-tagged PLGA-FPR nanoparticles in cell
culture buffer for in vitro studies in Caco-2 cells prepared using the post-microfluidics
conjugation approach. Data are mean ± SD (n = 6). ............................................................. 171

xxii
List of Abbreviations
ACN Acetonitrile
ADME Absorption-Distribution-Metabolism-Excretion
ANOVA Analysis of variance
ATP Adenosine triphosphate
AuNPs Gold nanoparticles
BSA Bovine serum albumin
bTAT Branched TAT
CLSM Confocal laser scanning microscopy
CPP Cell-penetrating peptide
CV Coefficient of variation
dfTat Dimeric and fluorescent Tat
DLS Dynamic light scattering
DMEM Dulbecco’s Modified Eagle Medium
DMSO Dimethyl sulfoxide
DoE Design of experiments
DPBS Dulbecco’s Phosphate Buffered Saline
D2O/H2O Deuterated water/Water
EDC N-(3-dimethylaminopropyl)-N-ethylcarbodiimide hydrochloride
EDTA Ethylenediaminetetraacetic acid
EMEM Eagle's Minimal Essential Medium
FBS Fetal bovine serum
FPR Fluorescent dye FPR648
FTIR Fourier-transform infrared
GIT Gastrointestinal tract
GnRH Gonadotropin releasing hormone
HBSS Hank’s balanced salt solution
HEPES 2-[4-(2-hydroxyethyl)piperazin-1-yl]ethanesulfonic acid
HFF Hydrodynamic flow-focusing
IDSS In vitro Sedimentation, Diffusion and Dosimetry
ISD3 In vitro Sedimentation, Diffusion, Dissolution, and Dosimetry
IU International unit
LOD Limit of detection
LOQ Limit of quantification
xxiii
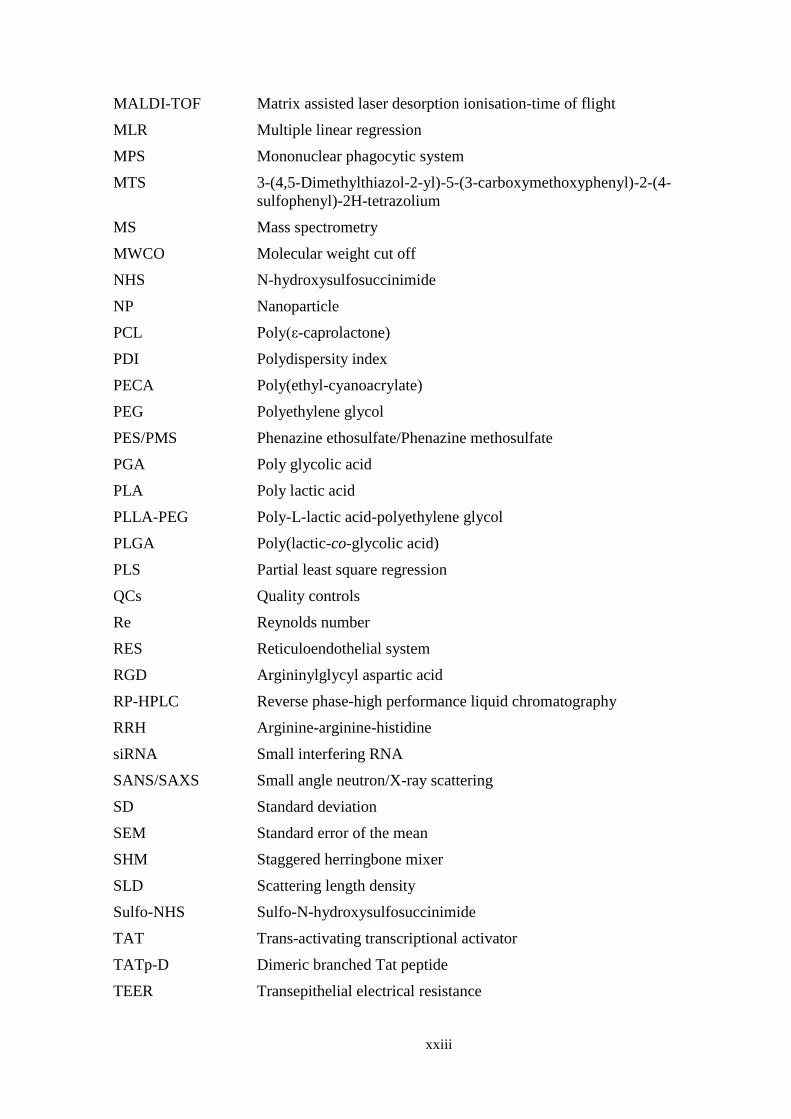
MALDI-TOF Matrix assisted laser desorption ionisation-time of flight
MLR Multiple linear regression
MPS Mononuclear phagocytic system
MTS 3-(4,5-Dimethylthiazol-2-yl)-5-(3-carboxymethoxyphenyl)-2-(4-
sulfophenyl)-2H-tetrazolium
MS Mass spectrometry
MWCO Molecular weight cut off
NHS N-hydroxysulfosuccinimide
NP Nanoparticle
PCL Poly(ε-caprolactone)
PDI Polydispersity index
PECA Poly(ethyl-cyanoacrylate)
PEG Polyethylene glycol
PES/PMS Phenazine ethosulfate/Phenazine methosulfate
PGA Poly glycolic acid
PLA Poly lactic acid
PLLA-PEG Poly-L-lactic acid-polyethylene glycol
PLGA Poly(lactic-co-glycolic acid)
PLS Partial least square regression
QCs Quality controls
Re Reynolds number
RES Reticuloendothelial system
RGD Argininylglycyl aspartic acid
RP-HPLC Reverse phase-high performance liquid chromatography
RRH Arginine-arginine-histidine
siRNA Small interfering RNA
SANS/SAXS Small angle neutron/X-ray scattering
SD Standard deviation
SEM Standard error of the mean
SHM Staggered herringbone mixer
SLD Scattering length density
Sulfo-NHS Sulfo-N-hydroxysulfosuccinimide
TAT Trans-activating transcriptional activator
TATp-D Dimeric branched Tat peptide
TEER Transepithelial electrical resistance

xxiv
TEM Transmission electron microscopy
TFA Trifluoroacetic acid
WAXS Wide angle X-ray scattering

1 Chapter One
General Introduction
Part of this Chapter has been published as:
S. Streck, L. Hong, B. J. Boyd and A. McDowell (2019). Microfluidics for the production of
nanomedicines: Considerations for polymer and lipid-based systems. Pharmaceutical
Nanotechnology, 7, 1-21.
Chapter One
26
Nanoparticles as oral drug delivery systems
The metric scale categorizes materials according to their dimensions, and
pharmaceutical research utilizes both micro- and nano-sized particles for application in
delivering therapeutic compounds to patients. Micro- and nanoparticles are used as drug
delivery systems for the treatment of cancer (Derakhshandeh et al., 2007; Dong et al., 2019;
Jaimes-Aguirre et al., 2017), diabetes (Sharma et al., 2015), bacterial infections (Sonam et al.,
2014), for vaccine delivery (Bailey et al., 2017; Kaneko et al., 2018) or as diagnostic agents
(Zhu et al., 2019). The term ‘nano’ refers to structures between 1 and 100 nm, but nanoparticles
more commonly include structures of up to 1000 nm in one dimension (Farokhzad and Langer,
2009). The application of nanoparticles for drug delivery via the oral route of administration is
a simple approach and results in good patient compliance since self-administration of the drug
delivery system is convenient for the patient (Date et al., 2016).
For therapeutic applications, proteins and peptides are often referred to as
biopharmaceuticals or biomacromolecules and they are of interest due to their high efficiency,
low toxicity and good tolerance after administration (Malhaire et al., 2016; Thwala et al., 2017).
The main challenge for oral delivery of proteins and peptides, however, is their fragility in the
gastrointestinal tract (GIT) (Malhaire et al., 2016). There are three main hurdles
biomacromolecules encounter before reaching the cell surface where uptake into the body can
occur. These hurdles are (i) the changes in pH that occur throughout the GIT and alter the
ionisation status of the molecules, (ii) the presence of enzymes in the lumen and within
epithelial cells that can degrade biomacromolecules and (iii) the mucus layer covering the apical
surface of the epithelium that acts as a diffusion barrier to absorption (Kristensen and Nielsen,
2016). In addition, the physicochemical characteristics of biomacromolecules including a high

Chapter One
27
molecular weight, hydrophilicity and enzymatic instability contribute to a low oral
bioavailability (< 1%) and poor permeability after oral administration (Bourganis et al., 2017;
Date et al., 2016; Thwala et al., 2017).
A strategy to overcome low bioavailability and physicochemical instability is the
encapsulation of biomacromolecules in drug delivery systems. Drug delivery systems are a
diverse group of carriers including liposomes (Kastner et al., 2015), micelles (Capretto et al.,
2012), lipid-polymer hybrid nanoparticles (Kim et al., 2012) and polymeric nanoparticles
(Jaimes-Aguirre et al., 2017). Nanoparticles can be used to shield proteins and peptides against
the harsh environment in the GIT and to assist the transport of therapeutics across the intestinal
epithelium (Malhaire et al., 2016). Polymeric nanoparticles are characterised by prolonged
stability in an acidic environment, low toxicity and targeted delivery abilities (Lee et al., 2016).
Three key advantages of polymeric nanoparticles as an oral drug delivery system have been
identified. The encapsulation of drug in polymeric nanoparticles improves the bioavailability
of the drug (Bobo et al., 2016), and facilitates controlled release of encapsulated drug from the
polymer matrix (Banik et al., 2016; Jaimes-Aguirre et al., 2017). A third advantage is that
surface modification increases the stability of the polymeric nanoparticles in in vitro and in vivo
conditions and the targeting of specific tissue as the site of action for the encapsulated drug
(Banik et al., 2016; Torchilin, 2014).
Polymeric delivery systems
Polymeric materials for production of nanoparticles for drug delivery can be obtained
from natural sources like albumin, alginate and chitosan or can be of synthetic origin (Zhang et
al., 2013). Synthetic polymers can be divided into biodegradable polymers like poly(ε-

Chapter One
28
caprolactone) and poly(lactic-co-glycolic acid) (PLGA) and non-degradable polymers such as
polyacrylates (Zhang et al., 2013). The polymer used for the formation of nanoparticles has a
major influence on the physicochemical characteristics of the formulated polymeric
nanoparticles and needs to be chosen carefully to suit the needs of the application (Bobo et al.,
2016). The focus of this thesis is on PLGA as a biodegradable polymer for oral drug delivery
systems due its biocompatibility and low toxicity and the approval of the polymer for human
applications by the FDA (Food and Drug Administration US) and EMA (European Medicine
Agency) (Danhier et al., 2012; Masood, 2016).
Poly(lactic-co-glycolic acid)
A copolymer is defined by the presence of two different monomer units repeating in the
polymer chain (Scott and Penlidis, 2017). The physicochemical characteristics of copolymers
depend on the incorporated monomers and show a wide range of characteristics due to the
combination of individual monomer properties (Scott and Penlidis, 2017). From a chemical
point of view, PLGA is a copolymer (Masood, 2016), but more commonly in scientific
publications it is referred to as a polymer and this nomenclature will also apply for this thesis.
The PLGA polymer consists of two monomers, namely lactic acid and glycolic acid,
and can be synthesised by direct polycondensation of the monomers or ring-opening
polymerisation of the cyclic diesters lactide and glycolide (Figure 1.1) (Avgoustakis, 2008).
Poly lactic acid (PLA) is a hydrophobic polymer due to methyl side groups in the molecule and
provides a slow rate of degradation over the period of weeks (Makadia and Siegel, 2011;
Steinbach et al., 2016). Poly glycolic acid (PGA) on the other hand is a hydrophilic polymer
and shows faster degradation because of hydrolytic instability (Makadia and Siegel, 2011). In
Chapter One
29
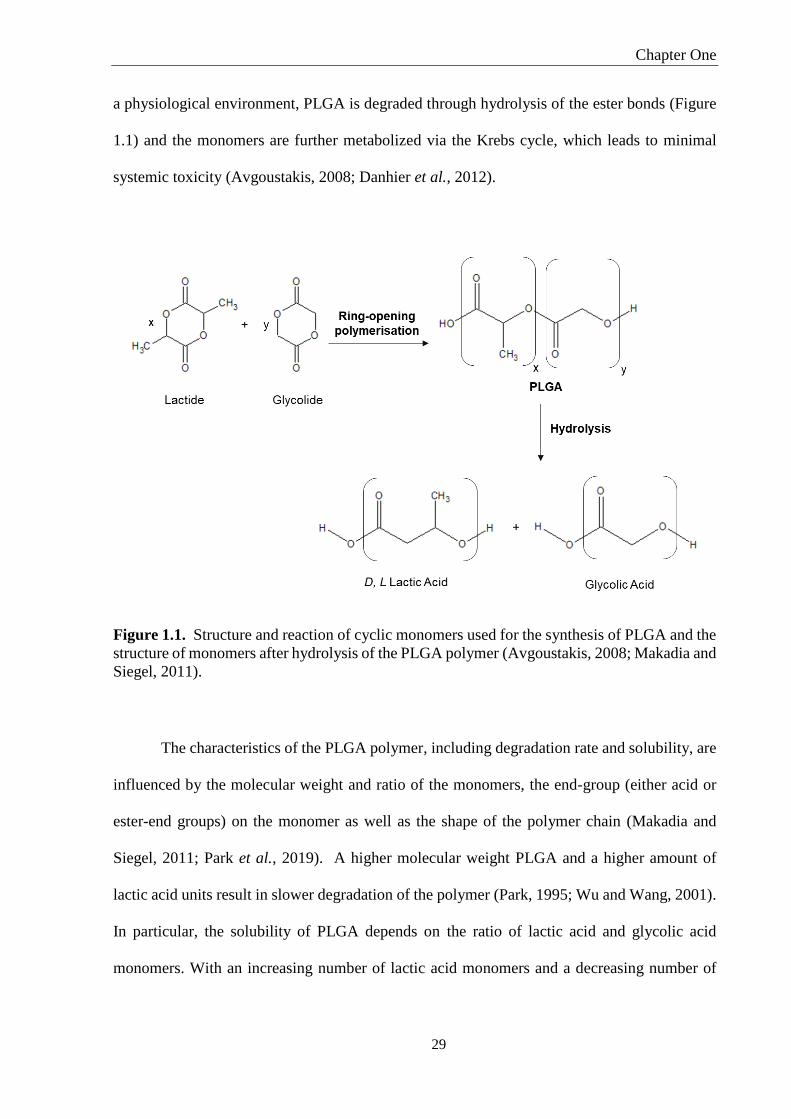
a physiological environment, PLGA is degraded through hydrolysis of the ester bonds (Figure
1.1) and the monomers are further metabolized via the Krebs cycle, which leads to minimal
systemic toxicity (Avgoustakis, 2008; Danhier et al., 2012).
Figure 1.1. Structure and reaction of cyclic monomers used for the synthesis of PLGA and the
structure of monomers after hydrolysis of the PLGA polymer (Avgoustakis, 2008; Makadia and
Siegel, 2011).
The characteristics of the PLGA polymer, including degradation rate and solubility, are
influenced by the molecular weight and ratio of the monomers, the end-group (either acid or
ester-end groups) on the monomer as well as the shape of the polymer chain (Makadia and
Siegel, 2011; Park et al., 2019). A higher molecular weight PLGA and a higher amount of
lactic acid units result in slower degradation of the polymer (Park, 1995; Wu and Wang, 2001).
In particular, the solubility of PLGA depends on the ratio of lactic acid and glycolic acid
monomers. With an increasing number of lactic acid monomers and a decreasing number of

Chapter One
30
glycolic acid monomers, the physicochemical characteristics change from being soluble in
fluorinated solvents to common organic solvents like acetone (Park et al., 2019).
Preparation of polymeric nanoparticles
Polymeric nanoparticles formulated with the PLGA polymer can increase the systemic
absorption after oral administration of small molecular weight drugs with different structures
and hydrophilicities as well as larger molecules like insulin, heparin and vaccines (Mante et al.,
2016). Efficient production of nanoparticles for drug delivery applications is increasingly
important to ensure that the benefits of these delivery systems are translated from ‘bench to
bedside’.
Bulk preparation methods
The formulation of nanoparticles is commonly performed with bulk preparation
methods, which use volumes between 5 and 50 mL in an appropriate vessel (Babos et al., 2018;
Haggag et al., 2018). There are a number of preparation methods like dialysis, interfacial
polymerisation, salting out and spray-drying that are less frequently used for the preparation of
nanoparticles (Allemann et al., 1993; Draheim et al., 2015; Kafka et al., 2009; Kostag et al.,
2010). Reasons for the infrequent use of these methods include the requirement of special
equipment, extensive washing, long production time (days) and unwanted side products. In this
Chapter, the focus is on the most common preparation methods including emulsion solvent
evaporation, nanoprecipitation, nanoemulsions and supercritical fluids for the formulation of
polymeric nanoparticles (Table 1.1).

Chapter One
31
Table 1.1. Summary of bulk preparation methods for the formulation of polymeric
nanoparticles. PLGA = poly (lactic-co-glycolic acid), PCL = poly(ε-caprolactone), PLA =
poly-L-lactic acid, PLLA-PEG = poly-L-lactic acid-poly (ethylene glycol), w/o = water/oil,
w/o/w = water/oil/water.
Preparation
method Polymer Advantages Disadvantages Reference
Emulsion solvent
evaporation
(w/o or w/o/w)
PLGA,
PLGA-
PEG
Encapsulation of
hydrophobic and
hydrophilic drugs
High energy use
Time consuming
Expensive
(Babos et al.,
2018; Haggag et
al., 2018;
Vaidya et al.,
2019)
Nanoprecipitation
/Solvent
displacement
PLGA,
PCL
Small quantity of
organic solvent
Encapsulation:
hydrophobic drugs
> hydrophilic
drugs
(Jara et al.,
2018; Vuddanda
et al., 2015)
Nanoemulsion –
phase inversion
composition (PIC)
PLGA
Mild operation
conditions
(temperature),
scale-up of
production
High
concentration of
surfactant
(Feiner-Gracia
et al., 2018;
Homs et al.,
2018; Sharma et
al., 2013)
Supercritical fluid
– supercritical
anti-solvent
technique
PLA,
PLLA-
PEG,
PLGA
Environmentally
friendly,
low residual
solvent,
mild operation
conditions
(temperature,
pressure)
Nanoparticle size
> 300 nm
Broad size
distribution
(Kalani and
Yunus, 2012;
Zabihi et al.,
2014; Zhao et
al., 2014b)
The most common bulk method for the production of PLGA nanoparticles is the
emulsification-based, double emulsion solvent evaporation method (Haque et al., 2018).
Applying the water/oil/water (w/o/w) double emulsion solvent evaporation method (Figure
1.2A), the polymer is dissolved in a water-miscible or immiscible organic solvent like
chloroform, dichloromethane or ethyl acetate and a primary emulsion in aqueous solution is
formed by high-energy sonication or homogenization (Haggag et al., 2018; Haque et al., 2018).
The primary emulsion, water/oil (w/o), is then added dropwise to an aqueous solution
containing stabilizer like polysorbate-80 or polyvinyl alcohol (PVA) (Jeevanandam et al., 2016;
Masood, 2016). For the production of the double emulsion, high-energy sonication or
homogenization is applied and the secondary double emulsion is left for solvent removal at

Chapter One
32
room temperature resulting in formation of polymeric nanoparticles by solidification of the
polymer (Arshad et al., 2015; Haggag et al., 2018; Haque et al., 2018). The high-speed
sonication or homogenization and the related energy that is introduced to form the emulsion
represents a crucial step in order to obtain particles in the nano-scale size range (Quintanar-
Guerrero et al., 1998). In addition, Haque et al. (2018) stated that the emulsification-based
method is influenced by the grade and concentration of the polymer, the concentration of
stabilizer, the volume of the aqueous and organic phases and the vessel geometry. An
alternative to this method is the single emulsion solvent evaporation method, which can be used
to encapsulate hydrophobic or poorly water soluble drugs (Sharma et al., 2016; Vaidya et al.,
2019). Using a single emulsion evaporation method, a w/o emulsion of polymer/drug mixture
in an aqueous surfactant solution is produced by high-speed sonication or homogenization
before solvent removal as described above (Figure 1.2B) (Sharma et al., 2016; Zu et al., 2019).
Figure 1.2. Schematic description of w/o/w double emulsion solvent evaporation (A) and o/w
single emulsion solvent evaporation (B) method for the preparation of polymeric nanoparticles
(Crucho and Barros, 2017).
Chapter One
33
Nanoemulsions have a droplet size of 20-200 nm and can be used for the production of
polymeric nanoparticles with a size below 60 nm (Feiner-Gracia et al., 2018; Homs et al.,
2018). In order to produce nanoemulsions, high-energy methods like sonication and high-
pressure homogenization can be applied (Homs et al., 2018). Alternatively, low-energy
methods, such as the phase inversion composition method, where nanoemulsions are produced
by changing the solvent composition at a constant temperature can be used (Fornaguera et al.,
2015; Homs et al., 2018). High-energy methods are cost-inefficient due to the use of high levels
of energy, whereas low-energy methods can produce small and uniform droplets by stirring as
they utilize the internal chemical energy of the system (Caldero et al., 2011; Solans and Solé,
2012). Nanoparticles are then obtained from the nanoemulsion by solvent removal under
reduced pressure or continuous stirring (Caldero et al., 2011; Feiner-Gracia et al., 2018).
Another approach for the formation of nanoparticles utilizes supercritical fluids for the
production of polymeric nanoparticles (Table 1.1) (Zabihi et al., 2014). Using the supercritical
anti-solvent technique, supercritical CO2 is introduced under pressure into the organic polymer
solution, which is in a high-pressure tank containing liquid CO2 that acts as an anti-solvent
(Zhao et al., 2014b). Under these conditions, the velocity of the supercritical CO2 breaks the
polymer solution apart and droplets are formed (Zhao et al., 2014b). The quick mass transfer
between the supercritical CO2 and organic solvent results in supersaturation and precipitation
of the polymeric precursor to form nanoparticles (Kalani and Yunus, 2012; Zhao et al., 2014b).
All of the methods described rely on residual solvent removal by magnetic stirring or
under reduced pressure before collection of nanoparticles (Masood, 2016; Sharma et al., 2016).
Chapter One
34
The collected nanoparticles are then washed at least twice using centrifugation with either
centrifugation at high speed or ultra-centrifugation and dialysis (Masood, 2016).
Nanoprecipitation
Nanoprecipitation, also known as solvent displacement (Bairagi et al., 2018; Fessi et
al., 1989), is the second most commonly used method for the formulation of polymeric
nanoparticles (Table 1.1 and Figure 1.3A). The method was first described by Fessi et al.
(1989) and since then has been optimised and adapted for the production of polymeric
nanoparticles with a small size (< 300 nm) and to encapsulate both hydrophobic and hydrophilic
drugs (Bilati et al., 2005). Using nanoprecipitation, nanoparticles are prepared by the dropwise
addition of an organic solution of the polymer to an aqueous solution while the mixture is
agitated (Derakhshandeh et al., 2007). Suitable water-miscible organic solvents for use in the
nanoprecipitation method include acetone, acetonitrile, ethanol and dimethylsulfoxide (Bilati
et al., 2005). The aqueous phase usually contains ionic and non-ionic surfactants like PVA and
pluronics (Tefas et al., 2015). After addition of the organic solvent to the aqueous phase, an
emulsification process takes place due to agitation of the solutions and a colloidal dispersion
with nanodroplets is formed (Derakhshandeh et al., 2007). The nanodroplets are unstable and
interfacial tension is decreased due to the rapid diffusion of the organic solvent towards the
aqueous phase (Derakhshandeh et al., 2007). This process is further supported by the addition
of a surfactant added to the aqueous phase (Derakhshandeh et al., 2007). The added surfactant
acts as a stabilizer and reduces the interfacial tension between the organic and aqueous phase
of the colloidal dispersion (Tefas et al., 2015). Turbulence at the interface between the aqueous
and organic phase due to differences of the interfacial tension are described by the Marangoni
effect (Derakhshandeh et al., 2007; Fessi et al., 1989). The Marangoni effect is a result of

Chapter One
35
variations in flow, diffusion and surface tension occurring at the interface of the two miscible
solvents (Bilati et al., 2005). Diffusion of the organic solvent reduces the local solubility of the
polymer at the interface between the organic solvent and the aqueous phase resulting in
nanoparticle formation due to precipitation of the polymer (Jara et al., 2018; Yadav and Sawant,
2010).
Figure 1.3. Schematic of the bulk nanoprecipitation method for the preparation of polymeric
nanoparticles (A) and assembly of polymeric nanoparticles (B) during preparation using the
nanoprecipitation method (Crucho and Barros, 2017; Karnik et al., 2008).
After precipitation of the polymer, the formation of nanoparticles is described by
classical nucleation theory, which is divided into three stages (i) nucleation, (ii) growth and (iii)

Chapter One
36
equilibrium (Figure 1.3B) (Jara et al., 2018). Nucleation occurs when a local supersaturation
of the polymer is achieved, meaning the concentration of the polymer is higher than its
solubility (Jara et al., 2018). During the nucleation phase, nuclei of dissolved polymer
molecules are formed and can undergo a growth reaction with the addition of further polymer
molecules (Lepeltier et al., 2014). The last stage, equilibrium, is described by the formation of
stable nanoparticles (Karnik et al., 2008). In order to formulate small and uniform
nanoparticles, the nucleation and growth processes need to be separated in time so that a high
nucleation rate can yield a high number of small nuclei (Jara et al., 2018; Lince et al., 2008).
The supersaturation state is influenced and controlled by the polymer concentration, type of
solvent and removal time, mixing energy and type of mixing (Jara et al., 2018). Further, the
addition of surfactants is crucial as they act as a stabilizer to avoid aggregation after formation
of monodisperse polymeric nanoparticles (Derakhshandeh et al., 2007; Tefas et al., 2015;
Vuddanda et al., 2015).
Even though the nanoprecipitation method is a simple preparation method (Jara et al.,
2018; Yadav and Sawant, 2010) and can be performed with basic laboratory equipment, the
physical process behind the formation of the polymeric nanoparticles is complex. The
advantages and disadvantages of the nanoprecipitation method are summarised in Table 1.1.
The main limitation of the nanoprecipitation method is the aggregation of nanoparticles and the
low reproducibility of the method (Jara et al., 2018). In order to overcome the limitations of
the nanoprecipitation method, an optimisation of the method is necessary and can be performed
using design of experiments (DoE). The principles of a DoE study are described in detail in
the introduction for Chapter 2. An optimised nanoprecipitation method can be used to
formulate uniform nanoparticles, yield higher encapsulation efficiency and drug loading and
reduce costs and production times (Jara et al., 2018).

Chapter One
37
Each of the methods described up to this point are used for the preparation of polymeric
nanoparticles and suitable for the encapsulation of hydrophilic and hydrophobic drugs, but the
main drawback of these methods is the variation in particle size from batch-to-batch. A recent
advance in the production of nanoparticles is the use of microfluidics as a promising technique
to improve the formulation of nanoparticles.
Microfluidics
There are a plethora of nanoparticle carriers that have been developed for drug delivery,
however, successful translation to a therapeutic product is often limited by the ability to
consistently produce optimized, uniform nanoparticles with the potential for scale up of the
manufacturing process under GMP (good manufacturing practice) conditions (Valencia et al.,
2012). The application of microfluidic approaches can address the limitations of traditional
bulk production methods. Microfluidics makes use of intersecting microchannels, which enable
nanolitre volumes of fluids to be mixed homogeneously or contacted in a precisely controlled
environment (Khan et al., 2015; Whitesides, 2006). While a wide range of microchannel
configurations and flow types are used to prepare nanoparticles, a very common chemical
process for the nanoparticle preparation in these devices is an ‘anti-solvent approach’. Here,
the organic solution containing nanoparticle precursor components and the aqueous solution
are introduced into the microfluidic device at a pre-determined flow rate and flow rate ratio
between aqueous and organic reagents (Donno et al., 2017; Kolishetti et al., 2010). The flow
rate is the combined speed of the fluids within the microchannel and the flow rate ratio is the
ratio between the two solvent streams in the microfluidic device. Flow rate and flow rate ratio
are discussed in more detail in Chapter 2, Section 2.1.3. Mixing the organic solution with the
anti-solvent (most often the aqueous solution) induces precipitation of the precursor
Chapter One
38
components as nanoparticles (Valencia et al., 2010). The advantages of microfluidic devices
include high reproducibility, control over the mixing process, the possibility of automation and
the mixing of fluids at high speed (Kang et al., 2005; Williams et al., 2008), enabling the rapid
production of nanoparticles. The key improvement of using a microfluidic device instead of a
bulk, macro-scale reaction vessels for the production of nanomedicines is the potential for
formulation of uniform nanoparticles (Jafarifar et al., 2017).
1.3.3.1 Types of microfluidics mixer
The mixing of small volumes of fluids in a microfluidic channel can be achieved using
devices with a range of different designs. There is a great variety of commercially available
microfluidic devices and individual microfluidic devices can be designed and manufactured
with soft lithography in the laboratory to suit specific production requirements. The most
commonly used microchannel design is hydrodynamic flow-focusing (HFF). HFF devices can
have a planar 2D geometry or a 3D geometry (Figure 1.4A and B) (Othman et al., 2015) and
can be used for the formulation of a variety of nanoparticles made of PLGA (Bramosanti et al.,
2017; Kang et al., 2013; Ortiz de Solorzano et al., 2016) and other polymers (Laulicht et al.,
2008; Liu et al., 2015; Min et al., 2014). In microfluidic devices, interfacial forces between the
fluids are dominant and diffusion-related mass transfer of the molecules is limited to the
interface between the fluids, which leads to greater control over the mixing process (Jahn et al.,
2004; Whitesides, 2006). With the 2D geometry device, fluids are injected concurrently
through three inlets. A central stream of a water-miscible organic solvent containing the
nanoparticle precursor components and drug is focussed horizontally by lateral fluid streams of
the aqueous anti-solvent introduced perpendicular to the central stream (Figure 1.4A) (Kang et
al., 2013). In a 2D HFF device, nanoparticle aggregation can occur at the wall of the
Chapter One
39
microfluidic channel (Figure 1.4A, cross section) and interfere with the ability to control the
size of nanoparticles and also increase internal pressure in the device by blocking the
microchannel (Kang et al., 2013; Othman et al., 2015). However, by using a 3D HFF device a
more efficient mixing can be achieved because the solvent stream, introduced through a
capillary, is surrounded by the anti-solvent stream, avoiding aggregation of the polymer at the
walls of the microchannel (Figure 1.4B) (Kang et al., 2013; Lim et al., 2014a; Othman et al.,
2015).
Figure 1.4. Illustration of the flow pattern of fluids in different microfluidic devices used for
the formulation of nanoparticles. (A) 2D and (B) 3D hydrodynamic flow-focusing
microchannel, (C) droplet-based microchannel and (D) microchannel with a staggered
herringbone mixer (SHM) channel design (Streck et al., 2019c).
A second common design that can be used for microfluidic mixing is a droplet-based
microfluidic system (Figure 1.4C). With this approach, emulsion droplets are formed by using
two immiscible fluids, e.g. water and oil, and a capillary microfluidic device (Utada et al., 2007;
Wang et al., 2011). Single, uniform droplets are generated when coaxial flow is induced by
reducing the diameter of the inner capillary, which is embedded in the outer capillary (Utada et

Chapter One
40
al., 2007). The formed droplets have a spherical shape due to surface tension and act as a micro-
reactor for the formulation of nanoparticles in the emulsion (Wang et al., 2011). This approach
can be used for the formulation of polymeric nanoparticles, nanocrystals and liposomes (Wang
et al., 2011).
Finally, passive mixers can be incorporated as a structural element within the
microchannel to induce a turbulent flow of the fluids (Capretto et al., 2013). One of the most
common passive mixers in microfluidic devices is the staggered herringbone mixer (SHM) (Du
et al., 2010; Stroock et al., 2002). The SHM is described as an in-groove pattern in the
microchannel with an asymmetric herringbone shape (Figure 1.4D) (Du et al., 2010; Stroock et
al., 2002). The topology of the SHM disturbs the laminar flow of the fluids within the
microchannel, causing mixing of fluids through chaotic advection (Du et al., 2010). The main
advantages of the SHM are the simplicity of the manufacturing process and the ability to
achieve complete mixing of fluids at a low Reynolds number (Re) (Du et al., 2010). The Re is
a physical measurement of the viscous and inertial forces of fluids within a channel (Capretto
et al., 2013). At low Re, laminar flow is present and the fluids flow in a parallel pattern
(Capretto et al., 2013). In contrast, turbulences have a high Re and fluctuations and vortices of
the fluids occur in these situations (Capretto et al., 2013). Microvortices are able to increase
the yield (g/hour) of nanoparticle formulations due to rapid convective mixing of the solvent
and anti-solvent in the microchannel (Kim et al., 2012). Other structural elements including a
mixing spiral to create microvortices (Feng et al., 2017; Sun et al., 2015; Zhang et al., 2015) or
a zigzag mixer can be added as passive mixers to the microchannel to reduce the mixing time
(Valencia et al., 2010).

Chapter One
41
As mentioned earlier for the bulk preparation of nanoparticles, residual solvent removal
is required before further use of polymeric nanoparticles produced with microfluidics e.g. in in
vitro cell culture studies. Processes like solvent removal with or without reduced pressure
(Leung and Shen, 2018; Ortiz de Solorzano et al., 2016), filtration through a 0.2 µm membrane
(Donno et al., 2017; Kolishetti et al., 2010), ultrafiltration (Kolishetti et al., 2010), centrifugal
filtration (Lim et al., 2014b), centrifugation (Xie and Smith, 2010) or ultra-centrifugation
(Amoyav and Benny, 2018) are applied individually or in combination to remove residual
solvents.
Scaling up the production of nanoparticles is necessary to formulate a sufficient amount
of nanoparticles for in vivo studies and clinical applications (Baby et al., 2017). The
parallelization of 8-25 microfluidic channels can increase the productivity of nanoparticle
production from 0.084 g/h to 75 g/h depending on the microfluidic device (Lim et al., 2014a;
Min et al., 2014; Toth et al., 2017). Other strategies to scale up the production of nanoparticles
include increasing the flow rate or designing the microchannel to have a greater depth to
increase the sample volume and yield (Baby et al., 2017; Liu et al., 2015).
1.3.3.2 Optimisation of size and charge of polymeric nanoparticles
The size of nanoparticles plays a crucial role in determining the therapeutic efficacy and
biodistribution (Zhigaltsev et al., 2012), and generally small uniform nanoparticles are
desirable, particularly for intravenous drug application. Uniform and small nanoparticles can
be obtained with a microfluidic approach and are characterized by a low polydispersity and a
narrow size range (Capretto et al., 2013; Karnik et al., 2008). Further, a uniform nanoparticle

Chapter One
42
size is advantageous for consistent release of encapsulated drugs, prediction of biodistribution
and cellular uptake of nanoparticles (Xie and Smith, 2010).
In order to influence the size of polymeric nanoparticles, sample-related parameters,
like molecular weight and concentration of the polymer, organic solvents, surfactant
concentration and channel dimensions can be varied to influence the size of polymeric
nanoparticles prepared using microfluidics. For example, an increase in size from 25 to 220
nm for polymeric nanoparticles formulated with polyethylene glycol-poly(lactic-co-glycolic)
acid (PEG-PLGA) polymer was found when the molecular weight of the PLGA polymer was
increased from 10 to 95 K (Kang et al., 2013; Lim et al., 2014a; Min et al., 2014; Valencia et
al., 2013). Similarly, an increase in concentration of the PEG-PLGA polymer from 5 to 50
mg/mL led to an increase in size of the resulting nanoparticles (Amoyav and Benny, 2018;
Kang et al., 2013; Karnik et al., 2008; Lim et al., 2014a) and a similar observation was made
for the PLGA polymer (Bramosanti et al., 2017; Karnik et al., 2008; Xu et al., 2017). However,
there are limits to these polymer characteristics in order to yield high quality nanoparticles.
This is illustrated in a study by Min et al. (2014) who reported aggregation when PEG-PLGA
with high molecular weight PLGA (PEG5k-PLGA55K) and at a high concentration (50 mg/mL)
were used in combination with a low flow rate ratio (7:3, aqueous:organic) and low flow rates
(< 0.08 mL/min). A possible reason for aggregation is that at low flow rates, the Re is low,
diffusive mixing is less efficient and aggregation of the non-precipitated polymer can occur
(Min et al., 2014). This demonstrates that several factors need to be considered to operate a
microfluidic device without losing control over the size of nanoparticles and to avoid blocking
of the microchannel (Liu et al., 2010). From the studies performed to date, it seems that the
influence of polymer concentration is more predominant than the influence of molecular weight
in determining the size of the resulting polymeric nanoparticles (Lim et al., 2014a).

Chapter One
43
The organic solvent used to dissolve the polymer also influences the size of polymeric
nanoparticles. In comparison to polymeric nanoparticles formulated with dimethyl sulfoxide
(DMSO) as an organic solvent, smaller polymeric nanoparticles below 150 nm were obtained
when acetonitrile or acetone were used (Bramosanti et al., 2017; Chiesa et al., 2018). The
reason proposed for this was that the higher viscosity of DMSO reduced the flow of the fluids
at the interface between the aqueous and organic solutions in the microfluidic device, resulting
in an increase in nanoparticle size (Bramosanti et al., 2017; Chiesa et al., 2018).
The charge carried by polymeric nanoparticles is a key property that can influence in
vivo performance and is determined by the functional groups present on the polymers that
comprise the nanoparticles. Modification to the polymer end group can be used to influence
the surface charge of polymeric nanoparticles. For example, by mixing neutral PEG with a
methoxy (-OCH3) end group with negatively charged PEG comprising a carboxyl (-COOH)
end group, the surface charge of nanoparticles was tuned between -5 and -20 mV (Valencia et
al., 2013).
Incorporation of stabilizers including PVA, sodium cholate or Tween®80 in the aqueous
anti-solvent for use in microfluidics can influence the size of PLGA nanoparticles and the
encapsulation efficiency of drugs (Morikawa et al., 2018). The highest encapsulation efficiency
of 18% for curcumin-loaded PLGA nanoparticles was achieved with 1% (w/v) PVA (Morikawa
et al., 2018). However, the nanoparticles showed a large size of around 200 nm. In contrast,
nanoparticles formulated with sodium cholate or Tween®80 had an encapsulation efficiency
below 15% and a size below 120 nm (Morikawa et al., 2018). Amoyav and Benny (2018) also
investigated the influence of PVA on the size of PLGA-PEG nanoparticles and found that

Chapter One
44
smaller nanoparticles with a size of 130 nm were produced with increasing concentrations of
PVA from 0.5 to 2% (w/v). Surfactants such as PVA are needed to reduce the interfacial tension
between the fluids and avoid aggregation of the newly formed nanoparticles (Amoyav and
Benny, 2018).
Baby et al. (2017) investigated the influence of the microchannel characteristics, width
(y-dimension) and depth (z-dimension), of a 2D HFF device on the size of PEG-PLGA
nanoparticles. The size of PEG-PLGA55K nanoparticles increasing to 107 nm when the width
of the microchannel was increased from 20 to 100 µm. Further, an increased depth of the
microchannel, 200 µm in comparison to 50 µm, decreased the size of the formulated
nanoparticles by 40 nm at a flow rate ratio of 0.8 (Baby et al., 2017).
Microfluidics is an efficient approach to tune the size of nanoparticles by altering
sample-related parameters. In addition, the physicochemical characteristics of polymeric
nanoparticles such as surface charge and decoration can be altered to enhance nanoparticle-cell
interaction.
Modifications of polymeric nanoparticles
The potential of nanoparticles to be effective drug carriers depends on their
physiochemical properties, which determine interactions with the human body including
cellular uptake, biodistribution and clearance (Banik et al., 2016; Griffin et al., 2016; von
Roemeling et al., 2017). Further, the biodistribution of polymeric nanoparticles depends on
several characteristics of the drug delivery system including size, charge, surface modifications
and the surface density of ligands (Farokhzad and Langer, 2009).

Chapter One
45
Influence of size on cellular uptake and biodistribution
As discussed earlier, the size of nanoparticles is influenced by the components used in
their production such as the type of polymer (e.g. PLGA, chitosan) and surfactant (e.g. PVA)
and by the selected preparation method (Banik et al., 2016; He et al., 2010; Partikel et al.,
2019). The preferred pathway of cellular uptake is determined by the size of the nanoparticles,
with smaller nanoparticles having a greater chance of uptake in comparison to larger
nanoparticles (Griffin et al., 2016). Nanoparticles with a size under 1 µm are internalized via
phagocytosis and nanoparticles with a size under 200 nm can enter the cell via endocytosis
(Sharma et al., 2015). He et al. (2012) showed higher uptake of methyl methacrylate-chitosan
nanoparticles with a size of 300 nm in comparison to nanoparticles with a size of 600 or
1000 nm in a Caco-2 cell monoculture and co-culture with Raji B cells. An explanation for this
size-dependent behaviour is that with a larger size, the number of available pathways for uptake
into cells is reduced (He et al., 2012). Endocytic uptake pathways for nanoparticles include the
clathrin-dependent and caveolae-dependent pathways as well as macropinocytosis (Dausend et
al., 2008), which are further discussed in Section 1.5.2. In a similar study, PLGA nanoparticles
with a size of 170 nm showed greater uptake in Caco-2 cells in comparison to PLGA
nanoparticles with a size above 300 nm (Gaumet et al., 2009), indicating that the size of
polymeric nanoparticles is crucial to enhance cellular uptake.
In addition, the size of polymeric nanoparticles influences their elimination from the
body. The main routes for elimination of nanoparticles include the kidneys, the lymphatic
system and the reticuloendothelial system (RES) (Griffin et al., 2016; von Roemeling et al.,
2017). The RES, more frequently referred to as the mononuclear phagocytic system (MPS), is
the system responsible for the removal of nanoparticles from the blood vessels by macrophages

Chapter One
46
(Alexander-Bryant et al., 2013). Nanoparticles circulating in the bloodstream are recognised
by proteins called opsonins (Alexander-Bryant et al., 2013). These proteins bind to the
nanoparticle surface and make the particles available to be taken up by macrophages and further
transported to liver and spleen (Alexander-Bryant et al., 2013; Danhier et al., 2012).
Nanoparticles with a size above 200 nm are likely to be removed by the MPS, whereas smaller
nanoparticles under 100 nm and with hydrophilic characteristics show fewer interactions with
the MPS and can avoid elimination (Alexander-Bryant et al., 2013). Nanoparticles with a size
between 40-60 nm can exit blood vessels via fenestrated capillaries in the kidneys and in the
intestine (Siafaka et al., 2016). The pores in the renal fenestrated endothelium are up to 100
nm in diameter and particles with a smaller size can pass through (von Roemeling et al., 2017).
The route of elimination through the lymphatic system applies to nanoparticles with a size of
600 nm or more and clearance occurs through liver and spleen (Bobo et al., 2016; Siafaka et
al., 2016).
Effective surface charge
The degree of surface charge associated with nanoparticles influences the stability of
the nanoparticles and thus their tendency to aggregate. Polymeric nanoparticles form a stable
suspension if their zeta potentials are lower than -30 mV or higher than +30 mV, since the
aggregation of nanoparticles is reduced due to electrostatic repulsion between the nanoparticles
(Sonam et al., 2014; Tefas et al., 2015; Vasconcelos et al., 2015). Depending on the design of
the nanoparticles, their surface charge is able to influence the electrostatic interactions with the
gastrointestinal mucus (Griffin et al., 2016). Mucin, a mucus protein, can immobilise charged
nanoparticles because of hydrophobic interactions (Lundquist and Artursson, 2016).
Nanoparticles with a surface charge between -10 and +10 mV show fewer interactions with the

Chapter One
47
cell membrane, whereas positively charged nanoparticles (> +15 mV) can help to improve the
internalization due to the interactions with the negatively charged cell membrane (He et al.,
2010; Lundquist and Artursson, 2016). After internalization, positively charged nanoparticles
are also able to avoid degradation via lysosomes and locate in the perinuclear regions of cells
(Danhier et al., 2012; Frohlich, 2016).
Surface modification
The surface of nanoparticles can be modified and approaches such as the addition of
PEG (Partikel et al., 2019), coating with chitosan (Cole et al., 2018) and attachment of ligands
(Bartheldyova et al., 2018) are used (Figure 1.5).
Figure 1.5. The influence of size, charge and surface modification on the physicochemical
properties of polymeric nanoparticles (Fenton et al., 2018; Torchilin, 2014). CPPs = cell-
penetrating peptides, PEG = polyethylene glycol.
Modification of nanoparticles with PEG attached to the nanoparticle wall is beneficial
to achieve a longer blood circulation in order to increase the half-life of the nanoformulations
in the bloodstream (Danhier et al., 2012). The molecular weight and density of PEG chains on
the nanoparticle surface influence the absorption of proteins leading to an inhibition of the

Chapter One
48
opsonisation process and the delayed clearance of the modified nanoparticles (Pelaz et al.,
2015; von Roemeling et al., 2017). In addition, PEG decoration can enhance the mucus
permeability, by preventing aggregation and reducing degradation of the nanoparticles (Griffin
et al., 2016).
The surface of polymeric nanoparticles can be modified by coating the nanoparticles
with a charged polymer. The coating of polymeric nanoparticles is based on an electrostatic
interaction between the negatively charged nanoparticles and the positively charged chitosan
(Czuba et al., 2018). The blood circulation time of chitosan-coated polymeric nanoparticles is
improved by hindrance of protein binding to the surface of the nanoparticles and prevention of
phagocytic uptake (Abouelmagd et al., 2015). After oral administration, the chitosan coating
can act as a permeation enhancer due to the mucoadhesive properties of chitosan and by opening
tight junctions between epithelial cells and increasing uptake (Cole et al., 2018; Lopes et al.,
2016; Sheng et al., 2015).
Surface modification of nanoparticles with specific ligands, including proteins like
transferrin and glycoprotein 1b and polysaccharides like hyaluronic acid, are advantageous for
targeted delivery of drugs into epithelial, endothelial and cancer cells, respectively
(Bartheldyova et al., 2018; Xu et al., 2013a; Zhu et al., 2016b). Active targeting is achieved
by binding of surface-modified nanoparticles to specific and overexpressed receptors on target
cells or by extending the residence time and uptake (Danhier et al., 2012; Date et al., 2016).

Chapter One
49
Cell-penetrating peptides
Cell-penetrating peptides (CPPs) are membrane-permeable peptides with positive
charges, dictated by the number of arginine and lysine amino acids in the peptide sequence
(Jafari et al., 2015; Lonn and Dowdy, 2015). CPPs are short amino acid sequences of 30 amino
acids or less and also called protein transduction domains or Trojan peptides and show potential
to enhance the delivery of cargos (Huang et al., 2013; Jafari et al., 2015; Lukanowska et al.,
2013; Zhang et al., 2016). CPPs are characterised by the ability to cross cell membranes, such
as the blood brain barrier and intestinal membrane, while also mediating the uptake of cargos
due to the strong affinity of the CPPs to the lipid bilayer of cells (Feiner-Gracia et al., 2018; Su
et al., 2009; Zhu et al., 2016a). The translocation ability applies to the CPP on their own but
also for conjugates of the CPPs with different cargos like polymeric nanoparticles (Feiner-
Gracia et al., 2018; Vasconcelos et al., 2015), liposomes (Shi et al., 2019), protein-based
nanoparticles (van Oppen et al., 2019), macromolecules such as peptides, proteins (Kristensen
et al., 2015), small interfering RNA (siRNA) and plasmid DNA (Künnapuu et al., 2019; Zhang
et al., 2019) and fluorophores (Trehin et al., 2004). CPP conjugates have been studied for the
treatment of asthma, cardiovascular diseases, inflammation, cancer and stroke (Jones et al.,
2005).
Classification and specific properties of CPPs
CPPs can be classified into different categories depending on the focus of the
classification (Table 1.2). Commonly CPPs are classified based on their physicochemical
properties and divided in cationic, amphipathic and hydrophobic CPPs (Jafari et al., 2015).
Further, CPPs are categorised by the origin of the peptide and can be either derived from natural
proteins, chimeric combination of two different peptide motifs or synthesised as artificial

Chapter One
50
sequences of amino acids (Jafari et al., 2015; Zhu et al., 2016a). The number of charges in the
CPP sequence influences the penetration abilities of CPPs; with a comparatively small amount
of positive charges leading to reduced cell internalization. In contrast, a high amount of positive
charges can induce toxicity (Lonn and Dowdy, 2015).
CPPs that are commonly used for drug delivery include TAT, polyarginine, penetratin
and Xentry. The highly positively charged TAT is the most studied CPP and is derived from
the human immunodeficiency virus trans-activating transcriptional activator (TAT) protein
(Trehin et al., 2004). The translocation abilities of the TAT protein were discovered by Green
and Lowenstein as well as Frankel and Pabo in 1988 (Frankel and Pabo, 1988; Green and
Loewenstein, 1988). Later, Vives et al. (1997) identified that the amino acid residues number
48-60 (GRKKRRQRRRPPQ) showed cell internalization on their own. The number of arginine
residues in the CPP sequence influences the transduction ability of the highly positively charged
arginine-rich CPPs to deliver small molecules. Synthetic CPPs with 6 to 12 arginine residues
were found to achieve an efficient translocation into mouse macrophages and human skin
fibroblasts (Futaki et al., 2001; van Oppen et al., 2019). Further, polyarginines showed higher
efficiency for the internalization in comparison to polyhistidines and polylysines (Mitchell et
al., 2000). Some CPPs are of special interest due do the fact that the peptide has been shown
to have specific features in addition to translocation abilities. Penetratin (Table 1.2) can cross
the blood brain barrier (Xia et al., 2012) and Xentry (Table 1.2) can permeate into cancer cells
such as HepG2 cells to deliver siRNA, which express syndecans, a group of heparan sulphate
proteoglycans on the cell surface (Montrose et al., 2014b; Patel et al., 2019).

Chapter One
51
Tab
le 1
.2.
Sum
mar
y o
f ce
ll-p
enet
rati
ng p
epti
des
com
monly
use
d i
n p
har
mac
euti
cal
rese
arch
.
Na
me
Paren
t p
rote
in
Ori
gin
P
rop
ert
ies
Seq
uen
ce
Carg
os
Ref
eren
ces
TA
T
(48-5
7)
Hum
an i
mm
unodef
icie
ncy
vir
us-
1 t
ransc
ripti
onal
acti
vat
or
pro
tein
Pro
tein
der
ived
C
atio
nic
G
RK
KR
RQ
RR
R
Nan
opar
ticl
es,
pro
tein
(Fra
nkel
and
Pab
o, 1988;
Gre
en a
nd
Loew
enst
ein,
1988)
Pen
etr
ati
n
(43-5
8)
Dro
sophil
a
ante
nnapaed
ia
hom
eodom
ain
Pro
tein
der
ived
A
mphip
athic
16-m
er
RQ
IKIW
FQ
NR
RM
KW
KK
Pro
tein
,
oli
gopep
tides
,
oli
gonucl
eoti
des
(Cla
yto
n e
t
al.
, 2006;
Der
oss
i et
al.
,
1996)
Poly
arg
inin
e
(R6
-12)
N/A
S
ynth
etic
C
atio
nic
R
RR
RR
RR
R
Nan
opar
ticl
es,
pro
tein
(Ryse
r an
d
Han
cock
,
1965)
Tra
nsp
ort
an
Mas
topar
an (
full
sequen
ce)
and g
alan
in (
N-
term
inal
seq
uen
ce)
Chim
eric
A
mphip
athic
21-m
er
GW
TL
NS
AG
YL
LG
KIN
LK
-AL
AA
LA
KK
IL
Dru
g m
ole
cule
s
(Pooga
et a
l.,
1998;
Rucz
yńsk
i et
al.
, 2019)
Xen
try
X
-pro
tein
of
the
hep
atit
is
B v
irus
Pro
tein
der
ived
H
yd
rophobic
L
CL
RP
VG
P
rote
in
(Montr
ose
et
al.
, 2014a;
Pat
el e
t al.
,
2019)
Chapter One
52
Over the years, additional categories for the classification of CPPs have emerged and
include antimicrobial, activatable and cyclic CPPs. For example, transportan (Table 1.2) shows
antimicrobial activity against Gram-positive and Gram-negative bacteria, which makes it
attractive for conjugation with antibiotic drugs (Ruczyński et al., 2019). Antimicrobial peptides
have similar characteristics as CPPs, but a higher number of lysine residues in the sequence is
beneficial for uptake into bacteria (Bahnsen et al., 2013). Another class of CPPs are ‘activatable
CPPs’, which are designed to release the functional CPP sequence from a polyanionic peptide
after activation by enzymes (Farkhani et al., 2014). Activatable CPPs are primarily used in
cancer research and can be utilized for the visualisation of enzyme reactions by releasing
imaging probes (Farkhani et al., 2014). The CPP sequence plays a role in the cellular uptake
and a modification of the amino acid sequence to form cyclic CPPs is believed to enhance the
delivery capacity of CPPs and promote cellular uptake efficiency (Amoura et al., 2019; Patel
et al., 2019). A cyclic structure is formed by disulphide bonds between cysteine residues after
introduction to the amino acid sequence at the N- and C-terminal ends (Amoura et al., 2019;
Patel et al., 2019). Cellular uptake, expressed as an increase in fluorescence in HeLa cells, of
conjugates between cyclic R8 or TAT and the green fluorescence protein increased by 6-9 fold
in comparison to the linear amino acid sequences of the CPPs (Patel et al., 2019).
1.5.1.1 Sequence-modified cell-penetration peptides
Optimisation of the CPP sequence is of great research interest and several studies have
shown a positive impact on cell internalization when branched CPPs are used. Limitations of
linear CPPs include a low translocation efficiency, low target specificity and instability in the
physiological environment (Monreal et al., 2015). Modification of the CPP sequence results in
new classes of CPPs with a variety of different architectures (Figure 1.6).
Chapter One
53
Figure 1.6. Classification of cell-penetrating peptides after modification of their sequence by
adding branches, dimers, scaffolds and creating networks and dendrimers (Angeles-Boza et al.,
2010; Brock et al., 2018; Eggimann et al., 2014; Foerg et al., 2007; Jeong et al., 2016; Saleh et
al., 2010; Yoo et al., 2017; Zhao et al., 2014a). CPP = cell-penetrating peptide.
New strategies to increase the number of positive charges associated with CPPs include
the synthesis of more complex CPP analogues with additional cationic groups. The
dimerization of CPPs (Figure 1.6) showed improvements in cellular uptake, endosomal escape
and cytotoxicity (Erazo-Oliveras et al., 2014; Monreal et al., 2015). For example, the
fluorescently labelled dimeric branched TAT peptide (TATp-D) led to an improved cellular
uptake in HeLa cells, with a six- to seven-fold increase in fluorescence intensity compared to
linear TAT at concentrations of 0.25 M (Monreal et al., 2015). Another dimeric and
fluorescent TAT (dfTAT) showed the ability of efficient cytosol delivery of a cell-impermeable

Chapter One
54
fluorophore after co-administration to HeLa cells (Erazo-Oliveras et al., 2014). Further, the
dimerization of the sC18 peptide (derived from the antimicrobial parent protein CAP 18),
increased the fluorescence intensity of the sC18 dimer in HT-29-MTX-E12 cells (further
referred to as HT-29 cells) by 10-fold in comparison to a linear sC18 (Hoyer et al., 2012). In
addition, the dimeric TAT-based CPPs, TATp-D and dfTAT, did not show cytotoxicity in HeLa
at concentrations between 5-50 M and concentrations of the sC18 dimer up to 50 M did not
show cytotoxicity in HT-29 cells (Erazo-Oliveras et al., 2014; Hoyer et al., 2012; Monreal et
al., 2015).
The CPP sequence can be modified by the introduction of side branches, formation of
dendrimers, linkage of CPPs sequences via disulphide bonds and attachment of the CPP
sequence to a peptide scaffold (Figure 1.6). Side branches can either be single or multiple
branches and can consist of specific amino acid sequences or can be non-natural amino acid
sequences, depending on the application (Foerg et al., 2007; Saleh et al., 2010). The formation
of G1 to G3 dendrimers based on CPP sequences can increase the charges in the outer region
of the peptide sequence (Zhao et al., 2014a). A G3 dendrimer based on TAT with short
dipeptide branches showed higher cell penetration, lower cytotoxicity in HeLa cells and better
human serum stability in comparison to the linear CPP (Eggimann et al., 2014). Cysteine can
be used to link to CPPs via disulphide bonds when adjacent cysteine residues are present in the
CPP sequence. A branched TAT network made through disulphide bonds showed improved
gene delivery ability and cyto-compatibility compared to the linear peptide TAT (Jeong et al.,
2016; Yoo et al., 2017). CPPs can be conjugated to a peptide scaffold containing lysine or
cysteine amino acids in order to achieve a branched structure (Angeles-Boza et al., 2010; Brock
et al., 2018). The peptide scaffold further serves for the conjugation of a fluorescent dye for
detection purposes (Angeles-Boza et al., 2010; Brock et al., 2018). Trimers of TAT on a
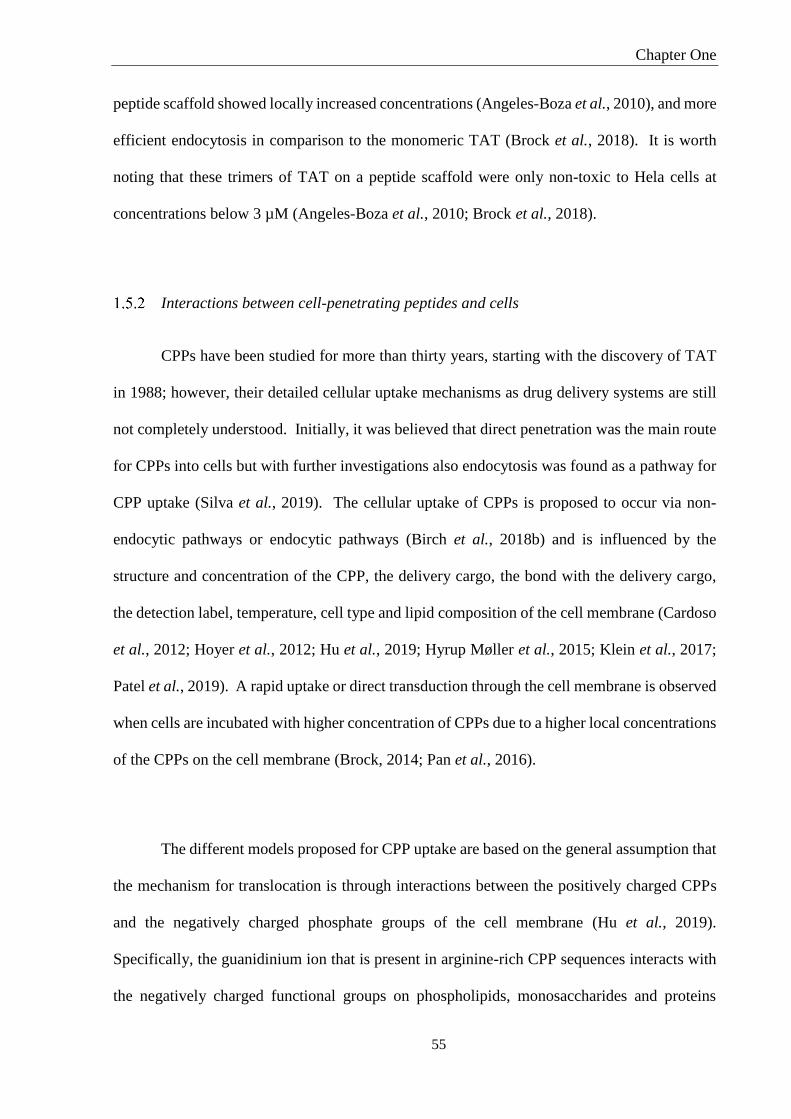
Chapter One
55
peptide scaffold showed locally increased concentrations (Angeles-Boza et al., 2010), and more
efficient endocytosis in comparison to the monomeric TAT (Brock et al., 2018). It is worth
noting that these trimers of TAT on a peptide scaffold were only non-toxic to Hela cells at
concentrations below 3 µM (Angeles-Boza et al., 2010; Brock et al., 2018).
Interactions between cell-penetrating peptides and cells
CPPs have been studied for more than thirty years, starting with the discovery of TAT
in 1988; however, their detailed cellular uptake mechanisms as drug delivery systems are still
not completely understood. Initially, it was believed that direct penetration was the main route
for CPPs into cells but with further investigations also endocytosis was found as a pathway for
CPP uptake (Silva et al., 2019). The cellular uptake of CPPs is proposed to occur via non-
endocytic pathways or endocytic pathways (Birch et al., 2018b) and is influenced by the
structure and concentration of the CPP, the delivery cargo, the bond with the delivery cargo,
the detection label, temperature, cell type and lipid composition of the cell membrane (Cardoso
et al., 2012; Hoyer et al., 2012; Hu et al., 2019; Hyrup Møller et al., 2015; Klein et al., 2017;
Patel et al., 2019). A rapid uptake or direct transduction through the cell membrane is observed
when cells are incubated with higher concentration of CPPs due to a higher local concentrations
of the CPPs on the cell membrane (Brock, 2014; Pan et al., 2016).
The different models proposed for CPP uptake are based on the general assumption that
the mechanism for translocation is through interactions between the positively charged CPPs
and the negatively charged phosphate groups of the cell membrane (Hu et al., 2019).
Specifically, the guanidinium ion that is present in arginine-rich CPP sequences interacts with
the negatively charged functional groups on phospholipids, monosaccharides and proteins

Chapter One
56
present in the cell membrane (Borrelli et al., 2018; Su et al., 2009). A study by Su et al. (2009)
showed the importance of arginine and lysine amino acids in the CPP sequence by investigating
the distance between penetratin and phospholipids, indicating a close contact of arginine and
lysine with the phospholipids. More recently, molecular simulations also showed strong
attraction between CPPs and phospholipids, which is needed for translocation through the lipid-
rich cell bilayer (Gao et al., 2019).
Figure 1.7. Cellular uptake mechanisms of cell-penetrating peptides adapted from Guidotti et
al. (2017) with permission from Elsevier.
The non-endocytic pathways (direct translocation) include uptake in an energy
independent manner via the inverted micelle, the carpet model or the pore model (Figure 1.7)
(Derossi et al., 1996; Koren and Torchilin, 2012). The inverse micelle model is based on the
formation of an inverse micelle within the cell membrane, which incorporates the peptides on

Chapter One
57
the outside of the cell and releases the peptides on the inside of the cell (Su et al., 2009). The
carpet model is described by the adsorption of CPPs to the outer layer of the cell membrane in
a parallel orientation (Binder and Lindblom, 2003; Clayton et al., 2006; Su et al., 2009). With
the presence of the CPPs on the surface of the cell membrane, the transmembrane electric field
between the outer and inner membrane is disturbed resulting in the permeation of the CPP
through the leakier cell membrane (Binder and Lindblom, 2003; Su et al., 2009). After
translocation of the CPP, an equilibrium of the CPP concentration between the outside and the
inside of the cell supports the stabilization of the transmembrane electric field (Binder and
Lindblom, 2003). The carpet model was reported for penetratin and arginine-rich CPPs (Alves
et al., 2008). Two kinds of pores, barrel-stave and toroidal, are induced by CPPs (Clayton et
al., 2006). In the barrel-stave pore model, CPP monomers aggregate and form a bundle were
the hydrophobic regions interact with the lipid compartments of the cell membrane and the
hydrophilic regions of the bundle produce an aqueous pore (Clayton et al., 2006). In contrast,
the toroidal pore model relies on direct interactions of the hydrophilic and charged regions of
the CPPs with the phospholipid head groups of the cell membrane (Clayton et al., 2006).
To better understand the interactions on a molecular level, molecular simulation
between a cell membrane model and CPPs are used (Gao et al., 2019; Hu et al., 2019).
Molecular dynamic simulation of octa-arginine with a small hydrophilic cargo showed that the
lifetime of a formed water pore within the membrane is longer and translocation of CPPs and
cargo increased when the linker length is half the membrane thickness (Hu et al., 2019). It is
important to consider that linkers between CPPs and cargos can influence the cellular selectivity
and linkers should be biodegradable (Hu et al., 2019). The direct penetration mechanisms are
preferred by CPPs with small cargos, whereas CPPs with larger cargos (peptides and proteins)
prefer to enter the cell via endocytosis (Brock, 2014; Patel et al., 2019).

Chapter One
58
Endocytosis mechanisms including clathrin-dependent, caveolae-dependent, clathrin
independent and caveolae independent uptake as well as macropinocytosis can be utilized by
CPPs (Figure 1.7) (Gump et al., 2010; Koren and Torchilin, 2012). For the clathrin-dependent
endocytosis, clathrin coat protein complexes are expressed on the cell surface and binding of
molecules induces endocytosis (Xu et al., 2013b). Caveolae appear as invaginations on the cell
surface and after binding to the cell surface molecules get trapped and internalised (Pelkmans
and Helenius, 2002). Macropinocytosis relies on the formation of membrane ruffles, which are
able to fold back towards the cell membrane entrapping fluids and nanoparticles located on the
cell surface (Reifarth et al., 2018; Xu et al., 2013b). Cellular uptake via macropinocytosis is
initiated by electrostatic interactions of the positively charged and arginine-rich CPPs with
negatively charged molecules on the cell membrane (Gump et al., 2010). The internalization
of CPPs via endocytosis results in the formation of endosomes containing the CPPs (Jones,
2007). Therefore, after endocytosis it is important for the CPPs to escape the endosome in order
to avoid degradation and to deliver the cargo (Silva et al., 2019). Possible mechanisms include
release through endosomal acidification or interaction of the CPPs with the endosomal
membrane (Fischer et al., 2004; Silva et al., 2019).
Apart from the uptake pathway of CPPs, there are three crucial steps to consider for
successful internalization. First, the CPP needs to bind to the components of the cell membrane
and secondly the binding needs to be followed by the absorption through the hydrophobic cell
membrane. Lastly, a breakage of the bond between the cell membrane and the CPP needs to
occur in order to release the CPP into the cytoplasm (Herce et al., 2014). These steps are crucial
for a translation of CPPs from in vitro and in vivo studies to clinical studies and the development
of commercial products.

Chapter One
59
The number of CPPs in the clinic and in clinical trials is low due to a limited
understanding of the molecular mechanisms for the uptake of CPPs into cells (Gao et al., 2019;
Klein et al., 2017). CPPs are captured in endosomes after endocytosis and the low cytoplasmic
delivery efficiency, as well as the low bioavailability and selectivity, make translation to the
clinic difficult (Klein et al., 2017). Clinical trials are mainly reported for CPP-drug conjugates
and the reasons for discontinuing clinical trials include low stability and poor efficiency of
CPPs in vivo and toxicity introduced by excipients (Habault and Poyet, 2019). For the efficient
delivery of CPPs and cargos into cells, it is crucial to understand the uptake mechanisms and
localization processes within the cells and ensure the functionality of the cargo is protected until
it reaches the site of action (Huang et al., 2015).
Association of cell-penetrating peptides with cargos
The association of CPPs with cargo includes either a physical mixture of both
components or formation of a covalent bond between CPP and cargo (Figure 1.8) (Liu et al.,
2013). Both approaches, non-covalent and covalent conjugation, aim to increase the delivery
efficiency of cargos and are used for a variety of different cargos (Huang et al., 2015).
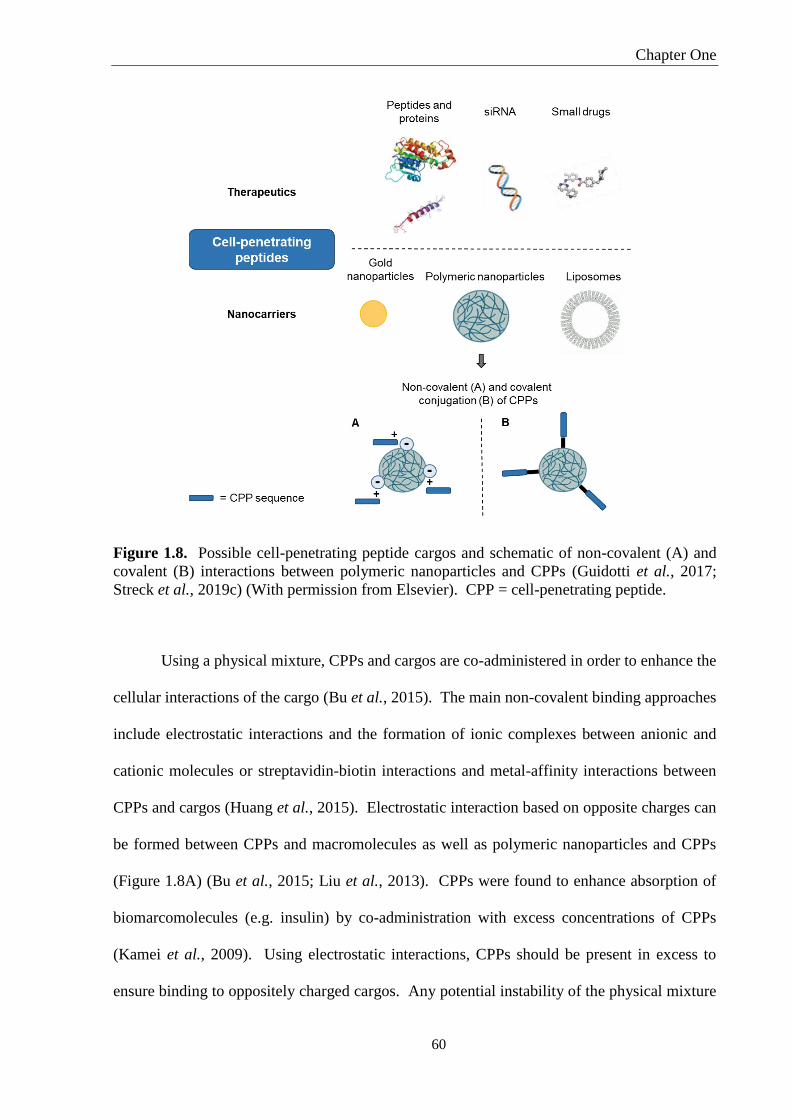
Chapter One
60
Figure 1.8. Possible cell-penetrating peptide cargos and schematic of non-covalent (A) and
covalent (B) interactions between polymeric nanoparticles and CPPs (Guidotti et al., 2017;
Streck et al., 2019c) (With permission from Elsevier). CPP = cell-penetrating peptide.
Using a physical mixture, CPPs and cargos are co-administered in order to enhance the
cellular interactions of the cargo (Bu et al., 2015). The main non-covalent binding approaches
include electrostatic interactions and the formation of ionic complexes between anionic and
cationic molecules or streptavidin-biotin interactions and metal-affinity interactions between
CPPs and cargos (Huang et al., 2015). Electrostatic interaction based on opposite charges can
be formed between CPPs and macromolecules as well as polymeric nanoparticles and CPPs
(Figure 1.8A) (Bu et al., 2015; Liu et al., 2013). CPPs were found to enhance absorption of
biomarcomolecules (e.g. insulin) by co-administration with excess concentrations of CPPs
(Kamei et al., 2009). Using electrostatic interactions, CPPs should be present in excess to
ensure binding to oppositely charged cargos. Any potential instability of the physical mixture

Chapter One
61
also needs to be considered due to interactions with competing ions in the GIT (Liu et al., 2013).
Further, CPPs have been used for in vivo gene and protein delivery after complexation or
condensation of CPPs with siRNA or antigens and studies in mice have shown that these CPP
delivery systems were able to inhibit the influenza virus replication and reduced tumour growth
of lung epithelial cells that were transformed with human papillomavirus (Shahbazi and
Bolhassani, 2018; Zhang et al., 2019). Electrostatic interactions between negatively charged
PLA or PLGA nanoparticles and positively charged CPPs can enhance the delivery of
CPP/messenger RNA polyplexes and encapsulated drugs (Bu et al., 2015; Cai et al., 2017;
Coolen et al., 2019).
The covalent linkage between CPPs and cargos depends on the cargo that is bound to
the CPP. Proteins and peptides are most commonly conjugated to CPPs by gene fusion utilizing
bacterial expression of recombinant fusion peptides between CPPs and therapeutic peptides or
proteins (Kristensen et al., 2015). For the conjugation of drug molecules, proteins and
fluorescent dyes for tracking of CPP-cargo formulations, chemical reactions like click
chemistry reactions are used (Patel et al., 2009; Ruczyński et al., 2019; Trehin et al., 2004).
Other binding strategies for cargos to CPPs include covalent linkage via hydrazine and
disulphide bonds (Hu et al., 2019). The linkage of small molecules to the CPP sequence should
preferably leave amino acids towards the C-terminus protonated, in order to preserve the
activity of CPP and cargo, the uptake abilities, and to avoid unwanted toxicity (Ruczyński et
al., 2019). Covalent conjugation between CPPs and the above mentioned cargos results in well-
defined molecules and enables predictions of the chemical structure and the activity of the
conjugates (Kristensen et al., 2015; Patel et al., 2019). Recent studies have shown that the
position of the conjugation in the CPPs sequence is crucial since this influences if a compound
shows biological activity e.g. against bacteria (Patel et al., 2019).

Chapter One
62
Different bioconjugation reactions can be used to functionalize polymeric nanoparticles
with CPPs. A covalent linkage between CPPs and nanoparticles can be produced by
bioconjugation reactions between polymers and CPPs (Figure 1.8B). Typical bioconjugation
reactions are the formation of a thiol-maleimide bond by thiol-amine coupling (Nam et al.,
2002; Steinbach et al., 2016; Xia et al., 2012) and formation of an amide bond by carbodiimide
conjugation (Egusquiaguirre et al., 2015). Arginine-rich CPPs are well-established for the
surface modification of polymeric nanoparticles or inorganic nanoparticles and less frequently
for the surface modification of liposomes (Figure 1.8) (Bartczak and Kanaras, 2011; Gullotti
and Yeo, 2012; Shi et al., 2019). As part of the introduction to Chapter 2, these reactions will
be explained in more detail (Section 2.1.4).
To confirm surface modification, surface charge is frequently used to assess the
conjugation of polymeric nanoparticles with CPPs (Coolen et al., 2019; Moku et al., 2019).
Changes in surface charge from a negative surface charge of unmodified polymeric
nanoparticles to a slightly negative or positive surface charge can indicate successful
conjugation of CPPs, depending on the exact composition of the nanoparticle formulation with
CPPs (Gartziandia et al., 2016; Liu et al., 2013; Xu et al., 2013a). Additionally, techniques
including Fourier-transform infrared spectroscopy (FTIR), nuclear magnetic resonance and X-
ray photoelectron spectroscopy (XPS) are used to investigate covalent binding (Bu et al., 2015;
Liu et al., 2013; Xia et al., 2012). For example, using XPS the elemental composition of the
modified nanoparticles is investigated and the presence of nitrogen indicates the modification
of the surface with CPPs (Liu et al., 2013; Xia et al., 2012). FTIR spectroscopy will be
discussed further in Section 2.1.4.

Chapter One
63
Surface modification of polymeric nanoparticles to enhance delivery of encapsulated
macromolecules is a prudent approach that does not alter the bioactivity of the encapsulated
macromolecule (Jain and Jain, 2015; Liu et al., 2013). CPPs have been conjugated to the
surface of polymeric nanoparticles to increase cellular uptake via the ocular and oral routes of
drug administration (Chiu et al., 2015; Vasconcelos et al., 2015; Zhu et al., 2016a). In this
thesis, the focus is on microfluidics for the preparation of polymeric nanoparticles and the
conjugation of CPPs with different architecture to alter the surface properties of polymeric
nanoparticles and exploit the influence of the CPP architecture on cellular uptake.
Thesis aims
Despite the vast amount of research conducted in pharmaceutical formulation science,
there is still a need for the improvement of drug delivery systems to successfully translate the
research from bench to bedside. Therefore, the overall aim of this thesis was to design,
characterise and evaluate an oral drug delivery system with polymeric nanoparticles decorated
with CPPs of different architectures for the ability to enhance cellular uptake.
The use of microfluidics for the formulation of polymeric nanoparticles results in the
preparation of small and uniform nanoparticles with a good reproducibility. Here, a traditional
bulk method and a microfluidics method were compared to investigate if microfluidics is
advantageous over a traditional bulk approach for the formulation of PLGA nanoparticles
(Chapter 2). Further, the conjugation of CPPs with different architecture to the surface of
PLGA nanoparticles leads to a change in the physicochemical properties of the nanoparticles.
Therefore, PLGA nanoparticles were modified with CPPs of different architecture using the
post-microfluidics conjugation approach and the influence of the CPP architecture on the

Chapter One
64
physicochemical properties such as size and surface charge of the CPP-tagged PLGA
nanoparticles was studied (Chapter 2).
To gain a better understanding of the surface modification and distribution of CPPs on
PLGA nanoparticles a second preparation method, an in situ microfluidics conjugation
approach, for the formulation of the CPP-tagged PLGA nanoparticles was designed. The
translation of the conjugation reaction from a post-microfluidics to an in situ microfluidics
conjugation approach should change the CPP distribution on PLGA nanoparticles. The
influence of CPP architecture and the conjugation approach on the distribution of CPPs on
PLGA nanoparticles were elucidated with transmission electron microscopy and small angle
X-ray scattering (Chapter 3).
To investigate the cellular uptake and interactions of CPP-tagged PLGA nanoparticles
with the nano-bio interface, in vitro studies with two different cell lines were performed. CPP-
tagged PLGA nanoparticles are expected to show greater cellular uptake than unmodified
PLGA nanoparticles due the surface modification with CPPs. Further, the role of the CPP
architecture on the internalization of PLGA nanoparticles was investigated (Chapter 4).

2 Chapter Two
Formulation and characterisation of poly-lactic-co-glycolic acid (PLGA) nanoparticles modified with cell-penetrating peptides of different architectures
Parts of this Chapter have been published as:
S. Streck, H. Neumann, H. Mørck Nielsen, T. Rades and A. McDowell (2019). Comparison
of bulk and microfluidics methods for the formulation of poly-lactic-co-glycolic acid (PLGA)
nanoparticles modified with cell-penetrating peptides of different architectures. International
Journal of Pharmaceutics: X, 1, 100030.
S. Streck, A. J. Clulow, H. Mørck Nielsen, T. Rades, B. J. Boyd and A. McDowell (2019). The
distribution of cell-penetrating peptides on polymeric nanoparticles prepared using
microfluidics and elucidated with light scattering techniques. Journal of Colloid and Interface
Science, 555, 438-448.
S. Streck, L. Hong, B. J. Boyd and A. McDowell (2019). Microfluidics for the production of
nanomedicines: Considerations for polymer and lipid-based systems. Pharmaceutical
Nanotechnology, 7, 1-21.

Chapter Two
66
Introduction
The physicochemical characteristics of drug delivery systems depend on the preparation
method and optimization of preparation-related parameters supports the design of well-defined
nanoparticles. Further, surface modifications of polymeric nanoparticles are crucial to increase
interactions with cells and the utilization of CPPs for this purpose is described in this Chapter.
Design of experiments
Experimental research carried out in the pharmaceutical sciences often follows a ‘trial
and error’ approach (Singh et al., 2011a; Singh et al., 2011b). Using ‘trial and error’ methods
means that one variable is adjusted at the time and incrementally, whereas all other parameters
remain constant (Singh et al., 2011a; Singh et al., 2011b). The main drawback of applying this
approach to the formulation of drug delivery systems is that the true optimum of the input
factors may not be able to be identified (Singh et al., 2011a; Singh et al., 2011b). In addition,
optimization based on changing one variable at the time does not guarantee that the relation and
dependency of the input factors on the output response of the process can be shown. The DoE
approach is a powerful alternative used to design experiments efficiently and to show the effect
of input factors alone and in combination on the output responses.
DoE is described as finding mathematical relations between various input factors and
an output response of a process or system (Mandenius and Brundin, 2008). The applications
of DoE studies are broad and include biotechnological processes such as antioxidant extraction
from plants (Sonchus oleraceus L.) (Ou et al., 2014), enzyme production in relation to the
composition of bacteria culture media and pharmaceutical technology processes such as the
formulation of nanoparticles (Hanrahan and Lu, 2006). In general, a specific software, e.g.

Chapter Two
67
MODDE, Design-Expert or Mini-Tab, is used to analyse the defined input factors and output
responses simultaneously to predict an experimental scheme (Bairagi et al., 2018; Kastner et
al., 2014; Patel et al., 2016; Singh et al., 2011a). The use of a DoE for optimisation of a process
is greatly supported by advantages including the requirement of only a small number of
experiments, minimized experimental bias, and an environmentally friendly and cost-effective
aspect due to better use of resources, materials and time (Singh et al., 2011a; Singh et al.,
2011b). However, there are also disadvantages, which need to be addressed to make sure the
DoE is performed correctly. The disadvantages of a DoE, including a lack of process
knowledge and inappropriate selection of variables, need to be overcome by judging the process
in question critically (Mandenius and Brundin, 2008). However, when used correctly, DoE can
contribute to the investigated process by giving direction to the optimal parameters with a
minimum number of experiments and variation of more than one variable at the time.
After definition of the input factors and output responses, a mathematical design for the
performance of the DoE study is selected. The applied designs for the DoE commonly include
two- or three-level factorial (Derakhshandeh et al., 2007; Vuddanda et al., 2015), central
composite (Water et al., 2015) and Box Behnken designs (Figure 2.1) (Bairagi et al., 2018;
Patel et al., 2016). The aim is to identify the input factors that have a significant influence on
the output response (Bairagi et al., 2018). The experiments are performed in a random order to
decrease the appearance of systematic errors and to avoid that expectations about the results of
the experiment are likely to influence the experimenter (Mandenius and Brundin, 2008). In
addition, the gathering of triplicate data at a specific centre point allows the determination of
the experimental error when the same experimental parameters are used. The mathematical
models to analyse the obtained output responses include a multiple linear regression (MLR) or
a partial least square regression (PLS) model. The MLR model is used for processes that show
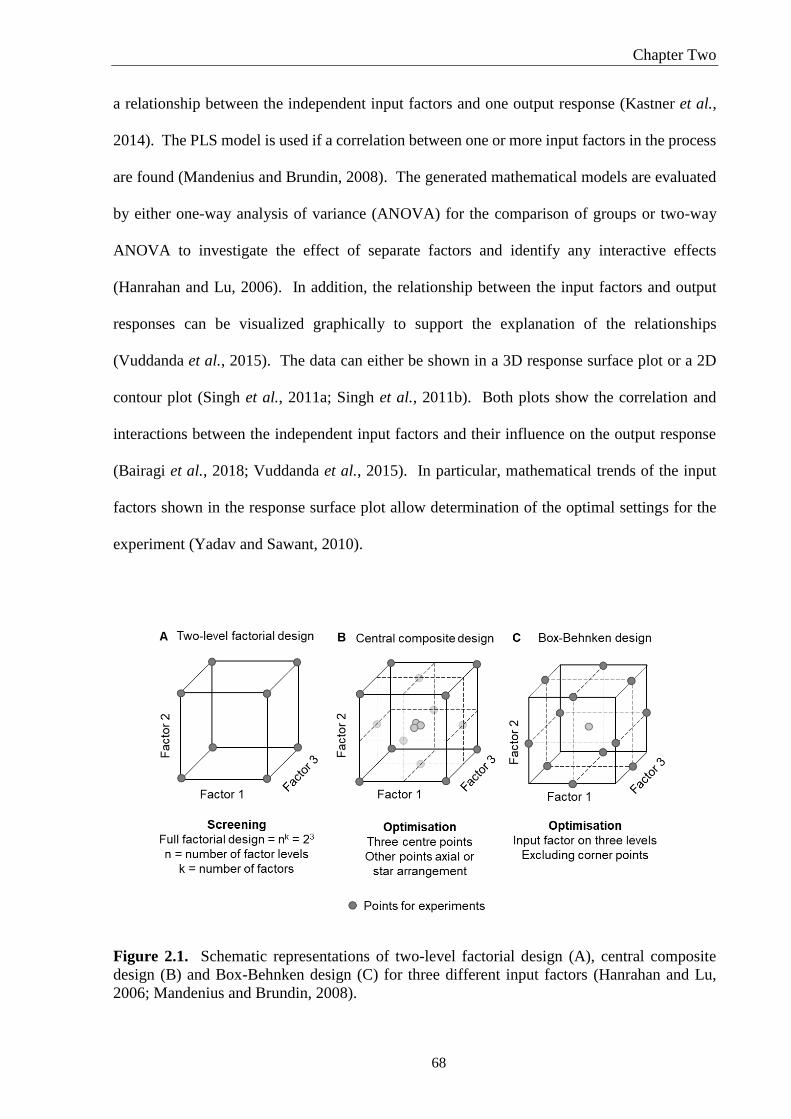
Chapter Two
68
a relationship between the independent input factors and one output response (Kastner et al.,
2014). The PLS model is used if a correlation between one or more input factors in the process
are found (Mandenius and Brundin, 2008). The generated mathematical models are evaluated
by either one-way analysis of variance (ANOVA) for the comparison of groups or two-way
ANOVA to investigate the effect of separate factors and identify any interactive effects
(Hanrahan and Lu, 2006). In addition, the relationship between the input factors and output
responses can be visualized graphically to support the explanation of the relationships
(Vuddanda et al., 2015). The data can either be shown in a 3D response surface plot or a 2D
contour plot (Singh et al., 2011a; Singh et al., 2011b). Both plots show the correlation and
interactions between the independent input factors and their influence on the output response
(Bairagi et al., 2018; Vuddanda et al., 2015). In particular, mathematical trends of the input
factors shown in the response surface plot allow determination of the optimal settings for the
experiment (Yadav and Sawant, 2010).
Figure 2.1. Schematic representations of two-level factorial design (A), central composite
design (B) and Box-Behnken design (C) for three different input factors (Hanrahan and Lu,
2006; Mandenius and Brundin, 2008).

Chapter Two
69
Design of experiments for bulk and microfluidics preparation of nanoparticles
Previous studies have utilized a DoE approach to optimise the nanoprecipitation method
for the preparation of polymeric PLGA nanoparticles. In a bulk method, the relevant input
factors identified by DoE approaches include the concentration of the polymer, the
concentration and kind of surfactant, the ratio between organic and aqueous phase, and the
addition of a co-solvent to the aqueous phase (Figure 2.2) (Bozkir and Saka, 2005;
Derakhshandeh et al., 2007; Patel et al., 2016; Sonam et al., 2014; Vuddanda et al., 2015;
Yadav and Sawant, 2010). The output responses include size, polydispersity index (PDI) and
zeta potential of the polymeric nanoparticles as well as the drug encapsulation efficiency (EE)
(Figure 2.2) (Bairagi et al., 2018; Bozkir and Saka, 2005; Derakhshandeh et al., 2007; Patel et
al., 2016; Sonam et al., 2014; Yadav and Sawant, 2010).
Figure 2.2. Influence of input factors on the output responses for the preparation of PLGA
nanoparticles using a bulk nanoprecipitation method (Bairagi et al., 2018; Patel et al., 2016;
Sonam et al., 2014; Tefas et al., 2015; Vuddanda et al., 2015; Yadav and Sawant, 2010). PDI
= polydispersity index, EE = encapsulation efficiency.

Chapter Two
70
Size and PDI of PLGA nanoparticles are influenced by the concentration of the polymer,
with a higher polymer concentration having a positive effect on size leading to the formation
of larger PLGA nanoparticles (Patel et al., 2016; Sonam et al., 2014; Tefas et al., 2015;
Vuddanda et al., 2015). The viscosity of the organic solution is increased with higher polymer
concentrations, slowing down the diffusion of the dissolved polymer from the coarse emulsion
droplets towards the aqueous phase, and increasing the chance of collision between
nanoparticles in the organic phase resulting in the formation of larger nanoparticles (Patel et
al., 2016; Sonam et al., 2014; Tefas et al., 2015). Further, size and PDI of PLGA nanoparticles
are decreased with higher surfactant concentrations due to the reduction of the interfacial
tension between the aqueous and organic phase (Patel et al., 2016; Sonam et al., 2014). With
a higher ratio of aqueous to organic solution, the formulation of smaller PLGA nanoparticles is
achieved as coalescence of organic solvents droplets in the aqueous phase can be prevented
(Patel et al., 2016; Sonam et al., 2014). The surface charge of PLGA nanoparticles is found be
more negative with higher concentrations of the PLGA polymer used (Tefas et al., 2015),
whereas higher surfactant concentrations resulted in PLGA nanoparticles with a less negative
zeta potential (Bairagi et al., 2018; Tefas et al., 2015). Finally, a higher polymer and surfactant
concentration as well as the addition of a co-solvent increases the encapsulation efficiency of
hydrophilic (Patel et al., 2016; Yadav and Sawant, 2010) and hydrophobic drugs (Bairagi et al.,
2018; Sonam et al., 2014).
As described in Chapter 1, a variety of microfluidic devices have been used for the
preparation of polymeric nanoparticles, micelles, nanogels and liposomes (Capretto et al., 2012;
Chiesa et al., 2018; Kastner et al., 2014; Water et al., 2015). However, there have been few
DoE studies performed on the optimisation of microfluidic methods for the preparation of
nanoparticles. The used designs include full factorial designs (Capretto et al., 2012; Chiesa et

Chapter Two
71
al., 2018) and a central composite design (Water et al., 2015) to evaluate the influence of
microfluidics-related parameters on nanoparticle size and drug encapsulation. The production
of PLGA nanoparticles and liposomes using a SHM was optimised using a DoE (Chiesa et al.,
2018; Kastner et al., 2014). Both, PLGA nanoparticles and liposomes showed a size ≤ 200 nm
at higher flow rate ratios (5:1) between the aqueous and organic phase (Chiesa et al., 2018;
Kastner et al., 2014). The same correlation between size and flow rate ratio was found for
polymeric micelles prepared with a 2D HFF device (Capretto et al., 2012). Encapsulation of
poorly soluble drugs in liposomes and peptides in hydrophilic nanogels has been reported to be
higher at flow rates around 2 mL/min (Kastner et al., 2014; Water et al., 2015). The above-
mentioned examples of DoE studies for the bulk and microfluidic methods show that the
optimisation of method-related parameters is crucial for the preparation of nanoparticles. The
method-related parameters have an influence on size, polydispersity and encapsulation
efficiency of drugs in the nanoparticles and thus define the suitability of formulated
nanoparticles as drug delivery systems.
Optimisation of size of polymeric nanoparticles
The microfluidics-related parameters; flow rate and flow rate ratio have an impact on
the size of polymeric nanoparticles produced with microfluidics and general considerations are
discussed below.
The flow rate is described as the combined speed of the fluids within the microchannel.
Generally, an increase in flow rate of the fluids within the microchannel leads to the formation
of polymeric nanoparticles with a size between 40 and 160 nm depending on the microfluidic
device utilized (Figure 2.3) (Lim et al., 2014b; Min et al., 2014; Morikawa et al., 2018). This
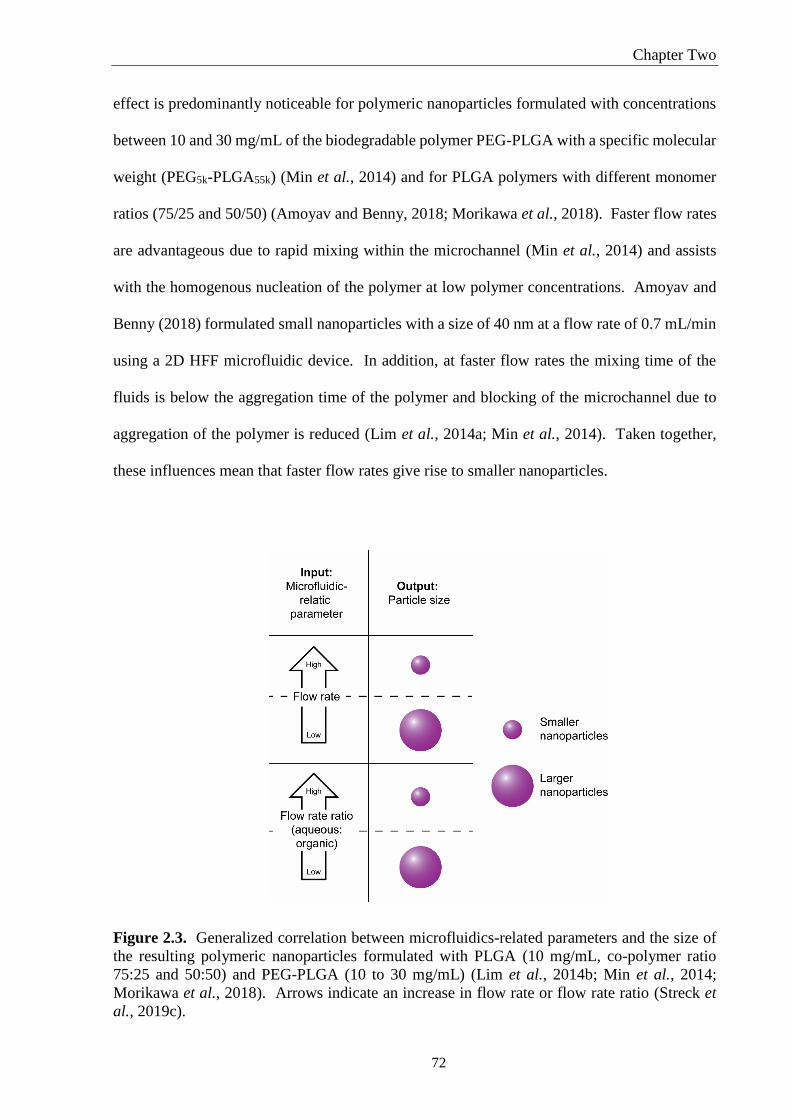
Chapter Two
72
effect is predominantly noticeable for polymeric nanoparticles formulated with concentrations
between 10 and 30 mg/mL of the biodegradable polymer PEG-PLGA with a specific molecular
weight (PEG5k-PLGA55k) (Min et al., 2014) and for PLGA polymers with different monomer
ratios (75/25 and 50/50) (Amoyav and Benny, 2018; Morikawa et al., 2018). Faster flow rates
are advantageous due to rapid mixing within the microchannel (Min et al., 2014) and assists
with the homogenous nucleation of the polymer at low polymer concentrations. Amoyav and
Benny (2018) formulated small nanoparticles with a size of 40 nm at a flow rate of 0.7 mL/min
using a 2D HFF microfluidic device. In addition, at faster flow rates the mixing time of the
fluids is below the aggregation time of the polymer and blocking of the microchannel due to
aggregation of the polymer is reduced (Lim et al., 2014a; Min et al., 2014). Taken together,
these influences mean that faster flow rates give rise to smaller nanoparticles.
Figure 2.3. Generalized correlation between microfluidics-related parameters and the size of
the resulting polymeric nanoparticles formulated with PLGA (10 mg/mL, co-polymer ratio
75:25 and 50:50) and PEG-PLGA (10 to 30 mg/mL) (Lim et al., 2014b; Min et al., 2014;
Morikawa et al., 2018). Arrows indicate an increase in flow rate or flow rate ratio (Streck et
al., 2019c).

Chapter Two
73
The flow rate ratio is described as the ratio between the two solvent streams (anti-solvent
or aqueous phase and organic solution) in the microfluidic device and can have a significant
influence on the size distribution of polymeric nanoparticles. Polymeric nanoparticles prepared
using HFF microfluidic devices with PEG5k-PLGA10-27k (Lim et al., 2014a) and PLGA
(Bramosanti et al., 2017) showed a decrease in size when the amount of anti-solvent was 20 to
50 times larger than the amount of organic polymer solution (Figure 2.3) (Bramosanti et al.,
2017; Lim et al., 2014a; Liu et al., 2015). The decrease in size at higher flow rate ratios was
attributed to the reduced width of the organic solvent stream and diffusive mixing occurring in
a more controlled way (Liu et al., 2015). Most of the microfluidics studies for the preparation
of PLGA or PEG-PLGA nanoparticles have been performed based on a ‘trial and error’
approach. The utilization of a DoE approach aids in simultaneously evaluating the influence
of microfluidics-related parameters on the formulation of PLGA nanoparticles. The DoE study
performed in this thesis contributes to a better understanding of the parameters required to
produce nanoparticles with a size below 200 nm. This has not yet been described in the
published literature for PLGA (50:50).
Conjugation of biomacromolecules and polymers
Bioconjugation reactions are defined by the formation of a covalent bond between two
compounds through the use of reactive crosslinking reagents (Hermanson, 2013a). Crosslinkers
are molecules that exploit reactive groups of compounds to facilitate the conjugation reaction
(Hermanson, 2013a). Common bioconjugation reactions between polymeric nanoparticles and
proteins or peptides include the maleimide reaction, the EDC/sulfo-NHS zero-length
crosslinking reaction and streptavidin-biotin affinity reaction (Yadav et al., 2011). The
maleimide reaction requires the presence of a thiol group (often a free cysteine) in the protein

Chapter Two
74
or peptide sequence and a maleimide moiety on the polymer (Cox et al., 2019; Gullotti and
Yeo, 2012). The thiol group reacts with the maleimide moiety and forms a thioether bond
(Figure 2.4A) (Yadav et al., 2011). The EDC/sulfo-NHS reaction is a zero-length crosslinking
reaction were a covalent bond between two compounds is formed directly without any bridging
groups (Hermanson, 2013c). This reaction is especially suitable for the conjugation of peptides
to nanoparticles due to the solubility of the reagents EDC and sulfo-NHS in the aqueous
environment and the maintenance of the native structure of biomacromolecules in this
environment (Totaro et al., 2016; Yadav et al., 2011). For the zero-length crosslinking reaction,
the carboxyl group of the polymer is activated with EDC and sulfo-NHS to form a sulfo-reactive
ester intermediate that can react with a primary amine present in the N-terminus or side chain
of the peptide sequence to form a covalent amide bond (Figure 2.4B) (Hermanson, 2013c;
Yadav et al., 2011). One disadvantage is the formation of side products including EDC-urea,
anhydrides of o-acylisourea and N-acylisourea, which are competing with the formation of the
desired amide bond if EDC is used in excess (Hermanson, 2013c; Totaro et al., 2016). The
streptavidin-biotin affinity reaction is based on the strong affinity of streptavidin to biotin and
is a non-covalent bioconjugation reaction (Figure 2.4C) (Hermanson, 2013b; Yadav et al.,
2011). The main advantage of this bioconjugation reaction is that the affinity of streptavidin to
biotin is not influenced by the conjugation to other proteins or labels (Hermanson, 2013b;
Yadav et al., 2011).
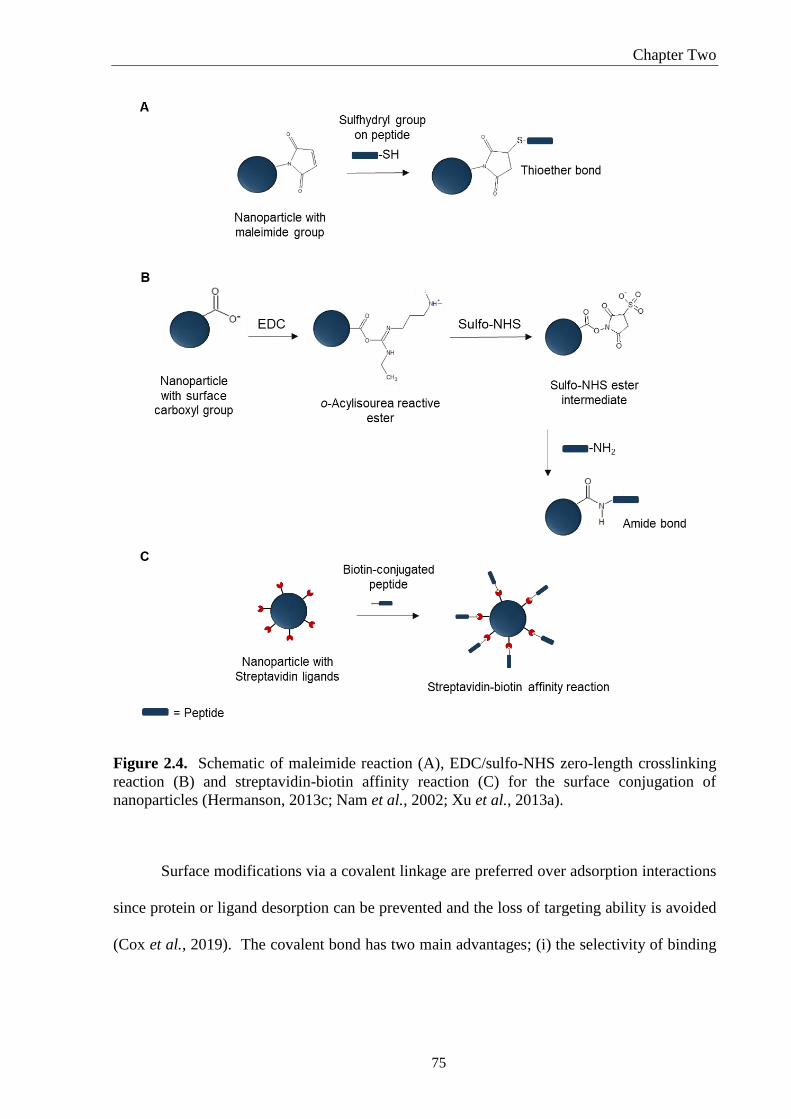
Chapter Two
75
Figure 2.4. Schematic of maleimide reaction (A), EDC/sulfo-NHS zero-length crosslinking
reaction (B) and streptavidin-biotin affinity reaction (C) for the surface conjugation of
nanoparticles (Hermanson, 2013c; Nam et al., 2002; Xu et al., 2013a).
Surface modifications via a covalent linkage are preferred over adsorption interactions
since protein or ligand desorption can be prevented and the loss of targeting ability is avoided
(Cox et al., 2019). The covalent bond has two main advantages; (i) the selectivity of binding

Chapter Two
76
is improved and (ii) the displacement of surface proteins by serum proteins after in vivo
administration or during purification process is prevented (Cox et al., 2019).
Mass spectrometry (MS) can be used for identification analysis of a wide range of
compounds. The combination of MS with the soft ionisation method matrix assisted laser
desorption ionisation (MALDI) and a time of flight (TOF) detector is an analytical tool for the
characterisation of peptides, proteins polymers and biomolecules with a large molecular weight
(Bilati et al., 2005; Kafka et al., 2011). Using MALDI-TOF, MS samples are co-crystallised
with excess of matrix before the sample matrix mixture is activated by laser energy to achieve
vaporisation (Kafka et al., 2011). In the gas phase, proton transfer from the matrix to the sample
results in single charge ions that are analysed by the detector according to their velocity
depending on their mass to charge ratio (Kafka et al., 2011). The qualitative analysis of peptides
with MALDI-TOF MS offers high sensitivity, a small sample amount and rapid sample
preparation in addition to the analysis of a wide mass range (Bilati et al., 2005). Previously,
MALDI-TOF MS was used successfully to investigate the conjugation between the poly(ethyl-
cyanoacrylate) nanoparticles (PECA) and the gonadotropin releasing hormone (GnRH)
analogue, D-Lys6-GnRH, showing that ethyl-cyanoacrylate monomer units were co-
polymerised with the D-Lys6-GnRH via histidine residues in the peptide sequence (Kafka et al.,
2009).
The successful conjugation of biomacromolecules to polymeric nanoparticles can be
analysed using Fourier-transform infrared (FTIR) spectroscopy. FTIR spectroscopy uses
infrared radiation to measure the wavelength and intensity of the absorbed radiation by a sample
(Kong and Yu, 2007). Using attenuated total reflectance (ATR)-FTIR, the infrared beam passes

Chapter Two
77
through a Germanium or ZnSe crystal, which is optically dense and has a high reflection index
(Shai, 2013). The crystal supports internal reflectance of the infrared beam, which can leave
the crystal and penetrate into the sample to a depth of 0.5-5 µm (Shai, 2013). With FTIR, the
type of chemical bond (single or double) and the quality of the bond vibration (stretch or bend)
can be assessed (Shai, 2013). The amide I bond vibration between 1700-1600 cm-1 is primarily
related to the C=O stretch within the peptide sequence (Kong and Yu, 2007; Shai, 2013). In
the wavenumber range between 1575-1480 cm-1 the amide II bond vibration is located, which
is related to the in-plane NH-bending and CN stretching of molecules/peptides/proteins (Kong
and Yu, 2007). Infra-red radiation absorbed by amide bonds leads to a total amount of nine
characteristics bands in peptides and proteins, with the amide I and II vibrations being the most
prominent ones (Kong and Yu, 2007).
Chapter aims
In this Chapter, the preparation of polymeric nanoparticles using a traditional bulk
method and a microfluidics method is highlighted. The two preparation methods were
optimised using a DoE approach and compared to evaluate the uniformity of the formulated
PLGA nanoparticles. Further, PLGA nanoparticles prepared with the microfluidics method
were surface-modified with CPPs of different architectures (Figure 2.5), to alter their
physicochemical properties. The three CPPs have a distinct architecture, namely a short, a long
linear and a branched architecture. The modified nanoparticles were characterized for their
suitability as a drug delivery system to enhance uptake after oral administration.

Chapter Two
78
Materials
Poly(DL-lactide-co-glycolide) (PLGA) 50:50, ester terminated, MW 15,980 Da, was
supplied by Durect Lactel (Cupertino, CA, USA). Acetonitrile (ACN) (HPLC grade) was
supplied by Merck (Darmstadt, Germany). Mowiol® 4-88 (polyvinyl alcohol, PVA, MW
31,000), 2-[4-(2-hydroxyethyl)piperazin-1-yl]ethanesulfonic acid (HEPES) (purity > 99.5%),
N-(3-dimethylaminopropyl)-N-ethylcarbodiimide hydrochloride (EDC) (purity > 98%),
trifluoroacetic acid (TFA, HPLC grade, purity > 99%), GRKKRRQK(RRH)K(RRH)K(RRH)
(bTAT, custom synthesized, MW 2661.2 Da, purity > 95%), α-cyano-4-hydroxycinnamic acid
(purity ≥ 99%) and ammonium phosphate were purchased from Sigma–Aldrich (St. Louis, MO,
USA). Snake Skin™ dialysis tubing (10 kDa MWCO) and sulfo-N-hydroxysulfosuccinimide
(sulfo-NHS) were purchased from Thermo Fisher Scientific Australia Pty (Scoresby,
Australia). The peptides RRH (MW 467.3 Da, purity > 98%) and GRKKRRQRRR (TAT (48-
57), MW 1396.7 Da, purity > 98%) were custom synthesized by GLS (Shanghai, China) and
used as supplied. Distilled, ultra-pure water was produced using a Milli-Q® Water Millipore
Purification System (Billerica, MA, USA).
In this work, CPPs with three different architectures were designed for conjugation to
PLGA nanoparticles to be able to investigate how the architecture of the CPPs influences cell
uptake (Figure 2.5). The short RRH was chosen due to previous work that showed 30% increase
in cellular uptake in Caco-2 cells when RRH was conjugated to PECA nanoparticles in
comparison to unmodified PECA nanoparticles (Chiu et al., 2015). The long linear CPP was
the widely investigated TAT peptide and the third CPP was custom designed and is
subsequently referred to as branched TAT (bTAT). It has a modified TAT backbone with three
RRH side branches (Figure 2.5).
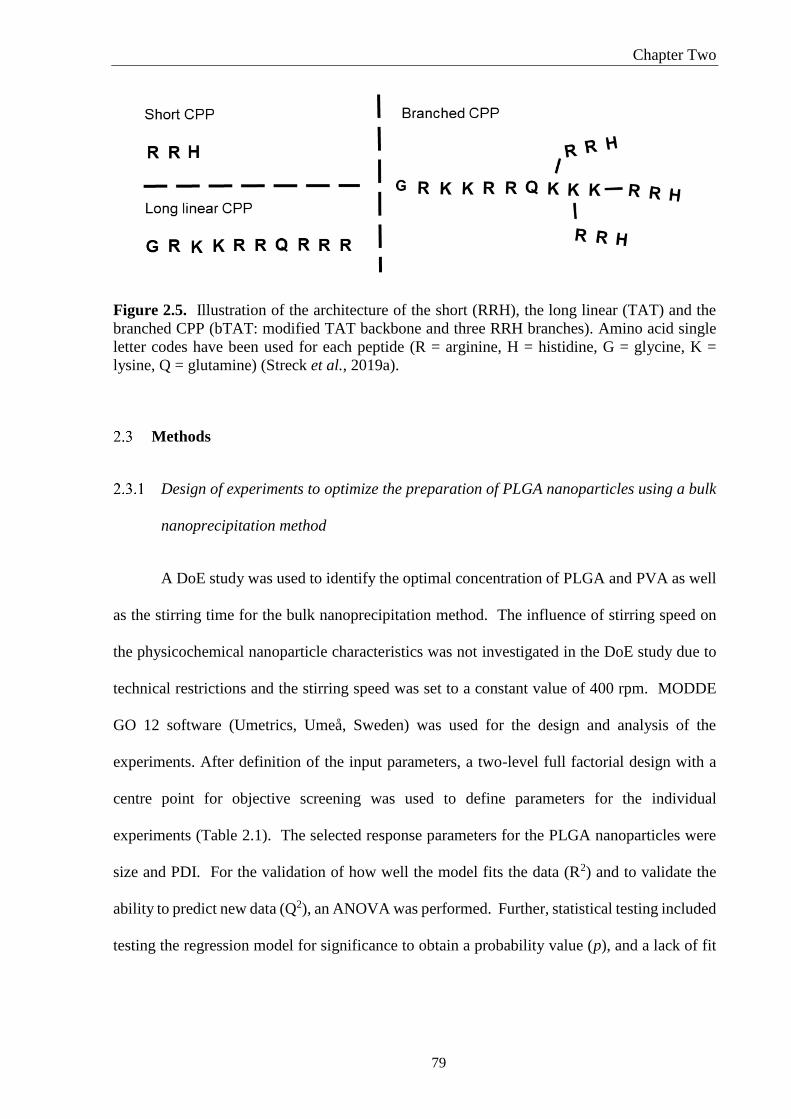
Chapter Two
79
Figure 2.5. Illustration of the architecture of the short (RRH), the long linear (TAT) and the
branched CPP (bTAT: modified TAT backbone and three RRH branches). Amino acid single
letter codes have been used for each peptide (R = arginine, H = histidine, G = glycine, K =
lysine, Q = glutamine) (Streck et al., 2019a).
Methods
Design of experiments to optimize the preparation of PLGA nanoparticles using a bulk
nanoprecipitation method
A DoE study was used to identify the optimal concentration of PLGA and PVA as well
as the stirring time for the bulk nanoprecipitation method. The influence of stirring speed on
the physicochemical nanoparticle characteristics was not investigated in the DoE study due to
technical restrictions and the stirring speed was set to a constant value of 400 rpm. MODDE
GO 12 software (Umetrics, Umeå, Sweden) was used for the design and analysis of the
experiments. After definition of the input parameters, a two-level full factorial design with a
centre point for objective screening was used to define parameters for the individual
experiments (Table 2.1). The selected response parameters for the PLGA nanoparticles were
size and PDI. For the validation of how well the model fits the data (R2) and to validate the
ability to predict new data (Q2), an ANOVA was performed. Further, statistical testing included
testing the regression model for significance to obtain a probability value (p), and a lack of fit
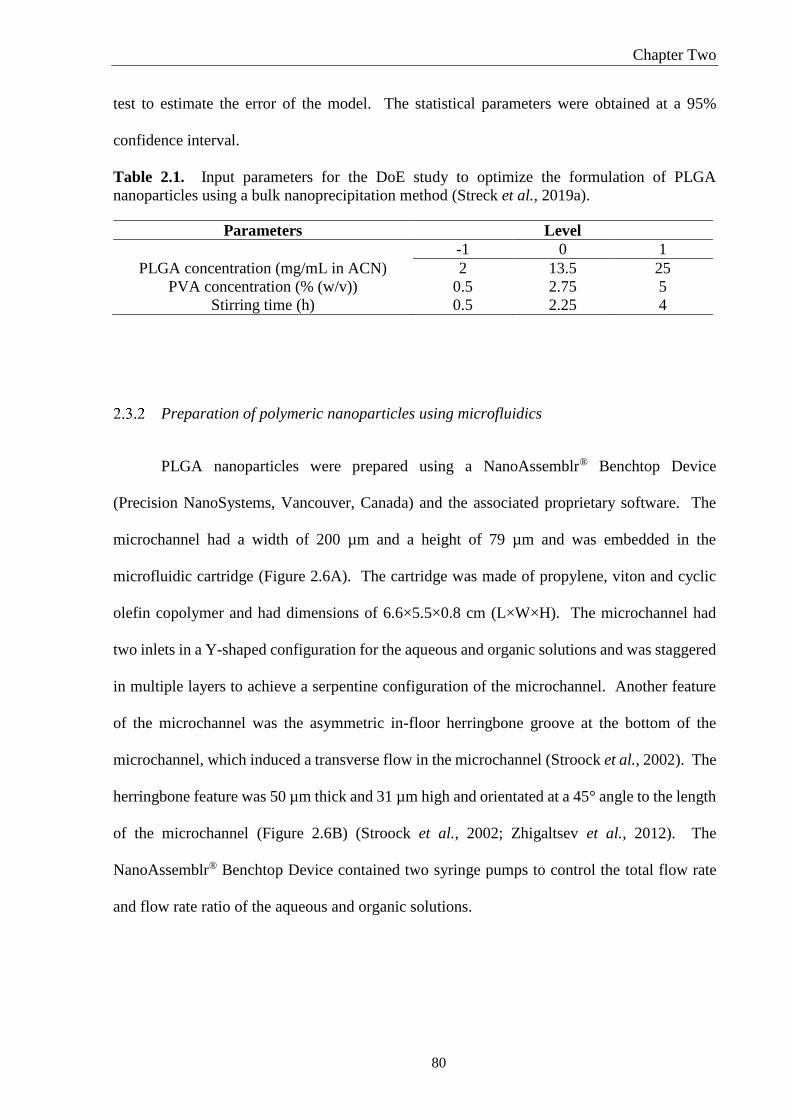
Chapter Two
80
test to estimate the error of the model. The statistical parameters were obtained at a 95%
confidence interval.
Table 2.1. Input parameters for the DoE study to optimize the formulation of PLGA
nanoparticles using a bulk nanoprecipitation method (Streck et al., 2019a).
Parameters Level
-1 0 1
PLGA concentration (mg/mL in ACN) 2 13.5 25
PVA concentration (% (w/v)) 0.5 2.75 5
Stirring time (h) 0.5 2.25 4
Preparation of polymeric nanoparticles using microfluidics
PLGA nanoparticles were prepared using a NanoAssemblr® Benchtop Device
(Precision NanoSystems, Vancouver, Canada) and the associated proprietary software. The
microchannel had a width of 200 µm and a height of 79 µm and was embedded in the
microfluidic cartridge (Figure 2.6A). The cartridge was made of propylene, viton and cyclic
olefin copolymer and had dimensions of 6.6×5.5×0.8 cm (L×W×H). The microchannel had
two inlets in a Y-shaped configuration for the aqueous and organic solutions and was staggered
in multiple layers to achieve a serpentine configuration of the microchannel. Another feature
of the microchannel was the asymmetric in-floor herringbone groove at the bottom of the
microchannel, which induced a transverse flow in the microchannel (Stroock et al., 2002). The
herringbone feature was 50 µm thick and 31 µm high and orientated at a 45° angle to the length
of the microchannel (Figure 2.6B) (Stroock et al., 2002; Zhigaltsev et al., 2012). The
NanoAssemblr® Benchtop Device contained two syringe pumps to control the total flow rate
and flow rate ratio of the aqueous and organic solutions.

Chapter Two
81
Figure 2.6. Microfluidic cartridge used for the NanoAssemblr® Benchtop Device (A) and
depth profile of herringbone feature (B) found within the microchannel (not to scale).
Schematic of the herringbone feature was adapted from Belliveau et al. (2012). The SHM
section of the microchannel is 2.5 cm long and can hold a volume of 0.0004 mL.
Design of experiments study for microfluidics preparation of PLGA nanoparticles
For the preparation of PLGA nanoparticles using microfluidics, a DoE study was used
to screen for factors that influenced the size distribution and PDI of the resulting nanoparticles.
A two-level full factorial design with a centre point was chosen to investigate the factors total
flow rate and flow rate ratio at three different levels (-1, 0, 1) (Table 2.2). The concentration
of the organic PLGA solution in ACN and the concentration of the aqueous PVA solution were
kept constant at 10 mg/mL (in ACN) and 2% (w/v), respectively (Table 2.2). After preparation,
the PLGA nanoparticle suspension was dialyzed overnight against ultra-pure water using a
regenerated cellulose membrane with a 10 kDa MWCO.
The experimental data were fitted with a MLR model using the MODDE GO 12
software. Interaction terms were determined by the addition of two-factor interactions to the
model to investigate a beneficial contribution to the model quality. The response surface plots

Chapter Two
82
were generated using the MODDE GO software and used for interpretation of the data. One-
way ANOVA was performed to validate how the model fits the data (R2) and to validate the
ability to predict new data (Q2). In addition, the regression of the model was tested for
significance and the probability value p was obtained. A lack of fit test was performed to
estimate the errors in the model. The statistical parameters were obtained at a 95% confidence
interval.
Table 2.2. Input parameters for the DoE study for the formulation of PLGA nanoparticles using
microfluidics (Streck et al., 2019b). FRR = flow rate ratio, TFR = total flow rate.
Parameters Concentration
PLGA concentration (mg/mL in ACN) 10
PVA concentration (% (w/v)) 2
Levels
-1 0 1
FRR (aqueous:organic) 1:1 6.5:1 12:1
TFR (mL/min) 2 7 12
Bulk nanoprecipitation method for preparation of PLGA nanoparticles
PLGA nanoparticles were prepared using a bulk nanoprecipitation method based on the
description by Fessi et al. (1989) and optimised using DoE (Section 2.3.1). Briefly, an organic
PLGA solution (10 mg/mL in ACN) was added dropwise to a beaker containing 10 mL PVA
(2% w/v in ultra-pure water) and the solvent was evaporated during magnetic stirring (400 rpm)
for 2 h and 15 min. The resulting PLGA nanoparticles were washed twice with ultra-pure water
by centrifugation at 17,900 g for 10 min at room temperature and stored as suspension in ultra-
pure water at 4°C until required with a maximum storage time of 7 days. Preliminary results
showed that size, PDI and zeta potential of PLGA nanoparticles did not change over a storage
time of 7 days at 4°C (Day 0: 144 ± 2 nm, 0.135 ± 0.001, -21 ± 2 mV; Day 7: 147 ± 5 nm, 0.198

Chapter Two
83
± 0.065, -21 ± 2 mV). PLGA nanoparticles were stored in aqueous solution, while stirring to
avoid sedimentation if immediate use was restricted by equipment availability.
Microfluidics method for the preparation of PLGA nanoparticles
PLGA nanoparticles were prepared using the NanoAssemblr® Benchtop Device with
the optimised setting from the DoE (Section 2.3.3). The aqueous PVA solution (2% w/v) was
mixed with the organic PLGA solution (10 mg/mL in ACN) at a flow rate ratio
(aqueous:organic) of 6:1 and a total flow rate of 10 mL/min. PLGA nanoparticles were dialyzed
overnight against ultra-pure water at room temperature using Snake Skin™ dialysis tubing (10
kDa MWCO) and stored as suspension in ultra-pure water at 4°C until required with a
maximum storage time of 7 days.
Preparation of surface-modified PLGA nanoparticles
Prior to the surface modification, PLGA nanoparticles suspensions produced with the
bulk nanoprecipitation or the microfluidics method (Section 2.3.4 and 2.3.5) were dialyzed
overnight against ultra-pure water at room temperature using Snake Skin™ dialysis tubing
(10 kDa MWCO).
A zero-length crosslinking reaction for the conjugation of CPPs to the surface of PLGA
nanoparticles was adapted from Egusquiaguirre et al. (2015) with some modifications. Briefly,
500 µL of the PLGA nanoparticle suspension was diluted with HEPES buffer (0.025 M, pH
6.4) to 1.5 mL and the nanoparticle suspension was gently stirred while adding 250 µL EDC
(1.5 mM in ultra-pure water) and 250 µL sulfo-NHS (2 mM in ultra-pure water). The stirring
continued for 30 min at room temperature, before the solution was separated by ultra-

Chapter Two
84
centrifugation at 42,800 g for 15 min at 4°C. The pellet, containing the activated nanoparticles,
was re-suspended and diluted with HEPES buffer (0.025 M, pH 6.4) to a volume of 1.1 mL.
To this suspension, 100 µL of the CPP solutions with varying concentrations of RRH (10, 50
and 75 mM), TAT (2.9, 5.7, and 8.6 mM) and bTAT (4.5 mM and 6 mM) were added. The
mixture was left to incubate overnight at 4°C and was then separated by ultra-centrifugation at
42,800 g for 15 min at 4°C. The supernatant was aspirated and kept at 4°C until RP-HPLC
analysis and the nanoparticle pellet was stored at 4°C until required with a maximum storage
time of 7 days.
Mass spectrometry assessment of cell-penetrating peptides
MALDI-TOF MS was used to analyse the three different CPPs; RRH, TAT and bTAT.
CPPs were dissolved in 2 µL ultra-pure water and diluted with ACN to achieve concentrations
of 0.5 mg/mL. The organic CPPs solutions were mixed with freshly prepared α-cyano-4-
hydroxycinnamic acid (10 mg/mL with 1 µL 1 M ammonium phosphate and 1 µL 10% (v/v)
TFA in ACN) matrix at a ratio of 2:1 (matrix:sample) before spotting on the Opti-TOF™
Sample Plate (Applied Biosystems, Framingham, MA, USA). After the spots were air dried,
the sample plate was inserted into the Applied Biosystems/MDS SCIEX 4800 MALDI
TOF/TOF™ Analyzer and analysed in a positive ion reflector mode with 1000 shots per sample
spot. A calibration was performed using the calibrations spots on the sample plate of 5 peptides
with different m/z (Insulin B chain m/z 3494.651, ACTH 18-39 m/z 2465.199, angiotensin II
m/z 1046.542, P14R m/z 1533.858 and bradykinin 1-7 m/z 757.400).

Chapter Two
85
Characterization of PLGA and CPP-tagged PLGA nanoparticles
Dynamic light scattering (DLS) was used to measure the Z-average diameter and PDI
of the nanoparticles (Malvern® Nano ZS, Model Zen 3600, Malvern Instruments, Malvern, UK)
equipped with a 633 nm laser and 173° detections optics. Laser Doppler electrophoresis was
used to measure zeta potential of the nanoparticles with the same instrument. All samples were
diluted to an appropriate concentration and triplicate measurements from three individual
batches were taken.
The morphologies of the PLGA and CPP-tagged PLGA nanoparticles, prepared using
the bulk nanoprecipitation method and the microfluidics method, were investigated using
transmission electron microscopy (TEM). First, the carbon film on a 300 mesh copper grid was
made hydrophilic by glow discharge in air (Aebi and Pollard, 1987). Afterwards, 10 µL of the
PLGA nanoparticle suspension was placed on the grid for 1 min and excess suspension was
blotted before the grid was washed twice with ultra-pure water and stained to contrast the
specimen with phosphotungstic acid (1% w/v, pH 6.8). The samples were viewed on a Philips
CM100 BioTWIN TEM (Philips Electron Optics, Eindhoven, The Netherlands) and the
micrographs were recorded using a MegaView3 camera (Soft Imaging System, Münster,
Germany).
Investigation of covalent binding between CPPs and PLGA conjugates
To investigate any interactions between the CPPs and PLGA, FTIR spectra of PLGA
polymer, CPPs and PLGA-CPP conjugates were recorded with a Varian 3100 FTIR (Varian,
Palo Alto, CA, USA) using transmission mode and compared. The spectra were obtained at
wavenumbers between 400-4000 cm-1 with 64 scans per sample and a resolution of 4 cm-1. The

Chapter Two
86
PLGA-CPP conjugates were prepared using the zero-length crosslinking reaction. PLGA
polymer was dissolved in ACN (10 mg/mL) and to a 1 mL solution of the polymer, 250 μL
EDC (1.5 mM in ultra-pure water) and 250 μL of sulfo-NHS (2 mM in ultra-pure water) were
added. The mixture was gently stirred on a magnetic stirring plate for 30 min and then
precipitated by adding 3 mL of ultra-pure water and separated by centrifugation at 3220 g for
20 min at 8 °C (Karve et al., 2011). The supernatant was removed and the pellet re-suspended
in ACN. 200 μL of CPP solutions (50 mM RRH, 8.6 mM TAT and 4.5 mM bTAT HEPES
(0.025 M, pH 6.4)) were added and incubated while gently stirred at room temperature for
30 min. The PLGA-CPP conjugates were precipitated again as described above and the pellet
was dissolved in ACN at a 1:10 ratio (v/v).
The PLGA polymer was dissolved in ACN at a concentration of 10 mg/mL and the
CPPs were dissolved in 20 μL ultra-pure water and then diluted with ACN to the intended
concentration (50 mM RRH, 8.6 mM TAT and 4.5 mM bTAT) before analysis.
Conjugation efficiency of CPPs tagged to PLGA nanoparticles
The conjugation efficiency of the CPPs to the nanoparticles was obtained indirectly
from the amount of CPPs remaining in the supernatant. The supernatant was collected after
overnight incubation of the activated nanoparticles with the different concentrations of the three
CPPs as described in Section 2.3.6.
CPP concentrations in the supernatant were quantified with validated RP-HPLC
methods using the Agilent series 1200 HPLC system (Agilent Technologies, Santa Clara, CA,
USA) with a reverse phase column (HiChrom ultrasphere 5 ODS, 250×4.6 mm, 5 µm particle
size, 300 Å pore size (HiChrom, Theale, UK)) and a UV detector (G1314B) at wavelengths

Chapter Two
87
between 214-220 nm. The aqueous mobile phase contained 0.1% (v/v) TFA in ultra-pure water
and the organic mobile phase contained 0.1% (v/v) TFA in ACN. The CPPs in the supernatant
were eluted by gradient (0 to 7% over 25 min for RRH, 0 to 13% over 37 min for TAT and
12 to 22% over 25 min for bTAT) at a flow rate of 0.6 mL/min. The CPP concentration was
quantified using peak integration and an individual standard curve was produced for each CPP.
Equation (2-1) was used to calculate the conjugation efficiency of the different CPPs
used in the study. The conjugation efficiency was obtained by calculating the difference
between the total concentration of CPPs added to the nanoparticle suspension and the measured
concentration of CPPs in the supernatant after conjugation.
Conjugation efficiency (%)=Total conc. CPP- Measured conc. CPP
Total conc. CPP× 100% (2-1)
Validation of RP-HPLC method for CPPs
A stock solution of RRH (1 mg/mL), TAT (1 mg/mL) and bTAT (1 mg/mL) was
prepared daily and divided into two aliquots for the preparation of an independent set of
standards and for the quality control samples (QCs). In order to obtain a standard curve, stock
solutions were diluted with HEPES buffer (0.025 M, pH 6.45) to concentrations within the
range of the standard curve (RRH: 50-1000 µg/mL, TAT: 100-1000 µg/mL and bTAT: 50-
750 µg/mL). The QCs were prepared with HEPES buffer (0.025 M, pH 6.45) at three different
concentrations of 75, 250 and 750 µg/mL; 200, 450 and 900 µg/mL and 75, 350 and 600 µg/mL
for RRH, TAT and bTAT, respectively. The validation was carried out over three subsequent
days with multiple injections of the QCs within one day. The analysis of the validation included
linearity of the standard curve, the inter- and intra-day precision and accuracy and sensitivity.

Chapter Two
88
For the evaluation of the RP-HPLC methods of the CPPs, the coefficient of variance
and the accuracy were calculated using Equations 2-2 and 2-3, respectively.
𝐶𝑜𝑒𝑓𝑓𝑖𝑐𝑖𝑒𝑛𝑡 𝑜𝑓 𝑣𝑎𝑟𝑖𝑎𝑛𝑐𝑒 (%) = 𝑆𝐷 𝑜𝑓 𝑠𝑎𝑚𝑝𝑙𝑒 𝑐𝑜𝑛𝑐𝑒𝑛𝑡𝑟𝑎𝑡𝑖𝑜𝑛
𝑀𝑒𝑎𝑛 𝑠𝑎𝑚𝑝𝑙𝑒 𝑐𝑜𝑛𝑐𝑒𝑛𝑡𝑟𝑎𝑡𝑖𝑜𝑛× 100 (2-2)
𝐴𝑐𝑐𝑢𝑟𝑎𝑐𝑦 (%) = 𝑀𝑒𝑎𝑛 𝑠𝑎𝑚𝑝𝑙𝑒 𝑐𝑜𝑛𝑐𝑒𝑛𝑡𝑟𝑎𝑡𝑖𝑜𝑛𝑚𝑒𝑎𝑠𝑢𝑟𝑒𝑑
𝑆𝑡𝑎𝑛𝑑𝑎𝑟𝑑 𝑐𝑜𝑛𝑐𝑒𝑛𝑡𝑟𝑎𝑡𝑖𝑜𝑛× 100 (2-3)
The limit of quantification (LOQ) is characterised by a detector response 10 times as
high as the noise level and the limit of detection (LOD) is characterised by a detector response
3.3 times as high as the noise level. The LOD and LOQ were calculated using Equations 2-4
and 2-5 (FDA, 1997).
𝐿𝑂𝐷 = (10 ∗ 𝑆𝑡𝑎𝑛𝑑𝑎𝑟𝑑 𝑑𝑒𝑣𝑖𝑎𝑡𝑖𝑜𝑛 𝑜𝑓 𝑦−𝑖𝑛𝑡𝑒𝑟𝑐𝑒𝑝𝑡)
𝑠𝑙𝑜𝑝𝑒 (2-4)
𝐿𝑂𝑄 = (3.3 ∗ 𝑆𝑡𝑎𝑛𝑑𝑎𝑟𝑑 𝑑𝑒𝑣𝑖𝑎𝑡𝑖𝑜𝑛 𝑜𝑓 𝑦−𝑖𝑛𝑡𝑒𝑟𝑐𝑒𝑝𝑡)
𝑠𝑙𝑜𝑝𝑒 (2-5)
Statistical analysis
All experiments were performed in triplicate and results are presented as mean ±
standard deviation (SD). Statistical analysis for the DoEs was performed using one-way
ANOVA with MODDE GO 12 software. Comparisons between single groups were made by
performing a Student’s t test. The reported p-values were considered statistically significant at
p < 0.05.

Chapter Two
89
Results and Discussion
Optimal PLGA and stabilizer concentration for the formulation of PLGA nanoparticles
determined by design of experiments (DoE)
The size of nanoparticles plays a crucial role in cellular uptake and formulation of PLGA
nanoparticles, with a size below 200 nm facilitating cellular uptake via endocytosis (Sharma et
al., 2015). In a DoE study, the influence of PLGA concentration, stabilizer concentration and
stirring time on the size and PDI of PLGA nanoparticles was investigated. The size and PDI of
formulated PLGA nanoparticles obtained at the different levels of the input factors are
summarized in Appendix I. A response surface plot was used for model interpretation and
represents the combined effect of alterations of the input factors on the output response (Bairagi
et al., 2018; Yadav and Sawant, 2010). The response surface plot obtained for the size of PLGA
nanoparticles prepared using a bulk nanoprecipitation method showed that a low concentration
of PVA (≥ 2%) and a low concentration of PLGA (< 15 mg/mL) were advantageous for the
production of PLGA nanoparticles with a size of approximately 150 nm (Figure 2.7A). The
significant factors influencing the size of PLGA nanoparticles were the concentration of PLGA
polymer, the concentration of PVA and the interaction term PLGA*PVA. Stirring time was
found to have no significant influence on the size and PDI of PLGA nanoparticles and a stirring
time of 2 h and 15 min, equal to the centre point of the DoE, was selected for the preparation
of PLGA nanoparticles. With increasing concentrations of PLGA and PVA, size increased to
approximately 200 nm. This observation was similar to other studies that reported an increase
in nanoparticle size of PLGA nanoparticles when increased concentrations of PLGA (Sonam et
al., 2014; Tefas et al., 2015) and PVA (Patel et al., 2016; Sonam et al., 2014) were used.
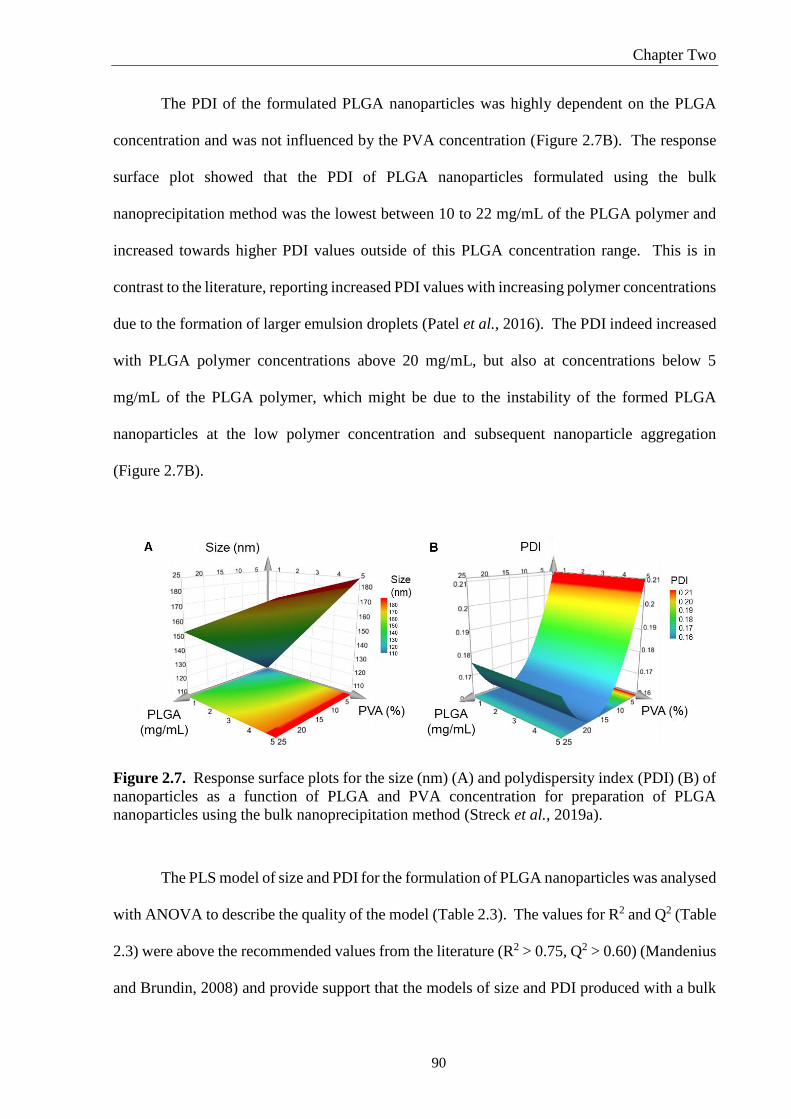
Chapter Two
90
The PDI of the formulated PLGA nanoparticles was highly dependent on the PLGA
concentration and was not influenced by the PVA concentration (Figure 2.7B). The response
surface plot showed that the PDI of PLGA nanoparticles formulated using the bulk
nanoprecipitation method was the lowest between 10 to 22 mg/mL of the PLGA polymer and
increased towards higher PDI values outside of this PLGA concentration range. This is in
contrast to the literature, reporting increased PDI values with increasing polymer concentrations
due to the formation of larger emulsion droplets (Patel et al., 2016). The PDI indeed increased
with PLGA polymer concentrations above 20 mg/mL, but also at concentrations below 5
mg/mL of the PLGA polymer, which might be due to the instability of the formed PLGA
nanoparticles at the low polymer concentration and subsequent nanoparticle aggregation
(Figure 2.7B).
Figure 2.7. Response surface plots for the size (nm) (A) and polydispersity index (PDI) (B) of
nanoparticles as a function of PLGA and PVA concentration for preparation of PLGA
nanoparticles using the bulk nanoprecipitation method (Streck et al., 2019a).
The PLS model of size and PDI for the formulation of PLGA nanoparticles was analysed
with ANOVA to describe the quality of the model (Table 2.3). The values for R2 and Q2 (Table
2.3) were above the recommended values from the literature (R2 > 0.75, Q2 > 0.60) (Mandenius
and Brundin, 2008) and provide support that the models of size and PDI produced with a bulk

Chapter Two
91
nanoprecipitation method were able to fit the data and can be used to predict new data. The p-
values for the regression of the models were < 0.05 and lack of fit p-values were either above
or approximating 0.25, indicating that both models were significant and statistically good at a
95% confidence interval.
Table 2.3. Summary of results for the statistical analysis of the size and polydispersity index
models for the bulk nanoprecipitation method to produce PLGA nanoparticles (Streck et al.,
2019a).
R2 Q2 Regression Lack of fit Significant
Size 0.963 0.806 > 0.001 0.442 Yes
Polydispersity
index 0.869 0.763 0.006 0.234 Yes
The response surface plots for size and PDI of the experimental data were used to select
the parameters to produce optimized nanoformulations. The selected optimized parameters
from the response surface plot for further experiments were a PLGA concentration of 10 mg/mL
and a PVA concentration of 2% (w/v).
Tuning the size and polydispersity of PLGA nanoparticles using microfluidics and
design of experiments
A DoE study was used to optimize the size and PDI of PLGA nanoparticles based on
the microfluidics parameters total flow rate and flow rate ratio (aqueous:organic). The size and
PDI of formulated PLGA nanoparticles obtained at the different levels of the input factors are
summarized in Appendix II. To investigate the influence of flow rate ratio on the size and PDI
of PLGA nanoparticles, the data were fitted with a MLR model to obtain the response surface
plots (Mandenius and Brundin, 2008). The response surface plots showed the relationship
between the input parameters, flow rate ratio and total flow rate, and the response in size and
PDI of the PLGA nanoparticles (Figure 2.8). Data analysis with MODDE 12 GO software

Chapter Two
92
further confirmed the significant factors for size and PDI were the flow rate ratio and the
interaction term flow rate ratio*flow rate ratio. Specifically, the interaction term flow rate
ratio*flow rate ratio revealed that the ratio between the aqueous and organic solutions used for
the preparation of the PLGA nanoparticles is of high importance for both size and PDI. The
response surface plots showed that at higher flow rate ratio (12:1), the PLGA nanoparticles had
a smaller size, whereas at lower flow rate ratio (2:1), the PLGA nanoparticles showed an
increase in size (Figure 2.8A). The PDI was also highly dependent on the flow rate ratio,
showing an increasing PDI with higher flow rate ratio (Figure 2.8B).
Figure 2.8. Response surface plots for the responses size (A) and PDI (B) as a function of the
total flow rate (mL/min) and the flow rate ratio (aqueous:organic) for preparation of PLGA
nanoparticles using the microfluidics method (Streck et al., 2019b).
Therefore, the size and PDI of PLGA nanoparticles formulated with the NanoAssemblr®
Benchtop Device depends strongly on the flow rate ratio between the aqueous and the organic
solutions. Higher flow rate ratio leads to a greater proportion of the aqueous solution with the
organic solution being constantly diluted during mixing in the microchannel. This is
advantageous for the formation of uniform nanoparticles because the polymer molecules
precipitate whilst isolated from each other. Here, the observed PDI increases from 0.060 to
Chapter Two
93
0.150 with higher flow rate ratio, however, since the PDI values are low and indicated a
monodisperse nanoparticle size distribution, this effect was minimal. A DoE study with
liposomes comprising phospholipids prepared using the NanoAssemblr® Benchtop Device
revealed that flow rate ratio had the largest impact on the size of the liposomes prepared
(Kastner et al., 2014). Similarly, Chiesa et al. (2018) reported that the flow rate ratio had a
major influence on the size of PLGA nanoparticles formulated using a PLGA polymer with a
monomer ratio of 75:25 (lactic acid:glycolic acid) and the NanoAssemblr® Benchtop Device.
One-way ANOVA was used to identify the statistical significance of the model to
describe size and PDI. The R2 and Q2 values were calculated to determine how well the model
fits the data and if the model is able to predict new data, respectively. The results of the one-
way ANOVA (Table 2.4) revealed that the models were able to fit the experimental data. The
R2 and Q2 values for both models were higher than the recommended values from the literature
(Mandenius and Brundin, 2008). In addition, the regression p-values for both models are below
0.05 indicating the significance of the models (Table 2.4). The lack of fit test showed that the
p-values were greater than 0.05 for both models and that the models had no statistical error
(Table 2.4). All statistical analysis for the size and PDI models were performed at a 95%
confidence interval. Overall, the models were highly accurate and had a good reliability and
robustness. Consequently, the models were used for the selection of parameters to further
prepare PLGA nanoparticles using microfluidics. A total flow rate of 10 mL/min and a flow
rate ratio of 6:1 was found to yield PLGA nanoparticles with a size of 150 nm and a PDI below
0.150 and these parameters were used for the subsequent preparation of PLGA nanoparticles.

Chapter Two
94
Table 2.4. Summary of results for the statistical analysis of the size and polydispersity index
models for the microfluidics method to produce PLGA nanoparticles (Streck et al., 2019b).
R2 Q2 Regression Lack of fit Significant
Size 0.994 0.992 < 0.001 0.052 Yes
Polydispersity
index 0.929 0.907 0.012 0.499 Yes
Quality assessment of cell-penetrating peptides
The quality of the CPPs obtained from external sources was confirmed using MALDI-
TOF MS. The mass spectrum of the short CPP RRH showed the main RRH peak at a mass to
charge ratio (m/z) of 468.2, which is equivalent the theoretical molecular weight of RRH
(Figure 2.9A). The main peaks of the long linear CPP TAT and the branched CPP bTAT were
observed in the mass spectra with m/z of 1396.9 and 2661.7, respectively, which were
equivalent to their theoretical molecular weight (Figure 2.9B and C). Therefore, the three CPPs
meet the required quality and were used for further studies.

Chapter Two
95
Figure 2.9. Mass spectra of the RRH (A), TAT (B) and bTAT (C) obtained with matrix assisted
laser desorption ionisation-time of flight mass spectrometry analysis.
Chapter Two
96
Characterization of PLGA nanoparticles
Unmodified PLGA nanoparticles prepared using the bulk nanoprecipitation method had
a significantly larger size compared to PLGA nanoparticles prepared using microfluidics (Table
2.5). PLGA nanoparticles formulated with both methods were monodisperse, but the PDI of
the PLGA nanoparticles was higher when prepared with the microfluidics method. Patel et al.
(2016) reported that a decrease in PDI was obtained with an increasing ratio between the
aqueous and organic solutions from 3:1 to 6:1 for the formulation of cromolyn-loaded PLGA
using a bulk nanoprecipitation method. A similar observation was made in the present study
where the bulk nanoprecipitation method with a higher ratio between the aqueous and organic
phase (20:1) yielded nanoparticles with a lower PDI compared to the microfluidics method,
where the ratio between the aqueous and organic phase was 6:1. Using a higher ratio between
the aqueous and organic phase during the preparation of polymeric nanoparticles results in a
greater dilution of the organic polymer solution and the formed nanoparticles are less likely to
aggregate. The higher ratio of aqueous to organic phase in the bulk nanoprecipitation method
did not reduce the size of PLGA nanoparticles and the formation of nanoparticles > 180 nm
might be due to a polymer concentration above the critical polymer concentration (Lepeltier et
al., 2014). A concentration above the critical polymer concentration leads to the presence of
amorphous polymer aggregates, which influence the size of prepared polymeric nanoparticles
(Galindo-Rodríguez et al., 2005). The zeta potential of PLGA nanoparticles prepared with the
two methods was similar (Table 2.5) and a negative surface charge below -20 mV suggested
the presence of negatively charged carboxyl groups on the surface of the PLGA nanoparticles
(Vasconcelos et al., 2015). The TEM micrographs revealed that PLGA nanoparticles with a
spherical shape were obtained with both preparation methods (Figure 2.10A and C).

Chapter Two
97
Table 2.5. Characterization of PLGA and TAT-tagged PLGA nanoparticles prepared with the
optimized parameters for the bulk nanoprecipitation method and with the microfluidics method
(Streck et al., 2019a). Data are means ± SD (n = 3 independent batches). * p-value < 0.05 in
comparison to the respective bulk method.
The size of TAT-tagged PLGA nanoparticles prepared using a post-bulk and post-
microfluidics conjugation approach, increased in comparison to PLGA nanoparticles (Table
2.5), suggesting the presence of the CPP on the surface of the PLGA nanoparticles (Vasconcelos
et al., 2015). The TAT-tagged PLGA nanoparticles produced using the microfluidics method
were significantly smaller than TAT-tagged PLGA nanoparticles produced using the bulk
nanoprecipitation method (Table 2.5). Further, the TAT-tagged PLGA nanoparticles prepared
with the bulk nanoprecipitation method showed a size of 200 nm with a standard deviation
above ± 10 nm indicating a low batch-to-batch reproducibility (Table 2.5). The zeta potential
of TAT-tagged PLGA nanoparticles prepared in this study was between -4 to -6 mV (Table
2.5). Although there was a shift in zeta potential to become less negative after conjugation of
TAT, the overall negative zeta potential indicated that negatively charged carboxyl groups of
the PLGA polymer were still present on the surface and that the surface density of TAT was
not sufficient to achieve a positive surface charge (Gullotti and Yeo, 2012). The surface charge
of the TAT-tagged PLGA nanoparticles in the present study was within the range of -7 to +3
mV published in the literature for TAT conjugated to PLGA-PEG or PLGA nanoparticles with
a size larger than 200 nm (Gartziandia et al., 2016; Xu et al., 2013a). The conjugation
efficiency of TAT to the PLGA nanoparticles was not different after production of the
Size ± SD (nm) PDI ± SD Zeta potential ±
SD (mV)
Conjugation
efficiency (%)
Unmodified PLGA nanoparticles
Bulk 184.0 ± 3.9 0.110 ± 0.007 -23.0 ± 0.8 N/A
Microfluidics 151.2 ± 1.2* 0.149 ± 0.014 -22.2 ± 0.5 N/A
TAT-tagged PLGA nanoparticles
Bulk 201.9 ± 12.5 0.136 ± 0.057 -6.0 ± 3.4 55.3 ± 0.7
Microfluidics 172.4 ± 2.6* 0.164 ± 0.014 -4.3 ± 0.8 56.3 ± 1.0

Chapter Two
98
nanoparticles using the bulk nanoprecipitation or microfluidics methods, with 55.3 ± 0.7% and
56.3 ± 1.0% conjugation efficiency, respectively (Table 2.5).
The morphology of the CPP-tagged PLGA nanoparticles did not change with the
conjugation of TAT to PLGA nanoparticles prepared using the bulk nanoprecipitation or
microfluidics methods (Figure 2.10B and E). Similarly, the conjugation of RRH and bTAT to
PLGA nanoparticles prepared using the microfluidics method did not influence the morphology
of the nanoparticles (Figure 2.10D and F). The microfluidics method was selected for further
investigations of the utility of this method for producing CPP-tagged PLGA nanoparticles due
to the smaller nanoparticle size yielded with better reproducibility by this method.

Chapter Two
99
Figure 2.10. Transmission electron micrographs of unmodified PLGA (A) and TAT-tagged
PLGA nanoparticles (B) prepared using a bulk nanoprecipitation method and unmodified
PLGA (C), RRH- (D), TAT- (E) and bTAT-tagged PLGA nanoparticles (F) prepared using the
microfluidics method (Streck et al., 2019a).

Chapter Two
100
Investigation of binding between CPPs and PLGA polymer
FTIR was used for the physicochemical characterization of the PLGA polymer, the three
different CPPs and PLGA-CPP conjugates. The FTIR spectrum of the PLGA polymer alone
showed the characteristic C=O stretch of the carboxyl group at 1749 cm-1 and C-O ester
stretches between 1167 and 1086 cm-1 (Figure 2.11). The individual CPPs showed bands
related to the amide I and II bond vibration at 1667-1659 and 1541-1560 cm-1, respectively
(Figure 2.11). The amide bond I and II vibrations were associated with the C=O stretching and
N-H bending of the amide bonds between the individual amino acids of the CPPs (Haris and
Severcan, 1999). In addition, C-O ester stretch vibrations from the C-terminal amino acid of
the CPPs were observed between 1202 and 1130 cm-1 (Figure 2.11).
Figure 2.11. Fourier-transform infrared spectra of PLGA polymer, the individual cell-
penetrating peptides (RRH, TAT, bTAT) and PLGA-CPP conjugates (Streck et al., 2019a).
Chapter Two
101
PLGA nanoparticles tagged with CPPs were analysed using FTIR, however, the FTIR
spectrum showed broad and weak FTIR bands, which made assignment of wavenumbers
difficult. Therefore, PLGA-CPP conjugates prepared by covalently attaching CPPs to the
PLGA polymer were used to identify any interactions between the PLGA polymer and the
CPPs. The carboxyl group of the PLGA polymer and the primary amine of the CPPs were
utilized to form a covalent bond using a zero-length crosslinking reaction (Hermanson, 2013c).
Conjugation between the CPPs and PLGA polymer was confirmed with the observation of an
amide I bond vibration in the CPP-PLGA conjugates at approximately 1635 cm-1. The shift of
the amide I bond vibration to a lower wavenumber in comparison to the amide I bond vibration
in RRH, TAT and bTAT (1667-1659 cm-1) provided evidence of the successful formation of a
covalent bond between these two components (Figure 2.11). The FTIR spectra of the PLGA-
CPP conjugates also showed a C=O stretch at 1763 cm-1 for the carboxyl group of the PLGA
polymer indicating that there were unconjugated carboxyl groups present.
Characteristics of CPP-tagged PLGA nanoparticles depends on the CPP architecture
The influence of CPP architecture on the characteristics of CPP-tagged PLGA
nanoparticles was investigated by conjugating CPPs to the surface of PLGA nanoparticles
produced using microfluidics. Unmodified PLGA nanoparticles had an average size of 150 nm
and a zeta potential of -19 mV (Figure 2.12A and B). With conjugation of each of the three
different CPPs, the size of the nanoparticles increased, but the increase in size was independent
of the concentration of CPP (Figure 2.12A). The slight increase in size of the CPP-tagged
PLGA nanoparticles could be attributed to the presence of CPPs. Further, nanoparticles may
increase in size due to swelling caused by the more hydrophilic surface of the CPP-tagged
PLGA nanoparticles compared to unmodified PLGA nanoparticles (Feiner-Gracia et al., 2018).
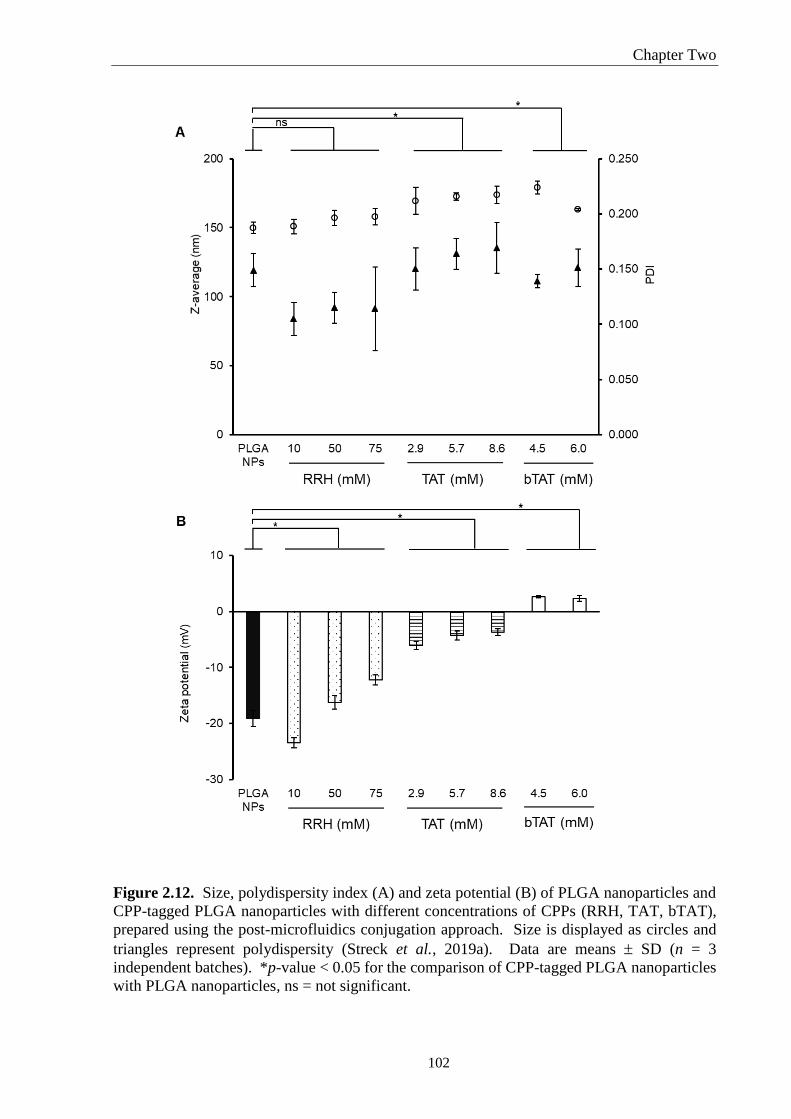
Chapter Two
102
Figure 2.12. Size, polydispersity index (A) and zeta potential (B) of PLGA nanoparticles and
CPP-tagged PLGA nanoparticles with different concentrations of CPPs (RRH, TAT, bTAT),
prepared using the post-microfluidics conjugation approach. Size is displayed as circles and
triangles represent polydispersity (Streck et al., 2019a). Data are means SD (n = 3
independent batches). *p-value < 0.05 for the comparison of CPP-tagged PLGA nanoparticles
with PLGA nanoparticles, ns = not significant.
Chapter Two
103
The influence of different CPP concentrations on the physicochemical characteristics of
CPP-tagged PLGA nanoparticles was evaluated to design nanoformulations with a diameter
below 200 nm and a neutral zeta potential to be suitable for future investigations as oral drug
delivery systems. Studies have shown that PLGA nanoparticles with a size below 200 nm were
taken up by Caco-2 cells to a higher extent compared to larger nanoparticles and that the surface
charge of nanoformulations influences the electrostatic interactions with the negatively charged
cell membrane (Danhier et al., 2012; Gaumet et al., 2009). In the present study, the zeta
potential of RRH-tagged PLGA nanoparticles shifted from -24 to -12 mV with increasing
concentrations of RRH (Figure 2.12B). The conjugation of TAT resulted in the formation of
slightly negative TAT-tagged PLGA nanoparticles with a surface charge of -4 mV (Figure
2.12B). After conjugation of bTAT to the PLGA nanoparticles the zeta potential was slightly
positive (+3 mV, Figure 2.12B). The change in zeta potential can be explained by the
architecture of the CPPs. The CPPs are characterized by a short, long linear and branched
architecture (Figure 2.5). The number of amino acids and positive charges in the peptide
sequence is increased with a longer and more complex architecture. RRH contains two positive
charges in the peptide sequence, whereas TAT and bTAT contain eight and twelve positive
charges, respectively. The increase in positive charges for RRH > TAT > bTAT resulted in
positively charged bTAT-tagged PLGA nanoparticles after the post-microfluidics conjugation
approach. According to the PDI values, all CPP-tagged PLGA nanoparticles showed a
monodisperse size distribution (Figure 2.12A) and no aggregation was observed. This is in
contrast to the literature, where highly negatively or positively charged nanoparticles with a
zeta potential below -30 and above +30 mV are believed to be more stable because of stronger
repulsion forces than between neutral charged nanoparticles with a zeta potential between -10
and +10 mV (Sonam et al., 2014; Tefas et al., 2015; Vasconcelos et al., 2015). This behaviour
was reported for PLGA nanoparticles without surface modifications (Sonam et al., 2014; Tefas

Chapter Two
104
et al., 2015). CPP-tagged PLGA nanoparticles prepared in this study and TAT modified PLGA
nanoparticles with a surface charge of above +20 mV (Vasconcelos et al., 2015) did not show
aggregation. Therefore, it is likely that the surface modification of PLGA nanoparticles with
CPPs caused particle repulsion resulting in no aggregation at neutral surface charges.
Validation of RP-HPLC methods
The RP-HPLC methods for the quantification of the concentration of three CPPs RRH,
TAT and bTAT were validated and representative RP-HPLC chromatograms are shown in
Figure 2.13. The three CPPs were eluted with TFA containing mobile phases over 25 to 37 min
and with an increasing concentration of the organic mobile phase at a rate of 0.5-1% per minute.
The slow increase of the organic mobile phase supports the elution of the peptides as
recommended in the literature (Scanlon and Finlayson, 2004). Further, no interference between
injection peaks, CPP peaks and solvent peaks was observed indicating a good selectivity of the
RP-HPLC methods.

Chapter Two
105
Figure 2.13. Representative RP-HPLC chromatograms of RRH (100 µg/mL) (A), TAT (100
µg/mL) (B) and bTAT (100 µg/mL) (C) eluted with the individual RP-HPLC methods for each
CPP.
Standard curves were obtained for five or six different concentrations of RHH, TAT and
bTAT after plotting the peak area against the concentration of the peptide. The average standard
curve equation (including standard deviation for the slope and y-intercept) for RRH between
50 and 1000 µg/mL was y = 13385x (± 1153) – 28110 (± 7280) (Appendix III), for TAT

Chapter Two
106
between 100 and 1000 µg/mL was y = 40151x (± 417) + 84592 (± 130705) (Appendix III) and
for bTAT between 50 and 7500 µg/mL was y = 17138x (± 46) + 383704 (± 63462) (Appendix
III). The average coefficient of regression (R2) was 1.0000 ± 0.00002, 0.9994 ± 0.0003 and
0.9999 ± 0.0001 for RRH, TAT and bTAT, respectively. The obtained R2 showed good
linearity between the peak area and the concentration of the CPPs. Overall, the accuracy of the
standard curve was not lower than 94% for all three peptides (Table 2.6). The RP-HPLC
chromatograms of RRH, TAT and bTAT showed the consistency of the peak shapes, the
retention time and resolution over the concentration range used to obtain the standard curve
(Appendix IV).
Table 2.6. Measured concentration (µg/mL), coefficient of variation (CV, %) and accuracy of
standard curves obtained for the validation of RP-HPLC methods for RRH, TAT and bTAT.
Data are means ± SD (n = 3).
Concentration
(µg/mL)
Measured concentration
± SD (µg/mL) CV (%)
Accuracy
(%)
RRH 50 50.0 ± 1.7 3.4 100.0
100 100.1 ± 1.2 1.2 100.1
200 201.2 ± 2.2 1.1 100.6
300 299.6 ± 2.0 0.7 99.9
500 498.4 ± 2.1 0.4 99.7
1000 1000.7 ± 0.5 0.1 100.1
TAT 100 94.0 ± 2.9 3.1 94.0
300 309.7 ± 9.4 3.0 103.2
500 509.0 ± 11.0 2.2 101.8
650 657.9 ± 4.7 0.7 101.2
800 806.6 ± 8.6 1.1 100.8
1000 995.4 ± 4.6 0.5 99.5
bTAT 50 52.7 ± 0.7 1.4 105.5
100 97.5 ± 3.9 4.0 97.5
250 249.0 ± 4.1 1.6 99.6
500 500.7 ± 3.3 0.7 100.1
750 750.0 ± 2.1 0.3 100.0
The precision and accuracy of the RP-HPLC methods for the three CPPs were further
evaluated with the measurement of QCs. The QCs were three selected concentrations (low,

Chapter Two
107
medium and high) within the concentration range of the standard curve of each CPP and
measurements were repeated three times within one day and on consecutive days to obtain intra-
and inter-day variability. Good repeatability and intermediate precision of the RP-HPLC
methods for all three CPPs was shown with a coefficient of variation below 2% for the intra-
day and inter-day variability, respectively (Table 2.7) (FDA, 2001). The RP-HPLC methods
for the three CPPs were accurate as the accuracy was greater than 98% for the intra- and inter-
day variability (Table 2.7).
Table 2.7. Measured concentration (µg/mL), coefficient of variation (CV, %) and accuracy for
intra- and inter-day values of quality control samples of RRH, TAT and bTAT for the validation
of RP-HPLC methods. Data are means ± SD (n = 3). QC = quality control sample.
Concentration
QC (µg/mL)
Measured concentration
± SD (µg/mL) CV (%)
Accuracy
(%)
RRH intra-day 75 74.7 ± 1.4 1.8 99.6
250 250.2 ± 2.4 0.9 100.1
750 743.2 ± 6.1 0.8 99.1
RRH inter-day 75 74.7 ± 1.0 1.3 99.6
250 250.2 ± 2.6 1.0 100.1
750 743.2 ± 4.9 0.7 99.1
TAT intra-day 200 196.7 ± 0.7 0.4 98.3
450 451.5 ± 1.5 0.3 100.3
900 894.0 ± 1.1 0.1 99.3
TAT inter-day 200 197.4 ± 2.3 1.2 98.7
450 451.5 ± 3.6 0.8 100.3
900 894.0 ± 8.8 1.0 99.3
bTAT intra-day 75 74.4 ± 1.0 1.4 99.2
350 353.5 ± 4.7 0.6 101.0
600 604.9 ± 2.6 0.4 100.8
bTAT inter-day 75 74.6 ± 0.9 1.1 99.4
350 353.5 ± 3.3 0.9 101.1
600 604.6 ± 6.4 1.1 100.8
The sensitivity of the RP-HPLC methods was determined by LOD and LOQ (Table 2.8).
All three RP-HPLC methods have shown a high sensitivity and the different CPPs and can be
quantified and detected at concentrations below 5.5 µg/mL (Table 2.8).

Chapter Two
108
Table 2.8. The limit of quantification and the limit of detection for the three different RP-
HPLC assays to quantify the concentration of each of the CPPs (Streck et al., 2019a).
Conjugation efficiency of CPPs with different architectures on PLGA nanoparticles
The amount of CPPs binding to the surface of PLGA nanoparticles depends on the
number of available carboxyl groups and the orientation of the CPP. The number of binding
sites on a single PLGA nanoparticle was estimated using the surface area of a PLGA
nanoparticle and the Connolly surface area for the lactic acid monomer. The surface area of the
lactic acid monomer was calculated from the Connolly surface, which describes the surface
area of a molecule that is accessible to a solvent (Connolly, 1983). The surface area of an
average spherical PLGA nanoparticle with a diameter of 155 nm was calculated first (Equation
2-6).
𝑺𝒖𝒓𝒇𝒂𝒄𝒆 𝒂𝒓𝒆𝒂 = 4 × 𝜋 × 𝑟2 = 4 × π × 77.5 𝑛𝑚2 = 𝟕𝟓𝟒𝟕𝟕 𝒏𝒎𝟐 (2-6)
π = 3.14159 r = radius
Further, it was assumed that 50% of the surface area of a PLGA nanoparticle was
occupied by the lactic acid monomer since a PLGA polymer with a monomer ratio of 50:50
(lactic acid:glycolic acid) was used for the preparation of PLGA nanoparticles. Therefore, the
surface area occupied by lactic acid monomer was considered to be 37739 nm2 (75477𝑛𝑚2
2=
37739 𝑛𝑚2). The number of binding sites on a PLGA nanoparticle was estimated by dividing
Limit of quantification (LOQ) µg/mL Limit of detection (LOD) µg/mL
RRH 5.4 1.8
TAT 3.1 1.0
bTAT 2.7 0.9

Chapter Two
109
the surface area of a PLGA nanoparticle occupied by lactic acid by the Connolly surface area
of a lactic acid monomer (Equation 2-7) and was estimated to be greater than 16000.
𝐵𝑖𝑛𝑑𝑖𝑛𝑔 𝑠𝑖𝑡𝑒𝑠 𝑜𝑛 𝑃𝐿𝐺𝐴 𝑁𝑃 = 𝑆𝑢𝑟𝑓𝑎𝑐𝑒 𝑎𝑟𝑒𝑎 𝑜𝑓 𝑙𝑎𝑐𝑡𝑖𝑐 𝑎𝑐𝑖𝑑 𝑜𝑛 𝑃𝐿𝐺𝐴 𝑛𝑎𝑛𝑜𝑝𝑎𝑟𝑡𝑖𝑐𝑙𝑒
𝐶𝑜𝑛𝑛𝑜𝑙𝑙𝑦 𝑠𝑢𝑟𝑓𝑎𝑐𝑒 𝑎𝑟𝑒𝑎 𝑜𝑓 𝑙𝑎𝑐𝑡𝑖𝑐 𝑎𝑐𝑖𝑑 𝑚𝑜𝑛𝑜𝑚𝑒𝑟 (2-7)
𝐵𝑖𝑛𝑑𝑖𝑛𝑔 𝑠𝑖𝑡𝑒𝑠 𝑜𝑛 𝑃𝐿𝐺𝐴 𝑛𝑎𝑛𝑜𝑝𝑎𝑟𝑡𝑖𝑐𝑙𝑒 =37739 𝑛𝑚2
2.328 𝑛𝑚2 = 16211
NP = nanoparticle
The three different CPPs have multiple primary amines that are likely to act as a binding
site depending on their position in the CPP sequence (Figure 2.5). The estimated amount of
CPPs covalently attached to the surface available carboxyl groups of the PLGA nanoparticles
was quantified by calculating the conjugation efficiency. The conjugation efficiency for RRH,
TAT and bTAT depended on the concentration of the CPPs added (Table 2.9). The amount of
RRH conjugated to the PLGA nanoparticles increased by 12-fold when the concentration of
RRH was increased from 10 to 50 mM. A further increase in the RRH concentration to 75 mM
resulted in only a slight decrease in conjugation efficiency, suggesting that at 50 mM there was
a saturation of the surface available carboxyl groups on the PLGA nanoparticles that can react
with the primary amines in RRH. The concentration of TAT conjugated to PLGA nanoparticles
increased in a linear manner with increasing concentrations of the CPP. The bTAT-tagged
PLGA nanoparticles showed a similar concentration of bTAT conjugated to the surface of the
PLGA nanoparticles as TAT (Table 2.9). These results can be related to the structure of the
CPPs. The short CPP RRH showed the highest concentration of CPP on the surface, which is
related to the amount of RRH that was added and the shorter amino acid sequence in comparison
to the other two CPPs. The concentrations of TAT and bTAT conjugated to the PLGA

Chapter Two
110
nanoparticles were similar and the amount of CPP that can be conjugated might be limited
because of the more complex and branched architectures of the CPPs, which induced steric
hindrance between individual CPP molecules. With the conjugation of TAT and bTAT to the
surface of PLGA nanoparticles, it is possible that not all available binding sites would be used
due to the orientation of the CPPs. TAT has primary amines along the amino acid sequence
and can, therefore, bind in an orientation perpendicular to the nanoparticle surface or with a
more tangential orientation in relation to the nanoparticle surface. A tangential orientation of
the CPP may cover other binding sites on the surface of the PLGA nanoparticles since the
tangential orientation covers more surface area. The same applies to the bTAT, which has
primary amino acids in the long linear backbone and the short branches.
Table 2.9. Conjugation efficiencies and the equivalent concentrations of the CPPs tagged to
PLGA nanoparticles (NPs) using different concentrations of CPPs prepared with a post-
microfluidics conjugation approach (Streck et al., 2019a). Data are means SD (n = 3
independent batches). * p-value < 0.05 in comparison to the conjugation efficiency of 8.6 mM
TAT.
CPP concentration
(mM)
Conjugation efficiency
SD (%)
CPP concentration
SD (µM)
RRH-tagged PLGA NPs
10 32.4 ± 0.8 0.25 ± 0.03
50 74.4 ± 4.5 3.10 ± 0.19
75 58.5 ± 6.0 3.66 ± 0.37
TAT-tagged PLGA NPs
2.9 57.6 ± 0.5 0.15 ± < 0.01
5.7 56.3 ± 1.0 0.29 ± 0.01
8.6 55.5 ± 0.8 0.43 ± 0.01
bTAT-tagged PLGA NPs
4.5 79.8 ± 0.3* 0.33 ± < 0.01
6.0 45.4 ± 0.7 0.25 ± < 0.01

Chapter Two
111
Conclusion
The DoE study of the bulk nanoprecipitation method showed that the PLGA polymer
concentration and the surfactant concentration influenced the size and PDI of PLGA
nanoparticles. Using the microfluidics method, the DoE revealed that flow rate ratio has an
influence on the size resulting in the formulation of smaller PLGA nanoparticles at higher flow
rate ratio (aqueous:organic). The successful conjugation of CPPs to the PLGA polymer was
shown by the formation of amide bonds. The CPP architecture determined the physicochemical
characteristics and in particular, the zeta potential of the CPP-tagged PLGA nanoparticles. The
surface charge was tuned from negatively charged RRH- and TAT-tagged PLGA nanoparticles
to slightly positively charged bTAT-tagged PLGA nanoparticles with the introduction of a
branched CPP architecture. The covalent attachment of CPPs to the PLGA polymer was
confirmed with FTIR by identifying the formation of an amide I bond. The amount of CPPs
tagged to PLGA nanoparticles increased with higher amounts of CPP added.
Decoration of nanoparticles with CPPs of different architectures showed the ability to
tune the surface charge of PLGA nanoparticles and further investigation will focus on the
distribution of CPPs on PLGA nanoparticles (Chapter 3) and implication for the interactions
with cells at the nano-bio interface (Chapter 4).

3 Chapter Three
Distribution of cell-penetrating peptides with different architectures on polymeric nanoparticles
Parts of this Chapter have been published as:
S. Streck, A. J. Clulow, H. Mørck Nielsen, T. Rades, B. J. Boyd and A. McDowell (2019). The
distribution of cell-penetrating peptides on polymeric nanoparticles prepared using
microfluidics and elucidated with light scattering techniques. Journal of Colloid and Interface
Science, 555, 438-448.
S. Streck, L. Hong, B. J. Boyd and A. McDowell (2019). Microfluidics for the production of
nanomedicines: Considerations for polymer and lipid-based systems. Pharmaceutical
Nanotechnology, 7, 1-21.

Chapter Three
113
Introduction
Light scattering techniques have been frequently applied for the characterisation of
nanoparticles. Dynamic light scattering is commonly used to evaluate the hydrodynamic
diameter of nanoparticles and is also a standard technique for the quality control of
nanoparticles (Brar and Verma, 2011). To further gain knowledge about the internal structure
and morphology of nanoparticles, radiation from other sources such as X-rays and electrons
can be utilized and the application of X-ray scattering and electron microscopy for polymeric
nanoparticles is further described in this Chapter.
Characterisation of polymeric nanoparticles using small angle X-ray scattering
The shape and structure of nanoparticles and biomacromolecules can be probed by the
utilization of X-ray techniques (Kikhney and Svergun, 2015; Li et al., 2016). Small angle X-
ray scattering (SAXS) is a contrast method that uses X-rays to generate scattering patterns based
on the electron density of a sample (Li et al., 2016; Putnam et al., 2007). The applications of
SAXS include the structural characterisation of lipid crystalline nanoparticles (Hong et al.,
2015), micelles (Sanada et al., 2013), polymeric nanoparticles (Jäger et al., 2018) and proteins
(Zhang et al., 2007) in solution. Further, SAXS can be used for time-resolved studies to monitor
kinetic processes like the formation of liquid crystalline structures during the digestion of milk
(Clulow et al., 2018) or the assembly of nanoparticles in a microfluidic device (Ghazal et al.,
2017).
Synchrotron facilities can provide X-rays with higher energy for SAXS and longer
sample-to-detector lengths than lab-based instruments, which is important for the investigation
of nanoparticles with a diameter larger than 100 nm using SAXS. A high quality of X-ray beam
Chapter Three
114
used at synchrotron facilities is ensured as the radiation is generated by the acceleration of
electrons close to the speed of light (Boyd and Rades, 2016). To obtain the scattering profile
of a sample, the sample solution is placed in a quartz capillary in the X-ray beam, illuminated
with the X-ray beam and the scattered X-rays are recorded using a diode array detector (Figure
3.1A) (Boyd and Rades, 2016). For samples measured in solution, the scattering pattern of the
pure solvent is obtained first and subtracted from the scattering pattern of the samples (Kikhney
and Svergun, 2015). With this approach, the influence of the solvent is removed and the
scattering pattern of the sample remains for further evaluation of the shape and size of the
sample (Kikhney and Svergun, 2015; Putnam et al., 2007). Generally, particles are randomly
distributed in solution and this behaviour results in an isotropic or radially scattering pattern
(Putnam et al., 2007), which is recorded and averaged by the 2D detector and plotted as a 1D
scattering curve with the scattering intensity I (q) on the y-axis against the scattering vector, q,
on the x-axis (Figure 3.1B) (Kikhney and Svergun, 2015).
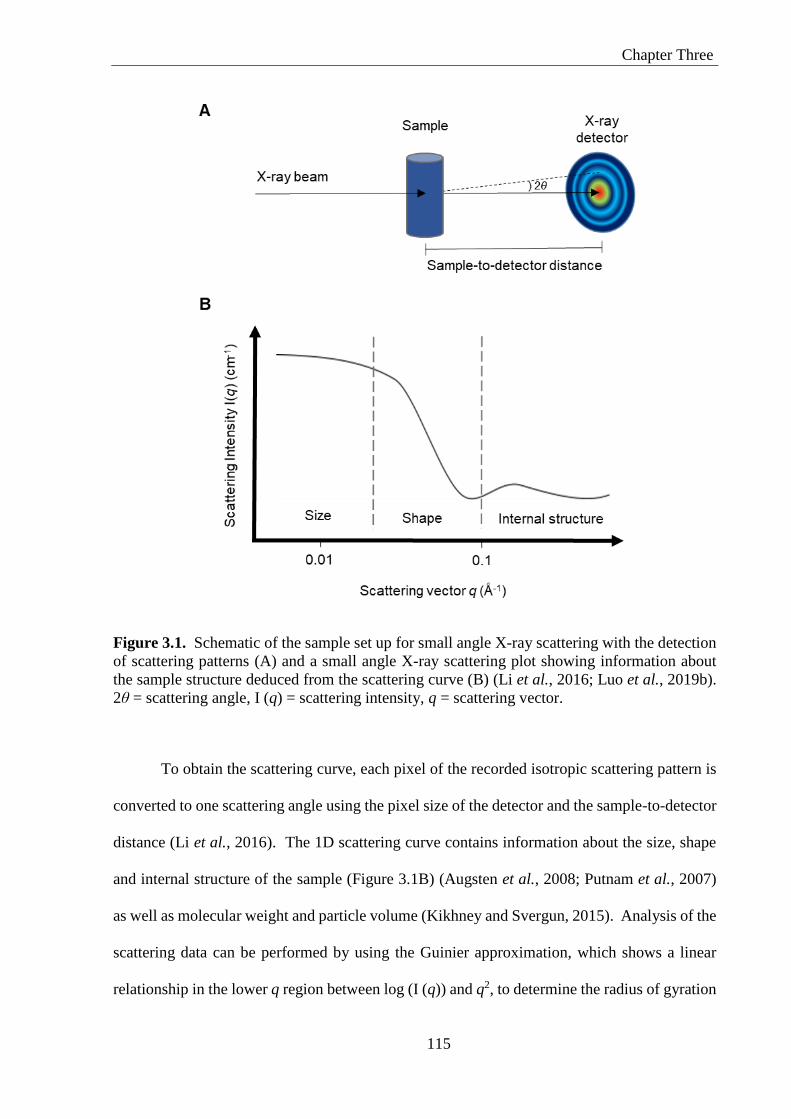
Chapter Three
115
Figure 3.1. Schematic of the sample set up for small angle X-ray scattering with the detection
of scattering patterns (A) and a small angle X-ray scattering plot showing information about
the sample structure deduced from the scattering curve (B) (Li et al., 2016; Luo et al., 2019b).
2θ = scattering angle, I (q) = scattering intensity, q = scattering vector.
To obtain the scattering curve, each pixel of the recorded isotropic scattering pattern is
converted to one scattering angle using the pixel size of the detector and the sample-to-detector
distance (Li et al., 2016). The 1D scattering curve contains information about the size, shape
and internal structure of the sample (Figure 3.1B) (Augsten et al., 2008; Putnam et al., 2007)
as well as molecular weight and particle volume (Kikhney and Svergun, 2015). Analysis of the
scattering data can be performed by using the Guinier approximation, which shows a linear
relationship in the lower q region between log (I (q)) and q2, to determine the radius of gyration
Chapter Three
116
(Rg) as a measurement of particle size (Putnam et al., 2007). In the higher q regions (q > 0.05
Å-1), the Porod approximation, where the scattering shows a decay of the scattering curve (q-4),
can be observed (Li et al., 2016). The Porod approximation is based on the assumption that the
electron density of two compounds in a two-phase system, e.g. particles and buffer, is different
(Ruland, 1971). The higher q regions provide information for surface area calculation of
particular systems of inorganic, polymeric and porous materials (Li et al., 2016). The pair
distribution function p(r) is calculated by Fourier transformation of the scattering data and based
on the distance between the electrons of the material within the sample, and information about
the diameter and shape e.g. of particles can be obtained (Kikhney and Svergun, 2015; Putnam
et al., 2007).
In order to obtain high quality data with SAXS, it is crucial to consider the influence of
the X-ray exposure time on the sample and the influence of the concentration of the sample on
the scattering profile. Using synchrotron-based SAXS, the exposure time can vary from
fractions of a second to minutes, and shorter exposure reduces the risk of radiation damage to
the sample (Kikhney and Svergun, 2015). Further, the use of a flow cell instead of a static
solution and reduced X-ray energy avoids radiation damage (Jeffries et al., 2015). The
concentration of the sample can be increased in SAXS experiments to gain a better signal-to-
noise ratio due to higher scattering intensities (Kikhney and Svergun, 2015). One drawback of
high sample concentrations, however, is the decrease in the inter-particle distance and therefore
the possibility of an unwanted contribution of scattering to the scattering in the low q region,
influencing the radius of gyration (Franke et al., 2012; Kikhney and Svergun, 2015).

Chapter Three
117
Small angle neutron scattering (SANS) and SAXS are complementary scattering
techniques utilizing either the scattering of neutrons or electrons (Di Cola et al., 2016). Similar
to SAXS, SANS is a non-invasive technique that can also be used to investigate structure and
interactions of soft matters including liposomes (Hofmann et al., 2010), polymeric
nanoparticles (Desgouilles et al., 2003), polymeric micelles (Yang et al., 2015), core-shell
nanoparticles with a metallic core and polymeric shell (Luo et al., 2019b) and cyclic peptide-
polymer conjugates (Koh et al., 2016). Neutrons interact with the atomic nucleus of elements
and result in a scattering contrast that varies greatly between elements and isotopes (Lopez et
al., 2018). The significant scattering contrast between hydrogen and its isotope deuterium is
particularly important and deuterated solvents are often used in SANS experiments (Grillo,
2008). The contrast of a system, e.g. polymeric nanoparticles in a dispersant, can be varied by
deuteration of specific molecules or by changing the amount of D2O and H2O in the solvent
mixture during preparation (Di Cola et al., 2016; Yang et al., 2015).
The combined application of SANS and SAXS can aid to acquire data on the
hydrophobic core and the hydrophilic shell of colloids including micelles (Manet et al., 2011)
and liposomes (Di Cola et al., 2016). SANS can provide information about the hydrophobic
structure, whereas SAXS is sensitive towards polar groups. Therefore, in this thesis SAXS was
used to study the distribution of gold labelled CPPs. The used CPPs contain polar and charged
amino acids in their sequence leading to increased hydrophilicity on the surface of polymeric
nanoparticles after conjugation.
Chapter Three
118
Imaging of nanoparticles to reveal morphology
Imaging of viral particles, nanoparticles and cells is achieved by using microscopic
techniques including electron microscopy and atomic force microscopy as both techniques offer
nanoscale resolution (Barreto-Vieira and Barth, 2015; Ruozi et al., 2011; Ruozi et al., 2014;
Tantra and Knight, 2011; Ye et al., 2015). Scanning and transmission electron microscopes are
most commonly used for the visualisation of individual nanoparticles to obtain information
about size and shape (Reifarth et al., 2018).
Scanning electron microscopy (SEM) is used for the investigation of shape and
morphology of micro- and nanoparticles (Bootz et al., 2004; Dubes et al., 2003; Zhai et al.,
2015; Zhou et al., 2019). In particular, the porosity of microparticles and morphological
changes of microparticles during drug release (over a period of days to weeks) can be monitored
using SEM (Gao et al., 2016; Zhai et al., 2015). Before SEM analysis, the particle samples are
dried and sputter coated with metals such as gold or palladium to generate contrast (Bootz et
al., 2004; Gao et al., 2016; Zhai et al., 2015). These two preparations steps are required,
however also a major disadvantage as changes in the properties of the particles can occur (Bootz
et al., 2004).
TEM is used to generate information about the morphology of individual polymeric
nanoparticles in a label-free manner (Augsten et al., 2008; Reifarth et al., 2018; Saarinen et al.,
2019). Using TEM, the electron beam is focused onto the sample and unscattered electron
waves undergo a change in their wave amplitude and phase after passing through the sample
(Tantra and Knight, 2011; Winey et al., 2014). The short wavelength electron beam originates
from an electron source that is operated under vacuum (de Jonge and Ross, 2011; Miao et al.,

Chapter Three
119
1999) and due to the short wavelength of the electron beam, a high resolution below 20 nm and
down to 1 nm can be achieved (Pauw, 2013; Winey et al., 2014).
Sample preparation has an influence on the quality of the specimen and it is crucial to
obtain high quality images with sufficient contrast between nanoparticles in the sample and the
background (Ruozi et al., 2014). Samples for TEM analysis are prepared by spotting a drop of
nanoparticle suspension onto cooper grids (Bohrey et al., 2016; Winey et al., 2014). Polymers
are known to generate a low contrast and therefore, heavy metals like osmium tetroxide
(Chelopo et al., 2016), phosphotungstic acid (Bohrey et al., 2016) or uranyl acetate (Chelopo
et al., 2016; Ruozi et al., 2014) are used for negative staining of polymeric nanoparticles to
enhance the contrast between nanoparticles and background to facilitate the observation of
nanoparticle features.
One of the main drawbacks of TEM is the presence of artefacts, which can be caused
by drying of the nanoparticles during sample preparation (Franken et al., 2017) and damage of
specimen through long exposure time to the electron beam (Tantra and Knight, 2011).
Therefore, it is important to critically examine obtained TEM micrographs and incorporate
other scattering techniques to complement the TEM data. Further, investigation of
nanoparticles with TEM is limited by the fact that not all nanoparticles in the sample are
analysed and typically only representative images of the whole sample are reported (Li et al.,
2016).

Chapter Three
120
Functionalisation of polymeric nanoparticles using microfluidics
As discussed earlier, functionalisation of nanoparticles with specific moieties for targeted
and enhanced delivery of therapeutics to specific cells can be achieved using microfluidics
(Kamaly et al., 2016; Kolishetti et al., 2010). Conjugation of the polymer with a functional
moiety can occur at different steps in the preparation process, namely before, during or after
microfluidics preparation of polymeric nanoparticles (Figure 3.2). The functionalisation of
polymeric nanoparticles performed in a pre-microfluidics approach makes use of polymer-
ligand conjugates as a starting material (Figure 3.2A) (Kamaly et al., 2016; Liu et al., 2010;
Valencia et al., 2013). This approach has been used to achieve decoration of polymeric
nanoparticles with targeted ligands including collagen IV (Kamaly et al., 2016), argininylglycyl
aspartic acid (RGD) (Liu et al., 2010) and the LIG ligand (Valencia et al., 2013) for different
therapeutic conditions including cancer and atherosclerosis. Liu et al. (2010) formulated RGD-
targeted supramolecular nanoparticles for targeting the αvβ3 integrin receptor of tumour cells
and an approximately 60% higher uptake was observed in αvβ3 receptor positive cells in
comparison to αvβ3 receptor negative cells. In addition, ligand density has been shown to
influence cellular uptake of polymeric nanoparticles in prostate cancer cell lines that
overexpress the prostate-specific membrane antigen (Valencia et al., 2013). The use of
increasing amounts of PLGA-PEG-LIG conjugates from 14 to 40 mol% of targeted polymeric
nanoparticles increased cell uptake by approximately 35% in comparison to non-targeted
polymeric nanoparticles (Valencia et al., 2013).

Chapter Three
121
Figure 3.2. Functionalisation of polymeric nanoparticles using a pre-microfluidics (A)
(Kamaly et al., 2016; Liu et al., 2010; Valencia et al., 2013), an in situ microfluidics (B) or a
post-microfluidics (C) (Kolishetti et al., 2010) conjugation approach (Streck et al., 2019c).
The modality for producing functionalised nanoparticles using microfluidics discussed in
the literature involves mainly the formation of nanoparticles from functionalised polymer
material during the mixing process. An alternative strategy for the formulation of surface-
modified polymeric nanoparticles is to functionalise the nanoparticles after production in the
microfluidic device in a post-microfluidics conjugation approach (Figure 3.2C). In order to
deliver anticancer drugs to prostate cancer cells, Kolishetti et al. (2010) functionalised the
surface of PLGA-PEG nanoparticles with a targeting ligand (A10-Aptamer) and showed
accumulation of the targeted nanoparticles in the endosomes of prostate cancer cells after

Chapter Three
122
endocytosis. The attachment of the targeting ligand was performed using a zero-length
crosslinking reaction with a carbodiimide (Kolishetti et al., 2010). Such zero-length
crosslinking reactions are commonly used for the surface modification of polymeric
nanoparticles (Yadav et al., 2011) and were described in Chapter 2, Section 2.1.4.
The above mentioned studies illustrate that functionalised polymeric nanoparticles have
the potential to achieve a targeted delivery approach for therapeutics. The conjugation reaction
is commonly performed in pre- and post-microfluidics conjugation approaches and the
possibility of microfluidic devices to act as a reaction vessel for functionalisation of polymeric
nanoparticles has not yet been fully exploited. Theoretically, the conjugation reaction between
the polymer and the moieties used for functionalisation of polymeric nanoparticles can be
translated from a pre- or post-microfluidics reaction to an in situ microfluidics reaction (Figure
3.2B). For the translation of the conjugation reaction into the microfluidic channel, the
conjugation reaction must be first evaluated for its suitability. Performing the conjugation
reaction in the microchannel relies on the formation of a covalent bond between the two
components and that the formation of nanoparticles can occur simultaneously. The conjugation
needs to occur almost immediately since the mixing time in the microchannel is greatly reduced
compared to a traditional bulk approach. It is proposed here that with a successful conjugation,
the functionalisation moiety will be present on the surface and free functionalisation moieties
might be encapsulated in the polymeric matrix of the nanoparticles. In this thesis, the in situ
functionalisation approach is applied to the preparation of CPP-tagged PLGA nanoparticles for
the first time. The formulated CPP-tagged PLGA nanoparticles are evaluated with different
advanced characterisation techniques including SAXS to get new insight on the influence of
the preparation method on the physicochemical properties of the formulated nanoparticles.

Chapter Three
123
Chapter aims
The aims of this study were to determine the utility of microfluidics for the production
of CPP-tagged PLGA nanoparticles and the influence and distribution of CPP architecture on
the nanoformulations after preparation. PLGA nanoparticles were surface modified with CPPs
of three different architectures (short, long linear and branched) using two different conjugation
approaches, a post-microfluidics and an in situ microfluidics conjugation approach. The
influence of the different conjugation approaches on the distribution of CPPs was investigated
using imaging techniques and X-ray scattering.

Chapter Three
124
Materials
Gold nanoparticles (5 nm Gold NanoSpheres, COOH-PEGylated) referred to as AuNPs
were supplied by Nanohybrids (Austin, TX, USA). The stock solution of AuNPs used in this
work had the following characteristics as quoted by the manufacturer: diameter = 4.7 ± 0.8 nm;
surface plasmon resonance peak = 514 nm; particle concentration = 5.3 × 10¹⁵ mL-1; Au mass
concentration = 6.3 mg mL-1; pH = 7.0; particle surface = Carboxy-PEG 5 kDa, zeta potential
= -6.5 mV.
All other ingredients and peptides required for the preparation of the nanoformulations
were used as listed in Chapter 2.
Methods
In situ microfluidics conjugation for the preparation of CPP-tagged PLGA
nanoparticles and Au-labelled CPP-tagged nanoparticles
For the in situ conjugation of CPPs to PLGA nanoparticles, a method was adapted from
Karve et al. (2011). The organic PLGA solution (10 mg/mL in ACN) was first activated by
adding 250 µL of EDC solution (1.5 mM in ultra-pure water) and 250 µL of sulfo-NHS solution
(2 mM in ultra-pure water) dropwise under gentle stirring, which was continued for 30 min at
room temperature. The mixture was precipitated by transfer into ultra-pure water and spun in
a centrifuge at 3150 g for 20 min at 8°C. The supernatant was removed and the pellet was
dissolved at a concentration of 10 mg/mL in ACN. 100 µL of CPPs (containing either 75 mM
RRH, 8.6 mM TAT or 4.5 mM bTAT) were mixed with 1 mL of 2% (w/v) PVA solution. For
the in situ microfluidics conjugation approach, a higher concentration of the CPP RRH was

Chapter Three
125
selected due to a higher conjugation efficiency in comparison to the post-microfluidics
conjugation approach.
For the preparation of Au-labelled CPP-tagged PLGA nanoparticles, each CPP solution
was incubated for 2 h with a 0.016 mM AuNPs solution (equals a 1-360 fold lower
concentration than the expected conjugation efficiency of each CPP) prior to the microfluidics
preparation. The label-free CPP solutions and the Au-labelled CPP solutions were mixed with
the activated organic solution of PLGA using the NanoAssemblr® Benchtop Device with a total
flow rate of 10 mL/min and a flow rate ratio of 6:1. The Au-labelled CPP-tagged PLGA
nanoparticles were kept in the fridge at 4°C until further required (Figure 3.3A, (ii)). The label-
free CPP-tagged PLGA nanoparticles (Figure 3.3A, (i)) were separated by ultra-centrifugation
at 42800 g for 15 min at 4°C to remove excess of ACN and unconjugated CPPs. The
supernatant was kept for RP-HPLC analysis and the nanoparticle pellet was re-suspended in
100 µL of ultra-pure water and stored at 4°C until required.

Chapter Three
126
Figure 3.3. Comparison of the in situ microfluidics (A) and the post-microfluidics (B)
conjugation approaches for the formulation of Au-labelled CPP-tagged PLGA nanoparticles.
Label-free CPP-tagged PLGA nanoparticles (i) and Au-labelled CPP-tagged PLGA
nanoparticles (ii) were produced using the in situ microfluidics (A) conjugation approach. The
microchannel diagram, with the red box indicating the herringbone structure, was modified
from Belliveau et al. (2012) (Streck et al., 2019b). SHM = staggered herringbone mixer, ACN
= acetonitrile.
Conjugation efficiency of CPPs after in situ microfluidics preparation of CPP-tagged
PLGA nanoparticles
The conjugation efficiency of the three CPPs (RRH, TAT and bTAT) to nanoparticles
was obtained indirectly from the amount of CPP in the supernatant after preparation of CPP-
tagged PLGA nanoparticles using the in situ conjugation approach. The supernatant was
collected after in situ microfluidics preparation as described above for label-free CPP-tagged
PLGA nanoparticles. The RP-HPLC methods for the quantification of the CPP concentrations
were described in Chapter 2, Section 2.3.9.

Chapter Three
127
Post-microfluidics conjugation for the preparation of CPP-tagged PLGA nanoparticles
and Au-labelled CPP-tagged PLGA nanoparticles
PLGA nanoparticles were prepared using the NanoAssemblr® Benchtop Device and
surface modified with RRH (50 mM), TAT (8.6 mM) and bTAT (4.5 mM) as described in
Chapter 2, Section 2.3.5 and 2.3.6, respectively. After removal of free CPPs by ultra-
centrifugation, the nanoparticle pellet was re-suspended and diluted with 1 mL HEPES buffer
(0.025 M, pH 6.11). For the preparation of Au-labelled CPP-tagged PLGA nanoparticles, a
suspension of the AuNPs was added to the CPP-tagged PLGA nanoparticles at a 1.5-2 fold
lower concentration than the expected conjugation efficiency of each CPP (RRH: 1.6 mM
AuNPs, TAT: 0.24 mM AuNPs and bTAT: 0.19 mM AuNPs) and incubated overnight with
gentle stirring (Figure 3.3B).
Characterization of nanoformulations
The Z-average diameter, PDI and zeta potential of the nanoformulations were measured
using DLS and laser Doppler electrophoresis as described previously in Chapter 2, Section
2.3.7.
Transmission electron microscopy
TEM micrographs were recorded to investigate the morphology of the Au-labelled CPP-
tagged PLGA nanoparticles. The Au-labelled CPP-tagged PLGA nanoparticles were prepared
using either the post-microfluidics or the in situ microfluidics conjugation approach as
described in Sections 3.3.1 and 3.3.3. TEM grids (Electron Microscope Science, Hatfield, PA
USA) were made hydrophilic by glow discharge in air for 1 min (Aebi and Pollard, 1987).

Chapter Three
128
Solutions of the Au-labelled CPP-tagged PLGA nanoparticles (10 µL) were spotted onto a 300
mesh copper grid and air-dried for 30-60 s before the excess solution was blotted with Whatman
filter paper Number 1. The samples were viewed with a Technai F30 (FEI, Eindhoven, The
Netherlands) and a Philips CM 100 Bio TWIN TEM (Philips Electron Optics, Eindhoven, The
Netherlands).
Small angle X-ray scattering
The SAXS/WAXS beamline at the Australian Synchrotron (ANSTO, Clayton,
Australia) was used to investigate the distribution of Au-labelled CPPs with different
architectures conjugated to PLGA nanoparticles produced using either the post-microfluidics
or in situ microfluidics conjugation approach. The samples were measured in a quartz capillary
mounted in the X-ray beam with a wavelength of the 0.954 Å (photon energy 13 keV). Sample-
to-detector distances of 1.53 m and 7.33 m were used to cover a scattering vector q range of
0.003 < q < 0.665 Å-1. The scattering vector q is given by 𝑞 = (4𝜋
𝜆) sin 𝜃, where 𝜆 is the X-ray
wavelength and 2θ is the scattering angle. 2D scattering profiles were acquired during X-ray
exposures between 0.1-1 s using a Pilatus 1 M detector. The obtained scattering patterns were
radially integrated into plots of I (q) versus q using the in-house-developed software package
ScatterBrain (Vithani et al., 2017).
Statistical analysis
Students t-tests were performed to make a comparison between single groups and
obtained p-values were statistically significant at p < 0.05.

Chapter Three
129
Results and Discussion
Conjugation approaches for preparation of CPP-tagged PLGA nanoparticles
The main difference between the post-microfluidics and the in situ microfluidics
conjugation approach to formulate CPP-tagged PLGA nanoparticles is the time point when the
PLGA polymer was activated by EDC/sulfo-NHS to enable the conjugation reaction with the
CPPs. In the post-microfluidics conjugation approach, the free carboxyl groups of the PLGA
polymer were activated after formation of the nanoparticles. Using this approach, the
conjugation reaction with the CPPs was limited to the surface available carboxyl groups. In the
in situ microfluidics conjugation approach, the PLGA polymer was activated before formation
of the nanoparticles. The activated carboxyl groups react with the CPPs during mixing within
the microchannel and consequently, the CPPs should have been distributed throughout the
PLGA nanoparticles.
Characteristics of CPP-tagged PLGA nanoparticles depends on the CPP architecture
The in situ microfluidics conjugation approach was used to formulate PLGA
nanoparticles and CPP-tagged PLGA nanoparticles. Unmodified PLGA nanoparticles were
monodisperse and showed an average size of 130 nm and a negative surface charge of -18 mV
(Figure 3.4). In comparison to the unmodified PLGA nanoparticles prepared using
microfluidics in Chapter 2 (Section 2.4.6), unmodified PLGA nanoparticles prepared using the
in situ microfluidics conjugation approach showed a smaller size, which might be related to the
use of the activated polymer for the preparation of PLGA nanoparticles. A possible explanation
is that the reactive sulfo-NHS ester intermediate on the activated PLGA polymer interferes with
the nanoprecipitation process. The unmodified PLGA nanoparticles were formulated for
control purposes only as the reactive sulfo-NHS ester intermediate may lead to unwanted

Chapter Three
130
reactions. CPP-tagged PLGA nanoparticles had a size between 159 and 174 nm, depending on
the CPP used, and showed a monodisperse size distribution with a PDI < 0.155 after preparation
with the in situ microfluidics conjugation approach (Figure 3.4A). Both preparation methods
resulted in CPP-tagged PLGA nanoparticles with a similar size and polydispersity (Chapter 2,
Section 2.4.6). The bTAT-tagged PLGA nanoparticles were only tested using one
concentration of bTAT (4.5 mM) for the in situ microfluidics conjugation approach as the
results from the post-microfluidics conjugation approach with 4.5 and 6 mM bTAT did not
reveal a difference in size or zeta potential (Chapter 2, Figure 2.12).
The zeta potential of RRH-tagged PLGA nanoparticles decreased from -18 to -8 mV
with increasing concentrations of RRH (Figure 3.4B). The conjugation of TAT resulted in
slightly negatively charged PLGA nanoparticles with a surface charge between -4 to -2 mV
(Figure 3.4B). The CPP-tagged PLGA nanoparticles prepared with the branched CPP, bTAT,
showed a positive zeta potential of +4 mV after preparation using the in situ microfluidics
conjugation approach (Figure 3.4B). A similar change in zeta potential after preparation of
CPP-tagged PLGA nanoparticles was also observed using the post-microfluidics conjugation
approach in Chapter 2, Section 2.4.6 and can be explained by the incorporation of more positive
charges in the CPP sequence with a more complex architecture of the CPPs.
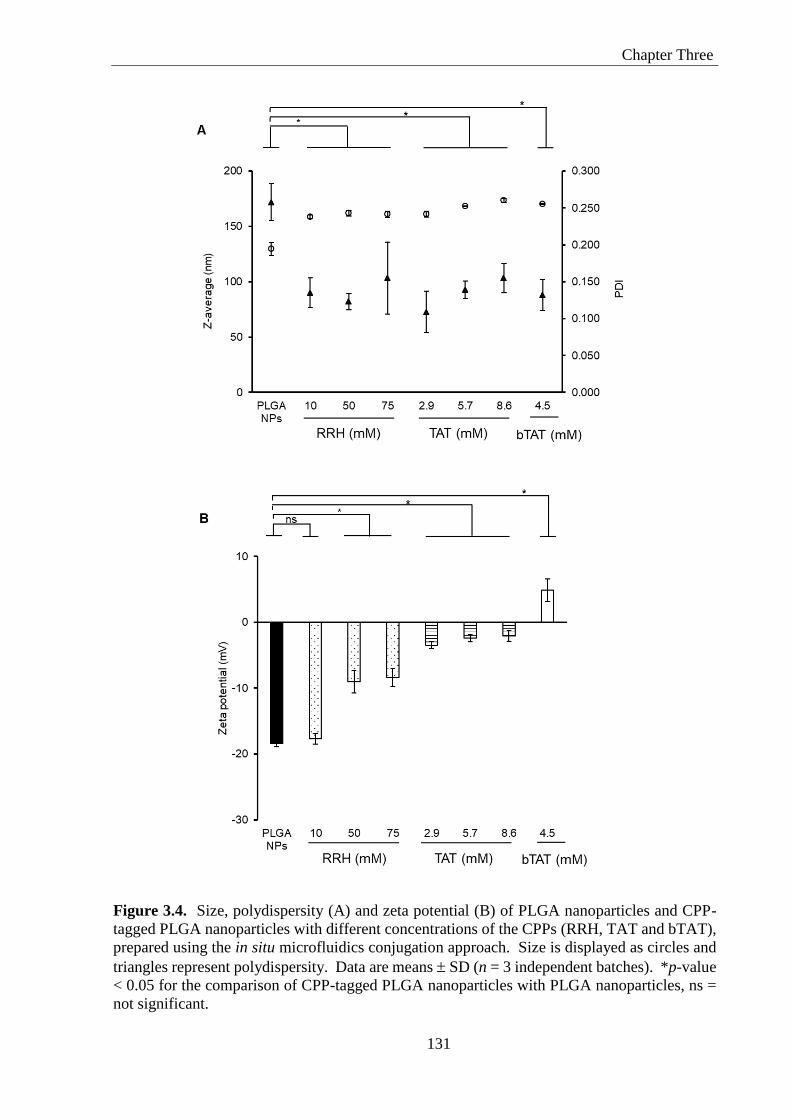
Chapter Three
131
Figure 3.4. Size, polydispersity (A) and zeta potential (B) of PLGA nanoparticles and CPP-
tagged PLGA nanoparticles with different concentrations of the CPPs (RRH, TAT and bTAT),
prepared using the in situ microfluidics conjugation approach. Size is displayed as circles and
triangles represent polydispersity. Data are means SD (n = 3 independent batches). *p-value
< 0.05 for the comparison of CPP-tagged PLGA nanoparticles with PLGA nanoparticles, ns =
not significant.

Chapter Three
132
Conjugation efficiency of CPPs with different architecture on PLGA nanoparticles
The conjugation efficiency of CPPs tagged to PLGA nanoparticles using the in situ
microfluidics conjugation approach was dependent on the concentration of CPP added (Table
3.1). Conjugation efficiencies of RRH increased from 73% to 91% with higher amounts of
RRH added. For RRH-tagged PLGA nanoparticles, the amount of RRH associated to the
nanoformulation was almost double using the in situ microfluidics conjugation approach in
comparison to the post-microfluidics conjugation approach at a RRH concentration of 75 mM
(Chapter 2, Section 2.4.8). The bTAT-tagged PLGA nanoparticles showed a high conjugation
efficiency (> 80%) using the in situ microfluidics conjugation approach. The conjugation
efficiency and the amount of bTAT conjugated to the PLGA nanoparticles using the in situ
microfluidics approach were similar compared to the post-microfluidics conjugation (Chapter
2, Section 2.4.8). The higher conjugation efficiencies for RRH- and bTAT-tagged PLGA
nanoparticles prepared using the in situ microfluidics conjugation approach compared to the
post-microfluidics conjugation approach suggested encapsulation of RRH and bTAT within the
formulated CPP-tagged PLGA nanoparticles. Higher conjugation efficiencies were observed
as RRH and bTAT were encapsulated as well as present on the surface of the PLGA
nanoparticles. The conjugation efficiency of TAT using the in situ microfluidics conjugation
approach increased with higher amounts of TAT added, but was overall low and ranged
between 15% to 29%. The conjugation efficiency of TAT was lower, compared to the post-
microfluidics conjugation approach (Chapter 2, Section 2.4.8) and the other CPPs investigated.
One possible reason for the low conjugation efficiency of TAT could be related to the amino
acids present in the peptide sequence of the investigated CPPs. RRH and bTAT both contain
the amino acid histidine in their peptide sequence and histidine has been shown to bind to ethyl-
cyanoacrylate monomer units during preparation of PECA nanoparticles (Kafka et al., 2009).
The lack of histidine in the TAT peptide sequence might be a reason for the lower conjugation

Chapter Three
133
efficiency as fewer interactions with the PLGA polymer occur during the formulation of the
nanoparticles in the microchannel.
Table 3.1 Conjugation efficiencies and the equivalent concentration of the CPPs tagged to
PLGA nanoparticles (NPs) using different concentrations of CPPs prepared with the in situ
microfluidics conjugation approach. Data are means SD (n = 3 independent batches). * p <
0.05 in comparison to the CPP concentration of 10 and 50 mM RRH, *a p < 0.05 in comparison
to the CPP concentration of 2.9 and 5.7 mM TAT, *b p < 0.05 in comparison to the CPP
concentration of 8.6 mM TAT.
CPP concentration
(mM)
Conjugation efficiency
(%) SD
CPP concentration
(µM) SD
RRH-tagged PLGA NPs
10 73.2 ± 3.5 0.67 ± 0.03
50 83.2 ± 1.1 3.78 ± 0.05
75 91.0 ± < 0.1 6.20 ± < 0.01*
TAT-tagged PLGA NPs
2.9 14.7 ± 3.3 0.04 ± 0.01
5.7 17.5 ± 1.6 0.09 ± 0.01
8.6 28.7 ± 0.5 0.22 ± < 0.01*a
bTAT-tagged PLGA NPs
4.5 84.2 ± 0.3 0.35 ± < 0.01*b
Characterization of Au-labelled CPP-tagged PLGA nanoparticles
CPP-tagged PLGA nanoparticles were labelled with gold nanoparticles (AuNPs) to
facilitate subsequent structural analysis using TEM and SAXS. The spherical AuNPs had a
nominal diameter of 4.7 nm and had a zeta potential of -6.5 mV due to the surface decoration
with PEG groups. The Au-labelled CPP-tagged PLGA nanoparticles were produced using each
of the different conjugation approaches previously described. The addition of AuNPs to CPP-
tagged PLGA nanoparticles did not change the average size (Table 3.2) as it remained between
140-180 nm, which was comparable with the size range of the Au label-free CPP-tagged PLGA
nanoparticles prepared using post-microfluidics and in situ microfluidics conjugation approach
(Figure 3.4 and Chapter 2, Figure 2.12). The addition of AuNPs to CPP-tagged PLGA
nanoparticles prepared using the post-microfluidics and the in situ microfluidics conjugation

Chapter Three
134
approach resulted in an increase in polydispersity, which might be related to the presence of
free AuNPs. The zeta potential of the CPP-tagged PLGA nanoparticles was, however,
influenced by the addition of AuNPs and resulted in a negative surface charge between -12 and
0 mV (Table 3.1 and Table 3.2) indicating electrostatic interactions between the positively
charged CPPs and the negatively charged AuNPs. Using the in situ microfluidics conjugation
approach, the surface charge of the Au-labelled CPP-tagged PLGA nanoparticles was less
negative due to the encapsulation of the AuNPs within the polymeric nanoparticles, which
cannot contribute to the overall surface charge.
Table 3.2. Characterization of Au-labelled CPP-tagged PLGA nanoparticles used for
transmission electron microscopy and small angle X-ray scattering analysis prepared using the
in situ microfluidics or post-microfluidics conjugation approach (Streck et al., 2019b). Data
are means ± SD (n = 3). * p < 0.05 in comparison to bTAT-tagged PLGA NPs prepared with
the in situ microfluidics conjugation approach.
Sample Size ± SD (nm) PDI Zeta potential
± SD (mV)
In situ microfluidics conjugation approach for Au-labelled nanoformulations
RRH-tagged PLGA NPs (75 mM) 140.6 ± 18.4 0.235 ± 0.034 0.2 ± 4.4
TAT-tagged PLGA NPs (8.6 mM) 168.1 ± 14.3 0.224 ± 0.039 -2.4 ± 3.7
bTAT-tagged PLGA NPs (4.5 mM) 142.4 ± 2.9 0.190 ± 0.043 -0.2 ± 6.3
Post-microfluidics conjugation approach for Au-labelled nanoformulations
RRH-tagged PLGA NPs (50 mM) 163.9 ± 3.2 0.225 ± 0.060 -12.3 ± 7.6
TAT-tagged PLGA NPs (8.6 mM) 180.7 ± 19.6 0.187 ± 0.067 -5.2 ± 0.3
bTAT-tagged PLGA NPs (4.5 mM) 156.9 ± 6.1* 0.162 ± 0.038 -4.6 ± 7.0

Chapter Three
135
TEM micrographs show the distribution of CPP on PLGA nanoparticles
Visualisation of Au-labelled CPP-tagged PLGA nanoparticles prepared with both
conjugation approaches showed individual nanoparticles with a regular spherical shape and a
smooth surface of the CPP-tagged PLGA nanoparticles independent of the conjugation
approach, (Figure 3.5 and Figure 3.7). The AuNPs were attached to the RRH-tagged PLGA
nanoparticles prepared using the post-microfluidics and in situ microfluidics conjugation
approach (Figure 3.5). The observed size of the polymeric nanoparticles after preparation on
the TEM grids was smaller compared to DLS, which is related to the shrinkage of the polymer
during the drying step during sample preparation (Luque-Michel et al., 2016).
Figure 3.5. Representative micrographs of Au-labelled RRH-tagged PLGA nanoparticles
prepared using the post-microfluidics (A) and the in situ microfluidics conjugation approach
(B) (Streck et al., 2019b).
The AuNPs formed mono- and/or bi-layers around the RRH-tagged PLGA
nanoparticles (Figure 3.5A) suggesting an interaction of the negatively charged AuNPs with
the positively charged RRH on the PLGA nanoparticle surface. Further, the RRH-tagged
PLGA nanoparticles showed a surface saturation with AuNPs (Figure 3.5A). It was also

Chapter Three
136
possible to observe an apparent depletion zone around the Au-labelled RRH-tagged PLGA
nanoparticles with free AuNPs also being observed (Figure 3.6A). The interaction between the
CPPs and AuNPs, as well as the behaviour of free AuNPs, is dependent on the surface charge
of the respective particles. The negatively charged AuNPs can electrostatically bind to the
positive charges within the CPP sequence. RRH contains positively charged guanidinium
groups and here, the guanidinium groups are likely to act as binding sites for AuNPs. An evenly
spaced arrangement of free AuNPs was observed here, where the nanoparticles adopted a
hexagonal lattice pattern (Figure 3.6, Insert 1) with an average distance of 27.6 ± 4.0 nm
(n = 100, number of free AuNPs) between the AuNPs. The free AuNPs are expected to repel
each other because of their negative charge and the resulting electrostatic forces between the
individual AuNPs. Interestingly, it was observed that the average distance between AuNPs was
significantly shorter when associated with the RRH-tagged PLGA nanoparticles (Figure 3.6,
Insert 2) compared to the distance between free AuNPs. The average distance between AuNPs
surface-bound to RRH-tagged PLGA nanoparticles was 12.1 ± 2.5 nm (n = 6, number of Au-
labelled RRH-tagged PLGA nanoparticles). The shorter distance can be explained by a
reduction of electrostatic forces between AuNPs due to the binding to RRH.

Chapter Three
137
Figure 3.6. Transmission electron micrograph of Au-labelled RRH-tagged PLGA
nanoparticles (A) and inserts of free individual AuNPs (1) and a RRH-tagged PLGA
nanoparticle with surface-bound AuNPs (2). The hexagonal formation of the AuNPs is
indicated by the red dashed line and the red arrows indicate how the distance between AuNPs
was measured (Streck et al., 2019b).
Au-labelled TAT-tagged PLGA nanoparticles prepared using the post-microfluidics
conjugation approach showed an arrangement of AuNPs around individual TAT-tagged PLGA
nanoparticles (Figure 3.7A). The AuNPs did not cover the surface completely and showed a
space between individual AuNPs, which might be due to steric hindrance introduced by the
longer TAT sequence compared to the short CPP sequence of RRH. Further, in Chapter 2
(Section 2.4.8) the available binding sites for CPPs on a PLGA nanoparticle were estimated to
be 16000 and it is possible that not all binding sites were occupied by TAT and therefore, no
complete surface saturation with AuNPs was observed. A similar observation was made for

Chapter Three
138
Au-labelled bTAT-tagged PLGA nanoparticles, were the AuNPs arrange around bTAT-tagged
PLGA nanoparticles with a regular distance between each other (Figure 3.7C).
Figure 3.7. Representative micrographs of Au-labelled TAT- and bTAT-tagged PLGA
nanoparticles prepared using the post-microfluidics (A, C) and the in situ microfluidics
conjugation approach (B, D).
The TEM micrographs obtained for Au-labelled CPP-tagged PLGA nanoparticles
prepared using the in situ microfluidics conjugation approach did not give conclusive results
about the AuNPs distribution and therefore, the CPP distribution (Figure 3.5B and Figure 3.7B
and D). In comparison to the Au-labelled CPP-tagged PLGA nanoparticles prepared using the
post-microfluidics conjugation approach, fewer AuNPs were observed in using TEM for the

Chapter Three
139
Au-labelled CPP-tagged PLGA nanoparticles prepared with the in situ microfluidics
conjugation approach and individual AuNPs seemed to generate less contrast and appeared grey
in the TEM micrographs making the imaging more difficult to interpret.
Since the aim of this study was to investigate the distribution of the CPPs on the PLGA
nanoparticles another technique, namely SAXS, was used to examine how the CPPs were
distributed after preparation of Au-labelled CPP-tagged PLGA nanoparticles using the post-
microfluidics and the in situ microfluidics conjugation approach.
Investigation of CPP distribution on PLGA nanoparticles using SAXS
The distribution of CPPs conjugated to PLGA nanoparticles prepared using the two
different conjugation approaches was investigated using SAXS. The SAXS profiles were
obtained by radial integration of 2D scattering patterns into plots of the scattered X-ray intensity
I(q) versus the scattering vector q. The scattering profiles of the three different Au-labelled
CPP-tagged PLGA nanoparticles prepared using either the post-microfluidics or the in situ
microfluidics conjugation approach are presented in Figure 3.8. A suspension of AuNPs alone
was used as a reference to determine the SAXS scattering pattern of the label used in this study
(Appendix V and black data points in Figure 3.8A-F). The manufacturer’s specifications for
the AuNPs provided an average particle diameter of 4.7 ± 0.8 nm. The high q portion of the
scattering profile for the AuNPs above q = 0.10 Å-1 could be fitted with the sphere form factor
for a sphere with a radius of 2.2 nm and a polydispersity of 0.17
(Polydispersity = Standard deviation
Mean) and was therefore consistent with the information
supplied by the manufacturer. However, the model did not account for some additional low q
scattering intensity observed and this is suggestive of the presence of a small fraction of larger

Chapter Three
140
AuNPs. The full scattering profile was fitted by incorporating a second sphere form factor into
the fitting model with a radius of 4.4 nm and a modelled volume fraction an order of magnitude
lower than the AuNPs fitted with a sphere radius of 2.2 nm (Appendix V). This suggested that
the commercially obtained AuNPs contained a subpopulation of around 1% of AuNPs with
diameters of 8.8 ± 1.5 nm in addition to those of the specified diameter of 4.4 ± 0.7 nm,
consistent with the manufacturer’s specifications.
The flat-plateau (Guinier region) below q = 0.02 Å-1 revealed that there were no
structure factor perturbations to the form factor and indicated that the AuNPs were at a
sufficiently low concentration in the dispersion not to be interacting with one another. In
addition, the scattering profiles of CPP-tagged PLGA nanoparticles prepared using the post-
microfluidics conjugation approach were obtained as a reference for both conjugation
approaches since a similar size was measured with DLS. These references account for the
scattering caused by the Au-label free CPP-tagged PLGA nanoparticles themselves. Given the
large average diameter of the PLGA nanoparticles (> 150 nm), the Guinier plateau at low q was
not observable within the measurable q-range of the instrument. The lowest observable q value
of 0.0026 Å-1 gave a maximum observable particle radius of ~ 500 Å (√5/3 × 1/qmin) and thereby
a maximum observable diameter of ~100 nm. However, scattering intensity indicated scattering
length density (SLD) contrast between the nanoparticles and the dispersant and surface (Porod)
scattering from the PLGA nanoparticles was observed at higher q that reached the incoherent
background intensity at q ≈ 0.02 Å-1 (Figure 3.8, red data points).

Chapter Three
141
Figure 3.8. Small angle X-ray scattering profiles of AuNPs (black data points) and PLGA
nanoparticles tagged with CPPs of different architectures (RRH, TAT and bTAT) (red data
points). Panels A-C show Au-labelled CPP-tagged PLGA nanoparticles prepared with the post-
microfluidics conjugation approach (purple data points) and panels D-F were produced using
the in situ microfluidics conjugation approach (green data points) (Streck et al., 2019b). AuNPs
= gold nanoparticles and MF = microfluidics.
Chapter Three
142
The Au-labelled CPP-tagged PLGA nanoparticles prepared using the post-microfluidics
conjugation approach had scattering profiles that showed features from the scattering profiles
of the label-free CPP-tagged PLGA nanoparticles and the scattering profile of the AuNPs.
Examining the Au-labelled CPP-tagged PLGA nanoparticles that were tagged in situ in the
microfluidic channel, a low q scattering feature was observed (Figure 3.8D-F). The scattering
feature at low q was consistent with the scattering of the larger PLGA nanoparticles alongside
a high q shoulder commensurate with the presence of a lower concentration of AuNPs than that
used in the post-microfluidics conjugation approach. The shape of the low q scattering feature
of the Au-labelled CPP-tagged PLGA nanoparticles prepared with the in situ microfluidics
conjugation approach was similar to the scattering profile of the label-free CPP-tagged PLGA
nanoparticles in the cases of RRH and TAT, indicating PLGA nanoparticles with a similar size.
The corresponding feature for the bTAT-tagged PLGA nanoparticles prepared with the in situ
microfluidics conjugation approach was broader, extending to higher q scattering intensity than
the corresponding nanoparticles not labelled with AuNPs. This indicated that the Au-labelled
bTAT-tagged PLGA particles were, in fact, smaller than their unlabelled counterparts. The
diameters of the Au-labelled CPP-tagged PLGA nanoparticles prepared using the in situ
microfluidics conjugation approach measured by DLS were between 142 and 168 nm and
similar to the label-free CPP-tagged PLGA nanoparticles (Table 3.2, Figure 3.4 and Chapter 2,
Figure 2.10). The primary difference between unmodified and CPP-tagged PLGA
nanoparticles in the low q scattering feature was that for each CPP-tagged PLGA nanoparticle
formulation there was an increase in the absolute scattering intensity by up to an order of
magnitude when CPPs were pre-conjugated to AuNPs and incorporated into the polymerization
mixture inside the microfluidic channel. In contrast to the PLGA nanoparticles, the AuNPs are
strong X-ray scatterers with higher SLDs because they have a greater electron density than the
aqueous dispersant (Clara-Rahola et al., 2018). These observations led to the conclusion that
Chapter Three
143
the strongly scattering AuNPs were incorporated uniformly throughout the CPP-tagged PLGA
nanoparticles when the in situ microfluidics conjugation approach was used. With the
incorporation of the AuNPs, the SLD contrast of the CPP-tagged PLGA nanoparticles increased
without significantly changing their size as observed by the similar shapes and positions of the
scattering profiles. Similar binding behaviour has been shown previously for
superparamagnetic iron oxide nanoparticles inside PLGA nanoparticles (Wassel et al., 2007).
The scattering profiles obtained from the Au-labelled CPP-tagged PLGA nanoparticles
prepared with the post-microfluidics conjugation approach (Figure 3.8A-C) were somewhat
different to scattering profiles obtained with the in situ microfluidics conjugation approach,
containing primarily the features of the AuNPs alone. It is likely that the absence of prominent
features from the PLGA nanoparticles at low q was obscured by the strong scattering from the
AuNPs in this region. For all three Au-labelled CPP-tagged PLGA nanoparticles, the scattering
from the native PLGA nanoparticles was weaker than the scattering of the AuNPs at most
observable q values. It is also possible that binding of AuNPs to the surface of the PLGA
nanoparticles, as observed by TEM (Figure 3.5A and Figure 3.7A and C), led to a measurable
increase in the overall size of the PLGA nanoparticles, which would push the scattering feature
to lower q values and outside of the observable range of the instrument. However, a significant
increase in the scattering intensity from the PLGA nanoparticles was not observed when AuNPs
were bound to CPP-tagged PLGA nanoparticles after the post-microfluidics conjugation
approach and this supports the hypothesis that the post-microfluidics conjugation approach did
not lead to the conjugation of the PLGA polymer with CPPs inside the nanoparticles. The only
case where scattering from the CPP-tagged PLGA nanoparticles was observed with the post-
microfluidics conjugation approach was in the case of bTAT-tagged PLGA nanoparticles and
in this case, the measured scattering intensity was the same as the sum of the scattering observed
Chapter Three
144
from bTAT conjugated PLGA nanoparticles and the AuNPs used to label them (Figure 3.8C).
As such, the location of any binding of the AuNPs by the CPPs could not be deduced directly
from the SAXS data for the Au-labelled CPP-tagged PLGA nanoparticles prepared with the
post-microfluidics conjugation approach. Any feature that represents a polymer core and
AuNPs-shell arrangement, which would typically appear as a side-maximum at higher q values,
were obscured by the strong scattering from the AuNPs. Lastly, it should be noted that SAXS
experiments were performed using a bulk nanoparticle suspension and therefore the obtained
data displays an average of the CPP distribution in the nanoparticle population.
Structural distribution of CPPs
A model is proposed for the selective conjugation of CPPs to PLGA nanoparticles using
different microfluidic approaches. Based on the SAXS, DLS and TEM data the distribution of
the CPPs depends on the conjugation approach. The AuNPs were electrostatically bound to the
positively charged CPPs and acted as a label to increase the scattering intensity of the PLGA
nanoparticles. TEM micrographs for the post-microfluidics conjugation approach indicated a
core-shell like arrangement of the AuNPs around the PLGA nanoparticles. Using the post-
microfluidics conjugation approach the CPPs were apparently initially conjugated to the
available carboxyl groups on the surface of the PLGA nanoparticles (Figure 3.9A). A potential
movement of the CPPs towards the inside of the nanoparticles due to pores in the polymer
matrix could not be observed with SAXS as the scattering contrast of the CPPs on their own is
very low. The presence of pores in PLGA nanoparticles is not clearly stated in the literature
and a porous structure is mainly reported for larger PLGA microparticles prepared using a
double emulsion solvent evaporation technique in the presence of ammonium bicarbonate
(Chen et al., 2019b). Even if pores are present in the PLGA nanoparticles, it is possible that

Chapter Three
145
the AuNPs (with a size of approximately 4.4 nm) could not penetrate through those pores into
the internal space of the nanoparticles.
Figure 3.9. Schematic overview of proposed CPP distribution of Au-labelled CPP-tagged
PLGA nanoparticles and the corresponding distribution of label-free CPP-tagged PLGA
nanoparticles prepared using a post-microfluidics conjugation (A) or an in situ microfluidics
conjugation (B) approach (Streck et al., 2019b). NP = nanoparticle.
The scattering curves of the Au-labelled CPP-tagged PLGA nanoparticles prepared with
the in situ microfluidics conjugation approach showed an enhanced scattering contrast between
the nanoparticles and the dispersant and thereby a distribution of the strongly scattering Au-
labelled CPPs throughout the polymeric PLGA nanoparticles (Figure 3.9B). When using the
in situ microfluidics conjugation approach, the PLGA polymer was activated prior to the
formulation of the nanoparticles and AuNPs/CPPs could bind to the PLGA polymer during the
polymer matrix formation, both being encapsulated inside the PLGA nanoparticles and present
on their surfaces (Figure 3.9B). To further elucidate the dynamic distribution of CPPs during
nanoparticle formation, future work could incorporate microfluidics coupled with SANS to
study in situ scattering of soft matters over time (Adamo et al., 2018).
Chapter Three
146
Conclusion
The CPP-tagged PLGA nanoparticles prepared using the in situ microfluidics approach
showed an influence of the CPP architecture on the physicochemical characteristics, in
particular, the tuneability of the surface charge. The amount of CPP tagged to PLGA
nanoparticles was concentration dependent and increased with higher concentrations of CPPs
added. Further, the distribution of ligands on and within nanoparticles is critical to their
utilization in vivo but is not often understood. Here, PLGA nanoparticles were tagged with
variants of the cationic CPP, TAT, known to enhance cell uptake (Trehin et al., 2004) and
prepared using different microfluidics-based conjugation approaches to probe the impact of
architecture and preparation method on the structure of the resulting nanoparticles. TAT has
been previously conjugated to polymer nanoparticles (Vasconcelos et al., 2015; Zhu et al.,
2016a), but the distribution of the ligand on and within the particles was not explored, nor was
their preparation by microfluidic techniques. In the present study, for the first time, the
utilization of microfluidics to produce CPP-tagged PLGA nanoparticles has been demonstrated.
It has also been shown that the distribution of the CPPs within the nanoparticle delivery system
was influenced by the preparation method. CPPs were distributed throughout the PLGA
nanoparticles when prepared using the in situ microfluidics conjugation approach. In contrast,
for CPP-tagged PLGA nanoparticles prepared using post-microfluidics conjugation, the results
were consistent with the CPPs being distributed on the surface of the nanoparticles. This
finding has important implications for the use of such nanoparticles, where the density of CPPs
on the surface is important in dictating biological interactions or alternatively when using an
ion pairing strategy to localize labile drugs to the inside of the nanoparticles. Future studies
exploring the impact of the nanoparticle preparation method on interactions with cells will test
this implication.
4 Chapter Four
Interaction of cell-penetrating peptide modified polymeric nanoparticles with cells

Chapter Four
148
Introduction
Interactions of nanoparticles with cell membranes are widely investigated, but still not
completely understood. Different cell lines such as HeLa and Caco-2 cells have been utilized
as in vitro cell culture models to study nanoparticle-cell interactions and cellular uptake of
nanoparticles (Czuba et al., 2018; Morimoto et al., 2016; Nam et al., 2002; Sheng et al., 2015).
The human cervical cancer cell line HeLa cells is a well-established cell line for uptake studies
of CPPs (Masters, 2002; Ramaker et al., 2018), whereas Caco-2 cells are used as a cell culture
model for the intestinal epithelium (Hidalgo et al., 1989). In this Chapter, the focus is on the
influences of surface modification of polymeric nanoparticles on nanoparticle-cell interactions
in different in vitro cell culture models.
Interactions of nanoparticles at the nano-bio interface
The nano-bio interface is described as the space between nanomaterials and biological
systems, and processes occurring at the nano-bio interface determine the uptake of
nanoparticles (Nel et al., 2009; Shang and Nienhaus, 2013). Dynamic interactions at the nano-
bio interface include both long- and short-range forces (Nel et al., 2009; Shang and Nienhaus,
2013). Long-range forces include van der Waals and repulsive electrostatic interactions with
the cell membrane, whereas short-range forces arise from surface charges or combine steric,
depletion and solvent interactions (Nel et al., 2009; Shang and Nienhaus, 2013). These forces
influence the formation of a protein corona around nanoparticles, determine cellular contact
and subsequent endocytosis and intracellular transport (Shang and Nienhaus, 2013). A protein
corona is formed around positively and negatively charged nanoparticles when they enter
biological fluids, with albumin being the main protein component (Fleischer and Payne, 2014;
Nel et al., 2009). Adherence to the cell membrane involves either specific or non-specific

Chapter Four
149
binding and CPPs are an example of surface modifications that can induce non-specific binding
to cells (Nel et al., 2009). Other factors that influence interactions at the nano-bio interface are
hydrophobicity of the nanoparticles, the surface roughness of the cells and size and shape of
the nanoparticles (Nel et al., 2009). To better understand the time frame for particles to arrive
at the nano-bio interface and their distribution within in vitro and in vivo systems, mathematical
modelling is used to predict the kinetic behaviour of particles (Li et al., 2012; Thomas et al.,
2018).
Kinetic studies of particle distribution can be either used for understanding the fate of
nanoparticles in the human body (Li et al., 2010) or to estimate the delivered dose to the cell in
an in vitro cell culture (Ahmad Khanbeigi et al., 2012). The former is used for the evaluation
of nanoparticles in the relevant compartments of the ADME (Absorption, Distribution,
Metabolism and Excretion) system after administered to the human body (Li et al., 2017). The
latter is used for the improvement of in vitro cell culture systems and will be discussed further.
The biological response of a system to an administered drug is dose dependent and
particokinetics is used as a computational tool to estimate the behaviour of nanoparticles in in
vitro cell culture systems (Price et al., 2019). Knowledge of the delivered dose is important as
there is a great difference between the administrated amount and the amount of nanoparticles
that reached the cell surface (Faria et al., 2019). Ahmad Khanbeigi et al. (2012) reported that
only 0.03-0.33% of the administered dose of polystyrene microspheres reached the cell surface
of macrophages in vitro and the findings were supported by particokinetic estimations.
The biological effects between nanoparticles and the cell membrane occur primarily via
interactions of the nanoparticles with the cell components (Thomas et al., 2018). In in vitro

Chapter Four
150
cell culture media or buffer, particles can sediment, diffuse and agglomerate according to their
physicochemical characteristics including size, charge and density (Hinderliter et al., 2010).
Hinderliter et al. (2010) used a computational model called the ISDD model (In vitro
Sedimentation, Diffusion and Dosimetry model) to describe the dynamics of particles in liquids.
The model can be used for the estimation of the amount of nanoparticles reaching the cell
surface, but a weakness of the ISDD model is that it does not describe changes in size during
degradation of the nanoparticles in the physiological environment (Hinderliter et al., 2010;
Thomas et al., 2018). The ISD3 model (In vitro Sedimentation, Diffusion, Dissolution, and
Dosimetry model) developed by Thomas et al. (2018) includes dissolution and was tested with
silver nanoparticles as model nanoparticles in buffer with 10% fetal bovine serum and
macrophages as model cells. Theoretically, the concept of the ISD3 model can also be applied
to polymeric nanoparticles in in vitro cell culture system. During incubation, the polymeric
nanoparticles diffuse and sediment towards the cell surface. At the same time, dissolution of
the polymer is occurring and subsequent drug release is triggered by interactions with the cell
culture media before and whilst the polymeric nanoparticles reach and interact with the cell
surface (Figure 4.1).
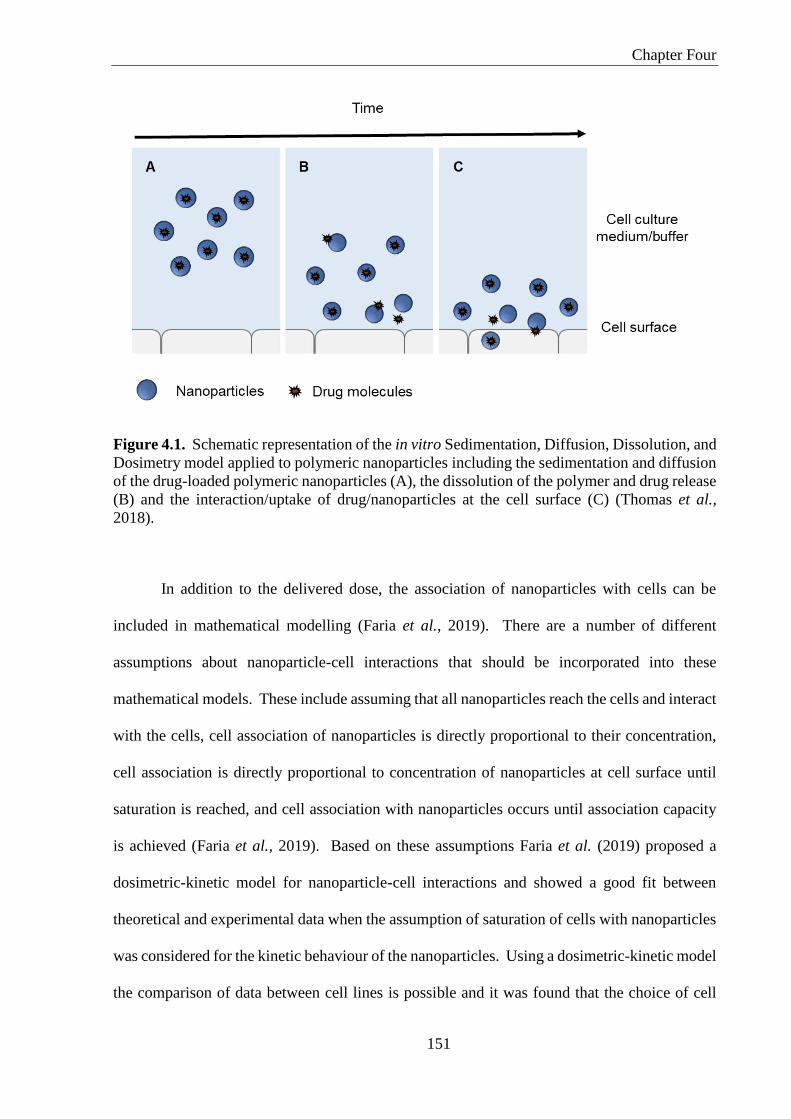
Chapter Four
151
Figure 4.1. Schematic representation of the in vitro Sedimentation, Diffusion, Dissolution, and
Dosimetry model applied to polymeric nanoparticles including the sedimentation and diffusion
of the drug-loaded polymeric nanoparticles (A), the dissolution of the polymer and drug release
(B) and the interaction/uptake of drug/nanoparticles at the cell surface (C) (Thomas et al.,
2018).
In addition to the delivered dose, the association of nanoparticles with cells can be
included in mathematical modelling (Faria et al., 2019). There are a number of different
assumptions about nanoparticle-cell interactions that should be incorporated into these
mathematical models. These include assuming that all nanoparticles reach the cells and interact
with the cells, cell association of nanoparticles is directly proportional to their concentration,
cell association is directly proportional to concentration of nanoparticles at cell surface until
saturation is reached, and cell association with nanoparticles occurs until association capacity
is achieved (Faria et al., 2019). Based on these assumptions Faria et al. (2019) proposed a
dosimetric-kinetic model for nanoparticle-cell interactions and showed a good fit between
theoretical and experimental data when the assumption of saturation of cells with nanoparticles
was considered for the kinetic behaviour of the nanoparticles. Using a dosimetric-kinetic model
the comparison of data between cell lines is possible and it was found that the choice of cell

Chapter Four
152
line mainly influences the cell-association rate of nanoparticles rather than nanoparticle size
(Faria et al., 2019).
The intestinal epithelium as a barrier for nanoparticle uptake
Specialized epithelial cells, such as the intestinal epithelium, separates the internal
contents of the human body from the environment in the lumen of the gut (Peterson and Artis,
2014). Epithelial cells are highly polarized cells with an apical and basolateral side and the
cells are connected to each other by tight junctions to increase tissue integrity and for protection
from ingested pathogens (Cartiera et al., 2009). The intestinal epithelium consists of different
cell types including absorptive enterocytes, mucus-producing goblet cells and M cells as part
of Peyer-patches that have been reported to play a crucial role in the uptake of polymeric
nanoparticles through the epithelium (Beduneau et al., 2014; Boegh et al., 2014; Caldorera-
Moore et al., 2019; Rieux et al., 2005; Tariq et al., 2015). Caco-2 cells are well-established as
an in vitro cell culture model for the human intestinal epithelium since this human cancer
adenocarcinoma cell line has similarities with normal intestinal cells (Gaumet et al., 2009).
Hildago et al. (1989) reported morphological changes and endocytic differentiation of Caco-2
cells cultured in permeable filter inserts in in vitro cultures after 16 days. Caco-2 cell
monolayers are morphologically similar to the columnar epithelium found in the small intestine
and show the formation of domes, which are described as aggregations of transporting and
polarized epithelial cells (Hidalgo et al., 1989). Further, tight junctions are expressed and
localized between cells in the Caco-2 cell monolayer, and metabolic enzymes like phosphatase
and sucrase-isomaltase are produced at bio-relevant levels (Birch et al., 2018a; Pinto et al.,
1983). A reason for Caco-2 cells being a popular in vitro cell culture model includes the

Chapter Four
153
simplicity of the system and culturing of the cell line in a reproducible and rapid way (Beduneau
et al., 2014; Lea, 2015).
Despite the properties of Caco-2 cells that promote their suitability as an intestinal
epithelium cell model, there are some limitations to the use of Caco-2 cells. Variations in
characteristics of Caco-2 cells occur with increasing passage numbers, due to the expression of
differentiation markers, increase in transepithelial electrical resistance (TEER) and
proliferation rate (Lea, 2015). Therefore, making a direct comparison of Caco-2 cell results
obtained with earlier or later passage numbers between laboratories is difficult (Lea, 2015).
The main limitation of Caco-2 cells as a model for the intestinal epithelium is the differentiation
into one particular cell type, namely enterocytes, and the absence of a mucus layer on top the
cells (Beduneau et al., 2014; Birch et al., 2018a). Mucus mainly consists of water (95%) but
other components including mucin, proteins and lipids (Boegh et al., 2013) are responsible for
the intestinal mucus being a rate-limiting step for the absorption of nanoparticles after oral
delivery (Boegh et al., 2014). In particular, mucin, which consists of glycosylated polymeric
proteins that form a mesh on top of epithelial cells, represents a significant barrier for the uptake
of nanoparticles across the epithelial lining. In vitro co-culture of Caco-2 cells with HT-29 cells
(Beduneau et al., 2014) or the addition of biosimilar mucus on the Caco-2 cell monolayer (Birch
et al., 2018a) are strategies to overcome the limitation of the Caco-2 cell culture model lacking
mucus. The co-culture of Caco-2 and HT-29 cells combines absorptive enterocyte-like cells
and mucus-secreting cells to mimic the intestinal epithelium (Fan et al., 2014). Intestinal mucus
is a steric barrier for the interaction and uptake of compounds like small molecules, lipophilic
drugs, biomacromolecules and nanoparticles by the epithelium (Birch et al., 2018a; Boegh et
al., 2014). Biosimilar mucus has similar rheological properties compared to mucus originating

Chapter Four
154
from pig and can be used on Caco-2 cell monolayers or alone for the evaluation of particle
movement and mucoadhesive formulations (Birch et al., 2018a; Boegh et al., 2014).
Polymeric nanoparticles can be used as a controlled release drug delivery system to
enhance oral absorption and protect the encapsulated drug against degradation in the GIT
(Gaumet et al., 2009). However, to achieve high drug absorption, the designed drug delivery
system requires a controlled burst release of the drug at the surface of the epithelium and
constant drug release while the nanoparticles are in close proximity to the cell surface. It has
been suggested that nanoparticles intended for oral drug delivery need to be (i) resistant to the
GIT environment and (ii) penetrate mucus to localize at the cell surface (Du et al., 2018; He et
al., 2013).
The uptake mechanisms proposed for nanoparticles include endocytosis via clathrin-
dependent and caveolae-dependent pathways, and macropinocytosis (Dausend et al., 2008).
The types of endocytic pathways were described in Chapter 1. The uptake of PLGA
nanoparticles into Caco-2 cells is reported to occur in a concentration- and time-dependent
manner (Alqahtani et al., 2015; Cartiera et al., 2009; He et al., 2013; Tariq et al., 2015). For
identification of uptake mechanisms involved in the internalization of nanoparticles, in vitro
cell experiments can be performed at a lower temperature to distinguish between active and
passive uptake or inhibitors can be applied prior to the nanoparticle incubation of cells (Table
4.1). Endocytosis is an energy-dependent uptake pathway and a decrease in temperature to 4°C
reduces the ATP synthesis and subsequently inhibits endocytosis due to low ATP levels, which
can hinder endocytic uptake pathways (Cartiera et al., 2009; Morimoto et al., 2016). In the
literature, a reduction in nanoparticle uptake is reported of up to 50% at 4°C for PLGA, CPP-

Chapter Four
155
modified PLGA and PEG-PLA nanoparticles (Liu et al., 2013; Sheng et al., 2015; Siu et al.,
2018; Win and Feng, 2005). These reports show that endocytosis is crucial for the uptake of
nanoparticles in in vitro cell culture systems. The application of specific endocytosis inhibitors
shows that clathrin- and caveolae-dependent endocytosis are the main active uptake
mechanisms (He et al., 2013; Siu et al., 2018; Tariq et al., 2015; Xu et al., 2013a). Further,
macropinocytosis is also involved in nanoparticle uptake depending on the properties of the
nanoparticles, including their size (Elsner et al., 2015; Siu et al., 2018; Zhu et al., 2016b).

Chapter Four
156
Table 4.1. Chemical inhibitors of in vitro uptake pathways categorized based on their influence
on polymeric nanoparticle internalization. +, ++, and +++ represent low, medium and high
influence on nanoparticle internalization.
Inhibitor Mechanism Cell line
Influence on
nanoparticle
uptake
References
Methyl-ß-
cyclodextrin
Caveolae-
dependent
endocytosis
HeLa,
Caco-2 ++ to +++
(He et al., 2013;
Morimoto et al., 2016;
Sheng et al., 2015)
Filipin
Caveolae-
dependent
endocytosis
Caco-2 ++
(Siu et al., 2018; Tariq
et al., 2015; Xu et al.,
2013a)
Nystatin
Caveolae-
dependent
endocytosis
HeLa,
Caco-2 +
(He et al., 2013;
Morimoto et al.,
2016)
Genistein
Caveolae-
dependent
endocytosis
Caco-2 + (He et al., 2013)
Phenylarsine
oxide
Clathrin-
dependent
endocytosis
Caco-2 ++ (He et al., 2013)
Sucrose
Clathrin-
dependent
endocytosis
HeLa,
Caco-2 +
(Morimoto et al.,
2016; Siu et al., 2018)
Chlorpromazine
Clathrin-
dependent
endocytosis
Caco-2 + to ++
(Sheng et al., 2015;
Siu et al., 2018; Tariq
et al., 2015; Xu et al.,
2013a; Zhu et al.,
2016b)
5-N-ethyl-N-
isoproamiloride Macropinocytosis Caco-2 + to ++
(He et al., 2013; Siu et
al., 2018; Zhu et al.,
2016b)
Sodium azide Active transport Caco-2 ++ (Sheng et al., 2015;
Tariq et al., 2015)
Uptake of nanoparticles is also influenced by their size and surface chemistry. The size
of nanoparticles is crucial for their interactions with and adhesion to cells (Win and Feng, 2005).
With the increase in nanoparticle size from 50 to 1000 nm lower amounts of polystyrene
nanoparticles, expressed as fluorophore concentration (≤ 0.05 µg/µg protein), were found to be
taken up in Caco-2 cells (Banerjee et al., 2016). Using confocal microscopy, PLGA
nanoparticles with a size of > 300 nm were found to be located in the cell membrane of Caco-
2 cells after 4 h, whereas smaller PLGA nanoparticles with a size of 100 nm were found in the
Chapter Four
157
intracellular space of the cells and in the cell nucleus (Gaumet et al., 2009). Most studies
reported in the literature have used PLGA nanoparticles with a size between 100 and 240 nm
for uptake studies (Cartiera et al., 2009; Czuba et al., 2018; Guo et al., 2019; Joshi et al., 2016;
Tariq et al., 2015). The characteristics of the nanoparticle surface, including surface charge
and hydrophilicity, are crucial for interactions of the nanoparticles with cells leading to potential
cellular uptake (Gaumet et al., 2009). The uptake of PLGA nanoparticles with a slightly
negative surface charge between -9 to -2 mV was reported to be lower in comparison to surface-
modified PLGA nanoparticles with CPPs or chitosan and a surface charge above > +8 mV
(Alqahtani et al., 2015; Czuba et al., 2018; Sheng et al., 2015; Zhu et al., 2016a).
Uptake of nanoparticles is mostly stated qualitatively by fluorescence and confocal
images (Alqahtani et al., 2015; Cartiera et al., 2009) and quantitatively by flow cytometry or
measurement of drug and fluorophore concentration (Czuba et al., 2018; Guo et al., 2019).
Methods for the quantitative measurement of drug or fluorophore concentration include the
bicinchoninic acid (BCA) assay, fluorescence and HPLC analysis and results are reported as
the concentration of drug in cells after cell lysis (Guo et al., 2019; Sheng et al., 2015; Siu et al.,
2018). Flow cytometry is used to analyse fluorescence within individual cells, but results are
often reported as the mean fluorescence intensity (Czuba et al., 2018) or as a peak shift (Tariq
et al., 2015) making comparison with other studies difficult. In general, biological materials
such as cells are prone to show a variation in their response and to ensure comparison between
studies, more details of protocols should be shared within the research community. A
standardisation as suggested by Faria et al. (2018) can aid to overcome the limited
comparability of in vitro cell culture data. MIRIBEL, minimum information reporting in bio-
nano experimental literature, combines information about the material characteristics,
biological characteristics and experimental protocol that will promote the four principles of

Chapter Four
158
reusability, quantification, practically and quality to ensure the comparison of results (Faria et
al., 2018).
Chapter aims
The aim of the work presented in this Chapter is to investigate the interactions between
CPP-tagged PLGA nanoparticles and cells at the nano-bio interface. Therefore, a fluorophore-
labelled PLGA was used for the preparation of CPP-tagged PLGA-FPR nanoparticles to enable
the detection of the vehicle using flow cytometry and confocal laser scanning microscopy
(CLSM). PLGA-FPR and CPP-tagged PLGA-FPR nanoparticles were prepared using the post-
microfluidics and the in situ microfluidics conjugation approach and characterised for their
physicochemical properties. Nanoparticle-cell interactions of the nanoformulations prepared
with both preparation methods were tested in HeLa cells to investigate the influence of the
preparation method and the architecture of the CPPs on the nano-bio interface. In order to
evaluate the potential of the CPP-tagged PLGA-FPR nanoparticles as an oral drug delivery
system, cell interaction of the nanoformulations with Caco-2 cells was investigated.

Chapter Four
159
Materials
HeLa cells (human cervical cells) were purchased from American Type Culture
Collection (ATCC, Manassas, VA, USA) and Caco-2 cells (carcinogenic human colonic cells)
were provided by Prof. Ian Tucker as a kind gift. Poly(lactide-co-glycolide)-FPR648 (PLGA-
FPR, 50:50, FPR648 fluorescent end-capped, MW 23,240 Da) was supplied by PolySciTech
(West Lafayette, IN, USA). MEM non-essential amino acids solution (NEAA, 100×, cell
culture grade), Hanks’ Balanced salts (powder, cell culture grade), bovine serum albumin (BSA,
≥ 98%), propidium iodide (≥ 97%), phenazine methosulfate (PMS, ≥ 90%),
ethylenediaminetetraacetic acid (EDTA, cell culture grade) and cell culture flasks were
purchased from Sigma-Aldrich (St. Louis, MO, USA). Penicillin-streptomycin (10,000
units/mL penicillin, 10 mg/mL streptomycin, cell culture grade), Hoechst 33342 (purity ≥ 99%,
final concentration 1 mg/mL) and CellMask™ Orange plasma membrane stain (5 mg/mL in
DMSO, final concentration 5 µg/mL) were purchased from Thermo Fisher Scientific Australia
Pty (Scoresby, Australia). Dulbecco’s Modified Eagle Medium, (DMEM, 4.5 g/L glucose, L-
glutamine, phenol red, cell culture grade), Dulbecco’s Phosphate Buffered Saline powder
(DPBS, cell culture grade), Trypan Blue Stain 0.4% and TrypLE Express (no phenol red) were
supplied by Gibco® Life Technologies (Grand Island, NE, USA). 3-(4,5-Dimethylthiazol-2-
yl)-5-(3-carboxymethoxyphenyl)-2-(4-sulfophenyl)-2H-tetrazolium (MTS) and CellTiter
96®AQueous One Solution were purchased from Promega (Madison, WI, USA). Cover glasses
No. 1 (circular, 13 mm) were from Lab Supply (Dunedin, New Zealand). Ibidi µ-slides were
obtained from Ibidi (Gräfelfing, Germany). HyClone fetal bovine serum (FBS) was sourced
from GE Healthcare Life Sciences (Tauranga, New Zealand). Cell culture plates and Falcon®
cell culture inserts (0.4 µm pore size) were sourced from BD Biosciences (San Jose, CA, USA).
Nylon syringe filters (0.45 µm) were obtained from MicroAnalytix Pty Ltd (Auckland, New
Zealand).

Chapter Four
160
The cell culture buffer used in this study was HBSS supplemented with 10 mM HEPES
and 0.05 % (w/v) BSA and is referred to below as hHBSS.
All other ingredients and peptides required for the preparation of the nanoformulations
used are listed in Chapter 2.
Methods
Preparation of CPP-tagged PLGA-FPR nanoparticles using microfluidics
CPP-tagged PLGA-FPR nanoparticles were prepared using the post-microfluidics and
in situ microfluidics conjugation approach as previously described in Chapters 2 and 3 with
some modifications. The PLGA polymer was exchanged with the PLGA-FPR polymer, which
is a fluorophore-labelled PLGA polymer. Further, either the NanoAssemblr® Benchtop device
(flow rate ratio 6:1, total flow rate 10 mL/min) or NanoAsssemblr® Cartridges were used in
combination with a syringe pump (Pump 11 Elite (Harvard Apparatus, Cambridge, MA, USA),
flow rate ratio 6:1 and total flow rate 2.5 mL/min).
Characterization of CPP-tagged PLGA-FPR nanoparticles
The Z-average diameter, PDI and the zeta potential of the nanoformulations were
measured using DLS and laser Doppler electrophoresis as described in Chapter 2. The
nanoformulations were prepared in hHBSS or in ultra-pure water and for size and zeta potential
measurements further diluted with ultra-pure water.

Chapter Four
161
The conjugation efficiencies of the three CPPs on CPP-tagged PLGA-FPR
nanoparticles prepared using the post-microfluidics and in situ microfluidics conjugation
approach were determined using RP-HPLC. The RP-HPLC methods were described in
Chapter 2 and samples of supernatants were filtered through a 0.45 µm nylon membrane prior
to RP-HPLC analysis.
Culturing of HeLa and Caco-2 cells
HeLa cells were cultured in 75 cm2 cell culture flasks with Eagle's Minimal Essential
Medium (EMEM) supplemented with 100 IU/mL penicillin, 100 μg/mL streptomycin, 2 mM
L-glutamine, 0.01 mM non-essential amino acids, 1 mM sodium pyruvate and 10% (v/v) FBS
at 37°C and 5% CO2. At a confluence of 80-90% in the culturing flasks, HeLa cells were
detached by trypsin-EDTA treatment (5 mg/mL trypsin and 2 mg/mL EDTA in DPBS, pH 7.4)
and seeded for subsequent experiments. HeLa cells were seeded at a density of
1.5×10⁴ cells/well in 96-well plates for cell viability assay, 1.5×10⁵ cells/well in 12-well plates
for flow cytometry, and 4.5×10⁵ cells/well in ibidi µ-slides for CLSM, 24 or 48 h prior to the
experiments using passages 2 to 9.
Caco-2 cells were routinely cultured in 75 cm2 cell culture flask with Dulbecco’s
Modified Eagle Medium (DMEM) containing 4 mM L-glutamine and supplemented with
1% (v/v) penicillin-streptomycin, 1% (v/v) non-essential amino acids and 10% (v/v) FBS at
37°C and 5% CO2. Caco-2 cells were weekly sub-cultured in a 1:5 ratio at a confluence of
around 50% and monitored using an Olympus CKX41 microscope (Auckland, New Zealand)
with phase contrast to evaluate confluence. For the cell viability assay, Caco-2 cells were seeded
in 96-well plate at a density of 5×10³ cells/well for 7-12 days until they reached confluence.

Chapter Four
162
Caco-2 cells were seeded at a density of 1×10⁵ cells/cm2 in Falcon® cell culture inserts
(diameter, 0.4 µm pores) and grown for 22 days for the cell integrity study. Caco-2 cells were
seeded for 21 days in 12-well plates at a density of 3×10⁴ cells/well or on cover glasses in 12-
well plates at a density of 5×10³ cells/well for flow cytometry and CLSM analysis, respectively.
The medium was replaced every two to three days and passage 59 to 73 were used for
experiments.
Toxicity of nanoformulations in HeLa and Caco-2 cells
HeLa cells were washed with hHBSS (pH 7.4) and incubated with 100 µL PLGA-FPR
or CPP-tagged PLGA-FPR nanoparticles (0.09-0.90 mg/mL) and CPP solutions (1-100 µM)
for 1 h before the test solutions were removed and HeLa cells were washed twice with hHBSS
(pH 7.4). Subsequently, HeLa cells were incubated with a MTS/PMS solution containing
240 µg/mL MTS and 2.4 µg/mL PMS in hHBSS (pH 7.4) for 4 h at 37°C and 5% CO2.
Absorbance was measured at 490 nm using microplate reader POLARstar OPTIMA (BMG
Labtech, Ortenberg, Germany).
Caco-2 cells were washed with hHBSS (pH 7.4) and incubated with 100 µL PLGA-FPR
or CPP-tagged PLGA-FPR nanoparticles (0.07-0.72 mg/mL) and CPP solutions (0.05-20 µM)
for 2 h. Afterwards, the test solutions were removed and Caco-2 cells were washed twice with
hHBSS (pH 7.4) before incubation with the CellTiter96® AQueous One Solution Reagent
containing 90 µg/mL MTS and 4.8 µg/mL µM phenazine ethosulfate (PES) for 1 h at 37°C and
5% CO2. Absorbance was measured at 490 nm using the POLARstar OMEGA microplate
reader (BMG Labtech, Ortenberg, Germany).

Chapter Four
163
Both cell lines were treated with hHBSS (pH 7.4) only and 0.2 % (w/v) SDS in HBSS
as negative and positive controls, respectively. Cell viability for both cell lines was calculated
with the absorbance of the test solutions and positive and negative controls as described in
Equation (4-1).
𝐶𝑒𝑙𝑙 𝑣𝑖𝑎𝑏𝑖𝑙𝑖𝑡𝑦 (%) = 𝐴𝑏𝑠𝑜𝑟𝑏𝑎𝑛𝑐𝑒(𝑡𝑒𝑠𝑡 𝑠𝑜𝑙𝑢𝑡𝑖𝑜𝑛𝑠)−𝐴𝑏𝑠𝑜𝑟𝑏𝑎𝑛𝑐𝑒(𝑝𝑜𝑠. 𝑐𝑜𝑛𝑡𝑟𝑜𝑙)
𝐴𝑏𝑠𝑜𝑟𝑏𝑎𝑛𝑐𝑒(𝑛𝑒𝑔. 𝑐𝑜𝑛𝑡𝑟𝑜𝑙)−𝐴𝑏𝑠𝑜𝑟𝑏𝑎𝑛𝑐𝑒(𝑝𝑜𝑠. 𝑐𝑜𝑛𝑡𝑟𝑜𝑙) × 100 (4-1)
Cell integrity of Caco-2 cell monolayer
Caco-2 cells were washed and equilibrated with hHBSS (pH 7.4) for 20 min at 37°C
and 5% CO2 before TEER was measured using Millicell® ERS Voltohmmeter (EMD Millipore,
Billerica, MA, USA) with a chopstick electrode. The reported TEER values (TEERCaco-2 cell
monolayer) were obtained from the resistance of the tissue (Equation 4-2) and multiplication with
the semipermeable membrane area (Equation 4-3).
𝑅𝑇𝑖𝑠𝑠𝑢𝑒(Ω) = 𝑅𝐶𝑎𝑐𝑜−2 𝑚𝑜𝑛𝑜𝑙𝑎𝑦𝑒𝑟 − 𝑅𝑏𝑙𝑎𝑛𝑘 𝑖𝑛𝑠𝑒𝑟𝑡 (4-2)
𝑇𝐸𝐸𝑅𝐶𝑎𝑐𝑜−2 cell monolayer(Ω × 𝑐𝑚2) = 𝑅𝑇𝑖𝑠𝑠𝑢𝑒 − 𝑀𝐴𝑟𝑒𝑎 (4-3)
Uptake of nanoparticles using flow cytometry for HeLa and Caco-2 cells
HeLa cells were washed with hHBSS (pH 7.4) and incubated with 500 µL of PLGA-
FPR or CPP-tagged PLGA-FPR nanoparticles (0.09-0.90 mg/mL) for 1 h at 37°C and 5% CO2.
The nanoformulations were removed and the HeLa cells were washed with ice-cold DPBS (pH
7.4). For the trypsinization of HeLa cells, 500 µL of trypsin (0.05% (v/v) in DPBS, pH 7.4)
Chapter Four
164
was added to the HeLa cells and incubated for 5 min at 37°C and 5% CO2. The plate was
slightly agitated before 800 µL complete medium (hHBSS (pH 7.4) with 10% (v/v) FBS) was
added to terminate the trypsinization process. HeLa cells were collected and separated by
centrifugation at 270 g for 3 min, prior to a second wash with 400 µL ice-cold heparin (20
µg/mL in DPBS, pH 7.4) and again separated by centrifugation as above. Finally, HeLa cells
were re-suspended in 500 µL complete medium and 10,000 viable cells were analysed and
gated for forward/sideways light scattering using a Gallios Flow Cytometer (Beckman Coulter,
Brea, CA, USA) and obtained data were analysed using FlowJo V10 analysis software (BD,
Franklin Lakes, NJ, USA).
Caco-2 cells were washed once with hHBSS (pH 7.4) and incubated with 500 µL
PLGA-FPR or CPP-tagged PLGA-FPR nanoparticles (0.07-0.72 mg/mL) at 37°C and 5% CO2
for 0.5, 2 and 6 h. The nanoformulations were discarded and Caco-2 cells were washed twice
with DPBS (pH 7.4) at room temperature. For the trypsinization of Caco-2 cells, 400 µL
TrypLE Express was added and incubated at 37°C and 5% CO2 for 10 min. To stop the
trypsinization process, 1 mL of complete medium (hHBSS (pH 7.4) with 1% (v/v) FBS) was
added. Caco-2 cells were separated by centrifugation at 330 g for 5 min, re-suspended and
washed with 400 µL of ice-cold DPBS (pH 7.4) containing heparin (20 µg/mL). For the
quantification of internalized and surface-bound nanoparticles, no heparin treatment was
applied and Caco-2 cells were washed with of ice-cold DPBS (pH 7.4) only. Caco-2 cells were
separated by centrifugation as above and re-suspend with 500 µL of DPBS (pH 7.4). Cell
viability was evaluated by adding 5 µL of propidium iodide (0.025 mg/mL) before analysis.
30,000 viable cells were analysed with FACS Canto™ II flow cytometry (BD Biosciences, San
Jose, CA, USA), gated for forward/sideways light scattering and obtained data were analysed
using FlowJo V10 analysis software.

Chapter Four
165
Qualitative cell uptake study using confocal laser scanning microscopy for HeLa and
Caco-2 cells
HeLa cells were washed with hHBSS (pH 7.4) before incubation with 200 µL of PLGA-
FPR or CPP-tagged PLGA-FPR nanoparticles (0.90 mg/mL) for 1 h. After the incubation,
HeLa cells were washed with hHBSS (pH 7.4) and first incubated with 2 µL of Hoechst 33342
(1 mg/mL) in 200 µL hHBSS (pH 7.4) for 15 to 30 min at 37°C and 5% CO2 to stain the cell
nucleus. HeLa cells were washed with hHBSS (pH 7.4) and incubated with 1 µL of CellMask
orange (5 µg/mL) in 200 µL hHBSS (pH 7.4) for another 15 to 30 min at 37°C and 5% CO2.
Finally, the cells were washed again with hHBSS (pH 7.4) and live cell images were taken
using the LSM 780 Zeiss inverted confocal microscope equipped with a 63 ×/1.4 numerical
aperture oil medium DIC III objective (Carl Zeiss, Oberkochen, Germany).
Similarly, Caco-2 cells were washed with hHBSS (pH 7.4) and incubated with 400 µL
of PLGA-FPR or CPP-tagged PLGA-FPR (0.72 mg/mL) nanoparticles for 2 h at 37°C and 5%
CO2. After the incubation Caco-2 cells were washed twice with hHBSS (pH 7.4) and further
incubated with 2 µL of Hoechst 33342 (1 mg/mL) in 500 µL hHBSS (pH 7.4) for 10 min at
37°C and 5% CO2 to stain the cell nucleus. Caco-2 cells were washed with hHBSS (pH 7.4)
and incubated with 1 µL of CellMask orange (5 µg/mL) in 500 µL hHBSS (pH 7.4) for another
10 min at 37°C and 5% CO2. Finally, the cells were washed again with hHBSS (pH 7.4) before
the cover glass was removed from the well with tweezers and carefully placed onto a drop of
Fluoromount-G™ to reduce fluorescence bleaching. Caco-2 cells were investigated using the
Nikon A1+ Inverted Confocal Scanning Microscope equipped with a 60 ×/1.4 numerical
aperture PlanApo oil objective (Nikon Instruments, Melville, NY, USA).

Chapter Four
166
Statistical analysis
Experiments for the characterisation of the PLGA-FPR and CPP-tagged PLGA-FPR
nanoparticles were performed at least in triplicate of independent batches and results are
presented as mean ± SD. In vitro cell culture experiments were performed as biological
replicates with at least three repeats and results are presented as mean ± standard error of the
mean (SEM). Student’s t-test was performed to make a comparison between single groups and
obtained p-values were considered statistically significant at p < 0.05.

Chapter Four
167
Results and Discussion
Characterization of CPP-tagged PLGA-FPR nanoparticles
For the in vitro investigation of CPP-tagged PLGA nanoparticles, the PLGA polymer
was replaced by a fluorescent PLGA labelled with the fluorophore FPR 648, which emits red
fluorescence (ʎex wavelength = 648 nm, ʎem wavelength = 672 nm). The fluorescent PLGA
polymer is hereafter referred to as PLGA-FPR. The CPP-tagged PLGA-FPR nanoparticles were
characterized for their physicochemical properties and conjugation efficiencies of CPPs were
determined before investigating in vitro interactions with HeLa and Caco-2 cells.
4.4.1.1 Physicochemical properties of nanoparticles in ultra-pure water
PLGA-FPR and CPP-tagged PLGA-FPR nanoparticles were characterized in ultra-pure
water to obtain their native size and charge. The nanoformulations were monodisperse and
showed a size between 140 and 180 nm for PLGA-FPR and CPP-tagged PLGA-FPR
nanoparticles produced using the post-microfluidics or the in situ microfluidics conjugation
approach (Table 4.2). The surface charge of the CPP-tagged PLGA-FPR nanoparticles
prepared with both conjugation approaches changed from a negative zeta potential of -16 mV
to a positive zeta potential of +8 mV depending on the conjugated CPP (Table 4.2). The
influence of the CPP architecture on the surface charge was discussed earlier in Chapters 2
and 3. Fluorophore-labelled PLGA and CPP-tagged PLGA nanoparticles prepared using the
post-microfluidics and in situ microfluidics conjugation approach had a size below 200 nm, a
similar size distribution, and a similar zeta potential in comparison to PLGA and CPP-tagged
PLGA nanoparticles prepared with the non-labelled PLGA polymer as a precursor material
(Table 4.2 and Chapter 3, Figure 3.4 and Chapter 2, Figure 2.12).

Chapter Four
168
Table 4.2. Characterization of PLGA-FPR and CPP-tagged PLGA-FPR nanoparticles in ultra-
pure water prepared using the post-microfluidics or the in situ microfluidics conjugation
approach. Data are mean ± SD (n = 3).
Nanoparticles Size ± SD (nm) PDI ± SD Zeta potential ±
SD (mV)
Post-microfluidics conjugation approach
PLGA-FPR 176.9 ± 4.5 0.131 ± 0.013 -22.9 ± 0.9
RRH-tagged PLGA-FPR 178.1 ± 1.2 0.130 ± 0.008 -16.3 ± 0.4
TAT-tagged PLGA-FPR 182.5 ± 5.2 0.137 ± 0.017 -2.3 ± 1.2
bTAT-tagged PLGA-FPR 185.1 ± 6.1 0.164 ± 0.017 8.8 ± 0.6
In situ microfluidics conjugation approach
PLGA-FPR 137.4 ± 16.0 0.150 ± 0.021 -13.2 ± 3.1
RRH-tagged PLGA-FPR 139.7 ± 4.6 0.177 ± 0.032 -5.7 ± 3.2
TAT-tagged PLGA-FPR 139.3 ± 1.2 0.172 ± 0.023 -3.1 ± 0.4
bTAT-tagged PLGA-FPR 142.1 ± 7.2 0.161 ± 0.017 1.5 ± 0.3
Further, the conjugation efficiency of each CPP was determined to estimate the amount
of CPP covalently bound to PLGA-FPR nanoparticles formulated with the post-microfluidics
or the in situ microfluidic conjugation approach. Details of the conjugation reaction and
theoretical considerations were discussed earlier in Chapters 2 and 3. Using the fluorophore-
labelled PLGA polymer, the CPP conjugation efficiency was lower compared to the non-
labelled PLGA polymer (Table 4.3). The conjugation efficiencies were 74%, 56% and 80% for
the post-microfluidics conjugation approach and 91%, 29% and 85% for the in situ
microfluidics conjugation approach using RRH, TAT and bTAT, respectively (Chapter 3, Table
3.1 and Chapter 2, Table 2.9). The lower conjugation efficiencies of the three CPPs can be
attributed to the presence of the fluorescent FPR molecules, which were conjugated to the
PLGA polymer to obtain the fluorophore-labelled PLGA polymer. For the conjugation of the
fluorescent dye and the CPPs, the carboxyl groups of the PLGA polymer were utilized and
therefore a lower number of carboxyl groups remained available for conjugation of CPPs. One
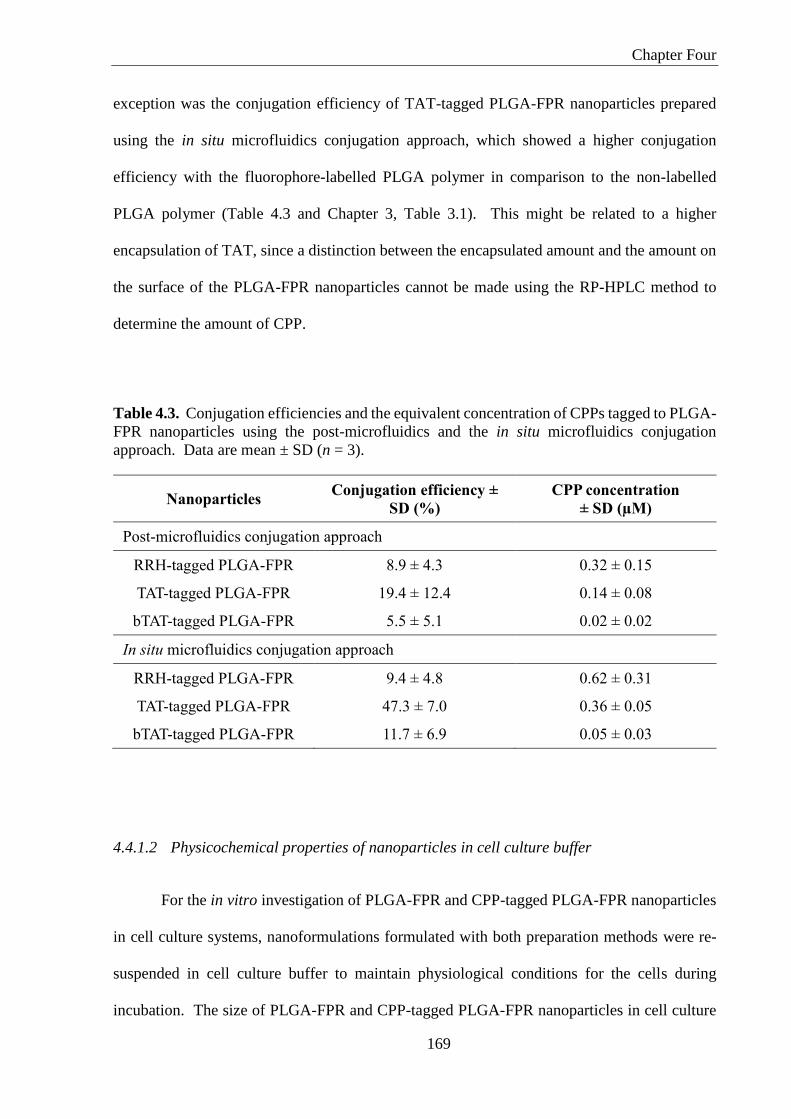
Chapter Four
169
exception was the conjugation efficiency of TAT-tagged PLGA-FPR nanoparticles prepared
using the in situ microfluidics conjugation approach, which showed a higher conjugation
efficiency with the fluorophore-labelled PLGA polymer in comparison to the non-labelled
PLGA polymer (Table 4.3 and Chapter 3, Table 3.1). This might be related to a higher
encapsulation of TAT, since a distinction between the encapsulated amount and the amount on
the surface of the PLGA-FPR nanoparticles cannot be made using the RP-HPLC method to
determine the amount of CPP.
Table 4.3. Conjugation efficiencies and the equivalent concentration of CPPs tagged to PLGA-
FPR nanoparticles using the post-microfluidics and the in situ microfluidics conjugation
approach. Data are mean ± SD (n = 3).
Nanoparticles Conjugation efficiency ±
SD (%)
CPP concentration
± SD (µM)
Post-microfluidics conjugation approach
RRH-tagged PLGA-FPR 8.9 ± 4.3 0.32 ± 0.15
TAT-tagged PLGA-FPR 19.4 ± 12.4 0.14 ± 0.08
bTAT-tagged PLGA-FPR 5.5 ± 5.1 0.02 ± 0.02
In situ microfluidics conjugation approach
RRH-tagged PLGA-FPR 9.4 ± 4.8 0.62 ± 0.31
TAT-tagged PLGA-FPR 47.3 ± 7.0 0.36 ± 0.05
bTAT-tagged PLGA-FPR 11.7 ± 6.9 0.05 ± 0.03
4.4.1.2 Physicochemical properties of nanoparticles in cell culture buffer
For the in vitro investigation of PLGA-FPR and CPP-tagged PLGA-FPR nanoparticles
in cell culture systems, nanoformulations formulated with both preparation methods were re-
suspended in cell culture buffer to maintain physiological conditions for the cells during
incubation. The size of PLGA-FPR and CPP-tagged PLGA-FPR nanoparticles in cell culture

Chapter Four
170
buffer was found to be between 175 and 245 nm with a PDI below 0.250 indicating that the
nanoformulations were monodisperse (Table 4.4 and Table 4.5). Similarly, the size and surface
charge of OVA-loaded chitosan nanoparticles was influenced by their suspension in HBSS in
comparison to ultra-pure water with a size increase from 126 to 196 nm and a decrease in the
surface charge from +38 to +10 mV when HBSS was the suspending media (Cole et al., 2018).
Here, the surface charge of the nanoformulations was between -8 and -2 mV, which showed the
influence of the cell culture buffer (hHBBS) (Table 4.4 and Table 4.5). Due to the presence of
salts and proteins in the cell culture buffer, it is likely that an electrostatic reaction between the
positively charged CPPs and negatively charged ions leads to the formation of a salt/protein
corona around the nanoparticles and an increase in the hydrodynamic diameter. In addition, it
is likely that the salts and proteins present in the cell culture buffer also influenced the surface
charge of the CPP-tagged PLGA-FPR nanoparticles and therefore positive charged induced by
CPP architecture were shielded and did not contribute to the overall surface charge. Since the
zeta potential for all formulations was similar, the surface charge as a factor for enhancing
cellular uptake of nanoparticles could be excluded and any difference in cellular uptake can be
related to the CPP architecture used for the conjugation with PLGA-FPR nanoparticles.

Chapter Four
171
Table 4.4. Characterization of PLGA-FPR and CPP-tagged PLGA-FPR nanoparticles in cell
culture buffer for in vitro studies in HeLa cells prepared using the post-microfluidics and the in
situ microfluidics conjugation approach. Data are mean ± SD (n = 6).
Nanoparticles Size ± SD (nm) PDI ± SD Zeta potential ±
SD (mV)
Post-microfluidics conjugation approach
PLGA-FPR 204.3 ± 10.6 0.165 ± 0.032 -8.2 ± 0.7
RRH-tagged PLGA-FPR 210.2 ± 5.8 0.176 ± 0.037 -8.1 ± 0.6
TAT-tagged PLGA-FPR 213.6 ± 3.0 0.151 ± 0.044 -3.5 ± 0.5
bTAT-tagged PLGA-FPR 210.7 ± 12.4 0.169 ± 0.006 -3.2 ± 1.2
In situ microfluidics conjugation approach
PLGA-FPR 216.9 ± 15.2 0.194 ± 0.073 -5.3 ± 2.2
RRH-tagged PLGA-FPR 241.8 ± 15.3 0.253 ± 0.028 -6.6 ± 1.9
TAT-tagged PLGA-FPR 245.4 ± 6.7 0.238 ± 0.018 -5.0 ± 0.4
bTAT-tagged PLGA-FPR 240.5 ± 30.8 0.236 ± 0.064 -4.6 ± 1.2
Table 4.5. Characterization of PLGA-FPR and CPP-tagged PLGA-FPR nanoparticles in cell
culture buffer for in vitro studies in Caco-2 cells prepared using the post-microfluidics
conjugation approach. Data are mean ± SD (n = 6).
Nanoparticles Size ± SD (nm) PDI ± SD Zeta potential ±
SD (mV)
Post-microfluidics conjugation approach
PLGA-FPR 175.4 ± 7.2 0.165 ± 0.037 -4.0 ± 1.0
RRH-tagged PLGA-FPR 176.6 ± 4.6 0.164 ± 0.022 -3.8 ± 2.2
TAT-tagged PLGA-FPR 185.1 ± 10.1 0.199 ± 0.054 -2.0 ± 1.2
bTAT-tagged PLGA-FPR 194.4 ± 14.1 0.234 ± 0.065 -4.1 ± 2.8

Chapter Four
172
Interaction of nanoformulations with HeLa cells
The interactions between CPP-tagged PLGA-FPR nanoparticles and the nano-bio
interface of cells were first investigated with HeLa cells. For the in vitro cell experiments with
HeLa cells, PLGA-FPR and CPP-tagged PLGA-FPR nanoparticles were prepared using the
post-microfluidics or the in situ microfluidics conjugation approach. The CPPs used in the
study are described by their distinct architecture including a short (RRH), a long linear (TAT)
and a branched peptide sequence (bTAT) (Chapter 2, Figure 2.5).
4.4.2.1 Cell viability of HeLa cells
The effect of nanoformulations on the cell viability of HeLa cells was investigated using
the MTS assay. The MTS assay is an end-point assay for the determination of viable cells and
utilizes an electron transfer reaction from the electron coupling reagent (PMS or PES) to the
tetrazolium salt (MTS) (Jacobsen et al., 1996). The electron transfer can only occur if viable
cells are present and the absorbance of the resulting coloured formazan product can be directly
related to the viability of the cells (Cory et al., 1991). Cell viability of HeLa cells was
investigated after incubation with PLGA-FPR and CPP-tagged PLGA-FPR nanoparticles for
1 h (Figure 4.2A and B). The nanoformulations were tested at three different concentrations
and the negative control was set to 100% as indicated by the black line in the cell viability
graphs (Figure 4.2). HeLa cells were viable after incubation with PLGA-FPR and CPP-tagged
PLGA-FPR nanoparticles, indicating that the nanoformulations in different concentrations had
no toxic effect on the cells. As reported in the literature, unmodified PLGA nanoparticles with
concentrations between 0.625 and 2.5 mg/mL were non-toxic to HeLa cells after 48 h of
incubation (Egusquiaguirre et al., 2015). In contrast, a decrease in cell viability of HeLa cells
incubated with PLGA nanoparticles for 48 h to below 70% was reported at a concentration

Chapter Four
173
of ≥ 0.2 mg/mL (Chen et al., 2017a). In the present study, the nanoparticle concentrations
ranged between 0.09 and 0.9 mg/mL for PLGA-FPR nanoparticles and did not show a negative
influence on cell viability. An influence on the cell viability was not expected since the PLGA
polymer is biocompatible and no toxicity was induced by the fluorescent label of the PLGA
polymer. RRH-tagged PLGA-FPR nanoparticles formulated with both preparation methods
showed a decrease in cell viability to 84%, which was lower, compared to other CPP-tagged
PLGA-FPR nanoparticles, but the cell viability was acceptable for using a concentration of 0.90
mg/mL in further in vitro experiments. CPP-modified PLGA nanoparticles (0.625-2.5 mg/mL)
were reported to maintain moderate viability levels in HeLa cells and cell viability decreased
with higher concentrations of nanoparticles administered (Egusquiaguirre et al., 2015). Feiner-
Gracia et al. (2018) found a reduction in cell viability to about 60% when TAT-modified
nanoparticles were used in a concentration of 3 mg/mL in comparison to 0.3 mg/mL after 24 h
incubation in HeLa cells and the toxicity was attributed to the positive charges of TAT-modified
PLGA nanoparticles. Further, HeLa cells were incubated with five different concentrations of
the three CPPs, RRH, TAT and bTAT, ranging from 1 to 100 µM. For all concentrations, HeLa
cells showed a cell viability of above 91% indicating that the CPPs were non-toxic (Figure
4.2C). This is in alignment with a study by Trehin et al. (2004) that showed that TAT (47-57)
was non-toxic to lung cancer (Calu-3 cells) and buccal mucosa cells (TR146) at concentrations
between 10 and 100 µM.

Chapter Four
174
Figure 4.2. Cell viability of HeLa cells after 1 h incubation with PLGA-FPR and CPP-tagged
PLGA-FPR nanoparticles prepared using the post-microfluidics (A) or in situ microfluidics (B)
conjugation approach and CPP solutions with different concentrations (C). The black line
indicates 100% as negative control. Data are means ± SEM (n = 3). NPs = nanoparticles.

Chapter Four
175
4.4.2.2 Quantification of cellular uptake of nanoparticles in HeLa cells
Flow cytometry was used to quantify the cellular uptake of PLGA-FPR and CPP-tagged
PLGA-FPR nanoparticles prepared using the post-microfluidics and the in situ microfluidics
conjugation approach in HeLa cells (Figure 4.3). By using flow cytometry analysis, individual
cells are analysed for their fluorescence intensity using forward/sideward light scattering. Flow
cytometry analysis revealed that the mean fluorescence intensity of HeLa cells incubated with
PLGA-FPR and CPP-tagged PLGA-FPR nanoparticles was similar to the control, HeLa cells
incubated with cell culture buffer, or approximately up to 1.7-fold higher. The low increase in
fluorescence intensity between control cells and HeLa cells treated with nanoformulations
indicates a low internalization efficiency of the nanoformulations (Figure 4.3). PLGA-FPR and
CPP-tagged PLGA-FPR nanoparticles were applied to HeLa cells in different concentrations
ranging between 0.05 and 0.90 mg/mL, but a concentration-dependent uptake of the
nanoformulations was not observed. Further, higher cellular uptake was expected for the
branched CPP bTAT, but this was not observed. Arginine-rich dendrimers based on TAT
showed 10-15 times higher fluorescence after incubation with HeLa cells for 1 h in comparison
to the linear TAT (Eggimann et al., 2014). The addition of the branched CPP to a polymeric
carrier might influence the penetration abilities of the branched CPP as in the literature, uptake
of sequence-modified CPPs were reported for the CPPs only (Brock et al., 2018; Hoyer et al.,
2012; Zhao et al., 2014a). One exception was the TAT-tagged PLGA-FPR nanoparticles
prepared with the post-microfluidics conjugation approach, which showed a 1.8 and 1.6-fold
higher uptake in comparison to PLGA-FPR nanoparticles when a concentration of 0.90 mg/mL
or the 1:2 dilution of that concentration was used, respectively (Figure 4.3A). The increase in
uptake was significant for the 1:2 dilution in comparison to the PLGA-FPR nanoparticles. HeLa
cells were washed with heparin to remove membrane-associated nanoformulations (Iwasa et
al., 2006; Patel et al., 2019) and therefore a contribution of membrane-associated nanoparticles

Chapter Four
176
to the fluorescence intensity was unlikely. Spider silk protein nanoparticles modified with TAT
or R8 and with a size below 300 nm showed that after incubation for 24 or 48 h up to 60% of
cultured HeLa cells contained nanoparticles (Elsner et al., 2015). Cellular uptake of
lyophilisomes, hollow micro- or nano-meter capsules made of albumin, with a size below 1 µm
was investigated with flow cytometry and trypan blue was used to quench the fluorescence of
membrane-associated lyophilisomes (van Bracht et al., 2014). Double the amount of
lyophilisome positive cells in the HeLa cell population were observed over 4 h for TAT-
conjugated lyophilisomes in comparison to unmodified lyophilisomes (van Bracht et al., 2014).
These two studies claim that HeLa cells were able to take up nanoparticles with a size > 200
nm as fluorescence was tested with flow cytometry after trypan blue treatment (Elsner et al.,
2015; van Bracht et al., 2014). The main difference to the present study was the time selected
for the incubation with HeLa cells. The literature reports suggest that longer incubation times
between 4 to 48 h may be required for the efficient internalization of CPP-tagged PLGA-FPR
nanoparticles in HeLa cells. In the present study, a shorter incubation time of 1 h was selected
to investigate the likelihood of the initial contact between the CPPs with different architectures
and the cells. Further, the internalization of CPP solutions including penetratin and branched
peptides is reported in the literature after 1 h in HeLa cells (Birch et al., 2017; Monreal et al.,
2015; Saleh et al., 2010) indicating that cell interactions occur within a short time.

Chapter Four
177
Figure 4.3. Fluorescence intensity measured in HeLa cells after 1 h incubation with different
dilutions of PLGA-FPR and CPP-tagged PLGA-FPR nanoparticles prepared using the post-
microfluidics (A) or the in situ microfluidics (B) conjugation approach. Control cells were
incubated with cell culture buffer. Data are means ± SEM (n = 3). * p-value < 0.05 for
comparison between PLGA-FPR and TAT-tagged PLGA-FPR nanoparticles. NPs =
nanoparticles.
4.4.2.3 Qualification of cellular uptake of nanoparticles in HeLa cells
For qualitative microscopic analysis, HeLa cells were incubated with PLGA-FPR and
CPP-tagged PLGA-FPR nanoparticles prepared using the post-microfluidics or the in situ
Chapter Four
178
microfluidics conjugation approach. In order to observe the HeLa cells under the microscope,
the cell nucleus was stained with Hoechst 33342 and the cell membrane was stained with
CellMask™ Orange plasma membrane stain appearing in blue and green, respectively.
Confocal images showed association of the PLGA-FPR and CPP-tagged PLGA-FPR
nanoparticles to the cell membrane of HeLa cells after incubation for 1 h. This observation was
made for nanoparticles prepared using the post-microfluidics (Figure 4.4) and the in situ
microfluidics conjugation approach (Figure 4.5). A study by Chen et al. (2017a) showed
overlapping fluorescence of doxorubicin-loaded PLGA-PEG-folic acid nanoparticles with the
nucleus after 4 and 24 h of incubation indicating that a longer incubation time was needed for
the uptake of polymeric nanoparticles in HeLa cells. No difference in cellular interactions of
PLGA-FPR nanoparticles tagged with the three CPPs: RRH, TAT and bTAT nor a difference
between preparation methods was observed. For example, confocal images of TAT-tagged
PLGA-FPR nanoparticles prepared using the post-microfluidics and the in situ microfluidics
conjugation approach showed a similar even distribution of the nanoparticles and association
of the nanoparticles with the cell membrane of HeLa cells (Figure 4.4C and Figure 4.5C). The
larger cluster of TAT-tagged PLGA-FPR nanoparticles prepared using the in situ microfluidics
conjugation can be related to aggregation of the nanoparticles (Figure 4.4C). Improvement of
internalization was reported in the literature for PLGA nanoparticles modified with
fluorophore-labelled CPPs at a concentration of 5 mg/mL after incubation in HeLa cells for 4
to 72 h, whereas no efficient internalization of PLGA nanoparticles on their own was observed
(Egusquiaguirre et al., 2015). Another study also observed uptake after incubation in HeLa
cells for 4 h with TAT-modified lyophilisomes in comparison to unmodified lyophilisomes (van
Bracht et al., 2014). As for PLGA-FPR nanoparticles, the incubation time is crucial for CPP-
modified nanoparticles to show efficient uptake into HeLa cells.
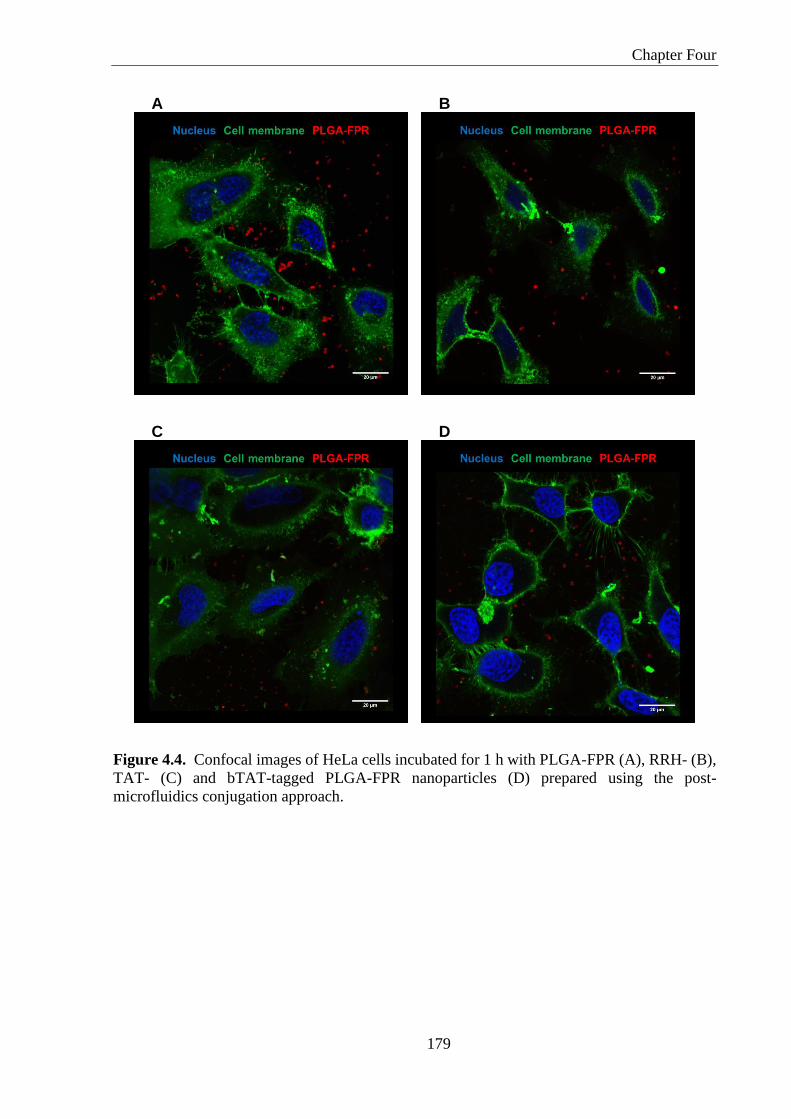
Chapter Four
179
A B
C D
Figure 4.4. Confocal images of HeLa cells incubated for 1 h with PLGA-FPR (A), RRH- (B),
TAT- (C) and bTAT-tagged PLGA-FPR nanoparticles (D) prepared using the post-
microfluidics conjugation approach.

Chapter Four
180
A B
C D
Figure 4.5. Confocal images of HeLa cells incubated for 1 h with PLGA-FPR (A), RRH- (B),
TAT- (C) and bTAT-tagged PLGA-FPR nanoparticles (D) prepared using the in situ
microfluidics conjugation approach.
As observed from the confocal images for PLGA-FPR and CPP-tagged PLGA-FPR
nanoparticles, the cell membrane appeared intact after incubation with the nanoformulations.
Further, as red fluorescence can be observed between the HeLa cells, an interaction of PLGA-
FPR or CPP-tagged PLGA-FPR nanoparticles with the coating of the cell culture µ-slides

Chapter Four
181
cannot be excluded. The µ-slides were coated with collagen IV displaying a neutral charge at
physiological pH and HeLa cells were not confluent leaving space between them and the
possibility of interactions between the nanoformulations and the coating.
Interaction of nanoformulations with Caco-2 cells
Caco-2 cell monolayers are frequently used as a model for the intestinal epithelium and
the cell line was selected to evaluate the potential of CPP-tagged PLGA-FPR nanoparticles as
an oral drug delivery system. Based on the similar results obtained with HeLa cells for PLGA-
FPR and CPP-tagged PLGA-FPR nanoparticles prepared using both conjugation approaches,
further experiments were performed with CPP-tagged PLGA-FPR nanoparticles prepared using
the post-microfluidics conjugation approach only. The CPPs are present on the surface of
PLGA-FPR nanoparticles after post-microfluidics conjugation (Streck et al., 2019b) and
therefore interactions between CPPs and the cell surface are more likely. The in situ
microfluidics conjugation approach also encapsulates the CPPs, which cannot contribute to cell
interactions. In this thesis, Caco-2 cells were grown as cell monolayers and for analysis of cell
viability and uptake of nanoparticles with CLSM an intact cell monolayer was used, whereas
for analysis of uptake using flow cytometry the cell monolayer was suspended into single cells.
4.4.3.1 Cell viability and cell integrity of Caco-2 cells
The influence of PLGA-FPR and CPP-tagged PLGA-FPR nanoparticles on the viability
of Caco-2 cells was evaluated after incubation for 2 h (Figure 4.6). The PLGA-FPR and CPP-
tagged PLGA nanoparticles were non-toxic to Caco-2 cells and the cell viability was above
90%. Previous studies reported that surface-modified and drug-loaded PLGA nanoparticles
were non-toxic to Caco-2 cells at concentrations between 2 mg/mL to 5 mg/well after

Chapter Four
182
incubation for 2-4 h (Czuba et al., 2018; Sheng et al., 2016). TAT- and R8-modified PLGA
and R8-modified PLGA-PEG nanoparticles showed cell viability above 80% after 2-6 h
incubation in Caco-2 cells (Liu et al., 2013; Zhu et al., 2016a). Further, CPP solutions with
concentrations ranging between 0.05 and 20 µM were non-toxic to Caco-2 cells and showed a
cell viability of around 100% (Figure 4.6B). In the present study, no toxicity of the CPPs was
found and the concentrations used were lower compared to the concentration used in HeLa cells
(Section 4.4.2.1) and in other cell lines as described in the literature (Section 4.4.2.1).

Chapter Four
183
Figure 4.6. Cell viability graphs of Caco-2 cells after 2 h incubation with PLGA-FPR and
CPP-tagged PLGA-FPR nanoparticles prepared using the post-microfluidics conjugation
approach (A) and CPP solutions with different concentrations (B). The black line indicates
100% as negative control. Data are means ± SEM (n = 3). NPs = nanoparticles.
The TEER value is the main measurement of epithelial integrity and primarily reflects
the tightness of the tight junctions between cells (Mukherjee et al., 2004). During the culturing
of Caco-2 cells on permeable filter inserts, the TEER value increases as the cells grow into a

Chapter Four
184
monolayer (Mukherjee et al., 2004). The TEER value of the Caco-2 cell monolayer was
monitored between day 17 and day 22 after seeding the Caco-2 cells on cell culture inserts with
a permeable membrane and a TEERCaco-2 cell monolayer value of 352 Ω×cm2 was reached by day
20 showing the presence of a tight cell monolayer (Appendix VI). Minimum TEER values
between 200 and 450 Ω×cm2 have been reported in the literature as a threshold for a Caco-2
cell monolayer to be used as a model for intestinal epithelium (Banerjee et al., 2016; Beduneau
et al., 2014; Birch et al., 2018a; Faralli et al., 2019; Mu et al., 2019).
4.4.3.2 Quantification of cellular uptake of nanoparticles in Caco-2 cells
The cellular uptake of PLGA-FPR and CPP-tagged PLGA-FPR nanoparticles was
measured at different time points to investigate the time-dependent behaviour of the
nanoformulations with Caco-2 cells. Before flow cytometry analysis, the Caco-2 cells were
washed with heparin to remove any membrane-associated nanoformulations (Iwasa et al., 2006;
Patel et al., 2019). The cellular uptake of the nanoformulations was expressed as percentage
fluorescence and was found to be between 2.5 to 5% after 2 h incubation (Figure 4.7A). PLGA-
FPR nanoparticles showed the highest uptake into Caco-2 cells, but without being significantly
different from the uptake of the CPP-tagged PLGA nanoparticles. After 6 h incubation, there
was no increase in cellular uptake, indicating that a longer incubation time was not necessarily
beneficial for the uptake of nanoformulations into Caco-2 cells (Figure 4.7A). Overall, the
findings showed very low uptake of the PLGA-FPR and CPP-tagged PLGA-FPR nanoparticles
in Caco-2 cells. Reports from the literature showed internalisation due to the increase or shift
of mean fluorescence intensity of PLGA nanoparticles in Caco-2 cells in comparison to control
formulations or dye solutions after incubation times between 1 and 4 h (Czuba et al., 2018;
Joshi et al., 2016). CPP-modified proliposomes, reconstituted from dry liposomal formulations

Chapter Four
185
before use, showed an initial higher uptake at 2 h, but at a time point of 4 h the mean
fluorescence intensity for different proliposome formulations, with and without CPPs showed
similar levels (Tunsirikongkon et al., 2019). The study was performed with individual Caco-2
cells that were allowed to adhere overnight and mean fluorescence intensity of control cells
without treatment for comparison was not reported.
The cell viability of Caco-2 cells was assessed over the time of the kinetic experiment
using propidium iodide. The Caco-2 cells were viable and no toxicity was induced by the
nanoformulations over the incubation period of 6 h (Figure 4.7B). Propidium iodide is taken
up by dead cells and intercalates with DNA resulting in a red fluorescence and detection of
propidium iodide-positive cell with flow cytometry indicates toxicity (Totterman et al., 1997).

Chapter Four
186
Figure 4.7. Uptake of PLGA-FPR and CPP-tagged PLGA-FPR nanoparticles prepared using
the post-microfluidics conjugation approach in Caco-2 cells after incubation for different time
points (0.5, 2 and 6 h) (A) and cell viability assessed with propidium iodide staining (B). Data
are means ± SEM (n = 3). NPs = nanoparticles.
Possible reasons for the low uptake found in the present study can be related to the Caco-
2 cells and to the used nanoformulations. The Caco-2 cells were grown as a monolayer for 21
days before the quantitative and qualitative uptake experiments to generate cells that represent
similar characteristics to the intestinal epithelium. With longer culturing times (> 14 days) the
Chapter Four
187
Caco-2 cell monolayer represents a tight barrier due to fully developed tight junctions and
internalisation of nanoparticles less favourable. Further, the conjugation efficiencies of the
CPPs using the post-microfluidics conjugation approach were below 20% and therefore, the
amount of CPP present might have been too low to enhance interactions with the cell surface.
In the literature, evidence of cellular uptake is found for unmodified and surface-
modified nanoparticles including polymeric nanoparticles and liposomal formulations (Czuba
et al., 2018; Joshi et al., 2016; Tunsirikongkon et al., 2019), but transport across epithelia is
often reported to be low. Reasons for low transport include possible exocytosis of nanoparticles
towards the apical and basolateral side of the Caco-2 cell monolayer after internalization and
during incubation for longer time points (Zhuang et al., 2018). Also, the culturing times for
Caco-2 cells used for uptake studies vary greatly between 24 h (Joshi et al., 2016;
Tunsirikongkon et al., 2019) and 14 and 21 days (Czuba et al., 2018; Zhuang et al., 2018) of
culturing, making the comparison of results difficult.
Since the ability of CPP-tagged PLGA-FPR nanoparticles to penetrate into Caco-2 cell
monolayers was low, an association of the CPP-tagged PLGA-FPR nanoparticles was
investigated. Flow cytometry data presented in Figure 4.8 shows the percent uptake of
nanoformulations into Caco-2 cells after the cells were treated with heparin during sample
preparation for the removal of membrane-associated nanoparticles. In order to discriminate
between uptake and membrane-associated nanoparticles, a heparin treatment can be applied to
cells (Iwasa et al., 2006; Patel et al., 2019). For evaluating the relative amount of membrane-
associated nanoformulations, Caco-2 cells were incubated for 2 h with PLGA-FPR and CPP-
tagged PLGA-FPR nanoparticles and analysed without heparin treatment. The comparison

Chapter Four
188
between heparin treatment and no heparin treatment indicated that the amount of membrane-
associated nanoformulation was low since the uptake, including membrane-associated
nanoformulations, remained below 10% without heparin treatment (Figure 4.8). There was a
2 and 2.5-fold increase in percent uptake for PLGA-FPR and bTAT-tagged PLGA-FPR
nanoparticles, respectively, when no heparin treatment was applied. The percent uptake for
RRH- and TAT-tagged PLGA-FPR nanoparticles showed no difference between heparin
treatment and no heparin treatment. Overall, this indicates that the increase in apparent uptake
is related to the membrane-associated nanoparticles, which could be taken up into cells with
longer incubation times.
Figure 4.8. Comparison of uptake of PLGA-FPR and CPP-tagged PLGA-FPR nanoparticles
after heparin treatment and no heparin treatment in Caco-2 cells after incubation for 2 h. Cells
were either washed with heparin (20 µg/mL in DPBS, pH 7.4) or washed with DPBS (pH 7.4)
without heparin. Data are means ± SEM (n = 3). * p-value < 0.05 for comparison between
samples prepared with or without heparin treatment. NPs = nanoparticles.

Chapter Four
189
4.4.3.3 Qualification of cellular uptake in Caco-2 cells
CLSM was applied for the qualitative assessment of the cellular uptake of PLGA-FPR
and CPP-tagged PLGA-FPR nanoparticles in Caco-2 cells. In order to observe the Caco-2 cell
monolayer under the microscope, the cell nucleus and the cell membrane were stained as
described for HeLa cells. After incubation of the Caco-2 cell monolayer with PLGA-FPR
nanoparticles, a red fluorescence of PLGA-FPR nanoparticles was observed within the
monolayer (Figure 4.9A). TAT-tagged PLGA-FPR nanoparticles showed some red
fluorescence in the Caco-2 cell monolayer indicating little uptake of the nanoparticles (Figure
4.9C). Uptake studies of nanoparticles containing PLGA are well-reported in the literature. A
study by Cartiera et al. (2009) found that uptake of rhodamine-loaded PLGA nanoparticles with
a size below 100 nm was low and after 24 h of incubation, an association to the Caco-2 cell
monolayer with an age between 14 to 21 days was observed. Further, PLGA nanoparticles
were found to accumulate in the cell cytoplasm and nucleus of Caco-2 cells (Win and Feng,
2005) and the observed fluorescence intensity was time- and concentration-dependent (He et
al., 2013; Joshi et al., 2016; Katsikari et al., 2009). Other studies using confocal microscopy
showed that positively charged, lipid-modified PLA-PEG nanoparticles had a better uptake
after 0.5 h incubation in Caco-2 cells compared to neutral and negatively charged lipid-modified
PLA-PEG nanoparticles (Du et al., 2018). Also, chitosan-coated PLGA nanoparticles with a
positive surface charge showed stronger fluorescence than uncoated nanoparticles after 2 h
incubation in Caco-2 cell monolayer (Sheng et al., 2015). Uptake studies with CPP-modified
nanoparticles showed stronger fluorescence of TAT- and R8-modified nanoparticles in
comparison to unmodified nanoparticles after incubation with Caco-2 cells for 1 h to 4 h (Chen
et al., 2017b; Koch et al., 2005; Tunsirikongkon et al., 2019; Zhu et al., 2016a). In contrast to
the literature, in this study very little evidence was found that PLGA-FPR and TAT-tagged
PLGA-FPR nanoparticles are taken up by Caco-2 cells.

Chapter Four
190
A B
C D
Figure 4.9. Representative confocal images of Caco-2 cell monolayer incubated for 2 h with
PLGA-FPR (A), RRH- (B), TAT- (C) and bTAT-tagged PLGA-FPR nanoparticles (D)
prepared using the post-microfluidics conjugation approach. The white arrow is pointing
towards red fluorescence of PLGA-FPR nanoparticles or CPP-tagged PLGA-FPR
nanoparticles.
In contrast to TAT-tagged PLGA-FPR nanoparticles, no uptake of RRH- and bTAT-
tagged PLGA-FPR nanoparticles was observed within the Caco-2 cell monolayer (Figure 4.9B
and D). To further evaluate the localization of the CPP-tagged PLGA-FPR nanoparticles z-
stack images of Caco-2 cells were taken. The red fluorescence related to the CPP-tagged PLGA-
FPR nanoparticles was observed towards the top layer of the Caco-2 cell monolayer indicating

Chapter Four
191
an association with the cell membrane (Appendix VII). This association might be rather weak
since little red fluorescence was seen. A difference in the behaviour of the CPP-tagged PLGA-
FPR nanoparticles depending on the CPP architecture was not observed (Figure 4.9B, C and
D). The confocal images of the Caco-2 cell monolayer showed the integrity of the cell
membrane after incubation with the nanoformulations.
As discussed earlier, a comparison between the results published in the literature and
results presented in this thesis is difficult as culturing times and analysis protocols vary greatly.
In the literature, Caco-2 cells were of different ages (Cartiera et al., 2009; Katsikari et al., 2009;
Sheng et al., 2015; Tunsirikongkon et al., 2019; Win and Feng, 2005), had a confluence of 70-
85% (Cartiera et al., 2009; Chen et al., 2017b; Du et al., 2018; He et al., 2013; Joshi et al.,
2016), were fixed during sample preparation and either cell nucleus or cell membrane were
stained (Cartiera et al., 2009; Joshi et al., 2016; Katsikari et al., 2009; Koch et al., 2005; Sheng
et al., 2015). In the present study, Caco-2 cells were cultured for 21 days to obtain a tight
monolayer comparable with the small intestine. Culturing times of Caco-2 cells in literature
are often less than 21 days and therefore no tight Caco-2 cell monolayer has developed and
nanoparticles can penetrate easier into cells. In addition, the Caco-2 cells in the present study
were not fixed to avoid artefacts introduced by the fixation process and cell compartments such
as cell nucleus and membrane were stained to distinguish between the compartments. In
particular, the age of Caco-2 cells has an influence on cellular uptake and the observation of no
uptake might be related to the tight monolayer formed after 21 days.
The observation of no uptake for CPP-tagged PLGA nanoparticles in Caco-2 cells can
also be related to little interaction between the CPPs and cells and a low concentration of CPP-

Chapter Four
192
tagged PLGA-FPR nanoparticles reaching the cell surface. As discussed earlier, the amount of
CPPs on PLGA-FPR nanoparticles was below 20% and in order to increase the amount of CPP,
the fluorophore-labelled PLGA polymer can be spiked with non-labelled PLGA polymer. The
addition of non-labelled PLGA will increase the amount of available carboxyl groups used for
the conjugation of CPPs and thus the concentration of CPPs on the polymeric nanoparticles can
be increased. Further, calculations to estimate the delivered dose can be applied to optimise the
amount of nanoparticles that are actually reaching the cell surface. Increasing the nanoparticle
concentration at the cell surface is crucial to ensure interactions between the cells and
nanoparticles.
Conclusion
The physiochemical characteristics of CPP-tagged PLGA-FPR nanoparticles were
controlled by the CPP architecture as previously observed for non-fluorescent PLGA.
Changing the media from ultra-pure water to cell culture buffer resulted in larger PLGA-FPR
and CPP-tagged PLGA-FPR nanoparticles (up to 250 nm) with a slightly negative surface
charge. Further, the conjugation efficiency of CPPs to the fluorophore-labelled PLGA was low
as binding sites for CPP conjugation were partly occupied by the fluorophore. The PLGA-FPR
and CPP-tagged PLGA-FPR were non-toxic to HeLa and Caco-2 cells and showed low uptake
in both HeLa cells and Caco-2 cells. An influence of CPP architecture on the uptake of CPP-
tagged PLGA-FPR nanoparticles was not found, but CPP-tagged PLGA-FPR nanoparticles
prepared using the post-microfluidics conjugation approach showed a slightly higher uptake in
HeLa in comparison to CPP-tagged PLGA-FPR nanoparticles prepared using the in situ
microfluidics conjugation approach. There was a trend for increased uptake in Caco-2 cells
with longer incubations time of the nanoformulations. The low cellular uptake observed with

Chapter Four
193
flow cytometry was supported by the confocal images for the nanoformulations in both cell
lines. In addition, the confocal images indicated an association rather than uptake of the PLGA-
FPR and CPP-tagged PLGA-FPR nanoparticles.

5 Chapter Five
General discussion and future directions

Chapter Five
195
Introduction and general summary
Nanoparticulate drug delivery systems are of great interest to assist in the treatment of
a range of different diseases that require biomacromolecules, such as proteins and peptides, as
the therapeutic agent. Efficient delivery of drugs in nanoparticles after oral administration
depends on the ability of the nanoparticles to shield and deliver the drug to the site of action.
Encapsulation of biomacromolecules in nanoparticles protects the fragile drug against the harsh
environment in the GIT following oral ingestion. One strategy to enhance nanoparticle-cell
interactions after oral administration is the surface modification of polymeric nanoparticles with
cell-penetrating peptides (CPPs) to increase interaction of the delivery system with the intestinal
epithelium. Cellular internalisation of nanoparticles decorated with CPPs, such as TAT, is
reported in the literature (Feiner-Gracia et al., 2018; van Bracht et al., 2014), however the
surface modification of polymeric nanoparticles with CPPs of different architectures has not
yet been explored. In this thesis, the hypothesis is that the CPP architecture influences
nanoparticle-cell interactions and therefore novel surface-modified polymeric nanoparticles
were designed as an oral drug delivery system to test this hypothesis. PLGA nanoparticles were
surface-modified with CPPs of different architectures and the physicochemical properties of
CPP-tagged PLGA nanoparticles were tuned by using CPPs of different architectures (Chapters
2 and 3). The distribution of CPPs on PLGA nanoparticles depends on the conjugation
approach used for the preparation of CPP-tagged PLGA nanoparticles (Chapter 3). Association
instead of uptake was found as between CPP-tagged PLGA nanoparticles and two different cell
lines in in vitro cell culture studies (Chapter 4). The in vitro study with Caco-2 cells was used
to evaluate the nanoparticle-cell interactions using a cell culture model representing the human
intestinal epithelium. The in vitro study indicated association of the CPP-tagged PLGA
nanoparticles with the cell membrane, in particular of nanoparticles surface-modified with the
branched CPP. The observed nanoparticle-cell interactions represent the initial step before

Chapter Five
196
internalisation of nanoparticles into Caco-2 cells. The presented results are valuable for a better
understanding of nanoparticle-cell interactions of CPP-tagged PLGA nanoparticles utilizing the
oral route of administration. Therefore, the title displays the crucial parts of the thesis including
CPPs, the use of nanoformulations and the aim of oral administration in a broad context. The
present Chapter firstly discusses the relevance of the results obtained in each Chapter in a
broader context and then gives future direction for the further development of the
nanoformulations.
Application of research in the wider research area
Surface modification of nanoparticles is a prudent approach to increase interactions
between nanoparticles and the epithelium in the small intestine. Generally, nanoparticles are
surface-modified to increase blood circulation time and avoid opsonisation by macrophages
(Partikel et al., 2019), for the targeting of specific cell-receptors on the cell surface
(Bartheldyova et al., 2018) and to introduce positive charges on the nanoparticle surface
(Feiner-Gracia et al., 2018). For these purposes, specific groups such as PEG, receptor-specific
ligands and CPPs can be used, respectively. In this thesis, three CPPs with a distinct architecture
were used namely the short RRH, the long linear TAT and the branched TAT (Chapter 2). The
results presented in Chapter 2 show that after surface modification with CPPs, the surface of
PLGA nanoparticles was tuned from slightly negative to slightly positive values depending on
the CPP architecture. Of particular interest was the suitability of the branched CPP for surface
modification of polymeric nanoparticles. To the best of my knowledge branched CPPs has not
yet been conjugated to polymeric nanoparticles before. Further, modifications of the CPP
sequence have been of great interest and an increase in positive charges in the CPP sequence
was reported to enhance cellular uptake (Brock et al., 2018). In this thesis, the novel branched
Chapter Five
197
CPP, bTAT, was designed based on the known peptides TAT and RRH. As demonstrated in
Chapter 2, the branched CPP can be conjugated to polymeric nanoparticles, demonstrating that
surface decoration of nanoparticles with ligands of complex shape and architecture is feasible.
Surface-modification of nanoparticles with complex ligands might be beneficial to increase cell
interactions and improve the efficiency of drug delivery systems. In addition, the branched
architecture of the CPP sequence is considered to cover more surface area of the cell as the
amino acids in the branches can reach over a wider area and can potentially enhance interactions
between CPP-tagged PLGA nanoparticles and cells.
The use of CPPs for the surface modification of polymeric nanoparticles results in a
tuneability of the surface charge of polymeric nanoparticles. Further, the use of covalent bonds
between the polymeric nanoparticles and the CPPs leads to well-defined systems in comparison
to non-covalent bound CPPs as the amount of CPPs on covalent modified nanoparticles can be
quantified and optimised. Pre- and post-conjugation approaches are well-described in the
literature and require either the synthesis of polymer-ligand conjugates before formulation of
nanoparticles or the performance of a conjugation reaction after formulation of nanoparticles
(Kamaly et al., 2016; Valencia et al., 2013). In this thesis, the preparation of surface-modified
polymeric nanoparticles using the in situ microfluidics conjugation approach was described for
the first time. The in situ conjugation approach aims to utilize the benefits of microfluidics
such as a rapid and controlled mixing of precursor materials for the formulation of surface-
modified nanoparticles. The preparation time of the CPP-tagged PLGA nanoparticles was
greatly reduced, as the post-microfluidics conjugation approach takes 2 days due to an overnight
incubation, whereas the in situ microfluidics conjugation approach takes only 3 to 4 hours
(Chapter 3). The innovative approach of gold labelling and the application of small angle X-
ray scattering in this thesis proofed evidence that the CPP distribution depended on the

Chapter Five
198
preparation method. Therefore, the in situ microfluidic conjugation approach is a time efficient
and well-characterised approach that can be applied to the surface-modification of other
nanoparticulate systems e.g. liposomes.
Following formulation, in vitro cell culture studies can elucidate nanoparticle-cell
interactions to collect information about toxicity, cell response and efficacy of drug delivery.
The testing of nanoparticles in different cell lines allows the identification of cell-specific
interactions. HeLa cells are a well-known cell line for the investigation of cell interactions and
uptake of CPPs, whereas Caco-2 cells are an in vitro model for the intestinal barrier offering
the possibility to evaluate the suitability of nanoparticles as oral drug delivery systems. The
initial contact between CPP-tagged PLGA nanoparticles and HeLa cells did not result in an
efficient internalization of nanoformulations, which might be related to the limited incubation
time of 1 h (Chapter 4). The analysis of CPP-tagged PLGA nanoparticles exposed to Caco-2
cells for different time points showed an association to the epithelial cells rather than
localisation of the nanoformulations within cells in the Caco-2 cell monolayer (Chapter 4). A
slight advantage of the nanoformulations prepared with the branched CPP was observed in
Caco-2 cells indicating the potential of the branched CPP to be further investigated for oral drug
delivery systems.
The minimal observed interactions observed between the CPP-tagged PLGA
nanoparticles and HeLa or Caco-2 cells might be due to method-related limitations. As with
most in vitro cell culture studies described in the literature, the in vitro cell culture studies in
this thesis were performed in multiwell plates and this set up might not sufficiently represent
the environment of the human GIT. As an example, a lack of similarity between the small

Chapter Five
199
intestine and in vitro cell culture model relates to a difference in cell structure and
differentiation, cell organisation, exposed surface area and flow conditions (Beduneau et al.,
2014; Guo et al., 2000; Wang et al., 2018). Further, when using multiwell plates, washing steps
are compulsory for analysis and detachment of cells from the wells is thus possible. The forces
used in these washing steps might be stronger compared to the flow of fluids in vivo resulting
in the removal of non-tightly bound nanoparticles, which could have taken up by the cells
eventually in an in vivo situation.
Formulation related-limitations identified in in vitro cell culture studies performed in
this thesis were associated with the influence of the cell culture buffer on the measured surface
charge of the CPP-tagged PLGA nanoparticles. Independent of the surface modification with
CPPs of different architecture or no surface modification, the nanoformulations displayed net
zeta potentials close to neutral. To achieve cellular uptake, negatively charged nanoparticles
have to overcome an electrostatic repulsion barrier due to the same charge of nanoparticles and
cells. This repulsion barrier is less difficult to overcome for slightly negatively charged
nanoparticles (Reix et al., 2012) and net neutral nanoparticles. Thus, the low interaction of the
overall net neutral CPP-tagged PLGA nanoparticles presented in Chapter 4 might arise from
formulation- and method-related limitations.
Future direction: Defining the surface of nanoparticles
Future direction should be aimed at specific improvements for the formulation of
nanoparticles and analytical methods to overcome the described formulation- and method-
related limitations. In order to improve the functionality of the CPP-tagged PLGA
nanoparticles presented in this study, the surface coverage of the PLGA nanoparticles with

Chapter Five
200
CPPs and the CPP orientation can be optimised. The used CPPs, in particular, the long linear
TAT and the branched TAT, have multiple primary amines in their sequence and binding to the
surface of PLGA nanoparticles can occur in multiple directions. Without controlling the
orientation of the CPPs on the nanoparticle surface, the surface coverage is non-uniform and
this results in variation of how individual CPP molecules are present on the PLGA nanoparticle
surface. To achieve uniform coverage of the surface of PLGA nanoparticles with CPPs,
protective groups could be added to the CPPs prior to the conjugation reaction. The addition
of protective groups limits the amount of available primary amines in the CPP sequence and
facilitates the arrangement of the CPPs in a defined orientation on the surface of PLGA
nanoparticles. It should be noted that the protection groups have to be removed before the
nanoformulations can be used for further studies. Application of this approach results in
specific amino acid sequences pointing towards the cell membrane to trigger nanoparticle-cell
interaction. The targeting-specificity of modified nanoparticles is increased with the
conjugation of the sdAb protein to the nanoparticle surface if the protein remains in its native
structure and the orientation of the protein favours interaction with the targeted receptors (Yong
et al., 2019).
A recent advance in the area of surface modification for nanoparticles is the use of
crystal structure to identify protein binding sites and the binding of proteins to the surface of
nanoparticles utilizing chemical modification and reactions to achieve a desired surface
orientation (Yong et al., 2019). An example of innovative surface modifications is molecular
imprinting for the design of polymeric nanoparticles with receptor specific ligands. The
principle behind molecular imprinting is that functionalized monomers polymerize with cross-
linkers around a template molecule e.g. a cell ligand (Chen et al., 2016). After removing the
template, the formulated nanoparticles include the shape and size of the ligands, which are

Chapter Five
201
embedded in the rigid polymer (Gagliardi et al., 2017). An example for molecular imprinting
of polymeric nanoparticles was shown by Gagliardi et al. (2017). They imprinted PLGA
nanoparticles towards the biotin-receptor, which is overexpressed on cancer cells. The analysis
of HeLa cells showed an increase in fluorescence for molecular imprinted PLGA nanoparticles
in comparison to control nanoparticles over 30 min indicating the receptor-mediated uptake of
the biotin imprinted PLGA nanoparticles (Gagliardi et al., 2017).
Work extending from this thesis can aim to optimise the conjugation reaction between
polymer and ligand within the microfluidics channel for the formulation of surface-modified
nanoparticles. This could be investigated using techniques such as microfluidic-small angle
neutron scattering. To enable real time neutron scattering, the microfluidic device needs to
fulfil certain requirements including high transmission for neutrons, low background scattering
and little neutron-induced radioactivity (Adamo et al., 2018; Lopez et al., 2015). With the
introduction of the microchannel into the scattering beam, the kinetics of in situ microfluidic
conjugation reactions can be followed and used for an optimisation of the process-related
parameters. Further, the in situ microfluidics conjugation approach is of interest for the
potential encapsulation of protein drugs, as surface modification should be avoided after protein
encapsulation to prevent unwanted release (Zhu et al., 2016b). Generally, a bulk surface
modification approach after preparation of nanoparticles is a time-intensive process and
nanoparticles are exposed to buffered solutions. A possible issue is that degradation of the
nanoparticles and unwanted release of encapsulated drug can occur due to the exposure of the
nanoparticles to a buffer with reagents and pH necessary to maintain ideal conditions for the
conjugation reaction, but not ideal for the storage of nanoparticles. Thus, for drug-loaded
nanoparticles, simultaneous drug-loading and surface modification is advantageous to ensure
the retention of the drug within the nanoparticles until use.

Chapter Five
202
Future direction: Elucidating nanoparticle-cell interactions
Future experiments to improve current cell culture methods can be facilitated by both,
microscopic techniques and microfluidic-based cell experiments. Static and dynamic changes
in the membrane of live cells can be monitored with scanning ion conductance microscopy
(Chen et al., 2019a). Topographical changes in the cell membrane can be recorded after
incubation with nanoparticles (Chen et al., 2019a) to elucidate interactions between
nanoparticles and cells. To explore details of interactions between individual nanoparticles and
cells, the technique of single particle tracking can be utilized. The mobility of fluorophore-
labelled nanoparticles is tracked using an optical microscope to generate a trajectory of the
nanoparticle mobility as a function of time and space (Manzo and Garcia-Parajo, 2015).
Tracking individual nanoparticles aids in understanding the physical behaviour of nanoparticles
including sedimentation and diffusion during incubation with cells. Luo et al. (2019a) showed
that internalisation of CPP-modified semiconductive polymer dots in HeLa cells occurred in
three stages, namely the movement of nanoparticles towards the cell membrane, crossing of
cell membrane and movement of the nanoparticles within the cytosol. Single particle tracking
is a promising technique and can be exploited in future studies to gain more insight into how
the architecture of CPPs influences interactions with cells. The main advantage of single
particle tracking over other methods such as confocal laser scanning microscopy is that the
dynamics of the interactions between nanoparticles and cells are captured. Traditional static
images of nanoparticles and cells are not able to visualise the movement of nanoparticles during
incubation, which generates useful information about the timeframe and kind of interactions.
Lastly, microfluidic devices can be fabricated to accommodate a membrane within the
microchannel to accommodate a Caco-2 cell monolayer, which is surrounded by media flowing
on the apical and basolateral side (Tan et al., 2018). In this modified microfluidic device, drug

Chapter Five
203
transport studies can be tested under flow conditions with similar fluid shear stresses found in
the human gut (Tan et al., 2018) making the results more biologically-relevant.
Future in vitro experiments looking at the kinetics of interaction over a longer time
period may profit from taking the delivered dose of nanoparticles into consideration to ensure
that nanoparticles reach the cell surface and interactions between surface ligands such as CPPs
and cells can occur. The design of future experiments is recommended to follow the guidelines
for minimum information reporting in bio-nano experimental literature (MIRIBEL) to obtain
results that are based on standardised protocols and easily comparable with other studies
following the guidelines. Further, an underestimation of interactions between CPP-tagged
PLGA nanoparticles and cells due to the analytical methods is possible and therefore, the
utilization of microfluidics for uptake studies and visualization of nanoparticle-cell interactions
with single particle tracking in future studies has the potential to add crucial information.
In conclusion, this thesis demonstrates that polymeric nanoparticles can be modified
with CPPs of different architecture to tune the surface characteristics of PLGA nanoparticles.
Microfluidics has been shown for the first time to be suitable for the conjugation of CPPs to the
PLGA polymer and the formation of surface-modified polymeric nanoparticles. The well-
characterised nanoformulations presented in this thesis can be further exploited to elucidate
interactions at the nano-bio interface that govern cellular interactions and therefore the efficacy
of delivered therapeutics.

204
References
Abouelmagd, S.A., Ku, Y.J., Yeo, Y., 2015. Low molecular weight chitosan-coated polymeric
nanoparticles for sustained and pH-sensitive delivery of paclitaxel. Journal of Drug
Targeting, 23 (7-8), 725-35.
Adamo, M., Poulos, A.S., G. Lopez, C., Martel, A., Porcar, L., Cabral, J.T., 2018. Droplet
microfluidic SANS. Soft Matter, 14 (10), 1759-70.
Aebi, U., Pollard, T.D., 1987. A glow discharge unit to render electron microscope grids and
other surfaces hydrophilic. Journal of Electron Microscopy Technique, 7 (1), 29-33.
Ahmad Khanbeigi, R., Kumar, A., Sadouki, F., Lorenz, C., Forbes, B., Dailey, L.A., Collins,
H., 2012. The delivered dose: Applying particokinetics to in vitro investigations of
nanoparticle internalization by macrophages. Journal of Controlled Release, 162 (2),
259-66.
Alexander-Bryant, A.A., Vanden Berg-Foels, W.S., Wen, X., 2013. Bioengineering strategies
for designing targeted cancer therapies. Advances in Cancer Research, 118, 1-59.
Allemann, E., Leroux, J.C., Gurny, R., Doelker, E., 1993. In vitro extended-release properties
of drug-loaded poly(DL-lactic acid) nanoparticles produced by a salting-out procedure.
Pharmaceutical Research, 10 (12), 1732-7.
Alqahtani, S., Simon, L., Astete, C.E., Alayoubi, A., Sylvester, P.W., Nazzal, S., Shen, Y., Xu,
Z., Kaddoumi, A., Sabliov, C.M., 2015. Cellular uptake, antioxidant and
antiproliferative activity of entrapped alpha-tocopherol and gamma-tocotrienol in poly
(lactic-co-glycolic) acid (PLGA) and chitosan covered PLGA nanoparticles (PLGA-
Chi). Journal of Colloid and Interface Science, 445, 243-51.
Alves, I.D., Goasdoue, N., Correia, I., Aubry, S., Galanth, C., Sagan, S., Lavielle, S., Chassaing,
G., 2008. Membrane interaction and perturbation mechanisms induced by two cationic
cell penetrating peptides with distinct charge distribution. Biochimica et Biophysica
Acta, 1780 (7-8), 948-59.
Amoura, M., Illien, F., Joliot, A., Guitot, K., Offer, J., Sagan, S., Burlina, F., 2019. Head to tail
cyclisation of cell-penetrating peptides: Impact on GAG-dependent internalisation and
direct translocation. Chemical Communications, 55 (31), 4566-69.
Amoyav, B., Benny, O., 2018. Controlled and tunable polymer particles’ production using a
single microfluidic device. Applied Nanoscience, 8 (4), 905-14.
Angeles-Boza, A.M., Erazo-Oliveras, A., Lee, Y.J., Pellois, J.P., 2010. Generation of
endosomolytic reagents by branching of cell-penetrating peptides: Tools for the delivery
of bioactive compounds to live cells in cis or trans. Bioconjugate Chemistry, 21 (12),
2164-7.
Arshad, A., Yang, B., Bienemann, A.S., Barua, N.U., Wyatt, M.J., Woolley, M., Johnson, D.E.,
Edler, K.J., Gill, S.S., 2015. Convection-enhanced delivery of carboplatin PLGA
nanoparticles for the treatment of glioblastoma. PLoS One, 10 (7), e0132266.
Augsten, C., Kiselev, M.A., Gehrke, R., Hause, G., Mäder, K., 2008. A detailed analysis of
biodegradable nanospheres by different techniques--a combined approach to detect
particle sizes and size distributions. Journal of Pharmaceutical and Biomedical
Analysis, 47 (1), 95-102.
Avgoustakis, K., 2008. Poly lactide-co-glycolic acid (PLGA), in: Mishra, M. (Ed.),
Encyclopedia of Biomaterials and Biomedical Engineering, 1st ed. Taylor & Francis pp.
2259-69.
Babos, G., Biró, E., Meiczinger, M., Feczkó, T., 2018. Dual drug delivery of sorafenib and
doxorubicin from PLGA and PEG-PLGA polymeric nanoparticles. Polymers, 10 (8),
895.

205
Baby, T., Liu, Y., Middelberg, A.P.J., Zhao, C.-X., 2017. Fundamental studies on throughput
capacities of hydrodynamic flow-focusing microfluidics for producing monodisperse
polymer nanoparticles. Chemical Engineering Science, 169, 128-39.
Bahnsen, J.S., Franzyk, H., Sandberg-Schaal, A., Nielsen, H.M., 2013. Antimicrobial and cell-
penetrating properties of penetratin analogs: Effect of sequence and secondary structure.
Biochimica et Biophysica Acta, 1828 (2), 223-32.
Bailey, B.A., Desai, K.H., Ochyl, L.J., Ciotti, S.M., Moon, J.J., Schwendeman, S.P., 2017. Self-
encapsulating poly(lactic-co-glycolic acid) (PLGA) microspheres for intranasal vaccine
delivery. Molecular Pharmaceutics, 14 (9), 3228-37.
Bairagi, U., Mittal, P., Singh, J., Mishra, B., 2018. Preparation, characterization, and in vivo
evaluation of nano formulations of ferulic acid in diabetic wound healing. Drug
Development and Industrial Pharmacy, 44 (11), 1783-96.
Banerjee, A., Qi, J., Gogoi, R., Wong, J., Mitragotri, S., 2016. Role of nanoparticle size, shape
and surface chemistry in oral drug delivery. Journal of Controlled Release, 238, 176-85.
Banik, B.L., Fattahi, P., Brown, J.L., 2016. Polymeric nanoparticles: The future of
nanomedicine. Wiley Interdisciplinary Reviews: Nanomedicine and
Nanobiotechnology, 8 (2), 271-99.
Barreto-Vieira, D.F., Barth, O.M., 2015. Negative and positive staining in transmission electron
microscopy for virus diagnosis, in: Maitama, Y. (Ed.), Microbiology in Agriculture and
Human Health, 1st ed. Intech, pp. 45-56.
Bartczak, D., Kanaras, A.G., 2011. Preparation of peptide-functionalized gold nanoparticles
using one pot EDC/sulfo-NHS coupling. Langmuir, 27 (16), 10119-23.
Bartheldyova, E., Effenberg, R., Masek, J., Prochazka, L., Knotigova, P.T., Kulich, P.,
Hubatka, F., Velinska, K., Zelnickova, J., Zouharova, D., Fojtikova, M., Hrebik, D.,
Plevka, P., Mikulik, R., Miller, A.D., Macaulay, S., Zyka, D., Droz, L., Raska, M.,
Ledvina, M., Turanek, J., 2018. Hyaluronic acid surface modified liposomes prepared
via orthogonal aminoxy coupling: Synthesis of nontoxic aminoxylipids based on
symmetrically alpha-branched fatty acids, preparation of liposomes by microfluidic
mixing, and targeting to cancer cells expressing CD44. Bioconjugate Chemistry, 29 (7),
2343-56.
Beduneau, A., Tempesta, C., Fimbel, S., Pellequer, Y., Jannin, V., Demarne, F., Lamprecht, A.,
2014. A tunable Caco-2/HT29-MTX co-culture model mimicking variable
permeabilities of the human intestine obtained by an original seeding procedure.
European Journal of Pharmaceutics and Biopharmaceutics, 87 (2), 290-8.
Belliveau, N.M., Huft, J., Lin, P.J., Chen, S., Leung, A.K., Leaver, T.J., Wild, A.W., Lee, J.B.,
Taylor, R.J., Tam, Y.K., Hansen, C.L., Cullis, P.R., 2012. Microfluidic synthesis of
highly potent limit-size lipid nanoparticles for in vivo delivery of siRNA. Molecular
Therapy Nucleic Acids, 1, e37.
Bilati, U., Pasquarello, C., Corthals, G.L., Hochstrasser, D.F., Allemann, E., Doelker, E., 2005.
Matrix-assisted laser desorption/ionization time-of-flight mass spectrometry for
quantitation and molecular stability assessment of insulin entrapped within PLGA
nanoparticles. Journal of Pharmaceutical Sciences, 94 (3), 688-94.
Binder, H., Lindblom, G., 2003. Charge-dependent translocation of the Trojan peptide
penetratin across lipid membranes. Biophysical Journal, 85 (2), 982-95.
Birch, D., Christensen, M.V., Staerk, D., Franzyk, H., Nielsen, H.M., 2017. Fluorophore
labeling of a cell-penetrating peptide induces differential effects on its cellular
distribution and affects cell viability. Biochimica et Biophysica Acta (BBA) -
Biomembranes, 1859 (12), 2483-94.

206
Birch, D., Diedrichsen, R.G., Christophersen, P.C., Mu, H., Nielsen, H.M., 2018a. Evaluation
of drug permeation under fed state conditions using mucus-covered Caco-2 cell
epithelium. European Journal of Pharmaceutical Sciences, 118, 144-53.
Birch, D., Christensen, M.V., Staerk, D., Franzyk, H., Nielsen, H.M., 2018b. Stereochemistry
as a determining factor for the effect of a cell-penetrating peptide on cellular viability
and epithelial integrity. Biochemical Journal, 475 (10), 1773-88.
Bobo, D., Robinson, K.J., Islam, J., Thurecht, K.J., Corrie, S.R., 2016. Nanoparticle-based
medicines: A review of FDA-approved materials and clinical trials to date.
Pharmaceutical Research, 33 (10), 2373-87.
Boegh, M., Foged, C., Müllertz, A., Nielsen, H.M., 2013. Mucosal drug delivery: Barriers, in
vitro models and formulation strategies. Journal of Drug Delivery Science and
Technology, 23 (4), 383-91.
Boegh, M., Baldursdottir, S.G., Müllertz, A., Nielsen, H.M., 2014. Property profiling of
biosimilar mucus in a novel mucus-containing in vitro model for assessment of
intestinal drug absorption. European Journal of Pharmaceutics and Biopharmaceutics,
87 (2), 227-35.
Bohrey, S., Chourasiya, V., Pandey, A., 2016. Factorial design based preparation, optimization,
characterization and in vitro drug release studies of olanzapine loaded PLGA
nanoparticles. Materials Research Express, 3 (12), 125403.
Bootz, A., Vogel, V., Schubert, D., Kreuter, J., 2004. Comparison of scanning electron
microscopy, dynamic light scattering and analytical ultracentrifugation for the sizing of
poly(butyl cyanoacrylate) nanoparticles. European Journal of Pharmaceutics and
Biopharmaceutics, 57 (2), 369-75.
Borrelli, A., Tornesello, A.L., Tornesello, M.L., Buonaguro, F.M., 2018. Cell penetrating
peptides as molecular carriers for anti-cancer agents. Molecules, 23 (2).
Bourganis, V., Karamanidou, T., Kammona, O., Kiparissides, C., 2017. Polyelectrolyte
complexes as prospective carriers for the oral delivery of protein therapeutics. European
Journal of Pharmaceutics and Biopharmaceutics, 111, 44-60.
Boyd, B.J., Rades, T., 2016. Applications of small angle X-ray scattering in pharmaceutical
science, in: Müllertz, A., Perrie, Y., Rades, T. (Eds.), Analytical techniques in the
pharmaceutical sciences. Springer, pp. 339-60.
Bozkir, A., Saka, O.M., 2005. Formulation and investigation of 5-FU nanoparticles with
factorial design-based studies. Il Farmaco, 60 (10), 840-46.
Bramosanti, M., Chronopoulou, L., Grillo, F., Valletta, A., Palocci, C., 2017. Microfluidic-
assisted nanoprecipitation of antiviral-loaded polymeric nanoparticles. Colloids and
Surfaces A: Physicochemical and Engineering Aspects, 532, 369-76.
Brar, S.K., Verma, M., 2011. Measurement of nanoparticles by light-scattering techniques.
TrAC Trends in Analytical Chemistry, 30 (1), 4-17.
Brock, D.J., Kustigian, L., Jiang, M., Graham, K., Wang, T.Y., Erazo-Oliveras, A., Najjar, K.,
Zhang, J., Rye, H., Pellois, J.P., 2018. Efficient cell delivery mediated by lipid-specific
endosomal escape of supercharged branched peptides. Traffic, 19 (6), 421-35.
Brock, R., 2014. The uptake of arginine-rich cell-penetrating peptides: Putting the puzzle
together. Bioconjugate Chemistry, 25 (5), 863-8.
Bu, X., Zhu, T., Ma, Y., Shen, Q., 2015. Co-administration with cell penetrating peptide
enhances the oral bioavailability of docetaxel-loaded nanoparticles. Drug Development
and Industrial Pharmacy, 41 (5), 764-71.
Cai, H., Liang, Z., Huang, W., Wen, L., Chen, G., 2017. Engineering PLGA nano-based
systems through understanding the influence of nanoparticle properties and cell-
penetrating peptides for cochlear drug delivery. International Journal of Pharmaceutics,
532 (1), 55-65.

207
Caldero, G., Garcia-Celma, M.J., Solans, C., 2011. Formation of polymeric nano-emulsions by
a low-energy method and their use for nanoparticle preparation. Journal of Colloid and
Interface Science, 353 (2), 406-11.
Caldorera-Moore, M., Vela Ramirez, J.E., Peppas, N.A., 2019. Transport and delivery of
interferon-alpha through epithelial tight junctions via pH-responsive poly(methacrylic
acid-grafted-ethylene glycol) nanoparticles. Journal of Drug Targeting, 27 (5-6), 582-
89.
Capretto, L., Mazzitelli, S., Brognara, E., Lampronti, I., Carugo, D., Hill, M., Zhang, X.,
Gambari, R., Nastruzzi, C., 2012. Mithramycin encapsulated in polymeric micelles by
microfluidic technology as novel therapeutic protocol for beta-thalassemia.
International Journal of Nanomedicine, 7, 307-24.
Capretto, L., Carugo, D., Mazzitelli, S., Nastruzzi, C., Zhang, X., 2013. Microfluidic and lab-
on-a-chip preparation routes for organic nanoparticles and vesicular systems for
nanomedicine applications. Advanced Drug Delivery Reviews, 65 (11), 1496-532.
Cardoso, A.M.S., Trabulo, S., Cardoso, A.L., Lorents, A., Morais, C.M., Gomes, P., Nunes, C.,
Lúcio, M., Reis, S., Padari, K., Pooga, M., Pedroso de Lima, M.C., Jurado, A.S., 2012.
S4(13)-PV cell-penetrating peptide induces physical and morphological changes in
membrane-mimetic lipid systems and cell membranes: Implications for cell
internalization. Biochimica et Biophysica Acta, 1818 (3), 877-88.
Cartiera, M.S., Johnson, K.M., Rajendran, V., Caplan, M.J., Saltzman, W.M., 2009. The uptake
and intracellular fate of PLGA nanoparticles in epithelial cells. Biomaterials, 30 (14),
2790-8.
Chelopo, M.P., Kalombo, L., Wesley-Smith, J., Grobler, A., Hayeshi, R., 2016. The fabrication
and characterization of a PLGA nanoparticle–Pheroid® combined drug delivery
system. Journal of Materials Science, 52 (6), 3133-45.
Chen, F., Manandhar, P., Ahmed, M.S., Chang, S., Panday, N., Zhang, H., Moon, J.H., He, J.,
2019a. Extracellular surface potential mapping by scanning ion conductance
microscopy revealed transient transmembrane pore formation induced by conjugated
polymer nanoparticles. Macromolecular Bioscience, 19 (2), e1800271.
Chen, J., Wu, Q., Luo, L., Wang, Y., Zhong, Y., Dai, H.B., Sun, D., Luo, M.L., Wu, W., Wang,
G.X., 2017a. Dual tumor-targeted poly(lactic-co-glycolic acid)-polyethylene glycol-
folic acid nanoparticles: A novel biodegradable nanocarrier for secure and efficient
antitumor drug delivery. International Journal of Nanomedicine, 12, 5745-60.
Chen, L., Wang, X., Lu, W., Wu, X., Li, J., 2016. Molecular imprinting: Perspectives and
applications. Chemical Society Reviews, 45 (8), 2137-211.
Chen, Q., Gou, S., Ma, P., Song, H., Zhou, X., Huang, Y., Kwon Han, M., Wan, Y., Kang, Y.,
Xiao, B., 2019b. Oral administration of colitis tissue-accumulating porous nanoparticles
for ulcerative colitis therapy. International Journal of Pharmaceutics, 557, 135-44.
Chen, S., Guo, F., Deng, T., Zhu, S., Liu, W., Zhong, H., Yu, H., Luo, R., Deng, Z., 2017b.
Eudragit S100-coated chitosan nanoparticles co-loading Tat for enhanced oral colon
absorption of insulin. AAPS PharmSciTech, 18 (4), 1277-87.
Chiesa, E., Dorati, R., Modena, T., Conti, B., Genta, I., 2018. Multivariate analysis for the
optimization of microfluidics-assisted nanoprecipitation method intended for the
loading of small hydrophilic drugs into PLGA nanoparticles. International Journal of
Pharmaceutics, 536 (1), 165-77.
Chiu, J.Z., Tucker, I.G., McLeod, B.J., McDowell, A., 2015. Arginine-tagging of polymeric
nanoparticles via histidine to improve cellular uptake. European Journal of
Pharmaceutics and Biopharmaceutics, 89, 48-55.
Clara-Rahola, J., Moscoso, A., Belén Ruiz-Muelle, A., Laurenti, M., Formanek, P., Lopez-
Romero, J.M., Fernández, I., Diaz, J.F., Rubio-Retama, J., Fery, A., Contreras-Cáceres,

208
R., 2018. Au@p4VP core@shell pH-sensitive nanocomposites suitable for drug
entrapment. Journal of Colloid and Interface Science, 514, 704-14.
Clayton, A.H.A., Atcliffe, B.W., Howlett, G.J., Sawyer, W.H., 2006. Conformation and
orientation of penetratin in phospholipid membranes. Journal of Peptide Science, 12 (3),
233-38.
Clulow, A.J., Salim, M., Hawley, A., Boyd, B.J., 2018. A closer look at the behaviour of milk
lipids during digestion. Chemistry and Physics of Lipids, 211, 107-16.
Cole, H., Bryan, D., Lancaster, L., Mawas, F., Vllasaliu, D., 2018. Chitosan nanoparticle
antigen uptake in epithelial monolayers can predict mucosal but not systemic in vivo
immune response by oral delivery. Carbohydrate Polymers, 190, 248-54.
Connolly, M., 1983. Solvent-accessible surfaces of proteins and nucleic acids. Science, 221
(4612), 709-13.
Coolen, A.L., Lacroix, C., Mercier-Gouy, P., Delaune, E., Monge, C., Exposito, J.Y., Verrier,
B., 2019. Poly(lactic acid) nanoparticles and cell-penetrating peptide potentiate mRNA-
based vaccine expression in dendritic cells triggering their activation. Biomaterials, 195,
23-37.
Cory, A.H., Owen, T.C., Barltrop, J.A., Cory, J.G., 1991. Use of an aqueous soluble
tetrazolium/formazan assay for cell growth assays in culture. Cancer Communications,
3 (7), 207-12.
Cox, A., Vinciguerra, D., Re, F., Magro, R.D., Mura, S., Masserini, M., Couvreur, P., Nicolas,
J., 2019. Protein-functionalized nanoparticles derived from end-functional polymers
and polymer prodrugs for crossing the blood-brain barrier. European Journal of
Pharmaceutics and Biopharmaceutics, 142, 70-82.
Crucho, C.I.C., Barros, M.T., 2017. Polymeric nanoparticles: A study on the preparation
variables and characterization methods. Materials Science and Engineering: C Materials
for Biological Applications, 80, 771-84.
Czuba, E., Diop, M., Mura, C., Schaschkow, A., Langlois, A., Bietiger, W., Neidl, R., Virciglio,
A., Auberval, N., Julien-David, D., Maillard, E., Frere, Y., Marchioni, E., Pinget, M.,
Sigrist, S., 2018. Oral insulin delivery, the challenge to increase insulin bioavailability:
Influence of surface charge in nanoparticle system. International Journal of
Pharmaceutics, 542 (1-2), 47-55.
Danhier, F., Ansorena, E., Silva, J.M., Coco, R., Le Breton, A., Preat, V., 2012. PLGA-based
nanoparticles: An overview of biomedical applications. Journal of Controlled Release,
161 (2), 505-22.
Date, A.A., Hanes, J., Ensign, L.M., 2016. Nanoparticles for oral delivery: Design, evaluation
and state-of-the-art. Journal of Controlled Release, 240, 504-26.
Dausend, J., Musyanovych, A., Dass, M., Walther, P., Schrezenmeier, H., Landfester, K.,
Mailander, V., 2008. Uptake mechanism of oppositely charged fluorescent
nanoparticles in HeLa cells. Macromolecular Bioscience, 8 (12), 1135-43.
de Jonge, N., Ross, F.M., 2011. Electron microscopy of specimens in liquid. Nature
Nanotechnology, 6, 695-704.
Derakhshandeh, K., Erfan, M., Dadashzadeh, S., 2007. Encapsulation of 9-nitrocamptothecin,
a novel anticancer drug, in biodegradable nanoparticles: Factorial design,
characterization and release kinetics. European Journal of Pharmaceutics and
Biopharmaceutics, 66 (1), 34-41.
Derossi, D., Calvet, S., Trembleau, A., Brunissen, A., Chassaing, G., Prochiantz, A., 1996. Cell
internalization of the third helix of the Antennapedia homeodomain is receptor-
independent. The Journal of Biological Chemistry, 271 (30), 18188-93.
209
Desgouilles, S., Vauthier, C., Bazile, D., Vacus, J., Grossiord, J.-L., Veillard, M., Couvreur, P.,
2003. The design of nanoparticles obtained by solvent evaporation: A comprehensive
study. Langmuir, 19 (22), 9504-10.
Di Cola, E., Grillo, I., Ristori, S., 2016. Small angle X-ray and neutron scattering: Powerful
tools for studying the structure of drug-loaded liposomes. Pharmaceutics, 8 (2).
Dong, Y.D., Tchung, E., Nowell, C., Kaga, S., Leong, N., Mehta, D., Kaminskas, L.M., Boyd,
B.J., 2019. Microfluidic preparation of drug-loaded PEGylated liposomes, and the
impact of liposome size on tumour retention and penetration. Journal of Liposome
Research, 29 (1), 1-9.
Donno, R., Gennari, A., Lallana, E., De La Rosa, J.M.R., d’Arcy, R., Treacher, K., Hill, K.,
Ashford, M., Tirelli, N., 2017. Nanomanufacturing through microfluidic-assisted
nanoprecipitation: Advanced analytics and structure-activity relationships. International
Journal of Pharmaceutics, 534 (1), 97-107.
Draheim, C., de Crecy, F., Hansen, S., Collnot, E.M., Lehr, C.M., 2015. A design of experiment
study of nanoprecipitation and nano spray drying as processes to prepare PLGA nano-
and microparticles with defined sizes and size distributions. Pharmaceutical Research,
32 (8), 2609-24.
Du, X.J., Wang, J.L., Iqbal, S., Li, H.J., Cao, Z.T., Wang, Y.C., Du, J.Z., Wang, J., 2018. The
effect of surface charge on oral absorption of polymeric nanoparticles. Biomaterials
Science, 6 (3), 642-50.
Du, Y., Zhang, Z., Yim, C., Lin, M., Cao, X., 2010. A simplified design of the staggered
herringbone micromixer for practical applications. Biomicrofluidics, 4 (2), 024105.
Dubes, A., Parrot-Lopez, H., Abdelwahed, W., Degobert, G., Fessi, H., Shahgaldian, P.,
Coleman, A.W., 2003. Scanning electron microscopy and atomic force microscopy
imaging of solid lipid nanoparticles derived from amphiphilic cyclodextrins. European
Journal of Pharmaceutics and Biopharmaceutics, 55 (3), 279-82.
Eggimann, G.A., Blattes, E., Buschor, S., Biswas, R., Kammer, S.M., Darbre, T., Reymond, J.-
L., 2014. Designed cell penetrating peptide dendrimers efficiently internalize cargo into
cells. Chemical Communications, 50 (55), 7254-57.
Egusquiaguirre, S.P., Manguan-Garcia, C., Pintado-Berninches, L., Iarriccio, L., Carbajo, D.,
Albericio, F., Royo, M., Pedraz, J.L., Hernandez, R.M., Perona, R., Igartua, M., 2015.
Development of surface modified biodegradable polymeric nanoparticles to deliver
GSE24.2 peptide to cells: A promising approach for the treatment of defective
telomerase disorders. European Journal of Pharmaceutics and Biopharmaceutics, 91,
91-102.
Elsner, M.B., Herold, H.M., Muller-Herrmann, S., Bargel, H., Scheibel, T., 2015. Enhanced
cellular uptake of engineered spider silk particles. Biomaterials Science, 3 (3), 543-51.
Erazo-Oliveras, A., Najjar, K., Dayani, L., Wang, T.Y., Johnson, G.A., Pellois, J.P., 2014.
Protein delivery into live cells by incubation with an endosomolytic agent. Nature
Methods, 11 (8), 861-7.
Fan, T., Chen, C., Guo, H., Xu, J., Zhang, J., Zhu, X., Yang, Y., Zhou, Z., Li, L., Huang, Y.,
2014. Design and evaluation of solid lipid nanoparticles modified with peptide ligand
for oral delivery of protein drugs. European Journal of Pharmaceutics and
Biopharmaceutics, 88 (2), 518-28.
Faralli, A., Shekarforoush, E., Mendes, A.C., Chronakis, I.S., 2019. Enhanced transepithelial
permeation of gallic acid and (-)-epigallocatechin gallate across human intestinal Caco-
2 cells using electrospun xanthan nanofibers. Pharmaceutics, 11 (4).
Faria, M., Bjornmalm, M., Thurecht, K.J., Kent, S.J., Parton, R.G., Kavallaris, M., Johnston,
A.P.R., Gooding, J.J., Corrie, S.R., Boyd, B.J., Thordarson, P., Whittaker, A.K.,
Stevens, M.M., Prestidge, C.A., Porter, C.J.H., Parak, W.J., Davis, T.P., Crampin, E.J.,

210
Caruso, F., 2018. Minimum information reporting in bio-nano experimental literature.
Nature Nanotechnology, 13 (9), 777-85.
Faria, M., Noi, K.F., Dai, Q., Björnmalm, M., Johnston, S.T., Kempe, K., Caruso, F., Crampin,
E.J., 2019. Revisiting cell–particle association in vitro: A quantitative method to
compare particle performance. Journal of Controlled Release, 307, 355-67.
Farkhani, S.M., Valizadeh, A., Karami, H., Mohammadi, S., Sohrabi, N., Badrzadeh, F., 2014.
Cell penetrating peptides: Efficient vectors for delivery of nanoparticles, nanocarriers,
therapeutic and diagnostic molecules. Peptides, 57, 78-94.
Farokhzad, O.C., Langer, R., 2009. Impact of nanotechnology on drug delivery. ACS Nano, 3
(1), 16-20.
FDA, 1997. Guidance for industry: Q2B validation of analytical procedures: Methology. Food
and Drug Administration, Center for Drug Evaluation and Research and Center for
Veterinary Medicine.
FDA, 2001. Guidance for Industry: Bioanalytical Method Validation. Food and Drug
Administration, Center for Drug Evaluation and Research and Center for Veterinary
Medicine.
Feiner-Gracia, N., Dols-Perez, A., Royo, M., Solans, C., Garcia-Celma, M.J., Fornaguera, C.,
2018. Cell penetrating peptide grafting of PLGA nanoparticles to enhance cell uptake.
European Polymer Journal, 108, 429-38.
Feng, Q., Liu, J., Li, X., Chen, Q., Sun, J., Shi, X., Ding, B., Yu, H., Li, Y., Jiang, X., 2017.
One-step microfluidic synthesis of nanocomplex with tunable rigidity and acid-
switchable surface charge for overcoming drug resistance. Small, 13 (9), 1603109.
Fenton, O.S., Olafson, K.N., Pillai, P.S., Mitchell, M.J., Langer, R., 2018. Advances in
biomaterials for drug delivery. Advanced Materials, e1705328.
Fessi, H., Puisieux, F., Devissaguet, J.P., Ammoury, N., Benita, S., 1989. Nanocapsule
formation by interfacial polymer deposition following solvent displacement.
International Journal of Pharmaceutics, 55 (1), R1-R4.
Fischer, R., Kohler, K., Fotin-Mleczek, M., Brock, R., 2004. A stepwise dissection of the
intracellular fate of cationic cell-penetrating peptides. The Journal of Biological
Chemistry, 279 (13), 12625-35.
Fleischer, C.C., Payne, C.K., 2014. Nanoparticle-cell interactions: Molecular structure of the
protein corona and cellular outcomes. Accounts of Chemical Research, 47 (8), 2651-9.
Foerg, C., Ziegler, U., Fernandez-Carneado, J., Giralt, E., Merkle, H.P., 2007. Differentiation
restricted endocytosis of cell penetrating peptides in MDCK cells corresponds with
activities of Rho-GTPases. Pharmaceutical Research, 24 (4), 628-42.
Fornaguera, C., Dols-Perez, A., Caldero, G., Garcia-Celma, M.J., Camarasa, J., Solans, C.,
2015. PLGA nanoparticles prepared by nano-emulsion templating using low-energy
methods as efficient nanocarriers for drug delivery across the blood-brain barrier.
Journal of Controlled Release, 211, 134-43.
Franke, D., Kikhney, A.G., Svergun, D.I., 2012. Automated acquisition and analysis of small
angle X-ray scattering data. Nuclear Instruments and Methods in Physics Research
Section A: Accelerators, Spectrometers, Detectors and Associated Equipment, 689, 52-
59.
Frankel, A.D., Pabo, C.O., 1988. Cellular uptake of the tat protein from human
immunodeficiency virus. Cell, 55 (6), 1189-93.
Franken, L.E., Boekema, E.J., Stuart, M.C.A., 2017. Transmission electron microscopy as a
tool for the characterization of soft materials: Application and interpretation. Advanced
Science, 4 (5), 1600476.
Frohlich, E., 2016. Cellular elimination of nanoparticles. Environmental Toxicology and
Pharmacology, 46, 90-94.

211
Futaki, S., Suzuki, T., Ohashi, W., Yagami, T., Tanaka, S., Ueda, K., Sugiura, Y., 2001.
Arginine-rich peptides. An abundant source of membrane-permeable peptides having
potential as carriers for intracellular protein delivery. The Journal of Biological
Chemistry, 276 (8), 5836-40.
Gagliardi, M., Bertero, A., Bifone, A., 2017. Molecularly imprinted biodegradable
nanoparticles. Scientific Reports, 7, 40046.
Galindo-Rodríguez, S.A., Puel, F., Briançon, S., Allémann, E., Doelker, E., Fessi, H., 2005.
Comparative scale-up of three methods for producing ibuprofen-loaded nanoparticles.
European Journal of Pharmaceutical Sciences, 25 (4), 357-67.
Gao, X., Hong, S., Liu, Z., Yue, T., Dobnikar, J., Zhang, X., 2019. Membrane potential drives
direct translocation of cell-penetrating peptides. Nanoscale, 11 (4), 1949-58.
Gao, Y., Zhao, D., Chang, M.-W., Ahmad, Z., Li, J.-S., 2016. Optimising the shell thickness-
to-radius ratio for the fabrication of oil-encapsulated polymeric microspheres. Chemical
Engineering Journal, 284, 963-71.
Gartziandia, O., Egusquiaguirre, S.P., Bianco, J., Pedraz, J.L., Igartua, M., Hernandez, R.M.,
Préat, V., Beloqui, A., 2016. Nanoparticle transport across in vitro olfactory cell
monolayers. International Journal of Pharmaceutics, 499 (1), 81-89.
Gaumet, M., Gurny, R., Delie, F., 2009. Localization and quantification of biodegradable
particles in an intestinal cell model: The influence of particle size. European Journal of
Pharmaceutical Sciences, 36 (4), 465-73.
Ghazal, A., Gontsarik, M., Kutter, J.P., Lafleur, J.P., Ahmadvand, D., Labrador, A., Salentinig,
S., Yaghmur, A., 2017. Microfluidic platform for the continuous production and
characterization of multilamellar vesicles: A synchrotron small-angle X-ray scattering
(SAXS) study. The Journal of Physical Chemistry Letters, 8 (1), 73-79.
Green, M., Loewenstein, P.M., 1988. Autonomous functional domains of chemically
synthesized human immunodeficiency virus tat trans-activator protein. Cell, 55 (6),
1179-88.
Griffin, B.T., Guo, J., Presas, E., Donovan, M.D., Alonso, M.J., O'Driscoll, C.M., 2016.
Pharmacokinetic, pharmacodynamic and biodistribution following oral administration
of nanocarriers containing peptide and protein drugs. Advanced Drug Delivery
Reviews, 106, 367-80.
Grillo, I., 2008. Small-angle neutron scattering and applications in soft condensed matter,
Springer, pp. 723-82.
Guidotti, G., Brambilla, L., Rossi, D., 2017. Cell-penetrating peptides: From basic research to
clinics. Trends in Pharmacological Sciences, 38 (4), 406-24.
Gullotti, E., Yeo, Y., 2012. Beyond the imaging: Limitations of cellular uptake study in the
evaluation of nanoparticles. Journal of Controlled Release, 164 (2), 170-76.
Gump, J.M., June, R.K., Dowdy, S.F., 2010. Revised role of glycosaminoglycans in TAT
protein transduction domain-mediated cellular transduction. The Journal of Biological
Chemistry, 285 (2), 1500-7.
Guo, F., Ouyang, T., Peng, T., Zhang, X., Xie, B., Yang, X., Liang, D., Zhong, H., 2019.
Enhanced oral absorption of insulin using colon-specific nanoparticles co-modified with
amphiphilic chitosan derivatives and cell-penetrating peptides. Biomaterials Science, 7
(4), 1493-506.
Guo, P., Weinstein, A.M., Weinbaum, S., 2000. A hydrodynamic mechanosensory hypothesis
for brush border microvilli. American Journal of Physiology-Renal Physiology, 279 (4),
F698-F712.
Habault, J., Poyet, J.L., 2019. Recent advances in cell penetrating peptide-based anticancer
therapies. Molecules, 24 (5).

212
Haggag, Y.A., Faheem, A.M., Tambuwala, M.M., Osman, M.A., El-Gizawy, S.A., O'Hagan,
B., Irwin, N., McCarron, P.A., 2018. Effect of poly(ethylene glycol) content and
formulation parameters on particulate properties and intraperitoneal delivery of insulin
from PLGA nanoparticles prepared using the double-emulsion evaporation procedure.
Pharmaceutical Development and Technology, 23 (4), 370-81.
Hanrahan, G., Lu, K., 2006. Application of factorial and response surface methodology in
modern experimental design and optimization. Critical Reviews in Analytical
Chemistry, 36 (3-4), 141-51.
Haque, S., Boyd, B.J., McIntosh, M.P., Pouton, C.W., Kaminskas, L.M., Whittaker, M., 2018.
Suggested procedures for the reproducible synthesis of poly(d,l-lactide-co-glycolide)
nanoparticles using the emulsification solvent diffusion platform. Current Nanoscience,
14 (5), 448-53.
Haris, P.I., Severcan, F., 1999. FTIR spectroscopic characterization of protein structure in
aqueous and non-aqueous media. Journal of Molecular Catalysis B: Enzymatic, 7 (1),
207-21.
He, B., Lin, P., Jia, Z., Du, W., Qu, W., Yuan, L., Dai, W., Zhang, H., Wang, X., Wang, J.,
Zhang, X., Zhang, Q., 2013. The transport mechanisms of polymer nanoparticles in
Caco-2 epithelial cells. Biomaterials, 34 (25), 6082-98.
He, C., Hu, Y., Yin, L., Tang, C., Yin, C., 2010. Effects of particle size and surface charge on
cellular uptake and biodistribution of polymeric nanoparticles. Biomaterials, 31 (13),
3657-66.
He, C., Yin, L., Tang, C., Yin, C., 2012. Size-dependent absorption mechanism of polymeric
nanoparticles for oral delivery of protein drugs. Biomaterials, 33 (33), 8569-78.
Herce, H.D., Garcia, A.E., Cardoso, M.C., 2014. Fundamental molecular mechanism for the
cellular uptake of guanidinium-rich molecules. Journal of the American Chemical
Society, 136 (50), 17459-67.
Hermanson, G.T., 2013a. Introduction to bioconjugation, in: Audet, J., Preap, M. (Eds.),
Bioconjugate Techniques, 3rd ed. Academic Press, pp. 1-125.
Hermanson, G.T., 2013b. (Strept)avidin–biotin systems, in: Audet, J., Preap, M. (Eds.),
Bioconjugate Techniques, 3rd ed. Academic Press, pp. 465-505.
Hermanson, G.T., 2013c. Zero-length crosslinkers, in: Audet, J., Preap, M. (Eds.), Bioconjugate
Techniques, 3rd ed. Academic Press, pp. 259-73.
Hidalgo, I.J., Raub, T.J., Borchardt, R.T., 1989. Characterization of the human colon carcinoma
cell line (Caco-2) as a model system for intestinal epithelial permeability.
Gastroenterology, 96 (3), 736-49.
Hinderliter, P.M., Minard, K.R., Orr, G., Chrisler, W.B., Thrall, B.D., Pounds, J.G.,
Teeguarden, J.G., 2010. ISDD: A computational model of particle sedimentation,
diffusion and target cell dosimetry for in vitro toxicity studies. Particle and Fibre
Toxicology, 7 (1), 36.
Hofmann, A.M., Wurm, F., Hühn, E., Nawroth, T., Langguth, P., Frey, H., 2010.
Hyperbranched polyglycerol-based lipids via oxyanionic polymerization: Toward
multifunctional stealth liposomes. Biomacromolecules, 11 (3), 568-74.
Homs, M., Calderó, G., Monge, M., Morales, D., Solans, C., 2018. Influence of polymer
concentration on the properties of nano-emulsions and nanoparticles obtained by a low-
energy method. Colloids and Surfaces A: Physicochemical and Engineering Aspects,
536, 204-12.
Hong, L., Salentinig, S., Hawley, A., Boyd, B.J., 2015. Understanding the mechanism of
enzyme-induced formation of lyotropic liquid crystalline nanoparticles. Langmuir, 31
(24), 6933-41.

213
Hoyer, J., Schatzschneider, U., Schulz-Siegmund, M., Neundorf, I., 2012. Dimerization of a
cell-penetrating peptide leads to enhanced cellular uptake and drug delivery. Beilstein
Journal of Organic Chemistry, 8, 1788-97.
Hu, J., Lou, Y., Wu, F., 2019. Improved intracellular delivery of polyarginine peptides with
cargoes. The Journal of Physical Chemistry B, 123 (12), 2636-44.
Huang, Y., Jiang, Y., Wang, H., Wang, J., Shin, M.C., Byun, Y., He, H., Liang, Y., Yang, V.C.,
2013. Curb challenges of the "Trojan Horse" approach: Smart strategies in achieving
effective yet safe cell-penetrating peptide-based drug delivery. Advanced Drug
Delivery Reviews, 65 (10), 1299-315.
Huang, Y.W., Lee, H.J., Tolliver, L.M., Aronstam, R.S., 2015. Delivery of nucleic acids and
nanomaterials by cell-penetrating peptides: Opportunities and challenges. BioMed
Research International, 2015, 834079.
Hyrup Møller, L., Bahnsen, J.S., Nielsen, H.M., Ostergaard, J., Sturup, S., Gammelgaard, B.,
2015. Selenium as an alternative peptide label - comparison to fluorophore-labelled
penetratin. European Journal of Pharmaceutical Sciences, 67, 76-84.
Iwasa, A., Akita, H., Khalil, I., Kogure, K., Futaki, S., Harashima, H., 2006. Cellular uptake
and subsequent intracellular trafficking of R8-liposomes introduced at low temperature.
Biochimica et Biophysica Acta, 1758 (6), 713-20.
Jacobsen, J., Pedersen, M., Rassing, M.R., 1996. TR146 cells as a model for human buccal
epithelium: II. Optimisation and use of a cellular sensitivity MTS/PMS assay.
International Journal of Pharmaceutics, 141 (1), 217-25.
Jafari, S., Maleki Dizaj, S., Adibkia, K., 2015. Cell-penetrating peptides and their analogues as
novel nanocarriers for drug delivery. BioImpacts, 5 (2), 103-11.
Jafarifar, E., Hajialyani, M., Akbari, M., Rahimi, M., Shokoohinia, Y., Fattahi, A., 2017.
Preparation of a reproducible long-acting formulation of risperidone-loaded PLGA
microspheres using microfluidic method. Pharmaceutical Development and
Technology, 22 (6), 836-43.
Jäger, A., Jäger, E., Giacomelli, F.C., Nallet, F., Steinhart, M., Putaux, J.-L., Konefał, R.,
Spěváček, J., Ulbrich, K., Štěpánek, P., 2018. Structural changes on polymeric
nanoparticles induced by hydrophobic drug entrapment. Colloids and Surfaces A:
Physicochemical and Engineering Aspects, 538, 238-49.
Jahn, A., Vreeland, W.N., Gaitan, M., Locascio, L.E., 2004. Controlled vesicle self-assembly
in microfluidic channels with hydrodynamic focusing. Journal of the American
Chemical Society, 126 (9), 2674-5.
Jaimes-Aguirre, L., Morales-Avila, E., Ocampo-Garcia, B.E., Medina, L.A., Lopez-Tellez, G.,
Gibbens-Bandala, B.V., Izquierdo-Sanchez, V., 2017. Biodegradable poly(D,L-lactide-
co-glycolide)/poly(L-gamma-glutamic acid) nanoparticles conjugated to folic acid for
targeted delivery of doxorubicin. Materials Science and Engineering: C Materials for
Biological Applications, 76, 743-51.
Jain, A., Jain, S.K., 2015. L-Valine appended PLGA nanoparticles for oral insulin delivery.
Acta Diabetologica, 52 (4), 663-76.
Jara, M.O., Catalan-Figueroa, J., Landin, M., Morales, J.O., 2018. Finding key
nanoprecipitation variables for achieving uniform polymeric nanoparticles using
neurofuzzy logic technology. Drug Delivery and Translational Research, 8 (6), 1797-
806.
Jeevanandam, J., Chan, Y.S., Danquah, M.K., 2016. Nano-formulations of drugs: Recent
developments, impact and challenges. Biochimie, 128-129, 99-112.
Jeffries, C.M., Graewert, M.A., Svergun, D.I., Blanchet, C.E., 2015. Limiting radiation damage
for high-brilliance biological solution scattering: Practical experience at the EMBL P12
beamline PETRAIII. Journal of Synchrotron Radiation, 22 (2), 273-9.
214
Jeong, C., Yoo, J., Lee, D., Kim, Y.C., 2016. A branched TAT cell-penetrating peptide as a
novel delivery carrier for the efficient gene transfection. Biomaterials Research, 20 (1),
28.
Jones, A.T., 2007. Macropinocytosis: Searching for an endocytic identity and role in the uptake
of cell penetrating peptides. Journal of Cellular and Molecular Medicine, 11 (4), 670-
84.
Jones, S.W., Christison, R., Bundell, K., Voyce, C.J., Brockbank, S.M.V., Newham, P.,
Lindsay, M.A., 2005. Characterisation of cell-penetrating peptide-mediated peptide
delivery. British Journal of Pharmacology, 145 (8), 1093-102.
Joshi, G., Kumar, A., Sawant, K., 2016. Bioavailability enhancement, Caco-2 cells uptake and
intestinal transport of orally administered lopinavir-loaded PLGA nanoparticles. Drug
Delivery, 23 (9), 3492-504.
Kafka, A.P., Kleffmann, T., Rades, T., McDowell, A., 2009. Histidine residues in the peptide
D-Lys6-GnRH: Potential for copolymerization in polymeric nanoparticles. Molecular
Pharmaceutics, 6 (5), 1483-91.
Kafka, A.P., Kleffmann, T., Rades, T., McDowell, A., 2011. The application of MALDI TOF
MS in biopharmaceutical research. International Journal of Pharmaceutics, 417 (1-2),
70-82.
Kalani, M., Yunus, R., 2012. Effect of supercritical fluid density on nanoencapsulated drug
particle size using the supercritical antisolvent method. International Journal of
Nanomedicine, 7, 2165-72.
Kamaly, N., Fredman, G., Fojas, J.J., Subramanian, M., Choi, W.I., Zepeda, K., Vilos, C., Yu,
M., Gadde, S., Wu, J., Milton, J., Carvalho Leitao, R., Rosa Fernandes, L., Hasan, M.,
Gao, H., Nguyen, V., Harris, J., Tabas, I., Farokhzad, O.C., 2016. Targeted interleukin-
10 nanotherapeutics developed with a microfluidic chip enhance resolution of
inflammation in advanced atherosclerosis. ACS Nano, 10 (5), 5280-92.
Kamei, N., Morishita, M., Takayama, K., 2009. Importance of intermolecular interaction on the
improvement of intestinal therapeutic peptide/protein absorption using cell-penetrating
peptides. Journal of Controlled Release, 136 (3), 179-86.
Kaneko, K., McDowell, A., Ishii, Y., Hook, S., 2018. Characterization and evaluation of
stabilized particulate formulations as therapeutic oral vaccines for allergy. Journal of
Liposome Research, 28 (4), 296-304.
Kang, H., DeLong, R., Fisher, M.H., Juliano, R.L., 2005. Tat-conjugated PAMAM dendrimers
as delivery agents for antisense and siRNA oligonucleotides. Pharmaceutical Research,
22 (12), 2099-106.
Kang, X., Luo, C., Wei, Q., Xiong, C., Chen, Q., Chen, Y., Ouyang, Q., 2013. Mass production
of highly monodisperse polymeric nanoparticles by parallel flow focusing system.
Microfluidics and Nanofluidics, 15 (3), 337-45.
Karnik, R., Gu, F., Basto, P., Cannizzaro, C., Dean, L., Kyei-Manu, W., Langer, R., Farokhzad,
O.C., 2008. Microfluidic platform for controlled synthesis of polymeric nanoparticles.
Nano Letters, 8 (9), 2906-12.
Karve, S., Werner, M.E., Cummings, N.D., Sukumar, R., Wang, E.C., Zhang, Y.-A., Wang,
A.Z., 2011. Formulation of diblock polymeric nanoparticles through nanoprecipitation
technique. Journal of Visualized Experiments (55), e3398.
Kastner, E., Kaur, R., Lowry, D., Moghaddam, B., Wilkinson, A., Perrie, Y., 2014. High-
throughput manufacturing of size-tuned liposomes by a new microfluidics method using
enhanced statistical tools for characterization. International Journal of Pharmaceutics,
477 (1-2), 361-8.

215
Kastner, E., Verma, V., Lowry, D., Perrie, Y., 2015. Microfluidic-controlled manufacture of
liposomes for the solubilisation of a poorly water soluble drug. International Journal of
Pharmaceutics, 485 (1-2), 122-30.
Katsikari, A., Patronidou, C., Kiparissides, C., Arsenakis, M., 2009. Uptake and cytotoxicity of
poly(d,l-lactide-co-glycolide) nanoparticles in human colon adenocarcinoma cells.
Materials Science and Engineering: B, 165 (3), 160-64.
Khan, I.U., Serra, C.A., Anton, N., Vandamme, T.F., 2015. Production of nanoparticle drug
delivery systems with microfluidics tools. Expert Opinion on Drug Delivery, 12 (4),
547-62.
Kikhney, A.G., Svergun, D.I., 2015. A practical guide to small angle X-ray scattering (SAXS)
of flexible and intrinsically disordered proteins. FEBS Letters, 589 (19), 2570-7.
Kim, Y., Lee Chung, B., Ma, M., Mulder, W.J., Fayad, Z.A., Farokhzad, O.C., Langer, R.,
2012. Mass production and size control of lipid-polymer hybrid nanoparticles through
controlled microvortices. Nano Letters, 12 (7), 3587-91.
Klein, M.J., Schmidt, S., Wadhwani, P., Burck, J., Reichert, J., Afonin, S., Berditsch, M.,
Schober, T., Brock, R., Kansy, M., Ulrich, A.S., 2017. Lactam-stapled cell-penetrating
peptides: Cell uptake and membrane binding properties. Journal of Medicinal
Chemistry, 60 (19), 8071-82.
Koch, A.M., Reynolds, F., Merkle, H.P., Weissleder, R., Josephson, L., 2005. Transport of
surface-modified nanoparticles through cell monolayers. ChemBioChem, 6 (2), 337-45.
Koh, M.L., FitzGerald, P.A., Warr, G.G., Jolliffe, K.A., Perrier, S., 2016. Study of (cyclic
peptide)-polymer conjugate assemblies by small-angle neutron scattering. Chemistry,
22 (51), 18419-28.
Kolishetti, N., Dhar, S., Valencia, P.M., Lin, L.Q., Karnik, R., Lippard, S.J., Langer, R.,
Farokhzad, O.C., 2010. Engineering of self-assembled nanoparticle platform for
precisely controlled combination drug therapy. Proceedings of the National Academy
of Sciences of the United States of America, 107 (42), 17939-44.
Kong, J., Yu, S., 2007. Fourier transform infrared spectroscopic analysis of protein secondary
structures. Acta Biochimica et Biophysica Sinica, 39 (8), 549-59.
Koren, E., Torchilin, V.P., 2012. Cell-penetrating peptides: Breaking through to the other side.
Trends in Molecular Medicine, 18 (7), 385-93.
Kostag, M., Köhler, S., Liebert, T., Heinze, T., 2010. Pure cellulose nanoparticles from
trimethylsilyl cellulose. Macromolecular Symposia, 294 (2), 96-106.
Kristensen, M., de Groot, A.M., Berthelsen, J., Franzyk, H., Sijts, A., Nielsen, H.M., 2015.
Conjugation of cell-penetrating peptides to parathyroid hormone affects its structure,
potency, and transepithelial permeation. Bioconjugate Chemistry, 26 (3), 477-88.
Kristensen, M., Nielsen, H.M., 2016. Cell-penetrating peptides as carriers for oral delivery of
biopharmaceuticals. Basic & Clinical Pharmacology & Toxicology, 118 (2), 99-106.
Künnapuu, K., Veiman, K.-L., Porosk, L., Rammul, E., Kiisholts, K., Langel, Ü., Kurrikoff, K.,
2019. Tumor gene therapy by systemic delivery of plasmid DNA with cell-penetrating
peptides. FASEB BioAdvances, 1 (2), 105-14.
Laulicht, B., Cheifetz, P., Mathiowitz, E., Tripathi, A., 2008. Evaluation of continuous flow
nanosphere formation by controlled microfluidic transport. Langmuir, 24 (17), 9717-
26.
Lea, T., 2015. Caco-2 cell line, in: Verhoeckx, K., Cotter, P., Lopez-Exposito, I., Kleiveland,
C., Lea, T., Mackie, A., Requena, T., Swiatecka, D., Wichers, H. (Eds.), The Impact of
Food Bioactives on Health: In vitro and ex vivo models, ed. Springer, pp. 103-11.
Lee, S.Y., Jung, E., Park, J.H., Park, J.W., Shim, C.K., Kim, D.D., Yoon, I.S., Cho, H.J., 2016.
Transient aggregation of chitosan-modified poly(d,l-lactic-co-glycolic) acid

216
nanoparticles in the blood stream and improved lung targeting efficiency. Journal of
Colloid and Interface Science, 480, 102-08.
Lepeltier, E., Bourgaux, C., Couvreur, P., 2014. Nanoprecipitation and the "Ouzo effect":
Application to drug delivery devices. Advanced Drug Delivery Reviews, 71, 86-97.
Leung, M.H.M., Shen, A.Q., 2018. Microfluidic assisted nanoprecipitation of PLGA
nanoparticles for curcumin delivery to leukemia Jurkat cells. Langmuir, 34 (13), 3961-
70.
Li, M., Al-Jamal, K.T., Kostarelos, K., Reineke, J., 2010. Physiologically based
pharmacokinetic modeling of nanoparticles. ACS Nano, 4 (11), 6303-17.
Li, M., Panagi, Z., Avgoustakis, K., Reineke, J., 2012. Physiologically based pharmacokinetic
modeling of PLGA nanoparticles with varied mPEG content. International Journal of
Nanomedicine, 7, 1345-56.
Li, M., Zou, P., Tyner, K., Lee, S., 2017. Physiologically based pharmacokinetic (PBPK)
modeling of pharmaceutical nanoparticles. The AAPS Journal, 19 (1), 26-42.
Li, T., Senesi, A.J., Lee, B., 2016. Small angle X-ray scattering for nanoparticle research.
Chemical Reviews, 116 (18), 11128-80.
Lim, J.M., Bertrand, N., Valencia, P.M., Rhee, M., Langer, R., Jon, S., Farokhzad, O.C.,
Karnik, R., 2014a. Parallel microfluidic synthesis of size-tunable polymeric
nanoparticles using 3D flow focusing towards in vivo study. Nanomedicine, 10 (2), 401-
9.
Lim, J.M., Swami, A., Gilson, L.M., Chopra, S., Choi, S., Wu, J., Langer, R., Karnik, R.,
Farokhzad, O.C., 2014b. Ultra-high throughput synthesis of nanoparticles with
homogeneous size distribution using a coaxial turbulent jet mixer. ACS Nano, 8 (6),
6056-65.
Lince, F., Marchisio, D.L., Barresi, A.A., 2008. Strategies to control the particle size
distribution of poly-ε-caprolactone nanoparticles for pharmaceutical applications.
Journal of Colloid and Interface Science, 322 (2), 505-15.
Liu, K., Wang, H., Chen, K.J., Guo, F., Lin, W.Y., Chen, Y.C., Phung, D.L., Tseng, H.R., Shen,
C.K., 2010. A digital microfluidic droplet generator produces self-assembled
supramolecular nanoparticles for targeted cell imaging. Nanotechnology, 21 (44),
445603.
Liu, K., Zhu, Z., Wang, X., Gonçalves, D., Zhang, B., Hierlemann, A., Hunziker, P., 2015.
Microfluidics-based single-step preparation of injection-ready polymeric nanosystems
for medical imaging and drug delivery. Nanoscale, 7 (40), 16983-93.
Liu, X., Liu, C., Zhang, W., Xie, C., Wei, G., Lu, W., 2013. Oligoarginine-modified
biodegradable nanoparticles improve the intestinal absorption of insulin. International
Journal of Pharmaceutics, 448 (1), 159-67.
Lonn, P., Dowdy, S.F., 2015. Cationic PTD/CPP-mediated macromolecular delivery: Charging
into the cell. Expert Opinion on Drug Delivery, 12 (10), 1627-36.
Lopes, M., Shrestha, N., Correia, A., Shahbazi, M.A., Sarmento, B., Hirvonen, J., Veiga, F.,
Seica, R., Ribeiro, A., Santos, H.A., 2016. Dual chitosan/albumin-coated
alginate/dextran sulfate nanoparticles for enhanced oral delivery of insulin. Journal of
Controlled Release, 232, 29-41.
Lopez, C.G., Watanabe, T., Martel, A., Porcar, L., Cabral, J.T., 2015. Microfluidic-SANS:
Flow processing of complex fluids. Scientific Reports, 5, 7727.
Lopez, C.G., Watanabe, T., Adamo, M., Martel, A., Porcar, L., Cabral, J.T., 2018. Microfluidic
devices for small-angle neutron scattering. Journal of Applied Crystallography, 51, 570-
83.
Lukanowska, M., Howl, J., Jones, S., 2013. Bioportides: Bioactive cell-penetrating peptides
that modulate cellular dynamics. Biotechnology Journal, 8 (8), 918-30.

217
Lundquist, P., Artursson, P., 2016. Oral absorption of peptides and nanoparticles across the
human intestine: Opportunities, limitations and studies in human tissues. Advanced
Drug Delivery Reviews, 106, 256-76.
Luo, Y., Han, Y., Hu, X., Yin, M., Wu, C., Li, Q., Chen, N., Zhao, Y., 2019a. Live-cell imaging
of octaarginine-modified polymer dots via single particle tracking. Cell Proliferation,
52 (2), e12556.
Luo, Z., Yang, Y., Radulescu, A., Kohlbrecher, J., Darwish, T.A., Ong, Q.K., Guldin, S.,
Stellacci, F., 2019b. Multidimensional characterization of mixed ligand nanoparticles
using small angle neutron scattering. Chemistry of Materials.
Luque-Michel, E., Larrea, A., Lahuerta, C., Sebastian, V., Imbuluzqueta, E., Arruebo, M.,
Blanco-Prieto, M.J., Santamaria, J., 2016. A simple approach to obtain hybrid Au-
loaded polymeric nanoparticles with a tunable metal load. Nanoscale, 8 (12), 6495-506.
Makadia, H.K., Siegel, S.J., 2011. Poly lactic-co-glycolic acid (PLGA) as biodegradable
controlled drug delivery carrier. Polymers, 3 (3), 1377-97.
Malhaire, H., Gimel, J.C., Roger, E., Benoit, J.P., Lagarce, F., 2016. How to design the surface
of peptide-loaded nanoparticles for efficient oral bioavailability? Advanced Drug
Delivery Reviews, 106, 320-36.
Mandenius, C.F., Brundin, A., 2008. Bioprocess optimization using design-of-experiments
methodology. Biotechnology Progress, 24 (6), 1191-203.
Manet, S., Lecchi, A., Imperor-Clerc, M., Zholobenko, V., Durand, D., Oliveira, C.L.,
Pedersen, J.S., Grillo, I., Meneau, F., Rochas, C., 2011. Structure of micelles of a
nonionic block copolymer determined by SANS and SAXS. The Journal of Physical
Chemistry B, 115 (39), 11318-29.
Mante, A., Heider, M., Zlomke, C., Mader, K., 2016. PLGA nanoparticles for peroral delivery:
How important is pancreatic digestion and can we control it? European Journal of
Pharmaceutics and Biopharmaceutics, 108, 32-40.
Manzo, C., Garcia-Parajo, M.F., 2015. A review of progress in single particle tracking: From
methods to biophysical insights. Reports on Progress in Physics, 78 (12), 124601.
Masood, F., 2016. Polymeric nanoparticles for targeted drug delivery system for cancer therapy.
Materials Science and Engineering: C Materials for Biological Applications, 60, 569-
78.
Masters, J.R., 2002. HeLa cells 50 years on: The good, the bad and the ugly. Nature Reviews
Cancer, 2 (4), 315-19.
Miao, J., Charalambous, P., Kirz, J., Sayre, D., 1999. Extending the methodology of X-ray
crystallography to allow imaging of micrometre-sized non-crystalline specimens.
Nature, 400 (6742), 342-44.
Min, K.I., Im, D.J., Lee, H.J., Kim, D.P., 2014. Three-dimensional flash flow microreactor for
scale-up production of monodisperse PEG-PLGA nanoparticles. Lab on a Chip, 14 (20),
3987-92.
Mitchell, D.J., Kim, D.T., Steinman, L., Fathman, C.G., Rothbard, J.B., 2000. Polyarginine
enters cells more efficiently than other polycationic homopolymers. The Journal of
Peptide Research, 56 (5), 318-25.
Moku, G., Layek, B., Trautman, L., Putnam, S., Panyam, J., Prabha, S., 2019. Improving
payload capacity and anti-tumor efficacy of mesenchymal stem cells using TAT peptide
functionalized polymeric nanoparticles. Cancers, 11 (4).
Monreal, I.A., Liu, Q., Tyson, K., Bland, T., Dalisay, D.S., Adams, E.V., Wayman, G.A.,
Aguilar, H.C., Saludes, J.P., 2015. Branched dimerization of Tat peptide improves
permeability to HeLa and hippocampal neuronal cells. Chemical Communication, 51
(25), 5463-6.

218
Montrose, K., Yang, Y., Krissansen, G.W., 2014a. The tetrapeptide core of the carrier peptide
Xentry is cell-penetrating: Novel activatable forms of Xentry. Scientific Reports, 4,
4900.
Montrose, K., Yang, Y., Krissansen, G.W., 2014b. X-pep, a novel cell-penetrating peptide
motif derived from the hepatitis B virus. Biochemical and Biophysical Research
Communications, 453 (1), 64-8.
Morikawa, Y., Tagami, T., Hoshikawa, A., Ozeki, T., 2018. The use of an efficient microfluidic
mixing system for generating stabilized polymeric nanoparticles for controlled drug
release. Biological and Pharmaceutical Bulletin, 41 (6), 899-907.
Morimoto, N., Wakamura, M., Muramatsu, K., Toita, S., Nakayama, M., Shoji, W., Suzuki,
M., Winnik, F.M., 2016. Membrane translocation and organelle-selective delivery
steered by polymeric zwitterionic nanospheres. Biomacromolecules, 17 (4), 1523-35.
Mu, Y., Fu, Y., Li, J., Yu, X., Li, Y., Wang, Y., Wu, X., Zhang, K., Kong, M., Feng, C., Chen,
X., 2019. Multifunctional quercetin conjugated chitosan nano-micelles with P-gp
inhibition and permeation enhancement of anticancer drug. Carbohydrate Polymers,
203, 10-18.
Mukherjee, T., Squillantea, E., Gillespieb, M., Shao, J., 2004. Transepithelial electrical
resistance is not a reliable measurement of the Caco-2 monolayer integrity in Transwell.
Drug Delivery, 11 (1), 11-8.
Nam, Y.S., Park, J.Y., Han, S.-H., Chang, I.-S., 2002. Intracellular drug delivery using poly(d,l-
lactide-co-glycolide) nano- particles derivatized with a peptide from a transcriptional
activator protein of HIV-1. Biotechnology Letters, 24 (24), 2093-98.
Nel, A.E., Mädler, L., Velegol, D., Xia, T., Hoek, E.M.V., Somasundaran, P., Klaessig, F.,
Castranova, V., Thompson, M., 2009. Understanding biophysicochemical interactions
at the nano–bio interface. Nature Materials, 8, 543.
Ortiz de Solorzano, I., Uson, L., Larrea, A., Miana, M., Sebastian, V., Arruebo, M., 2016.
Continuous synthesis of drug-loaded nanoparticles using microchannel emulsification
and numerical modeling: Effect of passive mixing. International Journal of
Nanomedicine, 11, 3397-416.
Othman, R., Vladisavljević, G.T., Hemaka Bandulasena, H.C., Nagy, Z.K., 2015. Production
of polymeric nanoparticles by micromixing in a co-flow microfluidic glass capillary
device. Chemical Engineering Journal, 280, 316-29.
Ou, Z.Q., Schmierer, D.M., Strachan, C.J., Rades, T., McDowell, A., 2014. Influence of
postharvest processing and storage conditions on key antioxidants in puha (Sonchus
oleraceus L.). The Journal of Pharmacy and Pharmacology, 66 (7), 998-1008.
Pan, R., Xu, W., Ding, Y., Lu, S., Chen, P., 2016. Uptake mechanism and direct translocation
of a new CPP for siRNA delivery. Molecular Pharmaceutics, 13 (4), 1366-74.
Park, K., Skidmore, S., Hadar, J., Garner, J., Park, H., Otte, A., Soh, B.K., Yoon, G., Yu, D.,
Yun, Y., Lee, B.K., Jiang, X., Wang, Y., 2019. Injectable, long-acting PLGA
formulations: Analyzing PLGA and understanding microparticle formation. Journal of
Controlled Release, 304, 125-34.
Park, T.G., 1995. Degradation of poly(lactic-co-glycolic acid) microspheres: Effect of
copolymer composition. Biomaterials, 16 (15), 1123-30.
Partikel, K., Korte, R., Stein, N.C., Mulac, D., Herrmann, F.C., Humpf, H.-U., Langer, K.,
2019. Effect of nanoparticle size and PEGylation on the protein corona of PLGA
nanoparticles. European Journal of Pharmaceutics and Biopharmaceutics, 141, 70-80.
Patel, L.N., Wang, J., Kim, K.J., Borok, Z., Crandall, E.D., Shen, W.C., 2009. Conjugation with
cationic cell-penetrating peptide increases pulmonary absorption of insulin. Molecular
Pharmaceutics, 6 (2), 492-503.

219
Patel, R.R., Chaurasia, S., Khan, G., Chaubey, P., Kumar, N., Mishra, B., 2016. Cromolyn
sodium encapsulated PLGA nanoparticles: An attempt to improve intestinal permeation.
International Journal of Biological Macromolecules, 83, 249-58.
Patel, S.G., Sayers, E.J., He, L., Narayan, R., Williams, T.L., Mills, E.M., Allemann, R.K., Luk,
L.Y.P., Jones, A.T., Tsai, Y.-H., 2019. Cell-penetrating peptide sequence and
modification dependent uptake and subcellular distribution of green florescent protein
in different cell lines. Scientific Reports, 9 (1), 6298.
Pauw, B.R., 2013. Everything SAXS: Small-angle scattering pattern collection and correction.
Journal of Physics: Condensed Matter, 25 (38), 383201.
Pelaz, B., del Pino, P., Maffre, P., Hartmann, R., Gallego, M., Rivera-Fernández, S., de la
Fuente, J.M., Nienhaus, G.U., Parak, W.J., 2015. Surface functionalization of
nanoparticles with polyethylene glycol: Effects on protein adsorption and cellular
uptake. ACS Nano, 9 (7), 6996-7008.
Pelkmans, L., Helenius, A., 2002. Endocytosis via caveolae. Traffic, 3 (5), 311-20.
Peterson, L.W., Artis, D., 2014. Intestinal epithelial cells: Regulators of barrier function and
immune homeostasis. Nature Reviews Immunology, 14, 141.
Pinto, M., Robine, S., Appay, M.D., Lacroix, B., Assmann, P.F., Fogh, J., Zweibaum, A., 1983.
Enterocyte-like differentiation and polarization of the human-colon carcinoma cell-line
Caco-2 in culture. Biology of the Cell, 47, 323-30.
Pooga, M., Hallbrink, M., Zorko, M., Langel, Ü., 1998. Cell penetration by transportan. FASEB
Journal, 12 (1), 67-77.
Price, S.R., Kinnear, C., Balog, S., 2019. Particokinetics and in vitro dose of high aspect ratio
nanoparticles. Nanoscale, 11 (12), 5209-14.
Putnam, C.D., Hammel, M., Hura, G.L., Tainer, J.A., 2007. X-ray solution scattering (SAXS)
combined with crystallography and computation: Defining accurate macromolecular
structures, conformations and assemblies in solution. Quarterly Reviews of Biophysics,
40 (3), 191-285.
Quintanar-Guerrero, D., Allemann, E., Fessi, H., Doelker, E., 1998. Preparation techniques and
mechanisms of formation of biodegradable nanoparticles from preformed polymers.
Drug Development and Industrial Pharmacy, 24 (12), 1113-28.
Ramaker, K., Henkel, M., Krause, T., Rockendorf, N., Frey, A., 2018. Cell penetrating peptides:
A comparative transport analysis for 474 sequence motifs. Drug Delivery, 25 (1), 928-
37.
Reifarth, M., Hoeppener, S., Schubert, U.S., 2018. Uptake and intracellular fate of engineered
nanoparticles in mammalian cells: Capabilities and limitations of transmission electron
microscopy—polymer-based nanoparticles. Advanced Materials, 30 (9), 1703704.
Reix, N., Parat, A., Seyfritz, E., Van der Werf, R., Epure, V., Ebel, N., Danicher, L., Marchioni,
E., Jeandidier, N., Pinget, M., Frere, Y., Sigrist, S., 2012. In vitro uptake evaluation in
Caco-2 cells and in vivo results in diabetic rats of insulin-loaded PLGA nanoparticles.
International Journal of Pharmaceutics, 437 (1-2), 213-20.
Rieux, A.d., Ragnarsson, E.G.E., Gullberg, E., Préat, V., Schneider, Y.-J., Artursson, P., 2005.
Transport of nanoparticles across an in vitro model of the human intestinal follicle
associated epithelium. European Journal of Pharmaceutical Sciences, 25 (4), 455-65.
Ruczyński, J., Rusiecka, I., Turecka, K., Kozłowska, A., Alenowicz, M., Gągało, I., Kawiak,
A., Rekowski, P., Waleron, K., Kocić, I., 2019. Transportan 10 improves the
pharmacokinetics and pharmacodynamics of vancomycin. Scientific Reports, 9 (1),
3247.
Ruland, W., 1971. Small-angle scattering of two-phase systems: Determination and
significance of systematic deviations from Porod's law. Journal of Applied
Crystallography, 4 (1), 70-73.
220
Ruozi, B., Belletti, D., Tombesi, A., Tosi, G., Bondioli, L., Forni, F., Vandelli, M.A., 2011.
AFM, ESEM, TEM, and CLSM in liposomal characterization: A comparative study.
International Journal of Nanomedicine, 6, 557-63.
Ruozi, B., Belletti, D., Vandelli, M.A., Pederzoli, F., Veratti, P., Forni, F., Tosi, G., Tonelli,
M., Zapparoli, M., 2014. AFM/TEM complementary structural analysis of surface-
functionalized nanoparticles. Journal of Physical Chemistry & Biophysics, 4 (4).
Ryser, H.J., Hancock, R., 1965. Histones and basic polyamino acids stimulate the uptake of
albumin by tumor cells in culture. Science, 150 (3695), 501-3.
Saarinen, J., Gutter, F., Lindman, M., Agopov, M., Fraser-Miller, S.J., Scherliess, R., Jokitalo,
E., Santos, H.A., Peltonen, L., Isomaki, A., Strachan, C.J., 2019. Cell-nanoparticle
interactions at (sub)-nanometer resolution analyzed by electron microscopy and
correlative coherent anti-Stokes Raman scattering. Biotechnology Journal, 14 (4),
e1800413.
Saleh, A.F., Arzumanov, A., Abes, R., Owen, D., Lebleu, B., Gait, M.J., 2010. Synthesis and
splice-redirecting activity of branched, arginine-rich peptide dendrimer conjugates of
peptide nucleic acid oligonucleotides. Bioconjugate Chemistry, 21 (10), 1902-11.
Sanada, Y., Akiba, I., Sakurai, K., Shiraishi, K., Yokoyama, M., Mylonas, E., Ohta, N., Yagi,
N., Shinohara, Y., Amemiya, Y., 2013. Hydrophobic molecules infiltrating into the
poly(ethylene glycol) domain of the core/shell interface of a polymeric micelle:
Evidence obtained with anomalous small-angle X-ray scattering. Journal of the
American Chemical Society, 135 (7), 2574-82.
Scanlon, D.B., Finlayson, J., 2004. Prep/semiprep separation of peptides, in: Aguilar, M.-I.
(Ed.), Methods in Molecular Biology, ed. Humana Press Inc.
Scott, A.J., Penlidis, A., 2017. Copolymerization, in, Reference Module in Chemistry,
Molecular Sciences and Chemical Engineering, ed.
Shahbazi, S., Bolhassani, A., 2018. Comparison of six cell penetrating peptides with different
properties for in vitro and in vivo delivery of HPV16 E7 antigen in therapeutic vaccines.
International Immunopharmacology, 62, 170-80.
Shai, Y., 2013. ATR-FTIR studies in pore forming and membrane induced fusion peptides.
Biochimica et Biophysica Acta, 1828 (10), 2306-13.
Shang, L., Nienhaus, G.U., 2013. Small fluorescent nanoparticles at the nano–bio interface.
Materials Today, 16 (3), 58-66.
Sharma, G., Sharma, A.R., Nam, J.-S., Doss, G.P.C., Lee, S.-S., Chakraborty, C., 2015.
Nanoparticle based insulin delivery system: The next generation efficient therapy for
Type 1 diabetes. Journal of Nanobiotechnology, 13 (1), 74.
Sharma, N., Mishra, S., Sharma, S., Deshpande, R.D., Sharma, R.K., 2013. Preparation and
optimization of nanoemulsions for targeting drug delivery. International Journal of Drug
Development and Research, 5 (4), 37-48.
Sharma, S., Parmar, A., Kori, S., Sandhir, R., 2016. PLGA-based nanoparticles: A new
paradigm in biomedical applications. TrAC Trends in Analytical Chemistry, 80, 30-40.
Sheng, J., Han, L., Qin, J., Ru, G., Li, R., Wu, L., Cui, D., Yang, P., He, Y., Wang, J., 2015. N-
trimethyl chitosan chloride-coated PLGA nanoparticles overcoming multiple barriers to
oral insulin absorption. ACS Applied Materials & Interfaces, 7 (28), 15430-41.
Sheng, J., He, H., Han, L., Qin, J., Chen, S., Ru, G., Li, R., Yang, P., Wang, J., Yang, V.C.,
2016. Enhancing insulin oral absorption by using mucoadhesive nanoparticles loaded
with LMWP-linked insulin conjugates. Journal of Controlled Release, 233, 181-90.
Shi, J., Guo, S., Wu, Y., Chen, G., Lai, J., Xu, X., 2019. Behaviour of cell penetrating peptide
TAT-modified liposomes loaded with salvianolic acid B on the migration, proliferation,
and survival of human skin fibroblasts. Journal of Liposome Research, 1-14.

221
Siafaka, P.I., Ustundag Okur, N., Karavas, E., Bikiaris, D.N., 2016. Surface modified
multifunctional and stimuli responsive nanoparticles for drug targeting: Current status
and uses. International Journal of Molecular Sciences, 17 (9).
Silva, S., Almeida, A.J., Vale, N., 2019. Combination of cell-penetrating peptides with
nanoparticles for therapeutic application: A review. Biomolecules, 9 (1), 22.
Singh, B., Bhatowa, R., Tripathi, C.B., Kapil, R., 2011a. Developing micro-/nanoparticulate
drug delivery systems using "design of experiments". International Journal of
Pharmaceutical Investigation, 1 (2), 75-87.
Singh, B., Kapil, R., Nandi, M., Ahuja, N., 2011b. Developing oral drug delivery systems using
formulation by design: Vital precepts, retrospect and prospects. Expert Opinion on Drug
Delivery, 8 (10), 1341-60.
Siu, F.Y., Ye, S., Lin, H., Li, S., 2018. Galactosylated PLGA nanoparticles for the oral delivery
of resveratrol: enhanced bioavailability and in vitro anti-inflammatory activity.
International Journal of Nanomedicine, 13, 4133-44.
Solans, C., Solé, I., 2012. Nano-emulsions: Formation by low-energy methods. Current Opinion
in Colloid & Interface Science, 17 (5), 246-54.
Sonam, Chaudhary, H., Kumar, V., 2014. Taguchi design for optimization and development of
antibacterial drug-loaded PLGA nanoparticles. International Journal of Biological
Macromolecules, 64, 99-105.
Steinbach, J.M., Seo, Y.E., Saltzman, W.M., 2016. Cell penetrating peptide-modified
poly(lactic-co-glycolic acid) nanoparticles with enhanced cell internalization. Acta
Biomaterialia, 30, 49-61.
Streck, S., Neumann, H., Nielsen, H.M., Rades, T., McDowell, A., 2019a. Comparison of bulk
and microfluidics methods for the formulation of poly-lactic-co-glycolic acid (PLGA)
nanoparticles modified with cell-penetrating peptides of different architectures.
International Journal of Pharmaceutics: X, 1, 100030.
Streck, S., Clulow, A.J., Nielsen, H.M., Rades, T., Boyd, B.J., McDowell, A., 2019b. The
distribution of cell-penetrating peptides on polymeric nanoparticles prepared using
microfluidics and elucidated with small angle X-ray scattering. Journal of Colloid and
Interface Science, 555, 438-48.
Streck, S., Hong, L., Boyd, B.J., McDowell, A., 2019c. Microfluidics for the production of
nanomedicines: Considerations for polymer and lipid-based systems. Pharmaceutical
Nanotechnology, 7 (6), 1-21.
Stroock, A.D., Dertinger, S.K., Ajdari, A., Mezic, I., Stone, H.A., Whitesides, G.M., 2002.
Chaotic mixer for microchannels. Science, 295 (5555), 647-51.
Su, Y., Doherty, T., Waring, A.J., Ruchala, P., Hong, M., 2009. Roles of arginine and lysine
residues in the translocation of a cell-penetrating peptide from (13)C, (31)P, and (19)F
solid-state NMR. Biochemistry, 48 (21), 4587-95.
Sun, J., Zhang, L., Wang, J., Feng, Q., Liu, D., Yin, Q., Xu, D., Wei, Y., Ding, B., Shi, X.,
Jiang, X., 2015. Tunable rigidity of (polymeric core)–(lipid shell) nanoparticles for
regulated cellular uptake. Advanced Materials, 27 (8), 1402-07.
Tan, H.Y., Trier, S., Rahbek, U.L., Dufva, M., Kutter, J.P., Andresen, T.L., 2018. A multi-
chamber microfluidic intestinal barrier model using Caco-2 cells for drug transport
studies. PLoS One, 13 (5), e0197101.
Tantra, R., Knight, A., 2011. Cellular uptake and intracellular fate of engineered nanoparticles:
A review on the application of imaging techniques. Nanotoxicology, 5 (3), 381-92.
Tariq, M., Alam, M.A., Singh, A.T., Iqbal, Z., Panda, A.K., Talegaonkar, S., 2015.
Biodegradable polymeric nanoparticles for oral delivery of epirubicin: In vitro, ex vivo,
and in vivo investigations. Colloids and Surfaces B: Biointerfaces, 128, 448-56.

222
Tefas, L.R., Tomuta, I., Achim, M., Vlase, L., 2015. Development and optimization of
quercetin-loaded PLGA nanoparticles by experimental design. Clujul Medical, 88 (2),
214-23.
Thomas, D.G., Smith, J.N., Thrall, B.D., Baer, D.R., Jolley, H., Munusamy, P., Kodali, V.,
Demokritou, P., Cohen, J., Teeguarden, J.G., 2018. ISD3: A particokinetic model for
predicting the combined effects of particle sedimentation, diffusion and dissolution on
cellular dosimetry for in vitro systems. Particle and Fibre Toxicology, 15 (1), 6.
Thwala, L.N., Preat, V., Csaba, N.S., 2017. Emerging delivery platforms for mucosal
administration of biopharmaceuticals: A critical update on nasal, pulmonary and oral
routes. Expert Opinion on Drug Delivery, 14 (1), 23-36.
Torchilin, V.P., 2014. Multifunctional, stimuli-sensitive nanoparticulate systems for drug
delivery. Nature Reviews Drug Discovery, 13 (11), 813-27.
Totaro, K.A., Liao, X., Bhattacharya, K., Finneman, J.I., Sperry, J.B., Massa, M.A., Thorn, J.,
Ho, S.V., Pentelute, B.L., 2016. Systematic investigation of EDC/sNHS-mediated
bioconjugation reactions for carboxylated peptide substrates. Bioconjugate Chemistry,
27 (4), 994-1004.
Toth, M.J., Kim, T., Kim, Y., 2017. Robust manufacturing of lipid-polymer nanoparticles
through feedback control of parallelized swirling microvortices. Lab on a Chip, 17 (16),
2805-13.
Totterman, A.M., Schipper, N.G., Thompson, D.O., Mannermaa, J.P., 1997. Intestinal safety of
water-soluble beta-cyclodextrins in paediatric oral solutions of spironolactone: Effects
on human intestinal epithelial Caco-2 cells. The Journal of Pharmacy and
Pharmacology, 49 (1), 43-8.
Trehin, R., Krauss, U., Beck-Sickinger, A.G., Merkle, H.P., Nielsen, H.M., 2004. Cellular
uptake but low permeation of human calcitonin-derived cell penetrating peptides and
Tat(47-57) through well-differentiated epithelial models. Pharmaceutical Research, 21
(7), 1248-56.
Tunsirikongkon, A., Pyo, Y.C., Kim, D.H., Lee, S.E., Park, J.S., 2019. Optimization of
polyarginine-conjugated PEG lipid grafted proliposome formulation for enhanced
cellular association of a protein drug. Pharmaceutics, 11 (6).
Utada, A.S., Chu, L.Y., Fernandez-Nieves, A., Link, D.R., Holtze, C., Weitz, D.A., 2007.
Dripping, jetting, drops, and wetting: The magic of microfluidics. MRS Bulletin, 32 (9),
702-08.
Vaidya, B., Parvathaneni, V., Kulkarni, N.S., Shukla, S.K., Damon, J.K., Sarode, A., Kanabar,
D., Garcia, J.V., Mitragotri, S., Muth, A., Gupta, V., 2019. Cyclodextrin modified
erlotinib loaded PLGA nanoparticles for improved therapeutic efficacy against non-
small cell lung cancer. International Journal of Biological Macromolecules, 122, 338-
47.
Valencia, P.M., Basto, P.A., Zhang, L., Rhee, M., Langer, R., Farokhzad, O.C., Karnik, R.,
2010. Single-step assembly of homogenous lipid-polymeric and lipid-quantum dot
nanoparticles enabled by microfluidic rapid mixing. ACS Nano, 4 (3), 1671-9.
Valencia, P.M., Farokhzad, O.C., Karnik, R., Langer, R., 2012. Microfluidic technologies for
accelerating the clinical translation of nanoparticles. Nature Nanotechnology, 7, 623.
Valencia, P.M., Pridgen, E.M., Rhee, M., Langer, R., Farokhzad, O.C., Karnik, R., 2013.
Microfluidic platform for combinatorial synthesis and optimization of targeted
nanoparticles for cancer therapy. ACS Nano, 7 (12), 10671-80.
van Bracht, E., Versteegden, L.R., Stolle, S., Verdurmen, W.P., Woestenenk, R., Raave, R.,
Hafmans, T., Oosterwijk, E., Brock, R., van Kuppevelt, T.H., Daamen, W.F., 2014.
Enhanced cellular uptake of albumin-based lyophilisomes when functionalized with
cell-penetrating peptide TAT in HeLa cells. PLoS One, 9 (11), e110813.

223
van Oppen, L.M.P.E., Pille, J., Stuut, C., van Stevendaal, M., van der Vorm, L.N., Smeitink,
J.A.M., Koopman, W.J.H., Willems, P.H.G.M., van Hest, J.C.M., Brock, R., 2019.
Octa-arginine boosts the penetration of elastin-like polypeptide nanoparticles in 3D
cancer models. European Journal of Pharmaceutics and Biopharmaceutics, 137, 175-84.
Vasconcelos, A., Vega, E., Perez, Y., Gomara, M.J., Garcia, M.L., Haro, I., 2015. Conjugation
of cell-penetrating peptides with poly(lactic-co-glycolic acid)-polyethylene glycol
nanoparticles improves ocular drug delivery. International Journal of Nanomedicine,
10, 609-31.
Vithani, K., Hawley, A., Jannin, V., Pouton, C., Boyd, B.J., 2017. Inclusion of digestible
surfactants in solid SMEDDS formulation removes lag time and influences the
formation of structured particles during digestion. The AAPS Journal, 19 (3), 754-64.
Vives, E., Brodin, P., Lebleu, B., 1997. A truncated HIV-1 Tat protein basic domain rapidly
translocates through the plasma membrane and accumulates in the cell nucleus. The
Journal of Biological Chemistry, 272 (25), 16010-7.
von Roemeling, C., Jiang, W., Chan, C.K., Weissman, I.L., Kim, B.Y.S., 2017. Breaking down
the barriers to precision cancer nanomedicine. Trends in Biotechnology, 35 (2), 159-71.
Vuddanda, P.R., Mishra, A., Singh, S.K., Singh, S., 2015. Development of polymeric
nanoparticles with highly entrapped herbal hydrophilic drug using nanoprecipitation
technique: An approach of quality by design. Pharmaceutical Development and
Technology, 20 (5), 579-87.
Wang, J.T., Wang, J., Han, J.J., 2011. Fabrication of advanced particles and particle-based
materials assisted by droplet-based microfluidics. Small, 7 (13), 1728-54.
Wang, Y., Kim, R., Hinman, S.S., Zwarycz, B., Magness, S.T., Allbritton, N.L., 2018.
Bioengineered systems and designer matrices that recapitulate the intestinal stem cell
niche. Cellular and Molecular Gastroenterology and Hepatology, 5 (3), 440-53.e1.
Wassel, R.A., Grady, B., Kopke, R.D., Dormer, K.J., 2007. Dispersion of super paramagnetic
iron oxide nanoparticles in poly(d,l-lactide-co-glycolide) microparticles. Colloids and
Surfaces A: Physicochemical and Engineering Aspects, 292 (2), 125-30.
Water, J.J., Kim, Y., Maltesen, M.J., Franzyk, H., Foged, C., Nielsen, H.M., 2015. Hyaluronic
acid-based nanogels produced by microfluidics-facilitated self-assembly Improves the
safety profile of the cationic host defense peptide novicidin. Pharmaceutical Research,
32 (8), 2727-35.
Whitesides, G.M., 2006. The origins and the future of microfluidics. Nature, 442 (7101), 368-
73.
Williams, M.S., Longmuir, K.J., Yager, P., 2008. A practical guide to the staggered herringbone
mixer. Lab on a Chip, 8 (7), 1121-29.
Win, K.Y., Feng, S.S., 2005. Effects of particle size and surface coating on cellular uptake of
polymeric nanoparticles for oral delivery of anticancer drugs. Biomaterials, 26 (15),
2713-22.
Winey, M., Meehl, J.B., O'Toole, E.T., Giddings, T.H., Jr., 2014. Conventional transmission
electron microscopy. Molecular Biology of the Cell, 25 (3), 319-23.
Wu, X.S., Wang, N., 2001. Synthesis, characterization, biodegradation, and drug delivery
application of biodegradable lactic/glycolic acid polymers. Part II: Biodegradation.
Journal of Biomaterials Science Polymer Edition, 12 (1), 21-34.
Xia, H., Gao, X., Gu, G., Liu, Z., Hu, Q., Tu, Y., Song, Q., Yao, L., Pang, Z., Jiang, X., Chen,
J., Chen, H., 2012. Penetratin-functionalized PEG-PLA nanoparticles for brain drug
delivery. International Journal of Pharmaceutics, 436 (1-2), 840-50.
Xie, H., Smith, J.W., 2010. Fabrication of PLGA nanoparticles with a fluidic nanoprecipitation
system. Journal of Nanobiotechnology, 8, 18.

224
Xu, H., Kona, S., Su, L.-C., Tsai, Y.-T., Dong, J.-F., Brilakis, E.S., Tang, L., Banerjee, S.,
Nguyen, K.T., 2013a. Multi-ligand poly(L-lactic-co-glycolic acid) nanoparticles inhibit
activation of endothelial cells. Journal of Cardiovascular Translational Research, 6 (4),
570-78.
Xu, J., Zhang, S., Machado, A., Lecommandoux, S., Sandre, O., Gu, F., Colin, A., 2017.
Controllable microfluidic production of drug-loaded PLGA nanoparticles using
partially water-miscible mixed solvent microdroplets as a precursor. Scientific Reports,
7 (1), 4794.
Xu, S., Olenyuk, B.Z., Okamoto, C.T., Hamm-Alvarez, S.F., 2013b. Targeting receptor-
mediated endocytotic pathways with nanoparticles: Rationale and advances. Advanced
Drug Delivery Reviews, 65 (1), 121-38.
Yadav, K.S., Sawant, K.K., 2010. Modified nanoprecipitation method for preparation of
cytarabine-loaded PLGA nanoparticles. AAPS PharmSciTech, 11 (3), 1456-65.
Yadav, S.C., Kumari, A., Yadav, R., 2011. Development of peptide and protein
nanotherapeutics by nanoencapsulation and nanobioconjugation. Peptides, 32 (1), 173-
87.
Yang, B., Lowe, J.P., Schweins, R., Edler, K.J., 2015. Small angle neutron scattering studies
on the internal structure of poly(lactide-co-glycolide)-block-poly(ethylene glycol)
nanoparticles as drug delivery vehicles. Biomacromolecules, 16 (2), 457-64.
Ye, D., Dawson, K.A., Lynch, I., 2015. A TEM protocol for quality assurance of in vitro cellular
barrier models and its application to the assessment of nanoparticle transport
mechanisms across barriers. The Analyst, 140 (1), 83-97.
Yong, K.W., Yuen, D., Chen, M.Z., Porter, C.J.H., Johnston, A.P.R., 2019. Pointing in the right
direction: Controlling the orientation of proteins on nanoparticles improves targeting
efficiency. Nano Letters, 19 (3), 1827-31.
Yoo, J., Lee, D., Gujrati, V., Rejinold, N.S., Lekshmi, K.M., Uthaman, S., Jeong, C., Park, I.K.,
Jon, S., Kim, Y.C., 2017. Bioreducible branched poly(modified nona-arginine) cell-
penetrating peptide as a novel gene delivery platform. Journal of Controlled Release,
246, 142-54.
Zabihi, F., Xin, N., Li, S., Jia, J., Cheng, T., Zhao, Y., 2014. Polymeric coating of fluidizing
nano-curcumin via anti-solvent supercritical method for sustained release. The Journal
of Supercritical Fluids, 89, 99-105.
Zhai, P., Chen, X.B., Schreyer, D.J., 2015. PLGA/alginate composite microspheres for
hydrophilic protein delivery. Materials Science and Engineering: C Materials for
Biological Applications, 56, 251-59.
Zhang, C., Ren, W., Liu, Q., Tan, Z., Li, J., Tong, C., 2019. Transportan-derived cell-
penetrating peptide delivers siRNA to inhibit replication of influenza virus in vivo. Drug
Design, Development and Therapy, 13, 1059-68.
Zhang, D., Wang, J., Xu, D., 2016. Cell-penetrating peptides as noninvasive transmembrane
vectors for the development of novel multifunctional drug-delivery systems. Journal of
Controlled Release, 229, 130-39.
Zhang, F., Skoda, M.W.A., Jacobs, R.M.J., Martin, R.A., Martin, C.M., Schreiber, F., 2007.
Protein interactions studied by SAXS: Effect of ionic strength and protein concentration
for BSA in aqueous solutions. The Journal of Physical Chemistry B, 111 (1), 251-59.
Zhang, L., Feng, Q., Wang, J., Zhang, S., Ding, B., Wei, Y., Dong, M., Ryu, J.-Y., Yoon, T.-
Y., Shi, X., Sun, J., Jiang, X., 2015. Microfluidic synthesis of hybrid nanoparticles with
controlled lipid layers: Understanding flexibility-regulated cell–nanoparticle
interaction. ACS Nano, 9 (10), 9912-21.
225
Zhang, Z., Tsai, P.C., Ramezanli, T., Michniak-Kohn, B.B., 2013. Polymeric nanoparticles-
based topical delivery systems for the treatment of dermatological diseases. Wiley
Interdisciplinary Reviews: Nanomedicine and Nanobiotechnology, 5 (3), 205-18.
Zhao, J., Zhou, R., Fu, X., Ren, W., Ma, L., Li, R., Zhao, Y., Guo, L., 2014a. Cell-penetrable
lysine dendrimers for anti-cancer drug delivery: Synthesis and preliminary biological
evaluation. Archiv der Pharmazie, 347 (7), 469-77.
Zhao, Z., Li, Y., Zhang, Y., Chen, A.-Z., Li, G., Zhang, J., Xie, M.-B., 2014b. Development of
silk fibroin modified poly(l-lactide)–poly(ethylene glycol)–poly(l-lactide)
nanoparticles in supercritical CO2. Powder Technology, 268, 118-25.
Zhigaltsev, I.V., Belliveau, N., Hafez, I., Leung, A.K., Huft, J., Hansen, C., Cullis, P.R., 2012.
Bottom-up design and synthesis of limit size lipid nanoparticle systems with aqueous
and triglyceride cores using millisecond microfluidic mixing. Langmuir, 28 (7), 3633-
40.
Zhou, X., Chen, Q., Ma, Y., Huang, Y., Gou, S., Xiao, B., 2019. Porous polymeric
microparticles as an oral drug platform for effective ulcerative colitis treatment. Journal
of Pharmaceutical Sciences, 108 (7), 2238-42.
Zhu, S., Chen, S., Gao, Y., Guo, F., Li, F., Xie, B., Zhou, J., Zhong, H., 2016a. Enhanced oral
bioavailability of insulin using PLGA nanoparticles co-modified with cell-penetrating
peptides and Engrailed secretion peptide (Sec). Drug Delivery, 23 (6), 1980-91.
Zhu, X., Wu, J., Shan, W., Tao, W., Zhao, L., Lim, J.-M., D'Ortenzio, M., Karnik, R., Huang,
Y., Shi, J., Farokhzad, O.C., 2016b. Polymeric nanoparticles amenable to simultaneous
installation of exterior targeting and interior therapeutic proteins. Angewandte Chemie,
55 (10), 3309-12.
Zhu, X., Lu, N., Zhou, Y., Xuan, S., Zhang, J., Giampieri, F., Zhang, Y., Yang, F., Yu, R.,
Battino, M., Wang, Z., 2019. Targeting pancreatic cancer cells with peptide-
functionalized polymeric magnetic nanoparticles. International Journal of Molecular
Sciences, 20 (12).
Zhuang, J., Wang, D., Li, D., Yang, Y., Lu, Y., Wu, W., Wu, W., Qi, J., 2018. The influence of
nanoparticle shape on bilateral exocytosis from Caco-2 cells. Chinese Chemical Letters,
29 (12), 1815-18.
Zu, M., Ma, L., Zhang, X., Xie, D., Kang, Y., Xiao, B., 2019. Chondroitin sulfate-
functionalized polymeric nanoparticles for colon cancer-targeted chemotherapy.
Colloids and Surfaces B: Biointerfaces, 177, 399-406.

Appendix

Appendix
227
Appendix I
Input factors and output responses for the individual runs of the bulk nanoprecipitation method
from the design of experiments study. Data obtained for the centre point is shown as mean ±
SD (n = 3).
PLGA Concentration
(mg/mL)
PVA
Concentration (%) Time (h) Size (nm) PDI
Level Level Level
-1 0 1 -1 0 1 -1 0 1
2 0.5 0.5 103.7 0.205
2 0.5 4 107.5 0.335
2 5 0.5 188.5 0.204
2 5 4 235.1 0.225
13.5 2.75 2.25 154.8 ± 6.1 0.149 ±
0.024
25 0.5 0.5 149.4 0.187
25 0.5 4 153.9 0.167
25 5 0.5 174.2 0.173
25 5 4 193.6 0.171

Appendix
228
Appendix II
Input factors and output responses for the individual runs of the microfluidics method from the
design of experiments study. Data obtained for the centre point is shown as mean ± SD (n = 6).
Total Flow Rate (TFR)
mL/min
Flow Rate Ratio (FRR) Size (nm) PDI
Level Level
-1 0 1 -1 0 1
2 1 : 1 194.8 0.055
2 1 : 1 196.8 0.080
2
12 : 1 136.4 0.165
2
12 : 1 135.0 0.168
7
6.5 : 1 172.7 ± 1.5 0.143 ± 0.014
12 1 : 1 194.2 0.056
12 1 : 1 192.2 0.060
12
12 : 1 137.8 0.163
12
12 : 1 139.8 0.155

Appendix
229
Appendix III
Standard curves of RP-HPLC methods for RRH (50-1000 µg/mL) (A), TAT (100-1000 µg/mL)
(B) and bTAT (50-750 µg/mL) (C). Data are means ± SD (n = 3).

Appendix
230
Appendix IV
Stacked RP-HPLC chromatograms of the RRH standards (50-1000 µg/mL) (A), TAT standards
(100-1000 μg/mL) (B) and bTAT standards (50-750 μg/mL) (C).

Appendix
231
Appendix V
Small angle X-ray scattering profile of the AuNPs used in this study along with the fitting of
the spherical structure factors. The dashed blue and red lines indicate the fitting models for
spheres with radii of 2.2 and 4.4 nm, respectively. Polydispersity of 0.17 (standard deviation
in radius over the mean radius) was incorporated into the two sphere models according to the
manufacturers specified standard deviation in mean radius. The black line is the sum of the two
models. Note that the background for each individual sphere model is half of the observed
background in the recorded data. SASView fitting software was used for the data modelling
and the following fitting parameters were used:
2
3
sin( ) cos( )( ) 3 ( )
( )
qr qr qrI q V background
V qr
where ϕ = particle volume fraction, V = particle volume, Δρ = SLD contrast, r = particle radius.
Sphere 1 – radius = 22 Å (fixed), polydispersity = 0.17 (fixed), particle SLD = 1.23 × 10⁻⁴ Å-2
(for Au, fixed), solvent SLD = 9.47 × 10⁻⁶ Å-2 (for water, fixed), background = 0.0009 cm-1
(fixed) and volume fraction of particles = (1.41 ± 0.01) × 10-5.
Sphere 2 – radius = 44 Å (fixed), polydispersity = 0.17 (fixed), particle SLD = 1.23 × 10⁻⁴ Å-2
(for Au, fixed), solvent SLD = 9.47 × 10⁻⁶ Å-2 (for water, fixed), background = 0.0009 cm-1
(fixed) and volume fraction of particles = (1.06 ± 0.01) × 10-6.

Appendix
232
Appendix VI
Monitoring of transepithelial electrical resistance (TEER) value of Caco-2 cell monolayer
between day 17 and day 22 after seeding on cell culture inserts with a permeable membrane.
Data are means ± SEM (n = 3).

Appendix
233
Appendix VII
A
B
Confocal images of Caco-2 cell monolayer incubated for 2 h with RRH- (A), TAT- (B) and
bTAT-tagged PLGA-FPR nanoparticles (C) prepared using the post-microfluidics conjugation
approach. The z-stack images of Caco-2 cells with CPP-tagged PLGA have had a slice
thickness of 0.75 µm or 1.25 µm for RRH- or TAT- and bTAT-tagged PLGA-FPR
nanoparticles, respectively. The white arrow is pointing towards red fluorescence of PLGA-
FPR nanoparticles or CPP-tagged PLGA-FPR nanoparticles.
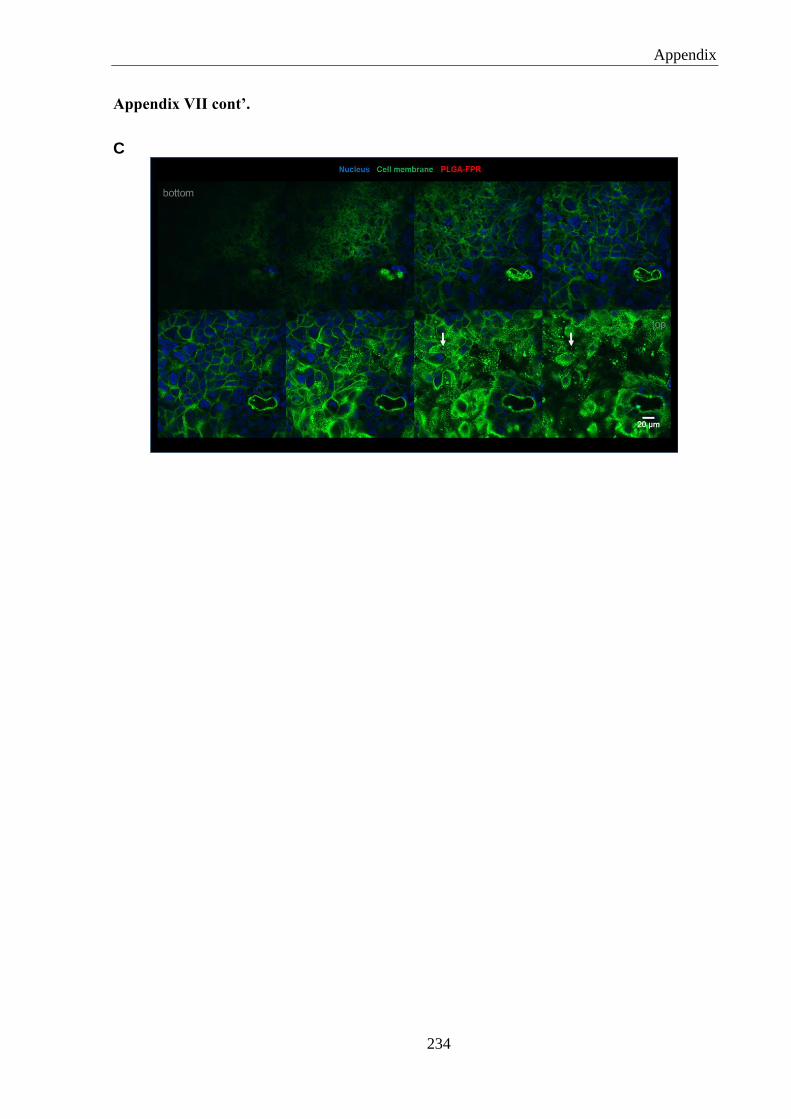
Appendix
234
Appendix VII cont’.
C
Copyright © 2022 FDOKUMEN