A theoretical account of cue averaging in the rodent head direction system
10
, 20130283, published 23 December 2013 369 2014 Phil. Trans. R. Soc. B M. Stringer Hector J. I. Page, Daniel M. Walters, Rebecca Knight, Caitlin E. Piette, Kathryn J. Jeffery and Simon direction system A theoretical account of cue averaging in the rodent head Supplementary data ml http://rstb.royalsocietypublishing.org/content/suppl/2013/12/20/rstb.2013.0283.DC2.ht "Data Supplement" References http://rstb.royalsocietypublishing.org/content/369/1635/20130283.full.html#ref-list-1 This article cites 31 articles, 13 of which can be accessed free This article is free to access Email alerting service here right-hand corner of the article or click Receive free email alerts when new articles cite this article - sign up in the box at the top http://rstb.royalsocietypublishing.org/subscriptions go to: Phil. Trans. R. Soc. B To subscribe to on December 23, 2013 rstb.royalsocietypublishing.org Downloaded from on December 23, 2013 rstb.royalsocietypublishing.org Downloaded from
Transcript of A theoretical account of cue averaging in the rodent head direction system
, 20130283, published 23 December 2013369 2014 Phil. Trans. R. Soc. B M. StringerHector J. I. Page, Daniel M. Walters, Rebecca Knight, Caitlin E. Piette, Kathryn J. Jeffery and Simon direction systemA theoretical account of cue averaging in the rodent head
Supplementary data
ml http://rstb.royalsocietypublishing.org/content/suppl/2013/12/20/rstb.2013.0283.DC2.ht
"Data Supplement"
Referenceshttp://rstb.royalsocietypublishing.org/content/369/1635/20130283.full.html#ref-list-1
This article cites 31 articles, 13 of which can be accessed free
This article is free to access
Email alerting service hereright-hand corner of the article or click Receive free email alerts when new articles cite this article - sign up in the box at the top
http://rstb.royalsocietypublishing.org/subscriptions go to: Phil. Trans. R. Soc. BTo subscribe to
on December 23, 2013rstb.royalsocietypublishing.orgDownloaded from on December 23, 2013rstb.royalsocietypublishing.orgDownloaded from
on December 23, 2013rstb.royalsocietypublishing.orgDownloaded from
rstb.royalsocietypublishing.org
ResearchCite this article: Page HJI, Walters DM,
Knight R, Piette CE, Jeffery KJ, Stringer SM.
2014 A theoretical account of cue averaging
in the rodent head direction system. Phil.
Trans. R. Soc. B 369: 20130283.
http://dx.doi.org/10.1098/rstb.2013.0283
One contribution of 24 to a Theo Murphy
Meeting Issue ‘Space in the brain: cells,
circuits, codes and cognition’.
Subject Areas:neuroscience, computational biology,
theoretical biology, cognition, behaviour
Keywords:path integration, head direction cells,
isomapping, sensory cue integration, attractor
dynamics, neural networks
Author for correspondence:Hector J. I. Page
e-mail: [email protected]
& 2013 The Authors. Published by the Royal Society under the terms of the Creative Commons AttributionLicense http://creativecommons.org/licenses/by/3.0/, which permits unrestricted use, provided the originalauthor and source are credited.
Electronic supplementary material is available
at http://dx.doi.org/10.1098/rstb.2013.0283 or
via http://rstb.royalsocietypublishing.org.
A theoretical account of cue averagingin the rodent head direction system
Hector J. I. Page1, Daniel M. Walters1, Rebecca Knight2, Caitlin E. Piette2,Kathryn J. Jeffery2 and Simon M. Stringer1
1Oxford Centre for Theoretical Neuroscience and Artificial Intelligence, Departmental of Experimental Psychology,University of Oxford, South Parks Road, Oxford OX1 3UD, UK2Division of Psychology and Language Sciences, Department of Cognitive, Perceptual and Brain Sciences,Institute of Behavioural Neuroscience, University College London, 26 Bedford Way, London WC1H 0AP, UK
Head direction (HD) cell responses are thought to be derived from a combin-
ation of internal (or idiothetic) and external (or allothetic) sources of
information. Recent work from the Jeffery laboratory shows that the relative
influence of visual versus vestibular inputs upon the HD cell response
depends on the disparity between these sources. In this paper, we present
simulation results from a model designed to explain these observations.
The model accurately replicates the Knight et al. data. We suggest that cue
conflict resolution is critically dependent on plastic remapping of visual
information onto the HD cell layer. This remap results in a shift in preferred
directions of a subset of HD cells, which is then inherited by the rest of the
cells during path integration. Thus, we demonstrate how, over a period of
several minutes, a visual landmark may gain cue control. Furthermore,
simulation results show that weaker visual landmarks fail to gain cue control
as readily. We therefore suggest a second longer term plasticity in visual pro-
jections onto HD cell areas, through which landmarks with an inconsistent
relationship to idiothetic information are made less salient, significantly hin-
dering their ability to gain cue control. Our results provide a mechanism for
reliability-weighted cue averaging that may pertain to other neural systems
in addition to the HD system.
1. IntroductionSingle-cell recordings in the limbic system of rats and primates reveal the pres-
ence of head direction (HD) cells, which respond to the animal’s HD in the
horizontal (azimuth or yaw) plane [1,2]. Individual HD cells have a Gaussian
firing profile of approximately 908 width, centred on a preferred HD to
which the cell maximally responds. Outside this Gaussian tuning curve, the
cell firing is at or near zero [3,4].
HD cell firing is influenced by both descending visual input and ascending ves-
tibular input. Vestibular information appears to be essential for the HD signal, as
damage to, or inactivation of, vestibular end organs eliminates directional firing
in the anterior dorsal thalamic nucleus and postsubiculum [5]. HD cells continue
to fire in the absence of visual input [6] and update this firing using vestibular
input to reflect the true HD of the animal, a process known as path integration
[7]. However, constantly changing HD representations based on internal self-
motion cues accumulate error [6,8,9], suggesting the need for a resetting process
to help the system realign itself with the true HD of the animal. This resetting
signal is likely to come from strong visual input indicating prominent landmarks
by which the system may reorient [9].
The relative influence of visual and vestibular cues on HD cell responses is
unclear. A number of studies have shown that, when these cues are in conflict,
HD cell responses are primarily, although not completely, determined by
vision. Cell preferred directions drift in the absence of visual cues and are reset
w2
network ofvisual cells
w1 = non-modifiable synapses
w2 = Hebb-modifiable synapses
network ofhead directioncells
w1
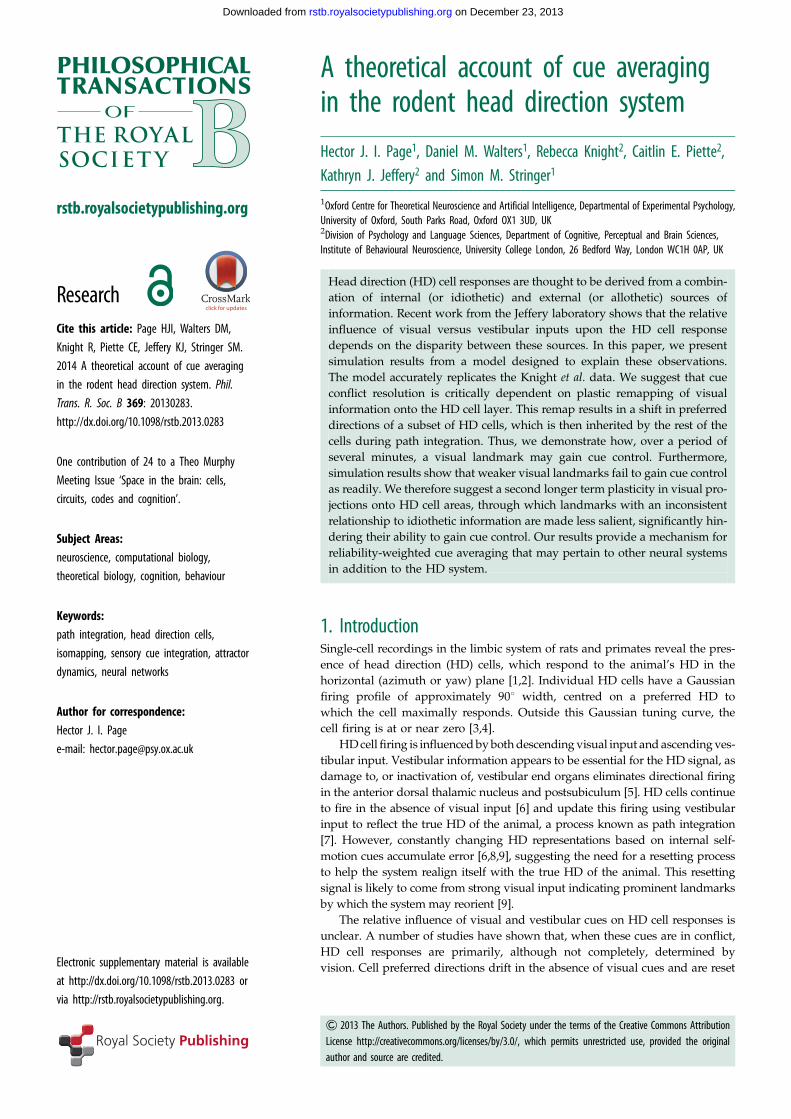
Figure 1. Network architecture, demonstrating connectivity both from thevisual layer into the HD layer (w2 synapses) and within the HD layer itself(w1 synapses).
visualring
HDring
w2 connections
w1 connections
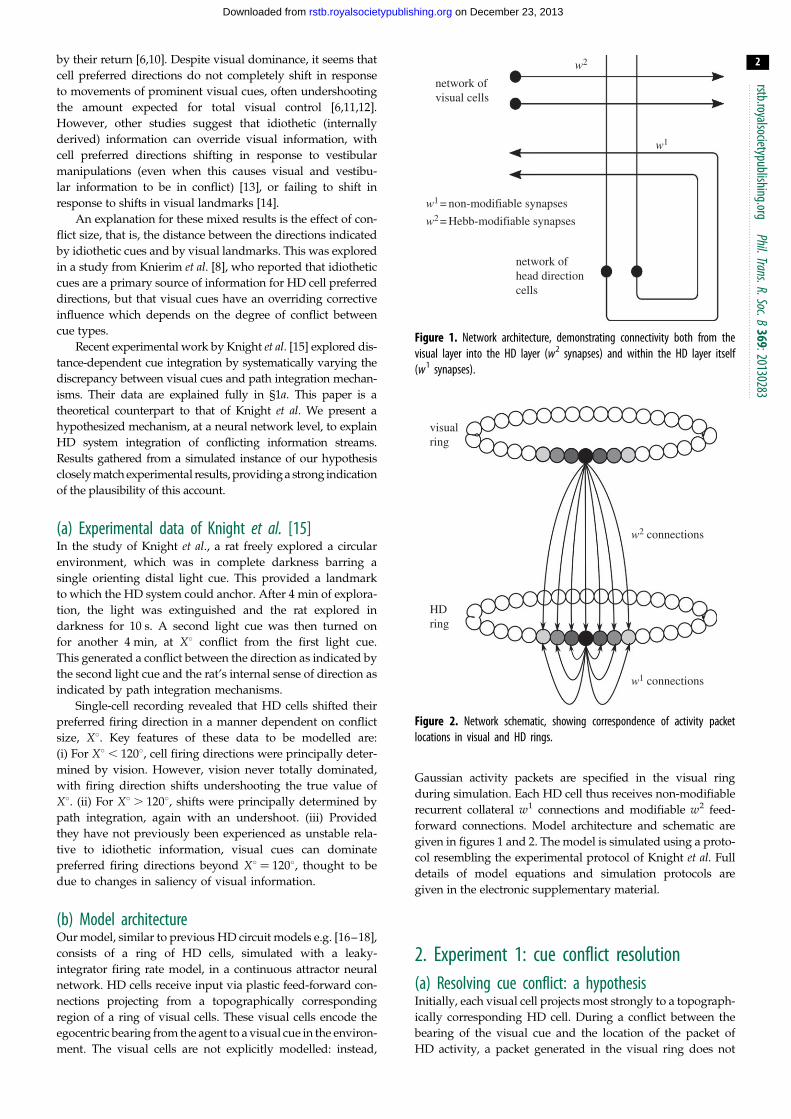
Figure 2. Network schematic, showing correspondence of activity packetlocations in visual and HD rings.
rstb.royalsocietypublishing.orgPhil.Trans.R.Soc.B
369:20130283
2
on December 23, 2013rstb.royalsocietypublishing.orgDownloaded from
by their return [6,10]. Despite visual dominance, it seems that
cell preferred directions do not completely shift in response
to movements of prominent visual cues, often undershooting
the amount expected for total visual control [6,11,12].
However, other studies suggest that idiothetic (internally
derived) information can override visual information, with
cell preferred directions shifting in response to vestibular
manipulations (even when this causes visual and vestibu-
lar information to be in conflict) [13], or failing to shift in
response to shifts in visual landmarks [14].
An explanation for these mixed results is the effect of con-
flict size, that is, the distance between the directions indicated
by idiothetic cues and by visual landmarks. This was explored
in a study from Knierim et al. [8], who reported that idiothetic
cues are a primary source of information for HD cell preferred
directions, but that visual cues have an overriding corrective
influence which depends on the degree of conflict between
cue types.
Recent experimental work by Knight et al. [15] explored dis-
tance-dependent cue integration by systematically varying the
discrepancy between visual cues and path integration mechan-
isms. Their data are explained fully in §1a. This paper is a
theoretical counterpart to that of Knight et al. We present a
hypothesized mechanism, at a neural network level, to explain
HD system integration of conflicting information streams.
Results gathered from a simulated instance of our hypothesis
closely match experimental results, providing a strong indication
of the plausibility of this account.
(a) Experimental data of Knight et al. [15]In the study of Knight et al., a rat freely explored a circular
environment, which was in complete darkness barring a
single orienting distal light cue. This provided a landmark
to which the HD system could anchor. After 4 min of explora-
tion, the light was extinguished and the rat explored in
darkness for 10 s. A second light cue was then turned on
for another 4 min, at X8 conflict from the first light cue.
This generated a conflict between the direction as indicated by
the second light cue and the rat’s internal sense of direction as
indicated by path integration mechanisms.
Single-cell recording revealed that HD cells shifted their
preferred firing direction in a manner dependent on conflict
size, X8. Key features of these data to be modelled are:
(i) For X8 , 1208, cell firing directions were principally deter-
mined by vision. However, vision never totally dominated,
with firing direction shifts undershooting the true value of
X8. (ii) For X8 . 1208, shifts were principally determined by
path integration, again with an undershoot. (iii) Provided
they have not previously been experienced as unstable rela-
tive to idiothetic information, visual cues can dominate
preferred firing directions beyond X8 ¼ 1208, thought to be
due to changes in saliency of visual information.
(b) Model architectureOur model, similar to previous HD circuit models e.g. [16–18],
consists of a ring of HD cells, simulated with a leaky-
integrator firing rate model, in a continuous attractor neural
network. HD cells receive input via plastic feed-forward con-
nections projecting from a topographically corresponding
region of a ring of visual cells. These visual cells encode the
egocentric bearing from the agent to a visual cue in the environ-
ment. The visual cells are not explicitly modelled: instead,
Gaussian activity packets are specified in the visual ring
during simulation. Each HD cell thus receives non-modifiable
recurrent collateral w1 connections and modifiable w2 feed-
forward connections. Model architecture and schematic are
given in figures 1 and 2. The model is simulated using a proto-
col resembling the experimental protocol of Knight et al. Full
details of model equations and simulation protocols are
given in the electronic supplementary material.
2. Experiment 1: cue conflict resolution(a) Resolving cue conflict: a hypothesisInitially, each visual cell projects most strongly to a topograph-
ically corresponding HD cell. During a conflict between the
bearing of the visual cue and the location of the packet of
HD activity, a packet generated in the visual ring does not
visual ring
(a)
(b)
HD ring
visual ring
HD ring
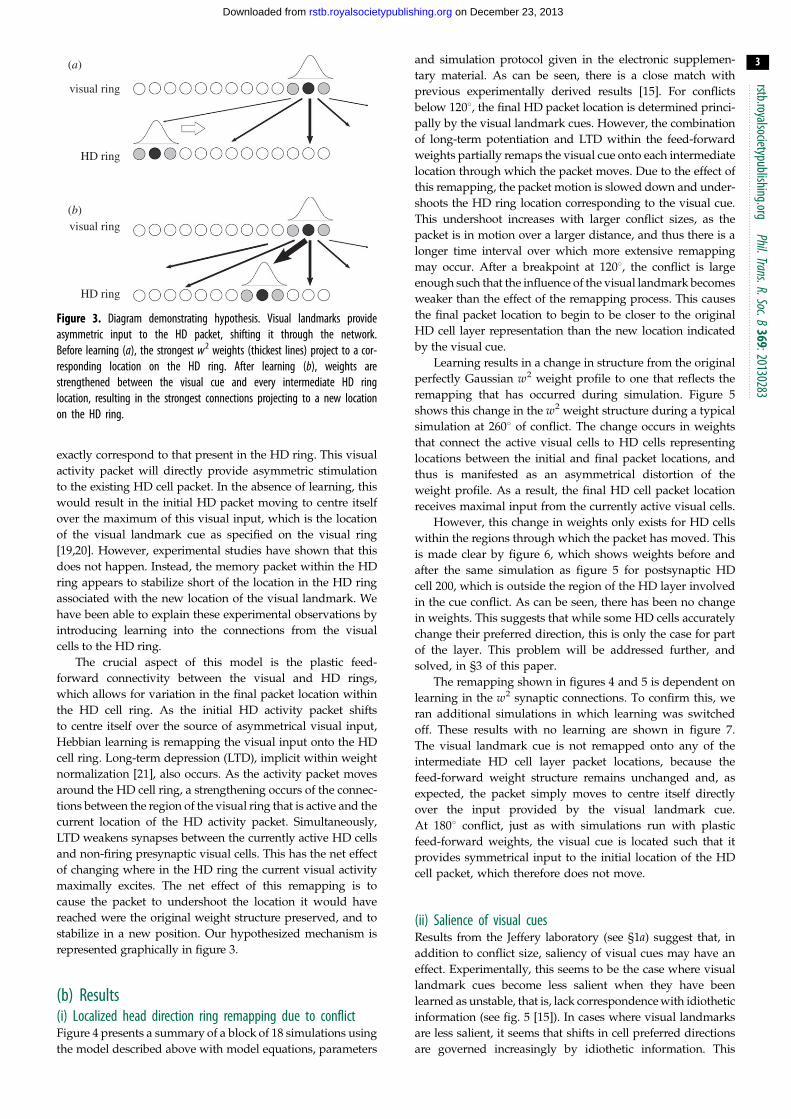
Figure 3. Diagram demonstrating hypothesis. Visual landmarks provideasymmetric input to the HD packet, shifting it through the network.Before learning (a), the strongest w2 weights (thickest lines) project to a cor-responding location on the HD ring. After learning (b), weights arestrengthened between the visual cue and every intermediate HD ringlocation, resulting in the strongest connections projecting to a new locationon the HD ring.
rstb.royalsocietypublishing.orgPhil.Trans.R.Soc.B
369:20130283
3
on December 23, 2013rstb.royalsocietypublishing.orgDownloaded from
exactly correspond to that present in the HD ring. This visual
activity packet will directly provide asymmetric stimulation
to the existing HD cell packet. In the absence of learning, this
would result in the initial HD packet moving to centre itself
over the maximum of this visual input, which is the location
of the visual landmark cue as specified on the visual ring
[19,20]. However, experimental studies have shown that this
does not happen. Instead, the memory packet within the HD
ring appears to stabilize short of the location in the HD ring
associated with the new location of the visual landmark. We
have been able to explain these experimental observations by
introducing learning into the connections from the visual
cells to the HD ring.
The crucial aspect of this model is the plastic feed-
forward connectivity between the visual and HD rings,
which allows for variation in the final packet location within
the HD cell ring. As the initial HD activity packet shifts
to centre itself over the source of asymmetrical visual input,
Hebbian learning is remapping the visual input onto the HD
cell ring. Long-term depression (LTD), implicit within weight
normalization [21], also occurs. As the activity packet moves
around the HD cell ring, a strengthening occurs of the connec-
tions between the region of the visual ring that is active and the
current location of the HD activity packet. Simultaneously,
LTD weakens synapses between the currently active HD cells
and non-firing presynaptic visual cells. This has the net effect
of changing where in the HD ring the current visual activity
maximally excites. The net effect of this remapping is to
cause the packet to undershoot the location it would have
reached were the original weight structure preserved, and to
stabilize in a new position. Our hypothesized mechanism is
represented graphically in figure 3.
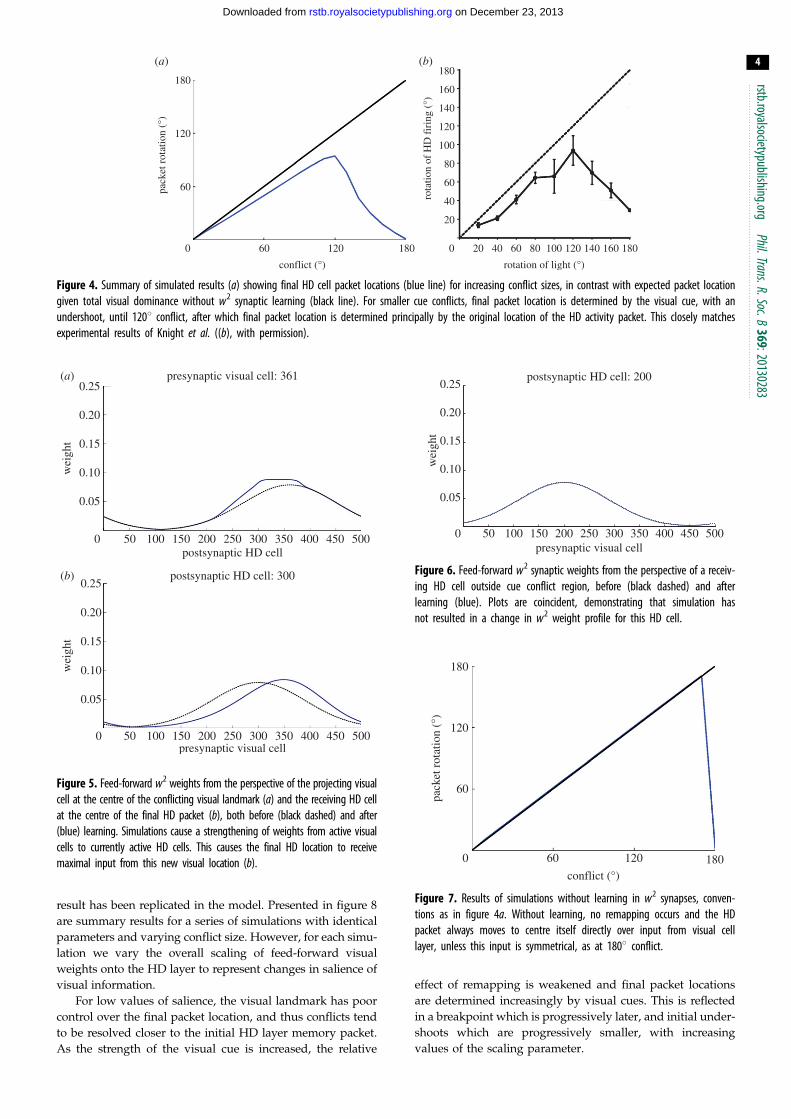
(b) Results(i) Localized head direction ring remapping due to conflictFigure 4 presents a summary of a block of 18 simulations using
the model described above with model equations, parameters
and simulation protocol given in the electronic supplemen-
tary material. As can be seen, there is a close match with
previous experimentally derived results [15]. For conflicts
below 1208, the final HD packet location is determined princi-
pally by the visual landmark cues. However, the combination
of long-term potentiation and LTD within the feed-forward
weights partially remaps the visual cue onto each intermediate
location through which the packet moves. Due to the effect of
this remapping, the packet motion is slowed down and under-
shoots the HD ring location corresponding to the visual cue.
This undershoot increases with larger conflict sizes, as the
packet is in motion over a larger distance, and thus there is a
longer time interval over which more extensive remapping
may occur. After a breakpoint at 1208, the conflict is large
enough such that the influence of the visual landmark becomes
weaker than the effect of the remapping process. This causes
the final packet location to begin to be closer to the original
HD cell layer representation than the new location indicated
by the visual cue.
Learning results in a change in structure from the original
perfectly Gaussian w2 weight profile to one that reflects the
remapping that has occurred during simulation. Figure 5
shows this change in the w2 weight structure during a typical
simulation at 2608 of conflict. The change occurs in weights
that connect the active visual cells to HD cells representing
locations between the initial and final packet locations, and
thus is manifested as an asymmetrical distortion of the
weight profile. As a result, the final HD cell packet location
receives maximal input from the currently active visual cells.
However, this change in weights only exists for HD cells
within the regions through which the packet has moved. This
is made clear by figure 6, which shows weights before and
after the same simulation as figure 5 for postsynaptic HD
cell 200, which is outside the region of the HD layer involved
in the cue conflict. As can be seen, there has been no change
in weights. This suggests that while some HD cells accurately
change their preferred direction, this is only the case for part
of the layer. This problem will be addressed further, and
solved, in §3 of this paper.
The remapping shown in figures 4 and 5 is dependent on
learning in the w2 synaptic connections. To confirm this, we
ran additional simulations in which learning was switched
off. These results with no learning are shown in figure 7.
The visual landmark cue is not remapped onto any of the
intermediate HD cell layer packet locations, because the
feed-forward weight structure remains unchanged and, as
expected, the packet simply moves to centre itself directly
over the input provided by the visual landmark cue.
At 1808 conflict, just as with simulations run with plastic
feed-forward weights, the visual cue is located such that it
provides symmetrical input to the initial location of the HD
cell packet, which therefore does not move.
(ii) Salience of visual cuesResults from the Jeffery laboratory (see §1a) suggest that, in
addition to conflict size, saliency of visual cues may have an
effect. Experimentally, this seems to be the case where visual
landmark cues become less salient when they have been
learned as unstable, that is, lack correspondence with idiothetic
information (see fig. 5 [15]). In cases where visual landmarks
are less salient, it seems that shifts in cell preferred directions
are governed increasingly by idiothetic information. This
180
(a) (b)180
160
140
120
100
80
60
40
20
0 20 40 60 80
rotation of light (°)
100 120 140 160 180180
120
120
60
60
conflict (°)
pack
et r
otat
ion
(°)
rota
tion
of H
D f
irin
g (°
)
0
Figure 4. Summary of simulated results (a) showing final HD cell packet locations (blue line) for increasing conflict sizes, in contrast with expected packet locationgiven total visual dominance without w2 synaptic learning (black line). For smaller cue conflicts, final packet location is determined by the visual cue, with anundershoot, until 1208 conflict, after which final packet location is determined principally by the original location of the HD activity packet. This closely matchesexperimental results of Knight et al. ((b), with permission).
0.25(a)
(b)
0.20
0.15
wei
ght
wei
ght
0.10
0.05
0 50 100 150 200 250postsynaptic HD cell
postsynaptic HD cell: 300
300 350 400 450 500
0 50 100 150 200 250presynaptic visual cell
presynaptic visual cell: 361
300 350 400 450 500
0.25
0.20
0.15
0.10
0.05
Figure 5. Feed-forward w2 weights from the perspective of the projecting visualcell at the centre of the conflicting visual landmark (a) and the receiving HD cellat the centre of the final HD packet (b), both before (black dashed) and after(blue) learning. Simulations cause a strengthening of weights from active visualcells to currently active HD cells. This causes the final HD location to receivemaximal input from this new visual location (b).
0 50 100 150 200 250 300 350 400 450 500
0.05
0.10
0.15
0.20
0.25
presynaptic visual cell
wei
ght
postsynaptic HD cell: 200
Figure 6. Feed-forward w2 synaptic weights from the perspective of a receiv-ing HD cell outside cue conflict region, before (black dashed) and afterlearning (blue). Plots are coincident, demonstrating that simulation hasnot resulted in a change in w2 weight profile for this HD cell.
conflict (°)
pack
et r
otat
ion
(°)
180
180
120
120
60
600
Figure 7. Results of simulations without learning in w2 synapses, conven-tions as in figure 4a. Without learning, no remapping occurs and the HDpacket always moves to centre itself directly over input from visual celllayer, unless this input is symmetrical, as at 1808 conflict.
rstb.royalsocietypublishing.orgPhil.Trans.R.Soc.B
369:20130283
4
on December 23, 2013rstb.royalsocietypublishing.orgDownloaded from
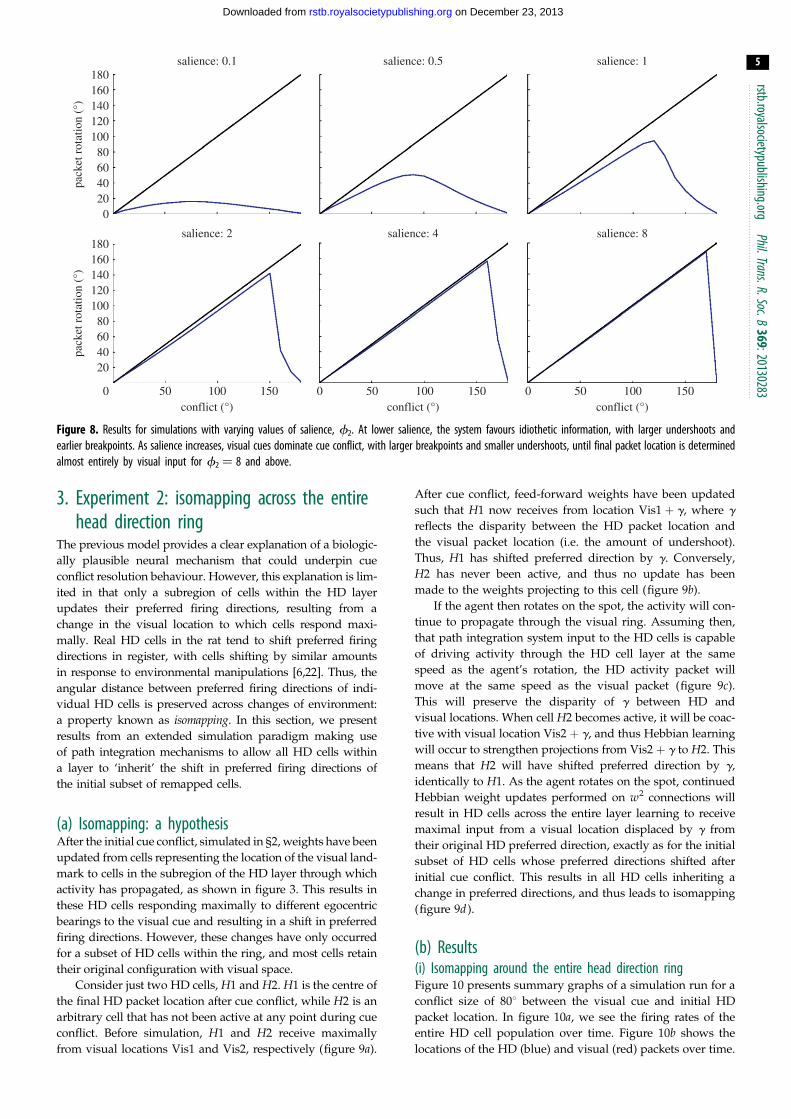
result has been replicated in the model. Presented in figure 8
are summary results for a series of simulations with identical
parameters and varying conflict size. However, for each simu-
lation we vary the overall scaling of feed-forward visual
weights onto the HD layer to represent changes in salience of
visual information.
For low values of salience, the visual landmark has poor
control over the final packet location, and thus conflicts tend
to be resolved closer to the initial HD layer memory packet.
As the strength of the visual cue is increased, the relative
effect of remapping is weakened and final packet locations
are determined increasingly by visual cues. This is reflected
in a breakpoint which is progressively later, and initial under-
shoots which are progressively smaller, with increasing
values of the scaling parameter.
salience: 2
0
20406080
pack
et r
otat
ion
(°)
100120140160180
020406080
pack
et r
otat
ion
(°)
100120140160180
50 100conflict (°)
150 0 50 100conflict (°)
150 0 50 100conflict (°)
150
salience: 4 salience: 8
salience: 0.1 salience: 0.5 salience: 1
Figure 8. Results for simulations with varying values of salience, f2. At lower salience, the system favours idiothetic information, with larger undershoots andearlier breakpoints. As salience increases, visual cues dominate cue conflict, with larger breakpoints and smaller undershoots, until final packet location is determinedalmost entirely by visual input for f2 ¼ 8 and above.
rstb.royalsocietypublishing.orgPhil.Trans.R.Soc.B
369:20130283
5
on December 23, 2013rstb.royalsocietypublishing.orgDownloaded from
3. Experiment 2: isomapping across the entirehead direction ring
The previous model provides a clear explanation of a biologic-
ally plausible neural mechanism that could underpin cue
conflict resolution behaviour. However, this explanation is lim-
ited in that only a subregion of cells within the HD layer
updates their preferred firing directions, resulting from a
change in the visual location to which cells respond maxi-
mally. Real HD cells in the rat tend to shift preferred firing
directions in register, with cells shifting by similar amounts
in response to environmental manipulations [6,22]. Thus, the
angular distance between preferred firing directions of indi-
vidual HD cells is preserved across changes of environment:
a property known as isomapping. In this section, we present
results from an extended simulation paradigm making use
of path integration mechanisms to allow all HD cells within
a layer to ‘inherit’ the shift in preferred firing directions of
the initial subset of remapped cells.
(a) Isomapping: a hypothesisAfter the initial cue conflict, simulated in §2, weights have been
updated from cells representing the location of the visual land-
mark to cells in the subregion of the HD layer through which
activity has propagated, as shown in figure 3. This results in
these HD cells responding maximally to different egocentric
bearings to the visual cue and resulting in a shift in preferred
firing directions. However, these changes have only occurred
for a subset of HD cells within the ring, and most cells retain
their original configuration with visual space.
Consider just two HD cells, H1 and H2. H1 is the centre of
the final HD packet location after cue conflict, while H2 is an
arbitrary cell that has not been active at any point during cue
conflict. Before simulation, H1 and H2 receive maximally
from visual locations Vis1 and Vis2, respectively (figure 9a).
After cue conflict, feed-forward weights have been updated
such that H1 now receives from location Vis1 þ g, where g
reflects the disparity between the HD packet location and
the visual packet location (i.e. the amount of undershoot).
Thus, H1 has shifted preferred direction by g. Conversely,
H2 has never been active, and thus no update has been
made to the weights projecting to this cell (figure 9b).
If the agent then rotates on the spot, the activity will con-
tinue to propagate through the visual ring. Assuming then,
that path integration system input to the HD cells is capable
of driving activity through the HD cell layer at the same
speed as the agent’s rotation, the HD activity packet will
move at the same speed as the visual packet (figure 9c).
This will preserve the disparity of g between HD and
visual locations. When cell H2 becomes active, it will be coac-
tive with visual location Vis2 þ g, and thus Hebbian learning
will occur to strengthen projections from Vis2 þ g to H2. This
means that H2 will have shifted preferred direction by g,
identically to H1. As the agent rotates on the spot, continued
Hebbian weight updates performed on w2 connections will
result in HD cells across the entire layer learning to receive
maximal input from a visual location displaced by g from
their original HD preferred direction, exactly as for the initial
subset of HD cells whose preferred directions shifted after
initial cue conflict. This results in all HD cells inheriting a
change in preferred directions, and thus leads to isomapping
(figure 9d ).
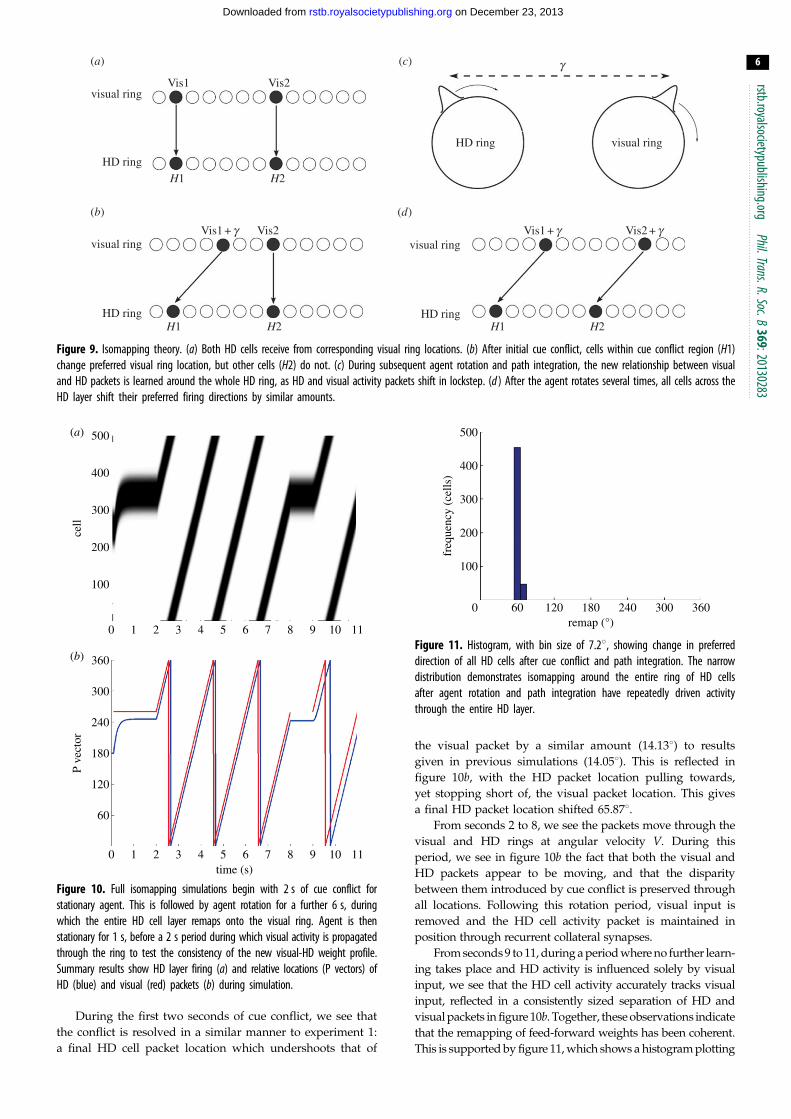
(b) Results(i) Isomapping around the entire head direction ringFigure 10 presents summary graphs of a simulation run for a
conflict size of 808 between the visual cue and initial HD
packet location. In figure 10a, we see the firing rates of the
entire HD cell population over time. Figure 10b shows the
locations of the HD (blue) and visual (red) packets over time.
HD ring
Vis1 Vis2
Vis1 + g Vis2
H1 H2
H1 H2 H1 H2
Vis1 + g Vis2 + g
visual ring
HD ring
visual ring
HD ring
visual ring
HD ring
g(a) (c)
(b) (d)
visual ring
Figure 9. Isomapping theory. (a) Both HD cells receive from corresponding visual ring locations. (b) After initial cue conflict, cells within cue conflict region (H1)change preferred visual ring location, but other cells (H2) do not. (c) During subsequent agent rotation and path integration, the new relationship between visualand HD packets is learned around the whole HD ring, as HD and visual activity packets shift in lockstep. (d ) After the agent rotates several times, all cells across theHD layer shift their preferred firing directions by similar amounts.
500
400
300
200
100
360
300
240
180
120
60
cell
P ve
ctor
0 1 2 3 4 5time (s)
6 7 8 9 10 11
0 1 2 3 4 5 6 7 8 9 10 11
(a)
(b)
Figure 10. Full isomapping simulations begin with 2 s of cue conflict forstationary agent. This is followed by agent rotation for a further 6 s, duringwhich the entire HD cell layer remaps onto the visual ring. Agent is thenstationary for 1 s, before a 2 s period during which visual activity is propagatedthrough the ring to test the consistency of the new visual-HD weight profile.Summary results show HD layer firing (a) and relative locations (P vectors) ofHD (blue) and visual (red) packets (b) during simulation.
500
400
300
200
100
0 60 120remap (°)
180 240 300 360
freq
uenc
y (c
ells
)
Figure 11. Histogram, with bin size of 7.28, showing change in preferreddirection of all HD cells after cue conflict and path integration. The narrowdistribution demonstrates isomapping around the entire ring of HD cellsafter agent rotation and path integration have repeatedly driven activitythrough the entire HD layer.
rstb.royalsocietypublishing.orgPhil.Trans.R.Soc.B
369:20130283
6
on December 23, 2013rstb.royalsocietypublishing.orgDownloaded from
During the first two seconds of cue conflict, we see that
the conflict is resolved in a similar manner to experiment 1:
a final HD cell packet location which undershoots that of
the visual packet by a similar amount (14.138) to results
given in previous simulations (14.058). This is reflected in
figure 10b, with the HD packet location pulling towards,
yet stopping short of, the visual packet location. This gives
a final HD packet location shifted 65.878.From seconds 2 to 8, we see the packets move through the
visual and HD rings at angular velocity V. During this
period, we see in figure 10b the fact that both the visual and
HD packets appear to be moving, and that the disparity
between them introduced by cue conflict is preserved through
all locations. Following this rotation period, visual input is
removed and the HD cell activity packet is maintained in
position through recurrent collateral synapses.
From seconds 9 to 11, during a period where no further learn-
ing takes place and HD activity is influenced solely by visual
input, we see that the HD cell activity accurately tracks visual
input, reflected in a consistently sized separation of HD and
visual packets in figure 10b. Together, these observations indicate
that the remapping of feed-forward weights has been coherent.
This is supported by figure 11, which shows a histogram plotting
0 50 100 150 200 250 300 350 400 450 500
0.05
0.10
0.15
0.20
0.25
presynaptic visual cell
wei
ght
postsynaptic HD cell: 350
final weightsintermediate weightsinitial weights
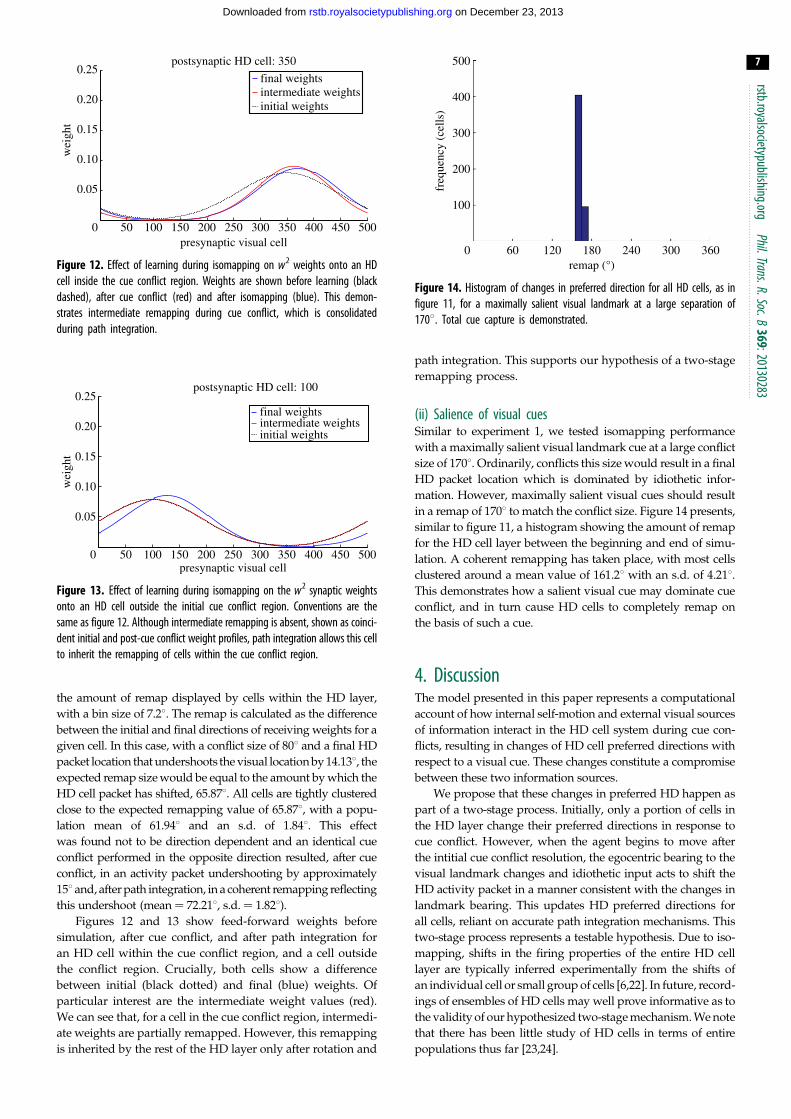
Figure 12. Effect of learning during isomapping on w2 weights onto an HDcell inside the cue conflict region. Weights are shown before learning (blackdashed), after cue conflict (red) and after isomapping (blue). This demon-strates intermediate remapping during cue conflict, which is consolidatedduring path integration.
0 50 100 150 200 250 300 350 400 450 500
0.05
0.10
0.15
0.20
0.25
presynaptic visual cell
wei
ght
postsynaptic HD cell: 100
final weightsintermediate weightsinitial weights
Figure 13. Effect of learning during isomapping on the w2 synaptic weightsonto an HD cell outside the initial cue conflict region. Conventions are thesame as figure 12. Although intermediate remapping is absent, shown as coinci-dent initial and post-cue conflict weight profiles, path integration allows this cellto inherit the remapping of cells within the cue conflict region.
500
400
300
200
100
0 60 120remap (°)
180 240 300 360
freq
uenc
y (c
ells
)
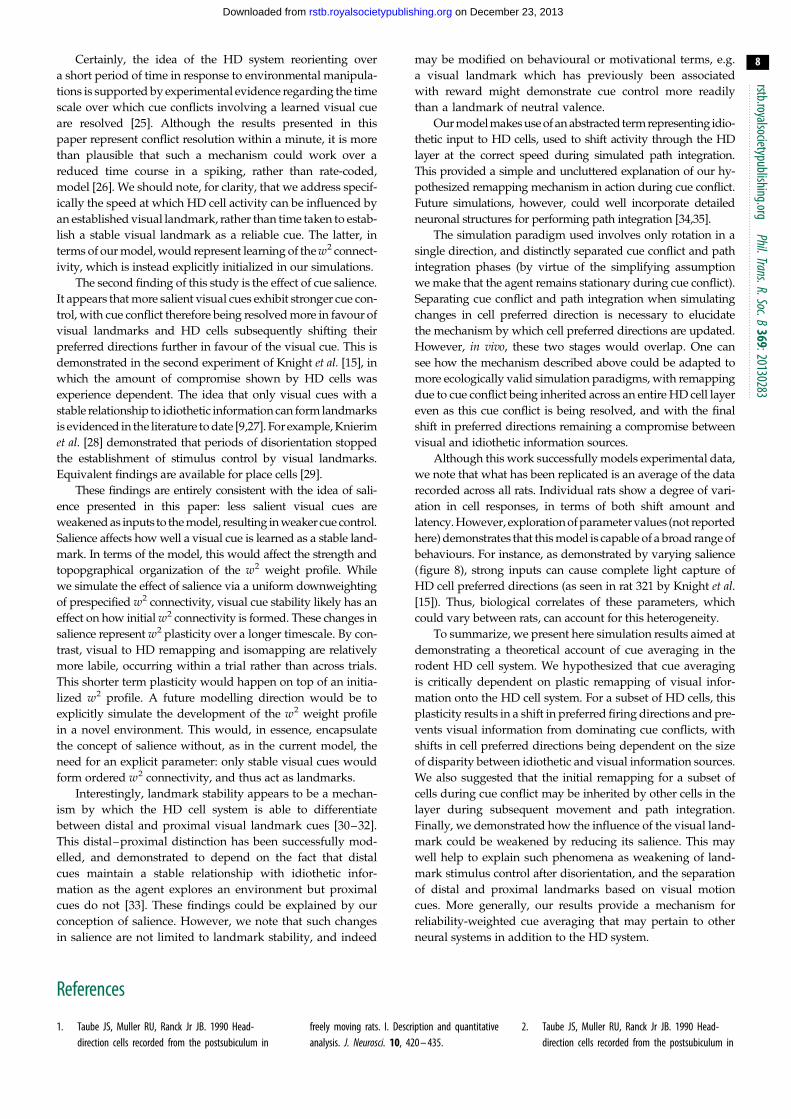
Figure 14. Histogram of changes in preferred direction for all HD cells, as infigure 11, for a maximally salient visual landmark at a large separation of1708. Total cue capture is demonstrated.
rstb.royalsocietypublishing.orgPhil.Trans.R.Soc.B
369:20130283
7
on December 23, 2013rstb.royalsocietypublishing.orgDownloaded from
the amount of remap displayed by cells within the HD layer,
with a bin size of 7.28. The remap is calculated as the difference
between the initial and final directions of receiving weights for a
given cell. In this case, with a conflict size of 808 and a final HD
packet location that undershoots the visual location by 14.138, the
expected remap size would be equal to the amount by which the
HD cell packet has shifted, 65.878. All cells are tightly clustered
close to the expected remapping value of 65.878, with a popu-
lation mean of 61.948 and an s.d. of 1.848. This effect
was found not to be direction dependent and an identical cue
conflict performed in the opposite direction resulted, after cue
conflict, in an activity packet undershooting by approximately
158 and, after path integration, in a coherent remapping reflecting
this undershoot (mean¼ 72.218, s.d. ¼ 1.828).Figures 12 and 13 show feed-forward weights before
simulation, after cue conflict, and after path integration for
an HD cell within the cue conflict region, and a cell outside
the conflict region. Crucially, both cells show a difference
between initial (black dotted) and final (blue) weights. Of
particular interest are the intermediate weight values (red).
We can see that, for a cell in the cue conflict region, intermedi-
ate weights are partially remapped. However, this remapping
is inherited by the rest of the HD layer only after rotation and
path integration. This supports our hypothesis of a two-stage
remapping process.
(ii) Salience of visual cuesSimilar to experiment 1, we tested isomapping performance
with a maximally salient visual landmark cue at a large conflict
size of 1708. Ordinarily, conflicts this size would result in a final
HD packet location which is dominated by idiothetic infor-
mation. However, maximally salient visual cues should result
in a remap of 1708 to match the conflict size. Figure 14 presents,
similar to figure 11, a histogram showing the amount of remap
for the HD cell layer between the beginning and end of simu-
lation. A coherent remapping has taken place, with most cells
clustered around a mean value of 161.28 with an s.d. of 4.218.This demonstrates how a salient visual cue may dominate cue
conflict, and in turn cause HD cells to completely remap on
the basis of such a cue.
4. DiscussionThe model presented in this paper represents a computational
account of how internal self-motion and external visual sources
of information interact in the HD cell system during cue con-
flicts, resulting in changes of HD cell preferred directions with
respect to a visual cue. These changes constitute a compromise
between these two information sources.
We propose that these changes in preferred HD happen as
part of a two-stage process. Initially, only a portion of cells in
the HD layer change their preferred directions in response to
cue conflict. However, when the agent begins to move after
the intitial cue conflict resolution, the egocentric bearing to the
visual landmark changes and idiothetic input acts to shift the
HD activity packet in a manner consistent with the changes in
landmark bearing. This updates HD preferred directions for
all cells, reliant on accurate path integration mechanisms. This
two-stage process represents a testable hypothesis. Due to iso-
mapping, shifts in the firing properties of the entire HD cell
layer are typically inferred experimentally from the shifts of
an individual cell or small group of cells [6,22]. In future, record-
ings of ensembles of HD cells may well prove informative as to
the validity of our hypothesized two-stage mechanism. We note
that there has been little study of HD cells in terms of entire
populations thus far [23,24].
rstb.royalsocietypublishing.orgPhil.Trans.R.Soc.B
369:20130283
8
on December 23, 2013rstb.royalsocietypublishing.orgDownloaded from
Certainly, the idea of the HD system reorienting over
a short period of time in response to environmental manipula-
tions is supported by experimental evidence regarding the time
scale over which cue conflicts involving a learned visual cue
are resolved [25]. Although the results presented in this
paper represent conflict resolution within a minute, it is more
than plausible that such a mechanism could work over a
reduced time course in a spiking, rather than rate-coded,
model [26]. We should note, for clarity, that we address specif-
ically the speed at which HD cell activity can be influenced by
an established visual landmark, rather than time taken to estab-
lish a stable visual landmark as a reliable cue. The latter, in
terms of our model, would represent learning of the w2 connect-
ivity, which is instead explicitly initialized in our simulations.
The second finding of this study is the effect of cue salience.
It appears that more salient visual cues exhibit stronger cue con-
trol, with cue conflict therefore being resolved more in favour of
visual landmarks and HD cells subsequently shifting their
preferred directions further in favour of the visual cue. This is
demonstrated in the second experiment of Knight et al. [15], in
which the amount of compromise shown by HD cells was
experience dependent. The idea that only visual cues with a
stable relationship to idiothetic information can form landmarks
is evidenced in the literature to date [9,27]. For example, Knierim
et al. [28] demonstrated that periods of disorientation stopped
the establishment of stimulus control by visual landmarks.
Equivalent findings are available for place cells [29].
These findings are entirely consistent with the idea of sali-
ence presented in this paper: less salient visual cues are
weakened as inputs to the model, resulting in weaker cue control.
Salience affects how well a visual cue is learned as a stable land-
mark. In terms of the model, this would affect the strength and
topopgraphical organization of the w2 weight profile. While
we simulate the effect of salience via a uniform downweighting
of prespecified w2 connectivity, visual cue stability likely has an
effect on how initial w2 connectivity is formed. These changes in
salience represent w2 plasticity over a longer timescale. By con-
trast, visual to HD remapping and isomapping are relatively
more labile, occurring within a trial rather than across trials.
This shorter term plasticity would happen on top of an initia-
lized w2 profile. A future modelling direction would be to
explicitly simulate the development of the w2 weight profile
in a novel environment. This would, in essence, encapsulate
the concept of salience without, as in the current model, the
need for an explicit parameter: only stable visual cues would
form ordered w2 connectivity, and thus act as landmarks.
Interestingly, landmark stability appears to be a mechan-
ism by which the HD cell system is able to differentiate
between distal and proximal visual landmark cues [30–32].
This distal–proximal distinction has been successfully mod-
elled, and demonstrated to depend on the fact that distal
cues maintain a stable relationship with idiothetic infor-
mation as the agent explores an environment but proximal
cues do not [33]. These findings could be explained by our
conception of salience. However, we note that such changes
in salience are not limited to landmark stability, and indeed
may be modified on behavioural or motivational terms, e.g.
a visual landmark which has previously been associated
with reward might demonstrate cue control more readily
than a landmark of neutral valence.
Our model makes use of an abstracted term representing idio-
thetic input to HD cells, used to shift activity through the HD
layer at the correct speed during simulated path integration.
This provided a simple and uncluttered explanation of our hy-
pothesized remapping mechanism in action during cue conflict.
Future simulations, however, could well incorporate detailed
neuronal structures for performing path integration [34,35].
The simulation paradigm used involves only rotation in a
single direction, and distinctly separated cue conflict and path
integration phases (by virtue of the simplifying assumption
we make that the agent remains stationary during cue conflict).
Separating cue conflict and path integration when simulating
changes in cell preferred direction is necessary to elucidate
the mechanism by which cell preferred directions are updated.
However, in vivo, these two stages would overlap. One can
see how the mechanism described above could be adapted to
more ecologically valid simulation paradigms, with remapping
due to cue conflict being inherited across an entire HD cell layer
even as this cue conflict is being resolved, and with the final
shift in preferred directions remaining a compromise between
visual and idiothetic information sources.
Although this work successfully models experimental data,
we note that what has been replicated is an average of the data
recorded across all rats. Individual rats show a degree of vari-
ation in cell responses, in terms of both shift amount and
latency. However, exploration of parameter values (not reported
here) demonstrates that this model is capable of a broad range of
behaviours. For instance, as demonstrated by varying salience
(figure 8), strong inputs can cause complete light capture of
HD cell preferred directions (as seen in rat 321 by Knight et al.[15]). Thus, biological correlates of these parameters, which
could vary between rats, can account for this heterogeneity.
To summarize, we present here simulation results aimed at
demonstrating a theoretical account of cue averaging in the
rodent HD cell system. We hypothesized that cue averaging
is critically dependent on plastic remapping of visual infor-
mation onto the HD cell system. For a subset of HD cells, this
plasticity results in a shift in preferred firing directions and pre-
vents visual information from dominating cue conflicts, with
shifts in cell preferred directions being dependent on the size
of disparity between idiothetic and visual information sources.
We also suggested that the initial remapping for a subset of
cells during cue conflict may be inherited by other cells in the
layer during subsequent movement and path integration.
Finally, we demonstrated how the influence of the visual land-
mark could be weakened by reducing its salience. This may
well help to explain such phenomena as weakening of land-
mark stimulus control after disorientation, and the separation
of distal and proximal landmarks based on visual motion
cues. More generally, our results provide a mechanism for
reliability-weighted cue averaging that may pertain to other
neural systems in addition to the HD system.
References
1. Taube JS, Muller RU, Ranck Jr JB. 1990 Head-direction cells recorded from the postsubiculum in
freely moving rats. I. Description and quantitativeanalysis. J. Neurosci. 10, 420 – 435.
2. Taube JS, Muller RU, Ranck Jr JB. 1990 Head-direction cells recorded from the postsubiculum in
rstb.royalsocietypublishing.orgPhil.Trans.R.Soc.B
369:20130283
9
on December 23, 2013rstb.royalsocietypublishing.orgDownloaded from
freely moving rats. II. Effects of environmentalmanipulations. J. Neurosci. 10, 436 – 447.
3. Sharp PE. 2005 Regional distribution andvariation in the firing properties of headdirection cells. In Head direction cells and theneural mechanisms of spatial orientation(eds SI Wiener, JS Taube), pp. 3 – 15. Cambridge,MA: MIT Press.
4. Taube JS. 2007 The head direction signal: originsand sensory-motor integration. Annu. Rev. Neurosci.30, 181 – 207. (doi:10.1146/annurev.neuro.29.051605.112854)
5. Stackman RW, Taube JS. 1997 Firing properties ofhead direction cells in the rat anterior thalamicnucelus: dependence on vestibular input.J. Neurosci. 17, 4349 – 4358.
6. Goodridge JP, Taube JS. 1995 Preferential useof the landmark navigational system byhead direction cells in rats. Behav. Neurosci.109, 49 – 61. (doi:10.1037/0735-7044.109.1.49)
7. Mittelstaedt ML, Mittelstaedt H. 1980 Homing bypath integration in a mammal. Naturwissenschaften67, 566 – 567. (doi:10.1007/BF00450672)
8. Knierim JJ, Kudrimoti HS, McNaughton BL. 1998Interactions between idiothetic cues and externallandmarks in the control of place cells and headdirection cells. J. Neurophysiol. 80, 425 – 446.
9. Goodridge JP, Dudchenko PA, Worboys KA, Golob EJ,Taube JS. 1998 Cue control and head direction cells.Behav. Neurosci. 112, 749 – 761. (doi:10.1037/0735-7044.112.4.749)
10. Mizumori SJ, Williams JD. 1993 Directionallyselective mnemonic properties of neurons in thelateral dorsal nucleus of the thalamus of rats.J. Neurosci. 13, 4015 – 4028.
11. Blair HT, Sharp PE. 1996 Visual and vestibularinfluences on head-direction cells in theanterior thalamus of the rat. Behav. Neurosci.120, 643 – 660. (doi:10.1037/0735-7044.110.4.643)
12. Zugaro MB, Tabuchi E, Wiener SI. 2000 Influence ofconflicting visual, inertial and substratal cues onhead direction cell activity. Exp. Brain Res. 133,198 – 208. (doi:10.1007/s002210000365)
13. Wiener SI. 1993 Spatial and behavioral correlates ofstriatal neurons in rats performing a self-initiatednavigation task. J. Neurosci. 13, 3802 – 3817.
14. Chen LL, Lin LH, Green EJ, Barnes CA, McNaughtonBL. 1994 Head-direction cells in the rat posteriorcortex. I. Anatomical distribution and behavioralmodulation. Exp. Brain Res. 101, 8 – 23. (doi:10.1007/BF00243212)
15. Knight R, Piette CE, Page H, Walters D, Marozzi E,Nardini M, Stringer S, Jeffery KJ. 2014 Weighted cueintegration in the rodent head direction system.Phil. Trans. R. Soc. B 369, 20120512. (doi:10.1098/rstb.2012.0512)
16. Skaggs WE, Knierim JJ, Kudrimoti HS, McNaughtonBL. 1995 A model of the neural basis of the rat’ssense of direction. In Advances in neural informationprocessing systems, vol. 7 (eds G Tesauro,DS Touretzky, TK Leen), pp. 173 – 180. Cambridge,MA: MIT Press.
17. Zhang K. 1996 Representation of spatial orientationby the intrinsic dynamics of the head-direction cellensemble: a theory. J. Neurosci. 16, 2112 – 2126.
18. Song P, Wang XJ. 2005 Angular path integration bymoving ‘hill of activity’: a spiking neuron modelwithout recurrent excitation of the head-directionsystem. J. Neurosci. 25, 1002 – 1014. (doi:10.1523/JNEUROSCI.4172-04.2005)
19. Amari S. 1977 Dynamics of pattern formation inlateral-inhibition type neural fields. Biol. Cybern. 27,77 – 87. (doi:10.1007/BF00337259)
20. Stringer SM, Trappenberg TP, Rolls ET, De Araujo IET.2002 Self-organizing continuous attractor networksand path integration: one dimensional models of headdirection cells. Netw. Comp. Neural Syst. 13, 217 – 242.
21. Royer S, Pare D. 2003 Conservation of total synapticweight through balanced synaptic depression andpotentiation. Nature 422, 518 – 522. (doi:10.1038/nature01530)
22. Taube JS, Goodridge JP, Golob EG, Dudchenko PA,Stackman RW. 1996 Processing the head directionsignal: a review and commentary. Brain Res. Bull.40, 477 – 486. (doi:10.1016/0361-9230(96)00145-1)
23. Stackman RW. 2011 Behavioural correlates ofneuronal activity recorded as single-units: promisesand pitfalls as illustrated by the rodent headdirection cell system. In Electrophysiologicalrecording techniques (eds RP Vertes, RW Stackman),pp. 127 – 167. New York, NY: Humana Press.
24. Johnson A, Seeland K, Redish AD. 2005Reconstruction of the postsubiculum head direction
signal from neural ensembles. Hippocampus 15,86 – 96. (doi:10.1002/hipo.20033)
25. Zugaro MB, Arleo A, Berthoz A, Wiener SI. 2003Rapid spatial reorientation and head direction cells.J. Neurosci. 23, 3478 – 3482.
26. Degris T, Brunel N, Sigaud O, Arleo A. 2004 Rapidresponse of head direction cells to reorienting visualcues: a computational model. Neurocomputing 58 –60, 675 – 682. (doi:10.1016/j.neucom.2004.01.113)
27. McNaughton BL, Knierim JJ, Wilson MA. 1995Vector encoding and the vestibular foundations ofspatial cognition: a neurophysiological andcomputational hypothesis. In The cognitiveneurosciences (ed. M Gazzaniga), pp. 585 – 595.Cambridge, MA: MIT Press.
28. Knierim JJ, Kudrimoti HS, McNaughton BL. 1995Place cells, head direction cells, and the learning oflandmark stability. J. Neurosci. 15, 1648 – 1659.
29. Jeffery KJ. 1997 Learning of landmark stability andinstability by hippocampal place cells.Neuropharmacology 37, 677 – 687. (doi:10.1016/S0028-3908(98)00053-7)
30. Cressant A, Muller RU, Poucet B. 1997 Failure ofcentrally placed objects to control the firing fields ofhippocampal place cells. J. Neurosci. 17, 2531 – 2542.
31. Zugaro MB, Berthoz A, Wiener SI. 2001 Background,but not foreground, spatial cues are taken asreferences for head direction responses by ratanterodorsal thalamus neurons. J. Neurosci. 21, RC154.
32. Yoganarasimha D, Yu X, Knierim JJ. 2006 Headdirection cells maintain internal coherence duringconflicting proximal and distal cue rotations:comparison with hippocampal place cells.J. Neurosci. 26, 622 – 631. (doi:10.1523/JNEUROSCI.3885-05.2006)
33. Walters DM. 2011 The computational neuroscience ofhead direction cells. PhD thesis, University of Oxford, UK.
34. Walters DM, Stringer SM. 2010 Path integration ofhead direction: updating a packet of neural activityat the correct speed using neuronal time constants.Biol. Cybern. 103, 21 – 41. (doi:10.1007/s00422-009-0355-0)
35. Walters DM, Stringer SM, Rolls ET. 2013 Pathintegration of head direction: updating a packet ofneural activity at the correct speed using axonalconduction delays. PLoS ONE 8, e58330. (doi:10.1371/journal.pone.0058330)