Central enhancement of nitrogen-to-oxygen abundance ratio in barred galaxies
23
Astronomy & Astrophysics manuscript no. bulbos_12072015 c ESO 2015 July 14, 2015 Central enhancement of nitrogen–to–oxygen abundance ratio in barred galaxies E. Florido 1, 2 , A. Zurita 1, 2 , I. Pérez 1, 2 , E. Pérez-Montero 3 , P.R.T. Coelho 4 , and D.A. Gadotti 5 1 Dpto. Física y del Cosmos. Campus de Fuentenueva, Universidad de Granada, 18071 Granada, Spain e-mail: 2 Instituto Carlos I de Física Teórica y Computación, Granada, Spain 3 Instituto de Astrofísica de Andalucía, CSIC, Apartado 3004, 18080 Granada, Spain 4 Instituto de Astronomia, Geofísica e Ciˆ encias Atmosféricas. Universidade de São Paulo, R. do Matão, 1226, 05508-090 São Paulo, SP, Brazil 5 European Southern Observatory, Casilla 19001, Santiago 19, Chile ABSTRACT Context. Bar–induced gas inflows towards the galaxy centres are recognized as a key agent for the secular evolution of galaxies. One immediate consequence of this inflow is the accumulation of gas in the centre of galaxies where it can form stars and alter the chemical and physical properties. Aims. Our aim is to study whether the properties of the ionised gas in the central parts of barred galaxies are altered by the presence of a bar, and whether the change in central properties is related to bar and/or parent galaxy properties. Methods. We use a sample of nearby face–on disc galaxies with available SDSS spectra, morphological decomposition and informa- tion on the stellar population of their bulges, to measure the internal Balmer extinction from the Hα to Hβ line ratio, star formation rate, and relevant line–ratios to diagnose chemical abundances and gas density. Results. The distributions of all parameters analysed (internal Balmer extinction at Hβ (c(Hβ)), star formation rate per unit area, electron density, [N ii]λ6583/Hα emission line ratio, ionization parameter and nitrogen–to–oxygen abundance ratio (N/O)) are differ- ent for barred and unbarred galaxies, except for the R 23 metallicity tracer and the oxygen abundance obtained from photoionisation models. The median values of the distributions of these parameters point towards (marginally) larger dust content, star formation rate per unit area, electron density and ionisation parameter in the centres of barred galaxies than in the unbarred counterpart. The most remarkable barred/unbarred difference appears in the [N ii]λ6583/Hα line ratio, which is on average ∼25% larger in barred galaxies, due to a larger N/O in the centres of these galaxies with respect to the unbarred ones. We have analysed these differences as a function of galaxy morphological type (as traced by bulge–to–disc light ratios and bulge mass), total stellar mass and bulge Sérsic index. We observe an enhancement of the differences between central gas properties in barred and unbarred galaxies in later–type galaxies or galaxies with less massive bulges. However the bar seems to have a lower impact on the central gas properties for galaxies with bulges above ∼ 10 10 M or total mass M ? & 10 10.8 M . Conclusions. We find observational evidence that the presence of a galactic bar affects the properties of the ionised gas in the central parts of disc galaxies (radii . 0.6–2.1 kpc). The most striking effect is an enhancement in the N/O abundance ratio, which can be qualitatively interpreted, in terms of our current knowledge on bar formation and evolution and on chemical evolution models, as due to a different star formation history in the centres of barred galaxies due to the gas inflow induced by the bar. Our results give support to the scenario in which less and more massive bulges have a different origin or evolutionary process, with the gaseous phase of the former having currently a closer relation with bars. Key words. Galaxies: evolution – (Galaxies:) bulges – Galaxies: spiral – Galaxies: abundances – Galaxies: ISM – Galaxies: structure – ISM: general 1. Introduction The distribution of gas and stars in disc galaxies has a basic ax- isymmetric structure driven by rotation, but superimposed non– axisymmetic morphological features, such as spiral arms or bars are expected to have important consequences on their evolu- tion (e.g. Kormendy & Kennicutt 2004). This secular, internally driven, evolution is thought to be dominant in recent times, as opposed to the evolution driven by galaxy hierarchical merg- ing and external gas accretion (e.g. Barnes & Hernquist 1992). Stellar bars have received great attention as important agents for secular galaxy evolution as their non–axisymmetic gravitational potential produces a redistribution of angular momentum of the gas and stars in galactic discs (e.g. Sellwood & Wilkinson 1993; Athanassoula 2003). Gas is dissipative and, at radii well inside corotation, loses angular momentum as a result of the gravita- tional torque exerted by the bar and it is therefore driven towards the galaxy centre (e.g. Athanassoula 1992; Friedli & Benz 1993; Friedli et al. 1994). Analytical and numerical simulations also show that the effectiveness to which a bar influences the galaxy dynamics (bar strength) changes as the bar evolves (Athanas- soula 2003) and therefore also does the bar–induced gas inflow rate (Regan & Teuben 2004). According to simulations, bar–induced gas inflow can affect the central properties of galaxies in a number of ways: increase the central gas and dust concentration and trigger star formation (SF) (Friedli & Benz 1993; Martinet & Friedli 1997); produce the formation and growth of a disky pseudobulge (Kormendy & Kennicutt 2004; Cheung et al. 2013) and alter central abundance Article number, page 1 of 23 arXiv:1507.03465v1 [astro-ph.GA] 13 Jul 2015
Transcript of Central enhancement of nitrogen-to-oxygen abundance ratio in barred galaxies

Astronomy & Astrophysics manuscript no. bulbos_12072015 c©ESO 2015July 14, 2015
Central enhancement of nitrogen–to–oxygen abundance ratio inbarred galaxies
E. Florido1, 2, A. Zurita1, 2, I. Pérez1, 2, E. Pérez-Montero3, P.R.T. Coelho4, and D.A. Gadotti5
1 Dpto. Física y del Cosmos. Campus de Fuentenueva, Universidad de Granada, 18071 Granada, Spaine-mail:
2 Instituto Carlos I de Física Teórica y Computación, Granada, Spain3 Instituto de Astrofísica de Andalucía, CSIC, Apartado 3004, 18080 Granada, Spain4 Instituto de Astronomia, Geofísica e Ciencias Atmosféricas. Universidade de São Paulo, R. do Matão, 1226, 05508-090 São Paulo,
SP, Brazil5 European Southern Observatory, Casilla 19001, Santiago 19, Chile
ABSTRACT
Context. Bar–induced gas inflows towards the galaxy centres are recognized as a key agent for the secular evolution of galaxies.One immediate consequence of this inflow is the accumulation of gas in the centre of galaxies where it can form stars and alter thechemical and physical properties.Aims. Our aim is to study whether the properties of the ionised gas in the central parts of barred galaxies are altered by the presenceof a bar, and whether the change in central properties is related to bar and/or parent galaxy properties.Methods. We use a sample of nearby face–on disc galaxies with available SDSS spectra, morphological decomposition and informa-tion on the stellar population of their bulges, to measure the internal Balmer extinction from the Hα to Hβ line ratio, star formationrate, and relevant line–ratios to diagnose chemical abundances and gas density.Results. The distributions of all parameters analysed (internal Balmer extinction at Hβ (c(Hβ)), star formation rate per unit area,electron density, [N ii]λ6583/Hα emission line ratio, ionization parameter and nitrogen–to–oxygen abundance ratio (N/O)) are differ-ent for barred and unbarred galaxies, except for the R23 metallicity tracer and the oxygen abundance obtained from photoionisationmodels. The median values of the distributions of these parameters point towards (marginally) larger dust content, star formation rateper unit area, electron density and ionisation parameter in the centres of barred galaxies than in the unbarred counterpart. The mostremarkable barred/unbarred difference appears in the [N ii]λ6583/Hα line ratio, which is on average ∼25% larger in barred galaxies,due to a larger N/O in the centres of these galaxies with respect to the unbarred ones. We have analysed these differences as a functionof galaxy morphological type (as traced by bulge–to–disc light ratios and bulge mass), total stellar mass and bulge Sérsic index. Weobserve an enhancement of the differences between central gas properties in barred and unbarred galaxies in later–type galaxies orgalaxies with less massive bulges. However the bar seems to have a lower impact on the central gas properties for galaxies with bulgesabove ∼ 1010 M� or total mass M? & 1010.8 M�.Conclusions. We find observational evidence that the presence of a galactic bar affects the properties of the ionised gas in the centralparts of disc galaxies (radii . 0.6–2.1 kpc). The most striking effect is an enhancement in the N/O abundance ratio, which can bequalitatively interpreted, in terms of our current knowledge on bar formation and evolution and on chemical evolution models, as dueto a different star formation history in the centres of barred galaxies due to the gas inflow induced by the bar. Our results give supportto the scenario in which less and more massive bulges have a different origin or evolutionary process, with the gaseous phase of theformer having currently a closer relation with bars.
Key words. Galaxies: evolution – (Galaxies:) bulges – Galaxies: spiral – Galaxies: abundances – Galaxies: ISM – Galaxies: structure– ISM: general
1. Introduction
The distribution of gas and stars in disc galaxies has a basic ax-isymmetric structure driven by rotation, but superimposed non–axisymmetic morphological features, such as spiral arms or barsare expected to have important consequences on their evolu-tion (e.g. Kormendy & Kennicutt 2004). This secular, internallydriven, evolution is thought to be dominant in recent times, asopposed to the evolution driven by galaxy hierarchical merg-ing and external gas accretion (e.g. Barnes & Hernquist 1992).Stellar bars have received great attention as important agents forsecular galaxy evolution as their non–axisymmetic gravitationalpotential produces a redistribution of angular momentum of thegas and stars in galactic discs (e.g. Sellwood & Wilkinson 1993;Athanassoula 2003). Gas is dissipative and, at radii well inside
corotation, loses angular momentum as a result of the gravita-tional torque exerted by the bar and it is therefore driven towardsthe galaxy centre (e.g. Athanassoula 1992; Friedli & Benz 1993;Friedli et al. 1994). Analytical and numerical simulations alsoshow that the effectiveness to which a bar influences the galaxydynamics (bar strength) changes as the bar evolves (Athanas-soula 2003) and therefore also does the bar–induced gas inflowrate (Regan & Teuben 2004).
According to simulations, bar–induced gas inflow can affectthe central properties of galaxies in a number of ways: increasethe central gas and dust concentration and trigger star formation(SF) (Friedli & Benz 1993; Martinet & Friedli 1997); producethe formation and growth of a disky pseudobulge (Kormendy &Kennicutt 2004; Cheung et al. 2013) and alter central abundance
Article number, page 1 of 23
arX
iv:1
507.
0346
5v1
[as
tro-
ph.G
A]
13
Jul 2
015
A&A proofs: manuscript no. bulbos_12072015
and dilute the initial disc metallicity gradient (Friedli & Benz1993; Friedli et al. 1994). If the gas is able to reach the centralparsecs, it could potentially act as fuel for a central massive blackhole (Shlosman et al. 1989) and thus form an AGN (e.g. Coelho& Gadotti 2011; Oh et al. 2012). Ultimately, bars can producecentral mass concentrations and once they accumulate sufficientmass in the centres they weakens and, for sufficiently high mass,the bar could even get dissolved (e.g. Pfenniger & Norman 1990;Friedli & Benz 1993; Bournaud & Combes 2002), althoughin more recent simulations bars are more robust than initiallythought (e.g. Shen & Sellwood 2004; Athanassoula et al. 2005,2013). For a detailed description on the role of bars in secularevolution see review by Kormendy & Kennicutt (2004) and ref-erences therein.
There is observational evidence for bar–induced gas inflows(e.g. Regan et al. 1997; Zurita et al. 2004). The inflow rate hasbeen measured to range ∼0.1-1 M� yr−1 (Regan et al. 1997;Sakamoto et al. 1999), being higher in earlier–type galaxies (Re-gan & Teuben 2004; Sheth et al. 2005). However, the observa-tional search for the theoretically predicted effects of bar inflowsin the properties of the central gas–phase component of galax-ies has not been successful in many cases and conclusions arefrequently contradictory.
Barred galaxies have higher central molecular mass concen-trations than unbarred galaxies (Sakamoto et al. 1999; Shethet al. 2005), that produce a higher star formation rate (SFR) inthe centres of barred galaxies as observed by a number of au-thors (e.g. Hummel et al. 1990; Ho et al. 1997b; Wang et al.2012; Zhou et al. 2015; Ellison et al. 2011; Oh et al. 2012) butthere is no agreement on the dependence of this enhancementin SFR with bar properties. For example, Wang et al. (2012) andZhou et al. (2015) find a positive trend between SFR and elliptic-ity or ellipticity–based parameters for strong bars, and Oh et al.(2012) with bar length, but no dependency is found by other au-thors (Pompea & Rieke 1990; Roussel et al. 2001; Ellison et al.2011). On the other hand, Ellison et al. (2011) find an enhance-ment in central SFR only for barred galaxies more massive than1010 M� and the enhancements observed by Oh et al. (2012) arerestricted to the reddest galaxies of their sample. In addition, re-cently Cacho et al. (2014) find no enhancement in SFR in barredgalaxies with respect to unbarred ones.
Studies of the central gas–phase metallicity yielded evenmore complex results. Ellison et al. (2011) find central oxygenabundances ∼0.06 dex larger in barred than in unbarred galax-ies at a given galaxy stellar mass, but Cacho et al. (2014) findno difference in a similar study to the one performed by Elli-son et al. (2011). Other authors (Considère et al. 2000; Dutil &Roy 1999) with a smaller galaxy sample measure lower centraloxygen abundances in barred starbursts than in normal unbarredgalaxies. No relation has been found so far between bar strengthand central oxygen abundance.
Therefore, although simulations predict important effects inthe central gas properties of barred galaxies, observationallyconfirmation has not yet convincingly been found. The samebars that produce an enhancement in SFR do not seem to pro-duce the metallicity alteration that simulations predict (Friedliet al. 1994; Martel et al. 2013). Bar evolution with its accompa-nying bar strength change, joined to the fact that bars can evenbe destroyed (so that currently unbarred galaxies maybe had abar in the past) might be part of the reason for the existing dis-crepant results. But also, central properties might also dependon the availability of gas and on host galaxy properties in gen-eral (namely total mass or Hubble type), which makes sampleselection critical.
The advent of the SDSS spectroscopic data has made it pos-sible to study the effects of bars in central gas properties usinglarge galaxy samples and covering wide ranges in host galaxyproperties. Although works in this field have contributed withinteresting results, all publications so far have focussed on cen-tral star–formation, and only in a few cases oxygen abundancehas also been studied (Ellison et al. 2011; Cacho et al. 2014).However, bar–induced gas inflows might also alter other phys-ical properties of the central gas. For example, if bars are ableto produce larger central mass concentrations (Sakamoto et al.1999; Sheth et al. 2005), larger concentrations of dust should beexpected in the centres of barred galaxies, which would producelarger extinction. This larger concentration of gas and dust incentres of barred galaxies joined to a larger bar–induced SFRcould also produce larger electron densities in the centres ofbarred galaxies (Ho et al. 1997b). The star–formation history ingalaxy centres is likely to be different in barred and unbarredgalaxies due to the gas supply induced by the bars, which mightleave footprints in the nitrogen–to–oxygen (N/O) abundance ra-tio (Mollá & Gavilán 2010; Mallery et al. 2007; Edmunds &Pagel 1978). It is then worth exploring other properties of theionised gas which might be modified by the effect of a bar. Thisis the motivation of the work presented here.
In this paper we will study ionised gas properties in the cen-tres of barred and unbarred galaxies. In addition to the SFR andoxygen abundance, the Balmer extinction, electron density andthe N/O abundance ratio will be measured. We will use a sam-ple of nearby galaxies with available spectra from which wewill remove AGN. Our galaxy sample has important advantageswith respect to previous ones: galaxies are face–on (i < 26◦),the stellar component has already been studied by Coelho &Gadotti (2011) and morphological 2D decomposition, and there-fore structural information of bars, bulges and discs, is also avail-able (Gadotti 2009).
Our final aim is to look for observational evidence that bar–induced inflows have important consequences on central proper-ties of the gas, and therefore on secular evolution.
This paper is organized as follows. Sect. 2 describes ourgalaxy sample. In Sect. 3 we describe the emission line fluxesmeasurements on which our study is based. Afterwards we re-move AGN from the sample (Sect. 4). In Sects. 5, 6, 7 and8 the internal extinction, central oxygen abundance, nitrogen–to–oxygen ratio, SFR and electron density are calculated for allsample galaxies, and the distribution of these parameters is com-paratively analysed for barred and unbarred galaxies separately.In the following sections (9, 10, 11) we explore the dependenceof the found differences with the galaxy Hubble type, and withtotal galaxy and bulge mass, and possible dependencies on barproperties. In Sect. 12 we discuss our results, which are summa-rized in Sect. 13.
2. Galaxy sample
The galaxy sample used here is the one used by Coelho &Gadotti (2011) to study the stellar populations of the bulges ofbarred and unbarred galaxies, which is based on the one studiedmorphologically by Gadotti (2009).
The sample contains all spiral face–on galaxies (axial ra-tio b/a > 0.9) in the Sloan Digital Sky Survey (SDSS) DataRelease 2, with stellar masses larger than 1010 M�, redshift0.02 6 z 6 0.07, bulge-to-total luminosity ratio below 0.043 (i.e.earlier than ∼Sd), and with signal-to-noise ratio in their corre-sponding SDSS spectra greater or equal than 10, measured over
Article number, page 2 of 23

E. Florido et al.: Central enhancement of nitrogen–to–oxygen abundance ratio in barred galaxies
the spectral range corresponding to the SDSS g–band. This sam-ple comprises 251 barred and 324 unbarred galaxies. The twosubsamples of barred and unbarred galaxies have similar totalstellar mass distributions (Coelho & Gadotti 2011).
3. Analysis of the spectra
3.1. Spectra pre–processing
The spectra analysed in this paper comes from the SDSS DataRelease 7. The spectra pre-processing comprises shifting of theoriginal spectra to the rest frame using the redshifts from theSDSS database, re-sampling in steps of 1Å, and Galactic extinc-tion correction as described by Cid Fernandes et al. (2005).
Afterwards the emission of the stellar component was mod-elled with the spectral synthesis code STARLIGHT (Cid Fernan-des et al. 2005), by comparing the observed SDSS spectra, in apixel-by-pixel basis, to stellar population models (Vazdekis et al.2010).
We refer the reader to Coelho & Gadotti (2011) and Gadotti(2009) and references therein for full details on the sample selec-tion and biases, and on the spectra pre–processing and modellingof the stellar component.
3.2. Emission line measurements
The emission line fluxes have been automatically measured overthe stellar emission subtracted SDSS spectra of the galaxy sam-ple, processed as described above.
We have developed a code for measuring the fluxes ofthe brightest emission lines of the optical spectra. These in-clude [O ii]λλ3727,3729, Hδ, Hγ, Hβ, [O iii]λ4959, [O iii]λ5007,[O i]λ6300, [N ii]λ6548, Hα, [N ii]λ6584 and [S ii]λλ6717,6731.All line fluxes were measured independently of each other, withno assumptions on the relative strength of any pair of lines.
In a first step, the code searches for significant emission (overthe continuum level) at the rest–frame wavelength of the bright-est emission lines. At this point, the continuum level is deter-mined from a linear fit of the median continuum level in twospectral regions at both sides of each emission line. If the codedetects an emission peak with signal over the continuum levelgreater than twice the standard deviation of the continuum, thenthe emission line profile is fitted with a Gaussian function, andthe central wavelength and full-width at half maximum ( f whm)of the line are determined. Only fitted emission features yield-ing reasonable values 1 for the central wavelength and f whm areconsidered as true detections. In a second step, the code mea-sures the emission line fluxes. To do this, the code first definesnew regions dominated by continuum emission at both sides ofeach emission line. The size and distance of these continuum re-gions from the emission line central wavelength depend on boththe previously determined f whm and on the location of neigh-bour emission lines. The continuum level at the emission lineposition is estimated through a linear fit of the median contin-uum levels in the continuum regions. This is a relevant step inthe procedure, as the larger uncertainties in the line fluxes comefrom the determination of the continuum level. Line fluxes are
1 At this stage, we only considered as true detections those featureshaving simultaneously: (a) A maximum central wavelength shift fromexpected rest–frame wavelength smaller than 4.5Å, and (b) A f whmwithin a factor or two the f whm of the [O ii]λλ3727,3729 doublet,when the doublet was detected, or a f whm between 2 and 45Å when[O ii]λλ3727,3729 was not detected.
then obtained from direct integration of the emission line pro-files over the continuum level determined as described above, ex-cept for [N ii]λ6548, Hα, [N ii]λ6583 and [S ii]λλ6717,6731, forwhich fluxes obtained from Gaussian line fitting were adoptedin order to ensure accurate flux retrieval in cases in which thesesets of lines were blended together.
The preliminary flux measurements were carefully inspectedfor unreliable measurements and/or undetected emission lines,clearly detectable by eye. These checks have been done interac-tively, by visual inspection of the individual spectra and on theGaussian and continuum fits, and with comparisons with mea-surements done by hand with the SPLOT IRAF2 task for randomsets of spectra. The code was then modified accordingly untilautomatic results were in reasonable agreement (within ∼20%)with by hand flux measurements.
The uncertainty of the line fluxes was estimated by propagat-ing the uncertainty of the continuum level emission in the lineflux calculation. Emission line flux measurements with signal-to-noise ratios lower than 3 were rejected and set to zero. Typ-ically, relative errors are below ∼5% for line fluxes brighterthan ∼1.5×10⁻¹⁵ erg s−1 cm−2 for all emission lines, except for[O ii]λλ3727,3729, for which relative errors are larger (∼10%)at that flux level. Line flux relative errors increase up to ∼20%at flux levels of ∼ 3 × 10⁻¹⁶ erg s−1 cm−2 for all lines exceptfor [O ii]λλ3727,3729, in which errors are typically larger (∼25-30%).
We have empirically checked the quality of our emis-sion line measurements by comparing the emission line ratios[N ii]λ6548/[N ii]λ6584 and [O iii]λ4959/[O iii]λ5007 to theirtheoretical values. This is done in Fig.1. The emission line fluxesof both doublets correlate well with each other, with correlationcoefficients of 0.97 and 0.88 for the [O iii] and [N ii] doublet re-spectively. The fitted slopes are 0.34 ± 0.01 and 0.37 ± 0.02 for[O iii]λ4959 vs. [O iii]λ5007 and [N ii]λ6548 vs. [N ii]λ6584 re-spectively, which are close to the ∼ 1/3 theoretical value (Os-terbrock & Ferland 2006). The dispersion in the [N ii]λ6548 vs.[N ii]λ6584 is larger than the one of the [O iii] doublet, speciallytowards larger values of [N ii]λ6584/Hβ. In general, the galaxieswith larger deviation from the best linear fits are also the oneswith larger error bars. This fact reinforces our flux error esti-mates, which seems to represent well real uncertainties in themeasurements. Data points with the largest deviation from thebest fit are normally AGNs (specially for the [N ii] doublet). Weconcentrate only on non–AGN galaxies in this paper and there-fore our results will not be affected by these larger uncertainties.
3.3. Comparison with emission line fluxes from otherdatabases
We have compared our emission line flux measurements withthose available in some public databases. The most popular pub-lic databases with emission line fluxes are the MPA-JHU3 re-lease of spectrum measurements (from SDSS DR7) and theOSSY4 database (Oh et al. 2011). As in our case, these databasesused also the 7th release of the SDSS spectra. MPA–JHU linefluxes of extended sources are normalised to match the photo-
2 IRAF is distributed by the National Optical Astronomy Observatory,which is operated by the Association of Universities for Research in As-tronomy (AURA) under cooperative agreement with the National Sci-ence Foundation.3 http://www.mpa-garching.mpg.de/SDSS/DR7/4 http://gem.yonsei.ac.kr/∼ksoh/wordpress/
Article number, page 3 of 23

A&A proofs: manuscript no. bulbos_12072015
Fig. 1. Comparison of the measured emission line fluxes of the two lines in doublets [N ii]λλ6548,6584 (left) and [O iii]λλ4959,5007 (right)normalized to the Hβ emission line flux. Purple points indicate galaxies classified as AGN (Sect. 4). The dashed green line shows the best linearfit to the data, which yields a slope of 0.37 ± 0.02 and 0.34 ± 0.01 for [N ii]λ6548/Hβ vs. [N ii]λ6584/Hβ and [O iii]λ4959/Hβ vs. [O iii]λ5007/Hβrespectively (see text in Sect. 3.2 for details).
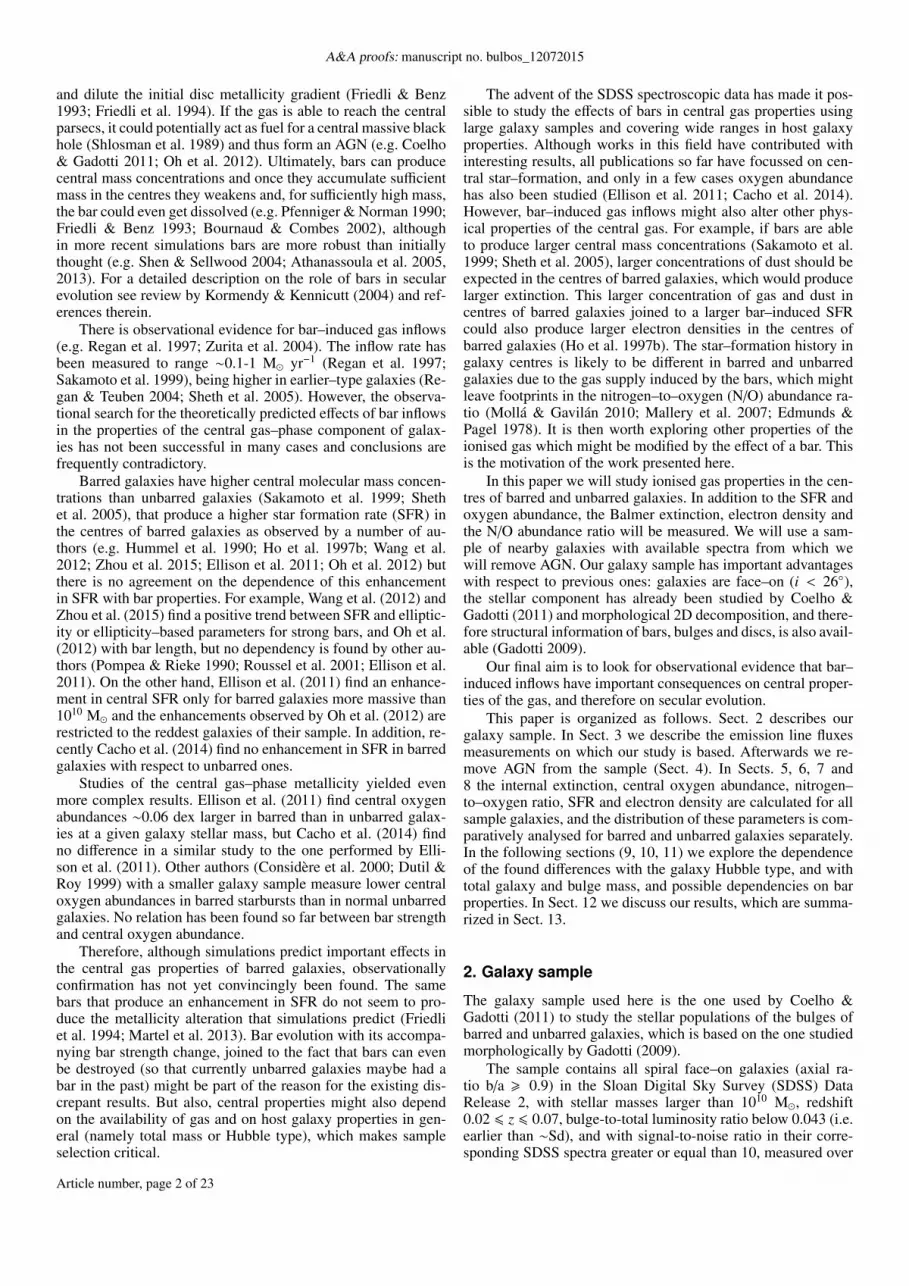
Fig. 2. Ratio of emission line fluxes available in public databases to the fluxes measured in this work (FluxTW ), for the OSSY (green circles) andMPA-JHU (pink squares) databases, as a function of the emission line fluxes measured in this work for the [O ii]λλ3726,3729 (top left), [O iii]λ5007(top right), Hα (bottom left) and [N ii]λ6583 (bottom right) emission lines. All fluxes are corrected for Galactic extinction (see Sect 3.3 for details).
metric fibre magnitude in the r–band. We have removed this nor-malization from the MPA–JHU data.
Fig. 2 shows the comparison of the [O ii]λλ3727,3729,[O iii]λ5007, Hα, and [N ii]λ6583 emission line fluxes measuredby these databases with our measurements from the spectra ofour galaxy sample (Sect. 2). The three sets of data representedin Fig. 2 are corrected for foreground Galactic reddening (notfor internal extinction). Our line emission fluxes agree fairlywell with those from the OSSY and MPA-JHU databases. Ingeneral the fluxes agree within ∼20% for lines brighter than∼10−15 erg s−1 cm−2, except for [O ii]λλ3727,3729, in which dif-ferences are within ∼30%. For weaker lines, the scatter increasesconsiderably, due to larger relative errors in the measurements.
For emission lines brighter than &3×10⁻¹⁵ erg s−1 cm−2,our fluxes agree with the OSSY and MPA-JHU measurementswithin ∼4-6%, except for [N ii]λ6583 and Hα as measured byOSSY, which are in average ∼8% larger than our measurements.Our measurements of [N ii]λ6583 and Hα are also systematically
lower than the ones from MPA-JHU but only by ∼4% in average.For [O ii]λλ3727,3729, and [O iii]λ5007, however, our measure-ments are systematically larger than MPA-JHU measurementsby ∼5%, and are in better agreement with the OSSY measure-ments (within ∼2-3%). These systematic differences can in part(but not completely) be due to the usage of different extinctionlaws for the correction of the foreground Galactic extinction. Ourdata was corrected using the Schlegel et al. (1998) maps andthe Cardelli et al. (1989) extinction curve (see Cid Fernandeset al. 2005). The MPA-JHU data are corrected using O’Donnell(1994). Differences of order ∼3% at [O ii]λλ3727,3729 are ex-pected for typical values of AV∼ 1 − 1.5 mag given the dif-ferences in the extinction curves. The extinction curve used byOSSY authors is not specified.
In any case, differences between our observed fluxes and theones available in the OSSY and MPA-JHU databases are smalland comparable to measurement errors, even taking into accountthat the stellar emission subtraction, the flux measurement pro-
Article number, page 4 of 23

E. Florido et al.: Central enhancement of nitrogen–to–oxygen abundance ratio in barred galaxies
cedures, and the foreground Galactic reddening correction differin the three sets of data.
4. Nuclear classification and removal of AGN
Our initial galaxy sample (see Sec. 2) includes active and nor-mal galaxies. We have used standard diagnostic diagrams basedon bright emission–line ratios (also known as BPT diagrams, af-ter Baldwin et al. 1981) to separate the galaxies whose dominantmechanism of ionisation is UV radiation from massive youngstars (i.e. star–forming galaxies) from those ionised by an activegalactic nucleus (AGN). In Fig. 3a and 3b we show the diagnos-tic diagrams based on our measured (non–extinction corrected5)ratios [O iii]λ5007/Hβ versus [N ii]λ6584/Hα, for the barred andunbarred subsamples of galaxies.
The solid line separates star–forming galaxies from AGN ac-cording to the predictions of the photoionisation models of Kew-ley et al. (2001), while the dashed line sets this separation em-pirically (Kauffmann et al. 2003a). Both lines do not agree, andthe number of AGN predicted by Kauffmann et al. (2003a) islarger than the theoretical prediction. We will refer to the galax-ies located between the two lines (i.e. classified as star–formingaccording to Kewley et al. 2001 and as AGN according to Kauff-mann et al. 2003a) as transition objects. These are also knownas composite objects and might be a population of objects whoseionisation is in part produced by recent star–formation and inpart due to an AGN (Kewley et al. 2006) but they also might in-clude photoionised nuclei with high nitrogen abundance (Pérez-Montero & Contini 2009). For the later reason we will use theKewley et al. (2001) criteria to remove AGN from our sample.The horizontal dot–dashed line separates the Seyfert region fromthe Low-Ionisation Nuclear-line Regions area (LINERs; Kewleyet al. 2006).
According to this classification into star–forming, transitionand AGN galaxies, the percentage of AGN in the subsamplesof barred and unbarred galaxies is 31% and 18%, respectively;or equivalently there are ∼ 1.7 times more AGN in barred thanin unbarred galaxies. This factor keeps when we consider theKauffmann et al. (2003a) criteria, i.e. AGN (according to Kewleyet al. 2001) plus transition objects are 1.7 times more frequent inthe subsample of barred galaxies than in the unbarred galaxysubsample6. The fraction of AGN in barred galaxies increaseswhen we consider galaxies with low mass bulges. AGN are about2 times more frequent in barred galaxies than in unbarred galax-ies when one considers only bulges less massive than 1010.1M�.
In what follows we will consider all the galaxies of the sam-ple except those classified as AGN. We will refer to them asthe non–AGN galaxies, and this sample includes star–forminggalaxies according to the Kauffmann et al. (2003a) criteria, tran-sition objects, and unclassified galaxies (normally due to thenon-detection of relevant emission lines involved in the BPT dia-
5 The [O iii]λ5007/Hβ versus [N ii]λ6584/Hα is the least reddening de-pendent BPT plot. After internal extinction correction as described inSect. 5, we have checked that our classification was correct. BPT dia-grams showed in Sect. 12 are based on extinction corrected emission–line fluxes.6 Coelho & Gadotti (2011) used the AGN cata-logue from Kauffmann et al. 2003a, http://www.mpa-garching.mpg.de/SDSS/DR4/Data/agncatalogue.html, to separateAGN galaxies from the whole sample. Their numbers differ from theones used in this work, in which classification comes from our emissionline measurements. However, in both cases AGN are ∼ 1.7 times morefrequent in barred than in unbarred galaxies.
Table 1. Number of active and non–active galaxies in the global sampleand in the subsamples of barred and unbarred galaxies, according to theBTP diagrams in Figs. 3a and 3b (see Sect. 4 for details).
Type whole barred unbarredsample subsample subsample
Star–forming 139 43 96Transition 113 66 47LINER 109 61 48Seyfert 28 17 11Unclassified 186 64 122
Fig. 4. Histograms showing the distribution of decimal logarithm of thetotal galaxy stellar mass, redshift, logarithm of bulge mass and loga-rithm of the bulge to disc light ratio in the i–band for barred (hatchedyellow) and unbarred (purple) galaxies separately, for all the non–activegalaxies of the sample. The number of galaxies in each subsample (NBand NU ) is indicated, together with the two–sample Anderson-Darlingtest P–values (AD, expressed in %). The yellow and purple circles inthe upper side of the panels indicate the median value of the barred andunbarred distributions respectively. The horizontal error bar covers the95% confidence interval (estimated as 1.57 × IQR/
√N, where IQR is
the interquartile range, or 1st quartile subtracted from the 3rd quartile,and N the number of data points) for the corresponding median value.
gram). Our effective sample of non–AGN galaxies have 173 and265 barred and unbarred galaxies, respectively.
4.1. Non–AGN and Star–forming subsamplescharacterization
Fig. 4 shows a comparison between the total galaxy stellar mass,redshift, bulge mass and bulge–to–disc light ratio (i–band) distri-butions for the subsamples of barred and unbarred galaxies. Thetotal stellar masses are taken from Kauffmann et al. (2003b), andare based on fitting to stellar spectral features (the 4000Å breakand the Balmer absorption line index HδA). The bulge massescome from Coelho & Gadotti (2011) (based on bulge luminos-ity and mass–to–light ratio in the i–band) and the bulge–to–disc light ratio comes from morphological decomposition per-formed by Gadotti (2009). The total galaxy stellar mass andredshift distributions are similar for barred and unbarred galax-ies. In order to statistically confirm this we have used the k–sample Anderson–Darling (hereinafter A–D) test (see Scholz &
Article number, page 5 of 23

A&A proofs: manuscript no. bulbos_12072015
Fig. 3. Diagnostic diagrams to classify emission–line galaxies according to their dominant ionisation mechanism for the barred (left) and unbarred(right) galaxies of the sample. The solid and dash lines separate the region of star–forming galaxies from the region of AGN according to Kewleyet al. (2001) and Kauffmann et al. (2003a), respectively. The horizontal dot–dashed line separates the AGN region into Seyfert and LINER galaxyregions (Kewley et al. 2006).
Fig. 5. Same as Fig. 4 but only for galaxies classified as star–formingaccording to Kauffmann et al. (2003a). NB and NU are the number ofbarred and unbarred galaxies respectively, and AD is the two–sampleAnderson-Darling test P–value (expressed in %).
Stephens 1987; Stephens 1974)7. The test yields P–values or sig-nificance levels at which the null hypothesis that the two sam-ples come from the same parent distribution can not be rejected
7 The k–sample Anderson–Darling test is based on the Anderson–Darling rank statistics (Anderson & Darling 1954) for testing homo-geneity of samples with possibly different sample sizes and unspeci-fied distributions. The Anderson–Darling test is, in turn, a modifica-tion of the Kolmogorov–Smirnov test. The k–sample version of thetest is more recommended than k–sample Kolmogorov–Smirnov forsmall sample sizes (see e.g. Hou et al. 2009). See also discussion athttps://asaip.psu.edu/Articles/beware-the-kolmogorov-smirnov-test.
of ∼37% and 54% for the total stellar mass and redshift respec-tively. These values are much greater than the 5% threshold valuenormally adopted, below which the result is statistically signif-icant and the null hypothesis can be rejected. The distributionsof bulge mass and bulge–to–disc light ratio are however differ-ent between barred and unbarred galaxies when all non–AGNgalaxies are considered. Median values and distribution shapesare different, and the A–D tests confirms the difference, with P–values well below 0.1%. The bulges of barred galaxies are lessmassive than in unbarred galaxies and bulge–to–disc light ratiosare also smaller for barred galaxies, even although both subsam-ples of barred and unbarred galaxies have the same total stellarmass distributions. This was already pointed out by Coelho &Gadotti (2011).
If we consider the subsample containing only galaxies clas-sified as star–forming, Fig. 5 and the A–D test results indicatethat the distributions of total stellar mass, redshift, bulge massand bulge–to–disc light ratio are not different for barred and un-barred galaxies, as P–values are larger than 5% in all cases.
5. Internal extinction
The emission line fluxes were corrected for internal extinctionfrom the Balmer decrement, using the Hα to Hβ emission lineflux ratio. In the absence of internal dust extinction, the Hα to Hβline flux ratio, (FHα/FHβ)intr is equal to 2.86, for typical electrontemperatures and densities in star forming regions (Te ∼10000 Kand ne ∼100 cm−3), under the case B of the recombination the-ory (Osterbrock & Ferland 2006). The presence of dust in theinterstellar medium increases this line ratio due to differentialextinction, and the amount of attenuation can be quantified withthe parameter c(Hβ), the internal extinction at the Hβ emissionline:
(FHβ)obs = (FHβ)intr 10−c(Hβ) (1)
Article number, page 6 of 23

E. Florido et al.: Central enhancement of nitrogen–to–oxygen abundance ratio in barred galaxies
Fig. 6. Left. Histogram of the values of the Balmer extinction at theHβ emission line, c(Hβ), for all galaxies of the sample with c(Hβ)>0.0except those classified as AGN as explained in Sect.4. Right. Same as inthe left but for barred (hatched yellow) and unbarred (purple) galaxiesseparately. The number of galaxies in each subsample and the P–valuefrom the A–D test for the two distributions are shown below the figurelegend.
where the subindexes ’obs’ and ’intr’ stand respectively for ob-served and intrinsic fluxes. c(Hβ) can be obtained from the Hαto Hβ emission line flux ratio, assuming a reddening law8 f (λ):
c(Hβ) =−1
f (Hα)
[log
(FHα
FHβ
)obs− log
(FHα
FHβ
)intr
](2)
f (Hα) is the reddening function at Hα normalized to Hβ (i.e.f (Hβ) = 0). We have employed the Seaton (1979) reddening lawwith the Howarth (1983) parametrisation, assuming RV = 3.1.With this combination of reddening law and RV , the extinctionin magnitudes at Hα is AHα = 1.515 c(Hβ). The intrinsic Hα toHβ line flux ratio has been assumed to be 2.86. We are awarethat in the central regions of galaxies the metallicity might beoversolar, with Te lower than 10000 K and therefore this ratiocan be larger than 2.9. Assuming a larger value of the Hα to Hβline flux ratio would decrease all c(Hβ) values by 0.02, 0.06 and0.1 for (FHα/FHβ)intr equal to 2.9, 3.0 and 3.1 respectively.
The histogram with the values of the Balmer extinctionc(Hβ) for all galaxies of the sample (except AGN) is on the leftpanel of Fig. 6. Values are in the range 0-1.4, being the medianvalue of the distribution (0.47 ± 0.03). We assign an internal ex-tinction of zero when the observed Balmer ratio FHα/FHβ is lowerthan the theoretical value. These objects are not considered inFig. 6. The obtained distribution is very similar in shape and invalues to that found by Stasinska et al. (2004) for 10854 spectrafrom the First Data Release of the SDSS.
Dust affects both, the stellar continuum emission and thenebular emission. Fig. 7 shows the V–band extinction in magni-tudes derived from the gas emission lines (AV,g) versus the stellarcontinuum V–band extinction (AV,s) as derived from the spectralsynthesis fitting with STARLIGHT (see Sect. 2). We note thereader that the Cardelli et al. (1989) extinction curve was usedin STARLIGHT, while we used Seaton (1979) for the gas com-ponent. However, both extinction curves gives roughly the sameextinction at the V–band (Seaton gives in average a larger extinc-tion by ∼0.8% in that spectral range). The dispersion is high, but
8 The relation of f (λ) with the function X(x) of the Howarth (1983)parametrisation is f (λ) =
X(x)X(xHβ) − 1, where x = 1/λ (λ in microns)
with xHβ, the corresponding value for the Hβ spectral line. In thisparametrisation, the extinction in magnitudes at a given wavelength λis Aλ = X(x) E(B − V).
Fig. 7. V–band extinction in magnitudes, AV,g, as obtained from theHα to Hβ Balmer decrement, versus the stellar continuum V–bandextinction (AV,s) as derived from the spectral synthesis fitting withSTARLIGHT for all non–AGN galaxies. The straight solid and dashedlines show the relations between AV,g and AV,s found by Calzetti et al.(2000) and Kreckel et al. (2013), respectively.
it is clear from the figure that both quantities are correlated, andthat the extinction derived from emission lines is typically abouttwice the extinction derived from the observed stellar continuum.This is in agreement with other author results, as e.g. Calzettiet al. (2000) and Kreckel et al. (2013), who find AV,s=(0.44 ±0.03) AV,g and AV,s=(0.470 ± 0.006) AV,g, respectively, for H iiregions and starburst galaxies. These relations are overplotted inFig. 7 and are compatible with our data in the range of extinctionobserved (AV,g from 0 to 3 mag).
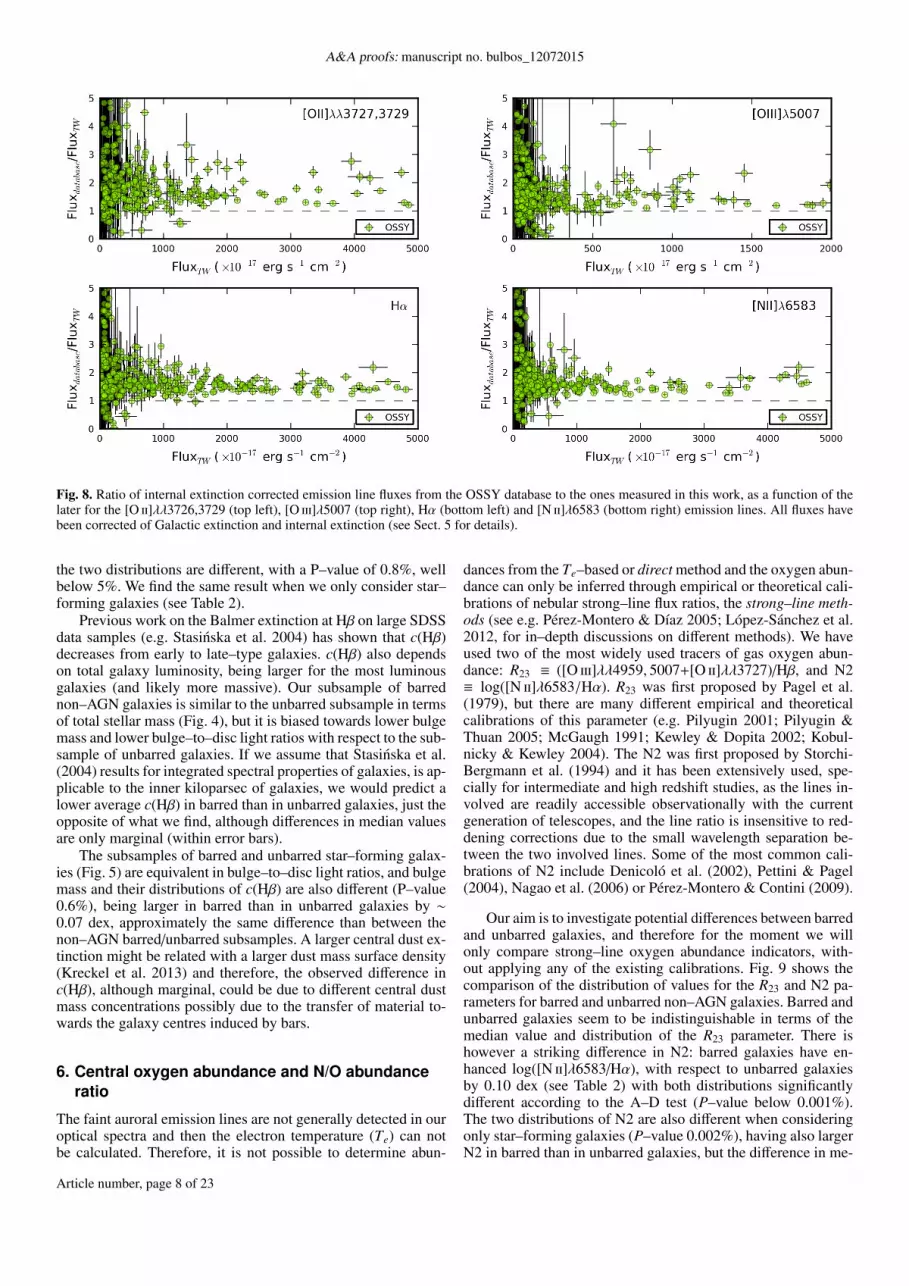
All measured emission lines were corrected for internal dustextinction using the derived values for c(Hβ). The correctedemission line fluxes have been compared with the correspond-ing values provided in one of the most popular public databases:OSSY (Oh et al. 2011). Fig. 8 shows comparison of extinctioncorrected fluxes for some of the brightest emission lines. As itcan be seen, OSSY fluxes are typically larger than our extinctioncorrected line fluxes by a factor of about 1.6 (∼1.8 for [O ii]).Also, the OSSY colour excess tabulated values for the gas andthe stellar continuum (called E(B-V)_gas and E(B-V)_star, re-spectively) do not hold the relation mentioned above (Fig. 7).
However, we remark here that our observed (uncorrected)emission line fluxes are in good agreement with their quoted ob-served fluxes (see Sect. 3.3 and Fig. 2).
A table containing extinction corrected line fluxes measuredin this paper are available at the CDS. The table contains thefollowing information: Column 1 gives the SDSS plate usedto collect the spectrum, Column 2 the modified Julian Date ofthe observation night (mjd), Column 3 the SDSS fiber number,Columns 4 to 25 the extinction corrected emission line fluxesnormalised to Hβ=100 and associated uncertainties, Columns 25and 27 give the Hβ flux in units of 10−17erg s−1 cm−2 and theBalmer extinction at Hβ, respectively, and Columns 26 and 28their corresponding uncertainties.
5.1. c(Hβ) distribution for barred and unbarred galaxies
The right panel of Fig. 6 shows the distribution of c(Hβ) forbarred and unbarred galaxies separately. The median value ofc(Hβ) is only marginally larger in barred (0.50±0.04) than inunbarred galaxies (0.44±0.03), but the A–D test indicates that
Article number, page 7 of 23
A&A proofs: manuscript no. bulbos_12072015
Fig. 8. Ratio of internal extinction corrected emission line fluxes from the OSSY database to the ones measured in this work, as a function of thelater for the [O ii]λλ3726,3729 (top left), [O iii]λ5007 (top right), Hα (bottom left) and [N ii]λ6583 (bottom right) emission lines. All fluxes havebeen corrected of Galactic extinction and internal extinction (see Sect. 5 for details).
the two distributions are different, with a P–value of 0.8%, wellbelow 5%. We find the same result when we only consider star–forming galaxies (see Table 2).
Previous work on the Balmer extinction at Hβ on large SDSSdata samples (e.g. Stasinska et al. 2004) has shown that c(Hβ)decreases from early to late–type galaxies. c(Hβ) also dependson total galaxy luminosity, being larger for the most luminousgalaxies (and likely more massive). Our subsample of barrednon–AGN galaxies is similar to the unbarred subsample in termsof total stellar mass (Fig. 4), but it is biased towards lower bulgemass and lower bulge–to–disc light ratios with respect to the sub-sample of unbarred galaxies. If we assume that Stasinska et al.(2004) results for integrated spectral properties of galaxies, is ap-plicable to the inner kiloparsec of galaxies, we would predict alower average c(Hβ) in barred than in unbarred galaxies, just theopposite of what we find, although differences in median valuesare only marginal (within error bars).
The subsamples of barred and unbarred star–forming galax-ies (Fig. 5) are equivalent in bulge–to–disc light ratios, and bulgemass and their distributions of c(Hβ) are also different (P–value0.6%), being larger in barred than in unbarred galaxies by ∼0.07 dex, approximately the same difference than between thenon–AGN barred/unbarred subsamples. A larger central dust ex-tinction might be related with a larger dust mass surface density(Kreckel et al. 2013) and therefore, the observed difference inc(Hβ), although marginal, could be due to different central dustmass concentrations possibly due to the transfer of material to-wards the galaxy centres induced by bars.
6. Central oxygen abundance and N/O abundanceratio
The faint auroral emission lines are not generally detected in ouroptical spectra and then the electron temperature (Te) can notbe calculated. Therefore, it is not possible to determine abun-
dances from the Te–based or direct method and the oxygen abun-dance can only be inferred through empirical or theoretical cali-brations of nebular strong–line flux ratios, the strong–line meth-ods (see e.g. Pérez-Montero & Díaz 2005; López-Sánchez et al.2012, for in–depth discussions on different methods). We haveused two of the most widely used tracers of gas oxygen abun-dance: R23 ≡ ([O iii]λλ4959, 5007+[O ii]λλ3727)/Hβ, and N2≡ log([N ii]λ6583/Hα). R23 was first proposed by Pagel et al.(1979), but there are many different empirical and theoreticalcalibrations of this parameter (e.g. Pilyugin 2001; Pilyugin &Thuan 2005; McGaugh 1991; Kewley & Dopita 2002; Kobul-nicky & Kewley 2004). The N2 was first proposed by Storchi-Bergmann et al. (1994) and it has been extensively used, spe-cially for intermediate and high redshift studies, as the lines in-volved are readily accessible observationally with the currentgeneration of telescopes, and the line ratio is insensitive to red-dening corrections due to the small wavelength separation be-tween the two involved lines. Some of the most common cali-brations of N2 include Denicoló et al. (2002), Pettini & Pagel(2004), Nagao et al. (2006) or Pérez-Montero & Contini (2009).
Our aim is to investigate potential differences between barredand unbarred galaxies, and therefore for the moment we willonly compare strong–line oxygen abundance indicators, with-out applying any of the existing calibrations. Fig. 9 shows thecomparison of the distribution of values for the R23 and N2 pa-rameters for barred and unbarred non–AGN galaxies. Barred andunbarred galaxies seem to be indistinguishable in terms of themedian value and distribution of the R23 parameter. There ishowever a striking difference in N2: barred galaxies have en-hanced log([N ii]λ6583/Hα), with respect to unbarred galaxiesby 0.10 dex (see Table 2) with both distributions significantlydifferent according to the A–D test (P–value below 0.001%).The two distributions of N2 are also different when consideringonly star–forming galaxies (P–value 0.002%), having also largerN2 in barred than in unbarred galaxies, but the difference in me-
Article number, page 8 of 23

E. Florido et al.: Central enhancement of nitrogen–to–oxygen abundance ratio in barred galaxies
Table 2. Median values and errors (95% confidence interval of the median) of the distributions of c(Hβ), R23 and N2 gas metallicity indicators, starformation rate per unit area, [S ii]λ6717/[S ii]λ6731 line ratio, oxygen abundance and nitrogen–to–oxygen ratio, and logarithm of the ionisationparameter, in the centres of barred and unbarred galaxies in the subsamples of non–AGN and pure star–forming galaxies (Sect. 4) and numberof galaxies in each subsample. The P–values of the k–sample Anderson–Darling test for the comparison of distributions for barred and unbarredgalaxies are shown for all cases.
Non–AGN Star–FormingP-valuea barred unbarred P-valuea barred unbarred
median N median N median N median Nc(Hβ) 0.8% 0.50±0.04 104 0.44±0.03 140 0.6% 0.53±0.04 43 0.46±0.04 96log R23 64.0% 0.31±0.04 105 0.31±0.04 130 0.3% 0.19±0.04 41 0.22±0.04 86N2 0.0009% -0.28±0.02 110 -0.38±0.02 152 0.02% -0.37±0.03 43 -0.43±0.01 96log ΣS FR 0.07% -1.1±0.1 112 -1.3±0.1 155 0.1% -0.9±0.1 43 -1.2±0.1 96[S ii]λ6717/[S ii]λ6731 0.05% 1.25±0.03 104 1.31±0.03 127 0.7% 1.28±0.03 40 1.33±0.03 84log (N/O) 0.01% -0.49±0.03 105 -0.58±0.03 143 0.03% -0.49±0.04 40 -0.58±0.03 9112+log (O/H) 4.3% 8.68±0.01 107 8.69±0.01 151 7.4% 8.69±0.01 40 8.70±0.01 92log U 5.3% -3.08±0.02 107 -3.14±0.02 151 2.5% -3.09±0.03 40 -3.18±0.02 92
Notes.(a) P–value for the Anderson–Darling test, or approximate significance level at which the null hypothesis that the two samples are drawn from thesame population can be rejected. Usually, significance levels lower than 5% are requested to reject the null hypothesis.
Fig. 9. Histograms of the values of the oxygen abundance indicatorsR23=([O iii]+[O ii])/Hβ (left) and N2 = log([N ii]λ6583/Hα) (right) forall non–AGN barred and unbarred galaxies of the sample. The numberof objects in each subsample and the P–values from the A–D test areshown in each panel.
dian values shortens to ∼0.06 dex, which is in any case muchlarger than the uncertainties in the median values.
It is well known that there is a positive mass–metallicity rela-tion for spirals (e.g. Tremonti et al. 2004; Bothwell et al. 2013).We will analyse in detail the dependence of N2 and R23 with to-tal stellar mass in Sect. 10. However, we remind the reader herethat the mass distributions of our barred and unbarred subsam-ples are identical and therefore the observed difference in N2might be indicating a real and strong physical difference in thecentres of barred galaxies with respect to unbarred galaxies.
Given that there are no differences between barred and un-barred galaxies in terms of the R23 parameter, any empirical cal-ibration of this parameter yields no difference in oxygen abun-dance between barred and unbarred galaxies. The opposite hap-pens with calibrations which make use of N2, except for the N2empirical calibration by Pérez-Montero & Contini (2009), whichincludes a correction to account for the nitrogen–to–oxygen ra-tio. We have estimated log (N/O) from the empirical calibrationof the N2S2 ratio (=log([N ii]λ6583/[S ii]λλ6717, 6731) from thesame authors. Afterwards, 12 + log(O/H) is calculated. We havealso estimated log (N/O), 12 +log(O/H) and the ionisation pa-
rameter9, U, from the new grids of photoionisation models byPérez-Montero (2014). The results are shown in Table 2 and inFig. 10. The barred and unbarred subsamples of galaxies havethe same average oxygen abundance within errors, 12+log(O/H)= 8.69±0.01, and the distributions are indistinguishable fromeach other: we obtain A–D P–values of 4.3% and 7.4% when weconsider non–AGN or star–forming galaxies, respectively. Thisis in agreement with recent results from Cacho et al. (2014) for asimilar sample of barred and unbarred nearby disc galaxies fromthe Nair & Abraham (2010) catalogue. However, our result is inapparent disagreement with Ellison et al. (2011), who reported alarger oxygen abundance (by ∼0.06 dex) in barred with respectto unbarred galaxies, for a galaxy sample also extracted fromNair & Abraham (2010). In Sect. 12 we will discuss these resultsand try to explain the possible sources of discrepancy betweentheir and our results.
However, as expected from the N2 values, we find a sta-tistically significant and interesting difference in the centralnitrogen–to–oxygen abundance ratio between barred and un-barred galaxies. The median log (N/O) is 0.09 dex larger inbarred than in unbarred galaxies, for both the non–AGN and thestar–forming samples. This difference is three times larger thanthe uncertainties in the median values (∼0.03 dex). The AD–testconfirms that the barred and unbarred distributions are differ-ent (mid–panel in Fig. 10), with P–values of 0.01% and 0.03%for the non–AGN and the star–forming samples, respectively. Toour knowledge, this is the most evident and larger difference inphysical properties of the gas observed so far between barred andunbarred galaxies.
9 Regarding the ionisation parameter values derived from the grid ofphotoionisation models from Pérez-Montero (2014), it is important tostress that in absence of emission line ratios sensitive to the electrontemperature, an empirical law between log U and 12+log(O/H) is as-sumed (i.e. lower U for higher O/H). Nevertheless, in the grid a certainrange of variation in log U is allowed for each O/H value that exceedsthe expected and reported log U variations in our sample of studied ob-jects, so we think that the resulting log U values give an accurate ideaof the variations.
Article number, page 9 of 23

A&A proofs: manuscript no. bulbos_12072015
Fig. 10. Histograms of the oxygen abundance (top), nitrogen–to–oxygen ratio (middle) and ionisation parameter (U, bottom), as calcu-lated with the Pérez-Montero (2014) method for all non–AGN barredand unbarred galaxies of the sample. The number of objects in eachsubsample and the P–values from the A–D test are shown below thelegend. Only non–AGN galaxies are considered.
7. Star formation rate
We have estimated the star formation rate (SFR) in the galaxycentres from the Hα extinction–corrected emission within the 3′′SDSS fibres and the Kennicutt (1998) conversion factor10. Thedistances to the galaxies have been estimated from the redshiftgiven by SDSS and a Hubble constant of 72 km s−1 Mpc−1.
Given the redshift range of the galaxy sample, the SDSS 3′′diameter fibre corresponds to a projected size ranging from ∼1.2to 4.2 kpc. Although the redshift range is small and the redshiftdistributions of barred and unbarred galaxies are similar, we have
10 The stellar component had already been subtracted from the originalSDSS spectra and therefore we do not have to correct for stellar absorp-tion under the Balmer lines at this point.
Fig. 11. Comparative histograms of star formation rate per unit area forall non–AGN barred (yellow hatched) and unbarred (purple) galaxies ofthe sample.
derived star formation rates per unit area, ΣS FR, in order to aver-age out possible dependences on galaxy distance.
The distributions of the logarithm ΣS FR for barred and un-barred galaxies are shown in Fig. 11. Both distributions are dif-ferent according to the A–D test (P–value < 0.1%) and barredgalaxies show marginally larger star formation rate per unit area.This difference is slightly larger when considering only star–forming galaxies, where barred galaxies show a median log ΣS FRwhich is ∼0.3 dex larger than unbarred galaxies.
A larger SFR in the centres of barred galaxies was also re-ported by Ellison et al. (2011) for the galaxies of similar totalstellar mass from a similar study and by other authors (see e.g.Hummel et al. 1990; Ho et al. 1997b; Wang et al. 2012; Oh et al.2012; Zhou et al. 2015).
8. Electron density
The [S ii]λ6717/[S ii]λ6731 line ratio is sensitive to the electrondensity (Ne). Nearly 8% of all galaxies in our sample have a[S ii]λ6717/[S ii]λ6731 line ratio which is above the low–densitytheoretical limit (=1.43, implying Ne ∼1cm−1, for Te=10000KShaw & Dufour 1994). Most of these targets have the largest[S ii]λ6717/[S ii]λ6731 relative errors (∼20-40%). We are hereconsidering only galaxies in which their [S ii]λ6717/[S ii]λ6731line ratio value is still compatible with being below the low–density theoretical limit taking into account their correspondingerror bars (López-Hernández et al. 2013). The median value ofthis line ratio in the centres of the non–AGN galaxy sample is1.29±0.02 (1.30±0.02 for pure SF galaxies), which correspondsto Ne ∼ 100−150 cm−1. This is in agreement with typical valuesin centres of galaxies measured previously by Kennicutt et al.(1989) and Ho et al. (1997a). In Fig. 12 we compare the dis-tributions [S ii]λ6717/[S ii]λ6731 for barred and unbarred non–AGN galaxies. The median value is marginally lower for barred(1.25±0.03) than for unbarred galaxies (1.31±0.03), indicatingthat on average, barred galaxies tend to posses a larger centralelectron density than unbarred galaxies. The A–D test yields avery low P–value (0.05%), indicating that both distributions aredifferent. Distributions are also different in the subsample of purestar–forming galaxies (P–value of 0.7%, see Table 2).
Article number, page 10 of 23
E. Florido et al.: Central enhancement of nitrogen–to–oxygen abundance ratio in barred galaxies
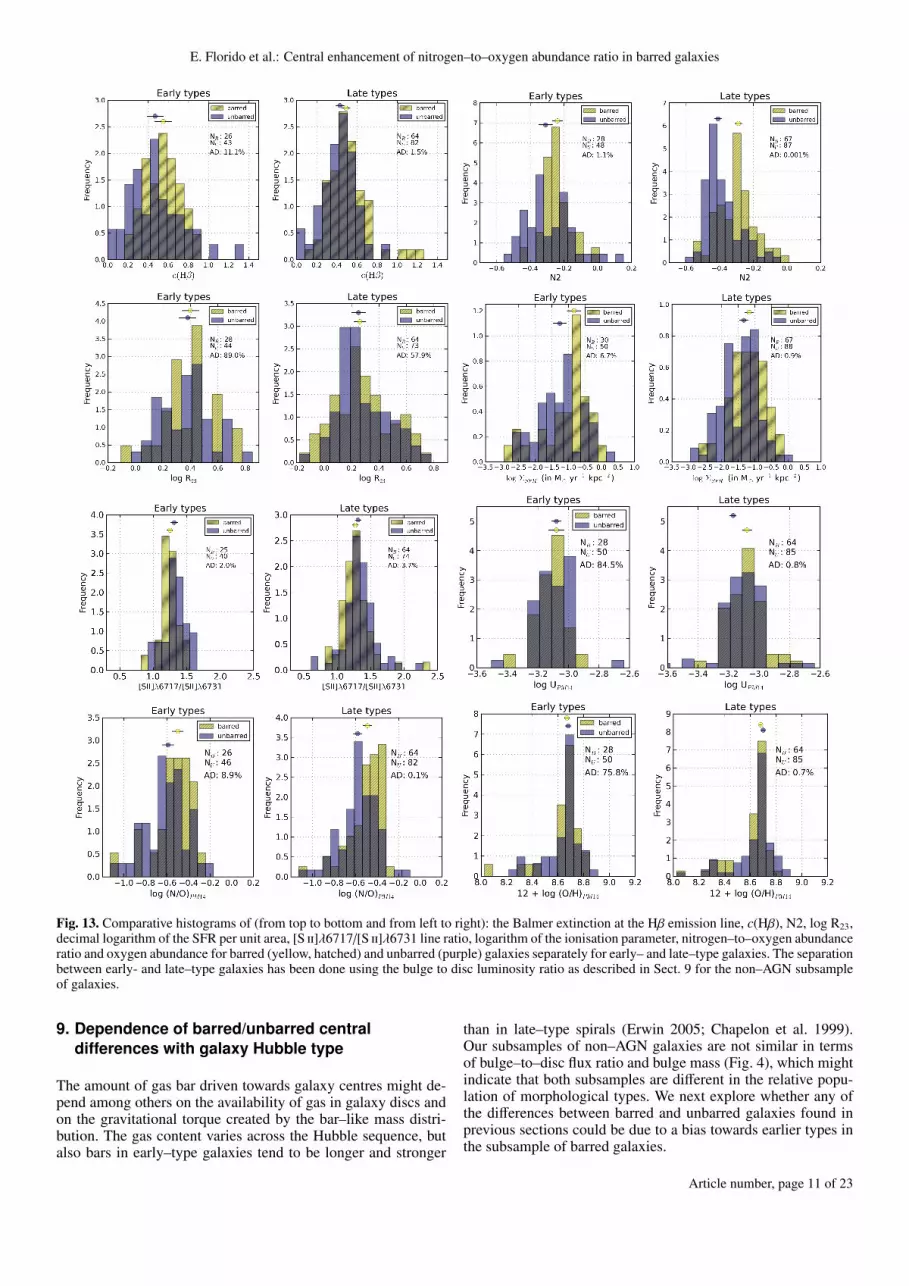
Fig. 13. Comparative histograms of (from top to bottom and from left to right): the Balmer extinction at the Hβ emission line, c(Hβ), N2, log R23,decimal logarithm of the SFR per unit area, [S ii]λ6717/[S ii]λ6731 line ratio, logarithm of the ionisation parameter, nitrogen–to–oxygen abundanceratio and oxygen abundance for barred (yellow, hatched) and unbarred (purple) galaxies separately for early– and late–type galaxies. The separationbetween early- and late–type galaxies has been done using the bulge to disc luminosity ratio as described in Sect. 9 for the non–AGN subsampleof galaxies.
9. Dependence of barred/unbarred centraldifferences with galaxy Hubble type
The amount of gas bar driven towards galaxy centres might de-pend among others on the availability of gas in galaxy discs andon the gravitational torque created by the bar–like mass distri-bution. The gas content varies across the Hubble sequence, butalso bars in early–type galaxies tend to be longer and stronger
than in late–type spirals (Erwin 2005; Chapelon et al. 1999).Our subsamples of non–AGN galaxies are not similar in termsof bulge–to–disc flux ratio and bulge mass (Fig. 4), which mightindicate that both subsamples are different in the relative popu-lation of morphological types. We next explore whether any ofthe differences between barred and unbarred galaxies found inprevious sections could be due to a bias towards earlier types inthe subsample of barred galaxies.
Article number, page 11 of 23

A&A proofs: manuscript no. bulbos_12072015
Table 3. Median values and errors (95% confidence interval of the median) of the distributions of c(Hβ), R23 and N2 gas metallicity indicators,star formation rate per unit area, [S ii]λ6717/[S ii]λ6731 line ratio, logarithm of the ionisation parameter, nitrogen–to–oxygen abundance ratio andoxygen abundance in the centres of barred and unbarred galaxies in the subsamples of early and late–type galaxies as defined in Sect. 9 and numberof galaxies in each subsample. Only non–AGN galaxies are considered. The P–values of the k–sample Anderson–Darling test for the comparisonof distributions for barred and unbarred galaxies is shown for all cases.
Early–type Late–type(based on B/D) (based on B/D)
P-value barred unbarred P-value barred unbarredmedian N median N median N median N
c(Hβ) 11.1% 0.55±0.08 26 0.47±0.08 43 1.5% 0.49±0.04 64 0.43±0.04 82log R23 89.0% 0.40±0.06 28 0.38±0.06 44 57.9% 0.26±0.04 64 0.25±0.05 73N2 1.1% -0.24±0.03 28 -0.31±0.04 48 0.001% -0.29±0.03 67 -0.41±0.01 87log ΣS FR 6.7% -0.8±0.2 30 -1.3±0.2 50 0.92% -1.17±0.12 67 -1.33±0.12 88[S ii]λ6717/[S ii]λ6731 2.0% 1.25±0.04 25 1.31±0.05 40 3.7% 1.27±0.04 64 1.31±0.04 74log U 85% -3.08±0.05 28 -3.08±0.03 50 0.8% -3.08±0.03 64 -3.17±0.02 85log (N/O) 8.9% -0.50±0.05 26 -0.59±0.05 46 0.05% -0.49±0.04 64 -0.58±0.04 8212+log (O/H) 76% 8.67±0.02 28 8.68±0.02 50 0.7% 8.68±0.01 64 8.70±0.01 85
Table 4. Same as Tables 2 and 3 but for the subsamples of low and high stellar mass bulges.
Mbulge < 109.7 M� Mbulge > 109.7 M�P-value barred unbarred P-value barred unbarred
median N median N median N median Nc(Hβ) 0.2% 0.46±0.03 50 0.42±0.04 68 58% 0.52±0.07 54 0.50±0.06 72log R23 49% 0.31±0.05 49 0.25±0.05 56 67% 0.34±0.06 56 0.35±0.05 74N2 0.001% -0.30±0.03 54 -0.43±0.02 68 3.0% -0.26±0.03 56 -0.33±0.04 84log ΣS FR 0.45% -1.15±0.13 54 -1.37±0.12 68 2.6% -0.99±0.17 58 -1.29±0.16 87[S ii]λ6717/[S ii]λ6731 0.97% 1.26±0.03 53 1.34±0.05 57 2.0% 1.25±0.05 51 1.31±0.03 70log U 2.9% -3.08±0.03 51 -3.18±0.02 65 54% -3.07±0.03 56 -3.09±0.03 86log (N/O) 0.3% -0.51±0.04 52 -0.63±0.04 63 0.3% -0.47±0.04 53 -0.56±0.03 8012+log (O/H) 0.9% 8.69±0.01 51 8.70±0.02 65 43% 8.67±0.02 56 8.67±0.01 86
Fig. 12. Comparative histograms of values of the [S ii]λ6717/[S ii]λ6731line ratio for barred (yellow hatched) and unbarred (purple) galaxiesseparately. Only non–AGN galaxies are considered.
The fact that most of the differences between barred and un-barred galaxies of the non–AGN subsample are also observedin the pure star–forming subsample, where the distribution ofbulge mass and bulge–to–disc flux ratio (hereinafter B/D) areequivalent for barred and unbarred galaxies (Fig. 5), seems toindicate that, even if a bias were present, bars tend to producehigher dust concentrations, larger N/O ratios, star formation andelectron densities in the centre of galaxies. A deeper analysis is
in any case necessary in order to disentangle the nature of thesedifferences.
Morphological classification is only available for ∼46% ofthe total galaxy sample, i.e. 245 galaxies of which 113 are barredand 132 unbarred. This classification comes from the Nair &Abraham (2010) catalogue. However, morphological decompo-sition of the galaxy sample has already been performed using thecode BUDDA v2.111 (de Souza et al. 2004; Gadotti 2008, 2009)which is able to fit up to four different galactic components (abulge with a Sèrsic profile, a single or double exponential disc,a Sèrsic bar and a Moffat central component) to a galaxy image.The morphological decomposition of the galaxies of this sam-ple was performed over SDSS g, r and i–band images (Gadotti2009) and the B/D flux ratios for the three photometric bandswere therefore obtained.
The behaviour of the B/D flux ratio along the Hubble se-quence is well known. However, this relation has a high disper-sion and strongly varies depending on the function used to fitthe bulge (R1/4 vs. Sèrsic R1/n), on the photometric band or onthe galaxy inclination and dust–extinction (see Graham & Wor-ley 2008, and references therein). We have analysed the depen-dence of the logarithm of the g, r and i–band B/D light ratios ob-tained with BUDDA (Gadotti 2009) with the T–type by Nair &Abraham (2010) for the galaxies in common between both sam-ples. From these relations and additional information from theGalaxy–Zoo2 catalogue (Willett et al. 2013), we have separatedall galaxies in our sample into early (T-type< 2) and late–types
11 http://www.sc.eso.org/∼dgadotti/budda.html
Article number, page 12 of 23

E. Florido et al.: Central enhancement of nitrogen–to–oxygen abundance ratio in barred galaxies
(T–type> 2). For more information on this separation we referthe reader to Appendix A.
The bulge stellar light and therefore its mass, has beenclaimed as a key parameter that might distinguish galaxies acrossthe Hubble sequence (see e.g. Meisels & Ostriker 1984; Gra-ham & Worley 2008, and references therein). In addition to theB/D light ratios we have also used the bulge mass (Coelho& Gadotti 2011) to explore whether the observed differencesbetween barred and unbarred galaxies are dependent on Hub-ble types. We have separated all non–AGN galaxies into twogroups attending to their bulge mass. The dividing bulge mass(109.7 M�) has been selected to ensure that the total stellar galaxymass distributions for barred and unbarred galaxies are equiva-lent in both bulge mass bins (with AD P–values greater than10%).
Fig. 13 and Table 3 show a comparison of central proper-ties between barred and unbarred galaxies separately for early-and late–type disc galaxies (using B/D light ratios as explainedabove). The same comparison is made in Fig. 14 and Table 4 forgalaxies with bulge mass below than 109.7M� and bulge masseslarger or equal than 109.7 M�. It can be seen that for galaxies withlater types (or less massive bulges) the distributions of all param-eters except log R23 are different between barred and unbarredgalaxies, with AD P–values lower than 4% in all cases. For ear-lier type galaxies results depend on whether we split galaxiesattending to B/D light ratios or bulge mass. Barred and unbarredearlier type galaxies (according to B/D) only show different dis-tributions for N2 and the [S ii]λ6717/[S ii]λ6731 emission–lineratio, while for galaxies with bulge mass above 109.7M�, in ad-dition to those parameters, we also find different distributions forΣS FR and log (N/O).
Barred galaxies tend to have on average larger centralBalmer Hβ extinction, larger values of the N2 metallicity indi-cator, SFR per unit area, electron densities and N/O abundanceratio than unbarred galaxies in all subsamples. However, takinginto account the uncertainties in the median values, we can notclaim real differences in average values between those parame-ters in barred and unbarred galaxies, apart from the N2 param-eter and the N/O abundance ratio. N2 is clearly larger in barredlate–type (by ∼0.12 dex) and lower bulge-mass (by ∼0.13 dex)galaxies with respect to unbarred galaxies, while this differenceis smaller (∼0.07 dex) but still significant in the early–type andhigher bulge mass subsample. These barred/unbarred differencesin N2 translate in a larger N/O abundance ratio in barred galax-ies by ∼ 0.12 dex in low bulge-mass galaxies, and ∼ 0.09 dex, inearly–type, late–type and higher bulge–mass subsamples.
Finally, if we restrict our comparative analysis ofbarred/unbarred galaxies to pure star–forming galaxies, we findthe same result as with the non-AGN galaxies: late–type galax-ies differ in central properties depending on whether they haveor not a bar, with barred galaxies exhibiting larger ΣS FR, c(Hβ),N2, log (N/O) and log U, and lower [S ii]λ6717/[S ii]λ6731 thanunbarred galaxies. Also, similarly to the non–AGN sample, thedistribution of 12 + log (O/H) is different between barred andunbarred late type galaxies and those with smaller bulge mass,with a marginally larger oxygen abundance in unbarred with re-spect to barred galaxies. The results for late–type galaxies inboth the pure star–forming and non–AGN samples, only dif-fer for log R23 which shows a different distribution for barredand unbarred galaxies in the SF sample (although with identicalmedian values). However, in the non–AGN sample the distribu-tions are identical in barred/unbarred galaxies (P–value 58%).The number statistics are poorer for SF galaxies, but it shows
that the inclusion of the transition objects is not dominating ourmain results. We will further comment about this in Sect. 12.
In summary, we observe statistically significant differencesin distributions of parameters for barred and unbarred galaxies inour later–type galaxy subsample regardless of whether we selectthem according to their predicted T–type (from their B/D lightratio) or their bulge mass. These appear in all parameters exceptin the metallicity tracer R23.
Median values are only marginally different in most pa-rameters (except in N2 and log (N/O)), but they point towardsa larger ΣS FR, c(Hβ), N2, log (N/O) and log U, and lower[S ii]λ6717/[S ii]λ6731 in barred galaxies. Results for earlier–type galaxies depend on whether we select them attending toB/D light ratio or bulge mass, but with both splitting criteria thedistributions of N2 and [S ii]λ6717/[S ii]λ6731 are significantlydifferent between barred and unbarred galaxies. The differencein the median value of N2 for barred and unbarred galaxies isslightly smaller than in later–type galaxies but still significant.
10. Barred/unbarred difference trends with totalgalaxy and bulge mass
Previous authors found observational evidence that massivebarred galaxies have a higher current central star formation ratethan unbarred galaxies of the same stellar mass (Ellison et al.2011). On the other hand, we have seen above that the effect ofbars in the galaxy centres seems to be stronger or more visiblein galaxies with lower bulge mass even when the barred and un-barred subsamples have been created to have indistinguishabletotal stellar mass distributions.
In order to better inspect our own and previous author re-sults, we have created a series of boxplots showing the vari-ation of all parameters as a function of bulge and total stel-lar mass. Boxplots are an useful representation in our case, assample sizes are not big enough to explore parameter depen-dences using histograms. Fig. 16 shows boxplots for c(Hβ), N2,log R23, ΣS FR, [S ii]λ6717/[S ii]λ6731, log U, N/O and oxygenabundance as a function of total galaxy stellar mass. See captionof this figure for a description on basic boxplots features. It isclear from these plots that for the most massive galaxies there isonly significant difference between barred and unbarred galax-ies for the N/O abundance ratio. The most massive galaxies arealso the galaxies with more massive bulges, and this result sim-ply confirms the results from Sect. 9. For less massive galaxies(M? . 1010.8 M�), N2 and ΣS FR are clearly higher for barredthan for unbarred galaxies with non–overlapping box–notchesbetween barred and unbarred galaxies in the two lowest mass in-tervals. Our results are therefore only partially in agreement withEllison et al. (2011). We do find a larger fibre SFR in barredgalaxies above 1010 M�, but we do not see differences in SFRbetween barred and unbarred galaxies above ∼1010.8 M�.
The differences between barred and unbarred galaxies areundoubtedly better correlated with bulge stellar mass (seeFig. 17). All properties (except R23, log U and 12+log (O/H))are significantly different between barred and unbarred galax-ies for bulge masses . 1010.0 M�, but differences normally in-crease towards lower bulge masses, except for c(Hβ) in the low-est mass bin, in which the median values are similar within er-rors for both types of galaxies. The observed differences go al-ways in the sense that barred galaxies present larger dust extinc-tion, star formation rate per unit area, [N ii]/Hα line ratio, lower[S ii]λ6717/[S ii]λ6731 (indicating a higher electron density) andlarger log (N/O) and log U in their centres.
Article number, page 13 of 23

A&A proofs: manuscript no. bulbos_12072015
Fig. 14. Comparative histograms of (from top to bottom and from left to right): the Balmer extinction at the Hβ emission line, c(Hβ), R23,N2, logarithm of the ionisation parameter, logarithm of the SFR per unit area, the [S ii]λ6717/[S ii]λ6731 line ratio, logarithm of the ionisationparameter, nitrogen–to–oxygen abundance ratio, and oxygen abundance for barred (yellow, hatched) and unbarred (purple) galaxies separately fornon-AGN galaxies with bulge mass lower than 109.7 M� and for galaxies with heavier bulges (& 109.7 M�).
We note also that the SFR per unit area is also larger in av-erage for barred galaxies in the highest bulge mass bin. How-ever, as mentioned above, we do not see differences in ΣS FR be-tween barred and unbarred galaxies in the most massive galax-ies (Fig. 16). This is probably due to the fact that bulge massesof barred galaxies are lower than in unbarred galaxies for the
most massive galaxies (Fig. 15), as already pointed by Coelho &Gadotti (2011).
More massive bulges are typically classical bulges, with Sèr-sic indexes higher than ∼2.5, in contrast with the so calledpseudo–bulges, whose surface brightness profile is better fittedwith lower Sèrsic indexes and which are typically less massive
Article number, page 14 of 23

E. Florido et al.: Central enhancement of nitrogen–to–oxygen abundance ratio in barred galaxies
Fig. 16. Boxplots showing the distribution in c(Hβ), N2 =log([N ii]6583/Hα), R23, SFR per unit area and [S ii]λ6717/[S ii]λ6731 line ratio,decimal logarithm of the ionisation parameter, nitrogen–to–oxygen abundance ratio and oxygen abundance, as a function of the total galaxy stellarmass (M?) for barred (yellow boxes) and unbarred (purple) galaxies. Each box represent the data distribution for galaxies in a 0.42 dex interval oflogarithm in stellar mass centred at the abscissa axis values of the box position. Inside each box, the central horizontal black straight line marks themedian value. The lower and upper quartiles are represented by the outer edges of the boxes; i.e. the box length is equal to the inter–quartile range,and therefore the box encloses 50% of the data points. The notches mark the 95% confidence interval for the median value. The whiskers extendto the most extreme data point within 1.5 times the inter–quartile range. Galaxies that do not fall within the reach of the whiskers are consideredas outliers (yellow and purple circles for barred and unbarred galaxies respectively). The number of galaxies in each box, in order or increasingstellar mass, ranges from 35 to 39, 55 to 59 and 13 to 14 for barred galaxies, and from 57 to 64, 58 to 70, and 15 to 21, for unbarred galaxies.
than classical bulges (Gadotti 2009). We have also analysed thebarred/unbarred galaxy central properties as a function of Sèr-sic index. Barred and unbarred galaxies with large values of theSèrsic index (n&3.1) do not differ in their central ionised gasproperties, apart from the SFR, which seems to be enhanced inbarred galaxies, in agreement with the result found for barredgalaxies with the most massive bulges. However the global pa-rameter dependences with the Sèrsic index and the differencesbetween barred and unbarred galaxies are not as clear as withbulge mass or even total stellar mass.
11. Dependence on bar parameters
Previous sections show clear differences in the central ionisedgas properties between barred and unbarred galaxies. These dif-ferences imply that the gas flows induced by bars are able tomodify gas properties, specially in lower mass or lower bulgemass galaxies. Simulations predict a dependence of the gas in-flow rate with bar strength, with stronger bars supplying gas to-wards the centre at a higher rate (Athanassoula 1992; Regan &Teuben 2004). It is then natural to wonder whether these obser-vational enhancements are related to dynamical or structural barparameters.
Article number, page 15 of 23

A&A proofs: manuscript no. bulbos_12072015
Fig. 17. Same as Fig. 16 but as a function of the bulge mass. Each box represents the data distribution for galaxies in a 0.85 dex interval oflogarithm in bulge stellar mass centred at the abscissas values of the box position. The number of galaxies in each box, in order of increasingstellar bulge mass, ranges from 9 to 10, 66 to 71 and 28 to 32 for barred galaxies, and from 18 to 22, 70 to 81, and 28 to 32, for unbarred galaxies.
Fig. 15. Boxplot showing median values of bulge stellar mass for threedifferent bins in total galaxy stellar mass.
Morphological decomposition of the galaxy sample was per-formed by Gadotti (2009) and a number of structural parametersfor discs, bulges and bars (in the case of barred galaxies) are then
available. This allows for a comparison between parameters suchas bar ellipticity (as a proxy for bar strength) and bar strengthwith central ionised gas properties. Our results are presented andcompared with previous work in the next paragraphs.
We find weak trends for the SFR per unit area (ΣS FR) to in-crease with the bar effective radius, the bar semi–major axis nor-malised to the galaxy disc scale length or the bar ellipticity, butthe dispersion is high and the Spearman rank correlation coef-ficients (ρS ) are 0.28, 0.20 and 0.12 respectively. For other pa-rameters, such as the bar Sérsic index (which might be relatedto the bar age; Kim et al. 2014) ρS is lower than 0.1. This is inagreement with previous works on central SFRs from infraredemission (e.g. Pompea & Rieke 1990; Roussel et al. 2001), whodid not find evidence that stronger bars could produce a largerenhancement in SFRs. Ellison et al. (2011) in turn, did not findcorrelation between bar length and fibre SFR in the central re-gion of galaxies from SDSS optical spectra. However, other au-
Article number, page 16 of 23

E. Florido et al.: Central enhancement of nitrogen–to–oxygen abundance ratio in barred galaxies
thors did report a positive relation between central star formationand bar parameters, but their results are in some cases conflict-ing: Oh et al. (2012) report a higher effect of bars on central SFbut only for the reddest galaxies and the effects are more pro-nounced with increasing bar length. On the other hand, other au-thors (Wang et al. 2012) find that only strong bars can enhancecentral SF, but the degree of enhancement depends only on barellipticity, and not on bar size or bar mass, in agreement withZhou et al. (2015), who find a weak positive trend between SFRin bulges and an ellipticity–based bar strength parameter.
Several studies have also tried to confirm observationally theeffect of bars on the central oxygen abundance and on the ra-dial oxygen abundance gradient (see e.g. Florido et al. 2012, andreferences therein), but results are also conflicting. For exam-ple, there is disagreement on whether bars produce a larger oxy-gen abundance in galaxy centres (e.g. Ellison et al. 2011), equalthan in unbarred galaxies (e.g. Chapelon et al. 1999; Cacho et al.2014) or whether O/H is lower in barred galaxies than in galaxieswithout a stellar bar (Considère et al. 2000; Dutil & Roy 1999).However there seems to be a consensus that neither central northe O/H abundance gradient depend on bar strength (Chapelonet al. 1999; Considère et al. 2000; Cacho et al. 2014; Ellisonet al. 2011). Our results agree with previous work, as we alsofind no clear trend between 12+log(O/H) and bar parameters(effective radius, normalised length, ellipticity) with correlationcoefficients ρS lower than 0.2, with a slightly better correlationwith the bar boxiness (ρS =0.32).
We also find no correlation between the N/O abundance ratioand any bar parameter, with ρS lower than 0.1 in all cases, withthe exception of a weak trend for the N/O to increase with the bareffective radius (ρS =0.15). c(Hβ) and the [S ii]λ6717/[S ii]λ6731emission line ratio do not show any clear dependence on barparameters either (ρS .0.2).
12. Discussion
In this paper we comparatively analyse the properties of theionised gas in the centres of disc galaxies that possess a stel-lar bar, with those without a bar structure. Our analysis is basedon SDSS spectra.
The SDSS fibre size (3′′) and our face–on galaxy sample red-shift range (0.02 6 z 6 0.07) implies that in this work we areanalysing emission of the ionised gas located within galactocen-tric radii between approximately 0.6 and 2.1 kpc. The ionisedgas emitting regions located at these galactocentric distancesare usually termed as nuclear H ii regions or H ii region nu-cleus when they are located in the immediate neighbourhood of agalactic centre, and hotspots or circumnuclear H ii regions whenthese regions surround the galaxy centre, frequently arranged ina ring or pseudo–ring shape (see e.g. Kennicutt et al. 1989; Hoet al. 1997a; Díaz et al. 2007). The spectroscopic studies of nu-clear and circumnuclear spatially resolved H ii regions are stilllimited to a small number of targets. These have focussed theattention of previous in depth spectroscopic studies but mainlywith the aim of comparing its physical and stellar content prop-erties with those of normal disc H ii regions (see e.g. Kennicuttet al. 1989; Ho et al. 1997a; Bresolin & Kennicutt 2002), study-ing differences in properties with host galaxy Hubble type (Hoet al. 1997a) and/or deriving chemical abundances for these re-gions, expected to be the ones with highest metal content due toits location in the inner parts of spiral discs (Díaz et al. 2007;Dors et al. 2011). To our knowledge there is no published workso far comparing the properties of resolved nuclear and circum-
nuclear H ii regions in barred and unbarred galaxies for a largenumber of galaxies and in a systematic way.
Our derived values for internal Balmer extinction,[S ii]λ6717/[S ii]λ6731 ratio, oxygen abundance and N/Oratio are within the values quoted by authors analysing indi-vidual, resolved nuclear and circumnuclear H ii regions (e.g.Kennicutt et al. 1989; Bresolin & Kennicutt 2002; Díaz et al.2007; Dors et al. 2008).
Our result that the current star formation rate and elec-tron density (as traced by [S ii]λ6717/[S ii]λ6731) are alsolarger in barred systems is also in agreement with Ho et al.(1997b), who made a spectroscopic survey of the nuclei (usinga 2′′×4′′aperture) of nearly 500 nearby galaxies. In particular,they found a larger star formation rate only in barred galaxiesearlier than Sbc with respect to the unbarred counterparts, withno difference between barred and unbarred late–type spirals. Wealso find a larger average SFR per unit area in barred galaxiesin our early–type subsample (see Fig. 13) but the distributionsfor barred and unbarred galaxies are only marginally different,while the difference in both distributions is statistically differentfor the late–type galaxies, according to the AD test. We shouldremind the reader that the most significant differences betweenbarred and unbarred galaxies (in all gas properties) are obtainedfor lower bulge/total stellar mass galaxies (i.e. later–type galax-ies). The total stellar galaxy or bulge mass distribution for Hoet al. (1997b) galaxy sample is not shown and we can not furthercompare both results.
12.1. Enhanced [N ii]λ6583/Hα in centres of barred galaxies
The most striking difference between barred and unbarredgalaxies obtained in this work comes from the observed[N ii]λ6583/Hα emission line ratio.
An enhanced [N ii]λ6583/Hα emission line ratio in thegalaxy centres was first found by Stauffer (1982) and later bydifferent authors (see e.g. Kennicutt et al. 1989; Ho et al. 1997a;Sanchez et al. 2014). Ho et al. (1997a) analysed the integratedspectra of a sample of 206 galaxy nuclei. They reported thatearly–type galaxies had the largest [N ii]λ6583/Hα. Accordingto these authors, it might be an indication that nitrogen is se-lectively enriched in the centres of bulge–dominated galaxies.This is in agreement with the general trend found in this work(without distinction between barred and unbarred systems), asearly–type galaxies are also in average more massive and hostmore massive bulges than late–type galaxies (see Figs. 16 and17). In this work we go a step forward and show that this lineratio is larger in the centres of barred galaxies and that the bareffect in enhancing this line ratio is more important in galaxieswith less massive bulges.
A number of effects can enhance the [N ii]λ6583 to Hα emis-sion line ratio, namely the nitrogen excitation by a differentsource to photoionisation (i.e. AGN or shocks), which enhancesthe [N ii] emission with respect to emission from recombinationlines, and a larger abundance of nitrogen atoms with respect tooxygen.
We will now analyse these cases separately. We have usedthe criteria by Kewley et al. (2001) based on the [O iii]λ5007/Hβvs. [N ii]λ6583/Hα to remove AGN from the galaxy sample. Thisseparation criteria allows for objects of the composite area to beincluded, which may add a number of galaxies in which shocksor an AGN can enhance the [N ii]λ6583 emission, but also purephotoionised objects with high N/O ratio (Pérez-Montero &Contini 2009). We remind the reader that pure SF galaxies alsoshow a significant difference in [N ii]λ6583/Hα between barred
Article number, page 17 of 23
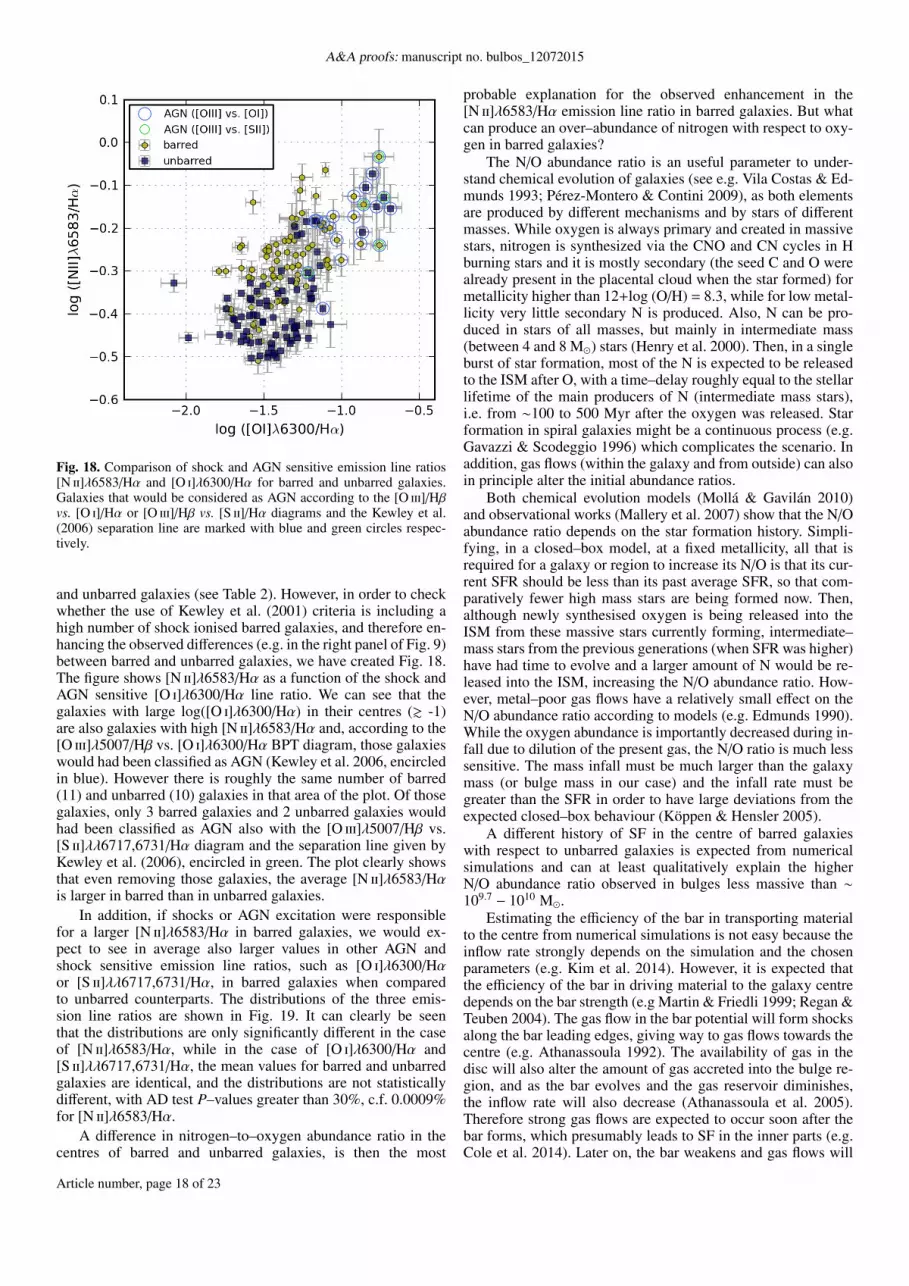
A&A proofs: manuscript no. bulbos_12072015
Fig. 18. Comparison of shock and AGN sensitive emission line ratios[N ii]λ6583/Hα and [O i]λ6300/Hα for barred and unbarred galaxies.Galaxies that would be considered as AGN according to the [O iii]/Hβvs. [O i]/Hα or [O iii]/Hβ vs. [S ii]/Hα diagrams and the Kewley et al.(2006) separation line are marked with blue and green circles respec-tively.
and unbarred galaxies (see Table 2). However, in order to checkwhether the use of Kewley et al. (2001) criteria is including ahigh number of shock ionised barred galaxies, and therefore en-hancing the observed differences (e.g. in the right panel of Fig. 9)between barred and unbarred galaxies, we have created Fig. 18.The figure shows [N ii]λ6583/Hα as a function of the shock andAGN sensitive [O i]λ6300/Hα line ratio. We can see that thegalaxies with large log([O i]λ6300/Hα) in their centres (& -1)are also galaxies with high [N ii]λ6583/Hα and, according to the[O iii]λ5007/Hβ vs. [O i]λ6300/Hα BPT diagram, those galaxieswould had been classified as AGN (Kewley et al. 2006, encircledin blue). However there is roughly the same number of barred(11) and unbarred (10) galaxies in that area of the plot. Of thosegalaxies, only 3 barred galaxies and 2 unbarred galaxies wouldhad been classified as AGN also with the [O iii]λ5007/Hβ vs.[S ii]λλ6717,6731/Hα diagram and the separation line given byKewley et al. (2006), encircled in green. The plot clearly showsthat even removing those galaxies, the average [N ii]λ6583/Hαis larger in barred than in unbarred galaxies.
In addition, if shocks or AGN excitation were responsiblefor a larger [N ii]λ6583/Hα in barred galaxies, we would ex-pect to see in average also larger values in other AGN andshock sensitive emission line ratios, such as [O i]λ6300/Hαor [S ii]λλ6717,6731/Hα, in barred galaxies when comparedto unbarred counterparts. The distributions of the three emis-sion line ratios are shown in Fig. 19. It can clearly be seenthat the distributions are only significantly different in the caseof [N ii]λ6583/Hα, while in the case of [O i]λ6300/Hα and[S ii]λλ6717,6731/Hα, the mean values for barred and unbarredgalaxies are identical, and the distributions are not statisticallydifferent, with AD test P–values greater than 30%, c.f. 0.0009%for [N ii]λ6583/Hα.
A difference in nitrogen–to–oxygen abundance ratio in thecentres of barred and unbarred galaxies, is then the most
probable explanation for the observed enhancement in the[N ii]λ6583/Hα emission line ratio in barred galaxies. But whatcan produce an over–abundance of nitrogen with respect to oxy-gen in barred galaxies?
The N/O abundance ratio is an useful parameter to under-stand chemical evolution of galaxies (see e.g. Vila Costas & Ed-munds 1993; Pérez-Montero & Contini 2009), as both elementsare produced by different mechanisms and by stars of differentmasses. While oxygen is always primary and created in massivestars, nitrogen is synthesized via the CNO and CN cycles in Hburning stars and it is mostly secondary (the seed C and O werealready present in the placental cloud when the star formed) formetallicity higher than 12+log (O/H) = 8.3, while for low metal-licity very little secondary N is produced. Also, N can be pro-duced in stars of all masses, but mainly in intermediate mass(between 4 and 8 M�) stars (Henry et al. 2000). Then, in a singleburst of star formation, most of the N is expected to be releasedto the ISM after O, with a time–delay roughly equal to the stellarlifetime of the main producers of N (intermediate mass stars),i.e. from ∼100 to 500 Myr after the oxygen was released. Starformation in spiral galaxies might be a continuous process (e.g.Gavazzi & Scodeggio 1996) which complicates the scenario. Inaddition, gas flows (within the galaxy and from outside) can alsoin principle alter the initial abundance ratios.
Both chemical evolution models (Mollá & Gavilán 2010)and observational works (Mallery et al. 2007) show that the N/Oabundance ratio depends on the star formation history. Simpli-fying, in a closed–box model, at a fixed metallicity, all that isrequired for a galaxy or region to increase its N/O is that its cur-rent SFR should be less than its past average SFR, so that com-paratively fewer high mass stars are being formed now. Then,although newly synthesised oxygen is being released into theISM from these massive stars currently forming, intermediate–mass stars from the previous generations (when SFR was higher)have had time to evolve and a larger amount of N would be re-leased into the ISM, increasing the N/O abundance ratio. How-ever, metal–poor gas flows have a relatively small effect on theN/O abundance ratio according to models (e.g. Edmunds 1990).While the oxygen abundance is importantly decreased during in-fall due to dilution of the present gas, the N/O ratio is much lesssensitive. The mass infall must be much larger than the galaxymass (or bulge mass in our case) and the infall rate must begreater than the SFR in order to have large deviations from theexpected closed–box behaviour (Köppen & Hensler 2005).
A different history of SF in the centre of barred galaxieswith respect to unbarred galaxies is expected from numericalsimulations and can at least qualitatively explain the higherN/O abundance ratio observed in bulges less massive than ∼109.7 − 1010 M�.
Estimating the efficiency of the bar in transporting materialto the centre from numerical simulations is not easy because theinflow rate strongly depends on the simulation and the chosenparameters (e.g. Kim et al. 2014). However, it is expected thatthe efficiency of the bar in driving material to the galaxy centredepends on the bar strength (e.g Martin & Friedli 1999; Regan &Teuben 2004). The gas flow in the bar potential will form shocksalong the bar leading edges, giving way to gas flows towards thecentre (e.g. Athanassoula 1992). The availability of gas in thedisc will also alter the amount of gas accreted into the bulge re-gion, and as the bar evolves and the gas reservoir diminishes,the inflow rate will also decrease (Athanassoula et al. 2005).Therefore strong gas flows are expected to occur soon after thebar forms, which presumably leads to SF in the inner parts (e.g.Cole et al. 2014). Later on, the bar weakens and gas flows will
Article number, page 18 of 23

E. Florido et al.: Central enhancement of nitrogen–to–oxygen abundance ratio in barred galaxies
Fig. 19. Histograms showing the distribution of AGN and shock sensitive emission line ratios (from left to right: [N ii]λ6583/Hα,[S ii]λλ6717,6731/Hα and [O i]λ6300/Hα) for barred and unbarred galaxies separately. All galaxies classified as non-AGN are included (seeSec. 4). The barred/unbarred distributions are only different for [N ii]λ6583/Hα, and therefore the source of the differences in that line ratiomust be other than shock ionisation and/or AGN contamination alone.
still transport material towards the central regions, where it canform stars, but at a lower rate and, according to chemical evolu-tion models, this could explain the high N/O in barred galaxieswith respect to unbarred galaxies. Apart from bars, other mech-anisms can produce gas flows towards the centre of the galaxies(holding or not a bar), for example tidal forces by an interactingcompanion (e.g. Cox et al. 2008) or asymmetric structures likespiral arms (e.g. Kormendy & Kennicutt 2004), but these mightbe more sporadic, not producing a continuous flow as in the caseof barred galaxies.
Late–type galaxies have a large reservoir of gas and cantherefore supply a large amount of gas towards the centres, giventhat a considerably strong bar is present. This is not the case forbulge–dominated galaxies, and this might be, at least partially,one of the reasons why differences between barred and unbarredgalaxies are smaller or non–existent in galaxies with massivebulges (& 1010 M�). The fact that we do not find differencesin central N/O abundance ratio in the most massive bulges couldbe indicating that bar effects on central gas properties either arenegligible (maybe because there is not much gas in the disc tofeed the inner parts) or invisible, maybe because there is anotherand more important and dominant mechanism that masks the ex-pected bar effects.
In any case, for massive bulges (which are also the ones withlarger N/O abundance ratio, see Fig. 17) it would be more com-plicated to detect an increase in N/O in barred galaxies. The rea-son is that in this scenario of the time–delay in the ejection ofN, at high abundances the increase in the N/O abundance ra-tio is smaller (Coziol et al. 1999). However, the fact that wedo not see differences in other properties (c(Hβ), 12+log (O/H),log U) or that the differences are smaller (as with ΣS FR or[S ii]λ6717/[S ii]λ6731) in the high bulge mass range, points to-wards a different bulge origin, formation or evolutionary process,dependent on bulge mass (or total galaxy stellar mass).
Bulges are usually classified in two different types: disc–likebulges or pseudo–bulges and classical bulges. The former aregenerally less massive than classical bulges, and are more com-mon among late–type galaxies. The formation of classical bulgesis thought to be faster and normally externally driven, by meansof gravitational collapse or hierarchical merging of smaller ob-jects (see e.g. Gadotti 2009 or Athanassoula 2005 for details onthe formation mechanisms for the different types), while disc–like bulges are thought to be formed by internal secular pro-
cesses, predominantly driven by bars (e.g. Kormendy & Ken-nicutt 2004; Athanassoula 2005).
There is observational evidence for a delay in the bar for-mation for less massive galaxies (Sheth et al. 2012). Therefore,both bars and bulges in massive galaxies, as mentioned before,form at earlier times. These bulges might be classical as theyform in more violent environments, with more gas and largermerger rates. Recent numerical simulations (Kraljic et al. 2012)show that the formation of bulges in spiral galaxies is influencedby the bar presence. They find an over abundance of star for-mation in the bulge for barred galaxies after the bar forms. It isthen possible that the difference observed in the central stellarmetallicities of massive galaxies Coelho & Gadotti (2011) is setat the time when the bar forms, and consumes and redistributesmost of the gas. This would be compatible with the frequent co-existence of both type of bulges in the centres of galaxies asobserved in previous works (Peletier et al. 2007; Méndez-Abreuet al. 2014; Erwin et al. 2015). In this scenario, low mass sys-tems will not develop a massive classical bulge, and the bar willform at later times. Furthermore, the central gas accretion willlast longer, secularly forming disc–like bulges in barred galax-ies. This would generate a difference in the ionised gas proper-ties between barred and unbarred low mass systems as observedin the present work.
Therefore our result that central properties of ionised gasdiffer predominantly in galaxies with lower mass bulges, givesstrength to a different origin or evolutionary process for less andmore massive bulges, with the gaseous phase of the former hav-ing currently a closer relation with bars.
12.2. Comparison with recent works
Several works have tried to find observational evidence for theeffect of gas flows by analysing the gas content, SFRs and/ormetallicities in galaxy centres (e.g. Ho et al. 1997b; Martin &Friedli 1999) but results were inconclusive, in part because theseworks were carried out with small data samples and sample se-lections could have introduced biased results due to well knownnow relations between the analysed gas properties with Hubbletype and/or total stellar mass. In an effort to circumvent theseproblems, more recently Ellison et al. (2011) and Cacho et al.(2014) have comparatively analysed gaseous–phase metallici-ties and SFRs in the centres of barred and unbarred galaxies inlarge samples (from ∼900 to 1500 galaxies respectively) by us-
Article number, page 19 of 23

A&A proofs: manuscript no. bulbos_12072015
ing SDSS spectra. In both cases the galaxy samples have beentaken from the catalogue of Nair & Abraham (2010)12, requiringaxial ratios b/a > 0.4 (i.e. i 6 68◦, c.f. to 26◦ in our sample) andredshift range z 6 0.06 and z < 0.1 in Ellison et al. (2011) andCacho et al. (2014), respectively. Special care was taken by theseauthors to avoid biases due to differences in inclination, redshiftand stellar mass between their barred and unbarred galaxy sam-ples. However, and in spite of the similarity in their samplesand in the data analysis, they find different results. While Elli-son et al. (2011) find that the SFR and the oxygen abundancein the galaxy centres are considerably larger in barred galaxiesmore massive than 1010 M� with respect to unbarred galaxies ofthe same mass, Cacho et al. (2014) do not find statistically sig-nificant differences between barred and unbarred galaxies, but atrend (which decreases with increasing mass) in their early–typesubsample, for barred galaxies to exhibit a larger 12+log (O/H)than unbarred galaxies.
The study presented here is in apparent disagreement withboth Ellison et al. (2011) and Cacho et al. (2014), as we dofind significant differences between barred and unbarred galax-ies, but we do not see differences in the oxygen abundance be-tween barred and unbarred galaxies. However, our results canexplain in a large extend the disagreement of Ellison et al. (2011)and Cacho et al. (2014) results among themselves and with ours.It mostly comes from the way in which star–forming galaxiesare selected and the empirical calibration used to obtain oxygenabundances. Cacho et al. (2014) use Kauffmann et al. (2003a) toseparate star–forming dominated from active galaxies, which re-jects galaxies from the transition area, where pure star–forminggalaxies with high nitrogen abundance are expected to be located(e.g. Pérez-Montero & Contini 2009). Ellison et al. (2011) andourselves use Kewley et al. (2001) and therefore include transi-tion objects in our analysis and our samples are then expected tocontain more nitrogen–rich galaxy centres. In addition, Ellisonet al. (2011) use the [N ii]/[O ii] empirical calibration (Kewley& Dopita 2002) to obtain 12+log (O/H), which depends on theN/O abundance. We believe their reported larger 12+log (O/H)in barred galaxies might be indicating a larger N/O abundanceratio in barred with respect to unbarred galaxies. Cacho et al.(2014) use the R23 parameter to obtain oxygen abundances, butlater on, in an effort to explain the differences with Ellison’s re-sults, they apply the same empirical calibration as Ellison et al.(2011), [N ii]/[O ii]. With this calibration they also find larger12+log (O/H) in barred than in unbarred galaxies, but the dif-ference is not as significant as in Ellison et al. (2011) becausetheir sample lacks a significant number of nitrogen rich galaxiesas explained above. We also get larger 12+log (O/H) in barredgalaxies when using empirical calibrations involving [N ii]λ6584such as the ones given by Pettini & Pagel (2004); Kewley & Do-pita (2002) or Bresolin (2007), but no difference when R23 or thePérez-Montero (2014) method is used, as described in Sec. 6.
Finally, we would like to mention that the fact that Ellisonet al. (2011) only find differences in the most massive galaxiesof their sample (M? & 1010 M�) does not contradict our results,as our galaxy sample contains galaxies precisely more massivethan 1010 M�. Our results do differ in that we do not find differ-ences between barred and unbarred galaxies more massive than∼1010.8 M�, while Ellison et al. (2011) finds larger SFRs and12+log (O/H) up to their upper limit mass (∼1011.2 M�).
We believe that the results presented here are showing thefootprints of bar–induced secular evolution of galaxies in thecentral gaseous component, which seems to be either more ef-
12 Bars are visually classified in the Nair & Abraham (2010) catalogue.
ficient or more relevant in galaxies with less massive bulges (i.e.later type galaxies), at least regarding the current central proper-ties of the gas.
13. Summary and conclusions
We have analysed the properties of the ionised gas in the cen-tre of a sample containing 251 and 324 barred and unbarredface–on galaxies respectively (173 and 265 after removing AGN,Kewley et al. 2001) of total stellar masses between 1010 and1011.2M�, where both subsamples have the same total galaxystellar mass and redshift distributions. We have compared thedistributions of internal extinction at Hβ, SFR per unit area(ΣS FR), [S ii]λλ6717,6731 emission line ratio, empirical trac-ers of oxygen abundance (R23 and N2=[N ii]λ6854/Hα), oxy-gen abundance, nitrogen–to–oxygen abundance ratio and ioni-sation parameters, for barred and unbarred galaxies separately.Our main conclusions are:
– The whole non–AGN barred galaxy sample has statis-tically significant different distributions of c(Hβ), ΣS FR,[S ii]λλ6717,6731, N2 and log(N/O) in their centres with re-spect to unbarred galaxies. The differences are remarkablyevident in N2 and log(N/O), which are ∼0.1 dex larger inbarred than in unbarred galaxies. Barred galaxies also tendto have larger central internal extinction, ΣS FR, and electrondensity than unbarred galaxies, but in these cases the differ-ences in median values between both distributions are withinerrors. We do not find differences between barred and un-barred galaxies neither in the central value of the R23 param-eter, nor in 12+log (O/H) as determined from Pérez-Montero(2014) grids of photoionisation models.
– When be split our sample into earlier and later types (ac-cording to their B/D light ratio or their bulge mass), the dif-ferences enhance towards later type galaxies. Specially sig-nificant is the difference in N2, which is ∼0.13 dex larger inlate–type barred with respect to unbarred galaxies, against adifference of ∼0.07 dex between barred and unbarred galax-ies in the earlier–type subsample. This difference in N2 trans-lates in a difference in N/O abundance ratio of 0.09 - 0.12 dexfrom photoionisation models.With this separation into earlier and later types, the oxy-gen abundance distribution appears to be different in barredand unbarred late–type galaxies, with a slightly larger me-dian value for unbarred galaxies. There is no difference in12+log (O/H) between barred and unbarred galaxies in theearly–type subsample. In addition to 12+log (O/H), barredand unbarred early–type galaxies seems to have similar cen-tral c(Hβ), R23 and log U. The distributions of ΣS FR and N/Oare different in barred and unbarred early–type galaxies (to-wards larger values in barred galaxies) depending on the waywe separate early from late type galaxies.
– We have explored the above barred/unbarred parameter dif-ferences in terms of the galaxy total and bulge stellar mass.These increase towards galaxies with lower mass systemsand seem to correlate better with bulge mass except for theSFR per unit area, which seems to have a stronger depen-dence with total galaxy stellar mass.
– We find no clear relation between the central ionised gasproperties in barred galaxies and the bar structural param-eters (effective radius, bar length, ellipticity or bar Sèrsic in-dex), but weak trends for the central ΣS FR to increase withbar effective length.
Article number, page 20 of 23

E. Florido et al.: Central enhancement of nitrogen–to–oxygen abundance ratio in barred galaxies
– The differences observed between barred and unbarredgalaxies can qualitatively be explained with current knowl-edge on bar evolution simulations and chemical evolutionmodels.
Taking all together, our results imply that bars do alter theproperties of the central ionised gas of galaxies, increasing theirelectron density, internal extinction, SFR per unit area, and verynotably the N/O abundance ratio. These bar effects on centralionised gas are more visible in later type galaxies, or more pre-cisely, in those with bulges less massive than ∼ 1010 M�.
This work presents one of the clearest observational evi-dences so far for the effects of bars in galaxy centres. It alsoemphasizes (1) the usefulness of the nitrogen–to–oxygen abun-dance ratio, which gives important clues on the star formationhistory of galaxy centres, and (2) the risk of using certain empir-ical calibrations for oxygen abundance estimations, which canmask a high N/O under a fake high O abundance.Acknowledgements. We acknowledge Joerg Dietrich for kindly sharing with ushis python script to perform the k–sample Anderson-Darling test and WilliamSchoenell for help in understanding STARLIGHT output spectra. This work hasbeen supported by MICINN of Spain via grants AYA2011-24728 (EF, IP andAZ), FPA2010-16802 (EF) and AYA2010-21887-C04-01 (EPM), and from the“Junta de Andalucía” local government through the FQM-108 project (AZ, IPand EF).
ReferencesAnderson, T. W. & Darling, D. A. 1954, Journal of the American Statistical As-
sociation, 49, 765Athanassoula, E. 1992, MNRAS, 259, 345Athanassoula, E. 2003, MNRAS, 341, 1179Athanassoula, E. 2005, MNRAS, 358, 1477Athanassoula, E., Lambert, J. C., & Dehnen, W. 2005, MNRAS, 363, 496Athanassoula, E., Machado, R. E. G., & Rodionov, S. A. 2013, MNRAS, 429,
1949Baldwin, J. A., Phillips, M. M., & Terlevich, R. 1981, PASP, 93, 5Barnes, J. E. & Hernquist, L. 1992, ARA&A, 30, 705Bothwell, M. S., Maiolino, R., Kennicutt, R., et al. 2013, MNRAS, 433, 1425Bournaud, F. & Combes, F. 2002, A&A, 392, 83Bresolin, F. 2007, ApJ, 656, 186Bresolin, F. & Kennicutt, Jr., R. C. 2002, ApJ, 572, 838Cacho, R., Sánchez-Blázquez, P., Gorgas, J., & Pérez, I. 2014, MNRAS, 442,
2496Calzetti, D., Armus, L., Bohlin, R. C., et al. 2000, ApJ, 533, 682Cardelli, J. A., Clayton, G. C., & Mathis, J. S. 1989, ApJ, 345, 245Chapelon, S., Contini, T., & Davoust, E. 1999, A&A, 345, 81Cheung, E., Athanassoula, E., Masters, K. L., et al. 2013, ApJ, 779, 162Cid Fernandes, R., Mateus, A., Sodré, L., Stasinska, G., & Gomes, J. M. 2005,
MNRAS, 358, 363Coelho, P. & Gadotti, D. A. 2011, ApJ, 743, L13Cole, D. R., Debattista, V. P., Erwin, P., Earp, S. W. F., & R., R. 2014, astro-ph,
100Considère, S., Coziol, R., Contini, T., & Davoust, E. 2000, A&A, 356, 89Coziol, R., Reyes, R. E. C., Considère, S., Davoust, E., & Contini, T. 1999, A&A,
345, 733de Souza, R. E., Gadotti, D. A., & dos Anjos, S. 2004, ApJS, 153, 411Denicoló, G., Terlevich, R., & Terlevich, E. 2002, MNRAS, 330, 69Díaz, Á. I., Terlevich, E., Castellanos, M., & Hägele, G. F. 2007, MNRAS, 382,
251Dors, Jr., O. L., Krabbe, A., Hägele, G. F., & Pérez-Montero, E. 2011, MNRAS,
415, 3616Dors, Jr., O. L., Storchi-Bergmann, T., Riffel, R. A., & Schimdt, A. A. 2008,
A&A, 482, 59Dutil, Y. & Roy, J.-R. 1999, ApJ, 516, 62Edmunds, M. G. 1990, MNRAS, 246, 678Edmunds, M. G. & Pagel, B. E. J. 1978, MNRAS, 185, 77PEllison, S. L., Nair, P., Patton, D. R., et al. 2011, MNRAS, 416, 2182Erwin, P. 2005, MNRAS, 364, 283Erwin, P., Saglia, R. P., Fabricius, M., et al. 2015, MNRAS, 446, 4039Florido, E., Pérez, I., Zurita, A., & Sánchez-Blázquez, P. 2012, A&A, 543, A150Friedli, D. & Benz, W. 1993, A&A, 268, 65Friedli, D., Benz, W., & Kennicutt, R. 1994, ApJ, 430, L105
Gadotti, D. A. 2008, MNRAS, 384, 420Gadotti, D. A. 2009, MNRAS, 393, 1531Gavazzi, G. & Scodeggio, M. 1996, A&A, 312, L29Graham, A. W. & Worley, C. C. 2008, MNRAS, 388, 1708Henry, R. B. C., Edmunds, M. G., & Köppen, J. 2000, ApJ, 541, 660Ho, L. C., Filippenko, A. V., & Sargent, W. L. W. 1997a, ApJ, 487, 579Ho, L. C., Filippenko, A. V., & Sargent, W. L. W. 1997b, ApJ, 487, 591Hou, A., Parker, L. C., Harris, W. E., & Wilman, D. J. 2009, ApJ, 702, 1199Howarth, I. D. 1983, MNRAS, 203, 301Hummel, E., van der Hulst, J. M., Kennicutt, R. C., & Keel, W. C. 1990, A&A,
236, 333Kauffmann, G., Heckman, T. M., Tremonti, C., et al. 2003a, MNRAS, 346, 1055Kauffmann, G., Heckman, T. M., White, S. D. M., et al. 2003b, MNRAS, 341,
33Kennicutt, Jr., R. C. 1998, ApJ, 498, 541Kennicutt, Jr., R. C., Keel, W. C., & Blaha, C. A. 1989, AJ, 97, 1022Kewley, L. J. & Dopita, M. A. 2002, ApJS, 142, 35Kewley, L. J., Dopita, M. A., Sutherland, R. S., Heisler, C. A., & Trevena, J.
2001, ApJ, 556, 121Kewley, L. J., Groves, B., Kauffmann, G., & Heckman, T. 2006, MNRAS, 372,
961Kim, T., Sheth, K., Gadotti, D. A., et al. 2014, ArXiv e-printsKobulnicky, H. A. & Kewley, L. J. 2004, ApJ, 617, 240Köppen, J. & Hensler, G. 2005, A&A, 434, 531Kormendy, J. & Kennicutt, Jr., R. C. 2004, ARA&A, 42, 603Kraljic, K., Bournaud, F., & Martig, M. 2012, ApJ, 757, 60Kreckel, K., Groves, B., Schinnerer, E., et al. 2013, ApJ, 771, 62López-Hernández, J., Terlevich, E., Terlevich, R., et al. 2013, MNRAS, 430, 472López-Sánchez, Á. R., Dopita, M. A., Kewley, L. J., et al. 2012, MNRAS, 426,
2630Mallery, R. P., Kewley, L., Rich, R. M., et al. 2007, ApJS, 173, 482Martel, H., Kawata, D., & Ellison, S. L. 2013, MNRAS, 431, 2560Martin, P. & Friedli, D. 1999, A&A, 346, 769Martinet, L. & Friedli, D. 1997, A&A, 323, 363McGaugh, S. S. 1991, ApJ, 380, 140Meisels, A. & Ostriker, J. P. 1984, AJ, 89, 1451Méndez-Abreu, J., Debattista, V. P., Corsini, E. M., & Aguerri, J. A. L. 2014,
A&A, 572, A25Mollá, M. & Gavilán, M. 2010, Mem. Soc. Astron. Italiana, 81, 992Nagao, T., Maiolino, R., & Marconi, A. 2006, A&A, 459, 85Nair, P. B. & Abraham, R. G. 2010, ApJS, 186, 427O’Donnell, J. E. 1994, ApJ, 422, 158Oh, K., Sarzi, M., Schawinski, K., & Yi, S. K. 2011, ApJS, 195, 13Oh, S., Oh, K., & Yi, S. K. 2012, ApJS, 198, 4Osterbrock, D. E. & Ferland, G. J. 2006, Astrophysics of gaseous nebulae and
active galactic nucleiPagel, B. E. J., Edmunds, M. G., Blackwell, D. E., Chun, M. S., & Smith, G.
1979, MNRAS, 189, 95Peletier, R. F., Falcón-Barroso, J., Bacon, R., et al. 2007, MNRAS, 379, 445Pérez-Montero, E. 2014, MNRAS, 441, 2663Pérez-Montero, E. & Contini, T. 2009, MNRAS, 398, 949Pérez-Montero, E. & Díaz, A. I. 2005, MNRAS, 361, 1063Pettini, M. & Pagel, B. E. J. 2004, MNRAS, 348, L59Pfenniger, D. & Norman, C. 1990, ApJ, 363, 391Pilyugin, L. S. 2001, A&A, 369, 594Pilyugin, L. S. & Thuan, T. X. 2005, ApJ, 631, 231Pompea, S. M. & Rieke, G. H. 1990, ApJ, 356, 416Regan, M. W. & Teuben, P. J. 2004, ApJ, 600, 595Regan, M. W., Vogel, S. N., & Teuben, P. J. 1997, ApJ, 482, L143Roussel, H., Sauvage, M., Vigroux, L., et al. 2001, A&A, 372, 406Sakamoto, K., Okumura, S. K., Ishizuki, S., & Scoville, N. Z. 1999, ApJ, 525,
691Sanchez, S. F., Perez, E., Rosales-Ortega, F. F., et al. 2014, ArXiv e-printsSchlegel, D. J., Finkbeiner, D. P., & Davis, M. 1998, ApJ, 500, 525Scholz, F. W. & Stephens, M. A. 1987, Journal of the American Statistical As-
sociation, 82, 918–924Seaton, M. J. 1979, MNRAS, 187, 73PSellwood, J. A. & Wilkinson, A. 1993, Reports on Progress in Physics, 56, 173Shaw, R. A. & Dufour, R. J. 1994, in Astronomical Society of the Pacific Con-
ference Series, Vol. 61, Astronomical Data Analysis Software and SystemsIII, ed. D. R. Crabtree, R. J. Hanisch, & J. Barnes, 327
Shen, J. & Sellwood, J. A. 2004, ApJ, 604, 614Sheth, K., Melbourne, J., Elmegreen, D. M., et al. 2012, ApJ, 758, 136Sheth, K., Vogel, S. N., Regan, M. W., Thornley, M. D., & Teuben, P. J. 2005,
ApJ, 632, 217Shlosman, I., Frank, J., & Begelman, M. C. 1989, Nature, 338, 45Stasinska, G., Mateus, Jr., A., Sodré, Jr., L., & Szczerba, R. 2004, A&A, 420,
475Stauffer, J. R. 1982, ApJ, 262, 66Stephens, M. A. 1974, Journal of the American Statistical Association, 347, 730Storchi-Bergmann, T., Calzetti, D., & Kinney, A. L. 1994, ApJ, 429, 572Tremonti, C. A., Heckman, T. M., Kauffmann, G., et al. 2004, ApJ, 613, 898Vazdekis, A., Sánchez-Blázquez, P., Falcón-Barroso, J., et al. 2010, MNRAS,
404, 1639Vila Costas, M. B. & Edmunds, M. G. 1993, MNRAS, 265, 199Wang, J., Kauffmann, G., Overzier, R., et al. 2012, MNRAS, 423, 3486Willett, K. W., Lintott, C. J., Bamford, S. P., et al. 2013, MNRAS, 435, 2835Zhou, Z.-M., Cao, C., & Wu, H. 2015, AJ, 149, 1Zurita, A., Relaño, M., Beckman, J. E., & Knapen, J. H. 2004, A&A, 413, 73
Article number, page 21 of 23

A&A proofs: manuscript no. bulbos_12072015
Fig. A.2. Decimal logarithm of the bulge–to–disc flux ratio in the i–band as a function of the morphological T–type as given in the Nair &Abraham (2010) catalogue for the galaxies of our sample included inthis catalogue. The colours represent different values of the predictedT–type Galaxy Zoo 2 parameter Willett et al. (2013).
Appendix A: Bulge–to–Disc flux ratios for differentgalaxy morphological types.
The decrease of the B/D flux ratio along the Hubble sequencefrom early to later–type galaxies is well known, but among oth-ers, it depends on the galaxy structural component fitting pro-cedure, on inclination and dust–extinction (see Graham & Wor-ley 2008, and references therein). Morphological classification isonly available, from the largest catalogue so far Nair & Abraham(2010), for less than 50% of our galaxy sample. Our aim here isto use the B/D flux ratios (Gadotti 2009) and the morphologicalclassification in T–types for our subsample of galaxies includedin the Nair & Abraham (2010) catalogue, to separate our galax-ies into early and late–types, according to their B/D flux ratios.
Fig. A.1 shows the dependence of the logarithm of the g,r and i–band B/D light ratios obtained with BUDDA (Gadotti2009) with the T–type by Nair & Abraham (2010) for the barredand unbarred galaxies in common between both samples. Thetop and bottom–left panels show this relation for the three differ-ent photometric bands, with small crosses for unbarred galaxiesand small filled circles for barred galaxies. The large crosses andbig empty circles indicate the median log (B/D) value for eachT–type value for unbarred and barred galaxies respectively. As itcan be seen there are no clear differences for barred and unbarredgalaxies. The bottom–right panel shows the median log (B/D)values, for barred and unbarred galaxies together, for each T–type for all photometric bands. The differences in the medianB/D light ratio between the different bands are in general smallerthan the error bars.
Our median values agree well (within error bars) with thosefrom Graham & Worley (2008, their Fig. 6) in the T–type rangein common (between T–type 0 and 5), except for T=0 in whichwe obtain a marginally larger B/D ratio in the r and i bands.These differences could arise from poor statistics at T=0 in Gra-ham & Worley (2008) (only 3 galaxies versus 30 in our sub-sample of galaxies included in the Nair & Abraham (2010) cat-alogue).
We caution the reader that a number of unbarred galaxies inour sample (∼15), supposed to be disc galaxies, are classifiedwith T–type ≤ -3 by Nair & Abraham (2010), i.e. as ellipticals(see Fig. A.1 or A.2). These galaxies are very difficult to clas-sify, since a face–on disc without spiral arms or a bar looks justlike a round elliptical. Gadotti (2009) classified as disc galaxiesafter looking at isophotal contours and the profile very carefully,
but as stated in the cited paper, the estimated misclassificationfrequency is ∼5-10%. With these uncertainties in mind, we haveopted to keep them in our galaxy sample and consider them asS0 disc galaxies.
The bulge–to–disc flux ratios decrease towards late–type spi-rals as expected. We have used this trend to create subsamplesdominated by early or late–type spirals. In our subsample ofgalaxies included in the Nair & Abraham (2010) catalogue, avalue of log (B/D) = −0.30 (or B/D = 0.5) approximately sep-arates galaxies with T–type< 2 (earlier than Sa) from those lateror equal to T–type = 2 (Sab), but the contamination from late–types (with the previous definition) in the early–type subsampleand vice versa is of order 12% and 30% respectively. The pre-dicted T–type, as given in the Galaxy Zoo213 catalogue (here-inafter GZ2 Willett et al. 2013), permits to improve this separa-tion. We then consider early–type galaxies as those galaxies ofthe sample with B/D > 0.5 or those that having B/D < 0.5 havea T-type, as predicted by GZ2, lower than -1. Similarly, we con-sider as late–type galaxies those with B/D < 0.5 and a T-typeas predicted by GZ2, larger or equal than 1. In this way we areable to include ∼70% and 90% of the early (T–type < 2) andlate types (T–type > 2) in the subsamples of early and late–typegalaxies respectively, and the contamination from late (early–types) in the early (late–type) subsample is ∼10% (25%). Thesenumbers are the same in all three bands. However, we have usedthe i–band, as the B/D flux ratio is available for all sample galax-ies in this filter.
13 http://data.galaxyzoo.org/
Article number, page 22 of 23

E. Florido et al.: Central enhancement of nitrogen–to–oxygen abundance ratio in barred galaxies
Fig. A.1. Logarithm of the bulge-to-disc (B/D) flux ratio in the g, r and i–band versus morphological type (expressed as T–type) for the galaxiesof the sample contained in the Nair & Abraham (2010) catalogue. Big crosses and big empty circles mark the median log (B/D) for each T–typevalue for unbarred and barred galaxies respectively. The bottom–right panel shows the median log (B/D) in each band for each T–type value. Errorbars represent the 95% confidence level of the median value for the distribution of B/D values at each T–type value. The blue solid straight linemarks B/D = 0.5, that we have used to separate early from late–type galaxies.
Article number, page 23 of 23