Measuring beta-diversity with abundance data
11
Measuring b-diversity with species abundance data Louise J. Barwell 1,2 *, Nick J. B. Isaac 2 and William E. Kunin 1 1 Institute of Integrative and Comparative Biology, University of Leeds, LC Miall Building, Leeds LS2 9JT, UK; and 2 Biological Records Centre, Centre for Ecology and Hydrology, Maclean Building, Benson Lane, Crowmarsh Gifford, Wallingford OX10 8BB, UK Summary 1. In 2003, 24 presence–absence b-diversity metrics were reviewed and a number of trade-offs and redundancies identified. We present a parallel investigation into the performance of abun- dance-based metrics of b-diversity. 2. b-diversity is a multi-faceted concept, central to spatial ecology. There are multiple metrics available to quantify it: the choice of metric is an important decision. 3. We test 16 conceptual properties and two sampling properties of a b-diversity metric: met- rics should be 1) independent of a-diversity and 2) cumulative along a gradient of species turnover. Similarity should be 3) probabilistic when assemblages are independently and identi- cally distributed. Metrics should have 4) a minimum of zero and increase monotonically with the degree of 5) species turnover, 6) decoupling of species ranks and 7) evenness differences. However, complete species turnover should always generate greater values of b than extreme 8) rank shifts or 9) evenness differences. Metrics should 10) have a fixed upper limit, 11) sym- metry (b A,B = b B,A ), 12) double-zero asymmetry for double absences and double presences and 13) not decrease in a series of nested assemblages. Additionally, metrics should be inde- pendent of 14) species replication 15) the units of abundance and 16) differences in total abundance between sampling units. When samples are used to infer b-diversity, metrics should be 1) independent of sample sizes and 2) independent of unequal sample sizes. We test 29 metrics for these properties and five ‘personality’ properties. 4. Thirteen metrics were outperformed or equalled across all conceptual and sampling prop- erties. Differences in sensitivity to species’ abundance lead to a performance trade-off between sample size bias and the ability to detect turnover among rare species. In general, abundance- based metrics are substantially less biased in the face of undersampling, although the pres- ence–absence metric, b sim , performed well overall. Only b Baselga R turn , b Baselga B-C turn and b sim measured purely species turnover and were independent of nestedness. Among the other met- rics, sensitivity to nestedness varied >4-fold. 5. Our results indicate large amounts of redundancy among existing b-diversity metrics, whilst the estimation of unseen shared and unshared species is lacking and should be addressed in the design of new abundance-based metrics. Key-words: b-diversity indices, community composition, differentiation, metrics, rank abun- dance distribution, similarity, simulated assemblage, spatial turnover Introduction Metrics of b-diversity are widely used in ecological studies, but there is uncertainty about the degree of redundancy among the metrics available and the facets of b-diversity being measured. Whittaker (1960, 1972) broadly defined b-diversity as the spatial variation (turnover) in species composition and abundance between sampling units, whilst a-diversity is the local diversity within a single sampling unit and c-diversity measures larger-scale diversity. The number of studies investigating b-diversity has increased considerably in recent years (Koleff, Gaston & Lennon 2003a; Anderson et al. 2011). b-diversity has been linked to the shape of the species–area curve (Harte et al. 1999), variance in species occupancy (McGlinn & Hurl- bert 2012) and species’ spatial aggregation (Morlon et al. *Correspondence author. E-mail: [email protected] © 2015 The Authors. Journal of Animal Ecology published by John Wiley & Sons Ltd on behalf of British Ecological Society. This is an open access article under the terms of the Creative Commons Attribution License, which permits use, distribution and reproduction in any medium, provided the original work is properly cited. Journal of Animal Ecology 2015 doi: 10.1111/1365-2656.12362
Transcript of Measuring beta-diversity with abundance data

Measuring b-diversity with species abundance data
Louise J. Barwell1,2*, Nick J. B. Isaac2 and William E. Kunin1
1Institute of Integrative and Comparative Biology, University of Leeds, LC Miall Building, Leeds LS2 9JT, UK; and2Biological Records Centre, Centre for Ecology and Hydrology, Maclean Building, Benson Lane, Crowmarsh Gifford,
Wallingford OX10 8BB, UK
Summary
1. In 2003, 24 presence–absence b-diversity metrics were reviewed and a number of trade-offs
and redundancies identified. We present a parallel investigation into the performance of abun-
dance-based metrics of b-diversity.2. b-diversity is a multi-faceted concept, central to spatial ecology. There are multiple metrics
available to quantify it: the choice of metric is an important decision.
3. We test 16 conceptual properties and two sampling properties of a b-diversity metric: met-
rics should be 1) independent of a-diversity and 2) cumulative along a gradient of species
turnover. Similarity should be 3) probabilistic when assemblages are independently and identi-
cally distributed. Metrics should have 4) a minimum of zero and increase monotonically with
the degree of 5) species turnover, 6) decoupling of species ranks and 7) evenness differences.
However, complete species turnover should always generate greater values of b than extreme
8) rank shifts or 9) evenness differences. Metrics should 10) have a fixed upper limit, 11) sym-
metry (bA,B = bB,A), 12) double-zero asymmetry for double absences and double presences
and 13) not decrease in a series of nested assemblages. Additionally, metrics should be inde-
pendent of 14) species replication 15) the units of abundance and 16) differences in total
abundance between sampling units. When samples are used to infer b-diversity, metrics
should be 1) independent of sample sizes and 2) independent of unequal sample sizes. We test
29 metrics for these properties and five ‘personality’ properties.
4. Thirteen metrics were outperformed or equalled across all conceptual and sampling prop-
erties. Differences in sensitivity to species’ abundance lead to a performance trade-off between
sample size bias and the ability to detect turnover among rare species. In general, abundance-
based metrics are substantially less biased in the face of undersampling, although the pres-
ence–absence metric, bsim, performed well overall. Only bBaselga R turn, bBaselga B-C turn and bsimmeasured purely species turnover and were independent of nestedness. Among the other met-
rics, sensitivity to nestedness varied >4-fold.
5. Our results indicate large amounts of redundancy among existing b-diversity metrics,
whilst the estimation of unseen shared and unshared species is lacking and should be
addressed in the design of new abundance-based metrics.
Key-words: b-diversity indices, community composition, differentiation, metrics, rank abun-
dance distribution, similarity, simulated assemblage, spatial turnover
Introduction
Metrics of b-diversity are widely used in ecological studies,
but there is uncertainty about the degree of redundancy
among the metrics available and the facets of b-diversitybeing measured. Whittaker (1960, 1972) broadly defined
b-diversity as the spatial variation (turnover) in species
composition and abundance between sampling units,
whilst a-diversity is the local diversity within a single
sampling unit and c-diversity measures larger-scale
diversity.
The number of studies investigating b-diversity has
increased considerably in recent years (Koleff, Gaston &
Lennon 2003a; Anderson et al. 2011). b-diversity has been
linked to the shape of the species–area curve (Harte et al.
1999), variance in species occupancy (McGlinn & Hurl-
bert 2012) and species’ spatial aggregation (Morlon et al.*Correspondence author. E-mail: [email protected]
© 2015 The Authors. Journal of Animal Ecology published by John Wiley & Sons Ltd on behalf of British Ecological Society.This is an open access article under the terms of the Creative Commons Attribution License,which permits use, distribution and reproduction in any medium, provided the original work is properly cited.
Journal of Animal Ecology 2015 doi: 10.1111/1365-2656.12362
2008). The distance–decay relationship (the increase in
b-diversity with geographical distance) is a critical compo-
nent of three of the six unified theories of biodiversity
reviewed by McGill (2010). Measures of b-diversity in
relation to environmental and spatial gradients have been
used to unpick community assembly (Chase 2003) and
drivers of global scale biodiversity patterns (Qian & Rick-
lefs 2007). Empirical measures of b-diversity can be used
to delineate biotic regions (Holt et al. 2013) and to inform
the optimal configuration of reserves (Wiersma & Urban
2005). b-diversity has been used to evaluate the land-
scape-scale implications of farm management (Gabriel
et al. 2006) and to assess the effects of environmental
change on biotic homogenization (Baiser et al. 2012).
Because c-diversity is entirely determined by the a- and
b-components of diversity, empirical estimates of b-diver-sity link biodiversity at local and regional scales (Smith
2010). Turnover in abundance also has important implica-
tions for ecosystem functioning and monitoring responses
to disturbance (Balata, Piazzi & Benedetti-Cecchi 2007).
A key distinction is between b-diversity metrics that use
presence–absence data and metrics that use species abun-
dances (Anderson et al. 2011). Abundance data are clearly
more information-rich than presence–absence data, and
this can change how we interpret spatial variation in
assemblage structure (Cassey et al. 2008). For presence–absence metrics, the only visible differences between sites
are in species identities. Abundance-based measures detect
more nuanced variation: we may observe all the same spe-
cies at two sites, but those species may have different
abundance ranks (the commonest species here may be
rare there and vice versa). Even when the ranks are the
same, evenness of abundances can vary (the common spe-
cies can be more or less dominant). Consequently, we dis-
tinguish sensitivity to (i) species turnover, (ii) species
richness differences (iii) rank abundance shifts and (iv)
evenness differences as distinct components of b-diversity.Abundance-based indices may also be expected to be
more robust to incomplete sampling (Beck, Holloway &
Schwanghart 2013): stochastic differences in rare species
are an artefact of undersampling, but abundance-based
metrics are less influenced by turnover of rare species than
their presence–absence counterparts. Whilst abundance
information makes our inferences about b-diversity more
powerful, it also introduces a source of subjectivity: we
need to decide how to weight turnover in common and
rare species.
Koleff, Gaston & Lennon (2003a) compared the perfor-
mance of 24 presence–absence metrics of b-diversity and
identified a number of trade-offs and redundancies among
the presence–absence metrics available. Overall, they rec-
ommended bsim (Lennon et al. 2001) as the best-perform-
ing index. We are lacking an equivalent investigation into
the performance and ‘personality’ of the many abun-
dance-based metrics available.
We test 16 conceptual properties that are important
for an abundance-based b-diversity metric, whatever the
application. Where applicable, we note the relationship
between these properties and those previously described in
the literature.
desirable properties
We make a distinction between conceptual and statistical
properties. Conceptual properties (C1–C16) are intrinsic
to the design of the metric (e.g. the use of abundance
information and whether the metric has a fixed upper
limit). Sampling properties (S1–S2) explore responses to
undersampling: true differences between assemblages are
confounded by imperfect detection, especially of rare spe-
cies. We consider both conceptual and sampling proper-
ties as desirable when choosing a metric.
Independence of a-diversity (C1)
b-diversity should be independent of a-diversity within
assemblage pairs, so that the a- and b- components of
diversity can be partitioned (Jost 2007; Chase et al. 2011)
and b-diversity can be meaningfully compared between
regions differing in a-diversity. If a- and b-diversities are
independent, then pairs of assemblages with the same pro-
portion of species turnover should have the same value of
b-diversity, regardless of whether a-diversity within those
assemblages is high or low. Legendre & De C�aceres
(2013: property 10) test this property algebraically for 16
dissimilarity metrics. In P1, we consider an alternative
where assemblage pairs have unequal species richness.
b is cumulative along a gradient of species turnover
(C2)
When assemblages are positioned along an environmental
gradient, species turnover will be directional. Koleff, Gas-
ton & Lennon (2003a) call this property additivity. Spe-
cies are gradually replaced as conditions change, so
turnover between neighbouring pairs of assemblages is
lower than between pairs that are farther apart. When
samples A, B and C are positioned in sequence along such
a gradient, summed b-diversity between consecutive pairs
of samples (bA,B + bB,C) should equal the total b-diversitybetween the end points of the gradient (bA,C). Metrics
with disproportionate sensitivity to small amounts of
turnover will lead to overestimates of cumulative b.
Similarity is probabilistic when assemblages are
independently and identically distributed (C3)
When assemblages are independently drawn from within
a larger, well-mixed metacommunity, then similarity (i.e.
1-b for metrics with an upper limit of 1) among multiple
pairs of assemblages should be probabilistic. The expected
similarity of assemblages A and C (1-bA,C) is given by the
product of similarities between A and B, and B and C,
(1-bA,B)*(1-bB,C). Metrics that lack an upper limit cannot
© 2015 The Authors. Journal of Animal Ecology published by John Wiley & Sons Ltd on behalf of British Ecological Society., Journal of
Animal Ecology
2 L. J. Barwell, N. J. B. Isaac & W. E. Kunin

be converted to their similarity complement and so cannot
be probabilistic.
Minimum of zero (C4)
Legendre & De C�aceres (2013: property 1) state that when
comparing an assemblage to itself, b should always be
zero, and when comparing two different assemblages, bshould be equal to or greater than zero.
Fixed upper limit (C5)
Legendre & De C�aceres (2013: property 9) note that bounded
metrics are easier to compare than unbounded ones. For
example, the maximum value of bEuclidean and bManhattan
depends on the combined abundances of an assemblage pair,
making it difficult to interpret the values of b when assem-
blage pairs have different numbers of individuals.
Monotonic increase with species turnover (C6)
b should be a strictly increasing monotonic function of
the proportion of species in the first assemblage that are
replaced by new species in the second assemblage; other-
wise, it is not reflecting species turnover. A pair of assem-
blages in which 20% of assemblage A species are replaced
by new species in assemblage B should have lower
b-diversity than an assemblage pair with 40% turnover.
The property is closely related to the property described
by Jost, Chao & Chazdon (2011) as monotonicity.
Monotonic increase with the decoupling of species ranks
(C7)
An abundance-based b-diversity metric should be sensitive
to the degree to which species ranks are decoupled between
assemblage pairs (reflecting differences in the dominant and
rare species). Therefore, b-diversity should decrease mono-
tonically with increased correlation between species ranks.
Monotonic increase with differences in evenness (C8)
Even if two sites have the same species, with the same
rank order of abundances, they may still differ in even-
ness: the commonest species may dominate more in some
sites than others. A good abundance-based b-diversitymetric should increase monotonically as differences in
evenness between sites grow larger. Properties C7 and C8
are two aspects of a property described as monotonicity
to changes in abundance by Legendre & De C�aceres
(2013: property 3).
b is lower for complete decoupling of species ranks than
for complete species turnover (C9)
Consider a pair of assemblages in which all species are
unshared and a second pair of assemblages in which all
species are shared, but the rank abundances are reversed,
such that the dominant species in assemblage A becomes
the rarest in assemblage B and vice versa. The first pair of
assemblages must be considered more different than the
second pair.
b is lower for evenness differences than for complete
species turnover (C10)
As an alternative scenario for abundance differences, con-
sider a pair of assemblages in which all species are shared:
in the first assemblage, the abundances are perfectly even
and in the second assemblage, all species are singletons
except the dominant species (e.g. extreme unevenness).
Compare this to an assemblage pair where all species are
shared. As above, the loss or gain of a species should
always be deemed a more extreme difference than a shift
in its abundance. Sites with no species in common should
have the largest values of b (Legendre & De C�aceres
2013: property 5). Properties C9 and C10 describe two
alternative scenarios in which this property should hold.
Symmetry (C11)
Legendre & De C�aceres (2013: property 2) and Koleff,
Gaston & Lennon (2003a) note that the order in which
two assemblages, A and B, are considered should not
change the value of b for that pair (e.g. bA, B = bB, A).
Double-zero asymmetry (C12)
Legendre & De C�aceres (2013: property 4) argue that
the absence of a species from both assemblages does not
indicate resemblance between the two assemblages in the
way that shared presences do: double absences contain
no information about the distance in ecological niche
space. Consequently, the addition of zero abundances to
both assemblages should not change the value of b,whilst the addition of shared presences should lower the
value of b.
b does not decrease in a series of nested assemblages
(C13)
Metrics vary in how they respond to nestedness. However,
b should never decrease when species richness differences
increase, as the addition of unique species should not
increase similarity (Legendre & De C�aceres 2013: property
6).
Independence of species replication (C14)
When all species in both the assemblages being compared
are duplicated, the value of b should remain constant.
This becomes important when identical subsets of an
assemblage are pooled (Jost, Chao & Chazdon 2011;
Legendre & De C�aceres 2013: property 7).
© 2015 The Authors. Journal of Animal Ecology published by John Wiley & Sons Ltd on behalf of British Ecological Society., Journal of
Animal Ecology
Abundance-based b-diversity 3
Independence of units of abundance (C15)
When comparing b among regions differing in productiv-
ity or the units used to measure abundance, metrics that
are sensitive to the total abundance in an assemblage pair
will be inappropriate. Legendre & De C�aceres (2013:
property 8) call this property invariance to measurement
units.
Independent of differences in abundance (C16)
This property was described as invariance to the total
abundance in each assemblage by Legendre & De C�aceres
(2013: property 11) and density invariance by Jost, Chao
& Chazdon (2011). It is designed to identify metrics that
are mathematically dependent on differences in abundance
between sampling units. C15 and C16 differ from under-
sampling in that there is no stochasticity.
Unbiased by undersampling (S1)
In all previous simulations, we have assumed our simu-
lated assemblages represent the ‘true’ composition. How-
ever, b-diversity is usually estimated from samples, which
generates differences in richness and abundances as a
sampling artefact (Chao et al. 2005, 2006). A good b-diversity metric should remain constant as the sample size
decreases.
Unbiased by unequal sampling effort (S2)
Differences in sample size can also inflate b-diversity due
to imperfect detection of rare species. A good b-diversitymetric should remain constant with increasing difference
in sample sizes.
personality properties
In addition to the desirable properties identified above,
b-diversity metrics may differ in other respects that are
worthy of note. We term this the ‘personality’ of the met-
rics and their importance will depend on the ecological
question concerned.
Sensitivity to nestedness (P1)
For presence–absence metrics, Koleff, Gaston & Lennon
(2003a) distinguish ‘narrow-sense’ metrics, which measure
purely species turnover, from ‘broad-sense’ metrics, which
measure both species turnover and differences in species
richness. We may want a b-diversity metric to reflect dif-
ferences in richness, as these will mean that one site will
have species that are absent in another. On the other
hand, we may want the value of b to measure purely spe-
cies turnover, especially if we are comparing b-diversitybetween regions with different species richness. This
differs from the test in C1 (independence of differences in
a-diversity): in C1, each pair of assemblages we compare
has an equal number of species. Here, species richness
differs between the two assemblages we compare.
Relative sensitivity to nestedness and turnover
components of b (P2)
We test two metrics (bBray-Curtis and bRuzicka) that can
be additively partitioned into independent nestedness
and turnover components (Baselga 2013; Podani,
Ricotta & Schmera 2013; Legendre 2014). For metrics
that cannot be deconstructed, it is useful to compare
the value of b for complete turnover to that for
extreme nestedness to estimate the relative sensitivity to
these components.
Relative weighting of species turnover and abundance
differences (P3 and P4)
We have identified two ways in which species abundances
can vary between assemblages: decoupling of species
ranks and differences in evenness. The relative weighting
of these components and species turnover is a useful
property to quantify. The ideal weighting is somewhat
subjective (provided that b-diversity is less for extreme
differences in abundance than for turnover of a species,
see C9 and C10, above).
Relative sensitivity to turnover of rare versus common
species (P5)
There is scope for variation in how common versus rare
species contribute to b. One reason for investigating this
is the occupancy–abundance relationship (ONR). Positive
ONRs are nearly ubiquitous (Brown 1984) and reflect that
rare species are generally more range restricted and so
more likely to be turned over than are locally abundant
(and more widespread) species.
Here, we manipulate the composition and structure of
hypothetical assemblages and apply 29 b-diversity metrics
to the resulting assemblage pairs. Each metric is evaluated
against 18 desirable properties (C1–C15 and S1–S2) to
generate a score card, which we use to identify the best-
performing abundance-based b-diversity metrics. We then
explore how personality properties may affect the choice
of metric for different ecological applications.
Materials and methods
b-diversity metrics
In total, we evaluated 24 abundance-based metrics and five pres-
ence–absence metrics (Appendix S1, Supplementary Information).
All metrics are expressed so that higher values of b indicate more
differentiation (1-b for similarity metrics). For comparability,
metrics were rescaled relative to the maximum value obtained in
each set of simulations, before calculating scores.
© 2015 The Authors. Journal of Animal Ecology published by John Wiley & Sons Ltd on behalf of British Ecological Society., Journal of
Animal Ecology
4 L. J. Barwell, N. J. B. Isaac & W. E. Kunin
hypothetical species assemblages
Abundance differences in our hypothetical assemblages were
modelled using the log series distribution (Fisher, Corbet & Wil-
liams 1943) using the function fisher.ecosystem in R package
‘untb’ (Hankin 2007). Our conclusions would be qualitatively
identical using other commonly used models of the species abun-
dance distribution (McGill 2010). A hypothetical species assem-
blage with 100 species and 10 000 individuals was used as the
starting assemblage for all simulations.
evaluation of properties
For b-diversity metrics that have been previously implemented
in R, the functions vegdist and d and adipart in R package
‘vegan’ v.2.0-5 (Oksanen et al. 2013) were used to calculate
b-diversity. Formulae for the remaining metrics can be found in
Appendix S1. Each of our properties was assessed by exploring
how measured b-diversity covaried with a test-specific parame-
ter, describing some aspect of assemblage structure. We manipu-
lated the starting assemblage according to the specific rules for
each test. Each simulation described below was run 10 000 times
at each unique combination of the test-specific parameter and
proportion species turnover, t = 0, 0�2, 0�4, �0�6, 0�8 and 1�0, toobtain median b for that combination. All simulations were car-
ried out in R v.3.0.3 (R Core Team 2014). Formulae for evalu-
ating b-diversity metrics for each of the properties can be found
in Appendix S2.
Independence of a-diversity (C1)
Fisher’s a of assemblages was manipulated using the function
fisher.ecosystem in R package ‘untb’ (Hankin 2007). The expected
number of individuals was fixed at N = 10 000, whilst manipulat-
ing the number of expected species, S, to generate a series of
assemblages with S = 300, 250, 200, 150, 100, 80, 60, 40, 20 and
10. Fisher’s a was estimated for each assemblage. For each
a-diversity:turnover combination, we calculated error as the
difference between the median b-diversity at each level of a and
the median b-diversity when a was highest (S = 300): dependence
on a-diversity was measured as the root-mean-squared error
(RMSE).
b is cumulative along a gradient of species turnover
(C2)
In each simulation, three assemblages, A, B and C, were gener-
ated according to the following rules: a proportion of species, t,
in assemblage A were randomly selected to be turned over in
assemblage B (t = 0, 0�1, 0�2, 0�3, 0�4 and 0�5). Of the species in
assemblage B, the same proportion was turned over in assem-
blage C, with the condition that species shared between assem-
blages A and B were g times more likely to be turned over in
assemblage C than species unique to assemblage B, where g is a
test-specific parameter which we manipulate to simulate different
strengths of directional species turnover (g = 1, 5, 10, 50, 100,
500 or 1000). At each turnover:gradient combination, we calcu-
lated error as the difference between observed b-diversity for
assemblages A and C (bA,C) and the value predicted if the metric
was cumulative (bA,B + bB,C): departure from cumulative b was
evaluated as the RMSE.
Similarity is probabilistic when assemblages are
distributed independently and identically in space (C3)
In each simulation, three assemblages, A, B and C, were generated
according to the following rules: a proportion, p (p = 0–1 in incre-
ments of 0�2), of the species in assemblage 1 were randomly selected
to be conserved in assemblage 2. This process was repeated with
the species in assemblages 1 and 2 (with the same value of p) to
obtain the third assemblage. Species lost from assemblage A can
reappear in assemblage C, as we would expect in independent sam-
ples drawn from a well-mixed species pool, but entirely novel spe-
cies can also appear in assemblage C. In each simulation, we
calculated error as the difference between observed similarity for
assemblages A and C (1�bA,C) and the similarity predicted if the
metric is probabilistic (1�bA,B)(1�bB,C): departure from probabi-
listic similarity was evaluated as the RMSE.
Minimum of zero (C4)
The starting assemblage was manipulated to generate assemblage
pairs with increasing differences in species turnover, t; decoupling of
species ranks, r; and evenness differences, DE. Methods for these sim-
ulations can be found in C7 and C8. Two behaviours were tested: (i)
b is zero for identical assemblages and (ii) b is greater than or equal
to zero when assemblages are different, either because of species turn-
over, decoupling of species ranks or evenness differences. The metric
was scored as TRUE if both qualities were met.
Fixed upper bound (C5)
This property was evaluated as TRUE/FALSE by applying equa-
tion 8 and then equation 3 in Legendre & De C�aceres (2013:
property 9) to calculate the upper limit of a metric, using a pair
of assemblages with no shared species.
Monotonic increase with species turnover (C6)
A series of assemblages with increasing species turnover was gen-
erated by randomly selecting a proportion of species (t = 0–1 in
increments of 0�2) in the starting assemblage and assigning them
a new identity in the new assemblage. Metrics were scored as
TRUE if each consecutive increase in species turnover generated
an increase in median b.
Monotonic increase with decoupling of species ranks
(C7)
A series of assemblages with increased decoupling of species
ranks was generated by determining species ranks in the new
assemblage partially by the ranks in the starting assemblage and
partially at random (r = +1�0 (a perfect positive correlation
between ranks) to �1�0 (a perfect negative correlation) in incre-
ments of 0�1). Metrics were scored as TRUE if each incremental
decrease in r, generated an increase in median b at a given level
of species turnover.
Monotonic increase with differences in evenness (C8)
In the starting assemblage for this test all except the dominant
species have just one individual (extreme unevenness). A series of
© 2015 The Authors. Journal of Animal Ecology published by John Wiley & Sons Ltd on behalf of British Ecological Society., Journal of
Animal Ecology
Abundance-based b-diversity 5
assemblages with increasing evenness differences was generated
by redistributing individuals from the dominant species among
the other 99 species: the probability of being allocated to each
species was determined by raising the abundances in a Fisher’s
log series distributed assemblage to a power, b = 0�2, 0�4, 0�6,0�8, 1�0, 1�2, 1�4, 1�6, 1�8 2�0, 4�0, 6�0 and 8�0. These values were
chosen to generate assemblages with both more and less evenness
relative to a Fisher’s log series distribution. Metrics were scored
as TRUE if each incremental increase in DE led to an increase in
median b.
b under extreme decoupling of species ranks < b when
species turnover is complete; b under extreme
evenness differences < b when species turnover is
complete (C9 and C10)
The turnover of a species should be weighted greater than a
change in abundance. Metrics were scored as TRUE for these
two properties if median b is lower for extreme decoupling of
species ranks (r = �1) and extreme evenness differences
(DE = 0�97) than for complete species turnover (t = 1). The rela-
tive weighting of abundance differences and species turnover also
has a personality component (see P3 and P4).
Symmetry (C11)
Symmetry was tested by reversing the order in which assemblages
A and B were given to a metric. This was tested for assemblage
pairs with multiple levels of species turnover, t; decoupling of
species ranks, r; and evenness differences, DE. A metric was
scored as TRUE if bA,B = bB,A in all simulations.
Double-zero asymmetry (C12)
We generated a series of eleven assemblage pairs, the first with no
double zeros and then consecutively adding up to 10 double zeros
to the assemblage pair. This was repeated, but adding double pres-
ences of equal abundance. Abundances in each simulation were
chosen at random from within the starting assemblage. Two behav-
iours were tested: (i) b does not change with the addition of double
zeros and (ii) b decreases with the addition of double presences.
Metrics were scored as TRUE if both conditions were met.
b does not decrease in a series of nested assemblages
(C13)
A series of nested assemblages was generated by randomly select-
ing a number of species to be lost from the starting assemblage
(S = 0–90 in increments of 10). Metrics were scored as TRUE if
each incremental increase in species loss led to an increase in
median b.
Independence of species replication (C14)
A series of 10 assemblage pairs with all species replicated x times
at six levels of species turnover, t, was used to simulate the effect
of pooling identical subsets of unshared species. At each combi-
nation of x (in 1–10) and t, error was calculated as the difference
between median b in one identical subset and when x identical
subsets were pooled. Metrics were scored as the RMSE.
Independent of the units of abundance (C15)
Following the method in Legendre & De C�aceres (2013), we test
this property by generating a series of assemblage pairs in which
the abundances in both assemblages are multiplied by a constant
factor (cc = 1–10). Error was calculated as the difference between
median b in the starting assemblage pair (cc = 1) and between
median b at each combination of cc and species turnover, t.
Metrics were scored as the RMSE.
Independence of differences in abundance (C16)
We test this property by generating a series of assemblage pairs
in which the abundances in one assemblage are multiplied by a
constant factor, (c = 1–10). At each c:turnover combination,
error was calculated as the difference between median b at each
value of c and median b in the starting assemblage pair, (c = 1).
Metrics were scored as the RMSE.
The following two properties test the behaviour of metrics
when samples are used to infer b-diversity.
Independence of sample size (S1)
For a series assemblage pairs with different levels of turnover, t,
both assemblages were randomly sampled, without replacement,
to generate a series of assemblage pairs with equal sample sizes
of N = 10 000 (fully censused), 9000, 8000, 7000, 6000, 5000,
4000, 3000, 2000, 1000, 500, 200, 100, 50, 20 and 10. For each
sample size:turnover combination, error was calculated as the dif-
ference between median b-diversity at sample size N and median
b-diversity in a fully censused assemblage: dependence on sample
size was measured as the RMSE.
Independence of unequal sample sizes (S2)
For a series of assemblage pairs with different levels of turnover,
t, one assemblage in each pair was randomly sampled, without
replacement, whilst the other was fully sampled to generate sam-
ple size differences of DN = 0, 1000, 2000, 3000, 4000, 5000,
6000, 7000, 8000, 9000, 9500, 9800, 9900, 9950, 9980 and 9990.
As above, for each DN:turnover combination, we calculated error
as the difference between the median b-diversity at sample size
difference DN and median b-diversity when both assemblages
were fully censused (DN = 0): dependence on unequal sample size
was measured as the RMSE.
Sensitivity to nestedness (P1)
To generate ten assemblages with differences in species richness,
DS, we randomly selected S species (see C13) to be lost from the
starting assemblage. For each species loss:turnover combination,
we calculated error as the difference between the median b-diver-sity for S and median b-diversity when species richness was equal
(S = 0): sensitivity to nestedness was measured as the RMSE.
Relative sensitivity to nestedness and turnover (P2)
This property was measured as the ratio of b under extreme nest-
edness but no turnover (DS = 90, t = 0) and the value for com-
plete species turnover but no species loss (t = 1, DS = 0).
© 2015 The Authors. Journal of Animal Ecology published by John Wiley & Sons Ltd on behalf of British Ecological Society., Journal of
Animal Ecology
6 L. J. Barwell, N. J. B. Isaac & W. E. Kunin
Relative sensitivity to abundance differences and
species turnover (P3 and P4)
We calculated b under extreme decoupling of species ranks
(r = �1), and extreme differences in evenness (DE = 0�97), usingsimulated assemblages from C7 and C8. These values were
expressed as a proportion of the value of median b under com-
plete species turnover, t = 1.
Relative sensitivity to turnover in rare versus common
species (P5)
We turned over a single species in the starting assemblage, from
the dominant (1450 individuals) to the rarest species (1 individ-
ual) and recorded the value of b for each. Relative sensitivity to
rare and common species was evaluated as the ratio between bwhen the rarest species was turned over to b when the dominant
species was turned over.
In order to investigate redundancy and complementarity
among the 29 metrics, a principal component analysis was per-
formed using all quantitatively measured properties, using the
function prcomp in R version 3.0.3 (R Development Core Team,
2014). We also investigate which of the metrics are Pareto-domi-
nated, that is, those metrics that are outperformed or equalled
across all desirable properties.
Results
We have scored the performance of 29 metrics for 16 con-
ceptual and two sampling properties (Table 1). In addi-
tion, a further five personality tests have enabled us to
identify more subjective variation in metrics’ behaviour
(Table 2). The results of all simulations are presented in
Appendix S3.
conceptual and sampling properties
All 29 metrics satisfied properties C4, C6 (minimum of zero
and positiveness, monotonic increase with species turnover:
Fig. S4) and C11 (symmetry). We use the remaining proper-
ties to discriminate between the performances of metrics.
Thirteen metrics were Pareto-dominated (Tables 1, S5). We
focus on the metrics that performed best against the con-
ceptual and sampling properties and consider their con-
trasting strengths and weaknesses.
Nine metrics passed all qualitatively scored tests (bMori-
sita, bHorn, bMorisita-Horn, bJost Simpson bRenkonen, bKulczynski,
bBray-Curtis, bCanberra and bRu�zi�cka,: C5–C13, Table 1). The
presence–absence metrics bsim, bClassic Jaccard and bClassicSørensen failed only C7 and C8 (monotonic increase with
decoupling of species ranks and evenness differences: Figs
S5 and S6), as such measures, by definition, are insensitive
to differences in abundance. All abundance-based metrics
became less sensitive to abundance differences as the spe-
cies turnover between assemblages became more extreme
(Figs S5 and S6).
Across all quantitative tests, bMorisita obtained the best
mean score. The presence–absence metric, bsim, performed
best or joint best for six of the eight quantitative concep-
tual and sampling properties, with the exception of C2 (bis cumulative) and S1 (independence of sample size).
bMorisita was the most robust metric to undersampling,
performing best when both assemblages were undersam-
pled (S1) and second best under unequal sample sizes
(S2). bsim was best for S2, but performed poorly for S1
(Figs S2 and S12: Table 1). bCanberra scored equally highly
with bsim, bClassic Sørensen and bClassic Jaccard for C1 (inde-
pendence of a-diversity: Fig. S1), C14 (independence of
species replication: Fig. S7) and C15 (independence of
measurement units: Fig. S8), but performed poorly on C2
(b is cumulative: Fig. S2), C3 (similarity is probabilistic:
Fig. S3) and C16 (independence of differences in abun-
dance: Fig. S9) and for both sampling properties (S1 and
S2). bBinomial was joint best for C15 (independence of
measurement units: Fig. S8), but performed poorly for all
other quantitative properties. bHorn and bRenkonen per-
formed relatively well across all quantitative properties,
but were never best for any property.
In sampling simulations S1 and S2 (Table 1; Figs S12
and S13), most presence–absence metrics were positively
biased by undersampling, with the exception of bChaoSørensen and bChao Jaccard which have a correction for un-
dersampling.
personality properties
With the exception of bsim and the partitioned turnover
components of bBray-Curtis and bRu�zi�cka, all metrics were at
least somewhat sensitive to nestedness (P1), although
there were fourfold differences in the degree of sensitivity
to species richness differences (P2, Table 2).
The relative weighting of abundance differences and
turnover varied substantially among abundance-based
metrics (Table 2). With the exception of bGower balt. Gower,
bAv. Euclidean, bLande Simpson and bEuclidean, metrics were
more sensitive to species turnover than differences in
abundance (P3: decoupling of species ranks, P4: differ-
ences in evenness, Figs S5 and S6).
The relative sensitivity to turnover in rare versus com-
mon species (P5) varied substantially among metrics from
equal weighting of rare and common species (all pres-
ence–absence metrics) to metrics that had a negligible
response to turnover in rare species (bMorisita: Fig. S11).
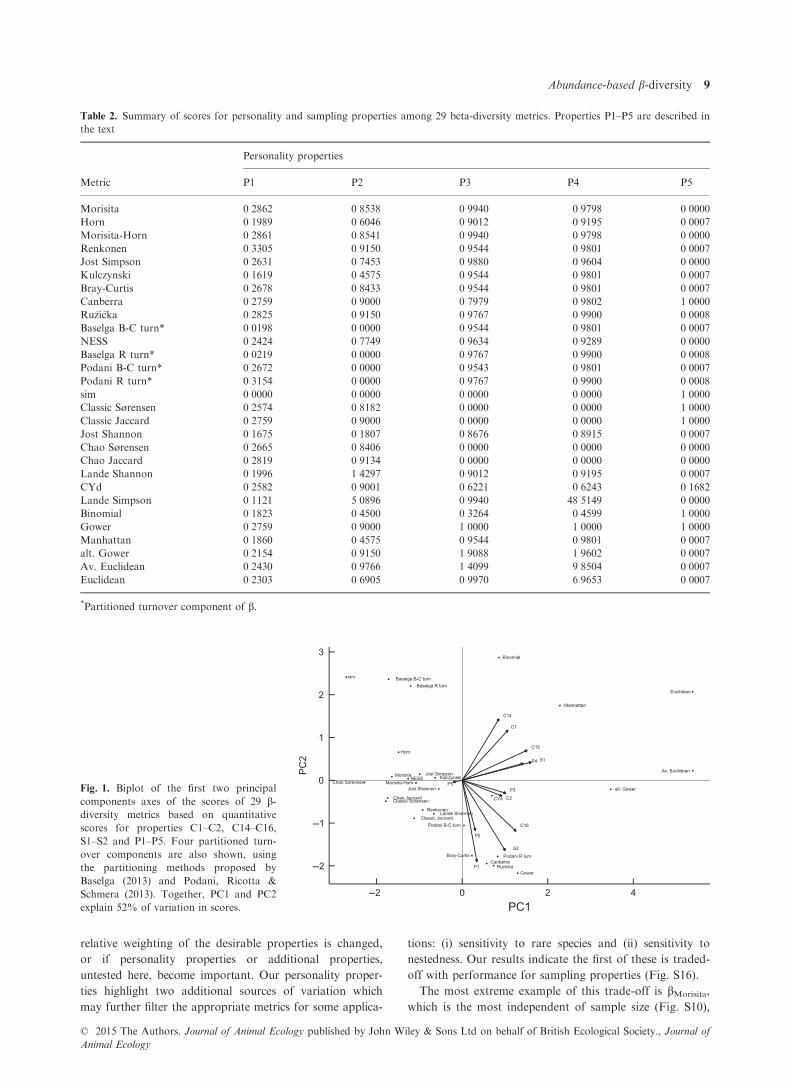
A principal component analysis revealed substantial
redundancy among the 29 metrics investigated (Fig. 1).
Discussion
Our results identify a number of trade-offs in perfor-
mance, consider redundancy and complementarity among
existing metrics and suggest areas to be addressed in the
design of new metrics.
In choosing a metric, we suggest that our desirable
properties will provide a useful primary filter in choosing
a metric. We focus on the best-performing metrics in
Table 1, but other metrics may still be useful if the
© 2015 The Authors. Journal of Animal Ecology published by John Wiley & Sons Ltd on behalf of British Ecological Society., Journal of
Animal Ecology
Abundance-based b-diversity 7

Table
1.Scorecard
for29b-diversity
metrics
against
the16conceptualandtw
osamplingproperties
described
inthetext.Metrics
are
ordered
bynumber
ofTRUESand,when
equal,bythemean
ofquantitativescores.Note
thisweights
qualitativeproperties
greaterthanquantitativeproperties,such
thatmetrics
withoneortw
ofailsdropdownthescorecard.Metrics
haveanidealscore
of
TRUE(T)forqualitativeproperties
and0forquantitativeproperties.C4,C6andC11wereTRUEforallmetrics
andscoresare
notshown
Metric
Conceptualproperties
Sampling
properties
Perform
ance
summary
C1
C2
C3
C5
C7
C8
C9
C10
C12
C13
C14
C15
C16
S1
S2
#T
#F
Meanof
quantitativescores
Morisita
0�07
57
0�01
97
0�00
47
TT
TT
TT
T0�00
30
0�00
38
0�00
27
0�01
59
0�00
36
80
0�01
61
Horn
0�02
94
0�03
31
0�00
24
TT
TT
TT
T0�00
09
0�00
16
0�00
07
0�13
59
0�03
57
80
0�03
00
Morisita-H
orn
0�07
63
0�02
00
0�00
48
TT
TT
TT
T0�00
30
0�00
37
0�00
26
0�13
56
0�08
99
80
0�04
20
Jost
Sim
pson
0�08
26
0�06
42
0�00
37
TT
TT
TT
T0�00
30
0�00
43
0�00
26
0�11
57
0�06
94
80
0�04
32
Renkonen*
0�02
94
0�03
31
0�00
24
TT
TT
TT
T0�00
09
0�00
16
0�00
07
0�16
90
0�14
33
80
0�04
76
Kulczynski*
0�02
94
0�03
31
0�00
24
TT
TT
TT
T0�00
09
0�00
16
0�22
92
0�16
90
0�22
35
80
0�08
61
Bray-C
urtis*
0�02
94
0�03
31
0�00
24
TT
TT
TT
T0�00
09
0�00
16
0�39
16
0�16
90
0�41
51
80
0�13
04
Canberra
0�00
00
0�15
84
0�01
70
TT
TT
TT
T0�00
00
0�00
00
0�34
33
0�22
60
0�36
99
80
0�13
93
Ru� zi� ck
a0�03
12
0�11
66
0�01
53
TT
TT
TT
T0�00
10
0�00
15
0�39
66
0�18
81
0�39
02
80
0�14
26
†BaselgaB-C
turn
0�02
94
0�03
31
0�00
24
TT
TT
TT
F0�00
09
0�00
16
0�00
07
0�16
90
0�00
31
71
0�03
00
NESS
0�00
62
0�03
51
0�00
14
TT
TT
TF
T0�01
37
0�00
10
0�00
09
0�14
31
0�09
45
71
0�03
70
†BaselgaR
turn
0�03
12
0�11
66
0�01
53
TT
TT
TT
F0�00
10
0�00
15
0�00
06
0�18
81
0�00
32
71
0�04
47
†PodaniB-C
turn*
0�02
94
0�03
31
0�00
24
TT
TT
TT
F0�00
09
0�00
16
0�39
16
0�16
90
0�41
56
71
0�13
05
†PodaniR
turn*
0�03
12
0�11
66
0�01
53
TT
TT
TT
F0�00
10
0�00
15
0�45
56
0�18
81
0�47
36
71
0�16
04
sim
0�00
00
0�05
47
0�00
00
TF
FT
TT
T0�00
00
0�00
00
0�00
00
0�14
85
0�00
26
62
0�02
57
Classic
Sørensen*
0�00
00
0�05
47
0�00
00
TF
FT
TT
T0�00
00
0�00
00
0�00
00
0�16
18
0�22
99
62
0�05
58
Classic
Jaccard*
0�00
00
0�15
84
0�01
70
TF
FT
TT
T0�00
00
0�00
00
0�00
00
0�18
54
0�24
04
62
0�07
52
Jost
Shannon
0�03
02
0�04
82
0�00
79
TT
TT
TF
F0�00
09
0�00
17
0�25
29
0�12
72
0�34
59
62
0�10
19
ChaoSørensen
0�03
00
0�03
30
0�00
34
TF
FT
TF
T0�00
19
0�00
23
0�00
15
0�04
81
0�08
49
53
0�02
56
ChaoJaccard
0�03
00
0�11
60
0�01
55
TF
FT
TF
T0�00
14
0�00
17
0�00
14
0�06
45
0�10
38
53
0�04
18
LandeShannon*
0�02
94
0�03
31
FF
TT
TT
FT
0�00
09
0�00
16
0�23
22
0�13
59
0�14
62
53
0�08
28
CYd
0�12
80
0�14
00
FF
TF
TT
TT
0�00
03
0�17
03
0�13
24
0�20
91
0�25
28
53
0�14
76
LandeSim
pson
0�25
86
0�02
00
FF
TT
TF
FT
0�46
63
0�00
37
0�29
05
0�06
14
0�04
46
44
0�16
36
Binomial
0�40
92
0�05
47
FF
FT
TT
FF
0�32
33
0�00
00
0�11
57
0�27
04
0�19
11
35
0�19
49
Gower*
0�00
00
0�05
77
0�13
50
TF
FF
FF
T0�00
00
0�00
00
0�50
54
0�41
37
0�46
02
35
0�19
65
Manhattan*
0�02
94
0�03
31
FF
FT
TT
FF
0�32
44
0�32
44
0�26
69
0�44
58
0�25
42
35
0�23
97
alt.Gower*
0�18
02
0�10
22
FF
FT
FF
TT
0�00
12
0�32
58
0�34
57
0�42
32
0�33
34
35
0�24
45
Av.Euclidean*
0�21
78
0�17
86
FF
FT
FF
TT
0�00
22
0�34
79
0�36
46
0�47
62
0�28
88
35
0�26
80
Euclidean*
0�26
25
0�13
93
FF
FT
TF
FT
0�31
68
0�37
75
0�35
86
0�52
03
0�26
70
35
0�32
03
*Pareto-dominated.
†Partitioned
turnover
componentofb.
© 2015 The Authors. Journal of Animal Ecology published by John Wiley & Sons Ltd on behalf of British Ecological Society., Journal of
Animal Ecology
8 L. J. Barwell, N. J. B. Isaac & W. E. Kunin
relative weighting of the desirable properties is changed,
or if personality properties or additional properties,
untested here, become important. Our personality proper-
ties highlight two additional sources of variation which
may further filter the appropriate metrics for some applica-
tions: (i) sensitivity to rare species and (ii) sensitivity to
nestedness. Our results indicate the first of these is traded-
off with performance for sampling properties (Fig. S16).
The most extreme example of this trade-off is bMorisita,
which is the most independent of sample size (Fig. S10),
Table 2. Summary of scores for personality and sampling properties among 29 beta-diversity metrics. Properties P1–P5 are described in
the text
Metric
Personality properties
P1 P2 P3 P4 P5
Morisita 0�2862 0�8538 0�9940 0�9798 0�0000Horn 0�1989 0�6046 0�9012 0�9195 0�0007Morisita-Horn 0�2861 0�8541 0�9940 0�9798 0�0000Renkonen 0�3305 0�9150 0�9544 0�9801 0�0007Jost Simpson 0�2631 0�7453 0�9880 0�9604 0�0000Kulczynski 0�1619 0�4575 0�9544 0�9801 0�0007Bray-Curtis 0�2678 0�8433 0�9544 0�9801 0�0007Canberra 0�2759 0�9000 0�7979 0�9802 1�0000Ru�zi�cka 0�2825 0�9150 0�9767 0�9900 0�0008Baselga B-C turn* 0�0198 0�0000 0�9544 0�9801 0�0007NESS 0�2424 0�7749 0�9634 0�9289 0�0000Baselga R turn* 0�0219 0�0000 0�9767 0�9900 0�0008Podani B-C turn* 0�2672 0�0000 0�9543 0�9801 0�0007Podani R turn* 0�3154 0�0000 0�9767 0�9900 0�0008sim 0�0000 0�0000 0�0000 0�0000 1�0000Classic Sørensen 0�2574 0�8182 0�0000 0�0000 1�0000Classic Jaccard 0�2759 0�9000 0�0000 0�0000 1�0000Jost Shannon 0�1675 0�1807 0�8676 0�8915 0�0007Chao Sørensen 0�2665 0�8406 0�0000 0�0000 0�0000Chao Jaccard 0�2819 0�9134 0�0000 0�0000 0�0000Lande Shannon 0�1996 1�4297 0�9012 0�9195 0�0007CYd 0�2582 0�9001 0�6221 0�6243 0�1682Lande Simpson 0�1121 5�0896 0�9940 48�5149 0�0000Binomial 0�1823 0�4500 0�3264 0�4599 1�0000Gower 0�2759 0�9000 1�0000 1�0000 1�0000Manhattan 0�1860 0�4575 0�9544 0�9801 0�0007alt. Gower 0�2154 0�9150 1�9088 1�9602 0�0007Av. Euclidean 0�2430 0�9766 1�4099 9�8504 0�0007Euclidean 0�2303 0�6905 0�9970 6�9653 0�0007*Partitioned turnover component of b.
Fig. 1. Biplot of the first two principal
components axes of the scores of 29 b-diversity metrics based on quantitative
scores for properties C1–C2, C14–C16,S1–S2 and P1–P5. Four partitioned turn-
over components are also shown, using
the partitioning methods proposed by
Baselga (2013) and Podani, Ricotta &
Schmera (2013). Together, PC1 and PC2
explain 52% of variation in scores.
© 2015 The Authors. Journal of Animal Ecology published by John Wiley & Sons Ltd on behalf of British Ecological Society., Journal of
Animal Ecology
Abundance-based b-diversity 9

at the expense of being almost completely insensitive to
turnover in rare species (Fig. S13). b-diversity metrics fall
along a continuum in terms of sensitivity to rare species.
bClassic Sørensen is conceptually linked to species richness
metrics of a-diversity such that rare and dominant species
are weighted equally. bHorn relates to Shannon entropy:
species are weighted by their relative abundance. bMorisita
is linked to the Gini-Simpson index of a-diversity (Jost
2007): rare species contribute little to the final value of
these metrics. Consequently, bMorisita performs well, even
with the very partial samples that ecologists usually work
with, because the missing rare species in small samples
have a negligible effect on the value of b. This may be
important: the emphasis bMorisita places on common spe-
cies is suitable when shifts in dominance are of interest
(e.g. when linking diversity to ecosystem function), but
will be less appropriate when patterns of turnover in rare
species of particular interest (e.g. complementarity of
reserve networks: Wiersma & Urban (2005)). Unfortu-
nately, those metrics that are sensitive to turnover in rare
species are, consequently, less robust in the face of under-
sampling.
In general, our results suggest that when insensitivity to
sample size (S1 and S2), sensitivity to turnover of individ-
uals (C7 and C8) and/or cumulative b (C2) are priorities,
bMorisita should be favoured. When turnover in rare spe-
cies is important and undersampling is not severe, the
presence–absence metric, bsim, is favoured due to superior
performance in terms of independence of a-diversity (C1),
probabilistic similarity (C3), independence of species repli-
cation (C14), measurement units (C15) and differences in
abundance (C16). However, bMorisita is almost completely
independent of sample size (S1), whilst bsim, bClassic Sørensen
and bClassic Jaccard
are eleventh, twelfth and eighteenth. This is
consistent with predictions that presence–absence metrics
are more sensitive to sample sizes.
An example of where our results have implications for
existing studies of b-diversity is in the spatial scaling of
b-diversity. Studies using presence–absence metrics have
shown that b-diversity decreases with the spatial grain of
samples (McGlinn & Hurlbert 2012; Barton et al. 2013).
One reason for this is statistical: the probability of a rare
species being turned over increases at finer grains (Keil
et al. 2012) both because rare species are range-restricted
and because fine-grain samples have (almost by definition)
much smaller sample sizes of individuals than do coarse-
grain samples. By contrast, common species are usually
more widespread than rare species and much less likely to
be turned over at fine grains. The trade-off we have noted
between robustness to undersampling and sensitivity to
rare species thus becomes relevant here: those metrics
which weight rare species turnover highly (including all
presence/absence measures) will likely find b shifting
with scale. It follows that abundance-based metrics, par-
ticularly those disproportionately influenced by dominant
species, will likely be less scale dependent than presence–absence metrics (Fig. S15).
A second consequence of this trade-off is that metrics
that are insensitive to turnover in rare species will also
return very low values of beta under a positive occu-
pancy–abundance relationship (Fig. S14), a pattern that is
near ubiquitous. Specialist applications focussing on rare
species may need to use metrics that are less robust to un-
dersampling but, consequently, will require larger sample
sizes to observe the rarer species: no abundance-based
metric is able to account for unseen shared species (i.e.
abundance-based equivalents of bChao Sørensen and
bChao Jaccard).
Another potential filter of metrics is sensitivity to
nestedness (P1). There are circumstances when the parti-
tioning of the nestedness and turnover components will
be a priority when choosing a metric. First, metrics
measuring purely species turnover address methodologi-
cal issues associated with species richness gradients (e.g.
latitudinal gradients: Koleff, Lennon & Gaston 2003b).
Moreover, patterns of nestedness and turnover are likely
to emerge as a result of different processes: distinguish-
ing these patterns may contribute to a more mechanistic
understanding of spatial patterns in b-diversity (e.g.
Baselga 2010). Our simulations include two abundance-
based metrics, bBray-Curtis and bRu�zi�cka, that can be addi-
tively partitioned into independent nestedness and turn-
over components. We find the partitioning method
described by Baselga (2013) generates turnover compo-
nents that are independent of nestedness, whilst the
method proposed by Podani, Ricotta & Schmera (2013)
does not.
A principal component analysis indicated a large
amount of redundancy among metrics. Yet our results
highlight one property which is lacking among existing
abundance-based b-diversity metrics. Three pieces of
information are absent in samples of species assemblages;
(i) how many species are missing in the sample, but pres-
ent at the site, (ii) their abundances and (iii) whether they
are shared or unshared between undersampled assem-
blage pairs. Abundance-based b-diversity metrics that
estimate this information and adjust the value of baccordingly are one avenue for improving performance
when there is undersampling. Recent developments in
biodiversity sampling theory (Green & Plotkin 2007;
Morlon et al. 2008; McGill 2011) and hierarchical Bayes-
ian techniques that model the observation process (K�ery
& Royle 2008) provide a useful starting point for devel-
oping such metrics.
The issues we have raised highlight that b-diversity is a
multi-faceted concept. Any study measuring b-diversityshould be explicit about its goals (which properties should
be emphasized) and assumptions (e.g. about sampling)
when filtering the available metrics.
Data accessibility
Code for simulations is available from figshare: http://dx.doi.org/
10.6084/m9.figshare.1305115 (Barwell, Isaac & Kunin 2015).
© 2015 The Authors. Journal of Animal Ecology published by John Wiley & Sons Ltd on behalf of British Ecological Society., Journal of
Animal Ecology
10 L. J. Barwell, N. J. B. Isaac & W. E. Kunin
Acknowledgements
We thank James Bullock, Stephen Sait and colleagues within the Biologi-
cal Records Centre for their feedback and Andr�es Baselga and an anony-
mous reviewer for their thoughtful comments. LB is funded by a NERC
studentship and WEK is supported by the EU FP7 SCALES project (con-
tract number 226852).
References
Anderson, M.J., Crist, T.O., Chase, J.M., Vellend, M., Inouye, B.D., Free-
stone, A.L. et al. (2011) Navigating the multiple meanings of beta diver-
sity: a roadmap for the practicing ecologist. Ecology Letters, 14, 19–28.Baiser, B., Olden, J.D., Record, S., Lockwood, J.L. & McKinney, M.L.
(2012) Pattern and process of biotic homogenization in the New Pan-
gaea. Proceedings of the Royal Society of London - Series B: Biological
Sciences, 279, 4772–4777.Balata, D., Piazzi, L. & Benedetti-Cecchi, L. (2007) Sediment disturbance
and loss of beta diversity on subtidal rocky reefs. Ecology, 88, 2455–2461.Barton, P.S., Cunningham, S.A., Manning, A.D., Gibb, H., Lindenmayer,
D.B. & Didham, R.K. (2013) The spatial scaling of beta diversity (ed A
Baselga). Global Ecology and Biogeography, 22, 639–647.Barwell, L.J., Isaac, N.J.B. & Kunin, W.E. (2015) Measuring beta-diver-
sity with abundance data. Figshare. doi: 10.6084/m9.figshare.1305115
Baselga, A. (2010) Partitioning the turnover and nestedness components of
beta diversity. Global Ecology and Biogeography, 19, 134–143.Baselga, A. (2013) Separating the two components of abundance-based
dissimilarity: balanced changes in abundance vs. abundance gradients
(ed R Freckleton). Methods in Ecology and Evolution, 4, 552–557.Beck, J., Holloway, J.D. & Schwanghart, W. (2013) Undersampling and
the measurement of beta diversity (ed D Orme). Methods in Ecology and
Evolution, 4, 370–382.Brown, J.H. (1984) On the relationship between abundance and distribu-
tion of species. American Naturalist, 124, 255–279.Cassey, P., Lockwood, J.L., Olden, J.D. & Blackburn, T.M. (2008) The
varying role of population abundance in structuring indices of biotic
homogenization. Journal of Biogeography, 35, 884–892.Chao, A., Chazdon, R.L., Colwell, R.K. & Shen, T.-J. (2005) A new sta-
tistical approach for assessing similarity of species composition with
incidence and abundance data. Ecology Letters, 8, 148–159.Chao, A., Chazdon, R.L., Colwell, R.K. & Shen, T.-J. (2006) Abundance-
based similarity indices and their estimation when there are unseen spe-
cies in samples. Biometrics, 62, 361–371.Chase, J.M. (2003) Community assembly: when should history matter?
Oecologia, 136, 489–498.Chase, J.M., Kraft, N.J.B., Smith, K.G., Vellend, M. & Inouye, B.D.
(2011) Using null models to disentangle variation in community dissimi-
larity from variation in a-diversity. Ecosphere, 2, Article 24.
Fisher, R.A., Corbet, A.S. & Williams, C.B. (1943) The relation between
the number of species and the number of individuals in a random sam-
ple of an animal population. Journal of Animal Ecology, 12, 42–58.Gabriel, D., Roschewitz, I., Tscharntke, T. & Thies, C. (2006) Beta diver-
sity at different spatial scales: plant communities in organic and conven-
tional agriculture. Ecological Applications, 16, 2011–2021.Green, J.L. & Plotkin, J.B. (2007) A statistical theory for sampling species
abundances. Ecology Letters, 10, 1037–1045.Hankin, R.K.S. (2007) Introducing untb, an R Package For Simulating
Ecological Drift Under the Unified Neutral Theory of Biodiversity.
Journal of Statistical Software, 22, 1–15.Harte, J., McCarthy, S., Taylor, K., Kinzig, A. & Fischer, M.L. (1999)
Estimating species-area relationships from plot to landscape scale using
species spatial-turnover data. Oikos, 86, 45–54.Holt, B.G., Lessard, J.-P., Borregaard, M.K., Fritz, S.A., Ara�ujo, M.B.,
Dimitrov, D. et al. (2013) An update of Wallace’s zoogeographic
regions of the world. Science, 339, 74–78.Jost, L. (2007) Partitioning diversity into independent alpha and beta com-
ponents. Ecology, 88, 2427–2439.Jost, L., Chao, A. & Chazdon, R. (2011) Compositional similarity and b
(beta) diversity. Biological Diversity: Frontiers in Measurement and
Assessment (eds A.E. Magurran & B.J. McGill), pp. 66–84. Oxford Uni-
versity Press, Oxford.
Keil, P., Schweiger, O., K€uhn, I., Kunin, W.E., Kuussaari, M., Settele, J.
et al. (2012) Patterns of beta diversity in Europe: the role of climate,
land cover and distance across scales. Journal of Biogeography, 39,
1473–1486.K�ery, M. & Royle, J.A. (2008) Hierarchical Bayes estimation of species
richness and occupancy in spatially replicated surveys. Journal of
Applied Ecology, 45, 589–598.Koleff, P., Gaston, K.J. & Lennon, J.J. (2003a) Measuring beta diversity
for presence-absence data. Journal of Animal Ecology, 72, 367–382.Koleff, P., Lennon, J.J. & Gaston, K.J. (2003b) Are there latitudinal gra-
dients in species turnover? Global Ecology and Biogeography, 12, 483–498.
Legendre, P. (2014) Interpreting the replacement and richness difference
components of beta diversity. Global Ecology and Biogeography, 23,
1324–1334.Legendre, P. & De C�aceres, M. (2013) Beta diversity as the variance of
community data: dissimilarity coefficients and partitioning. Ecology Let-
ters, 16, 951–963.Lennon, J.J., Koleff, P., Greenwood, J.J.D. & Gaston, K.J. (2001) The
geographical structure of British bird distributions: diversity, spatial
turnover and scale. Journal of Animal Ecology, 70, 966–979.
McGill, B.J. (2010) Towards a unification of unified theories of biodiver-
sity. Ecology Letters, 13, 627–642.McGill, B.J. (2011) Linking biodiversity patterns by autocorrelated ran-
dom sampling. American Journal of Botany, 98, 481–502.McGlinn, D.J. & Hurlbert, A.H. (2012) Scale dependence in species turn-
over reflects variance in species occupancy. Ecology, 93, 294–302.Morlon, H., Chuyong, G., Condit, R., Hubbell, S., Kenfack, D., Thomas,
D. et al. (2008) A general framework for the distance-decay of similarity
in ecological communities. Ecology Letters, 11, 904–917.Oksanen, J., Blanchet, F.G., Kindt, R., Legendre, P., Minchin, P.R.,
O’Hara, R.B. et al. (2013) vegan: Community Ecology Package. R
Package version 2.0-10. http://cran.r-project.org/package=vegan
Podani, J., Ricotta, C. & Schmera, D. (2013) A general framework for
analyzing beta diversity, nestedness and related community-level phe-
nomena based on abundance data. Ecological Complexity, 15, 52–61.Qian, H. & Ricklefs, R.E. (2007) A latitudinal gradient in large-scale beta
diversity for vascular plants in North America. Ecology Letters, 10,
737–744.R Development Core Team. (2014) R: A Language and Environment for
Statistical Computing. Version 3.1.1. R Foundation for Statistical Com-
puting, Vienna, Austria. http://www.R-project.org/
Smith, A.B. (2010) Caution with curves: caveats for using the species–arearelationship in conservation. Biological Conservation, 143, 555–564.
Whittaker, R.H. (1960) Vegetation of the Siskiyou Mountains, Oregon
and California. Ecological Monographs, 30, 280–338.Whittaker, R.H. (1972) Evolution and measurement of species diversity.
Taxon, 21, 213–251.Wiersma, Y.F. & Urban, D.L. (2005) Beta diversity and nature reserve
system design in the Yukon, Canada. Conservation Biology, 19, 1262–1272.
Received 15 October 2014; accepted 18 February 2015
Handling Editor: Tim Coulson
Supporting Information
Additional Supporting Information may be found in the online version
of this article.
Appendix S1. b-diversity metrics.
Appendix S2. Evaluation of metrics.
Appendix S3. Supplementary results.
© 2015 The Authors. Journal of Animal Ecology published by John Wiley & Sons Ltd on behalf of British Ecological Society., Journal of
Animal Ecology
Abundance-based b-diversity 11