THE ATOMIC-TO-MOLECULAR TRANSITION IN GALAXIES. II: H I AND H 2 COLUMN DENSITIES

arX
iv:0
803.
2023
v1 [
astr
o-ph
] 13
Mar
200
8TO APPEAR IN The Astrophysical Journal Supplement Series.
Preprint typeset using LATEX style emulateapj v. 26/01/00
A NEW H I SURVEY OF ACTIVE GALAXIES
LUIS C. HO1, JEREMY DARLING2, AND JENNY E. GREENE3,4
To appear in The Astrophysical Journal Supplement Series.
ABSTRACT
We have conducted a new Arecibo survey for HI emission for 113 galaxies with broad-line (type 1) activegalactic nuclei (AGNs) out to recession velocities as high as∼ 35,000 km s−1. The primary aim of the study isto obtain sensitive HI spectra for a well-defined, uniformly selected sample of active galaxies that have estimatesof their black hole masses in order to investigate correlations between HI properties and the characteristics of theAGNs. H I emission was detected in 66 out of the 101 (65%) objects with spectra uncorrupted by radio frequencyinterference, among which 45 (68%) have line profiles with adequate signal-to-noise ratio and sufficiently reliableinclination corrections to yield robust deprojected rotational velocities. This paper presents the basic surveyproducts, including an atlas of HI spectra, measurements of HI flux, line width, profile asymmetry, opticalimages, optical spectroscopic parameters, as well as a summary of a number of derived properties pertaining tothe host galaxies. To enlarge our primary sample, we also assemble all previously published HI measurementsof type 1 AGNs for which can can estimate black hole masses, which total an additional 53 objects. The finalcomprehensive compilation of 154 broad-line active galaxies, by far the largest sample ever studied, forms thebasis of our companion paper, which uses the HI database to explore a number of properties of the AGN hostgalaxies.
Subject headings: galaxies: active — galaxies: bulges — galaxies: ISM — galaxies: kinematics and dynamics— galaxies: nuclei — galaxies: Seyfert
1. INTRODUCTION
Central black holes (BHs) with masses ranging from∼ 106
to a few×109 M⊙ are an integral component of most, perhapsall, galaxies with a bulge component (Kormendy 2004), and al-though rarer, at least some late-type galaxies host nuclearBHswith masses as low as∼ 105 M⊙ (Filippenko & Ho 2003; Barthet al. 2004; Greene & Ho 2007a, 2007b). It is now widelybelieved that BHs play an important role in the life cycle ofgalaxies (see reviews in Ho 2004). To date, most of the obser-vational effort to investigate the relationship between BHs andtheir host galaxies have focused on the stellar component ofthehosts, especially the velocity dispersion and luminosity of thebulge, which empirically seem most closely coupled to the BHmass. Although the gas content of inactive galaxies has beenextensively studied (e.g., Haynes & Giovanelli 1984; Knappetal. 1985; Roberts et al. 1991; Bregman et al. 1992; Morgantiet al. 2006), comparatively little attention has been devoted tocharacterizing the interstellar medium of active galaxiesor ofsystems with knowledge of their BH mass or accretion rate.
The gaseous medium of the host galaxy, especially the coldphase as traced in neutral atomic or molecular hydrogen, offersa number of diagnostics inaccessible by any other means. Sincecold gas constitutes the very raw material out of which both thestars form and the BH grows, the cold gas content of the hostgalaxy is one of the most fundamental quantities that can bemeasured in the effort to understand the coevolution of BHsand galaxies. At the most rudimentary level, we might naivelyexpect the gas content of the host to be correlated with the BHaccretion rate or the luminosity of its active galactic nucleus(AGN). Likewise, the gas content should reflect the particularevolutionary stage of the host galaxy. Many current models
(e.g., Granato et al. 2004; Springel et al. 2005) invoke AGNfeedback as a key ingredient for galaxy formation and for cou-pling the BH to its host. Depending on the violence with whichthe accretion energy is injected into the host and the evolution-ary state of the system, AGN feedback can wreck havoc on theinterstellar medium of the host. For example, recent HI absorp-tion observations of radio-loud AGNs detect substantial quanti-ties of high-velocity outflowing neutral gas, presumably inthemidst of being expelled from the host galaxy by the radio jet(Morganti et al. 2007). Performing a careful, systematic censusof the cold gas content of AGN hosts will provide much neededempirical guidance for AGN feedback models. Apart from thesheer gas mass, HI and CO observations, even when conductedin spatially unresolved mode, can provide other useful probesof the physical properties of the host, and of its circumgalacticenvironment (e.g., Ho 2007a, 2007b). For example, the widthof the integrated line profile, if it is sufficiently regular,gives anestimate of the rotation velocity of the disk, and hence an addi-tional handle on the gravitational potential of the system.Com-bining the line width with the Tully-Fisher (1977) relation, wecan infer immediately the total luminosity of the host, indepen-dent of any contamination from the AGN. The degree of sym-metry of the line profile furnishes useful, if crude, informationon the spatial distribution of gas within and around the host, aswell as an effective probe of possible dynamic disturbancesdueto neighboring galaxies.
The primary goal of this study is to quantify the HI content ofa large, well-defined sample of active galaxies with uniformlymeasured BH masses and optical properties, spanning a widerange in AGN properties. Despite the obvious importance of
1The Observatories of the Carnegie Institution of Washington, 813 Santa Barbara St., Pasadena, CA 91101.2Center for Astrophysics and Space Astronomy, Department ofAstrophysical and Planetary Sciences, University of Colorado, 389 UCB, Boulder, CO 80309-0389.3Princeton Observatory, Peyton Hall, Princeton University, Princeton, NJ 08544-1001.4Hubble Fellow and Carnegie-Princeton Fellow.
1

2 HO, DARLING, & GREENE
FIG. 1.— The distribution of BH masses and Eddington ratios for the sampleincluded in this study. The 101 newly surveyed objects for which H I observa-tions were successfully obtained are plotted as circles, while the sample of 53sources taken from the literature are marked as triangles.
understanding the cold gas component of AGN host galaxies,there has been relatively little modern work conducted withthisexplicit goal in mind. Although there have been a number ofH I surveys of AGNs, most of them have focused on relativelylow-luminosity Seyfert nuclei (Allen et al. 1971; Heckman etal. 1978; Bieging & Biermann 1983; Mirabel & Wilson 1984;Hutchings 1989; Greene et al. 2004) and radio-emitting ellip-tical galaxies (Dressel et al. 1982; Jenkins 1983), with onlylimited attention devoted to higher luminosity quasars (Condonet al. 1985; Hutchings et al. 1987; Lim & Ho 1999). This is inpart due to sensitivity limitations (quasars are more distant), butalso due to the poor baselines of pre-upgrade Arecibo5 spectra.With the new Gregorian optics,L-band receiver, and modernbackend at Arecibo, the time is ripe to revisit the problem ina concerted fashion. In light of the scientific issues outlinedabove, the motivation has never been stronger. We are particu-larly keen to use the HI line width as a kinematic tracer of thehost galaxy potential. Since the rotation velocity of the disk iscorrelated with the stellar velocity dispersion of the bulge (seeHo 2007a, and references therein), the HI line width can beused as a new variable to investigate the correlation betweenBH mass and galaxy potential. We are additionally interestedin using the HI spectra to obtain dynamical masses for the hostgalaxies, to use the line shape to probe the nearby environmentand dynamical state of the hosts, and to evaluate possible corre-lations between HI content and AGN properties. These issuesare investigated in a companion paper (Ho et al. 2008).
2. OBSERVATIONS AND DATA REDUCTION
2.1. Sample
Our sample of AGNs was chosen with one overriding sci-entific motivation in mind: the availability of a reliable BHmass estimate. As we rely on the virial mass method to es-timate BH masses (Kaspi et al. 2000; Greene & Ho 2005b;Peterson 2007), this limits our targets to type 1 AGNs. Sensi-tivity considerations with the current Arecibo system imposesa practical redshift limit ofz∼<0.1. Apart from these two fac-tors, and the visibility restrictions of Arecibo (0
∼< δ ∼< 37),the targets were selected largely randomly to fill the availableschedule blocks of the telescope. The 113 newly observed ob-jects, whose basic properties are summarized in Table 1, con-tains two subsamples. The first comprises 98 type 1 AGNsfrom the Fourth Data Release of the Sloan Digital Sky Survey(SDSS; Adelman-McCarthy et al. 2006), which form part ofan on-going study of low-redshift AGNs by Greene (2006; seealso Greene & Ho 2004, 2005b, 2006a, 2006b, 2007a, 2007b).Although the SDSS objects strictly do not form a complete orunbiased sample, they are representative of low-redshift broad-line AGNs of moderate to high luminosities. WithMg ≈ −18.8to −23.1 mag, only∼ 3− 4 objects satisfy the conventional lu-minosity threshold of quasars6, but most are very prominentSeyfert 1 nuclei. Twenty-eight of the objects have broad Hαprofiles with full-width at half maximum (FWHM) less than2000 km s−1, and thus meet the formal line width criterion ofnarrow-line Seyfert 1 galaxies (e.g., Osterbrock & Pogge 1985).The second subsample, in total 15 objects, were primarily cho-sen because they have been studied with reverberation mapping(Kaspi et al. 2000; Peterson et al. 2004); we deem these tobe high-priority objects because they have better-determinedBH masses. This subsample includes seven Palomar-Green(PG) sources (Schmidt & Green 1983), among them five lu-minous enough to qualify as bona fide quasars, and two satis-fying the line width criterion of narrow-line Seyfert 1 galaxies(PG 0003+199 and PG 1211+143).
To augment the sample size and to increase its dynamic rangein terms of BH mass and AGN luminosity, we performed acomprehensive search of the literature to compile all previouslypublished HI measurements of type 1 AGNs that have suffi-cient optical data to allow estimation of BH masses. The re-sults of this exercise yielded a sizable number of additionalobjects (53), the details of which are documented in the Ap-pendix. Our final sample, now totaling 166 and by far thelargest ever studied, covers a wide range of BH masses, fromMBH ≈ 105 to 109 M⊙, and a significant spread in Edding-ton ratios, from logLbol/LEdd ≈ −2.7 to 0.3 (Fig. 1), whereLEdd ≡ 1.26× 1038
(
MBH/M⊙
)
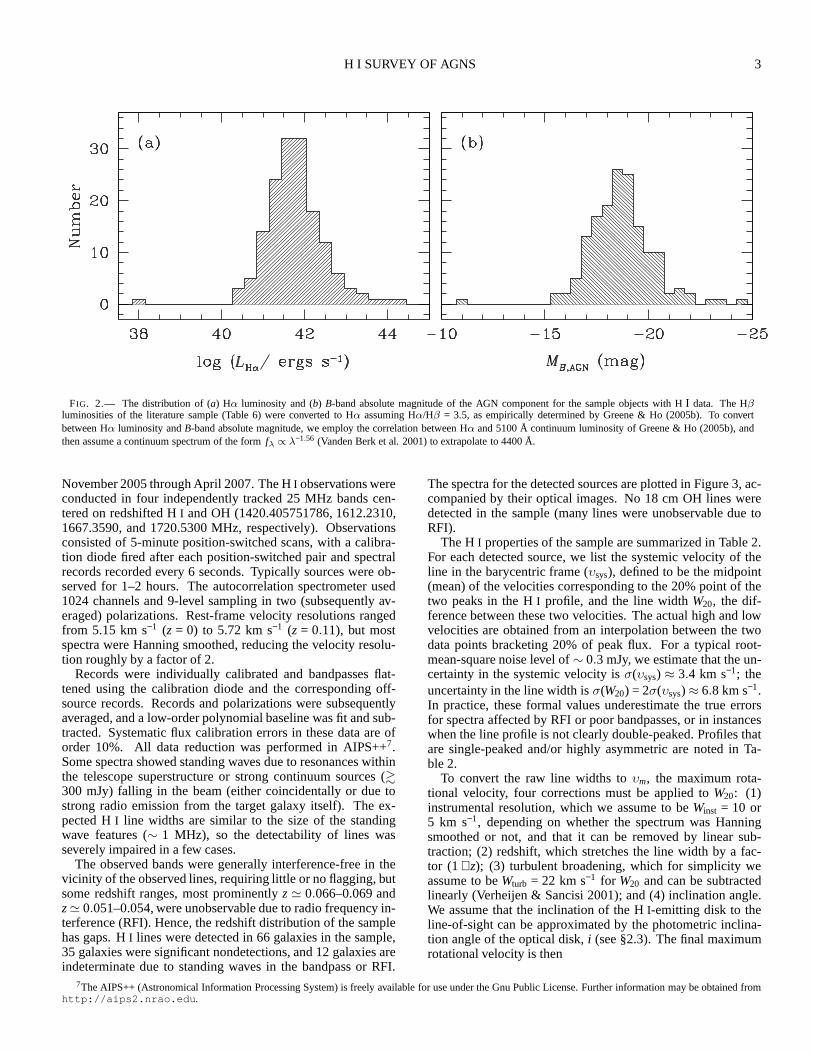
ergs s−1. Although the sam-ple definitely contains predominantly low-luminosity AGNs,it covers at least 4 orders of magnitude in nuclear luminos-ity (Fig. 2a), from LHα ≈ 1040 to 1044 ergs s−1 (excluding theultra-low-luminosity object NGC 4395 atLHα ≈ 1038 ergs s−1),which in more familiar units corresponds toB-band absolutemagnitudes ofMB ≈ −15.5 to −24.75 mag (Fig. 2b).
2.2. Arecibo Observations
We observed the 21 cm spin-flip transition of neutral hydro-gen (HI) in our sample at the Arecibo radio telescope from
5The Arecibo Observatory is part of the National Astronomy and Ionosphere Center, which is operated by Cornell University under a cooperative agreement withthe National Science Foundation.
6The canonical luminosity threshold of quasars,MB = −23.0 mag (Schmidt & Green 1983), translates toMB = −22.1 mag in our distance scale, which assumesH0= 70 km s−1 Mpc−1, Ωm = 0.3, andΩΛ = 0.7. For a power-law AGN spectrum of the formfλ ∝ λ−1.56 (Vanden Berk et al. 2001), this threshold isMg ≈ −22.3 mag.
H I SURVEY OF AGNS 3
FIG. 2.— The distribution of (a) Hα luminosity and (b) B-band absolute magnitude of the AGN component for the sampleobjects with HI data. The Hβluminosities of the literature sample (Table 6) were converted to Hα assuming Hα/Hβ = 3.5, as empirically determined by Greene & Ho (2005b). To convertbetween Hα luminosity andB-band absolute magnitude, we employ the correlation between Hα and 5100 Å continuum luminosity of Greene & Ho (2005b), andthen assume a continuum spectrum of the formfλ ∝ λ−1.56 (Vanden Berk et al. 2001) to extrapolate to 4400 Å.
November 2005 through April 2007. The HI observations wereconducted in four independently tracked 25 MHz bands cen-tered on redshifted HI and OH (1420.405751786, 1612.2310,1667.3590, and 1720.5300 MHz, respectively). Observationsconsisted of 5-minute position-switched scans, with a calibra-tion diode fired after each position-switched pair and spectralrecords recorded every 6 seconds. Typically sources were ob-served for 1–2 hours. The autocorrelation spectrometer used1024 channels and 9-level sampling in two (subsequently av-eraged) polarizations. Rest-frame velocity resolutions rangedfrom 5.15 km s−1 (z = 0) to 5.72 km s−1 (z = 0.11), but mostspectra were Hanning smoothed, reducing the velocity resolu-tion roughly by a factor of 2.
Records were individually calibrated and bandpasses flat-tened using the calibration diode and the corresponding off-source records. Records and polarizations were subsequentlyaveraged, and a low-order polynomial baseline was fit and sub-tracted. Systematic flux calibration errors in these data are oforder 10%. All data reduction was performed in AIPS++7.Some spectra showed standing waves due to resonances withinthe telescope superstructure or strong continuum sources (&300 mJy) falling in the beam (either coincidentally or due tostrong radio emission from the target galaxy itself). The ex-pected HI line widths are similar to the size of the standingwave features (∼ 1 MHz), so the detectability of lines wasseverely impaired in a few cases.
The observed bands were generally interference-free in thevicinity of the observed lines, requiring little or no flagging, butsome redshift ranges, most prominentlyz ≃ 0.066–0.069 andz ≃ 0.051–0.054, were unobservable due to radio frequency in-terference (RFI). Hence, the redshift distribution of the samplehas gaps. HI lines were detected in 66 galaxies in the sample,35 galaxies were significant nondetections, and 12 galaxiesareindeterminate due to standing waves in the bandpass or RFI.
The spectra for the detected sources are plotted in Figure 3,ac-companied by their optical images. No 18 cm OH lines weredetected in the sample (many lines were unobservable due toRFI).
The HI properties of the sample are summarized in Table 2.For each detected source, we list the systemic velocity of theline in the barycentric frame (υsys), defined to be the midpoint(mean) of the velocities corresponding to the 20% point of thetwo peaks in the HI profile, and the line widthW20, the dif-ference between these two velocities. The actual high and lowvelocities are obtained from an interpolation between the twodata points bracketing 20% of peak flux. For a typical root-mean-square noise level of∼ 0.3 mJy, we estimate that the un-certainty in the systemic velocity isσ(υsys) ≈ 3.4 km s−1; theuncertainty in the line width isσ(W20) = 2σ(υsys) ≈ 6.8 km s−1.In practice, these formal values underestimate the true errorsfor spectra affected by RFI or poor bandpasses, or in instanceswhen the line profile is not clearly double-peaked. Profiles thatare single-peaked and/or highly asymmetric are noted in Ta-ble 2.
To convert the raw line widths toυm, the maximum rota-tional velocity, four corrections must be applied toW20: (1)instrumental resolution, which we assume to beWinst = 10 or5 km s−1, depending on whether the spectrum was Hanningsmoothed or not, and that it can be removed by linear sub-traction; (2) redshift, which stretches the line width by a fac-tor (1+ z); (3) turbulent broadening, which for simplicity weassume to beWturb = 22 km s−1 for W20 and can be subtractedlinearly (Verheijen & Sancisi 2001); and (4) inclination angle.We assume that the inclination of the HI-emitting disk to theline-of-sight can be approximated by the photometric inclina-tion angle of the optical disk,i (see §2.3). The final maximumrotational velocity is then
7The AIPS++ (Astronomical Information Processing System) is freely available for use under the Gnu Public License. Further information may be obtained fromhttp://aips2.nrao.edu.

4H
O,D
AR
LIN
G,&
GR
EE
NE
TABLE 1: The Sample
Source Name Alternate Name C Type q i D25 z DL Mg g − r σ∗±error FWHMHα log LHα log MBH log Lbol
() (′′) (Mpc) (mag) (mag) (km s−1) (km s−1) (L⊙) (M⊙) (LEdd)(1) (2) (3) (4) (5) (6) (7) (8) (9) (10) (11) (12) (13) (14) (15) (16)
SDSS J000805.62+145023.3 · · · 0.37 SBb 0.45 69.5 17.8 0.0454 201.6 −20.93 0.18 140±27 7211 41.17 7.61 −2.06SDSS J003646.45+145936.9 · · · 0.44 S0/Sp 0.85 33.5 6.9 0.0892 408.8 −20.81 −0.44 (149±15) 1220 41.42 6.16 −0.39SDSS J004055.88+153349.0 · · · 0.43 S0/Sp 0.89 28.9 6.9 0.0988 455.7 −21.49 0.11 124±21 532 41.19 5.29 0.28SDSS J004719.39+144212.6 Mrk 1146 0.44 SBbc 0.63 54.8 25.9 0.0393 173.7 −21.99 −0.17 180±42 2185 41.62 6.79 −0.85SDSS J010712.03+140844.9 · · · 0.37 E/S0 0.90 27.7: 4.6 0.0768 349.0 −19.87 −0.01 128±26 880 42.57 6.50 0.26SDSS J015046.68+132359.9 0.41 E/S0 0.66 52.2: 3.8 0.0941 432.8 −20.24 0.30 90±33 1085 41.76 6.24 −0.18SDSS J075245.60+261735.7 · · · 0.38 E/S0 0.96 17.8: 5.5 0.0822 374.6 −21.35 −0.17 (94±9) 1139 42.15 6.50 −0.10SDSS J080243.39+310403.3 0.34 E/S0 0.84 34.2 10.6 0.0409 181.0 −20.80 0.47 151±17a 5191 41.84 7.69 −1.56SDSS J080538.66+261005.4 IC 492 0.51 SBcd · · · 25 62.8 0.0169 73.6 −20.63 0.20 100±14 3108 40.16 6.30 −1.62SDSS J080546.97+260532.9 · · · 0.33 S0 · · · 20: 6.7 0.0738 334.4 −20.98 0.25 91±28 2395 41.43 6.77 −0.99SDSS J081700.40+343556.3 0.28 E/S0 0.83 36.3: 9.8 0.0617 277.4 −20.63 0.86 119±21 4302 42.01 7.61 −1.33SDSS J081835.73+285022.4 · · · 0.37 S0/Sp 0.82 36.5: 6.9 0.0772 350.9 −20.77 0.35 135±28 1646 41.49 6.47 −0.64SDSS J082048.30+282217.8 0.42 Sp(d) 0.71 47.7 4.9 0.0932 428.4 −20.22 0.68 187±21 2560 41.22 6.71 −1.12SDSS J082320.68+074020.2 0.56 SBc 0.96 16.6 12.6 0.0646 290.8 −21.39 0.66 103±18 10852 41.17 7.98 −2.43SDSS J083045.36+340532.1 0.31 SBa 0.47 67.4 11.3 0.0623 279.9 −21.10 0.31 210±46 1772 42.10 6.87 −0.52SDSS J083107.63+052105.9 0.30 E/S0 0.87 30.8 7.6 0.0635 285.7 −20.09 0.97 223±30 3811 41.39 7.16 −1.42SDSS J083747.89+053644.8 0.34 E/S0 0.69 49.2 5.9 0.0991 457.0 −20.57 0.82 127±32 5020 41.87 7.67 −1.51
SDSS J084025.51+033301.7 0.35 E/S0 0.85 33.1: 8.1 0.0605 271.6 −20.81 0.20 164±32b 1544 42.03 6.71 −0.42SDSS J084556.67+340936.2 0.38 S0/Sp 0.90 27.8 17.6 0.0655 295.1 −21.49 0.60 102±27 1498 41.63 6.46 −0.51SDSS J090028.53+060842.5 · · · 0.38 S0/Sp 0.90 27.1: 5.6 0.0773 351.1 −19.94 0.30 125±21 1784 41.05 6.30 −0.85SDSS J091222.31+065829.0 · · · 0.42 S0/Sp 0.91 25.9: 3.8 0.0781 355.3 −19.53 0.45 273±58 6960 41.16 7.57 −2.03SDSS J093240.55+023332.6 0.40 S0/Sp 0.79 40.2 9.1 0.0568 254.2 −20.79 0.66 102±17 3688 41.61 7.25 −1.32SDSS J093259.60+040506.0 0.41 S0/Sp 0.89 27.9 10.6 0.0590 264.7 −21.25 0.54 70.5±6.7a 4314 41.53 7.35 −1.49SDSS J093812.26+074340.0 0.34 E/S0 0.79 49.9 16.0 0.0219 95.5 −19.97 0.72 119±8.0a 3365 41.03 6.85 −1.42SDSS J093917.26+363343.9MCG +06-21-068 0.31 S0 0.68 50.3 29.3 0.0201 87.3 −19.95 0.69 117±20 3146 40.71 6.62 −1.47SDSS J094529.37+093610.4 MS 0942.8+0950 0.32 SB0 0.67 50.8 18.7 0.0133 57.6 −18.82 0.63 118±20 1933 40.53 6.08 −1.08
SDSS J095955.85+130237.8 NGC 3080 0.34 Sa 0.96 17.1: 47.7 0.0354 156.1 −21.69 0.45 100±54b 1796 41.75 6.69 −0.64SDSS J100155.79+055413.3 0.35 Sa · · · 80.0: · · · 0.1034 478.5 −20.77 0.69 131±21 5254 41.81 7.68 −1.58SDSS J102148.90+030732.2 0.42 Sa 0.77 41.8 10.0 0.0618 277.8 −21.27 0.53 (452±45) 2556 41.48 6.85 −1.03SDSS J102402.60+062943.9 · · · 0.43 Sa 0.93 22.8 12.5 0.0440 195.2 −20.69 0.21 68±23 1561 41.26 6.29 −0.66SDSS J102925.73+140823.2 0.27 S0 0.63 54.8 14.9 0.0608 273.0 −21.61 0.61 181±25 4529 41.67 7.47 −1.49SDSS J104326.47+110524.3 0.40 S0/Sp 0.75 44.0: 8.9 0.0476 211.5 −20.35 0.03 (262±26) 4619 42.15 7.75 −1.35SDSS J104913.79+044039.9 0.38 S0/Sp 0.67 51.3 6.6 0.0884 404.7 −20.57 0.59 212±36 3272 41.52 7.10 −1.25SDSS J105115.42+054824.6 · · · 0.40 Sa 0.27 90.0 12.4 0.0695 313.9 −20.06 0.47 173±25 3105 41.46 7.02 −1.22SDSS J110538.99+020257.4 0.40 S0/Sp 0.65 53.0 10.7 0.1066 494.4 −22.60 0.19 226±50 3830 42.83 7.96 −0.97SDSS J110640.20+051905.6 0.40 SBb 0.79 39.9 13.2 0.0913 419.1 −21.99 0.60 140±15a 5770 42.10 7.92 −1.57SDSS J110654.46+061213.1 · · · 0.29 E 0.85 33.5: 11.4 0.0435 192.6 −19.83 0.37 93±29 6260 40.96 7.37 −2.00SDSS J111031.61+022043.2 · · · 0.41 E/S0 0.81 37.6: 4.6 0.0795 361.8 −20.01 0.29 70±15 1016 41.16 5.85 −0.31SDSS J111045.96+113641.6 0.40 SBb 0.80 39.2 25.8 0.0423 187.4 −21.48 0.56 110±18 3102 41.18 6.86 −1.30SDSS J111237.43+120729.5 0.35 Sa 0.48 66.6 20.2 0.0467 207.7 −20.72 0.76 189±26 4651 40.74 6.98 −1.80SDSS J111639.15+040427.6 · · · 0.32 E 0.81 37.5: 7.5 0.0745 337.9 −20.32 0.10 67±22 2483 41.45 6.81 −1.02SDSS J112328.11+052823.2 0.42 E/S0 0.85 33.5 4.7 0.1013 468.3 −20.85 0.29 232±80b 1516 42.00 6.67 −0.40SDSS J112455.86+080615.3 0.44 SBb 0.77 42.3 9.7 0.0701 316.7 −21.68 0.50 118±29 3970 40.96 6.96 −1.59SDSS J112555.85+073107.8 0.36 SBa 0.90 26.5 8.3 0.0749 337.7 −21.04 0.59 121±17 4915 41.39 7.39 −1.65SDSS J112813.02+102308.3 · · · 0.42 S0/Sp 0.98 12.2: 6.9 0.0504 224.7 −20.80 0.05 113±113 1079 41.87 6.30 −0.14SDSS J112904.01+061140.0 0.32 E/S0 0.94 20.1 6.3 0.0734 332.8 −20.74 0.53 153±26 6974 41.99 8.03 −1.77

HIS
UR
VE
YO
FA
GN
S5
TABLE 1: The Sample—Continued
Source Name Alternate Name C Type q i D25 z DL Mg g − r σ∗±error FWHMHα log LHα log MBH log Lbol
() (′′) (Mpc) (mag) (mag) (km s−1) (km s−1) (L⊙) (M⊙) (LEdd)(1) (2) (3) (4) (5) (6) (7) (8) (9) (10) (11) (12) (13) (14) (15) (16)
SDSS J113111.94+100231.3 · · · 0.46 Sa 0.48 66.9 12.7 0.0744 337.3 −21.05 0.37 104±13 2024 41.01 6.39 −0.98SDSS J113249.28+101747.3 IC 2921 0.34 SBa 0.43 70.7 17.1 0.0437 193.6 −20.81 0.55 210±32 4002 41.64 7.34 −1.38SDSS J114008.71+030711.3 · · · 0.41 SBa 0.98 11.9 7.5 0.0811 369.5 −20.67 0.33 92±39 591 41.33 5.46 0.23SDSS J114105.71+024117.0 0.23 E 0.74 44.9 10.7 0.0931 427.9 −21.75 0.27 (283±28) 2423 42.61 7.43 −0.63SDSS J115038.86+020854.2 · · · 0.36 Sa 0.33 82.2 14.1 0.1094 508.2 −20.84 0.77 155±36 6013 41.32 7.53 −1.85SDSS J120011.27+100135.6 VIII Zw 160 0.32 E 0.92 24.1: 8.2 0.0854 390.1 −21.73 0.25 123±28 3787 42.38 7.70 −1.10SDSS J120257.81+045045.0 IC 756 0.49 SBcd 0.40 74.1 58.2 0.0207 90.1 −20.75 0.50 102±20 2252 40.12 5.99 −1.35SDSS J120330.23+123140.9 0.40 Sb 0.63 54.3 13.4 0.0646 290.8 −20.97 0.42 75±15 2511 40.56 6,33 −1.31SDSS J120332.94+022934.5 UM 472 0.24 SBc 0.70 48.8 18.8 0.0775 352.1 −22.29 0.15 125±31 2666 42.26 7.32 −0.83SDSS J120648.31+065912.2 0.30 E · · · · · · · · · 0.0803 365.5 −20.71 0.56 133±31 4135 41.57 7.33 −1.43SDSS J121629.91+084253.3 0.32 S0 0.41 72.6 9.4 0.0709 320.5 −20.42 0.64 118±29 3391 41.85 7.31 −1.17SDSS J121930.87+064334.4 MS 1217.0+0700 0.35 Sa 0.96 16.7: 7.6 0.0804 366.1 −21.78 0.25 113±23 1671 42.30 6.93 −0.40SDSS J122042.00+112405.2 0.41 Sb 0.73 45.8 9.4 0.0932 428.1 −21.55 0.48 131±45 3155 41.76 7.20 −1.14SDSS J122324.13+024044.4 Mrk 50 0.34 E/S0 0.59 57.8: 22.5 0.0236 102.9 −19.84 0.55 78±15 3878 41.64 7.32 −1.36SDSS J122811.42+095126.8 · · · 0.34 E/S0 0.87 31.7: 11.5 0.0639 287.4 −20.78 0.61 123±21 4888 41.09 7.22 −1.74SDSS J123235.82+060310.0 · · · 0.26 E 0.97 14.8: 7.6 0.0838 382.5 −21.24 0.27 175±30 2679 41.98 7.17 −0.92SDSS J123639.78+040758.4 · · · 0.33 S0 0.28 90.0 20.4 0.0706 319.0 −21.06 0.54 147±22 5808 41.30 7.49 −1.83SDSS J123944.23+120159.9 0.43 Sb 0.55 61.3 13.4 0.0857 391.7 −21.72 0.71 223±30 6360 40.90 7.35 −2.03SDSS J124239.13+054717.6 · · · 0.36 SBa 0.84 35.0: 7.5 0.0936 430.1 −20.73 0.38 107±29 2895 41.27 6.85 −1.21SDSS J124319.98+025256.2 0.35 S0/Sp 0.78 40.8 6.9 0.0867 396.6 −20.89 0.57 122±15 1084 41.69 6.20 −0.20SDSS J124635.24+022208.7 PG 1244+026 0.32 E 0.95 19.2: 7.2 0.0482 214.3 −20.85 −0.04 (171±17) 966 41.73 6.12 −0.09SDSS J124913.75+151510.5 0.35 Sa 0.80 39.3 12.6 0.0834 380.6 −21.64 0.80 197±22 2437 41.31 6.72 −1.05SDSS J125039.08+141241.0 0.33 Sa 0.46 68.2 15.9 0.0847 386.7 −21.43 0.77 177±20 2682 41.44 6.88 −1.10SDSS J130241.53+040738.6 · · · 0.40 S0/Sp 0.97 14.6: 3.7 0.1022 472.3 −20.50 0.21 186±40 4819 41.81 7.60 −1.50SDSS J130803.04+035114.5 · · · 0.30 E 0.69 49.3: 9.6 0.0706 319.4 −20.87 0.28 161±52 981 41.80 6.17 −0.07SDSS J132026.49+051113.5 · · · 0.35 S0 0.64 53.9: 6.7 0.0984 453.7 −20.96 0.14 102±28 1617 41.89 6.67 −0.50SDSS J132442.44+052438.8 · · · 0.41 S0/Sp 0.79 40.0 3.6 0.1158 540.6 −20.08 0.06 127±70 12025 41.93 8.49 −2.28SDSS J134952.84+020445.1 UM 614 0.27 S0 0.51 64.5 21.0 0.0328 144.4 −20.35 0.39 138±13 2657 41.71 7.02 −1.00SDSS J140018.42+050242.2 TOL 1358+052 0.41 SBb 0.76 43.3 19.0 0.0342 150.5 −21.29 0.30 145±14 3340 41.26 6.97 −1.34SDSS J142748.28+050222.0 · · · 0.46 E/S0 0.96 17.2: 4.8 0.1061 491.8 −22.45 −0.27 (26±3) 1513 42.62 7.01 −0.21SDSS J143450.62+033842.5 · · · 0.53 Scd 0.86 32.2 16.3 0.0286 123.6 −20.19 0.27 77±25 1480 41.87 6.58 −0.42SDSS J145047.19+033645.4 · · · 0.40 S0/Sp 0.56 60.7: 5.0 0.0665 300.0 −19.34 0.31 119±21 1987 41.05 6.39 −0.94SDSS J150556.55+034226.3 Mrk 1392 0.27 SBb 0.53 62.8 33.4 0.0359 158.1 −22.07 0.16 199±18 4373 42.12 7.69 −1.32SDSS J153839.19+024324.7 0.39 Sb 0.69 49.2 20.3 0.0314 137.9 −18.98 0.28 (953±95) 3982 40.50 6.71 −1.74SDSS J155417.43+323837.8 0.34 S0/Sp 0.83 36.0 9.8 0.0483 214.9 −21.04 0.55 122±32 4734 42.10 7.75 −1.40SDSS J160936.42+254459.6 0.35 S0/Sp 0.89 29.1: 7.6 0.0411 181.8 −19.97 0.66 145±22 8562 41.40 7.89 −2.14SDSS J163152.23+345328.7 0.41 SBa 0.85 33.8 11.7 0.0732 331.6 −21.54 0.56 130±21 1633 41.73 6.59 −0.56SDSS J163159.59+243740.3 0.37 E/S0 0.89 29.0: 5.7 0.0435 192.7 −19.39 0.47 82±26 836 40.84 5.50 −0.23SDSS J163453.67+231242.7MCG +04-39-016 0.45 Sb 0.78 40.7 16.5 0.0386 170.5 −21.50 0.51 117±20 4354 40.96 7.05 −1.68SDSS J163523.44+263046.5 0.31 E/S0 0.64 53.9 10.3 0.0708 319.8 −20.89 0.76 107±18 2501 41.14 6.65 −1.13SDSS J165601.61+211241.2 0.36 Sp 0.50 65.2: 9.7 0.0491 218.6 −20.18 0.68 109±29 5429 41.50 7.54 −1.70SDSS J170102.29+340400.5 0.38 E/S0 0.69 49.8: 4.5 0.0944 433.9 −20.14 0.53 168±37 5917 42.47 8.15 −1.48SDSS J171257.02+231526.8 0.38 Sa 0.47 67.6 11.2 0.0570 255.2 −20.62 0.73 141±21 5243 40.61 7.02 −1.95SDSS J171520.19+274825.9 0.36 Sa 0.45 69.5 6.7 0.1069 496.2 −20.55 0.61 59±27b 5023 41.67 7.56 −1.58SDSS J171601.93+311213.8 0.41 Sa 0.94 21.0 8.9 0.1102 512.1 −23.07 0.09 (367±37) 1648 43.20 7.41 −0.10SDSS J210622.99+105606.5 · · · 0.39 Sb 0.80 39.4 6.5 0.0947 435.8 −21.18 −0.12 106±28 3179 41.36 6.98 −1.26

6H
O,D
AR
LIN
G,&
GR
EE
NE
TABLE 1: The Sample—Continued
Source Name Alternate Name C Type q i D25 z DL Mg g − r σ∗±error FWHMHα log LHα log MBH log Lbol
() (′′) (Mpc) (mag) (mag) (km s−1) (km s−1) (L⊙) (M⊙) (LEdd)(1) (2) (3) (4) (5) (6) (7) (8) (9) (10) (11) (12) (13) (14) (15) (16)
SDSS J210721.91+110359.0 · · · 0.37 S0/Sp 0.42 71.7 9.2 0.0423 187.1 −19.83 −0.27 69±23 4108 40.81 6.91 −1.67SDSS J211646.34+110237.4 · · · 0.34 Sa 0.92 24.5 12.3 0.0806 366.9 −22.01 −0.18 104±48 2861 42.21 7.36 −0.91SDSS J223338.42+131243.6 · · · 0.34 SB0 0.52 63.4 14.2 0.0934 429.4 −22.26 0.06 161±46 3122 42.24 7.45 −0.97SDSS J225305.11+140351.2 · · · 0.32 E/S0 0.74 44.7: 8.1 0.0925 424.9 −20.93 0.26 (115±12) 4250 41.44 7.29 −1.51SDSS J232721.96+152437.3 · · · 0.28 E 0.73 46.0 23.0 0.0457 203.0 −21.84 0.37 (133±13) 7541 41.69 7.94 −1.94SDSS J235128.78+155259.0 0.35 S0/Sp 0.58 58.8 7.2 0.0963 443.4 −21.52 0.63 185±16 7881 42.24 8.28 −1.80
3C 120 Mrk 1506 · · · S0 0.62 55.3 46.6 0.0330 145.7 −22.50 · · · 162±24 2205 42.92 7.48 −0.42Akn 120 Mrk 1095 · · · E/S0 0.81 37.9 56.0 0.0327 144.3 −22.25 · · · 221±17 5410 42.99 7.92 −0.80
MCG +01-13-012 UGC 3223 · · · SBa 0.44 70.3 92.9 0.0156 67.1 −20.40 · · · 106±28 4740 40.74 7.20 −2.02NGC 3227 · · · · · · SABa 0.51 64.4 244.4 0.00386 17.1 −20.16 · · · 136±4 5208 40.85 7.37 −2.10NGC 5548 Mrk 1509 · · · S0/a 0.79 40.0 80.9 0.0172 74.3 −21.14 · · · 201±12 5662 42.15 7.57 −1.17NGC 7469 Mrk 1514 · · · SABa 0.83 35.8 82.8 0.0163 71.4 −21.57 · · · 131±5 2169 42.40 6.83 −0.22
PG 0003+199 Mrk 335 · · · E · · · · · · · · · 0.0258 112.9 −21.27 · · · · · · 1502 42.56 6.89 −0.14PG 0844+349 TON 951 · · · Sp(d) · · · · · · · · · 0.0640 287.6 −22.18 · · · · · · 2148 43.13 7.71 −0.47PG 1211+143 · · · · · · ? · · · · · · · · · 0.0809 368.6 −23.74 · · · · · · 1317 43.59 7.90 −0.26PG 1229+204 Mrk 771 · · · SB0 0.64 53.7 6.0 0.0630 282.9 −22.09 · · · · · · 3415 42.81 7.60 −0.63PG 1307+085 · · · · · · ? · · · · · · · · · 0.1550 742.9 −23.72 · · · · · · 5058 43.74 8.38 −0.61PG 1426+015 Mrk 1383 · · · E/S0 · · · · · · 4.4 0.0865 395.7 −23.31 · · · · · · 6323 43.55 8.85 −1.24PG 2130+099 II Zw 136 · · · S0 0.64 53.7 10.4 0.0629 282.9 −22.58 · · · · · · 2912 43.25 8.40 −1.05
RX J0602.1+2828 · · · · · · ? · · · · · · · · · 0.033 145.7 −22.7 · · · · · · 7117 41.80 8.15 −2.05RX J0608.0+3058 · · · · · · ? · · · · · · · · · 0.073 330.0 −23.6 · · · · · · 5918 44.29 9.38 −1.13
NOTE.— Col. (1) Source name. Col. (2) Alternate name. Col. (3) The (inverse) concentration index in the g band, defined as the ratio of Petrosian radiienclosing 50% to 90% of the light. Col. (4) Adopted morphological type. For SDSS objects, this was estimated either from C, following Shimasaku et al. 2001,or from visual inspection of the images presented in Fig. 1; for non-SDSS objects, this was either taken from the RC3, or estimated from visual inspection ofHST images, where available. See text. We use conventional notation for most objects, except in cases where we cannot distinguish a true elliptical vs. an S0(E/S0) or between a true S0 vs. a spiral (S0/Sp). “Sp(d)” denotes a tidally disturbed spiral. Col. (5) Ratio of minor axis to major axis (q = b/a), measured at asurface brightness level of µ = 25 mag arcsec−2 in the g and B band for SDSS and non-SDSS (from Hyperleda) objects, respectively. Col. (6) Inclination angle,calculated from q using Hubble’s 1926 formula assuming q0 = 0.3 (Fouque et al. 1990). Values that are deemed suspect or particularly uncertain are followed bya colon. The values for SDSS J080538.66+261005.4 and SDSS J080546.97+260532.9 were estimated visually. Col. (7) Isophotal diameter, measured at a surfacebrightness level of µ = 25 mag arcsec−2 in the g and B band for SDSS and non-SDSS (from Hyperleda) objects, respectively. Col. (8) Optical redshift from theNASA/IPAC Extragalactic Database. Col. (9) Luminosity distance calculated assuming H0 = 70 km s−1 Mpc−1, Ωm = 0.27, and ΩΛ = 0.73. Col. (10) Total(host galaxy + AGN) absolute magnitude, corrected for Galactic extinction; SDSS objects are given in the g band and non-SDSS objects in the B band. Col.(11) Total (host galaxy + AGN) g − r color, corrected for Galactic extinction. Col. (12) Central velocity dispersion, derived either from stars (Barth et al. 2005;Greene & Ho 2006b; this work) or from the width of the [O II] λ3727 line (values given in parentheses), as described in Greene & Ho 2005a. Additional data comefrom Onken et al. 2004 (3C 120), Nelson et al. 2004 (Akn 120, NGC 3227, NGC 5548, NGC 7469), and Nelson & Whittle 1995 (MCG +01-13-012). Col. (13)FWHM of the broad Hα line for the SDSS objects and of the broad Hβ line for the rest. Data for the non-SDSS objects come from Peterson et al. 2004, exceptfor MCG +01-13-012 (Stirpe 1990) and RX J0602.1+2828 and RX J0608.0+3058 (Motch et al. 1998, measured from the published spectra, which were kindlysent to us by C. Motch). Col. (14) Luminosity of the broad Hα line. For the non-SDSS objects, the Hα luminosity was estimated from the 5100 A continuumluminosity of Peterson et al. 2004, using the LHα − L
5100Acorrelation (Eq. 1) of Greene & Ho 2005b, with the exception of MCG +01-13-012 (Stirpe 1990) and
RX J0602.1+2828 and RX J0608.0+3058 (Motch et al. 1998), whose published Hβ luminosities were converted to Hα assuming Hα/Hβ = 3.5 (see Greene &Ho 2005b). Col. (15) Black hole mass derived from the Hα method (Eq. 6) of Greene & Ho 2005b, except for the reverberation-mapped objects, whose masseswere taken directly from Peterson et al. 2004, and MCG +01-13-012, RX J0602.1+2828, RX J0608.0+3058, whose masses are based on the Hβ method (Eq. 7)of Greene & Ho 2005b. For consistency with the virial mass zeropoint adopted by Greene & Ho 2005b, all the reverberation-mapped masses were reduced by afactor of 1.8 (see footnote 4 in Greene & Ho 2005b). Col. (16) Eddington ratio, assuming Lbol = 9.8L
5100A(McLure & Dunlop 2004), with L
5100Aestimated from
the LHα − L5100A
correlation of Greene & Ho 2005b.aTaken from Greene & Ho (2006a).bPossibly unreliable.

H I SURVEY OF AGNS 7
FIG. 3a.— H I spectra and opticalg-band SDSS images of the HI-detected objects. The velocity scale is given in the barycentric frame, and the velocity range ischosen such that the lines have roughly comparable widths onthe plots. Features suspected to be due to radio frequency interference are labeled “RFI.” Each imagesubtends a physical scale of 50 kpc× 50 kpc, with north oriented up and east to the left.

8 HO, DARLING, & GREENE
FIG. 3b.— Same as Fig. 3a.

H I SURVEY OF AGNS 9
FIG. 3c.— Same as Fig. 3a.

10 HO, DARLING, & GREENE
FIG. 3d.— Same as Fig. 3a.

H I SURVEY OF AGNS 11
FIG. 3e.— Same as Fig. 3a.

12 HO, DARLING, & GREENE
FIG. 3f.— Same as Fig. 3a.

H I SURVEY OF AGNS 13
FIG. 3g.— Same as Fig. 3a. The image for Akn 120 comes fromHST/PC2 (filter F750LP) and subtends 22.4 kpc× 22.4 kpc.

14 HO, DARLING, & GREENE
FIG. 3h.— Same as Fig. 3a, except that for MCG +01-13-012, NGC 3227, NGC 5548, and NGC 7469 the images are in theB band taken from the Digital SkySurvey. The images for the four PG quasars come fromHST, taken with the following detector and filter combinations and field sizes: PG 0844+349 (ACS/F625W,84.6 kpc× 84.6 kpc), PG 1229+204 (PC2/F606W, 43.9 kpc× 43.9 kpc), PG 1426+015 (PC2/F814W, 61.4 kpc× 61.4 kpc), and PG 2130+099; (PC2/F450W, 43.9kpc× 43.9 kpc).

H I SURVEY OF AGNS 15
FIG. 3i.— Same as Fig. 3a, except that for RX J0602.1+2828 and RX J0608.0+3058 the images are in theB band and were taken from the Digital Sky Survey.

16 HO, DARLING, & GREENE
FIG. 4a.— Opticalg-band SDSS images of the HI nondetections. Each image subtends a physical scale of 50 kpc × 50 kpc, with north oriented up and east tothe left.

H I SURVEY OF AGNS 17
FIG. 4b.— Same as Fig. 4a.

18 HO, DARLING, & GREENE
FIG. 4c.— Same as Fig. 4a, except for PG 0003+199, which comes fromHST/PC2 (filter F606W) and subtends 21.9 kpc× 21.9 kpc.

H I SURVEY OF AGNS 19
TABLE 2: H I Properties
Source Name Base. Smooth vsys W20 υm Prof.∫
Sνdv log MH I log Mdyn MB,TF Notes(km s−1) (km s−1) (km s−1) (Jy km s−1) (M⊙) (M⊙) (mag)
(1) (2) (3) (4) (5) (6) (7) (8) (9) (10) (11) (12)
SDSS J000805.62+145023.3 5 Yd 13688.9 477.5 227.0 D 0.669 9.81 10.79 −20.72 1,3SDSS J003646.45+145936.9 5 Yd · · · · · · · · · · · · <0.33 <10.11 · · · · · · 4SDSS J004055.88+153349.0 5 Yd · · · · · · · · · · · · <0.21 <10.01 · · · · · · 5SDSS J004719.39+144212.6 5 Yd 11796.2 407.9 220.8 D 1.608 10.06 10.86 −20.63 1SDSS J010712.03+140844.9 5 Yd 22982.5 293.2 259.2: AS 0.215 9.79 10.56: −21.15: 2,4SDSS J015046.68+132359.9 5 Yd 28060.1 692.4 380.7: AS 0.149 9.82 10.90: −22.40: 14,20SDSS J075245.60+261735.7 5 Yd 24690.4 258.7 339.9: ? 0.158 9.72 10.90: −22.03: 6SDSS J080243.39+310403.3 5 Yd 12300.6 313.5 259.4 A 0.511 9.59 10.63 −21.15SDSS J080538.66+261005.4 5 N 5156.2 263.8 275.1 D 2.929 9.57 11.07 −21.34SDSS J080546.97+260532.9 5 N 22156.0 100.9 98.4: S 0.196 9.71 9.86: −18.00:SDSS J081700.40+343556.3 5 Yd · · · · · · · · · · · · <0.47 <9.94 · · · · · · 21SDSS J081835.73+285022.4 5 Yd · · · · · · · · · · · · <0.35 <10.00 · · · · · ·
SDSS J082048.30+282217.8 5 Yd · · · · · · · · · · · · <0.26 <10.06 · · · · · ·
SDSS J082320.68+074020.2 5 Yd 19353.3 183.9 247.4 A? 0.154 9.49 10.87 −21.00 22SDSS J083045.36+340532.1 5 Yd · · · · · · · · · · · · <0.20 <9.57 · · · · · · 7,23SDSS J083107.63+052105.9 5 Yd 19285.4 137.1 95.2 S 0.074 9.15 9.82 −17.89 2,24SDSS J083747.89+053644.8 5 Yd · · · · · · · · · · · · <0.26 <10.12 · · · · · · 7,25SDSS J084025.51+033301.7 5 Yd 18159.8 263.1 198.4: D 0.138 9.38 10.46: −20.28:SDSS J084556.67+340936.2 5 Yd 19717.5 192.4 159.9 D 0.806 10.22 10.65 −19.58 2SDSS J090028.53+060842.5 5 Yd · · · · · · · · · · · · <0.43 <10.10 · · · · · ·
SDSS J091222.31+065829.0 5 Yd · · · · · · · · · · · · <0.36 <10.03 · · · · · · 7SDSS J093240.55+023332.6 5 Yd 17103.9 290.6 188.6 D 0.176 9.43 10.44 −20.12SDSS J093259.60+040506.0 5 Yd 17818.4 162.8 130.7 D 0.441 9.86 10.20 −18.92 2SDSS J093812.26+074340.0 5 Yd 6776.4 304.6 174.1 AS 0.663 9.15 10.19 −19.86 2,26SDSS J093917.26+363343.9 5 Yd 5978.9 219.5 119.2 S 1.373 9.39 10.08 −18.62 2SDSS J094529.37+093610.4 5 Yd · · · · · · · · · · · · <0.38 <8.48 · · · · · · 27SDSS J095955.85+130237.8 5 Y 10638.6 175.2 233.9: D 2.052 10.07 11.13: −20.81: 28SDSS J100155.79+055413.3 5 Yd 31098.7 169.3 62.1: S? 0.092 9.69 · · · −16.51: 2,29SDSS J102148.90+030732.2 5 Yd 18688.8 284.4 177.4 AS 0.520 9.98 10.46 −19.92 30SDSS J102402.60+062943.9 5 Y 13147.3 328.4 365.1 AS 1.074 9.99 11.04 −22.26 2,8SDSS J102925.73+140823.2 5 Yd 18385.5 202.4 97.5 AS 0.120 9.32 10.11 −17.97SDSS J104326.47+110524.3 5 Yd 14285.1 338.0 209.5: AS 0.497 9.72 10.44: −20.46: 2SDSS J104913.79+044039.9 5 Yd · · · · · · · · · · · · <0.31 <10.08 · · · · · · 31SDSS J105115.42+054824.6 · · · · · · · · · · · · · · · · · · · · · · · · · · · · · · 9,10SDSS J110538.99+020257.4 · · · · · · · · · · · · · · · · · · · · · · · · · · · · · · 25SDSS J110640.20+051905.6 5 Yd 27488.5 331.0 212.1 D 0.309 10.11 10.92 −20.50 2SDSS J110654.46+061213.1 5 Yd 13039.2 344.4 270.4: D 0.231 9.31 10.73: −21.29:SDSS J111031.61+022043.2 5 Y 23732.3 385.5 267.0: A 1.311 10.61 10.60: −21.24: 2SDSS J111045.96+113641.6 5 Y 12698.3 257.7 170.6 D 2.034 10.23 10.67 −19.79SDSS J111237.43+120729.5 5 Yd 13989.1 480.1 232.7 AS 0.386 9.59 10.88 −20.80 2,14SDSS J111639.15+040427.6 5 Y 22391.1 92.4 44.9: S 0.265 9.85 9.23: −15.45: 11SDSS J112328.11+052823.2 · · · · · · · · · · · · · · · · · · · · · · · · · · · · · · 9SDSS J112455.86+080615.3 5 Yd 21091.6 403.8 257.1 A 0.168 9.60 10.83 −21.12 2,32SDSS J112555.85+073107.8 5 Yd · · · · · · · · · · · · <0.26 <9.84 · · · · · ·
SDSS J112813.02+102308.3 5 Yd · · · · · · · · · · · · <0.52 <9.79 · · · · · · 10SDSS J112904.01+061140.0 5 Yd · · · · · · · · · · · · <0.31 <9.91 · · · · · ·
SDSS J113111.94+100231.3 5 Y 22330.0 468.3 219.9 A 0.718 10.29 10.84 −20.61SDSS J113249.28+101747.3 5 Yd 13373.7 105.9 37.0 ? 0.099 8.94 9.18 −14.82 12SDSS J114008.71+030711.3 3 Yd 24427.1 328.8 661.7 A 0.476 10.19 11.61 −24.19SDSS J114105.71+024117.0 · · · · · · · · · · · · · · · · · · · · · · · · · · · · · · 9

20 HO, DARLING, & GREENE
TABLE 2: H I Properties—Continued
Source Name Base. Smooth vsys W20 υm Prof.∫
Sνdv log MH I log Mdyn MB,TF Notes(km s−1) (km s−1) (km s−1) (Jy km s−1) (M⊙) (M⊙) (mag)
(1) (2) (3) (4) (5) (6) (7) (8) (9) (10) (11) (12)
SDSS J115038.86+020854.2 5 Yd 32894.4 738.7 320.4 D 0.270 10.22 11.39 −21.84 13SDSS J120011.27+100135.6 5 Yd 25642.7 208.0 196.4: AS 0.280 10.00 10.61: −20.25: 2SDSS J120257.81+045045.0 5 N 6273.7 431.4 205.8 D 4.628 9.95 10.87 −20.40SDSS J120330.23+123140.9 5 Yd 19308.4 327.9 170.3 D 0.502 10.00 10.58 −19.78SDSS J120332.94+022934.5 5 N 23214.2 394.5 225.6 D 1.062 10.49 11.05 −20.70SDSS J120648.31+065912.2 5 Yd · · · · · · · · · · · · <0.30 <9.98 · · · · · ·
SDSS J121629.91+084253.3 5 Yd · · · · · · · · · · · · <0.25 <9.78 · · · · · ·
SDSS J121930.87+064334.4 5 Yd 24112.3 189.4 250.6: AS 0.276 9.94 10.77: −21.04:SDSS J122042.00+112405.2 · · · · · · · · · · · · · · · · · · · · · · · · · · · · · · 33SDSS J122324.13+024044.4 5 Yd · · · · · · · · · · · · <0.50 <9.10 · · · · · ·
SDSS J122811.42+095126.8 5 Yd · · · · · · · · · · · · <0.50 <9.99 · · · · · · 9SDSS J123235.82+060310.0 5 Yd · · · · · · · · · · · · <0.37 <10.11 · · · · · ·
SDSS J123639.78+040758.4 5 Y 21272.9 593.5 261.5 D 0.820 10.29 11.17 −21.18SDSS J123944.23+120159.9 5 Yd 25664.6 275.4 125.8 D 0.220 9.90 10.44 −18.80 2SDSS J124239.13+054717.6 5 Y 28135.8 248.8 171.2: D 0.326 10.15 10.50: −19.80:SDSS J124319.98+025256.2 5 Yd · · · · · · · · · · · · <0.24 <9.94 · · · · · ·
SDSS J124635.24+022208.7 5 Yd · · · · · · · · · · · · <0.47 <9.70 · · · · · ·
SDSS J124913.75+151510.5 · · · · · · · · · · · · · · · · · · · · · · · · · · · · · · 33SDSS J125039.08+141241.0 5 Yd · · · · · · · · · · · · <0.58 <10.31 · · · · · ·
SDSS J130241.53+040738.6 5 Yd · · · · · · · · · · · · <0.34 <10.25 · · · · · · 9SDSS J130803.04+035114.5 5 Yd · · · · · · · · · · · · <0.34 <9.91 · · · · · ·
SDSS J132026.49+051113.5 5 Yd 29483.1 454.3 236.7: D 0.229 10.05 10.75: −20.85: 9SDSS J132442.44+052438.8 · · · · · · · · · · · · · · · · · · · · · · · · · · · · · · 9SDSS J134952.84+020445.1 5 Y 9831.1 355.1 172.9 D 1.172 9.76 10.48 −19.83 2,9SDSS J140018.42+050242.2 5 Y 10322.6 364.9 234.1 D 0.602 9.51 10.72 −20.82 2SDSS J142748.28+050222.0 5 Y 31763.8 167.6 203.7: D 0.251 10.16 10.51: −20.37: 9SDSS J143450.62+033842.5 5 Yd · · · · · · · · · · · · <0.87 <9.50 · · · · · · 15SDSS J145047.19+033645.4 5 Yd · · · · · · · · · · · · <0.55 <10.07 · · · · · · 9,10SDSS J150556.55+034226.3 5 Y 10822.0 443.4 222.8 D 0.892 9.72 10.94 −20.66 2,9SDSS J153839.19+024324.7 5 Yd 9497.8 428.2 253.3 D 1.526 9.84 10.78 −21.07SDSS J155417.43+323837.8 5 Yd 14494.2 311.3 225.8 AS 0.350 9.58 10.55 −20.70 2SDSS J160936.42+254459.6 5 Yd 12476.7 436.5 398.6: D 0.631 9.69 10.86: −22.55: 2SDSS J163152.23+345328.7 5 Yd 21702.5 241.2 173.9 A? 0.276 9.86 10.59 −19.85 29SDSS J163159.59+243740.3 5 Yd · · · · · · · · · · · · <0.30 <9.42 · · · · · ·
SDSS J163453.67+231242.7 5 Yd 11593.0 297.0 195.0 D 0.456 9.49 10.55 −20.22SDSS J163523.44+263046.5 5 Yd · · · · · · · · · · · · <0.34 <9.91 · · · · · ·
SDSS J165601.61+211241.2 5 Yd 14715.2 319.1 150.2: A 0.361 9.61 10.20: −19.38: 29SDSS J170102.29+340400.5 5 Yd · · · · · · · · · · · · <0.28 <10.10 · · · · · ·
SDSS J171257.02+231526.8 5 Yd · · · · · · · · · · · · <0.28 <9.64 · · · · · ·
SDSS J171520.19+274825.9 5 Yd · · · · · · · · · · · · <0.32 <10.27 · · · · · ·
SDSS J171601.93+311213.8 · · · · · · · · · · · · · · · · · · · · · · · · · · · · · · 9SDSS J210622.99+105606.5 5 Yd 28420.6 276.5 174.4 AS 0.163 9.86 10.46 −19.86 2SDSS J210721.91+110359.0 5 Yd · · · · · · · · · · · · <0.62 <9.71 · · · · · · 9SDSS J211646.34+110237.4 5 Yd 24186.9 322.5 322.2 AS 0.304 9.98 11.19 −21.85SDSS J223338.42+131243.6 5 Yd 28165.8 550.1 263.9 D 0.312 10.13 11.15 −21.21 2SDSS J225305.11+140351.2 5 Yd · · · · · · · · · · · · <0.32 <10.13 · · · · · ·
SDSS J232721.96+152437.3 · · · · · · · · · · · · · · · · · · · · · · · · · · · · · · 9,16SDSS J235128.78+155259.0 5 Yd · · · · · · · · · · · · <0.48 <10.35 · · · · · ·
3C 120 · · · · · · · · · · · · · · · · · · · · · · · · · · · · · · 16Akn 120 5 Y 9809.2 370.3 266.1 D 1.965 9.98 11.28 −21.23

H I SURVEY OF AGNS 21
TABLE 2: H I Properties—Continued
Source Name Base. Smooth vsys W20 υm Prof.∫
Sνdv log MH I log Mdyn MB,TF Notes(km s−1) (km s−1) (km s−1) (Jy km s−1) (M⊙) (M⊙) (mag)
(1) (2) (3) (4) (5) (6) (7) (8) (9) (10) (11) (12)
MCG +01-13-012 5 N 4705.1 440.7 216.2 D 3.150 9.52 10.99 −20.56 17NGC 3227 5 N 1135.6 453.4 235.5 D 15.495 9.03 10.89 −20.84 34NGC 5548 5 Y 5169.8 321.1 220.8 AS 1.384 9.26 10.99 −20.63 1,17NGC 7469 7 Y 4899.5 525.1 414.4 AS 3.741 9.65 11.53 −22.67 2,18,35
PG 0003+199 5 Yd · · · · · · · · · · · · <0.35 <9.02 · · · · · · 19PG 0844+349 5 Yd 19363.1 488.5 213.9L D 1.048 10.31 · · · −20.52L 2,20PG 1211+143 · · · · · · · · · · · · · · · · · · · · · · · · · · · · · · 16PG 1229+204 5 Yd 19208.2 295.0 152.7 ? 0.229 9.64 10.12 −19.43PG 1307+085 · · · · · · · · · · · · · · · · · · · · · · · · · · · · · · 16PG 1426+015 5 Yd 25975.2 357.4 148.9L D 0.456 10.23 10.11 −19.35LPG 2130+099 5 Yd 19000.5 506.0 275.8 D 0.469 9.95 10.87 −21.35 1
RX J0602.1+2828 5 Y 9907.0 627.2 287.7L AS 2.111 10.02 · · · −21.49L 9RX J0608.0+3058 5 Y 21869.1 218.9 86.3L D 0.175 9.65 · · · −17.58L
NOTE.— Col. (1) Source name. Col. (2) Order of polynomial used to fit the baseline. Col. (3) Type of smoothing applied to thedata prior to fitting. Col. (4) Systemic velocity in barycentric optical frame. Col. (5) Width of the line profile measured at 20% ofthe peak. Col. (6) Maximum rotational velocity, corrected for inclination, instrumental resolution, and redshift; derived from W20.Entries followed by a colon are particularly uncertain because of the uncertain inclination correction; those followed by “L” denotelower limits because inclination angles are not available (see Table 1, Col. 6). Col. (7) Profile type. “D” = classical double-peaked;“A” = asymmetric; “S” = single-peaked; “?” = signal-to-noise ratio too low to tell. Col. (8) Integrated line flux; upper limits arecalculated as the product of 3 times the root-mean-square noise level and a rest-frame line width of 304 km s−1 (see text). Col. (9)H I mass, derived from Equation 1. Col. (10) Dynamical mass of the galaxy, derived from D25 and υm using Equation 4. Col. (11)B-band absolute magnitude of the host galaxy, derived from υm and the Tully-Fisher relation (see text). Col. (12) Notes: (1) Faintneighboring galaxy in the beam, but unlikely to be a source of confusion. (2) Possible confusion. (3) RFI at high side of line; widthmight be affected at the level of ∼ 20 km s−1. (4) Uncertain baseline. (5) 3.4 σ feature; unclear if real. (6) Low S/N. (7) Low levelbroad line might be present. (8) Galaxy pair. (9) Solar RFI. (10) Close to 1350 MHz radar. (11) Nearby RFI does not affect H I.(12) Dubious detection; possible H I within redshift uncertainty. (13) Uncertain; RFI at H I edge, if H I is real. (14) Very broadprofile. (15) RMS includes some RFI. (16) Standing waves (strong continuum). (17) Feed res.; < line power. (18) Feed res.; used YYpolarization only. (19) 3.3 σ dip at ∼ 7885 km s−1; unlikely to be real. (20) Close apparent interacting companion in HST image (Fig.3h). (21) Integration time too short. (22) Difficult profile to measure. (23) Peak is 2.4 σ. (24) Narrow line; much bandpass structure.(25) Peak is < 3 σ. (26) Irregular profile, but strong peak. (27) Peak at 2.8 σ. (28) Odd dip on low-velocity side of line; Gaussian fitto feature shows negligible impact on H I profile and properties. (29) Possible RFI contamination. (30) Feature at 18150 km s−1 isRFI; broad shoulders. (31) High feature at 3.4 σ. (32) Possible H I; line width very sensitive to choice of initial parameters of fit. (33)Bad bandpasses. (34) Interacting with NGC 3226, but the latter is unlikely to be a source of confusion because it is an elliptical. (35)Interacting with IC 5283, an Scd galaxy, so likely to be a source of confusion.
TABLE 3: Comparison with Published Work
Source Name W20 (km s−1)∫
Sνdv (Jy km s−1)
Ours Literature Ours Literature
IC 492 263.8 257.0±3.9 2.93 3.44±0.61IC 756 431.4 402.7−444.6 4.63 4.83±0.85
MCG +01-13-012 440.7 442.6±12.1 3.15 2.68±0.22Mrk 1146 407.9 417.8±16.6 1.61 2.83±1.13NGC 3227 453.4 299.9−526.0 15.49 18.88±2.44NGC 5548 321.1 239.9−297.2 1.38 1.38±0.17NGC 7469 525.1 395.4−510.5 3.74 2.73±0.61
PG 2130+099 506.0 950.6±79.6 0.47 0.97±0.39
NOTE.—Literature values compiled from Hyperleda (http://leda.univ-lyon1.fr).

22 HO, DARLING, & GREENE
TABLE 4: Spectroscopic Properties of SDSS Objects
Source Name [O II] Hβ [O III] Hα [N II] [S II] [S II] MB,host
λ3727 λ4861 λ5007 λ6563 λ6583 λ6716 λ6731 (mag)(1) (2) (3) (4) (5) (6) (7) (8) (9)
SDSS J000805.62+145023.3 0.191 0.208 1.89 1.034 0.142 0.185 0.197 −20.39SDSS J003646.45+145936.9 0.038 0.082 4.12 0.253 0.194 0.085 0.060 −20.20SDSS J004055.88+153349.0 0.105 0.213 3.60 0.872 0.480 0.179 0.167 −20.99SDSS J004719.39+144212.6 0.019 0.079 20.47 0.248 0.227 0.063 0.049 −21.46SDSS J010712.03+140844.9 0.033 0.061 3.49 0.190 0.104 0.045 0.045 > −19.42SDSS J015046.68+132359.9 0.218 0.463 195.34 1.156 0.161 0.068 0.082 −19.11SDSS J075245.60+261735.7 0.049 0.111 7.99 0.345 0.271 0.072 0.086 −20.40SDSS J080243.39+310403.3 0.225 0.105 1847.99 0.295 0.293 0.076 0.077 −19.92SDSS J080538.66+261005.4 · · · 0.066 27.45 0.303 0.312 0.083 0.078 −20.17SDSS J080546.97+260532.9 0.112 0.049 19.42 0.441 0.396 0.143 0.133 −20.39SDSS J081700.40+343556.3 2.070 0.385 2064.29 1.188 0.660 0.480 0.391 −19.34SDSS J081835.73+285022.4 0.022 0.027 3.42 0.085 <0.015 0.064 0.045 −20.12SDSS J082048.30+282217.8 0.346 0.097 246.49 0.508 0.453 0.138 0.111 −19.58SDSS J082320.68+074020.2 0.366 0.076 123.28 0.223 0.600 0.152 0.105 −20.88SDSS J083045.36+340532.1 0.109 0.093 4509.09 0.333 0.253 0.069 0.061 −20.06SDSS J083107.63+052105.9 0.365 0.122 1122.54 0.581 0.404 0.167 0.140 −19.32SDSS J083747.89+053644.8 0.343 0.096 267.48 0.415 0.424 0.195 0.170 −19.51SDSS J084025.51+033301.7 0.036 0.763 1454.20 0.070 0.070 0.025 0.026 −19.66SDSS J084556.67+340936.2 0.080 0.079 988.46 0.222 0.258 0.040 0.040 −20.91SDSS J090028.53+060842.5 0.054 0.167 2.18 0.811 0.401 0.156 0.092 −19.32SDSS J091222.31+065829.0 0.286 0.285 2.87 0.884 0.626 0.198 0.210 −18.74SDSS J093240.55+023332.6 0.195 0.107 1049.79 0.338 0.227 0.076 0.064 −20.09SDSS J093259.60+040506.0 0.353 0.188 1020.02 0.762 0.476 0.188 0.151 −20.67SDSS J093812.26+074340.0 0.000 0.135 1427.78 0.477 0.662 0.015 0.044 −19.36SDSS J093917.26+363343.9 0.000 0.318 1534.84 1.229 0.435 0.688 0.585 −19.42SDSS J094529.37+093610.4 0.000 0.069 9602.33 0.276 0.197 0.062 0.061 −18.20SDSS J095955.85+130237.8 0.099 0.164 1153.99 0.444 0.246 0.064 0.066 −21.10SDSS J100155.79+055413.3 0.356 0.094 428.27 0.549 0.521 0.225 0.169 −19.91SDSS J102148.90+030732.2 0.265 0.172 1183.84 0.559 0.343 0.152 0.115 −20.70SDSS J102402.60+062943.9 0.044 0.069 7.10 0.216 0.148 0.071 0.061 −20.11SDSS J102925.73+140823.2 0.206 0.137 1112.72 0.674 0.541 0.128 0.113 −21.03SDSS J104326.47+110524.3 0.336 0.129 7089.73 0.399 0.043 0.050 0.043 −17.13SDSS J104913.79+044039.9 1.997 0.753 122.61 3.262 1.407 0.750 0.532 −19.86SDSS J105115.42+054824.6 0.084 0.148 8.69 0.573 0.423 0.145 0.129 −19.22SDSS J110538.99+020257.4 0.032 0.045 1633.48 0.124 0.108 0.027 0.033 −21.49SDSS J110640.20+051905.6 0.169 0.064 439.41 0.244 0.398 0.096 0.077 −21.32SDSS J110654.46+061213.1 0.321 0.265 2.60 0.822 0.381 0.565 0.468 −19.22SDSS J111031.61+022043.2 0.151 0.199 2.04 0.989 0.136 0.177 0.188 −19.35SDSS J111045.96+113641.6 0.178 0.112 718.17 0.456 0.438 0.142 0.141 −20.98SDSS J111237.43+120729.5 0.258 0.206 358.23 1.750 1.336 0.328 0.229 −20.23SDSS J111639.15+040427.6 0.065 0.093 7.51 0.454 0.358 0.119 0.120 −19.58SDSS J112328.11+052823.2 0.205 0.122 614.93 0.492 0.276 0.084 0.059 −19.79SDSS J112455.86+080615.3 0.415 0.455 432.02 2.014 0.990 0.352 0.258 −21.20SDSS J112555.85+073107.8 0.218 0.100 391.24 0.292 0.226 0.082 0.063 −20.47SDSS J112813.02+102308.3 0.048 0.144 30.67 0.431 0.192 0.055 0.049 −19.89SDSS J112904.01+061140.0 0.146 0.086 2992.35 0.213 0.103 0.038 0.044 −19.61SDSS J113111.94+100231.3 0.049 0.215 2.54 0.958 0.572 0.198 0.142 −20.54SDSS J113249.28+101747.3 0.022 0.100 22.53 0.363 0.458 0.094 0.081 −20.09SDSS J114008.71+030711.3 · · · 0.639 2.07 1.981 1.239 0.284 0.285 −20.07SDSS J114105.71+024117.0 0.185 0.132 757.66 0.382 0.224 0.071 0.064 −20.20

H I SURVEY OF AGNS 23
TABLE 4: Spectroscopic Properties of SDSS Objects—Continued
Source Name [O II] Hβ [O III] Hα [N II] [S II] [S II] MB,host
λ3727 λ4861 λ5007 λ6563 λ6583 λ6716 λ6731 (mag)(1) (2) (3) (4) (5) (6) (7) (8) (9)
SDSS J115038.86+020854.2 0.038 0.043 2.23 0.593 0.665 0.209 0.201 −20.26SDSS J120011.27+100135.6 0.065 0.067 31.72 0.209 0.173 0.042 0.040 −20.71SDSS J120257.81+045045.0 · · · 0.089 14.28 0.476 0.698 0.183 0.198 −20.29SDSS J120330.23+123140.9 0.297 0.298 86.47 1.482 0.849 0.236 0.175 −20.50SDSS J120332.94+022934.5 0.083 0.101 29.17 0.380 0.283 0.080 0.075 −21.61SDSS J120648.31+065912.2 0.216 0.072 1564.87 0.271 0.265 0.092 0.089 −20.01SDSS J121629.91+084253.3 0.233 0.089 1152.96 0.317 0.472 0.195 0.179 −19.27SDSS J121930.87+064334.4 0.266 0.243 561.79 0.812 0.399 0.145 0.115 −20.89SDSS J122042.00+112405.2 0.204 0.143 588.90 0.497 0.295 0.086 0.090 −20.94SDSS J122324.13+024044.4 · · · 0.121 16.95 0.443 0.231 0.092 0.079 −18.57SDSS J122811.42+095126.8 0.098 0.079 8.79 0.352 0.614 0.226 0.191 −20.25SDSS J123235.82+060310.0 0.140 0.114 5.41 0.568 0.296 0.127 0.098 −20.42SDSS J123639.78+040758.4 0.103 0.069 7.55 0.400 0.698 0.193 0.210 −20.51SDSS J123944.23+120159.9 0.952 0.175 72.42 1.435 1.246 0.512 0.445 −21.25SDSS J124239.13+054717.6 0.061 0.105 5.92 0.524 0.273 0.117 0.090 −20.15SDSS J124319.98+025256.2 0.206 0.155 727.38 0.443 0.290 0.073 0.076 −20.17SDSS J124635.24+022208.7 0.123 0.310 24.58 0.961 0.352 0.101 0.101 −20.09SDSS J124913.75+151510.5 0.594 0.226 102.85 1.939 1.904 0.688 0.478 −21.13SDSS J125039.08+141241.0 0.618 0.189 1524.23 0.950 0.552 0.267 0.231 −20.89SDSS J130241.53+040738.6 0.151 0.073 3.98 0.398 0.154 0.103 0.076 −19.48SDSS J130803.04+035114.5 0.032 0.079 17.76 0.244 0.293 0.085 0.078 −20.06SDSS J132026.49+051113.5 0.053 0.119 6.54 0.385 0.245 0.126 0.099 −20.10SDSS J132442.44+052438.8 0.420 0.239 1.75 1.194 0.164 0.213 0.227 −18.08SDSS J134952.84+020445.1 0.128 0.107 124.03 0.349 0.187 0.077 0.077 −19.38SDSS J140018.42+050242.2 6.752 0.215 1.81 1.069 0.147 0.191 0.204 −20.77SDSS J142748.28+050222.0 0.018 0.134 12.64 4.527 <0.012 0.016 0.033 −21.55SDSS J143450.62+033842.5 · · · 0.236 5.29 0.823 0.494 0.160 0.147 −18.72SDSS J145047.19+033645.4 0.305 0.244 1.33 0.757 0.642 0.212 0.178 −18.57SDSS J150556.55+034226.3 0.052 0.080 231.96 0.302 0.329 0.080 0.086 −21.41SDSS J153839.19+024324.7 4.964 1.551 24.84 5.477 1.308 1.577 1.516 −18.39SDSS J155417.43+323837.8 0.219 0.115 5707.56 0.500 0.346 0.133 0.115 −19.96SDSS J160936.42+254459.6 0.574 0.190 1689.61 0.530 0.176 0.086 0.075 −19.15SDSS J163152.23+345328.7 0.172 0.056 433.73 0.207 0.408 0.134 0.089 −20.94SDSS J163159.59+243740.3 0.378 0.075 1078.42 0.297 0.161 0.098 0.075 −18.75SDSS J163453.67+231242.7 0.281 0.113 2257.33 0.489 0.451 0.179 0.140 −21.02SDSS J163523.44+263046.5 0.141 0.082 447.23 0.293 0.307 0.099 0.089 −20.36SDSS J165601.61+211241.2 0.360 0.165 3935.65 0.625 0.162 0.112 0.084 −19.35SDSS J170102.29+340400.5 0.216 0.096 2841.40 0.333 0.145 0.048 0.051 > −19.69SDSS J171257.02+231526.8 1.222 0.332 65.60 1.475 1.876 0.924 0.772 −20.13SDSS J171520.19+274825.9 0.383 0.098 513.18 0.320 0.301 0.180 0.154 −19.72SDSS J171601.93+311213.8 0.156 0.062 7727.33 0.168 0.199 0.056 0.050 −21.57SDSS J210622.99+105606.5 0.208 0.236 4.99 0.818 0.689 0.296 0.212 −20.63SDSS J210721.91+110359.0 0.109 0.096 6.17 0.479 0.249 0.107 0.082 −19.26SDSS J211646.34+110237.4 0.092 0.026 85.07 0.180 0.086 0.084 0.073 −21.28SDSS J223338.42+131243.6 0.065 0.073 23.98 0.227 0.210 0.089 0.079 −21.58SDSS J225305.11+140351.2 0.013 0.024 92.95 0.167 0.079 0.077 0.067 −20.33SDSS J232721.96+152437.3 0.018 0.022 97.22 0.153 0.073 0.071 0.062 −21.28SDSS J235128.78+155259.0 0.329 0.113 2991.89 0.455 0.357 0.125 0.120 −20.56
NOTE.— Col. (1) Source name. Col. (2)–(8) All fluxes are relative to that of [O III] λ5007, which is given in units of 10−15 ergss−1 cm−2. Galactic extinction has been corrected, but not internal extinction. Col. (9) B-band absolute magnitude of the host galaxy,derived from subtracting the AGN contribution from the total luminosity (see text). In the case of the SDSS objects, the g-bandmagnitudes were converted to the B band assuming g − B = −0.45 mag, appropriate for an Sab galaxy (Fukugita et al. 1995).

24 HO, DARLING, & GREENE
υm =(W20 −Winst)/(1+ z) −Wturb
2 sin i. (1)
In the optically thin limit, the integrated line flux,∫
Sν dυ, inunits of Jy km s−1, is related to the HI mass as (Roberts 1962)
MH I = 2.36×10⁵ D2L
∫
Sν dυ M⊙, (2)
whereDL is the luminosity distance expressed in Mpc anddυis the line width in the observer’s frame. We neglect any cor-rection for self-absorption, since this is controversial (see, e.g.,Springob et al. 2005), and, in any case, depends on Hubbletype, which is not well-known for many of our sources (see§2.3). Upper limits for the integrated fluxes and HI masses arecalculated using 3 times the root-mean-square noise level anda rest-frame line width of 304 km s−1, the median value for the66 detected objects.
Single-dish HI observations always run the risk of sourceconfusion, especially for relatively distant samples suchas ours.At the median redshift ofz = 0.05 for our targets, Arecibo’stelescope beam (FWHM≈ 3.′5) subtends a linear diameter of∼ 200 kpc. We use the optical images (from SDSS if avail-able, or else from the Palomar Digital Sky Survey; see §2.3),in combination with the redshifts, to identify potential sourcesof confusion within a search radius of 7.′5. The intensity of thefirst sidelobes of the Arecibo beam drops to∼10% of the peakat a distance of 5.′5 from the beam center, and by 7′–8′ it be-comes negligible (Heiles et al. 2000). We consider an objectasa candidate confusing source if it lies within the search radiusand has a cataloged radial velocity within±500 km s−1 of thatof the science target. Only a few candidates have been identi-fied, and these are noted in Table 2. The vast majority of theobjects in our survey are unaffected by source confusion.
Eight of the objects in our survey have published HI data.A comparison of our measurements with those in the literature(Table 3) shows that in general there is fairly good agreement.The most noticeable exception is PG 2130+099, for which bothour line width and flux are lower than the literature values byabout a factor of 2.
2.3. Optical Data
We use both optical spectroscopic and imaging data to as-certain a number of parameters that are central to our analysis.For the SDSS objects, these data were taken directly from theSDSS archives. The spectra were analyzed following the proce-dures previously described in Greene & Ho (2004, 2005b; seealso Kim et al. 2006). In brief, we obtain a pure emission-linespectrum for each object by subtracting from the observed totalspectrum a model consisting of a stellar component, a feature-less power-law component, and an FeII “pseudo-continuum.”We then fit the resulting narrow and broad emission lines us-ing a combination of multi-component Gaussians. The opticalemission-line parameters are collected in Table 4. We also give(in Table 1), where available, values of the central stellarveloc-ity dispersion and its associated uncertainty, derived using thetechnique of Greene & Ho (2006a). If the data do not permitthe stellar velocity dispersion to be measured, we list insteadthe velocity dispersion of the [OII ] λ3727 line, which Greene& Ho (2005a) have shown to be an effective substitute. BHmasses were estimated using the broad Hα method of Greene& Ho (2005b), using the FHWM and luminosities given in Ta-ble 1. We further convert the broad Hα luminosity to the AGN
continuum luminosity at 5100 Å, using Equation 1 of Greene &Ho (2005b), from which we deduce the bolometric luminosityassuming thatLbol = 9.8 L5100 (McClure & Dunlop 2004).
The non-SDSS objects were treated differently. The major-ity of these, by design, have BH masses directly measured fromreverberation mapping, and we simply adopt the values givenin Peterson et al. (2004), from which continuum luminositiesat 5100 Å were also taken. Three of the non-SDSS objects(MCG +01-13-012, RX J0602.1+2828, and RX J0608.0+3058)only have measurements for the Hβ line, but BH masses basedon this line alone can also be estimated with reasonable accu-racy (Greene & Ho 2005b).
The images provide five important pieces of informationabout the sources: the total (AGN plus host galaxy) magni-tude, morphological type, size, inclination angle, and poten-tial sources of confusion within the HI beam. For the SDSSobjects, we choose theg band as our fiducial reference point,since it is closest to the more traditionalB band on which mostof the literature references are based. In Figure 3, we displaythe optical image of the sources detected in HI; images of theH I nondetections are shown in Figure 4. In a few cases we wereable to locate high-resolution images in theHubble Space Tele-scope (HST) archives. The size of each image has been scaledto a constant physical scale of 50 kpc× 50 kpc to facilitatecomparison of objects with very different distances.
Inspection of Figures 3 and 4 shows that obtaining reliablemorphological types of the host galaxies is challenging formostof the sources, because of their small angular sizes and thecoarse resolution and shallow depth of the SDSS images. In as-signing a morphological type, we must be careful to give lowerweight to the apparent prominence of the bulge, since a substan-tial fraction of the central brightness enhancement presumablycomes from the AGN core itself. The SDSS database providesquantitative measurements of the Petrosian radius containing50% and 90% of the light, from which one can calculate the (in-verse) “concentration index,” defined to beC ≡ rP50/rP90. Weuse the correlation betweenC and morphological type index ofShimasaku et al. (2001) as an additional guide to help us as-sign morphological types, again bearing in mind that becauseof the AGN contamination the concentration index should beviewed strictly as an upper limit to the true value. We gener-ally give less weight to the classifications based onC. (We havediscovered a few glaring examples where the SDSS-based con-centration index gives an egregiously erroneous morphologicaltype.) The most difficult classifications are those that lie on theboundary between ellipticals and S0s, which is sometimes am-biguous even for nearby, bright galaxies. Unless the galaxyishighly inclined, it is often just impossible to tell; we label thesecases as “E/S0.” Another difficult situation arises when tryingto discern whether a disk galaxy truly possesses spiral arms.Given the modest quality of the SDSS images and the relativelylarge distances of the galaxies, again often no clear-cut deci-sion can be made, and we are forced to assign a classificationof “S0/Sp.” For a few of the objects, the image material is sim-ply inadequate to allow a classification to be made at all.
The SDSS photometry additionally provides values for themajor axis (a) and minor axis (b) isophotal diameters measuredat a surface brightness level ofµ = 25 mag arcsec−2, from whichwe can deduce the photometric inclination angle using Hub-ble’s (1926) formula
cos2i =q2 − q2
0
1− q20
, (3)

H I SURVEY OF AGNS 25
FIG. 5.— The distribution of (a) H I masses and (b) H I masses normalized to theB-band luminosity of the host galaxy. Limits are plotted as open histograms.
whereq = b/a. The intrinsic thickness of the disk,q0, varies byabout a factor of 2 along the spiral sequence; we adoptq0 = 0.3,a value appropriate for early-type systems (Fouqué et al. 1990).It is also of interest to combine the galaxy’s optical size (D25,diameter atµ = 25 mag arcsec−2) with the H I line width tocompute a characteristic dynamical mass. From Casertano &Shostak (1980),
Mdyn = 2×10⁴
(
DL
Mpc
)(
D25
arcmin
)(
υm
km s−1
)2
M⊙. (4)
Because we have no actual measurement of the size of the HIdisk, this formula yields only an approximate estimate of thetrue dynamical mass. However, from spatially resolved ob-servations we know that the sizes of HI disks of spiral galax-ies, over a wide range of Hubble types and luminosities, scaleremarkably well with their optical sizes. From the studiesof Broeils & Rhee (1997) and Noordermeer et al. (2005),DH I/D25 ≈ 1.7 within 30%–40%. Nevertheless, our values ofMdyn are probably much more accurate as a relative rather thanan absolute measure of the galaxy dynamical mass.
The optical photometry, albeit of insufficient angular reso-lution to yield a direct decomposition of the host galaxy fromthe AGN core, nevertheless can be used to give a rough, yetstill useful, estimate of the host galaxy’s luminosity. Followingthe strategy of Greene & Ho (2004, 2007b), we obtain the hostgalaxy luminosity by subtracting the AGN contribution, derivedfrom the spectral analysis, from the total Petrosian (galaxy plusAGN) luminosity available from the photometry. In the currentapplication, we use the broad Hα luminosity as a surrogate forthe 5100 Å continuum luminosity to minimize the uncertaintyof measuring the latter, since in some of our objects there maybe significant starlight within the 3′′ aperture of the SDSS spec-tra (see Greene & Ho 2005b). We extrapolate the flux densityat 5100 Å to the central wavelength of theg filter (5120 Å)assuming that the underlying power-law continuum has a shapefλ ∝ λ−1.56 (Vanden Berk et al. 2001), adding the small offset tothe photometric zeropoint of theg-band filter recommended inthe SDSS website8. In a few sources the host galaxy luminos-
ity derived in this manner actually exceeds the total luminosity.This may reflect the inherent scatter introduced by our proce-dure, or perhaps variability in the AGN. For these cases, weadopt the total luminosity as an upper limit on the host galaxyluminosity.
3. DISCUSSION AND SUMMARY
We have used the Arecibo telescope to conduct the largestmodern survey to date for HI emission in active galaxies. Thesample consists of 113z ∼< 0.11 galaxies with type 1 AGNs,selected from an extensive study of SDSS sources for whichBH masses can be reliably determined. The new observationswere supplemented with an additional 53 type 1 AGNs assem-bled from the literature, forming a final, comprehensive sam-ple of 154 sources with HI detections or useful upper limits.Among the newly observed galaxies, we detected HI in 66 outof the 101 objects that were not adversely affected by RFI, foran overall detection rate of 65%. The HI masses for the de-tected sources range fromMH I ≈ 109 to 4× 10¹⁰ M⊙, withan average value of 8.6× 10⁹ M⊙, while upper limits for theundetected objects generally hover aroundMH I ≈ 1010 M⊙
(Fig. 5a). Adding in the literature sample does not appreciablychange these values. The host galaxies of the current sampleof type 1 AGNs are therefore quite rich in neutral hydrogen.For reference, recall that our Galaxy has a total HI mass of5.5×109 M⊙ (Hartmann & Burton 1997). Since the HI contentof galaxies scales with the stellar luminosity in a manner thatdepends on morphological type (e.g., Roberts & Haynes 1994),Figure 5b examines the HI masses normalized to theB-bandluminosity of the host galaxy. In the case of the SDSS objects,we converted the host galaxy luminosities in theg band (§2.3)to theB band assuming an average color ofg − B = −0.45 mag,appropriate for an Sab galaxy (Fukugita et al. 1995), roughlythe average morphological type of our sample. The resultingdistribution, ranging fromMH I/LB ≈ 0.02 to 4.5 with an aver-age value of 0.42, agrees well with the distribution of inactivespiral galaxies of Hubble type Sa to Sb (e.g., Roberts & Haynes
8http://photo.astro.princeton.edu/#data_model

26 HO, DARLING, & GREENE
FIG. 6.— Distribution of radial velocity difference as measured in the op-tical and in HI, ∆υ = υopt − υsys. Note the excess of objects toward negativevalues of∆υ.
1994). This reinforces the conclusion that the host galaxies oftype 1 AGNs possess a normal gas content, at least as far asneutral atomic hydrogen is concerned.
The implications of these detection statistics, along withanextensive analysis of the HI and AGN properties assembledhere, are presented in our companion paper (Ho et al. 2008).
Figure 6 compares the systemic radial velocity measuredfrom H I with the published optical radial velocity,υopt = cz.The velocity difference,∆υ = υopt − υsys, shows a large spread,from ∆υ ≈ −300 to+250 km s−1, but there is a noticeable ex-cess at negative velocities. On average,〈∆υ〉 = −46± 91 km
s−1. A similar effect was previously reported by Mirabel &Wilson (1984) and Hutchings et al. (1987); in their samples,the mean offset is〈∆υ〉 ≈ −50 km s−1, essentially identical toour result. Since our sources are relatively bright, type 1 AGNs,the optical radial velocities are predominantly derived from thenarrow emission lines. The systemic velocity of the galaxy,onthe other hand, is well anchored by the HI measurement. Thenegative value of〈∆υ〉 therefore implies that on average theionized gas in the narrow-line region has a general tendencytobe mildly outflowing.
The work of L. C. H. was supported by the Carnegie Insti-tution of Washington and by NASA grants HST-GO-10149.02and HST-AR-10969 from the Space Telescope Science In-stitute, which is operated by the Association of Universitiesfor Research in Astronomy, Inc., for NASA, under contractNAS5-26555. Support for J. D. and J. E. G. was providedby NASA through Hubble Fellowship grants HF-01183.01-Aand HF-01196, respectively, awarded by the Space TelescopeScience Institute. We made use of the databases in Hyper-Leda (http://leda.univ-lyon1.fr/), the Sloan Dig-ital Sky Survey, and the NASA/IPAC Extragalactic Database(http://nedwww.ipac.caltech.edu/), which is op-erated by the Jet Propulsion Laboratory, California Instituteof Technology, under contract with NASA. We thank MinjinKim for help with preparing theHST images and for analyz-ing the SDSS spectra shown in Table 7, Aaron Barth for send-ing theHST image of PG 0844+349, and C. Motch for mak-ing available his published spectra of RX J0602.1+2828 andRX J0608.0+3058. We thank the anonymous referee for help-ful suggestions.
APPENDIX
LITERATURE DATA
In an effort to assemble a large database of HI parameters for nearby active galaxies with BH mass estimates, we supplementedour new Arecibo observations with a sample drawn from the published literature. While there is no perfect way to accomplish thistask, we began by assembling all the HI measurements listed in Hyperleda, which to date contains the most comprehensive andsystematic database for this purpose. One limitation of Hyperleda is that it lists HI detections but not upper limits. From this masterlist we systematically cross-correlated the galaxy names with modern compilations of AGN spectroscopic parameters (e.g., Whittle1992; Marziani et al. 2003; Boroson & Green 1992), as well as whatever other AGN references known to us, with the goal of findinga matching subset that has reliable measurements of nuclearAGN luminosities and line widths for broad Hα or Hβ emission, to beused to calculate BH masses. In total we were able to locate 61objects, of which 53 are not included in our new survey (the eightoverlapping objects are given in Table 3).
Table 5 summarizes the basic properties of the literature sample, as given in Hyperleda. (Note that the isophotal diameters andabsolute magnitudes of the literature sample have been corrected for internal extinction, as described in Hyperleda. Because of thegenerally larger distances and more uncertain morphological types of our Arecibo sample, this correction has not been applied tothe latter.) Table 6 gathers all the key properties of the sample, including AGN luminosities and line widths, BH masses,Eddingtonratios, HI masses, rotation velocities, dynamical masses, and estimates of host galaxy luminosities; these parameters were derived,to the extent possible, following the same precepts used forthe main Arecibo sample. Ho (2007a; see Appendix) discussessomecomplications encountered in using the inclination anglesand rotation velocities given in Hyperleda; this study follows the proceduresoutlined in that paper. Finally, three of the objects do not have published optical spectroscopic parameters but were observed bySDSS. We reanalyzed their optical spectra and present theiremission-line measurements in Table 7.

H I SURVEY OF AGNS 27
TABLE 5: Literature Sample
Source Name Alternate Name T i Dc
25z DL MBc
Tσ∗±error
() (′) (Mpc) (mag) (km s−1)(1) (2) (3) (4) (5) (6) (7) (8) (9)
Akn 564 UGC 12163 6.2 47.2 0.68 0.0247 107.6 −21.19 · · ·ESO 140−G043 Fairall 51 3.2 71.0 2.09 0.0142 57.8 −20.23 · · ·ESO 362−G018 MCG−05-13-017 0.1 56.3 1.29 0.0126 50.1 −19.75 · · ·
IC 3528 SDSS J123455.90+153356.1 3.0 19.5 0.42 0.0461 199.5 −21.45 · · ·IRAS 04312+4008 2.5 · · · · · · 0.0207 89.5 · · · · · ·MCG +05-03-013 UGC 524 3.1 26.3 1.02 0.0359 155.6 −21.91 · · ·MCG +08-11-011 UGC 3374 4.0 37.2 2.75 0.0205 89.9 −22.51 73.3±52.6MCG +11-08-054 UGC 3478 3.1 77.3 1.23 0.0128 57.5 −21.15 · · ·
Mrk 6 IC 450 −0.6 62.7 1.38 0.0188 86.7 −20.44 · · ·Mrk 10 UGC 4013 3.1 67.3 1.51 0.0293 128.2 −22.69 142.9±39.6Mrk 40 I Zw 26 −2.0 90.0 0.81 0.0211 93.8 −19.26 · · ·Mrk 79 UGC 3973 3.0 33.0 1.41 0.0222 97.3 −21.75 130±20Mrk 315 II Zw 187 −4.9 60.9 0.72 0.0389 170.6 −21.89 · · ·Mrk 352 −2.0 33.9 0.68 0.0149 65.2 −19.51 · · ·Mrk 358 4.0 42.3 0.71 0.0452 195.0 −21.71 · · ·Mrk 359 UGC 1032 2.5 39.5 0.78 0.0174 73.5 −20.56 · · ·Mrk 493 UGC 10120 3.1 45.4 0.93 0.0313 138.0 −21.16 · · ·Mrk 506 1.0 47.3 0.79 0.0430 187.1 −21.71 · · ·Mrk 533 NGC 7674 3.8 26.7 1.12 0.0289 127.1 −21.93 150.3±33.4Mrk 541 −3.2 70.5 0.89 0.0394 169.8 −20.72 · · ·Mrk 543 NGC 7811, III Zw 127 9.9 23.7 0.41 0.0255 109.1 −20.53 · · ·Mrk 590 NGC 863 1.0 28.5 1.23 0.0264 111.7 −21.61 189±6Mrk 595 1.0 52 · · · 0.0269 114.8 −20.89 · · ·Mrk 704 −0.9 70 0.78 0.0292 128.8 −21.14 · · ·Mrk 705 Akn 202, VIII Zw 47 −2.0 40.7 0.71 0.0292 124.2 −20.95 · · ·Mrk 728 −0.9 · · · · · · 0.0357 153.5 −20.82 · · ·
Mrk 739E NGC 3758 3.8 37.4 0.62 0.0299 128.8 −21.24 · · ·Mrk 871 IC 1198 2.8 62.4 0.71 0.0337 146.6 −21.63 · · ·Mrk 975 UGC 774 2.9 51.5 0.98 0.0496 212.8 −22.28 · · ·Mrk 1018 UGC 1597 −1.9 54 0.91 0.0424 181.1 −21.73 223.1±19.8Mrk 1040 NGC 931 3.7 81.8 2.95 0.0167 72.4 −21.17 154.0±32.6Mrk 1044 1.4 36.9 0.83 0.0165 68.9 −19.37 · · ·Mrk 1126 NGC 7450 −0.9 20.6 1.62 0.0106 44.7 −19.36 85.2±25.1Mrk 1239 · · · · · · · · · 0.0199 83.6 · · · 263.4±21.1Mrk 1243 NGC 3080 1.0 18.4 0.83 0.0354 152.1 −21.25 · · ·Mrk 1511 NGC 5940 0.9 20.4 0.81 0.0339 147.2 −21.58 · · ·NGC 1566 4.0 55.8 8.13 0.0050 17.4 −21.33 109.6±7.8NGC 3516 −2.0 39 2.04 0.0088 40.9 −20.75 181±5NGC 3783 1.3 28.0 2.29 0.00973 39.3 −21.13 95±10NGC 4051 4.0 36.0 5.13 0.00234 13.1 −20.01 89±3NGC 4151 2.1 21.0 3.80 0.00332 17.1 −20.17 97±3NGC 4395 8.8 34.5 4.07 0.00106 4.3 −18.19 30NGC 4593 Mrk 1330 3.0 36.0 2.63 0.00900 35.6 −20.87 135±6NGC 5804 SDSS J145706.79+494008.4 3.1 26.5 1.17 0.0138 62.8 −20.45 · · ·NGC 6814 4.0 21 3.55 0.00521 22.6 −21.42 111.8±17.5NGC 7213 0.9 30.0 3.80 0.00584 22.8 −20.89 181.7±19.6

28 HO, DARLING, & GREENE
TABLE 5: Literature Sample—Continued
Source Name Alternate Name T i Dc
25z DL MBc
Tσ∗±error
() (′) (Mpc) (mag) (km s−1)(1) (2) (3) (4) (5) (6) (7) (8) (9)
NGC 7214 4.4 49.5 2.00 0.0231 95.9 −22.08 · · ·PG 0007+106 III Zw 2, Mrk 1501 2.9 · · · · · · 0.0893 383.7 −22.15 · · ·PG 0050+124 I Zw 1, Mrk 1502 · · · 44.3 0.48 0.0611 261.8 −22.98 · · ·PG 1119+120 Mrk 734 3.4 · · · · · · 0.0502 217.8 −21.88 · · ·PG 1659+294 Mrk 504 1.6 60.2 0.55 0.0359 157.8 −20.77 · · ·PG 2214+139 Mrk 304 −3.0 35.7 0.40 0.0658 283.1 −22.78 · · ·
UGC 3142 IRAS 04406+2852 0.0 39.2 1.86 0.0217 93.8 −22.36 · · ·
NOTE.— Data collected from Hyperleda. Col. (1) Source name. Col. (2) Alternate name(s). Col. (3) Morphologicaltype index. Col. (4) Inclination angle. Col. (5) Isophotal diameter at a B-band surface brightness of 25 mag arcsec−2,corrected for inclination and internal extinction, as described in Bottinelli et al. 1995. Col. (6) Redshift. Col. (7)Luminosity distance, derived assuming a Local Group infall velocity of 208 km s−1 toward the Virgo cluster and a Hubbleconstant of H0 = 70 km s−1 Mpc−1. The distance to NGC 4395 comes from Thim et al. 2004. Col. (8) Total (host galaxy+ AGN) absolute B-band magnitude, corrected for Galactic extinction, internal extinction, and K-correction. Col. (9)Central stellar velocity dispersion, with additional data from Onken et al. 2004 (Mrk 79 and NGC 3783), Nelson et al.2004 (Mrk 590, NGC 3516, 4051, 4151, and 4593), and Filippenko & Ho 2003 (NGC 4395).

H I SURVEY OF AGNS 29
TABLE 6: Properties of the Host Galaxies
Source Name FWHMHβ Ref. log LHβ Ref. log MBH log Lbol log MH I υm Ref. log Mdyn MB,host MB,TF Notes(km s−1) (L⊙) (M⊙) (LEdd) (M⊙) (km s−1) (M⊙) (mag) (mag)
(1) (2) (3) (4) (5) (6) (7) (8) (9) (10) (11) (12) (13) (14)
Akn 564 1301 1 40.59 1 6.00±0.5 −0.49 10.05 166.7± 7.8 20 10.61 −21.14 −19.71 · · ·
ESO 140−G043 3077 1 41.05 1 7.00±0.5 −1.08 10.01 130.3± 5.6 20 10.61 −19.88 −18.91 · · ·
ESO 362−G018 4000 2 40.99 2 7.19±0.5 −1.33 9.31 125.5± 8.6 20 10.31 −19.23 −18.79 · · ·
IC 3528 1574 3 41.48 3 6.42±0.5 −0.12 10.18 128.5±21.0 20 10.44 −21.19 −18.87 1IRAS 04312+4008 1374 4 42.02 13 6.84±0.5 −0.07 9.69 101.9± 3.4 20 · · · · · · −18.12 · · ·
MCG +05-03-013 4161 6 41.03 6 7.25±0.5 −1.35 10.12 263.4±10.5 20 11.34 −21.85 −21.20 · · ·
MCG +08-11-011 6002 7 41.41 14 7.78±0.5 −1.55 10.18 312.0±34.0 20 11.68 −22.43 −21.75 · · ·
MCG +11-08-054 1461 4 40.67 13 6.14±0.5 −0.56 9.83 169.9± 6.9 20 10.61 −21.09 −19.78 · · ·
Mrk 6 7375 7 41.43 14 7.97±0.5 −1.72 8.35 270 14 11.24 −19.70 −21.28 · · ·
Mrk 10 2400 8 41.38 14 6.97±0.5 −0.76 10.68 255.7±31.9 20 11.40 −22.63 −21.10 · · ·
Mrk 40 2000 8 40.76 14 6.46±0.5 −0.80 10.36 100 14 10.18 −18.75 −18.05 · · ·
Mrk 79 4852 15 41.84 15 7.46±0.11 −0.85 9.87 167.2±23.5 20 10.88 −21.30 −19.72 · · ·
Mrk 315 3700 7 41.02 14 7.14±0.5 −1.25 10.12 89.8±15.1 20 10.30 −21.83 −17.70 · · ·
Mrk 352 3800 8 41.15 14 7.24±0.5 −1.23 9.41 182.9± 8.8 20 10.47 −18.35 −20.02 · · ·
Mrk 358 2235 4 40.86 14 6.62±0.5 −0.87 10.27 237.0±12.2 20 11.19 −21.66 −20.86 · · ·
Mrk 359 816 4 40.40 14 5.48±0.5 −0.14 8.88 38.0± 2.6 20 9.22 −20.50 −14.91 2Mrk 493 740 6 41.13 4,6 5.81±0.5 0.18 9.87 24.7± 2.0 20 9.19 −21.00 −13.51 · · ·
Mrk 506 5643 1 41.14 1 7.58±0.5 −1.58 9.71 169.7±16.2 20 10.93 −21.61 −19.77 · · ·
Mrk 533 17053 1 41.18 1 8.56±0.5 −2.53 10.45 373.5±48.7 20 11.60 −21.85 −22.33 3Mrk 541 3300 8 40.84 16 6.94±0.5 −1.21 10.15 182.6±16.7 20 11.00 −20.59 −20.01 4Mrk 543 3828 7 40.23 7 6.73±0.5 −1.54 9.71 255.2±22.6 20 10.77 −20.49 −21.10 · · ·
Mrk 590 2220 15 41.94 15 7.42±0.06 −0.72 10.17 372.3±43.0 20 11.58 −20.91 −22.32 · · ·
Mrk 595 2360 5 41.77 14 7.17±0.5 −0.62 8.92 222 14 · · · −19.74 −20.64 5Mrk 704 5500 5 41.52 14 7.77±0.5 −1.44 8.89 133 14 10.55 −20.74 −18.98 5Mrk 705 2387 1 41.07 1 6.79±0.5 −0.86 9.22 198.4±13.5 20 10.84 −20.78 −20.28 · · ·
Mrk 728 10275 1 41.54 1 8.32±0.5 −1.97 9.50 169.2±15.5 20 · · · −20.20 −19.76 6Mrk 739E 1615 6 42.25 17 7.11±0.5 −0.13 9.51 234.9±22.9 20 10.95 · · · −20.83 7Mrk 871 3688 1 40.91 1 7.08±0.5 −1.29 9.98 251.9±23.3 20 11.12 −21.57 −21.06 · · ·
Mrk 975 4120 1 41.27 1 7.38±0.5 −1.27 9.93 223.9±35.6 20 11.32 −22.21 −20.67 · · ·
Mrk 1018 5000 9 40.33 14 7.02±0.5 −1.74 <9.12 155 14 10.90 −21.71 −19.48 8,9Mrk 1040 4220 4 41.00 14 7.25±0.5 −1.38 10.56 208.3±12.8 20 11.27 −21.05 −20.44 · · ·
Mrk 1044 1010 6 41.01 4,6 6.01±0.5 −0.13 9.65 171.8±18.2 20 10.53 −18.47 −19.81 · · ·
Mrk 1126 2750 4 40.28 18 6.47±0.5 −1.23 9.56 234.2±26.2 20 10.90 −19.21 −20.82 · · ·
Mrk 1239 1075 6 41.14 14 6.14±0.5 −0.14 9.89 180 14 · · · · · · −19.96 9Mrk 1243 3172 4 41.01 18 7.00±0.5 −1.12 10.10 226.2±12.1 20 11.11 −21.14 −20.71 · · ·
Mrk 1511 5236 1 40.79 1 7.32±0.5 −1.63 9.95 226.6±10.8 20 11.09 −21.53 −20.71 · · ·
NGC 1566 2583 10 40.05 10 6.29±0.5 −1.26 9.89 117.2± 4.1 20 10.59 −21.32 −18.57 · · ·
NGC 3516 3353 15 40.88 15 7.37±0.13 −1.60 <8.42 296 21 11.16 −20.61 −21.58 9,10NGC 3783 3093 15 41.32 15 7.21±0.07 −1.05 9.57 125.7±11.4 20 10.45 −20.88 −18.80 · · ·
NGC 4051 1052 15 39.81 15 6.02±0.15 −1.20 9.15 209.9±10.3 20 10.77 −19.98 −20.46 · · ·
NGC 4151 4248 15 40.60 23 7.40±0.05 −1.88 9.46 144.6± 4.3 20 10.43 −20.03 −19.25 · · ·
NGC 4395 1500 24 37.44 24 5.30±0.12 −2.57 9.31 84.0± 1.6 20 9.39 −18.19 −17.49 11NGC 4593 3769 15 40.53 25 6.74±0.08 −1.28 9.37 274.6±17.2 20 11.15 −20.81 −21.34 · · ·
NGC 5804 2176 3 40.61 3 6.23±0.5 −0.70 9.24 219.3±41.6 20 10.85 −20.34 −20.60 1NGC 6814 4200 11 40.60 11 7.02±0.5 −1.50 9.60 98.2± 1.4 20 10.19 −21.38 −17.99 12NGC 7213 3200 2 40.78 2 6.88±0.5 −1.20 9.41 378.6±44.9 20 11.40 −20.79 −22.38 · · ·
NGC 7214 4500 2 41.25 2 7.44±0.5 −1.35 9.79 210.7±17.1 20 11.23 −21.99 −20.48 · · ·
PG 0007+106 5100 12 42.32 19 8.15±0.5 −1.11 10.37 289.5±64.0 20 · · · −21.08 −21.51 3,13PG 0050+124 1092 1 41.93 1 6.59±0.5 0.10 10.34 219.2±17.1 20 11.08 −22.83 −20.60 · · ·
PG 1119+120 2171 1 41.48 1 6.94±0.5 −0.64 9.75 146.6±21.1 20 · · · −21.71 −19.30 6

30 HO, DARLING, & GREENE
TABLE 6: Properties of the Host Galaxies—Continued
Source Name FWHMHβ Ref. log LHβ Ref. log MBH log Lbol log MH I υm Ref. log Mdyn MB,host MB,TF Notes(km s−1) (L⊙) (M⊙) (LEdd) (M⊙) (km s−1) (M⊙) (mag) (mag)
(1) (2) (3) (4) (5) (6) (7) (8) (9) (10) (11) (12) (13) (14)
PG 1659+294 2300 8 40.95 18 6.69±0.5 −0.86 9.30 116.2± 6.1 20 10.37 −20.61 −18.54 6PG 2214+139 5131 1 42.03 1 7.99±0.5 −1.21 10.24 217.4±18.5 20 11.03 −22.55 −20.58 · · ·
UGC 3142 10489 4 41.04 13 8.06±0.5 −2.15 9.87 208.9± 9.7 20 11.18 −22.32 −20.45 · · ·
NOTE.— Col. (1) Source name. Col. (2) FWHM of the broad Hβ line. Col. (3) Reference for FWHMHβ. Col. (4) Luminosity of thebroad Hβ line; in the case of the reverberation mapped objects, the Hβ luminosity was estimated from the published 5100 A continuumluminosity, using the LHβ − L
5100Acorrelation (Eq. 2) of Greene & Ho 2005b. Col. (5) Reference for LHβ. Col. (6) Black hole mass
derived either from the Hβ method of Greene & Ho 2005b or from reverberation mapping; preference is given to the latter if available.Masses from the latter method come from Peterson et al. 2004, except for NGC 4395 (Peterson et al. 2005), NGC 4151 (Bentz et al.2006), and NGC 4593 (Denney et al. 2006). For consistency with the virial mass zeropoint adopted by Greene & Ho 2005b, all thereverberation mapped masses were reduced by a factor of 1.8 (see footnote 4 in Greene & Ho 2005b). Col. (7) Eddington ratio, assumingLbol = 9.8L
5100A(McLure & Dunlop 2004), with L
5100Aestimated from the LHβ − L
5100Acorrelation of Greene & Ho 2005b. Col. (8)
H I mass. Col. (9) Maximum rotational velocity, corrected for inclination. Col. (10) Reference for υm. Col. (11) Dynamical massof the galaxy, derived from Dc
25 and υm. Col. (12) B-band absolute magnitude of the host galaxy, derived from subtracting the AGNcontribution from the total luminosity. Col. (13) B-band absolute magnitude of the host galaxy, derived from υm and the Tully-Fisherrelation. Col. (14) Notes: (1) Broad-line parameters based on Hα instead of Hβ; black hole mass derived using the Hα method of Greene& Ho 2005. (2) The W20 value listed in Giovanelli & Haynes 1993 gives Vmax = 159 km s−1. (3) Broad Hβ component seems very weakand ambiguous; omit from sample. (4) Hβ flux is the average of the values of two epochs, as quoted in Phillips 1978. (5) H I flux fromHutchings 1989. (6) No available value for inclination angle. (7) Galaxy pair; H I line width may be affected by the starburst companionMrk 739W. (8) Vmax based on optical rotation curve. (9) H I flux from Mirabel & Wilson 1984. (10) Inclination angle from Mulchaeyet al. 1992. (11) The inclination angle given in Hyperleda, 90, is incorrect. The listed value comes from Ho et al. 1997. (12) Theinclination angle given in Hyperleda, 85.6, is incorrect. The listed value comes from Schulz et al. 1994, but it is very uncertain; it canbe as low as i ≈ 0. The width of the broad Hβ profile of NGC 6814 is extremely variable, by about a factor of 2; the listed value is theaverage for “group 1” and “group 2” given in Rosenblatt et al. 1994. The listed broad Hβ flux is also the average of these two groups.(13) No B-band magnitude given in Hyperleda. (14) H I line width highly uncertain.
REFERENCES.— (1) Marziani et al. 2003; (2) Winkler 1992; (3) SDSS, this paper; (4) Botte et al. 2004; (5) Stirpe 1990; (6)Veron-Cetty et al. 2001; (7) Wang et al. 2006; (8) Osterbrock 1977; (9) Osterbrock 1981; (10) Kriss et al. 1991; (11) Rosenblatt etal. 1994; (12) Boroson & Green 1992; (13) Greene & Ho 2005, converted from λLλ(5100 A) luminosity given in Botte et al. 2004; (14)Whittle 1992; (15) Peterson et al. 2004; (16) Phillips 1978; (17) Netzer et al. 1987; (18) Dahari & De Robertis 1988; (19) L. C. Ho 2007,in preparation; (20) Hyperleda (http://leda.univ-lyon1.fr/); (21) Mulchaey et al. 1992; (22) Condon et al. 1985; (23) Bentz et al.2006; (24) Filippenko & Ho 2003; (25) Denney et al. 2006.
TABLE 7: Emission-line Properties of New SDSS Objects
Source Name Narrow Lines Broad Lines Type
Hβ [O III] [O I] Hα [N II] [S II] Hβ FWHM Hα FWHMλ4861 λ5007 λ6300 λ6563 λ6583 λλ6716, 6731 λ4861 (km s−1) λ6563 (km s−1)
SDSS J120257.81+045045.0 4.68 48.1 3.81 20.5 31.5 18.9 17.9 3829 151 2066 S1.5SDSS J123455.90+153356.1 33.0 158 6.49 161 111 55.6 118 1891 640 1574 S1.2SDSS J145706.79+494008.4 58.8 36.0 13.4 199 131 90.1 367 3328 873 2176 S1.0
NOTE.—Line fluxes in units of 10−16 ergs s−1 cm−2, corrected for Galactic extinction, but not for internal extinction. The Seyfert type given inthe last column is based on the observed flux ratio of [O III] λ5007/Hβ(total), following the criteria recommended by Whittle 1992.

H I SURVEY OF AGNS 31
REFERENCES
Adelman-McCarthy, J. K., et al. 2006, ApJS, 162, 38Allen, R. J., Darchy, B. F., & Lauque, R. 1971, A&A, 10, 198Baes, M., Buyle, P., Hau, G. K. T., & Dejonghe, H. 2003, MNRAS,341, L44Barth, A. J., Greene, J. E., & Ho, L. C. 2005, ApJ, 619, L151Barth, A. J., Ho, L. C., Rutledge, R. E., & Sargent, W. L. W. 2004, ApJ, 607,
90Bentz, M. C., et al. 2006, ApJ, 651, 775Bieging, J. H., & Biermann, P. 1983, AJ, 88, 161Boroson, T. A., & Green, R. F. 1992, ApJS, 80, 109Bothun, G. D., Heckman, T. M., Schommer, R. A., & Balick, B. 1984, AJ, 89,
1293Bothun, G. D., Mould, J., Heckman, T., Balick, B., Schommer,R. A., &
Kristian, J. 1982, AJ, 87, 1621Botte, V., Ciroi, S., Rafanelli, P., & Di Mille, F. 2004, AJ, 127, 3168Bottinelli, L., Gouguenheim, L., Paturel, G., & Teerikorpi, P. 1995, A&A, 296,
64Bregman, J. N., Hogg, D. E., & Roberts, M. S. 1992, ApJ, 387, 484Broeils, A. H., & Rhee, M.-H. 1997, A&A, 324, 877Casertano, S. P. R., & Shostak, G. S. 1980, A&A, 81, 371Condon, J. J., Hutchings, J. B., & Gower, A. C. 1985, AJ, 90, 1642Dahari, O., & De Robertis, M. M. 1988, ApJS, 67, 249Denney, K. D., et al. 2006, ApJ, 653, 152Dressel, L. L., Bania, T. M., & O’Connell, R. W. 1982, ApJ, 259, 55Ferrarese, L. 2002, ApJ, 578, 90Filippenko, A. V., & Ho, L. C. 2003, ApJ, 588, L13Fouqué, R., Bottinelli, L., Gouguenheim, L., & Paturel, G. 1990, ApJ, 349, 1Fukugita, M., Shimasaku, K., & Ichikawa, T. 1995, PASP, 107,945Giovanelli, R., & Haynes, M. P. 1993, AJ, 105, 1271Granato, G. L., De Zotti, G., Silva, L., Bressan, A., & Danese, L. 2004, ApJ,
600, 580Greene, J. E. 2006, Ph.D. Thesis, Harvard UniversityGreene, J. E., & Ho, L. C. 2004, ApJ, 610, 722——. 2005a, ApJ, 627, 721——. 2005b, ApJ, 630, 122——. 2006a, ApJ, 641, 117——. 2006b, ApJ, 641, L21——. 2007a, ApJ, 667, 131——. 2007b, ApJ, 670, 92Greene, J. E., Lim, J., & Ho, P. T. P. 2004, ApJS, 153, 93Hartmann, D., & Burton, W. B. 1997, Atlas of Galactic NeutralHydrogen
(Cambridge: Cambridge Univ. Press)Haynes, M. P. & Giovanelli, R. 1984, AJ, 89, 758Heckman, T. M., & Balick, B., & Sullivan, W. T. 1978, ApJ, 224,745Heiles, C., et al. 2000, Arecibo Technical and Operations Memo 2000-04Ho, L. C. 2004, ed., Carnegie Observatories Astrophysics Series, Vol. 1:
Coevolution of Black Holes and Galaxies (Cambridge: Cambridge Univ.Press)
——. 2007a, ApJ, 668, 94——. 2007b, ApJ, 669, 821Ho, L. C., Darling, J., & Greene, J. E. 2008, ApJ, in pressHo, L. C., Filippenko, A. V., & Sargent, W. L. W. 1997, ApJS, 112, 315Hubble, E. 1926, ApJ, 64, 321Hutchings, J. B. 1989, AJ, 98, 524Hutchings, J. B., Gower, A. C., Price, R. 1987, AJ, 93, 6Jenkins, C. R. 1983, MNRAS, 205, 1321Kaspi, S., Smith, P. S., Netzer, H., Maoz, D., Jannuzi, B. T.,& Giveon, U. 2000,
ApJ, 533, 631Kim, M., Ho, L. C., & Im, M. 2006, ApJ, 642, 702Knapp, G. R., Turner, E. L., & Cunniffe, P. E. 1985, AJ, 90, 454
Kriss, G. A., Hartig, G. F., Armus, L., Blair, W. P., Caganoff, S., & Dressel, L.1991, ApJ, 377, L13
Lim, J., & Ho, P. T. P. 1999, ApJ, 510, L7Marziani, P., Sulentic, J. W., Zamorani, R., Calvani, M., Dultzin-Hacyan, D.,
Bachev, R., & Zwitter, T. 2003, ApJS, 145, 199McLure, R. J., & Dunlop, J. S. 2004, MNRAS, 352, 1390Mirabel, I. F., & Wilson, A. S. 1984, ApJ, 277, 92Morganti, R., et al. 2006, MNRAS, 371, 157Morganti, R., Tadhunter, C. N., Oosterloo, T. A., Holt, J., &Emonts, B. 2007,
in The Central Engine of Active Galactic Nuclei, ed. L. C. Ho &J.-M. Wang(San Francisco: ASP), 343
Motch, C., et al. 1998, A&AS, 132, 341Mulchaey, J. S., Tsvetanov, Z., Wilson, A. S., & P/’erez-Fournon, I. 1992, ApJ,
394, 91Nelson, C. H., Green, R. F., Bower, G., Gebhardt, K., & Weistrop, D. 2004,
ApJ, 615, 652Nelson, C. H., & Whittle, M. 1995, ApJS, 99, 67Netzer, H., Kollatschny, W., & Fricke, K. J. 1987, A&A, 171, 41Noordermeer, E., van der Hulst, J. M., Sancisi, R., Swaters,R. A., & van
Albada, T. S. 2005, A&A, 442, 137Onken, C. A., Ferrarese, L., Merritt, D., Peterson, B. M., Pogge, R. W.,
Vestergaard, M., & Wandel, A. 2004, ApJ, 615, 645Osterbrock, D. E. 1977, ApJ, 215, 733——. 1981, ApJ, 249, 462Osterbrock, D. E., & Pogge, R. W. 1985, ApJ, 297, 166Paturel, G., Petit, C., Prugniel, Ph., Theureau, G., Rousseau, J., Brouty, M.,
Dubois, P., & Cambrésy, L. 2003a, A&A, 412, 45Paturel, G., Theureau, G., Bottinelli, L., Gouguenheim, L., Coudreau-Durand,
N., Hallet, N., & Petit, C. 2003b, A&A, 412, 57Peterson, B. M., et al. 2004, ApJ, 613, 682——. 2005, ApJ, 632, 799 (err: 641, 638)Peterson, B. M. 2007, in The Central Engine of Active Galactic Nuclei, ed. L.
C. Ho & J.-M. Wang (San Francisco: ASP), 3Phillips, M. M. 1978, ApJS, 38, 187Pizzella, A., Corsini, E., Dalla Bontá, E., Sariz, M., Coccato, L., & Bertola, F.
2005, ApJ, 631, 785Roberts, M. S. 1962, AJ, 67, 437Roberts, M. S., & Haynes, M. P. 1994, ARA&A, 32, 115Roberts, M. S., Hogg, D. E., Bregman, J. N., Forman, W. R., & Jones, C. 1991,
ApJS, 75, 751Rosenblatt, E. I., Malkan, M. A., Sargent, W. L. W., & Readhead, A. C. S. 1994,
ApJS, 93, 73Schmidt, M., & Green, R. F. 1983, ApJ, 269, 352Schulz, H., Knake, A., & Schmidt-Kaler, Th. 1994, A&A, 288, 425Shimasaku, K., et al. 2001, AJ, 122, 1238Springel, V., Di Matteo, T., & Hernquist, L. 2005, MNRAS, 361, 776Springob, C. M., Haynes, M. P., Giovanelli, R., & Kent, B. R. 2005, ApJS, 160,
149Stirpe, G. M. 1990, A&AS, 85, 1049Thim, F., Hoessel, J. G., Saha, A., Claver, J., Dolphin, A., &Tammann, G. A.
2004, AJ, 127, 2322Tully, R. B., & Fisher, J. R. 1977, A&A, 54, 661Vanden Berk, D. E., et al. 2001, AJ, 122, 549Verheijen, M. A. W., & Sancisi, R. 2001, A&A, 370, 765Véron-Cetty, M.-P., Véron, P., & Goncalves, A. C. 2001, A&A, 372, 730Wang, J., Wei, J. Y., & He, X. T. 2006, ApJ, 638, 106Whitmore, B. C., & Kirshner, R. P. 1981, ApJ, 250, 43Whitmore, B. C., Schechter, P. L., & Kirshner, R. P. 1979, ApJ, 234, 68Whittle, M. 1992, ApJS, 79, 49Winkler, H. 1992, MNRAS, 257, 677
Copyright © 2022 FDOKUMEN