THE NONSTELLAR INFRARED CONTINUUM OF SEYFERT GALAXIES
16
THE ASTRONOMICAL JOURNAL, 121:1369È1384, 2001 March ( 2001. The American Astronomical Society. All rights reserved. Printed in U.S.A. THE NONSTELLAR INFRARED CONTINUUM OF SEYFERT GALAXIES1 ALMUDENA ALONSO-HERRERO2 AND ALICE C. QUILLEN Steward Observatory, 933 North Cherry Avenue, University of Arizona, Tucson, AZ 85721 CHRIS SIMPSON Subaru Telescope, National Astronomical Observatory of Japan, 650 North A“Oho 6 ku 6 Place, Hilo, HI 96720 ANDREAS EFSTATHIOU Astrophysics Group, Imperial College London, Blackett Laboratory, Prince Consort Road, London SW7 2BZ, England, UK AND MARTIN J. WARD Department of Physics and Astronomy, University of Leicester, Leicester LE1 7RH, England, UK Received 2000 October 16 ; accepted 2000 November 17 ABSTRACT JHKL @M (1È5 km) imaging of a sample of Seyfert 2 galaxies is presented. We have performed an accurate estimate of the near-infrared nonstellar nuclear Ñuxes. We conÐrm that the near-infrared nuclear continuum between 1 and 2.2 km of some Seyfert 2s is dominated by stellar emission, whereas the continuum emission at longer wavelengths (j \ 3È5 km) is almost entirely nonstellar in origin. The nonstellar spectral energy distributions (SED) in the infrared (up to 15 km) of Seyfert galaxies show a variety of shapes, and they are well reproduced with the tapered disk models of Efstathiou & Rowan- Robinson. We have used two models, one including an optically thin cone component found to Ðt the SED of NGC 1068 and a coneless model. Although our modeling of the SEDs does not allow us to favor either model to account for all the observed SEDs, we Ðnd that the viewing angle toward the central source is well constrained by both models. The galaxies in our sample have Ðtted values of the viewing angle in the range for the assumed model parameters. We have also investigated h v \ 0¡È 64¡, nonstellar color-color diagrams (L @[M vs. H[M and L @[M vs. H[L @). The colors of the Seyfert gal- axies with viewing angles are better reproduced with the cone model. These diagrams provide a h v \ 30¡ good means to separate Seyfert 2s with moderate obscuration mag from hard X-ray (A V [ 20 observations) from those with high obscuration. The ground-based 4.8 km and ISO 9.6 km luminosities are well correlated with the hard X-ray lumi- nosities of Seyfert 1s and 2s. These continuum emissions appear as a good indicator of the AGN lumi- nosity, at least in the cases of hard X-ray Compton-thin Seyfert galaxies cm~2). We Ðnally (N H ¹ 1024 stress the Ðnding that some Compton thick galaxies show bright nonstellar emission at 5 km. This sug- gests that the near-infrared emission in Seyfert galaxies is produced in an extended component illumi- nated by the central source, that is more visible from all viewing angles, providing a good explanation for the di†ering ratios found in some Seyfert 2s. We discuss possible implications of mid-infrared N H /A V surveys for the search of counterparts of highly obscured hard X-ray sources. Key words : galaxies : active È galaxies : nuclei È galaxies : photometry È galaxies : Seyfert È galaxies : stellar content È infrared : galaxies 1. INTRODUCTION There is now considerable evidence that the infrared emission in active galaxies (Seyfert galaxies and radio quiet quasars) is thermal in origin, namely hot dust emission (e.g., Rieke & Low 1975 ; Rieke 1978 ; Barvainis 1987 ; McAlary & Rieke 1988 ; Sanders et al. 1989 ; Danese et al. 1992 ; and recently Andreani, Franceschini, & Granato 1999 ; Haas et al. 2000 ; Polletta et al. 2000, and references therein). The strong mid- and far-infrared emission in active galactic ÈÈÈÈÈÈÈÈÈÈÈÈÈÈÈ 1 This work is based on observations collected at UKIRT. The UKIRT is operated by the Joint Astronomy Centre on behalf of the UK Particle Physics and Astronomy Research Council. Based on observations with the NASA/ESA Hubble Space T elescope, obtained at the Space Telescope Science Institute, which is operated by the Association of Universities for Research in Astronomy, Inc., under NASA contract NAS 5-26555. 2 Current address : Department of Physical Sciences, University of Hertfordshire, College Lane, HatÐeld, Herts, AL10 9AB, England, UK. nuclei is often interpreted as produced by a disklike (Sanders et al. 1989) or torus-like (e.g., Pier & Krolik 1992 ; Granato & Danese 1994 ; Efstathiou & Rowan-Robinson 1995, among others) dust conÐguration heated by the central source. This obscuring material which hides a direct view of the central source in type 2 objects, absorbs a large fraction of the X-ray/UV/optical energy emitted by the central source and reradiates it in the infrared spectral range. The nature of the nonstellar infrared continuum in Seyfert 2 galaxies, where the stellar component dominates the nuclear near-infrared emission (Edelson & Malkan 1986 ; Alonso-Herrero, Ward, & Kotilainen 1996), has eluded us because of the difficulty in estimating the non- stellar contribution at near-infrared wavelengths (up to 2 km). High-resolution near-infrared images observed with NICMOS on the HST have now been used to detect and measure the nuclear nonstellar emission in Seyfert galaxies 1369
Transcript of THE NONSTELLAR INFRARED CONTINUUM OF SEYFERT GALAXIES

THE ASTRONOMICAL JOURNAL, 121 :1369È1384, 2001 March( 2001. The American Astronomical Society. All rights reserved. Printed in U.S.A.
THE NONSTELLAR INFRARED CONTINUUM OF SEYFERT GALAXIES1
ALMUDENA ALONSO-HERRERO2 AND ALICE C. QUILLEN
Steward Observatory, 933 North Cherry Avenue, University of Arizona, Tucson, AZ 85721
CHRIS SIMPSON
Subaru Telescope, National Astronomical Observatory of Japan, 650 North A“Oho6 ku6 Place, Hilo, HI 96720
ANDREAS EFSTATHIOU
Astrophysics Group, Imperial College London, Blackett Laboratory, Prince Consort Road, London SW7 2BZ, England, UK
AND
MARTIN J. WARD
Department of Physics and Astronomy, University of Leicester, Leicester LE1 7RH, England, UKReceived 2000 October 16 ; accepted 2000 November 17
ABSTRACTJHKL @M (1È5 km) imaging of a sample of Seyfert 2 galaxies is presented. We have performed an
accurate estimate of the near-infrared nonstellar nuclear Ñuxes. We conÐrm that the near-infrarednuclear continuum between 1 and 2.2 km of some Seyfert 2s is dominated by stellar emission, whereasthe continuum emission at longer wavelengths (j \ 3È5 km) is almost entirely nonstellar in origin. Thenonstellar spectral energy distributions (SED) in the infrared (up to 15 km) of Seyfert galaxies show avariety of shapes, and they are well reproduced with the tapered disk models of Efstathiou & Rowan-Robinson. We have used two models, one including an optically thin cone component found to Ðt theSED of NGC 1068 and a coneless model. Although our modeling of the SEDs does not allow us tofavor either model to account for all the observed SEDs, we Ðnd that the viewing angle toward thecentral source is well constrained by both models. The galaxies in our sample have Ðtted values of theviewing angle in the range for the assumed model parameters. We have also investigatedh
v\ 0¡È64¡,
nonstellar color-color diagrams (L @[M vs. H[M and L @[M vs. H[L @). The colors of the Seyfert gal-axies with viewing angles are better reproduced with the cone model. These diagrams provide ah
v\ 30¡
good means to separate Seyfert 2s with moderate obscuration mag from hard X-ray(AV
[ 20observations) from those with high obscuration.
The ground-based 4.8 km and ISO 9.6 km luminosities are well correlated with the hard X-ray lumi-nosities of Seyfert 1s and 2s. These continuum emissions appear as a good indicator of the AGN lumi-nosity, at least in the cases of hard X-ray Compton-thin Seyfert galaxies cm~2). We Ðnally(NH ¹ 1024stress the Ðnding that some Compton thick galaxies show bright nonstellar emission at 5 km. This sug-gests that the near-infrared emission in Seyfert galaxies is produced in an extended component illumi-nated by the central source, that is more visible from all viewing angles, providing a good explanationfor the di†ering ratios found in some Seyfert 2s. We discuss possible implications of mid-infraredNH/A
Vsurveys for the search of counterparts of highly obscured hard X-ray sources.Key words : galaxies : active È galaxies : nuclei È galaxies : photometry È galaxies : Seyfert È
galaxies : stellar content È infrared : galaxies
1. INTRODUCTION
There is now considerable evidence that the infraredemission in active galaxies (Seyfert galaxies and radio quietquasars) is thermal in origin, namely hot dust emission (e.g.,Rieke & Low 1975 ; Rieke 1978 ; Barvainis 1987 ; McAlary& Rieke 1988 ; Sanders et al. 1989 ; Danese et al. 1992 ; andrecently Andreani, Franceschini, & Granato 1999 ; Haas etal. 2000 ; Polletta et al. 2000, and references therein). Thestrong mid- and far-infrared emission in active galactic
ÈÈÈÈÈÈÈÈÈÈÈÈÈÈÈ1 This work is based on observations collected at UKIRT. The UKIRT
is operated by the Joint Astronomy Centre on behalf of the UK ParticlePhysics and Astronomy Research Council. Based on observations with theNASA/ESA Hubble Space Telescope, obtained at the Space TelescopeScience Institute, which is operated by the Association of Universities forResearch in Astronomy, Inc., under NASA contract NAS 5-26555.
2 Current address : Department of Physical Sciences, University ofHertfordshire, College Lane, HatÐeld, Herts, AL10 9AB, England, UK.
nuclei is often interpreted as produced by a disklike(Sanders et al. 1989) or torus-like (e.g., Pier & Krolik 1992 ;Granato & Danese 1994 ; Efstathiou & Rowan-Robinson1995, among others) dust conÐguration heated by thecentral source. This obscuring material which hides a directview of the central source in type 2 objects, absorbs a largefraction of the X-ray/UV/optical energy emitted by thecentral source and reradiates it in the infrared spectralrange.
The nature of the nonstellar infrared continuum inSeyfert 2 galaxies, where the stellar component dominatesthe nuclear near-infrared emission (Edelson & Malkan1986 ; Alonso-Herrero, Ward, & Kotilainen 1996), haseluded us because of the difficulty in estimating the non-stellar contribution at near-infrared wavelengths (up to 2km). High-resolution near-infrared images observed withNICMOS on the HST have now been used to detect andmeasure the nuclear nonstellar emission in Seyfert galaxies
1369

1370 ALONSO-HERRERO ET AL. Vol. 121
(Quillen et al. 2001a). This work reported that almost 100%of all Seyfert 1È1.9 galaxies and 50% of all Seyfert 2s showpoint sources at 1.6 km. This unresolved emission is vari-able in some of the Seyfert 2s and thus is presumably non-stellar emission associated with the central engine (Quillenet al. 2000). The high detection rate of point sources in thenear-infrared is in contrast with the small number of pointsources reported in Seyfert 2s in the HST optical survey ofMalkan, Gorjian, & Tam (1998). Previous attempts tomodel the nonstellar spectral energy distributions (SEDs) ofSeyfert 2s (e.g., Edelson & Malkan 1986 and recently Faddaet al. 1998, and references therein) su†ered from a number ofproblems, including large aperture photometry and uncer-tain determinations of the stellar component which maydominate the near-infrared emission up to 2.2 km of Seyfert2s. To date, a detailed modeling of SEDs has been restrictedto individual galaxies (e.g., NGC 1068, Efstathiou, Hough,& Young 1995 ; NGC 3281, Simpson 1998 ; CenA, Alex-ander et al. 1999 ; the Circinus galaxy, Ruiz et al. 2001). Anadditional problem may exist when nonsimultaneous obser-vations are used since some Seyfert 1.8s and 1.9s are nowfound to show variability at near-infrared wavelengths overtimescales of several months (Quillen et al. 2000 from HST /NICMOS observations at 1.6 km).
Models of dusty tori with di†erent geometries (e.g., Pier& Krolik 1992 ; Granato & Danese 1994 ; Efstathiou &Rowan-Robinson 1995 ; Granato, Danese, & Franceschini1997) predict bright infrared emission, making the L -band(at 3.5 km) and M-band (at 4.8 km) well suited to study thenature of the nonstellar emission in Seyfert galaxies.Because of the strong dependence of the infrared emissionwith the viewing angle and the geometry of the obscuringmaterial, infrared SEDs can be used to constrain the torusparameters in Seyfert galaxies. An additional advantage isthat the stellar contribution is greatly reduced longward of2 km, even for Seyfert 2s (Alonso-Herrero et al. 1996). Theuse of observations at longer wavelengths [50 km (e.g.,IRAS and ISO measurements), while useful in determiningthe bolometric emission, are problematic when trying toseparate the contributions from the central AGN and apossible circumnuclear starburst, because of the large aper-tures employed.
In this paper we present near-infrared (from 1 to 5 km)imaging observations of a small sample of Seyfert 1.9È2galaxies which are complemented with HST /NICMOS andISO imaging, covering a spectral range from 1 km up to 15km. In a future paper (Quillen et al. 2001b) we will discussthe infrared properties and SEDs of the Seyfert 1.8È2s in theCfA sample. The paper is organized as follows, in ° 2 wedescribe the observations, in ° 3 we determine the nonstellaremission, and in ° 4 we analyze the observed nonstellarenergy distributions, nonstellar color-color diagrams andcompare them with the outputs from torus models. In ° 5 wewill show that the 5È10 km Ñuxes are a good indicator forthe AGN luminosity for Compton-thin AGNs. Conclusionsare presented in ° 6.
2. OBSERVATIONS
2.1. UKIRT ObservationsWe obtained J km), H km), K(jc \ 1.25 (jc \ 1.65 (jc\2.20 km), L @ km) and M km) imaging of(jc \ 3.80 (jc\ 4.80
a sample of 14 Seyfert 1.9 and Seyfert 2 galaxies (see Table1) with the infrared camera IRCAM3 on the 3.9 m UnitedKingdom Infrared Telescope (UKIRT) during two observ-ing runs in 1997 September and 1998 April. The size of theJ, H, and K images is 256] 256 pixels with pixel size of
pixel~1, whereas the size of the L @M images is 64] 640A.143pixels, with pixel size pixel~1.0A.286
Standard reduction procedures were applied. Conditionswere photometric during both runs, so standard star obser-vations from the Elias et al. (1982) list (for JHKL @) and fromthe UKIRT list of photometric standards (for M) were usedto perform the photometric calibration of the images. Themajor source of uncertainty in near-infrared observationscomes from the background subtraction, especially at thelonger wavelengths (L @ and M). Typical errors from thephotometric calibration are 0.09, 0.04, 0.08, 0.07, and 0.10mag in J, H, K, L @, and M, respectively. The FWHM seeingwas measured from the standard stars at K band0A.6È0A.7for both runs.
Standard synthetic aperture photometry was performedon all the images using a 3A diameter circular aperture(Table 2). The errors associated with the sky subtraction at
TABLE 1
LOG OF UKIRT AND HST /NICMOS OBSERVATIONS
TimescaleGalaxy UKIRT Date NICMOS Date Var. (months)
(1) (2) (3) (4) (5) (6) (7)
NGC 1052 . . . . . . . . . . . . JHKL @M 1997 Sep NIC2 F160W 1998 Sep . . . . . .NGC 1068 . . . . . . . . . . . . JHKL @M 1997 Sep NIC2 F110W, F160W, F222M 1998 Feb . . . . . .NGC 1097 . . . . . . . . . . . . JHKL @M 1997 Sep . . . . . . . . . . . .NGC 2992 . . . . . . . . . . . . JHKL @M 1998 Apr NIC2 F205W 1998 Nov . . . . . .NGC 4968 . . . . . . . . . . . . JHKL @M 1998 Apr NIC2 F160W 1998 May . . . . . .NGC 5252a . . . . . . . . . . . M 1998 Apr NIC1 F110W, F160W 1998 Mar, 1998 Apr No 1 monthNGC 5506 . . . . . . . . . . . . JHKL @M 1998 Apr NIC2 F160W, F205W 1998 Apr, 1998 Aug . . . . . .NGC 7172 . . . . . . . . . . . . JHKL @M 1997 Sep . . . . . . . . . . . .NGC 7217 . . . . . . . . . . . . JHKL @M 1997 Sep NIC1 F110W, F160W 1997 Aug . . . . . .Mrk 1 . . . . . . . . . . . . . . . . . JHKL @ 1997 Sep NIC1 F160W 1997 Sep . . . . . .Mrk 348a . . . . . . . . . . . . . M 1997 Sep . . . . . . . . . . . .Mrk 533 . . . . . . . . . . . . . . JHKL @M 1997 Sep NIC1 F110W, F160W 1998 Sep, 1997 Sep Yes 14Mrk 573a . . . . . . . . . . . . . M 1997 Sep NIC1 F110W, F160W 1998 Aug No 12MCG [5-23-16 . . . . . . JHKL @M 1998 Apr . . . . . . . . . . . .
a JHKL @ imaging can be found in Alonso-Herrero et al. (1998).
No. 3, 2001 NONSTELLAR IR CONTINUUM OF SEYFERT GALAXIES 1371
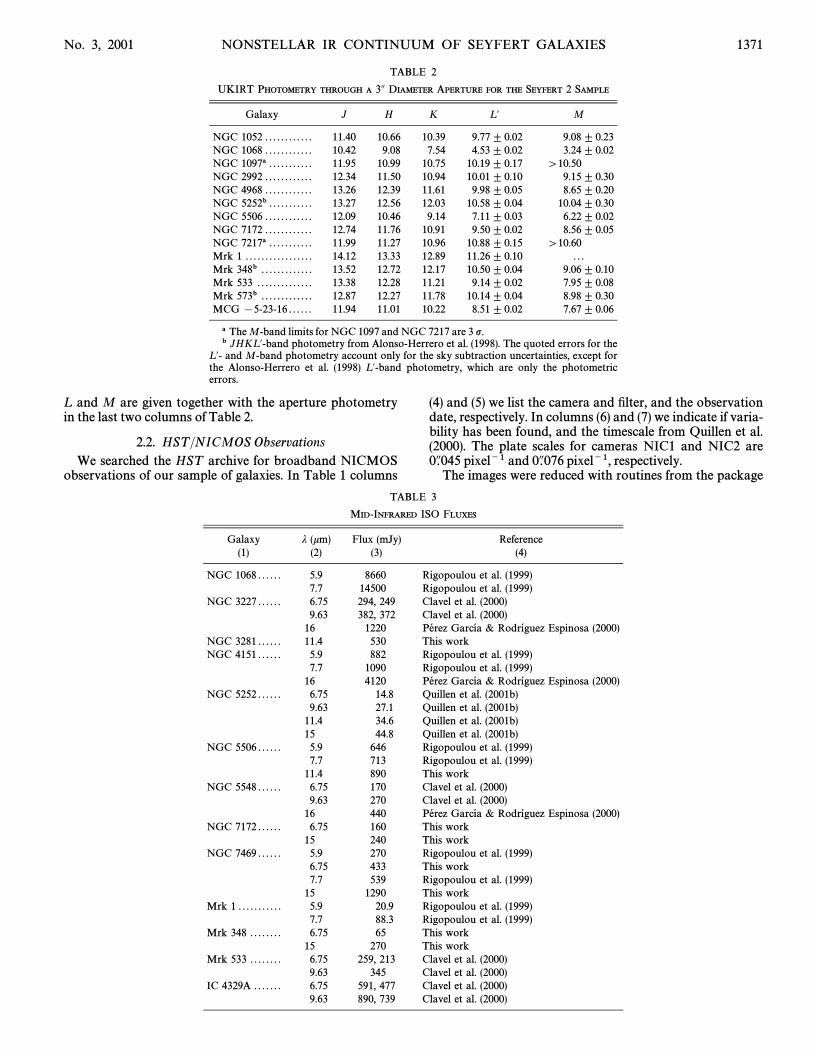
TABLE 2
UKIRT PHOTOMETRY THROUGH A 3A DIAMETER APERTURE FOR THE SEYFERT 2 SAMPLE
Galaxy J H K L @ M
NGC 1052 . . . . . . . . . . . . 11.40 10.66 10.39 9.77^ 0.02 9.08^ 0.23NGC 1068 . . . . . . . . . . . . 10.42 9.08 7.54 4.53^ 0.02 3.24^ 0.02NGC 1097a . . . . . . . . . . . 11.95 10.99 10.75 10.19^ 0.17 [10.50NGC 2992 . . . . . . . . . . . . 12.34 11.50 10.94 10.01^ 0.10 9.15^ 0.30NGC 4968 . . . . . . . . . . . . 13.26 12.39 11.61 9.98^ 0.05 8.65^ 0.20NGC 5252b . . . . . . . . . . . 13.27 12.56 12.03 10.58^ 0.04 10.04^ 0.30NGC 5506 . . . . . . . . . . . . 12.09 10.46 9.14 7.11^ 0.03 6.22^ 0.02NGC 7172 . . . . . . . . . . . . 12.74 11.76 10.91 9.50^ 0.02 8.56^ 0.05NGC 7217a . . . . . . . . . . . 11.99 11.27 10.96 10.88^ 0.15 [10.60Mrk 1 . . . . . . . . . . . . . . . . . 14.12 13.33 12.89 11.26^ 0.10 . . .Mrk 348b . . . . . . . . . . . . . 13.52 12.72 12.17 10.50^ 0.04 9.06^ 0.10Mrk 533 . . . . . . . . . . . . . . 13.38 12.28 11.21 9.14^ 0.02 7.95^ 0.08Mrk 573b . . . . . . . . . . . . . 12.87 12.27 11.78 10.14^ 0.04 8.98^ 0.30MCG [5-23-16 . . . . . . 11.94 11.01 10.22 8.51^ 0.02 7.67^ 0.06
a The M-band limits for NGC 1097 and NGC 7217 are 3 p.b JHKL @-band photometry from Alonso-Herrero et al. (1998). The quoted errors for the
L @- and M-band photometry account only for the sky subtraction uncertainties, except forthe Alonso-Herrero et al. (1998) L @-band photometry, which are only the photometricerrors.
L and M are given together with the aperture photometryin the last two columns of Table 2.
2.2. HST /NICMOS ObservationsWe searched the HST archive for broadband NICMOS
observations of our sample of galaxies. In Table 1 columns
(4) and (5) we list the camera and Ðlter, and the observationdate, respectively. In columns (6) and (7) we indicate if varia-bility has been found, and the timescale from Quillen et al.(2000). The plate scales for cameras NIC1 and NIC2 are
pixel~1 and pixel~1, respectively.0A.045 0A.076The images were reduced with routines from the package
TABLE 3
MID-INFRARED ISO FLUXES
Galaxy j (km) Flux (mJy) Reference(1) (2) (3) (4)
NGC 1068 . . . . . . 5.9 8660 Rigopoulou et al. (1999)7.7 14500 Rigopoulou et al. (1999)
NGC 3227 . . . . . . 6.75 294, 249 Clavel et al. (2000)9.63 382, 372 Clavel et al. (2000)
16 1220 Pe� rez Garc•� a & Rodr•� guez Espinosa (2000)NGC 3281 . . . . . . 11.4 530 This workNGC 4151 . . . . . . 5.9 882 Rigopoulou et al. (1999)
7.7 1090 Rigopoulou et al. (1999)16 4120 Pe� rez Garc•� a & Rodr•� guez Espinosa (2000)
NGC 5252 . . . . . . 6.75 14.8 Quillen et al. (2001b)9.63 27.1 Quillen et al. (2001b)
11.4 34.6 Quillen et al. (2001b)15 44.8 Quillen et al. (2001b)
NGC 5506 . . . . . . 5.9 646 Rigopoulou et al. (1999)7.7 713 Rigopoulou et al. (1999)
11.4 890 This workNGC 5548 . . . . . . 6.75 170 Clavel et al. (2000)
9.63 270 Clavel et al. (2000)16 440 Pe� rez Garc•� a & Rodr•� guez Espinosa (2000)
NGC 7172 . . . . . . 6.75 160 This work15 240 This work
NGC 7469 . . . . . . 5.9 270 Rigopoulou et al. (1999)6.75 433 This work7.7 539 Rigopoulou et al. (1999)
15 1290 This workMrk 1 . . . . . . . . . . . 5.9 20.9 Rigopoulou et al. (1999)
7.7 88.3 Rigopoulou et al. (1999)Mrk 348 . . . . . . . . 6.75 65 This work
15 270 This workMrk 533 . . . . . . . . 6.75 259, 213 Clavel et al. (2000)
9.63 345 Clavel et al. (2000)IC 4329A . . . . . . . 6.75 591, 477 Clavel et al. (2000)
9.63 890, 739 Clavel et al. (2000)
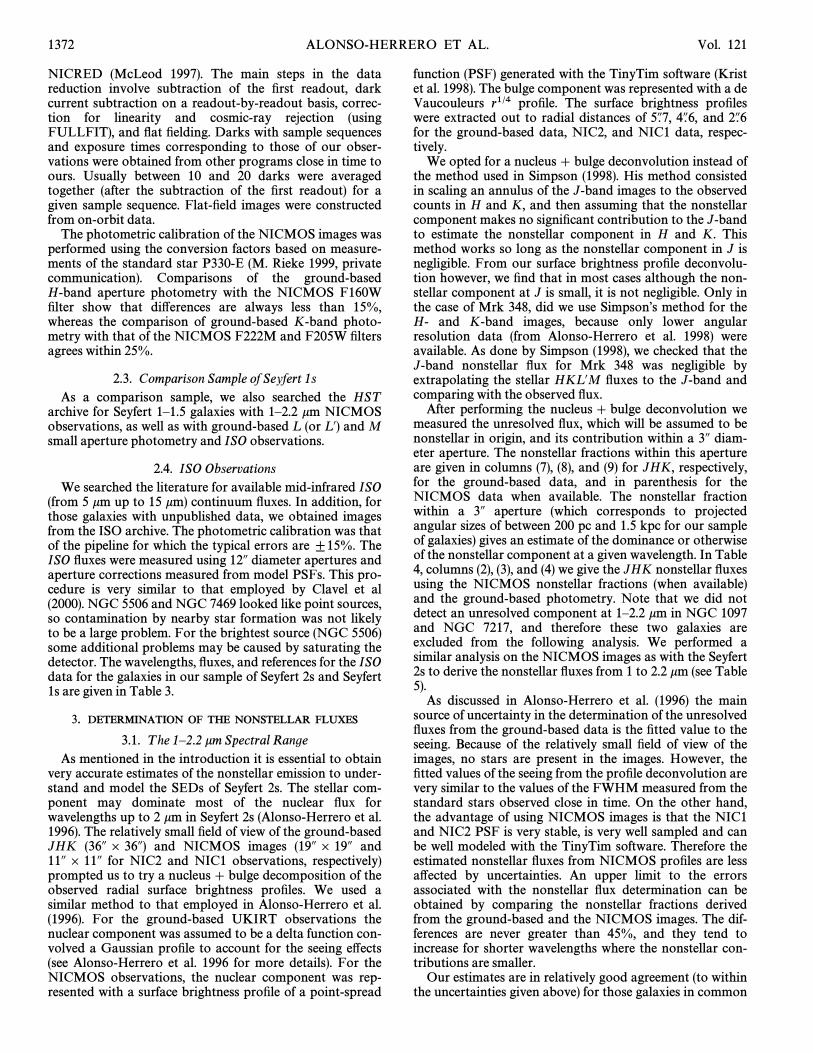
1372 ALONSO-HERRERO ET AL. Vol. 121
NICRED (McLeod 1997). The main steps in the datareduction involve subtraction of the Ðrst readout, darkcurrent subtraction on a readout-by-readout basis, correc-tion for linearity and cosmic-ray rejection (usingFULLFIT), and Ñat Ðelding. Darks with sample sequencesand exposure times corresponding to those of our obser-vations were obtained from other programs close in time toours. Usually between 10 and 20 darks were averagedtogether (after the subtraction of the Ðrst readout) for agiven sample sequence. Flat-Ðeld images were constructedfrom on-orbit data.
The photometric calibration of the NICMOS images wasperformed using the conversion factors based on measure-ments of the standard star P330-E (M. Rieke 1999, privatecommunication). Comparisons of the ground-basedH-band aperture photometry with the NICMOS F160WÐlter show that di†erences are always less than 15%,whereas the comparison of ground-based K-band photo-metry with that of the NICMOS F222M and F205W Ðltersagrees within 25%.
2.3. Comparison Sample of Seyfert 1sAs a comparison sample, we also searched the HST
archive for Seyfert 1È1.5 galaxies with 1È2.2 km NICMOSobservations, as well as with ground-based L (or L @) and Msmall aperture photometry and ISO observations.
2.4. ISO ObservationsWe searched the literature for available mid-infrared ISO
(from 5 km up to 15 km) continuum Ñuxes. In addition, forthose galaxies with unpublished data, we obtained imagesfrom the ISO archive. The photometric calibration was thatof the pipeline for which the typical errors are ^15%. TheISO Ñuxes were measured using 12A diameter apertures andaperture corrections measured from model PSFs. This pro-cedure is very similar to that employed by Clavel et al(2000). NGC 5506 and NGC 7469 looked like point sources,so contamination by nearby star formation was not likelyto be a large problem. For the brightest source (NGC 5506)some additional problems may be caused by saturating thedetector. The wavelengths, Ñuxes, and references for the ISOdata for the galaxies in our sample of Seyfert 2s and Seyfert1s are given in Table 3.
3. DETERMINATION OF THE NONSTELLAR FLUXES
3.1. T he 1È2.2 km Spectral RangeAs mentioned in the introduction it is essential to obtain
very accurate estimates of the nonstellar emission to under-stand and model the SEDs of Seyfert 2s. The stellar com-ponent may dominate most of the nuclear Ñux forwavelengths up to 2 km in Seyfert 2s (Alonso-Herrero et al.1996). The relatively small Ðeld of view of the ground-basedJHK (36A ] 36A) and NICMOS images (19A ] 19A and11A ] 11A for NIC2 and NIC1 observations, respectively)prompted us to try a nucleus ] bulge decomposition of theobserved radial surface brightness proÐles. We used asimilar method to that employed in Alonso-Herrero et al.(1996). For the ground-based UKIRT observations thenuclear component was assumed to be a delta function con-volved a Gaussian proÐle to account for the seeing e†ects(see Alonso-Herrero et al. 1996 for more details). For theNICMOS observations, the nuclear component was rep-resented with a surface brightness proÐle of a point-spread
function (PSF) generated with the TinyTim software (Kristet al. 1998). The bulge component was represented with a deVaucouleurs r1@4 proÐle. The surface brightness proÐleswere extracted out to radial distances of and5A.7, 4A.6, 2A.6for the ground-based data, NIC2, and NIC1 data, respec-tively.
We opted for a nucleus] bulge deconvolution instead ofthe method used in Simpson (1998). His method consistedin scaling an annulus of the J-band images to the observedcounts in H and K, and then assuming that the nonstellarcomponent makes no signiÐcant contribution to the J-bandto estimate the nonstellar component in H and K. Thismethod works so long as the nonstellar component in J isnegligible. From our surface brightness proÐle deconvolu-tion however, we Ðnd that in most cases although the non-stellar component at J is small, it is not negligible. Only inthe case of Mrk 348, did we use SimpsonÏs method for theH- and K-band images, because only lower angularresolution data (from Alonso-Herrero et al. 1998) wereavailable. As done by Simpson (1998), we checked that theJ-band nonstellar Ñux for Mrk 348 was negligible byextrapolating the stellar HKL @M Ñuxes to the J-band andcomparing with the observed Ñux.
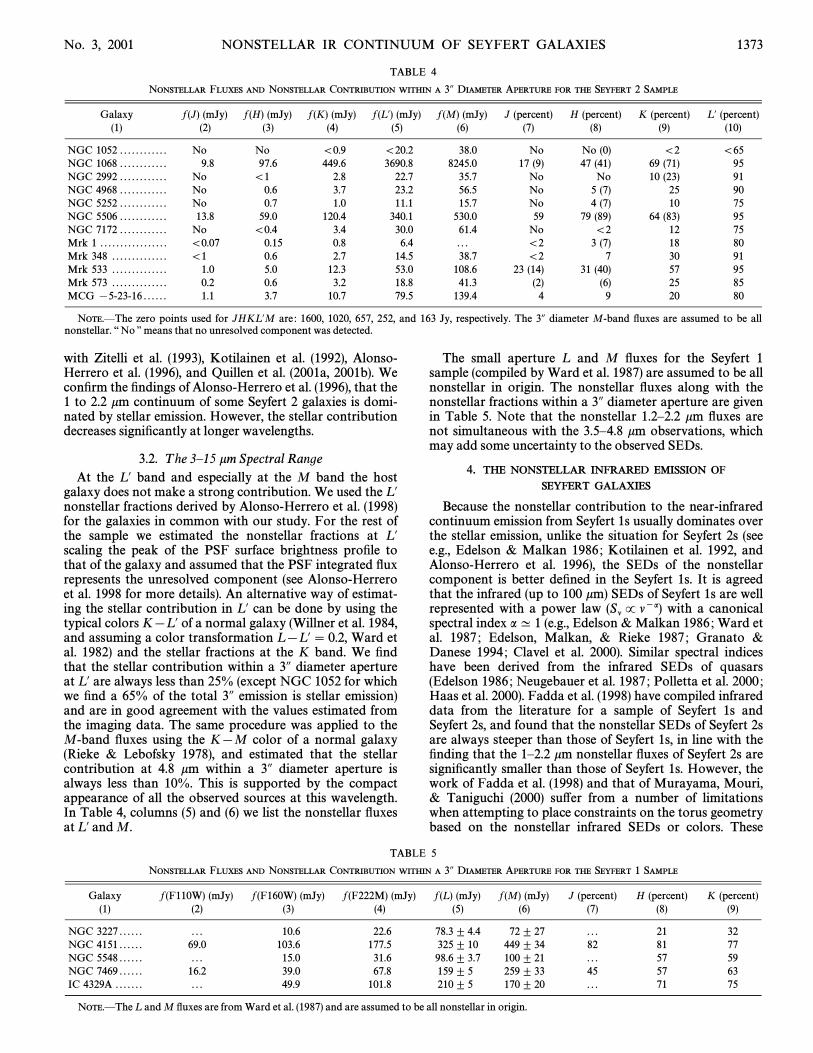
After performing the nucleus] bulge deconvolution wemeasured the unresolved Ñux, which will be assumed to benonstellar in origin, and its contribution within a 3A diam-eter aperture. The nonstellar fractions within this apertureare given in columns (7), (8), and (9) for JHK, respectively,for the ground-based data, and in parenthesis for theNICMOS data when available. The nonstellar fractionwithin a 3A aperture (which corresponds to projectedangular sizes of between 200 pc and 1.5 kpc for our sampleof galaxies) gives an estimate of the dominance or otherwiseof the nonstellar component at a given wavelength. In Table4, columns (2), (3), and (4) we give the JHK nonstellar Ñuxesusing the NICMOS nonstellar fractions (when available)and the ground-based photometry. Note that we did notdetect an unresolved component at 1È2.2 km in NGC 1097and NGC 7217, and therefore these two galaxies areexcluded from the following analysis. We performed asimilar analysis on the NICMOS images as with the Seyfert2s to derive the nonstellar Ñuxes from 1 to 2.2 km (see Table5).
As discussed in Alonso-Herrero et al. (1996) the mainsource of uncertainty in the determination of the unresolvedÑuxes from the ground-based data is the Ðtted value to theseeing. Because of the relatively small Ðeld of view of theimages, no stars are present in the images. However, theÐtted values of the seeing from the proÐle deconvolution arevery similar to the values of the FWHM measured from thestandard stars observed close in time. On the other hand,the advantage of using NICMOS images is that the NIC1and NIC2 PSF is very stable, is very well sampled and canbe well modeled with the TinyTim software. Therefore theestimated nonstellar Ñuxes from NICMOS proÐles are lessa†ected by uncertainties. An upper limit to the errorsassociated with the nonstellar Ñux determination can beobtained by comparing the nonstellar fractions derivedfrom the ground-based and the NICMOS images. The dif-ferences are never greater than 45%, and they tend toincrease for shorter wavelengths where the nonstellar con-tributions are smaller.
Our estimates are in relatively good agreement (to withinthe uncertainties given above) for those galaxies in common
No. 3, 2001 NONSTELLAR IR CONTINUUM OF SEYFERT GALAXIES 1373
TABLE 4
NONSTELLAR FLUXES AND NONSTELLAR CONTRIBUTION WITHIN A 3A DIAMETER APERTURE FOR THE SEYFERT 2 SAMPLE
Galaxy f (J) (mJy) f (H) (mJy) f (K) (mJy) f (L @) (mJy) f (M) (mJy) J (percent) H (percent) K (percent) L @ (percent)(1) (2) (3) (4) (5) (6) (7) (8) (9) (10)
NGC 1052 . . . . . . . . . . . . No No \0.9 \20.2 38.0 No No (0) \2 \65NGC 1068 . . . . . . . . . . . . 9.8 97.6 449.6 3690.8 8245.0 17 (9) 47 (41) 69 (71) 95NGC 2992 . . . . . . . . . . . . No \1 2.8 22.7 35.7 No No 10 (23) 91NGC 4968 . . . . . . . . . . . . No 0.6 3.7 23.2 56.5 No 5 (7) 25 90NGC 5252 . . . . . . . . . . . . No 0.7 1.0 11.1 15.7 No 4 (7) 10 75NGC 5506 . . . . . . . . . . . . 13.8 59.0 120.4 340.1 530.0 59 79 (89) 64 (83) 95NGC 7172 . . . . . . . . . . . . No \0.4 3.4 30.0 61.4 No \2 12 75Mrk 1 . . . . . . . . . . . . . . . . . \0.07 0.15 0.8 6.4 . . . \2 3 (7) 18 80Mrk 348 . . . . . . . . . . . . . . \1 0.6 2.7 14.5 38.7 \2 7 30 91Mrk 533 . . . . . . . . . . . . . . 1.0 5.0 12.3 53.0 108.6 23 (14) 31 (40) 57 95Mrk 573 . . . . . . . . . . . . . . 0.2 0.6 3.2 18.8 41.3 (2) (6) 25 85MCG [5-23-16 . . . . . . 1.1 3.7 10.7 79.5 139.4 4 9 20 80
NOTE.ÈThe zero points used for JHKL @M are : 1600, 1020, 657, 252, and 163 Jy, respectively. The 3A diameter M-band Ñuxes are assumed to be allnonstellar. ““ No ÏÏ means that no unresolved component was detected.
with Zitelli et al. (1993), Kotilainen et al. (1992), Alonso-Herrero et al. (1996), and Quillen et al. (2001a, 2001b). WeconÐrm the Ðndings of Alonso-Herrero et al. (1996), that the1 to 2.2 km continuum of some Seyfert 2 galaxies is domi-nated by stellar emission. However, the stellar contributiondecreases signiÐcantly at longer wavelengths.
3.2. T he 3È15 km Spectral RangeAt the L @ band and especially at the M band the host
galaxy does not make a strong contribution. We used the L @nonstellar fractions derived by Alonso-Herrero et al. (1998)for the galaxies in common with our study. For the rest ofthe sample we estimated the nonstellar fractions at L @scaling the peak of the PSF surface brightness proÐle tothat of the galaxy and assumed that the PSF integrated Ñuxrepresents the unresolved component (see Alonso-Herreroet al. 1998 for more details). An alternative way of estimat-ing the stellar contribution in L @ can be done by using thetypical colors K[L @ of a normal galaxy (Willner et al. 1984,and assuming a color transformation L [L @\ 0.2, Ward etal. 1982) and the stellar fractions at the K band. We Ðndthat the stellar contribution within a 3A diameter apertureat L @ are always less than 25% (except NGC 1052 for whichwe Ðnd a 65% of the total 3A emission is stellar emission)and are in good agreement with the values estimated fromthe imaging data. The same procedure was applied to theM-band Ñuxes using the K[M color of a normal galaxy(Rieke & Lebofsky 1978), and estimated that the stellarcontribution at 4.8 km within a 3A diameter aperture isalways less than 10%. This is supported by the compactappearance of all the observed sources at this wavelength.In Table 4, columns (5) and (6) we list the nonstellar Ñuxesat L @ and M.
The small aperture L and M Ñuxes for the Seyfert 1sample (compiled by Ward et al. 1987) are assumed to be allnonstellar in origin. The nonstellar Ñuxes along with thenonstellar fractions within a 3A diameter aperture are givenin Table 5. Note that the nonstellar 1.2È2.2 km Ñuxes arenot simultaneous with the 3.5È4.8 km observations, whichmay add some uncertainty to the observed SEDs.
4. THE NONSTELLAR INFRARED EMISSION OF
SEYFERT GALAXIES
Because the nonstellar contribution to the near-infraredcontinuum emission from Seyfert 1s usually dominates overthe stellar emission, unlike the situation for Seyfert 2s (seee.g., Edelson & Malkan 1986 ; Kotilainen et al. 1992, andAlonso-Herrero et al. 1996), the SEDs of the nonstellarcomponent is better deÐned in the Seyfert 1s. It is agreedthat the infrared (up to 100 km) SEDs of Seyfert 1s are wellrepresented with a power law with a canonical(Sl P l~a)spectral index a ^ 1 (e.g., Edelson & Malkan 1986 ; Ward etal. 1987 ; Edelson, Malkan, & Rieke 1987 ; Granato &Danese 1994 ; Clavel et al. 2000). Similar spectral indiceshave been derived from the infrared SEDs of quasars(Edelson 1986 ; Neugebauer et al. 1987 ; Polletta et al. 2000 ;Haas et al. 2000). Fadda et al. (1998) have compiled infrareddata from the literature for a sample of Seyfert 1s andSeyfert 2s, and found that the nonstellar SEDs of Seyfert 2sare always steeper than those of Seyfert 1s, in line with theÐnding that the 1È2.2 km nonstellar Ñuxes of Seyfert 2s aresigniÐcantly smaller than those of Seyfert 1s. However, thework of Fadda et al. (1998) and that of Murayama, Mouri,& Taniguchi (2000) su†er from a number of limitationswhen attempting to place constraints on the torus geometrybased on the nonstellar infrared SEDs or colors. These
TABLE 5
NONSTELLAR FLUXES AND NONSTELLAR CONTRIBUTION WITHIN A 3A DIAMETER APERTURE FOR THE SEYFERT 1 SAMPLE
Galaxy f (F110W) (mJy) f (F160W) (mJy) f (F222M) (mJy) f (L ) (mJy) f (M) (mJy) J (percent) H (percent) K (percent)(1) (2) (3) (4) (5) (6) (7) (8) (9)
NGC 3227 . . . . . . . . . 10.6 22.6 78.3 ^ 4.4 72 ^ 27 . . . 21 32NGC 4151 . . . . . . 69.0 103.6 177.5 325 ^ 10 449 ^ 34 82 81 77NGC 5548 . . . . . . . . . 15.0 31.6 98.6 ^ 3.7 100 ^ 21 . . . 57 59NGC 7469 . . . . . . 16.2 39.0 67.8 159 ^ 5 259 ^ 33 45 57 63IC 4329A . . . . . . . . . . 49.9 101.8 210 ^ 5 170 ^ 20 . . . 71 75
NOTE.ÈThe L and M Ñuxes are from Ward et al. (1987) and are assumed to be all nonstellar in origin.

1374 ALONSO-HERRERO ET AL. Vol. 121
works make use of nonsimultaneous observations, obser-vations from di†erent sources, uncertain nonstellar Ñuxes,and relatively large aperture N- and Q-band or IRAS Ñuxes,which may be contaminated by other contributions. More-over, in order to understand the nature of the nonstellarSEDs of Seyfert 2 galaxies and in turn to constrain the torusgeometry and derive the infrared extinctions to the centralregions and their relation with the hard X-ray absorptioncolumns, one cannot average the nonstellar SEDs of Seyfert2s (or Seyfert 1s).
An additional problem often present in past statisticalstudies of SEDs is the grouping of galaxies into the Seyfert 1and Seyfert 2 categories. A galaxy may be classiÐed as aSeyfert 2 when it is observed in the optical (that is, no broadlines), but it may still show broad lines in the infrared, wherethe extinction is greatly reduced (see, for instance, Ruiz,Rieke, & Schmidt 1994 ; Goodrich, Veilleux, & Hill 1994 ;Veilleux, Goodrich, & Hill 1997). If using the latter obser-vations, one would classify it as a Seyfert 1.8 or Seyfert 1.9.A better approach to the understanding of the infrared SEDof Seyfert galaxies is to study each galaxy separately anddetermine whether a single torus geometry is able to Ðtmost of the galaxies. Although in our study we do not claima complete or unbiased sample of Seyfert 1s and 2s, becausewe have estimated accurate nonstellar SEDs we cancompare these with current torus models and see whetherthere is a general agreement across the range of propertiespresent in this sample. We will make use of Efstathiou &Rowan-Robinson (1995) models and discuss other modelsavailable in the literature. In addition to the galaxies pre-sented in this work, we will Ðt the nonstellar infrared SEDof NGC 3281 (nonstellar Ñuxes from Simpson 1998).
4.1. T he Efstathiou & Rowan-Robinson (1995) ModelsFor our analysis we consider the tapered disk model of
Efstathiou & Rowan-Robinson (1995). In this geometry, theheight of the disk increases with the radial distance, but ittapers o† to a constant height in the outer part. We will usea simple torus model (coneless) and a composite model witha torus and an optically thin cone. The latter model gave abetter Ðt to the near-infrared emission in NGC 1068(Efstathiou et al. 1995). The reasons for adding the opticallythin component rather than using a simple torus model toÐt the SED of NGC 1068 were twofold. First, this addi-tional optically thin cone component increases the contin-uum around 3È5 km, a condition necessary to Ðt the almostÑat (in observed SEDs of Seyfert 1s (see also below).lfl )This problem seems to a†ect all the current torus models(e.g., Pier & Krolik 1993 ; Granato & Danese 1994 ; and themodel used here). Second, the simple torus model predictsstrong absorption features at 9.7 km for Seyfert 2s, whichare not usually observed (Roche et al. 1991). See also thediscussion in Efstathiou et al. (1995).
The model assumes a maximum dust temperature (dustsublimation temperature) of T \ 900 K and the followingparameters : (ratio of the inner and outer radii),r1/r2\ 0.01
(ratio of the height scale and the outer radius)h/r2\ 0.1and equatorial UV optical depth of with a half-qUV \ 1200,opening angle of the toroidal cone of We will alsohc \ 30¡.explore for comparison purposes another coneless modelwith a dust sublimation temperature of T \ 1500 K.
A beaming factor was introduced by Efstathiou et al.(1995), basically to boost the near-infrared Ñux, as the inclu-sion of conical dust by itself did not provide sufficient emis-
TABLE 6
VIEWING ANGLES, UV OPTICAL DEPTHS,AND EQUIVALENT VISUAL EXTINCTIONS
FOR THE MODELS
hv
qUV AV
(deg) (mag) (mag)
90 . . . . . . . . . . . . . . . 1200 22184 . . . . . . . . . . . . . . . 1197 22179 . . . . . . . . . . . . . . . 1018 18873 . . . . . . . . . . . . . . . 914 16964 . . . . . . . . . . . . . . . 812 15050 . . . . . . . . . . . . . . . 700 12944 . . . . . . . . . . . . . . . 658 12140 . . . . . . . . . . . . . . . 620 11436 . . . . . . . . . . . . . . . 558 10330 . . . . . . . . . . . . . . . 263 4930 . . . . . . . . . . . . . . . 50 (24) 9 (4)25 . . . . . . . . . . . . . . . 2.5 (0) 0.5 (0)20 . . . . . . . . . . . . . . . 2.5 (0) 0.5 (0)10 . . . . . . . . . . . . . . . 2.5 (0) 0.5 (0)0 . . . . . . . . . . . . . . . . 2.5 (0) 0.5 (0)
NOTE.ÈIn cols. (2) and (3) in parenth-eses are the values for the T \ 1500 Kmodel.
sion in this spectral range. The beaming factor is deÐned asthe ratio of the radiation intensity emitted by the contin-uum source toward the optically thin cone with respect tothat directed toward the torus,
fb\ Sl(h \ hc)
Sl(h º hc), (1)
where is the semi-opening angle of the torus, and h is thehcangle measured from the pole. The beaming factor for thismodel ( f
b\ 6).
The viewing angles with polar view, andhv\ 0¡ h
v\ 90¡
equatorial view (note that in Efstathiou & Rowan-Robinson 1995 models the authors measure the angles fromthe equator), UV optical depth, and corresponding visualextinctions of the coneless and cone torus model outputsare given in Table 6.
4.2. SED FittingThe Ðrst step was to scale the outputs from the model to
the observed SEDs in The SED Ðtting was performedlfl .by minimizing the s2 function of the models and the obser-vations for the varying viewing angles to the AGN andnormalizations at di†erent wavelengths, taking intoaccount the errors due to the determination of the non-stellar Ñuxes and the photometric uncertainties. Note thatwe have not attempted to Ðt NGC 2992 or NGC 4968because there are only four points for their SEDs. In Table 7we list the best-Ðtting models (at 1 p level conÐdence) for theSEDs, where n is the number of points in the SED, s2/l is s2per degree of freedom, is the best-Ðtting viewing angle (orh
vrange of angles), and the corresponding models.In Figures 1È15 we present the observed SEDs in(log lf lunits of ergs per square centimeter per second) for the
sample of Seyferts along with the best-Ðtting model scaledto the observed SED. The model outputs are plotted for theviewing angles given in Table 6 is the top line, and(h
v\ 0¡
increases to the bottom). The abrupt transition seen inhvthe model output at viewing angle is due to theh
v\ 30¡

No. 3, 2001 NONSTELLAR IR CONTINUUM OF SEYFERT GALAXIES 1375
TABLE 7
INFRARED NONSTELLAR SED MODELING
Galaxy n s2/l hv(deg) Model
NGC 1068 . . . . . . . . . . . . 7 1.0È1.6 40 Cone, T \ 900 K, and no cone, T \ 1500 KNGC 3227 . . . . . . . . . . . . 7 1.0 30 No cone, T \ 900 KNGC 3281 . . . . . . . . . . . . 6 1.8È2.2 40 Cone and no cone, T \ 900 KNGC 4151 . . . . . . . . . . . . 8 0.8 10 Cone, T \ 900 KNGC 5252 . . . . . . . . . . . . 8 1.6 30 Cone, T \ 900 KNGC 5506 . . . . . . . . . . . . 7 1.3 30 No cone, T \ 1500 KNGC 5548 . . . . . . . . . . . . 7 0.9È1.0 10È30 Cone, T \ 900 K, and no cone, T \ 1500 KNGC 7172 . . . . . . . . . . . . 6 0.7È1.6 40 Cone, T \ 900 K, and no cone, T \ 1500 KNGC 7469 . . . . . . . . . . . . 9 1.1 0È30 Cone, T \ 900 K, and no cone, T \ 1500 KMrk 1 . . . . . . . . . . . . . . . . . 6 1.2 40È64 Cone and no cone, T \ 900 KMrk 348 . . . . . . . . . . . . . . 7 0.4È1.0 36È44 AllMrk 533 . . . . . . . . . . . . . . 7 1.5 30È36 Cone and no cone, T \ 900 KMrk 573 . . . . . . . . . . . . . . 6 0.4È0.8 36È50 Cone and no cone, T \ 900 KMCG [5-23-16 . . . . . . 5 0.7È0.8 30È36 Cone and no cone, T \ 900 KIC 4329A . . . . . . . . . . . . . 6 1.4 10 Cone, T \ 900 K
NOTE.Ès2/l is s2 per degree of freedom, where l\ n[2 and n is number of points for the SED.
assumed beaming factor. Using a beaming factor varyingsmoothly with h would avoid the abrupt transition betweenthose viewing angles.
As can be seen from Table 7 and Figures 1È15, the conemodel provides good Ðts to the observed SEDs except in thecases of some intermediate SEDs (the SEDs of NGC 3227and NGC 5506). The reason why the cone model fails toreproduce these intermediate SEDs is because of the abrupttransition produced for the assumed form of the beamingfactor. If the beaming factor is decreased, then the conemodel produces an acceptable Ðt to the SEDs of these gal-axies, which is statistically indistinguishable from the cone-less model. In some cases we Ðnd from our SED Ðtting thatboth the cone and coneless models produce indistinguish-able Ðts at the 1 p conÐdence level.
Despite the fact that we do not Ðnd compelling evidenceto favor either the coneless or the cone model alone, we Ðndthat the viewing angle to the central source is very wellconstrained by the modeling of the SEDs. We Ðnd that noneof the galaxies (not even the hard X-ray Compton-thickgalaxies) in our sample show viewing angles greater than64¡, with most of the obscured Seyferts displaying values ofbetween 30¡ and 40¡. This does not mean that there are noSeyfert galaxies with First, the values for the Ðttedh
v[ 65¡.
viewing angles will depend on the assumed geometry for thetorus model (mainly, the equatorial optical depth and thebeaming factor). Second, the shapes of the SEDs for viewingangles above 65¡ become almost parallel, with the addedcomplication that the Ðtted viewing angle is very sensitivenear-infrared nonstellar estimates. Finally, we stress thatour sample is not complete or unbiased in the sense that weare most likely not including very obscured objects.
All the Seyfert 1s (see also Granato et al. 1997) exceptNGC 3227 show relatively Ñat SEDs implying viewingangles in the range a face-on view. Theh
v\ 0¡È30¡Èalmost
coneless torus model does not account for the bright 1È5km emission present in NGC 4151 and IC 4329A. Othermodels also invoke additional near-infrared components inorder to explain the SED of NGC 1068. Granato et al.(1997) assumed a model similar to the ““ anisotropicspheres ÏÏ of Efstathiou & Rowan-Robinson (1995), whereasPier & Krolik (1993) used a hot component made up ofclouds inside the inner radius of the torus.
As expected, the Seyfert 2 galaxies show SEDs with di†er-ent shapes well explained with the varying viewing angle tothe central source. For example, NGC 5252 and NGC 5506(both classiÐed as Seyfert 1.9) appear to be seen at a viewingangle similar to that NGC 3227 (classiÐed as a Seyfert 1.5).For the particular model assumed here it would be h
v\
30¡. The similarity between the SEDs of NGC 5506, NGC5252, and NGC 3227 is also supported by the detection inNGC 5506 and NGC 5252 of a broad line component in theinfrared hydrogen recombination line Pab (Rix et al. 1990 ;Blanco, Ward, & Wright 1990 ; and Ruiz et al. 1994,respectively). Veilleux et al. (1997), however, argued againstthe presence of such broad component in NGC 5506. Bothgalaxies also show relatively low hydrogen column densitiesderived from hard X-ray observations and(NH \ 4.33.4] 1022 cm ~2 for NGC 5252 and NGC 5506, respec-tively, Bassani et al. 1999 ; equivalent to an optical extinc-tion of and 17 mag for the standard gas-to-dustA
V^ 22
conversion factor). NGC 5506, NGC 5252, and NGC 3227appear as good examples of why averaging properties oftype 1 and type 2 objects may result in a loss of information.
The rest of the Seyfert 2s are viewed at angles hvº 30¡
(NGC 1068, NGC 3281, NGC 7172, Mrk 348, Mrk 533, andMCG [5-23-16). Of these galaxies Mrk 348, Mrk 533, andMCG [5-23-16 show broad components in infraredhydrogen recombination lines (Ruiz et al. 1994 for the Ðrsttwo and Veilleux et al. 1997 for MCG [5-23-16). Notehowever, that Veilleux et al. (1997) disputed the Ðnding ofbroad lines in Mrk 533. The optical extinctions derivedfrom hard X-ray observations (taken from Bassani et al.1999) vary from moderate (MCG [5-23-16, mag),A
V^ 8
intermediate (NGC 7172 mag and NGC 3281AV
^ 60mag) to Compton-thick galaxies (NGC 1068 andA
V^ 400
Mrk 533). The most obscured SEDs in terms of the Ðttedviewing angles are Mrk 1 and Mrk 573. Neither galaxyshows broad infrared hydrogen recombination lines(Veilleux et al. 1997).
We Ðnd a tendency for the galaxies in our sample to havelower Ðtted extinctions from the SED modeling than thosederived from hard X-ray hydrogen column densities forthose galaxies with relatively high values of The partic-NH.ular values of the extinctions derived from Ðtting the SEDsdepend on the assumed equatorial UV optical depth. As

1376 ALONSO-HERRERO ET AL. Vol. 121
FIG. 1.ÈObserved SED and best-Ðtting model (T \ 1500 K, no cone)for NGC 1068. The viewing angles for the model outputs increase from(h
v)
top to bottom.
FIG. 3.ÈSame as Fig. 1, but for NGC 3281, model T \ 900 K, no cone
discussed in Efstathiou & Rowan-Robinson (1995) in orderto reproduce the high extinction needed for Compton thickobjects, it would be necessary to increase the value of upqUVto 4000 mag. This would cause the models to produce avery deep 10 km absorption feature. The main difficulty intori with optical depths of the order of a few thousands,however, is that the SEDs become too narrow as the tem-perature drops more steeply with radius. This is evident in
FIG. 2.ÈSame as Fig. 1, but for NGC 3227, model T \ 900 K, no cone
FIG. 4.ÈSame as Fig. 1, but for NGC 4151, model T \ 900 K, cone
the models of Pier & Krolik (1993), and it is basically thereason why the ““ optically thin dust ÏÏ in their model forNGC 1068 is cooler than ours. But even if we were toassume a much higher equatorial optical depth, the infraredSEDs of two Compton thick galaxies in our sample (NGC1068 and Mrk 533) are well reproduced with relativelymodest extinctions that could not possibly be as elevated asthose inferred from hard X-ray column densities. The rela-

No. 3, 2001 NONSTELLAR IR CONTINUUM OF SEYFERT GALAXIES 1377
FIG. 5.ÈSame as Fig. 1, but for NGC 5252, model T \ 900 K, cone
FIG. 7.ÈSame as Fig. 1, but for NGC 5548, model T \ 900 K, cone
tively low values of the extinction needed for NGC 1068were already noted in previous works (e.g., Efstathiou et al.1995 ; Granato et al. 1997). We interpret the di†ering hardX-ray and infrared extinctions in the context of thetorus ] cone model. Most of the near-infrared emissionseems to originate in the extended cone conÐguration whichsu†ers less extinction than radiation emitted much closer tothe active galactic nucleus (e.g., the hard X-rays).
FIG. 6.ÈSame as Fig. 1, but for NGC 5506, model T \ 1500 K, nocone.
FIG. 8.ÈSame as Fig. 1, but for NGC 7172, model T \ 900 K, cone
4.3. Nonstellar Color- Color DiagramsA number of works have attempted to use near-infrared
to mid-infrared colors or Ñux ratios to constrain the obscur-ing torus geometry, to derive viewing angles to the torus, orto simply quantify the di†erent observed properties betweentype 1 and type 2 Seyferts. For instance, Pier & Krolik(1993) used the L [N colors for Seyfert galaxies to con-strain the ratio a/h (that is, the ratio of the inner radius of

1378 ALONSO-HERRERO ET AL. Vol. 121
FIG. 9a FIG. 9b
FIG. 9.ÈSame as Fig. 1, but for NGC 7469. (a) model T \ 900 K, cone. (b) Model T \ 1500 K, no cone.
FIG. 10.ÈSame as Fig. 1, but for Mrk 1, model T \ 900 K, no cone
the torus to its thickness and therefore the opening angleof the torus), but failed to reproduce the L [N colors ofSeyfert 2s, as well as the Ñat SEDs of Seyfert 1s and PGquasars. Murayama et al. (2000) have used Pier & Krolik(1993) models and the ratio of the L (3.5 km) and IRAS 25km Ñuxes to derive torus properties such as the openingangle and the critical viewing angle for which the broad-lineregion (BLR) is visible. Fadda et al. (1998) compared theaverage of number of near-infrared and mid-infrared colors
FIG. 11.ÈSame as Fig. 1, but for Mrk 348, model T \ 900 K, cone
for Seyfert 1s and 2s with predictions of a wide series ofmodels. These studies, as mentioned above, may su†er fromunquantiÐed large aperture e†ects in the mid-infraredwhere the underlying galaxy and/or star formation maymake a signiÐcant contribution.
We explore nonstellar color-color diagrams involvingobservations with j \ 5 km for which we are certain aboutthe nonstellar contribution. Because of the large aperturesemployed by the ISO instruments, there may be a signiÐ-
No. 3, 2001 NONSTELLAR IR CONTINUUM OF SEYFERT GALAXIES 1379
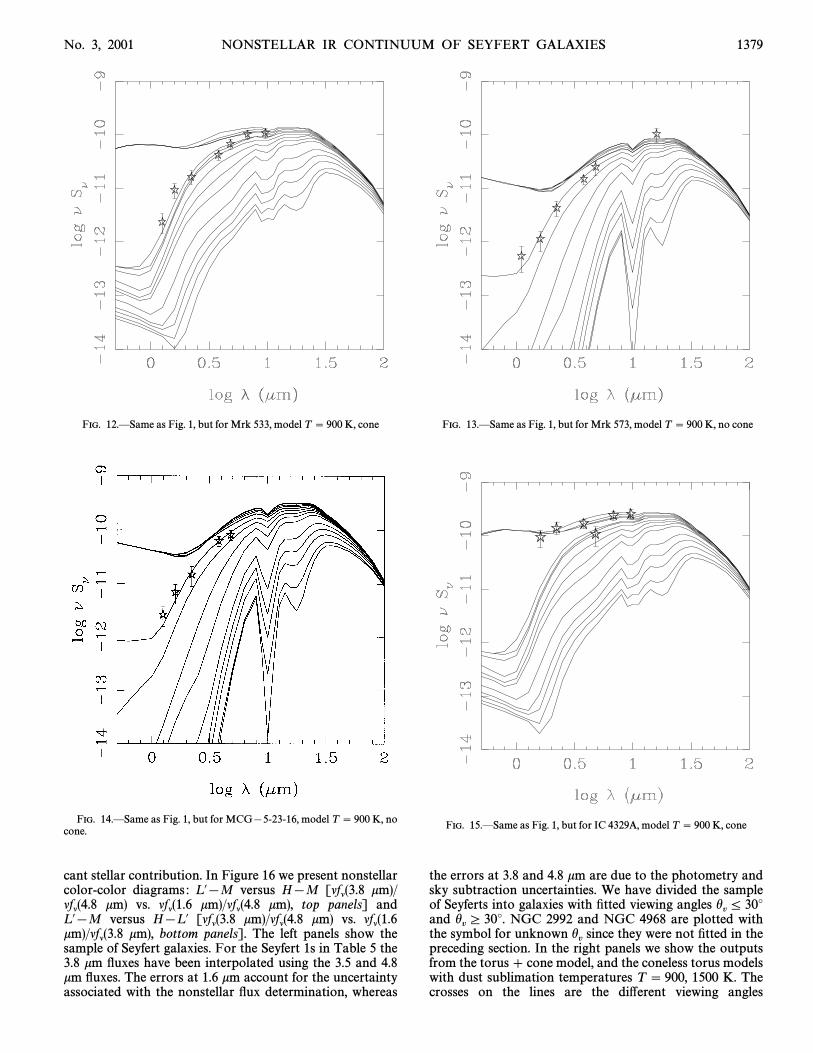
FIG. 12.ÈSame as Fig. 1, but for Mrk 533, model T \ 900 K, cone
FIG. 14.ÈSame as Fig. 1, but for MCG[5-23-16, model T \ 900 K, nocone.
cant stellar contribution. In Figure 16 we present nonstellarcolor-color diagrams : L @[M versus H[M km)/[lfl(3.8
km) vs. km), top panels] andlfl(4.8 lfl(1.6 km)/lfl(4.8L @[M versus H[L @ km) vs.[lfl(3.8 km)/lfl(4.8 lfl(1.6
km), bottom panels]. The left panels show thekm)/lfl(3.8sample of Seyfert galaxies. For the Seyfert 1s in Table 5 the3.8 km Ñuxes have been interpolated using the 3.5 and 4.8km Ñuxes. The errors at 1.6 km account for the uncertaintyassociated with the nonstellar Ñux determination, whereas
FIG. 13.ÈSame as Fig. 1, but for Mrk 573, model T \ 900 K, no cone
FIG. 15.ÈSame as Fig. 1, but for IC 4329A, model T \ 900 K, cone
the errors at 3.8 and 4.8 km are due to the photometry andsky subtraction uncertainties. We have divided the sampleof Seyferts into galaxies with Ðtted viewing angles h
v¹ 30¡
and NGC 2992 and NGC 4968 are plotted withhvº 30¡.
the symbol for unknown since they were not Ðtted in thehvpreceding section. In the right panels we show the outputs
from the torus ] cone model, and the coneless torus modelswith dust sublimation temperatures T \ 900, 1500 K. Thecrosses on the lines are the di†erent viewing angles
1380 ALONSO-HERRERO ET AL. Vol. 121
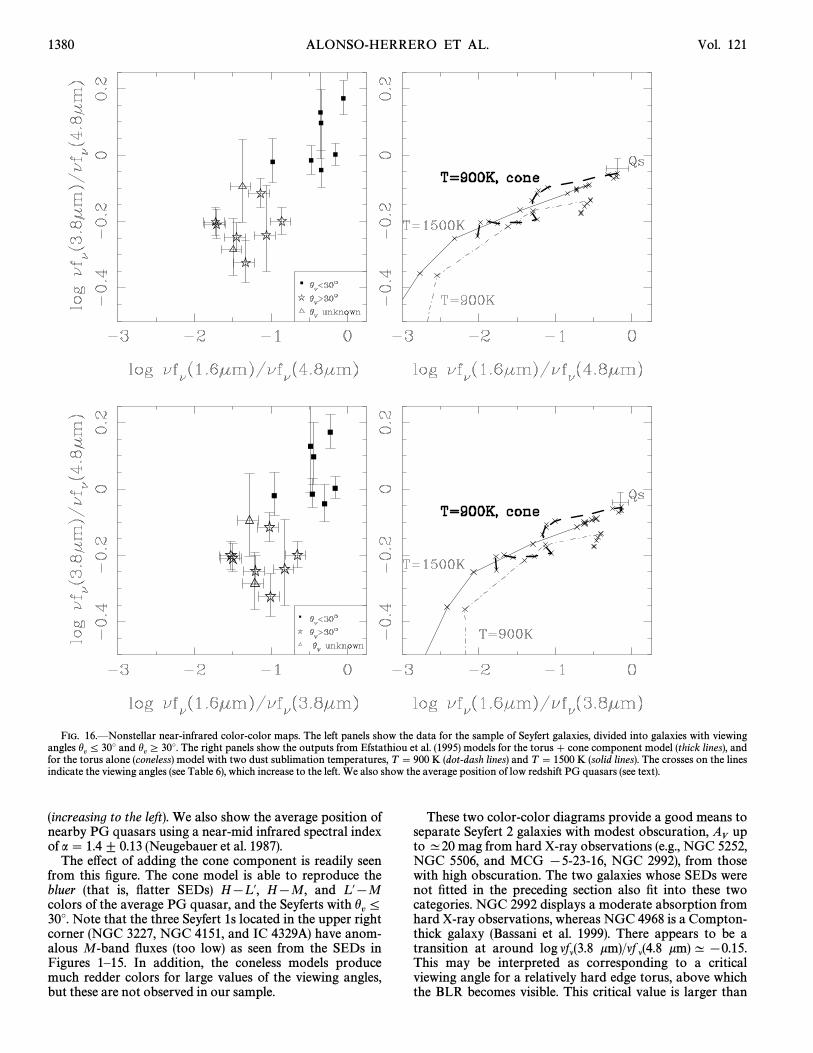
FIG. 16.ÈNonstellar near-infrared color-color maps. The left panels show the data for the sample of Seyfert galaxies, divided into galaxies with viewingangles and The right panels show the outputs from Efstathiou et al. (1995) models for the torus ] cone component model (thick lines), andh
v¹ 30¡ h
vº 30¡.
for the torus alone (coneless) model with two dust sublimation temperatures, T \ 900 K (dot-dash lines) and T \ 1500 K (solid lines). The crosses on the linesindicate the viewing angles (see Table 6), which increase to the left. We also show the average position of low redshift PG quasars (see text).
(increasing to the left). We also show the average position ofnearby PG quasars using a near-mid infrared spectral indexof a \ 1.4^ 0.13 (Neugebauer et al. 1987).
The e†ect of adding the cone component is readily seenfrom this Ðgure. The cone model is able to reproduce thebluer (that is, Ñatter SEDs) H[L @, H[M, and L @[Mcolors of the average PG quasar, and the Seyferts with h
v¹
30¡. Note that the three Seyfert 1s located in the upper rightcorner (NGC 3227, NGC 4151, and IC 4329A) have anom-alous M-band Ñuxes (too low) as seen from the SEDs inFigures 1È15. In addition, the coneless models producemuch redder colors for large values of the viewing angles,but these are not observed in our sample.
These two color-color diagrams provide a good means toseparate Seyfert 2 galaxies with modest obscuration, upA
Vto ^20 mag from hard X-ray observations (e.g., NGC 5252,NGC 5506, and MCG [5-23-16, NGC 2992), from thosewith high obscuration. The two galaxies whose SEDs werenot Ðtted in the preceding section also Ðt into these twocategories. NGC 2992 displays a moderate absorption fromhard X-ray observations, whereas NGC 4968 is a Compton-thick galaxy (Bassani et al. 1999). There appears to be atransition at around km)^ [0.15.log lfl(3.8 km)/lf l(4.8This may be interpreted as corresponding to a criticalviewing angle for a relatively hard edge torus, above whichthe BLR becomes visible. This critical value is larger than
No. 3, 2001 NONSTELLAR IR CONTINUUM OF SEYFERT GALAXIES 1381
the opening angle. The separation between the two classes isnot so well deÐned if the km) [orlog lfl(1.6 km)/lf l(4.8
km)] Ñux ratio is used instead, prob-log lfl(1.6 km)/lf l(3.8ably due to other e†ects such as foreground extinction stilla†ecting the 1.6 km Ñuxes (see Quillen et al. 2001b for adetailed discussion on this issue).
5. MID-INFRARED EMISSION OF AGN, AN INDICATOR OF
THE AGN LUMINOSITY?
5.1. T he Mid-Infrared versus Hard X-Ray CorrelationsAs mentioned in the introduction all torus models predict
strong emission at mid-infrared wavelengths. Based on ISOobservations of quasars it has been found that there is agood correlation between the infrared (3È40 km) lumi-nosities and other properties (blue luminosity, soft X-rayluminosities) and this is indicative that an important frac-tion of the mid-infrared energy is produced by dust heatedby the AGN (Polletta et al. 2000 ; Haas et al. 2000). To test ifthis is the case for both Seyfert 1s and Seyfert 2s, it is neces-sary to have a good indicator of the AGN luminosity towhich we can ratio the mid-infrared emission.
The hard X-ray (2È10 keV) emission of Seyfert galaxies isknown to be a good indicator of the intrinsic luminosity ofthe AGN for those cases where it is transmitted through thetorus, that is, in Compton thin galaxies. Other proposedindicators of the AGN power of both Seyfert 1s and Seyfert2s include the [O III] j5007 luminosity (Mulchaey et al.1994 ; Heckman 1995) or the nonthermal 1.45 GHz radiocontinuum (Heckman 1995). The [O III] luminosities maybe a†ected by extinction, distribution of the gas in theparent galaxy, and star formation. Heckman (1995) foundthat the 10.6 km emission of Seyfert 2s when ratioed to thenonthermal 1.4 GHz emission is 4 times smaller than that ofSeyfert 1s, and this would suggest that even the mid-infrared emission of Seyfert 2s is anisotropic. However,caution is needed when interpreting HeckmanÏs result ; the
radio emission of Seyfert galaxies may not be an isotropicproperty because of Doppler boosting of the core emissionin Seyfert 1s. Because of the uncertainties associated withthe use of the radio and [O III] luminosities as indicators ofthe AGN power, we will test the above assumption usinghard X-ray measurements.
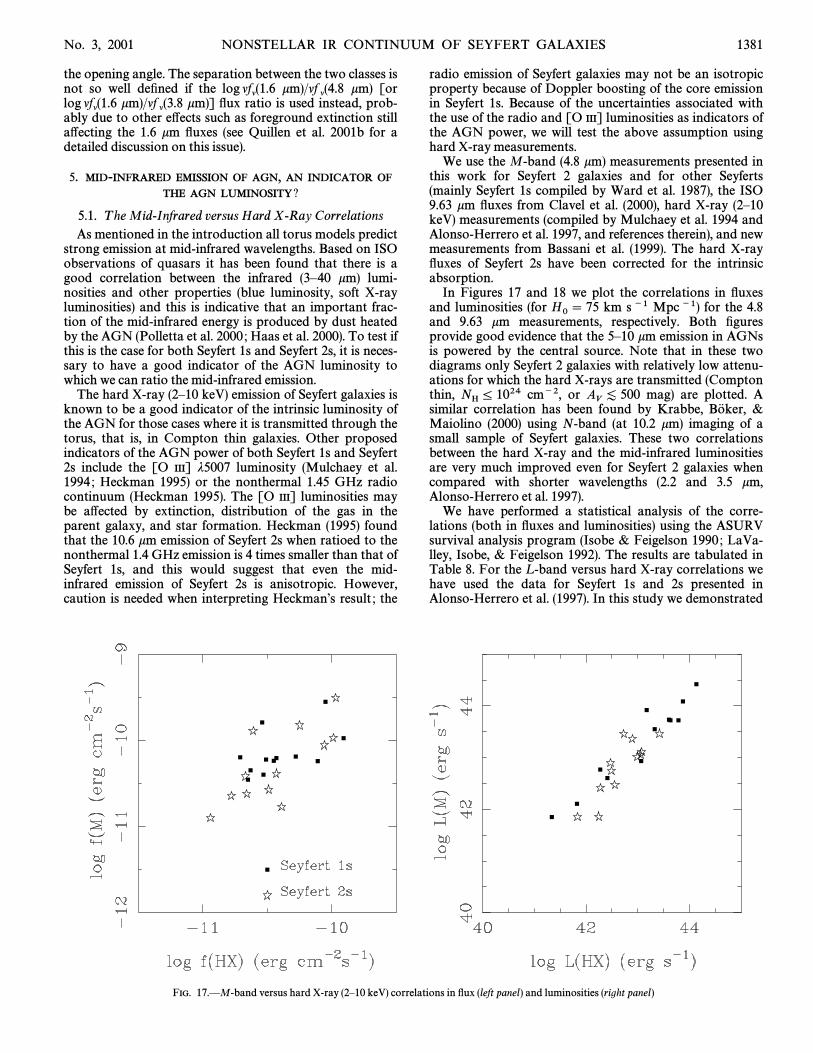
We use the M-band (4.8 km) measurements presented inthis work for Seyfert 2 galaxies and for other Seyferts(mainly Seyfert 1s compiled by Ward et al. 1987), the ISO9.63 km Ñuxes from Clavel et al. (2000), hard X-ray (2È10keV) measurements (compiled by Mulchaey et al. 1994 andAlonso-Herrero et al. 1997, and references therein), and newmeasurements from Bassani et al. (1999). The hard X-rayÑuxes of Seyfert 2s have been corrected for the intrinsicabsorption.
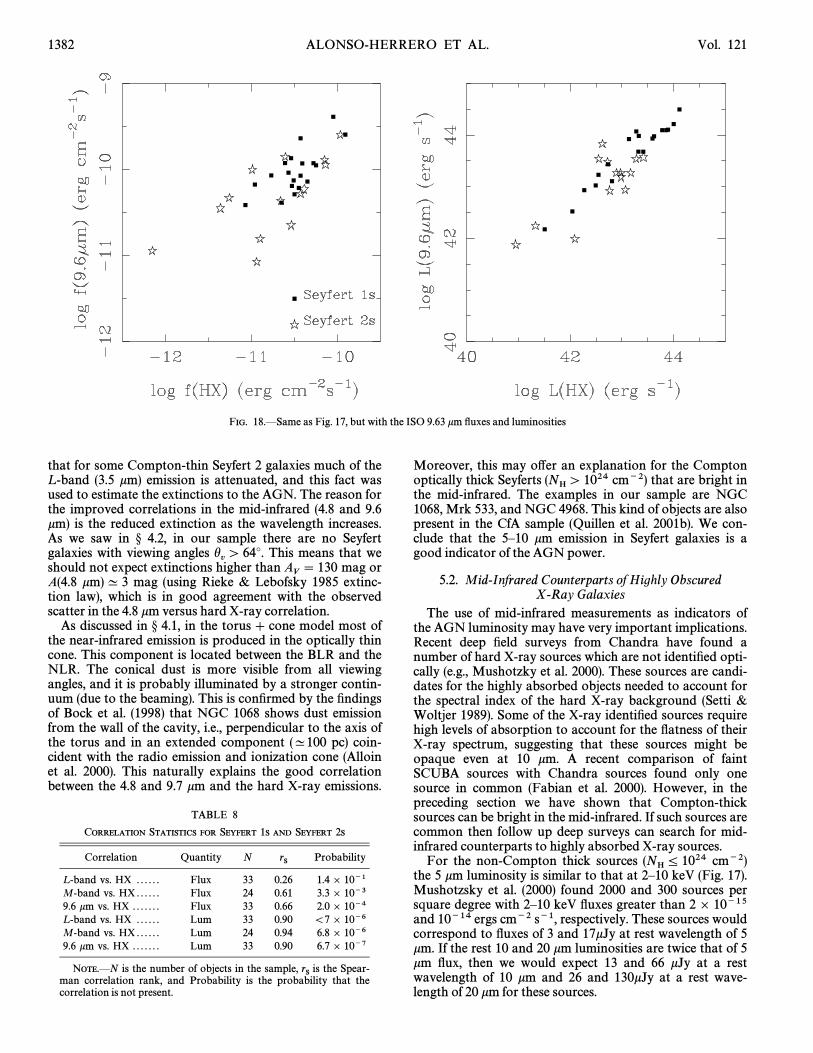
In Figures 17 and 18 we plot the correlations in Ñuxesand luminosities (for km s~1 Mpc~1) for the 4.8H0\ 75and 9.63 km measurements, respectively. Both Ðguresprovide good evidence that the 5È10 km emission in AGNsis powered by the central source. Note that in these twodiagrams only Seyfert 2 galaxies with relatively low attenu-ations for which the hard X-rays are transmitted (Comptonthin, cm~2, or mag) are plotted. ANH ¹ 1024 A
V[ 500
similar correlation has been found by Krabbe, &Bo� ker,Maiolino (2000) using N-band (at 10.2 km) imaging of asmall sample of Seyfert galaxies. These two correlationsbetween the hard X-ray and the mid-infrared luminositiesare very much improved even for Seyfert 2 galaxies whencompared with shorter wavelengths (2.2 and 3.5 km,Alonso-Herrero et al. 1997).
We have performed a statistical analysis of the corre-lations (both in Ñuxes and luminosities) using the ASURVsurvival analysis program (Isobe & Feigelson 1990 ; LaVa-lley, Isobe, & Feigelson 1992). The results are tabulated inTable 8. For the L -band versus hard X-ray correlations wehave used the data for Seyfert 1s and 2s presented inAlonso-Herrero et al. (1997). In this study we demonstrated
FIG. 17.ÈM-band versus hard X-ray (2È10 keV) correlations in Ñux (left panel) and luminosities (right panel)
1382 ALONSO-HERRERO ET AL. Vol. 121
FIG. 18.ÈSame as Fig. 17, but with the ISO 9.63 km Ñuxes and luminosities
that for some Compton-thin Seyfert 2 galaxies much of theL -band (3.5 km) emission is attenuated, and this fact wasused to estimate the extinctions to the AGN. The reason forthe improved correlations in the mid-infrared (4.8 and 9.6km) is the reduced extinction as the wavelength increases.As we saw in ° 4.2, in our sample there are no Seyfertgalaxies with viewing angles This means that weh
v[ 64¡.
should not expect extinctions higher than mag orAV
\ 130A(4.8 km)^ 3 mag (using Rieke & Lebofsky 1985 extinc-tion law), which is in good agreement with the observedscatter in the 4.8 km versus hard X-ray correlation.
As discussed in ° 4.1, in the torus ] cone model most ofthe near-infrared emission is produced in the optically thincone. This component is located between the BLR and theNLR. The conical dust is more visible from all viewingangles, and it is probably illuminated by a stronger contin-uum (due to the beaming). This is conÐrmed by the Ðndingsof Bock et al. (1998) that NGC 1068 shows dust emissionfrom the wall of the cavity, i.e., perpendicular to the axis ofthe torus and in an extended component (^100 pc) coin-cident with the radio emission and ionization cone (Alloinet al. 2000). This naturally explains the good correlationbetween the 4.8 and 9.7 km and the hard X-ray emissions.
TABLE 8
CORRELATION STATISTICS FOR SEYFERT 1S AND SEYFERT 2S
Correlation Quantity N rS Probability
L -band vs. HX . . . . . . Flux 33 0.26 1.4 ] 10~1M-band vs. HX . . . . . . Flux 24 0.61 3.3 ] 10~39.6 km vs. HX . . . . . . . Flux 33 0.66 2.0 ] 10~4L -band vs. HX . . . . . . Lum 33 0.90 \7 ] 10~6M-band vs. HX . . . . . . Lum 24 0.94 6.8 ] 10~69.6 km vs. HX . . . . . . . Lum 33 0.90 6.7 ] 10~7
NOTE.ÈN is the number of objects in the sample, is the Spear-rSman correlation rank, and Probability is the probability that thecorrelation is not present.
Moreover, this may o†er an explanation for the Comptonoptically thick Seyferts cm~2) that are bright in(NH [ 1024the mid-infrared. The examples in our sample are NGC1068, Mrk 533, and NGC 4968. This kind of objects are alsopresent in the CfA sample (Quillen et al. 2001b). We con-clude that the 5È10 km emission in Seyfert galaxies is agood indicator of the AGN power.
5.2. Mid-Infrared Counterparts of Highly ObscuredX-Ray Galaxies
The use of mid-infrared measurements as indicators ofthe AGN luminosity may have very important implications.Recent deep Ðeld surveys from Chandra have found anumber of hard X-ray sources which are not identiÐed opti-cally (e.g., Mushotzky et al. 2000). These sources are candi-dates for the highly absorbed objects needed to account forthe spectral index of the hard X-ray background (Setti &Woltjer 1989). Some of the X-ray identiÐed sources requirehigh levels of absorption to account for the Ñatness of theirX-ray spectrum, suggesting that these sources might beopaque even at 10 km. A recent comparison of faintSCUBA sources with Chandra sources found only onesource in common (Fabian et al. 2000). However, in thepreceding section we have shown that Compton-thicksources can be bright in the mid-infrared. If such sources arecommon then follow up deep surveys can search for mid-infrared counterparts to highly absorbed X-ray sources.
For the non-Compton thick sources cm~2)(NH ¹ 1024the 5 km luminosity is similar to that at 2È10 keV (Fig. 17).Mushotzsky et al. (2000) found 2000 and 300 sources persquare degree with 2È10 keV Ñuxes greater than 2] 10~15and 10~14 ergs cm~2 s~1, respectively. These sources wouldcorrespond to Ñuxes of 3 and 17kJy at rest wavelength of 5km. If the rest 10 and 20 km luminosities are twice that of 5km Ñux, then we would expect 13 and 66 kJy at a restwavelength of 10 km and 26 and 130kJy at a rest wave-length of 20 km for these sources.
No. 3, 2001 NONSTELLAR IR CONTINUUM OF SEYFERT GALAXIES 1383
The K-correction in the mid-infrared is likely to make theobserved sources more difficult to detect since the spectrumis red out to D30 km. The obscured sources are most likelyto be detected between D15È90 km where the rest wave-length 5È30 km peak is redshifted into the observed wave-length range, though unobscured sources would su†er lessfrom the K correction. Deep mid-IR surveys planned withSIRTF will go deep enough over large enough areas thatmid-IR candidates to absorbed X-ray sources should befound. However we expect based on ISO surveys that in thiswavelength region the number of counts from starburstswill dominate by at least an order of magnitude the countsfrom AGNs. If these sources are at a redshift of 2.0 then theX-ray luminosity of a source with hard X-ray Ñuxes 10~14ergs cm~2 s~1 is only D1044 ergs s~1 (assuming q0\ 0.15and which implies that these sources might just beH0\ 75)Seyferts. If they are L * galaxies they would be difficult todetect in optical follow-up searches (m
I[ 26).
6. SUMMARY AND CONCLUSIONS
We have presented 1È5 km imaging for a sample ofSeyfert 2 galaxies. The data have been complemented withexisting HST /NICMOS (1È2.2 km) and ISO (6È15 km)observations of the Seyfert 2s, as well as a small comparisonsample of Seyfert 1s. We have performed a very carefulestimate of the nonstellar Ñuxes in the 1È5 km range toconstruct nonstellar infrared SEDs. We Ðt the nonstellarinfrared (up to 15 km) SEDs with the Efstathiou & Rowan-Robinson (1995) code for tapered disks. We consider asimple torus model (coneless) and a composite model whichincludes a torus and an optically thin cone component. Thelatter model was found to Ðt well the SED of NGC 1068(Efstathiou et al. 1995). From our analysis we Ðnd that :
1. The nonstellar infrared SEDs for the Seyfert galaxiesin our sample display a variety of shapes, which can all bewell Ðtted by either cone or coneless models. Although themodel Ðts to the SEDs do not clearly favor the cone models,as claimed by Efstathiou et al. (1995), we nevertheless Ðndthat the viewing angle toward the central source is wellconstrained even in cases where the Ðts to the cone andconeless models are equally valid. For all the galaxies in our
sample we Ðnd viewing angles with most of thehv¹ 64¡,
obscured galaxies showing The Ðtted viewinghv^40¡.
angles are however dependent on the assumed torusgeometry.
2. The nonstellar L @[M versus H[L @ and H[M color-color diagrams provide a good means to separate thoseSeyfert 2s with moderate obscurations mag from(A
V[ 20
hard X-ray observations) from those with high obscuration.The L @[M, H[L @, and H[M colors of Seyfert 1s andSeyfert 2s with viewing angles of are better repro-h
v\ 30¡
duced with the cone model.3. The extinctions derived from the model Ðts to the
SEDs tend to be less than those inferred from measure-ments of the hard X-ray attenuations. This can be under-stood if the material responsible for obscuration of theinfrared continuum is in a di†erent location from the gascolumn causing absorption of the X-rays.
4. There is a good correlation between 4.8 km and ISO9.7 km and hard X-ray Ñuxes and luminosities for bothSeyfert 1s and Compton thin cm~2) Seyfert 2s.(NH ¹ 1024The improved correlations at 4.8 and 9.7 km with respect tothose at shorter wavelengths are explained in terms of thereduced extinction. Some Compton thick sources (e.g.,NGC 1068 and Mrk 533) are bright infrared sources sug-gesting that the component responsible for the bulk of theinfrared emission in Seyfert galaxies is more visible from allviewing angles than that responsible for the hard X-rayemission. We conclude that the mid-infrared emission inSeyfert galaxies can be used as a measure of the AGN lumi-nosity. This has important implications for future mid-infrared searches of visually obscured objects which maymake an important contribution to the hard X-ray back-ground.
We are grateful to P. Martini for providing us with someof the NICMOS images used in this work prior to theirpublication. We also thank M. Ruiz for useful discussions.A. A.-H. was partially supported by the National Aeronau-tics and Space Administration on grant NAG 5-3042through the University of Arizona. A. A.-H. thanks theDepartment of Physics and Astronomy, University ofLeicester for their warm hospitality.
REFERENCES
Alexander, D. M., Efstathiou, A., Hough, J. H., Aitken, D. K., Lutz, D.,Roche, P. F., & Sturm, E. 1999, MNRAS, 310, 78
Alloin, D., Pantin, E., Lagage, P. O., & Granato, G. L. 2000, A&A, 363, 926Alonso-Herrero, A., Simpson, C., Ward, M. J., & Wilson, A. S. 1998, ApJ,
495, 196Alonso-Herrero, A., Ward, M. J., & Kotilainen, J. K. 1996, MNRAS, 278,
902ÈÈÈ. 1997, MNRAS, 288, 977Andreani, P., Franceschini, A., & Granato, G. 1999, MNRAS, 306, 161Barvainis, R. 1987, ApJ, 320, 537Bassani, L., Dadina, M., Maiolino, R., Salvati, M., Risaliti, G., Della Ceca,
R., Matt, G., & Zamorani, G. 1999, ApJS, 121, 473Blanco, P. R., Ward, M. J., & Wright, G. S. 1990, MNRAS, 242, P4Bock, J. J., Marsh, K. A., Ressler, M. E., & Werner, M. W. 1998, ApJ, 504,
L5Clavel, J., et al. 2000, A&A, 357, 839Danese, L., Zitelli, V., Granato, G. L., DeZotti, G., & Mandolesi, N. 1992,
ApJ, 399, 38Edelson, R. A. 1986, ApJ, 309, L69Edelson, R. A., & Malkan, M. A. 1986, ApJ, 308, 59Edelson, R. A., Malkan, M. A., & Rieke, G. H. 1987, ApJ, 321, 233Efstathiou, A., Hough, J. H., & Young, S. 1995, MNRAS, 277, 1134Efstathiou, A., & Rowan-Robinson, M. 1995, MNRAS, 273, 649Elias, J. H., Frogel, J. A., Matthews, K., & Neugebauer, G. 1982, AJ, 87,
1029
Fabian, A. C., et al. 2000, MNRAS, 315, L8Fadda, D., Giuricin, G., Granato, G. L., & Vecchies, D. 1998, ApJ, 496, 117Goodrich, R. W., Veilleux, S., & Hill, G. J. 1994, ApJ, 422, 521Granato, G. L., & Danese, L. 1994, MNRAS, 268, 235Granato, G. L., Danese, L., & Franceschini, A. 1997, ApJ, 486, 147Haas, M., S. A. H., Chini, R., Meisenheimer, K., Klaas, U., Lemke,Mu� ller,
D., Kreysa, E., & Camenzind, M. 2000, A&A, 354, 453Heckman, T. M. 1995, ApJ, 446, 101Isobe, T., & Feigelson, E. D. 1990, BAAS, 29, 917Kotilainen, J. K., Ward, M. J., Boisson, C., DePoy, D. L., Smith, M. G., &
Bryant, L. R. 1992, MNRAS, 256, 125Krabbe, A., T., & Maiolino, R. 2000, ApJ, in pressBo� ker,Krist, J. E., Golimowski, D. A., Schroeder, D. J., & Henry, T. J. 1998,
PASP, 110, 1046LaValley, M., Isobe, T., & Feigelson, E. D. 1992, in ASP Conf. Ser. 25,
Astronomical Data Analysis Software and Systems I, ed. D. M. Worrall,C. Biemesderfer, & J. Barnes (San Francisco : ASP), 245
Malkan, M. A., Gorjian, V., & Tam, R. 1998, ApJS, 117, 25McAlary, C. W., & Rieke, G. H. 1988, ApJ, 333, 1McLeod, B. A. 1997, in The 1997 HST Calibration Workshop, ed. S.
Casertano, R. Jedrzejewski, C. D. Keyes, & M. Stevens (Baltimore :STScI), 281
Mulchaey, J. S., Koratkar, A., Ward, M. J., Wilson, A. S., Whittle, M.,Antonucci, R. R. J., Kinney, A. L., & Hurt, T. 1994, ApJ, 436, 586
Murayama, T., Mouri, H., & Taniguchi, Y. 2000, ApJ, 528, 179
1384 ALONSO-HERRERO ET AL.
Mushotzky, R. F., Cowie, L. L., Barger, A. J., & Arnaud, K. A. 2000,Nature, 404, 459
Neugebauer, G., Green, R. F., Matthews, K., Schmidt, M., Soifer, B. T., &Bennett, J. 1987, ApJS, 63, 615
A. M. & Espinosa, J. M. 2000 (astro-ph/0003349)Pe� rez Garc•� a, Rodr•� guezPier, E. A., & Krolik, J. H. 1992, ApJ, 401, 99ÈÈÈ. 1993, ApJ, 418, 673Polletta, M., Courvoisier, T. J.-L., Hooper, E. J., & Wilkes, B. J. 2000,
A&A, 362, 75Quillen, A. C., McDonald, C., Alonso-Herrero, A., Lee, A., Shaked, S.,
Rieke, M. J., & Rieke, G. H. 2001a, ApJ, 547, 129Quillen, A. C., Shaked, S., Alonso-Herrero, A., McDonald, C., Lee, A.,
Rieke, M. J., & Rieke, G. H. 2000, ApJ, 532, L17Quillen, A. C., Alonso-Herrero, A., et al., 2001b, in preparationRieke, G. H. 1978, ApJ, 226, 550Rieke, G. H., & Lebofsky, M. J. 1978, ApJ, 220, L37ÈÈÈ. 1985, ApJ, 288, 618Rieke, G. H., & Low, F. J. 1975, ApJ, 199, L13Rigopoulou, D., Spoon, H. W. W., Genzel, R., Lutz, D., Moorwood,
A. F. M., & Tran, Q. D. 1999, AJ, 118, 2625
Rix, H.-W., Carlenton, N. P., Rieke, G., & Rieke, M. 1990, ApJ, 363, 480Roche, P., Aitken, D. K., Smith, C. H., & Ward, M. J. 1991, MNRAS, 248,
606Ruiz, M., Efstathiou, A., Alexander, D., & Hough, J. 2001, MNRAS, in
pressRuiz, M., Rieke, G. H., Schmidt, G. D. 1994, ApJ, 423, 608Sanders, D. B., Phinney, E. S., Neugebauer, G., Soifer, B. T., & Matthews,
K. 1989, ApJ, 347, 29Setti, G., & Woltjer, L. 1989, A&A, 224, L21Simpson, C. 1998, ApJ, 509, 653Veilleux, S., Goodrich, R. W., & Hill, G. J. 1997, ApJ, 477, 631Ward, M. J., Allen, D. A., Wilson, A. S., Smith, M. G., & Wright, A. E.
1982, MNRAS, 199, 953Ward, M., Elvis, M., Fabbiano, G., Carleton, N. P., Willner, S. P. & Law-
rence, A. 1987, ApJ, 315, 74Willner, S. P., Fabbiano, G., Elvis, M., Ward, M., Longmore, A., & Law-
rence, A. 1984, PASP, 96, 143Zitelli, V., Granato, G. L., Mandolesi, N., Wade, R., & Danese, L. 1993,
ApJS, 84, 185