Outflowing gas in a compact ionization cone in the Seyfert 2 ...
14
MNRAS 489, 4111–4124 (2019) doi:10.1093/mnras/stz2333 Outflowing gas in a compact ionization cone in the Seyfert 2 galaxy ESO 153-G20 Pamela Soto-Pinto, 1 ‹ Neil M. Nagar, 1‹ Carolina Finlez, 1 Venkatessh Ramakrishnan , 1 Dania Mu˜ noz-Vergara, 1,2 Roy Slater, 3 Pedro K. Humire, 1 Thaisa Storchi-Bergmann, 4 Davide Lena , 5,6 Steven B. Kraemer, 7 Travis C. Fischer, 8 Henrique R. Schmitt, 9 Rogemar A. Riffel , 10 Allan Schnorr-M¨ uller, 4 Andrew Robinson, 11 D. Michael Crenshaw 12 and Martin S. Elvis 13 1 Departamento de Astronom´ ıa, Universidad de Concepci´ on, Casilla 160-C, Concepci ´ on, Chile 2 Departamento de F´ ısica y Astronom´ ıa, Universidad de La Serena, Av. Juan Cisternas 1200, La Serena, Chile 3 Direcci´ on de Formaci´ on General, Facultad de Educaci´ on y Cs. Sociales, Universidad Andres Bello, Sede Concepci´ on, Autopista Concepci´ on-Talcahuano 7100, Talcahuano, Chile 4 Instituto de F´ ısica, CP 15015, Universidade Federal do Rio Grande do Sul, 91501-970, Porto Alegre, RS, Brazil 5 SRON, Netherlands Institute for Space Research, Sorbonnelaan 2, NL3584 CA Utrecht, the Netherlands 6 Department of Astrophysics/IMAPP, Radboud University, Nijmegen, PO Box 9010, NL-6500 GLNijmegen, the Netherlands 7 Institute for Astrophysics and Computational Sciences, Department of Physics, The Catholic University of America, Washington, DC 20064, USA 8 Astrophysics Science Division, Goddard Space Flight Center, Code 665, Greenbelt, MD 20771, USA 9 Naval Research Laboratory, 4555 Overlook Avenue, SW, Washington, DC 20375, USA 10 Universidade Federal de Santa Mar´ ıa, Departamento de F´ ısica, Centro de Ciencias Naturais e Exatas, 97105-900, Santa Maria, RS, Brazil 11 Department of Physics, Rochester Institute of Technology, 84 Lomb Memorial Drive, Rochester, NY 14623, USA 12 Department of Physics and Astronomy, Georgia State University, Astronomy Offices, 25 Park Place, Suite 605, Atlanta, GA 30303, USA 13 Harvard-Smithsonian Center for Astrophysics 60 Garden St., ms.6, Cambridge, MA 02138 USA Accepted 2019 August 16. Received 2019 August 13; in original form 2018 March 28 ABSTRACT We present two-dimensional ionized gas and stellar kinematics in the inner 1.4 × 1.9 kpc 2 of the Seyfert 2 galaxy ESO 153-G20 obtained with the Gemini-South/Gemini multi-object spectrograph integral field unit (GMOS-IFU) at a spatial resolution of ∼250 pc and spectral resolution of 36 km s −1 . Strong [O III], Hα, [N II] and [S II] emission lines are detected over the entire field of view. The stellar kinematics trace circular rotation with a projected velocity amplitude of ±96 km s −1 , a kinematic major axis in position angle of 11 ◦ , and an average velocity dispersion of 123 km s −1 . To analyse the gas kinematics, we used aperture spectra, position–velocity diagrams and single/double Gaussian fits to the emission lines. All lines show two clear kinematic components: a rotating component that follows the stellar kinematics, and a larger-dispersion component, close to the systemic velocity (from which most of the [O III] emission comes), mainly detected to the south-west. We interpret this second component as gas outflowing at ∼400 km s −1 in a compact (300 pc) ionization cone with a half-opening angle ≤40 ◦ . The counter-cone is probably obscured behind a dust lane. We estimate a mass outflow rate of 1.1 M yr −1 , 200 times larger than the estimated accretion rate on to the supermassive black hole, and a kinetic to radiative power ratio of 1.7 × 10 −3 . Bar-induced perturbations probably explain the remaining disturbances observed in the velocity field of the rotating gas component. Key words: galaxies: active – galaxies: individual: ESO 153-G20 – galaxies: kinematics and dynamics – galaxies: nuclei – galaxies: Seyfert. E-mail: [email protected] (PS-P); [email protected] (NMN) C 2019 The Author(s) Published by Oxford University Press on behalf of the Royal Astronomical Society Downloaded from https://academic.oup.com/mnras/article/489/3/4111/5571294 by guest on 23 January 2022
-
Upload
khangminh22 -
Category
Documents
-
view
0 -
download
0
Transcript of Outflowing gas in a compact ionization cone in the Seyfert 2 ...

MNRAS 489, 4111–4124 (2019) doi:10.1093/mnras/stz2333
Outflowing gas in a compact ionization cone in the Seyfert 2 galaxyESO 153-G20
Pamela Soto-Pinto,1‹ Neil M. Nagar,1‹ Carolina Finlez,1 Venkatessh Ramakrishnan ,1
Dania Munoz-Vergara,1,2 Roy Slater,3 Pedro K. Humire,1 Thaisa Storchi-Bergmann,4
Davide Lena ,5,6 Steven B. Kraemer,7 Travis C. Fischer,8 Henrique R. Schmitt,9
Rogemar A. Riffel ,10 Allan Schnorr-Muller,4 Andrew Robinson,11
D. Michael Crenshaw12 and Martin S. Elvis13
1Departamento de Astronomıa, Universidad de Concepcion, Casilla 160-C, Concepcion, Chile2Departamento de Fısica y Astronomıa, Universidad de La Serena, Av. Juan Cisternas 1200, La Serena, Chile3Direccion de Formacion General, Facultad de Educacion y Cs. Sociales, Universidad Andres Bello, Sede Concepcion, Autopista Concepcion-Talcahuano7100, Talcahuano, Chile4Instituto de Fısica, CP 15015, Universidade Federal do Rio Grande do Sul, 91501-970, Porto Alegre, RS, Brazil5SRON, Netherlands Institute for Space Research, Sorbonnelaan 2, NL3584 CA Utrecht, the Netherlands6Department of Astrophysics/IMAPP, Radboud University, Nijmegen, PO Box 9010, NL-6500 GL Nijmegen, the Netherlands7Institute for Astrophysics and Computational Sciences, Department of Physics, The Catholic University of America, Washington, DC 20064, USA8Astrophysics Science Division, Goddard Space Flight Center, Code 665, Greenbelt, MD 20771, USA9Naval Research Laboratory, 4555 Overlook Avenue, SW, Washington, DC 20375, USA10Universidade Federal de Santa Marıa, Departamento de Fısica, Centro de Ciencias Naturais e Exatas, 97105-900, Santa Maria, RS, Brazil11Department of Physics, Rochester Institute of Technology, 84 Lomb Memorial Drive, Rochester, NY 14623, USA12Department of Physics and Astronomy, Georgia State University, Astronomy Offices, 25 Park Place, Suite 605, Atlanta, GA 30303, USA13Harvard-Smithsonian Center for Astrophysics 60 Garden St., ms.6, Cambridge, MA 02138 USA
Accepted 2019 August 16. Received 2019 August 13; in original form 2018 March 28
ABSTRACTWe present two-dimensional ionized gas and stellar kinematics in the inner 1.4 × 1.9 kpc2 ofthe Seyfert 2 galaxy ESO 153-G20 obtained with the Gemini-South/Gemini multi-objectspectrograph integral field unit (GMOS-IFU) at a spatial resolution of ∼250 pc and spectralresolution of 36 km s−1. Strong [O III], Hα, [N II] and [S II] emission lines are detected overthe entire field of view. The stellar kinematics trace circular rotation with a projected velocityamplitude of ±96 km s−1, a kinematic major axis in position angle of 11◦, and an averagevelocity dispersion of 123 km s−1. To analyse the gas kinematics, we used aperture spectra,position–velocity diagrams and single/double Gaussian fits to the emission lines. All lines showtwo clear kinematic components: a rotating component that follows the stellar kinematics, anda larger-dispersion component, close to the systemic velocity (from which most of the [O III]emission comes), mainly detected to the south-west. We interpret this second component asgas outflowing at ∼400 km s−1 in a compact (300 pc) ionization cone with a half-opening angle≤40◦. The counter-cone is probably obscured behind a dust lane. We estimate a mass outflowrate of 1.1 M� yr−1, 200 times larger than the estimated accretion rate on to the supermassiveblack hole, and a kinetic to radiative power ratio of 1.7 × 10⁻³. Bar-induced perturbationsprobably explain the remaining disturbances observed in the velocity field of the rotating gascomponent.
Key words: galaxies: active – galaxies: individual: ESO 153-G20 – galaxies: kinematics anddynamics – galaxies: nuclei – galaxies: Seyfert.
� E-mail: [email protected] (PS-P); [email protected] (NMN)
C© 2019 The Author(s)Published by Oxford University Press on behalf of the Royal Astronomical Society
Dow
nloaded from https://academ
ic.oup.com/m
nras/article/489/3/4111/5571294 by guest on 23 January 2022

4112 P. Soto-Pinto et al.
1 IN T RO D U C T I O N
Investigations into the gas kinematics in nearby low-ionizationnuclear emission-line region (LINER)/Seyfert galaxies can be usedto search for signatures of gas inflows and/or outflows to/from thenucleus (e.g. Fathi et al. 2006; Storchi-Bergmann et al. 2007; Davieset al. 2009; Rosario et al. 2010; Schnorr Muller et al. 2011; Combeset al. 2013; Garcıa-Burillo et al. 2015; Lena et al. 2015; Garcıa-Burillo et al. 2017); to allow the determination of the mass of thecentral region in a galaxy (e.g. Kormendy & Ho 2013); and tostudy the stellar population in the central region of a galaxy afterdecoupling the gas from the stellar kinematics (Sarzi et al. 2005;Repetto et al. 2017).
It is now widely accepted that the radiation emitted by an activegalactic nucleus (AGN) is the result of the accretion of gas on toa supermassive black hole (hereafter SMBH) (Lynden-Bell 1969;Begelman, Blandford & Rees 1984). This has motivated the searchfor signatures, such as inflows and outflows, of the mechanismsresponsible for transferring mass from galactic scales down tonuclear scales to feed the SMBH. Simoes Lopes et al. (2007) foundthat there is a marked difference in the dust and gas content inthe nuclei of early-type active galaxies as compared with non-active ones: while the former always have dusty structures, inthe form of spirals and filaments at scales of hundreds of parsecs,only 25 per cent of non-active galaxies have such structures. Thisindicates that a reservoir of gas and dust is a necessary conditionfor nuclear activity and also suggests that the dusty structures aretracers of feeding channels to the AGN.
Simulations and theoretical studies have shown that non-axisymmetric potentials efficiently promote gas inflow towards theinner regions of galaxies (Shlosman, Begelman & Frank 1990;Englmaier & Shlosman 2004; Knapen 2005; Emsellem et al. 2006),where structures such as nuclear bars, spiral arms and small-scalediscs are commonly observed (e.g. Erwin & Sparke 1999).
In order to better understand the extent, geometry, kinematics andenergetics of the narrow-line region (NLR) on ≤100-pc scales in awell-defined sample of nearby AGNs, we have been pursuing high-resolution integral field unit (IFU) observations of (∼30) Seyfertgalaxies from the Hubble Space Telescope (HST) [O III] SnapshotSurvey of Schmitt et al. (2003) selected to (a) have NLRs that extendbeyond ∼1 arcsec from the nucleus, and (b) cover the full range (39≤ log (L[O III]) ≤ 42 erg s−1) of AGN luminosities of the sample.Results on individual or subsets of galaxies can be found in Schnorr-Muller et al. (2014a,b), Riffel, Storchi-Bergmann & Riffel (2015),Lena et al. (2016), Finlez et al. (2018), Humire et al. (2018), Freitaset al. (2018), Slater et al. (2019), Munoz-Vergara et al. (2019) andRamakrishnan et al. (2019), and overall results of the study will bepublished on completion of the sample. As part of this study, weobserved ESO 153-G20 with the IFU of the Gemini multi-objectspectrograph (GMOS-IFU). The results and analysis are sufficientlydetailed (and no previous kinematic study of this galaxy is availablein the literature) that we present them independently in this work.
ESO153-G20 is a nearby SBab galaxy harbouring a Seyfert 2nucleus (RC3: de Vaucouleurs et al. 1991; de Grijp, Lub & Miley1987); it is located at a distance of 79.4 ± 5.6 Mpc (from NED,1
derived assuming a redshift of 0.019737 and H0 = 73.0 km s−1
Mpc−1), corresponding to a scale of 385 pc arcsec−1 and a
1The NASA/IPAC Extragalactic Database (NED) is operated by the JetPropulsion Laboratory, California Institute of Technology, under contractwith the National Aeronautics and Space Administration.
heliocentric velocity of 5917 ± 28 km s−1 (da Costa et al. 1991).Many extremely different major axis position angles (hereafter PAs)have been suggested for this object, from 14◦ (Lauberts & Valentijn1989), through 125◦ (Skrutskie et al. 2006, hereafter 2MASS) to164◦ (Paturel et al. 2003, hereafter HYPERLEDA). This variationis primarily a result of the presence of rings, which change theperspective of this object depending on the observation band used.For example, Schmitt & Kinney (2000) found PAs of 8◦ and −50◦
using images taken in the I and B band, respectively. These ringshave been relatively well characterized in Buta & Crocker (1991,1993) and in Buta (1995). In these works, the authors determinethat ESO153-G20 is a classical example of a ‘2 + 2’ spiral armmultiplicity, namely two main arms and two secondary ones, thatshows a very open inner pseudo-ring (rs) around a prominent bar,and is also one of the best cases of a Type I Schwarz outer pseudo-ring (R’1).
The listed diameters of ESO 153-G20 vary from 93 to 114 arcsec(RC3; Lauberts 1982; Lauberts & Valentijn 1989; 2MASS), usinga reference level of ∼25.0 B-mag arcsec−2 in the case of the formerthree works, and a reference level of 20.0 K-mag arcsec−2 in the caseof 2MASS. For the minor axis, we found only one determination,of 72 arcsec by Lauberts (1982), using the same reference level of25.0 B-mag arcsec−2. An ellipticity between 0.37 and 0.40 has alsobeen determined by the same authors.
In the HST imaging survey of extended [O III] λ5007 emission inSeyferts, Schmitt et al. (2003) found that the bulk of the emission-line region comes from the inner 385 pc and is extended alongPA = −100◦. These authors interpret this as an ionization cone tothe south-west with a half-opening angle of 40◦. They also founddiffuse emission in a region of ∼1.85 × 2.65 arcsec2 around thenucleus, with the major axis at PA = −10◦.
The present paper is organized as follows. Section 2 describes theobservations and data reduction. Section 3 presents the proceduresused for the analysis of the data and the subsequent results. Section 4briefly discusses our results, and Section 5 presents our conclusions.
2 O B S E RVAT I O N S A N D DATA R E D U C T I O N
The observations were obtained with the GMOS-IFU (Hook et al.2004; Allington-Smith et al. 2002) at the Gemini South Telescopeon the night of 2014 October 29 as part of the project GS-2014B-Q-20 (P.I. Nagar). The observations were obtained in ‘one-slit’ modeand consisted of two IFU fields, covering a field of view (FOV)of 3.5 × 5 arcsec2 each, and resulting in a total usable coverageof 3.6 × 4.9 arcsec2 around the nucleus. Two exposures of 900 seach were obtained for each field, slightly shifted spatially and inwavelength coverage, in order to correct for detector defects aftercombination of the frames. The seeing during the observation was∼0.65 arcsec, as listed in the observation log, and confirmed bymeasuring the full width at half-maximum (FWHM) of the profilesof four stars in the science acquisition image. This corresponds to aspatial resolution of ∼250 pc at the distance of the galaxy.
We used the B600 G5323 grating with a central wavelengthof either 5700 or 5750 Å, resulting in a spectral range of 4110–7280 Å, which covers the Hβ, [O III] λλ4959, 5007, Hα + [N II]λλ6549, 6583 and [S II] λλ6717, 6731 emission lines. The wave-length sampling was 0.51 Å per pixel at a spectral resolution of R∼ 3550, corresponding to σ inst ≈ 36 km s−1, as measured from thearc spectra.
Data reduction was performed using specific tasks developedfor GMOS data in the gemini.gmos package as well as generic
MNRAS 489, 4111–4124 (2019)
Dow
nloaded from https://academ
ic.oup.com/m
nras/article/489/3/4111/5571294 by guest on 23 January 2022

Outflowing gas in ESO 153-G20 4113
tasks in PYRAF.2 The reduction process included bias subtraction,bad-pixel masking, flat-fielding, trimming, wavelength calibration,sky subtraction, relative flux calibration, differential atmosphericrefraction correction, building of the data cubes at a sampling of0.1 × 0.1 arcsec2, and finally the alignment and combination ofthe four data cubes using the PYFU3 package. We also performedcosmic ray rejection using the Laplacian Cosmic Ray Identificationcode (L.A.COSMIC) written by van Dokkum, Bloom & Tewes(2012).
Flux calibration was performed using the spectroscopic standardstar LTT 2415 (V = 12.21), for which fluxes are tabulated every 50Å (Hamuy et al. 1992, 1994). It was observed in a 600-s exposureon the night of 2014 October 11, with the same instrument setupas for the galaxy. The flux calibration step applies by default anarbitrary scaling of 1015 in order to avoid later numerical errors.This factor was considered to give true flux units in our analysis.
Sky subtraction was performed using spectra from the ‘Sky’FOV.4 In Fig. 1, we note a residual Telluric absorption at ∼6870 Å(see spectrum at position 1) that affects the [S II] λ6731 emissionline. In order to correct this feature, we created a pseudo-spectrumof the standard star, using the absolute magnitudes on the V, R, I,J, H and K bands and the imexpr task from IRAF.5 The observedspectrum of the standard star was divided by this pseudo-spectrumin order to obtain a ‘flat’ spectrum that was used to correct forTelluric absorption in each spectrum of the data cube. The result ofthis process can be observed in the spectra at positions 2 and 3 ofFig. 1. We note that the science and flux calibrator exposures weretaken on different nights, and thus the Telluric subtraction is notoptimal. This does not change any of our principal science results,as this absorption only affects a small region close to the [S II]lines.
3 R ESULTS
Fig. 1 presents an overview of our target galaxy and observations.The upper left panel shows the Gemini GMOS acquisition image ofESO153-G20, where we can observe the spiral arms. The upperright panel shows an image of the inner 8 × 8 arcsec2 of thegalaxy obtained with the Wide-Field Planetary Camera 2 (WFPC2)through the filter F547M aboard the HST. The middle left panelpresents a ‘structure’ map of the same FOV as the WFPC2 image,where the rectangle shows the GMOS FOV of our observations.This structure map was obtained following the process detailed inPogge & Martini (2002); it was derived using a deconvolved HSTimage, in conjunction with a synthetic point spread function (PSF)produced with the TINY TIM software (Krist, Hook & Stoehr 2011).In the structure map, we clearly see more dust obscuration to theeast, implying that the near side of the galaxy disc is to the east. Thisinterpretation is consistent with the assumption of trailing spiralarms. The red circles plotted on each side of the nucleus will bediscussed in Section 4; these correspond to the apertures where we
2PYRAF is a product of the Space Telescope Science Institute, which isoperated by AURA for NASA.3Version 0.9 of the PYFU 3D data manipulation package was contributedby James Turner through the Gemini Data Reduction User Forum.4For further details, check the Gemini/GMOS-IFU web pagehttp://www.gemini.edu/sciops/instruments/gmos/integral-field-spectroscopy/basic-design.5IRAF is distributed by the National Optical Astronomy Observatories, whichare operated by the Association of Universities for Research in Astronomy,Inc., under cooperative agreement with the National Science Foundation.
posit a visible ionization cone (south-west) and its correspondingobscured cone (north-east). In the middle right panel, we showthe stellar continuum image from Gemini/GMOS-IFU, obtained byintegrating the flux within a line-free spectral window from λ5400to λ5800 Å. The solid line represents the kinematic major axis ofthe galaxy (PA = 11◦), obtained from our analysis of the stellarkinematics (see Section 3.1), and the dashed line represents theminor axis.
In the lower panel of Fig. 1, we present three spectra fromthe locations marked as 1 (nucleus), 2 (intermediate region) and3 (boundary region) in the IFU image and extracted using anaperture diameter of 0.4 arcsec (∼154 pc). The position of thestellar kinematic centre was adopted as the nucleus of the galaxy(derived in Section 3.1). We clearly detect strong emission lines– Hβ, [O III] λλ4959, 5007, Hα + [N II] λλ6549, 6583 and [S II]λλ6717, 6731 – in all the spectra. All permitted lines show only‘narrow components’ after subtraction of the stellar component (seeSection 3.1), consistent with the classification of ESO 153-G20 asa Seyfert 2 galaxy.
3.1 Stellar kinematics
In order to measure the stellar kinematics, we employed thepenalized pixel fitting technique (PPXF) (Cappellari & Emsellem2004; Cappellari 2017) using as template spectra the Medium-resolution Isaac Newton Telescope Library of Empirical Spectra(MILES) Stellar Library (Vazdekis et al. 2010). These models havea spectral resolution of 2.5 Å (FWHM), as estimated in Falcon-Barroso et al. (2011) (or σ inst ∼ 64 km s−1), and cover the range3525–7500 Å (Sanchez-Blazquez et al. 2006). The final dispersionmaps obtained were corrected, in quadrature, for both the mismatchin the spectral resolution of the science spectra and templates, andthe intrinsic spectral resolution of the science spectra. To ensurethe reliability of the stellar kinematic measurements, the finaldata cube was spatially binned using the Voronoi binning method(Cappellari & Copin 2003), creating bins with a minimum signal-to-noise ratio (S/N) of 25 per bin.
Before running PPXF, we first identified and masked the spectralregions contaminated by emission lines: this included the linesmentioned in Section 2, with the addition of Hδ, Hγ , He II λ4685,[N I] λλ5198, 5200 and [O I] λλ6300, 6363. The bottom panelsof Fig. 1 show examples of observed spectra, the best-fittingstellar template obtained with PPXF, and the corresponding residual(observed − fit). Here, at positions (2) and (3), they correspond tothe binned data cube.
The stellar velocity field (v∗) derived from PPXF is shown inthe left panel of Fig. 2. There is a clear rotation pattern, reachingprojected velocities of ∼96 km s−1 within our FOV. The lineof nodes is oriented close to the north–south direction, with thenorth side receding and the south side approaching. Although themajor axis is along the shorter side of our FOV, we are still ableto obtain reliable results for the kinematics. The stellar velocitydispersion (σ ∗), shown in the rightmost panel, varies between76 and 188 km s−1 across the FOV.
We fitted a rotation model to the stellar velocity field, afterobtaining the best-fitting systemic velocity of the galaxy (Vs ≈5907 km s−1) and the PA of the kinematic major axis (PA = 11◦),measured from north to east, using both Kinemetry and Fit kinematicPA (Krajnovic et al. 2006) IDL routines. For this purpose, weassumed the kinematic centre as the zero-velocity point of the stellarvelocity field. If we also assume a spherical potential and circularorbits in a plane, the observed radial velocity at a position (R, ψ) in
MNRAS 489, 4111–4124 (2019)
Dow
nloaded from https://academ
ic.oup.com/m
nras/article/489/3/4111/5571294 by guest on 23 January 2022

4114 P. Soto-Pinto et al.
Figure 1. Top left: acquisition image from Gemini GMOS. Top right: HST-WFPC2 image of the nuclear region marked on the acquisition image. Middle left:Structure map of the HST-WFPC2 image showing the GMOS FOV. The red circles correspond to the apertures towards which we posit (Section 4) a visibleionization cone (south-west) and its corresponding obscured cone (north-east). Middle right: stellar continuum image extracted from the IFU data cube. Thesolid (dashed) line represents the kinematic major (minor) axis (derived in Section 3.1). Bottom: observed-frame spectra (black solid lines) corresponding tothe regions marked as (1), (2) and (3) in the continuum image. For regions (2) and (3), we also show the best-fitting stellar spectrum derived by PPXF (reddotted line) and the residual (observed − stellar) spectrum (blue dashed line). All images have the orientation defined by the compass shown in the middleright panel.
the plane of the sky is given by (Bertola et al. 1991):
V = Vs
+ AR cos(ψ − ψ0) sin(θ ) cosp θ
{R2[sin2(ψ − ψ0) + cos2 θ cos2(ψ − ψ0)] + c2 cos2 θ}p/2.
(1)
Here, θ is the inclination of the disc (with θ = 0 for a face-on disc); ψ0 is the position angle of the line of nodes; Vs is thesystemic velocity; R is the projected radius from the nucleus; A isthe amplitude of the velocity curve; c is the concentration parameter,which indicates at what distance the rotation curve reaches itsmaximum; and p describes the behaviour of the velocity curve
beyond its maximum value (e.g. if it flattens, p=1, or decreases).For galaxies, we expect 1 ≤ p ≤ 3/2.
The best-fitting parameters are shown in Table 1, while the secondand third panels of Fig. 2 show the best-fitting stellar rotation modeland the velocity residual.
3.2 Gas kinematics
3.2.1 Single Gaussian fit
We used the Profit IDL routine (Riffel 2010) to fit the strong emissionlines with a single Gaussian profile to obtain the emission-linefluxes, centroid velocities and velocity dispersions of the gas. In
MNRAS 489, 4111–4124 (2019)
Dow
nloaded from https://academ
ic.oup.com/m
nras/article/489/3/4111/5571294 by guest on 23 January 2022

Outflowing gas in ESO 153-G20 4115
Figure 2. From left to right: observed stellar radial velocity field (km s−1), best-fitting rotation model, residual (observed − model), and stellar velocitydispersion (km s−1). The solid (dashed) lines mark the positions of the kinematic major (minor) axis, and the white cross marks the stellar kinematic centre.Each panel follows the colour bar on its right.
Table 1. Parameters of the best-fitting rotation models.
Parameter Stars [N II] λ6583 [N II] ‘eye’ fit
A (km s−1) 145 265 280c (arcsec) 1.2 3.0 1.2p 1.0 1.0 1.0θ (◦) 51 51 46ψ0 (◦) 11 11 11
Notes. Column 1, parameter name (see text for details); column 2, best-fitting parameter values for the stellar velocity field; column 3, values forthe [N II] λ6583 velocity field; and column 4, values for the [N II] ‘eye’ fit.
Fig. 3 we present the integrated flux distributions, velocity fieldsand dispersion maps of the [O III] λ5007 Å, Hα, Hβ, [N II] λ6583Å and [S II] λ6716 Å emission lines.
The emission-line fluxes show the highest values within a regionwith radius ∼1 arcsec (385 pc), centred about 0.25 arcsec to thesouth-west of the stellar kinematic centre. The flux distributionof the [O III] emission line appears mainly axisymmetric aroundthis centre, but at fainter fluxes it appears to be extended alongPA ≈ 110◦, close to the value reported by Schmitt et al. (2003)using HST imaging. In the case of Hα and Hβ, the distributionsappear more symmetric with respect to the nucleus, reaching valuesof 0.9 and 0.2 (×10−15 erg cm−2 s−1) in an aperture of radius0.2 arcsec around the centre, respectively. The Hα and Hβ fluxdistributions seem also to extend more to the north than the [O III]flux distribution, while the [N II] and [S II] distributions seem to bean intermediate between [O III] and Hα, being slightly axisymmetricand showing a slight elongation to the north.
The centroid velocity maps for Hα, Hβ, [N II] and [S II] (secondrow of Fig. 3) show signatures consistent with rotation in a disc,reaching amplitudes of ∼200 km s−1, but also showing some dis-tortions that are particularly evident in the case of Hα, which showsan S-shaped velocity pattern characteristic of barred disc galaxies(see Section 4). On the other hand, the [O III] emission line showssignificantly lower velocities, reaching values of only ∼30 km s−1 inthe inner 1.5 arcsec. In order to better visualize the large differencein the [O III] kinematics, Fig. 4 plots the change of velocity withradius along the (stellar) kinematic major axis, namely the rotationcurve, of all strong emission lines. Here the Hα, [N II] and [S II]emission lines show a radial profile consistent with rotation, whilethe [O III] emission line is mostly close to zero velocity.
We fitted a Bertola rotation model to the [N II] λ6583 emission-line velocity map, following the same procedure as for the stellarfield (Section 3.1). The parameters A, c and p were free, while theinclination and major axis PA were fixed to the values determined
from the stellar velocity field best fit. Using the results of the best fitto the emission line as a starting point, we changed all the parametersin order to obtain a model that best fit (by ‘eye’) the position–velocity diagrams presented in Section 3.2.2. This gave significantlydifferent results because, as mentioned above, the observed gaskinematics appear to show multiple velocity components, so thatthe velocity field from the single Gaussian fit does not reflect therotating gas component only. The parameter values of these twoBertola fits to the emission-line kinematics are listed in the thirdand fourth columns of Table 1.
Fig. 5 shows the rotation models obtained for the stellar and[N II] emission line along with the gas velocity residual (observed− modelled) fields. Both visually and by comparing the rms inthe residuals, it is clear that the Hα and [N II] emission lines showvelocity fields more in agreement with the [N II] rotation model,while the [O III] emission line velocity field more closely resemblesthe stellar rotation model.
Velocity dispersion maps of the emission lines, after correctingfor the instrumental resolution (σ inst ≈ 36 km s−1), are shown inthe third row of Fig. 3. The mean dispersion value seen over allemission lines is ∼90 km s−1. The Hα and Hβ lines show lowerdispersions (∼60 km s−1) to the north-east, and higher dispersions tothe south-west. The former values are consistent with the dispersionobserved in the rotating component of the gas (see Section 3.2.2).The higher dispersions seen to the south-west can be explained bythe superposition of rotating gas with an outflow along an ionizationcone (Section 4).
Fig. 6 presents maps of the [N II]/Hα, [O III]/Hβ, Hα/Hβ and[S II]6716/6730 line ratios. We also estimated the electron densityfrom the [S II] line ratio in some representative spectra, assumingan electron temperature of 10 000 K (Osterbrock 1989); it is ashigh as 1200 cm−3 at the nucleus and decreases to ∼700 cm−3 at 1arcsec from the nucleus. The [N II]/Hα line ratio has values between1.0 and1.5 within the inner 1 arcsec, while Hα/Hβ reaches valuesbetween 3.9 and 5.2 within the same region. The [O III]/Hβ lineratio varies between 4.6 and 11.0 in the inner 1 arcsec, with a valueof 8.4 in the nucleus. These ratios are typical of AGNs rather than ofstar-forming (H II region) galaxies (Kauffmann et al. 2003; Kewleyet al. 2006).
3.2.2 Position–velocity diagrams, line profiles and doubleGaussian fits
We made position–velocity (P-V) diagrams for the three strongestemission lines – [O III], Hα and [N II] – in order to better constrain
MNRAS 489, 4111–4124 (2019)
Dow
nloaded from https://academ
ic.oup.com/m
nras/article/489/3/4111/5571294 by guest on 23 January 2022

4116 P. Soto-Pinto et al.
Figure 3. From top to bottom: maps of the integrated fluxes (10−15 erg cm−2 s−1 Å−1 arcsec−2), centroid velocities (km s−1) and velocity dispersions (km s−1)derived from the single Gaussian fit to the [O III], Hα, Hβ, [N II] and [S II] emission lines. Each panel follows the colour bar on its right, and the axes (in arcsec)are relative to the stellar kinematic centre, indicated by the intersection of the solid and dashed lines on each map. The solid (dashed) lines indicate the major(minor) axes. The near and far sides of the disc are indicated on the panels in the leftmost column. The zero velocity corresponds to a systemic velocity of5907 km s−1.
Figure 4. Radial velocity ‘rotation curves’ along the kinematic major axis(PA = 11◦) for the stellar velocity field and the strongest emission lines,following the legend in the top left. For emission lines, the velocities arethose obtained by the single Gaussian fit. For reference, the best-fittingBertola stellar rotation model and [N II] rotation model are also shown.
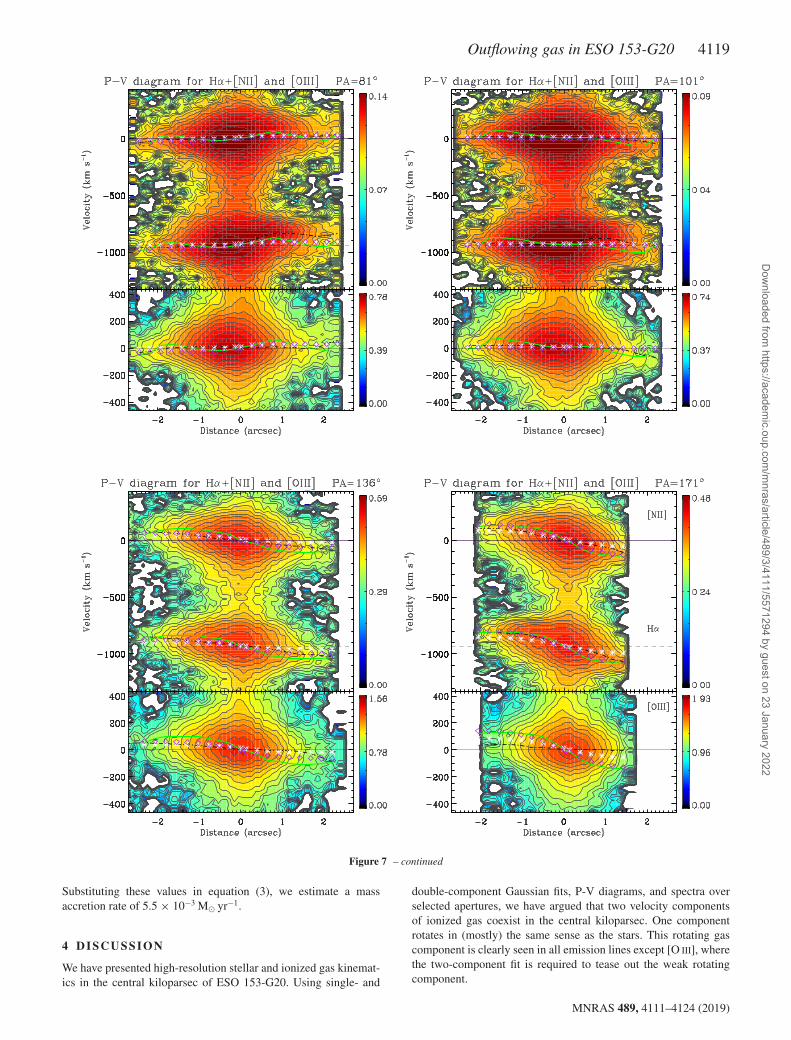
their kinematics. Our analysis used P-V diagrams centred on thestellar kinematic centre, and systemic velocity derived from thebest-fitting Bertola model to the stellar velocity field, along 36different PAs spaced by 5◦. Fig. 7 shows the most relevant of theseP-V diagrams, including those along the major and minor axes. For
a direct comparison, we also overplot the velocities derived fromthe single-Gaussian fit to the respective emission line, the best-fitting model to the stellar velocity field, the ‘by eye’ fit to the [N II](which was obtained by visual fitting to these P-V diagrams), andthe ‘best’ bar perturbation model (see Section 4 for details on thelatter). It is clear that the velocities derived from the single Gaussianfit do not represent well the rotating component in the case of Hα
and [N II], especially on the blue-shifted side, where the presenceof a second lower velocity component is clearly seen. The [N II]‘by eye’ model, as mentioned in Section 3.2, is the one that bestrepresents the velocities seen in the Hα and [N II] emission lines inmost PAs, although at some PAs it predicts velocities lower thanthose observed on the red-shifted side (the north-east side of thegalaxy). In the case of [O III], the P-V diagrams are completelydifferent: there is some agreement with the predictions of the [N II]model at the faintest contours, but the strongest emission comesfrom gas with velocities very close to systemic at all PAs and alldistances from the nucleus.
To complement the P-V diagrams, in Fig. 8 we show normalizedprofiles of the [O III], Hα, [N II] and [S II] emission lines, extractedfrom several 0.2-arcsec-radius apertures distributed over our FOV.These spectra have been continuum-subtracted using the continuumtask from IRAF. Many apertures show two velocity components,but it is easy to appreciate the difficulty of separating these twocomponents because the width of the non-rotating component is
MNRAS 489, 4111–4124 (2019)
Dow
nloaded from https://academ
ic.oup.com/m
nras/article/489/3/4111/5571294 by guest on 23 January 2022

Outflowing gas in ESO 153-G20 4117
Figure 5. The best-fitting Bertola rotation model for the [N II] and stellarvelocity fields (top row), and the velocity residual fields for the [O III],Hα and [N II] emission lines (rows two to four, respectively). The stellarkinematic centre is marked by a black cross, and the axes are in arcseconds.Each row follows the colour bar on its right. Velocity units are in km s−1.
similar to the total velocity variation in our FOV in the rotatingcomponent. It is easy to determine that the [O III] profile (solid line)peaks at zero velocity (the galaxy systemic velocity) in all apertures,showing slight wings or a small rotating component in agreementwith the model prediction in some of the apertures from the northside. Its mean full width at 10 per cent is ∼490 km s−1, consideringthe apertures with high S/N. The apertures located along the majoraxis, and close to it, show that Hα (dot–dashed line) has either twocomponents, or one with a weak wing: one component peaks at zerovelocity, in agreement with [O III], and the other one is close to thepredicted velocity of the rotation model. The two apertures closeto the minor axis show profiles with almost the same behaviour as[O III]. The one to the north-east shows the rotating component inHα, which corresponds to the red-shifted location in the velocitymaps. The [N II] and [S II] lines show, in all apertures, a behaviour
intermediate between Hα and [O III], tracing both the rotation andthe zero-velocity component.
As clearly demonstrated, a second velocity component is oftenobserved in some of the emission lines. We performed doubleGaussian fits to the [O III], Hα and [N II] emission lines, as theyhave the highest S/Ns. With this approach we obtained the followingresults.
(i) The flux distributions show, in the case of the [O III] emissionline, that the non-rotating component is brighter than the rotatingone (a peak value of 1.8 × 10⁻¹⁵ erg cm−2 s−1 versus a peak valueof 0.7 × 10⁻¹⁵ erg cm−2 s−1). The flux distribution of the non-rotating component appears symmetric: its flux peaks at a location∼0.25 arcsec to the south-west from the stellar kinematic centre,and it is extended by ∼0.9 arcsec in FWHM (after deconvolutionof the seeing). In the case of Hα, the two velocity componentsshow roughly similar morphologies and intensities, but the rotatingcomponent is more extended to the east (the near side of the disc).The location of the flux peak for both components is slightly to thesouth-west of the kinematic centre. The [N II] line profiles (Fig. 8)are intermediate between those of [O III] and Hα, and thus theflux distributions observed for both components appear to be verysymmetric with a slight elongation to the north-east and a peakvalue of ∼0.6 × 10⁻¹⁵ erg cm−2 s−1 located at 0.25 arcsec south-west of the nucleus. In Fig. 9, we plot the flux ratio of the rotatingcomponent to the zero-velocity component for [O III] and Hα. Inboth cases, the greatest values (up to 6 in Hα) are located to thenorth side of the disc.
(ii) In the velocity fields (not shown), we recover the rotatingpattern seen in the single Gaussian fit in Hα (including the S-shape),but now with amplitudes of the order of 100 km s−1 and a more sym-metric distribution. In the case of [O III], the rotating component ismostly observed to the north, with values close to 100 km s−1, whileto the south the velocity amplitudes reach only ∼50 km s−1; wenote, however, that the asymmetry is affected by large uncertaintiesowing to the poorly constrained two-component fits. For the [N II]emission line, the rotating component reaches amplitudes of theorder of ∼90 km s−1. The non-rotating component, in all emissionlines, shows velocity dispersions of the order of ∼200 km s−1 to thesouth-west, which we will later argue to be due to outflowing gasin an ionization cone. In the opposite direction (north-east), low-velocity dispersions (close to 60 km s−1) are seen. Thus, overall,the second, high velocity-dispersion component centred on zerovelocity is primarily detected to the south-west, at a position ∼0.25arcsec from the kinematic centre, while the emission-line gas to thenorth-east is predominantly rotating.
Finally, as previously mentioned, the coincidence between thewidth of the non-rotating component and the total velocity variationin the rotating one did not allow us to perform double Gaussian fitsto the Hα and [N II] lines in all the apertures. We thus chose, fromFig. 8, the five apertures where the two components can be easilyseparated in velocity and then performed a double Gaussian fit tothe Hα profile. The results of these double Gaussian fits are used inSection 4 to estimate the gas mass and mass outflow rate. From thesefits, we obtain a mean velocity dispersion of σ ∼ 124 km s−1 forthe non-rotating component and of σ ∼ 60 km s−1 for the rotatingcomponent.
3.3 The black hole mass and accretion rate
There are no direct black hole mass measurements for ESO 153-G20. We thus use the relationship of Gultekin et al. (2009) to
MNRAS 489, 4111–4124 (2019)
Dow
nloaded from https://academ
ic.oup.com/m
nras/article/489/3/4111/5571294 by guest on 23 January 2022

4118 P. Soto-Pinto et al.
Figure 6. Maps of the line ratios [N II]/Hα, [O III]/Hβ, Hα/Hβ and [S II]6716/[S II]6730. Each panel follows the colour bar on top, and the white crosses markthe stellar kinematic centre.
Figure 7. Position–velocity diagrams of the strongest emission lines: Hα + [N II] and [O III]. The PA of the simulated slit is indicated at the top of each setof panels (the major axis is at PA = 11◦). The dashed–dot black lines show the velocities obtained from the single Gaussian fit, the solid green line representsthe best bar-perturbation model (see Section 4), the purple diamonds correspond to the [N II] ‘by-eye’ rotation model, and the white asterisks are the stellarrotation model. The colour bars on the right of each panel have units of 10−15 erg cm−2 s−1 Å−1 arcsec−2.
estimate the black hole mass via the central velocity dispersion:
MBH
108 M�= (1.312 ± 0.08)
(σ
200 km s−1
)4.24±0.41
. (2)
Using the summed spectrum of our data cube and PPXF, wefind that the stellar velocity dispersion is 190 km s−1, whichimplies a black hole mass of MBH ≈ (1.1 ± 0.1) × 108 M� usingequation (2).
We also estimated the accretion rate on to the black hole using
Macc = Lbol
c2η, (3)
where η is the conversion efficiency of the rest mass energy of theaccreted material into radiation, typically assumed to be η = 0.1for Seyfert galaxies (Frank, King & Raine 2002), and Lbol is thebolometric luminosity of the AGN. We follow Dumas et al. (2007)in using Lbol ≈ 90 × L[O III]. The total [O III] luminosity in our FOVis L[O III] = 3.5 × 1041 erg s−1, and thus Lbol ≈ 3.1 × 1043 erg s−1.
MNRAS 489, 4111–4124 (2019)
Dow
nloaded from https://academ
ic.oup.com/m
nras/article/489/3/4111/5571294 by guest on 23 January 2022
Outflowing gas in ESO 153-G20 4119
Figure 7 – continued
Substituting these values in equation (3), we estimate a massaccretion rate of 5.5 × 10⁻³ M� yr−1.
4 D ISCUSSION
We have presented high-resolution stellar and ionized gas kinemat-ics in the central kiloparsec of ESO 153-G20. Using single- and
double-component Gaussian fits, P-V diagrams, and spectra overselected apertures, we have argued that two velocity componentsof ionized gas coexist in the central kiloparsec. One componentrotates in (mostly) the same sense as the stars. This rotating gascomponent is clearly seen in all emission lines except [O III], wherethe two-component fit is required to tease out the weak rotatingcomponent.
MNRAS 489, 4111–4124 (2019)
Dow
nloaded from https://academ
ic.oup.com/m
nras/article/489/3/4111/5571294 by guest on 23 January 2022

4120 P. Soto-Pinto et al.
Figure 8. Normalized profiles for the [O III], Hα, [N II] and [S II] emission lines (in blue, green, magenta and orange, respectively; see text for details) inseveral 0.2-arcsec-radius apertures distributed across the FOV. The aperture position is indicated on the stellar continuum image and in each panel (as x andy offsets, in arcsec, from the nuclear position). The vertical black dashed line represents the systemic velocity of the galaxy (km s−1), and the vertical purpledotted line corresponds to the velocity predicted from the [N II] ‘by eye’ rotation model (km s−1). Spectra have been continuum-subtracted using the continuumtask from IRAF.
Figure 9. The ratio of total flux in the rotating component to total flux inthe non-rotating, zero-velocity component for the two-component fit to the[O III] and Hα emission lines. Rotating gas dominates to the north-east, andthe zero-velocity component dominates to the south-west.
The second component has a relatively large velocity dispersion(up to 125 km s−1), and its velocity is consistent with the systemicvelocity of the galaxy. While this component is seen in all emissionlines, it is strongest in the [O III] line, and it is detected in a compactregion centred at ∼0.25 arcsec south-west of the nucleus. A 2DGaussian fit to the flux distribution of the non-rotating componentin all emission lines gives a mean, almost circular, observed extent
of 1.1 FWHM; after correcting for the seeing (FWHM ∼ 0.65),we obtained an intrinsic FWHM of ∼0.8 arcsec. The ionizationstate of the gas to the south-west of the nucleus, namely spatiallycoincident with this second component, is high, and the line ratios(e.g. [O III]/Hβ > 10, see Fig. 6) are AGN-like. As noted inSection 1, earlier HST imaging of the [O III] line suggested anionization cone with PA ≈ −100◦ east of north (Schmitt et al.2003). For these reasons, we interpret the zero-velocity componentas gas in an ionization cone to the south-west of the nucleus. Thedetection of the He II λ4686 emission line at positions (1) and (2)(see Fig. 1) is a strong evidence of AGN photoionization and is alsomainly seen in the region south-west of the nucleus (see Fig. 10).
The zero-velocity component is centred on the systemic velocityof the galaxy, and has a dispersion of ∼125 km s−1. One interpreta-tion is that the large line width comes from the intrinsic dispersionof gas, and not from any bulk velocity. However, it would be difficultto explain such a large dispersion in a compact off-nuclear region.Alternatively, the gas is outflowing from the nucleus and lit up bythe ionizing radiation. In this case, the ionization cone would haveits axis along the plane of the sky, in order to give a central velocitycentred on systemic. Projection effects (given a large opening angleof the cone) and/or acceleration/deceleration along the 0.8-arcsecextent creates the observed line width. The locations of the positedionization cone to the south-west and the equivalent position to
MNRAS 489, 4111–4124 (2019)
Dow
nloaded from https://academ
ic.oup.com/m
nras/article/489/3/4111/5571294 by guest on 23 January 2022

Outflowing gas in ESO 153-G20 4121
Figure 10. Flux distribution of the He II emission line. Units are in 10−15
erg cm−2 s−1 Å−1 arcsec−2. The panel follows the colour bar on its right,and the axes (in arcsec) are relative to the stellar kinematic centre indicatedby the black cross. The solid (dashed) line indicates the major (minor) axis.The near and far sides of the disc are indicated.
the north-east where we would expect the counter-cone are markedwith red circles in the structure map (Fig. 1). Clearly, the predictedlocation of the counter-cone is coincident with a strong dust laneseen on the near side of the galaxy disc. Extinction resulting fromthis dust lane would explain the lack of detection of the counter-cone.
The interpretation of an ionization cone to the south-west withan obscured counter-cone to the north-east is supported by thedispersion seen in the Hα and Hβ lines (Section 3.2.1). The visibleionization cone to the south-west contributes to the Hα and Hβ
emission profiles. This, together with the rotating gas componentin these lines, produces high-velocity dispersions to the south-west.Because the north-east ionization cone is obscured, the Hα andHβ dispersions to the north-east reflect only the dispersion of therotating component and thus, the values in this direction are lower.The higher value of ‘dispersion’ seen towards the nucleus canbe explained as being due to the high (solid-body) rotation-curvegradient in this region. Dust in the nucleus would also explainthe offset between the kinematic centre and the radius at whichthe south-west ionization cone is first detected (∼ 96 pc). To fullyobscure the counter-cone by the near side of the galaxy then requiresthat the half-opening angle of the cone is ≤ 40◦, given that the galaxydisc has an inclination of 51◦. This value is in agreement with theopening angle derived by Schmitt et al. (2003). If an opening angleof 40◦ is assumed, then the line width of the zero-component wouldimply that the true outflow velocity is v ≈ 400 km s−1, althoughthis would be higher if a smaller opening angle were used.
An alternative explanation for the high velocities seen in the sec-ond component is an outflow produced by an off-nuclear starburst.We extracted aperture spectra from the two regions marked withthe red circles in the structure map (Fig. 1), namely the locations
of the posited ionization cone and the unseen counter-cone. Fits tothese two spectra with PPXF show that the stellar templates usedin both cases are very similar in terms of stellar population ages.That is, while both require a relatively large fraction of young stars,there is no strong evidence that one is significantly younger thanthe other. Gonzalez Delgado, Heckman & Leitherer (2001) studiedthe relation of gas excitation and starburst processes in a sample of20 Seyfert 2 galaxies by analysing their near-ultraviolet (lookingfor high-order terms of the Balmer series in absorption) and opticalspectra, focusing on the nuclear and circumnuclear regions. Theyfound that the nuclei of starburst spiral galaxies have a very lowexcitation ([O III]/Hβ ≤ 1), which is not the case for the galaxy thatwe are studying. For these reasons, and because of the evidenceof AGN photoionization presented above, we disfavour a starburstorigin for the zero-velocity component.
Assuming that the zero-velocity component represents outflow-ing gas with deprojected velocity v ≈ 400 km s−1 along theionization cone, we estimated the mass outflow rate as the ratiobetween the mass of the outflowing gas and the dynamical time atthe nucleus (Mg/td). We derived the gas mass as
Mg = NempV f , (4)
where Ne is the electron density, mp is the mass of a proton, V isthe volume of the region where the outflow is detected, and f is thefilling factor, which can be estimated from
LHα ∼ f N2e jHα(T )V , (5)
where jHα(T) = 3.534 × 10⁻²⁵ erg cm−3 s−1 (Osterbrock 1989) andLHα is the Hα luminosity emitted by a volume V.
Substituting equation (5) into equation (4), we obtain
Mg = mp LHα
Ne jHα(T ). (6)
Considering a luminosity distance of 80.7 Mpc, the Hα lumi-nosity derived from the whole FOV (LHα ≈ 2.3 × 1041 erg s−1),and Ne = 960 cm−3 (the mean value for the electron density withinthe inner 0.8 arcsec centred on the outflow peak), we obtain Mg ≈6 × 10⁵ M�. From the double Gaussian fit we performed in selectedapertures (see Section 3.2.2), we concluded that almost 70 per centof the Hα emission comes from the non-rotating component, that is,from a mass of ∼4 × 10⁵ M�. The dynamical time can be estimatedfrom the ratio between the extent of the region over which we detectthe outflow (0.8 arcsec ≈ 308 pc) and the velocity of the outflow(taken to be ∼400 km s−1). This gives td ≈ 7.5 × 10⁵ yr, and thusthe mass outflow rate is Mout ∼ 5.4 × 10⁻¹ M� yr−1. This valueshould then be doubled, Mout ∼ 1.1 M� yr−1, to account for thesecond, invisible, ionization cone. This outflow rate is ∼200 timesthe estimated accretion rate on to the SMBH in ESO 153-G20(Section 3.3).We also estimated the kinetic power of the outflow using theexpression from section 4.2 in Humire et al. (2018). However,we neglected the velocity dispersion term. This is because ofthe difficulties in separating the multiple components: we cannotdistinguish what fraction of the total line width comes from bulkvelocity projection effects or from intrinsic dispersion in the gas(although the former is likely to dominate). We derived a kineticpower of Eout = 5.4 × 1040 erg s−1. Comparing this with thebolometric luminosity (Lbol = 3.1 × 1043 erg s−1; Section 3.3),we obtain Eout/Lbol ≈ 1.7 × 10⁻³.
Another notable kinematic feature is the presence of S-shapedisovelocity contours in the gas velocity maps, most prominent in theHα and [N II] emission lines. These features are often seen in barred
MNRAS 489, 4111–4124 (2019)
Dow
nloaded from https://academ
ic.oup.com/m
nras/article/489/3/4111/5571294 by guest on 23 January 2022

4122 P. Soto-Pinto et al.
galaxies, and have been explained as perturbations produced by thebar (Bosma 1978; Schommer et al. 1988; Moore & Gottesman 1998;Combes et al. 2002; Fuentes-Carrera et al. 2019). Because ESO 153-G20 shows clear evidence of a bar (RC3; Schmitt & Kinney 2000)we briefly explore the kinematic signature expected using the linearperturbation analysis outlined in Finlez et al. (2018). Briefly, then,this procedure starts with an unperturbed rotation curve based on themass of the galaxy disc, the photometric parameters of the galaxy(disc and bar PAs, and bar ellipticity) and uses linear perturbationanalysis (Wong, Blitz & Bosma 2004; Fathi et al. 2005; van deVen & Fathi 2010) to predict the velocity field expected for differentvalues of bar pattern speed and ‘damping’ (which simulates a radialfrictional force). We thus first created an unperturbed velocity field,based on an exponential disc with a total disc mass of Md =1 × 10¹¹ M� and a disc scale-length of rd = 1 kpc. This initialconfiguration did not converge properly to a solution owing to thefact that our kinematical centre is not located at the geometriccentre of the image. Because of this issue, we chose ‘by eye’ thevalues of Md and rd by comparison with the Hα velocity field,obtaining Md = 1.2 × 10¹⁰ M� and rd = 0.46 kpc. We assumedPAdisc = 11◦, PAbar = 126◦ (as obtained from the I-band image inSchmitt & Kinney 2000), and a bar ellipticity ε = 0.4 (the meanvalue obtained by modelling the WFPC2-HST image from Fig. 1with GALFIT, Peng et al. 2002, and DISKFIT, Spekkens & Sellwood2007; Sellwood & Sanchez 2010). We perturbed this model, creatinga matrix of velocity fields by varying the bar-pattern speed ( p) overthe range 20 to 300 km s−1 kpc−1 and the damping factor (λ) overthe range 0.01 to 0.4.
None of the perturbed models exactly reproduces the S-shapedkinematic pattern seen in the Hα and [N II] emission lines. Wetherefore did not proceed to the next step of minimizing residualsand thus determining the best-fitting bar-perturbation model andits associated parameters. However, some of the perturbed mapsdid produce roughly the kinematic morphology observed. We showfour examples of these ‘roughly matching’ bar-perturbed models inFig. 11. Of the four, the one with p = 250 and λ= 0.07 most closelyresembles the observed velocity field, and we plotted its predictedvelocities in the P-V diagrams in Section 3.2.2. Effectively, while wecannot exactly reproduce the distortions in the rotating componentof the emission-line gas, it is most likely that these are due toperturbations induced by the bar. Unfortunately, this complicationmeans that we are unable to further analyse the rotation-componentvelocity field for signatures of streaming inflows. The major limitingfactor in this analysis is the modest extent of our FOV.
5 C O N C L U S I O N S
We have observed the inner 1.4 × 1.9 kpc2 of the Seyfert 2 galaxyESO 153-G20 using the GMOS integral field spectrograph on theGemini South Telescope, at a spatial resolution of �r ≈ 250 pcand covering the wavelength range 4110–7280 Å at a spectralresolution of σ inst ≈ 36 km s−1. This allowed the detection ofprominent emission lines (Hβ, [O III] λλ4959, 5007, Hα + [N II]λλ6548, 6583, [S II] λλ6716, 6731), and the derivation of thegaseous and stellar kinematics. One- and two-component Gaussianfits, aperture spectra, and P-V diagrams were used to obtain spatiallyresolved fluxes, radial velocities and velocity dispersions, and toanalyse the kinematics. The main results are as follows.
(i) The stellar velocity field traces circular rotation with the line ofnodes oriented at PA ≈ 11◦ and reaching amplitudes of ± 96 km s−1.
Figure 11. Example velocity field models obtained by adding ‘bar-perturbations’ to an axisymmetric rotation curve. The bar and disc PA,bar ellipticity, and disc mass were fixed to values measured for ESO153-G20, while the bar-pattern speed ( p) and damping factor (λ) were varied(see text). Each panel lists the values of p (in km s−1kpc−1) and λ, andits colours follow the bar on the right. We show only four selected models,which are the most reminiscent of the observed velocity fields. The dashedline shows the PA of the bar (126◦).
(ii) Dust obscuration seen in the structure map and the assump-tion of trailing spiral arms indicate that the near side of the galaxydisc is to the east.
(iii) Single and double Gaussian fits, aperture spectra, and P-Vdiagrams reveal that all emission lines have two kinematic com-ponents: a rotating component that follows the stellar kinematics,and a higher-dispersion zero-velocity component, with its brightestemission seen as a 0.8-arcsec (308-pc) diameter region centred ata projected distance of 0.25 arcsec (∼96 pc) south-west of thenucleus. We interpret this region as due to an outflow observedalong an ionization cone in the plane of the sky.
(iv) High [O III]/Hβ ratios (>10) are seen towards the region inwhich most of the zero-velocity component is found, consistent alsowith gas illuminated by an AGN ionization cone. The equivalentaperture on the other side of the nucleus shows significantly lowervalues (<4), indicating emission from gas with lower excitation.In fact, this latter aperture falls on a prominent dust lane on thenear side of the galaxy disc. We speculate that the compact counter-cone is obscured by this dust lane, and that the base of the visibleionization cone is also obscured by dust.
(v) Given that the velocity of the outflowing component is closeto zero (systemic velocity), and that the counter-cone seems to bebehind the galaxy plane on its east side, we posit that the ionizationcone has an axis in the plane of the sky and a half-opening angle of≤ 40◦. The outflowing gas has bulk velocity v ≈ 400 km s−1 along
MNRAS 489, 4111–4124 (2019)
Dow
nloaded from https://academ
ic.oup.com/m
nras/article/489/3/4111/5571294 by guest on 23 January 2022

Outflowing gas in ESO 153-G20 4123
the ionization cones, and the line width is produced primarily byprojection effects.
(vi) Assuming a bi-conical outflow, with one side invisible owingto obscuration, a mass outflow rate Mout ≈ 1.1 M� yr−1 is obtainedfor ESO 153-G20. This value is significantly higher (∼200 times)than the accretion rate necessary to support the AGN luminosity.
(vii) Perturbations produced by the bar are a likely explanationfor the S-shape observed in the Hα velocity field, although ourlinear perturbation models fail to exactly reproduce this S-shape.
AC K N OW L E D G E M E N T S
This work is based on observations obtained at the Gemini Ob-servatory, which is operated by the Association of Universitiesfor Research in Astronomy, Inc., under a cooperative agreementwith the NSF on behalf of the Gemini partnership: the NationalScience Foundation (USA), National Research Council (Canada),CONICYT (Chile), Ministerio de Ciencia, Tecnologıa e Inno-vacion Productiva (Argentina), Ministerio da Ciencia, Tecnologia eInovacao (Brazil), and Korea Astronomy and Space Science Insti-tute (Republic of Korea). NN acknowledges support from Conicyt(PIA ACT172033, Fondecyt 1171506 and BASAL AFB-170002).RAR acknowledges support from FAPERGS (project no. 16/2551-0000251-7) and CNPq (project N0. 303373/2016-4). DM grate-fully acknowledges support from CONICYT-PFCHA/DoctoradoNacional/2019-21191543.
RE FERENCES
Allington-Smith J. et al., 2002, PASP, 114, 892Begelman M. C., Blandford R. D., Rees M. J., 1984, Rev. Mod. Phys., 56,
255Bertola F., Bettoni D., Danziger J., Sadler E., Sparke L., de Zeeuw T., 1991,
ApJ, 373, 369Bosma A., 1978, PhD thesis, Groningen UniversityButa R., 1995, ApJS, 96, 39Buta R., Crocker D. A., 1991, AJ, 102, 1715Buta R., Crocker D. A., 1993, AJ, 105, 1344Cappellari M., 2017, MNRAS, 466, 798Cappellari M., Copin Y., 2003, MNRAS, 342, 345Cappellari M., Emsellem E., 2004, PASP, 116, 138Combes F., Boisse P., Mazure A., Blanchard A., Seymour M., 2002, Galaxies
and Cosmology. Springer, New YorkCombes F. et al., 2013, A&A, 558, A124da Costa L. N., Pellegrini P. S., Davis M., Meiksin A., Sargent W. L. W.,
Tonry J. L., 1991, ApJS, 75, 935Davies R. I., Maciejewski W., Hicks E. K. S., Tacconi L. J., Genzel R., Engel
H., 2009, ApJ, 702, 114de Grijp M. H. K., Lub J., Miley G. K., 1987, A&AS, 70, 95de Vaucouleurs G., de Vaucouleurs A., Corwin H. G., Jr, Buta R. J., Paturel
G., Fouque P., 1991, Third Reference Catalogue of Bright Galaxies.Volume I: Explanations and References. Volume II: Data for Galaxiesbetween 0h and 12h. Volume III: Data for Galaxies between 12h and24h. Springer, New York
Dumas G., Mundell C. G., Emsellem E., Nagar N. M., 2007, MNRAS, 379,1249
Emsellem E., Fathi K., Wozniak H., Ferruit P., Mundell C. G., SchinnererE., 2006, MNRAS, 365, 367
Englmaier P., Shlosman I., 2004, ApJ, 617, L115Erwin P., Sparke L. S., 1999, ApJ, 512, L37Falcon-Barroso J., Sanchez-Blazquez P., Vazdekis A., Ricciardelli E.,
Cardiel N., Cenarro A. J., Gorgas J., Peletier R. F., 2011, A&A, 532,A95
Fathi K., Storchi-Bergmann T., Riffel R. A., Winge C., Axon D. J., RobinsonA., Capetti A., Marconi A., 2006, ApJ, 641, L25
Fathi K., van de Ven G., Peletier R. F., Emsellem E., Falcon-Barroso J.,Cappellari M., de Zeeuw T., 2005, MNRAS, 364, 773
Finlez C., Nagar N. M., Storchi-Bergmann T., Schnorr-Muller A., Riffel R.A., Lena D., Mundell C. G., Elvis M. S., 2018, MNRAS, 479, 3892
Frank J., King A., Raine D. J., 2002, Accretion Power in Astrophysics, 3rdedn. Cambridge University Press, Cambridge, UK
Freitas I. C. et al., 2018, MNRAS, 476, 2760Fuentes-Carrera I. et al., 2019, A&A, 621, A25Garcıa-Burillo S. et al., 2015, A&A, 580, A35Garcıa-Burillo S. et al., 2017, A&A, 608, A56Gonzalez Delgado R. M., Heckman T., Leitherer C., 2001, ApJ, 546, 845Gultekin K. et al., 2009, ApJ, 698, 198Hamuy M., Suntzeff N. B., Heathcote S. R., Walker A. R., Gigoux P., Phillips
M. M., 1994, PASP, 106, 566Hamuy M., Walker A. R., Suntzeff N. B., Gigoux P., Heathcote S. R., Phillips
M. M., 1992, PASP, 104, 533Hook I. M., Jørgensen I., Allington-Smith J. R., Davies R. L., Metcalfe N.,
Murowinski R. G., Crampton D., 2004, PASP, 116, 425Humire P. K. et al., 2018, A&A, 614, A94Kauffmann G. et al., 2003, MNRAS, 346, 1055Kewley L. J., Groves B., Kauffmann G., Heckman T., 2006, MNRAS, 372,
961Knapen J. H., 2005, Gravitationally Induced Inflow in Starbursts and AGN.
Springer Netherlands, Dordrecht, p. 85Kormendy J., Ho L. C., 2013, ARA&A, 51, 511Krajnovic D., Cappellari M., de Zeeuw P. T., Copin Y., 2006, MNRAS, 366,
787Krist J. E., Hook R. N., Stoehr F., 2011, Proceedings of the SPIE, 20 years
of Hubble Space Telescope optical modeling using Tiny Tim. p. 81270JLauberts A., 1982, ESO/Uppsala Survey of the ESO(B) Atlas. European
Southern Observatory (ESO), GarchingLauberts A., Valentijn E. A., 1989, The Surface Photometry Catalogue
of the ESO-Uppsala Galaxies, European Southern Observatory (ESO),Garching
Lena D., Robinson A., Storchi-Bergmann T., Couto G. S., Schnorr-MullerA., Riffel R. A., 2016, MNRAS, 459, 4485
Lena D. et al., 2015, ApJ, 806, 84Lynden-Bell D., 1969, Nature, 223, 690Moore E. M., Gottesman S. T., 1998, MNRAS, 294, 353Munoz-Vergara D. et al., 2019, MNRAS, 487, 3679Osterbrock D. E., 1989, Astrophysics of Gaseous Nebulae and Active
Galactic Nuclei. University Science Books, USAPaturel G., Petit C., Prugniel P., Theureau G., Rousseau J., Brouty M.,
Dubois P., Cambresy L., 2003, A&A, 412, 45Peng C. Y., Ho L. C., Impey C. D., Rix H.-W., 2002, AJ, 124, 266Pogge R. W., Martini P., 2002, ApJ, 569, 624Ramakrishnan V. et al., 2019, MNRAS, 487, 444Repetto P., Faundez-Abans M., Freitas-Lemes P., Rodrigues I., de Oliveira-
Abans M., 2017, MNRAS, 464, 293Riffel R. A., 2010, Ap&SS, 327, 239Riffel R. A., Storchi-Bergmann T., Riffel R., 2015, MNRAS, 451, 3587Rosario D. J., Whittle M., Nelson C. H., Wilson A. S., 2010, MNRAS, 408,
565Sarzi M., Rix H.-W., Shields J. C., Ho L. C., Barth A. J., Rudnick G.,
Filippenko A. V., Sargent W. L. W., 2005, ApJ, 628, 169Schmitt H. R., Donley J. L., Antonucci R. R. J., Hutchings J. B., Kinney A.
L., 2003, ApJS, 148, 327Schmitt H. R., Kinney A. L., 2000, ApJS, 128, 479Schnorr-Muller A., Storchi-Bergmann T., Nagar N. M., Ferrari F., 2014b,
MNRAS, 438, 3322Schnorr-Muller A., Storchi-Bergmann T., Nagar N. M., Robinson A., Lena
D., Riffel R. A., Couto G. S., 2014a, MNRAS, 437, 1708Schnorr Muller A., Storchi-Bergmann T., Riffel R. A., Ferrari F., Steiner J.
E., Axon D. J., Robinson A., 2011, MNRAS, 413, 149Schommer R. A., Caldwell N., Wilson A. S., Baldwin J. A., Phillips M. M.,
Williams T. B., Turtle A. J., 1988, ApJ, 324, 154Sellwood J. A., Sanchez R. Z., 2010, MNRAS, 404, 1733Shlosman I., Begelman M. C., Frank J., 1990, Nature, 345, 679
MNRAS 489, 4111–4124 (2019)
Dow
nloaded from https://academ
ic.oup.com/m
nras/article/489/3/4111/5571294 by guest on 23 January 2022

4124 P. Soto-Pinto et al.
Simoes Lopes R. D., Storchi-Bergmann T., de Fatima Saraiva M., MartiniP., 2007, ApJ, 655, 718
Skrutskie M. F. et al., 2006, AJ, 131, 1163Slater R. et al., 2019, A&A, 621, A83Spekkens K., Sellwood J. A., 2007, ApJ, 664, 204Storchi-Bergmann T., Dors O. L., Jr., Riffel R. A., Fathi K., Axon D. J.,
Robinson A., Marconi A., Ostlin G., 2007, ApJ, 670, 959Sanchez-Blazquez P. et al., 2006, MNRAS, 371, 703van de Ven G., Fathi K., 2010, ApJ, 723, 767
van Dokkum P. G., Bloom J., Tewes M., 2012, L.A.Cosmic: LaplacianCosmic Ray Identification. Astrophysics Source Code Library, recordascl:1207.005
Vazdekis A., Sanchez-Blazquez P., Falcon-Barroso J., Cenarro A. J., BeasleyM. A., Cardiel N., Gorgas J., Peletier R. F., 2010, MNRAS, 404, 1639
Wong T., Blitz L., Bosma A., 2004, ApJ, 605, 183
This paper has been typeset from a TEX/LATEX file prepared by the author.
MNRAS 489, 4111–4124 (2019)
Dow
nloaded from https://academ
ic.oup.com/m
nras/article/489/3/4111/5571294 by guest on 23 January 2022