REVERBERATION MAPPING MEASUREMENTS OF BLACK HOLE MASSES IN SIX LOCAL SEYFERT GALAXIES
52
arXiv:1006.4160v1 [astro-ph.CO] 21 Jun 2010 Reverberation Mapping Measurements of Black Hole Masses in Six Local Seyfert Galaxies K. D. Denney 1 , B. M. Peterson 1,2 , R. W. Pogge 1,2 , A. Adair 3 , D. W. Atlee 1 , K. Au-Yong 3 , M. C. Bentz 1,4,5 , J. C. Bird 1 , D. J. Brokofsky 6,7 , E. Chisholm 3 , M. L. Comins 1,8 , M. Dietrich 1 , V. T. Doroshenko 9,10,11 , J. D. Eastman 1 , Y. S. Efimov 10 , S. Ewald 3 , S. Ferbey 3 , C. M. Gaskell 6,12 , C. H. Hedrick 6,8 , K. Jackson 3 , S. A. Klimanov 10,11 , E. S. Klimek 6,13 , A. K. Kruse 6,14 , A. Lad´ eroute 3 , J. B. Lamb 15 , K. Leighly 16 , T. Minezaki 17 , S. V. Nazarov 10,11 , C. A. Onken 18,19 , E. A. Petersen 6 , P. Peterson 20 , S. Poindexter 1 , Y. Sakata 21 , K. J. Schlesinger 1 , S. G. Sergeev 10,11 , N. Skolski 3 , L. Stieglitz 3 , J. J. Tobin 15 , C. Unterborn 1 , M. Vestergaard 22,23 , A. E. Watkins 6 , L. C. Watson 1 , and Y. Yoshii 17
-
Upload
independent -
Category
Documents
-
view
0 -
download
0
Transcript of REVERBERATION MAPPING MEASUREMENTS OF BLACK HOLE MASSES IN SIX LOCAL SEYFERT GALAXIES
arX
iv:1
006.
4160
v1 [
astr
o-ph
.CO
] 2
1 Ju
n 20
10
Reverberation Mapping Measurements of Black Hole Masses in
Six Local Seyfert Galaxies
K. D. Denney1, B. M. Peterson1,2, R. W. Pogge1,2, A. Adair3, D. W. Atlee1, K. Au-Yong3,
M. C. Bentz1,4,5, J. C. Bird1, D. J. Brokofsky6,7, E. Chisholm3, M. L. Comins1,8,
M. Dietrich1, V. T. Doroshenko9,10,11, J. D. Eastman1, Y. S. Efimov10, S. Ewald3,
S. Ferbey3, C. M. Gaskell6,12, C. H. Hedrick6,8, K. Jackson3, S. A. Klimanov10,11,
E. S. Klimek6,13, A. K. Kruse6,14, A. Laderoute3, J. B. Lamb15, K. Leighly16, T. Minezaki17,
S. V. Nazarov10,11, C. A. Onken18,19, E. A. Petersen6, P. Peterson20, S. Poindexter1,
Y. Sakata21, K. J. Schlesinger1, S. G. Sergeev10,11, N. Skolski3, L. Stieglitz3, J. J. Tobin15,
C. Unterborn1, M. Vestergaard22,23, A. E. Watkins6, L. C. Watson1, and Y. Yoshii17
– 2 –
1Department of Astronomy, The Ohio State University, 140 West 18th Avenue, Columbus, OH 43210,
USA; [email protected]
2Center for Cosmology and AstroParticle Physics, The Ohio State University, 191 West Woodruff Avenue,
Columbus, OH 43210, USA
3Centre of the Universe, Herzberg Institute of Astrophysics, National Research Council of Canada, 5071
West Saanich Road, Victoria, BC V9E 2E7, Canada
4Present address: Department of Physics and Astronomy, 4129 Frederick Reines Hall, University of
California at Irvine, Irvine, CA 92697-4575, USA
5Hubble Fellow
6Department of Physics & Astronomy, University of Nebraska, Lincoln, NE 68588-0111, USA.
7Deceased, 2008 September 13
8Current address: Astronomy and Astrophysics Department, Pennsylvania State University, 525 Davey
Laboratory, University Park, PA 16802, USA
9Crimean Laboratory of the Sternberg Astronomical Institute, p/o Nauchny, 98409 Crimea, Ukraine
10Crimean Astrophysical Observatory, p/o Nauchny, 98409 Crimea, Ukraine
11Isaak Newton Institute of Chile, Crimean Branch, Ukraine
12Current address: Astronomy Department, University of Texas, Austin, TX 78712-0259, USA
13Current address: Astronomy Department, MSC 4500, New Mexico State University, PO BOX 30001,
La Cruces, NM 88003-8001, USA
14Current address: Physics Department, University of Wisconsin-Madison, 1150 University Avenue, Madi-
son, WI 53706-1390, USA
15Department of Astronomy, University of Michigan, 500 Church St., Ann Arbor, MI 48109-1040, USA
16Homer L. Dodge Department of Physics and Astronomy, The University of Oklahoma, 440 W. Brooks
St., Norman, OK 73019, USA
17Institute of Astronomy, School of Science, University of Tokyo, 2-21-1 Osawa, Mitaka, Tokyo 181-0015,
Japan
18Plaskett Fellow; Dominion Astrophysical Observatory, Herzberg Institute of Astrophysics, National Re-
search Council of Canada, 5071 West Saanich Road, Victoria, BC V9E 2E7, Canada
19Current address: Mount Stromlo Observatory, Research School of Astronomy & Astrophysics, The
Australian National University, Cotter Road, Weston Creek, ACT 2611, Australia
20Ohio University, Department of Physics and Astronomy, Athens, OH 45701-2979, USA
21Department of Astronomy, School of Science, University of Tokyo, 7-3-1 Hongo, Bunkyo-ku, Tokyo
113-0013, Japan
22Steward Observatory, The University of Arizona, 933 North Cherry Avenue, Tucson, AZ 85721, USA

– 3 –
ABSTRACT
We present the final results from a high sampling rate, multi-month, spec-
trophotometric reverberation mapping campaign undertaken to obtain either
new or improved Hβ reverberation lag measurements for several relatively low-
luminosity AGNs. We have reliably measured the time delay between variations
in the continuum and Hβ emission line in six local Seyfert 1 galaxies. These mea-
surements are used to calculate the mass of the supermassive black hole at the
center of each of these AGNs. We place our results in context to the most cur-
rent calibration of the broad-line region (BLR) RBLR–L relationship, where our
results remove outliers and reduce the scatter at the low-luminosity end of this
relationship. We also present velocity-resolved Hβ time delay measurements for
our complete sample, though the clearest velocity-resolved kinematic signatures
have already been published.
Subject headings: galaxies: active — galaxies: nuclei — galaxies: Seyfert
1. INTRODUCTION
The technique of reverberation mapping (Blandford & McKee 1982; Peterson 1993) has
been used to directly measure black hole masses in relatively local broad-line (Type 1)
AGNs for over two decades (see compilation by Peterson et al. 2004). In recent years,
these measurements have become particularly desirable with the increasingly strong evi-
dence (both observational and theoretical) that there is a connection between supermassive
black hole (BH) growth and galaxy evolution (e.g., Silk & Rees 1998; Kormendy & Gebhardt
2001; Haring & Rix 2004; Di Matteo et al. 2005; Bennert et al. 2008; Somerville et al. 2008;
Hopkins & Hernquist 2009; Shankar et al. 2009). Empirical relationships have been dis-
covered for both quiescent and active galaxies that show similar correlations between the
central BH and properties of the bulge of the host galaxy (well outside the gravitational
sphere of influence of the black hole). Examples include correlations between the BH
mass and total luminosity of stars in the galactic bulge — the MBH–Lbulge relationship
(Kormendy & Richstone 1995; Magorrian et al. 1998; Wandel 2002; Graham 2007; Bentz et al.
2009a) — and between BH mass and the bulge stellar velocity dispersion — the MBH–
σ⋆ relationship (Ferrarese & Merritt 2000; Gebhardt et al. 2000a,b; Ferrarese et al. 2001;
Tremaine et al. 2002; Onken et al. 2004; Nelson et al. 2004).
23Dark Cosmology Centre, Niels Bohr Institute, Copenhagan University
– 4 –
The current thrust to better understand this BH-galaxy connection relies on mass mea-
surements of large samples of black holes in both the local and distant Universe. The
masses of BHs in distant galaxies can only be measured indirectly using the scaling relation-
ships mentioned above, as well as the AGN RBLR–L relationship (Kaspi et al. 2000, 2005;
Bentz et al. 2006, 2009b), which provides the capability to estimate BH masses from a single
spectrum of an AGN (Wandel et al. 1999). In order to understand the evolution of BH and
galaxy growth over cosmological times, it is useful to compare the location of distant galaxies
on these relationships with local samples. This can only be done by calibrating the local
relation with direct BH mass measurements.
Local masses are measured directly in quiescent galaxies using dynamical methods (see
Kormendy & Richstone 1995; Kormendy & Gebhardt 2001; Ferrarese & Ford 2005, for re-
views) that rely on resolving the motions of gas and stars within the sphere of influence of
the central BH and are thus very resolution intensive and only applicable in the nearby Uni-
verse. Direct measurements can also be made from observations of megamasers sometimes
seen in Type 2 AGNs, but making these observations relies on a particular viewing angle into
the nuclear region of these galaxies and is thus not applicable to large numbers of objects.
Direct mass measurements can also be made in Type 1 AGNs using reverberation mapping,
which is a method that relies on time resolution to trace the light-travel time delay between
continuum and broad emission-line flux variations to measure the characteristic size of the
broad line region (BLR). Using virial arguments, this size is related to the black hole mass
through the velocity dispersion of the BLR gas, determined from the broad emission-line
width. Although reverberation mapping is technically applicable at all redshifts, the rever-
beration time-delay scales with the AGN luminosity (i.e., the RBLR–L relationship), and this
coupled with time dilation effects make it difficult and particularly time-consuming to make
such measurements out to high redshift (see Kaspi et al. 2007).
The constraints for making direct BH mass measurements at large distances make the
use of the RBLR–L relationship particularly attractive for obtaining even indirect mass es-
timates at all redshifts for which a broad-line AGN spectrum can be obtained. In addi-
tion, masses can be estimated for large samples of objects (e.g., McLure & Dunlop 2004;
Kollmeier et al. 2006; Salviander et al. 2007; Shen et al. 2008; Vestergaard et al. 2008), fa-
cilitating studies of the BH-galaxy connection and its evolution across cosmic time (e.g.,
Salviander et al. 2007; Vestergaard & Osmer 2009). However, in order to reliably apply
these relationships to high redshift objects and determine any evolution in the relationships
themselves, local versions of the relationships need to be well-populated with high-quality
data, so that calibration of these local relationships is secure (i.e., observational scatter min-
imized) and any intrinsic scatter is well characterized (see, e.g., Bentz et al. 2006, 2009a,b;
Graham 2007; Gultekin et al. 2009; Woo et al. 2010, for recent efforts to improve scaling

– 5 –
relation calibration and characterization of intrinsic scatter). Furthermore, systematic un-
certainties also need to be understood and minimized so that the local relations, on which all
other related studies are based, are as robust as possible. For instance, systematic uncertain-
ties are present in the direct, dynamical mass measurements of the BHs in quiescent galaxies
due to model-dependencies of the mass derivation (e.g., Gebhardt & Thomas 2009 find more
than a factor of two difference in the measured BH mass in M87 when they include a dark
matter halo in their model; see also Shen & Gebhardt 2010 and van den Bosch & de Zeeuw
2010 for more recent model-dependent changes made to previously measured quiescent black
hole masses that change the masses by similar amounts, i.e., factors of ∼2). On the other
hand, the reverberation-based masses as we present them (measuring simply the mean BLR
radius from the reverberation time-delay) do not rely on any physical models; instead, the
largest systematic uncertainty comes from the additional zero-point calibration of the mass
scale (Woo et al. 2010). This calibration is needed due to a number of uncertainties, such
as the relationship between the line-of-sight (LOS) velocity dispersion measured from the
broad-line width and the actual velocity dispersion of the BLR, systematic effects in deter-
mining the effective radius, and the role of non-gravitational forces.
In this work, we present new reverberation-mapping measurements of the BLR radius
and black hole mass for several nearby Seyfert galaxies from an intensive spectroscopic
and photometric monitoring program. The goals of this program are (1) to improve the
calibration of local scaling relationships by populating them with not only additional high-
quality measurements, but also replace previous measurements of either poor quality or that
were suspect for one reason or another, and (2) to take the method of reverberation mapping
one step past its currently successful application of measuring BLR radii and BH masses
to uncover velocity-resolved structure in the reverberation delays from the Hβ emission
line. This velocity-resolved analysis is a first step towards recovering velocity-dependent Hβ
transfer functions, or “velocity–delay maps”, which describe the response of the emission-line
to an outburst from the ionizing continuum as a function of LOS velocity and light-travel
time-delay (for a tutorial, see Peterson 2001; Horne et al. 2004). Creation of velocity–delay
maps provides valuable knowledge of the structure, inclination, and kinematics of the BLR,
which in turn will reduce systematic uncertainties in reverberation-based black hole mass
measurements.
Our monitoring program spanned more than four months, over which primary spectro-
scopic observations were obtained nightly (weather permitting) for the first three months
at MDM Observatory. Supplementary observations were gathered from other observatories
around the world. Objects in our sample were targeted because (a) they had short enough
expected lags (i.e., low enough luminosity) that we were likely to see sufficient variability
over the course of our ∼3–4 month campaign to securely measure a reverberation time delay,

– 6 –
(b) they appeared as outliers on AGN scaling relationships and/or had large uncertainties
associated with previous results due to suspected undersampling or other complications, and
(c) previous observations demonstrated the potential for our high sampling-rate observations
to uncover a velocity-resolved line response to the continuum variations. We also note that
some of the AGNs observed in this program are among the closest AGNs and are therefore
the best candidates for measuring the central black hole masses by other direct methods
such as modeling of stellar or gas dynamics, which will allow a direct comparison of mass
measurements from multiple independent techniques. This paper is arranged such that we
present our observations and analysis in Section 2, the black hole mass measurements are
described in Section 3, any velocity-resolved structures that we uncovered are presented in
Section 4, and our results are discussed in Section 5.
2. Observations and Data Analysis
Except where noted, data acquisition and analysis practices employed here follow closely
those laid out by Denney et al. (2009b) for the first results from this campaign on NGC4051.
The reader is also referred to similar previous works, such as Denney et al. (2006) and
Peterson et al. (2004), for additional details and discussions on these practices. Throughout
this work, we assume the following cosmology: Ωm = 0.3, ΩΛ = 0.70, and H0 = 70 km sec−1
Mpc−1.
2.1. Spectroscopy
Spectra of the nuclear region of our complete1 sample (see Table 1) were obtained daily
(weather permitting) over 89 consecutive nights in Spring 2007 with the 1.3 m McGraw–Hill
telescope at MDM Observatory, and supplemental spectroscopic observations of most tar-
gets were obtained with the 2.6 m Shajn telescope of the Crimean Astrophysical Observatory
(CrAO) and/or the Plaskett 1.8 m telescope at Dominion Astrophysical Observatory (DAO)
to extend the total campaign duration to ∼120 nights. We used the Boller and Chivens CCD
spectrograph at MDM with the 350 grooves/mm grating (i.e., a dispersion of 1.33 A/pix)
to target the Hβ λ4861 and [O iii]λλ4959, 5007 emission line region of the optical spectrum.
The position angle was set to 0, with a slit width of 5.′′0 projected on the sky, resulting in a
1We also monitored MCG08-23-067, but because this object did not vary sufficiently during our campaign,
we did not complete a full reduction and analysis of the data and do not include it as part of our final, complete
sample.

– 7 –
spectral resolution of 7.6 A across this spectral region. We acquired the CrAO spectra with
the Nasmith spectrograph and SPEC-10 1340×100 pixel CCD. For these observations a 3.′′0
slit was utilized, with a 90 position angle. Spectral wavelength coverage for this data set
was from ∼3800–6000 A, with a dispersion of 1.8 A/pix and a spectral resolution of 7.5 A
near 5100 A. The actual wavelength coverage is slightly greater than this, but the red and
blue edges of the CCD frame are unusable due to vignetting. The DAO observations of the
Hβ region were obtained with the Cassegrain spectrograph and SITe-5 CCD, where the 400
grooves/mm grating results in a dispersion of 1.1 A/pix. The slit width was set to 3.′′0 with a
fixed 90 position angle. This setup resulted in a resolution of 7.9 A around the Hβ spectral
region. Figure 1 shows the mean and rms spectra of our sample based on the MDM obser-
vations. Table 2 gives more detailed statistics of the spectroscopic observations obtained for
each target, including number of observations, time span of observations, spectral resolution,
and spectral extraction window.
A relative flux calibration of each set of spectra was performed using the χ2 goodness
of fit estimator algorithm of van Groningen & Wanders (1992) to scale relative fluxes to
the [O iii]λ5007 constant narrow-line flux. This algorithm not only makes a multiplicative
scaling to account for the night-to-night differences in flux in this line caused primarily by
aperture affects, but it also makes slight wavelength shifts to correct for zero-point differ-
ences in the wavelength calibration and small resolution corrections to account for small
variations in the line width caused by variable seeing. The best-fit calibration is found by
minimizing residuals in the difference spectrum formed between each individual spectrum
and the reference spectrum, which was taken to be the average of the best spectra of each
object (i.e., those obtained under photometric or near-photometric conditions). Because of
this multiple-component calibration method, the final, scaled [O iii]λ5007 line flux in each
spectrum is not exactly the same as the reference spectrum. Instead, there is a small stan-
dard deviation in the mean line flux due to differences in data quality that averages ∼1.2%
across our sample.
2.2. Photometry
In addition to spectral observations, we obtained supplemental V -band photometry
from the 2.0 m Multicolor Active Galactic NUclei Monitoring (MAGNUM) telescope at the
Haleakala Observatories in Hawaii, the 70 cm telescope of the CrAO, and the 0.4 m telescope
of the University of Nebraska. The number of observations obtained from each telescope and
the time span over which observations were made of each target are given in Table 3.
The MAGNUM observations were made with the multicolor imaging photometer (MIP)

– 8 –
as described by Kobayashi et al. (1998a,b), Yoshii (2002), and Kobayashi et al. (2004). Pho-
tometric fluxes were measured within an aperture with radius 8.′′3. Reduction of these ob-
servations was similar to that described for other sources by Minezaki et al. (2004) and
Suganuma et al. (2006), except the host-galaxy contribution to the flux within the aperture
was not subtracted and the filter color term was not corrected because these photometric
data were later scaled to the MDM continuum light curves (as described below). Also, minor
corrections (of order 0.01 mag or less) due to the seeing dependence of the host-galaxy flux
were ignored.
The CrAO photometric observations were collected with the AP7p CCD mounted at
the prime focus of the 70 cm telescope (f = 282 cm). In this setup, the 512 × 512 pixels
of the CCD field projects to a 15′ × 15′ field of view. Photometric fluxes were measured
within an aperture diameter of 15.′′0. For further details of the CrAO V -band observations
and reduction, see the similar analysis described by Sergeev et al. (2005).
The University of Nebraska observations were conducted by taking and separately mea-
suring a large number of one-minute images (∼20). Details of the observing and reduction
procedure are as described by Klimek et al. (2004). Comparison star magnitudes were cali-
brated following Doroshenko et al. (2005a,b) and Chonis & Gaskell (2008). To minimize the
effects of variations in the image quality, fluxes were measured through an aperture of radius
8.′′0. The errors given for each night are the errors in the means.
2.3. Light Curves
Except where noted below for individual objects, continuum and Hβ light curves were
created as followed. Continuum light curves for each object were made with the V -band
photometric observations and the average continuum flux density measured from spectro-
scopic observations over the spectral ranges listed in Table 2 (i.e., rest frame ∼5100 A).
Continuum light curves from each source were scaled to the same flux scale following the
procedure described by Denney et al. (2009b). Figure 2 (top panels) shows these merged
light curves, where measurements from each different observatory are shown by the different
symbols described in the figure caption.
Light curves of the Hβ flux were made by integrating the line flux above a linearly
interpolated continuum, locally defined by regions just blueward and redward of the Hβ
emission line. The Hβ emission line was defined between the observed frame wavelength
ranges given for each object in Table 2. The Hβ light curves formed from each separate
spectroscopic data set (i.e., MDM, CrAO, and DAO) were placed on the same flux scale

– 9 –
(i.e., that of the MDM observations) by again following the scaling procedures described by
Denney et al. (2009b). An additional flux calibration step was used for NGC3516, however,
because it has a particularly extended [O iii] narrow-line emission region. In an attempt to
decrease the uncertainties in our relative flux calibration from slit losses of this extended
emission, we made an additional correction to each MDM Hβ flux measurement to account
for possible differences in the observed [O iii]λ5007 flux due to seeing effects. To measure
the expected differences in [O iii]λ5007 flux entering the slit as a result of changes in the
nightly seeing, we followed the procedure of Wanders et al. (1992), using their artificially
seeing-degraded narrow-band image of the [O iii]λ5007 emission from the nuclear region
of NGC3516 (details regarding the narrow-band data are described by Wanders et al.).
Using the differences in measured flux, we scaled our MDM flux measurements accordingly.
We could only do this for the MDM measurements, since we do not have accurate seeing
estimates for the CrAO and DAO data sets. Because of our deliberately large aperture (see
Table 2, Column 8), the effect was not appreciable for most observations, and there is no
indication that our inability to complete the same analysis for the CrAO and DAO data had
any measurable effect on the subsequent time-series analysis. The lower panels of Figure 2
show the Hβ light curves for each object after merging the separate data sets into a single
Hβ light curve.
Before completing the time-series analysis, the light curves shown in Figure 2 were
modified in the following ways:
1. An absolute flux calibration was applied to both continuum and Hβ light curves by
scaling to the absolute flux of the [O iii]λ5007 emission line given for each object
in Column 3 of Table 4. For objects in which there was not a previously reported
absolute flux, we calculated one from the average line flux measured from only those
observations obtained at MDM under photometric conditions.
2. The host galaxy starlight contribution to the continuum flux was subtracted. This
contribution, listed for each target in Column 5 of Table 4, was determined using the
methods of Bentz et al. (2009b) for all objects except Mrk 290, which had not been
targeted for reverberation mapping prior to our observing campaign2. For Mrk 290,
we use an estimate made from the spectral decomposition (following decomposition
method “B” described by Denney et al. 2009a) of an independent spectrum taken at
MDM with nearly the same setup as our campaign observations but covering optical
2The 2008 LAMP campaign (Bentz et al. 2009c) subsequently monitored Mrk 290, and it is currently
being targeted for HST observations (GO 11662, PI Bentz) to measure its host starlight contribution, but
the observations have not yet been completed.

– 10 –
wavelengths from 3500–7150 A with a 1.′′5 slit. This value is only a lower limit, however,
since this slit width was smaller than that of our campaign observations (i.e., 5.′′0).
3. We “detrended” any light curves in which we detected long-term secular variability
over the duration of the campaign that is not associated with reverberation variations
(Welsh 1999; see also Sergeev et al. 2007, who show that there is little correlation
between long-term continuum variability and Hβ line properties, demonstrating the
independence of this variability on reverberation processes). Detrending is important
because if the time series contains long-term trends (i.e., compared to reverberation
timescales), the flux measurements are not randomly distributed about the mean and
are, thus, highly correlated on these long timescales. These long time scale correlations
then dominate the results of the cross correlation analysis that determines the time
delay, biasing the desired correlation due to reverberation. Welsh (1999) strongly
recommends removing these low-frequency trends with low order polynomials (a linear
fit at the very least) to improve the reliability of cross correlation lag determinations.
We took a conservative approach and only linearly detrended light curves in which
there was evidence for secular variability and for which the cross correlation analysis
was improved upon detrending: both light curves from Mrk 290, the Hβ light curve
fromMrk 817, and the continuum light curve from NGC3227 (see Section 2.4 for further
discussion). These fits are shown in Figure 2 for each of these respective light curves. It
was unnecessary to detrend all light curves, as no improvement in the cross correlation
analysis would result from detrending light curves that already have a relatively flat
mean flux. Also, it is not surprising for associated continuum and line light curves to
exhibit different long-term secular trends, since the relationship between the measured
continuum and the ionizing continuum responsible for producing the emission lines may
not be a linear one (Peterson et al. 2002), and the exact response of the line depends
on the detailed structure and dynamics of the BLR.
4. We excluded the points from the Mrk 817 light curve with JD<2454200 because (1)
there is a large gap in the data between these points and the rest of the light curve,
and (2) there is little to no coherent variability pattern seen here (i.e., the continuum is
relatively flat and noisy, and the Hβ fluxes are particularly noisy and are of otherwise
little use, given there are no continuum points at earlier times).
Tabulated continuum and Hβ fluxes for all objects, except for NGC4051 which were
previously reported by Denney et al. (2009b), are given in Tables 5 and 6, respectively.
Values listed represent the flux of each observation after completing all flux calibrations
described above (i.e., absolute flux calibration based on the [O iii]λ5007 emission-line flux
and host galaxy starlight subtraction), but before detrending, since this results in an arbitrary

– 11 –
flux scale normalized to 1.0. The final calibrated light curves used for the subsequent time-
series analysis are shown for each object in the left panels of Figure 3. Statistical parameters
describing these calibrated light curves (again, before detrending) are given in Table 7, where
Column (1) lists each object. Columns (2) and (3) are mean and median sampling intervals,
respectively, between data points in the continuum light curves. The mean continuum flux
is shown in column (4), while column (5) gives the excess variance, calculated as
Fvar =
√σ2 − δ2
〈f〉 (1)
where σ2 is the variance of the observed fluxes, δ2 is their mean square uncertainty, and 〈f〉is the mean of the observed fluxes. Column (6) is the ratio of the maximum to minimum
flux in the continuum light curves. Columns (7–11) display the same quantities as Columns
(2–6) but for the Hβ light curves.
2.4. Time-Series Analysis
We performed a cross correlation analysis to evaluate the mean light-travel time delay,
or lag, between the continuum and Hβ emission line flux variations. We primarily employed
an interpolation scheme (Gaskell & Sparke 1986; Gaskell & Peterson 1987, with the modifi-
cations of White & Peterson 1994). Using this method, we first interpolate (with an interval
equal to roughly half the median data spacing, i.e., ∼0.5 day) between points in the emission-
line light curve before cross correlating it with the original continuum light curve, calculating
cross correlation coefficients, r, for many potential lag values (both positive and negative).
We then average these cross correlation coefficients with those measured by imposing the
same set of possible lag values in the case where we cross correlate an interpolated contin-
uum light curve with the original emission-line light curve. This gives us a distribution of
average cross correlation coefficients as a function of possible lags, known as the cross corre-
lation function (CCF). We checked the results from this method with the discrete correlation
method of Edelson & Krolik (1988), also employing the modifications of White & Peterson
(1994), but we do not show these results here, since they are consistent with our primary
cross correlation method, and provide no additional information.
The right panels of Figure 3 show the adopted cross correlation results for each object
(i.e., after detrending selected light curves; see below for a discussion of the effect of de-
trending on this analysis). Here, the auto-correlation function (ACF), computed by cross
correlating the continuum with itself, is shown in the top right panel for each object, and the
CCF computed by cross correlating the Hβ light curve with that of the continuum, is shown

– 12 –
in the bottom right. Because the CCF is a convolution of the transfer function with the ACF,
it is instructive to compare the two distributions, as the lag measured through this type of
cross correlation analysis will depend not only on the delay map, but also on characteristic
time scales of the continuum variations (see, e.g., Netzer & Maoz 1990). We characterize the
time delay between the continuum and emission-line variations by the parameter τcent, the
centroid of the CCF based on all points with r ≥ 0.8rmax, as well at the lag corresponding
to the peak in the CCF at r = rmax, τpeak. Time dilation-corrected values of τcent and τpeakwere determined for each object using the redshifts listed in Table 1, i.e., τrest = τobs/(1+ z),
and are given in Table 8. Uncertainties in both lag determinations are computed via model-
independent Monte-Carlo simulations that employ the bootstrap method of Peterson et al.
(1998), with the additional modifications of Peterson et al. (2004).
Visual inspection of the CCFs of selected objects before and after detrending was made
to determine if detrending these light curves was warranted. Based on the combined prop-
erties of the light curves shown in Figure 2 (whether or not an overall slope appeared in
the flux across the extent of our campaign) and the CCFs, shown in Figure 4 for Mrk 290,
Mrk 817, and NGC3227 before and after detrending, we ultimately decided to adopt the
detrending for the following reasons listed for each object:
Mrk 290 — The top panels of Figure 4 show that before detrending (left), the peak of the
CCF is broader than the detrended peak (right) and is blended with an aliased peak at ∼30
days. Since the reverberation lag is clearly seen in the Mrk 290 light curves in Figures 2
and 3 and the peak of highest significance is the same both before and after detrending, the
presence of this alias only acts to decrease the precision of our lag measurements. While
τcent is roughly one day smaller after detrending (a difference less than even the measured
uncertainty) due to the reduced significance of the aliased peak at ∼30 days by a factor of
almost 10, the detrended CCF is narrower and the measured lags more precise, so we adopt
the detrended measurements.
Mrk 817 — The middle panels of Figure 4 show the original (left) and detrended (right) CCFs
from the analysis of Mrk 817. The choice to detrend was marginal in this case. The process
resulted in a larger observed lag (τcent = 14.48 days versus τcent = 11.93) after detrending,
contrary to the typical expectation that lags will be underestimated after detrending (since
the process removes low frequency variability). We adopt the detrended results because the
resulting CCF is narrower, particularly with respect to lags . 0.0 days, and the resulting
lag measurement is more consistent with past results that we hold to be reliable (see Section
5.1).
NGC3227 — The bottom panels of Figure 4 show the original (left) and detrended (right)

– 13 –
CCFs from the analysis of NGC3227. Here is it obvious that not detrending the light curves
results in a non-physical measurement of the lag at ∼ -33 days with a broad peak (due to
aliasing effects between the features with the highest flux in each of the original continuum
and Hβ light curves). While the physical peak (i.e, with positive lag, as seen and measured
from the detrended CCF) is present, every lag is of low significance, i.e., r .0.4. After
detrending, the CCF peak at negative lags is still present, however the ’true’ reverberation
signal at a lag of ∼4 days is rightfully more significant.
3. Black Hole Masses
We assume that the motions of the BLR are dominated by the gravity of the central
black hole so that the mass of the black hole can be defined by
MBH =fcτ(∆V )2
G. (2)
Here, τ is the measured emission-line time delay, so that cτ represents the BLR radius, and
∆V is the BLR velocity dispersion. The dimensionless factor f depends on the structure,
kinematics, and inclination of the BLR, and we adopt the value of Onken et al. (2004),
f = 5.5± 1.4, determined empirically by adjusting the zero-point of the reverberation-based
masses to scale the AGN MBH–σ⋆ relationship to that of quiescent galaxies.
An estimate of the BLR velocity dispersion is made from the width of the Doppler-
broadened Hβ emission line. This line width is commonly characterized by either the FWHM
or the line dispersion, i.e., the second moment of the line profile. Table 8 gives both FWHM
and line dispersion, σline, measurements from the rms spectra of all objects except Mrk 817,
in which the rms profile was not well defined (see Figure 1), and thus we measured the
width from the mean spectrum. All widths and their uncertainties were measured em-
ploying methods described in detail by Peterson et al. (2004). We removed the narrow-line
[O iii]λλ4959, 5007 emission and the narrow-line component of Hβ from all objects before
these line widths were measured (except for NGC4051, where this component could not
be reliably isolated due to the line profile shape and, in any case, does not affect our rms
line width measurements; see Denney et al. 2009b). Flux contributions from the narrow-line
component will not contaminate the line widths measured in the rms spectrum (i.e., the
narrow-line component does not vary in response to the ionizing continuum on reverbera-
tion timescales), so removal of this component was generally unnecessary for most objects
in our sample; however, we do so for all objects anyway to check the accuracy of our Hβ
to O iiiλ5007 line ratio determinations (Table 4, column 4) by looking for any significant

– 14 –
residual narrow-line emission in the rms spectra of Figure 1. The exception to this is for
Mrk 817: since we measured the width in the mean spectrum, it was necessary to remove
the narrow-line before measuring the line widths because the narrow-line component will
bias (i.e., underestimate) line widths measured in the mean spectrum or in any single-epoch
spectrum (see Denney et al. 2009a). Also, for the width measurements in two cases, Mrk 290
and NGC3227, we narrowed the line boundaries to 4935–5064 A and 4810–4942 A, respec-
tively, compared to what was used for the flux measurements, since the rms line profiles of
these objects were clearly narrower than their mean profiles (the rms profile is often narrower
than the mean profile, which is not surprising, given that likely not all flux seen in the mean
spectrum varies in response to the continuum; see, e.g., Korista & Goad 2004).
Black hole masses for all objects, calculated from equation (2), are listed in Table 8
and were calculated using τcent, for the time delay, τ , and the quoted line dispersion, σline,
for the emission-line width, ∆V . This combination of measurements for the line width and
reverberation lag is not only appropriate because it is the combination used by Onken et al.
(2004) to determine the value of the scale factor, f , that we adopt here, but also because
Peterson et al. (2004) show that this combination also results in the strongest virial relation
between line width and BLR radius, i.e., R ∼ ∆V −0.5. The exception to this prescription
for the black hole mass calculation is Mrk 817, which has a poorly defined, triple-peaked
rms line profile. Because the rms profile is weak and poorly-defined, we measure the line
widths from the mean spectrum and use the Collin et al. (2006) calibration of the scale
factor determined for the line dispersion measured from the mean spectrum, f = 3.85. Sta-
tistical and observational uncertainties have been included in these mass measurements, but
intrinsic uncertainties from sources such as unknown BLR inclination cannot be accurately
ascertained. We also note here that there has been some debate in the literature as to the im-
portance of radiation pressure on black hole masses calculated using virial assumptions, since
the outward radiation force has the same radial dependence as gravity (see Marconi et al.
2008; Netzer 2009; Marconi et al. 2009). As there is not yet conclusive evidence suggesting a
radiation-pressure correction is important for the relatively low Eddington ratio objects we
present here, we do not make this correction, but a radiation-pressure corrected mass can be
computed from the observables given in Table 8 and the formulae provided by Marconi et al.
(2008).
4. Velocity-Resolved Reverberation Lags
The primary cross correlation analysis presented above was intended to measure the
average time delay across the full extent of the BLR from which to ascertain the mean, or

– 15 –
“characteristic,” radius of the Hβ-emitting region of the BLR to use for calculating black hole
masses. For this reason, we utilized the full line flux from which to measure the reverberation
signal. However, the BLR is an extended region, and therefore, the light-travel time for
the ionizing continuum to reach different volume elements within the BLR will vary across
the extent of the emitting region. The expectation is then that the responding BLR gas
variations will lag the continuum variations on slightly different time scales as a function
of the line of sight velocity. Measuring and mapping these slight differences in the BLR
response time across velocity space recovers the transfer function, which is easily visualized
as a velocity–delay map (see Horne et al. 2004). Recovering an unambiguous velocity–delay
map is a continuing goal of reverberation mapping analyses, as the construction and analysis
of such a map is our best hope, with current technology, of gaining insight into the geometry
and kinematics of the BLR.
The construction and analysis of full two-dimensional velocity–delay maps is beyond
the scope of this work and remains the focus of future research. However, we do present a
more simple reconstruction of the velocity-dependent reverberation signal, observed across
the Hβ emission line region when we divide the line flux into eight velocity-space bins of
equal flux. These results for NGC4051, NGC3516, NGC3227, and NGC5548 have been
previously published (Denney et al. 2009b,c) but are included again here for completeness.
Line boundaries are the same as those used in the full line analysis, except where noted
in Table 2. In these cases the narrowed boundaries given above for Mrk 290 were used,
and a discussion of the difference in boundary choices for the other objects is presented by
Denney et al. (2009c). Light curves were created from measurements of the integrated Hβ
flux in each bin and then cross correlated with the continuum light curve following the same
procedures described above. Figure 5 shows the results of this analysis for all objects, where
the top panel shows the division of each rms Hβ line profile into the eight velocity bins, and
the bottom panels shows the lag measurements and uncertainties for each of these bins. Error
bars in the velocity direction represent the bin width. We see a variety of velocity-resolved
responses that we discuss in further detail below.
5. Discussion
5.1. Comparison with Previous Results
Some of the objects in this campaign were targeted, at least in part, because they
have previously appeared as outliers on AGN scaling relationships, in particular, the RBLR–
L relationship. As such, all objects except Mrk 290 have previous reverberation results,
several of which were suspect for one reason or another and warranted re-observation. Based

– 16 –
on the outcomes of the current analysis, we will group our results into three categories:
(1) new measurements for an object never before targeted, i.e., Mrk 290, (2) replacement
measurements for objects that had uncertain results (typically due to undersampling) and
for which our results completely replace any previous measurements of the Hβ reverberation
lag, i.e., NGC3227, NGC3516, and NGC4051, and (3) additional measurements of objects
for which we already trust the previous lag measurements, i.e., NGC5548 and Mrk 817. In
this context, we can compare our new results to previously published results.
5.1.1. New Measurements
At the time of our campaign (first half of 2007), reverberation mapping had never before
targeted Mrk 290. However, in 2008 LAMP also monitored Mrk 290 for a reverberation
analysis (see Bentz et al. 2009c), although they were unable to recover an unambiguous
reverberation lag measurement from their data because Mrk 290 exhibited little variability
during their campaign. Therefore, the results we present here are the only reverberation
measurements of this object.
5.1.2. Replacement Measurements
Our current measurements of NGC3227, NGC3516, and NGC4051 should completely
supersede previous results measuring a reverberation radius based on Hβ and the black hole
mass. A thorough comparison between our new measurement of the BLR radius of NGC4051
and that from past studies is discussed by Denney et al. (2009b), and the reader is referred
to this work for details. However, the main conclusion of that comparison is that the light
curves from which previous measurements of the lag were made (e.g., Peterson et al. 2000)
were undersampled, leading to an overestimate of the lag. Our current study remedied this
problem with a much higher sampling rate, routinely obtaining more than one observation
per day.
Previous reverberation lag measurements of the Hβ-emitting region in NGC3227 (Salamanca et al.
1994; Winge et al. 1995; Onken et al. 2003) were reanalyzed by Peterson et al. (2004). The
Hβ light curves of Salamanca et al. (1994) from a Lovers of Active Galaxies (LAG) cam-
paign were undersampled, and they do not even attempt to measure a time delay from them.
Winge et al. (1995) report an Hβ lag of 18 ± 5 days from observations taken during a pe-
riod in which the optical luminosity was only ∼0.3 dex larger than our current observations
(i.e., a change in radius of ∼40% is expected from such a change in luminosity, based on

– 17 –
a RBLR–L relationship slope of ∼0.5). However, their average and median sampling inter-
vals were ∼6 and four days, respectively, which is marginally sampled compared to what is
needed for this low luminosity source. These early reverberation campaigns did not have
the benefit of the predictive power that we currently have with the RBLR–L relationship
to use for planning campaign observations; i.e., these campaigns were fundamentally ex-
ploratory. A reanalysis of the LAG consortium data presented by Salamanca et al. (1994)
was conducted by Onken et al. (2003) using the van Groningen & Wanders (1992) algorithm
to reduce uncertainties in the relative flux calibration of the spectra. Onken et al. found an
Hβ lag of τcent = 12.0+26.7−9.1 days, consistent with the results of Winge et al. (1995). Later,
Peterson et al. (2004) also re-analyzed the CTIO data presented by Winge et al. (1995)
with the van Groningen & Wanders (1992) algorithm and further re-examined the LAG
data rescaled by Onken et al. (2003). This reanalysis resulted in some improvement in the
Hβ lag determinations and uncertainties, i.e., smaller overall lags, however, the reanalyzed
values still had large uncertainties, resulting in a measurement consistent with zero lag:
τcent = 8.2+5.1−8.4 days and τcent = 5.4+14.1
−8.7 days for the CTIO and LAG data sets, respectively
(Peterson et al. 2004). It is clear that our new measurement of the Hβ lag in NGC3227 of
τcent = 3.75+0.76−0.82 days should supersede these past results.
Likewise, the previous reverberation data for NGC3516 also came from a LAG consor-
tium campaign, also with a sampling interval of ∼4 days (Wanders et al. 1993). Since the
lag for this object was at least larger than the sampling rate, the undersampling was not
as severe a handicap as for other objects in our sample, such as NGC4051 and NGC3227.
Thus, reanalysis of the LAG data first by Onken et al. (2003) and then by Peterson et al.
(2004) measure lags of τcent = 7.3+5.4−2.5 days and τcent = 6.7+6.8
−3.8 days, respectively, that are
consistent with the original analysis by Wanders et al., who measure the peak Hβ lag to be
7 ± 3 days, with the centroid of the CCF yielding a radius of 11 light days. All of these
centroid measurements are consistent with our new measurement of τcent = 11.68+1.02−1.53 days.
Also, the LAG spectra were obtained through a narrow (2.′′0) slit; as the narrow-line region
in this object is partially resolved, it was necessary to make seeing-dependent corrections
to the continuum and emission-line measurements (Wanders et al. 1992) that are both large
and uncertain. For our new measurements, the aperture corrections are small and have a
negligible effect on the final results; the seeing-corrected and uncorrected fluxes differ by,
on average, 0.09 ± 0.05%, which is smaller than the standard deviation of our relative flux
scaling of 1.6% for NGC3516. Clearly, our new observations with an approximately daily
sampling rate show great improvement over past campaigns, for these objects, and the re-
sults presented here should supersede past values of the Hβ lag measured for NGC3227,
NGC3516, and NGC4051.

– 18 –
5.1.3. Additional Measurements
The goals of this campaign were not only to re-observe outliers or objects with highly
uncertain lag measurements but also to explore the possibility of uncovering velocity-resolved
kinematic signatures and eventually reconstruct velocity–delay maps. Therefore, we also
monitored two objects, NGC5548 and Mrk 817, for which previous reverberation mapping
results are solid, and lags measured from this campaign are simply to be considered additional
measurements of the BLR radius. Reasons for making repeat reverberation measurements
of AGNs include (1) exploring the radius-luminosity relationship in a single source, (2)
checking the repeatability of the mass measurements for AGNs at different times, in different
luminosity states, and with different line profiles, and (3) testing different characterizations
of the line width (i.e., determining what line width measure leads to the most repeatable
mass value). The mean lag and black hole mass results presented here for NGC5548 are
consistent with past results, taking into account the luminosity state of NGC5548 during
our campaign compared with other campaigns (i.e., NGC5548 has been in a low luminosity
state for the past several years, but the measured lags have been consistently smaller, as
expected for this low state; also see Bentz et al. 2007, 2009c).
We also monitored Mrk 817, which is the highest luminosity object in our present sample.
Previous measurements of the Hβ radius were made by Peterson et al. (1998) from an eight-
year campaign to monitor nine Seyfert 1 galaxies. From this campaign, they separately
measured the lag from three different observing seasons. The reanalysis of this data by
Peterson et al. (2004) resulted in rest-frame τcent measurements of 19.0+3.9−3.7, 15.3+3.7
−3.5, and
33.6+6.5−7.6 days. Bentz et al. (2009b) calculate a weighted average of log τcent from these three
measurements of (converted back to linear space) 〈τcent〉wt = 21.8+2.4−3.0 days at an average
luminosity of 〈logL5100〉wt = 43.64 ± 0.03 to use in calibrating the RBLR–L relationship.
The luminosity of Mrk 817 during our campaign was only about 0.1 dex higher than the
weighted average luminosity quoted by Bentz et al., and our measured lag of τcent = 14.04+3.41−3.47
days is highly consistent with the shortest lag of Peterson et al. and marginally consistent
with the 19.0 day lag and the weighted average. Furthermore, the virial mass that we
measure (see Column 8 of Table 8) is also consistent with those given by Peterson et al.
(2004). Unfortunately, we were not able to improve on the uncertainties associated with
these measurements, as our Hβ light curve for this object was rather noisy (see Figures
2 and 3), which decreases the certainty with which we are able to trace the reverberated
continuum variations in the line light curve. Since there was neither an improvement over
nor a discrepancy with past measurements, this new result is simply added to past results
as an additional measurement of the Hβ-based BLR radius and MBH in Mrk 817.

– 19 –
5.2. The BLR Radius Luminosity Relationship
To investigate the outcome of our goal to improve the calibration of scaling relations
by re-examining objects that had large measurements uncertainties and/or that appeared
as outliers on these scaling relationships, we place our new measurements in context to
the RBLR–L relationship most recently calibrated by Bentz et al. (2009b). Luminosities
were measured from the average, host-corrected continuum flux density measured within the
5100 A rest-frame continuum windows listed for each object in Table 2. For most objects,
we simply corrected for Galactic reddening along the line of sight (Schlegel et al. 1998);
however, NGC3227 and NGC3516 show evidence of internal reddening that must be taken
into account in determining the luminosity. Gaskell et al. (2004) argue that the UV-optical
continua of AGNs are all very similar, so that the reddening can be estimated by dividing
the spectrum of a reddened AGN by the spectrum of an unreddened AGN. In the case of
NGC3227, we use the value of AB determined by Crenshaw et al. (2001) by comparing the
UV-optical spectrum of NGC3227 to the unreddened spectrum of NGC4151. For NGC3516,
we consider two methods for estimating the reddening, which result in consistent estimates
of AB: (1) we follow the Crenshaw et al. method, comparing the spectrum of NGC3516
again to that of NGC4151, which results in AB = 1.72, and (2) we use the Balmer decre-
ment measured from the broad components of the Hα and Hβ emission lines to estimate a
reddening of AB = 1.68. These two values are highly consistent, and we adopt the average
between the two methods of AB = 1.70. Our measured luminosities are given in Column
9 of Table 8, where the uncertainties in the luminosities are the standard deviation in the
continuum flux over the course of the campaign, except for NGC4051, where the uncertainty
in the distance is added in quadrature to this (see Denney et al. 2009b).
The top panel of Figure 6 shows the Bentz et al. (2009b) RBLR–L relationship, repro-
duced from the bottom panel of their Figure 5. Here, we have differentiated the objects
targeted for our present campaign with solid squares, while all other objects presented by
Bentz et al. are open squares. The bottom panel of Figure 6 shows our current results, where
the objects for which our new measurements are either truly new (i.e., Mrk 290) or have be-
come replacements for old values are shown by the solid stars, and we no longer plot the old
values. Our additional measurements for NGC5548 and Mrk 817 are shown with the open
stars, and the previous weighted average lags and luminosities for these objects as reported
by Bentz et al. are still present in this bottom panel. The reader should immediately notice
the increased precision and accuracy of our new and replacement measurements, where it
is important to note that we have not determined a new fit to the data3. Clearly, these
3Re-evaluating the fit to and scatter in this relationship is outside the scope of this paper but is planned

– 20 –
better measurements emphasize the small intrinsic scatter in this relationship, reinforcing
the apparently homologous nature of AGNs, even over many orders of magnitude in lumi-
nosity. The results from this campaign also support the conclusion of Peterson (2010) that
improving this relationship further will not come from simply obtaining more BLR radii
measurements to “beat down” the noise, but rather, from more reliable, higher-precision
measurements.
5.3. Velocity-Resolved Results
The cleanest cases of a velocity-resolved reverberation response are for NGC3516,
NGC3227, and NGC5548, where we see kinematic signatures indicating apparent infall,
outflow, and non-radial, or “virialized,” motions, respectively. Denney et al. (2009c) discuss
the velocity-resolved results for these three objects and the implications of these different
kinematic signatures in the context of our overall understanding of the BLR and the use
of BLR radii measurements for determining black hole masses. In addition, Denney et al.
(2009b) present and discuss the marginally velocity-resolved lags shown here for NGC4051,
and so those results are not discussed further here.
The objects not discussed in previous publications are Mrk 290 and Mrk 817. Figure 5
shows that there is very little variation in the reverberation lag across the full width of the
Mrk 290 line profile, indicating that any differences in the reverberation lag across the extent
of the Hβ-emitting region in this object were unresolvable with the sampling rate of our
campaign. An additional possibility for the uniform response we observed (i.e., small range
in lags and no short lags observed) could be that the highest velocity gas seen in the wings
of the mean spectrum is optically thin, and therefore does not respond to the continuum
variations. This is supported by the narrowness of the Hβ profile in the rms spectrum
compared to that observed in the mean spectrum. On the other hand, based on the relative
emission-line strengths of the high-velocity wings in several AGNs, Snedden & Gaskell (2007)
argue against this interpretation.
At first glance, Mrk 817 appears to show an outflow signature similar to that of NGC3227,
however, cross correlation between the continuum light curve and those derived from the line
flux in the first four velocity bins actually results in lag determinations that are, though nega-
tive, largely consistent with zero lag. Ignoring these first bins gives results similar to Mrk 290,
where no velocity-dependent differences in the lags are resolved. Taken at face value, this
result is curious. We present binned light curves of the Mrk 817 line profile in Figure 7,
for future work that will include all new, relevant data (see, e.g., Bentz et al. 2009c).

– 21 –
where to increase the clarity of the discrepancy between the red and blue sides of the line
for this discussion, we have combined sets of two bins to make a total of 4 bins instead of
eight, i.e., we plot the flux from bin 1 added to that of bin 2, bin 3 added to bin 4, etc. For
completeness we also recompute the CCFs (also shown in Fig. 7) and velocity-resolved lag
measurements for these four combined bins and find results consistent with simply taking
the average of the lags of each set of two bins that we combined, though the uncertainties in
the newly measured lags are generally smaller, particularly for the bluest and reddest bins.
Upon inspection of the individual light curves for these bins, it becomes apparent that the
cross correlation analysis for these bins essentially failed, not finding a strong correlation
between the continuum flux variability and that seen in the light curves of Bin 1 and Bin
2. The light curves show a lack of variability in the flux in these bins during the first half
of the campaign, and then a fairly monotonic rise in flux during the second half, so the
peak in the continuum flux seen near ∼JD2454230 is not seen in the light curves of Bins
1 and 2, and instead, the feature the cross correlation analysis picks up is the trough near
∼JD2454282, apparently seen in the Bins 1 and 2 light curves ∼8–10 days earlier. This
combination causes the cross correlation analysis to give unreliable results. Furthermore,
no real indication of the expected positive lag can been seen by eye, as can with the other
bins (and other objects, for that matter). The observations could be explained by some gas
having an unresolved velocity structure near the mean radius measured for this object and
there also being an outflowing component in the BLR of this object, so that the blue-shifted
gas is primarily along line of sight and a resulting zero day lag is measured. However, given
that (1) the overall variability observed in this object was small during this campaign, and
(2) the Hβ profile is very broad, leading to a small variability signal spread over a large
wavelength range, we cannot make any strong conclusions at this time. Future efforts will
be made both to glean further information from the velocity–delay map reconstructed from
our current data as well as to re-analyze the previous monitoring data on this object in an
attempt to search for any other indications of velocity-resolved signatures.
Despite the differences we see in the velocity-resolved kinematics across our sample of
objects, we do not believe that there is cause for concern for the masses derived from the
mean BLR radii measured from these reverberation lags. Obviously, observing unresolved,
virial, or infalling gas motions certainly does not question the validity of our assumption
that the BLR motions are gravitationally dominated, but indications of outflow may be
more problematic. However, even given these signatures, the mean lag we measure is still
consistent with lags derived from the majority of the emission-line gas. Besides, it is only
gas outflowing at velocities larger than the escape velocity that would break the validity of
our assumptions, and this does not seem to be the case. There are good observational and
theoretical reasons to believe that there are multiple components within the BLR (e.g., disk

– 22 –
and wind components), and the disk-wind model of Murray et al. (1995), for example, is
still able to justify the constraint of the black hole mass by the reverberation mapping radii
measurements, even with the presence of a wind (see Chiang & Murray 1996).
From velocity-resolved studies such as the one discussed here and in our previous pub-
lications on this data set (Denney et al. 2009b,c), it is clear that high-cadence reverberation
mapping studies are beginning to push the envelope with respect to the amount of infor-
mation we are able to glean from data of high quality and homogeneity. The next goal is
to attempt a reconstruction of the velocity-resolved transfer function through the produc-
tion of velocity–delay maps, with priority placed on the objects shown here and discussed
by Denney et al. (2009c) that exhibit statistically significant kinematic signatures of infall,
outflow, and virialized motions (NGC3516, NGC3227, and NGC5548, respectively). Pre-
liminary results from this analysis show the potential to reveal the types of structured maps
that will hopefully provide additional constraints on future models of the BLR and more
clearly reveal distinct kinematic structures responsible for the velocity-resolved signatures
we presented here.
6. Conclusion
We have reported the results for our complete sample of six local Seyfert 1 galaxies
that were monitored in a reverberation mapping campaign that aimed to remeasure the
BLR radius from Hβ emission in objects that previously had poor measurements (large
measurement uncertainties and/or undersampled light curves) or that were targeted with
the aim of recovery of velocity-resolved reverberation lag signals and/or transfer functions.
Based on the measured luminosities of our sample over the course of our ∼4 month campaign,
we measure Hβ lags that are in excellent agreement with the expectations of the most recent
calibration of the RBLR–L relationship of Bentz et al. (2009b).
Combining these lag measurements with velocity dispersion measurements estimated
from the width of the broad Hβ emission line, we make direct black hole mass measure-
ments for our entire sample. Based on a comparison of our results with previous measure-
ments (where available), most of our sample constitutes results that are either entirely new
(Mrk 290) or supersede past measurements (NGC3227, NGC3516, and NGC4051). How-
ever, for NGC5548 and Mrk 817, we compared our current mass measurements with past
results and find them consistent within the measurements uncertainties, and therefore, place
these results under the category of “additional measurements” for these objects.
An additional goal of this campaign was to determine velocity-resolved reverberation

– 23 –
lags across the extent of the Hβ-emitting region of the BLR for use in future efforts to recover
velocity–delay maps to help constrain the geometry and kinematics of the BLR. Though the
velocity structure in some of our targets remained unresolved on sampling-rate-limited time
scales, we still found some statistically significant and kinematically diverse velocity-resolved
signatures, even within this small sample. We see indications of apparent infall, outflow, and
virialized motions, which, if taken at face value, would indicate that the BLR is a complicated
region that differs from object to object. However, given the small scatter in the RBLR–L
relation and the consistency with which we are able to measure the BLR radius and black
hole mass in multiple objects across dynamical time scales (e.g., NGC5548 and Mrk 817),
it is unlikely that the steady-state dynamics within this region are truly this diverse. The
BLR could be made up of multiple kinematic components with possible transient features
such as winds and/or warped disks that travel through the line of sight to the observer over
dynamical timescales. In such a scenario, evidence for different types of kinematic signatures
would arise depending on the observer’s line of sight through this region at a given time.
In order to quantify such possibilities and fit models to the velocity-resolved data, it is
necessary to collect more velocity-resolved reverberation mapping results for these objects,
as well as others. This remains a goal for future observing programs, and efforts are focused
on recovering velocity–delay maps for the current sample. Similar efforts are being made by
the LAMP consortium (M. Bentz, priv. comm.) with the sample presented by Bentz et al.
(2009c), increasing our probability of success for this elusive goal of reverberation mapping.
We would like to thank Luis Ho for providing the optical spectra of the Hβ and Hα
regions of NGC3516 from which we calculated the Balmer decrement to determine the de-
gree of internal reddening. We acknowledge support for this work by the National Science
Foundation though grant AST-0604066 to The Ohio State University. MCB gratefully ac-
knowledges support provided by NASA through Hubble Fellowship grant HF–51251 awarded
by the Space Telescope Science Institute, which is operated by the Association of Univer-
sities for Research in Astronomy, Inc., for NASA, under contract NAS 5-26555. CMG is
grateful for support by the National Science Foundation through grants AST 03-07912 and
AST 08-03883. MV acknowledges financial support from HST grants HST-GO-10417, HST-
AR-10691, and HST-GO-10833 awarded by the Space Telescope Science Institute, which
is operated by the Association of Universities for Research in Astronomy, Inc., for NASA,
under contract NAS5-26555. The Dark Cosmology Centre is funded by the Danish Na-
tional Research Foundation. VTD acknowledges the support of the Russian Foundation
for Basic Research (project no. 09-02-01136a) to the Crimean Laboratory of the Sternberg
Astronomical Institute. SGS acknowledges support through Grant No. 5-20 of the ”Cos-
momicrophysics” program of the National Academy of Sciences of Ukraine to CrAO. The

– 24 –
CrAO CCD cameras have been purchased through the US Civilian Research and Develop-
ment Foundation for the Independent States of the Former Soviet Union (CRDF) awards
UP1-2116 and UP1-2549-CR-03. This research has made use of the NASA/IPAC Extragalac-
tic Database (NED) which is operated by the Jet Propulsion Laboratory, California Institute
of Technology, under contract with the National Aeronautics and Space Administration.

– 25 –
REFERENCES
Bennert, N., Canalizo, G., Jungwiert, B., Stockton, A., Schweizer, F., Peng, C. Y., & Lacy,
M. 2008, ApJ, 677, 846
Bentz, M. C., Peterson, B. M., Netzer, H., Pogge, R. W., & Vestergaard, M. 2009a, ApJ,
697, 160
Bentz, M. C., Peterson, B. M., Pogge, R. W., & Vestergaard, M. 2009b, ApJ, 694, L166
Bentz, M. C., Peterson, B. M., Pogge, R. W., Vestergaard, M., & Onken, C. A. 2006, ApJ,
644, 133
Bentz, M. C., et al. 2007, ApJ, 662, 205
—. 2009c, ApJ, 705, 199
Blandford, R. D., & McKee, C. F. 1982, ApJ, 255, 419
Chiang, J., & Murray, N. 1996, ApJ, 466, 704
Chonis, T. S., & Gaskell, C. M. 2008, AJ, 135, 264
Collin, S., Kawaguchi, T., Peterson, B. M., & Vestergaard, M. 2006, A&A, 456, 75
Crenshaw, D. M., Kraemer, S. B., Bruhweiler, F. C., & Ruiz, J. R. 2001, ApJ, 555, 633
Denney, K. D., Peterson, B. M., Dietrich, M., Vestergaard, M., & Bentz, M. C. 2009a, ApJ,
692, 246
Denney, K. D., et al. 2006, ApJ, 653, 152
—. 2009b, ApJ, 702, 1353
—. 2009c, ApJ, 704, L80
Di Matteo, T., Springel, V., & Hernquist, L. 2005, Nature, 433, 604
Doroshenko, V. T., Sergeev, S. G., Merkulova, N. I., Sergeeva, E. A., Golubinsky, Y. V.,
Pronik, V. I., & Okhmat, N. N. 2005a, Astrophysics, 48, 156
—. 2005b, Astrophysics, 48, 304
Edelson, R. A., & Krolik, J. H. 1988, ApJ, 333, 646
Ferrarese, L., & Ford, H. 2005, Space Science Reviews, 116, 523

– 26 –
Ferrarese, L., & Merritt, D. 2000, ApJ, 539, L9
Ferrarese, L., Pogge, R. W., Peterson, B. M., Merritt, D., Wandel, A., & Joseph, C. L. 2001,
ApJ, 555, L79
Gaskell, C. M., Goosmann, R. W., Antonucci, R. R. J., & Whysong, D. H. 2004, ApJ, 616,
147
Gaskell, C. M., & Peterson, B. M. 1987, ApJS, 65, 1
Gaskell, C. M., & Sparke, L. S. 1986, ApJ, 305, 175
Gebhardt, K., & Thomas, J. 2009, ApJ, 700, 1690
Gebhardt, K., et al. 2000a, ApJ, 539, L13
—. 2000b, ApJ, 543, L5
Graham, A. W. 2007, MNRAS, 379, 711
Gultekin, K., Richstone, D. O., Gebhardt, K., Lauer, T. R., Tremaine, S., Aller, M. C.,
Bender, R., Dressler, A., Faber, S. M., Filippenko, A. V., Green, R., Ho, L. C.,
Kormendy, J., Magorrian, J., Pinkney, J., & Siopis, C. 2009, ApJ, 698, 198
Haring, N., & Rix, H. 2004, ApJ, 604, L89
Hopkins, P. F., & Hernquist, L. 2009, ApJ, 694, 599
Horne, K., Peterson, B. M., Collier, S. J., & Netzer, H. 2004, PASP, 116, 465
Kaspi, S., Brandt, W. N., Maoz, D., Netzer, H., Schneider, D. P., & Shemmer, O. 2007,
ApJ, 659, 997
Kaspi, S., Maoz, D., Netzer, H., Peterson, B. M., Vestergaard, M., & Jannuzi, B. T. 2005,
ApJ, 629, 61
Kaspi, S., Smith, P. S., Netzer, H., Maoz, D., Jannuzi, B. T., & Giveon, U. 2000, ApJ, 533,
631
Klimek, E. S., Gaskell, C. M., & Hedrick, C. H. 2004, ApJ, 609, 69
Kobayashi, Y., Yoshii, Y., & Minezaki, T. 2004, Astronomische Nachrichten, 325, 537
Kobayashi, Y., Yoshii, Y., Peterson, B. A., Minezaki, T., Enya, K., Suganuma, M., &
Yamamuro, T. 1998a, in Proc. SPIE, Vol. 3354, 769–776

– 27 –
Kobayashi, Y., et al. 1998b, in Proc. SPIE, Vol. 3352, 120–128
Kollmeier, J. A., et al. 2006, ApJ, 648, 128
Korista, K. T., & Goad, M. R. 2004, ApJ, 606, 749
Kormendy, J., & Gebhardt, K. 2001, in American Institute of Physics Conference Series,
Vol. 586, 20th Texas Symposium on relativistic astrophysics, ed. J. C. Wheeler &
H. Martel, 363–381
Kormendy, J., & Richstone, D. 1995, ARA&A, 33, 581
Magorrian, J., et al. 1998, AJ, 115, 2285
Marconi, A., Axon, D. J., Maiolino, R., Nagao, T., Pastorini, G., Pietrini, P., Robinson, A.,
& Torricelli, G. 2008, ApJ, 678, 693
Marconi, A., Axon, D. J., Maiolino, R., Nagao, T., Pietrini, P., Risaliti, G., Robinson, A.,
& Torricelli, G. 2009, ApJ, 698, L103
McLure, R. J., & Dunlop, J. S. 2004, MNRAS, 352, 1390
Minezaki, T., Yoshii, Y., Kobayashi, Y., Enya, K., Suganuma, M., Tomita, H., Aoki, T., &
Peterson, B. A. 2004, ApJ, 600, L35
Murray, N., Chiang, J., Grossman, S. A., & Voit, G. M. 1995, ApJ, 451, 498
Nelson, C. H., Green, R. F., Bower, G., Gebhardt, K., & Weistrop, D. 2004, ApJ, 615, 652
Netzer, H. 2009, ApJ, 695, 793
Netzer, H., & Maoz, D. 1990, ApJ, 365, L5
Onken, C. A., Ferrarese, L., Merritt, D., Peterson, B. M., Pogge, R. W., Vestergaard, M., &
Wandel, A. 2004, ApJ, 615, 645
Onken, C. A., Peterson, B. M., Dietrich, M., Robinson, A., & Salamanca, I. M. 2003, ApJ,
585, 121
Peterson, B. M. 1993, PASP, 105, 247
Peterson, B. M. 2001, in Advanced Lectures on the Starburst-AGN Connection, ed. I. Aretx-
aga, D. Kunth, & R. Mujica (Singapore: World Scientific), p. 3
—. 2010, in prep, (see also arXiv1001.3675)

– 28 –
Peterson, B. M., Wanders, I., Bertram, R., Hunley, J. F., Pogge, R. W., & Wagner, R. M.
1998, ApJ, 501, 82
Peterson, B. M., et al. 1991, ApJ, 368, 119
—. 2000, ApJ, 542, 161
—. 2002, ApJ, 581, 197
—. 2004, ApJ, 613, 682
Salamanca, I., et al. 1994, A&A, 282, 742
Salviander, S., Shields, G. A., Gebhardt, K., & Bonning, E. W. 2007, ApJ, 662, 131
Schlegel, D. J., Finkbeiner, D. P., & Davis, M. 1998, ApJ, 500, 525
Sergeev, S. G., Doroshenko, V. T., Dzyuba, S. A., Peterson, B. M., Pogge, R. W., & Pronik,
V. I. 2007, ApJ, 668, 708
Sergeev, S. G., Doroshenko, V. T., Golubinskiy, Y. V., Merkulova, N. I., & Sergeeva, E. A.
2005, ApJ, 622, 129
Shankar, F., Weinberg, D. H., & Miralda-Escude, J. 2009, ApJ, 690, 20
Shen, J., & Gebhardt, K. 2010, ApJ, 711, 484
Shen, Y., Greene, J. E., Strauss, M. A., Richards, G. T., & Schneider, D. P. 2008, ApJ, 680,
169
Silk, J., & Rees, M. J. 1998, A&A, 331, L1
Snedden, S. A., & Gaskell, C. M. 2007, ApJ, 669, 126
Somerville, R. S., Hopkins, P. F., Cox, T. J., Robertson, B. E., & Hernquist, L. 2008,
MNRAS, 391, 481
Suganuma, M., et al. 2006, ApJ, 639, 46
Tremaine, S., et al. 2002, ApJ, 574, 740
van den Bosch, R. C. E., & de Zeeuw, P. T. 2010, MNRAS, 401, 1770
van Groningen, E., & Wanders, I. 1992, PASP, 104, 700

– 29 –
Vestergaard, M., Fan, X., Tremonti, C. A., Osmer, P. S., & Richards, G. T. 2008, ApJ, 674,
L1
Vestergaard, M., & Osmer, P. S. 2009, ApJ, 699, 800
Wandel, A. 2002, ApJ, 565, 762
Wandel, A., Peterson, B. M., & Malkan, M. A. 1999, ApJ, 526, 579
Wanders, I., Peterson, B. M., Pogge, R. W., Derobertis, M. M., & van Groningen, E. 1992,
A&A, 266, 72
Wanders, I., et al. 1993, A&A, 269, 39
Welsh, W. F. 1999, PASP, 111, 1347
White, R. J., & Peterson, B. M. 1994, PASP, 106, 879
Whittle, M. 1992, ApJS, 79, 49
Winge, C., Peterson, B. M., Horne, K., Pogge, R. W., Pastoriza, M. G., & Storchi-Bergmann,
T. 1995, ApJ, 445, 680
Woo, J., et al. 2010, ApJ, 716, 269
Yoshii, Y. 2002, in New Trends in Theoretical and Observational Cosmology, ed. K. Sato &
T. Shiromizu (Tokyo: Universal Academy), 235
This preprint was prepared with the AAS LATEX macros v5.2.

– 30 –
Table 1. Object List
Objects z α2000 δ2000 Host AB
(hr min sec) ( ′ ′′) Classification (mag)
(1) (2) (3) (4) (5) (6)
Mrk 290 0.02958 15 35 52.3 +57 54 09 E1 0.065
Mrk 817 0.03145 14 36 22.1 +58 47 39 SBc 0.029
NGC3227 0.00386 10 23 30.6 +19 51 54 SAB(s) pec 0.76a
NGC3516 0.00884 11 06 47.5 +72 34 07 (R)SB(s) 1.70a
NGC4051 0.00234 12 03 09.6 +44 31 53 SAB(rs)bc 0.056
NGC5548 0.01717 14 17 59.5 +25 08 12 (R’)SA(s)0/a 0.088
aValues have been adjusted to account for additional internal reddening
as described in section 5.2.

– 31 –
Table 2. Spectroscopic Observations
Julian Dates Res 5100A Cont. Hβ Line Extraction
Objects Observ. Nobs (-2450000) (A) Window (A) Limits (A) Window (′′)
(1) (2) (3) (4) (5) (6) (7) (8)
Mrk 290 MDM 71 4184–4268 7.6 5235–5265 4915–5086a,b 5.0×12.75
CrAO 18 4266–4301 7.5 5235–5265 4915–5086 3.0×11.0
DAO 11 4262–4290 7.9 5235–5265 4915–5086 3.0×6.28
Mrk 817 MDM 65 4185–4269 7.6 5245–5275 4900–5099 5.0×12.75
CrAO 23 4265–4301 7.5 5245–5275 4900–5099 3.0×11.0
NGC3227 MDM 75 4184–4268 7.6 5105–5135 4795–4942a,b 5.0×8.25
NGC3516 MDM 74 4184–4269 7.6 5130–5160 4845–4965b 5.0×12.75
CrAO 19 4266–4300 7.5 5130–5160 4845–4965b 3.0×11.0
NGC4051 MDM 86 4184–4269 7.6 5090–5130 4815–4920 5.0×12.75
CrAO 22 4266–4300 7.5 5090–5130 4815–4920 3.0×11.0
NGC5548 MDM 77 4184–4267 7.6 5170–5200 4845–5004b 5.0×12.75
CrAO 20 4265–4301 7.5 5170–5200 4845–5004b 3.0×11.0
DAO 11 4276–4293 7.9 5170–5200 4845–5000b 3.0×6.28
aHβ line limits were narrowed for the measurement of the line width in the rms spectrum.
See Section 3 for details.
bHβ line limits were changed for the velocity-resolved lag investigation. See Section 4 for
details.

– 32 –
Table 3. Photometric Observations
Julian Dates
Objects Observatory Nobs (-2450000)
(1) (2) (3) (4)
Mrk 290 MAGNUM 17 4200–4321
CrAO 61 4180–4298
UNebr 6 4199–4252
Mrk 817 MAGNUM 24 4185–4330
CrAO 69 4180–4299
NGC3227 MAGNUM 19 4181–4282
CrAO 58 4180–4263
UNebr 19 4195–4276
NGC3516 MAGNUM 10 4190–4277
CrAO 73 4181–4299
UNebr 22 4195–4258
NGC4051 MAGNUM 23 4182–4311
CrAO 76 4180–4299
UNebr 28 4195–4290
NGC5548 MAGNUM 48 4182–4332
CrAO 71 4180–4299
UNebr 13 4198–4289

– 33 –
Table 4. Constant Spectral Properties
FWHM([O iii] λ5007)a F ([O iii]λ5007) Hβnar FHost
Objects rest frame (km s−1) (10−13 ergs s−1 cm−2) Line Strengthb (10−15 ergs s−1 cm−2 A−1)
(1) (2) (3) (4) (5)
Mrk 290 380 1.91 ± 0.12 0.08 1.79
Mrk 817 330 1.32 ± 0.07 0.08 1.84± 0.17
NGC3227 485 6.81 ± 0.54 0.088c 7.30± 0.67
NGC3516 250 3.35 ± 0.42 0.07 16.1 ± 1.5
NGC4051 190 3.91 ± 0.12c · · · 9.18± 0.85
NGC5548 410 5.58 ± 0.27d 0.11e 4.48± 0.41
aFrom Whittle (1992).
bRatio of narrow F (Hβnar) to F ([O iii]λ5007).
cFrom Peterson et al. (2000).
dFrom Peterson et al. (1991).
eFrom Peterson et al. (2004).
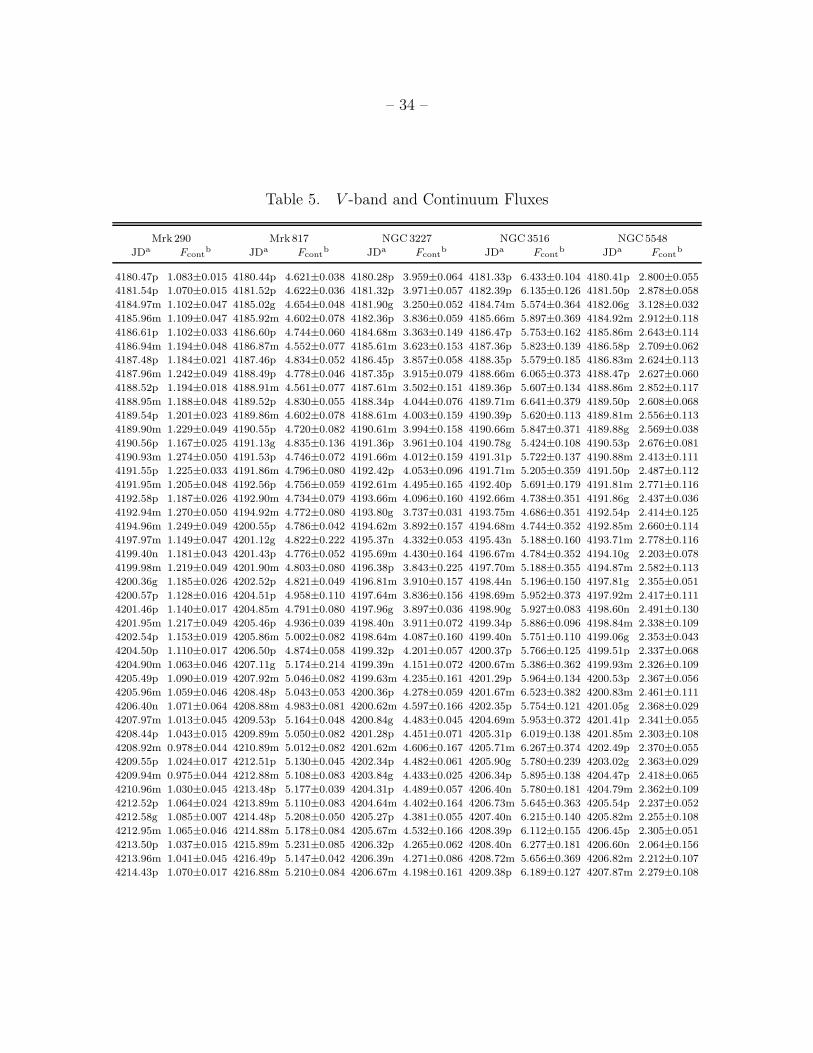
– 34 –
Table 5. V -band and Continuum Fluxes
Mrk290 Mrk817 NGC3227 NGC3516 NGC5548
JDa Fcontb JDa Fcont
b JDa Fcontb JDa Fcont
b JDa Fcontb
4180.47p 1.083±0.015 4180.44p 4.621±0.038 4180.28p 3.959±0.064 4181.33p 6.433±0.104 4180.41p 2.800±0.055
4181.54p 1.070±0.015 4181.52p 4.622±0.036 4181.32p 3.971±0.057 4182.39p 6.135±0.126 4181.50p 2.878±0.058
4184.97m 1.102±0.047 4185.02g 4.654±0.048 4181.90g 3.250±0.052 4184.74m 5.574±0.364 4182.06g 3.128±0.032
4185.96m 1.109±0.047 4185.92m 4.602±0.078 4182.36p 3.836±0.059 4185.66m 5.897±0.369 4184.92m 2.912±0.118
4186.61p 1.102±0.033 4186.60p 4.744±0.060 4184.68m 3.363±0.149 4186.47p 5.753±0.162 4185.86m 2.643±0.114
4186.94m 1.194±0.048 4186.87m 4.552±0.077 4185.61m 3.623±0.153 4187.36p 5.823±0.139 4186.58p 2.709±0.062
4187.48p 1.184±0.021 4187.46p 4.834±0.052 4186.45p 3.857±0.058 4188.35p 5.579±0.185 4186.83m 2.624±0.113
4187.96m 1.242±0.049 4188.49p 4.778±0.046 4187.35p 3.915±0.079 4188.66m 6.065±0.373 4188.47p 2.627±0.060
4188.52p 1.194±0.018 4188.91m 4.561±0.077 4187.61m 3.502±0.151 4189.36p 5.607±0.134 4188.86m 2.852±0.117
4188.95m 1.188±0.048 4189.52p 4.830±0.055 4188.34p 4.044±0.076 4189.71m 6.641±0.379 4189.50p 2.608±0.068
4189.54p 1.201±0.023 4189.86m 4.602±0.078 4188.61m 4.003±0.159 4190.39p 5.620±0.113 4189.81m 2.556±0.113
4189.90m 1.229±0.049 4190.55p 4.720±0.082 4190.61m 3.994±0.158 4190.66m 5.847±0.371 4189.88g 2.569±0.038
4190.56p 1.167±0.025 4191.13g 4.835±0.136 4191.36p 3.961±0.104 4190.78g 5.424±0.108 4190.53p 2.676±0.081
4190.93m 1.274±0.050 4191.53p 4.746±0.072 4191.66m 4.012±0.159 4191.31p 5.722±0.137 4190.88m 2.413±0.111
4191.55p 1.225±0.033 4191.86m 4.796±0.080 4192.42p 4.053±0.096 4191.71m 5.205±0.359 4191.50p 2.487±0.112
4191.95m 1.205±0.048 4192.56p 4.756±0.059 4192.61m 4.495±0.165 4192.40p 5.691±0.179 4191.81m 2.771±0.116
4192.58p 1.187±0.026 4192.90m 4.734±0.079 4193.66m 4.096±0.160 4192.66m 4.738±0.351 4191.86g 2.437±0.036
4192.94m 1.270±0.050 4194.92m 4.772±0.080 4193.80g 3.737±0.031 4193.75m 4.686±0.351 4192.54p 2.414±0.125
4194.96m 1.249±0.049 4200.55p 4.786±0.042 4194.62m 3.892±0.157 4194.68m 4.744±0.352 4192.85m 2.660±0.114
4197.97m 1.149±0.047 4201.12g 4.822±0.222 4195.37n 4.332±0.053 4195.43n 5.188±0.160 4193.71m 2.778±0.116
4199.40n 1.181±0.043 4201.43p 4.776±0.052 4195.69m 4.430±0.164 4196.67m 4.784±0.352 4194.10g 2.203±0.078
4199.98m 1.219±0.049 4201.90m 4.803±0.080 4196.38p 3.843±0.225 4197.70m 5.188±0.355 4194.87m 2.582±0.113
4200.36g 1.185±0.026 4202.52p 4.821±0.049 4196.81m 3.910±0.157 4198.44n 5.196±0.150 4197.81g 2.355±0.051
4200.57p 1.128±0.016 4204.51p 4.958±0.110 4197.64m 3.836±0.156 4198.69m 5.952±0.373 4197.92m 2.417±0.111
4201.46p 1.140±0.017 4204.85m 4.791±0.080 4197.96g 3.897±0.036 4198.90g 5.927±0.083 4198.60n 2.491±0.130
4201.95m 1.217±0.049 4205.46p 4.936±0.039 4198.40n 3.911±0.072 4199.34p 5.886±0.096 4198.84m 2.338±0.109
4202.54p 1.153±0.019 4205.86m 5.002±0.082 4198.64m 4.087±0.160 4199.40n 5.751±0.110 4199.06g 2.353±0.043
4204.50p 1.110±0.017 4206.50p 4.874±0.058 4199.32p 4.201±0.057 4200.37p 5.766±0.125 4199.51p 2.337±0.068
4204.90m 1.063±0.046 4207.11g 5.174±0.214 4199.39n 4.151±0.072 4200.67m 5.386±0.362 4199.93m 2.326±0.109
4205.49p 1.090±0.019 4207.92m 5.046±0.082 4199.63m 4.235±0.161 4201.29p 5.964±0.134 4200.53p 2.367±0.056
4205.96m 1.059±0.046 4208.48p 5.043±0.053 4200.36p 4.278±0.059 4201.67m 6.523±0.382 4200.83m 2.461±0.111
4206.40n 1.071±0.064 4208.88m 4.983±0.081 4200.62m 4.597±0.166 4202.35p 5.754±0.121 4201.05g 2.368±0.029
4207.97m 1.013±0.045 4209.53p 5.164±0.048 4200.84g 4.483±0.045 4204.69m 5.953±0.372 4201.41p 2.341±0.055
4208.44p 1.043±0.015 4209.89m 5.050±0.082 4201.28p 4.451±0.071 4205.31p 6.019±0.138 4201.85m 2.303±0.108
4208.92m 0.978±0.044 4210.89m 5.012±0.082 4201.62m 4.606±0.167 4205.71m 6.267±0.374 4202.49p 2.370±0.055
4209.55p 1.024±0.017 4212.51p 5.130±0.045 4202.34p 4.482±0.061 4205.90g 5.780±0.239 4203.02g 2.363±0.029
4209.94m 0.975±0.044 4212.88m 5.108±0.083 4203.84g 4.433±0.025 4206.34p 5.895±0.138 4204.47p 2.418±0.065
4210.96m 1.030±0.045 4213.48p 5.177±0.039 4204.31p 4.489±0.057 4206.40n 5.780±0.181 4204.79m 2.362±0.109
4212.52p 1.064±0.024 4213.89m 5.110±0.083 4204.64m 4.402±0.164 4206.73m 5.645±0.363 4205.54p 2.237±0.052
4212.58g 1.085±0.007 4214.48p 5.208±0.050 4205.27p 4.381±0.055 4207.40n 6.215±0.140 4205.82m 2.255±0.108
4212.95m 1.065±0.046 4214.88m 5.178±0.084 4205.67m 4.532±0.166 4208.39p 6.112±0.155 4206.45p 2.305±0.051
4213.50p 1.037±0.015 4215.89m 5.231±0.085 4206.32p 4.265±0.062 4208.40n 6.277±0.181 4206.60n 2.064±0.156
4213.96m 1.041±0.045 4216.49p 5.147±0.042 4206.39n 4.271±0.086 4208.72m 5.656±0.369 4206.82m 2.212±0.107
4214.43p 1.070±0.017 4216.88m 5.210±0.084 4206.67m 4.198±0.161 4209.38p 6.189±0.127 4207.87m 2.279±0.108

– 35 –
Table 5—Continued
Mrk290 Mrk817 NGC3227 NGC3516 NGC5548
JDa Fcontb JDa Fcont
b JDa Fcontb JDa Fcont
b JDa Fcontb
4214.95m 1.078±0.046 4217.48p 5.059±0.066 4207.39n 4.128±0.072 4209.73m 5.659±0.367 4208.37p 2.437±0.053
4215.96m 1.034±0.045 4217.89m 5.013±0.082 4207.77m 4.346±0.163 4210.40n 6.825±0.150 4208.83m 2.219±0.107
4216.54p 1.076±0.014 4218.51p 5.172±0.043 4207.82g 4.009±0.056 4210.72m 6.637±0.385 4208.99g 2.114±0.069
4216.95m 1.098±0.046 4218.90m 5.106±0.083 4208.32p 4.301±0.059 4211.38p 5.942±0.098 4209.50p 2.259±0.051
4217.50p 1.108±0.018 4219.03g 5.208±0.026 4208.36n 4.203±0.119 4212.32p 5.904±0.096 4209.84m 2.160±0.107
4217.93m 1.102±0.047 4219.52p 5.280±0.047 4208.67m 4.077±0.160 4212.67m 6.556±0.383 4210.08g 2.208±0.049
4218.53p 1.112±0.017 4220.45p 5.117±0.059 4209.37p 4.204±0.058 4213.28p 5.921±0.111 4210.84m 2.214±0.107
4218.95m 1.094±0.046 4220.91m 5.079±0.083 4209.65m 4.114±0.160 4213.69m 5.446±0.365 4211.53p 2.284±0.060
4220.40n 1.067±0.043 4221.48p 5.192±0.073 4210.30n 4.332±0.072 4213.77g 6.283±0.114 4212.83m 2.203±0.107
4220.48p 1.084±0.024 4222.90m 5.200±0.084 4210.67m 4.291±0.162 4214.31p 5.884±0.128 4212.89g 2.257±0.035
4220.96m 1.139±0.047 4223.50p 5.316±0.065 4210.90g 4.044±0.091 4214.68m 5.957±0.371 4213.45p 2.238±0.053
4221.57g 1.073±0.050 4223.90m 5.421±0.087 4211.34p 4.150±0.055 4215.69m 5.740±0.368 4213.85m 2.075±0.105
4221.98m 1.131±0.047 4224.48p 5.407±0.071 4212.30p 3.963±0.055 4216.31p 5.694±0.129 4214.40p 2.250±0.056
4222.53p 1.067±0.025 4224.90m 5.287±0.085 4212.62m 3.892±0.157 4216.68m 6.342±0.377 4214.84m 2.121±0.105
4222.95m 1.137±0.047 4225.49p 5.408±0.058 4213.33p 3.924±0.059 4217.37p 6.017±0.137 4215.45p 2.155±0.095
4223.53p 1.098±0.024 4226.06g 5.511±0.081 4214.29p 3.868±0.067 4217.68m 5.616±0.368 4215.85m 2.081±0.105
4223.94m 1.119±0.047 4226.44p 5.447±0.064 4214.63m 3.920±0.157 4218.44p 5.687±0.107 4216.46p 2.089±0.057
4224.45p 1.094±0.024 4226.89m 5.569±0.089 4215.37p 4.130±0.066 4218.75m 4.792±0.353 4216.84m 2.020±0.104
4224.94m 1.195±0.048 4227.53p 5.447±0.085 4215.64m 4.049±0.159 4219.28p 5.851±0.110 4217.44p 2.041±0.061
4225.52p 1.035±0.026 4227.90m 5.542±0.089 4216.63m 3.901±0.157 4219.40n 6.157±0.201 4217.84m 2.115±0.105
4225.92m 1.134±0.047 4228.91m 5.718±0.091 4217.31p 4.427±0.071 4219.79m 5.235±0.360 4218.47p 1.984±0.060
4226.42p 1.055±0.019 4229.53p 5.500±0.066 4217.63m 4.866±0.171 4220.27p 5.506±0.130 4218.77g 2.045±0.069
4226.94m 1.020±0.045 4229.88m 5.545±0.089 4218.29p 4.269±0.058 4220.40n 5.919±0.160 4218.86m 2.066±0.105
4227.95m 0.988±0.044 4230.91m 5.524±0.088 4218.30n 4.417±0.086 4220.69m 5.547±0.367 4219.50p 1.830±0.066
4228.94m 0.965±0.044 4231.45p 5.385±0.063 4218.70m 4.337±0.163 4221.33p 6.051±0.199 4219.88m 2.136±0.105
4229.45p 0.953±0.014 4231.91m 5.317±0.086 4219.30p 4.419±0.106 4221.69m 5.436±0.365 4220.41p 2.017±0.095
4229.93m 0.941±0.043 4232.02g 5.494±0.210 4219.30n 4.239±0.068 4221.84g 6.462±0.146 4220.60n 1.968±0.143
4230.95m 0.896±0.043 4232.43p 5.275±0.039 4219.74m 4.606±0.167 4222.38p 5.601±0.149 4220.86m 1.885±0.101
4231.43p 0.927±0.017 4232.90m 5.449±0.087 4219.93g 4.066±0.051 4222.69m 5.916±0.371 4221.07g 2.063±0.034
4231.50g 0.880±0.035 4233.44p 5.275±0.052 4220.29p 4.232±0.075 4223.34p 5.867±0.168 4221.46p 1.997±0.090
4231.95m 0.882±0.043 4233.89m 5.407±0.087 4220.31n 4.500±0.099 4223.69m 5.786±0.371 4221.84m 2.055±0.104
4232.38p 0.860±0.014 4234.43p 5.215±0.040 4220.64m 4.411±0.164 4224.35p 5.725±0.149 4222.51p 1.890±0.095
4232.94m 0.832±0.042 4234.89m 5.316±0.086 4221.32p 4.320±0.080 4224.69m 5.706±0.370 4222.85m 2.042±0.104
4233.47p 0.863±0.014 4235.44p 5.270±0.046 4221.35n 4.351±0.073 4226.39p 5.709±0.155 4223.05g 1.942±0.094
4233.94m 0.816±0.042 4235.90m 5.358±0.086 4221.64m 4.254±0.161 4226.71m 5.376±0.362 4223.48p 2.029±0.073
4234.46p 0.824±0.014 4236.45p 5.199±0.045 4222.37p 4.345±0.073 4227.41p 5.486±0.134 4223.85m 1.877±0.101
4234.94m 0.904±0.043 4236.90m 5.345±0.086 4222.63m 4.532±0.166 4227.69m 5.385±0.364 4224.41p 2.033±0.064
4235.46p 0.843±0.013 4237.44p 5.154±0.055 4223.36p 4.358±0.068 4229.42p 5.783±0.150 4224.85m 2.062±0.105
4235.94m 0.818±0.042 4237.90m 5.451±0.087 4223.64m 4.439±0.164 4229.73m 5.490±0.363 4225.06g 1.971±0.034
4236.95m 0.851±0.043 4239.90m 5.491±0.088 4223.83g 4.410±0.055 4230.27p 5.382±0.125 4225.46p 2.000±0.111
4237.42p 0.823±0.013 4239.93g 5.346±0.040 4224.33p 4.365±0.061 4230.69m 5.340±0.362 4225.89m 1.908±0.103
4237.95m 0.784±0.042 4240.48p 5.342±0.050 4224.63m 4.476±0.165 4231.41p 5.622±0.131 4226.37p 2.049±0.057
4238.49g 0.844±0.015 4240.89m 5.226±0.085 4225.33p 4.396±0.064 4231.70m 6.147±0.374 4226.83m 1.943±0.103
4239.57n 0.804±0.043 4241.44p 5.240±0.041 4226.26p 4.346±0.071 4232.35p 5.773±0.115 4227.50p 1.859±0.116
4239.94m 0.818±0.042 4241.89m 5.309±0.086 4226.64m 4.346±0.163 4232.68m 5.780±0.370 4227.86m 2.054±

– 36 –
Table 5—Continued
Mrk290 Mrk817 NGC3227 NGC3516 NGC5548
JDa Fcontb JDa Fcont
b JDa Fcontb JDa Fcont
b JDa Fcontb
4240.44p 0.873±0.024 4242.49p 5.213±0.050 4226.81g 4.447±0.045 4233.42n 5.834±0.231 4228.86m 1.932±0.103
4240.93m 0.858±0.043 4243.51p 5.262±0.051 4227.64m 4.207±0.161 4233.68m 6.766±0.382 4229.40p 2.046±0.049
4241.47p 0.864±0.015 4243.90m 5.303±0.086 4228.75m 4.653±0.167 4234.30p 5.854±0.120 4229.84m 2.078±0.105
4241.93m 0.876±0.043 4244.90m 5.202±0.084 4229.34p 4.257±0.061 4234.68m 6.876±0.388 4230.86m 1.954±0.103
4242.45p 0.871±0.018 4245.45p 5.194±0.041 4229.68m 4.384±0.163 4235.29p 5.756±0.118 4231.38p 1.977±0.052
4242.94m 0.899±0.043 4245.90m 5.220±0.085 4230.64m 4.560±0.166 4235.44n 6.320±0.301 4231.84g 1.873±0.079
4243.46p 0.922±0.014 4246.51p 5.196±0.044 4231.32p 4.375±0.057 4235.68m 6.184±0.377 4231.86m 1.887±0.101
4243.95m 0.966±0.044 4246.89m 5.096±0.083 4231.65m 4.346±0.163 4236.27p 6.186±0.118 4232.33p 2.058±0.047
4244.94m 0.944±0.044 4247.84g 5.206±0.020 4232.27p 4.303±0.058 4236.68m 6.785±0.386 4232.85m 1.985±0.104
4245.48p 0.934±0.016 4247.88m 5.158±0.084 4232.63m 4.272±0.162 4237.38p 5.884±0.101 4233.43p 2.024±0.048
4245.95m 0.889±0.043 4248.89m 5.120±0.083 4233.30p 4.390±0.057 4237.50n 6.235±0.251 4233.85m 2.002±0.104
4246.49p 0.915±0.014 4249.51p 5.127±0.047 4233.38n 4.650±0.133 4237.69m 6.212±0.378 4234.41p 1.902±0.048
4246.50n 0.994±0.043 4249.89m 5.028±0.082 4233.63m 4.727±0.168 4238.46n 5.375±0.271 4234.85m 2.067±0.105
4246.94m 0.889±0.043 4250.89m 5.049±0.082 4234.29p 4.474±0.058 4238.68m 5.997±0.373 4234.93g 2.041±0.027
4247.93m 0.918±0.043 4251.48p 5.135±0.064 4234.64m 4.523±0.165 4239.48p 5.676±0.154 4235.41p 1.997±0.049
4248.94m 0.914±0.043 4251.89m 4.822±0.080 4234.81g 4.764±0.035 4239.70m 5.400±0.363 4235.85m 2.003±0.104
4249.53p 0.875±0.019 4252.54p 5.036±0.111 4235.27p 4.543±0.057 4240.33p 5.426±0.119 4236.41p 2.115±0.047
4250.94m 0.829±0.042 4252.88m 5.082±0.083 4235.46n 4.874±0.113 4240.52n 5.741±0.261 4236.85m 2.020±0.104
4251.44p 0.791±0.026 4253.01g 5.119±0.058 4235.64m 4.476±0.165 4240.68m 6.180±0.376 4237.35p 1.955±0.047
4252.49g 0.770±0.015 4253.89m 4.987±0.082 4236.29p 4.520±0.055 4241.27p 5.557±0.120 4237.60n 1.960±0.195
4252.49p 0.763±0.022 4254.85m 4.924±0.081 4236.63m 4.569±0.166 4241.45n 5.615±0.281 4237.85m 1.942±0.103
4252.57n 0.716±0.085 4255.48p 4.958±0.057 4237.26p 4.501±0.058 4241.68m 6.231±0.377 4237.92g 2.047±0.027
4252.93m 0.795±0.042 4255.86m 4.780±0.080 4237.64m 4.467±0.165 4242.35p 5.518±0.106 4238.57n 2.167±0.182
4253.94m 0.764±0.041 4256.50p 5.061±0.052 4238.63m 4.467±0.165 4242.40n 5.558±0.311 4239.45p 2.062±0.057
4254.90m 0.734±0.041 4256.87m 4.868±0.080 4238.79g 4.764±0.024 4242.70m 5.973±0.372 4239.85m 1.990±0.104
4255.51p 0.723±0.020 4257.49p 4.951±0.044 4239.30p 4.374±0.061 4243.35p 5.110±0.136 4239.96g 2.041±0.027
4255.91m 0.584±0.038 4258.51p 5.007±0.062 4239.33n 4.204±0.120 4243.69m 5.861±0.371 4240.40p 2.032±0.053
4256.47p 0.715±0.017 4258.88m 5.094±0.083 4239.66m 4.616±0.167 4244.75m 5.083±0.357 4240.84m 1.912±0.103
4256.91m 0.628±0.039 4259.42p 4.951±0.039 4240.31p 4.542±0.059 4245.30p 4.978±0.136 4241.38p 2.016±0.068
4257.46p 0.725±0.015 4259.89m 5.012±0.082 4240.63m 4.783±0.169 4245.69m 4.521±0.349 4241.50n 2.176±0.195
4257.94m 0.610±0.038 4259.99g 4.935±0.094 4241.29p 4.641±0.058 4246.36n 4.467±0.171 4241.84m 2.236±0.108
4258.48p 0.724±0.015 4260.49p 4.959±0.043 4241.63m 4.912±0.171 4246.37p 5.193±0.117 4241.97g 2.043±0.053
4258.93m 0.665±0.039 4260.89m 4.788±0.080 4242.33p 4.903±0.061 4246.69m 4.262±0.343 4242.38p 2.078±0.049
4259.45p 0.696±0.014 4261.41p 4.924±0.038 4242.64m 4.829±0.170 4247.69m 4.152±0.342 4242.92m 1.960±0.103
4259.47g 0.636±0.014 4261.89m 4.820±0.080 4243.31p 4.726±0.069 4247.86g 5.191±0.127 4243.38p 2.063±0.049
4259.94m 0.689±0.040 4262.42p 4.952±0.038 4243.64m 5.024±0.173 4248.36p 4.939±0.134 4243.85m 1.971±0.103
4260.44p 0.689±0.012 4263.44p 4.978±0.041 4244.68m 5.191±0.174 4248.69m 4.731±0.353 4244.85m 2.033±0.104
4260.94m 0.612±0.038 4263.86m 4.840±0.080 4245.33p 4.901±0.122 4249.30p 4.879±0.129 4245.43p 2.076±0.065
4261.44p 0.665±0.012 4264.86m 5.005±0.082 4245.65m 5.126±0.174 4249.69m 5.083±0.359 4245.85m 2.133±0.105
4261.93m 0.594±0.038 4264.92g 4.875±0.037 4246.34n 4.992±0.080 4250.28p 5.302±0.199 4245.89g 2.007±0.066
4262.45p 0.625±0.014 4265.44c 4.870±0.094 4246.64m 5.033±0.173 4250.69m 4.822±0.354 4246.40p 2.172±0.057
4262.45g 0.667±0.014 4265.88m 4.967±0.081 4246.76g 4.919±0.057 4251.34p 5.179±0.156 4246.85m 2.023±0.104
4262.84d 0.603±0.057 4266.44c 5.125±0.097 4247.65m 4.820±0.170 4251.69m 4.258±0.345 4247.84m 2.042±0.104
4263.50p 0.679±0.014 4266.86m 5.041±0.082 4248.30p 4.608±0.084 4252.37p 4.897±0.145 4248.41p 2.194±0.164
4263.91m 0.636±0.039 4267.42c 4.985±0.095 4248.64m 4.718±0.168 4252.49n 4.360±0.160 4248.85m 2.140±0.105

– 37 –
Table 5—Continued
Mrk290 Mrk817 NGC3227 NGC3516 NGC5548
JDa Fcontb JDa Fcont
b JDa Fcontb JDa Fcont
b JDa Fcontb
4264.92m 0.645±0.039 4267.86m 4.985±0.082 4249.32p 4.522±0.086 4252.69m 4.536±0.347 4249.48p 1.985±0.074
4265.93m 0.681±0.040 4268.48c 5.206±0.098 4249.64m 4.643±0.167 4253.68m 5.022±0.353 4249.85m 2.241±0.108
4266.48c 0.728±0.057 4268.85m 4.899±0.080 4249.80g 4.749±0.066 4253.81g 5.044±0.064 4249.94g 2.153±0.034
4266.91m 0.703±0.040 4269.85m 4.852±0.080 4250.31p 4.513±0.122 4254.42n 4.558±0.211 4250.84m 2.188±0.107
4267.44c 0.704±0.056 4269.88g 4.922±0.025 4250.64m 4.374±0.163 4255.43p 4.199±0.120 4251.38p 2.212±0.079
4267.91d 0.771±0.041 4270.47c 4.909±0.095 4251.64m 4.254±0.161 4255.51n 4.368±0.291 4251.84m 2.110±0.105
4267.91m 0.713±0.060 4271.42c 4.800±0.093 4252.34p 4.219±0.072 4255.71m 4.081±0.341 4252.43p 2.116±0.088
4268.90m 0.762±0.041 4272.45c 4.846±0.094 4252.40n 4.214±0.067 4256.33p 4.295±0.116 4252.51n 1.967±0.156
4269.46c 0.755±0.058 4272.93g 4.849±0.055 4252.64m 4.096±0.160 4256.44n 4.633±0.251 4252.84m 2.258±0.108
4269.87d 0.798±0.062 4273.42c 4.956±0.095 4253.65m 3.873±0.157 4257.37p 4.542±0.087 4252.96g 2.221±0.048
4270.85d 0.841±0.063 4274.48c 4.870±0.094 4254.40n 3.844±0.080 4257.69m 3.544±0.333 4253.84m 2.077±0.105
4273.45c 0.996±0.063 4275.93g 4.900±0.031 4254.76g 4.596±0.050 4258.29p 4.365±0.143 4254.81m 2.093±0.105
4274.44c 0.946±0.062 4276.40c 4.941±0.095 4255.32p 4.603±0.058 4258.40n 4.378±0.181 4254.96g 2.249±0.042
4274.47g 0.847±0.020 4277.39c 4.902±0.095 4255.67m 4.402±0.164 4258.71m 4.111±0.341 4255.41p 2.215±0.062
4276.43g 0.863±0.012 4278.41p 4.891±0.056 4256.30p 4.598±0.058 4259.32p 4.073±0.099 4255.53n 2.159±0.182
4277.43c 0.936±0.062 4278.42c 4.919±0.095 4256.66m 4.179±0.161 4259.70m 4.091±0.336 4255.82m 2.305±0.109
4277.89d 0.891±0.064 4278.87g 4.809±0.037 4257.64m 3.994±0.158 4260.33p 4.104±0.098 4256.39p 2.388±0.056
4278.45p 0.880±0.018 4280.45p 4.734±0.097 4258.31p 4.362±0.084 4260.71m 3.871±0.334 4256.41n 2.392±0.130
4278.46c 0.879±0.061 4281.43p 4.802±0.059 4259.30p 4.203±0.054 4261.28p 4.108±0.121 4256.82m 2.492±0.112
4281.47p 0.912±0.024 4281.48c 4.510±0.089 4259.65m 3.650±0.153 4261.69m 3.127±0.323 4257.32p 2.427±0.047
4282.37g 0.892±0.014 4282.39p 4.738±0.054 4259.76g 3.848±0.111 4262.33p 3.566±0.116 4257.81m 2.654±0.114
4282.42p 0.885±0.027 4282.50c 4.535±0.089 4260.31p 4.116±0.060 4262.69m 3.147±0.321 4258.39n 2.389±0.182
4282.46c 0.881±0.061 4282.94g 4.596±0.053 4260.66m 4.152±0.161 4263.33p 3.638±0.098 4258.44p 2.431±0.056
4282.81d 0.996±0.067 4283.39c 4.694±0.092 4261.65m 3.836±0.156 4263.68m 3.264±0.323 4258.83m 2.557±0.113
4283.42c 0.848±0.060 4283.44p 4.701±0.041 4262.28p 3.965±0.061 4264.70m 2.746±0.319 4259.40p 2.459±0.052
4283.47p 0.941±0.026 4284.38c 4.582±0.090 4262.65m 3.613±0.153 4265.72m 1.946±0.301 4259.84m 2.523±0.112
4284.41c 0.837±0.060 4284.40p 4.788±0.044 4263.30p 4.018±0.056 4266.36c 2.037±0.345 4259.88g 2.550±0.021
4284.42p 0.895±0.024 4285.92g 4.574±0.100 4263.37n 3.963±0.060 4266.69m 2.377±0.310 4260.36p 2.550±0.049
4285.86d 0.816±0.062 4290.41c 4.925±0.095 4263.76g 3.831±0.089 4267.69m 1.946±0.303 4260.84m 2.363±0.109
4286.86d 0.822±0.062 4291.38c 4.805±0.093 4264.65m 3.752±0.155 4268.34c 1.732±0.339 4261.39p 2.543±0.049
4287.86d 0.835±0.063 4293.39p 5.078±0.038 4265.67m 4.161±0.161 4268.69m 1.604±0.296 4261.53n 2.866±0.195
4288.44g 0.807±0.015 4294.42p 5.005±0.046 4266.65m 4.430±0.164 4269.29c 2.226±0.348 4261.84m 2.774±0.116
4288.86d 0.686±0.060 4295.40p 5.046±0.057 4267.64m 4.968±0.172 4269.69m 1.165±0.288 4261.93g 2.488±0.056
4289.42c 0.870±0.061 4296.41p 5.089±0.041 4268.64m 4.950±0.172 4271.37c 1.918±0.342 4262.40p 2.430±0.095
4290.44c 0.813±0.059 4297.43c 5.190±0.098 4268.78g 4.645±0.105 4271.79g 1.964±0.297 4262.80m 2.495±0.112
4290.85d 0.800±0.062 4298.34p 5.194±0.034 4270.35n 4.901±0.100 4272.37c 1.700±0.338 4263.41p 2.418±0.051
4291.41c 0.826±0.059 4298.45c 5.219±0.099 4273.77g 4.896±0.048 4273.36c 1.744±0.339 4263.81m 2.609±0.113
4293.43p 0.826±0.014 4299.38c 5.070±0.096 4274.33c 2.763±0.358 4263.94g 2.462±0.042
4296.42c 0.846±0.060 4299.46p 5.218±0.074 4274.80g 2.895±0.084 4264.82m 2.284±0.108
4296.43p 0.860±0.017 4300.36c 5.175±0.098 4277.33c 3.374±0.370 4265.81m 2.333±0.109
4297.48c 0.983±0.063 4300.85g 5.266±0.059 4277.77g 2.843±0.141 4266.82m 2.177±0.107
4298.42c 1.034±0.064 4301.43c 5.217±0.099 4278.32c 3.672±0.376 4267.81m 2.169±0.107
4298.43p 0.905±0.016 4305.84g 5.270±0.117 4279.29c 3.371±0.370 4268.86g 2.199±0.040
4300.38g 0.920±0.033 4311.83g 5.655±0.027 4279.29p 3.253±0.187 4270.43n 2.309±0.182
4300.40c 0.994±0.063 4314.83g 5.656±0.041 4280.29c 2.974±0.362 4270.90g 2.332±0.021

– 38 –
Table 5—Continued
Mrk290 Mrk817 NGC3227 NGC3516 NGC5548
JDa Fcontb JDa Fcont
b JDaFcontb JDa Fcont
b JDa Fcontb
4301.46c 1.021±0.064 4319.83g 5.416±0.053 4280.41p 3.117±0.199 4272.89g 2.307±0.027
4306.36g 0.975±0.046 4330.77g 5.578±0.048 4281.30p 2.860±0.132 4274.87g 2.335±0.021
4310.33g 1.049±0.022 4281.42c 2.761±0.358 4276.84d 2.089±0.118
4318.33g 1.126±0.015 4282.31p 2.816±0.130 4276.87g 2.379±0.027
4321.33g 1.079±0.013 4283.29c 2.665±0.356 4277.80d 2.276±0.122
4283.31p 3.087±0.112 4278.35p 2.318±0.104
4284.29p 2.822±0.109 4278.83d 2.596±0.127
4284.33c 2.548±0.354 4279.36p 2.348±0.082
4290.28c 2.676±0.357 4281.37p 2.207±0.111
4291.32c 2.386±0.351 4282.37p 2.337±0.086
4293.29p 3.044±0.099 4282.76d 2.592±0.127
4294.34p 2.712±0.092 4282.85g 2.474±0.027
4295.35p 2.708±0.099 4283.41p 2.276±0.084
4296.29p 2.561±0.102 4284.33p 2.221±0.066
4296.31c 2.512±0.354 4284.90g 2.419±0.027
4298.31p 2.797±0.087 4285.77d 2.311±0.122
4299.33c 2.761±0.358 4286.76d 2.238±0.121
4299.34p 2.986±0.097 4287.76d 2.341±0.122
4300.30c 3.347±0.369 4288.76d 2.387±0.123
4288.85g 2.541±0.021
4289.39n 2.363±0.117
4290.75d 2.716±0.130
4290.85g 2.662±0.035
4292.84d 2.617±0.127
4293.36p 2.588±0.056
4293.77d 2.686±0.129
4294.82g 2.758±0.036
4296.38p 2.539±0.056
4298.38p 2.513±0.058
4299.38p 2.652±0.053
4299.83g 2.666±0.035
4304.81g 2.940±0.051
4307.84g 3.094±0.068
4309.80g 3.012±0.036
4311.81g 2.940±0.036
4313.81g 2.726±0.070
4318.81g 2.684±0.042
4319.81g 2.515±0.048
4320.80g 2.554±0.042
4330.75g 2.414±0.034
4332.77g 2.348±0.060
aJulian Dates are −2450000 and include the following observatory code to indicate the origin of the
observation: MDM — m, MAGNUM — g, CrAO spectroscopy — c, CrAO photometry — p, UNebr. —
n, and DAO — d.
bContinuum fluxes are in units of 10−15 ergs s−1 cm−2 A−1 and represent the average continuum flux
density measured ∼5100 A, rest-frame, from spectroscopic observations or the photometric V -band flux.
Spectroscopic and photometric fluxes were scaled to a uniform scale as described in Section 2.3. All fluxes

– 39 –
have been corrected for host starlight contamination.

– 40 –
Table 6. Hβ Fluxes
Mrk290 Mrk817 NGC3227 NGC3516 NGC5548
JDa FHβb JDa FHβ
b JDa FHβb JDa FHβ
b JDa FHβb
4184.97m 2.203±0.049 4185.92m 2.491±0.082 4184.68m 3.559±0.103 4184.74m 5.833±0.185 4184.92m 2.285±0.212
4185.96m 2.253±0.050 4186.87m 2.515±0.083 4185.61m 3.576±0.104 4185.66m 6.170±0.195 4185.86m 2.298±0.213
4186.94m 2.230±0.049 4188.91m 2.340±0.077 4187.61m 3.506±0.102 4188.66m 6.150±0.195 4186.83m 2.227±0.207
4187.96m 2.196±0.048 4189.86m 2.169±0.071 4188.61m 4.066±0.118 4189.71m 6.130±0.193 4188.86m 2.184±0.203
4188.95m 2.183±0.048 4191.86m 2.518±0.083 4190.61m 3.690±0.107 4190.66m 5.782±0.184 4189.81m 1.941±0.181
4189.90m 2.158±0.047 4192.90m 2.450±0.080 4191.66m 3.853±0.111 4191.71m 5.633±0.179 4190.88m 1.830±0.170
4190.93m 2.251±0.050 4194.92m 2.261±0.075 4192.61m 3.774±0.110 4192.66m 5.495±0.175 4191.81m 1.730±0.161
4191.95m 2.285±0.051 4201.90m 2.416±0.080 4193.66m 3.945±0.114 4193.75m 5.534±0.176 4192.85m 1.517±0.142
4192.94m 2.217±0.049 4204.85m 2.389±0.079 4194.62m 4.015±0.116 4194.68m 5.674±0.181 4193.71m 1.572±0.146
4194.96m 2.221±0.049 4205.86m 2.537±0.083 4195.69m 3.840±0.111 4196.67m 5.466±0.174 4194.87m 1.764±0.164
4197.97m 2.261±0.050 4207.92m 2.351±0.078 4196.81m 4.010±0.116 4197.70m 5.664±0.178 4197.92m 1.659±0.155
4199.98m 2.323±0.051 4208.88m 2.390±0.079 4197.64m 4.052±0.118 4198.69m 6.280±0.200 4198.84m 1.353±0.126
4201.95m 2.315±0.051 4209.89m 2.380±0.079 4198.64m 4.319±0.125 4200.67m 5.621±0.179 4199.93m 1.672±0.156
4204.90m 2.233±0.049 4210.89m 2.312±0.077 4199.63m 3.940±0.114 4201.67m 5.840±0.186 4200.83m 1.730±0.161
4205.96m 2.274±0.050 4212.88m 2.314±0.077 4200.62m 4.138±0.120 4204.69m 5.804±0.185 4201.85m 1.587±0.148
4207.97m 2.240±0.049 4213.89m 2.535±0.083 4201.62m 4.138±0.120 4205.71m 5.899±0.186 4204.79m 1.513±0.140
4208.92m 2.281±0.050 4214.88m 2.436±0.080 4204.64m 4.481±0.130 4206.73m 5.455±0.172 4205.82m 1.427±0.133
4209.94m 2.198±0.048 4215.89m 2.531±0.083 4205.67m 4.416±0.128 4208.72m 5.886±0.188 4206.82m 1.392±0.130
4210.96m 2.169±0.048 4216.88m 2.367±0.078 4206.67m 4.539±0.132 4209.73m 6.035±0.192 4207.87m 1.456±0.135
4212.95m 2.169±0.048 4217.89m 2.293±0.076 4207.77m 4.573±0.133 4210.72m 6.305±0.201 4208.83m 1.581±0.147
4213.96m 2.220±0.049 4218.90m 2.536±0.083 4208.67m 4.636±0.135 4212.67m 6.385±0.204 4209.84m 1.522±0.142
4214.95m 2.214±0.049 4220.91m 2.538±0.083 4209.65m 4.672±0.135 4213.69m 5.732±0.183 4210.84m 1.629±0.152
4215.96m 2.214±0.049 4222.90m 2.375±0.079 4210.67m 4.708±0.136 4214.68m 6.438±0.204 4212.83m 1.414±0.131
4216.95m 2.129±0.047 4223.90m 2.486±0.082 4212.62m 4.658±0.135 4215.69m 5.980±0.190 4213.85m 1.297±0.121
4217.93m 2.149±0.047 4224.90m 2.369±0.079 4214.63m 4.249±0.123 4216.68m 6.325±0.200 4214.84m 1.500±0.139
4218.95m 2.253±0.050 4226.89m 2.566±0.084 4215.64m 4.041±0.117 4217.68m 6.218±0.199 4215.85m 1.309±0.122
4220.96m 2.265±0.050 4227.90m 2.395±0.079 4216.63m 4.169±0.121 4218.75m 5.753±0.184 4216.84m 1.348±0.125
4221.98m 2.331±0.052 4228.91m 2.519±0.083 4217.63m 4.128±0.120 4219.79m 5.699±0.181 4217.84m 1.305±0.121
4222.95m 2.251±0.050 4229.88m 2.618±0.086 4218.70m 4.037±0.117 4220.69m 5.870±0.188 4218.86m 1.126±0.105
4223.94m 2.234±0.049 4230.91m 2.639±0.087 4219.74m 3.914±0.113 4221.69m 5.930±0.189 4219.88m 0.881±0.082
4224.94m 2.212±0.049 4231.91m 2.538±0.083 4220.64m 3.961±0.115 4222.69m 6.144±0.196 4220.86m 0.987±0.092
4225.92m 2.246±0.050 4232.90m 2.512±0.083 4221.64m 3.899±0.113 4223.69m 6.466±0.207 4221.84m 0.845±0.078
4226.94m 2.314±0.051 4233.89m 2.516±0.083 4222.63m 4.025±0.117 4224.69m 6.518±0.209 4222.85m 0.957±0.088
4227.95m 2.303±0.051 4234.89m 2.386±0.079 4223.64m 4.311±0.125 4226.71m 6.145±0.195 4223.85m 1.087±0.101
4228.94m 2.256±0.050 4235.90m 2.610±0.086 4224.63m 4.467±0.130 4227.69m 6.234±0.199 4224.85m 0.976±0.091
4229.93m 2.291±0.051 4236.90m 2.655±0.088 4226.64m 4.022±0.117 4229.73m 6.050±0.192 4225.89m 1.084±0.101
4230.95m 2.313±0.051 4237.90m 2.517±0.083 4227.64m 4.001±0.116 4230.69m 6.079±0.194 4226.83m 1.122±0.104
4231.95m 2.108±0.046 4239.90m 2.627±0.087 4228.75m 4.069±0.118 4231.70m 6.181±0.196 4227.86m 1.160±0.108
4232.94m 2.214±0.049 4240.89m 2.547±0.084 4229.68m 3.858±0.112 4232.68m 6.254±0.200 4228.86m 1.010±0.094
4233.94m 2.169±0.048 4241.89m 2.561±0.084 4230.64m 3.888±0.113 4233.68m 6.371±0.201 4229.84m 1.027±0.095
4234.94m 2.074±0.045 4243.90m 2.561±0.084 4231.65m 3.847±0.111 4234.68m 6.398±0.204 4230.86m 1.192±0.111
4235.94m 2.164±0.048 4244.90m 2.584±0.085 4232.63m 3.912±0.113 4235.68m 6.395±0.204 4231.86m 1.009±0.094
4236.95m 2.234±0.049 4245.90m 2.527±0.083 4233.63m 3.889±0.113 4236.68m 6.522±0.208 4232.85m 0.890±0.083
4237.95m 2.176±0.048 4246.89m 2.565±0.084 4234.64m 3.855±0.111 4237.69m 6.256±0.200 4233.85m 1.070±0.100
4239.94m 2.164±0.048 4247.88m 2.609±0.086 4235.64m 3.856±0.111 4238.68m 6.196±0.197 4234.85m 0.997±0.092

– 41 –
Table 6—Continued
Mrk290 Mrk817 NGC3227 NGC3516 NGC5548
JDa FHβb JDa FHβ
b JDa FHβb JDa FHβ
b JDa FHβb
4240.93m 2.143±0.047 4248.89m 2.615±0.086 4236.63m 3.830±0.111 4239.70m 6.131±0.195 4235.85m 1.010±0.094
4241.93m 2.115±0.046 4249.89m 2.421±0.080 4237.64m 3.718±0.108 4240.68m 6.304±0.201 4236.85m 0.875±0.082
4242.94m 2.074±0.045 4250.89m 2.571±0.085 4238.63m 3.756±0.109 4241.68m 6.493±0.207 4237.85m 0.953±0.088
4243.95m 2.114±0.046 4251.89m 2.521±0.083 4239.66m 3.991±0.116 4242.70m 6.323±0.201 4239.85m 0.905±0.084
4244.94m 2.078±0.046 4252.88m 2.551±0.084 4240.63m 3.930±0.114 4243.69m 6.662±0.213 4240.84m 0.952±0.088
4245.95m 2.073±0.045 4253.89m 2.480±0.081 4241.63m 4.028±0.117 4244.75m 6.223±0.198 4241.84m 0.981±0.091
4246.94m 2.141±0.047 4254.85m 2.405±0.080 4242.64m 3.816±0.110 4245.69m 6.208±0.198 4242.92m 0.950±0.088
4247.93m 2.043±0.045 4255.86m 2.670±0.088 4243.64m 4.363±0.126 4246.69m 6.139±0.195 4243.85m 1.037±0.096
4248.94m 2.114±0.046 4256.87m 2.566±0.084 4244.68m 4.049±0.118 4247.69m 5.749±0.183 4244.85m 0.984±0.091
4250.94m 2.167±0.048 4258.88m 2.600±0.086 4245.65m 4.207±0.122 4248.69m 6.103±0.195 4245.85m 0.992±0.092
4252.93m 2.181±0.048 4259.89m 2.434±0.080 4246.64m 4.218±0.122 4249.69m 6.168±0.197 4246.85m 0.741±0.069
4253.94m 2.157±0.047 4260.89m 2.544±0.084 4247.65m 4.220±0.122 4250.69m 5.914±0.189 4247.84m 0.958±0.090
4254.90m 2.055±0.045 4261.89m 2.503±0.082 4248.64m 4.260±0.123 4251.69m 5.698±0.182 4248.85m 0.740±0.069
4255.91m 2.027±0.044 4263.86m 2.319±0.077 4249.64m 4.273±0.124 4252.69m 5.805±0.184 4249.85m 0.846±0.079
4256.91m 2.148±0.047 4264.86m 2.335±0.077 4250.64m 4.139±0.120 4253.68m 5.898±0.186 4250.84m 0.659±0.061
4257.94m 2.002±0.044 4265.44c 2.157±0.080 4251.64m 4.268±0.123 4255.71m 5.973±0.190 4251.84m 0.615±0.057
4258.93m 2.005±0.044 4265.88m 2.346±0.078 4252.64m 4.034±0.117 4257.69m 5.576±0.178 4252.84m 0.801±0.074
4259.94m 1.928±0.043 4266.44c 2.326±0.086 4253.65m 3.873±0.112 4258.71m 6.062±0.193 4253.84m 0.827±0.077
4260.94m 2.033±0.044 4266.86m 2.341±0.078 4255.67m 3.695±0.107 4259.70m 5.887±0.185 4254.81m 0.870±0.081
4261.93m 1.908±0.042 4267.42c 2.392±0.089 4256.66m 3.857±0.112 4260.71m 5.631±0.178 4255.82m 1.070±0.100
4262.84d 1.915±0.060 4267.86m 2.360±0.078 4257.64m 3.473±0.101 4261.69m 5.493±0.174 4256.82m 0.988±0.092
4263.91m 1.920±0.043 4268.48c 2.435±0.090 4259.65m 3.872±0.112 4262.69m 5.194±0.163 4257.81m 1.093±0.101
4264.92m 1.856±0.041 4268.85m 2.447±0.080 4260.66m 3.476±0.101 4263.68m 5.431±0.171 4258.83m 1.028±0.096
4265.93m 1.818±0.040 4269.85m 2.338±0.077 4261.65m 3.537±0.103 4264.70m 5.417±0.173 4259.84m 1.174±0.109
4266.48c 1.820±0.061 4270.47c 2.234±0.082 4262.65m 3.183±0.092 4265.72m 5.004±0.156 4260.84m 0.984±0.091
4266.91m 1.845±0.041 4271.42c 2.105±0.078 4264.65m 3.394±0.098 4266.36c 5.213±0.369 4261.84m 1.306±0.121
4267.44c 1.887±0.062 4272.45c 2.254±0.083 4265.67m 3.471±0.100 4266.69m 5.238±0.165 4262.80m 1.200±0.112
4267.91d 1.894±0.042 4273.42c 2.166±0.080 4266.65m 3.519±0.102 4267.69m 5.161±0.163 4263.81m 1.121±0.104
4267.91m 1.770±0.055 4274.48c 2.170±0.080 4267.64m 3.661±0.106 4268.34c 4.934±0.349 4264.82m 1.089±0.101
4268.90m 1.876±0.042 4276.40c 2.082±0.077 4268.64m 3.892±0.113 4268.69m 5.101±0.160 4265.38c 1.253±0.120
4269.46c 1.866±0.062 4277.39c 2.067±0.077 4269.29c 5.047±0.357 4265.81m 1.114±0.104
4269.87d 1.894±0.060 4278.42c 2.182±0.080 4269.69m 4.768±0.149 4266.41c 0.987±0.094
4270.85d 1.805±0.057 4281.48c 2.148±0.080 4271.37c 4.018±0.284 4266.82m 1.095±0.101
4273.45c 1.865±0.062 4282.50c 2.185±0.080 4272.38c 3.586±0.254 4267.39c 1.275±0.121
4274.44c 1.859±0.062 4283.39c 2.387±0.088 4273.36c 3.521±0.249 4267.81m 1.277±0.118
4277.43c 1.982±0.066 4284.38c 2.288±0.084 4274.33c 3.911±0.277 4268.36c 1.248±0.118
4277.89d 1.942±0.061 4290.41c 2.211±0.081 4277.34c 3.974±0.281 4269.40c 1.088±0.104
4278.46c 1.893±0.062 4291.38c 2.159±0.080 4278.32c 4.500±0.319 4271.39c 1.067±0.101
4282.46c 1.872±0.062 4297.43c 2.180±0.080 4279.29c 3.776±0.267 4272.41c 1.006±0.096
4282.81d 2.008±0.063 4298.45c 2.324±0.086 4280.29c 3.619±0.256 4273.38c 1.039±0.099
4283.42c 1.943±0.064 4299.38c 2.219±0.082 4281.42c 3.889±0.275 4274.35c 1.072±0.101
4284.41c 1.974±0.065 4300.36c 2.266±0.084 4283.29c 3.902±0.276 4276.84d 1.059±0.082
4285.86d 1.950±0.062 4301.43c 2.256±0.083 4284.33c 4.070±0.288 4277.36c 1.147±0.109
4286.86d 2.093±0.066 4290.28c 4.150±0.294 4277.80d 1.040±0.081
4287.86d 2.041±0.064 4291.32c 3.658±0.259 4278.39c 1.031±0.098

– 42 –
Table 6—Continued
Mrk290 Mrk 817 NGC3227 NGC3516 NGC5548
JDa FHβb JDaFHβ
b JDaFHβb JDa FHβ
b JDa FHβb
4288.86d 2.061±0.065 4296.31c 3.823±0.271 4278.83d 1.078±0.083
4289.42c 2.071±0.069 4299.33c 3.655±0.259 4282.76d 1.161±0.090
4290.44c 1.935±0.064 4300.30c 3.441±0.244 4283.35c 1.223±0.116
4290.85d 2.134±0.067 4284.35c 0.933±0.088
4291.41c 2.092±0.070 4285.77d 1.109±0.086
4296.42c 1.977±0.066 4286.76d 0.919±0.070
4297.48c 1.985±0.066 4287.76d 0.926±0.071
4298.42c 1.868±0.062 4288.76d 1.017±0.078
4300.40c 1.977±0.065 4289.34c 1.058±0.100
4301.46c 2.001±0.066 4290.38c 1.085±0.103
4290.75d 1.153±0.088
4291.35c 1.118±0.107
4292.84d 1.101±0.084
4293.77d 1.143±0.088
4296.33c 1.215±0.116
4299.35c 1.286±0.122
4300.32c 1.251±0.118
4301.38c 1.277±0.121
aJulian Dates are −2450000 and include the same observatory codes as Table 5.
bHβ flux is in units of 10−13 ergs s−1 cm−2.
Table 7. Light Curve Statistics
Continuum Statistics Hβ Line Statistics
Sampling(days) Mean Sampling(days) Mean
Objects 〈T 〉 Tmedian Fluxa Fvar Rmax 〈T 〉 Tmedian Fluxb Fvar Rmax
(1) (2) (3) (4) (5) (6) (7) (8) (9) (10) (11)
Mrk 290 0.77 0.52 0.94 0.18 2.18 ± 0.17 1.18 1.00 2.09 0.07 1.32 ± 0.05
Mrk 817 0.84 0.56 5.06 0.05 1.27 ± 0.03 1.33 1.00 2.41 0.05 1.29 ± 0.06
NGC3227 0.55 0.45 3.27 0.10 1.88 ± 0.09 1.13 1.00 3.99 0.08 1.48 ± 0.06
NGC3516 0.60 0.54 4.86 0.28 5.90 ± 1.50 1.26 1.00 5.54 0.15 1.94 ± 0.15
NGC4051 0.56 0.45 4.49 0.09 1.69 ± 0.11 1.08 1.00 4.67 0.07 1.39 ± 0.07
NGC5548 0.70 0.48 2.29 0.11 1.71 ± 0.06 1.09 1.00 1.20 0.26 3.74 ± 0.49
aFluxes are the same units as Table 5.
bFluxes are the same units as Table 6.

– 43 –
Table 8. Rest Frame Lags, Line Widths, Black Hole Masses, and Luminosities
τcent τpeak σline FWHM Mvir MBHa logL5100
Objects rmax (days) (days) (km/s) (km/s) (×106M⊙) (×106M⊙) (ergs s−1)
(1) (2) (3) (4) (5) (6) (7) (8) (9)
Mrk 290 0.632 8.72+1.21−1.02 9.2+1.5
−1.4 1609 ± 47 4270 ± 157 4.42+0.67−0.67 24.3+3.7
−3.7 43.00+0.08−0.08
Mrk 817b 0.614 14.04+3.41−3.47 16.0+3.9
−5.3 2025 ± 5 5627 ± 30 11.3+2.7−2.8 43.3+10.5
−10.7 43.78+0.02−0.02
NGC3227 0.547 3.75+0.76−0.82 2.99+2.00
−1.00 1376 ± 44 3578 ± 83 1.39+0.29−0.31 7.63+1.62
−1.72 42.11+0.04−0.04
NGC3516 0.894 11.68+1.02−1.53 7.43+1.99
−0.99 1591 ± 10 5175 ± 96 5.76+0.51−0.76 31.7+2.8
−4.2 43.17+0.15−0.15
NGC4051 0.583 1.87+0.54−0.50 2.60+0.79
−1.40 927 ± 64 1034 ± 41 0.31+0.10−0.09 1.73+0.55
−0.52 41.82+0.10−0.36
NGC5548 0.708 12.40+2.74−3.85 6.1+9.4
−2.8 1822 ± 35 4849 ± 112 8.04+1.80−2.51 44.2+9.9
−13.8 42.91+0.05−0.05
aUsing Onken et al. (2004) calibration (except Mrk 817, see below).
bThe weak and poorly defined, triple-peaked profile of the Hβ emission in the rms spectrum necessitated
the use of the line width measured from the mean spectrum for Mrk 817 (Columns 5 and 6) and a black hole
mass (Column 8) calculated with the scale factor determined by Collin et al. (2006) for the use of this line
width measurement, f = 3.85, instead of the standard Onken et al. (2004) value of f = 5.5 that was used
for all other objects.

– 44 –
Fig. 1.—: Mean and rms (variable emission) spectra from MDM observations. The solid lines show
the narrow-line subtracted spectra, while the dotted lines show the narrow-line component of Hβ
and the [O iii] λλ4959, 5007 narrow emission lines and rms residuals.

– 45 –
Fig. 2.—: Light curves showing complete set of observations from all sources for all objects. Top:
The 5100 A continuum flux in units of 10−15 ergs s−1 cm−2 A−1. Bottom: Hβ λ4861 line flux in
units of 10−13 ergs s−1 cm−2. Observations from different sources are as follows: CrAO photometry
— solid triangles, MAGNUM photometry — solid circles, UNebr. photometry — solid squares,
MDM spectroscopy — open circles, CrAO spectroscopy — open triangles, and DAO spectroscopy
— asterisks. The solid lines show linear, secular-variation detrending fits to the light curves.

– 46 –
Fig. 2.—: Continued.
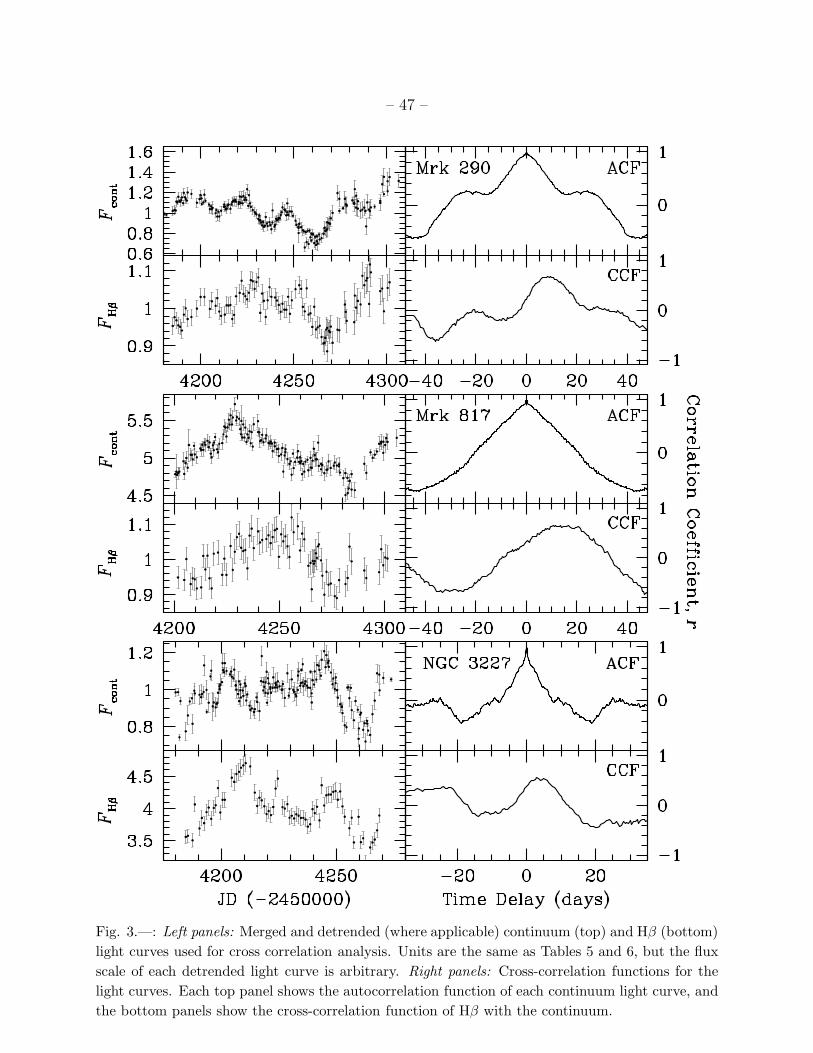
– 47 –
Fig. 3.—: Left panels: Merged and detrended (where applicable) continuum (top) and Hβ (bottom)
light curves used for cross correlation analysis. Units are the same as Tables 5 and 6, but the flux
scale of each detrended light curve is arbitrary. Right panels: Cross-correlation functions for the
light curves. Each top panel shows the autocorrelation function of each continuum light curve, and
the bottom panels show the cross-correlation function of Hβ with the continuum.

– 48 –
Fig. 3.—: Continued.

– 49 –
Fig. 4.—: CCFs before (left) and after (right) detrending selected light curves of Mrk 290 (top),
Mrk 817 (middle), and NGC3227 (bottom). See Section 2.4 for details.

– 50 –
Fig. 5.—: Top panels: Hβ rms spectral profile of each object broken into bins of equal flux
(numbered and separated by dashed lines) with the linearly-fit continuum level shown (dotted-
dashed line). Flux units are the same as in Fig. 1. Bottom panels: Velocity-resolved time-delay
measurements. Time delay measurements and errors are determined similarly to those for the mean
BLR lag, and error bars in the velocity direction show the bin size. The horizontal solid and dotted
lines show the mean BLR centroid lag and associated errors, calculated in Section 2.4.

– 51 –
Fig. 6.—: Top: Most recently calibrated RBLR–L relation (Bentz et al. 2009b, solid line). The
closed points show the location of our targets, and open points show all other objects used by
Bentz et al. Bottom: Same as top but with our new results displayed. Solid stars show new objects
or improvements upon past results which replace solid points of NGC4051, NGC3227, NGC3516,
and Mrk 290 in top panel, and open points show results for NGC5548 and Mrk 817, which serve as
additional measurements for these objects but do not replace previous measurements. Note that
we keep the same calibration of the relationship as determined by Bentz. et al.; no new fit has been
calculated with our new results.

– 52 –
Fig. 7.—: Left panels: Continuum (top) and linearly detrended Hβ light curves of Mrk 817 from
four equal flux bins. Units are the same as Tables 5 and 6. Right panels: Cross-correlation functions
for the light curves. The top panel shows the autocorrelation function of the continuum light curve,
and the lower panels show the cross-correlation function of each Hβ bin with the continuum.