A Population of Radio-loud Narrow Line Seyfert 1 Galaxies with Blazar-like Properties
29
arXiv:0806.3755v1 [astro-ph] 24 Jun 2008 ACCEPTED FOR PUBLICATION IN APJ Preprint typeset using L A T E X style emulateapj v. 08/13/06 A POPULATION OF RADIO-LOUD NARROW LINE SEYFERT1 GALAXIES WITH BLAZAR-LIKE PROPERTIES? W. YUAN 1 , H. Y. ZHOU 2,3,4 , S. KOMOSSA 4 , X. B. DONG 2,3 , T. G. WANG 2,3 , H. L. LU 2,3 , J. M. BAI 1 accepted for publication in ApJ ABSTRACT Blazars with strong emission lines were found to be associated mostly with broad-line type 1 Active Galactic Nuclei (AGN). Hitherto, evidence for blazars identified with Narrow Line Seyfert 1 (NLS1) AGN was limited to very few individual cases. Here we present a comprehensive study of a sample of 23 genuine radio-loud NLS1 galaxies which have the radio-loudness parameters, the ratio of radio (21 cm) to optical (4400Å) luminosity, greater than 100. The sample, drawn from the SDSS and FIRST, is homogeneous and the largest of this kind. A significant fraction of the sample objects show interesting radio to X-ray properties that are unusual to most of the previously known radio-loud NLS1 AGN, but are reminiscent of blazars. These include flat radio spectra, large amplitude flux and spectral variability, compact VLBI cores, very high brightness temperatures (10 11-14 K) derived from variability, enhanced optical emission in excess of the normal ionising continuum, flat X-ray spectra, and blazar-like SEDs. We interpret them as evidence for the postulated blazar nature of these very radio-loud NLS1 AGN, which might possess at least moderately relativistic jets. We suggest that those steep spectrum radio-loud NLS1 AGN in the sample are of the same population but with their radio jets aligned at large angles to the lines-of-sight. Intrinsically, some of the objects have relatively low radio power and would have been classified as radio-intermediate AGN. The black hole masses, estimated from the broad Balmer line width and luminosity, are within 10 6-8 M ⊙ , and the inferred Eddington ratios are around unity. Unless the black hole masses are largely under-estimated, our result stretches the low mass end of the black holes of luminous, fast accreting radio-loud AGN to a smaller mass regime (the order of 10 6 M ⊙ ) in the black hole mass–radio-loudness space where other normal AGN are seldom found. The results imply that radio-loud AGN may be powered by black holes with moderate masses (∼ 10 6-7 M ⊙ ) accreting at high rates (Eddington ratios up to unity or higher). The host galaxies of a few nearby objects appear to be disk-like or merger; and some of the objects show imprints of young stellar populations in their SDSS spectra. We find that some of the objects, despite having strong emission lines, resemble high-energy peaked BL Lacs in their SED with the synchrotron component peaked at around the UV; such objects constitute an intriguingly high fraction of the sample. The radio sources of the sample are ubiquitously compact. They are smaller than at most several tens of kilo-parsecs, suggesting a possible link with compact steep-spectrum radio sources. Given the peculiarities of blazar-like NLS1 galaxies, questions arise as to whether they are plain downsizing extensions of normal radio-loud AGN, or whether they form a previously unrecognised population. Subject headings: galaxies: active — galaxies: Seyfert – galaxies: jets – quasars: general – X-rays: galaxies – radio continuum: galaxies 1. INTRODUCTION As a minority of AGN, radio-loud (RL) AGN differ from their radio-quiet (RQ) counterparts mainly in possessing prominent radio jets and/or lobes that produce strong radio ra- diation. In observations, a widely used division between RL and RQ AGN is the radio-loudness parameter R ≈10, defined as the ratio between the radio 5 GHz to optical B-band lumi- nosity (Kellermann et al. 1989; Stocke et al. 1992), though it is still a controversy whether R has a bimodal distribution below and above this value. RL AGN are an important labora- tory to study the formation of relativistic jets, which is not yet understood so far (e.g. Blandford 2000; Celott & Blandford 2001; Meier 2003). Nevertheless, it is widely thought that radio-loudness (formation of radio jets) is possibly depend- ing on the accretion rate/state (e.g. Ho 2002; Maccarone et Electronic address: [email protected] 1 National Astronomical Observatories/Yunnan Observatory, Chinese Academy of Sciences, Kunming, Yunnan, P.O. BOX 110, P.R.China 2 Center for Astrophysics, University of Science and Technology of China, Hefei, Anhui, 230026, P.R.China 3 Joint Institute of Galaxies and Cosmology, SHAO and USTC 4 Max-Planck-Institut für extraterrestrische Physik, Postfach 1312, 85741 Garching, Germany al. 2003; Greene et al. 2006; Körding et al. 2006), the spin of the black hole (e.g. Blandford 2000; Maraschi & Tavecchio 2003; Sikora et al. 2007), black hole mass (M BH , e.g. Laor 2000; Lacy 2001; Dunlop et al. 2003; Mclure & Jarvis 2004; Metcalf & Magliocchetti 2006, but see Woo & Urry 2002 for a different view), and host galaxy morphology (e.g. Balmaverde & Capetti 2006; Capetti & Balmaverde 2006; Sikora et al. 2007), or a combination of some of these factors (e.g. Ballan- tyne 2007). As an important sub-class of RL AGN, blazar is a collec- tive term for BL Lac objects and flat-spectrum radio quasars (FSRQs). Blazars are characterised by flat radio spectra at above ∼1 GHz, fast variability, high and variable polariza- tion, superluminal motion, and high brightness temperatures (see e.g. Urry & Padovani 1995; Celott 2002, for reviews). They are now believed to be RL AGN with the orientation of relativistic jets close to the line-of-sight, and hence their non-thermal jet emission is highly Doppler boosted (Bland- ford & Rees 1978; Urry & Padovani 1995). Blazars have distinctive spectral energy distributions (SED) that are char- acterised by two broad humps in the log ν - log ν f ν repre- sentation. The low-energy hump is commonly interpreted as synchrotron emission, while the high-energy one as inverse
Transcript of A Population of Radio-loud Narrow Line Seyfert 1 Galaxies with Blazar-like Properties

arX
iv:0
806.
3755
v1 [
astr
o-ph
] 24
Jun
200
8ACCEPTED FOR PUBLICATION INAPJPreprint typeset using LATEX style emulateapj v. 08/13/06
A POPULATION OF RADIO-LOUD NARROW LINE SEYFERT 1 GALAXIES WITH BLAZAR-LIKE PROPERTIES?
W. YUAN1, H. Y. ZHOU2,3,4, S. KOMOSSA4, X. B. DONG2,3, T. G. WANG2,3, H. L. LU2,3, J. M. BAI 1
accepted for publication in ApJ
ABSTRACTBlazars with strong emission lines were found to be associated mostly with broad-line type 1 Active Galactic
Nuclei (AGN). Hitherto, evidence for blazars identified with Narrow Line Seyfert 1 (NLS1) AGN was limited tovery few individual cases. Here we present a comprehensive study of a sample of 23 genuine radio-loud NLS1galaxies which have the radio-loudness parameters, the ratio of radio (21 cm) to optical (4400Å) luminosity,greater than 100. The sample, drawn from the SDSS and FIRST, is homogeneous and the largest of thiskind. A significant fraction of the sample objects show interesting radio to X-ray properties that are unusual tomost of the previously known radio-loud NLS1 AGN, but are reminiscent of blazars. These include flat radiospectra, large amplitude flux and spectral variability, compact VLBI cores, very high brightness temperatures(1011−14 K) derived from variability, enhanced optical emission in excess of the normal ionising continuum, flatX-ray spectra, and blazar-like SEDs. We interpret them as evidence for the postulated blazar nature of thesevery radio-loud NLS1 AGN, which might possess at least moderately relativistic jets. We suggest that thosesteep spectrum radio-loud NLS1 AGN in the sample are of the same population but with their radio jets alignedat large angles to the lines-of-sight. Intrinsically, someof the objects have relatively low radio power and wouldhave been classified as radio-intermediate AGN.
The black hole masses, estimated from the broad Balmer line width and luminosity, are within 106−8 M⊙,and the inferred Eddington ratios are around unity. Unless the black hole masses are largely under-estimated,our result stretches the low mass end of the black holes of luminous, fast accreting radio-loud AGN to a smallermass regime (the order of 106 M⊙) in the black hole mass–radio-loudness space where other normal AGNare seldom found. The results imply that radio-loud AGN may be powered by black holes with moderatemasses (∼ 106−7 M⊙) accreting at high rates (Eddington ratios up to unity or higher). The host galaxies of afew nearby objects appear to be disk-like or merger; and someof the objects show imprints of young stellarpopulations in their SDSS spectra. We find that some of the objects, despite having strong emission lines,resemble high-energy peaked BL Lacs in their SED with the synchrotron component peaked at around theUV; such objects constitute an intriguingly high fraction of the sample. The radio sources of the sample areubiquitously compact. They are smaller than at most severaltens of kilo-parsecs, suggesting a possible linkwith compact steep-spectrum radio sources. Given the peculiarities of blazar-like NLS1 galaxies, questionsarise as to whether they are plain downsizing extensions of normal radio-loud AGN, or whether they form apreviously unrecognised population.Subject headings: galaxies: active — galaxies: Seyfert – galaxies: jets – quasars: general – X-rays: galaxies –
radio continuum: galaxies
1. INTRODUCTION
As a minority of AGN, radio-loud (RL) AGN differ fromtheir radio-quiet (RQ) counterparts mainly in possessingprominent radio jets and/or lobes that produce strong radiora-diation. In observations, a widely used division between RLand RQ AGN is the radio-loudness parameterR ≈10, definedas the ratio between the radio 5 GHz to opticalB-band lumi-nosity (Kellermann et al. 1989; Stocke et al. 1992), thoughit is still a controversy whetherR has a bimodal distributionbelow and above this value. RL AGN are an important labora-tory to study the formation of relativistic jets, which is not yetunderstood so far (e.g. Blandford 2000; Celott & Blandford2001; Meier 2003). Nevertheless, it is widely thought thatradio-loudness (formation of radio jets) is possibly depend-ing on the accretion rate/state (e.g. Ho 2002; Maccarone et
Electronic address: [email protected] National Astronomical Observatories/Yunnan Observatory, Chinese
Academy of Sciences, Kunming, Yunnan, P.O. BOX 110, P.R.China2 Center for Astrophysics, University of Science and Technology of China,
Hefei, Anhui, 230026, P.R.China3 Joint Institute of Galaxies and Cosmology, SHAO and USTC4 Max-Planck-Institut für extraterrestrische Physik, Postfach 1312, 85741
Garching, Germany
al. 2003; Greene et al. 2006; Körding et al. 2006), the spin ofthe black hole (e.g. Blandford 2000; Maraschi & Tavecchio2003; Sikora et al. 2007), black hole mass (MBH, e.g. Laor2000; Lacy 2001; Dunlop et al. 2003; Mclure & Jarvis 2004;Metcalf & Magliocchetti 2006, but see Woo & Urry 2002 for adifferent view), and host galaxy morphology (e.g. Balmaverde& Capetti 2006; Capetti & Balmaverde 2006; Sikora et al.2007), or a combination of some of these factors (e.g. Ballan-tyne 2007).
As an important sub-class of RL AGN, blazar is a collec-tive term for BL Lac objects and flat-spectrum radio quasars(FSRQs). Blazars are characterised by flat radio spectra atabove∼1 GHz, fast variability, high and variable polariza-tion, superluminal motion, and high brightness temperatures(see e.g. Urry & Padovani 1995; Celott 2002, for reviews).They are now believed to be RL AGN with the orientationof relativistic jets close to the line-of-sight, and hence theirnon-thermal jet emission is highly Doppler boosted (Bland-ford & Rees 1978; Urry & Padovani 1995). Blazars havedistinctive spectral energy distributions (SED) that are char-acterised by two broad humps in the logν − logν fν repre-sentation. The low-energy hump is commonly interpreted assynchrotron emission, while the high-energy one as inverse

2 W. Yuan, et al.
Compton emission scattering off the same electron popula-tion which produces the synchrotron emission. Depending onthe peak frequency of the synchrotron hump, BL Lac objectsare divided into Low-energy-peaked BL Lacs (LBL) with thepeak around IR–optical wavelengths and High-energy-peakedBL Lacs (HBL) with the peak around UV/soft X-ray energies(Padovani & Giommi 1995). Classical FSRQs have generallythe peak frequencies of the synchrotron hump similar to oreven lower than LBL. Interestingly, it was suggested that thewhole blazar family can be arranged in a sequence from HBLto LBL and to FSRQ in the order of decreasing synchrotronpeak frequencies and increasing source power—the so calledblazar sequence5 (Fossati et al. 1998). However, exceptionswere also reported in recent years as the presence of powerfulFSRQs with HBL-like SEDs (though this remains a matter ofcontroversy), whose synchrotron hump is peaked around theUV/soft X-ray band (see e.g. Padovani et al. 2003, and refer-ences therein). Following Perlman et al. (1998), we term FS-RQs with HBL-like SED HFSRQs (High-energy-peaked FS-RQs), and those with LBL-like SED—the classical FSRQs—LFSRQs (Low-energy-peaked FSRQs), as parallels to HBLsand LBLs.
Until recently, RL AGN (blazars) with strong broad emis-sion lines were found to ubiquitously have the Balmer linewidths greater than 2000 kms−1 in full width at half maximum(FWHM). It was found that the line width is correlated withthe orientation of the radio axis, with narrower lines as well asstronger optical FeII emission in objects with smaller viewingangles to the radio axis (e.g. Wills & Browne 1986; Jackson& Browne 1991). This was interpreted as arising from a disk-like emission line region. A marked absence of radio-loudquasars (RLQs) was noted below the 2000 kms−1 line-widthcutoff (Wills & Browne 1986), that is the characteristic line-width range for narrow line Seyfert 1 galaxies—a sub-classof type 1 AGN in contrast to the classical Broad Line AGN(BLAGN). The situation has changed since the detection ofradio emission from NLS1 galaxies.
Apart from narrow line-widths of the broad Balmer lines(originally defined as< 2000 kms−1, Osterbrock & Pogge1985; Goodrich 1989), NLS1 galaxies also show other ex-treme properties compared to normal broad line AGN (seeKomossa 2008, for a recent review), such as strong permit-ted optical/UV FeII emission lines (Boroson & Green 1992;Grupe et al. 1999; Véron-Cetty et al. 2001), steep soft X-rayspectra (Wang et al. 1996; Boller et al. 1996; Grupe et al.1998), and rapid X-ray variability (Leighly 1999; Komossa& Meerschweinchen 2000). Observational evidence suggeststhat NLS1 galaxies tend to have small black hole masses andhigh Eddington ratios (defined as the bolometric to the Ed-dington luminosity ratio),REdd ≡ Lbol/LEdd ≈ 1 (e.g. Boro-son 2002; Collin & Kawaguchi 2004). In fact, they werefound to locate at one extreme end, opposite to BLAGN, ofeigenvector1 of the correlation matrix which is believed tobedriven primarily byREdd (Boroson & Green 1992; Sulentic etal. 2000). NLS1 galaxies were once thought to be radio-quiet.This was simply a consequence of the fact that NLS1 galaxieshave a low radio-loud fraction (Zhou et al. 2006; Komossa etal. 2006b) and the small number of NLS1 galaxies known tillthen.
Previous studies of the radio properties of NLS1 galaxies
5 The blazar sequence can be explained as, for instance, the decrease of theenergy of electrons emitting at the SED peaks with increasing energy densityof the seed photons for Compton scattering (Ghisellini et al. 1998)
are all based on small samples. These showed that the ra-dio sources, if detected, are compact (less than a few hun-dred parsec), at modest radio power (Ulvestad et al. 1995),of steep radio spectra (Moran et al. 2000), mostly in the RQregime (Stepanian et al. 2003), and of low RL fraction (Zhou& Wang 2002). Until recently, there were only several RLNLS1 galaxies identified and studied individually (see Ko-mossa et al. 2006b, for a review and references therein). Stud-ies using (small) samples of RL NLS1 galaxies were carriedout by Komossa et al. (2006b) and Whalen et al. (2006) fornon-radio selected and radio selected objects, respectively.These studies confirmed that, as in ‘normal’ NLS1 galaxies(their RQ counterparts), RL NLS1 AGN are accreting at ahigh rate close to the Eddington limit. More importantly, aspointed out by Komossa et al. (2006b), with relatively lowMBH and highR, they occupy a previously sparsely populatedregion in theMBH–R diagram. Most of the sources of thatsample are compact steep spectrum sources. It was confirmedthat RL NLS1 galaxies are rare (∼ 7%), and very radio-loudobjects withR > 100 are even more sparse (see also Zhou &Wang 2002; Zhou et al. 2006), compared to about 10–15% fornormal BLAGN and quasars (e.g. Ivezic et al. 2002). Severalof these studies discussed the starburst versus AGN contri-bution to the radio emission, and concluded that it is AGNdominated.
Of particular interest, a few outstanding RL NLS1galaxies came to be known to exhibit blazar properties.RXJ 16290+4007 (Schwope et al. 2000; Grupe et al. 2004)was known as a blazar and its X-ray emission is dominatedby synchrotron emission (Padovani et al. 2002), or else bysoft X-ray emission that is typical for NLS1 galaxies, per-haps from the accretion disk (Komossa et al. 2006b). TheSED of PKS 2004-4476 (Oshlack et al. 2001) was well mod-eled with the blazar type (Gallo et al. 2006). Using infor-mation on the radio flux variations, very high radio bright-ness temperatures (& 1013 K) were inferred for J0948+0022(Zhou et al. 2003) and 0846+5137 (Zhou et al. 2005)—bothincluded in our sample, arguing for relativistic beaming (seealso Wang et al. 2006). They also show some other blazar-likebehavior. Recently, Doi et al. (2006, 2007) performed high-resolution VLBI observations for several radio-loud NLS1AGN (three are included in our sample8) and found that theyare unresolved with milli-arcsec resolutions, setting directlower limits on the brightness temperatures in the range of107 − 109 K. They also found that inverted radio spectra arecommon in the radio-loudest objects. The authors suggestedthat Doppler beaming, presumably resulting from highly rel-ativistic jets, can explain naturally the observations. Inthisrespect, the most remarkable object of this kind is perhaps2MASX J0324+3410, found in our recent work (Zhou et al.2007). It showed rapid variability in the radio, optical, and X-ray bands, and was even claimed to be marginally detected inTeVγ-rays (Falcone et al. 2004). Its non-thermal SED clearlyresembles that of HBLs. Moreover, 2MASX J0324+3410 ishosted by a relatively small, apparent disk galaxy with one-armed spiral or ring galaxy morphology. These enigmaticobjects present a challenge to current models of both NLS1galaxies and blazars, and render a unique opportunity to studyjet formation in black hole systems accreting at high rates.
6 However, the NLS1 nature of PKS 2004-447 is not certain; see Zhou etal. (2003) for a short comment.
7 A formerly known blazar; see Appendix B for details.8 J0948+0022, J1633+4718, and J1644+2619.

Radio-loud Narrow Line Seyfert 1 galaxies 3
Apparently, they do not seem to belong to any types of AGNcurrently known. An immediate question is whether they aresome exceptional individuals or there exists a population ofsuch objects. What are their general properties in continuumand line emission, central engine and host galaxies? What aretheir relations with other types of AGN?
Motivated by these issues, we compiled a RL NLS1 galaxysample from the Sloan Digital Sky Survey (SDSS) database,aimed at a systematic study with a large and homogeneoussample. Since, as the first step, we focus on genuine RL ob-jects, we consider in this paper objects with the radio-loudnessparameterR > 100 (see § 2.2 for the definition ofR) for thefollowing reasons. Firstly, the classification of AGN into RLand RQ is somewhat ambiguous in the rangeR = 10− 50due to the presence of (a small number of) so called radio-intermediate AGN spanning in between the bulks of the twoclasses, which may have a different origin from genuine RLobjects (e.g. Falcke et al. 2006a). The same may also be truefor NLS1 galaxies. Secondly, inR > 100 objects contamina-tion of radio emission from the host galaxy is negligible (see§ 6.2.1). Thirdly, their jet component, if present, can be de-tected and studied relatively easily in other wavebands thanthe radio, such as optical and X-rays. Last, but not the least,they are the least studied objectsas a sample, due to their ex-treme rarity, in contrast to less RL NLS1 galaxies as the bulkin the samples of Komossa et al. (2006b) and Whalen et al.(2006). We defer to a later paper a comprehensive and com-plete treatment of the SDSS–FIRST detected NLS1 galaxiessample, including radio-intermediate objects, to addressques-tions such as the RL–RQ dichotomy for NLS1 galaxies. Ourresults show that there exists a population of NLS1 galaxiesthat are blazar-like, despite their rarity.
The compilation of the sample and the analyses of multi-waveband data are described in § 2. The broad band con-tinuum and emission line properties are presented in § 3 and§ 4, respectively. In § 5 the properties of their host galax-ies are presented. We discuss other properties such as blackhole mass and accretion rate, and isotropic radio emission,aswell as the implications of the results in § 6. Throughout thepaper, we assume a cosmology withH0= 70 km s−1 Mpc−1,ΩM = 0.3, andΩΛ = 0.7. Errors are quoted at the 68% confi-dence level unless mentioned otherwise. We use the followingconventions to denote power-law spectral indices:αν in thefrequency domain [S(ν) ∝ ναν , specificallyαr≡αν in the ra-dio band], andαλ in the wavelength domain [S(λ) ∝ λαλ ];and the X-ray photon indexΓ, defined asfpho(E) ∝ E−Γ,where fpho(E) is X-ray photon number flux density.
2. SAMPLE COMPILATION AND MULTIWAVELENGTH DATAANALYSIS
2.1. SDSS NLS1 galaxy sample
We have carried out a systematic search for NLS1 galax-ies from the SDSS spectroscopic samples and the first resultshave been published in Zhou et al. (2006). The proceduresof data analysis have been documented in that paper in detailand only an outline is summarised here. We carefully fit emis-sion line spectra, AGN continua, and host galaxy starlight ina self-consistent manner. Firstly, galaxy starlight and AGNcontinuum, as well as the optical FeII emission complex aremodeled (see Appendix A for a brief account) and then sub-tracted. The optical FeII multiplets are modeled with the FeIIspectral data given by Véron-Cetty et al. (2004) for both thebroad and narrow components. Emission line spectra are fit-ted with the following models, using a code similar to that
described in Dong et al. (2005). The Balmer emission linesare de-blended into a narrow and a broad component, whichare modeled by a Gaussian and a Lorentz profile, respectively.All narrow emission lines are fitted with a single Gaussian ex-cept the [OIII ] λλ4959/5007 doublet. Each line of the [OIII ]doublet is fitted with two Gaussians, one of which is used toaccount for a possible blue wing as seen in a few objects. Asshown in Zhou et al. (2006), our analysis procedures yieldreliable and accurate measurements of emission line parame-ters.
The SDSS spectroscopic samples of both galaxies andQSOs in the redshift range ofz < 0.8 were analyzed basedon the SDSS data release 5 (DR5, Adelman-McCarthy et al.2007). Following Zhou et al. (2006), we classify NLS1 galax-ies as those having the “broad" component of Hβ or Hα whichis detected at the 10σ or higher confidence level and is nar-rower than 2200 kms−1 in FWHM. As discussed in Zhou etal. (2006), objects selected as such fulfill naturally the sec-ond of the conventional criteria of NLS1 classification, i.e.[O III ]λ5007/Hβ < 3, and the sample is reliable and uniform.As a result, about 3300 NLS1 galaxies are found, supersed-ing the previously published 2011 drawn from the SDSS DR3(Zhou et al. 2006, hereafter Zhou06 sample).
2.2. Search for radio counterparts
Having compiled a large NLS1 galaxies sample from theSDSS, we search for their radio emission using data of theFIRST9 survey (Becker et al. 1995). The survey has a spa-tial resolution of 5′′and typical 90% source positional uncer-tainty ellipses less than 1′′. The identification is performedby matching the SDSS positions of NLS1 AGN against thoseof radio sources following the procedure used by Lu et al.(2007). This procedure was designed to search for SDSSquasars detected in the FIRST survey, and is summarised here.Since extended radio sources often have multiple (diffuse)components in morphology and sometimes their positions arevague to define, we treat extended sources differently fromcompact sources in search of radio counterparts. By compactFIRST source we mean that only one source is found within3′of the optical position and is unresolved; for them, we usea 2′′matching radius. We search for possible extended radiosources associated with the NLS1 AGN in two steps. First,candidates are selected if they match one of the following cri-teria. (1) Only one resolved radio source is found within 3′ofthe optical position, and the optical position is located withinthe size of the radio source. (2) Two radio sources are lo-cated nearly symmetrically around the optical position within3′. (3) More than two radio sources are scattered around theoptical position within 3′. Then we visually inspect 6′ × 6′
cutouts of the FIRST images centered at an object to rejectfalse matches. As discussed in Lu et al. (2007), this approachhas proved to be effective for finding extended radio sourcesassociated with AGN; about 24% of the radio quasars in thesample of Lu et al. (2007) are resolved by the FIRST survey,among which half show FR II type morphology (Fanaroff &Riley 1974).
This procedure yields a sample of SDSS NLS1 galax-ies detected in the FIRST survey. Interestingly, we notethat all the radio sources associated with these NLS1AGN are compact in morphology. For each object wecalculate the radio-loudness parameter defined asR1.4≡fν (1.4GHz)/ fν(4400Å), where the fluxes are in the rest
9 Faint Images of the Radio Sky at Twenty-centimeters

4 W. Yuan, et al.
frame of the objects10. The rest frame 4400 Å flux densitiesare calculated from the SDSS g-magnitudes assuming a spec-tral slopeαν=−0.5. An index of−0.5 is also assumed for theK-correction for the radio fluxes. We focus on very radio-loudobjects only withR1.4> 100 in this paper, and will present thewhole sample elsewhere.
We note that three NLS1 galaxies with apparentR1.4> 100stand out for their extremely red optical continua (αλ& 2.7),namely, J095919.14+090659.4, J111354.66+124439.0, andJ233903.82-091221.3. Our original fit to the continuum spec-trum with a fixed power law slopeαλ = −1.7 yields substan-tial reddening ofE(B −V )=0.7–1. Among them, J233903.82-091221.3 (z=0.66) has been found to show convincing evi-dence for substantial dust extinction (Wang et al. 2005)11.Given the fact that the other two objects resemble closelyJ2339-0912 in their SDSS spectra, their optical light is mostlikely subject to heavy extinction as well. After correctionfor extinction, their radio-loudness parameters are largely re-duced toR1.4≃ 10− 20, below or merely close to the RL/RQdividing line. We therefore exclude these three objects fromour current sample.
2.3. Very radio-loud NLS1 galaxy Sample
The above selection procedures result in 23 NLS1 galaxieshavingR1.4> 100, which compose our sample. By exclud-ing less RL objects withR1.4 < 100 our sample can be re-garded as very radio-loud to some extent. We believe that theradio-loudness estimates of our sample are not significantlyaffected by optical extinction, as is discussed in § 6.2.2. Theobjects are listed in Table 1, along with some relevant parame-ters of the continua and emission lines. As demonstration, weshow in Figure 1 examples of the SDSS spectra and their bestfit models for two representative objects; they are chosen torepresent the ranges of some characterising parameters of thesample. Measurable starlight contribution is present in onlyone object, J1633+4718, accounting for at most∼20% of itsobserved spectral flux density at 5100 Å. Most of our objectsshow strong FeII emission complexes (see Section 4). The[O III ] lines are weak in general, all having [OIII ]λ5007/Hβ< 1.2. All of the objects fulfill the conventional definition ofNLS1 (Osterbrock & Pogge 1985; Goodrich 1989), and aretherefore bona-fide NLS1 galaxies.
The redshift and radio-loudness distributions are plottedinFigure 2. Our sample has a relatively high redshift distributionpeaked atz ∼ 0.5 (the median). We calculate theB-band abso-lute magnitudesMB assumingαλ=−1.5 for the K-correction,which are listed in Table 1. TheMB values range from−20.8to −25.6, with a median of−22.8. Among the sample, 10objects are as bright asMB ≤ −23 and hence can be classi-fied as narrow-line type I quasars. Three objects in the sam-ple have been previously identified with RL NLS1 galaxiesand studied in detail, namely, J094857.32+002225.5 (Zhouet al. 2003), J084957.98+510829.0 (Zhou et al. 2005), andJ172206.03+565451.6 (Komossa et al. 2006a). In addition,several objects were known as general RL AGN and havebeen studied previously, whose properties are summarised in-
10 It should be noted that our definition of radio-loudness,R1.4, is related tothe previously commonly usedR6cm ≡ fν (6cm)/fν (4400Å) (Kellermann etal. 1989) viaR1.4= 1.9R6cm. Therefore, our radio-loudness cutoff correspondsto R6cm & 50.
11 In addition to the extremely red optical continuum, its SDSSspectrumshows signatures of reddening of broad emission lines, detection of strongCaII and MgII absorption lines of non-stellar origin (see Wang et al. 2005,for details).
dividually in Appendix B.
2.4. X-ray and UV data analysis
We have searched for X-ray emission from the sampleobjects using ROSAT source catalogues of the RASS andpointed observations of both the RXP (Voges et al. 1999) andWGA (White et al. 1995) catalogues. The matching radii are 5times the given positional errors of ROSAT sources, which aretypically 10′′–20′′. For each match, we visually inspect theirSDSS optical images to avoid spurious matches in which theX-ray source is actually associated with another nearby ob-ject within the matching radius. Of the 23 objects, 12 weredetected in the RASS and 4 in pointed observations, amongwhich 2 detected in both. Thus a total of 14 objects—morethan half of the sample—were detected in X-rays with theROSAT PSPC12.
All of the objects except J1633+4718 do not have sufficientX-ray counts to allow proper spectral modeling. FollowingSchartel et al. (1996), Siebert (1996), and Yuan (1998), weestimate the X-ray photon indexΓ from the two hardness ra-tios13, wherever available, assuming an absorbed power-lawspectral model. BothΓ and absorption column densityNHcan be estimated as free parameters, or the index alone as-sumingNH to be the Galactic column density. This methodhad been verified to be reliable and robust under the assump-tion that intrinsic spectral shapes are indeed a simple absorbedpower-law (Brinkmann & Siebert 1994). The X-ray fluxes inthe ROSAT PSPC band (0.1–2.4keV) are calculated from thecount rates using the energy to counts conversion factor (ECF)for a power law spectrum and Galactic absorption (ROSATAO-2 technical appendix, 1991). The ECF for each X-raysource is explicitly calculated from the ROSAT PSPC effec-tive area14, by using information on individualΓ if obtain-able, or using the mean otherwise (Γ = 2.49, see below). Welist some of the information about the X-ray observations inTable 2.
For objects not detected in X-rays, we determine upper lim-its on their X-ray fluxes from count rate limits set by theRASS. Since the X-ray backgrounds are very low in most ofthe RASS observations, detection of a source is mostly deter-mined by the source photon counts that follow Poisson statis-tics. We set an upper limit of source counts as 12 for an objectnot detected in the RASS, as often adopted (e.g. Yuan et al.1998). The corresponding count rate limit is then calculatedby using the effective exposure time at the source position asavailable from the RASS exposure map. Then the flux limitfor each object is calculated using the same method above andassumingΓ as the mean.
Among the ROSAT detected objects, J1644+2619 was ob-served with Chandra with a large number of photon countsaccumulated. Moreover, for J0849+5108 the hardness ratios(HR1 = 0.97±0.11,HR2 = 0.28±0.15) yield an abnormallyflat spectrumΓ = 0.6+0.36
−0.52 (see also Zhou et al. 2005). Forthis object we also investigate its ROSAT data in spite of therelatively low number of counts (∼ 60). We perform X-rayspectral and timing analysis for J1633+4718, J1644+2619,and J0849+5108. We briefly describe here the data reduction
12 Positional Sensitive Proportional Counter13 Defined asHR1 = (C2 −C1)/(C2 +C1), HR2 = (C4 −C3)/(C4 +C3), where
C1, C2, C3 andC4 are the number of photon counts in the 0.1–0.4 keV, 0.5–2.0 keV, 0.5–0.9 keV, and 0.9–2.0 keV bands, respectively.
14 We used those that are appropriate for the RASS or pointed observa-tions, accordingly.

Radio-loud Narrow Line Seyfert 1 galaxies 5
4000 5000 6000 7000 8000
0
50
100 SDSS J163323.58+471859.0
0
50
100
150
4800 4900 5000
−5
5
3000 4000 5000
0
10
20
30SDSS J104732.68+472532.1
0
20
40
4800 4900 5000
−5
5
Rest Wavelength (A)
Flu
x(1
0−
17
ergs
s−1
cm−
2A
−1)
FIG. 1.— Examples of the SDSS spectra of two radio-loud NLS1 galaxies in our sample. The left-hand side panels show the rest frame spectra and the fitsto the continuum with a nuclear power-law (blue color) and optical FeII emission (magenta) model, plus host galaxy starlight contribution (green) wherevernon-negligible (see § 2.1 for a description of spectral analysis). The panels on the right-hand side show a close-up of the continuum-subtracted emission linespectra and the best fits in the Hβ–[O III ] region. SDSS J1633+4718 (upper panel), a flat-spectrum radio source, has the lowest radio-loudness and redshift, andits spectrum is among the highest S/N; it has the largest fraction (∼20%) of detectable host galaxy starlight contribution among the sample. SDSS J1047+4725(lower panel), a steep-spectrum radio source, has the highest radio-loudness and redshift, and its spectral S/N is among the lowest in the sample.
FIG. 2.— Distribution of the radio loudnessR1.4 (left panel) and redshifts (right panel) of the radio-loud NLS1 galaxies sample.

6 W. Yuan, et al.
procedures and present results in § 3.3. We use version 12.2of XSPEC (Arnaud et al. 1996) for spectral modeling.
J1633+4718 (RXJ 16333+4719): The target was observedwith the ROSAT PSPC-b with an exposure time of 3732 sec-onds on July 24th, 1993 (Obs-ID: 701549; PI: N. Bade). Weretrieved the ROSAT data from the archive and use the XS-ELECT (version 2.3) tool of FTOOLS (Blackburn 1995) fordata analysis. The X-ray spectrum is extracted from a circleof150′′radius, and a background spectrum is extracted from anannulus with inner/outer radii of 195/300′′. There are∼ 976net source counts, and the count rate is 0.26±0.01ctss−1. Thespectrum in the 0.1–2.4keV band is binned to have at least30 counts in each bin. J1633+4718 was also detected in theRASS with a weighted exposure of 909 s, yielding∼ 185 netsource counts and a count rate 0.20±0.02ctss−1. We extractthe RASS spectrum following the procedure described in Bel-loni et al. (1994).
J1644+2619: The object was targeted with the ChandraACIS-S (PI: S. Laurent-Muehleisen) with an exposure timeof 2946 s on June 02, 2003. The data were retrieved fromthe Chandra data archive and were reduced from the level-2data set following the standard procedure using CIAO (ver-sion 3.4). There are 553±44 net source counts detected, witha count rate of 0.188ctss−1. The 0.2–5 keV spectrum (veryfew counts accumulated above 5 keV) is binned to have atleast 20 counts in each energy bin.
J0849+5108: The object was observed with the ROSATPSPC-b in a pointed observation as a target in 1993, Aprilwith an exposure time of 4496 s (Obs-ID: 700821). There areonly 63 net source counts detected in the 0.1–2.4keV band.We fit the unbinned spectrum by minimizing the C-statistic(Cash 1979; Nousek & Shue 1989), which is valid for Poissonstatistics appropriate to the low counts regime.
We also searched for UV data from the GALEX (Martinet al. 2005) GR2/GR3 data release15. Twelves objects in oursample have available photometric measurements in the farand/or near UV imaging bands with an effective wavelengthof 1516 Å and 2267 Å, respectively. Their UV images aremostly point source like. The GALEX magnitudes (in the ABmagnitude system) are corrected for Galactic extinction usingAFUV/E(B−V ) = 8.376 andANUV/E(B−V ) = 8.741, followingWyder et al. (2005).
3. BROAD BAND CONTINUUM RADIATION
3.1. GHz radio emission
3.1.1. Radio morphology and spectrum
The FIRST radio images of our RL NLS1 sources are ubiq-uitously unresolved at a resolution of 5.4′′, which is remark-able. This sets upper limits on the projected size of 10–40kpc,depending on the redshift. Among our sample there are sev-eral objects observed with VLBI, including J0948+0022 (Doiet al. 2006), J1633+4718 and J1644+2619 (Doi et al. 2007),and J1505+0326 (Dallacasa et al. 1998), as reported in the lit-erature; they remain unresolved at resolutions ranging froma few milli-arcsec to a few tens of milli-arcsec, which cor-respond to several to several-tens parsec in physical scale.These observations set constraints on the brightness temper-atures ofTB > 108−9 K (Doi et al. 2006, 2007). Since all theradio sources in our sample are compact, we use hereafterthe average of the FIRST and NVSS16 measurements as their
15 http://galex.stsci.edu/GR2/16 The NRAO VLA Sky Survey
FIG. 3.— Distribution of the radio spectral indicesαr around 5 GHz [S(ν)∝ναr ].
1.4 GHz flux densities in the following analysis; this is to min-imize the effects of fluctuations on the results caused by largeflux variations. Similarly, at other frequencies, in cases wheremultiple epoch measurements are available at the same fre-quency, the average flux is used.
Multi-frequency and multi-epoch radio data were collectedfrom the NASA/IPAC Extragalactic Database (NED). Of the23 objects, 11 have flux measurements at 5 GHz, for whichthe 1.4 GHz–5 GHz spectral indicesαr are estimated, thoughthe observations were not simultaneous. The 5 GHz fluxesandαr are listed in Table 1, and the histogram ofαr is shownin Figure 317. It can be seen that the radio spectra are system-atically flat, with a median of−0.30 and a mean of−0.13.Adopting the conventional dividing line between flat- andsteep-spectrum sources,αr= −0.5, 8 out of the 11 objects withαr measurement turn out to be flat-spectrum radio sources(αr> −0.5). In particular, several objects show an invertedradio slope (αr > 0) near 5 GHz and toward higher frequen-cies based on simultaneous multi-frequency measurements,namely, J0948+0022 (Reich et al. 2000; Zhou et al. 2003; Doiet al. 2006), J1633+4718 (Neumann et al. 1994), J1644+2619(Doi et al. 2007), and J1505+0326 (Tinti et al. 2005). Only 3objects haveαr steeper than, yet very close to,−0.5.
Among the remaining 12 objects without available slopesnear 5 GHz, 9 have lower frequency 327 MHz–1.4GHz in-dices measurable (see Section C), out of which 6 have flatspectra (α1.4G
327M > −0.5). Thus, it is likely that most of these12 objects may have the same flat (or even flatter) indicesat higher frequencies as well, unless there is a break near1 GHz, as in Gigahertz-peaked spectrum sources (GPS). Thisfact supports further the flat spectral index distribution foundabove for our sample. Though in part of the sample the radioslopes are estimated from non-simultaneous data, the currentαr distribution should be correct in the statistical sense; there-fore, we expect that the bulk of our sample objects should beflat-spectrum sources. As is known, radio sources with flatspectrum, which can be produced by relativistic jet models(e.g. Blandford & Königl 1979), have a fairly good chance tobe blazars (e.g. Fugmann 1988).
Now we can elaborate the radio-loudness parameter cal-culation for our sample by using the averaged 1.4 GHz fluxdensities and the estimatedαr for individual sources for theK-correction (if not available,αr=−0.5 is assumed as above).
17 For J0849+5108, the flux variations at 1.4 GHz were substantial and thespectral shape around 5 GHz was flat or even inverted (Arp et al. 1979); wethus useαr=0 for this object in the analysis below.

Radio-loud Narrow Line Seyfert 1 galaxies 7
We also make use of the measured optical slopes as presentedin § 3.2. The improved radio-loudness values are listed in Ta-ble 1. The differences between the previous estimates and theimproved values are small, typically within 10% in logR1.4;such differences are comparable with changes inR1.4 causedby source flux variations typical of our objects (see below).
3.1.2. Radio variability and brightness temperature
A number of objects showed significant flux variationsbased on multi-epoch observations taken at the same wave-lengths18. In Table 3 we list those having the significance ofvariations higher than∼ 3σ between two observations, where
σ is defined asσ = (S1 − S2)/√
σ2s1 + σ2
s2. We also give inthe table the amplitudes of variations∆S, the fractional am-plitudes∆S/〈S〉 where〈S〉 is the average of the two fluxes,and the time spans∆t between the two observational epochs.Their variability is consistent with the fact that the variableshave ubiquitously flat or inverted radio spectra when avail-able. The fractional amplitudes given in Table 3 have a me-dian of 43%. In particular, several objects show large am-plitude variations (∼40–75%) on relatively short timescales,J0948+0022 (reported by Zhou et al. 2003), J0849+5108 (re-ported by Arp et al. 1979), and J1505+0326 within a fewyears, and J1548+3511 by 44% within 207 days (140 days inthe source rest frame).
Large amplitude variability on short timescales has beencommonly used to set lower limits on theapparent bright-ness temperature (TB) of a radio source, since the size ofthe variable part of the source can be constrained from thelight-crossing time (e.g. Krolik 1999; Fanti et al. 1983; Gopal-Krishna et al. 1984). Assuming that the variable portion of theradio flux is emitted from a region with a size smaller than thatcorresponding to the light-crossing time, which is the timespan between the two observations, theapparent brightnesstemperature is estimated to be19
TB &∆Pνe
2π2kν2(∆t)2=
2D2L∆Sν
(1+ z)πkν2(∆t)2(1)
wherek is the Boltzmann constant,DL the luminosity dis-tance,∆Sν the variable portion of the observed flux den-sity, ∆Pνe the corresponding radio power at the emission fre-quency in the source rest frame,ν the observing frequencyand∆t the time span in the observer’s frame. The estimatedTB are listed in Table 3.
Of the 8 objects, 6 have estimatedTB exceeding the equipar-tition brightness temperature∼ 3× 10¹¹ K as proposed byReadhead (1994), which is expected to conform by mostradio sources. In particular, 4 of the objects, all of flat-spectrum, haveTB exceeding the inverse Compton limit≃1012 K (Kellermann & Pauliny-Toth 1969). The highestTB isfound to be 1014 K in J1505+0326, from two VLBI observa-tions at 8.3 GHz with the variability significance of 3σ. The
18 In cases where two observations have much different spatialresolutions,we consider the variability to be genuine only if the higher flux was measuredat a higher resolution. This is to avoid detection of spurious variations causedby the possibility that a measured higher flux may be contributed by contami-nating extended/nearby emission if the observation is madeat a lower spatialresolution. We take this approach even though this problem actually has littleeffect to our objects, all of which are compact on the scales concerned, e.g.several arc-seconds. Thus, our results are conservative regarding the numberof variables, and variability amplitudes and timescales.
19 We noted that there was an error in our previous calculation of TB inWang et al. (2006) and Zhou et al. (2003), which was also pointed out byGhosh & Punsly (2007). We have corrected it in this paper.
extremely highTB values are commonly explained as emis-sion originating from relativistic jets (Blandford & Königl1979; Jones & Burbidge 1973). For instance, taking the in-verse Compton limit as a conservative limit, the minimumDoppler factor can be estimated asδmin = (TB/1012K)1/3. Thisresults inδmin =1.5–4.7 for the 4 objects (Table 3), consistentwith the range of the Doppler factors of relativistic jets in-ferred for classical RL AGN (Ghisellini et al. 1993; Jiang etal. 1998).
3.1.3. Summary of the GHz radio properties
(1) All the radio sources of our sample are compact, be-ing unresolved at the FIRST resolution of several arc-seconds.(2) The majority of objects with available radio indices areofflat-spectrum (around 1.4–5 GHz), some even with invertedspectra. (3) Most of the flat-spectrum sources show signifi-cant variability, from which the brightness temperatures areinferred to be as high asTB > 1011 K, and even exceeding theinverse Compton limit of 1012 K in 4 objects. These highTBvalues may suggest the presence of at least mildly relativisticbeaming of the radio emission.
The properties of the radio emission at low frequencies ofour sample objects are summarised in AppendixC, whichis important for understanding the intrinsic radio power andradio-loudness of these objects, as discussed in Section 6.3.
3.2. Optical continuum emission
Our standard algorithm to select NLS1 galaxies as abovedoes not give information about the optical continuum shape.However, for RL objects the optical continuum may devi-ate from the ‘canonical’ shape in consideration of a poten-tial contribution of jet emission. To properly take this effectinto account, we parameterise the optical continuum shape es-pecially for our RL sample. We model the AGN continuumin the 2500Å–5500Å rest frame range with a power-law or abroken power-law, and repeat the above spectral fitting withthe slope as a free parameter. The fits are performed in thesame way as described in § 2.1 assuming no intrinsic redden-ing. The improved fits give a more realistic description ofthe AGN continuum; while, on the other hand, we find thatthe new fits have almost no effects on the parameterisation ofthe emission line spectra. The optical continuum fluxes in thesource rest frame are measured directly from the power-lawfits of the AGN continuum.
It has been established that the optical luminosityLopt ofNLS1 AGN is tightly correlated with the Hβ line luminosityLHβ based on large samples (Zhou et al. 2006); henceLHβ
is a good indicator ofLopt. We test this scaling relation forRL NLS1 galaxies as shown in Figure 4, where the measured5100Å luminosities are plotted versusLHβ . As a comparisonthe∼ 2000 predominantly RQ NLS1 galaxies in the Zhou’06sample are over-plotted, along with the fittedλLλ5100– LHβ
relation (Zhou et al. 2006, their Eq. 5). As can be seen, theRL NLS1 galaxies reveal the same trend of correlation, but,of particular interest, lie systematically above the knownLopt–LHβ relation for normal NLS1 galaxies. We estimate the ratioof the observed luminosity to that expected from the Hβ lu-minosity (Lλ5100/L
Hβλ5100) using theλLλ5100– LHβ relation. We
find that the ratios range from 0.93 to 5.2, with a mean of1.9. The ratios differ systematically between flat- and steep-spectrum sources as groups, with the mean being 2.4 for theformer and 1.8 for the latter, and 1.6 for those without radioindices.

8 W. Yuan, et al.
FIG. 4.— Relationship between the nuclear monochromatic luminosity at5100Å and the Hβ luminosity for the radio-loud NLS1 AGN of our sample(filled dots: flat-spectrum radio sources; open circles: steep-spectrum radiosources; asterisks: no available radio indices). Over-plotted are NLS1 galax-ies in the Zhou’06 sample (small dots), predominantly radio-quiet, as well asthe best-fit relation (dashed). It shows that the radio-loudNLS1 galaxies havesystematically higher observed luminosities in excess of that predicted fromthe Hβ luminosity of normal NLS1 galaxies.
The optical continua in the rest frame 2500Å–5500Å rangecan be described with a power-law for most of the ob-jects. The fits are relatively poor for two objects, namely,J1037+0036 and J1634+4809, which show convex-shapedspectra in the optical–UV band with a drop short-ward ofMg IIλ2800Å in wavelength. For one object, J1138+3653,the spectrum cannot be fitted with a power-law due to a rapiddrop in the blue part, which results possibly from mild extinc-tion and is discussed further in § 6.2.2. The best-fit slopesshow a large range from modestly red (αλ =−0.2) to blue(αλ =−2.4) spectra. Their distribution is shown in Figure 5(excluding J1138+3653), which has a median of−1.54 and amean of−1.43. We compare thisαλ distribution with that of aRQ NLS1 sample, which comprises 55 SDSS-selected objectswith reliably measured optical slopes (dashed line in the fig-ure, Ai et al. 2008, for objects with multi-epoch data the av-eraged slopes are used). It should be noted that that RQ sam-ple has the redshift and luminosity distributions indistinguish-able from those of our sample [the two-sided Kolmogorov-Smirnov (K-S) test probability of 0.48 and 0.52, respectively].It can be seen that, though there is a broad range of overlap,our very radio-loud NLS1 AGN appear to have systematicallybluer continua than the RQ objects. The RQ sample have amedian of−1.24 and a mean of−1.15. The chance probabilitythat the two distributions are the same is onlyPchance. 0.01, asgiven by the K-S test. A comparison with the smaller NLS1galaxies sample of Constantin & Shields (2003), which haveUV–optical slope measurements with the Hubble Space Tele-scope (HST), yields a similar conclusion; the closest valueof their sample to ours is the continuum slope of the mediancomposite spectra,αν∼ −0.79 (αλ∼ −1.21).
3.3. X-ray radiation
FIG. 5.— Histogram of the power-law slopes of the optical continuum (restframe 2500–5000Å) for our radio-loud NLS1 sample (solid line; except forone object which is fitted with a broken power-law). As a comparison, thedashed line represents the histogram ofαλ for a radio-quiet NLS1 sampleselected from the SDSS with redshift and luminosity distributions compatibleto ours (from Ai et al. 2008).
Assuming an absorbed power-law spectral model and usingthe aforementioned hardness ratio method, the effective pho-ton indices are estimated for most of the objects with validROSAT/PSPC hardness ratios extracted from the ROSATsource catalogues. The estimated absorptionNH values arefound to be well consistent with the Galactic values withinerrors, indicating that there is no significant X-ray absorp-tion in these objects. Hence, we adopt the photon indicesΓ (Table 2) obtained by assumingNH =NGal
H for better con-straining the parameters. Furthermore, for 5 of the objectsnophysically meaningful result can be obtained by this method,because either the spectrum is complex and highly deviatingfrom the assumed absorbed power-law, or the measured hard-ness ratios are displaced outside the valid zone by Poissonfluctuations. For objects with multiple X-ray data, we usethe weighted mean forΓ and fluxes in the following analy-ses. Results from detailed spectral analysis for the 3 objects ,J1633+4718, J1644+2619, and J0849+5108, are summarisedbelow.
J1633+4718 (RX J16333+4719): The spectrum deviatesapparently from a simple absorbed power-law model, withprominent soft X-ray emission dominatingE <0.5 keV anda hard tail atE >0.5 keV. The best fit is achieved using amodel of a power-law plus a redshifted blackbody compo-nent, and the absorptionNH is found to be in excellent agree-ment with the GalacticNGal
H =1.79×1020cm−2. HenceNH isfixed to NGal
H . The data and the best fit model are shown inFigure 6. The rest frame blackbody temperature is found tobe 32.5+8.0
−6.0 eV and the photon index of the underlying powerlaw Γ = 1.37±0.49 (90% confidence for one parameter of in-terest). The latter is less well constrained due to the limitedbandpass of the PSPC in the ‘hard’ X-rays. No temporal vari-ability is found within the observation interval. The spectrummeasured in the RASS has almost identical spectral shape asthat of the pointed observation. The best-fit parameters arein excellent agreement with those obtained from the pointedobservation, withΓ = 1.47+0.77
−0.92 and the blackbody tempera-

Radio-loud Narrow Line Seyfert 1 galaxies 9
ture 30+12−10 eV (90% confidence level), though the errors are
large given the small source counts. No variation in either thespectral shape or the flux is found between the RASS and thepointed observation.
J1644+2619: A simple power-law model is found to be anexcellent fit to the spectrum (see Figure 7), resulting in a re-ducedχ2 =13 (for 23 d.o.f). The fitted absorptionNH is al-most identical to the Galactic valueNGal
H =5.12× 1020cm−2.The best-fit photon index is steep,Γ = 2.19±0.27 (90% con-fidence for one parameter of interest). Adding an extra softX-ray component (e.g. blackbody) does not improve the fit,though with two more free parameters; the power-law pho-ton index becomes flatter,Γ ∼ 1.8+0.6
−0.3, but is subject to a largeuncertainty range which encompasses the single power-lawmodel. We therefore suggest that the simple power-law modelwith a relatively steep index is the most likely spectral shape,though models composed of a flatter power-law with a weaksoft component cannot be ruled out from the current data.Compared to the observation in the RASS, the X-ray sourcewas about 2.5 times fainter at the Chandra observation epoch,though the photon index seems not to vary.
J0849+5108: The spectrum can be fitted with a power-law with absorptionNH close to the Galactic valueNGal
H=3.0×1020cm−2. Fixing column density atNGal
H yields a pho-ton indexΓ = 1.77+0.44
−0.60 (90% confidence for one parameterof interest). We note that the extremely hard hardness ratiosgiven in the source catalogue are incorrect, which may re-sulted from inappropriate background subtraction around thisobject in the presence of nearby, seemingly extended X-rayemission.
Figure 8 shows the distribution of theeffective X-ray photonindicesΓ, which span a wide range from 1.7 to 3.3. Sincethe uncertainties of most of the derivedΓ are relatively large,we try to disentangle the intrinsic distribution ofΓ from themeasurement uncertainties, using the Maximum-Likelihoodmethod introduced by Maccacaro et al. (1988). Assuming thatthe intrinsic distribution ofΓ is Gaussian, we find that thedistribution is intrinsically broad, with a standard deviation of0.39+0.41
−0.19 and a mean of 2.60+0.37−0.43 (at the 90% confidence level
for two interesting parameters). We conclude that the soft X-ray continuum shape, as described by the power-law photonindexΓ, exhibits a considerable variety among our RL NLS1galaxies, with both flat and steep spectra.
It should be noted that the thus estimatedΓ from hardnessratios are only an indicator of the overall spectral shape inthe 0.1–2.4keV range. A steepΓ value does not rule out thepresence of a flat ‘hard’ X-ray component if both a steep softX-ray and a flat ‘hard’ X-ray component co-exist. As an ex-ample, for J1633+4718, a slope ofΓ ≃ 2.8 is derived from itshardness ratios if the spectrum is approximated as a power-law. This is particularly true for NLS1 galaxies, since a softX-ray excess component is commonly seen in them. Betterquality X-ray spectra in a wider energy band than that of theROSAT/PSPC are needed to determine the true underlyingpower-law in these objects.
3.4. Broad band SED
To quantify the broad band SED, we calculate thecommonly used effective spectral indices between the5 GHz radio, 2500 Å optical/UV, and 2 keV X-ray band,namely, αro, αox, and αrx; they are defined asα12 =− log(Sν1/Sν2)/ log(ν1/ν2), whereSν1 andSν2 are the fluxesat the frequenciesν1 andν2, respectively, in the object rest
frame20. The rest frame 2500 Å fluxes are computed from theu-band PSF magnitudes, which have the effective wavelength(3542Å) very close to the redshifted 2500 Å light (within arange of 500 Å); for the K-correction, the measured opticalslopes for individual objects are adopted (for one object with-out the slope available,αλ =−1.5 is assumed). For the 3 ob-jects for which X-ray spectral fits were enabled, the X-ray fluxdensities at 2 keV (f2keV) are measured directly from the best-fit spectral model; while for the othersf2keV are computedfrom the 0.1–2.4keV integrated fluxes. In doing so, as wellas the K-correction, the derivedΓ values are used for individ-ual sources whenever available, or the mean〈Γ〉 = 2.6 is usedotherwise. For those without X-ray detection, lower limitsonαox andαrx are calculated using the upper limits on the X-rayfluxes constrained by the RASS. The obtainedαro, αrx, andαox are listed in Table 4.
In Figure 9 we plot our RL NLS1 galaxies on the commonlyusedαro–αox blazar diagnostic diagram, separating them intothree groups: flat (underlying) spectra (Γ < 2.0, filled dots),steep spectra (Γ > 2.0, open circles), and those withoutΓestimates (asterisks). For comparisons, we over-plot RLQsfrom the ROSAT detected quasar sample of Brinkmann et al.(1997). That sample is composed of both FSRQ and steep-spectrum radio quasars (SSRQ), whose loci largely overlapwith each other. It can be seen that some of the objects do fol-low the trend defined by FSRQ/SSRQs, indicating their SEDsare similar to those of FSRQ/SSRQs. Specifically, all the 3objects in our sample known to have a steep radio spectrumare well consistent with normal SSRQs. It is known that FS-RQs (and SSRQs) occupy almost the same region on theαro–αox diagram as LBLs, owing to their similar SEDs (Padovaniet al. 1997a; Brinkmann et al. 1996; Sambruna et al. 1996;Fossati et al. 1998).
However, a considerable fraction of the objects clearly off-sets. We expect that these outliers must have different SEDsfrom those of classical FSRQ and LBLs. By invoking theclassification scheme of BL Lac objects, we divide theαro–αox diagram into the loci of LBLs and HBLs. A simple yetcommonly used criterion separating HBLs and LBLs isαrx;a nominal value is set to be aroundα′
rx ∼ 0.75− 0.78 (de-fined between 5 GHz and 1 keV) suggested by various au-thors, with HBLs having smaller (flatter)αrx values. We adopt0.78 as the dividing line (as in, e.g. Padovani et al. 2003) ,which corresponds toαrx=0.787 for theαrx definition adoptedin this paper and is represented by the dashed line in Fig-ure 9. Following Padovani et al. (2003), a more elaboratedlocus for HBL is also indicated schematically, which is pop-ulated by X-ray selected BL Lac objects (e.g. Brinkmann etal. 1996). Of particular interest, most of the objects offsettingfrom the classical FSRQ and LBL locus actually fall withinthe HBL locus21. This indicates that the broad band SEDsof these NLS1 AGN are similar to those of HBLs. Follow-
20 There are slight differences in the frequencies adopted in the αro andαox definitions among the literature. Whenever we citeαro andαox whichhave different definitions, we first convert their values to those according tothe definition used in this paper.
21 In a strict sense, the HBL locus in Figure 9 represent the SEDsof the‘pure blazar’ component only or dominated by the non-thermal continuum.Our NLS1 objects are, however, strong-lined and a significant contributionis expected from the thermal ionizing continuum to the observed optical flux(∼ 50% on average, see § 3.2). For rigorous comparisons with HBLs, weshould consider the ’corrected SED’ corresponding to the pure non-thermalcontinuum only. However, such corrections are very small (∆αox ∼ −0.12and∆αro ∼ 0.05 on average) for the bulk of the objects, and the results areessentially not affected.

10 W. Yuan, et al.
0.1
1
0.05
0.2
0.5
norm
aliz
ed c
ount
s s−
1 ke
V−
1
10.2 0.5
−1
0
1
∆Sχ2
Energy (keV) 0.1 10.2 0.5 2
10−
410
−3
0.01
Pho
tons
cm
−2
s ke
V
Energy (keV)
FIG. 6.— X-ray spectral fit for J1633+4718. Left panel: ROSAT PSPC spectrum, the folded best-fit model and the residuals; right panel: best fit model of apower-law plus a black-body (with Galactic absorption).
0.01
0.1
5×10⁻³
0.02
0.05
0.2
norm
aliz
ed c
ount
s s−
1 ke
V−
1
10.5 2
−1
0
1
∆Sχ2
Energy (keV)
FIG. 7.— Chandra ACIS X-ray spectrum of J1644+2619 and the best-fit model as a steep power-law (Γ = 2.19± 0.27, 90% errors) with Galacticabsorption.
ing our terminology introduced in § 1, we refer to them asNLS1 HFSRQs, and those with SEDs typical of classical FS-RQs (LBL-like) as NLS1 LFSRQs. These NLS1 HFSRQshave ubiquitously flat radio spectra whenever available, con-sistent with a potential blazar nature. Those without X-rayde-tection (arrows) have theirαro andαox limits consistent withthe αro and αox values for either LFSRQs/SSRQs or HFS-RQs. Also, a few objects lie very close to the border line,on both the HBL and the LBL sides, suggesting a smoothtransition between the two types. As a comparison, we alsomark in the plot the position of 2MASX J0324+3410, an ex-treme NLS1–blazar composite object, which has a HBL-typeSED with the synchrotron peak in the UV/soft X-rays (Zhouet al. 2007). Clearly, 2MASX J0324+3410 fulfills the HBLclassification in terms of its radio–optical–X-ray SED, as ex-pected. We note there are a few objects lying in the vicinityof 2MASX J0324+3410 in theαro–αox diagram, suggestingtheir similarities and thus the previously known NLS1–blazarhybrid 2MASX J0324+3410 is not unique.
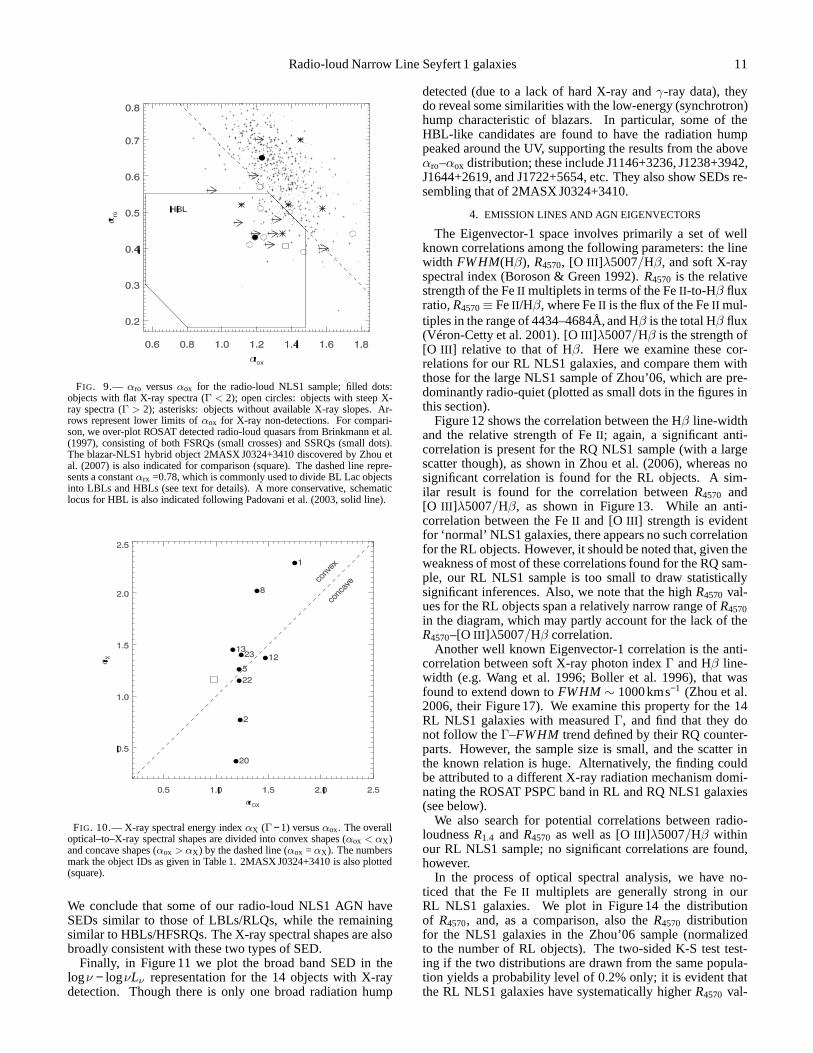
FSRQs/LBLs and HBLs are known to differ in their X-rayspectral shapes as FSRQs/LBLs have relatively flat spectra
FIG. 8.— Distribution of theeffective photon indices of representing power-law of the X-ray spectra of our radio-loud NLS1 galaxies, where available.All the indices are measured with the ROSAT PSPC in 0.1–2.4 keV, except forJ1644+2619 with the Chandra ACIS in 0.2-5 keV. For J1633+4718 we adoptΓ = 2.8 obtained from the hardness ratios to represent the overallspectralshape.
while HBLs have steep spectra (e.g. Worrall & Wilkes 1990;Brinkmann et al. 1996; Padovani & Giommi 1995; Wolter etal. 1998); specifically,Γ ∼ 2.0 were found for FSRQs/LBLsandΓ∼ 2.5 or steeper for HBLs in the ROSAT band. As such,the overall spectral shapes from the optical to the X-ray bandare concave in FSRQs/LBLs (αox > αx, whereαx ≡ Γ − 1 isthe energy index), while they are convex (αox < αx) in HBLs(e.g. Sambruna et al. 1996; Padovani et al. 1997a; Perlman etal. 2005). Parallelly, the X-ray emission of HFSRQs is hy-pothesized to be dominated by synchrotron radiation with asteep X-ray spectrum, as claimed to be seen in a few individ-uals (Padovani et al. 2002). For the NLS1 HFSRQs in oursample with measured X-ray slopes, we find that all but one(J1633+4718) have steep X-ray spectra (Γ > 2.0). We alsoexamine the optical–to–X-ray spectral shapes for the objectswith availableαx by plottingαx versusαox in Figure 10. Ascan be seen, the two objects (J1633+4718 and J0849+5108)with flat X-ray spectraαx< 1.0 show prominently concaveoptical-to-X-ray spectral shapes; whereas most of the steepX-ray spectrum objects are consistent with convex spectra,in-cluding 2MASX J0324+3410 withΓ≃ 2.2 (Zhou et al. 2007).
Radio-loud Narrow Line Seyfert 1 galaxies 11
FIG. 9.— αro versusαox for the radio-loud NLS1 sample; filled dots:objects with flat X-ray spectra (Γ < 2); open circles: objects with steep X-ray spectra (Γ > 2); asterisks: objects without available X-ray slopes. Ar-rows represent lower limits ofαox for X-ray non-detections. For compari-son, we over-plot ROSAT detected radio-loud quasars from Brinkmann et al.(1997), consisting of both FSRQs (small crosses) and SSRQs (small dots).The blazar-NLS1 hybrid object 2MASX J0324+3410 discoveredby Zhou etal. (2007) is also indicated for comparison (square). The dashed line repre-sents a constantαrx =0.78, which is commonly used to divide BL Lac objectsinto LBLs and HBLs (see text for details). A more conservative, schematiclocus for HBL is also indicated following Padovani et al. (2003, solid line).
FIG. 10.— X-ray spectral energy indexαX (Γ− 1) versusαox. The overalloptical–to–X-ray spectral shapes are divided into convex shapes (αox < αX )and concave shapes (αox > αX ) by the dashed line (αox = αX ). The numbersmark the object IDs as given in Table 1. 2MASX J0324+3410 is also plotted(square).
We conclude that some of our radio-loud NLS1 AGN haveSEDs similar to those of LBLs/RLQs, while the remainingsimilar to HBLs/HFSRQs. The X-ray spectral shapes are alsobroadly consistent with these two types of SED.
Finally, in Figure 11 we plot the broad band SED in thelogν − logνLν representation for the 14 objects with X-raydetection. Though there is only one broad radiation hump
detected (due to a lack of hard X-ray andγ-ray data), theydo reveal some similarities with the low-energy (synchrotron)hump characteristic of blazars. In particular, some of theHBL-like candidates are found to have the radiation humppeaked around the UV, supporting the results from the aboveαro–αox distribution; these include J1146+3236, J1238+3942,J1644+2619, and J1722+5654, etc. They also show SEDs re-sembling that of 2MASX J0324+3410.
4. EMISSION LINES AND AGN EIGENVECTORS
The Eigenvector-1 space involves primarily a set of wellknown correlations among the following parameters: the linewidth FW HM(Hβ), R4570, [O III ]λ5007/Hβ, and soft X-rayspectral index (Boroson & Green 1992).R4570 is the relativestrength of the FeII multiplets in terms of the FeII -to-Hβ fluxratio,R4570≡ FeII /Hβ, where FeII is the flux of the FeII mul-tiples in the range of 4434–4684Å, and Hβ is the total Hβ flux(Véron-Cetty et al. 2001). [OIII ]λ5007/Hβ is the strength of[O III ] relative to that of Hβ. Here we examine these cor-relations for our RL NLS1 galaxies, and compare them withthose for the large NLS1 sample of Zhou’06, which are pre-dominantly radio-quiet (plotted as small dots in the figuresinthis section).
Figure 12 shows the correlation between the Hβ line-widthand the relative strength of FeII ; again, a significant anti-correlation is present for the RQ NLS1 sample (with a largescatter though), as shown in Zhou et al. (2006), whereas nosignificant correlation is found for the RL objects. A sim-ilar result is found for the correlation betweenR4570 and[O III ]λ5007/Hβ, as shown in Figure 13. While an anti-correlation between the FeII and [OIII ] strength is evidentfor ‘normal’ NLS1 galaxies, there appears no such correlationfor the RL objects. However, it should be noted that, given theweakness of most of these correlations found for the RQ sam-ple, our RL NLS1 sample is too small to draw statisticallysignificant inferences. Also, we note that the highR4570 val-ues for the RL objects span a relatively narrow range ofR4570in the diagram, which may partly account for the lack of theR4570–[O III ]λ5007/Hβ correlation.
Another well known Eigenvector-1 correlation is the anti-correlation between soft X-ray photon indexΓ and Hβ line-width (e.g. Wang et al. 1996; Boller et al. 1996), that wasfound to extend down toFWHM ∼ 1000kms−1 (Zhou et al.2006, their Figure 17). We examine this property for the 14RL NLS1 galaxies with measuredΓ, and find that they donot follow theΓ–FWHM trend defined by their RQ counter-parts. However, the sample size is small, and the scatter inthe known relation is huge. Alternatively, the finding couldbe attributed to a different X-ray radiation mechanism domi-nating the ROSAT PSPC band in RL and RQ NLS1 galaxies(see below).
We also search for potential correlations between radio-loudnessR1.4 and R4570 as well as [OIII ]λ5007/Hβ withinour RL NLS1 sample; no significant correlations are found,however.
In the process of optical spectral analysis, we have no-ticed that the FeII multiplets are generally strong in ourRL NLS1 galaxies. We plot in Figure 14 the distributionof R4570, and, as a comparison, also theR4570 distributionfor the NLS1 galaxies in the Zhou’06 sample (normalizedto the number of RL objects). The two-sided K-S test test-ing if the two distributions are drawn from the same popula-tion yields a probability level of 0.2% only; it is evident thatthe RL NLS1 galaxies have systematically higherR4570 val-

12 W. Yuan, et al.
FIG. 11.— Broad-band spectral energy distribution in the logνLν − logν representation for radio-loud NLS1 AGN with available X-ray data. The luminositiesare at the emitting frequencies in the rest frame of the objects. The radio and infrared data are collected from the NED andsupplementarily from recent radiosurveys such as FIRST. The optical data are SDSS PSF magnitudes in the five bands (u,g,r, i,z). The UV data are GALEX near- and far-UV magnitudes. Theoptical and UV magnitudes have been corrected for Galactic extinction. The host galaxy contamination should be negligible, as shown in Section 2.3. For objectswhose X-ray spectrum can be represented by a power-law, the estimated slope and uncertainties are indicated as a bow-tie. For J1633+4718, the X-ray spectrumis complex and the unfolded spectrum is presented.
ues than their RQ counterparts. The averageR4570 is 1.03,compared to 0.82 for the ‘normal’ NLS1 galaxies with reli-able FeII measurements in the Zhou’06 sample. To exam-ine whether the largeR4570 values are caused by systemat-ically weak (total) Hβ emission, we compare the Hβ fluxdistribution of the RL and RQ samples; we find that thetwo Hβ flux distributions are indistinguishable between thetwo samples (the K-S test). Moreover, the RL NLS1 samplehasFWHM(Hβ) and [OIII ]λ5007/Hβ distributions indistin-guishable from those of the Zhou’06 sample (the K-S test).This result, together with the absence of the anti-correlationsof R4570–FWHM(Hβ) and R4570–[O III ]λ5007/Hβ indicatethat the highR4570 values for the RL sample are real, ratherthan spuriously induced from dependence on other parame-ters. We thus conclude that the optical FeII emission in ourvery RL NLS1 galaxies is on average stronger than that in RQNLS1 galaxies. In fact, this effect has been noted in the sam-
ple of Komossa et al. (2006b, their Figure 3), but the statisticalsignificance is not as high due to a factor of 2 smaller of thesample size.
We have identified four [OIII ] blue outliers in our sample,with the [OIII ] lines significantly blueshifted byV ([O III ])>200 kms−1 relative to [OII ] 22. The phenomenon of blue out-liers has been observed in a few radio galaxies (e.g. Tadhunteret al. 2001), and is especially frequent among NLS1 galax-ies (Komossa et al. 2007, and references therein). We find afraction of blue outliers withV ([O III ])> 200 kms−1 of 17%among our sample, about a factor of 2.4 higher than that inthe RQ NLS1 sample of Komossa et al. (2007). These au-thors also discovered that, for RQ blue outliers, the velocityoffsets are correlated with ionization potential and line width.Such correlations persist for RL blue outliers. In all four
22 V ([O III ]) are 220, 400, 480 and 520 kms−1 for J1634+4809,J1505+0326, J1305+5116, and J1443+4725, respectively

Radio-loud Narrow Line Seyfert 1 galaxies 13
FIG. 12.— Ratio of the FeII multiplets to the total Hβ line flux, R4570versus Hβ line-width in FW HM for the radio-loud NLS1 galaxies (fill cir-cles), as well as normal NLS1 galaxies in the Zhou et al. (2006) sample (smalldots).
FIG. 13.— Ratio of the FeII multiplets to the total Hβ flux, R4570versus theratio of the [OIII ]-to-Hβ line flux. Plot symbols are the same as in Figure 12.
we detect blueshifted [NeV] lines with velocity shifts up to∼2300kms−1 (J1443+4725). The high frequency of blue out-liers in RL NLS1 galaxies may indicate that jet-cloud interac-tions contribute to, or dominate, the [OIII ]λ5007 blueshifts inthe RL sources.
Most of the objects show symmetric profiles of the[O III ]λ5007 line. In three objects, particularly J1633+4718,the [OIII ] doublets show a blue wing that can be modeled byan extra Gaussian component (see Figure 1). This indicatesthe presence of possible outflows associated with the narrowline region. In addition, J103123.73+423439.3 shows double-peaked profiles in both [OIII ]λ5007 and Hβ.
5. HOST GALAXIES
The host galaxies of radio-loud NLS1 AGN are poorlyunderstood due to very sparse observations. The only ob-
FIG. 14.— Distribution of FeII /Hβ for the radio-loud NLS1 galaxies (solidline). For comparison, also plotted is the distribution forthe normal NLS1galaxies in the Zhou et al. (2006) sample, normalized to the size of the radio-loud sample (dashed line).
ject, as far as we are aware of, observed with the HST is2MASX J0324+3410. Its HST image reveals a ring or one-armed galaxy morphology, indicating a possible galaxy inter-acting/merging history (Zhou et al. 2007). As for our currentsample, given the relatively high redshifts, most of their hostgalaxies cannot be examined with the SDSS images. The ex-ceptions are J1633+4718 and J1644+2619, which have red-shifts of 0.116 and 0.144, respectively. Interestingly, the hostgalaxy of J1633+4718 has a size of more than 20 kpc alongthe major axis and is in an interacting pair/merger system, inwhich the second galaxy hosts a reddened starburst nucleus(Bade et al. 1995). Both of the member galaxies appear to begas rich with disturbed morphology, and thus of late morpho-logical type. The host galaxy of J1644+2619, though beingcompact (∼ 15 kpc), also seems to be disk-like. We note thatthe black hole masses in both galaxies are small, 2.0×10⁶ and8.4×106 M⊙ for J1633+4718 and J1644+2619, respectively(see § 6.4).
The SDSS spectrum of J1633+4718 includes a significantcontribution of the host galaxy light within the fiber of 3′′
diameter, which appears to be dominated by a young stel-lar population, as can be seen in Figure 1 (the contamina-tion from the starburst nucleus of 4′′ away should be negligi-ble). Besides, marginal imprints of high-order Balmer absorp-tion lines, though being week, are likely present in the SDSSspectra of other three objects at higher redshifts (J1146+3236,J1505+0326, and J1634+4809;z = 0.4− 0.5), indicating pos-sible young stellar populations in their host galaxies.
We thus suggest that some of the radio-loud NLS1 AGN(at least those with a small black hole mass; see § 6.4) mayreside in gas-rich, disk galaxies, and some reside in galaxieswith possible young stellar populations. This result contrastsclearly with classical RLQs and BL Lac objects, that prefer-entially reside in giant elliptical or massive bulge-dominatedgalaxies, or strongly passively evolving galaxies (e.g. Bahcallet al. 1997; Dunlop et al. 2003; Floyd et al. 2004; O’Dowd& Urry 2005). While it is, to some extent, in line with thefinding of Ho & Peng (2001) and Ho (2002) for the Seyfertgalaxies in their samples, which are much less luminous and

14 W. Yuan, et al.
more sub-Eddington than our radio-loud NLS1 AGN stud-ied here, however. As is shown in § 6.4, most of the ob-jects in our sample have relatively small black hole masses(MBH∼ 106−8 M⊙). Hence, considering theMBH–spheroidmass relation known for nearby galaxies (Magorrian et al.1998), our finding about the host galaxies of radio-loud NLS1AGN is not unexpected. Deeper observations are needed toreveal the host galaxy properties for the remaining radio-loudNLS1 AGN with largerMBH, which are not an easy task giventheir relatively high redshifts, however.
6. INTERPRETATION AND DISCUSSION
6.1. The sample
Our objects fulfill the conventional definition of NLS1galaxies, and show typical NLS1 characteristics such asstrong optical FeII emission. They also share similar dis-tributions in black hole mass and Eddington ratio with ‘nor-mal’ NLS1 galaxies (see § 6.4). Therefore, they shouldbe bona-fide NLS1 galaxies. The 5 GHz radio luminositiesL5GHz range from 1024.17 to 1026.96 W Hz−1 with a median of1025.23. Thus, most of our objects would remain qualifiedas radio-loud even if the alternative criterion of RL AGN isapplied, which is based solely on radio luminosity,L5GHz &1025 W Hz−1 as proposed by some authors (e.g. Miller et al.1990; Kellermann et al. 1994). Of our sample, 19 were spec-troscopically targeted in the SDSS as quasar candidates basedon their optical colors, and 3 were targeted serendipitously;only one object was selected solely as a ROSAT/FIRST coun-terpart. Hence our very RL NLS1 sample can be regarded asan essentially optically-selected one, similar to other SDSSradio-quiet NLS1 samples.
The sample spans a luminosity range from Seyfert galaxiesto quasars, with roughly half of the sample in each category.Compared to the ‘normal’ NLS1 galaxies in the Zhou’06 sam-ple, which have an average Hβ luminosity 〈LHβ〉 = 3.0×1042 ergs−1, our RL objects have relatively higher luminosi-ties (〈LHβ〉 = 6.0×1042 ergs−1, see also Figure 4). This dif-ference is likely a consequence of the trend that RL objectsare more likely to be found in AGN with more massive blackholes (and thus higher luminosities), as suggested recently(e.g. Best et al. 2005). We find that such very RL objectsrepresent only 0.7% of NLS1 galaxies drawn from the SDSS,though this fraction may be somewhat uncertain given allkinds of selection effects introduced in the surveys.
Compared to the other two previously published RL NLS1samples of Komossa et al. (2006b) and Whalen et al. (2006),which comprise 11 and 16 objects respectively, our currentsample differs mainly in that it has a much higher radio-loudness cutoff. Consequently, the sample is biased for select-ing flat-spectrum sources dominated by beamed radio emis-sion. In addition, our sample has a statistically higher red-shift distribution than those two samples. In comparison,only three and four objects from those two samples satisfyR1.4> 100, respectively, among which, two from the formerand one from the latter sample are included in our currentsample.
6.2. Broad band continuum emission
6.2.1. Radio emission: relativistic beaming and jets
The radio luminosities of our sample objects are well abovethose expected from the most radio-luminous starburst galax-ies∼ 1022.3−23.4 W Hz−1 (Smith et al. 1998). In addition, noimprints of vigorous starbursts are found in the optical SDSS
spectra of sources of our sample; these spectra sample the cen-tral region of the host galaxies within a radius of 3–11 kpc.None of the objects are found to be associated with IRASsources except for J1633+4718, for which the infrared emis-sion is expected (at least predominantly) from the starburstnucleus 4′′ away, rather than from the active nucleus, however.These results suggest that for essentiallyall of the objects theradio emission is of AGN origin, rather than of starburst ori-gin.
Large amplitude flux variations up to∼ 70% have been ob-served in some of our objects with flat radio spectra. To makesure that this is not spurious due to contamination of nearbysources, we visually examined the FIRST and NVSS imagesof the variable objects. We find that for 6 of the 8 objectsno other sources are detected within 3′; for the remaining 2,faint sources are present but are all well separated from them.Therefore, the observed variations are not caused by flux con-tamination from nearby sources. In addition, we argue in thispaper (see AppendixD for details) that those observed varia-tions are largely intrinsic, rather than extrinsic that is causedby refractive interstellar scintillation (RISS).
We have shown that most of the sources known to be flat-spectrum in our sample have very high brightness tempera-tures 1011−13 K; in 4 of the objectsTB even exceeds the inverseCompton limit of 1012 K. Such high brightness temperaturesindicate that the radio emission is highly Doppler beamed andhence must originate from (at least mildly) relativistic jets, asin blazars. Among the 4 withTB > 1012 K, J0849+5108 isa known OVV/HPQ blazar (e.g. Arp et al. 1979; Sitko et al.1984, and see AppendixB) and the high brightness temper-ature is well expected; in turn, this gives us confidence inthe results for the other objects. J0948+0022 has been pre-viously suggested to be so by Zhou et al. (2003). For theremaining two, J1505+0326 and J1548+3511, the evidencefor relativistic beaming is presented for the first time. ForJ1505+0326, this result is consistent with its VLBI imagesmade at 2.3 GHz, which are dominated by a very compactcomponent, marginally resolved at a few tens milli-arcsecresolution (Dallacasa et al. 1998). Besides, two objects,J1633+4718, and J1644+2619 have also been suggested tobe blazar-like based on VLBI observations (Doi et al. 2007).Thus, in a total of 6 objects of our sample there is evidence forrelativistic beaming. Assuming that the brightness tempera-tures of 1011−12 K are probably also an indication of beaming,the number of such objects will increase to 9, i.e. all the 8flat-spectrum sources and one with unknown radio index.
Our suggestion for the presence of (at least mildly) rela-tivistic jets is also supported by polarization detected ina fewindividual objects, e.g. J0849+5108 (see AppendixB) and2MASX J0324+3410 (Neumann et al. 1994). Furthermore,this is consistent with the observed large amplitude variabil-ity in the optical in a few objects monitored, e.g. J0849+5108,J0948+0022 (Zhou et al. 2003), since normal NLS1 galaxiesare found to be much less variable in the optical band (Ai etal. 2008).
These results are most naturally explained in terms ofbeamed emission; and thus we postulate that relativistic jetsare likely present in most, if not all, of the flat-spectrum,very radio-loud NLS1 AGN. However, it should be noted thatpart of the observed properties above may also be explainedby some other non-blazar, compact sources. For instance,flat and inverted spectra are also typical of Gigahertz-PeakedSpectrum (GPS) sources, though they generally lack of largeamplitude flux variations (e.g. O’Dea 1998). Moreover, flat

Radio-loud Narrow Line Seyfert 1 galaxies 15
spectra are often seen also in the radio sources of some ‘nor-mal’ Seyfert galaxies, though mostly with much less powercompared to the objects studied here (e.g. Ho & Ulvestad2001). Incorporating the properties of these flat-spectrumNLS1 AGN in other wave-bands, we regard the blazar-likescenario as the most likely origin of their multi-waveband(non-thermal) emission in this paper, though other possibili-ties cannot be ruled out completely at this stage. We note thatthe majority of the sources of Komossa et al. (2006b) sample(R1.4> 10) are steep-spectrum sources, in which strong beam-ing is generally not expected. The difference is largely at-tributed to the much higher radio-loudness cutoff of our sam-ple, as mentioned above.
6.2.2. Optical continuum: dust extinction and jetcontribution?
The majority of our sample objects (16/23) have opticalcontinuum slopes bluer thanαλ=−1. If the continuum is in-trinsically blue in all objects (assumingαλ=−1.7) but is red-dened by extinction, a slope ofαλ =−1 corresponds to anamount of extinction E(B-V)≃ 0.2, i.e. a correction factor ofonly∼ 2 in theB-band flux. So, even if this was the case, mostof our objects would still haveR1.4&100, above the radio-loudness cutoff of our sample. There are 5 objects at low red-shifts (z < 0.38) having both the Hα and Hβ lines measurable,including J1138+3653, the only one showing a significant de-viation from a power-law optical continuum. J1138+3653 hasa broad line Balmer decrement of Hα/Hβ=4.43, indicative ofmild extinction. Adopting the intrinsic Hα/Hβ ratio of 3.37[with a dispersion of 0.06 dex in log(Hα/Hβ)] for blue radio-loud quasars (free from dust extinction) found in our recentwork (Dong et al. 2008) and the Galactic extinction curve,we find an internal extinction correctionAB ≃ 0.97 [E(B-V)=0.236], and an extinction correctedR1.4 a factor of 2.4lower, leading to an intrinsic radio-loudnessR1.4≃ 86. Forthe remaining 4 objects, the broad line Hα/Hβ ratios rangefrom 2.8–3.8 with a mean of 3.4, that are well consistent withthe intrinsic Hα/Hβ distribution and hence with little or noextinction; therefore their radio-loudnessR1.4 measurementsas above are almost un-affected. Particularly, J1031+4234shows a red optical spectrum withαλ =0.55, indicating thatin at least some of the objects the red optical spectrum is in-trinsic, rather than resulting from dust extinction. Anotherexample is the blazar J0849+5108 with the reddest slope,αλ=−0.20, that is close to the previous measurement at itshigh light state. Its slope steepens with decreasing luminos-ity and changes rapidly on timescales on several months, andhence the red slope is preferentially explained as being intrin-sic23 (Arp et al. 1979), similar to red BL Lac objects (Stein etal. 1976).
Observations have revealed that in a large fraction of FS-RQs the optical light can be contributed significantly bythe non-thermal emission from relativistic jets that is highlybeamed (e.g. Whiting et al. 2001). We have discovered thatthe observed optical fluxes are systematically in excess ofthose predicted from the broad Hβ luminosity, presumablyfrom an accretion disk, assuming that radio-loud NLS1 AGNhave the same conditions in the broad line region as normalNLS1 AGN (see § 3.2). In addition, the optical slopes ofour radio-loud objects are systematically bluer than that of
23 Alternatively, the red slope is explained as contaminationfrom a fore-ground red galaxy on the line of sight (Stickel et al. 1989), though we considerthis unlikely.
radio-quiet NLS1 AGN. These facts point to the presence of asecond component superposed on the normal AGN-like (ther-mal) continuum. In light of the similar radio properties of ourRL NLS1 galaxies to FSRQs, we attribute the excess opti-cal emission to arising from the non-thermal radiation fromjets, as in FSRQs, i.e. the extension to higher energies ofthe radio-to-infrared synchrotron radiation. This model ex-plains naturally the observed difference in the observed-to-predicted luminosity ratios between flat- and steep-spectrumNLS1 AGN. In flat-spectrum sources, the relativistic beam-ing effect is strong—as suggested above—and hence the jetcomponent over-shines the thermal optical component; whilein steep-spectrum sources, the former becomes comparable toor weaker than the latter.
The observed optical continua have a variety of slopes,ranging from moderately red to blue. They are reminiscentof the optical emission of BL Lac objects, which have bothred and blue continua (e.g. Stein et al. 1976), correspondingto the low- and high-peak frequency of the synchrotron humpof LBLs and HBLs, respectively. In fact, this comparison isparticularly relevant in light of our finding that the RL NLS1AGN have both LBL- and HBL-like SEDs: the blue opticalcontinuum may be explained as contribution from the syn-chrotron emission peaked at high energies (UV or higher);while the red slope may be contributed by that peaked in theinfrared. In turn, this is consistent with our above inferencethat the red slopes in our objects are mostly intrinsic, ratherthan resulting from extinction.
6.2.3. X-ray radiation and broad band SED
So far, we have shown that relativistically beamed jet emis-sion, as found in blazars, provides a good explanation ofthe observed radio and optical properties in flat-spectrum RLNLS1 AGN. This scenario is also consistent with the fact thatsome of the objects show SEDs similar to FSRQs/SSRQs,while the others similar to HFSRQs in theαro, αox, andαrx pa-rameter space (Figure 9). In fact, a few of these objects weresimply classified as FSRQs or SSRQs in previous studies. It isthus natural to speculate that the similar radiation mechanismsare operating in these objects as in normal FSRQs/SSRQs andHFSRQs for producing the broad-band non-thermal emission.
From the soft X-ray spectral shapes alone it is not possibleto distinguish the origin of the X-ray emission, i.e. that asso-ciated with accretion disk as in normal RQ NLS1 galaxies ornon-thermal jet emission as in blazars, since RQ NLS1 galax-ies also show a similarΓ distribution with a large scatter (e.g.Boller et al. 1996; Grupe et al. 1999; Leighly 2000; Zhou etal. 2006). The only exception is perhaps the flat hard X-raycomponent (Γ = 1.37±0.49) in J1633+4718, whose best esti-mate value is hardly found in RQ NLS1 galaxies but is typicalof FSRQs.
One way is to search for possible enhancement in the X-ray emission of RL NLS1 AGN compared to RQ objects ina statistical sense, which, if is the case, may be consideredas an indirect evidence for the presence of a non-thermal jetX-ray component. Here, we simply use the X-ray detectionrate in the RASS as an indicator of possible enhancement inthe X-ray emission of our objects over normal NLS1 galaxiesby comparing the RL and RQ samples. This is plausible sinceour RL NLS1 sample is essentially an optically selected one(see discussion in § 6.1), as the SDSS RQ NLS1 samples. TheRASS detection rate for RQ NLS1 galaxies is≈ 31% fromthe SDSS DR3 NLS1 sample (Zhou et al. 2006); while it is50(±11)% (11/22) for the present RL sample (excluding one

16 W. Yuan, et al.
solely RASS-selected target). If we consider the objects (bothdetections and upper limits) falling within the HBL locus only(Figure 9; excluding 2MASX J0324+3410), the detection rateis even higher 58(±14)% (7/12). Therefore, the higher RASSdetection rate in our RL sample compared to the RQ NLS1sample is suggestive of the presence of a significant excessX-ray component, presumably from the relativistic jets.
In AppendixE, we discuss in detail the possible mecha-nisms of the X-ray radiation of our RL NLS1 AGN, whichare summarised here. In all of the objects, the X-rays pro-duced in the accretion process as in normal RQ NLS1 galax-ies are likely not negligible and make a considerable contri-bution. In addition, we suggest that the non-thermal X-rayemission from relativistic jets may also play a similarly im-portant role. Such a component is most likely to originatefrom inverse Compton radiation and has a flat X-ray spec-trum (in J1633+4718 and possibly in J0849+5108), as seenin FSRQs, for objects having the LFSRQ-like SEDs (NLS1LFSRQs); whereas it is possibly the high-energy tail of syn-chrotron radiation with a steep spectrum for objects with theHFSRQ-like SEDs (NLS1 HFSRQs).
6.2.4. Dichotomy of LFSRQ- and HFSRQ-like NLS1 AGN
In Figure 9, there are about 7–12 objects, or 1/3–1/2of the sample, falling within the box-shaped locus andthus having HBL/HFSRQ-like SEDs (the uncertainty comesfrom those with lower αox limits). Considering thatradio/optically-selected (‘broad’-line) FSRQs have predom-inately LBL/LFSRQ-like SED, such a high fraction ofHFSRQ-like objects is surprising for our sample, which is es-sentially optically/radio-selected. The figure also showsthatthere are no objects resembling extreme HBL/HFSRQs (thelower-left corner of the HBL locus), which have the syn-chrotron component peaked in the X-ray regime. In fact,nearly all the candidate HFSRQ-type SEDs have the syn-chrotron humps peaked likely around the UV band.
Strong emission lined–FSRQs with HBL-type SEDs haverecently been reported as a result of the identificationof radio–X-ray (ROSAT) selected sources (Padovani et al.1997b; Perlman et al. 1998; Padovani et al. 2003). Onemajor distinction with our objects is that those objects havemuch broader lines withFWHM > 2000 kms−1, typical ofclassical FSRQs. The fraction of HBLs/HFSRQs is sample-selection dependent; the authors proposed a fraction (HBLs+HFSRQs) of about 10–15% among the whole blazar popula-tion and about 30% in the RASS–Green Bank (RGB) sample(Padovani et al. 2003). The RGB sample is comparable inthe way of selection to our RASS-detected sub-sample here,which comprises 12 objects; among them, 8 objects are pos-sibly of the HFSRQ-type (Figure 9), making the fraction ashigh as∼ 2/3. It seems that the HFSRQ fraction of our radio-loud NLS1 sample is higher than that of HFSRQs in Padovaniet al. (2003).
Within the unified blazar sequence, the energy of the syn-chrotron peak was found to be well anti-correlated with 5 GHzradio luminosity24, and withαrx, which was suggested to bea tracer of the peak energy (Fossati et al. 1998). We plot inFigure 15αrx versus 5 GHz radio luminosity for the sample,with those objects without X-ray detection indicated by ar-rows. It clearly reveals a good correlation; the Spearman cor-relation test incorporating lower limits ofαrx using ASURV(Isobe et al. 1986; Isobe & Feigelson 1990) yields a signif-
24 L5GHz is thought to be a good tracer of the bolometric luminosity.
FIG. 15.— Relationship ofαrx and 5 GHz radio luminosity. Symbols: ar-rows indicateαrx upper limits for objects without X-ray detection; filled dots:flat spectrum radio sources; open circles: steep spectrum radio sources; aster-isks: sources without available radio spectral indices. 2MASX J0324+3410is also plotted (square). The dotted line corresponds to thesimple divisionbetween LBLs and HBLs usingαrx.
icant correlation at the probability levelPspchance=0.4%. It can
be seen that the transition between LFSRQs and HFSRQs (us-ing αrx≈ 0.78) happens at aroundνLν ∼ 1042 ergs−1, con-sistent with what was previously found between HBLs andLBLs (Fossati et al. 1998, see their Figure 7). Ifαrx doestrace the synchrotron peak energy, this result shows that ourradio-loud NLS1 AGN do follow the blazar sequence well.In fact, the objects at the low luminosity end are among theleast radio luminous blazars known so far, falling close to oreven below the low-end of the FSRQ luminosity function ac-cording to unification schemes (L5GHz ∼ 1031.5 ergs−1Hz−1,Urry & Padovani 1995). However, there seems to be no orat most a weak correlation betweenαrx and Hβ luminosity(Psp
chance=0.1). Such a blazar sequence also explains naturallythe high fraction of HFSRQs, as the majority of our samplehave lower radio powers compared to classical FSRQs. Infact, the objects of our sample have intrinsic powers mostlyinthe range for FR I type radio sources (see § 6.3).
6.3. Intrinsic radio power and radio-loudness
Optically thin radio emission at low frequencies is thoughtto be isotropic, and thus can be used as a measure of the in-trinsic power of the radio sources free from Doppler boost-ing. The low frequency power of radio galaxies can be sepa-rated into two distinct classes at the fiducial valueL178MHz≃2× 1025 W Hz−1 sr−1: the FR Is with the radio emission de-creasing outwards away from the nucleus, and the FR IIswhich have lobes with prominent hot spots and bright edges(Fanaroff & Riley 1974). It has been suggested that RLQsare found in FR II sources, and the distinction of the FR I andFR II types is likely determined by the accretion process ofthe central engine (e.g. Baum et al. 1995), as well as by thedensity of the environment (Gopal-Krishna & Wiita 2002).Despite a lack of adequate observations on their radio mor-phology, it would be informative to compare the isotropic ra-dio power of our RL NLS1 galaxies with the FR types.
We estimate the rest frame 151 MHz luminosities,L151MHz,for our objects, based on their radio data at low frequencies,

Radio-loud Narrow Line Seyfert 1 galaxies 17
which are summarised in AppendixC. For 4 objects with151 MHz fluxes,L151MHz are calculated directly by using the151–327MHz indices for K-correction. Among the rest, 11objects have fluxes at 327 MHz, for whichL151MHz are esti-mated by extrapolating the spectra down to 151 MHz assum-ing the averageα327M
151M=−0.34 found from the above 4. Usingthe steepest (−0.62) and the flattest (+0.09)α327M
151M found abovewould increase and decreaseL151MHz by a factor of up to 1.4and 1.8, respectively; and thus the estimatedL151MHz are rela-tively insensitive to the choice ofα327M
151M. For the 15 objectswith either detected or estimated 151 MHz fluxes,L151MHzrange from 4.5×1024 to 3.5×1027WHz−1, with a median of7.1× 1025WHz−1. Among these, three have luminosities inthe FR II range (J1047+4725, J1305+5116, and J1443+4725,all detected in the 151 MHz survey); while the remaining ma-jority have similar luminosities as FR Is or are close to thetransition line. With estimatedL151MHz =9× 1024 WHz−1,2MASX J0324+3410 also has a luminosity typical of a FR Igalaxy. However, it is not clear whether the clear separationin both radio power and morphology for radio galaxies is ap-plicable to RL NLS1 galaxies, considering their apparentlypeculiar, compact morphology.
It has been suggested that, in classical RL AGN, isotropicradio emission at low frequencies can be used as a good in-dicator of the power of the jets (e.g. Rawlings & Saunders1991). If this is applicable to RL NLS1 galaxies, the aboveresults imply that our sample has much lower jet power com-pared to classical RLQs, which have radio power and mor-phology predominantly in the FR II category (e.g. Rawlings& Saunders 1991; Baum et al. 1995; Liu et al. 2006). We willaddress this issue in a detailed study in the future.
The radio-loudness, by its definition, is largely an apparentrather than intrinsic parameter for the sources in which thebeaming effect is important above 1 GHz in the radio but lessso in the optical band. As a consequence, some radio-loudAGN would have been classified as radio-intermediate or evenradio-quiet, which might also possess weak and mildly rela-tivistic jets in at least some (e.g. Falcke et al. 2006b; Blundellet al. 2003; Brunthaler et al. 2005; Wang et al. 2006), weretheir jets not directed close to our line-of-sight (Falcke et al.2006a; Jarvis & Mclure 2002). A more physically meaning-ful parameter is the ‘intrinsic’ radio-loudness free from thebeaming effect. We calculate the intrinsic radio-loudnessus-ing the un-beamed radio component, that can be extrapolatedfrom a low-frequency flux and dominates fluxes at severalGHz after the jet emission is de-boosted. The intrinsic radio-loudness at 5 GHz,Rintr
5GHz, is estimated by using 327 MHzfluxes for those having this flux measurement. We findRintr
5GHzin the range 34–2600 (with a median of 110) assuming a spec-tral slope of−0.7 for the un-beamed component, or 17–1380(with a median of 56) assuming a slope of−1. It should benoted that such estimates are subject to large uncertainties,partly due to the above finding that the optical light is alsopartially beamed in some of the objects. Nevertheless, theyseem to indicate that a sizable fraction of the sample, includ-ing 2MASX J0324+3410, are likely radio-intermediate (e.g.<250 was suggested by Falcke et al. 2006a, for flat-spectrumsources). Among the sample, there are almost no genuine in-trinsically RQ objects withR ≪ 10, however.
6.4. Black hole masses of radio-loud NLS1 galaxies
6.4.1. Estimation of black hole mass and Eddington ratio
It has become possible recently to estimate the black holemassesMBH of AGN from single epoch spectroscopic obser-vational data (e.g. Kaspi et al. 2000; Wandel et al. 1999),though the uncertainties of both systematics and scatter re-main large (Vestergaard & Peterson 2006; Collin et al. 2006).Assuming that the motion of the line-emitting clouds are viri-alised, the black hole mass can be determined byMBH =f RBLR∆v2/G, where f is a scale factor depending on thekinematics and geometry of the BLR,∆v the emission linewidth, andRBLR the BLR radius. We assume that the com-monly usedRBLR–luminosity relation, derived via reverbera-tion mapping for nearby, normal AGN, is applicable to NLS1AGN. We use the relation for the Hβ luminosity given byKaspi et al. (2005, their Eq. 1 and Table 3); we intend not touse the continuum 5100Å luminosity for possible contami-nation from jet emission (see Section 3.2). A common prac-tice, among a few others25, is to takeFWHM as ∆v andf = (
√3/2)2 = 0.75, assuming an isotropic distribution with
random orbital inclinations of the broad line clouds (Netzer1990). We follow the practice in this work, the same as inKomossa et al. (2006b).
The estimated black hole masses of our sample range from1× 106 to 1.5× 10⁸ M⊙ , peaked at near the median 1.3×10⁷ M⊙ . The black hole mass distribution is well consis-tent with that of the Komossa et al. (2006b) sample. How-ever, by studying the systematic effects inMBH estimation,Collin et al. (2006) argued that the use ofFWHM ratherthan line-dispersion (σline) would introduce systematic bias inthe scaling factorf . We also give alternativeMBH estima-tion by correcting this effect using the formalism proposedbyCollin et al. (2006, their eq.7). For the objects in our sam-ple (FWHM< 2200 kms−1) specifically, this correction sets avalue of the scale factorf ≃1.5, about twice the value in theformer estimation. This results inMBH estimates a factor of2 larger than the values obtained above, ranging from 2×10⁶
to 3×10⁸ M⊙ with a median 2.6×10⁷ M⊙ . The black holemasses thus estimated are listed in Table 4, which are used inthe following analysis.
Having estimated the masses of the central black holes, nowwe can derive the Eddington ratios,REdd. For bolometric lu-minosity correction, we assumeLbol=9λLλ5100, as suggestedby, e.g. Warner et al. (2004), Vestergaard (2004), and Kaspiet al. (2000). TheλLλ5100 luminosity is estimated from thebroad Hβ line luminosity using Eq.(5) of (Zhou et al. 2006) toeliminate the effect of the extra jet contribution. It should benoted that such an estimate is subject to large systematic un-certainties inherent in estimation ofMBH, as well as of bolo-metric luminosity. Using theMBH values obtained with thescale factorf = 0.75 (see above), we find the Eddington ratiosranging fromREdd =0.52 to 2.6 and peaked around a mean of1.0, similar to those found by Komossa et al. (2006b) with amean of 1.2. However, when the correction of Collin et al.(2006) is applied, theMBH values become about twice largerand, consequently, the obtainedREdd values become abouttwice smaller, i.e. ranging from 0.27 to 1.28 with an averageof 0.52.
Now we compare the distributions ofMBH and REdd be-tween our RL sample and the normal NLS1 sample ofZhou’06. Our RL sample has significantly higherMBH and
25 A few other scaling relations forMBH estimation were recently pre-sented in the literature(e.g. Onken et al. 2004; Greene & Ho 2005, 2007;Vestergaard & Peterson 2006; Collin et al. 2006), that slightly differ fromone another.

18 W. Yuan, et al.
REdd distributions compared to the RQ one. This agrees withthe general trend that, as aforementioned in § 6.1, RL objectsare more likely to be found in AGN with massive black holes(e.g. Best et al. 2005). Given their narrow ranges of the line-width, the black hole masses of NLS1 samples, as determinedfrom the Hβ/Hα line-width and luminosity, is strongly corre-lated with luminosity, and in turn, with redshift for flux lim-ited samples. This may explain the higher redshift distributionof our RL sample compared to that of the normal NLS1 sam-ple of Zhou’06 (see Figure 2).
It should be pointed out that the virialMBH estimation issubject to assumption of an isotropic geometry of the BLRwith random orbital inclination of the clouds. If the BLRis flat, a small line width would be a result of small incli-nation, and thenMBH would be largely underestimated (see,e.g. Wills & Browne 1986; Decarli et al. 2008). Indeed thereare some suggestions in the literature for a flattened geometryof the BLR in some RL AGN (e.g. Vestergaard et al. 2000;Sulentic et al. 2003; Jarvis & McLure 2006); but see Punsly(2007). This caveat concerns particularly those of our ob-jects, that have compact radio morphology and those that areblazar-like, indicating a small viewing angle. Given that theMBH distribution of our sample is indistinguishable from thatof the RQ NLS1 sample (within the same redshift range), thiscomes back to the old question whether NLS1 galaxies, asa population, have flattened BLRs and are viewed preferen-tially face-on, rather than having smallMBH (e.g. Osterbrock& Pogge 1985; Puchnarewicz et al. 1992; Bian & Zhao 2004);but see e.g. Smith et al. (2004).
If RL NLS1 galaxies do possess relativistic jets and henceanisotropic radio emission, as we have shown here, they canbe used as a probe to this question since their inclinationcan be inferred from radio observations in a statistic manner.However, with the relatively few data available currently,wedo not find any statistically significant trends of the depen-dence of line-width (MBH) on probable inclination indicators,such as radio-loudness or radio slope. Therefore, though thereis no compelling evidence supporting the planar BLR natureof RL NLS1 from the present data, we cannot rule out thispossibility, either. A much larger RL NLS1 sample coveringa wide range of radio-loudness is desirable to shed light to thisimportant question in the future.
6.4.2. Radio-loudness versus black hole mass
As one of the fundamental relations in understanding AGNjets, the dependence of radio-loudnessR on MBH has beenstudied extensively in recent years, with the advent of the easyestimation ofMBH in AGN. A R–MBH correlation was pro-posed by Laor (2000) that all RLQs in the PG quasar samplehaveMBH > 3×10⁸ M⊙ , while the radio-quiet quasars havea much lowerMBH distribution. This trend was confirmed insome studies (e.g. Lacy 2001; Mclure & Jarvis 2004; Metcalf& Magliocchetti 2006), but was found to be weak or absent inothers (Oshlack et al. 2002; Woo & Urry 2002). Furthermore,by including Seyferts and low luminosity AGN, Ho (2002)found thatR is mostly correlated withREdd rather thanMBH.In a recent comprehensive treatment of this question, Sikoraet al. (2007) demonstrated thatR depends on bothREdd andMBH, with two distinct inverseR–REdd dependence sequencesfor AGN hosted by elliptical (systematically higherR) anddisk galaxies (systematically lowerR), respectively. Regard-less whether there is indeed a trend of dependence or not, mostaforementioned studies show that, on theMBH–R plane, thereis a scarcity of RL AGN with lowMBH. Even for those low-
FIG. 16.— Dependence of radio-loudness on black hole mass for the radio-loud NLS1 galaxies of our sample (filled dots) and those from the sampleof Komossa et al. (2006b, open squares). Over-plotted are schematic areaspopulated by the bulk of the radio sources of the samples of Laor (2000, solidline) and Lacy (2001, dashed line). We note that a small number of (normal)RL AGN with smallMBH and largeR has also been claimed by Woo & Urry(2002), which lies mostly at higherR ≃ 103−4 above ours in the diagram;however, there remains a controversy as to the estimation ofthoseMBH (see,e.g. Jarvis & Mclure 2002; Laor 2003).
MBH RL AGN suggested in the literature (e.g. Oshlack et al.2002; Woo & Urry 2002), there remains a controversy as tothe estimation ofMBH andR (see, e.g. Jarvis & Mclure 2002;Laor 2003).
Obviously, as first pointed out by Wang et al. (2001) andZhou et al. (2003), radio-loud NLS1 AGN donot follow theabove trend found for normal RL AGN (provided the virialMBH as estimated above are largely correct). Moreover, Ko-mossa et al. (2006b) demonstrated explicitly that RL NLS1galaxies are located in a region of theMBH–R diagram thatis sparsely populated by other types of AGN (R ≃ 101−3 andMBH < 108 M⊙).
Similarly, we plotR1.4 versusMBH for our very RL NLS1galaxies in Figure 16. Also plotted are the loci of the ob-jects in the samples of Laor (2000) and Lacy (2001) for com-parison. Two pieces of results can be inferred immediatelyfrom Figure 16. Firstly, within our sample, there is no cor-relation found betweenR1.4 andMBH, nor betweenR1.4 andREdd (Psp
chance=0.44 and 0.27, respectively); however, we notethat these results are rather uncertain given the small sam-ple size and the limited ranges in bothR1.4 andREdd. Sec-ondly, our new result confirms and strengthens that of Ko-mossa et al. (2006b), and improves upon it by extending theRL NLS1 locus to even lowerMBH and higherR1.4. In partic-ular, the bulk of our RL NLS1 galaxies lies within a locus ofMBH ≃ 106−7.5 M⊙ andR ≃ 101−3, which appears to be pref-erentially avoided by other types of RL AGN [compared to,e.g. Sikora et al. (2007), see their Figure 4], except for lowpower Seyfert galaxies and LINERs; however, those excep-tions have exclusively low Eddington ratiosREdd < 10−2 andare drastically different from NLS1 with highREdd (see alsoHo 2002). Compared to Figure 4 in Sikora et al. (2007), ourRL NLS1 galaxies appear to have the largest radio-loudnessup to R1.4∼ 103−4 among all types of AGN within thisMBHrange. This means that the RL NLS1 galaxies show strongexcess radio emission with respect to theirMBH, when thesuggested radio power–MBH relation for normal AGN is com-pared26 (e.g. Lacy 2001). Finally, we note that the above
26 We note that several (normal) RL AGN with smallMBH similar to oursand with even largerR (≃ 103−4) have also been claimed by Woo & Urry(2002), though there remains a controversy as to the estimation of MBH (see,

Radio-loud Narrow Line Seyfert 1 galaxies 19
two results remain valid even if the Doppler de-boosted radio-loudness values (see § 6.3) are used instead, which are in therange ofR ≃ 101−3.
Hence, the existence of RL NLS1 galaxies as apopulationwith smallMBH, if estimated correctly, fills up the previouslysparsely populated region in theMBH –R parameter space fornormal RL AGN. This result indicates that there indeed existAGN with high radio-loudness (R ∼ 102−3) but intermediateMBH (106−8 M⊙). Though there is the systematic uncertaintyin estimatingMBH ascribed to the possible BLR inclination ef-fect, we argue that this result may not be affected qualitatively.This is because the Komossa et al. sample, though composedof mainly steep spectrum sources (thus relatively larger incli-nation), led to similar results. Furthermore, in a few objectswhere the host galaxies are resolved, their smallMBH are sup-ported by a lack of massive galactic bulges, as predicted bytheMBH –bulge relation (e.g. Magorrian et al. 1998). Our re-sult also implies that the inverse relation betweenR andREddas suggested previously (see, e.g. Greene et al. 2006; Sikoraet al. 2007) may not work at the highREdd end close to the Ed-dington rate. Furthermore, Sikora et al. (2007) argued thatRLAGN hosted by elliptical galaxies are much radio-louder thanAGN hosted by disk galaxies. Though this statement maybe true in general, it is perhaps more appropriate in terms ofRL fraction, i.e. the fraction of RL objects is lower in AGNhosted by disk galaxies compared to that of AGN hosted byellipticals; in addition, the difference in radio-loudness is nowless than what was thought previously (Sikora et al. 2007).
6.5. On the nature of radio-loud NLS1 galaxies
6.5.1. A previously unknown population of radio-loud AGN?
On the black hole mass–radio-loudness plane our RL NLS1galaxies form a natural extension to lowMBH of classicalRLQ/BLRGs (Broad Line Radio Galaxies) with roughly con-stant radio-loudness (Figure 16; see also Figure 3 in Sikoraetal. 2007). This is not surprising, since the transition betweenBLAGN and NLS1 AGN issmooth in the line-width of thebroad lines, and, as a consequence, in black hole mass andluminosity. If theMBH are underestimated systematically (see§ 6.4), the loci of the radio-loud NLS1 AGN will move evencloser to those of normal RL AGN. In this regard, it is naturalto treat RL NLS1 galaxies as the low–MBH end of normal RLAGN.
On the other hand, however, RL NLS1 galaxies show somepeculiarities in observed properties that are unusual in com-parison with, or at an extreme of, normal RL AGN. The mostdistinctive features are in the radio properties. Even for steep-spectrum sources, the radio sources of RL NLS1 galaxies ap-pear to be compact, with the size less than several tens of kpcor even smaller wherever higher resolution observations areavailable. In contrast, the radio sources of RLQ/BLRGs areabout 100–400kpc in a similar redshift and luminosity rangeas our radio-loud NLS1 AGN (Singal 1993). Moreover, mostof the RL NLS1 galaxies have radio power in the range ofFR I radio galaxies, whereas RLQ/BLRGs tend to be associ-ated with FRII type sources27 (e.g. Laing et al. 1983).
In the following aspects the two types are not mutually ex-clusive but overlap to some extent, yet they seem to differ ina systematic way. Firstly, There seems to be a higher fraction
e.g. Laor 2003). Our sample appears to differ from theirs in the sense thatit fills up the gap betweenR ≃ 10 and 103 in the smallMBH regime in theirMBH–R diagram.
27 There are exceptions, though; see, e.g. Blundell & Rawlings(2001).
of HBL/HFSRQ-like blazars in optically selected RL NLS1galaxies than in normal RLQ/BLRGs of radio/optically se-lected samples (Padovani et al. 2003), though further con-firmation using complete samples is needed. Secondly, ascommonly suggested, NLS1 AGN are accreting at close to,or larger than the Eddington limit (e.g. Collin & Kawaguchi2004). At such high rates the accretion flow proceeds via aslim disk where energy is partially advected into the blackhole before being radiated due to relatively long cooling time(e.g. Abramowicz et al. 1988; Mineshige et al. 2000; Wang& Netzer 2003). Thus the accretion processes in radio-loud NLS1 AGN may differ drastically from those in normalRLQ/BLRGs, where a standard thin disk is believed to be op-erating, though they do overlap atREdd ≃ 1 to some extent(see e.g. Sikora et al. 2007). The final point—on the hostgalaxies—is only suggestive because of a lack of sufficientevidence. RL NLS1 nuclei, at least some, seem to be hostedin disk or interacting galaxies, and/or galaxies with relativelyyoung stellar populations. In contrast, classical RLQ/BLRGs28 are preferentially hosted in giant elliptical/massive bulgedominated galaxies or at least strongly passively evolvinggalaxies (e.g. Bahcall et al. 1997; Dunlop et al. 2003; Floydetal. 2004; O’Dowd & Urry 2005), although there was alsoevidence reported for star-formation in some hosts beyondz & 0.4 (e.g. Örndahl & Rönnback 2005; O’Dowd & Urry2005).
In consideration of their unusual properties, we are left withtwo options regarding the nature of RL NLS1 galaxies: ei-ther they are a downsized extension of normal RL AGN tothe lower-MBH (and perhaps higher-REdd) range, or they forma previously unknown population distinct from normal RLAGN. The former would invoke some unknown processes thatcan explain the observed differences between RL NLS1 andnormal RL AGN with the smooth change ofMBH. For thelatter, the operating physical processes in likely black holeaccretion and jet formation may be radically different for thetwo classes. A related, interesting question is whether thedifferences in the observed properties between RL NLS1 andnormal RL AGN can be naturally explained by the same un-derlying physical processes that make NLS1 different fromnormal AGN, or whether some additional mechanisms areneeded. To further understand these questions, a large sam-ple of RL NLS1 galaxies with the full range of radio-loudnessis needed, as well as extensive observations, especially intheradio band. As complementary discussion, we also comparethem with two special types of RL AGN below, namely, BLLac objects and compact steep-spectrum sources. As will beseen, RL NLS1 galaxies may be a heterogeneous populationthemselves.
6.5.2. Relationship with BL Lac objects
One object in our sample, J0849+5108 (0846+51W1), wasformerly classified as a BL Lac object at its high light statebased on previous observations (see AppendixB for details).As such, it presents an interesting case linking possibly RLNLS1 galaxies with BL Lac objects, as pointed out by Zhouet al. (2005), though its black hole mass (2.6× 10⁷ M⊙) islower compared to those typical of BL Lac objects (MBH ∼108−9 M⊙, e.g. Cao 2003). In fact, it has been speculated in
28 Ho & Peng (2001) showed that some Seyfert galaxies hosted in disk-dominated spirals are in fact RL when the optical nuclear luminosities areconsidered properly. However, the vast majority of their sample objects areof substantially low power and sub-Eddington (Ho 2002).

20 W. Yuan, et al.
the past decade that concealed Seyfert nuclei exist in a few BLLac objects, including BL Lac itself (Vermeulen et al. 1995;Corbett et al. 2000). It is therefore tempting to postulate thatsome RL NLS1 galaxies may actually be BL Lac objects (withlow MBH) at their low light states.
The bulk of our RL NLS1 galaxies have a BLR luminos-ity29 distribution lying within log(LBLR/ergs−1 )=43.5–44.5,the low end of which overlaps partially with those of BL Lacobjects (a median of 1043.7 ergs−1 was given for the upper lim-its of LBLR by Celotti et al. 1997). Specifically, J0849+5108hasLBLR ∼ 1043.7 ergs−1. However, this is likely not the casefor most of the RL NLS1 galaxies given their relatively higherLBLR compared to the upper limits for BL Lac objects. Onthe other hand, this possibility means that BL Lac objectsmight not be a homogeneous population, and some may justbe Seyfert nuclei/NLS1 at a high state of the non-thermal ra-diation from the jet. Similarly, this concerns only BL Lac ob-jects at the low-MBH end, as is the case of J0849+5108, ratherthan the bulk of classical BL Lac objects that habour massiveblack holes and accrete likely via a low efficiency accretionflow (e.g. Cao 2003).
6.5.3. Relationship with CSS sources
Compact steep-spectrum sources are compact, powerful ra-dio sources with spectral peaks near 100 MHz. They are in-herently compact with linear sizes≤ 20 kpc, having (oftensymmetric) double/triple morphology with complete jets andlobes on small scales. The most popular scenarios to explaintheir nature advocate that they are either young and evolv-ing radio sources or confined by dense gas of their environ-ment (see O’Dea 1998, for a review). Very recently, a fewlines of observational evidence point to an interesting link be-tween RL NLS1 galaxies and CSS, which share some degreeof similarity as the following. (1) As mentioned in § 1, theradio sources of all RL NLS1 galaxies are compact, includ-ing steep-spectrum sources. In particular, a few NLS1 AGNhaving higher resolution observations show small-size struc-ture: e.g. most of the radio emission of 2MASX J0324+3410is from a region smaller than 6.8 mas (8.2 pc projected size),as seen from VLBA images at 8.4 GHz (in preparation). (2)The low frequency spectrum of J1047+4725, one of the steep-spectrum objects in our sample, appears to flatten at arounda few hundred MHz as indicated by its flat slope of−0.28between 327 and 151 MHz; such a spectral break is charac-teristic of CSS. In fact, the RL NLS1–CSS connection wasadvocated by Oshlack et al. (2001) and Gallo et al. (2006)for the case of PKS 2004-447, although it is unclear as towhether PKS 2004-447 is a genuine NSL1 galaxy (see Zhouet al. 2003, for a short comment). (3) There are observationalindications that the host galaxies of a large fraction of CSSare interacting/merging and may contain significant amountof dense gas (O’Dea 1998), similar to what was found in someRL NLS1 galaxies.
The radio power distribution of our RL NLS1 galaxies over-laps with the lower part of that of CSS (O’Dea 1998). Assuch, if there is an overlap between CSS and RL NLS1 galax-ies, they should be mostly the CSS having low radio power,and, relatively smallMBH. Since CSS sources also possess(small scale) jets, in cases where the jets are directed close to
29 The luminosity of the broad line region is estimated from theHβ lu-minosity using the method proposed by Celotti et al. (1997) and the quasaremission line ratios given by Francis et al. (1991), yielding LBLR = 25.26LHβ
(see also Liu et al. 2006).
our line-of-sight, we expect to see blazar-like objects. Someof those could be the flat-spectrum RL NLS1 galaxies stud-ied here, in which relativistic jets are inferred to be present.Conclusive remarks have to await future proper and detailedcomparisons of the two classes, as well as more radio obser-vations with higher resolution, however.
6.5.4. Implication for jet formation in AGN
Given the high Eddington ratios of NLS1 galaxies in gen-eral, as commonly suggested and also found here, our RLNLS1 AGN present a strong case where jets, possibly at leastmildly relativistic, can be produced in highREdd systems. Thisstrengthens the similar situation in powerful RLQs with muchlargerMBH. This contrasts clearly with black hole X-ray bi-naries where jets are found at the low/hard state, despite thesuggestion that transient jets (or mass ejection) may occuratthe so called very-high state whereREdd is higher (Maccaroneet al. 2003; Fender 2004). The formation of jets is thought tobe related to the black hole and accretion process (e.g. Bland-ford 2000; Celott & Blandford 2001; Meier 2003; Ballantyne2007). The finding of relativistic jets in black hole accre-tion systems with highREdd (where the accretion proceedsvia probably a new form other than the standard disk) and,moreover, with relatively lowMBH is important for address-ing basic questions as to how jets are formed. Jet formation inhigh REdd systems (slim disks) is far from clear, though thereare some suggestions that outflows as well as mildly beamedand collimated emission are likely present in such systems(Ohsuga et al. 2005).
As has been shown above (see also Komossa et al. 2006b;Whalen et al. 2006), apart from the continuum radiation,the RL NLS1 galaxies resemble closely their RQ counter-parts in many ways, e.g. optical emission properties (exceptfor stronger FeII emission), the distributions of black holemasses and the Eddington ratios. These facts suggest thatRL NLS1 galaxies are simply otherwise normal NLS1 galax-ies but having relativistic jets, reminiscent of the RL/RQ di-chotomy of more powerful, classical AGN. It would be inter-esting to find out whether there is a bimodal distribution inthe radio-loudness, as reported for the broad-line quasar pop-ulation (though this is still a matter of debate), in future workconsidering objects with the whole range of radio-loudness.The nearly indistinguishable properties other than the pres-ence of radio jets possessed by the two subsets of NLS1 galax-ies, RL and RQ, seemingly hint at a possibly important role ofblack hole spin in the making of relativistic jets in RL NLS1galaxies.
7. SUMMARY OF CONCLUSIONS AND IMPLICATIONS
A homogeneous sample of genuine RL NLS1 galaxies(radio-loudnessR1.4& 100) is presented for the first time,comprising 23 objects drawn from SDSS spectroscopic ob-jects with FIRST detections. Their NLS1 nature is discoveredby analysing systematically the spectroscopic data from theQSO and galaxy database in the SDSS DR5. The sample canbe treated as an optically–radio selected one. We carry outsystematic investigations into their multiwaveband propertiesfrom radio to X-rays using data available from the archives.The main results are the following.
All radio sources of the sample are compact, less than a fewtens of kilo-parsec at least. Several with VLBI observationsare unresolved or marginally resolved at scales of about tensof parsec. Among those with available radio spectral indices,

Radio-loud Narrow Line Seyfert 1 galaxies 21
the majority are flat-spectrum sources (α > −0.5 around 1.4–5 GHz), and a few even have inverted spectra (α > 0). Radiovariability is found to be common in most of the flat-spectrumsources. We were able to estimate the brightness temperaturesof the radio sources, that are as high asTB > 1011 K and evenexceeding the inverse Compton limit (1012 K) in four objects.The high brightness temperatures indicate the presence of rel-ativistic beaming. The majority of RL NLS1 galaxies hasa low-frequency (isotropic) radio power falling in the rangeof FR I type radio galaxies (L151MHz . 1025 WHz−1 sr−1), andthe remaining minority in the range of the FR II type. Whenisotropic, rather than Doppler boosted, emission is consid-ered, a large fraction of the objects can be considered as in-trinsically radio-intermediate.
The observed optical luminosities are systematically in ex-cess of the thermal continua predicted from the Hβ line lu-minosities by a factor of up to several. The optical slopesof our RL objects, while spanning a wide range from moder-ately red to blue, are systematically bluer than that of radio-quiet NLS1 AGN. We interpret this effect as the contributionfrom a (non-thermal) component, presumably from relativis-tic jets, to the optical band superimposing the central ionisingcontinuum seen in radio-quiet NLS1 AGN. The optical FeIIemission in the radio-loud NLS1 in our sample is on aver-age stronger than ‘normal’ NLS1 galaxies. Except this, thetwo subsets of NLS1 galaxies seem to be indistinguishable inother emission line properties.
On the radio–optical–X-ray effective spectral indices plane(αox vs.αro), our objects have broad-band SEDs well consis-tent with those of blazars, i.e. both the HFSRQ and LFSRQtypes as well as SSRQs. Of particular interest, the fractionofthe candidate HFSRQ-type objects seems to be high, thoughtheir synchrotron component peaks are only moderately high(at around the UV). This finding extends the recently discov-ered strongly-lined (FSRQ) HBL-type blazars (Padovani et al.2003) to NLS1 galaxies.
The continuum shape in the soft X-ray band exhibits a largevariety among our RL NLS1 galaxies. There is evidence inone, or possibly two objects for a flat X-ray spectral com-ponent (Γ . 1.8), which we interpret as an inverse-Comptonorigin from jets as in FSRQs. Most of the objects with esti-mation of the X-ray spectral slopes show steep spectra. Thesteep X-ray spectrum is also consistent with what is expectedfor HFSRQs, that originates from the high energy end of thesynchrotron component. Based on this circumstantial evi-dence, we suggest that such a component may be a signifi-cant contributor to the observed X-ray emission, though theX-ray component as seen in radio-quiet NLS1 galaxies mayalso play a role.
In view of the independent lines of evidence presented here,as well as those found in previous studies for several indi-viduals (either inclusive or exclusive of our sample), we sug-gest that there likely exists a population of RL NLS1 galaxiesshowing the broad-band continuum emission characteristicofblazars, though alternative explanations cannot be ruled outcompletely. In this scenario, beamed non-thermal emissionfrom jets, that are at least mildly relativistic, dominatesthehigh-frequency radio band, and contributes significantly to theoptical and possibly the X-ray bands. Our finding extends theradio-loud quasar population into a narrow line-width regimeof the broad emission lines. We postulate that all genuineradio-loud NLS1 galaxies possess small scale, at least mildlyrelativistic jets, reminiscent of classical radio-loud AGN. Inthis scenario, steep-spectrum NLS1 sources (perhaps includ-
ing some of those with smaller radio-loudness withinR =10–100) are simply objects of the same population whose radiojets are aligned at a relatively large angle to the line-of-sight.
The host galaxies of two nearby RL NLS1 nuclei, whoseimages are resolved, have disk morphology, one even in amerger, in line with the finding for the previously publishedblazar-NLS1 hybrid object 2MASX J0324+3410 (Zhou et al.2007). In several objects imprints of young stellar populationsare likely to be present in form of high-order Balmer absorp-tion lines in the SDSS spectra.
Based on the commonly used relation of black hole masswith broad line width and luminosity, our RL NLS1 galax-ies have estimatedMBH in the range of 106 − 108 M⊙, pro-vided that thisMBH scaling relation is applicable to NLS1 andthe BLR is not largely flattened. The thus estimated Edding-ton ratios range fromREdd =0.5 to 3, and peak atREdd≈ 1(assumingLbol = 9λLλ5100). RL NLS1 galaxies deviate fromthe known trends of radio-loudness versus the Eddington ra-tio and black hole mass, and are populated in a region in theradio-loudness–MBH diagram where normal AGN are seldomfound, i.e. moderateMBH and largeR (MBH ≃ 106−7.5 M⊙,R ≃ 101−3), confirming and improving upon the previous re-sults suggested by Komossa et al. (2006b). As such, RL NLS1show strong excess radio emission with respect to theirMBH,when compared to the previously suggested radio power–MBHrelation for normal AGN (e.g. Lacy 2001). Our results implythat large radio-loudness (R = 101−3) can be produced in AGNwith moderateMBH down to∼ 106 − 107 M⊙ and accretingat/close to the Eddington rate; and some of these AGN arehosted in late-type galaxies, some even in interacting systems.The presence of relativistic jets in such systems may have in-teresting implications for understanding jet formation inAGNin general.
In spite of a likeness to normal RL AGN in many aspects,RL NLS1 galaxies show some extreme or unusual proper-ties, though some of the evidence are only circumstantial.These include compact radio morphology, relatively low ra-dio power, a high incidence of HBL/HFSRQ-type SEDs, hostgalaxies of probably late-type and/or with young stellar pop-ulations, and the common properties characteristic of NLS1galaxies, e.g. smaller black hole masses, higher Eddingtonratios, and stronger FeII emission. All of these lead usto postulate that either they are an extension of normal RLAGN to the lower-MBH range, and all those differences canbe explained as a consequence of decreasingMBH; or theyform a previously unknown population distinct from normalradio-loud AGN. As one interesting possibility, we speculatethat low-power CSS might be the parent population of theflat-spectrum RL NLS1 galaxies with beamed jet emission.For the future, a much larger sample and extensive multi-waveband observations are essential for understanding thena-ture of radio-loud NLS1 galaxies.
Finally, if the broad-band radiation mechanisms in flat-spectrum radio-loud NLS1 AGN are indeed the same as inblazars, we expect some of these objects to beγ-ray emit-ters in the GeV band. This can be tested by observations ofGLAST in the near future.
We thank the anonymous referee for helpful comments andsuggestions. This work is supported by the Chinese Natu-ral Science Foundation through projects No. NSF10533050and NSF10473013, and the BaiRen Project of the ChineseAcademy of Sciences. Funding for the creation and the dis-

22 W. Yuan, et al.
tribution of the SDSS Archive has been provided by the Al-fred P. Sloan Foundation, the Participating Institutions,theNational Aeronautics and Space Administration, the NationalScience Foundation, the U.S. Department of Energy, theJapanese Monbukagakusho, and the Max Planck Society. TheSDSS is managed by the Astrophysical Research Consortium(ARC) for the Participating Institutions. The Participating In-stitutions are The University of Chicago, Fermilab, the Insti-tute for Advanced Study, the Japan Participation Group, The
Johns Hopkins University, Los Alamos National Laboratory,the Max-Planck-Institute for Astronomy (MPIA), the Max-Planck-Institute for Astrophysics (MPA), New Mexico StateUniversity, Princeton University, the United States NavalOb-servatory, and the University of Washington. This researchhas made use of the NASA/IPAC Extragalactic Database(NED) which is operated by the Jet Propulsion Laboratory,California Institute of Technology, under contract with theNational Aeronautics and Space Administration.
APPENDIX
A. OPTICAL SPECTRAL MODELING
The starlight and nuclear continua are modeled as
S(λ) = Ahost(EhostB−V ,λ) A(λ) + Anucleus(Enucleus
B−V ,λ) [bB(λ) + cbCb(λ) + cnCn(λ) + dD(λ)] (A1)
whereS(λ) is the observed spectrum.A(λ) =∑6
i=1 ai ICi(λ,σ∗) represents the starlight component modeled by our 6 synthesizedgalaxy templates, which had been built up from the spectral template library of Simple Stellar Populations (SSPs) of Bruzual &Charlot (2003) using our new method based on the Ensemble Learning Independent Component Analysis (EL-ICA) algorithm.The details of the galaxy templates and their applications are presented in (Lu et al. 2006).A(λ) was broadened by convolvingwith a Gaussian of widthσ∗ to match the stellar velocity dispersion of the host galaxy;in this process the velocity differencebetween emission and absorption lines is taken into account. The un-reddened nuclear continuum is assumed to beB(λ) = λ−1.7
as given in Francis (1996). We modeled the optical FeII emission, both broad and narrow, using the spectral data of the FeIImultiplets for I Zw I in theλλ 3535–7530Å range provided by Véron-Cetty et al. (2004, Table A1,A2). We assume that the broadFeII lines (Cb in Eq.1) have the same profile as the broad Hβ line, and the narrow FeII lines (Cn), both permitted and forbidden,have the same profile as the that of the narrow Hβ component, or of [OIII ]λ5007 if Hβ is weak.D(λ) represents the templates ofhigher-order Balmer emission lines (10≤ n ≤ 50) and Balmer continuum generated in the same way as in Dietrich et al. (2003).Ahost(Ehost
B−V ,λ) andAnucleus(EnucleusB−V ,λ) are the color excesses due to possible extinction of the host galaxy and the nuclear region,
respectively, assuming the extinction curve for the Small Magellanic Cloud of Pei (1992). The fitting is performed by minimizingtheχ2 with Ehost
B−V , EnucleusB−V , ai, σ∗, b, cb, cn, andd being free parameters.
B. NOTES ON INDIVIDUAL OBJECTS
J0849+5108 (0846+51W1): This object has drawn substantial attention ever since its first identification with a BL Lac object(at a bright state) by Arp et al. (1979), at a claimed high redshift of z = 1.8630. Its radio flux also showed large amplitudevariations up to 50% at 1.4 GHz. This object exhibited a remarkable optical brightening with an amplitude of∆V ∼ 5 withinless than a month (Arp et al. 1979) and high and variable optical polarization (Moore & Stockman 1981; Sitko et al. 1984),making it one of the optically violent variables (OVV) and highly polarized QSOs (HPQ). Night-to-night and even intra-nightoptical variability was also found (Sitko et al. 1984; Stalin et al. 2005). At maximum light outburst, the continuum is featureless,whereas its spectra taken at normal/minimum light states show strong emission lines (Arp et al. 1979; Stickel et al. 1989). Thusit is a transition between a quasar and a BL Lac object, i.e. appeared to be a BL Lac object only at its flaring state. The largeandvariable polarization in the optical band suggests strongly that this emission is due to synchrotron radiation (Sitko et al. 1984).The conspicuous characteristic emission lines identified in the SDSS spectrum of J0849+5108 give a redshift ofz = 0.583. Adetailed study of its SDSS spectrum and other properties waspresented by Zhou et al. (2005). The optical spectral slope obtainedfrom fitting the SDSS spectrum is red, withαλ≃ −0.2.
J0948+0022: The object was first discovered for its radio emission in various radio surveys (S5GHz ∼0.2–0.3Jy). It wasidentified with a NLS1 galaxy, based on its SDSS spectrum, by Williams et al. (2002) and Zhou et al. (2003), and was studiedin detail as one of the few previously known very RL NLS1 galaxies. The radio source has an inverted radio spectrum and wasunresolved with VLBI at milli-arcsec resolution. These observations were explained in terms of relativistic beaming (Doi etal. 2006). A very high brightness temperature (∼ 1013 K) inferred from radio flux variations suggest the presence of a jet withrelativistic beaming (Zhou et al. 2003). Long-term opticalvariability with an amplitude of about 1 mag in theB-band was alsonoted in Zhou et al. (2003).
J1505+0326: It has radio fluxes peaked at∼ 7 GHz (Tinti et al. 2005). Its VLBI images are dominated by a very compactcomponent, marginally resolved at 2.3 GHz band (Dallacasa et al. 1998). The radio emission at centimeter wavelengths showsvariability.
J1633+4718 (RXJ 16333+4719): The object was identified with a NLS1 galaxy in optical identification of ROSAT All-SkySurvey (RASS) sources (Moran et al. 1996; Wisotzki & Bade 1997). The AGN (see Figure 1 for its SDSS spectrum) is actuallyone of the two nuclei, separated by 4′′, residing in an interacting/merger system. The other nucleus has a starburst spectrum(Bade et al. 1995). The radio source, which is associated with the AGN, is unresolved with VLBI at milli-arcsec resolution(Doi et al. 2007). Its spectral shape above 5 GHz is inverted,as measured by simultaneous multiwavelength observationsbyNeumann et al. (1994). The system was noticed to be associated with the IRAS source IRAS 16319+4725 (RA=16h33m23.03s,Dec=+47d19m03.5s), whose positional uncertainty—much larger than the separation of the two optical nuclei—encompasses
30 This redshift value, given by the authors based on the spectra with low resolution and signal-to-noise ratios, turned out to be wrong.

Radio-loud Narrow Line Seyfert 1 galaxies 23
both of the nuclei (Boller et al. 1992; Moran et al. 1996; Condon et al. 1998b). The [OIII ] doublet shows a noticeable blue wingin its SDSS spectrum.
J1644+2619: Its radio source has an inverted spectrum and was unresolved with VLBI at milli-arcsec resolution (Doi et al.2007).
C. RADIO EMISSION AT LOW FREQUENCIES
In the above sections, evidence has been presented for the blazar-like properties of the (flat-spectrum) RL NLS1 galaxies,arguing for the presence of relativistic jets in them. As is known in normal radio quasars/galaxies, radio jets are associatedwith large scale radio lobes. These show diffuse radio emission with steep spectrum (αr ≃ −0.77; e.g. Kellermann 1966) whichdominates the radio fluxes at low frequencies (several hundred MHz), via synchrotron radiation from optically thin plasma. Herewe examine the radio properties of our sample at low frequencies, though the data are sparse in general, especially at around100 MHz. The radio emission is searched for using the WENSS31 survey (Rengelink et al. 1997) at 327 MHz and using NEDfor surveys at lower frequencies. We find 15 objects with detections at 327 MHz, for which the 1.4 GHz to 327 MHz spectralindicesα1.4G
327M can be computed. We found a medianα1.4G327M of −0.47, and∼ 47% being steeper than−0.5 with the steepest as
−0.83, systematically steeper than the 1.4–5GHz indices (3/11are steep-spectrum). This means that the spectral indices steepenprogressively towards low frequencies.
This behavior can well be explained by onset of a steep-spectrum component dominating the low frequencies, as commonlyseen in normal RL AGN. Therefore, we postulate that in these objects there exists diffuse, optically thin emission, presumablyfrom putative radio lobes that are powered by (relativistic) jets. If this is the case, those blazar-like (flat-spectrum) NLS1 AGNmust possess the general core–halo morphology as seen in some blazars (e.g. Stannard & Mcilwrath 1982; Browne & Perley1986; Murphy et al. 1993). Given the compact morphology unresolved at the FIRST resolution (smaller than several tens kpc),there are two possibilities: either they have large scale extended emission—similar to the classical radio sources—but are viewedclose to the radio axis, or are intrinsically compact, similar to CSS (compact steep-spectrum sources).
At the even lower frequency of 151 MHz, 4 objects have detected radio emission, all from the 6C/7C survey (e.g. Baldwin et al.1985; Hales et al. 1988), namely J1047+4725 (1.81 Jy), J1305+5116 (0.32 Jy), J1443+4725 (0.5 Jy), and J1548+3511 (0.26 Jy).The 151–327MHz indices areα327M
151M=−0.28,−0.54,−0.62,+0.09, respectively, and the average is−0.34. These values are muchflatter than the ‘canonical’ slope for diffuse optically thin emission from powerful sources (< −0.7, e.g. Kellermann 1966),indicating that the spectra have already turned over, or started to turn over, in this frequency range due possibly to synchrotronself-absorption. In fact, the radio spectra of J1047+4725 and J1548+3511 show a clear trend of turnover at low frequencies.Considering the relatively large redshifts of the sample, the break frequencies in some sources could be as high as several hundredMHz in the source rest frame. Spectral turnovers at such frequencies are often seen in radio sources with small scale structure,such as in CSS (e.g. O’Dea & Baum 1997). The previously reported extreme NLS1/blazar hybrid object 2MASX J0324+3410(Zhou et al. 2007) was also detected at 151 MHz (1.02 Jy); its radio slope also steepens significantly towards low frequencies,α327M
151M=−0.44 (compared toαr≃ 0.1 at high frequencies, Neumann et al. 1994), suggesting the dominance of a steep-spectrumcomponent at low frequencies.
D. EFFECTS OF REFRACTIVE INTERSTELLAR SCINTILLATION ON RADIOFLUX VARIATIONS
For compact radio sources (milli-arcsec scale), it is knownthat refractive interstellar scintillation (RISS), caused by inhomo-geneities in the interstellar medium, may give rise to variations of radio flux densities (e.g. Rickett 1986, 1990; Blandford etal. 1986). RISS is wavelength-dependent and concerns predominantly the low frequency domain (below 1 GHz). At centimeterwavelengths, RISS mostly causes “flickering” at a lever of a few percent, as was found in observations (Heeschen 1984) andisalso consistent with the theoretical models (Rickett 1986;Blandford et al. 1986). Although variations at a larger amplitude weresometimes ascribed to RISS, they were limited to a small number of individual objects which ubiquitously are at low Galacticlatitude (< 10) or even have a line-of-sight passing through the Galactic plane (Hjellming & Narayan 1986; Dennison et al.1987). Monitoring observations of radio sources at frequencies above 1 GHz showed that both intrinsic and extrinsic (RISS)variability contribute to observed radio flux variations, with the former having timescales from months to years and thelatterbeing faster and having rms amplitude typically< 10% (e.g. Lazio et al. 2001; Mitchell et al. 1994; Rickett et al. 2006).
In consideration of the large variation amplitudes in some of the objects of our sample and their high Galactic latitudes(b=31−51, Table 3), we argue that the variations are predominantly intrinsic for the majority of the variables reported here, insteadof arising from RISS. This is especially true for variationsat 5 GHz or even higher frequencies. Furthermore, the brightnesstemperatures deduced from variability at 1.4 GHz are in the same range as those from 5 GHz (Table 3); this favours the intrinsicvariability explanation, since RISS at 1.4 GHz is expected to be more pronounced than at 5 GHz due to its strong wavelengthdependence. We therefore suggest that, although a non-negligible role played by RISS may not be ruled out in individual objects,especially those with relatively low amplitudes, our results for the sample as a whole should not be affected significantly.
E. ON THE X-RAY RADIATION MECHANISMS OF RADIO-LOUD NLS1 AGN
As one of the defining characteristics, the X-ray spectra of FSRQs are flat and extend from the soft to the hard X-ray band(Γ∼ 1.6 with a dispersionσ = 0.1− 0.2; see e.g. Reeves & Turner 2000), which is interpreted as inverse Compton radiation fromthe relativistic jets and beamed. In most RLQs the contribution from a hot disk corona to the observed X-rays is negligible (inthe hard X-ray band> 2 keV), except the steep-spectrum soft X-ray excess below 1 keV (e.g. Brinkmann et al. 1997; Yuan etal. 2000). From the data analysis above, we find a flat X-ray spectrum in J1633+4718 withΓ = 1.37± 0.49, and possibly in
31 The Westerbork Northern Sky Survey

24 W. Yuan, et al.
J0849+5108 withΓ = 1.77+0.44−0.60 (90% errors). Their concave optical to X-ray spectral shapes (see Figure 10) also agree with the
inverse Compton scenario. For J0849+5108, the LBL-like SEDand flat X-ray spectrum are well expected, based on its OVV/HPQproperties (see Appendix B). The prominent soft X-ray excess in J1633+4718 is also typical of normal NLS1 galaxies. It ispuzzling, however, that J1633+4718 shows a broad band SED similar to that of HFSRQs, for which a steep X-ray spectrum anda convexαox–X-ray shape are generally expected. Future multi-waveband observations, especially in the X-ray band, are neededto confirm this peculiarity.
As discussed above, in the presence of an excess soft X-ray component, the effective spectral slopes derived from the hardnessratios are generally steep. The same is expected to be true for radio-loud NLS1 galaxies, as found in J1633+4718 above. Forreference, FSRQs at redshifts (z < 1) are found to haveΓ∼ 2.1 with a dispersionσ ≃ 0.2 in the ROSAT PSPC band (Brinkmannet al. 1997; Yuan 1998). Therefore, we expect that a few otherobjects, e.g. those having FSRQ/LBL-type SEDs yet steepΓvalues in the PSPC bandpass (Figure 9) would similarly have aflat underlying X-ray continuum.
HBLs are commonly observed to show steep X-ray spectra (e.g.Worrall & Wilkes 1990; Brinkmann et al. 1996; Padovani &Giommi 1995; Wolter et al. 1998), which are intrinsically curved, progressively steepening with increasing photon energy (e.g.Perlman et al. 2005). Their X-ray emission is thought to be attributed to the high-energy tail of the synchrotron radiation, i.e.the synchrotron bump reaches the soft X-ray band (Ghisellini & Maraschi 1989). There are only a few flat-spectrum radio-loudNLS1 AGN studied previously with multi-waveband data and, interestingly, most of these show HBL/HFSRQ-like SEDs. Forexample, RXJ16290+4007, formerly classified as a FSRQ, was suggested by Padovani et al. (2002) to be the first confirmedHFSRQ for its modeled synchrotron peak at 2×10¹⁶Hz and a steep soft X-ray spectrumΓ≃ 3. 2MASX J0324+3410 also showsa continuum SED (square in Figure 9; Zhou et al. 2007) and a luminosity closely resembling that of Mkn 421, a well-knownHBL; the object was claimed to be even marginally detected inTeV γ-rays (Falcone et al. 2004), as seen in some nearby brightHBL. In the X-ray band, 2MASX J0324+3410 also shows a steep spectrum (Γ ≃ 2.2, Zhou et al. 2007).
Most of the objects falling into the HBL locus in Figure 9 showsteep X-ray spectra wherever available (Γ = 2.0− 3.3). Mean-while, theirαox–αx SED shapes are either convex or close to a straight line (i.e.power-law; see Figure 10). Thus, based on thesimilarity with HBL in both the SED and X-ray spectral shape,we suggest their X-ray emission to be the high-energy tail ofthesynchrotron component, as in HBL. There are a few objects lying close to the border line, known as intermediate BL Lac objects(IBL) where the synchrotron peaks are around 1014− 1015 Hz. In them, the high-energy synchrotron tail may still reach the softX-rays, as found in a few IBL objects (e.g. Tagliaferri et al.2000; Ferrero et al. 2006).
REFERENCES
Abramowicz, M.A., Czerny, B., Lasota, J.P., Szuszkiewicz,E., 1988, ApJ,332, 646
Adelman-McCarthy, J.K., et al. 2007, ApJS, 172, 634Ai, Y. et al. 2008, in preparationArnaud, K.A., 1996, Astronomical Data Analysis Software and Systems V,
eds. G. Jacoby and J. Barnes, p17, ASP Conf. Series volume 101Arp, H., Sargent, W.L.W., Willis, A.G., Oosterbaan, C.E. 1979, ApJ, 230, 68Bade, N., Fink, H.H., Engels, D., Voges, W., Hagen, H.-J., etal., 1995,
A&AS, 110, 469Bahcall, J.N., Kirhakos, S., Saxe, D.H., Schneider, D.P., 1997, ApJ, 479, 642Baldwin, J.E., Boysen, R.C., Hales, S.E.G., Jennings, J.E., Waggett, P.C., et
al. 1985, MNRAS, 217, 717Ballantyne, D.R. 2007, astro-ph/0707.3142Balmaverde, B. & Capetti, A. 2006, A&A, 447, 97Baum, S.A., Zirbel, E.L., O’Dea, Ch. 1995, ApJ, 451, 88Becker, R.H., White, R.L., & Edwards, A.L. 1991, ApJS, 75, 1Becker, R.H., White, R.L. & Helfand, D.J. 1995, ApJ, 450, 559Belloni, T., Hasinger, G., Izzo, C. 1994, A&A, 283, 1037Best, P.N., Kauffmann, G., Heckman, T.M., Brinchmann, J., Charlot, S., et
al. 2005, MNRAS, 362, 25Bian, W. & Zhao, Y. 2004, MNRAS, 352, 823Blackburn, J.K. 1995, in ASP Conf. Ser., Vol. 77, Astronomical Data
Analysis Software and Systems IV, ed. R.A. Shaw, H.E. Payne,and J.J.E.Hayes (San Francisco: ASP), 367 (http://heasarc.gsfc.nasa.gov/ftools)
Blandford, R.D. & Rees, M.,J. 1978, in Pittsburgh Conference on BL LacObjects, ed. A.M. Wolfe (Pittsburgh: Univ. Pittsburgh Dept. Phys. Astron.),p328
Blandford, R.D. & Königl, A. 1979, ApJ, 232, 34Blandford, R.D., Narayan, R., Romani, R.W. 1986, ApJ, 301, L53Blandford, R.D. 2000, Roy. Soc. of London Phil. Tr. A., vol. 358, issue 1767,
p.811Blundell, K.M., Beasley, A.J., & Bicknell, G.V. 2003, ApJ, 591, L103Blundell, K.M. & Rawlings, S. 2001, ApJ, 562, L5Boller, Th., Meurs, E.I.A., Brinkmann, W., Fink, H., Zimmermann, U., Adorf,
H.-M. 1992, A&A, 261, 57Boller, T., Brandt, W.N., & Fink, H. 1996, A&A, 305, 53Boroson, T.A. & Green, R.F. 1992, ApJS, 80, 109Boroson, T.A. 2002, ApJ, 565, 78Brinkmann, W., & Siebert, J. 1994, A&A, 285, 812Brinkmann, W., Siebert, J., Kollgaard, R.I., Thomas, H.-C.1996, A&A, 313,
356Brinkmann, W., Yuan, W., Siebert, J. 1997, A&A, 319, 413
Browne, I.W.A., & Perley, R.A. 1986, MNRAS, 222, 149Brunthaler, A., et al. 2005, A&A, 435, 497Bruzual, G. & Charlot, S. 2003, MNRAS, 344, 1000Cao, X. 2003, ApJ, 599, 147Capetti, A. & Balmaverde, B. 2006, A&A, 453, 27Cash, W. 1979, ApJ, 228, 939Celotti, A., Padovani, P., Ghisellini, G. 1997, MNRAS, 286,415Celott, A. & Blandford, R.D. 2001, in ‘Black Holes in Binaries and Galactic
Nuclei: Diagnostics, Demography and Formation’, (Eds) L. Kaper, E.P.J.van den Heuvel, & P.A. Woudt. Springer-Verlag, 2001, p.206
Celotti, A. 2002, in ‘Relativistic Flows in Astrophysics’,(Eds) A.W.Guthmann et al., LNP 589, p.88
Collin, S., & Kawaguchi, T. 2004, A&A, 426, 797Collin, S., Kawaguchi, T., Peterson, B.M., Vestergaard, M.2006, A&A, 456,
75Condon, J.J., Cotton, W.D., Greisen, E.W., Yin, Q.F., Perley, R.A., et al. 1998,
AJ, 115, 1693Condon, J.J., Yin, Q.F., Thuan, T.X., Boller, Th. 1998, AJ, 116, 2682Constantin, A. & Shields, J.C. 2003, PASP, 115, 592Corbett, E.A., Robinson, A., Axon, D.J. , and Hough, J.H. 2000, MNRAS,
311, 485Dallacasa, D., Bondi, M., Alef, W., Mantovani, F. 1998, A&AS, 129, 219Decarli R., Dotti M., Fontana M., Haardt F., 2008, MNRAS, in press (astro-
ph/0801.4560)Dennison, B., et al. 1987, ApJ, 313, 141Dietrich, M., Hamann, F., Appenzeller, I. & Vestergaard, M.2003, ApJ, 596,
817Doi, A., Nagai, H., Asada, K., Kameno, S., Wajima, K., & Inoue, M. 2006,
PASJ, 58, 777Doi, A., Fukusawa, K., Inoue, M., Wajima, K., Nagai, H., et al. 2007, PASJ,
accepted (astro-ph/0704.3836)Dong, X.-B., Zhou, H.-Y., Wang, T.-G., Wang, J.-X., Li, C., &Zhou, Y.-Y.
2005, ApJ, 620, 629Dong, X.-B., Wang, T.-G., Wang, J., Yuan, W., Zhou, H.-Y., Dai, H.-F., &
Zhang, K. 2008, MNRAS, 383, 581Dunlop, J.S., McLure, R.J., Kukula, M.J., Baum, S.A., O’Dea, C.P., Hughes,
D.H., 2003, MNRAS, 340, 1095Falcke, H., Sherwood, W., & Patnaik, A.R. 1996a, ApJ, 471, 106Falcke, H., Patnaik, A.R., & Sherwood, W. 1996b, ApJ, 473, L13Falcone, A.D., et al. 2004, ApJ, 613, 710Fanaroff, B.L. & Riley, J.M 1974, MNRAS, 167, 31

Radio-loud Narrow Line Seyfert 1 galaxies 25
Fanti, C., Fanti, R., Ficarra, A., Gregorini, L., Mantovani, F., Padrielli, L.1983, A&A, 118, 171
Fender, R.P., Bellone, T.M., Gallo, E. 2004, MNRAS, 2004, 355, 1105Ferrero, E., Wagner, S.J., Emmanoulopoulos, D., Ostorero,L. 2006, A&A,
457, 133Floyd, D.J.E., et al. 2004, MNRAS, .355, 196Fossati, G., Maraschi, L., Celotti, A., Comastri, A., Ghisellini, G. 1998,
MNRAS, 299, 433Francis, P.J. 1996, Publications of the Astronomical Society of Australia, 13,
212Francis, P.J. 1991, ApJ, 373, 465Fugmann, W. 1988, A&A, 205, 86Gallo, L.C., et al. 2006, MNRAS, 370, 245Ghisellini, G. & Maraschi, L., 1989, ApJ, 340, 181Ghisellini, G., Padovani, P. Celotti, A., Maraschi, L. 1993, ApJ, 407, 65Ghisellini, G., Celotti, A., Fossati, G., Maraschi, L., Comastri, A. 1998,
MNRAS, 301, 451Ghosh, K.K, & Punsly, B., 2007, astro-ph/0704.2407Goodrich, R.W. 1989, ApJ, 342, 22Gopal-Krishna, Krishnamohan, S., Singal, A.K. 1984, A&A, 140, L19Gopal-Krishna & Wiita, P.J., 2002, NewAR, 46, 357Greene, J.E. & Ho, L.C. 2005, ApJ, 630, 122Greene, J.E., Ho, L.C., Ulvestad, J.S. 2006, ApJ, 636, 56Greene, J.E. & Ho, L.C. 2007, ApJ, 670, 92Griffith, M.R., Wright, A.E., Burke, B.F., Ekers, R.D. 1995,ApJS, 97, 347Grupe, D., Beuermann, K., Thomas, H.-C., Mannheim, K., & Fink, H.H.
1998, A&A, 330, 25Grupe, D., Beuermann, K., Mannheim, K., & Thomas, H.-C. 1999, A&A,
350, 805Grupe, D., Wills, B.J., Leighly, K.M., & Meusinger, H. 2004,AJ, 127, 156Hales, S.E.G., Baldwin, J.E., Warner, P.J. 1988, MNRAS, 234, 919Heeschen, D.S. 1984, AJ, 89, 1111Hjellming, R.M. & Narayan, R. 1986, ApJ, 310, 768Ho, L.C., & Peng, C.Y. 2001, ApJ, 555, 650Ho, L.C., & Ulvestad, J.S. 2001, ApJS, 133, 77Ho, L.C. 2002, ApJ, 564, 120Isobe, T., Feigelson, E.D., and Nelson, P.I., 1986, ApJ, 306, 490Isobe, T. & Feigelson, E.D. 1990, “ASURV", Bull. Amer. Astro. Society, 22,
917Ivezic, Z., et al. 2002, AJ, 124, 2364Jackson, N., Browne, I.W.A. 1991, MNRAS, 250, 422Jarvis, M.J., & McLure, R.J. 2002, MNRAS, 336, L38Jarvis, M.J. & McLure, R.J. 2006, MNRAS, 369, 182Jiang, D.R., Cao, X., Hong, X. 1998, ApJ, 494, 139Jones, T.W. & Burbidge, G.R. 1973, ApJ, 186, 791Kaspi, S. Maoz, D., Netzer, H., Peterson, B.M., Vestergaard, M., Jannuzi,
B.T. 2005, ApJ, 629, 61Kaspi, S., Smith, P.S., Netzer, H., Maoz, D., Jannuzi, B.T.,& Giveon, U.
2000, ApJ, 533, 631Kellermann, K.I. 1966, ApJ, 146, 621Kellermann, K.I., & Pauliny-Toth, I.I.K. 1969, ApJ, 155, L71Kellermann, K.I., Sramek, R., Schmidt, M., Shaffer, D.B., Green, R. 1989,
AJ, 98, 1195Kellermann, K.I., Sramek, R.A., Schmidt, M., Green, R.F., Shaffer, D.B.
1994, AJ, 108, 1163Komossa, S., & Meerschweinchen, J. 2000, A&A, 354, 411Komossa, S., Voges, W., Adorf, H.M., Xu, D., Mathur, S., Anderson, S. 2006,
ApJ, 639, 710Komossa, S., Voges, W., Xu, D., Mathur, S., Adorf, H.M., Lemson, G.,
Duschl, W., Grupe, D. 2006, AJ, 132, 531Komossa, S., Xu, D., Zhou, H., Binette, L., Storchi-Bergmann, T. 2007, ApJ,
submittedKomossa, S. 2008, in: The nuclear region, host galaxy and environment of
AGN, E. Benitez, I. Cruz-Gonzales, Y. Krongold (eds), RevMexAA, inpress (arXiv:0710.3326v1)
Körding, E.G., Jester, S., Fender, R.P. 2006, MNRAS, 372, 1366Krolik, J.H. 1999, Active Galactic Nuclei (Princeton Univ.Press)Lacy, M., Laurent-Muehleisen, S.A., Ridgway, S.E., Becker, R.H., White,
R.L., 2001, ApJ, 551, L17Laing, R.A., Riley, J.M., Longair, M.S., 1983, MNRAS, 204, 151Langston, G.I., Heflin, M.B., Conner, S.R., Lehar J., Carrilli, Ch.L., Burke,
B.F. 1990, ApJS, 72, 621Laor, A. 2000, ApJ, 543, L111Laor, A. 2003, arXiv:astro-ph/0312417v2Lazio, T.J.W., Waltman, E.B., Ghigo, F.D., Fiedler, R.L., Foster, R.S.,
Johnston, K.J. 2001, ApJS, 136, 265Leighly, K.M. 1999, ApJS, 125, 297Leighly, K.M. 2000, New Astronomy Review, 44, 395
Liu, Y., Jiang, D.R., Gu, M.F. 2006, ApJ, 637, 669Lu, H., Zhou, H., Wang, J., Wang, T., Dong, X., Zhuang, Z., & Li, C. 2006,
AJ, 131, 790Lu, Y., Wang, T., Zhou, H., Wu, J., 2007, AJ, 133, 1615Maccacaro, T., Gioia, I.M., Wolter, A., Zamorani, G., Stocke, J.T. 1988, ApJ,
326, 680Maccarone, T.J., Gallo, E., Fender, R. 2003, MNRAS, 345, L19Magorrian, J., Tremaine, S., Richstone, D., Bender, R., Bower, G. et al., 1998,
AJ, 115, 2285Maraschi, L. & Tavecchio, F. 2003, ApJ, 593, 667Martin, D.C., et al. 2005, ApJ, 619, L1Mclure, R.J., & Jarvis, M.J. 2004, MNRAS, 353, L45Meier, D.L. 2003, New Astronomy Reviews, 47, 667Metcalf, R.B. & Magliocchetti, M. 2006, MNRAS, 365, 101Miller, L., Peacock, J.A., Mead, A.R.G., 1990, MNRAS, 244, 207Mineshige, S., Kawaguchi, T., Takeuchi, M., Hayashida, K.,2000, PASJ, 52,
499Mitchell, K.J., Dennison, B., Condon, J.J., Altschuler, D.R., Payne, H.E., et
al. 1994, ApJS, 93, 441Moore, R.L., & Stockman, H.S., 1981, ApJ, 243, 60Moran, E.C., Halpern, J.P., Helfand, D.J. 1996, ApJS, 106, 341Moran, E.C. 2000, NewA Rev., 44, 527Murphy, D.W., Browne, I.W.A., & Perley, R. A. 1993, MNRAS, 264, 298Nousek, J.A., & Shue, D.R. 1989, ApJ, 342, 1207Netzer, H. 1990, inActive Galactic Nuclei, ed. T.J.-L. Courvoisier & M.
Mayor (Berlin: Springer), 137Neumann, M., Reich, W., Furst, E., Brinkmann, W., Reich, P.,et al. 1994,
A&AS, 106, 303O’Dea, C.P. & Baum, S.A. 1997, AJ, 113, 148O’Dea, C.P. 1998, PASP, 110, 493O’Dowd, M. & Urry, C.M. 2005, ApJ, 627, 97Ohsuga, K., Mori, M., Nakamoto, T., Mineshige, S. 2005, ApJ,628, 368Onken, C.A., Ferrarese, L., Merritt, D., Peterson, B.M., Pogge, R.W., et al.
2004, ApJ, 615, 645Örndahl, E. & Rönnback, J. 2005, A&A, 443, 61Oshlack, A.Y.K.N., Webster, R.L., & Whiting, M.T. 2001, ApJ, 558, 578Oshlack, A.Y.K.N., Webster, R.L., & Whiting, M.T. 2001, ApJ, 576, 81Osterbrock, D.E., & Pogge, R.W. 1985, ApJ, 297, 166Padovani, P. & Giommi, P. 1995, ApJ, 444, 567Padovani, P. & Giommi, P., 1996, MNRAS, 279, 526Padovani, P., Giommi, P., Fiore, F. 1997a, MNRAS, 284, 569Padovani, P., Giommi, P., Fiore, F. 1997b, in Mem. Soc. Astron. Italiana, 68,
147Padovani, P., Costamante, L. Ghisellini, G., Giommi, P., Perlman, E. 2002,
ApJ, 581, 895Padovani, P., Perlman, E., Landt, H., Giommi, P., Perri, M. 2003, ApJ, 588,
128Pei, Y.C. 1992, ApJ, 395, 130Perlman, E.S., Padovani, P., Giommi, P., Sambruna, R., Jones, L.R., et al.
1998, AJ, 115, 1253Perlman, E.S., Madejski, G., Georganopoulos, M., Andersson, K., Daugherty,
T., et al. 2005, ApJ, 625, 727Puchnarewicz, E.M., et al. 1992, MNRAS, 256, 589Punsly, B. 2007, ApJ, 657, L9Rawlings, S. & Saunders, R. 1991, Nature, 349, 138Readhead, A.C.S. 1994, ApJ, 426, 51Reeves, J.N. & Turner, M.J.L. 2000, MNRAS, 316, 234Reich, W., Fürst, E., Reich, P., Kothes, R., Brinkmann, W., &Siebert, J.,
2000, A&A, 363, 141Rengelink, R.B., Tang, Y., de Bruyn, A.G., Miley, G.K., Bremer, M.N., et al.
1997, A&AS, 124, 259Rickett, B.J. 1986, ApJ, 307, 564Rickett, B.J. 1990, ARA&A, 28, 561Rickett, B.J., Lazio, T.J.W., Ghigo, F.D. 2006, ApJS, 165, 439Sambruna, R.M., Maraschi, L, Urry, C.M. 1996, ApJ, 463, 444Schartel, N., et al. 1996, MNRAS, 283, 1015Schwope, A.D., et al. 2000, Astron. Nachr., 321, 1Siebert, J. 1996, Ph.D. Thesis, Techn. Univ. MünchenSikora, M., Stawarz, L., Lasota, J.-P. 2007, ApJ, 2007, 658,815Singal, A.K. 1993, MNRAS, 263, 139Sitko, M.L., Rudnick, L., Jones, T.W., Schmidt, G.D. 1984, PASP, 96, 402Smith, D.A., Herter, T., & Haynes, M.P. 1998, ApJ, 494, 150Smith, J.E., Robinson, A., Alexander, D.M., Young, S., Axon, D.J., Corbett,
E.A. 2004, MNRAS, 350, 140Stalin, C.S., Gupta, A.C., Gopal-Krishna, Wiita, P.J., Sagar, R. 2005,
MNRAS, 356, 607Stannard, D. & Mcilwrath, B.K. 1982, Nature, 298, 140Stein, W.A., Odell, S.L., Strittmatter, P.A. 1976, ARA&A, 14, 173

26 W. Yuan, et al.
Stepanian, J.A. 2003, ApJ, 588, 746Stocke, J.T., Morris, S.L., Weymann, R.J., Foltz, C.B. 1992, ApJ, 396, 487Stickel, M., Fred, J.W., Kühr, H. 1989, A&A, 224, L27Sulentic, J.W., Zwitter, T., Marziani, P., & Dultzin-Hacyan, D. 2000, ApJ,
536, L5Sulentic, J.W., Zamfir, S., Marziani, P., Bachev, R., Calvani, M., Dultzin-
Hacyan, D. 2003, ApJ, 597, L17Tadhunter, C., Wills, K., Morganti, R., Oosterloo, T., Dickson, R. 2001,
MNRAS, 327, 227Tagliaferri, G., Ghisellini, G., Giommi, P., Chiappetti, L., Maraschi, L.,
Celotti, A., et al. 2000, A&A, 354, 431Tinti, S., Dallacasa, D., De Zotti, G., Celotti, A., Stanghellini, C. 2005, A&A,
432, 31Ulvestad, J.S., Antonucci, R.R.J., & Goodrich, R.W. 1995, AJ, 109, 81Urry, C.M. & Padovani, P. 1995, PASP, 107, 803Vermeulen, R.C., et al. 1995, ApJ, 452, L5Véron-Cetty, M.-P., Véron, P., & Gonçalves, A.C. 2001, A&A,372, 730Véron-Cetty, M.-P., Joly, M., & Véron, P. 2004, A&A, 417, 515Vestergaard, M. 2004, ApJ, 601, 676Vestergaard, M., Wilkes, B.J., Barthel, P.D. 2000, ApJ, 538, L103Vestergaard, M. & Peterson, B.M. 2006, ApJ, 641, 689Voges, W., et al. 1999, A&A, 349, 389Warner, C., Hamann, F., Dietrich, M. 2004, ApJ, 608, 136Wandel, A., Peterson, B.M., & Malkan, M.A. 1999, ApJ, 526, 579Wang, J.-M., & Netzer, H. 2003, A&A, 398, 927Wang, T., Brinkmann, W. & Bergeron, J. 1996, A&A, 309, 81Wang, T.G., Matsuoka, M., Kubo, H., Mihara, T., & Negoro, H. 2001, ApJ,
554, 233Wang, T.G., Dong, X.B., Zhou, H.Y., &Wang, J. X. 2005, ApJ, 622, L101Wang, T.-G., Zhou, H.-Y., Wang, J.-X., Lu, Y.-J., Lu, Y. 2006, ApJ, 645, 856
Whalen, D.J., Laurent-Muehleisen, S.A., Moran, E.C., Becker, R.H. 2006,AJ, 131, 1948
White, N.E., Giommi, P., & Angelini, L. 1995, WGA ROSAT source catalogWhiting, M.T.,Webster, R.L., & Francis, P.J. 2001, MNRAS, 323, 718Williams, R.J., Pogge, R.W., Mathur, S. 2002, AJ, 124, 3042Willis, A.G., Oosterbaan, C.E., de Ruiter H.R. 1976, A&AS, 25, 543Wills, B.J. & Browne, I.W.A. 1986, ApJ, 302, 56Wisozki, L., & Bade, N. 1997, A&A, 320, 395Wolter, A. Comastri, A., Ghisellini, G., Giommi, P., Guainazzi, M., et al.
1998, A&A, 335, 899Woo, J.-H. & Urry, C.M. 2002, ApJ, 581, L5Worrall, D.M. & Wilkes, B.J. 1990, ApJ, 360, 396Wyder, T.K., et al. 2005, ApJ, 619, L15Yuan, W. 1998, Ph.D. Thesis, Techn. Univ. MünchenYuan, W., Brinkmann, W., Siebert, J., Voges, W. 1998, A&A, 330, 108Yuan, W., Brinkmann, W., Gliozzi, M., Zhao, Y., Matsuoka, M.2000, A&A,
362, 19Zhou, H.-Y., & Wang, T.-G. 2002, Chinese Journal of Astron. &Astrophy.,
2, 501Zhou, H.-Y., Wang, T.-G., Dong, X.-B., Zhou, Y.-Y., & Li, C. 2003, ApJ, 584,
147Zhou, H.-Y., Wang, T.-G., Dong, X.-B., Li, C., & Zhang, X.-G.2005, Chinese
Journal of Astron. & Astrophy., 5, 41Zhou, H., Wang, T., Yuan, W., Lu, H., Dong, X., Wang, J., Lu, Y.2006, ApJS,
166, 128Zhou, H., Wang, T., Yuan, W., Shan, H., Komossa, S., et al. 2007, ApJ, 658,
L13

Rad
io-lo
ud
Narrow
Lin
eS
eyfert1g
alaxies2
7
TABLE 1SAMPLE OF VERY RADIO-LOUD NLS1 GALAXIES
No. name SDSS name Z u g MB f20cm f6cm f92cm αr logR λ f5100a αλ fwhm(Hβ) f (Hβ ) b f (OIII) b R4570 mNUV mFUV
mag mag mag mJy mJy mJy kms−1 mag mag(1) (2) (3) (4) (5) (6) (7) (8) (9) (10) (11) (12) (13) (14) (15) (16) (17) (18) (19) (20)
1 J0814+5609 J081432.11+560956.6 0.509 18.05 17.89 -24.1 69/60 43 72 -0.33 2.53 458 -2.43 2164± 59 870±16 54± 7 1.042 J0849+5108 J084957.98+510829.0 0.583 19.80 18.85 -23.1 344/266 161 202 ∼ 0c 3.16 187 -0.20 1811±191 135±12 42± 3 0.233 J0850+4626 J085001.17+462600.5 0.523 19.67 19.02 -22.8 21/16 ... 51 ... 2.23 409 -0.86 1251± 61 255±10 133± 5 1.48 20.80 21.294 J0902+0443 J090227.16+044309.6 0.532 19.38 18.92 -23.0 153/157 106 ... -0.30 3.02 520 -0.53 2089±205 341±20 192± 6 1.10 20.285 J0948+0022 J094857.32+002225.5 0.584 18.59 18.36 -23.9 108/70 295 ... 0.82 2.55 510 -1.87 1432± 87 341±12 34± 4 1.22 18.61 19.046 J0953+2836 J095317.09+283601.5 0.657 19.19 18.94 -23.6 45/43 ... ... ... 2.71 240 -1.73 2162±201 215±14 52± 5 1.237 J1031+4234 J103123.73+423439.3 0.376 19.64 19.36 -21.6 17/19 ... 44 ... 2.34 284 -0.55 1642± 75 379±14 131± 8 1.078 J1037+0036 J103727.45+003635.6 0.595 20.04 19.32 -22.8 27/28 ... ... ... 2.66 225 -1.71 1357±107 173± 9 25± 4 1.58 21.25 22.999 J1047+4725 J104732.68+472532.1 0.798 19.16 18.95 -24.0 734/789 404 1463 -0.51 3.87 293 -1.30 2153±267 421±32 325± 8 0.6610 J1110+3653 J111005.03+365336.3 0.630 21.13 20.59 -21.819/23 ... 45 ... 2.97 74 -1.28 1300±339 93±20 32± 4 0.88 21.35 21.8511 J1138+3653 J113824.54+365327.1 0.356 20.49 19.52 -21.213/12 ... 26 ... 2.34 378 ... 1364± 99 393±20 72±10 0.6912 J1146+3236 J114654.28+323652.3 0.465 19.08 18.62 -23.015/17 ... 26 ... 2.11 427 -1.54 2081±183 632±39 149± 6 0.7813 J1238+3942 J123852.12+394227.8 0.622 19.89 19.55 -22.810/10 ... ... ... 2.23 175 -1.19 910±200 103±18 68± 4 1.0514 J1246+0238 J124634.65+023809.0 0.362 18.52 18.31 -22.737/36 ... ... ... 2.38 601 -1.89 1425± 68 527±12 115± 5 0.84 19.01 19.5815 J1305+5116 J130522.75+511640.3 0.785 17.45 17.28 -25.684/87 46 211 -0.50 2.34 1264 -1.68 1925± 53 1982±43 487±13 0.65 17.45 18.1416 J1435+3131 J143509.49+313147.8 0.501 19.87 19.43 -22.339/43 ... 137 ... 2.87 306 -1.70 1719±253 346±36 137± 6 1.3217 J1443+4725 J144318.56+472556.7 0.703 18.20 18.11 -24.6165/166 72 309 -0.67 3.07 534 -2.06 1848±113 337±18 105±13 1.45 18.09 18.5718 J1505+0326 J150506.48+032630.8 0.408 18.78 18.52 -22.7365/395 859 ... 0.66 3.19 389 -0.83 1082±113 95± 8 106± 4 1.5319 J1548+3511 J154817.92+351128.0 0.478 18.18 17.91 -23.9141/141 107 279 -0.22 2.84 545 -2.32 2035± 52 721±12 309± 7 1.24 18.41 18.6920 J1633+4718 J163323.58+471859.0 0.116 17.94 17.38 -20.963/69 35 107 -0.30 2.22 1868 -1.70 909± 43 902±21 919± 8 1.02 18.20 19.4821 J1634+4809 J163401.94+480940.2 0.494 20.18 19.53 -22.28/14 ... 16 ... 2.31 257 -1.60 1609± 79 287±11 87± 3 0.98 21.03 22.3022 J1644+2619 J164442.53+261913.2 0.144 18.03 18.02 -20.888/128 99 ... -0.07 2.65 1788 -1.00 1507± 42 1108±22 120± 4 0.75 18.50 18.6523 J1722+5654 J172206.03+565451.6 0.425 18.66 18.31 -23.137/43 ... 119 ... 2.37 544 -1.41 1385± 36 542±11 323± 4 0.58
NOTE. — Col.(2): abbreviated name of object used in this paper; Col.(3): SDSS name; Col.(4): redshift; Col.(5): SDSSu band PSF magnitude corrected for Galactic extinction; Col.(6): as col.(5), but fortheg band; Col.(7): derivedB band absolute magnitude; Col.(8): FIRST and NVSS radio flux densities at 20 cm (FIRST/NVSS); Col.(9): flux density at 6 cm;Col.(10): flux density at 92 cm given by WNESS;Col.(11): radio spectral slope between 6 cm and 20 cm; Col.(12): logrithm of radio-loudness defined as≡ fν (1.4GHz)/ fν (4400); Col.(13): fluxλ f at 5100 Å in the rest frame; Col.(14): optical power-law slope(S(λ) ∝ λαλ ); Col.(15): line width of Hβ in FWHM; Col.(16): line flux of the broad component of Hβ; Col.(17): line flux of [OIII ]; Col.(18): FeII-to-Hβ flux ratio (see text); Col.(19): near-UV magnitude givenby GALEX corrected for Galactic extinction; Col.(20): the same as col.(19) but for the far-UV band.
aRest frame fluxλ f in units of 10−15 ergs−1 cm−2
bRest frame line flux in units of 10−17 ergs−1 cm−2cGiven the strong variation of the 1.4 GHz flux, we adopt a representing radio slopeαr∼ 0 as suggested by the radio data from Arp et al. (1979).

28 W. Yuan, et al.
TABLE 2X-RAY DATA AND ANALYSIS RESULTS
name X-ray source obs. Texpo(s) NH,Gal C.Rate fluxaΓ kTbb remark
sec 1020 cm−2 10−2 c/s eV(1) (2) (3) (4) (5) (6) (7) (8) (9) (10)
J0814+5609 J081432.9+561008 RS 345 4.49 5.40 1.71 2.57+0.40−0.46 BSC
— J081432.11+560956.6 RP 7343 4.49 2.04 0.39 3.36±0.12 WGAJ0849+5108 J084957.98+510829.0 RP 4472 3.00 1.19 0.27 1.77+0.32
−0.39 fitJ0850+4626 no detection 469 2.64 <4.51 <0.98 ...J0902+0443 no detection 362 3.11 <5.72 <1.45 ...J0948+0022 J094856.9+002235 RS 447 5.22 4.10 1.16 2.26±0.64 FSCJ0953+2836 no detection 449 1.28 <5.52 <0.66 ...J1031+4234 no detection 498 0.99 <6.00 <0.60 ...J1037+0036 J103727.45+003635.6 RP 10475 4.87 0.84 0.16 2.43+0.43
−0.49— J103727.45+003635.6 RP 6158 4.87 2.56 0.51 3.23±0.29
J1047+4725 J104731.4+472528 RS 509 1.30 2.13 0.26 ... FSCJ1110+3653 no detection 315 1.69 <7.22 <1.06 ...J1138+3653 no detection 327 1.75 <6.16 <0.94 ...J1146+3236 J114654.0+323653 RS 452 1.42 1.67 0.21 2.37+0.81
−0.60 FSCJ1238+3942 J123852.1+394253 RS 508 1.46 5.08 0.65 2.45+0.32
−0.28 BSCJ1246+0238 no detection 160 2.01 <11.6 <1.98 ...J1305+5116 no detection 499 0.98 <5.82 <0.58 ...J1435+3131 J143509.2+313203 RS 382 1.14 10.50 1.15 ... BSCJ1443+4725 J144319.8+472541 RS 587 1.47 1.92 0.25 ... FSCJ1505+0326 no detection 417 3.89 <6.90 <2.14 ...J1548+3511 J154817.6+351130 RS 241 2.28 5.49 1.05 ... FSCJ1633+4718 J163323.58+471859.0 RP 3748 1.79 26.0 5.44 1.37±0.30 32.5+3.9
−3.7 fitJ1633+4718 J163323.3+471848 RS 909 1.79 20.0 4.72 1.47+0.77
−0.92 30+12−10 fit
J1634+4809 J163400.1+480915 RS 943 1.64 1.40 0.20 ... FSCJ1644+2619 J164443.2+261909 RS 518 5.12 10.6 2.60 2.03+0.25
−0.28 BSC— as target Ch 2946 5.12 18.0b 1.05b 2.19±0.17 fit
J1722+5654 J172205.0+565450 RS 1415 2.10 8.11 1.33 2.40±0.15 BSC
NOTE. — Col.(1): object name; Col.(2): name of X-ray source; Col.(3): RS – the RASS, RP – ROSAT pointed observation,Ch – Chandra observation; Col.(4): effective exposure timein units of seconds (vegneting corrected); Col.(5): Galactic absorp-tion column density; Col.(6): X-ray count rate as detected with the ROSAT PSPC (except one of J1644+2619 with the ChandraACIS-S; Col.(7): X-ray flux density corrected for Galactic absorption (0.1–2.4 keV for ROSAT and 0.3–5 keV band for Chandradata); Col.(8): power-law photon index; Col.(9): temperature of an additional soft X-ray blackbody component; Col.(10): re-marks on how the X-ray data analysis is performed; fit – by spectral fitting; for the rest, the fluxes andΓ are derived using countrates and hardness ratio (see text for details) from RASS bright source catalogue (BSC), RASS faint source catalogue (FSC),and ROSAT source catalogues from pointed observations (RXP) and its WGA version (WGA), respectively.
ain units of 10−12 ergs−1 cm−2
bin the 0.3–5 keV band for the Chandra ACIS-S detector

Radio-loud Narrow Line Seyfert 1 galaxies 29
TABLE 3RADIO FLUX VARIATIONS AND INFERRED BRIGHTNESS TEMPERATURES
name b band ∆S ∆S/〈S〉 ∆ t logTB δmin referencedeg. GHz mJy % days K
J0814+5609 33.7 1.4 9 14 1273 12.0 - 2J0849+5108 39.1 1.4 78 25 1257 13.0 2.2 2,6
...... 1.4 230 75 2191 13.0 2.2 7,8J0850+4626 39.3 1.4 5 27 1223 11.8 - 2,6J0902+0443 31.2 4.85 10 9 1125 11.1 - 1,3J0948+0022 38.7 1.4 38 43 1282 12.7 1.7 2,6J1505+0326 50.3 4.85 527 72 1125 12.6 1.5 1,3
...... 8.3 146 43 64 14.0 4.7 9J1548+3511 51.6 4.85 38 44 207 13.0 2.2 1,4J1633+4718 42.6 4.85 24 55 1370 9.9 - 1,5
NOTE. — band – observing frequency;b – Galactic latitude;∆S– abso-lute flux change between two epoches;∆S/〈S〉– fractional amplitudes where〈S〉 is the average of the two fluxes;∆t–time span of the two epoches (foran observation whose epoch is available accurately only to month, the maxi-mum length of dates is used for conservative estimation);TB–brightness tem-perature (logrithm);δmin–minimum Doppler factor of beaming assuming anintrinsic maximumTB as the inverse Compton limit 1012 k. Reference codes:(1) Becker et al. (1991) (2) Becker et al. (1995) (3) Griffith et al. (1995) (4)Langston et al. (1990) (5) Neumann et al. (1994) (6) Condon etal. (1998a)(7) Willis et al. (1976) (8) Arp et al. (1979) (9) Goddard Geodetic VLBIGROUP’s auxiliary web pages http://lacerta.gsfc.nasa.gov/vlbi/images/
TABLE 4BROAD-BAND EFFECTIVE SPECTRAL INDICESa AND
BLACK HOLE MASSESb
name αro αrx αox log(MBH/M⊙)
J0814+5609 0.44 0.87 1.75 8.0J0849+5108 0.65 0.84 1.23 7.4J0850+4626 0.44 >0.68 >1.17 7.2J0902+0443 0.60 >0.78 >1.16 7.7J0948+0022 0.57 0.78 1.22 7.5J0953+2836 0.48 >0.74 >1.29 7.8J1031+4234 0.44 >0.71 >1.27 7.3J1037+0036 0.50 0.79 1.39 7.3J1047+4725 0.70 0.94 1.45 8.1J1110+3653 0.56 >0.68 >0.92 7.1J1138+3653 0.47 >0.66 >1.07 7.1J1146+3236 0.39 0.74 1.47 7.8J1238+3942 0.41 0.65 1.16 6.8J1246+0238 0.41 >0.68 >1.25 7.3J1305+5116 0.40 >0.78 >1.56 8.5J1435+3131 0.52 0.71 1.11 7.5J1443+4725 0.51 0.86 1.58 7.8J1505+0326 0.70 >0.86 >1.19 6.6J1548+3511 0.52 0.80 1.38 7.9J1633+4718 0.43 0.68 1.19 6.3J1634+4809 0.44 0.74 1.35 7.4J1644+2619 0.51 0.74 1.22 6.9J1722+5654 0.43 0.69 1.24 7.4
aCalculated using the rest frame luminosities at5 GHz, 2500 Å, and 2 keV. The lower limits are com-puted for X-ray non-detections from the X-ray fluxlimits set by the RASS.
bVirial black hole masses estimated from the widthand luminosity of the broad Hβ lines (see text fordetails).