Non-radial motion in the TeV blazar S5 0716+714 The pc-scale kinematics of a BL Lac Object
24
arXiv:1001.2126v1 [astro-ph.CO] 13 Jan 2010 Astronomy & Astrophysics manuscript no. 10875 c ESO 2010 January 13, 2010 Non-radial motion in the TeV blazar S5 0716+714 The pc-scale kinematics of a BL Lac Object S. Britzen 1 , V.A. Kam 1,⋆ , A. Witzel 1 , I. Agudo 2,1 , M.F. Aller 3 , H.D. Aller 3 , M. Karouzos 1 ,⋆⋆ , A. Eckart 4 , and J.A. Zensus 1 1 Max-Planck-Institut f¨ ur Radioastronomie, Auf dem H¨ ugel 69, 53121 Bonn, Germany e-mail: [email protected] 2 Instituto de Astrof´ ısica de Andaluc´ ıa (CSIC), Apartado 3004, E-18080 Granada, Spain 3 Astronomy Department, University of Michigan, Ann Arbor, MI 48109-1042, USA 4 I. Physikalisches Institut K¨ oln, Universit¨ at zu K ¨ oln, Z¨ ulpicher Str. 77, 50937 K¨ oln, Germany Received January 13, 2010; accepted January 13, 2010 ABSTRACT Context. Flat-spectrum radio sources often show a core-jet structure on pc-scales. Individual jet components reveal predominantly outward directed motion. For the BL Lac object S5 0716+714 conflicting apparent velocities have been reported in the literature. This object is an intra-day variable source and suited to investigate a possible correlation between kinematic properties and flux-density variability on different timescales. Aims. We study the kinematics in the pc-scale jet of S5 0716+714 to determine the apparent speeds of the jet components based on a much improved data set. In addition, we search for correlations between the radio flux-density light curves and the morphological changes detected along the VLBI jet. Methods. We (re-)analyze 50 VLBI observations obtained with the VLBA at 5 different frequencies (5 – 43 GHz) between 1992.73 and 2006.32. The data have been parameterized using circular Gaussian components. We analyze the jet component motion in detail taking care not only to account for motion in the radial but also in the orthogonal direction. We study the evolution of the jet ridge line and investigate the spectral properties of the individual components. We search for correlations between radio band light curves and the kinematic properties of the jet components. Results. We present an alternative kinematic scenario for jet component motion in S5 0716+714. We present evidence for the apparent stationarity of jet components (with regard to their core separation) with time. Jet components, however, do seem to move significantly non-radially with regard to their position angle and in a direction perpendicular to the major axis of the jet. We discuss a possible correlation between the long-term radio flux-density variability and apparent jet component motions. Conclusions. In S5 0716+714 an alternative motion scenario is proposed. With regard to the core separation, rather stationary components can fit the VLBI observations well. A new model to explain the observed motion with regard to the position angle is required. Based on the correlation between the longterm radio flux-density variability and the position angle evolution of a jet component, we conclude that a geometric contribution to the origin of the long-term variability might not be negligible. Subluminal motion has been reported for most of the TeV blazars. Our analysis also confirms this finding for the case of S5 0716+714. This result increases the number of TeV blazars showing apparent subluminal motion to 7. Key words. Techniques: interferometric – BL Lacertae objects: individual: S5 0716+714 – Radio continuum: jets – variability 1. Introduction The BL Lac Object S5 0716+714 (redshift 0.31±0.08, Nilsson et al. 2008) shows flux-density variability at all wavelength ranges that have been investigated so far (e.g., Wagner & Witzel 1995). It is still the only Active Galactic Nuclei (AGN) for which a si- multaneous change in the mode of the radio/optical variability has been observed on intra-day time scales (Quirrenbach et al. 1991) and is thus so far the best candidate for an intrinsic origin of intra-dayvariability (IDV, Wagner & Witzel 1995, and refer- ences therein). Several authors claim the detection of periodicity or nearly pe- riodic variations in radio and optical (Quirrenbach et al. 1991), ⋆ Change of name: Veronika Meyer changed her name to Veronika Kam by marriage ⋆⋆ Member of the International Max Planck Research School (IMPRS) for Radio and Infrared Astronomy at the Universities of Bonn and Cologne optical (Gupta et al., 2008) and X-ray light-curves (Gupta et al., 2009). Apparently correlated optical/radio quasi-periods of ∼1 day lasting over several days have been observed by Quirrenbach et al. (1991). Gupta et al. (2008) report a rough period of ∼ 3.0 ± 0.3 years and Gupta et al. (2009) find quasi-periodic os- cillations (QPOs) of ∼30 minutes. As a possible origin of the X-ray QPOs, shocks propagating along the jet have been dis- cussed. Most recently, S5 0716+714 has been detected in the TeV-regime by the MAGIC collaboration (Teshima et al. 2008, Anderhub et al. 2009). S5 0716+714 has been investigated with Very Long Baseline Interferometry (VLBI) at various radio frequencies with differ- ent arrays. On parsec-scales it reveals a North-South directed jet with several embedded components (e.g., Eckart et al. 1987). On kpc-scales, the jet is more East-West oriented with some ev- idence for halo-emission (e.g., Antonucci et al. 1986). A rather large range in proper motions (0.05 mas/yr – 1.11 mas/yr) has been reported by different authors based on the investigation of
Transcript of Non-radial motion in the TeV blazar S5 0716+714 The pc-scale kinematics of a BL Lac Object
arX
iv:1
001.
2126
v1 [
astr
o-ph
.CO
] 13
Jan
201
0Astronomy & Astrophysicsmanuscript no. 10875 c© ESO 2010January 13, 2010
Non-radial motion in the TeV blazar S5 0716+714The pc-scale kinematics of a BL Lac Object
S. Britzen1, V.A. Kam1,⋆, A. Witzel1, I. Agudo2,1, M.F. Aller3, H.D. Aller3, M. Karouzos1,⋆⋆, A. Eckart4, and J.A.Zensus1
1 Max-Planck-Institut fur Radioastronomie, Auf dem Hugel69, 53121 Bonn, Germanye-mail:[email protected]
2 Instituto de Astrofısica de Andalucıa (CSIC), Apartado 3004, E-18080 Granada, Spain3 Astronomy Department, University of Michigan, Ann Arbor, MI 48109-1042, USA4 I. Physikalisches Institut Koln, Universitat zu Koln, Zulpicher Str. 77, 50937 Koln, Germany
Received January 13, 2010; accepted January 13, 2010
ABSTRACT
Context. Flat-spectrum radio sources often show a core-jet structure on pc-scales. Individual jet components reveal predominantlyoutward directed motion. For the BL Lac object S5 0716+714 conflicting apparent velocities have been reported in the literature. Thisobject is an intra-day variable source and suited to investigate a possible correlation between kinematic properties and flux-densityvariability on different timescales.Aims. We study the kinematics in the pc-scale jet of S5 0716+714 to determine the apparent speeds of the jet components based ona much improved data set. In addition, we search for correlations between the radio flux-density light curves and the morphologicalchanges detected along the VLBI jet.Methods. We (re-)analyze 50 VLBI observations obtained with the VLBAat 5 different frequencies (5 – 43 GHz) between 1992.73and 2006.32. The data have been parameterized using circular Gaussian components. We analyze the jet component motion in detailtaking care not only to account for motion in the radial but also in the orthogonal direction. We study the evolution of thejet ridgeline and investigate the spectral properties of the individual components. We search for correlations between radio band light curvesand the kinematic properties of the jet components.Results. We present an alternative kinematic scenario for jet component motion in S5 0716+714. We present evidence for the apparentstationarity of jet components (with regard to their core separation) with time. Jet components, however, do seem to move significantlynon-radially with regard to their position angle and in a direction perpendicular to the major axis of the jet. We discussa possiblecorrelation between the long-term radio flux-density variability and apparent jet component motions.Conclusions. In S5 0716+714 an alternative motion scenario is proposed. With regard to the core separation, rather stationarycomponents can fit the VLBI observations well. A new model to explain the observed motion with regard to the position angleis required. Based on the correlation between the longterm radio flux-density variability and the position angle evolution of a jetcomponent, we conclude that a geometric contribution to theorigin of the long-term variability might not be negligible. Subluminalmotion has been reported for most of the TeV blazars. Our analysis also confirms this finding for the case of S5 0716+714. This resultincreases the number of TeV blazars showing apparent subluminal motion to 7.
Key words. Techniques: interferometric – BL Lacertae objects: individual: S5 0716+714 – Radio continuum: jets – variability
1. Introduction
The BL Lac Object S5 0716+714 (redshift 0.31±0.08, Nilsson etal. 2008) shows flux-density variability at all wavelength rangesthat have been investigated so far (e.g., Wagner & Witzel 1995).It is still the only Active Galactic Nuclei (AGN) for which a si-multaneous change in the mode of the radio/optical variabilityhas been observed on intra-day time scales (Quirrenbach et al.1991) and is thus so far the best candidate for an intrinsic originof intra-day variability (IDV, Wagner & Witzel 1995, and refer-ences therein).Several authors claim the detection of periodicity or nearly pe-riodic variations in radio and optical (Quirrenbach et al. 1991),
⋆ Change of name: Veronika Meyer changed her name to VeronikaKam by marriage⋆⋆ Member of the International Max Planck Research School (IMPRS)for Radio and Infrared Astronomy at the Universities of BonnandCologne
optical (Gupta et al., 2008) and X-ray light-curves (Gupta et al.,2009). Apparently correlated optical/radio quasi-periods of ∼1day lasting over several days have been observed by Quirrenbachet al. (1991). Gupta et al. (2008) report a rough period of∼3.0 ± 0.3 years and Gupta et al. (2009) find quasi-periodic os-cillations (QPOs) of∼30 minutes. As a possible origin of theX-ray QPOs, shocks propagating along the jet have been dis-cussed. Most recently, S5 0716+714 has been detected in theTeV-regime by the MAGIC collaboration (Teshima et al. 2008,Anderhub et al. 2009).S5 0716+714 has been investigated with Very Long BaselineInterferometry (VLBI) at various radio frequencies with differ-ent arrays. On parsec-scales it reveals a North-South directed jetwith several embedded components (e.g., Eckart et al. 1987).On kpc-scales, the jet is more East-West oriented with some ev-idence for halo-emission (e.g., Antonucci et al. 1986). A ratherlarge range in proper motions (0.05 mas/yr – 1.11 mas/yr) hasbeen reported by different authors based on the investigation of

2 S. Britzen: Non-radial motion in the TeV blazar S5 0716+714
Table 1. Details of the observations presented in this paper (in epochs marked by a star, S5 0716+714 served as calibrator forobservations targeted on NRAO 150).
Epoch ν [GHz] Array/Survey Reference1992.73 5.0 VLBA CJF-Survey Britzen et al. (2007)1992.85 22.2 Global array Bach et al. (2005)1993.71 22.2 Global array Bach et al. (2005)1994.21 8.4 VLBA Bach et al. (2005)1994.67 15.3 VLBA MOJAVE/2cm Survey Kellermann et al. (1998); Zensus et al. (2002)1994.70 5.0 VLBA CJF-Survey Britzen et al. (2007)1995.15 22.2 VLBA Jorstad et al. (2001)1995.47 22.2 VLBA Jorstad et al. (2001)1995.65 8.4, 22.2 VLBA Bach et al. (2005)1996.34 22.2 VLBA Jorstad et al. (2001)1996.53 15.3 VLBA MOJAVE/2cm Survey Kellermann et al. (1998); Zensus et al. (2002)1996.63 5.0 VLBA/CJF-Survey Britzen et al. (2007)1996.82 15.3 VLBA MOJAVE/2cm Survey Kellermann et al. (1998); Zensus et al. (2002)1996.90 22.2 VLBA Jorstad et al. (2001)1997.03 8.4 VLBA Fey et al. (2000)1997.58 22.2 VLBA Jorstad et al. (2001)1997.93 8.4 VLBA Ros et al. (2001)1999.41 8.4 VLBA Ros et al. (2001)1999.55 15.3 VLBA MOJAVE/2cm Survey Kellermann et al. (1998); Zensus et al. (2002)1999.89 5.0 VLBA/CJF-Survey Britzen et al. (2007)2000.82 5.0 VLBA+Effelsberg Bach et al. (2005)2001.17 15.3 VLBA MOJAVE/2cm Survey Kellermann et al. (1998); Zensus et al. (2002)2002.48 8.4, 22.2, 43.2 VLBA ∗ Agudo et al. (2007)2003.20 8.4, 22.2, 43.2 VLBA ∗ Agudo et al. (2007)2003.49 8.4, 22.2, 43.2 VLBA ∗ Agudo et al. (2007)2003.65 15.3 VLBA MOJAVE/2cm Survey Kellermann et al. (2004)2003.88 22.2, 43.2 VLBA Agudo et al. (A&A, 2008 in prep.)2004.44 15.3 VLBA MOJAVE/2cm Survey Kellermann et al. (2004)2004.60 15.3, 22.2, 43.2 VLBA ∗ Agudo et al. (2007)2004.79 15.3 VLBA MOJAVE/2cm Survey Kellermann et al. (2004)2004.97 15.3, 22.2, 43.2 VLBA ∗ Agudo et al. (2007)2005.01 15.3 VLBA MOJAVE/2cm Survey Kellermann et al. (2004)2005.09 15.3, 22.2, 43.2 VLBA ∗ Agudo et al. (2007)2005.70 15.3 VLBA MOJAVE/2cm Survey Kellermann et al. (2004)2005.72 15.3 VLBA MOJAVE/2cm Survey Kellermann et al. (2004)2006.32 15.3 VLBA MOJAVE/2cm Survey Kellermann et al. (2004)
an increasing core separation with time modeled for jet com-ponents in this source (e.g., Eckart et al. 1987, Witzel et al.1988, Schalinski et al. 1992, Gabuzda et al. 1998, Jorstad etal.2001, Perez-Torres et al. 2004, Kellermann et al. 2004, Bach etal. 2005, Rastorgueva et al. 2008). Based on these results itisnot clear, whether S5 0716+714 reveals slow apparent velocitiestypical for BL Lac objects (e.g., Britzen et al. 2007) or fasterapparent velocities more typical for quasars (e.g., Kellermann etal. 2004).Based on the now available improved database with multi-frequency observations at 5 different frequencies, covering atime span of∼14 years, we can address the question concern-ing the kinematics in the pc-scale jet of S5 0716+714 in moredetail. This source belongs to the most rapidly variable radiosources (e.g., Wagner & Witzel 1995) and we can - in additionto the kinematics - investigate whether these sources show evi-dence for a possible correlation between morphological changesand flux-density variability.In an earlier publication of the results relying on the 15 GHzdataonly, we presented a description of preliminary results (Britzenet al. 2006). A detailed description of the data reduction, analy-sis, and investigation is presented in Meyer (2007).The current paper is organized as follows: we first give anoverview of the data that have been (re-)investigated; we
then describe the model-fitting results and discuss the model-component kinematics; we present and discuss a new motionscenario; and we investigate a possible correlation between thetotal flux-density data and the VLBI kinematics, and concentratein the discussion on the implications and resulting consequences.Throughout this paper we use a Hubble constant of H0 = 71kms−1Mpc−1.
2. The observations, data reduction and analysis
2.1. The observations
S5 0716+714 has been observed in 34 VLBA observations andin 2 Global array VLBI observations between 1992.73 and2006.32. These observations have been performed at 5.0, 8.4,15.3, 22.2, and 43.2 GHz. 12 of the VLBA epochs have been ob-tained by the MOJAVE / 2 cm-VLBA survey group (MOJAVE,e.g., Lister & Homan 2005, 2cm Survey, e.g., Kellermann et al.2004). 4 observations were taken from the CJF-survey (Britzenet al. 2007). S5 0716+714 was used as calibrator source forobservations targeted at NRAO 150 (Agudo et al. 2007) in 6epochs. Part of the data presented here have already been ana-lyzed and discussed by Bach et al. (2005). All of the above men-tioned data-sets have been re-analyzed by us.In Table 1 we summarize the observations presented in this pa-

S. Britzen: Non-radial motion in the TeV blazar S5 0716+714 3
per. In column (1) we list the epoch, in column (2) the frequencyof the observation, column (3) lists the array and survey-type,and in column (4) we note references to the original publicationof the individual data sets. We refer to the references in column(4) for more details concerning the observations and data reduc-tion.

4 S. Britzen: Non-radial motion in the TeV blazar S5 0716+714
0 2 4 6Core separation [mas]
0
20
40
Pos
ition
ang
le
1994.671996.531996.821999.55
(a)
0 2 4 6Core separation [mas]
0
20
40
Pos
ition
ang
le
1999.552001.172003.652004.44
(b)
0 2 4 6Core separation [mas]
0
20
40
Pos
ition
ang
le
2004.442004.602004.792004.972005.01
(c)
0 2 4 6Core separation [mas]
0
20
40
Pos
ition
ang
le
2005.012005.092005.702005.722006.32
(d)
0 2 4Core separation [mas]
0
20
40
Pos
ition
ang
le
1992.821993.711994.211995.15
(e)
0 2 4Core separation [mas]
0
20
40
Pos
ition
ang
le
1995.151995.471995.651996.321996.90
(f)
0 2 4Core separation [mas]
0
20
40
Pos
ition
ang
le
1996.901997.582003.202003.49
(g)
0 2 4Core separation [mas]
0
20
40
Pos
ition
ang
le
2003.492003.882004.602004.972005.09
(h)
Fig. 1.The jet ridge line (as defined by all component positions per epoch) is shown at 15 GHz in (a)–(d) and at 22 GHz in (e)–(h).

S. Britzen: Non-radial motion in the TeV blazar S5 0716+714 5
2.2. Model-fitting
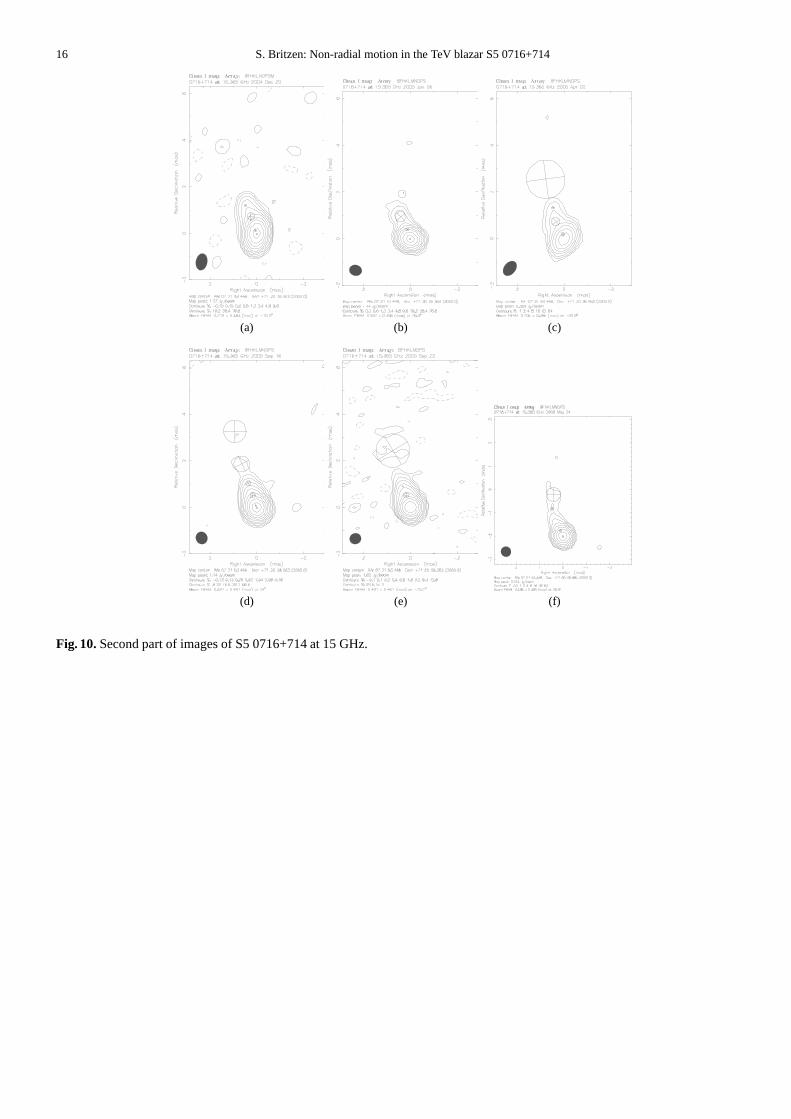
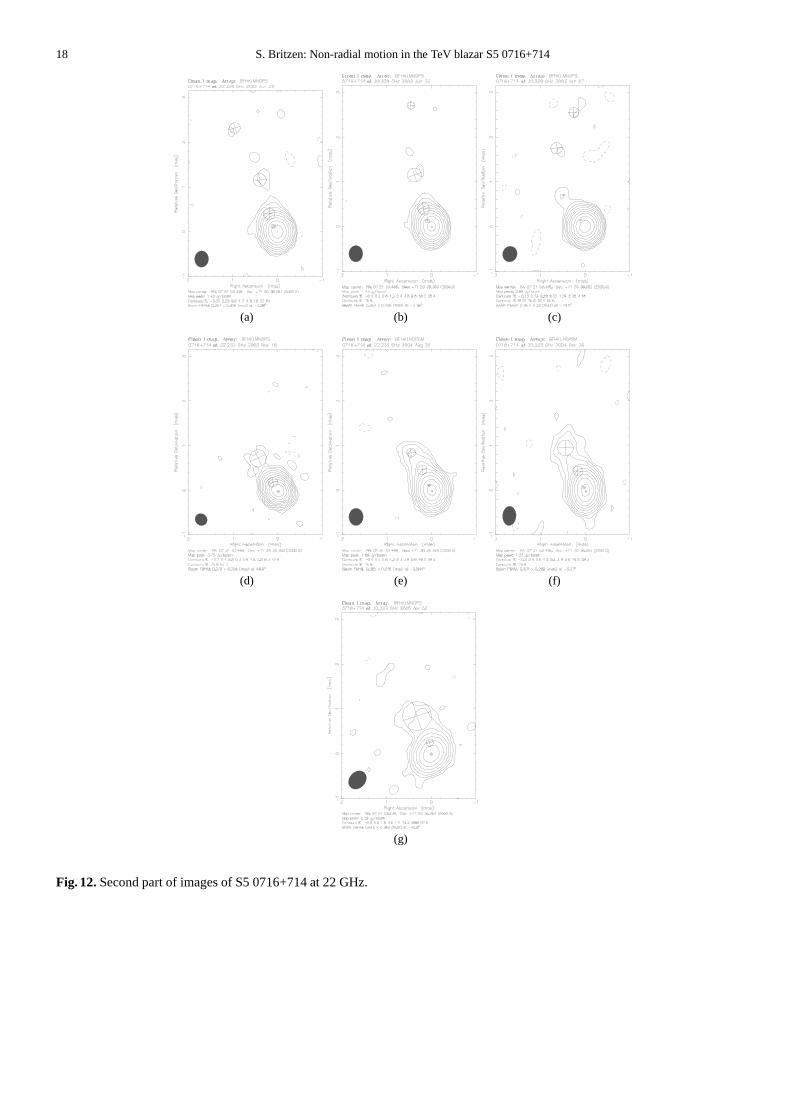
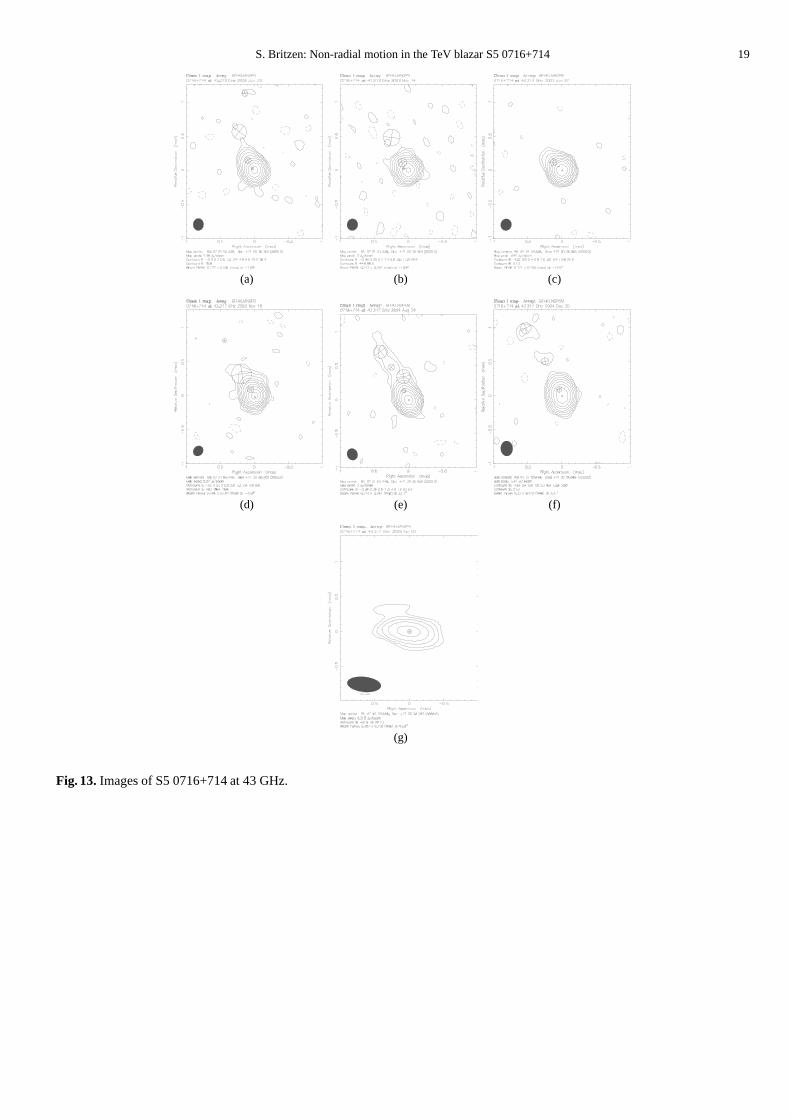
Model-fits have been carried out using thedifmap-package (e.g.,Lovell 2000) and starting with a point-like model in all of the ob-servations. The final number of jet components necessary to fitthe data adequately was reached when adding another jet compo-nent did not lead to a significant improvement in the value of chi-squared. We aimed at obtaining the optimum number of compo-nents for each individual data set. The quality of the observationscan differ from epoch to epoch and, in addition, the flux-densityof the source - in particular in this case of 0716+714 - is knownto vary between epochs. A brighter core component can obscurepart of the jet structure, and not all jet components might bevis-ible in this particular epoch. Vice versa, in the case of a faintcore component when more jet components might be detectable.Thus, the optimum number of Gaussian components that fits thedata best, differs between epochs. The uncertainties of themodelcomponent parameters have been determined by comparing theparameter ranges obtained by performing model-fits with dif-ferent numbers of model components (±1 component). Wherethis was not possible, we used for the core separation r and theposition angle an uncertainty of 5 %. The uncertainties of theflux-density increase with increasing distance from the core. Weaccounted for this by adjusting the uncertainties accordingly: r≤1mas: 5 %, 1≤ r 2mas: 10 – 20 %, and for r>2mas : 20%. Welist all parameters of all re-analyzed epochs in Table 5. We listthe frequency, epoch of observation, flux-density, core separa-tion, position angle, axis size, and component identification. InFigs. 7, 8, 9, 10, 11, 12, and 13 we show the maps with theGaussian components superimposed.
2.3. Component identification
The component identification was carried out based on the as-sumption that changes of the flux density, core separation, andposition angle of the modeled jet components should be smallontime scales between adjacent epochs. We identified the compo-nents across the epochs by takingall model-fit parameters intoaccount. We show an example for the component identificationin Fig. 2. The identified model components are marked by let-ters which are used throughout the paper for the identificationscenario presented here. We are aware of the problems involvedwhen tracing and identifying components through the epochs. Adetailed discussion of the problems and uncertainties involvedhas been published by us in Britzen et al. (2008) with regard tothe analysis of the kinematics of the CJF-survey (for 293 AGN).Whereas in most VLBI data analyses the small number of obser-vations hampers a proper component identification the situationis much better in the case of 0716+714 with a comparably largenumber of data sets. However, 0716+714 is a rather faint AGN inthe cm-regime, and the jet is even fainter. Thus the modelingofjet components is difficult, and the identification of componentsis even more difficult. Although a large number of VLBA obser-vations (50) is available for the analysis, the data are -as usual inVLB analysis - unevenly sampled. In addition to this fact, VLBIdata are usually of non-uniform quality. The identificationacrossthe epochs has to take differences in the number of data points,uv-coverage, data quality and resolution of the data sets into ac-count. To prevent a potentially large systematic error fromaris-ing due to the incorrect cross-identification of moving featuresfrom epoch to epoch, we chose to adopt the simplest schemewhen identifying the jet-features in the jet of 0716+714. Weusedall available model-fit parameters (flux-density, core separation,position angle, size of axis) to find the best suited set of cross-
identifications. The result presented here is meant to provide themost robust and simplest identification based on the largestVLBdata set currently available for this source. Stroboscopiceffectscan occurr in very fast sources where too few data are available.For this source we present here the analysis of the largest data setso far available and hope we can exclude stroboscopic effects.
���
������
���
������������
������������
��������
��������
���
���
core
b
c
d
e
f
Fig. 2. A map of S5 0716+714 with Gaussian model-fit compo-nents superimposed. Letters denote individual components.
3. Results
In the following sections, we present the results of our model-fitting analysis. S5 0716+714 reveals a core-jet structure witha rather faint jet. Tracing the jet components across the epochsallows us to investigate the kinematics in the pc-scale jet.In ad-dition to tracing the components, we investigate the jet ridge lineas a whole. This does not require any component identificationand is thus independent of any identification scenarios. We firstdescribe this evolution of the jet ridge line, and then we concen-trate on the core separation behavior of the individual compo-nents as a function of time. In the next subsection we compareour identification scenario - based on the observed core separa-tion/time relation - with results presented by other authors. Wethen discuss the position angle changes, calculate the apparentvelocities in the standard manner (core separation/time) and tak-ing all the observed motions into account (XY). We compare thederived values with the results presented by other authors.Wethen study the frequency dependence of the individual compo-nents and finally search for correlations between the kinematicsand the flux-density evolution.

6 S. Britzen: Non-radial motion in the TeV blazar S5 0716+714
1992 1994 1996 1998 2000 2002Time [yr]
0
2
4
6C
ore
sepa
ratio
n [m
as]
a_5
b_5
c_5
d_5
e_5
f_5
c2
c3
c4c5
c7
c9
(a)
_8
_8
_8
_8
(b)
1994 1996 1998 2000 2002 2004 2006Time [yr]
0
1
2
3
4
Cor
e se
para
tion
[mas
]
a_15
b_15
c_15
d_15
e_15c3
c6
c7
c8
c9
(c)
1992 1994 1996 1998 2000 2002 2004 2006Time [yr]
0
1
2
Cor
e se
para
tion
[mas
]
a_22
b_22
c_22
d_22
e_22
c10
c4c5
c6
c7
c8
c9
(d)
2002.5 2003 2003.5 2004 2004.5 2005Time [yr]
0
0.25
0.5
0.75
1
1.25
Cor
e se
para
tion
[mas
]
a_43b_43
c_43
d_43
e_43
(e)
Fig. 3.The core separation as a function of time is shown for all frequencies investigated: (a) at 5 GHz, (b) at 8 GHz, (c) at 15 GHz,(d) at 22 GHz, and (e) at 43 GHz. We show the new identification scenario described in detail in this paper (filled symbols, linearregression is shown as solid line). In addition we show – where possible – the previous jet component identifications adopted byBach et al. (2005) (open symbols, linear regression as dotted line).
3.1. Evolution of the jet ridge line
In Fig. 1 we show the evolution of the jet ridge line (definedby the positions in core separation and position angle for allthe components per epoch) with time at 15 GHz (a–d) and at22 GHz (e–h). Obviously the components define rather differentpaths between adjacent epochs. The difference in position an-
gle is larger than the uncertainties of the individual components.Based on these plots, it seems that the individual components donot follow a well-defined path, instead, the ridge line changesbetween adjacent epochs. We are currently investigating muchdenser sampled data (one epoch per day over one week of obser-vations) for S5 0716+714 to investigate this effect in more detailand to determine whether this evolution is periodic.

S. Britzen: Non-radial motion in the TeV blazar S5 0716+714 7
Table 2.The table lists the average values of the reducedχ2-values.
linear regression data ν [GHz] time span χ2red number of data points
‘stationary scenario’ Meyer 2007 22 1995.15–1996.90 0.015 10Bach et al. (2005) Bach et al. (2005) 1995.15–1996.90 0.016 29
Table 4.Apparent velocities taken from Bach et al. (2005)
Id. µ[mas/yr] βapp [c]C1 0.86±0.13 16.13±2.36C2 0.63±0.10 11.87±1.82C3 0.62±0.04 11.59±0.76C4 0.44±0.01 8.27±0.24C5 0.43±0.02 8.16±0.29C6 0.41±0.02 7.80±0.33C7 0.37±0.01 6.89±0.19C8 0.32±0.01 6.04±0.20C9 0.26±0.01 4.98±0.27C10 0.24±0.01 4.52±0.45c11 0.29±0.02 5.48±0.55
3.2. Core separation as function of time
In Fig. 3(a)–(e) we show the core separation as a function oftime for all model-fitted components for all data sets from 5– 43 GHz. The components are shown with filled symbols.Superimposed are linear regressions (solid line) based on ourcomponent identification. In addition to our own results, the re-sults published by Bach et al. (2005) for a subset of the datapresented here are shown as well. The component identificationacross the observing epochs by Bach et al. is based on a com-bined data set composed of all data at all frequencies (5, 8, 15,and 22 GHz). The data by Bach et al. are indicated by open sym-bols, the linear regression by Bach et al. is shown with dottedlines.The larger amount of data analyzed in this paper leads to a dif-ferent component identification compared to Bach et al. We findthat components tend to remain at similar core separations overthe entire observing period. This behavior is found at all five fre-quencies.
3.2.1. Comparison of goodness of fit
In the previous section we introduced a new scenario of jet com-ponent identification for S5 0716+714. Based on this core sepa-ration/time relation we obtain different apparent velocities com-pared to Bach et al. These apparent velocities will be discussedin section 3.4. Here we compare how good the assumed iden-tification (outwards moving components in the case of Bach etal. (2005) and rather stationary components as assumed in thispaper) fits the distribution of the observed data. We thereforecompare the reduced chi-squared values obtained when fittingthese two scenarios to the data sets with the most intense sam-pling in order to have the most reliable data sets for a meaningfulanalysis:- the “stationary scenario” for the 22 GHz data by Meyer et al.(2007) between 1995.15 and 1996.90- the “fast scenario” by Bach et al. (2005) for the data from Bachet al. (2005) between 1995.15 and 1996.90In Table 2 we list in the first column the kind of scenario weapply, the second column identifies the data reduction, the third
column lists the frequency, the fourth column lists the timespancovered by these observations, the fifth column gives the reducedchi-squared value and the last column contains the number ofdata points that entered this study. We do not list the frequencyfor the data of the Bach et al. paper, since data from all frequen-cies were taken together to identify individual components; thus,all frequencies enter the reduced chi-squared value test. This ex-plains why the number of data points is significantly higher com-pared to the data set from Meyer (2007). Based on the assumedscenario (“fast” or “stationary”) we apply a linear regression tothe data and measure the quality of the fit by means of the chi-squared values. Theχ2 values were calculated as follows
χ2= Σ
(
observed values - expected values)2
expected values(1)
χ2red =
χ2
number of data− 1(2)
χ2red is the reducedχ2 value.
The resulting values are listed in Table 2. We obtain a compa-rable (insignificantly better) chi-squared value for the “station-ary” scenario-based linear regression for the 22 GHz data com-pared to the Bach et al. “fast scenario” for the same time range.We conclude that our scenario of rather stationary componentsfits the observed data well, and the test using the time spans withthe most intensive sampling demonstrates quantitatively that thefit is at least comparable to, if not better than, the “fast motionscenario”.
A general comparison of the two scenarios is complicatedby several factors:
– Bach et al. (2005) determined the linear regression forindividual components based on themulti-frequencydataset.All component parameters obtained at all investigated fre-quencies have been taken together to determine individualcomponent motions.We investigated each frequency individually.
– The time span covered by Bach et al. is significantly shortercompared to the time span that the data presented by uscover.
– The number of components in Bach et al. is much largercompared to the number of components which our identifi-cation requires.
3.3. Position angle as function of time
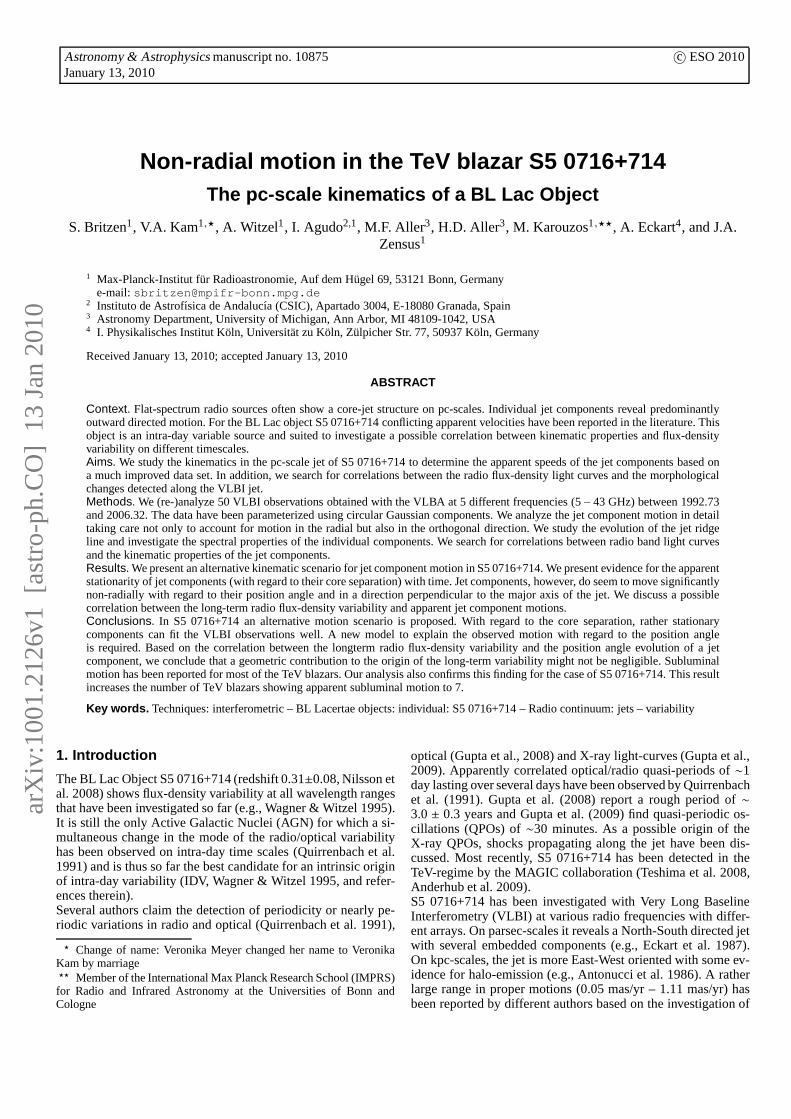
All jet components show significant changes with regard to theposition angle. We show the motion of the inner four jet compo-nents at 15 GHz in rectangular coordinates in Fig. 4. We used arunning average for the data ofa, b, andc. The arrows in Fig. 4indicate the direction as the paths evolve with time. To follow
8 S. Britzen: Non-radial motion in the TeV blazar S5 0716+714
Table 3.Proper motions and apparent speeds for individual components (for further explanation see section 3.4).
ν Comp. µ βapp (coresep.) µ βapp (rect. coord.)[GHz] [mas/year] [c] [mas/year] [c]
5.0 a -0.009±0.042 -0.19±0.84 0.117±0.058 2.19±1.09b 0.034±0.048 0.68±0.95 0.110±0.055 2.06±1.03c 0.045±0.017 0.89±0.34 0.121±0.060 2.27±1.13d 0.018±0.085 0.36±1.68 0.424±0.212 7.96±3.98
8.4 a -0.025±0.018 -0.49±0.37 0.169±0.084 3.17±1.58b -0.042±0.030 -0.84±0.59 0.205±0.102 3.85±1.92c -0.014±0.046 -0.29±0.91 0.164±0.082 3.08±1.54d 0.016±0.031 0.32±0.61 0.276±0.138 5.18±2.59
15.3 a -0.004±0.006 -0.09±0.13 0.24±0.12 4.5±2.3b -0.011±0.009 -0.22±0.19 0.32±0.16 6.0±3.0c -0.037±0.013 -0.74±0.27 0.54±0.27 10.0±5.0d -0.029±0.037 -0.58±0.73 1.60±0.80 29.8±15.0
22.2 a 0.001±0.002 0.02±0.05 0.043±0.021 0.80±0.40b -0.005±0.006 -0.10±0.12 0.088±0.044 1.65±0.82c 0.006±0.010 0.14±0.20 0.269±0.134 0.50±0.25e 0.019±0.006 0.38±0.13 0.005±0.002 0.09±0.04
43.2 a 0.015±0.012 0.31±0.24 0.031±0.015 0.58±0.29b -0.011±0.014 -0.23±0.27 0.044±0.022 0.82±0.41c -0.008±0.027 -0.17±0.54 0.179±0.089 3.36±1.68d -0.016±0.021 -0.32±0.43 0.235±0.117 4.41±2.20e -0.009±0.042 -0.18±0.84 0.775±0.387 14.55±7.27
the position angle evolution with time completely, more denselysampled data in time are required.
-0.6 -0.4 -0.2x
0.5
1
1.5
2
y
<----
<----
<----
---->
a
b
c
d
Fig. 4.Motion of the inner four components at 15 GHz in rectan-gular coordinates (5-point running average fora, 4-point runningaverage forb andc, and 3-point running average ford). The ar-rows indicate the direction of the motion.
3.4. Apparent velocities
In the subsections above we showed that a “stationary” scenario- components showing no long-term outward motion - describesour results best. We calculate the apparent speeds based on theobserved “stationarity” and list them in Table 3. The apparentspeeds have been calculated for the inner 2.5 mas at 5.0 GHz,for the inner 3.5 mas at 8.4 GHz, for the inner 2.5 mas at 15.3GHz, for the inner 2 mas at 22.2 GHz, and for the inner 1.3 masat 43.3 GHz.Some of the model components reveal apparent inward motion,
which is not uncommon in AGN. We discuss this in theDiscussion section. However, none of these values is of 3σsignificance. For the apparent velocities derived for the motionbased on the core separation evolution with time only, wethus exclusively find subluminal values. We list these valuesin Table 3 on the left side. The values have been calculateddepending on the assumed angle to the line of sight of 4.9◦ or≃0◦, respectively. Angles to the line of sight are taken fromBach et al. (2005).The fast apparent velocities found by e.g., Bach et al. (seeTable 4, taken from Bach et al. 2005) are not confirmed by theapparent speeds we derive for the “stationary” components.The MOJAVE 2cm survey webpage(http://www.physics.purdue.edu/astro/MOJAVE/sourcepages/)quotes a number of 1.199± 0.116 mas/y for the motion in S50716+714 (Lister et al., in prep.). This value is significantlyhigher than the values we find based on the core separation/timerelation for individual jet components.In columns (5) and (6) of Table 3, we calculate lower limitsfor the proper motion and apparent speed based on the motionperpendicular to the radial motion - taking the motion withregard to the position angle into account. We estimated thedistance traveled by each component in rectangular coordinates.
3.5. Frequency dependence
After having identified all components independently accordingto core separation, position angle, flux-density, and majoraxis- as described in previous sections - we then traced the indi-vidual components across the frequencies. We did nota priorimake any assumptions concerning frequency dependent proper-ties. We averaged the component positions (weighted by theirflux-density) and found that they can easily be grouped into thefour components shown in Fig. 5(a). We there show the averagecore separation of each component at each frequency. The fre-quency identification is hampered by the different resolution atdifferent frequencies. Thus, at 22 GHz, components close tothe

S. Britzen: Non-radial motion in the TeV blazar S5 0716+714 9
0 1 2 3 4core separation [mas]
0
10
20
30
40F
requ
ency
[GH
z]
I II III IV
(a)
5 10 15 20 25Frequency [GHz]
0.001
0.01
0.1
log
Flu
x de
nsity
[Jy]
I
II
IIIIV
(b)
-1 -0.8 -0.6 -0.4 -0.2 0x [mas]
0
1
2
3
4
y [m
as]
5815 22
58
15
22
58
15 22
58
15
22
I
II
III
IV
(c)
Fig. 5. Identification of the components across the frequencies.(a) shows the average core separation of each component at eachfrequency. (b) shows the logarithm of the flux-density as func-tion of frequency. (c) shows the position of the components ac-cording to the frequency at which they were observed in rectan-gular coordinates along the jet.
core can be seen, which are not visible at lower frequencies.Wewant to mention that - for the afore mentioned reason - at 15 GHzwe grouped the componentsa andb into one component and at22 GHz the componentsc andd into one component ande andx1 andx2 andx3 into one component. We find that we can easilyidentify four components (labeled I–IV) between 5 and 15 GHz.In Fig. 5(b) we show the logarithm of the flux-density as a func-tion of frequency for these 4 components. Fig. 5(c) shows theposition of the components according to the frequency at whichthey were observed in rectangular coordinates along the jet. Wecan trace components at different frequencies along the jetandfind that at lower frequencies we see consistently and preferren-
tially the right side of the jet and towards higher frequencies theleft side of the jet becomes visible.
4. Correlation: total flux-densityevolution/position-angle evolution
In Fig. 6(a) we show the flux-density light-curves at 4.8, 8.0,and 14.5 GHz as obtained within the Michigan monitoring pro-gramme. Superimposed we show part of the epochs of the VLBIobservations. This figure illustrates that morphological informa-tion is available to investigate a possible correlation between thelongterm flux-density evolution and the kinematics. Althoughmuch more flux-density compared to VLBI information is avail-able, the VLBI information covers the general trend well. Inpar-ticular, maxima as well as minima in the flux-density light-curvecan be accompanied by interferometric measurements.In Fig. 6(b) we show a collection of several data sets (all at 15GHz): the total flux density at 14.5 GHz (black dots, data), theflux density of the core (dot-dashed), the flux density of compo-nenta (closest component to the core, dashed), and the positionangle for componenta (dotted) as function of time. We find thatmost of the total flux density is contained in the core compo-nent - which is usual for this type of object. We also find evi-dence for a correlation between the total flux-density evolutionwith time and the position-angle evolution of componenta withtime. Thus, we find acorrelation between flux-density variabil-ity and kinematic properties for the innermost jet component.This means as well that the “core” is exhibiting behavior similarto a jet-component. This might suggest that the longterm flux-density evolution in S5 0716+714 may have a non-negligiblegeometric contribution. The position angle information for a isnot sufficient to unambiguously prove a correlation, but thedataconsistently reproduce the same trend as seen in the total flux-density light-curve. We plan to probe and investigate further thisparticular relation in more detail with more data and on shortertimescales.
5. Discussion
5.1. “Fast” versus “Slow” scenario
In this paper we show that motion in the pc-scale jet of 0716+714can be interpreted within a new kinematic scenario of non-radialmotion. Components do not show the generally assumed fast ap-parent outward motion. Instead, stationary components with re-gard to the core separation are observed. In addition, significantmotion perpendicular to the jet is observed. In the following, wediscuss our results and compare them to those from other studiesof AGN pc-scale jet kinematics.
5.2. Apparent stationarity and non-radial motion of jetcomponents
Our observations reveal a new picture of jet component motionin the BL Lac Object 0716+714: We do not find any longtermoutward motion at any of the investigated frequencies. Instead,model components remain at similar core separations in the in-vestigated time span. This is in contrast to previous studies ofjet component motion in AGN, where components tend to showpredominantly outward motion (e.g., Britzen et al. 2007, 2008).In contrast to previous studies — that relied mainly on investi-gating the core separation evolution — we study the position-angle evolution with time as well. Although we do not find any

10 S. Britzen: Non-radial motion in the TeV blazar S5 0716+714
evidence for long term outward motion, we instead find that allmodelled jet components move with regard to the position an-gle. A similar motion phenomenon has already been observedand analyzed in the jet of 1803+784 (Kudryavtseva et al. 2007,Britzen et al. 2009).In quite a number of AGN, jet components follow either thesame path or a small number of different paths, which have beenexplained within precession scenarios (e.g., PKS 0528+134:Britzen et al. 1999). While components in general tend to fol-low the same jet ridge line in a number of AGN investigated indetail, the jet ridge line itself in 0716+714 shows strong evolu-tion with time.This can be explained as a result of precession of the baseof the jet. This precession can be explained and described bya number of different models. Assuming that the core of theAGN hosts a single object (i.e. SMBH), precession can oc-cur as a result of the Bardeen-Petterson effect (Caproni et al.2006), magnetic torques (Lai 2003) or magnetohydrodynamicinstabilities, prominently Kelvin-Helmholtz instabilities (e.g.,Camenzind & Krockenberger 1992, Hardee & Norman 1988,Birkinshaw 1991, Zhao et al. 1992, Hardee et al. 1994, Hardeeet al. 1997, Meier & Nakamura 2006, Perucho et al. 2006).If we assume that the AGN core hosts a binary system (presum-ably a binary black hole, BBH) then precession can occur as aresult of the orbital motion of the binary system (e.g., Lobanov& Roland 2005, Roos et al. 1993, Kaastra & Roos 1992), tidalforces, gravitational torques (e.g., Katz 1997, Romero et al.2000), as well as orbital motion of the system around the galac-tic gravity center (Roland et al. 2008).Finally, it is possible that the bending of the jet ridge lineisexplained by external causes. Interaction with the surroundingintergalactic medium can cause a bending of the jet, it is, how-ever, highly unlikely that this bending will show any periodicor quasi-periodic behaviour. Furthermore, bending of a jetridgeline can occur by gravitational interaction of the host galaxywith a nearby galaxy (Blandford & Icke 1978, Jagers & de Grijp1985, Lupton & Gott 1982). Again, each and all the above phe-nomena, of external origin, can only partially but not fullyex-plain the bending of the jet ridge line. For a more detailed dis-cussion of the above models please see Britzen et al. (2009) andreferences therein.We are currently working on a model to explain the quasi-stationarity within a model of non-ballistic motion (Gong 2008).
5.3. TeV blazars and subluminal motion
In quite a large fraction of the TeV blazars, subluminal motionhas been detected (e.g., Piner et al. 2008). The apparent patternspeeds measured in the TeV blazars are considerably slowerthan those measured in sources selected for their compact radioemission (e.g., CJF: Britzen et al. 2008), or for their GeVgamma-ray emission (Jorstad et al. 2001). S5 0716+714 hasmost recently been detected in the TeV-regime as well. Thesubluminal motion we find in this source thus fits nicely withthe tendency for significantly slower apparent speeds in thisclass of objects. Piner et al. (2008) discuss the possible originof these slow apparent motions and their connection to theTeV production mechanism. Since the rapid radio variabilitydetected in S5 0716+714 requires quite high Doppler factors(e.g., Wagner & Witzel 1995 and references therein), it is likelythat the slow apparent speeds we see result from pattern speedsand do not reflect the speeds of the underlying bulk motion.
5.4. Correlation between kinematics & flux-densityvariability
We find some evidence for a possible correlation between po-sition angle changes of the innermost component and the long-term flux-density variability. This favors a geometric contribu-tion to the origin of the longterm flux-density evolution. Furthersupport for the geometric contribution has been discussed basedon monitoring of the flux-density variability and studies ofthelight-curves:The flux-density variability in the optical and in the radio bandshows different timescales (Raiteri et al. 2003). Raiteri et al. findthat the variation of the amplitude of the flux-density decreaseswith increasing wavelength and that the outbursts in the opticaland radio regime are caused by the same mechanism. The flux-density in the radio regime seems to be the sum of two differentspectral distributions. Raiteri et al. claim that the oscillations inboth wavelength regimes have either an energetic or a geometricorigin. Nesci et al. (2005) find in an optical light curve someev-idence for long term variability on which short term variationsare superimposed. Indications for a precessing jet have also beenfound (Nesci et al.).The tentative correlation that we find between the position an-gle changes of the innermost component and the long-term flux-density variability leads us to believe that a geometrical expla-nation for the long-term variability of S5 0716+714 is plausi-ble. Camenzind & Krochenberger (1992), first introduced thelighthouse effect, according to which the periodiocity (orquasi-periodicity) observed in the lightcurves of blazars can be at-tributed to the fast rotation of non-axisymmetric plasma bub-bles near the central black hole. During the propagation of thebubble downstream in the jet, it experiences beaming effects, asthe viewing angle changes, thus producing the outbursts in thelight curves. The possible quasi-periodicity found from the lightcurves is characteristic of the rotation period of the plasma nearthe black hole, although it is significantly shorter due to rela-tivistic effects. The above scenario requires a well collimated jetwith a relatively small opening angle. In any different casetheflux-density dies out quickly.Schramm et al. (1993), find that the lighthouse effect is possi-bly responsible for the optical variability for the blazar 3C 345,although they consider that extrinsic effects e.g. microlensing)could also contribute to the long-term variability observed. ForOJ 287, Katz (1997) argues that a precessing disk consequentlyresults in beaming effects for the jet and variability in theflux-density. For the same source, Villata et al. (1998), proposed abeaming model for which both black holes of a BBH systemproduce a jet. A combination of bending and beaming of thejets can produce the double-peaked lightcurve observed forthatsource, thus attributing the variability only to geometrical ef-fects. Qian et al. (2007) make use of a similar model to explainthe light curve of quazar 3C 345.3. Rieger (2004) also attributesvariability of blazars to differential Doppler boosting effects, asthe plasma follows helical trajectories, induced by different pos-sible mechanisms (as orbital motion of a BBH system, intrinsicjet rotation and jet precession). A geometrical origin (relativisticbeaming) for the variability of blazar AO 0235+16 is also con-sidered by Raiteri et al. (2001).Non geometrical phenomena can, however, also explain thelong-term variability seen in the light curves of 0716+714.Mostprominently, two different models have been proposed for OJ287 which shows periodic variability in its light curves (inboththe radio and the visual regime). Sillanpaa. et al. (1988)orig-inally argued that tidal forces from the secondary black hole

S. Britzen: Non-radial motion in the TeV blazar S5 0716+714 11
1994 1996 1998 2000 2002 2004 2006Time [yr]
0
1
2
3
4
Flu
x de
nsity
[Jy]
4.8 GHz8.0 GHz14.5 GHz
1994.67 1996.53
1996.82
1999.552001.17
2003.65 2004.44
2004.602004.79
2004.97
2005.01
2005.70
2005.72
2006.322005.092002.48
2003.20
2003.49
1994.70
1996.63
1999.892000.82
1994.21
1995.651997.03
1997.93
1999.41
(a)
1994 1996 1998 2000 2002 2004 2006Time [yr]
0
1
2
3
4
Flu
x d
ensi
ty [
Jy]
Pos
ition
ang
le
10
30
40
20
(b)
Fig. 6. (a) shows the flux-density light curves obtained by the Michigan monitoring programme at three different frequencies.Superimposed are part of the epochs of the available VLBI epochs investigated in this paper. In (b) a compilation of several datasetsis displayed: the total flux-density at 14.5 GHz (black dots with error bars), the flux density of the core (dot-dashed), the fluxdensity of component a (dashed) as function of time and the position angle of component a (dotted). Most of the total flux-densityis contained in the core component, as expected.
around the pericenter of its orbit will lead to an increased accre-tion rate for the primary black hole and thus result in an outburst.Lehto & Valtonen (1996) proposed that the secondary black holeplunges into and through the accretion disk of the primary beforeand after the pericenter, resulting in the double outburst observedin the light curves (see also Valtonen et al. 2006). This proce-dure however, as argued by Valtaoja et al. (2000), is thermalandshould not produce an outburst in the radio regime; thus it seemsunlikely for the case of 0716+714. In summary, we find that ageometrical explanation is a better match to the observationalproperties of 0716+714.
6. Conclusions
In the previous sections we presented our results on the kine-matics of jet component motion in S5 0716+714. We find adifferent scenario than previously described in the literature forthis source. In particular, we find no long term outward motionfor this source. We present a new model component motionscenario for S5 0716+714 with the following implications:• The jet ridge line changes significantly from epoch to epoch.Components donot follow a well-defined path.• In this scenario the jet components show no 3σ evidence forlong term outward motion. Instead, they remain at similar coreseparations and seem to change significantly in position anglewithin the computed uncertainties. We calculate exclusively

12 S. Britzen: Non-radial motion in the TeV blazar S5 0716+714
apparent subluminal speeds based on the observed core separa-tion/time relation.• S5 0716+714 has been detected as a TeV blazar and shows- as most of the other TeV blazars - subluminal motion. Theobserved apparent motions most likely result from patternspeeds.• Taking the “real” motion in rectangular coordinates intoaccount, we find significantly higher values for the apparentspeeds. These values can only be limits.• We find a possible correlation between the total flux densityand the position angle of the component closest to the core(a). This relation might suggest a non-negligible geometriccontribution to the origin of the longterm flux-density variabilityin S5 0716+714.The usually observed outward motion of jet components inAGN is — according to our analysis — not observable inthe BL Lac object S5 0716+714. Instead, we find kinematicproperties, e.g. non-radial motion, evolving jet ridge-line, etc.which have not been reported for this source so far and haveonly been observed in a couple of other AGN so far (e.g. Britzenet al. 2009). More observations and modelling are required tounderstand the physical origin of these phenomena.
Acknowledgements.We highly appreciate many comments and suggestionsby T.P. Krichbaum on how to check the significance of the results presentedhere. I. Agudo acknowledges financial support from the EU Commissionfor Science and Research under contract HPRN-CT-2002-00321 (ENIGMANetwork). M. Karouzos was supported for this research through a stipend fromthe International Max Planck Research School (IMPRS) for Radio and InfraredAstronomy. We wish to acknowledge the 2cm Survey/MOJAVE team. This re-search has made use of data from the University of Michigan Radio AstronomyObservatory which has been supported by the University of Michigan and theNational Science Foundation. This work made use of the VLBA,which is a fa-cility of the National Science Foundation, operated under cooperative agreementby Associated Universities, Inc. We used the European VLBI Network, which isa joint facility of European, Chinese, South African and other radio astronomyinstitutes funded by their national research councils. This work is also based onobservations with the 100m radio telescope of the MPIfR (Max-Planck-Institutfur Radioastronomie) at Effelsberg.
References
Agudo, I, Bach, U., Krichbaum, T. P., Marscher, A. P., et al. 2007, A&A, 476,17
Agudo, I., Krichbaum, T.P., Ungerechts, H., Kraus, A., et al. 2006, A&A, 456,117
Anderhub, H., Antonelli, L.A., Antoranz, P., Backes, M., etal. 2009, ApJ, 704L,129A
Antonucci, R.R.J., Hickson, P., Olszewski, E.W., Miller, J.S. 1986, AJ, 92, 1Bach, U., Krichbaum, T.P., Ros, E., et al. 2005, A&A, 433, 815Birkinshaw, M. 1991, MNRAS, 252, 505Blandford, R.D. & Icke, V. 1978, MNRAS, 185, 527Britzen, S., Witzel, A., Krichbaum, T.P., et al. 2005, MNRAS, 362, 966Britzen, S., Vermeulen, R.C., Taylor, G.B., Campbell, R.M., et al. 2007, A&A,
472, 763Britzen, S., Vermeulen, R.C., Campbell, R.M., et al. 2008, A&A, 484, 119Britzen, S., Kudryavtseva, N., Witzel, A., et al. 2009, A&A,acceptedBritzen, S., Meyer, V., Witzel, A., et al., Proceedings of the 8th European VLBI
Network Symposium. September 26-29, 2006,Torun, PolandCamenzind, M. & Krockenberger, M. 1992, A&A, 255, 59Caproni, A., Abraham, Z., Mosquera Cuesta, H.J. 2006, ApJ, 638, 120Eckart, A., Witzel, A., Biermann, P., et al. 1987, A&AS, 67, 121Fey, A.L., & Charlot, P. 2000, ApJS, 128, 17Gabuzda, D.C., Kovalev, Y.Y., Krichbaum, T.P., et al. 1998,A&A, 333, 445Gong, B.P. 2008, MNRAS, 389, 315Hardee, P.E., Norman, M.L. 1988, ApJ, 334, 70Hardee, P.E., Cooper, M.A., Clarke, D.A. 1994, ApJ, 424, 126Hardee, P.E., Clarke, D.A., Rosen, A. 1997, ApJ, 485, 533Jagers, W.J. & de Grijp, M.H.K. 1985, A&A, 143, 176Jorstad, S.G., Marscher, A.P., Mattox, J.R., et al. 2001, ApJS, 134, 181Kaastra, J.S. & Roos, N. 1992, A&A, 254, 96
Katz, J.I. 1997, ApJ, 478, 527Kellermann, K.I., Vermeulen, R.C., Zensus, J.A., & Cohen, M.H. 1998, AJ, 115,
1295Kellermann, K.I., Lister, M.L., Homan, D.C., et al. 2004, ApJ, 609, 539Kudryavtseva, N., et al.,Proceedings of the 8th European VLBI Network
Symposium. September 26-29, 2006,Torun,PolandLai D. 2003, ApJ, 591, 119Lehto, H.J., Valtonen, M.J. 1996, ApJ, 460, 207Lobanov, A.P. & Roland, J. 2005, A&A, 431, 831Lister, M., & Homan, D. 2005, AJ, 130, 1418Lister, M.L., Cohen, M.H., Homan, D.C., Kadler, M. et al. 2009, AJ, accepted,
arXiv0909.5100Lovell, A.J. 2000, Astrophysical Phenomena Revealed by Space VLBI,
Proceedings of the VSOP Symposium, H. Hirabayashi, P.G. Edwards, andD.W. Murphy (eds.), Institute of Space and Astronautical Science, 301
Lupton, R.H., Gott, J.R., III 1982, ApJ, 255, 408Meier, D.L., Nakamura, M. 2006, ASP Conference Series, Vol.350Meyer, V.A. 2007, Diploma Thesis, University of CologneNesci, R., Massaro, E., Rossi, C., Sclavi, S., et al. 2005, AJ, 130, 1466Nilsson, K., Pursimo, T., Sillanpaa, A., Takalo, L.O., Lindfors, E. 2008, A&A,
487, 29Perez-Torres, M.,, Marcaide, J., Guirado, J., et al. 2004,A&A, 428, 847Perucho, M., Lobanov, A.P., Marti, J.M., Hardee, P.E. 2006, A&A, 456, 493Piner, G.B., Pant, N., Edwards, P.G. 2008, ApJ, 678, 64Quirrenbach, A., Witzel, A., Wagner, S., et al., 1991 ApJ, 372, 71Raiteri, C.M., Villata, M., Aller, H.D., Aller, M.F., et al.2001, A&A, 377, 396Raiteri, C.M., Villata, M., Tosti, G., et al., 2003 A&A, 402,151Rastorgueva, E.A., Wiik, K., Savolainen, T., Takalo, L.O.,et al. 2009, A&A,
494, 5Rieger, F.M. 2004, ApJ, 615, L5Roland, J., Britzen, S., Kudryavtseva, N.A., Witzel, A., Karouzos, M. 2008,
A&A, 483, 125Romero, C.E., Chajet, L., Abraham, Z., Fan, J.H. 2000, A&A,360, 57Roos, N., Kaastra, J.S., Hummel, C.A. 1993, ApJ, 409, 130Ros, E., Marcaide, J.M., Guirado, J.C., & Perez-Torres, M.A., 2001 A&A, 376,
1090Schalinski, C.J., Witzel, A., Krichbaum, T.P., et al. 1992,in proceedings of
Variability of Blazars, E. Valtaoja & M. Valtonen (eds.) (Cambridge CUP),225
Schramm, K.-J., Borgeest, U., Camenzind, M., Wagner, S.J.,et al. 1993, A&A,278, 391
Sillanpaa, A., Haarala, S., Valtonen, M.J., Sundelius, B., et al. 1988, ApJ, 325,628
Teshima, M., The MAGIC Collaboration 2008, ATel 1500, 1TValtaoja, E., Tersranta, H., Tornikoski, M., Sillanpaa,A. 2000, ApJ, 531, 744Valtonen, M.J., Lehto, H.J., Sillanpaa, A., Nilsson, K.,et al. 2006, ApJ, 646, 36Villata, M., Raiteri, C.M., Sillanpaa, A., Takalo, L.O. 1998, MNRAS, 293, 13Wagner, S.J. & Witzel, A. 1995, ARA&A, 33, 163Witzel, A., Schalinski, C.J., Johnston, K.J., et al. 1988, A&A, 206, 245Zhao, J.-H., Burns, J.O.; Hardee, P.E., Norman, M.L. 1992, ApJ, 387, 69Zensus, J.A., Ros, E., Kellermann, K.I., et al. 2002, AJ, 124, 662

S. Britzen: Non-radial motion in the TeV blazar S5 0716+714 13
(a) (b) (c)
(d) (e)
Fig. 7.5 GHz VLBI images of S5 0716+714. Model-fits convolved with the interferometric beam and with the residual map addedto them are shown with the Gaussian model components superimposed. The following figures show similar images obtained atdifferent frequencies.

14 S. Britzen: Non-radial motion in the TeV blazar S5 0716+714
(a) (b) (c)
(d) (e) (f)
(g) (h)
Fig. 8. Images of S5 0716+714 at 8 GHz.
S. Britzen: Non-radial motion in the TeV blazar S5 0716+714 15
(a) (b) (c)
(d) (e) (f)
(g) (h) (i)
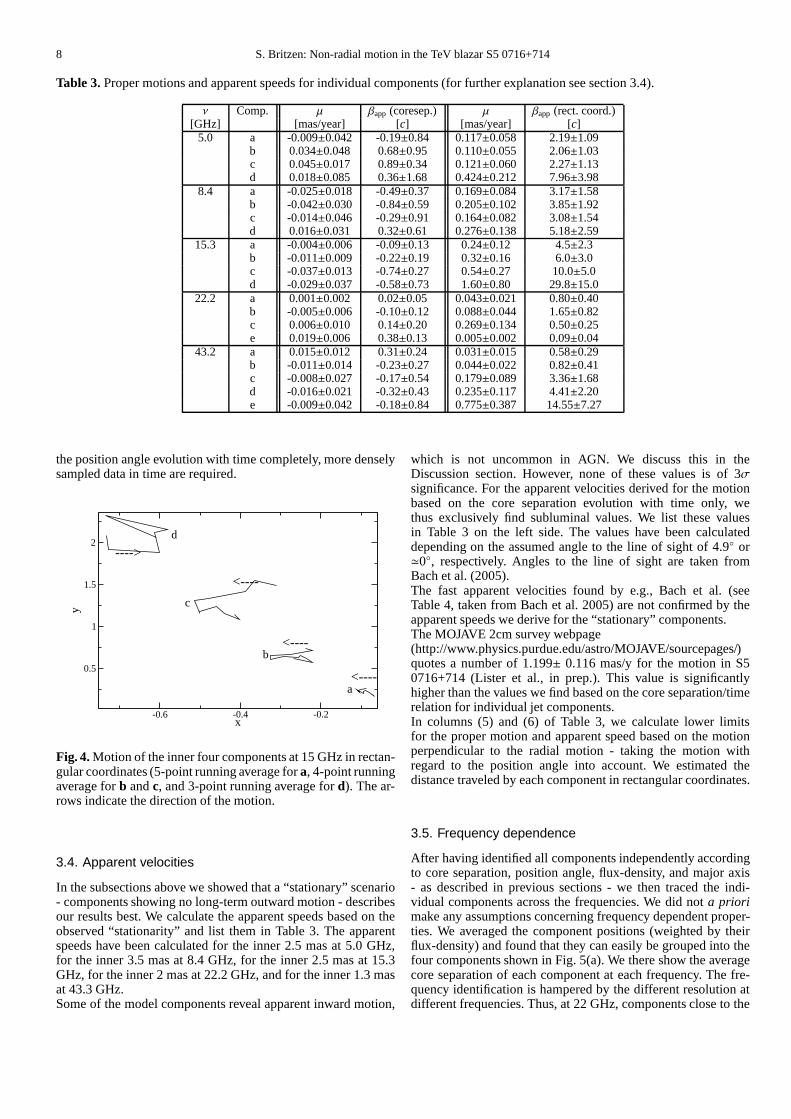
Fig. 9.First part of images of S5 0716+714 at 15 GHz.
16 S. Britzen: Non-radial motion in the TeV blazar S5 0716+714
(a) (b) (c)
(d) (e) (f)
Fig. 10.Second part of images of S5 0716+714 at 15 GHz.

S. Britzen: Non-radial motion in the TeV blazar S5 0716+714 17
(a) (b) (c)
(d) (e) (f)
(g) (h) (i)
Fig. 11.First part of images of S5 0716+714 at 22 GHz.
18 S. Britzen: Non-radial motion in the TeV blazar S5 0716+714
(a) (b) (c)
(d) (e) (f)
(g)
Fig. 12.Second part of images of S5 0716+714 at 22 GHz.
S. Britzen: Non-radial motion in the TeV blazar S5 0716+714 19
(a) (b) (c)
(d) (e) (f)
(g)
Fig. 13.Images of S5 0716+714 at 43 GHz.

20 S. Britzen: Non-radial motion in the TeV blazar S5 0716+714
Table 5.The parameters of the model-fitting.
ν Epoch S r θ M.A. Comp.[GHz] [mJy] [mas] [deg] [mas]
5.0 1992.73 600±30 0 0 0.14±0.01 Core1992.73 35±2 0.69±0.03 24.1±1.2 0.01±0.01 a1992.73 12±2 1.98±0.10 7.1±0.4 0.01±0.01 c1992.73 10±2 4.25±0.21 18.0±1.0 0.53±0.03 e1992.73 5±1 6.52±0.33 12.0±0.6 0.51±0.03 f1994.70 78±4 0 0 0.01±0.01 Core1994.70 231±12 0.32±0.02 1.8±0.1 0.22±0.01 a1994.70 14±2 1.87±0.10 15.5±0.1 0.77±0.04 c1994.70 16±3 3.32±0.20 12.9±0.6 0.89±0.04 d1996.63 182±10 0 0 0.03±0.01 Core1996.63 22±1 1.15±0.06 6.5±0.3 0.01±0.01 b1996.63 5±1 3.75±0.20 20.2±1.0 0.25±0.01 d1996.63 7.0±0.4 5.66±0.30 23.0±1.2 1.78±0.09 f1999.89 552±30 0 0 0.15±0.01 Core1999.89 40±4 1.12±0.06 8.6±0.4 0.01±0.01 b1999.89 20±4 2.30±0.11 12.3±0.6 0.62±0.03 c1999.89 12±2 3.98±0.20 12.8±0.6 1.70±0.09 d2000.82 446±22 0 0 0.07±0.01 Core2000.82 48±2 0.51±0.03 26.9±1.3 0.01±0.01 a2000.82 25±2 1.36±0.07 13.8±0.7 0.29±0.01 b2000.82 12±2 2.23±0.11 11.7±0.6 0.52±0.03 c2000.82 7.0±0.4 3.25±0.16 11.4±0.6 0.85±0.04 d2000.82 4.0±0.2 4.32±0.22 11.6±0.6 0.97±0.05 e2000.82 3±1 6.18±0.31 16.9±0.8 2.17±0.11 f
8.4 1994.21 261±14 0 0 0.14±0.01 Core1994.21 26±13 0.79±0.04 13.8±0.7 0.45±0.02 a1994.21 10±15 1.82±0.09 16.7±0.8 0.75±0.04 b1994.21 12±24 3.31±0.17 12.8±0.6 1.15±0.06 d1995.65 238±12 0 0 0.07±0.01 Core1995.65 47.00±2.35 0.370±0.02 9.9±0.5 0.23±0.01 a1995.65 7.0±0.7 1.37±0.07 15.0±0.8 0.49±0.02 b1995.65 3.0±0.6 2.63±0.13 19.4±1.0 0.36±0.02 c1995.65 4.00±0.08 3.86±0.19 15.5±0.8 1.05±0.05 d1997.03 191±10 0 0 0.05±0.01 Core1997.03 21.00±0.11 0.52±0.03 22.5±1.1 0.01±0.01 a1997.93 372±19 0 0 0.02±0.01 Core1997.93 31.0±1.6 0.54±0.03 10.7±0.5 0.36±0.02 a1997.93 15.0±1.5 1.60±0.08 8.5±0.4 0.34±0.02 b1997.93 7.0±1.4 3.24±0.16 15.8±0.8 0.86±0.04 d1999.41 728.0±36.4 0 0 0.01±0.01 Core1999.41 233.0±11.7 0.24±0.01 13.2±0.7 0.12±0.01 a1999.41 32±16 0.99±0.05 13.6±0.7 0.30±0.02 b1999.41 11.00±0.22 2.05±0.10 9.0±0.5 0.45±0.02 c1999.41 7.0±1.4 3.61±0.18 12.6±0.6 0.90±0.05 d2002.48 663±33 0 0 0.01±0.01 Core2002.48 152±1 0.24±0.01 27.5±0.2 0.15±0.01 a2002.48 17.0±0.5 1.15±0.01 18.2±0.1 0.46±0.02 b2002.48 7.0±0.7 2.20±0.01 19.7±0.2 0.52±0.03 c2002.48 10±2 3.69±0.18 13.6±0.1 1.08±0.05 d2003.20 1106±60 0 0 0.12±0.01 Core2003.20 31±2 0.58±0.03 32.1±1.6 0.01±0.01 a2003.20 23±2 1.55±0.08 19.7±1.0 0.76±0.04 b2003.20 4.0±0.4 2.67±0.13 18.2±0.9 0.01±0.01 c2003.20 4.0±0.8 3.58±0.18 16.5±0.8 0.70±0.04 d
continued in next column

S. Britzen: Non-radial motion in the TeV blazar S5 0716+714 21
ν Epoch S r θ M.A. Comp.[GHz] [mJy] [mas] [deg] [mas]
2003.20 4.0±0.5 4.52±0.02 22.0±0.9 0.42±0.02 e2003.49 1518±80 0 0 0.02±0.01 Core2003.49 96±14 0.37±0.04 33.4±0.3 0.01±0.01 a2003.49 11±1 1.15±0.05 20.9±0.4 0.01±0.01 b2003.49 16±1 2.30±0.12 21.4±0.4 1.20±0.06 c2003.49 6±2 4.35±0.06 23.2±1.2 2.06±0.10 e2003.49 3.0±0.5 6.82±0.14 4.2±1.3 1.25±0.06 x
15.3 1994.67 321±20 0 0 0.05±0.01 Core1994.67 71±4 0.17±0.01 4.6±0.2 0.01±0.01 a1994.67 20±1 0.80±0.04 34.0±1.7 0.84±0.04 b1994.67 9.0±0.9 1.57±0.08 11.9±0.6 0.58±0.03 c1996.53 208±10 0 0 0.05±0.01 Core1996.53 26.0±1.3 0.23±0.01 17.6±0.9 0.01±0.01 a1996.53 19±1 0.67±0.034 6.2±0.3 0.28±0.01 b1996.53 3.0±0.3 1.49±0.08 12.6±0.6 0.31±0.02 c1996.53 1.0±0.2 2.41±0.12 18.6±0.9 0.48±0.02 d1996.53 2.0±0.4 4.15±0.21 16.3±0.8 0.67±0.04 x1996.82 240±2 0 0 0.01±0.01 Core1996.82 13±1 0.38±0.02 17.3±0.9 0.01±0.01 a1996.82 8.0±0.8 1.48±0.01 11.0±0.4 0.53±0.03 c1999.55 1033±52 0 0 0.07±0.01 Core1999.55 174±9 0.18±0.01 27.2±1.4 0.01±0.01 a1999.55 22±1 0.76±0.04 13.6±0.7 0.09±0.01 b1999.55 16.0±1.6 1.55±0.08 11.5±0.6 0.36±0.02 c1999.55 5±1 3.24±0.16 17.8±0.9 0.36±0.02 e2001.17 545±30 0 0 0.05±0.01 Core2001.17 72±22 0.42±0.02 21.5±1.0 0.16±0.01 a2001.17 2.0±0.5 0.89±0.02 16.8±0.3 0.01±0.01 b2001.17 12±3 1.84±0.01 17.0±0.1 0.61±0.03 c2001.17 5.0±1.5 3.10±0.01 13.3±0.7 0.69±0.03 e2001.17 2.0±0.5 5.20±0.02 17.4±0.9 0.01±0.01 x2003.65 2299±110 0 0 0.02±0.01 Core2003.65 254±13 0.16±0.01 36.0±1.8 0.10±0.01 a2003.65 15.0±0.8 0.70±0.04 32.7±1.6 0.33±0.02 b2003.65 10±2 2.20±0.11 18.1±0.9 1.03±0.05 d2004.44 1403±70 0 0 0.01±0.01 Core2004.44 419±20 0.17±0.01 29.2±1.5 0.07±0.01 a2004.44 84.0±4.2 0.56±0.03 31.1±1.6 0.18±0.01 b2004.44 25±3 1.03±0.05 24.2±1.2 0.25±0.01 c2004.60 1336±70 0 0 0.01±0.01 Core2004.60 200±10 0.26±0.01 25.5±1.3 0.01±0.01 a2004.60 13±7 1.30±0.07 29.9±1.5 0.31±0.02 c2004.79 1841±90 0 0 0.07±0.04 Core2004.79 15.0±0.8 0.33±0.02 20.8±1.0 0.01±0.01 a2004.79 100±5 0.69±0.04 21.4±1.0 0.44±0.02 b2004.79 8.0±0.8 1.46±0.07 17.8±0.9 0.31±0.02 c2004.79 3.0±0.5 2.02±0.10 21.7±1.1 0.81±0.04 d2004.97 1018±43 0 0 0.01±0.02 Core2004.97 288±40 0.16±0.01 24.6±0.2 0.07±0.01 a2004.97 51.0±0.5 0.80±0.04 18.6±1.0 0.32±0.02 b2004.97 17±3 1.31±0.04 21.9±0.3 0.09±0.01 c2004.97 2.0±0.5 1.94±0.03 22.8±0.4 0.01±0.01 d2004.97 3.0±0.2 3.28±0.08 33.4±1.7 0.01±0.01 e2004.97 2±1 4.16±0.02 22.8±0.1 0.01±0.01 x2005.01 1406.0±0.5 0 0 0.05±0.01 Core
continued in next column

22 S. Britzen: Non-radial motion in the TeV blazar S5 0716+714
ν Epoch S r θ M.A. Comp.[GHz] [mJy] [mas] [deg] [mas]
2005.01 91±4 0.27±0.04 20.4±0.1 0.01±0.01 a2005.01 16±8 0.43±0.01 18.3±0.2 0.11±0.01 b2005.01 46.00±0.05 1.05±0.05 23.8±1.2 0.44±0.02 c2005.01 5.00±0.03 1.99±0.09 8.7±0.4 0.02±0.01 d2005.09 319±16 0 0 0.01±0.01 Core2005.09 84.0±4.2 0.24±0.01 14.1±0.7 0.15±0.01 a2005.09 30.0±1.5 0.86±0.04 25.0±1.3 0.36±0.02 b2005.09 12.0±1.2 1.46±0.07 19.2±1.0 0.10±0.01 c2005.09 12±2 2.71±0.14 16.9±0.8 1.65±0.08 d2005.09 2.0±0.6 5.48±0.3 8.3±0.4 0.01±0.01 x2005.70 868±50 0 0 0.03±0.01 Core2005.70 292±12 0.12±0.01 27.5±1.7 0.05±0.01 a2005.70 98.0±5.5 0.57±0.03 18.9±0.8 0.22±0.01 b2005.70 9.0±22.5 1.12±0.06 19.2±0.4 0.22±0.01 c2005.70 5±2 2.00±0.29 19.0±0.9 0.68±0.03 d2005.70 5.0±1.5 3.43±0.51 16.1±0.8 0.96±0.05 e2005.72 769±50 0 0 0.01±0.01 Core2005.72 87.0±5.5 0.57±0.03 20.5±0.8 0.21±0.01 b2005.72 14.0±2.5 1.00±0.06 19.9±0.4 0.01±0.01 c2005.72 9±2 2.58±0.29 17.3±0.9 1.44±0.07 d2006.32 498.0±24.9 0 0 0.04±0.01 Core2006.32 53.0±2.6 0.280±0.002 19.3±1.0 0.10±0.01 a2006.32 10.0±0.5 0.71±0.01 26.9±1.3 0.01±0.01 b2006.32 5.0±0.5 1.26±0.06 21.9±1.1 0.12±0.01 c2006.32 13.0±1.9 1.85±0.09 12.7±0.6 0.61±0.03 d2006.32 2.0±0.4 3.39±0.17 4.4±0.2 0.01±0.01 e
22.2 1992.85 700±35 0 0 0.13±0.01 Core1992.85 20±3 1.62±0.08 7.2±0.4 0.01±0.01 e1992.85 10±2 2.42±0.12 17.9±0.9 0.01±0.01 x21993.71 248.0±1.2 0 0 0.01±0.01 Core1993.71 99±5 0.170±0.009 16.7±0.8 0.10±0.01 a1993.71 17.0±0.9 0.57±0.03 15.3±0.8 0.13±0.01 b1993.71 16±16 1.23±0.06 20.3±1.0 0.24±0.01 d1994.21 252.0±1.3 0 0 0.01±0.01 Core1994.21 44±22 0.18±0.01 22.1±1.1 0.01±0.01 a1994.21 13.0±0.7 0.80±0.04 18.2±0.9 0.37±0.02 c1994.21 6.0±0.9 1.80±0.09 15.2±0.8 0.47±0.02 e1995.15 677.0±33.9 0 0 0.05±0.01 Core1995.15 72±36 0.17±0.01 4.1±0.2 0.18±0.01 a1995.15 4.00±0.04 1.15±0.06 13.6±0.7 0.01±0.01 c1995.15 5±1 2.63±0.13 7.9±0.4 0.01±0.01 x31995.15 8±16 3.64±0.18 16.2±0.8 0.14±0.01 y1995.47 173±9 0 0 0.04±0.01 Core1995.47 11.0±0.6 0.54±0.03 17.2±0.9 0.01±0.01 b1995.47 7±14 2.12±0.11 15.5±0.8 0.01±0.01 x11995.65 174.0±8.7 0 0 0.06±0.01 Core1995.65 123.0±6.2 0.14±0.01 10.6±0.5 0.06±0.01 a1995.65 28±14 0.36±0.02 12.1±0.6 0.23±0.01 b1995.65 4.0±0.2 0.76±0.04 10.2±0.5 0.01±0.01 c1995.65 5.0±0.8 1.61±0.08 17.3±0.9 0.43±0.02 e1996.34 178±9 0 0 0.01±0.01 Core1996.34 57.0±0.3 0.18±0.01 10.5±0.5 0.01±0.01 a1996.34 24±12 0.58±0.03 5.1±0.3 0.15±0.01 b1996.34 13.0±2.6 1.99±0.10 23.2±1.2 1.23±0.06 x11996.90 218±11 0 0 0.01±0.01 Core
continued in next column

S. Britzen: Non-radial motion in the TeV blazar S5 0716+714 23
ν Epoch S r θ M.A. Comp.[GHz] [mJy] [mas] [deg] [mas]
1996.90 61.0±3.1 0.14±0.01 21.5±1.1 0.13±0.01 a1996.90 7.00±0.35 0.81±0.04 10.8±0.5 0.09±0.01 c1996.90 6.0±0.9 1.57±0.08 10.9±0.5 0.31±0.01 e1997.58 765.0±38.3 0 0 0.01±0.01 Core1997.58 164.0±8.2 0.11±0.01 40.7±2.0 0.09±0.01 a1997.58 22.0±1.1 0.63±0.03 1.6±0.1 0.21±0.01 b1997.58 4±3 1.60±0.08 11.6±0.6 0.01±0.01 e1997.58 4.0±0.8 2.21±0.11 2.0±0.1 0.01±0.01 x12002.48 1343±12 0 0 0.01±0.01 Core2002.48 161±8 0.16±0.01 35.6±0.2 0.09±0.01 a2002.48 18±4 0.45±0.03 24.2±1.2 0.25±0.01 b2002.48 9.0±0.5 1.23±0.04 19.0±0.8 0.29±0.01 d2002.48 3.0±0.5 1.73±0.03 18.5±0.1 0.01±0.01 e2002.48 3.0±0.2 2.52±0.03 22.2±4.9 0.24±0.01 x22003.20 1342.0±6.7 0 0 0.02±0.01 Core2003.20 159±8 0.16±0.01 35.8±1.8 0.09±0.01 a2003.20 20±1 0.45±0.02 24.3±1.2 0.26±0.01 b2003.20 9.0±0.9 1.23±0.06 18.3±0.9 0.31±0.02 d2003.20 3.0±0.3 1.75±0.09 17.9±0.9 0.01±0.01 e2003.20 4.0±0.6 2.76±0.14 9.7±0.5 0.16±0.01 x32003.49 2819±2 0 0 0.01±0.01 Core2003.49 128±1 0.18±0.01 37.9±1.9 0.04±0.01 a2003.49 5.0±0.3 0.47±0.02 21.4±1.0 0.01±0.01 b2003.49 8.0±0.4 0.85±0.04 33.7±1.7 0.04±0.01 c2003.49 5.0±0.5 1.87±0.09 20.1±1.0 0.25±0.01 e2003.49 5.0±0.8 2.57±0.13 5.6±0.3 0.22±0.01 x22003.88 2309±115 0 0 0.04±0.01 Core2003.88 804±75 0.17±0.01 30.5±1.6 0.10±0.01 a2003.88 14.0±0.5 0.88±0.01 31.3±1.6 0.38±0.02 c2004.60 1444±72 0 0 0.02±0.01 Core2004.60 328±16 0.15±0.01 27.3±1.4 0.05±0.01 a2004.60 72±4 0.53±0.03 24.6±1.2 0.21±0.01 b2004.60 30±2 0.98±0.05 28.4±1.4 0.20±0.01 c2004.60 4.0±0.4 1.86±0.10 27.7±1.4 0.01±0.01 e2004.60 3.0±0.6 2.86±0.14 21.2±1.1 0.01±0.01 x32004.97 907±45 0 0 0.02±0.01 Core2004.97 475±24 0.10±0.01 26.7±1.3 0.06±0.01 a2004.97 45±2 0.49±0.02 1.4±0.1 0.22±0.01 b2004.97 29±3 1.08±0.05 25.1±1.3 0.35±0.02 c2004.97 4.0±0.4 1.90±0.09 21.5±1.1 0.01±0.01 e2005.09 376±20 0 0 0.06±0.01 Core2005.09 41.0±0.5 0.26±0.01 8.5±0.2 0.16±0.01 a2005.09 31±2 0.91±0.03 20.5±0.2 0.64±0.03 c
43.2 2002.48 1484.0±74.2 0 0 0.01±0.01 Core2002.48 329.0±16.5 0.040±0.002 51.2±2.6 0.03±0.01 a2002.48 130.0±6.5 0.18±0.01 34.7±1.7 0.09±0.01 b2002.48 9.0±4.5 0.61±0.03 22.1±1.1 0.22±0.01 d2002.48 4.0±0.4 1.14±0.06 7.1±0.4 0.10±0.01 e2003.20 1853.0±92.7 0 0 0.01±0.01 Core2003.20 211.0±10.6 0.080±0.004 70.2±3.5 0.03±0.01 a2003.20 127.0±6.4 0.15±0.01 38.4±1.9 0.13±0.01 b2003.20 6.0±0.3 0.54±0.03 27.4±14 0.24±0.01 d2003.20 4.0±0.4 1.08±0.05 31.1±1.6 0.01±0.01 e2003.49 3310.0±16.6 0 0 0.01±0.01 Core2003.49 294.0±14.7 0.080±0.004 41.4±2.1 0.01±0.01 a
continued in next column

24 S. Britzen: Non-radial motion in the TeV blazar S5 0716+714
ν Epoch S r θ M.A. Comp.[GHz] [mJy] [mas] [deg] [mas]
2003.49 86.0±4.3 0.18±0.01 47.8±2.4 0.10±0.01 b2003.49 9.00±0.45 0.33±0.02 45.9±2.3 0.01±0.01 c2003.49 4.0±0.2 0.64±0.03 52.5±2.6 0.01±0.1 d2003.88 2072.0±10.4 0 0 0.02±0.01 Core2003.88 1636.0±81.8 0.040±0.002 12.2±0.6 0.01±0.01 a2003.88 570.0±28.5 0.13±0.07 29.4±1.5 0.09±0.01 b2003.88 57.0±2.85 0.39±0.02 29.9±1.5 0.26±0.01 c2003.88 4.0±0.2 0.95±0.05 28.2±1.4 0.19±0.01 e2004.60 1871.0±93.6 0 0 0.02±0.01 Core2004.60 200±10 0.060±0.003 46.8±2.3 0.01±0.01 a2004.60 217.0±10.9 0.16±0.01 26.0±1.3 0.06±0.01 b2004.60 33.0±1.7 0.36±0.02 12.3±6.2 0.20±0.01 c2004.60 22.0±1.1 0.55±0.03 27.3±1.4 0.09±0.01 d2004.60 27.0±1.4 0.83±0.04 29.9±1.5 0.19±0.01 x2004.60 4.0±0.4 1.07±0.05 25.5±1.3 0.01±0.01 e2004.97 1382.0±69.1 0 0 0.01±0.01 Core2004.97 197.0±9.9 0.11±0.01 23.4±1.2 0.08±0.01 a2004.97 12.0±0.6 0.57±0.03 26.2±1.3 0.10±0.01 d2004.97 18.0±1.8 1.13±0.06 28.0±1.4 0.16±0.01 e2005.09 325.0±16.3 0 0 0.05±0.01 Core2005.09 12.0±0.6 0.33±0.02 29.7±1.5 0.01±0.01 c