Environmental Study S5 Monitoring Program for the Montara Well Release Timor Sea: Final Report on...
49
Environmental Study S5 Monitoring Program for the Montara Well Release Timor Sea: Final Report on the Nature of Barracouta and Vulcan Shoals Authors: Andrew Heyward, Cordelia Moore, Ben Radford, and Jamie Colquhoun Contributors: Paul Tinkler, Kim Brooks, Greg Suosaari, Dave Whillas, Kerryn Johns, Ross Jones, Jamie Oliver Report prepared by the Australian Institute of Marine Science for PTTEP Australasia (Ashmore Cartier) Pty. Ltd. in accordance with Contract No.: 000/2009/10-23 August 2010
-
Upload
independent -
Category
Documents
-
view
2 -
download
0
Transcript of Environmental Study S5 Monitoring Program for the Montara Well Release Timor Sea: Final Report on...

Environmental Study S5
Monitoring Program for the Montara Well Release Timor Sea: Final Report on
the Nature of Barracouta and Vulcan Shoals
Authors: Andrew Heyward, Cordelia Moore, Ben Radford, and Jamie Colquhoun
Contributors:
Paul Tinkler, Kim Brooks, Greg Suosaari, Dave Whillas, Kerryn Johns, Ross Jones, Jamie Oliver
Report prepared by the Australian Institute of Marine Science for PTTEP Australasia (Ashmore Cartier) Pty. Ltd. in accordance with Contract No.: 000/2009/10-23
August 2010

ii
Enquiries should be addressed to: Andrew Heyward Australian Institute of Marine Science UWA Oceans Institute Building (M096) 35 Stirling Hwy CRAWLEY WA 6009 Email: [email protected]
© Copyright . PTTEP Australasia (Ashmore Cartier) Pty Ltd
All rights are reserved and no part of this document may be reproduced, stored or copied in any form or by any means whatsoever except with the prior written permission of PTTEP Australasia (Ashmore Cartier) Pty Ltd
DISCLAIMER While reasonable efforts have been made to ensure that the contents of this document are factually correct, AIMS does not make any representation or give any warranty regarding the accuracy, completeness, currency or suitability for any particular purpose of the information or statements contained in this document. To the extent permitted by law AIMS shall not be liable for any loss, damage, cost or expense that may be occasioned directly or indirectly through the use of or reliance on the contents of this document.
Cover Photo: Barracouta Shoals – small coral isolate with associated biodiversity 25m depth.

Montara Monitoring Program S5: Barracouta & Vulcan Shoals Heyward et al.
3
Table of Contents
Table of Contents ................................................................................................................... 3
List of Figures and Tables ..................................................................................................... 4
Executive Summary ............................................................................................................... 7
Background .............................................................................................................................. 9
Methods .................................................................................................................................... 9
Location ........................................................................................................................................................... 9
Field sampling ................................................................................................................................................ 10
Data analysis .................................................................................................................................................. 12
Still photo analysis ..................................................................................................................................................... 12
Cluster analysis and heatmaps.............................................................................................................................. 13
Power analysis ............................................................................................................................................................ 13
Results .................................................................................................................................... 15
Broad scale characterization of habitat types from video .................................................................. 18
Quantitative broadscale patterns from point intercept analysis .................................................................. 21
Examples of common habitat types .................................................................................................................... 26
Fine scale patterns and patchiness ........................................................................................................... 30
Power analysis ............................................................................................................................................................ 43
Other shoals ................................................................................................................................................. 43
Discussion .............................................................................................................................. 45
Acknowledgements .............................................................................................................. 46
References ............................................................................................................................. 47
Appendix1 .............................................................................................................................. 48
Appendix 2. ............................................................................................................................ 49

Montara Monitoring Program S5: Barracouta & Vulcan Shoals Heyward et al.
4
List of Figures and Tables
Figure 1. Location of study sites in relation to modeled relative exposure map of the oil spill. Image of the modeled spill provided via PTTEP. ................................................................................................... 10
Figure 2. Towed body used for all transect surveys. A forward facing video camera (VC) provides live images to the ship, allowing the towed body to be “flown” along just above the seabed while marine scientists classify the habitats.. ........................................................................................... 11
Figure 3. The AIMS towvid system in use on board the research vessel RV Solander during the survey.. ............................................................................................................................................................................. 11
Figure 4. Example of the towvid transect still image sub-sampling approach – the georeferenced transect track plot is show on the left. The time-based position data from the track file is used to georeference the associated still images taken along the track (middle image). ........................... 14
Figure 5. Fine scale image analysis - individual still photos at 10m spacing were analysed for percent cover of dominant organisms using a stratified random point intercept protocol, with 20 points per image (orange and blue letter symbols). The classification scheme applied is included as Appendix 1. ............................................................................................................................ 15
Figure 6. Barracouta Shoal -Location of survey transects and initial habitat classification of epibenthos, based on towvid data, for the top of Barracouta Shoal. This shoal has a ubiquitous presence of low to medium density calcareous green alga Halimeda, with some patchy but occasionally dense live coral.................................................................................................................. 16
Figure 7. Vulcan Shoal - Location of survey transects and initial habitat classification of epibenthos, based on towvid data, for the top of Vulcan Shoal. This shoal has an extensive presence of low to medium density seagrass with some moderate to high density live coral around the shallower ground towards the western end.. ....................................................................... 17
Figure 8. Dominant substrate groups at Barracouta and Vulcan Shoals –classification of substrate based on real-time towvid data from all tows shown in Figs. 6 and 7. HR Reef= high relief reef, LR Reef=low relief reef <1m high. .................................................................................................................. 20
Figure 9. Barracouta Shoal – comparison of mean abundance, expressed as a percent of total benthic cover, for major benthic categories on each survey transect. ........................................................... 22
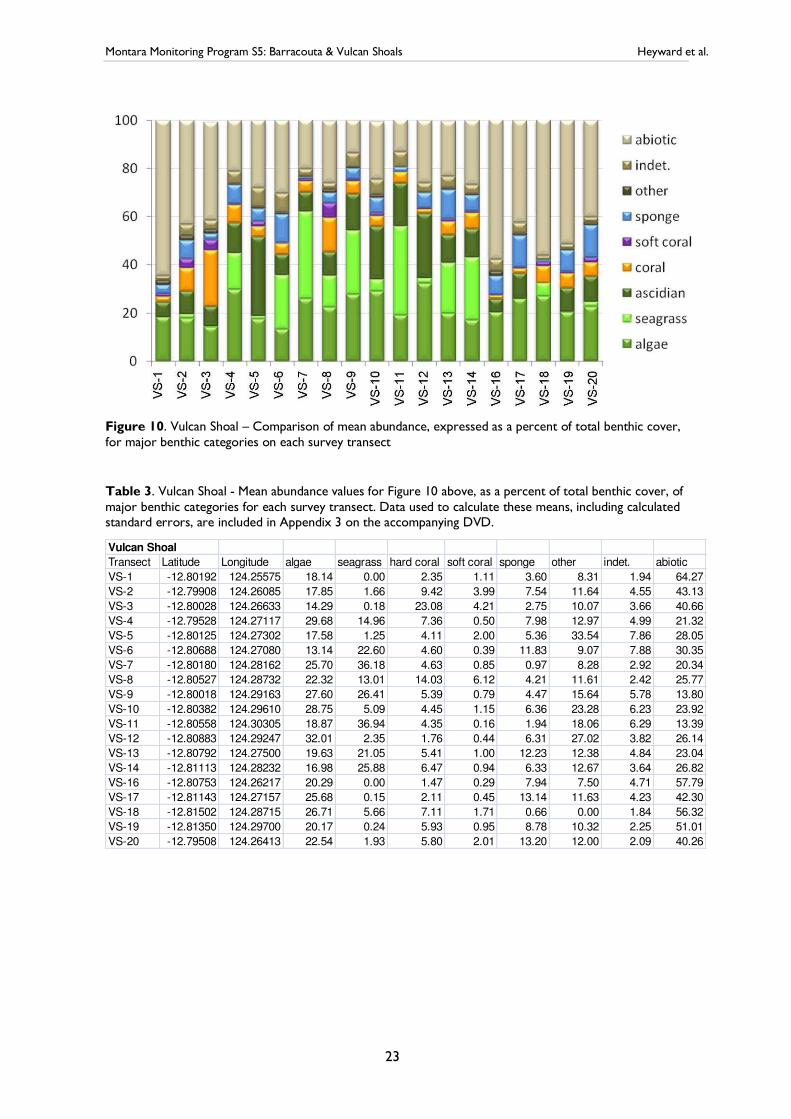
Figure 10. Vulcan Shoal – Comparison of mean abundance, expressed as a percent of total benthic cover, for major benthic categories on each survey transect ............................................................ 23
Figure 11. Barracouta and Vulcan Shoals- major benthic groups- comparative abundance estimates of major benthic groups, expressed as mean percent cover of the seabed.. ............................. 25
Figure 12. Barracouta Shoal: soft coral field with coral bommie in the background. This small species of soft coral, a provisional Nephthea species, extended as a dense cover over hectares at the western shoal margin. ..................................................................................................................... 26
Figure 13. Barracouta Shoal: coral-Halimeda-filter feeder mixed habitats were frequently encountered on rocky and low relief reef areas................................................................................................... 26
Figure 14. Barracouta Shoal – low relief consolidated reef and broken rock areas could support very diverse biota. ......................................................................................................................................................... 27
Figure 15. Barracouta Shoal –extensive rubble zones were encountered, with encrusting red algae commonly forming fields of rounded rhodoliths, which were intersperse with Halimeda and occasional bare sand patches. .......................................................................................................... 27
Figure 16. Barracouta Shoal –isolated outcrop amidst coarse sand and rubble. Sandy patches were found across the shoal plateau but appeared to be more common and extensive towards the rim areas in 40m depths. ..................................................................................................................... 28
Montara Monitoring Program S5: Barracouta & Vulcan Shoals Heyward et al.
5
Figure 17. Vulcan Shoal – dense seagrass Thalassodendron ciliatum was a notable feature on parts of this shoal. .................................................................................................................................................................... 28
Figure 18. Vulcan Shoal –seagrass, algae and corals were encountered mixed together in a number of locations...................................................................................................................................................... 29
Figure 19. Vulcan Shoal - A small photosynthetic ascidian, very similar in appearance to Lissoclinum bistratum Sluiter, mixed with the calcareous green alga Halimeda. This ascidian was abundant and formed dense patches on some parts of Vulcan Shoal, possibly due to very localized recruitment .......................................................................................................................................... 29
Figure 20. Barracouta Shoal - examples of fine scale patchiness and habitat heterogeneity along four transects representing different habitat types. ............................................................................................. 32
Figure 21. Vulcan Shoal – examples of fine scale patchiness and habitat heterogeneity along four transects representing different habitat types.. ..................................................................................................... 33
Figure 22. Cluster analysis (complete linkage) based on Hellinger transformed distance matrix for major benthic biotic groups found at Barracuda shoal transects. Two robust groups (outlined in red) are identified using bootstraped significance calculation..................................................... 34
Figure 23. Barracouta Shoal - Heatmap and cluster analysis (complete linkage) based on Hellinger transformed distance matrix for major benthic biotic groups found at Barracuda shoal transects.. ........................................................................................................................................................................ 35
Figure 24. Barracouta Shoal - Spatial distribution of similar transects, based on cluster analysis above. Mean depth data is also shown under each transect in the cluster.. .................................................. 36
Figure 25: Vulcan Shoal - Cluster analysis (complete linkage) based on Hellinger transformed distance matrix for major benthic biotic groups found at Vulcan shoal transects. Two robust groups (outlined in red) are identified using bootstraped significance calculation. ........................ 37
Figure 26: Vulcan Shoal - Heatmap and cluster analysis (complete linkage) based on Hellinger transformed distance matrix for major benthic biotic groups found at Vulcan shoal transects. Cell values are labeled with correlation statistic (R-sq). ................................................................. 38
Figure 27. Vulcan Shoal - Spatial distribution of similar transects, based on cluster analysis above. Median depth data is also shown under each transect in the cluster.............................................................. 39
Figure 28: Barracouta and Vulcan Shoal comparative cluster analysis (complete linkage) based on Hellinger transformed distance matrix for major benthic biotic groups found at Vulcan shoal transects. Two robust groups (outlined in red) are identified using bootstraped significance calculation.. ............................................................................................................................................... 40
Figure 29. Barracouta Shoal - power analysis of six transects with divergent benthic coverage of major habitat groups, identified by cluster analysis.. ............................................................................................ 41
Figure 30. Power analysis of six transects from Vulcan shoal with divergent benthic coverage of major habitat groups, identified by cluster analysis. . ........................................................................................... 42
Figure 31. Potential shoal type habitat locations in the vicinity of the Montara spill. Shoals type features, indicated by red dots, were identified from the Australian hydro-geographic charts A00314, A00319 and A00320 and defined as abrupt submerged features rising from deeper than 50 meters.. .................................................................................................................................... 44

Montara Monitoring Program S5: Barracouta & Vulcan Shoals Heyward et al.
6
Table 1. Dominant benthic groups at Barracouta and Vulcan Shoals –classification of major biotic groups based on real-time towvid data from all transect tows shown in Figs. 6 and 7 .............................. 20
Table 2. Barracouta Shoal - Mean abundance values for Figure 9 above, expressed as a percent of total benthic cover, of major benthic categories for each survey transect. Data used to calculate these means, including calculated standard errors, are included in Appendix 3 on the accompanying DVD. .............................................................................................................................................. 22
Table 3. Vulcan Shoal - Mean abundance values for Figure 10 above, as a percent of total benthic cover, of major benthic categories for each survey transect. Data used to calculate these means, including calculated standard errors, are included in Appendix 3 on the accompanying DVD. ..................................................................................................................................................... 23

Montara Monitoring Program S5: Barracouta & Vulcan Shoals Heyward et al.
7
Executive Summary
At the request of PTTEP Australasia (Ashmore Cartier) Pty. Ltd. (the company), a pilot survey of
benthic environments at two submerged shoals, Barracouta and Vulcan, located 55 km and 27 km
west and south-west respectively of the Montara Well Head Platform, was conducted by
Australian Institute of Marine Science (AIMS) in April, 2010. The objective of this preliminary
work was to assist the company and the Commonwealth Government (through the responsible
agency, the Department for Sustainability, Environment, Water, Population and Communities –DSEWPaC ) to understand the possible scale of impact which might have occurred as a result of
the uncontrolled release from the Montara well head, and to understand the variability of
community composition within the shoals and between these two adjacent shoals. This would
provide the company with information that could be used to design a more detailed and spatially
comprehensive study to detect possible impacts in the event that the Banks and Shoals
component (S5) of the Montara Monitoring Plan developed by the company and DSEWPaC was
formally triggered.
This survey had a high discovery component, since the habitats on these two shoals had not been
investigated before.
In summary, extensive survey sampling across the plateau areas of Barracouta and Vulcan shoals
in April 2010 - conducted 4 months after uncontrolled flow from the Montara H1 well had been
stopped, revealed that: (a) both contained diverse biological communities (b) there were
pronounced differences within and especially between the two shoals in the relative abundance of
dominant groups and (c) there were no obvious signs of a major, recent disturbance. This study,
however, was not designed to detect any smaller or more localized impacts, nor could it
determine if any other shoals in the region have been impacted from the oil release at the
Montara platform.
The cause of the pronounced variability observed between Barracouta and Vulcan Shoals is
unknown, but could be related to disturbance events such as hurricanes, bathymetry, or to the
biology of the dominant organisms (i.e. founder events, clonal reproduction, larval dispersal etc).
While the variability precludes extrapolation of the benthic condition recorded for the two
shoals to others in the region, sampling strategies are suggested (based on the present study) to
accommodate this variability and to be able to better characterise the other banks and shoals in
the Timor Sea.
A series of video transects and still images was captured across the plateau areas of each shoal,
allowing the nature of the biological communities to be characterized. This report documents the
field sampling achieved and the general nature of the seabed habitats, together with results from
broadscale and finer scale analysis of the seabed image data.
The shoals rise steeply from 100-200 m depths on the outer continental shelf and begin to flatten
out into a plateau at around 40-50 m depth. The plateau areas of each shoal cover several square
kilometers at 20-30m depths. Both shoal plateau areas are similar in size, in the range of 10-15
km2 , with Vulcan slightly larger than Barracouta Shoal. Occasional higher ground rises to within
approximately 10 m of the sea surface. The available bathymetry, in the form of Australian
Montara Monitoring Program S5: Barracouta & Vulcan Shoals Heyward et al.
8
mariners‟ charts, proved to be indicative only, so the location and depth of the shoals were based
on soundings acquired during the cruise.
On the shoal plateaus, there is adequate light to support many photosynthetic organisms.
Consequently, the upper shoal areas have the potential to support benthic primary producer
habitat (BPPH). Extensive video survey sampling across the general plateau areas, in depths of 15-
50 m, and subsequent analysis of biota from fine scale seabed images found this to be the case,
with the major habitat types recorded being dominated by varying amounts of photosynthetic
organisms, typically algae, hard coral or seagrass.
Although direct sampling and traditional taxonomic characterization of the biota was not
undertaken, the analysis of video and still images indicate that these shoals support highly diverse
ecosystems. They provide a variety of carbonate substrates, along with fine scale topographic
complexity and support communities typically seen on many coral reefs.
Spatial variability was noted at all scales; within transect, within shoal and between shoals. On
both shoals extensive rubble and rock fields were common and tended to support plants and
smaller invertebrates. These rubble fields were interspersed with lesser areas of consolidated,
low relief reef, patches of coarse sand and isolated coral outcrops. Both shoals supported reef
building corals, seagrass and algae, particularly the calcareous green algae Halimeda spp. However,
there were also significant differences between Barracouta and Vulcan in both the presence and
absence of some important organisms and their relative abundance. Barracouta Shoal supported
abundant algae, especially Halimeda, and very little seagrass. A very extensive and likely
monoclonal field of soft coral, preliminarily identified as Nephthea sp. covered a significant
proportion of the western margin of the shoal. In contrast, Vulcan Shoal was particularly notable
for an extensive and lush field of the seagrass Thallasodendron ciliatum that was not seen on
Barracouta.
A number of potential shoal-type habitats have been identified, solely on available bathymetry,
within 100 km of the Montara platform site. The results reported here provide some guidance
for future sampling, if it is decided to conduct a detailed assessment of possible impact from the
Montara well release.
Our analysis of statistical power indicates that for shoals of similar size and bathymetry to
Barracouta and Vulcan, an initial survey program of 30-40 transects at each shoal should deliver
well characterized habitats and the ability to make comparisons on the abundance and
distribution of dominant biota within and between the shoals. Nonetheless, it should be noted
that if a monitoring program is considered, there is a large variation, depending on location and
habitat type, in the power of this type of sampling to detect changes through time. In this study,
the power analyses show that in order to detect changes in abundance of 20% for dominant biota
in space or time, 3-9 transects in selected major habitat types would suffice, but in some
locations power is much lower. If a particular location was thought to need monitoring then, if it
was highly variable or the organisms of interest were low in abundance, alternative sampling
methods with greater spatial precision would be needed. Consequently a monitoring program
design would depend on the question and the biota of interest. For example algae, which were
more widely and evenly distributed, require less sampling intensity than the more patchily
distributed corals or less commonly observed sponges.

Montara Monitoring Program S5: Barracouta & Vulcan Shoals Heyward et al.
9
Background
The Montara Well Head Platform (MWHP) uncontrolled release (21 August – 3 November
2009) occurred within the North West Shelf marine biogeographic province defined within the
„Integrated Marine and Coastal Regionalization of Australia (IMCRA): ecosystem-based
classification scheme for marine and coastal environments‟ (IMCRA 2006). Within the province there are many submerged and emergent reefs and cays along the outer edge of the continental
shelf extending from the Lydoch and Troubadour Shoals in the Arafura Sea (north of Darwin) to
the Rowley Shoals north-west of Broome. This 246,404 km2 area is also referred to as the
Oceanic Shoals (OSS) meso-scale region within the IMCRA classification (IMCRA 2006). The
limits of this region are nominated as lying between 18° South and 119° East, and 10° 30‟ South and 131° East.
The banks and shoals of the OSS may have once constituted an intermittent barrier reef prior to
being buried by rising sea levels (IMCRA 2006) and have a floral and faunal composition similar to
the emergent oceanic reef systems. However, due to the remoteness of the meso-region most of
the banks and shoals are either unstudied or poorly characterized. The lease operator PTTEP
Australasia (Ashmore Cartier) Pty Ltd (PTTEPAA) requested a preliminary assessment of
benthos on the tops of Barracouta and Vulcan Shoals, two submerged shoals within 100 km of
the MWHP (see Figure 1), that were likely to lie under the area covered by some components of
the Montara spill. The purpose of this survey was to provide preliminary data as a pilot study to
aid in planning, should a broader assessment of the numerous shoals in the region be required as
a result of a formal triggering of component S5 of the Montara Monitoring Plan, (PTTEPAA
2009).
Methods
Location
Barracouta Shoal, 124 2.011 E 12 32.837°S lies approximately 55 km west of the MWHP site
and chart AUS314 indicates the shallowest depth is 10.2m. Vulcan Shoal, 124 16.986 E 12
48.217°S, lies approximately 27 km south-west of Montara West Atlas rig site and chart AUS
314 indicates the shallowest depth is 9.5 m (see Fig. 1).
These two shoals are poorly described, with limited available bathymetric data and no biological
descriptions. Both shoals are somewhat elliptical in outline, with the long axis running
approximately east-west. They have similar dimensions across the plateaux areas, when measured
at the nominal 50 m depth contour, with Barracouta 5.0 km long x 2.4 km wide and Vulcan 6.4
km long x 2.6 km wide,. Consequently these shoals provide 12-16 km2 of substrate at depths
which, based on AIMS observations elsewhere in the region, could potentially support light
dependent benthic communities.

Montara Monitoring Program S5: Barracouta & Vulcan Shoals Heyward et al.
10
Figure 1. Location of study sites in relation to modeled relative exposure map of the oil spill.Image of the spill developed by Asia-Pacific ASA in another of the independent studies triggered under the monitoring plan developed by the company and DSEWPaC and released by the agency. This is a relative exposure map representing up to 99.9% of occurrences of visible surface oil associated with the Montara incident. It is important to note that the area shown does not represent the extent of any oil slick observed at any time during the spill incident. It is a summation of the area within which isolated patches of oil and wax were observed by aerial or satellite observations and oil spill trajectory modeling.
Field sampling
The tops of Barracouta and Vulcan Shoals were surveyed using towed video and still camera
imagery. A minimum of 15 tows was desired for each shoal. The AIMS Towvid system comprises
a towed camera platform sending a live camera feed to a vessel-based image classification system
(see Colquhoun et al. 2007, Fry et al. 2008).
The towed platform supports a forward facing video camera with lights, together with a
downward-facing high resolution still camera and strobe system programmed to take sequential
still images at fixed time intervals (Fig. 2). The towed platform was deployed over the stern of the
vessel, maintained within a meter of the seabed and towed at 1-2 knots (1.5 nominal) until a
distance of about 500 m or more has been covered in a continuous line transect. On the vessel, a
computer-based Towvid program manages collation of position, depth, and operator-derived
habitat classification data, which is captured in real time as an operator interprets the live video
feed and then archived for subsequent spatial analysis (Fig. 3). At the completion of a transect the
tow platform was retrieved to the vessel deck, still camera images downloaded and the camera
systems serviced as required while the vessel steamed to the next transect station. The location
of each transect was nominal, in the absence of any guiding habitat information and somewhat
poor bathymetry from the available charts (AUS 314 Timor Sea, Sahul Banks navigation chart).

Montara Monitoring Program S5: Barracouta & Vulcan Shoals Heyward et al.
11
Priority was given to surveying the shallow plateau regions of each shoal, identified by monitoring
the live soundings, which tended to drop away quickly beyond 30-40 m depths.
Figure 2. Towed body used for all transect surveys. A forward facing video camera (VC) provides live images to the ship, allowing the towed body to be “flown” just above the seabed while marine scientists classify the habitats. Positioned at the rear of the towed body a high resolution still camera (SC) with strobe takes downward facing, detailed images of the seabed every 5 seconds, for use in later analyses.
Figure 3. The AIMS towvid system in use on board the research vessel RV Solander during the survey. Live video is classified directly into a computer, with the observer keying in the appropriate classification from a variety of pre-programmed major habitat types, along with the associated data on position and depth. The video and this associated data are also recorded to tape and archived.
VC
SC & Strobe

Montara Monitoring Program S5: Barracouta & Vulcan Shoals Heyward et al.
12
Data analysis
The AIMS Towvid program exports the data in a simple text format, as three comma separated
values (CSV) files. The first of these is formatted to be imported directly into access for
subsequent data management and storage. The second contains the header information, whilst
the third is formatted for direct import into ArcGIS and includes a layback calculation to account
for the angle and the distance of the towed body behind the boat. All the AIMS towvid
observations for each transect were imported into ArcGIS directly for subsequent analysis and
visualisation. Each point observation, recorded at 2 second intervals along the transect, was
colour coded according to the dominant benthic group recorded by the observer, then displayed
accordingly to create a colour coded transect classification. This broadscale classification was
overlaid on a background map of the shoal bathymetry derived from the AUS 314 chart (see Figs.
8 and 9). This type of visualisation allows for rapid assessment of any major spatial patterns of the
dominant benthos and can be useful in identifying general features, such as large areas of unusual
habitat, transition between different types of habitat or general zones where particular benthic
groups such as corals, algae or seagrass predominate.
The semi-qualitative nature of the broadscale classification has limitations, particularly as only the
most dominant benthic group is recorded. This is particularly constraining in complex mixed
habitats, as significant but minor components of the biota are not represented in the real-time
classifications, leading to potential bias and loss of detail, and no quantitative information is
provided on the mixture of biota that are present. Furthermore, when classifying according to
dominant benthic groups the abundance of the major groups is only relative, with somewhat
arbitrary divisions between low, medium and high density estimates assigned by the observer in
real time. Nonetheless, the rapid acquisition of broad scale data does facilitate initial
characterization of habitat patterns and aid in selecting subsets of more detailed imagery from the
still camera for finer scale analysis and rapid reporting (see Heyward et al. 2010). A fine scale
analysis of the relative abundance of key biota is desirable in order to better understand the
complexity of habitats and allow better spatial discrimination within and between the shoals. This
type of analysis is best done using high quality still images, which allow reliable characterization of
different biota at a high taxonomic resolution. In this study, a spatially standardized subset of the
still images from each survey transect has been used to provide a fine scale analysis of the biota.
There were 21 survey transects at Barracouta Shoal and 20 at Vulcan Shoal (Appendix 2). While
the preliminary report (Heyward et al. 2010) drew on data from the towed video and more
detailed image analysis from a small subset of transects, in this report the analyses have focused
on the quantitatively more robust and detailed dataset obtained from a full analysis of still images
from all transects. This consists of point intercept data from a spatially standardized set of still
photos, approximately 10m apart, collected along all transects for each shoal.
Still photo analysis
The still photo images for all transects were geo-referenced, based on corrected tow platform
position data and time code synchrony, prior to being sub sampled at a standardized spatial
separation then grouped for detailed point-intercept analysis. Based on previous experience of
benthic habitats in the OSS60 meso-scale bioregion (Heyward et al. 1997, Heyward and Rees

Montara Monitoring Program S5: Barracouta & Vulcan Shoals Heyward et al.
13
1999), a sub sampling interval of 10 m along each selected transect was chosen to minimize the
chance of autocorrelation between sequential images. This resulted in groups of 35-42 images per
transect being further analyzed. Consequently approximately 800 images were analyzed at each of
these shoals.
In each image the relative abundance of key biota, such as corals, algae or seagrass were
quantified using point-intercept software CPCe (Version 3.4, Kohler and Gill 2006); and sampling
20 points per image. The classification scheme used is attached as Appendix 1. A stratified
random sampling protocol was used (see Fig. 7), with the data for each image being saved to
Microsoft Excel. The images and analytical data used for this report, along with associated
position and depth information for each image is attached as Appendix 3, (see included DVD)
Cluster analysis and heatmaps
Comparison of similarities in the abundance of major biological groups between shoals and
between transects within each shoal was undertaken, using a bootstrapped cluster analysis of the
entire still photo transect data, to identify distinct habitats. This is a fairly conservative method
but highlights major habitat groups on each shoal. The cluster analysis (complete linkage) was
based on Hellinger transformed distance matrix (see Legendre and Gallagher 2001) of the major
benthic groups, which is an ecologically meaningful transformation appropriate for community
composition data.
The resulting cluster shows groupings between transects at various levels of similarity. To aid
interpretation of these patterns, each cluster has also been expressed in association with a
heatmap, labeled with correlation statistics (R-sq) for each major benthic group‟s influence on an
individual transect. This provides a visual tool with which to quickly identify transects or groups
of transects which group together because of one or more of the major benthic groups. In the
heat map matrix, the cells have been coloured coded from dark red, which is low or no
correlation, to yellow/white which is highly correlated.
Power analysis
A power analysis was conducted to determine the optimal number of transects required to
detect change a 20 % change in major benthic cover with a confidence level of 95%. This was
conducted using high resolution still photos for coral, algae, soft coral, sponge, other, seagrass
and abiotic substrate (i.e. groups that can occur with point cover estimates greater than 10%).
The 20 % threshold with 95% confidence was used as it‟s commonly adopted as a benchmark for benthic cover change (reviewed in Quinn and Keough 2002).
This analysis was conducted based on consecutive pair runs (Quinn and Keough 2002; Dupont
2008; Zar 1998). The benthic cover data derived from photos taken at 10 meter intervals along
each transect. Each analysis was run for n=300 (n equaling number of photos). In this study we
analyzed ~35-40 photos per transect, so an “n” of 300 approximates 9 transects of nominal 500
m length.

Montara Monitoring Program S5: Barracouta & Vulcan Shoals Heyward et al.
14
Assumptions of the analysis were:
1. Both shoal plateaus contain several major and somewhat distinct and discreet habitat
types (defined by cluster analysis, the types are different for each shoal)
2. The transect with photos identified are and adequate and representative sample of cover
for each substrate group on each shoal.
3. Projection of sample size beyond n=300 assumes the coefficient of the slope remains
constant (with no asymptote) until power is equal to 1.
4. Poisson distribution of errors.
Figure 4. Example of the towvid transect still image sub-sampling approach – the georeferenced transect track plot is show on the left. The time-based position data from the track file is used to georeference the associated still images taken along the track (middle image). For the analyses in this report a subset of images at a nominal spacing of 10m along the transect is then selected (right hand image) and used for point intercept analyses of benthic cover (see Fig.5 below).

Montara Monitoring Program S5: Barracouta & Vulcan Shoals Heyward et al.
15
Figure 5. Fine scale image analysis - individual still photos at 10m spacing were analysed for percent cover of dominant organisms using a stratified random point intercept protocol, with 20 points per image (yellow letter symbols which change to blue once classified). The classification scheme applied is included as Appendix 1.
Results
Rough seas prevented deployment of any vessel tender and subsequent capture of additional
drop camera stills, with heaving of the main ship also leading to three tow cable breakages during
the survey. Nonetheless an adequate number of tow transects, delivering both video and still
images were completed. In total, 20 tows of 500m+ were captured at Vulcan Shoal and 21 tows
at Barracouta Shoals. These tows produced real-time habitat observations (6978, Barracouta;
6826, Vulcan) based on video observation, associated with location and depth. These data when
integrated into ArcGIS and colour coded for major habitat types indicated that the broad central
plateau areas of both shoals supported a mixed benthic community, in which there was
considerable spatial variability at 10-100m scales along each transect, but where bare substrate
was common, algae or seagrass could be important in many areas and corals were patchy and
localized (see Figs. 6 and 7). In addition, each tow captured in the order of 80 high resolution
stills, with the exception of 1 tow where battery failure disabled a camera and another where
some incident, probably an impact on the tow platform due to heavy weather, disabled the still
camera mid-tow. In addition, a short series of panoramic drop camera images were obtained
from the RV Solander at the conclusion of each shoal survey.

Montara Monitoring Program S5: Barracouta & Vulcan Shoals Heyward et al.
16
Figure 6. Barracouta Shoal -Location of survey transects and initial habitat classification of epibenthos, based on towvid data, for the top of Barracouta Shoal. This shoal has a ubiquitous presence of low to medium density calcareous green alga Halimeda, with some patchy but occasionally dense live coral. A very extensive field of soft coral on the western margin is a noteworthy feature. The 50m contour line shown is nominal, based on overlay of the data on the bathymetry shown in chart AUS 314.

Montara Monitoring Program S5: Barracouta & Vulcan Shoals Heyward et al.
17
Figure 7. Vulcan Shoal - Location of survey transects and initial habitat classification of epibenthos, based on towvid data, for the top of Vulcan Shoal. This shoal has an extensive presence of low to medium density seagrass with some moderate to high density live coral around the shallower ground towards the western end. The 100 m depth contour line shown is nominal, based on overlay of the data and bathymetric from chart AUS314.

Montara Monitoring Program S5: Barracouta & Vulcan Shoals Heyward et al.
18
Broad scale characterization of habitat types from video
Both shoals have abrupt bathymetry, rising steeply from the surrounding shelf to horizontal
plateaux areas mostly 20-30 m deep, but with occasional elevated areas. The outer rim areas
slope more quickly at 40-50 m before plunging steeply to >100 m. This survey concentrated on
an assessment of the shoal plateaux. Shoal substrate types could be broadly summarised as small
patches of coarse sand, extensive fields of rubble and rocks (Fig. 15), limited areas of low relief
consolidated reef (Figs. 13 and14) and occasional isolated rock or live coral outcrops (Fig. 16).
Both shoals had very similar major classes of substrate, although proportions varied between the
shoals, with Barracouta having more than twice as much consolidated low relief reef substrate
(21%) as Vulcan (8%), but also more sand dominated areas (3% vs1%) (see Fig. 8). The substrate
on both Barracouta and Vulcan was predominantly rubble and stones mixed with coarse sand
(59-70% cover respectively, see Figs. 8 and 15) of varying density, covered in smaller plants and
invertebrates. Coarser rocky (>250mm), or low relief (<1m) reef areas with isolated
consolidated lumps, made up the bulk of the remaining area. Phototrophic benthos typical of
tropical coral reef areas was predominant (Figs. 12-19). Areas exclusively dominated by dense
hard coral were relatively rare, representing less than 1% of total observations and occurring in
small patches, but low to moderate density hard coral habitat was very common, especially mixed
with other biota. Coral was present as the sole dominant organism type in <10% of towed video
observations on either shoal, but occurred mixed with Halimeda or filter feeders in 47% of
observations on Barracouta Shoal and 34% of observations on Vulcan Shoal (Table 1). There was
a notable and ubiquitous presence of Halimeda, with variable abundance especially throughout the
rubble regions. The seagrass Thalassodendron ciliatum was also present on both shoals, although
insignificant on Barracouta while being a feature of Vulcan and the dominant organism in 36% of
observations. This was not evenly distributed, with an extensive meadow of dense grass at the
eastern end of Vulcan Shoal representing particularly strong presence of this plant. This spatially
dominant feature was mirrored by a similar extensive patch of soft coral on the western end of
Barracouta Shoal. No signs of bleaching or recent mortality were observed in the stony corals.
The biota was very diverse, particularly in the more structurally complex rocky and low relief
reef areas, where moderate to high cover of algae, corals and filter feeders was frequently
encountered (see Figs. 13 and 14). On both shoals multiple transects were typified by a mix of
algae, hard corals and filter feeders. Calcareous red and green (Halimeda) algae were the
dominant plants on Barracouta Shoal, while on Vulcan Shoal a mix of algae featured, with
Halimeda also important and the stemmed seagrass Thalassodendron cilatum common (Fig. 17). In
addition a small photosynthetic ascidian, nominally Lissoclinum sp., made an important
contribution to the overall benthic community and was a dominant component in a few places
(Fig. 19)
Bare sand or rubble patches were a very important component of these shoals, but the majority
of survey transects across the central plateaux encountered moderate to high levels of benthic
life. There was some indication of higher levels of bare substrate, particularly sand, on those tows
that ventured s into slightly deeper water off the edges of the shoal plateaux. Barracouta Shoal
had more bare sand but also consolidated low-relief, or reef-like, substrate than Vulcan Shoal
(Fig. 8 and Table 1). These consolidated areas supported a richer coral community and generally

Montara Monitoring Program S5: Barracouta & Vulcan Shoals Heyward et al.
19
were covered with macroscopic invertebrates or encrusting red algae, interspersed with algae,
particularly Halimeda. Large coral outcrops higher than 1m were rare, although occasionally
encountered (see Fig. 12). The most abundant biota were organisms which are dependant on
light, such as the various algae, corals, and seagrass. Filter feeders, such as sponges and soft
corals, were in general a lesser component, although small upright soft corals were widely
distributed and had a spectacular presence with the large field of Nepthea on the western end of
Barracouta Shoal.
The extensive rubble fields, mainly consisting of golf-ball to tennis-ball sized stones and
rhodoliths*, are an important habitat. Organisms that can utilised this substrate , such as seagrass,
the small ascidian Lissoclinum, the calcareous alga Halimeda and some soft corals, may form an
important component of the habitat. It is not clear if asexual propagation or highly localised and
intense recruitment is responsible for the dense patches of these biota.
* - rhodoliths are unattached red algal which have an outer layer, of varying thickness, of crustose
coralline algae. As these are moved around by currents they may rotate, allowing the encrusting
algae to grow on a new surface. Continual turnover of the stone and deposition of calcareous
material on all sides gradually builds up the size of a rhodolith.

Montara Monitoring Program S5: Barracouta & Vulcan Shoals Heyward et al.
20
Table 1. Dominant benthic groups at Barracouta and Vulcan Shoals –classification of major biotic groups based on real-time towvid data from all transect tows shown in Figs. 6 and 7.
Figure 8. Dominant substrate groups at Barracouta and Vulcan Shoals –classification of substrate based on real-time towvid data from all tows shown in Figs. 6 and 7. HR Reef= high relief reef, LR Reef=low relief reef <1m high.

Montara Monitoring Program S5: Barracouta & Vulcan Shoals Heyward et al.
21
Quantitative broadscale patterns from point intercept analysis
In comparison to towed video classification, point intercept data from post-processed still images
is much slower to acquire, but it provides an opportunity to extract more detail on the variety of
biological attributes and delivers robust measures of abundance and associated levels of variation.
In this analysis of the transect still images a classification table discriminating 15 types of coral and
11 types of algae was applied (see Appendix 1 Table 1a). The raw classification data, in the order
of 15,000 points per shoal, has been used in all statistical analyses, but has been aggregated into
major biological groups at transect and shoal level for presentation of broad scale patterns. The
complete raw data results and individual images, along with associated position and depth data
are included as 3a & 3b in the companion DVDs.
The mean abundance of the major benthic groups such as, Coral, Algae, Soft coral, Seagrass and
Sponges are shown for each survey transect on the individual shoals (Figs. 9 and 10, Tables 2 and
3). Three additional data groups, Other, Indeterminate and Abiotic captured most remaining
biotic and abiotic categories. “Other” records a mixed group of other organism, including
ascidians and bryozoans. “Indeterminate” (Indet) captures data points in the analysis which, due
to inadequate image quality, could not be assigned to any category with confidence. Points under
which bare substrate, devoid of any obvious biota was discernible were recorded as “Abiotic”.
Most points could be assigned to one of the major biological categories or to Abiotic, although
on average around 3% of points remained as Indeterminate (see Appendix 1, Table 1a for the full
list of classifications).
On Barracouta Shoal most transects contained low to moderate levels of most of the major
biological groups (Fig. 9), although transects 10 and 14 were strongly dominated by soft coral and
abiotic habitat respectively. The abiotic habitat type, largely rubble and areas of bare coarse sand,
were the major component of all transects with the exception of transect 10, which represents
the extensive and dense field of Nepthea soft coral at the western edge of the shoal (see Fig. 12).
Algae of several types, mostly green and red forms, were present on all transects and typically
occupied 20-30% of the substrate, while hard corals were much less ubiquitous, but covered
close to 20% of the seabed on 6 of the 21 transects (Table 2). Soft corals and sponges were
widespread but progressively less important in general in terms of abundance.
On Vulcan Shoal, bare sand and rubble substrate, classified as Abiotic, was similarly the most
significant category overall, but less dominant than on Barracouta (Fig. 10). Overall biological
coverage was higher on Vulcan Shoal, with the ubiquitous presence of algae augmented by large
amounts of the seagrass Thallasodendron ciliatum. This tropical seagrass was recorded on almost
all transects, rivalling or exceeding the abundance of algae on 6 of the 20 transects and being the
dominant biological group on 2 transects with in excess of 36% cover (see Table 3). Hard coral
was widespread, recorded on all transects, but frequently at levels below 5% cover. Only two
transects exceeded 10% coral cover, supporting 14% & 23% cover. Soft corals were greatly
diminished in abundance on Vulcan compared to Barracouta Shoal, with some recorded on all
transects but typically at mean levels of <2%. This mirrors the sort of levels seen for sponges on
Barracouta, whereas on Vulcan Shoal sponges were a much more important group, with many
transects supporting 5-10% cover of sponges and 4 close to 12-13% (Tables 2 and 3). A peculiar
additional component recorded on almost all transects at Vulcan Shoal, was the strong presence

Montara Monitoring Program S5: Barracouta & Vulcan Shoals Heyward et al.
22
of a small green ascidian, most likely Lissoclinum pliatum, which was the major organism
contributing to the “Other” category in Table 3.
Figure 9. Barracouta Shoal – comparison of mean abundance, expressed as a percent of total benthic cover, for major benthic categories on each survey transect.
Table 2. Barracouta Shoal - Mean abundance values for Figure 9 above, expressed as a percent of total benthic cover, of major benthic categories for each survey transect. Data used to calculate these means, including calculated standard errors, are included in 3 on the accompanying DVD.
Barracouta Shoal
Transect Latitude Longitude algae seagrass hard coral soft coral sponge other indet. abiotic
BS-1e -12.53992 124.03725 24.16 0.00 10.42 2.43 2.56 0.62 2.37 57.30
BS-2 -12.54698 124.02938 31.36 0.00 20.02 6.78 2.65 0.53 2.86 35.38
BS-4 -12.54965 124.04418 33.91 0.00 5.31 3.75 1.72 0.16 0.94 54.22
BS-5 -12.54495 124.04743 9.88 0.00 0.00 10.95 0.95 0.24 0.36 77.62
BS-6 -12.54158 124.04040 37.67 0.00 8.67 2.17 2.00 0.33 4.17 45.00
BS-7 -12.54448 124.04088 22.40 0.00 9.45 2.29 2.56 0.40 2.83 59.92
BS-8 -12.55423 124.03432 26.29 0.00 9.15 4.33 2.50 0.33 4.49 52.75
BS-9 -12.55065 124.02668 27.02 0.00 15.48 8.33 2.02 0.48 4.52 42.14
BS-10 -12.54310 124.03002 34.96 0.00 18.84 8.17 3.18 0.23 3.06 31.44
BS-11 -12.54530 124.01850 5.59 0.00 0.29 85.59 0.00 0.29 0.29 7.94
BS-12 -12.55113 124.02252 22.84 0.00 1.17 19.47 0.44 3.95 4.10 47.58
BS-13 -12.54715 124.02130 27.92 0.00 6.25 7.08 1.67 5.83 4.86 46.39
BS-14 -12.54218 124.02390 25.91 0.00 22.81 10.19 1.66 0.44 3.77 34.88
BS-15 -12.53840 124.03022 4.88 0.00 2.77 0.33 1.55 0.55 1.55 88.24
BS-16 -12.54162 124.03597 30.00 0.00 12.63 3.63 2.50 0.25 4.63 46.38
BS-17 -12.54715 124.03938 25.70 0.00 18.54 4.22 3.45 0.64 2.43 44.76
BS-19 -12.55165 124.03023 31.63 0.00 15.88 9.53 1.52 1.20 5.25 34.94
BS-20 -12.55018 124.02387 27.17 0.00 9.58 8.68 2.14 1.24 5.64 44.76
BS-21 -12.54217 124.03305 22.51 0.00 18.86 4.01 4.14 0.73 1.34 48.18
BS-22 -12.54897 124.03405 23.87 0.00 19.56 8.40 5.52 0.55 4.64 36.91
Montara Monitoring Program S5: Barracouta & Vulcan Shoals Heyward et al.
23
Figure 10. Vulcan Shoal – Comparison of mean abundance, expressed as a percent of total benthic cover, for major benthic categories on each survey transect
Table 3. Vulcan Shoal - Mean abundance values for Figure 10 above, as a percent of total benthic cover, of major benthic categories for each survey transect. Data used to calculate these means, including calculated standard errors, are included in Appendix 3 on the accompanying DVD.
Vulcan Shoal
Transect Latitude Longitude algae seagrass hard coral soft coral sponge other indet. abiotic
VS-1 -12.80192 124.25575 18.14 0.00 2.35 1.11 3.60 8.31 1.94 64.27
VS-2 -12.79908 124.26085 17.85 1.66 9.42 3.99 7.54 11.64 4.55 43.13
VS-3 -12.80028 124.26633 14.29 0.18 23.08 4.21 2.75 10.07 3.66 40.66
VS-4 -12.79528 124.27117 29.68 14.96 7.36 0.50 7.98 12.97 4.99 21.32
VS-5 -12.80125 124.27302 17.58 1.25 4.11 2.00 5.36 33.54 7.86 28.05
VS-6 -12.80688 124.27080 13.14 22.60 4.60 0.39 11.83 9.07 7.88 30.35
VS-7 -12.80180 124.28162 25.70 36.18 4.63 0.85 0.97 8.28 2.92 20.34
VS-8 -12.80527 124.28732 22.32 13.01 14.03 6.12 4.21 11.61 2.42 25.77
VS-9 -12.80018 124.29163 27.60 26.41 5.39 0.79 4.47 15.64 5.78 13.80
VS-10 -12.80382 124.29610 28.75 5.09 4.45 1.15 6.36 23.28 6.23 23.92
VS-11 -12.80558 124.30305 18.87 36.94 4.35 0.16 1.94 18.06 6.29 13.39
VS-12 -12.80883 124.29247 32.01 2.35 1.76 0.44 6.31 27.02 3.82 26.14
VS-13 -12.80792 124.27500 19.63 21.05 5.41 1.00 12.23 12.38 4.84 23.04
VS-14 -12.81113 124.28232 16.98 25.88 6.47 0.94 6.33 12.67 3.64 26.82
VS-16 -12.80753 124.26217 20.29 0.00 1.47 0.29 7.94 7.50 4.71 57.79
VS-17 -12.81143 124.27157 25.68 0.15 2.11 0.45 13.14 11.63 4.23 42.30
VS-18 -12.81502 124.28715 26.71 5.66 7.11 1.71 0.66 0.00 1.84 56.32
VS-19 -12.81350 124.29700 20.17 0.24 5.93 0.95 8.78 10.32 2.25 51.01
VS-20 -12.79508 124.26413 22.54 1.93 5.80 2.01 13.20 12.00 2.09 40.26

Montara Monitoring Program S5: Barracouta & Vulcan Shoals Heyward et al.
24
After aggregating the fine scale data for each shoal, it is clear that the broad scale benthic
communities have marked differences in the relative contributions of the major groups. While
bare areas (Abiotic) are very significant on both shoals (Fig. 11), the biological cover exceeds
50%. Taken as a whole these shoals both support rich benthic communities, dominated by
primary producers. Of these, the plants are overwhelmingly important, in particular the
calcareous green alga Halimeda and various encrusting red algae. In addition, seagrass makes a
major contribution to the benthic habitats of Vulcan Shoal and is a key point of difference with
Barracouta Shoal (see Fig. 11), although traces amounts were also seen there. The two shoals
differed in the comparative abundance of sponge, soft coral and hard coral. The presence of
extensive dense soft coral at the western end of Barracouta was mirrored by the dense seagrass
meadows across the north-east of Vulcan.
Mean hard coral cover at Barracouta Shoal was 11%, almost twice that of Vulcan Shoal. While
both shoals had single transects supporting up to 23% live coral (Tables 2 and 3), Barracouta had
many more with similar abundance, suggestive of a more extensive coral zone. The greater coral
cover on Barracouta Shoal was associated with more abundant consolidated substrate, in the
form of low relief reef (Fig. 8). This coral community was also more diverse, with a greater array
of Acroporid morphotypes recorded (Fig. 11).

Montara Monitoring Program S5: Barracouta & Vulcan Shoals Heyward et al.
25
Figure 11. Barracouta and Vulcan Shoals- major benthic groups- comparative abundance estimates of major benthic groups, expressed as mean percent cover of the seabed. These data are based on the complete point intercept analysis of photos on all transects surveyed on each shoal (n≈ 15,000 per shoal).

Montara Monitoring Program S5: Barracouta & Vulcan Shoals Heyward et al.
26
Examples of common habitat types
Figure 12. Barracouta Shoal: soft coral field with coral bommie in the background. This small species of soft coral, a provisional Nephthea species, extended as a dense cover over hectares at the western shoal margin.
Figure 13. Barracouta Shoal: coral-Halimeda-filter feeder mixed habitats were frequently encountered on rocky and low relief reef areas.

Montara Monitoring Program S5: Barracouta & Vulcan Shoals Heyward et al.
27
Figure 14. Barracouta Shoal – low relief consolidated reef and broken rock areas could support very diverse biota.
Figure 15. Barracouta Shoal –extensive rubble zones were encountered, with encrusting red algae commonly forming fields of rounded rhodoliths, which were intersperse with Halimeda and occasional bare sand patches.

Montara Monitoring Program S5: Barracouta & Vulcan Shoals Heyward et al.
28
Figure 16. Barracouta Shoal –isolated outcrop amidst coarse sand and rubble. Sandy patches were found across the shoal plateau but appeared to be more common and extensive towards the rim areas in 40m depths.
Figure 17. Vulcan Shoal – dense seagrass Thalassodendron ciliatum was a notable feature on parts of this shoal.

Montara Monitoring Program S5: Barracouta & Vulcan Shoals Heyward et al.
29
Figure 18. Vulcan Shoal –seagrass, algae and corals were encountered mixed together in a number of locations.
Figure 19. Vulcan Shoal - A small photosynthetic ascidian, very similar in appearance to Lissoclinum bistratum Sluiter, mixed with the calcareous green alga Halimeda. This ascidian was abundant and formed dense patches on some parts of Vulcan Shoal, possibly due to very localized recruitment

Montara Monitoring Program S5: Barracouta & Vulcan Shoals Heyward et al.
30
Fine scale patterns and patchiness
While it is clear that there are differences in major benthic groups at transect and whole shoal
scales, spatial variability was also a persistent feature within each survey transect. It was rare to
find even the dominant biological group remaining unchanged over more than 10 m intervals, and
subdominant components of the community were continually changing at even finer scales.
Figures 20 and 21 prove an illustration of the sorts of spatial variability in major biological groups
encountered at 10m intervals along four transects at each of the two shoals. These transects
were selected as representative of four broader habitat types, including highly dominated ones
such as the soft coral meadow on Barracouta Shoal or seagrass field on Vulcan Shoal (Fig. 20, BS-
11; Fig. 21, VS-11) to more complex mixed communities (Fig. 20 BS-7; Fig. 21, VS-3). It is clear
that most habitats at scales of tens of metres, have quite variable contributions from the major
biological groups, but that those groups present tend to be recorded more often than not in
sequential images along the 500 m transect.
The similarity between these benthic communities were explored with cluster analyses of all
transect point intercept data. A bootstrapped analysis, indicated two very robust groups of
transects at Barracouta Shoal (Fig. 22), which consisted of three deeper transects located
towards the outer shoal rim (Fig. 24) that had above average amounts of soft coral and very little
hard coral (Fig. 23). Of the remaining large group of 18 transects, distributed across the main
plateau area of the shoal, a further group of transects was associated with areas where algae
were slightly more important (BS-4,6,13) versus more abundant hard and soft corals. The
comparative importance of these major benthic biotic groups is provided in the Barracouta Shoal
heatmap (Fig. 23). There is some suggestion from these analyses that the slightly shallower
transects located around the central apex of the shoal contain the most hard and soft coral (see
Fig. 24). Transects coded Blue and Green in Figure 24 have equivalent amounts of algae (26-28%),
but the Blue transects, which lie across most of the central plateau, have more hard and soft
coral (18.8 ± 0.8% and 7.5 ± 0.8% respectively) than the surrounding Green transects (10.3 ±
0.6% and 4.3 ± 1.2% respectively). Nonetheless, as the mean transect depths are not tidally
corrected and the overall shoal bathymetry is very limited the association of higher coral cover
with shallower depths cannot be rigorously tested at present.
At Vulcan Shoal the cluster analysis (Fig. 25) shows two very distinct groups of transects, each
containing a number of subgroups. The principal benthic group forcing this high level grouping is
seagrass, which is a key component of all 8 transects in one of the major groups (see Heatmap,
Fig. 26). The high seagrass group has a mean percent cover of 24.63 ± 3.09 (mean ± SE) whilst
the remaining group of transects contain little seagrass (1.68 ± 0.61) and more bare substrate
(43.8 ± 4.04 versus 21.85 ± 2.14). Both clusters are characterised by a similar mix of algae (6.53 ±
1.13 versus 6.15 ± 1.85), hard coral (21.74 ± 1.99 versus 22.18 ± 1.64), soft coral (1.34 ± 0.69
versus 1.66 ± 0.41) and sponge (6.25 ± 1.49 versus 6.88 ± 1.18). Consequently, the exception of
the additional seagrass, this group of transects is not particularly different to the rest of the shoal
in terms of other biota (Fig. 26.). However, as the seagrass is additional to these other major
groups, the overall live benthic cover is higher (see Fig. 10). Consequently, the seagrass
dominated transects appear to be especially rich in benthic life. These seagrass transects are

Montara Monitoring Program S5: Barracouta & Vulcan Shoals Heyward et al.
31
mostly located on the central and northeast areas of the shoal, with some indication that these
generally lie across shallower areas (Fig. 27).
When looking at the finer detail of the cluster analysis, the seagrass dominated group (cluster 1,
Fig. 27) is broken into three groups; the first characterised by relatively high seagrass cover
(33.17%) and macroalgae (24%); the second by a greater presence of sponge (10.13%); and the
third characterised by lower seagrass cover (14.96%) but high macroalgae (29.68%). The
remaining major group, which has little seagrass (Fig.27, Cluster 2 as indicated by dotted line) is
broken down into four groups; the first characterized by macroalgae (26.71%) and bare substrate
(56.32%); the second characterized by ascidians (27.95%); the third by higher hard coral cover
(23.08%); and the fourth by the presence of sponges (9.03%).
A final Cluster analysis, using data combined from all transects (Fig. 28), demonstrates the
distinctive nature of the benthic communities on both shoals. While a few transects group most
closely with those found on the other shoal, overwhelmingly the benthic communities on each
shoal are coherent and more related to each other than to the adjacent shoal.

Montara Monitoring Program S5: Barracouta & Vulcan Shoals Heyward et al.
32
Figure 20. Barracouta Shoal - examples of fine scale patchiness and habitat heterogeneity along four transects representing different habitat types. Each pie disk summarizes the results of image analysis for an individual photoquadrat (n=35-42) at 10m intervals along the transect. Colour groups indicate hard corals (red-orange), soft corals (purple-pink), sponges (blues), plants (greens) or bare substrates (greys).

Montara Monitoring Program S5: Barracouta & Vulcan Shoals Heyward et al.
33
Figure 21. Vulcan Shoal – examples of fine scale patchiness and habitat heterogeneity along four transects representing different habitat types. Each pie disk summarizes the results of image analysis for an individual photoquadrat (n=35-42) at 10m intervals along the transect. Colour groups indicate hard corals (red-orange), soft corals (purple-pink), sponges (blues), plants (greens) or bare substrates (greys).

Montara Monitoring Program S5: Barracouta & Vulcan Shoals Heyward et al.
34
Figure 22. Cluster analysis (complete linkage) based on Hellinger transformed distance matrix for major benthic biotic groups found on Barracouta Shoal transects. Two robust groups (outlined in red) are identified using bootstrapped significance calculation. Iterations =1000.

Montara Monitoring Program S5: Barracouta & Vulcan Shoals Heyward et al.
35
Figure 23. Barracouta Shoal - Heatmap and cluster analysis (complete linkage), row and column ordered, based on Hellinger transformed distance matrix for major benthic biotic groups found on Barracouta Shoal transects. Cell values are labeled with correlation statistic (R-sq). This cluster analysis varies slightly from the bootstrapped analysis shown in Figure 22, as it is the result of a single analysis and was not bootstrapped. It is presented here primarily to aid interpretation of which major benthic groups are influencing the grouping of transects. The lighter the colour in each box the greater the degree to which that class of benthos is associated with a particular transect. A purple box has been overlaid to indicate how this type of map can be used to clarify which major benthic group has a significant effect on the grouping. In this example the purple box highlights a group of transects with tended to contain hard coral as a significant component.

Montara Monitoring Program S5: Barracouta & Vulcan Shoals Heyward et al.
36
Figure 24. Barracouta Shoal - Spatial distribution of similar transects, based on cluster analysis above. Mean depth data is also shown under each transect in the cluster. The degree of similarity, using the Hellinger distance matrix, has been colour coded, with similar transect groups shown displayed in similar colour tones, e.g., blue tones versus green or yellow tones. The dotted circle encloses a mixed group of transects clustering together, as indicated by the dotted rectangle in the Hellinger matrix. This larger cluster breaks down into two subgroups, those slightly shallow transects around the central apex of the shoal, shown in blue, containing more hard and soft coral than the green transects.

Montara Monitoring Program S5: Barracouta & Vulcan Shoals Heyward et al.
37
Figure 25: Vulcan Shoal - Cluster analysis (complete linkage) based on Hellinger transformed distance matrix for major benthic biotic groups found on Vulcan Shoal transects. Two robust groups (outlined in red) are identified using bootstrapped significance calculation.

Montara Monitoring Program S5: Barracouta & Vulcan Shoals Heyward et al.
38
Figure 26: Vulcan Shoal - Heatmap and cluster analysis (complete linkage), row and column ordered, based on Hellinger transformed distance matrix for major benthic biotic groups found on Vulcan Shoal transects. Cell values are labeled with correlation statistic (R-sq). This cluster analysis varies slightly from the bootstrapped analysis shown in Figure 25, as it is the result of a single analysis and was not bootstrapped. It is presented here primarily to aid interpretation of which major benthic groups are influencing the grouping of transects. The lighter the colour in each box the greater the degree to which that class of benthos is associated with a particular transect.

Montara Monitoring Program S5: Barracouta & Vulcan Shoals Heyward et al.
39
Figure 27. Vulcan Shoal - Spatial distribution of similar transects, based on cluster analysis above. Median depth data is also shown under each transect in the cluster. The degree of similarity, using the Hellinger distance matrix, has been colour coded, with similar transect groups shown displayed in similar colours, e.g. blue tones versus green or yellow tones. The dotted area encloses a group clustering together as indicated by the dotted rectangle in the Hellinger matrix. This larger cluster breaks down into three subgroups, those slightly shallow transects around the central apex of the shoal, shown in yellows and browns, containing abundant seagrass, three transitional transects, shown in green with <5% seagrass, and the remaining group along the south and west margin, shown in greys, with low seagrass and more bare substrate.

Montara Monitoring Program S5: Barracouta & Vulcan Shoals Heyward et al.
40
Figure 28. Barracouta and Vulcan Shoal comparison -Cluster analysis (complete linkage) based on Hellinger transformed distance matrix for major benthic biotic groups found on Vulcan Shoal transects. Two robust groups are identified using bootstrapped significance calculation. The transects on each shoal, labeled BS or VS respectively, clearly group together, based on benthic community patterns. An extreme outlier is transect BS-11, circled in purple, which represented to dense field of soft coral Nepthea. A small group of transects (BS-5, BS-15 and VS -3) circled in yellow are intermediate between the two shoal groups, having in common high abiotic cover, moderate soft coral and no seagrass.

Montara Monitoring Program S5: Barracouta & Vulcan Shoals Heyward et al.
41
Figure 29. Barracouta Shoal - power analysis of six transects with divergent benthic coverage of major habitat groups, identified by cluster analysis. Total sample size n is 300 photoquadrats, equivalent to approximately 9 transects with a photo analysed every 10m. Benthic groups coral are shown in red, algae in brown, soft coral in yellow, sponge in purple, other in orange, seagrass in green and abiotic in gray.

Montara Monitoring Program S5: Barracouta & Vulcan Shoals Heyward et al.
42
Figure 30. Power analysis of six transects from Vulcan shoal with divergent benthic coverage of major habitat groups, identified by cluster analysis. Total sample size n is 300 photoquadrats, equivalent to approximately 9 transects. Benthic groups coral are shown in red, algae in brown, soft coral in yellow, sponge in purple, other in orange, seagrass in green and abiotic in gray.

Montara Monitoring Program S5: Barracouta & Vulcan Shoals Heyward et al.
43
Power analysis
The power analysis demonstrates that the habitat variability encountered across these shoals will
strongly influence the sampling effort required to detect changes in the order of 20% for major
biological groups. Figures 29 and 30 provide comparison power analyses for six transects on each
shoal that are representative of the range of benthic communities encountered.
It is clear that in locations where benthic cover is high and a major biotic class such as algae or
soft coral is extensive, adequate power to detect a 20% change in that class of biota can be
generated with just a few transects. For example the dense soft coral field on Barracouta is
extremely even and just a single tow repeated in that habitat would provide enough data to
detect such a level of change (see Fig. 29, transect BS-11).Nonetheless, it would be prudent to
undertake triplicate tows as a minimum.
As can be seen in Figures 29 and 30, the 95% confidence level to detect a 20% change in major
groups can be reached in many habitat types or benthic classes such as Abiotic and Algae on both
Barracouta and Vulcan Shoal by undertaking approximately 6 transects. However, there are
fewer locations where the density and evenness of distribution of significant Coral or Seagrass
habitats could be surveyed with an equivalent level of power using the same number of transects
and even in these areas 6 - 9 transects , equivalent to 300 photos, would be required.
Consequently, for most biotic groups that occur in non-trivial amounts (i.e. 10% cover or
greater) a sample size of between 6 and 9 transects per habitat type was required to estimate
point cover to within 20% around mean value and with a power of 95% and allow detection in of
change in point cover of 20% or greater.
Habitat groups with typically low prevalence (i.e. sponge) and/or high variability (i.e. seagrass)
would require many more than 9 transects per habitat to characterize point coverage and pick up
change. If this was important when estimating point coverage for this type of low prevalence of
high variability groups, for example in a monitoring program, it would be necessary to revise the
sampling method and sample plan to produces less variance in point cover estimates. Generally
these alternative methods require much high spatial accuracy when sampling and better
supporting data, such as multibeam bathymetry.
Other shoals
The results of the initial survey support the idea that the submerged shoals in the Timor Sea can
support diverse tropical ecosystems and in many cases, particularly where the depths are shallow
enough to support phototrophic organisms, may support a typical array of coral reef primary
producers and associated biodiversity. Based on general observations in this region, benthic
primary producers such as algae and reef building corals can be dominant to depths of 50-60m at
least. On this basis a preliminary analysis of the bathymetry around the Montara Well Head
platform has identified more than 20 possible shoal features within 100km distance and >100
similar bathymetric features within 200km (Fig. 31).

Montara Monitoring Program S5: Barracouta & Vulcan Shoals Heyward et al.
44
Figure 31. Potential shoal type habitat locations in the vicinity of the Montara spill. Shoals type features, indicated by red dots, were identified from the Australian hydro-geographic charts A00314, A00319 and A00320 and defined as abrupt submerged features rising from deeper than 50 meters. Depths of less than 50 meters along the coast of Australia have been excluded from the analysis. Due to much of the region being inadequately surveyed this analysis may only be used as a guide.

Montara Monitoring Program S5: Barracouta & Vulcan Shoals Heyward et al.
45
Discussion
Consequently our results are the first to describe these benthic communities. Both Barracouta
and Vulcan Shoals support diverse biological communities across their shallow plateau areas, with
many organisms typical of shallow water coral reefs. There were significant differences between
the two shoals in the relative abundance of dominant groups, particularly the algae, seagrass, hard
corals and soft corals.
The surveys of areas down to 40 m revealed bare sand and rubble as a ubiquitous component of
the benthos, but interspersed with abundant primary producers, dominated by algae, corals and
seagrass. More than 50% of the seabed on both shoals was covered with life. To the degree
measurable from image analysis, there was no evidence of major recent disturbance or mortality
in the biota.
Within each shoal there were distinct habitat areas where individual organism types dominated,
but there were also broad patches with mixed biota in juxtaposition. The differences in
community structure between the two shoals and the fact that on Barracouta soft corals seem
much more common and create a large field at one end, while on Vulcan the same can be said of
seagrass, raises a number of questions about what processes are driving these patterns. The
disturbance history of these plateau areas, due to passing storms, may be partly responsible, but
the distribution of substrates and the ability of some organisms to self propagate or self seed to
the parental shoal are also likely factors. Localised recruitment due to very limited larval dispersal
has been observed a number of invertebrate species, including ascidians similar to the species
observed on Vulcan Shoal (see Olson and McPherson 1987). The extensive field of soft coral at
the western margin of Barracouta Shoal may be a consequence of that species, likely to be in the
genus Nepthea, propagating asexually, as has been demonstrated through the production of
runner like mechanisms in a number of soft corals (see Walker and Bull 1983 and references
therein). Similar processes may have contributed to the dense patches of seagrass on Vulcan
Shoal, as T. ciliatum, like most seagrasses demonstrates primarily vegetative growth through its
rhizomes (Bandeira and Nilsson, 2001).
If future monitoring is required as part of a formally triggered component of the Montara
Monitoring Plan, our analyses suggest sampling intensity of 30 - 40 tows would give adequate
power to detect moderate changes in major habitats across any individual shoal. This level of
effort could be reduced by targeting specific habitats of interest in more detail, but greater
sampling precision, allowing a return to the exact survey transect , individual quadrat or coral,
may be required in certain habitats. If so then alternative methods must be applied and could
include the use of divers, ROV and AUV technologies. A number of potential shoal-type habitats
have been identified, solely on available bathymetry, within 100 km of the Montara Well Head
Platform. The preliminary analysis reported here, although relying on several assumptions,
provides some guidance for future sampling effort. High resolution bathymetry is an additional
dataset that would be highly desirable in future work, and could facilitate rigorous interpolation
of habitat extent between survey points. If better bathymetry is available beforehand it would also
enable more efficient sample design.

Montara Monitoring Program S5: Barracouta & Vulcan Shoals Heyward et al.
46
The results of this survey do not provide any insight into sub-lethal, chronic or highly localized
effects on these shoals. Additionally, it is not possible to extrapolate the benthic condition
recorded for these shoals to other shoals in the region. The pathways for any interaction or
potential exposure that may have occurred between the Montara spill and the benthic
communities of Barracouta and Vulcan Shoals may not be the same for other shoals that lie under
the spill area. Similarly, given the biological differences observed between these two shoals, it is
not yet possible to confidently predict what exists on the remaining unsurveyed shoals of the
region. Consequently it is not clear if un-surveyed shoals under the spill support unusual or more
complex biological communities with differing sensitivities.
Acknowledgements
We are grateful to Kerryn Johns, Kim Brooks, Greg Suosaari, Dave Whillas and Paul Tinkler for
field support with the Towvid and drop camera gear. The survey was conducted from the AIMS
vessel RV Solander and we acknowledge the excellent and professional operation of the vessel by
Master Greg Lambert and crew: Scott Davis (Chief Engineer), Mike Walker (2nd Mate), Leo
Zidek (1st Mate), Peter Koroibulu (Deckhand), and Tracy Biggs (Chef). Formatting of this report
was greatly facilitated by Liz Howlett.
Montara Monitoring Program S5: Barracouta & Vulcan Shoals Heyward et al.
47
References
Bandeira SO, Nilsson PG (2001) Genetic population structure of the seagrass Thalassodendron ciliatum in sandy and rocky habitats in southern Mozambique. Marine Biology 139:1007-1012
Colquhoun J, Heyward AJ, Rees M, Twiggs E, Fitzpatrick BM, McAllister FA, Speare PJ (2007) Ningaloo Reef Marine Park Deepwater Benthic Biodiversity Survey. Report for Western Australian Marine Science Institution (WAMSI). Australian Institute of Marine Science. 143 p.
Dupont WD (2008) Statistical Modeling for Biomedical Researchers, 2nd Edition. Cambridge, U.K.: Cambridge University Press.
Fry G, Heyward AJ, Wassenberg T, Ellis N, Taranto T, Keesing JK, Irvine T, Stieglitz TC, Colquhoun J (2008) Benthic habitat surveys of potential LNG hub locations in the Kimberley region. Final Report for Western Australian Marine Science Institution (WAMSI). CSIRO National Research Flagships - Wealth from Oceans and Australian Institute of Marine Science. 131 p.
Heyward AJ, Pinceratto E, Smith LD (1997) Big Bank Shoals of the Timor Sea: an environmental resource atlas. Australian Institute of Marine Science & BHP Petroleum. 115 p.
Heyward AJ, Rees M (1999) Scott Reef deeper lagoon habitat preview and recommendations for further assessment. Australian Institute of Marine Science. 14 p.
IMCRA (2006) A guide to the Integrated Marine and Coastal Biogeographic Regionalisation of Australia: IMCRA Version 4.0: June 2006. Department of the Environment and Heritage, Australian Government. http://www.environment.gov.au/coasts/mbp/publications/imcra/pubs/imcra4.pdf.
Kohler KE, Gill SM (2006) Coral Point Count with Excel extensions (CPCe): A Visual Basic program for the determination of coral and substrate coverage using random point count methodology. Computers and Geosciences 32(9): 1259-1269.
Legendre P, Gallagher ED (2001) Ecologically meaningful transformations for ordination of species data. Oecologia 129: 271-280.
Olson RR, McPherson R (1987) Potential vs. realized larval dispersal: fish predation on larvae of the ascidian Lissoclinum patella (Gottschaldt). Journal of Experimental Marine Biology and Ecology 110: 245-256.
PTTEPAA (2009). Monitoring Plan for the Montara Well Release in the Timor Sea. As agreed between PTTEP Australasia (Ashmore Cartier) Pty. Ltd. and the Department of the Environment, Water Heritage and the Arts. PTTEPAA 04/ Interwoven #142768, October 2009, 64 pp. Available at http://www.environment.gov.au/coasts/publications/pubs/montara-monitoring-plan.pdf
Quinn GP, Keough MJ (2002) Experimental Design and Data Analysis for Biologists. Cambridge University Press, Melbourne.
Walker TA, Bull GD (1983) A newly discovered method of reproduction in gorgonian coral. Marine Ecology Progress Series 12: 137-143.
Zar JH (1998) Biostatistical Analysis. Fourth edition. Prentice-Hall, Upper Saddle River, New Jersey.

Montara Monitoring Program S5: Barracouta & Vulcan Shoals Heyward et al.
48
Appendix1
Table A1. Real-time habitat classification system for towed video TowVid analysis.
Habitat (Descriptor1=Dense, Medium,
Sparse); (No Descriptor2)
Substrate Organism/Items of Interest
Sponge Garden1 Soft Mud Anemone Alcyonarian Garden1 Silt (Sandy-Mud) Ascidian Gorgonian Garden1 Sand Bryozoan Whip Garden1 Coarse Sand Holothurian Hard Coral Garden1 Sand Waves/Dunes Starfish Seagrass1 Rubble/Stones (<250 mm) Crinoid Filter-Feeders Mixed1 Rocks (>250 mm) Urchin Halimeda2 Low Relief Reef (<0.5 m) Hydroid Macroalgae2 High Relief Reef (0.5-2.0 m) Clam Algae Turf/Microphyton2 Bioturbated Seapen Halimeda/Hard Coral2 Rhodolith Filter-Feeders/Hard Coral2 Solitary Coral
Table A2. Post-processing Coral Point Count (CPCe) analysis - abiotic and biotic classification system.
Substrate Hard Coral Soft Coral Sponge Algae & Seagrass
Other & Unknown
Consolidated Substrate
Branching Acropora Whip Clathrate Rhodolith Ascidian
Bioturbated Sand
Digitate Acropora Gorgonian Fan
Erect Laminar Brown Zoanthid
Bioturbated Silt
Encrusting Acropora Gorgonian Branching
Erect Branching Green Urchin
Silt Staghorn Acropora Arborescent Simple Erect Red Calcareous Bryozoan
Sand Corymbose Acropora Branching Stalked Erect Halimeda Fleshy Bryozoan
Coarse Sand Submassive/columnar Acropora
Soft Coral Solid Massives Turf Algal Community
Hydroid
Gravel Tabulate Acropora Capitate Barrel/Ridgelike Massives
Crustose Coralline
Other Organisms
Shells/Skeletal Rubble
Bottlebrush Acropora Digitate Cup/Vase Shape Coralline Unknown
Stones Branching non-Acropora
Encrusting Encrusters Articulated Calcareous
Rocks Encrusting non-Acropora
Erect Filamentous
Dead Coral (Recent)
Foliose non-Acropora Lobate Foliose
Massive non-Acropora Massive Seagrass Fungid/Solitary Coral Sea Pen Submassive/columnar
non-Acropora
Tabulate non-Acropora

Montara Monitoring Program S5: Barracouta & Vulcan Shoals Heyward et al.
49
Appendix 2.