Chapter S5 ENVIRONMENTAL AIR ANALYSIS
79
S5.1 Chapter S5 ENVIRONMENTAL AIR ANALYSIS Contents 5.1 Environment of Model Areas ・・・・・・・・・・・・・・・・・・・・・・・・・・・・・・・・・・・・・・・・・・・・・・・ S5.3 5.2 Air Quality Monitoring ・・・・・・・・・・・・・・・・・・・・・・・・・・・・・・・・・・・・・・・・・・・・・・・・・・・・ S5.4 5.3 Air Quality Analysis ・・・・・・・・・・・・・・・・・・・・・・・・・・・・・・・・・・・・・・・・・・・・・・・・・・・・・ S5.13 Table and Figures Table 5.2.1 General Description of the Monitoring Sites of Buenos Aires・・・・・・・・・・・ S5.6 Table 5.2.2 General Description of the Monitoring Sites of Lujan de Cuyo・・・・・・・・・・ S5.7 Table 5.2.3 General Description of the Monitoring Sites of San Nicolas ・・・・・・・・・・・・ S5.8 Table 5.2.4 Monitoring Item, Frequency and Analytical Method・・・・・・・・・・・・・・・・・・ S5.9 Table 5.2.5 Integrated Results of Summer Monitoring Data (Mean Value) ・・・・・・・・・ S5.12 Table 5.2.6 Integrated Results of Winter Monitoring Data (Mean Value) ・・・・・・・・・・ S5.12 Table 5.2.7 Air Quality Data by Other Agencies in the Monitoring Period ・・・・・・・・・ S5.13 Table 5.3.1 Hourly Mixing Layer Height ・・・・・・・・・・・・・・・・・・・・・・・・・・・・・・・・・・・ S5.15 Table 5.3.2 Concentration of Pollutants in Mendoza Urban Area ・・・・・・・・・・・・・・・・ S5.20 Table 5.3.3 Achievement of the Environmental Standards ・・・・・・・・・・・・・・・・・・・・・・ S5.21 Figure 5.2.1 Location of the Monitoring Sites of Buenos Aires ・・・・・・・・・・・・・・・・・・・ S5.5 Figure 5.2.2 Location of the Monitoring Sites of Lujan de Cuyo ・・・・・・・・・・・・・・・・・・ S5.7 Figure 5.2.3 Location of the Monitoring Sites of San Nicolas ・・・・・・・・・・・・・・・・・・・・ S5.8 Appendixes S5-A1 Buenos Aires Manual Monitoring Data (3.2001) ・・・・・・・・・・・・・・・・・・・・・・・ S5.22 S5-A2 Buenos Aires Automatic Data (Summer) ・・・・・・・・・・・・・・・・・・・・・・・・・・・・・ S5.23 S5-A3 Central Puerto Operation Data (Summer) ・・・・・・・・・・・・・・・・・・・・・・・・・・・・・ S5.24 S5-A4 Central Puerto Nuevo and Nuevo Puerto Emission Data (Summer) ・・・・・・・・・ S5.24 S5-A5 Central Puerto Meteorological Data (Summer) ・・・・・・・・・・・・・・・・・・・・・・・・・ S5.25 S5-A6 Central Termica Costanera Operation Data (Summer) ・・・・・・・・・・・・・・・・・・・ S5.26 S5-A7 Central Termica Costanera Emission Data (Summer) ・・・・・・・・・・・・・・・・・・・・ S5.26 S5-A8 Central Termica Costanera Meteorological Data (Summer) ・・・・・・・・・・・・・・・ S5.27 S5-A9 Buenos Aires Manual Data (7.2001) ・・・・・・・・・・・・・・・・・・・・・・・・・・・・・・・・・ S5.28 S5-A10 Buenos Aires Automatic Data (Winter)・・・・・・・・・・・・・・・・・・・・・・・・・・・・・・ S5.29 S5-A11 Central Puerto Operation Data (Winter) ・・・・・・・・・・・・・・・・・・・・・・・・・・・・・ S5.30 S5-A12 Central Puerto Emission Data (Winter) ・・・・・・・・・・・・・・・・・・・・・・・・・・・・・・ S5.30 S5-A13 Central Puerto Meteorological Data (Winter) ・・・・・・・・・・・・・・・・・・・・・・・・・ S5.31 S5-A14 Central Termica Costanera Operation Data (Winter) ・・・・・・・・・・・・・・・・・・・ S5.32 S5-A15 Central Termica Costanera Emission Data (Winter) ・・・・・・・・・・・・・・・・・・・・ S5.32
-
Upload
khangminh22 -
Category
Documents
-
view
0 -
download
0
Transcript of Chapter S5 ENVIRONMENTAL AIR ANALYSIS
S5.1
Chapter S5 ENVIRONMENTAL AIR ANALYSIS
Contents
5.1 Environment of Model Areas ・・・・・・・・・・・・・・・・・・・・・・・・・・・・・・・・・・・・・・・・・・・・・・・ S5.3
5.2 Air Quality Monitoring・・・・・・・・・・・・・・・・・・・・・・・・・・・・・・・・・・・・・・・・・・・・・・・・・・・・ S5.4
5.3 Air Quality Analysis ・・・・・・・・・・・・・・・・・・・・・・・・・・・・・・・・・・・・・・・・・・・・・・・・・・・・・ S5.13
Table and Figures
Table 5.2.1 General Description of the Monitoring Sites of Buenos Aires・・・・・・・・・・・ S5.6Table 5.2.2 General Description of the Monitoring Sites of Lujan de Cuyo・・・・・・・・・・ S5.7Table 5.2.3 General Description of the Monitoring Sites of San Nicolas・・・・・・・・・・・・ S5.8Table 5.2.4 Monitoring Item, Frequency and Analytical Method・・・・・・・・・・・・・・・・・・ S5.9Table 5.2.5 Integrated Results of Summer Monitoring Data (Mean Value) ・・・・・・・・・ S5.12Table 5.2.6 Integrated Results of Winter Monitoring Data (Mean Value) ・・・・・・・・・・ S5.12Table 5.2.7 Air Quality Data by Other Agencies in the Monitoring Period ・・・・・・・・・ S5.13Table 5.3.1 Hourly Mixing Layer Height ・・・・・・・・・・・・・・・・・・・・・・・・・・・・・・・・・・・ S5.15Table 5.3.2 Concentration of Pollutants in Mendoza Urban Area ・・・・・・・・・・・・・・・・ S5.20Table 5.3.3 Achievement of the Environmental Standards・・・・・・・・・・・・・・・・・・・・・・ S5.21Figure 5.2.1 Location of the Monitoring Sites of Buenos Aires・・・・・・・・・・・・・・・・・・・ S5.5Figure 5.2.2 Location of the Monitoring Sites of Lujan de Cuyo・・・・・・・・・・・・・・・・・・ S5.7Figure 5.2.3 Location of the Monitoring Sites of San Nicolas ・・・・・・・・・・・・・・・・・・・・ S5.8
Appendixes
S5-A1 Buenos Aires Manual Monitoring Data (3.2001) ・・・・・・・・・・・・・・・・・・・・・・・ S5.22S5-A2 Buenos Aires Automatic Data (Summer) ・・・・・・・・・・・・・・・・・・・・・・・・・・・・・ S5.23S5-A3 Central Puerto Operation Data (Summer) ・・・・・・・・・・・・・・・・・・・・・・・・・・・・・ S5.24S5-A4 Central Puerto Nuevo and Nuevo Puerto Emission Data (Summer) ・・・・・・・・・ S5.24S5-A5 Central Puerto Meteorological Data (Summer)・・・・・・・・・・・・・・・・・・・・・・・・・ S5.25S5-A6 Central Termica Costanera Operation Data (Summer) ・・・・・・・・・・・・・・・・・・・ S5.26S5-A7 Central Termica Costanera Emission Data (Summer)・・・・・・・・・・・・・・・・・・・・ S5.26S5-A8 Central Termica Costanera Meteorological Data (Summer) ・・・・・・・・・・・・・・・ S5.27S5-A9 Buenos Aires Manual Data (7.2001)・・・・・・・・・・・・・・・・・・・・・・・・・・・・・・・・・ S5.28S5-A10 Buenos Aires Automatic Data (Winter)・・・・・・・・・・・・・・・・・・・・・・・・・・・・・・ S5.29S5-A11 Central Puerto Operation Data (Winter) ・・・・・・・・・・・・・・・・・・・・・・・・・・・・・ S5.30S5-A12 Central Puerto Emission Data (Winter)・・・・・・・・・・・・・・・・・・・・・・・・・・・・・・ S5.30S5-A13 Central Puerto Meteorological Data (Winter) ・・・・・・・・・・・・・・・・・・・・・・・・・ S5.31S5-A14 Central Termica Costanera Operation Data (Winter) ・・・・・・・・・・・・・・・・・・・ S5.32S5-A15 Central Termica Costanera Emission Data (Winter) ・・・・・・・・・・・・・・・・・・・・ S5.32

S5.2
S5-A16 Central Termica Costanera Meteorological Data (Winter) ・・・・・・・・・・・・・・・ S5.33S5-A17 Lujan de Cuyo Manual Monitoring Data (2001.2) ・・・・・・・・・・・・・・・・・・・・・ S5.34S5-A18 Lujan de Cuyo Automatic Data (Summer) ・・・・・・・・・・・・・・・・・・・・・・・・・・・ S5.35S5-A19 Central Termica Lujan de Cuyo Generation Data (Summer) ・・・・・・・・・・・・・ S5.36S5-A20 Central Termica Meteorological Data (Feb/20 - Feb/25) ・・・・・・・・・・・・・・・・ S5.37S5-A21 Lujan de Cuyo Manual Monitoring Data (6,7.2001)・・・・・・・・・・・・・・・・・・・・ S5.38S5-A22 Lujan de Cuyo Automatic Data (Winter) ・・・・・・・・・・・・・・・・・・・・・・・・・・・・ S5.39S5-A23 Central Termica Lujan de Cuyo Generation Data (Winter)・・・・・・・・・・・・・・・ S5.40S5-A24 Central Termica Lujan de Cuyo Meteorological Data (Winter) ・・・・・・・・・・・ S5.41S5-A25 CTM No.23 Concentration Data (Summer) ・・・・・・・・・・・・・・・・・・・・・・・・・・ S5.42S5-A26 CTM No.23 Concentration Data (Winter)・・・・・・・・・・・・・・・・・・・・・・・・・・・・ S5.42S5-A27 San Nicolas Manual Monitoring Data (2001.2) ・・・・・・・・・・・・・・・・・・・・・・・ S5.43S5-A28 San Nicolas Automatic Data (Summer) ・・・・・・・・・・・・・・・・・・・・・・・・・・・・・ S5.44S5-A29 Central Termica San Nicolas Operation Data (Summer)・・・・・・・・・・・・・・・・・ S5.45S5-A30 Central Termica San Nicolas Emission Data (Summer) ・・・・・・・・・・・・・・・・・ S5.45S5-A31 San Nicolas Ws Wd (UTN, Summer) ・・・・・・・・・・・・・・・・・・・・・・・・・・・・・・・ S5.46S5-A32 San Nicolas Manual Monitoring Data (7,8.2001) ・・・・・・・・・・・・・・・・・・・・・・ S5.47S5-A33 San Nicolas Automatic Data (Winter)・・・・・・・・・・・・・・・・・・・・・・・・・・・・・・・ S5.48S5-A34 Central Termica San Nicolas Fuel Consumption Data (Winter) ・・・・・・・・・・・ S5.49S5-A35 Central Termica San Nicolas Generation Data (Winter) ・・・・・・・・・・・・・・・・・ S5.49S5-A36 Centaral Termica San Nicolas Emission Data (Winter)・・・・・・・・・・・・・・・・・・ S5.49S5-A37 San Nicolas Meteorological Data (UTN, Winter) ・・・・・・・・・・・・・・・・・・・・・・ S5.50S5-A38 Height of the Thermal Internal Boundary Layer ・・・・・・・・・・・・・・・・・・・・・・・ S5.51S5-A39 Hourly Mean and Standard Deviations of Mixing Layer Height, and Frequency of Occurrence of Daytime Atmospheric Stability Classes ・・・・・・ S5.53S5-A40 Variation of NOx, TSP and SO2 with Wind Speed or Wind Direction in Buenos Aires, San Nicolas and Lujan de Cuyo. ・・・・・・・・・・・・・・・・・・・・・ S5.54S5-A41 Review of Air Quality of Buenos Aires, San Nicolas & Mendoza ・・・・・・・・・ S5.66S5-A42 Averaging Time Analyses Mathematical Model ・・・・・・・・・・・・・・・・・・・・・・・ S5.68
Photographs
Air Quality Automatic Continuous Analyzers
Manual Air Sampling Unit
Some of Manual Samplint Sites in Model Areas
S5.3
5.1 Environment of Model Areas
5.1.1 Buenos Aires
This model area covers the whole of Buenos Aires City. The city is developed on a vast plain
spreading out in smooth geographical features, and has the La Plata river to the east of the city.
The urban area where many high buildings and houses are densely built-up, stretches along the
river at an interval of 1km. In the urban area, people use cars for transportation at every turn and
the traffic to the arterial highway is chronically heavy and bustling with human activity causing
peak highway congestion in the morning and evening on weekdays.
The Nuevo Puerto and the Puerto Nuevo power plants are located at the Buenos Aires seaport,
northeastward from the center of the Capital Federal and close to the urban area. Both power
plants are approximately 500m apart from each other. The Nuevo Puerto power plant is located
on the north side and the Puerto Nuevo on the south side. The surrounding area is an industrial
area comprised of relatively small-scale factories. The Central Costanera power plant is located
at the eastern extremity of Buenos Aires city, where both the La Plata River and the Riachuelo
river which is the boundary between Buenos Aires city and Gran Buenos Aires area, are
confluent. Around the power plant, a dockyard adjoins and oil refineries exist at a distance of
1km southeastward. The refineries are outside of the model area.
The domestic airport is situated on the banks of the La Plata River about 2km northwest of the
power plants. The international airport is outside the model area.
5.1.2 Lujan de Cuyo
This area is centered on the Lujan de Cuyo power plant. The Lujan de Cuyo power plant is
located in the industrial park at a distance of 10km west-southwest of Lujan de Cuyo city in the
Province of Mendoza. Lujan de Cuyo city is developed on flat land at an altitude of 900m at a
distance of 30km south of the center of Mendoza city, the provincial capital. The area reaches
to the piedmont of the Andean 5km west of the power plant. Vineyards surround the power
plant.
A YPF oil refinery and a petrochemical plant adjoin to the power plant, while other plants also in
exist including a silicone inorganic chemical factory, a coke plant and gypsum plant. A large
amount of pollutants (soot and dust) are constantly emitted from almost all these factories.
Roadways for Mendoza and Chile run around the power plant but the traffic is light. The area is
on oil and natural gas deposit fields.

S5.4
5.1.3 San Nicolas
The San Nicolas power plant is central to this model area and is located at the northwestern
extremity of Buenos Aires Province and to the northeast part of San Nicolas city which is in
200km northwest of Buenos Aires City. This area has a flat topographic feature and the Paraná
River to the northeast of the city. The urban area is developed for 6km round with very little
traffic, and pasture and farm fields stretch out around it.
The San Nicolas power plant faces the Paraná River and an steel works is situated nearby to the
south of the plant and numerous stationary emission sources exist. To the west of the power
plant, the urban area stretches out and is home to an insect- and herbicide manufacturing plant
and cement factories are found. Another steel works exists 15km northwest of the power plant.
5.2 Air Quality Monitoring
5.2.1 Planning
The purpose of the monitoring is to grasp the current status of air pollution in the model area and
to obtain adequate data and information to verify the simulation model. The monitoring was
carried out both in summer and winter, when the fuel used in the power plant was supposed to be
different.
The sites of manual sampling were selected in the area 5 km around each main power plant and
the number of the sites was 9, considering the quantity of available instruments in the possession
of CNEA and including those by JICA as well. At one of the sites of each model area, the
automatic analyzers were also mobilized together with the manual sampling in order to verify
each method.
The chemical analysis was carried out by counterparts using instrument in the possession of
CNEA. Regarding oxides of nitrogen, only total NOx was monitored, conforming to the actual
environmental criteria of Argentina. As for SO2 analysis, an ion chromatography method was
adopted using the CNEA’s instrument.
5.2.2 Monitoring Sites and Chemical Laboratory
1) Buenos Aires
For manual sampling, because of breakdowns of high volume air samplers and the night
safety of the area around the sites, 7 sites of ① to ⑦ around the hospitals were selected
S5.5
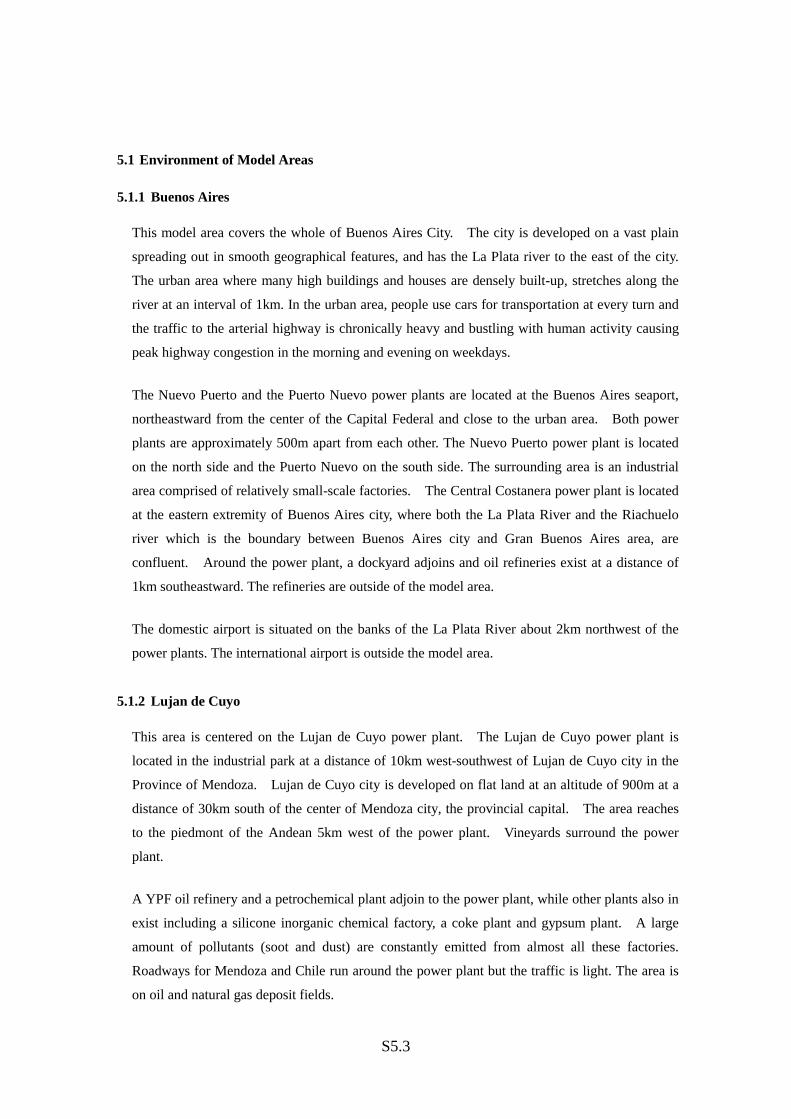
for the summer monitoring. For the winter monitoring, 9 sites of ① to ③ and ⑤ to ⑨
were selected. For automatic analyzers, the Hospital Alemán was selected. The monitoring
was implemented by CNEA. Figure 5.2.1 indicates the location of the monitoring sites and
Table 5.2.1 shows their general description.
Figure 5.2.1 Location of the Monitoring Sites of Buenos Aires

S5.6
Table 5.2.1 General Description of the Monitoring Sites of Buenos Aires
Monitoring sitesDirection and
distance from thePuerto P/P
Direction anddistance from the
Costanera P/PSurrounding conditions
① EMERGENCIAS
SANITARIAS 1.6km west7.3kmnorthwest
Situated on grassy premises of the Direcciónde Emergencias Sanitarias Ministerio de Saludwith an emergency heliport, close to ahighway.
② HOSPITAL ALEMAN
2.6kmsouthwest
6.1kmwest-northwest
Situated on the premises of the HospitalAlemán. Surrounding roads have heavy traffic.
③ RAPALLINI 3.5km south3.9kmwest-northwest
Situated on 5th floor of an apartment facing anarterial highway.
④ INAP*13.6km south
4kmwest-northwest
Situated on 3rd floor of the INAP Centro deCapacitación facing an arterial highway.
⑤ CASA AMARILLA
5.6kmsouth southeast
2.1km westSituated in the park of the Casa Amarilla delAlmirante Guillermo Brown facing an arterialhighway.
⑥ METRO GAS6.8km south
3km west-southwest
Situated on the premises of the gas company.
⑦ GARRAHAN 5.7kmsouthsouthwest
4km west
Situated on the rooftop of the 4-story buildingof the Hospital National de Pediatria on thepark fringe.
⑧ JARDIN JAPOINES*2 2.3km west
7.5kmnorthwest
Situated in the Japanese garden. Thesurrounding roads congested with heavytraffics.
⑨ BIBLIOTECA NATOINAL*2
1.8kmsouthwest
6.3kmnorthwest
Situated on a hill on the 2nd floor of thenational library, in a residential area with manyapartment buildings.
⑩ AGUASARGENTINAS*2
6.9km south3.9km west-southwest
Situated in the office of the water treatmentplant.
The automatic monitoring site was determined on the rooftop of the 7-story building of the HOSPITALALEMAN.*1 : Monitoring site only in summer. *2 : Monitoring site only in winter.
2) Lujan de Cuyo
For manual sampling, the 9 monitoring sites of ① to ⑨ were selected with collaboration
from the Mendoza provincial government. The thermal power plant (CTM) was selected
as a monitoring site for automatic analyzer. NOx analysis was carried out at a tenanted
part of the water analysis institute of Lujan de Cuyo city, while other analyses were carried
out in CNEA. Figure 5.2.2 indicates the location of the monitoring sites and Table 5.2.2
shows their general description.

S5.7
Figure 5.2.2 Location of the Monitoring Sites of Lujan de Cuyo
Table 5.2.3 General Description of the Monitoring Sites of Lujan de CuyoMonitoring sites Direction and distance from
the Lujan de Cuyo powerplant
Surrounding conditions
① ZONA FRANCA 1.85km southwest Situated on vast premises of a bondedwarehouse which is sometimes filled with dustturbulence.
② ACSA 0.67km west-northwest Situated on the premises of Aceros CartelloneS. A.
③ CTM Situated on the power plant premises.
④ ALMACEN 2.8km southeast Situated on the premises of the container factoryfacing an arterial highway, and front of the YPF.
⑤ MISTA 5.7km east-southeast Situated on the premises of a machine factory.
⑥ CHIPOLETTI 5km east-northeast Situated at the dam observation post of theMendoza river.
⑦ VISTALBA 5.25km northeast Situated in a villa area
⑧ YPF GAS STATION 3.25km north-northeast Situated next to a gas station facing an arterialhighway.
⑨ CASA UHGO 2.74km north Situated in the garden of a personal residencefacing an arterial highway.
・ The automatic monitoring site was determined at Centrales Termicas Mendoze (CTM).
3) San Nicolas
For manual sampling, the 9 monitoring sites of ① to ⑨ were selected in summer and 9
slightly different sites of ① to ⑧ and ⑩ in winter. For automatic analyzers, a site on a
premises of the UTN (National University of Technology) was selected. NOx analysis was
carried out in a chemical laboratory at the power plant in summer, while at the UTN in
winter. The other analyses were carried out in CNEA. Figure 5.2.3 indicates the location of

S5.8
the monitoring sites and Table 5.2.3 shows their general description.
Figure 5.2.3 Location of the Monitoring Sites of San Nicolas
Table 5.2.3 General Description of the Monitoring Sites of San Nicolas
Monitoring sitesDirection and distancefrom the power plant Surrounding conditions
① Universidad Tech.Nacional
3.85km northwest Situated on the rooftop of the 3-storybuilding of the National University ofTechnology facing the Paraná river.
② HOTEL RIO 5.1km west-northwest Situated on the rooftop of a barn back of ahotel on a busy street.
③ TANQUE 4.04km west-northwest It faces an arterial highway.
④ TRANSIBA 3.85km west Situated on a premises of a transformerstation on a busy street.
⑤ B° FAMILY 3.1km west-southwest Situated in a residential area.
⑥ AERO CLUB 4.6km south-southwest Situated in an airport for Cessna, which issometimes filled with dust turbulence.
⑦ CASA DE MINA 3.52km south Situated in a residential area
⑧ METALURGICA FLOGG 2.89km south-southeast Situated on premises of a welding shop
⑨ CENTRAL TERMICA*1 Situated on the premises of the power plant
⑩ ESTABLECIMINET
METALURGICO UNIVERSAL*2
4.1km southeast Situated on the premises of a metalprocessing factory.
The automatic monitoring site was determined on the rooftop of the 3-story building of the UTN.*1: Monitoring site only in summer. *2: Monitoring site only in winter.
5.2.3 Monitoring Item, Frequency and Analytical Method
Table 5.2.4 gives monitored items and frequencies, and also analytical methods employed for the
monitoring.

S5.9
Table 5.2.4 Monitoring Item, Frequency and Analytical Method
Item Analytical Method Monitoring FrequencySO2 ASTM D-2914-95
Ion chromatography6 times a day (each 1 hour at 0, 4, 8, 12, 16, 20o'clock) for 7 days
NOx ASTM D-3608-95Saltzman Absorptiometry
6 times a day (each 1 hour at 0, 4, 8, 12, 16, 20o'clock) for 7 days
Manualsampling
TSP ASTM D-4096-91High volume air sampler
Once a day (from 12 to 12 o'clock) for 7 days
SO2 UV Fluorescence For 7 days continuouslyNOx Chemiluminescence For 7 days continuously
Automaticanalyzers
PM β-ray absorption For 7 days continuously
5.2.4 Monitored and Collected Data
1) General
The integrated results of air quality monitoring implemented by both manual sampling and
automatic analyzers in summer is summarized in Table 5.2.5, and that of winter monitoring
in Table 5.2.6, respectively. The results are evaluated in the Article 5.3.
2) Buenos Aires
The summer monitoring was carried out from noon Thursday 8 March 2001 to noon
Thursday 15 March 2001.
S5-A1 describes the detailed results of the manual sampling (SO2, NOx and TSP), and
S5-A2 does of the automatic analyzers (SO2, NO, NO2, NOx and PM) respectively.
S5-A3, S5-A4 and S5-A5 give the operating data, the pollutant source data and the
meteorological data of the Puerto power plant, respectively. The sets of data for the
Costanera power plant are shown in S5-A6, S5-A7 and S5-A8, respectively. Except the
monthly data (NOx, TSP, Settled dust, etc.) from 1997 to 1999 given by the City of Buenos
Aires (#121), the Study Team was unable to acquire additional data monitored by other
research agencies in this model area during the summer monitoring.
The winter monitoring was planned to be carried out from noon Friday, 13 July, 2001 to
noon Sunday, 22 July, 2001. However, the monitoring was called off for two days,
Wednesday 18 and Thursday 19 July because of a strike. Consequently the schedule was
extended for two more days on Saturday 21 and Sunday 22 July. S5-A9 describes the
detailed results of the manual sampling (SO2, NOx and TSP), and S5-A10 shows the
automatic analyzers (SO2, NO, NO2, NOx and PM) respectively. The operating data, the
pollutant source data and the meteorological data of the Puerto power plant obtained during

S5.10
the Field Works are shown in S5-A11, S5-A12 and S5-A13, respectively. S5-A14, S5-A15
and S5-A16 show the results of the Costanera power plant, respectively. No additional data
monitored by other research agencies was acquired during the winter monitoring.
3) Lujan de Cuyo
The summer monitoring was carried out from noon Sunday 18 February 2001 to noon
Sunday 25 February 2001.
S5-A17 and S5-A18 contain the detailed results of the manual sampling (SO2, NOx and
TSP), and automatic analyses (SO2, NO, NO2, NOx and PM).
S5-A19 summarizes the operating data of the Lujan de Cuyo power plant and the
pollutant source data during the monitoring. The meteorological data observed by the
Provincial Government of Mendoza on a premise of the Lujan de Cuyo power plant are
shown in S5-A20.
The winter monitoring was carried out from noon Wednesday 27 June 2001 to noon
Wednesday 4 July 2001.
S5-A21 describes the detailed results of the manual sampling (SO2, NOx and TSP), and
S5-A22 shows the automatic analyzers (SO2, NO, NO2, NOx and PM) respectively. S5-A23
summarizes the operating data of the Lujan de Cuyo power plant and the pollutant source
data during the monitoring. The meteorological data observed by the Provincial Government
of Mendoza on a premise of the Lujan de Cuyo power plant are shown in S5-A24.
The Mendoza Province official gave to the Study Team daily data of SO2, NOx, etc.
monitored at sites in Mendoza City from 1/1999 to 7/2000, in YPF Refinery from 1/1999 to
6/2000 (#130), and also at CTM and YPF from 1/2000 to 12/2000 (#232).
Since the Provincial Government of Mendoza had stopped the monitoring at CTM
during the summer monitoring of the Study, the monitoring data at CTM measured by the
Provincial Government of Mendoza in a proximal period of the summer work is shown in
S5-A25 and that of winter in S5-A26, respectively. Table 5.2.7 shows the integrated results
of both analyses. The data are shown in the Table 5.2.6 and in S5-2-13. In comparison of
the existing available data with the monitored data in the summer by the Study Team, no
good correspondence is found. This discrepancy may arise from the different methodologies.
Namely, the sampling period of the NOx monitoring was 1 hour for the Study, while it was
1day in the case of the of Mendoza Provincial Government. The Study Team employed
high volume air samplers for TSP monitoring, and the Mendoza Government did low
volume samplers. In contrast, the monitoring results in winter of both NOx and SO2 are
approximately consistent with the existing data.

S5.11
4) San Nicolas
The summer monitoring was carried out from noon Monday 5 February 2001 to noon
Monday 12 February 2001.
S5-A27 and S5-A28 show the results of the manual sampling (SO2, NOx and TSP) and
automatic analyses (SO2, NO, NO2, NOx and PM) respectively. S5-A29 and S5-A30 give the
operating and pollutant source data of San Nicolas power plant during the summer
monitoring period of the Study. The meteorological data of the same period observed by
UTN are shown in S5-A31. The Study Team obtained daily ambient air quality data (SO2,
NOx) from January 1997 to December 1998 and the similar daily data (SO2, NOx, PM10,
etc.) in January and March 1999 provided by ENRE (#137). No additional air quality data
monitored by other research agencies could be acquired during the summer monitoring
period.
The winter monitoring was carried out from noon Friday 27 July 2001 to noon Friday
3 August 2001.
S5-A32 describes the detailed results of the manual sampling (SO2, NOx and TSP),
and S5-A33 describes the automatic analyzers (SO2, NO, NO2, NOx and PM) respectively.
S5-A34, S5-A35 and S5-A36 give the operating data and the pollutant source data of the San
Nicolas power plant, respectively. The meteorological data during the monitoring period
observed by the UTN is shown in S5-A37. No additional air quality data monitored by other
research agencies could be acquired during the winter monitoring period.

S5.12
Table 5.2.5 Integrated Results of Summer Monitoring Data (Mean Value)
Unit Buenos Aires Lujan de Cuyo San NicolasPeriod of monitoring 3/8~3/15 2/5~2/12 2/18~2/25
whole period μg/m3 7.7(<4~59.3) 5.6(<4~30.9) 4.9(<4~45.5)weekday daytime μg/m3 11.7 6.3 5.5weekday night μg/m3 5.5 5.0 4.8weekend daytime μg/m3 <4 5.6 <4
Manualsampling
weekend night μg/m3 4.6 4.5 4.1NOx
Continuous and automatedmonitoring whole period
μg/m349.1 (8~169) 11.5(0~113) 21.8(0~141)
mean value μg/m3 111.1(25~1009) 63.2(<9~466) 43.2(<9~1075)weekday daytime μg/m3 111.3 55.8 42.9weekday night μg/m3 115.3 71.9 51.8weekend daytime μg/m3 124.7 66.6 16.3
Manualsampling
weekend night μg/m3 113.5 42.5 28.3
SO2
Automatic analyzers wholeperiod
μg/m363(34~89) 32(0~105) 73(26~479)
whole period μg/m3 69(48~129) 180(68~443) 108(32~230)weekday μg/m3 75 187 117
Manualsampling
weekend μg/m3 55 151 57
TSP(PM)
Automatic analyzers wholeperiod
μg/m3 5.1(0~12) 5.1(0~12) 13.0(0~56)
Table 5.2.6 Integrated Results of Winter Monitoring Data (Mean Value)
Unit Buenos Aires Lujan de Cuyo San NicolasPeriod of monitoring 7/13~7/22 6/27~7/4 7/27~8/3
whole period μg/m3 32.4(<4~1200) 18.1(<4~64.4) 12.6(<4~45.5)weekday daytime μg/m3 36.8 26.6 11.1weekday night μg/m3 32.4 21.0 16.1weekend daytime μg/m3 20.0 8.5 8.8
Manualsampling
weekend night μg/m3 21.6 9.5 10.3NOx
Continuous and automatedmonitoring whole period
μg/m3 44.7 (6~133) 60.2(15~165) 6(<8~164)
mean value μg/m3 94.7(10.8~1200) 45.0(0~791.7) 39.7(10.8~516.7)weekday daytime μg/m3 107.8 66.7 45.4weekday night μg/m3 81.2 31.2 38.2weekend daytime μg/m3 101.8 20.8 28.4
Manualsampling
weekend night μg/m3 234.9 22.2 26.1
SO2
Automatic analyzers wholeperiod
μg/m3 58(50~68) 68(60~73) 113(23~199)
whole period μg/m3 64(19~153) 116(40~346) 92.6(18~254)weekday μg/m3 67 124 95.1
Manualsampling
weekend μg/m3 48 64 61.7
TSP(PM)
Automatic analyzers wholeperiod
μg/m3 4.8(0~10) 6(0~17) ---

S5.13
Table 5.2.7 Air Quality Data by Other Agencies in the Monitoring Period
CTM in Lujan de Cuyo (measured by the Provincial Government of Mendoza)Monitoring Item Summer (31/1/2001~23/2/2001) Winter (5/6/2001~20/7/2001)
NOx(ppm) 0.009 (0.002~0.023) 0.013 (0.004~0.031)SO2(ppm) --- 0.006 (0.001~0.019)TSP(μg/m3) 2 (nil~2) ---
5.2.5 Notice on Automatically Analyzed Data
The data by automatic analyzers during the summer monitoring period had a considerable amount
of missing and negative indications. The results (S5-2-2, S5-2-10 and S5-2-15) gave no
correlative sign with monitoring time or day. In the winter monitoring, the results of NOx and
SO2 approximately consistent with the results of the manual sampling, while the results of TSP
were extremely low in comparison with those of the manual sampling. The automatic analyzers
are not adequate for the operators to grasp a tendency of the analyzed data continuously, because
they are not equipped with plotters for continuous recording, although it has a display to indicate
current spot values.
5.3 Air Quality Analyses
5.3.1 Air Pollution Episodes in Model Areas
1) Air Pollution in Buenos Aires Area by Mobile Sources
The City of Buenos Aires has advantageous conditions for good dispersion of air pollutants
because of its location on the flat terrain and with relatively strong winds. However, daytime
emissions, from mobile sources on weekdays in the downtown area and around the major
traffic corridors at peak hours, are heavy insomuch that the street canyons phenomena
present. As a result, the air pollutants from the mobile sources are not sufficiently dispersed
(#54).
2) Dustfall in San Nicolas Area
In San Nicolas, complaints about settling dust thick on roofs, yards and gardens, were
frequently reported by the residents. Several sources including chemical factories, iron
works and a power plant exist in the area (#107).
3) Lujan de Cuyo and Mendoza Areas
From dawn to noon on 18 May, 1995, an episode occurred in Mendoza. Many residents

S5.14
complained about respiratory stimulation. According to the record of the meteorological
condition at that time, it was calm and had a ground inversion at an altitude of 100 to 200 m.
From the wind direction, it was estimated that the source was the petrochemical plant in the
provincial industrial park and the causative agents were SO2 and H2S (#160).
5.3.2 Climatological Aspects involved in Air Pollution in Argentina
In view of synoptic climatology, Argentina has characteristic winds under the influence of three
anticyclones; the warm and humid winds by the Atlantic anticyclone, which characterizes the
climate of North Patagonia, the west winds by the Pacific anticyclone, and the cold winds by the
Antarctic anticyclone. These three typical winds underlie the climatology of Argentina.
Local winds are also important factors of the climate of Argentine. The Zonda, which is a warm
and dry wind and blows generally from May to October, is in the west of pre-cordillera including
La Rioja, San Juan and Mendoza. The Sudestada originates locally on the Pampa coast and is
extremely humid. The Pampero is a cold and dry south local wind and blows mainly in summer.
The temperature and humidity soar after the Pampero blows for several days from October to
March. The Plata Basin has tornadoes with a central wind speed of up to 500 km/h (#162).
It is assumed that an internal boundary layer would be formed due to both the difference of aero-
dynamical roughness and the difference of the heat capacity between water of the La Plata River
and land. The height of the internal boundary layer can be estimated by semi-empirical formula
(S5-A38). In Buenos Aires and San Nicolas, no meteorological observation is carried out at
present to find out the structure of the internal boundary layer.
5.3.3 Meteorological Data
1) Buenos Aires Area
According to the data provided by the Aeroparque station, the mean wind speed for 10 years
(1981-1990) is about 4.4m/s (#109), and the prevailing wind direction is the east.
Distinction of wind speed depending on the wind direction is not observed. The calm
appears frequently at a rate of 8~9% in winter (#109).
A daytime mixing layer height is the key parameter for the determination of the
atmospheric capability to disperse air pollutants. The mixing layer height in this area was
estimated by Holzworth’s method, using both the daytime surface hourly meteorological
data for 5 years at the Aeroparque station and the upper air meteorological data at 12 GMT
(9 Local Time; LT) of Ezeiza Aeroport (#102). The seasonal and annual hourly means of the

S5.15
mixing layer height are shown in Table 5.3.1 and in S5-A39. In general the maximum
mixing layer height is observed at 14 LT. The mixing layer height is the lowest in winter
among all seasons and is half of that in summer.
S5-A39 (Fig.2) shows the derived seasonal and annual occurrence frequencies of
daytime atmospheric stability classes. The Turner atmospheric stability is defined using
wind speed, solar radiation and cloud amount. The unstable situation of the atmosphere is
dominant in summer (#102).
Table 5.3.1 Hourly Mixing Layer Height
Mixing layer height (m) Summer Autumn Winter Spring AnnualMax.Min.
Mean rangeRMS
1170547
264 - 405289
822363
333 - 833234
592261
272 - 413144
891468
205 - 349275
870410
262 - 667265
Frequency ofoccurrence< 1500m
85% 95% 99% 94% 93%
2) San Nicolas Area
According to the data measured for 10 years (1981-1990) at the Rosario weather station
(#109), the mean wind speed is about 6.2m/s, and the prevailing wind direction is easterly.
Distinction of wind speeds depending on the wind direction is not observed. The frequency
of calm in winter is fairly high at a rate of 28%.
3) Lujan de Cuyo and Mendoza Areas
At the Mendoza airport, the mean wind speed in 1999 was about 2.6m/s, and the prevailing
wind direction was southeast. The calm in winter appears at a rate of 19% (#109). The
ground inversion layer and the upper air temperature inversion layer are formed in Mendoza
and its vicinities in consequence of the Zonda (dry and warm local wind in winter) and both
layers cause reportedly the air pollution problem with a high concentration of pollutants
(#159). In the third Field Work, we contacted the author of the paper #159, to confirm the
relationship between the Zonda and the air pollution with a high concentration of pollutants.
According to his comments, the description of the paper had inaccuracies and the
concentration of pollutants diminishes when the Zonda blows.

S5.16
5.3.4 Air Quality Data
1) Buenos Aires
The air quality data of the manual analysis for NOx, TSP and SO2 implemented in the
second Field Work (Summer) were analyzed (Tables 5.2.4 and 5.2.5). With regard to the
time series behavior of hourly NOx concentration, generally it was low at night and high
during the day, and a peak was observed at 16 LT with the maximum value of 0.03 ppm.
The peak at 16 LT was recognized at 5 sites*). The wind speed and direction at the peak
time, were 3m/s and the east, respectively. Considering the location of the large factories in
relation to the measuring sites, it is estimated that the peak arose under the influence of
vehicular emission (Figure 1 and 2 in S5-A40). The NOx concentration during the First Air
Quality Monitoring (Summer) was below the environmental standard of the city of 0.21ppm
(20min) and0.05 ppm (1day).
*) The 5 sites are Dines, Hospital Alemán, Casa Marilla, Metro Gas and Garhan.
Regarding the daily variation of TSP, it was the highest on Saturday, with the maximum
daily value of 0.13 mg/m3, and the lowest on Sunday. The site No.1 (Dines) always
marked higher value than the other sites during the Monitoring. This can be attributed to the
vehicular emission. Comparing with the level of San Nicolas and Lujan de Cuyo, however,
the TSP concentration is rather low. The TSP during the First Air Quality Monitoring
(Summer) was also below the standard of the city of 0.15 mg/m3 (1day).
According to the result of the manual analysis, the hourly SO2 concentration marked
0.38ppm (1hr) at its highest, although it was below the national environmental standard
1ppm (1hr). No difference of concentration depending on the wind direction and speed was
recognized during the Field Work (Figure 3 and 4 in S5-A40).
The air quality data of the measurement implemented in Winter were analyzed in Tables
5.2.4 and 5.2.6.
The hourly data of the manual analysis for NOx in winter were extremely higher and
nearly double of that in summer. It is inferred that the height of the mixed layer caused the
high concentration in winter (#102). The maximum level of NOx during the third Field Work
(Winter) was 0.12ppm (1hr) and 0.05ppm (1day), which didn’t exceed the environmental
standard for the city of 0.05ppm (1day) and 0.21ppm (20min). Regarding the meteorological
conditions at the time, the wind speed was 3.5m/s and the Pasquill atmospheric stability
Class was BC. A difference of concentration depending on the wind direction was not
recognized during the measuring period because of the scant wind. The concentration
showed a tendency to be low on Sundays (Figure 13 and 14 in S5-A40).

S5.17
The daily mean concentration of TSP in winter was slightly higher than the
measurement result in summer. The maximum value marked was 0.16mg/m3 (1day), which
was over the environmental standard for the city of 0.15mg/m3 (1day), although it was below
the environmental standard for the city of 0.5 mg/m3 (20min). The concentration tended to
be low on Sundays.
According to the hourly data of the manual analysis, the maximum SO2 concentrations
marked 0.48 ppm (1hr) and 0.16ppm (1day), which exceeded the environmental standard for
the city 0.19 ppm (20min) and 0.027ppm (1hr), although it was below the national
environmental standard 1ppm (1hr). No difference of concentration depending on the wind
direction and speed was recognized during the Field Work. (Figure 15 and 16 in S5-A40)
According to the result of past measurements implemented by Buenos Aires City in
1998 (#82), the annual monthly mean of NOx concentration at “Estacion : Av. Las Herasy y
O. De Ocampo” was 0.11ppm, which exceeded the environmental standard for the city of
Buenos Aires (0.05ppm, 1day). In order to realize a commensurate comparison between the
NOx concentration data and the environmental standard value, the Larsen model was applied
to estimate the values of 24hrs and 1hr, using the monthly mean values (Table 1 in S5-A42).
According to the estimation by the Larsen model, the mean concentration of 1hr was
0.09ppm and the value at the standard deviation point was 0.15ppm. The maximum value
was estimated at 0.57ppm, while the national environmental standard of NOx is 0.45ppm
(1hr). As a result, it can be assumed that the maximum value would go beyond the national
environmental standard. Regarding the value of 24 hours, the mean concentration was
estimated by the Larsen model at 0.10ppm, at the standard deviation point at 0.12ppm and
the maximum value at 0.16ppm, while the national environmental standard is 0.15ppm
(1day) and the environmental standard for city is 0.05 ppm. It can also be assumed that the
maximum value would go beyond the national and civic environmental standard. It is
difficult to estimate maximum concentration using the Larsen model. According to an
accuracy check of the Larsen model using a known hourly dataset (1year) measured in
Tokyo, an error of maximum concentration comes from that of estimated standard deviation.
The concentrations of TSP and NOx obtained by the Monitoring were nearly equal to the
results of the measurement implemented in the World Bank project “the Air Quality
Situation in the Gran Buenos Aires area” (#98). Accordingly it can be considered that the
air pollution has not increased in Buenos Aires in the past several years.
2) San Nicolas
The air quality data of the manual analysis for NOx, TSP and SO2 implemented in the second
Field Work (Summer) were analyzed (Tables 5.2.4 and 5.2.5).

S5.18
The hourly NOx concentration during the Monitoring was below the provincial
environmental standard 0.2 ppm (1hr), and marked 0.023 ppm (1hr) at the highest. Any
particular patterns were not recognized for the time series behavior of NOx concentration
(Figures 5 and 6 in S5-A40).
Regarding the daily variation of TSP, it was high on weekdays, with the maximum
hourly data of 0.23 mg/m3 (1day), and low at the weekend. The maximum concentration
exceeded the national environmental standard of 0.15 mg/m3 (1month). The site No.5
(B’Family) always marked higher values than the other sites during the second Field Work.
The cause is considered to be a natural origination because the site is situated in a residential
area
The hourly SO2 concentration during the First Air Quality Monitoring (Summer) was
below the provincial standard 0.50 ppm (3 hrs), and marked 0.11 ppm at the highest. Any
particular patterns were not recognized for the time series behavior of SO2 concentration.
As for the relation between the SO2 concentration and the wind speed and direction, the
highest concentration was observed at 2m/s of wind speed and in north-northwestern (Figure
7 and 8 in S5-A40). Factories were situated to the north of the site where the highest value
was observed.
The air quality data of the measurement implemented in Winter were analyzed in Tables
5.2.4 and 5.2.6.
The measurement result of the manual analysis for hourly NOx in winter was extremely
higher and nearly double of that in summer. The maximum level of NOx during the third
Field Work (Winter) was 0.05ppm (1hr), which was below the provincial environmental
standard of Buenos Aires 0.2ppm (1hr). During the measurement period it was recognized
that the concentration increased when the wind speed weakened. The concentration tended
to be high when the wind direction was the northeast. (Figure 17 and 18 in S5-A40)
The daily mean concentration of TSP measured in winter (0.25mg/m3 at the maximum)
had almost the same trend as the measurement result in summer. A tendency was not
recognized for the concentration to be low on Sundays. The maximum concentration
exceeded the national environmental standard of 0.15 mg/m3 (1 month).
The hourly SO2 concentration during the Second Air Quality Monitoring (Winter) was
below the provincial environmental standard 0.50 ppm (3 hrs), and marked 0.21 ppm (1hr) at
the highest. No difference of concentration depending on the wind direction and speed was
recognized during the Field Work except for a few data. (Figure 19 and 20 in S5-A40).
Universida Technologica Nacional (UTN) is carrying out air quality monitoring in San
Nicolas sponsored by the Central Termica San Nicolas. The Central Termica San Nicolas
did not want to open the air quality data to this Study.

S5.19
3) Lujan de Cuyo and Mendoza
The air quality data of the manual analysis for NOx, TSP and SO2 at Lujan de Cuyo
implemented in the First Air Quality Monitoring (Summer) were analyzed (Tables 5.2.4 and
5.2.5). The hourly NOx concentration was below the national environmental standard of
0.45 ppm (1hr). With regard to the time series behavior of NOx concentration, it was low at
night and high during the day, and a peak was observed at 16 LT with the maximum value of
0.02ppm. The peak at 16 LT was recognized at 6 sites*). Considering the location of
these sites, the NOx concentration was high all over the area. The wind speed and direction
at the peak time, were 5m/s and the east respectively, while the Pasquill atmospheric
stability Class was B. At the peak time the concentration was elevated because the
insolation was strong and the atmospheric state was unstable (Figure 9 and 10 in S5-A40).
*) The 6 sites are Hotel Rio, Tarnsba, Tanque, B’Family, Aeroclub, and Casa de Mina.
Regarding the daily variation of TSP, it was high on weekdays, with the maximum value
of 0.44 mg/m3, and low at the weekend. The site No.2 (ACSA) always marked higher
values than the other sites during the Monitoring. The maximum concentration exceeded the
national environmental standard of 0.15 mg/m3 (1 month).
According to the result of the manual analysis, the hourly SO2 concentration marked
0.17ppm at the highest, which was below the national environmental standard 1.0 ppm (1hr).
During the measurement period a tendency was recognized for the concentration to increase
when the wind speed weakened. The concentration tended to be high when the wind
direction was the west and the east. A tendency was not recognized which elevated the
concentration when the wind blew from the west as the result of NOx concentration (Figure
11 and 12 in S5-A40).
The air quality data of the measurement implemented in Winter were analyzed in Tables
5.2.4 and 5.2.6.
The measurement result of the manual analysis for hourly NOx in winter was extremely
higher and nearly double of that in summer. The maximum level of NOx during the Field
Work (Winter) was 0.04ppm (1hr), which was below the national environmental standard of
0.45 ppm (1hr). During the measurement period a tendency was recognized for the
concentration to increase when the wind speed weakened. Depending on the wind direction,
no difference of concentration was recognized (Figure 21 and 22 in S5-A40).
The daily mean concentration of TSP measured in winter (0.35mg/m3 at the maximum)
tended to be lower than the measurement result in summer. The maximum concentration
exceeded the national environmental standard of 0.15 mg/m3 (1 month). A tendency was not
recognized for the concentration to be low on Sundays.
According to the result of the manual analysis, the hourly SO2 concentration marked

S5.20
0.32 ppm at the highest, which was below the national environmental standard of 1.0 ppm
(1hr). No difference of concentration depending on the wind direction and speed was
recognized during the Field Work (Figure 23 and 24 in S5-A40).
Table 5.3.2 Concentration of Pollutants in Mendoza Urban AreaIntersection of San Juan St.
and Lavalle St.Godoy Cruz
government plazaSan Martin
general parkTSP period average max
1987-19940.138 mg/m3
0.721 mg/m3
1992-19940.42 mg/m3
-
1991-19940.009 mg/m3
0.179 mg/m3
SO2 period average max
1987-19940.0019ppm0.26ppm
1992-19940.0006ppm
2.7ppm
1991-19940.0009ppm0.009ppm
NOx period average max
1987-199428.25μg/m3
988μg/m3
1992-199415.6μg/m3
-
1991-19949.531μg/m3
50μg/m3
The measurement of air quality in Mendoza was implemented by the Instituto de
Estudios de Medio Ambiente - University of Mendoza and the Dirección de Saneamiento y
Control Ambiental del Ministerio de Medio Ambiente, Urbanismo y Vivienda (#160).
Table 5.3.2 shows the summary of the results. The measurement data of NOx and TSP are
daily mean and measurement data of SO2 is weekly mean. It is indicated that the principal
source of pollutants is vehicular emission. Considering the seasonal change, the
concentration of pollutant becomes the highest in winter.
The monthly concentrations of NOx (obtained at 5 sites) and TSP (obtained at 4 sites) in
Mendoza City was analyzed (Table2 and 3 in S5-A42). In order to uniform averaging
times and evaluate the actual situation of conformance to the environmental standard, the
Larsen model was applied to estimate the daily and hourly mean values and the standard
deviation from the monthly mean values. The maximum value of NOx concentration was
estimated 0.14 ppm at the site No.20, and its value is near the national environmental
standard 0.15 ppm (1day). As a result, regarding the NOx concentration it is assumable that
neither hourly nor daily mean values would go beyond the national environmental standard.
As for TSP, maximum monthly value (0.196 mg/m3) was observed at the site No.22
(Patricias Mendocinas), and the monthly mean exceeded the national standard (0.15 mg/m3).
It is considered to be due to the frequent departure and arrival of buses.
4) Achievement of the Environmental Standards in Three Cities.
Achievement of the environmental standards in Buenos Aires, San Nicolas and Lujan de
Cuyo using the air quality data implemented in the Field Works (Summer and Winter) was
shown in Table 5.3.3.

S5.21
Table 5.3.3 Achievement of the Environmental Standards
Buenos Aires San Nicolas Lujan de CuyoSummer Winter summer Winter summer winter
〇0.02/0.05
(1day/1day C)
〇0.05/0.05
(1day/1day C)
NOx(ppm)
〇0.03/0.21
(1h/20min C)
〇0.12/0.21
(1h/20min C)
〇0.02/0.2
(1h/1h PB)
〇0.05/0.2
(1h/1h PB)
〇0.02/0.45(1h/1h N)
〇0.04/0.45(1h/1h N)
〇0.13/0.15
(1day/1day C)
×0.16/0.15
(1day/1day C)
〇0.14/0.15
(7day/1mon N)
〇0.15/0.15
(7day/1mon N)
TSP(mg/m3)
〇0.13/0.5(1day/
20min C)
〇0.16/0.5(1day/
20min C)
〇0.23/0.15
(1day/1mon N)
〇0.25/0.15
(1day/1mon N)
×0.27/0.15
(7day/1mon N)
〇0.17/0.15
(7day/1mon N)
×0.10/0.027
(1day/1day C)
×0.16/0.027
(1day/1day C)
〇0.11/0.5
(1h/3h PB)
〇0.21/0.5
(1h/3h PB)×
0.38/0.19(1h/20min C)
×0.48/0.19
(1h/20min C)
SO2(ppm)
〇0.38/1.0
(1h/1h N)
〇0.48/1.0
(1h/1h N)
〇0.11/1.0
(1h/1h N)
〇0.21/1.0
(1h/1h N)
〇0.17/1.0
(1h/1h N)
〇0.32/1.0
(1h/1h N)
〇:This marks below the environmental standard.
×:This marks over the environmental standard.
N :The National environmental standard
C : The environmental standard for Buenos Aires
PB : The environmental standard for province of Buenos Aires
Numerator of fractional number : maximum concentration during air quality monitoring.
Denominator of fractional number: concentration of the environmental standard.
Fraction in parenthesis : Sampling time (numerator) and averaging time in environmental standard
(denominator).

S5.22
S5-A1 Buenos Aires Manual Monitoring Data(3.2001)
No 1 No 2 No 3 No 4 No 5 No 6 No 7 No 8 No 9
hr SO2 NOx TSP SO2 NOx TSP SO2 NOx TSP SO2 NOx TSP SO2 NOx TSP SO2 NOx TSP SO2 NOx TSP SO2 NOx TSP SO2 NOx TSP
12 - - - - - - - - - - - - - - - -16 250.8 58.15 217.5 51.36 154.2 37.95 291.7 32.4 34.2 57.36 174.2 59.32 69.2 54.63 - -20 92.5 <4 99.2 <4 100.8 <4 166.7 <4 241.7 <4 92.5 <4 131.7 <4 - -Av
0 86.7 ND 79.2 ND 116.7 ND 74.2 ND 119.2 ND 63.3 ND 107.5 ND - -4 80 <4 283.3 <4 70 <4 150.8 <4 84.2 4.54 106.7 <4 39.2 <4 - -8 59.2 <4 166.7 <4 133 8.67 79.2 8.29 152.5 <4 91.7 <4 71.7 <4 - -12 216..7 5.21 225 5.25 118.3 <4 275 <4 283.3 <4 91.7 7.81 45 <4 - -16 104.2 <4 147.5 19.5 225 13.17 109.2 11 200 10.37 100.8 7.55 100.8 16.6 - -20 200 <4 64.2 <4 150.8 5.65 105.8 <4 188.3 <4 92.5 <4 74.2 <4 - -Av
0 266.7 <4 233.3 <4 208.3 5.65 49.2 <4 241.7 <4 65.8 <4 87.5 <4 - -4 106.7 <4 50.8 <4 25 <4 85 <4 50.8 <4 54.2 <4 109.2 <4 - -8 67.5 5.31 76.7 8.74 156.7 10.98 52.5 7.55 160.8 <4 46.7 <4 59.2 5.79 - -12 85.8 4.46 63.3 13.36 123.3 18.17 45.8 12.41 64.2 11.1 79.2 7.32 45 7 - -16 48.3 7.93 55 12.41 57.5 13.17 47.5 8.51 39.2 6.84 72.5 8.22 166.7 5.22 - -20 241.7 <4 358.3 <4 1009 5.79 65 <4 165.8 <4 156.7 <4 52.5 <4 - -Av
0 105 <4 70 <4 130.8 <4 68.3 <4 37.5 <4 250 <4 159.2 <4 - -4 119.2 <4 87.5 <4 73.3 <4 67.5 <4 89.2 <4 104.2 <4 75.8 <4 - -8 127.5 <4 65.8 <4 120.8 4.93 107.5 <4 165.8 <4 89.2 <4 120 <4 - -12 99.2 <4 154.2 <4 268.3 <4 93.3 <4 80.8 <4 110.8 <4 110.8 <4 - -16 88.3 <4 130.8 <4 233.3 <4 114.2 <4 92.5 <4 94.2 <4 150.8 <4 - -20 84.2 6.79 78.3 8.55 64.2 5.79 106.7 6.84 160.8 <4 65 <4 125.8 <4 - -Av0 258.3 <4 144.2 5.5 52.5 <4 102.5 <4 118.3 <4 105 <4 275 <4 - -4 119.2 <4 81.7 <4 115 <4 76.7 <4 83.3 <4 30.8 <4 59.2 <4 - -8 135 5.55 58.3 9.84 65 12.43 122.5 11.27 114.2 7.12 79.2 <4 81.7 8.17 - -12 125.8 12.46 58.3 8.17 58.3 12.12 55.8 11.84 75.8 8.7 137.5 <4 95 11.93 - -16 72.5 13.98 258.3 5.46 360 12.31 144.2 16.1 89.2 11.07 52.5 10.65 87.5 12.17 - -20 65.8 15.12 100.8 25.49 94.2 25.36 72.5 20.36 78.3 19.27 65.8 14.5 90 17.98 - -Av
0 275 6.27 54.2 13.36 127.5 ND 72.5 6.79 70.8 7.32 167.5 6 122.5 8.89 - -4 110 <4 62.5 <4 125.8 ND 85.8 <4 125.8 <4 91.7 <4 89.2 <4 - -8 155.8 5.79 82.5 <4 70 ND 64.2 16.93 92.5 9.56 157.5 9.1 125.8 7.7 - -12 152.5 <4 59.2 <4 130.8 ND 72.5 <4 172.5 12.12 93.3 7.46 408.3 6.41 - -16 153.3 5.05 96.7 26.19 64.2 31.32 57.5 28.65 100.8 16.66 90.8 12.14 550 22.38 - -20 178.3 <4 104.2 <4 92.5 <4 111.7 <4 30.8 <4 94.2 <4 59.2 <4 - -Av0 132.5 <4 107.5 <4 54.2 <4 47.5 <4 92.5 <4 115.8 <4 79.2 <4 - -4 366.7 <4 67.5 6.63 61.7 <4 35.8 <4 41.7 12.3 79.2 5.38 42.5 4.94 - -8 65 10.88 37.5 18.4 152.5 10.23 44.2 17.8 69.2 <4 52.5 5.65 70.8 7.94 - -12 69.2 20 93.3 36.88 70 9.3 54.2 12.03 65 4.94 111.7 <4 35.8 5.22 - -16 118.3 <4 39.2 7.45 94.2 7.22 56.7 9.36 106.7 6.9 233.3 <4 70 <4 - -20 558.3 <4 73.3 <4 37.5 <4 50 <4 70.8 <4 57.5 <4 79.2 <4 - -Av0 50.8 <4 45.8 <4 139.2 <4 66.7 <4 84.2 <4 111.7 <4 52.5 <4 - -4 45.8 <4 86.7 <4 39.2 <4 82.5 <4 52.5 <4 64.2 <4 150 <4 - -8 64.2 <4 110.8 <4 139.2 17.7 42.5 5.32 75.8 <4 74.2 <4 55 <4 - -
3/8
3/9
3/10
3/11
53
100
64
7480
56
65
68
53
76 50 56
9580129
70 50
103
91
53
6288
54
49 55
8294
49
45
62 -
60
50
3/15
90 53 60
61 50
102
3/14
3/12
3/13
63 60 55 59 70 50
μg/m3
98
58 77 82

S5.23
S5-A2 Buenos Aires Automatic Data (Summer)day hour PM(Mg/m3) GSR(w/m2) SO2(ppm) NO(ppm) NO2(ppm) NOx(ppm) CO(ppm) day hour PM(Mg/m3) GSR(w/m2) SO2(ppm) NO(ppm) NO2(ppm) NOx(ppm) CO(ppm)03/08/2001 11:06 0.000 762 - 0.003 0.001 0.004 0.000 03/12/2001 06:06 0.007 0 0.025 0.011 <0.004 0.008 0.19003/08/2001 12:06 0.001 836 0.034 0.025 <0.004 0.020 0.400 03/12/2001 07:06 0.007 13 0.025 0.025 <0.004 0.019 0.54003/08/2001 13:06 0.001 853 0.032 0.024 <0.004 0.021 0.670 03/12/2001 08:06 0.007 108 0.025 0.038 <0.004 0.026 0.67003/08/2001 14:06 0.002 808 0.030 0.018 <0.004 0.016 0.430 03/12/2001 09:06 0.007 171 0.025 0.052 <0.004 0.034 0.84003/08/2001 15:06 0.002 675 0.030 0.046 <0.004 0.034 0.610 03/12/2001 10:06 0.008 656 0.024 0.045 <0.004 0.030 0.89003/08/2001 16:06 0.002 582 0.029 0.060 <0.004 0.045 0.720 03/12/2001 11:06 0.000 464 0.024 0.038 <0.004 0.027 0.56003/08/2001 17:06 0.003 336 0.029 0.030 <0.004 0.025 0.490 03/12/2001 12:06 0.001 810 0.023 0.030 <0.004 0.022 0.52003/08/2001 18:06 0.003 133 0.029 0.043 <0.004 0.034 0.820 03/12/2001 13:06 0.001 281 0.023 0.031 <0.004 0.022 0.61003/08/2001 19:06 0.003 2 0.029 0.077 <0.004 0.056 1.240 03/12/2001 14:06 0.001 903 0.023 0.036 <0.004 0.026 0.71003/08/2001 20:06 0.004 0 0.028 0.044 <0.004 0.034 0.870 03/12/2001 15:06 0.002 664 0.023 0.027 <0.004 0.019 0.74003/08/2001 21:06 0.004 0 0.020 0.040 <0.004 0.034 0.920 03/12/2001 16:06 0.002 506 0.023 0.045 <0.004 0.033 0.68003/08/2001 22:06 0.005 0 0.028 0.032 <0.004 0.028 0.670 03/12/2001 17:06 0.002 318 0.023 0.043 <0.004 0.032 0.65003/08/2001 23:06 0.005 0 0.030 0.016 0.001 0.018 0.620 03/12/2001 18:06 0.003 120 0.022 0.039 <0.004 0.031 0.82003/09/2001 00:06 0.006 0 0.030 0.019 <0.004 0.019 0.440 03/12/2001 19:06 0.003 0 0.024 0.050 <0.004 0.043 0.89003/09/2001 01:06 0.006 0 0.030 0.014 <0.004 0.015 0.530 03/12/2001 20:06 0.004 0 0.024 0.060 <0.004 0.045 1.13003/09/2001 02:06 0.006 0 0.030 0.013 <0.004 0.013 0.390 03/12/2001 21:06 0.004 0 0.023 0.060 <0.004 0.043 1.00003/09/2001 03:06 0.006 0 0.030 0.007 <0.004 0.008 0.300 03/12/2001 22:06 0.005 0 0.024 0.063 <0.004 0.043 0.80003/09/2001 04:06 0.006 0 0.030 0.009 <0.004 0.009 0.350 03/12/2001 23:06 0.005 0 0.022 0.034 <0.004 0.025 0.72003/09/2001 05:06 0.007 0 0.032 0.009 <0.004 0.009 0.350 03/13/2001 00:06 0.005 0 0.022 0.055 <0.004 0.036 0.43003/09/2001 06:06 0.007 0 0.030 0.015 <0.004 0.012 0.390 03/13/2001 01:06 0.005 0 0.022 0.051 <0.004 0.038 0.47003/09/2001 07:06 0.008 17 0.032 0.050 <0.004 0.033 0.530 03/13/2001 02:06 0.005 0 0.022 0.011 <0.004 0.009 0.13003/09/2001 08:06 0.008 54 0.031 0.046 <0.004 0.032 0.930 03/13/2001 03:06 0.006 0 0.022 0.006 <0.004 0.006 0.20003/09/2001 09:06 0.009 378 0.032 0.050 <0.004 0.034 1.300 03/13/2001 04:06 0.006 0 0.023 0.007 <0.004 0.006 0.14003/09/2001 10:06 0.009 645 0.031 0.050 <0.004 0.033 1.360 03/13/2001 05:06 0.006 0 0.023 0.009 <0.004 0.007 0.16003/09/2001 11:06 0.000 880 0.031 0.063 <0.004 0.041 0.910 03/13/2001 06:06 0.006 0 0.022 0.014 <0.004 0.012 0.26003/09/2001 12:06 0.001 829 0.030 0.025 <0.004 0.020 0.680 03/13/2001 07:06 0.007 14 0.022 0.050 <0.004 0.032 0.41003/09/2001 13:06 0.001 835 0.030 0.025 <0.004 0.021 1.230 03/13/2001 08:06 0.007 215 0.022 0.044 <0.004 0.028 0.57003/09/2001 14:06 0.002 788 0.031 0.048 <0.004 0.031 0.580 03/13/2001 09:06 0.008 504 0.022 0.036 <0.004 0.024 0.73003/09/2001 15:06 0.002 871 0.029 0.087 <0.004 0.057 0.600 03/13/2001 10:06 0.008 714 0.021 0.069 <0.004 0.044 0.99003/09/2001 16:06 0.003 513 0.028 0.084 <0.004 0.056 0.730 03/13/2001 11:06 0.000 692 0.022 0.040 <0.004 0.028 0.76003/09/2001 17:06 0.004 325 0.028 0.050 <0.004 0.037 0.600 03/13/2001 12:06 0.001 766 0.022 0.072 <0.004 0.047 0.83003/09/2001 18:06 0.004 129 0.028 0.038 <0.004 0.029 0.750 03/13/2001 13:06 0.001 797 0.022 0.031 <0.004 0.024 0.60003/09/2001 19:06 0.005 2 0.027 0.070 <0.004 0.049 0.910 03/13/2001 14:06 0.001 154 0.021 0.053 <0.004 0.038 0.88003/09/2001 20:06 0.005 0 0.027 0.070 <0.004 0.050 1.260 03/13/2001 15:06 0.001 621 0.020 0.033 <0.004 0.025 0.46003/09/2001 21:06 0.006 0 0.027 0.054 <0.004 0.040 1.210 03/13/2001 16:06 0.002 458 0.020 0.036 <0.004 0.026 0.72003/09/2001 22:06 0.007 0 0.027 0.074 <0.004 0.050 0.720 03/13/2001 17:06 0.002 256 0.020 0.067 <0.004 0.047 1.04003/09/2001 23:06 0.007 0 0.027 0.030 <0.004 0.024 0.690 03/13/2001 18:06 0.003 80 0.020 0.037 <0.004 0.029 1.09003/10/2001 00:06 0.008 0 0.027 0.021 <0.004 0.018 0.430 03/13/2001 19:06 0.003 0 0.021 0.085 <0.004 0.057 1.23003/10/2001 01:06 0.009 0 0.027 0.022 <0.004 0.019 0.670 03/13/2001 20:06 0.008 0 0.020 0.097 <0.004 0.090 1.73003/10/2001 02:06 0.009 0 0.026 0.027 <0.004 0.020 0.490 03/13/2001 21:06 0.005 0 0.021 0.072 <0.004 0.056 1.73003/10/2001 03:06 0.010 0 0.027 0.020 <0.004 0.016 0.560 03/13/2001 22:06 0.006 0 0.020 0.049 <0.004 0.041 1.22003/10/2001 04:06 0.010 0 0.027 0.012 <0.004 0.011 0.380 03/13/2001 23:06 0.006 0 0.021 0.040 <0.004 0.032 1.00003/10/2001 05:06 0.010 0 0.028 0.024 <0.004 0.017 0.470 03/14/2001 00:06 0.007 0 0.022 0.028 <0.004 0.025 0.82003/10/2001 06:06 0.011 0 0.028 0.021 <0.004 0.015 0.460 03/14/2001 01:06 0.007 0 0.021 0.025 <0.004 0.022 0.62003/10/2001 07:06 0.011 22 0.028 0.030 <0.004 0.021 0.390 03/14/2001 02:06 0.008 0 0.021 0.012 <0.004 0.014 0.49003/10/2001 08:06 0.011 144 0.027 0.028 <0.004 0.020 0.520 03/14/2001 03:06 0.008 0 0.021 0.011 <0.004 0.011 0.21003/10/2001 09:06 0.011 272 0.027 0.029 <0.004 0.021 0.500 03/14/2001 04:06 0.008 0 0.022 0.010 <0.004 0.011 0.17003/10/2001 10:06 0.012 109 0.029 0.017 <0.004 0.015 0.400 03/14/2001 05:06 0.009 0 0.013 0.013 <0.004 0.013 0.26003/10/2001 11:06 0.000 489 0.027 0.042 <0.004 0.032 0.750 03/14/2001 06:06 0.009 0 0.022 0.030 <0.004 0.023 0.29003/10/2001 12:06 0.001 285 0.026 0.027 <0.004 0.025 0.790 03/14/2001 07:06 0.009 13 0.021 0.062 <0.004 0.041 0.62003/10/2001 13:06 0.002 307 0.026 0.039 <0.004 0.036 0.690 03/14/2001 08:06 0.009 192 0.021 0.089 <0.004 0.056 1.29003/10/2001 14:06 0.002 144 0.025 0.017 <0.004 0.022 0.900 03/14/2001 09:06 0.010 473 0.022 0.083 <0.004 0.053 1.15003/10/2001 15:06 0.003 100 0.024 0.011 <0.004 0.015 0.530 03/14/2001 10:06 0.011 580 0.021 0.051 <0.004 0.035 1.10003/10/2001 16:06 0.003 117 0.026 0.043 <0.004 0.035 0.770 03/14/2001 11:06 0.000 713 0.021 0.052 <0.004 0.037 0.86003/10/2001 17:06 0.004 358 0.028 0.024 <0.004 0.025 0.770 03/14/2001 12:06 0.001 796 0.021 0.047 <0.004 0.034 0.78003/10/2001 18:06 0.004 59 0.024 0.042 <0.004 0.035 0.830 03/14/2001 13:06 0.001 809 0.020 0.034 <0.004 0.025 0.36003/10/2001 19:06 0.005 0 0.025 0.034 <0.004 0.032 1.020 03/14/2001 14:06 0.001 764 0.020 0.026 <0.004 0.021 0.49003/10/2001 20:06 0.005 0 0.025 0.023 <0.004 0.023 0.830 03/14/2001 15:06 0.002 652 0.021 0.032 <0.004 0.025 0.24003/10/2001 21:06 0.006 0 0.024 0.032 <0.004 0.028 1.050 03/14/2001 16:06 0.002 492 0.019 0.035 <0.004 0.028 0.48003/10/2001 22:06 0.006 0 0.026 0.026 <0.004 0.024 0.860 03/14/2001 17:06 0.002 305 0.020 0.053 <0.004 0.038 0.72003/10/2001 23:06 0.007 0 0.027 0.017 <0.004 0.018 0.620 03/14/2001 18:06 0.003 112 0.019 0.037 <0.004 0.028 0.88003/11/2001 00:06 0.007 0 0.020 0.016 <0.004 0.017 0.480 03/14/2001 19:06 0.003 0 0.019 0.040 <0.004 0.037 1.22003/11/2001 01:06 0.006 0 0.026 0.010 <0.004 0.013 0.450 03/14/2001 20:06 0.004 0 0.019 0.049 <0.004 0.037 0.96003/11/2001 02:06 0.008 0 0.026 0.009 <0.004 0.009 0.390 03/14/2001 21:06 0.005 0 0.019 0.028 <0.004 0.025 0.76003/11/2001 03:06 0.008 0 0.026 0.007 <0.004 0.007 0.230 03/14/2001 22:06 0.005 0 0.019 0.029 <0.004 0.259 0.61003/11/2001 04:06 0.008 0 0.027 0.008 <0.004 0.009 0.190 03/14/2001 23:06 0.005 0 0.020 0.014 <0.004 0.015 0.49003/11/2001 05:06 0.009 0 0.027 0.010 <0.004 0.010 0.220 03/15/2001 00:06 0.005 0 0.020 0.014 <0.004 0.014 0.46003/11/2001 08:06 0.009 0 0.028 0.011 <0.004 0.011 0.200 03/15/2001 01:06 0.006 0 0.021 0.016 <0.004 0.015 0.37003/11/2001 07:06 0.009 39 0.029 0.007 <0.004 0.009 0.270 03/15/2001 02:06 0.006 0 0.021 0.021 <0.004 0.018 0.31003/11/2001 08:06 0.009 101 0.028 0.009 <0.004 0.009 0.220 03/15/2001 03:06 0.006 0 0.021 0.010 <0.004 0.010 0.38003/11/2001 09:06 0.009 193 0.028 0.010 <0.004 0.010 0.280 03/15/2001 04:06 0.007 0 0.022 0.010 <0.004 0.009 0.27003/11/2001 10:06 0.010 162 0.028 0.014 <0.004 0.012 0.230 03/15/2001 05:06 0.007 0 0.021 0.010 <0.004 0.009 0.31003/11/2001 11:06 0.000 250 0.026 0.012 <0.004 0.012 0.220 03/15/2001 06:06 0.007 0 0.020 0.027 <0.004 0.020 0.28003/11/2001 12:06 0.001 68 0.026 0.020 <0.004 0.018 0.760 03/15/2001 07:06 0.007 13 0.020 0.068 <0.004 0.042 0.50003/11/2001 13:06 0.001 45 0.025 0.013 <0.004 0.014 0.500 03/15/2001 08:06 0.008 59 0.019 0.062 <0.004 0.041 1.20003/11/2001 14:06 0.002 150 0.027 0.023 <0.004 0.019 0.680 03/15/2001 09:06 0.009 276 0.020 0.071 <0.004 0.044 1.77003/11/2001 15:06 0.002 131 0.026 0.017 <0.004 0.017 0.550 03/15/2001 10:06 0.009 609 0.020 0.051 <0.004 0.035 1.02003/11/2001 16:06 0.003 104 0.025 0.015 <0.004 0.015 0.490 03/15/2001 11:06 0.000 705 0.020 0.029 <0.004 0.023 3.07003/11/2001 17:06 0.003 88 0.025 0.011 <0.004 0.011 0.490 03/15/2001 12:06 0.001 778 0.018 0.096 <0.004 0.061 0.62003/11/2001 18:06 0.003 36 0.025 0.021 <0.004 0.018 0.490 03/15/2001 13:06 0.002 292 0.019 0.071 <0.004 0.049 1.00003/11/2001 19:06 0.004 0 0.024 0.024 <0.004 0.021 0.630 03/15/2001 14:06 0.002 307 0.019 0.039 <0.004 0.036 1.04003/11/2001 20:06 0.004 0 0.024 0.031 <0.004 0.024 0.740 03/15/2001 15:06 0.003 578 0.018 0.028 <0.004 0.028 0.91003/11/2001 21:06 0.005 0 0.025 0.031 <0.004 0.024 0.540 03/15/2001 16:06 0.003 433 0.018 0.036 <0.004 0.036 0.82003/11/2001 22:06 0.006 0 0.024 0.023 <0.004 0.020 0.540 03/15/2001 17:06 0.004 247 0.017 0.034 <0.004 0.030 0.84003/11/2001 23:06 0.005 0 0.025 0.032 <0.004 0.024 0.520 03/15/2001 18:06 0.004 80 0.017 0.054 <0.004 0.041 1.05003/12/2001 00:06 0.006 0 0.024 0.026 <0.004 0.021 0.510 03/15/2001 19:06 0.005 0 0.018 0.041 <0.004 0.033 0.78003/12/2001 01:06 0.006 0 0.025 0.027 <0.004 0.022 0.520 03/15/2001 20:06 0.005 0 0.019 0.027 <0.004 0.023 0.79003/12/2001 02:06 0.006 0 0.025 0.010 <0.004 0.009 0.260 03/15/2001 21:06 0.006 0 0.019 0.380 <0.004 0.030 0.77003/12/2001 03:06 0.006 0 0.025 0.070 <0.004 0.006 0.190 03/15/2001 22:06 0.006 0 0.020 0.025 <0.004 0.024 0.78003/12/2001 04:06 0.007 0 0.025 0.007 <0.004 0.007 0.060 03/15/2001 23:06 0.006 0 0.019 0.019 <0.004 0.019 0.53003/12/2001 05:06 0.007 0 0.026 0.006 <0.004 0.005 0.180

S5.24
S5-A3 Central Puerto Operation Data (Summer)Consumos diarios calculados por curva de consumo específico.( Valores calculados )
NP5 NP6(27.5+132) PN7 PN8 PN9 CCDam3 Dam3 Dam3 Dam3 Dam3 Dam3
8-Mar 356.91 851.45 0.00 0.00 802.74 3079.509-Mar 399.35 983.11 0.00 0.00 953.71 3058.3910-Mar 358.65 731.40 199.45 281.49 704.55 3012.5511-Mar 338.05 737.48 504.72 594.61 650.08 2913.8912-Mar 346.77 698.58 545.42 594.78 674.29 3019.4113-Mar 411.87 718.54 0.00 689.93 983.84 2530.3514-Mar 340.54 1015.14 0.00 606.02 996.85 2942.2415-Mar 474.63 1088.73 0.00 637.00 1095.21 3028.78
Consumos diarios calculados por curva de consumo específico.( Valores calculados )
NP5 NP6(27.5+132) PN7 PN8 PN9 CCMWH MWH MWH MWH MWH MWh
8-Mar 351.00 796.05 0.00 0.00 757.99 2936.199-Mar 388.98 912.14 0.00 0.00 900.52 2935.7110-Mar 353.63 685.38 165.19 206.25 659.83 2872.3511-Mar 336.39 685.23 503.94 542.60 601.25 2766.1912-Mar 342.87 650.69 536.76 549.71 626.96 2875.8113-Mar 404.31 666.81 0.00 627.57 908.53 2415.5214-Mar 334.83 936.53 0.00 545.47 945.21 2802.5015-Mar 465.09 1002.96 0.00 570.45 1041.86 2878.54
S5-A4 Central Puerto Nuevo and Nuevo Puerto Emission Data (Summer)NAME: CENTRAL PUERTO NUEVO LOCATION: BUENOS AIRES ARGENT STATION ID: 1CHAN NAME O1516 OP-17 S1516 N1516 SO217 NO-17 O2-15 O2-17CHAN UNITS % % PPM PPM PPM PPM % %2001/3/8 Ave. 0.7 0.6 1 -1 3 147 15.3 82001/3/9 Ave. 0.7 0.6 2 -1 4 162 15.3 72001/3/10 Ave 2.0 0.6 9 20 11 131 13.1 72001/3/11 Ave. 1.1 0.6 2 61 4 117 9.9 82001/3/12 Ave. 1.1 0.7 11 55 13 123 9.9 72001/3/13 Ave. 1.0 0.6 2 57 4 167 9.6 72001/3/14 Ave. 0.7 0.6 13 47 15 187 9.2 72001/3/15 Ave 0.8 0.9 9 42 10 179 9.2 6NAME: CENTRAL NUEVO PUERTO LOCATION: BUENOS AIRES ARGENT STATION ID: 2CHAN NAME OP-13 OP-14 SO213 NO-13 SO214 NO-14 O2-13 O2-14CHAN UNITS % % PPM PPM PPM PPM % %2001/3/8 Ave. 2.1 0.5 3 2 27 15 8.6 82001/3/9 Ave. 2.2 0.6 3 2 29 16 7.8 72001/3/10 Ave. 2.5 0.5 3 2 27 14 8.7 82001/3/11 Ave 2.7 0.5 3 2 27 15 8.4 92001/3/12 Ave. 4.5 0.5 3 2 28 17 9.0 102001/3/13 Ave. 6.3 0.7 3 2 28 16 8.3 92001/3/14 Ave. 7.9 0.6 3 2 29 15 9.5 72001/3/15 Ave. 8.6 1.0 5 5 29 15 7.7 7NAME: CALDERA "A LOCATION: CICLO COMBINADO STATION ID: 3CHAN NAME NOXco O2"A" NOX A OPA A NOxno COMBUSTIBLE OBSERVCHAN UNITS ppm % ppm % mg/m3 GAS/DESTILADO2001/3/8 Ave 12.70 13.40 18 1 02001/3/9 Ave 12.40 13.30 18 1 02001/3/10 Ave 11.60 13.40 16 1 02001/3/11 Ave 14.00 13.50 19 1 02001/3/12 Ave 12.30 13.50 17 1 02001/3/13 Ave 12.10 13.40 17 1 02001/3/14 Ave 11.70 13.40 16 0 02001/3/15 Ave 9.30 16.90 16 0 32NAME: CALDERA "B" LOCATION: CICLO COMBINADO STATION ID: 4CHAN NAME NOXco O2"B" NOX B OPA B NOxno COMBUSTIBLE OBSERVCHAN UNITS ppm % ppm % mg/m3 GAS/DESTILADO03/13/01 00:00 12.20 13.40 17 0 23 premix03/13/01 00:24 46.50 13.70 60 0 19< pilot premix03/13/01 02:42 0.10 19.90 0 0 0 F/S03/13/01 08:30 3.30 19.90 1 -1 6 primary03/13/01 08:36 35.60 17.80 21 -1 68 pilote premix03/13/01 09:30 69.40 14.50 82 22 102B pilote premixNAME: CALDERA 15/16 STATION ID: 5 NAME: CALDERA 17 STATION ID: 6 NAME: CALDERA 13 STATION ID: 7CHAN NAME O1516 S1516 N1516 CHAN NAME OP-17 SO217 NO-17 CHAN NAME OP-13 SO213 NO-13 02-13CHAN UNITS % PPM PPM CHAN UNITS % PPM PPM CHAN UNITS % PPM PPM %03/08/01 08:48 0.5 17 -1 03/15/01 09:00 0.7 9 116 03/09/01 11:42 0.8 2 2 803/08/01 09:24 33.8 0 -1 03/15/01 09:30 0.7 6 153 03/09/01 12:00 0.8 2 2 803/08/01 09:30 4.8 -2 -1 03/15/01 09:36 54.1 0 -2 03/09/01 12:18 26.7 2 2 803/10/01 16:00 1.5 3 20 03/15/01 09:48 0.7 8 143 03/09/01 12:42 2.4 3 2 903/10/01 16:30 3.9 14 32 03/09/01 13:00 2.6 3 2 903/10/01 16:36 25.5 4 35 NAME: CALDERA 14 STATION ID: 803/10/01 17:06 8.6 8 23 CHAN NAME OP-14 SO214 NO-14 O2-1403/10/01 17:30 2.6 10 61 CHAN UNITS % PPM PPM %
03/15/01 09:36 0.5 32 20 603/15/01 09:54 54.3 0 -2 003/15/01 10:24 0.5 27 11 6

S5.25
S5-A5 Central Puerto Meteorological Data (Summer)Fecha Hora
TempAire °C
Max°C
Min°C
HpascalVelocidadVientoKm/h
MaxKm/h
DirecViento
SensTermica°C
Recorridodel VientoKm
PuntoRocio°C
IndiceT.H. Fecha Hora
TempAire °C
Max°C
Min°C
HpascalBarometro
VelocidadVientoKm/h
VelocidadMaxKm/h
DireccionViento
SensacionTermica°C
Recorridodel VientoKm
PuntoRocio°C
IndiceT.H.
2001/3/8 0:00 25.6 25.8 25.4 1011.4 25.7 32.2NNE 22.9 12.4 25.6 28.9 2001/3/12 0:00 22.7 22.8 22.3 1016.7 24.1 37SE 19.2 10.9 22.7 252001/3/8 1:00 25.4 25.5 25.3 1011.6 30.6 38.6NNE 22.3 14.5 25.4 28.9 2001/3/12 1:00 23.9 24.1 23.3 1016.9 32.2 43.5ESE 20 15.1 23.9 26.12001/3/8 2:00 25.3 25.3 25.2 1011.8 29 38.6N 22.2 13 25.3 28.9 2001/3/12 2:00 23.9 23.9 23.8 1016.9 32.2 40.2ESE 20 14.8 23.9 26.12001/3/8 3:00 25 25.2 24.9 1011.5 30.6 38.6N 21.7 13.8 25 27.8 2001/3/12 3:00 23.7 23.7 23.6 1016.6 29 38.6ESE 20 13.5 23.7 26.12001/3/8 4:00 24.7 24.9 24.6 1011.7 30.6 40.2N 21.3 14.2 24.7 27.8 2001/3/12 4:00 23.8 23.8 23.6 1016.7 33.8 41.8E 19.7 15.3 23.8 26.12001/3/8 5:00 24.3 24.4 24.3 1011.8 29 35.4N 20.9 13.5 24.3 26.7 2001/3/12 5:00 23.2 23.4 23.1 1017 32.2 41.8E 19 15 23.2 25.62001/3/8 6:00 23.7 23.9 23.6 1012.2 30.6 41.8N 19.9 13.8 23.7 26.1 2001/3/12 6:00 22.7 22.9 22.6 1017.2 25.7 33.8E 19.1 11.4 22.7 252001/3/8 7:00 23.4 23.5 23.3 1013 22.5 32.2NNO 20.3 10.1 23.4 25.6 2001/3/12 7:00 22.6 22.6 22.4 1017.3 19.3 27.4ENE 19.7 9.2 22.6 252001/3/8 8:00 23.2 23.3 23.1 1013.5 19.3 27.4NNO 20.4 8.9 23.2 25.6 2001/3/12 8:00 22.6 22.6 22.5 1017.7 20.9 29ENE 19.4 9.3 22.6 252001/3/8 9:00 23.2 23.3 22.9 1013.5 20.9 27.4N 20.2 9.5 23.2 25.6 2001/3/12 9:00 22.6 22.7 22.5 1018.1 17.7 25.7ENE 19.9 8.2 22.6 252001/3/8 10:00 23.5 23.8 23.3 1013.5 20.9 30.6N 20.7 9.7 23.5 25.6 2001/3/12 10:00 22.2 22.4 22 1018.2 20.9 27.4E 19 9.3 22.2 24.42001/3/8 11:00 24.1 24.7 23.9 1013.6 19.3 29NNO 21.6 8.9 24.1 26.1 2001/3/12 11:00 22.2 22.3 22.1 1018.2 17.7 24.1E 19.4 8.2 22.2 24.42001/3/8 12:00 24.6 25 24.5 1013.5 17.7 24.1N 22.4 7.6 24.6 26.7 2001/3/12 12:00 22.8 22.9 22.6 1017.4 17.7 25.7E 20.2 8.2 22.8 252001/3/8 13:00 24.7 24.8 24.7 1012.8 22.5 32.2N 22.1 10.6 24.7 27.8 2001/3/12 13:00 24.1 24.4 23.5 1016.7 12.9 20.9ENE 22.6 6.3 24.1 26.12001/3/8 14:00 25.4 25.4 25.2 1012.1 20.9 29NNE 23.1 10--- --- 2001/3/12 14:00 24.9 25.2 24.7 1015.7 14.5 25.7E 23.2 6.9 24.9 27.82001/3/8 15:00 25.8 26.1 25.6 1011.4 14.5 20.9NNE 24.4 6.8 25.8 30.6 2001/3/12 15:00 24.1 24.3 24.1 1014.9 20.9 25.7SE 21.4 9.5 24.1 26.12001/3/8 16:00 26.2 26.3 26 1010.3 11.3 14.5NE 25.3 5.1--- --- 2001/3/12 16:00 24.6 24.7 24.4 1014 24.1 30.6SE 21.8 11.1 24.6 26.72001/3/8 17:00 26.4 26.8 26.3 1009.7 11.3 16.1NE 25.6 4.8--- --- 2001/3/12 17:00 25 25.3 24.7 1013.4 24.1 32.2SE 22.3 11.1 --- ---2001/3/8 18:00 26.1 26.2 26 1009.6 16.1 20.9SE 24.4 7.6--- --- 2001/3/12 18:00 24.9 25.1 24.8 1012.8 27.4 35.4SE 21.9 12.9 24.9 27.82001/3/8 19:00 26.2 26.3 26.1 1009.5 12.9 19.3ESE 25.1 6.1--- --- 2001/3/12 19:00 24.9 25 24.7 1012.8 27.4 37SE 21.8 12.9 24.9 27.82001/3/8 20:00 26.4 27.3 26.1 1009.6 17.7 30.6E 24.8 8 26.4 32.2 2001/3/12 20:00 24.9 25 24.8 1012.9 24.1 32.2ESE 22.1 11.4 24.9 27.82001/3/8 21:00 27.3 27.4 27.3 1009.8 30.6 37NNE 25 14.3--- --- 2001/3/12 21:00 25.1 25.2 24.9 1013.4 16.1 24.1ESE 23.2 7.6 25.1 27.82001/3/8 22:00 26.9 27 26.8 1010 27.4 37NNE 24.6 13 26.9 32.2 2001/3/12 22:00 25.3 25.4 25.3 1013.5 14.5 17.7ESE 23.8 6.3 --- ---2001/3/8 23:00 26.4 26.6 26.3 1010 25.7 32.2NE 24.1 12.1 26.4 32.2 2001/3/12 23:00 25.6 25.7 25.6 1013.6 16.1 24.1ENE 23.8 7.4 25.6 28.92001/3/9 0:00 26.1 26.2 25.9 1009.6 29 37NNE 23.4 13.5 26.1 30.6 2001/3/13 0:00 25.6 25.8 25.4 1013.4 35.4 45.1NE 22.3 15.9 25.6 28.92001/3/9 1:00 25.7 25.9 25.5 1009.8 30.6 40.2NNE 22.7 13.7 25.7 28.9 2001/3/13 1:00 24.7 24.8 24.6 1013.8 38.6 49.9NE 20.8 17.9 24.7 26.72001/3/9 2:00 25.4 25.5 25.2 1009.5 25.7 33.8NE 22.7 11.7--- --- 2001/3/13 2:00 24.2 24.3 23.9 1013.4 45.1 57.9NNE 19.7 20.9 24.2 26.72001/3/9 3:00 25 25.1 24.9 1009 33.8 41.8NNE 21.5 15.4 25 27.8 2001/3/13 3:00 23.7 23.7 23.6 1013.3 48.3 56.3NNE 18.8 21.7 23.7 26.12001/3/9 4:00 24.4 24.7 24.1 1009 35.4 45.1N 20.5 16.1 24.4 26.7 2001/3/13 4:00 23.5 23.7 23.4 1013.1 49.9 57.9NNE 18.5 22.7 23.5 25.62001/3/9 5:00 23.6 23.7 23.5 1008.7 32.2 40.2NNE 19.6 14.8 23.6 26.1 2001/3/13 5:00 23.3 23.3 23.2 1013.2 46.7 57.9N 18.3 21.6 23.3 25.62001/3/9 6:00 23.3 23.3 23.2 1008.8 33.8 41.8NNE 19 15.6 23.3 25.6 2001/3/13 6:00 23 23.1 22.9 1014.5 29 46.7N 19.1 13.4 23 252001/3/9 7:00 22.9 23 22.8 1009 32.2 40.2NNE 18.6 14.8 22.9 25 2001/3/13 7:00 23 23.1 22.9 1014.6 20.9 32.2N 20 9.8 23 252001/3/9 8:00 22.9 23 22.8 1009.2 30.6 38.6NNE 18.7 14.2 22.9 25 2001/3/13 8:00 23.1 23.1 23 1015.2 19.3 29N 20.3 9 23.1 25.62001/3/9 9:00 22.8 22.9 22.7 1009.1 27.4 33.8NNE 18.9 12.1 22.8 25 2001/3/13 9:00 23.2 23.5 23.1 1016 17.7 24.1N 20.7 8 23.2 25.62001/3/9 10:00 23 23.1 22.9 1009.1 20.9 29N 20 9.3 23 25 2001/3/13 10:00 23.7 23.8 23.5 1016.1 16.1 25.7NNO 21.4 7.4 23.7 26.12001/3/9 11:00 23.4 23.6 23.3 1008.9 20.9 27.4N 20.6 9.3 23.4 25.6 2001/3/13 11:00 24.3 24.6 23.8 1015.1 14.5 20.9NNO 22.5 6.6 24.3 26.72001/3/9 12:00 24.1 24.3 23.9 1008.3 19.3 27.4N 21.6 8.7 24.1 26.1 2001/3/13 12:00 24.7 24.8 24.3 1014.1 17.7 24.1NNO 22.5 7.7 24.7 26.72001/3/9 13:00 24.8 25.1 24.6 1007.4 17.7 22.5NNE 22.7 8.2 24.8 27.8 2001/3/13 13:00 25.8 26.6 25.3 1013.6 16.1 24.1NNO 24.1 7.1 --- ---2001/3/9 14:00 25.4 25.6 25.3 1006.9 11.3 16.1NE 24.4 5.3 25.4 28.9 2001/3/13 14:00 27.5 28.3 26.6 1013.3 11.3 16.1N 26.8 5.1 --- ---2001/3/9 15:00 26 26.1 25.9 1006 11.3 17.7ENE 25.1 5.1--- --- 2001/3/13 15:00 26.5 26.6 26.4 1012.7 14.5 17.7NNE 25.2 6.9 26.5 32.22001/3/9 16:00 26.4 26.6 26.3 1005 14.5 19.3E 25.1 6.4--- --- 2001/3/13 16:00 26.3 26.4 26.3 1012.1 11.3 14.5ENE 25.5 5.3 26.3 30.62001/3/9 17:00 26.6 26.6 26.5 1004.6 14.5 19.3E 25.2 6.4 26.6 32.2 2001/3/13 17:00 26.6 26.7 26.4 1012 9.7 12.9NE 25.9 4.3 26.6 32.22001/3/9 18:00 26.2 26.3 26.1 1004.7 24.1 30.6ESE 23.9 10.9--- --- 2001/3/13 18:00 26.9 26.9 26.8 1012 8 9.7NE 26.6 3.4 --- ---2001/3/9 19:00 26.2 26.2 26.1 1004.3 22.5 30.6ESE 24 10.3 26.2 30.6 2001/3/13 19:00 26.8 26.9 26.8 1012.2 4.8 8NE 26.8 2.6 --- ---2001/3/9 20:00 25.8 25.9 25.8 1003.9 19.3 29ESE 23.8 9.2--- --- 2001/3/13 20:00 26.7 26.8 26.6 1012.3 4.8 8E 26.7 2.4 --- ---2001/3/9 21:00 26.6 26.9 26.2 1004.2 17.7 24.1ENE 24.9 8.2--- --- 2001/3/13 21:00 27.5 27.6 27.3 1012.9 8 9.7SE 27.2 3.4 --- ---2001/3/9 22:00 26.9 27.1 26.8 1004.4 25.7 30.6NE 24.7 11.6 26.9 32.2 2001/3/13 22:00 27.1 27.2 26.9 1013 11.3 17.7SE 26.3 5.1 --- ---2001/3/9 23:00 26.5 26.6 26.4 1004.4 32.2 40.2NNE 23.7 15--- --- 2001/3/13 23:00 26.3 26.3 26.2 1012.9 11.3 14.5SE 25.4 5.5 --- ---
2001/3/10 0:00 26.2 26.3 26.1 1004.2 30.6 41.8NNE 23.4 14.2 26.2 30.6 2001/3/14 0:00 25.6 25.6 25.5 1012.6 9.7 12.9ESE 24.9 4.2 --- ---2001/3/10 1:00 26.2 26.2 26.1 1003.9 40.2 48.3NNE 22.9 18.3 26.2 30.6 2001/3/14 1:00 25.4 25.5 25.4 1012.7 9.7 12.9ESE 24.8 4.3 --- ---2001/3/10 2:00 26.1 26.2 26.1 1003.9 43.5 53.1N 22.7 19.8--- --- 2001/3/14 2:00 25.3 25.4 25.2 1012.5 14.5 19.3NE 23.7 6.4 --- ---2001/3/10 3:00 25.7 25.8 25.5 1003.8 41.8 53.1NNE 22.2 19.2 25.7 28.9 2001/3/14 3:00 25 25.1 24.9 1012.3 12.9 17.7NE 23.7 6.3 25 27.82001/3/10 4:00 25.1 25.5 24.7 1003.8 38.6 49.9NNE 21.4 17.7 25.1 27.8 2001/3/14 4:00 24.7 24.8 24.7 1012.3 12.9 17.7NE 23.3 6.1 24.7 27.82001/3/10 5:00 24.3 24.4 24.2 1004 35.4 45.1N 20.3 16.1 24.3 26.7 2001/3/14 5:00 24.6 24.7 24.5 1012.3 12.9 16.1NNE 23.2 5.8 --- ---2001/3/10 6:00 24.1 24.1 24 1004.6 30.6 38.6N 20.4 13.7 24.1 26.1 2001/3/14 6:00 24.6 24.6 24.6 1012.3 9.7 14.5NNE 23.8 4.7 --- ---2001/3/10 7:00 24.3 24.4 24.2 1005.8 22.5 32.2N 21.5 10.1 24.3 26.7 2001/3/14 7:00 24.6 24.6 24.5 1012.7 8 12.9NE 24.1 4--- ---2001/3/10 8:00 24.3 24.4 24.3 1006.3 19.3 25.7N 21.9 9 24.3 26.7 2001/3/14 8:00 24.7 24.7 24.6 1013.2 9.7 12.9NE 23.9 4.7 --- ---2001/3/10 9:00 24.6 24.6 24.4 1007 17.7 24.1N 22.4 8.4 24.6 26.7 2001/3/14 9:00 24.8 24.9 24.7 1013.6 9.7 12.9ENE 24.1 4--- ---2001/3/10 10:00 25.3 25.7 24.9 1007.6 12.9 19.3NNO 24.1 6 25.3 28.9 2001/3/14 10:00 25.3 25.7 25.1 1013.3 9.7 16.1ESE 24.6 4.5 --- ---2001/3/10 11:00 25.9 26.5 25.4 1007 11.3 29O 25.1 5.1--- --- 2001/3/14 11:00 25.1 25.4 24.8 1013.5 11.3 16.1ESE 24.1 5.6 --- ---2001/3/10 12:00 25.4 25.9 25 1007 14.5 24.1SSE 23.9 6.6 25.4 28.9 2001/3/14 12:00 25.1 25.4 24.8 1013 12.9 19.3ESE 23.8 5.6 --- ---2001/3/10 13:00 24.8 25 24.7 1007.5 14.5 17.7ESE 23.2 6.9 24.8 27.8 2001/3/14 13:00 25.6 25.8 25.4 1012.4 14.5 22.5ESE 24.1 6.6 --- ---2001/3/10 14:00 25.2 25.4 24.9 1008.4 4.8 9.7NE 25.2 1.9--- --- 2001/3/14 14:00 25.7 25.8 25.5 1012.1 19.3 27.4ESE 23.6 8.9 --- ---2001/3/10 15:00 26.9 27.4 26.3 1008.8 9.7 30.6NO 26.4 4.3--- --- 2001/3/14 15:00 25.2 25.4 25.1 1011.3 22.5 30.6SE 22.7 10.6 25.2 27.82001/3/10 16:00 26.1 26.7 25.7 1005.9 4.8 20.9O 26.1 2.6--- --- 2001/3/14 16:00 25.2 25.3 25.1 1010.9 22.5 29SE 22.7 10.1 25.2 27.82001/3/10 17:00 24.7 25.1 24.6 1006.8 24.1 35.4SE 21.8 11.1--- --- 2001/3/14 17:00 25.6 25.8 25.4 1010.3 20.9 30.6SE 23.4 10 25.6 28.92001/3/10 18:00 24.7 25.2 24.6 1006.9 17.7 24.1ESE 22.5 8.2--- --- 2001/3/14 18:00 26 26.2 25.9 1010.4 20.9 33.8SE 23.9 10.1 26 30.62001/3/10 19:00 25.6 26.3 24.8 1007.8 11.3 22.5S 24.7 5.3--- --- 2001/3/14 19:00 25.6 25.7 25.4 1010.3 27.4 37SE 22.8 13 25.6 28.92001/3/10 20:00 25.4 25.6 25.3 1008.9 17.7 38.6SSE 23.4 8.2--- --- 2001/3/14 20:00 25.2 25.4 25.1 1010.3 30.6 38.6SE 22 14--- ---2001/3/10 21:00 25.3 25.5 25.2 1009.7 14.5 35.4S 23.8 6.8 25.3 28.9 2001/3/14 21:00 25.2 25.2 25.1 1010.4 27.4 37ESE 22.2 12.7 25.2 27.82001/3/10 22:00 25.2 25.4 25 1010.4 16.1 32.2SSE 23.3 7.6 25.2 27.8 2001/3/14 22:00 25.4 25.6 25.3 1010.6 33.8 43.5ESE 22.1 15.6 25.4 28.92001/3/11 0:00 22.8 23.1 22.7 1011.2 24.1 45.1SSE 19.4 11.6 22.8 25 2001/3/14 23:00 25.6 25.7 25.5 1010.3 33.8 43.5ESE 22.4 15.8 25.6 28.92001/3/11 1:00 22.6 22.7 22.4 1011.4 20.9 45.1SSE 19.4 9.7 22.6 25 2001/3/15 0:00 25.3 25.3 25.2 1010.4 35.4 46.7E 21.8 16.6 25.3 28.92001/3/11 2:00 22 22.3 21.6 1012.7 19.3 40.2SSE 18.9 8.7 22 24.4 2001/3/15 1:00 25.1 25.2 24.9 1010.5 30.6 38.6E 21.8 14.2 25.1 27.82001/3/11 3:00 20.8 20.9 20.6 1012.6 20.9 43.5SSE 17.1 9.7 20.8 22.2 2001/3/15 2:00 24.7 24.8 24.7 1010 22.5 33.8ENE 22.1 10.5 24.7 27.82001/3/11 4:00 20.1 20.4 19.7 1012.4 19.3 40.2SSE 16.5 9.3 20.1 21.1 2001/3/15 3:00 24.7 24.8 24.6 1010 32.2 40.2NNE 21.1 14.5 24.7 26.72001/3/11 5:00 19.3 19.7 19 1013.4 16.1 40.2S 16.1 7.2 19.3--- 2001/3/15 4:00 24.6 24.7 24.6 1009.9 32.2 40.2N 21 14.6 24.6 26.72001/3/11 6:00 18.7 18.9 18.6 1013.4 24.1 45.1SSE 13.8 10.6 18.7--- 2001/3/15 5:00 24.5 24.6 24.4 1009.7 27.4 35.4N 21.3 12.1 24.5 26.72001/3/11 7:00 18.4 18.6 18.2 1013.6 20.9 40.2SSE 14.1 9.7 17.2--- 2001/3/15 6:00 24.5 24.7 24.4 1009.9 27.4 35.4N 21.3 12.6 24.5 26.72001/3/11 8:00 18.6 18.8 18.6 1014.4 22.5 41.8S 14.1 9.7 17.4--- 2001/3/15 7:00 24.3 24.4 24.3 1010.4 17.7 22.5N 22.1 7.9 24.3 26.72001/3/11 9:00 19.2 19.3 18.9 1014.6 20.9 40.2SSE 15.1 10 17.7--- 2001/3/15 8:00 24.4 24.5 24.4 1011 19.3 25.7N 22.1 8.5 24.4 26.72001/3/11 10:00 19.8 20 19.7 1014.7 22.5 41.8SSE 15.7 10.1 18.2--- 2001/3/15 9:00 24.6 24.8 24.4 1011.2 14.5 20.9N 22.8 6.1 24.6 26.72001/3/11 11:00 20.8 21.1 20.4 1015.3 25.7 41.8SE 16.4 11.4 20.8 22.2 2001/3/15 10:00 24.9 25.2 24.7 1011.2 11.3 16.1N 23.8 5.3 24.9 27.82001/3/11 12:00 22.1 22.4 21.7 1015.8 17.7 37SSE 19.2 8.4 22.1 24.4 2001/3/15 11:00 25 25.1 24.8 1011.3 12.9 17.7N 23.7 6 25 27.82001/3/11 13:00 22 22.1 21.9 1015.8 16.1 30.6SSE 19.4 7.1 22 24.4 2001/3/15 12:00 25.3 25.6 25.2 1011.4 8 12.9ENE 24.9 3.5 25.3 28.92001/3/11 14:00 22.2 22.4 22.1 1015.2 19.3 35.4SSE 19.2 8.9 22.2 24.4 2001/3/15 13:00 25.8 25.8 25.6 1011 12.9 19.3E 24.6 5.8 --- ---2001/3/11 15:00 23 23.4 22.7 1015.3 27.4 43.5SE 19.2 12.9 23 25 2001/3/15 14:00 26.2 26.3 25.9 1010.8 14.5 20.9ESE 24.8 6.9 26.2 30.62001/3/11 16:00 23.4 23.6 23.3 1015.1 33.8 45.1SE 19.2 15.8 23.4 25.6 2001/3/15 15:00 26.8 26.9 26.6 1010.2 17.7 24.1SE 25.2 8 26.8 32.22001/3/11 17:00 23.3 23.5 23.1 1015 29 43.5SE 19.4 13 23.3 25.6 2001/3/15 16:00 27.7 28 27.1 1009.6 12.9 22.5SE 26.8 6.1 27.7 35.62001/3/11 18:00 22.4 22.6 22.4 1015.4 25.7 40.2SE 18.7 12.1 22.4 24.4 2001/3/15 17:00 27.8 27.9 27.6 1009.1 14.5 20.9ESE 26.7 7.1 27.8 35.62001/3/11 19:00 22.9 22.9 22.8 1015.8 27.4 43.5SE 19.1 13.2 22.9 25 2001/3/15 18:00 25.9 26.3 25.6 1010.2 38.6 56.3SE 22.6 18.2 25.9 30.62001/3/11 20:00 22.7 22.9 22.6 1015.9 20.9 37SE 19.7 9.8 22.7 25 2001/3/15 19:00 25.6 25.7 25.4 1010.6 33.8 49.9SE 22.3 16.6 25.6 28.92001/3/11 21:00 22.6 22.7 22.6 1016.4 22.5 41.8SE 19.3 10.3 22.6 25 2001/3/15 20:00 25.3 25.4 25.2 1011.2 35.4 45.1SE 21.8 16.7 25.3 28.92001/3/11 22:00 22.5 22.7 22.3 1016.9 19.3 33.8SSE 19.6 8.9 22.5 25 2001/3/15 21:00 25.2 25.3 25.1 1012.4 27.4 38.6ESE 22.2 13.5 25.2 27.82001/3/11 23:00 22.3 22.4 22.3 1016.8 20.9 33.8SE 19.2 9.5 22.3 24.4 2001/3/15 22:00 25.5 25.6 25.3 1013.2 30.6 43.5SE 22.4 15--- ---
2001/3/15 23:00 24.8 25.1 24.4 1013.8 29 45.1SE 21.6 13.5 24.8 27.8
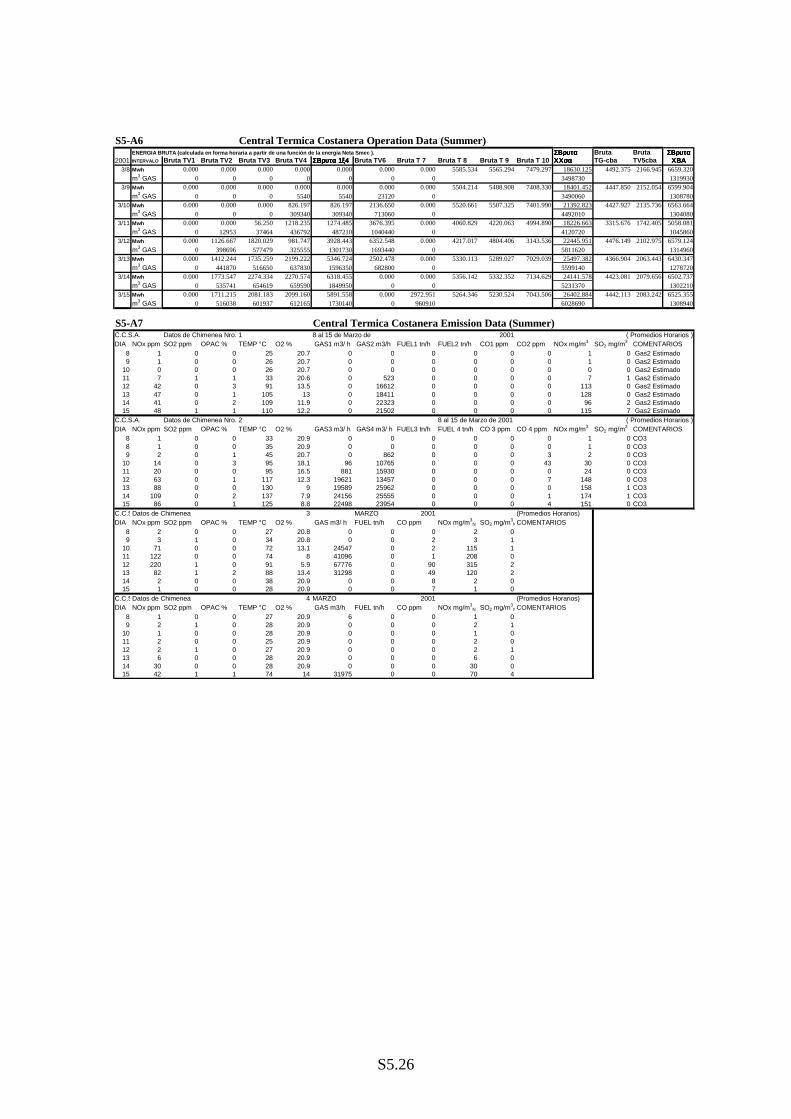
S5.26
S5-A6 Central Termica Costanera Operation Data (Summer)ENERGIA BRUTA (calculada en forma horaria a partir de una función de la energia Neta Smec ). ΣΒρυταΣΒρυταΣΒρυταΣΒρυτα Bruta Bruta ΣΒρυταΣΒρυταΣΒρυταΣΒρυτα
2001 INTERVALO Bruta TV1 Bruta TV2 Bruta TV3 Bruta TV4 ΣΒρυτα 1ξ4ΣΒρυτα 1ξ4ΣΒρυτα 1ξ4ΣΒρυτα 1ξ4 Bruta TV6 Bruta T 7 Bruta T 8 Bruta T 9 Bruta T 10 ΧΧσαΧΧσαΧΧσαΧΧσα TG-cba TV5cba ΧΒΑΧΒΑΧΒΑΧΒΑ3/8 Mwh 0.000 0.000 0.000 0.000 0.000 0.000 0.000 5585.534 5565.294 7479.297 18630.125 4492.375 2166.945 6659.320
m3 GAS 0 0 0 0 0 0 0 3498730 13199303/9 Mwh 0.000 0.000 0.000 0.000 0.000 0.000 0.000 5504.214 5488.908 7408.330 18401.452 4447.850 2152.054 6599.904
m3 GAS 0 0 0 5540 5540 23120 0 3490060 13087803/10 Mwh 0.000 0.000 0.000 826.197 826.197 2136.650 0.000 5520.661 5507.325 7401.990 21392.823 4427.927 2135.736 6563.664
m3 GAS 0 0 0 309340 309340 713060 0 4492010 13040803/11 Mwh 0.000 0.000 56.250 1218.235 1274.485 3676.395 0.000 4060.829 4220.063 4994.890 18226.663 3315.676 1742.405 5058.081
m3 GAS 0 12953 37464 436792 487210 1040440 0 4120720 10458603/12 Mwh 0.000 1126.667 1820.029 981.747 3928.443 6352.548 0.000 4217.017 4804.406 3143.536 22445.951 4476.149 2102.975 6579.124
m3 GAS 0 398696 577479 325555 1301730 1693440 0 5811620 13149603/13 Mwh 0.000 1412.244 1735.259 2199.222 5346.724 2502.478 0.000 5330.113 5289.027 7029.039 25497.382 4366.904 2063.443 6430.347
m3 GAS 0 441870 516650 637830 1596350 682800 0 5599140 12787203/14 Mwh 0.000 1773.547 2274.334 2270.574 6318.455 0.000 0.000 5356.142 5332.352 7134.629 24141.578 4423.081 2079.656 6502.737
m3 GAS 0 535741 654619 659590 1849950 0 0 5231370 13022103/15 Mwh 0.000 1711.215 2081.183 2099.160 5891.558 0.000 2972.951 5264.346 5230.524 7043.506 26402.884 4442.113 2083.242 6525.355
m3 GAS 0 516038 601937 612165 1730140 0 960910 6028690 1308940
S5-A7 Central Termica Costanera Emission Data (Summer)C.C.S.A. Datos de Chimenea Nro. 1 8 al 15 de Marzo de 2001 ( Promedios Horarios )DIA NOx ppm SO2 ppm OPAC % TEMP °C O2 % GAS1 m3/ h GAS2 m3/h FUEL1 tn/h FUEL2 tn/h CO1 ppm CO2 ppm NOx mg/m3 SO2 mg/m3 COMENTARIOS
8 1 0 0 25 20.7 0 0 0 0 0 0 1 0 Gas2 Estimado9 1 0 0 26 20.7 0 0 0 0 0 0 1 0 Gas2 Estimado
10 0 0 0 26 20.7 0 0 0 0 0 0 0 0 Gas2 Estimado11 7 1 1 33 20.6 0 523 0 0 0 0 7 1 Gas2 Estimado12 42 0 3 91 13.5 0 16612 0 0 0 0 113 0 Gas2 Estimado13 47 0 1 105 13 0 18411 0 0 0 0 128 0 Gas2 Estimado14 41 0 2 109 11.9 0 22323 0 0 0 0 96 2 Gas2 Estimado15 48 1 1 110 12.2 0 21502 0 0 0 0 115 7 Gas2 Estimado
C.C.S.A. Datos de Chimenea Nro. 2 8 al 15 de Marzo de 2001 ( Promedios Horarios )DIA NOx ppm SO2 ppm OPAC % TEMP °C O2 % GAS3 m3/ h GAS4 m3/ h FUEL3 tn/h FUEL 4 tn/h CO 3 ppm CO 4 ppm NOx mg/m3 SO2 mg/m3 COMENTARIOS
8 1 0 0 33 20.9 0 0 0 0 0 0 1 0 CO38 1 0 0 35 20.9 0 0 0 0 0 0 1 0 CO39 2 0 1 45 20.7 0 862 0 0 0 3 2 0 CO3
10 14 0 3 95 18.1 96 10765 0 0 0 43 30 0 CO311 20 0 0 95 16.5 881 15930 0 0 0 0 24 0 CO312 63 0 1 117 12.3 19621 13457 0 0 0 7 148 0 CO313 88 0 0 130 9 19589 25962 0 0 0 0 158 1 CO314 109 0 2 137 7.9 24156 25555 0 0 0 1 174 1 CO315 86 0 1 125 8.8 22498 23954 0 0 0 4 151 0 CO3
C.C.SDatos de Chimenea 3 MARZO 2001 (Promedios Horarios)DIA NOx ppm SO2 ppm OPAC % TEMP °C O2 % GAS m3/ h FUEL tn/h CO ppm NOx mg/m3
N SO2 mg/m3NCOMENTARIOS
8 2 0 0 27 20.8 0 0 0 2 09 3 1 0 34 20.8 0 0 2 3 1
10 71 0 0 72 13.1 24547 0 2 115 111 122 0 0 74 8 41096 0 1 208 012 220 1 0 91 5.9 67776 0 90 315 213 82 1 2 88 13.4 31298 0 49 120 214 2 0 0 38 20.9 0 0 8 2 015 1 0 0 28 20.9 0 0 7 1 0
C.C.SDatos de Chimenea 4 MARZO 2001 (Promedios Horarios)DIA NOx ppm SO2 ppm OPAC % TEMP °C O2 % GAS m3/h FUEL tn/h CO ppm NOx mg/m3
N SO2 mg/m3NCOMENTARIOS
8 1 0 0 27 20.9 6 0 0 1 09 2 1 0 28 20.9 0 0 0 2 1
10 1 0 0 28 20.9 0 0 0 1 011 2 0 0 25 20.9 0 0 0 2 012 2 1 0 27 20.9 0 0 0 2 113 6 0 0 28 20.9 0 0 0 6 014 30 0 0 28 20.9 0 0 0 30 015 42 1 1 74 14 31975 0 0 70 4

S5.27
S5-A8 Centaral Termica Costanera Meteorological Data (Summer)Día -Hora Temp. Temp. Hume Hume Vel. Dir. Sens.T Presión Dew Día -Hora Temp. Temp. Hume Hume Vel. Dir. Sens.T Presión Dew
Ext Int Ext Int Vient Vient Temp Point Ext Int Ext Int Vient Vient Temp Point2001/3/8 0:00 26.3 28.1 77.0 64.0 4.8 0 26.3 1011.8 21.9 2001/3/13 20:00 28.5 23.9 73.0 41.0 0.0 0 28.5 1013.0 23.22001/3/8 1:00 26.2 28.0 73.0 62.0 6.4 0 26.1 1012.0 20.9 2001/3/13 21:00 28.2 23.9 72.0 50.0 0.0 28.2 1013.4 22.72001/3/8 2:00 26.1 27.9 72.0 61.0 9.7 0 25.4 1012.4 20.6 2001/3/13 22:00 28.1 23.7 73.0 49.0 1.6 8 28.0 1013.6 22.72001/3/8 3:00 26.1 27.9 71.0 60.0 9.7 0 25.3 1012.1 20.3 2001/3/13 23:00 27.8 23.8 77.0 44.0 1.6 8 27.8 1013.5 23.42001/3/8 4:00 26.1 27.8 71.0 60.0 9.7 0 25.3 1012.2 20.3 2001/3/14 0:00 27.8 23.7 78.0 54.0 0.0 9 27.8 1013.3 23.62001/3/8 5:00 25.8 27.7 73.0 60.0 9.7 0 25.1 1012.3 20.6 2001/3/14 1:00 27.7 23.6 80.0 53.0 0.0 9 27.6 1013.4 23.82001/3/8 6:00 25.6 27.7 76.0 61.0 12.9 0 24.3 1012.7 20.9 2001/3/14 2:00 27.4 23.6 81.0 45.0 1.6 15 27.4 1013.1 23.82001/3/8 7:00 25.0 27.6 79.0 64.0 11.3 1 23.9 1013.4 21.1 2001/3/14 3:00 27.0 23.5 76.0 56.0 3.2 0 27.0 1013.0 22.42001/3/9 9:00 26.0 28.6 79.0 64.0 9.7 0 25.3 1009.7 22.1 2001/3/14 4:00 26.8 23.4 77.0 44.0 3.2 0 26.8 1012.9 22.4
2001/3/9 10:00 27.1 28.9 75.0 63.0 11.3 0 26.3 1009.7 22.2 2001/3/14 5:00 26.6 23.5 75.0 51.0 3.2 0 26.5 1012.9 21.72001/3/9 11:00 27.8 28.9 75.0 63.0 8.0 0 27.5 1009.2 22.9 2001/3/14 6:00 26.3 23.4 75.0 58.0 3.2 1 26.3 1012.8 21.62001/3/9 12:00 28.4 29.0 73.0 59.0 8.0 0 28.2 1008.9 23.2 2001/3/14 7:00 26.3 23.7 77.0 49.0 3.2 1 26.3 1013.2 22.02001/3/9 13:00 29.3 27.6 73.0 44.0 6.4 0 29.3 1008.0 23.9 2001/3/14 8:00 26.3 23.4 76.0 57.0 3.2 1 26.3 1013.8 21.72001/3/9 14:00 29.6 26.6 74.0 43.0 6.4 0 29.6 1007.5 24.4 2001/3/14 9:00 27.1 23.4 69.0 44.0 3.2 0 27.0 1014.1 20.82001/3/9 15:00 29.8 26.0 73.0 41.0 3.2 0 29.8 1006.6 24.4 2001/3/14 10:00 28.6 23.6 67.0 52.0 4.8 0 28.5 1013.9 21.82001/3/9 16:00 29.9 25.6 75.0 42.0 3.2 0 29.9 1005.7 25.0 2001/3/14 11:00 29.3 23.6 63.0 46.0 4.8 0 29.3 1014.1 21.52001/3/9 18:00 29.3 24.7 76.0 49.0 3.2 3.0 1005.2 2001/3/14 12:00 29.9 23.3 63.0 49.0 4.8 0 29.9 1013.7 22.12001/3/9 19:00 28.9 24.6 77.0 48.0 3.2 14.0 1004.8 2001/3/14 13:00 30.5 23.4 60.0 43.0 3.2 15 30.5 1013.0 21.9
2001/3/12 10:00 25.8 26.3 77.0 63.0 4.8 0 25.8 1018.8 21.4 2001/3/14 14:00 30.9 23.6 60.0 42.0 3.2 14 30.9 1012.6 22.32001/3/12 11:00 26.4 25.2 75.0 45.0 6.4 15 26.4 1018.7 21.7 2001/3/14 15:00 31.0 23.8 64.0 44.0 3.2 13 31.0 1012.1 23.42001/3/12 12:00 27.2 24.1 73.0 55.0 6.4 15 27.2 1018.1 21.9 2001/3/14 16:00 30.6 23.7 70.0 53.0 3.2 14 30.5 1011.7 24.42001/3/12 13:00 28.0 23.7 68.0 46.0 4.8 15 28.0 1017.4 21.6 2001/3/14 17:00 29.0 23.7 70.0 46.0 6.4 8 29.0 1010.9 23.02001/3/12 14:00 28.5 23.8 74.0 52.0 4.8 0 28.5 1016.6 23.4 2001/3/14 18:00 28.6 23.9 67.0 45.0 6.4 8 28.5 1010.9 21.82001/3/12 15:00 28.4 23.6 76.0 48.0 4.8 14 28.4 1015.5 23.8 2001/3/14 19:00 28.4 23.7 74.0 46.0 4.8 9 28.4 1010.9 23.32001/3/12 16:00 28.4 23.7 76.0 52.0 3.2 0 28.4 1014.6 23.8 2001/3/14 20:00 28.2 23.9 76.0 47.0 3.2 11 28.1 1010.8 23.52001/3/12 17:00 28.1 23.6 77.0 45.0 3.2 13 28.0 1013.9 23.6 2001/3/14 21:00 27.9 23.6 77.0 47.0 3.2 13 27.9 1011.0 23.52001/3/12 18:00 27.7 23.6 79.0 56.0 3.2 0 27.7 1013.5 23.7 2001/3/14 22:00 27.8 23.7 74.0 46.0 4.8 14 27.8 1011.1 22.82001/3/12 19:00 27.3 23.6 84.0 45.0 3.2 15 27.3 1013.1 24.3 2001/3/14 23:00 27.8 23.5 78.0 52.0 4.8 14 27.8 1010.8 23.62001/3/12 20:00 26.9 23.7 86.0 58.0 3.2 15 26.9 1013.3 24.3 2001/3/15 0:00 27.7 23.6 82.0 45.0 8.0 3 27.3 1011.0 24.32001/3/12 21:00 26.7 25.1 87.0 57.0 3.2 14 26.7 1013.8 24.3 2001/3/15 1:00 27.6 23.4 83.0 56.0 9.7 3 27.0 1011.1 24.32001/3/12 22:00 26.7 26.0 87.0 58.0 3.2 0 26.7 1014.0 24.3 2001/3/15 2:00 27.4 23.4 83.0 44.0 6.4 4 27.4 1010.6 24.32001/3/12 23:00 26.8 26.4 84.0 59.0 3.2 2 26.8 1014.0 23.9 2001/3/15 3:00 27.1 23.4 88.0 52.0 4.8 0 27.0 1010.7 24.82001/3/13 0:00 26.7 26.8 76.0 61.0 6.4 3 26.7 1013.9 22.1 2001/3/15 4:00 26.8 23.3 88.0 50.0 9.7 0 26.2 1010.6 24.62001/3/13 1:00 26.4 27.1 76.0 61.0 8.0 2 26.0 1014.3 21.8 2001/3/15 5:00 26.6 23.4 89.0 48.0 9.7 0 25.9 1010.3 24.62001/3/13 2:00 26.1 27.2 77.0 62.0 8.0 0 25.6 1013.9 21.7 2001/3/15 6:00 26.6 23.4 90.0 49.0 11.3 0 25.7 1010.5 24.82001/3/13 3:00 25.4 27.2 79.0 62.0 11.3 0 24.4 1013.9 21.6 2001/3/15 7:00 26.5 23.2 92.0 54.0 9.7 0 25.9 1010.9 25.12001/3/13 4:00 25.2 27.3 80.0 62.0 14.5 0 23.6 1013.9 21.5 2001/3/15 8:00 26.5 23.3 91.0 47.0 11.3 1 25.7 1011.3 24.92001/3/13 5:00 25.0 27.3 81.0 62.0 12.9 0 23.7 1013.8 21.5 2001/3/15 9:00 26.8 23.3 86.0 43.0 9.7 1 26.2 1011.7 24.22001/3/13 6:00 24.9 27.3 83.0 65.0 12.9 0 23.6 1015.0 21.8 2001/3/15 10:00 28.6 23.4 78.0 43.0 6.4 0 28.5 1011.8 24.32001/3/13 7:00 24.7 27.3 82.0 65.0 12.9 1 23.3 1015.1 21.4 2001/3/15 11:00 29.8 23.3 76.0 47.0 4.8 0 29.8 1012.0 25.12001/3/13 8:00 24.7 26.4 84.0 44.0 11.3 0 23.6 1015.8 21.7 2001/3/15 12:00 30.6 23.7 75.0 43.0 4.8 0 30.5 1012.0 25.62001/3/13 9:00 25.3 24.8 79.0 50.0 9.7 0 24.6 1016.6 21.4 2001/3/15 13:00 31.0 23.6 74.0 43.0 3.2 0 31.0 1011.7 25.8
2001/3/13 10:00 26.3 24.7 79.0 45.0 6.4 0 26.3 1016.6 22.4 2001/3/15 14:00 30.9 23.5 75.0 42.0 4.8 0 30.9 1011.6 26.02001/3/13 11:00 27.1 24.3 74.0 49.0 8.0 0 26.7 1015.7 22.0 2001/3/15 15:00 31.1 23.6 75.0 44.0 4.8 15 31.0 1010.9 26.12001/3/13 12:00 28.1 24.4 72.0 47.0 9.7 0 27.6 1014.7 22.6 2001/3/15 16:00 31.4 23.4 71.0 41.0 3.2 14 31.4 1010.2 25.62001/3/13 13:00 28.8 23.7 73.0 43.0 9.7 0 28.4 1014.2 23.4 2001/3/15 17:00 31.4 23.3 72.0 43.0 3.2 14 31.4 1009.9 25.72001/3/13 14:00 29.5 23.3 71.0 40.0 6.4 0 29.5 1014.0 23.7 2001/3/15 18:00 29.5 24.3 78.0 46.0 11.3 7 29.1 1010.8 25.32001/3/13 15:00 29.8 23.8 72.0 46.0 1.6 0 29.8 1013.4 24.2 2001/3/15 19:00 28.4 24.6 77.0 48.0 8.0 8 28.2 1011.2 24.02001/3/13 16:00 29.8 23.6 73.0 41.0 1.6 1 29.8 1012.8 24.5 2001/3/15 20:00 28.4 24.2 81.0 40.0 4.8 10 28.4 1011.7 24.82001/3/13 17:00 29.6 23.7 71.0 42.0 3.2 0 29.5 1012.6 23.7 2001/3/15 21:00 28.2 23.8 82.0 50.0 4.8 14 28.2 1012.8 24.82001/3/13 18:00 29.4 23.7 71.0 48.0 3.2 0 29.4 1012.5 23.6 2001/3/15 22:00 28.2 23.5 80.0 41.0 3.2 13 28.1 1014.0 24.32001/3/13 19:00 29.1 23.8 73.0 53.0 1.6 0 29.0 1012.7 23.7 2001/3/15 23:00 27.6 23.6 85.0 49.0 6.4 7 27.5 1014.4 24.8

S5.28
S5-A9 Buenos Aires Manual Monitoring Data(7.2001)
No 1 No 2 No 3 No 5 No 6 No 7 No 8 No 9 No 10
hr SO2 NOx TSP SO2 NOx TSP SO2 NOx TSP SO2 NOx TSP SO2 NOx TSP SO2 NOx TSP SO2 NOx TSP SO2 NOx TSP SO2 NOx TSP12 42.5 19.1 29.7 38.3 65.9 30.7 92.5 41.4 S/D 38.3 34.816 208.3 225.7 558.3 28.4 558.3 14.5 566.7 30.7 191.7 29.8 208.3 20.8 45 S/D 131.7 39.3 85.8 29.620 32.5 48.5 19.2 37.6 40 30.8 130 69.9 40.8 25.9 90 52.6 79.2 S/D 550 35.2 16.7 33.7Av0 10.8 23.6 10.8 26.6 126.7 25.4 135 32.8 10.8 24.1 10.8 26.4 67.5 S/D 20.8 55.5 160.8 25.94 208.3 4.6 66.7 <4 266.7 <4 51.7 <4 55 <4 60.8 <4 46.7 S/D 113.3 7.5 166.7 <48 34.2 13.1 10.8 11.7 216.7 9 21.7 7.3 10.8 7.7 10.8 <4 10.8 S/D 10.8 14.6 425 13.712 15.8 33.8 11.7 41.0 31.7 38.5 114.2 39.5 10.8 31.7 10.8 29.7 22.5 S/D 51.7 <4 112.5 41.316 55.8 95.1 106.7 43.1 24.2 53.4 50.8 55.2 117.5 48 19.2 40.9 441.7 83.5 86.7 57.3 35.8 56.720 140.8 - 115 47.4 25.8 40.3 70.8 110.4 258.3 55.2 166.7 57.9 166.7 114.6 115 72.5 43.3 131.6Av
0 16.7 S/D 250 44.7 27.5 37.9 75.8 52.2 30 43.6 51.7 43.2 25.8 76.5 35 78.3 241.7 68.64 10.8 17.7 191.7 16.1 110.8 12.8 71.7 21.7 116.7 14.1 95 18.6 18.3 26.7 300 41 60.8 29.48 216.7 12.3 115.8 11.4 134.2 6.5 119.2 21.1 104.2 8.3 57.5 13.7 10.8 17.2 101.7 16.5 11.7 19.212 216.7 9.3 16.7 15.4 49.2 14 118.3 19.2 14.2 10.5 14.2 16.5 16.7 20 72.5 18.4 34.2 12.516 128.3 32.8 133.3 20.6 115.8 21.7 101.7 41.2 191.7 24.6 191.7 30.5 79.2 50.6 175 34.6 208.3 2020 137.5 15.8 99.2 18.0 87.5 18 79.2 22.7 166.7 19.9 208.3 33.7 113.3 66.9 616.7 44 110.8 30.3Av
0 128.3 16.4 140.8 35.3 104.2 15.1 155 17.8 128.3 15.9 99.2 15.8 126.7 26 134.2 26.8 135 18.14 137.5 19.2 132.5 24.7 120 7.3 70.8 13.1 120 <4 175 7.5 225 12 115.8 23.5 112.5 14.18 583.3 33.7 23.3 60.2 84.2 29.5 216.7 47 72.5 30.5 27.5 24.8 225 52.2 1100 31.6 1200 26.612 127.5 67.5 95 110.7 208.3 83.5 175 47.4 27.5 48.3 25 48.6 130.8 64.5 700 73.6 110.8 71.416 140 44.4 114.2 48.2 118.3 49.2 151.7 50.4 119.2 45.5 125.8 48.7 146.7 60.4 208.3 77.8 175 61.220 120.8 36.1 120 40.3 65 38.7 146.7 38.3 200 33.9 53.3 39.7 333.3 49.1 208.3 65.5 200 52.4Av0 55.8 26.1 90 30.5 16.7 28.5 23.3 31.7 130 29.2 55 31.3 250 31.4 155.8 41.8 150.8 32.24 54.2 30.3 10.8 20.8 10.8 23 10.8 23.9 40 24.8 56.7 26.3 10.8 28.4 16.7 33.7 18.3 29.18 84.2 - 19.2 ー 10.8 ー 55 ー 56.7 ー 49.2 ー 10.8 ー 13.3 - 69.2 -12 10.8 29.7 60 43.6 10.8 32.6 10.8 38.4 55 30.3 55 41.3 50.8 47.9 84.2 42.1 83.3 3816 39.2 32 72.5 45.3 10.8 29.3 10.8 29.4 77.5 35.1 57.5 39 87.5 59.4 46.7 66.8 90 3320 31.7 39.4 37.5 17.8 10.8 29.3 104.2 32 58.3 27 94.2 28.8 50.8 41.8 78.3 50.2 82.5 45.5Av
0 134.2 13.2 120.8 18.0 20 15.6 10.8 15.7 25.8 14.4 37.5 14 141.7 17.7 75.8 24.1 84.2 23.74 22.5 19.7 35 15.2 19.2 21.6 10.8 18.9 34.2 19.8 11.7 18.6 10.8 19.5 55 <4 151.7 29.68 10.8 36.1 10.8 17.9 14.2 16 10.8 32.6 10.8 32.3 10.8 27.1 41.7 <4 14.2 31.2 30 50.512 10.8 21.7 10.8 <4 15.8 S/D 10.8 23.2 10.8 21.6 10.8 19.7 11.7 29 30 43.1 10.8 41.516 34.2 - 55.8 - 11.7 - 17.5 - 84.2 - 110.8 - 250 - 60 - 107.5 -20 44.2 - 63.3 - 105 - 10.8 - 74.2 - 100.8 - 183.3 - 46.7 - 75.8 -Av
7/20 12 57.5 20.3 45.8 14.4 92.5 18.7 42.5 30.2 70 29.1 175 24.3 233.3 44.9 57.5 129.8 66.7 3116 35 33.9 107.5 23.3 35.8 35.3 49.2 11 10.8 30.4 69.2 25.6 61.7 34.9 120.8 51 47.5 45.920 39.2 36.2 45.8 39.7 32.5 22.1 122.5 41.1 10.8 28.1 87.5 27.3 25.8 47.3 34.2 37.4 50.8 53.6
0 15.8 48 10.8 43.1 10.8 29 191.7 30.3 109.2 29.1 26.7 38.2 35 48.7 43.3 47.1 23.3 54.84 10.8 4 10.8 5.7 10.8 <4 283.3 4.6 10.8 <4 10.8 5.3 10.8 10.9 18.3 18.8 13.3 <48 10.8 7.4 10.8 <4 10.8 10.4 71.7 7.2 10.8 6.5 17.5 4.6 10.8 10.4 31.7 18.8 13.3 18.712 10.8 18.4 10.8 8.6 10.8 212.8 125 18.3 10.8 18.8 10.8 14.7 10.8 24.1 19.2 32.4 11.7 29.616 43.3 13.5 75.8 15.3 10.8 13.8 45 12.7 57.5 12.7 124.2 7.1 124.2 16 93.3 24.5 140 18.120 62.5 - 72.5 - 10.8 - 55 - 150.8 - 165 - 74.2 - 105.8 - 118.3 -Av
048
41 43
6748
73
92
70 88
77 125
100
153
4042
85 42
54
7152
117
28 33
μg/m3
18 25 51
88
45 105
1921 22 23 19
43
7/22
134 86 86 114 98 61 123 96
S/D 4251
7/21
16
52
50
7/17
7/13
7/4
7/15
7/16
7/18
119
18
27 79
82 132 45
63
109 67
60
773244 27
87 48
49 30 35S/D 39 46 159
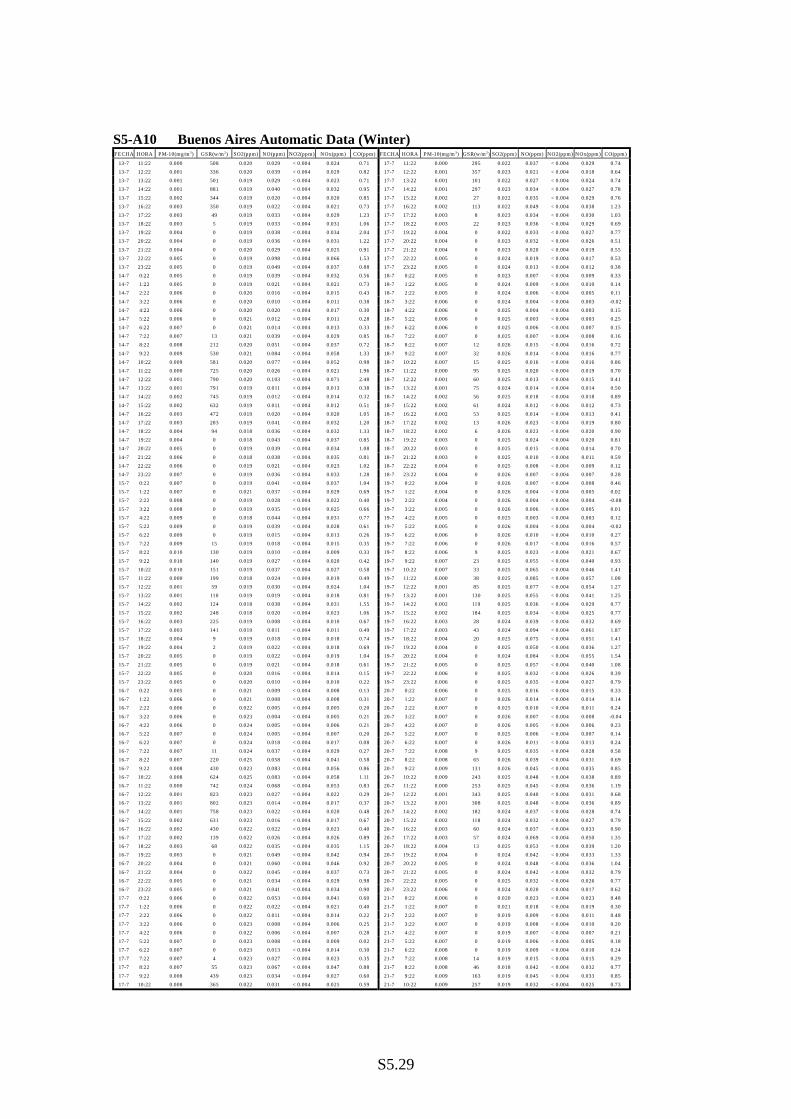
S5.29
S5-A10 Buenos Aires Automatic Data (Winter)FECHA HORA PM-10(mg/m3) GSR(w/m2) SO2(ppm) NO(ppm) NO2(ppm) NOx(ppm) CO(ppm) FECHA HORA PM-10(mg/m3) GSR(w/m2) SO2(ppm) NO(ppm) NO2(ppm) NOx(ppm) CO(ppm)
13-7 11:22 0.000 508 0.020 0.029 < 0.004 0.024 0.71 17-7 11:22 0.000 295 0.022 0.037 < 0.004 0.029 0.74
13-7 12:22 0.001 336 0.020 0.039 < 0.004 0.029 0.82 17-7 12:22 0.001 357 0.023 0.021 < 0.004 0.018 0.64
13-7 13:22 0.001 501 0.019 0.029 < 0.004 0.023 0.71 17-7 13:22 0.001 101 0.022 0.027 < 0.004 0.024 0.74
13-7 14:22 0.001 881 0.019 0.040 < 0.004 0.032 0.95 17-7 14:22 0.001 297 0.023 0.034 < 0.004 0.027 0.78
13-7 15:22 0.002 344 0.019 0.020 < 0.004 0.020 0.85 17-7 15:22 0.002 27 0.022 0.035 < 0.004 0.029 0.76
13-7 16:22 0.003 350 0.019 0.022 < 0.004 0.021 0.73 17-7 16:22 0.002 113 0.022 0.049 < 0.004 0.038 1.23
13-7 17:22 0.003 49 0.019 0.033 < 0.004 0.029 1.23 17-7 17:22 0.003 8 0.023 0.034 < 0.004 0.030 1.03
13-7 18:22 0.003 5 0.019 0.033 < 0.004 0.031 1.06 17-7 18:22 0.003 22 0.023 0.036 < 0.004 0.029 0.69
13-7 19:22 0.004 0 0.019 0.038 < 0.004 0.034 2.04 17-7 19:22 0.004 0 0.022 0.033 < 0.004 0.027 0.77
13-7 20:22 0.004 0 0.019 0.036 < 0.004 0.031 1.22 17-7 20:22 0.004 0 0.023 0.032 < 0.004 0.026 0.51
13-7 21:22 0.004 0 0.020 0.029 < 0.004 0.025 0.91 17-7 21:22 0.004 0 0.023 0.020 < 0.004 0.019 0.55
13-7 22:22 0.005 0 0.019 0.098 < 0.004 0.066 1.53 17-7 22:22 0.005 0 0.024 0.019 < 0.004 0.017 0.53
13-7 23:22 0.005 0 0.019 0.049 < 0.004 0.037 0.88 17-7 23:22 0.005 0 0.024 0.013 < 0.004 0.012 0.38
14-7 0:22 0.005 0 0.019 0.039 < 0.004 0.032 0.56 18-7 0:22 0.005 0 0.023 0.007 < 0.004 0.009 0.33
14-7 1:22 0.005 0 0.019 0.021 < 0.004 0.021 0.73 18-7 1:22 0.005 0 0.024 0.009 < 0.004 0.010 0.14
14-7 2:22 0.006 0 0.020 0.016 < 0.004 0.015 0.43 18-7 2:22 0.005 0 0.024 0.006 < 0.004 0.005 0.11
14-7 3:22 0.006 0 0.020 0.010 < 0.004 0.011 0.38 18-7 3:22 0.006 0 0.024 0.004 < 0.004 0.003 -0.02
14-7 4:22 0.006 0 0.020 0.020 < 0.004 0.017 0.30 18-7 4:22 0.006 0 0.025 0.004 < 0.004 0.003 0.15
14-7 5:22 0.006 0 0.021 0.012 < 0.004 0.011 0.28 18-7 5:22 0.006 0 0.025 0.003 < 0.004 0.003 0.25
14-7 6:22 0.007 0 0.021 0.014 < 0.004 0.013 0.33 18-7 6:22 0.006 0 0.025 0.006 < 0.004 0.007 0.15
14-7 7:22 0.007 13 0.021 0.039 < 0.004 0.029 0.85 18-7 7:22 0.007 0 0.025 0.007 < 0.004 0.008 0.16
14-7 8:22 0.008 212 0.020 0.051 < 0.004 0.037 0.72 18-7 8:22 0.007 12 0.026 0.015 < 0.004 0.016 0.72
14-7 9:22 0.009 530 0.021 0.084 < 0.004 0.058 1.33 18-7 9:22 0.007 32 0.026 0.014 < 0.004 0.016 0.77
14-7 10:22 0.009 581 0.020 0.077 < 0.004 0.052 0.98 18-7 10:22 0.007 15 0.025 0.016 < 0.004 0.016 0.86
14-7 11:22 0.000 725 0.020 0.026 < 0.004 0.021 1.96 18-7 11:22 0.000 95 0.025 0.020 < 0.004 0.019 0.70
14-7 12:22 0.001 790 0.020 0.103 < 0.004 0.071 2.48 18-7 12:22 0.001 60 0.025 0.013 < 0.004 0.015 0.41
14-7 13:22 0.001 791 0.019 0.011 < 0.004 0.013 0.38 18-7 13:22 0.001 75 0.024 0.014 < 0.004 0.014 0.50
14-7 14:22 0.002 745 0.019 0.012 < 0.004 0.014 0.32 18-7 14:22 0.002 56 0.025 0.018 < 0.004 0.018 0.89
14-7 15:22 0.002 632 0.019 0.011 < 0.004 0.012 0.51 18-7 15:22 0.002 61 0.024 0.012 < 0.004 0.012 0.73
14-7 16:22 0.003 472 0.019 0.020 < 0.004 0.020 1.05 18-7 16:22 0.002 53 0.025 0.014 < 0.004 0.013 0.41
14-7 17:22 0.003 283 0.019 0.041 < 0.004 0.032 1.20 18-7 17:22 0.002 13 0.026 0.023 < 0.004 0.019 0.80
14-7 18:22 0.004 94 0.018 0.036 < 0.004 0.032 1.33 18-7 18:22 0.002 6 0.026 0.023 < 0.004 0.020 0.90
14-7 19:22 0.004 0 0.018 0.043 < 0.004 0.037 0.85 18-7 19:22 0.003 0 0.025 0.024 < 0.004 0.020 0.81
14-7 20:22 0.005 0 0.019 0.039 < 0.004 0.034 1.08 18-7 20:22 0.003 0 0.025 0.015 < 0.004 0.014 0.70
14-7 21:22 0.006 0 0.018 0.038 < 0.004 0.035 0.81 18-7 21:22 0.003 0 0.025 0.010 < 0.004 0.011 0.59
14-7 22:22 0.006 0 0.019 0.021 < 0.004 0.023 1.02 18-7 22:22 0.004 0 0.025 0.008 < 0.004 0.009 0.12
14-7 23:22 0.007 0 0.019 0.036 < 0.004 0.033 1.28 18-7 23:22 0.004 0 0.026 0.007 < 0.004 0.007 0.28
15-7 0:22 0.007 0 0.019 0.041 < 0.004 0.037 1.04 19-7 0:22 0.004 0 0.026 0.007 < 0.004 0.008 0.46
15-7 1:22 0.007 0 0.021 0.037 < 0.004 0.029 0.69 19-7 1:22 0.004 0 0.026 0.004 < 0.004 0.005 0.02
15-7 2:22 0.008 0 0.019 0.028 < 0.004 0.022 0.40 19-7 2:22 0.004 0 0.026 0.004 < 0.004 0.004 -0.08
15-7 3:22 0.008 0 0.019 0.035 < 0.004 0.025 0.66 19-7 3:22 0.005 0 0.026 0.006 < 0.004 0.005 0.01
15-7 4:22 0.009 0 0.018 0.044 < 0.004 0.031 0.77 19-7 4:22 0.005 0 0.025 0.003 < 0.004 0.003 0.12
15-7 5:22 0.009 0 0.019 0.039 < 0.004 0.028 0.61 19-7 5:22 0.005 0 0.026 0.004 < 0.004 0.004 -0.02
15-7 6:22 0.009 0 0.019 0.015 < 0.004 0.013 0.26 19-7 6:22 0.006 0 0.026 0.010 < 0.004 0.010 0.27
15-7 7:22 0.009 15 0.019 0.018 < 0.004 0.015 0.35 19-7 7:22 0.006 0 0.026 0.017 < 0.004 0.016 0.57
15-7 8:22 0.010 130 0.019 0.010 < 0.004 0.009 0.33 19-7 8:22 0.006 9 0.025 0.023 < 0.004 0.021 0.67
15-7 9:22 0.010 140 0.019 0.027 < 0.004 0.020 0.42 19-7 9:22 0.007 23 0.025 0.055 < 0.004 0.040 0.93
15-7 10:22 0.010 151 0.019 0.037 < 0.004 0.027 0.58 19-7 10:22 0.007 33 0.025 0.065 < 0.004 0.046 1.41
15-7 11:22 0.000 199 0.018 0.024 < 0.004 0.019 0.49 19-7 11:22 0.000 38 0.025 0.085 < 0.004 0.057 1.08
15-7 12:22 0.001 59 0.019 0.030 < 0.004 0.024 1.04 19-7 12:22 0.001 85 0.025 0.077 < 0.004 0.054 1.27
15-7 13:22 0.001 110 0.019 0.019 < 0.004 0.018 0.81 19-7 13:22 0.001 130 0.025 0.055 < 0.004 0.041 1.25
15-7 14:22 0.002 124 0.018 0.038 < 0.004 0.031 1.55 19-7 14:22 0.002 119 0.025 0.036 < 0.004 0.029 0.77
15-7 15:22 0.002 248 0.018 0.020 < 0.004 0.023 1.06 19-7 15:22 0.002 184 0.025 0.034 < 0.004 0.025 0.77
15-7 16:22 0.003 225 0.019 0.008 < 0.004 0.010 0.67 19-7 16:22 0.003 28 0.024 0.039 < 0.004 0.032 0.69
15-7 17:22 0.003 141 0.019 0.011 < 0.004 0.011 0.49 19-7 17:22 0.003 43 0.024 0.094 < 0.004 0.061 1.87
15-7 18:22 0.004 9 0.019 0.018 < 0.004 0.018 0.74 19-7 18:22 0.004 20 0.025 0.075 < 0.004 0.051 1.41
15-7 19:22 0.004 2 0.019 0.022 < 0.004 0.018 0.69 19-7 19:22 0.004 0 0.025 0.050 < 0.004 0.036 1.27
15-7 20:22 0.005 0 0.019 0.022 < 0.004 0.019 1.04 19-7 20:22 0.004 0 0.024 0.084 < 0.004 0.055 1.54
15-7 21:22 0.005 0 0.019 0.021 < 0.004 0.018 0.61 19-7 21:22 0.005 0 0.025 0.057 < 0.004 0.040 1.08
15-7 22:22 0.005 0 0.020 0.016 < 0.004 0.014 0.15 19-7 22:22 0.006 0 0.025 0.032 < 0.004 0.026 0.39
15-7 23:22 0.005 0 0.020 0.010 < 0.004 0.010 0.22 19-7 23:22 0.006 0 0.025 0.035 < 0.004 0.027 0.79
16-7 0:22 0.005 0 0.021 0.009 < 0.004 0.008 0.13 20-7 0:22 0.006 0 0.025 0.016 < 0.004 0.015 0.33
16-7 1:22 0.006 0 0.021 0.008 < 0.004 0.008 0.31 20-7 1:22 0.007 0 0.026 0.014 < 0.004 0.014 0.14
16-7 2:22 0.006 0 0.022 0.005 < 0.004 0.005 0.20 20-7 2:22 0.007 0 0.025 0.010 < 0.004 0.011 0.24
16-7 3:22 0.006 0 0.023 0.004 < 0.004 0.005 0.21 20-7 3:22 0.007 0 0.026 0.007 < 0.004 0.008 -0.04
16-7 4:22 0.006 0 0.024 0.005 < 0.004 0.006 0.21 20-7 4:22 0.007 0 0.026 0.005 < 0.004 0.006 0.23
16-7 5:22 0.007 0 0.024 0.005 < 0.004 0.007 0.20 20-7 5:22 0.007 0 0.025 0.006 < 0.004 0.007 0.14
16-7 6:22 0.007 0 0.024 0.018 < 0.004 0.017 0.08 20-7 6:22 0.007 0 0.026 0.011 < 0.004 0.013 0.24
16-7 7:22 0.007 11 0.024 0.037 < 0.004 0.029 0.27 20-7 7:22 0.008 9 0.025 0.035 < 0.004 0.028 0.58
16-7 8:22 0.007 220 0.025 0.058 < 0.004 0.041 0.58 20-7 8:22 0.008 65 0.026 0.039 < 0.004 0.031 0.69
16-7 9:22 0.008 430 0.023 0.083 < 0.004 0.056 0.86 20-7 9:22 0.009 131 0.026 0.045 < 0.004 0.035 0.85
16-7 10:22 0.008 624 0.025 0.083 < 0.004 0.058 1.11 20-7 10:22 0.009 243 0.025 0.048 < 0.004 0.038 0.89
16-7 11:22 0.000 742 0.024 0.068 < 0.004 0.053 0.83 20-7 11:22 0.000 253 0.025 0.045 < 0.004 0.036 1.19
16-7 12:22 0.001 823 0.023 0.027 < 0.004 0.022 0.29 20-7 12:22 0.001 343 0.025 0.040 < 0.004 0.031 0.68
16-7 13:22 0.001 802 0.023 0.014 < 0.004 0.017 0.37 20-7 13:22 0.001 308 0.025 0.048 < 0.004 0.036 0.89
16-7 14:22 0.001 758 0.023 0.022 < 0.004 0.020 0.48 20-7 14:22 0.002 182 0.024 0.037 < 0.004 0.028 0.74
16-7 15:22 0.002 631 0.023 0.016 < 0.004 0.017 0.67 20-7 15:22 0.002 118 0.024 0.032 < 0.004 0.027 0.79
16-7 16:22 0.002 430 0.022 0.022 < 0.004 0.023 0.40 20-7 16:22 0.003 60 0.024 0.037 < 0.004 0.033 0.90
16-7 17:22 0.002 139 0.022 0.026 < 0.004 0.026 0.89 20-7 17:22 0.003 57 0.024 0.069 < 0.004 0.050 1.35
16-7 18:22 0.003 68 0.022 0.035 < 0.004 0.035 1.15 20-7 18:22 0.004 13 0.025 0.053 < 0.004 0.039 1.20
16-7 19:22 0.003 0 0.021 0.049 < 0.004 0.042 0.94 20-7 19:22 0.004 0 0.024 0.042 < 0.004 0.033 1.33
16-7 20:22 0.004 0 0.021 0.060 < 0.004 0.046 0.92 20-7 20:22 0.005 0 0.024 0.048 < 0.004 0.036 1.04
16-7 21:22 0.004 0 0.022 0.045 < 0.004 0.037 0.73 20-7 21:22 0.005 0 0.024 0.042 < 0.004 0.032 0.79
16-7 22:22 0.005 0 0.021 0.034 < 0.004 0.029 0.98 20-7 22:22 0.005 0 0.025 0.032 < 0.004 0.026 0.77
16-7 23:22 0.005 0 0.021 0.041 < 0.004 0.034 0.90 20-7 23:22 0.006 0 0.024 0.020 < 0.004 0.017 0.62
17-7 0:22 0.006 0 0.022 0.053 < 0.004 0.041 0.60 21-7 0:22 0.006 0 0.020 0.023 < 0.004 0.023 0.48
17-7 1:22 0.006 0 0.022 0.022 < 0.004 0.021 0.40 21-7 1:22 0.007 0 0.021 0.018 < 0.004 0.019 0.30
17-7 2:22 0.006 0 0.022 0.011 < 0.004 0.014 0.22 21-7 2:22 0.007 0 0.019 0.009 < 0.004 0.011 0.48
17-7 3:22 0.006 0 0.023 0.008 < 0.004 0.006 0.25 21-7 3:22 0.007 0 0.019 0.008 < 0.004 0.010 0.20
17-7 4:22 0.006 0 0.022 0.006 < 0.004 0.007 0.28 21-7 4:22 0.007 0 0.019 0.007 < 0.004 0.007 0.21
17-7 5:22 0.007 0 0.023 0.008 < 0.004 0.009 0.02 21-7 5:22 0.007 0 0.019 0.006 < 0.004 0.005 0.18
17-7 6:22 0.007 0 0.023 0.013 < 0.004 0.014 0.30 21-7 6:22 0.008 0 0.019 0.009 < 0.004 0.010 0.24
17-7 7:22 0.007 4 0.023 0.027 < 0.004 0.023 0.35 21-7 7:22 0.008 14 0.019 0.015 < 0.004 0.015 0.29
17-7 8:22 0.007 55 0.023 0.067 < 0.004 0.047 0.88 21-7 8:22 0.008 46 0.018 0.042 < 0.004 0.032 0.77
17-7 9:22 0.008 439 0.023 0.034 < 0.004 0.027 0.60 21-7 9:22 0.009 163 0.019 0.045 < 0.004 0.033 0.85
17-7 10:22 0.008 365 0.022 0.031 < 0.004 0.025 0.59 21-7 10:22 0.009 257 0.019 0.032 < 0.004 0.025 0.73

S5.30
S5-A11 Central Purto Operation Data (Winter) NP5NP5NP5NP5 NP6(27.5+132)NP6(27.5+132)NP6(27.5+132)NP6(27.5+132) PN7PN7PN7PN7 PN8PN8PN8PN8 PN9PN9PN9PN9 TG11TG11TG11TG11 TG12TG12TG12TG12 TV10TV10TV10TV10 CCCCCCCC MWHMWHMWHMWH MWHMWHMWHMWH MWHMWHMWHMWH MWHMWHMWHMWH MWHMWHMWHMWH MWhMWhMWhMWh MWhMWhMWhMWh MWhMWhMWhMWh MWhMWhMWhMWh
13-Jul13-Jul13-Jul13-Jul 0.00 2147.54 0.00 0.00 3038.42 4618.05 3994.39 5337.37 13950.1714-Jul14-Jul14-Jul14-Jul 0.00 2201.75 0.00 0.00 2130.84 0.00 4111.43 2566.56 6678.0915-Jul15-Jul15-Jul15-Jul 0.00 17.19 0.00 0.00 40.34 1197.71 2110.49 1996.96 5305.1616-Jul16-Jul16-Jul16-Jul 0.00 0.00 0.00 0.00 2330.19 5221.07 1180.31 3566.79 9968.1717-Jul17-Jul17-Jul17-Jul 0.00 1152.45 0.00 0.00 2339.06 5017.88 3374.04 4946.83 13338.7518-Jul18-Jul18-Jul18-Jul 0.00 2253.42 0.00 0.00 2181.98 5009.44 0.00 2809.81 7819.2619-Jul19-Jul19-Jul19-Jul 0.00 2308.13 0.00 0.00 2112.93 5151.69 0.00 2748.44 7900.1320-Jul20-Jul20-Jul20-Jul 0.00 2426.39 0.00 0.00 2299.32 4891.97 0.06 2724.36 7616.3921-Jul21-Jul21-Jul21-Jul 0.00 2978.92 0.00 0.00 2113.09 1153.50 3953.40 2857.45 7964.3522-Jul22-Jul22-Jul22-Jul 0.00 2145.27 0.00 0.00 2109.69 5039.16 0.00 2730.27 7769.43
Consumos Consumos Consumos Consumos horarios horarios horarios horarios solicitados solicitados solicitados solicitados para el control de para el control de para el control de para el control de emisiones.emisiones.emisiones.emisiones.
( ( ( ( Valores Valores Valores Valores calculados )calculados )calculados )calculados ) GASGASGASGAS
NP5NP5NP5NP5 NP6(27.5+132)NP6(27.5+132)NP6(27.5+132)NP6(27.5+132) PN7PN7PN7PN7 PN8PN8PN8PN8 PN9PN9PN9PN9 CCCCCCCC Dam³Dam³Dam³Dam³ Dam³Dam³Dam³Dam³ Dam³Dam³Dam³Dam³ Dam³Dam³Dam³Dam³ Dam³Dam³Dam³Dam³ Dam³Dam³Dam³Dam³
13-Jul13-Jul13-Jul13-Jul 0.00 515.06 0.00 0.00 407.02 2657.4914-Jul14-Jul14-Jul14-Jul 0.00 666.34 0.00 0.00 628.74 1319.2915-Jul15-Jul15-Jul15-Jul 0.00 5.38 0.00 0.00 4.17 1074.1916-Jul16-Jul16-Jul16-Jul 0.00 0.00 0.00 0.00 689.35 1936.2817-Jul17-Jul17-Jul17-Jul 0.00 334.77 0.00 0.00 689.89 2498.1818-Jul18-Jul18-Jul18-Jul 0.00 687.54 0.00 0.00 650.75 1448.8319-Jul19-Jul19-Jul19-Jul 0.00 700.38 0.00 0.00 633.54 1499.7320-Jul20-Jul20-Jul20-Jul 0.00 729.41 8.81 0.00 679.43 1406.3621-Jul21-Jul21-Jul21-Jul 0.00 862.31 0.00 0.00 634.05 1505.4022-Jul22-Jul22-Jul22-Jul 0.00 658.53 0.00 0.00 632.55 1339.51
Consumos Consumos Consumos Consumos horarios horarios horarios horarios solicitados solicitados solicitados solicitados para el control de para el control de para el control de para el control de emisiones.emisiones.emisiones.emisiones.
( ( ( ( Valores Valores Valores Valores calculados )calculados )calculados )calculados ) Combustible Combustible Combustible Combustible alternativoalternativoalternativoalternativo
NP5NP5NP5NP5 NP6(27.5+132)NP6(27.5+132)NP6(27.5+132)NP6(27.5+132) PN7PN7PN7PN7 PN8PN8PN8PN8 PN9PN9PN9PN9 CCCCCCCC TonTonTonTon TonTonTonTon TonTonTonTon TonTonTonTon TonTonTonTon TonTonTonTon
13-Jul13-Jul13-Jul13-Jul 0.00 123.25 0.00 0.00 385.11 0.0014-Jul14-Jul14-Jul14-Jul 0.00 0.00 0.00 0.00 0.00 0.0015-Jul15-Jul15-Jul15-Jul 0.00 0.00 0.00 0.00 0.00 0.0016-Jul16-Jul16-Jul16-Jul 0.00 0.00 0.00 0.00 0.00 0.0017-Jul17-Jul17-Jul17-Jul 0.00 0.00 0.00 0.00 0.00 0.0018-Jul18-Jul18-Jul18-Jul 0.00 0.00 0.00 0.00 0.00 0.0019-Jul19-Jul19-Jul19-Jul 0.00 0.00 0.00 0.00 0.00 0.0020-Jul20-Jul20-Jul20-Jul 0.00 0.00 0.00 0.00 0.00 0.0021-Jul21-Jul21-Jul21-Jul 0.00 0.00 0.00 0.00 0.00 0.0022-Jul22-Jul22-Jul22-Jul 0.00 0.00 0.00 0.00 0.00 0.00
S5-A12 Central Puerto Emission Data (Winter) NAME: CENTRAL PUERTO NUEVO LOCATION: BUENOS AIRES ARGENT STATION ID: 1
CHAN NAME O1516 OP-17 S1516 N1516 SO217 NO-17 O2-15 O2-17
CHAN UNITS % % PPM PPM PPM PPM % %
13-Jul Daily Average 0.5 1.9 96 10 98 174 19.8 10 14-Jul Daily Average 0.7 0.7 7 14 8 132 19.6 11
15-Jul Daily Average 0.7 0.9 4 14 6 24 19.6 21
16-Jul Daily Average 1.0 0.8 3 11 5 120 19.6 10
17-Jul Daily Average 1.3 0.7 -1 16 1 109 19.7 10
18-Jul Daily Average 1.4 0.7 1 15 3 110 19.7 11
19-Jul Daily Average 1.9 0.7 0 13 2 104 19.7 11
20-Jul Daily Average 1.5 0.7 -1 12 1 120 19.8 10
21-Jul Daily Average 0.6 0.6 -1 15 1 115 19.8 11
22-Jul Daily Average 0.6 0.6 0 16 2 106 19.6 11
NAME: CENTRAL NUEVO PUERTO LOCATION: BUENOS AIRES ARGENT STATION ID: 2
CHAN NAME OP-13 OP-14 SO213 NO-13 SO214 NO-14 O2-13 O2-14
CHAN UNITS % % PPM PPM PPM PPM % %
12-Jul Daily Average 2.0 6.0 3 2 63 86 21.1 6 13-Jul Daily Average 2.0 5.8 3 2 47 54 21.1 6
14-Jul Daily Average 2.2 2.1 3 2 31 23 21.1 6
15-Jul Daily Average 2.4 0.6 3 2 15 14 21.1 15
16-Jul Daily Average 2.2 0.4 3 2 14 15 21.1 15
17-Jul Daily Average 2.0 1.1 3 2 25 21 21.1 11
18-Jul Daily Average 2.0 1.3 3 2 28 20 21.1 6
19-Jul Daily Average 1.9 1.3 3 2 30 22 21.1 6
20-Jul Daily Average 2.0 1.5 3 2 28 17 21.1 6
21-Jul Daily Average 2.0 1.9 3 2 37 37 21.1 5
22-Jul Daily Average 2.1 1.7 3 2 32 30 21.1 6
NAME: CALDERA "A" LOCATION: CICLO COMBINADO STATION ID: 3
CHAN NAME NOXco O2"A" NOx A OPA A NOXno
CHAN UNITS ppm % ppm % mg/m3
12-Jul Daily Average 17.7 14.4 20 1 34 13-Jul Daily Average 18.3 14.6 20 2 35
14-Jul Daily Average -0.1 22.3 0 0 0
15-Jul Daily Average 19.3 19.7 13 1 37
16-Jul Daily Average 15.3 14.0 19 1 29
17-Jul Daily Average 14.5 13.9 18 1 28
18-Jul Daily Average 14.7 14.0 18 1 28
19-Jul Daily Average 15.0 13.9 19 1 29
20-Jul Daily Average 14.9 14.0 18 1 28
21-Jul Daily Average 14.8 20.0 12 2 28
22-Jul Daily Average 16.7 14.4 19 1 32
NAME: CALDERA "B" LOCATION: CICLO COMBINADO STATION ID: 4
CHAN NAME NOXco O2"B" NOX B OPA B NOxno
CHAN UNITS ppm % ppm % Mg/m3
12-Jul Daily Average 9.3 13.7 12 0 18 13-Jul Daily Average 9.1 13.6 11 0 17
14-Jul Daily Average 9.2 13.5 12 0 17
15-Jul Daily Average 4.7 16.7 6 0 9
16-Jul Daily Average 9.4 18.2 10 1 18
17-Jul Daily Average 11.4 13.4 15 0 22
18-Jul Daily Average 0.2 20.4 0 1 0
19-Jul Daily Average 0.1 20.3 0 1 0
20-Jul Daily Average 0.2 20.3 0 1 0
21-Jul Daily Average 19.2 14.1 20 0 37
22-Jul Daily Average 0.1 20.8 0 0 0

S5.31
S5-A13 Central Puerto Meteorological Data (Winter)TEMPERATURA AIRE VELOC DEL
VIENTO DIRECC SENSAC RECORR PUNTO TEMPERATURA AIRE VELOC DELVIENTO DIRECC SENSAC RECORR PUNTO
MEDIA MÁXIMA MÍNIMABAROMET
MEDIA MÁXIMA VIENTO TÉRMICA VIENTOHUMEDAD
ROCÍO MEDIA MÁXIMA MÍNIMABAROMET
MEDIA MÁXIMA VIENTO TÉRMICA VIENTOHUMEDAD
ROCÍOFECHA HORA
°C °C °C mBAR Km/h Km/h °C Km % °C
FECHA HORA
°C °C °C mBAR Km/h Km/h °C Km % °C7/137/137/137/13 0:00 9.1 9.2 8.8 1024.1 35.4 41.8 ENE -1.7 15.9 74 4.7 7/187/187/187/18 0:00 17.3 17.6 16.7 1000.8 8.0 20.9 OSO 16.4 3.2 90 15.67/137/137/137/13 1:00 8.7 8.8 8.7 1023.6 33.8 41.8 ENE -1.9 15.8 76 4.7 7/187/187/187/18 1:00 15.2 15.3 15.1 1001.6 8.0 24.1 OSO 14.2 3.5 90 13.67/137/137/137/13 2:00 8.8 8.9 8.7 1023.4 30.6 40.2 ENE -1.2 14.3 72 4.0 7/187/187/187/18 2:00 14.9 15.0 14.8 1002.4 11.3 33.8 SO 12.6 5.0 88 12.97/137/137/137/13 3:00 8.9 9.1 8.8 1023.2 29.0 37.0 NE -0.6 13.7 75 4.7 7/187/187/187/18 3:00 14.2 14.4 14.1 1003.0 11.3 32.2 OSO 11.8 5.0 87 12.17/137/137/137/13 4:00 9.1 9.1 9.0 1023.0 25.7 32.2 NE 0.5 11.4 73 4.5 7/187/187/187/18 4:00 13.4 13.4 13.4 1003.9 11.3 38.6 OSO 10.9 5.1 89 11.77/137/137/137/13 5:00 8.8 8.9 8.7 1023.0 22.5 29.0 NE 1.1 10.6 72 4.0 7/187/187/187/18 5:00 13.4 13.5 13.3 1003.8 16.1 38.6 O 8.8 6.4 89 11.77/137/137/137/13 6:00 8.7 8.7 8.6 1023.3 24.1 29.0 NE 0.4 10.8 74 4.3 7/187/187/187/18 6:00 14.0 14.1 13.9 1004.3 9.7 30.6 O 12.3 4.5 84 11.37/137/137/137/13 7:00 8.6 8.7 8.5 1023.5 27.4 33.8 NE -0.6 12.4 72 3.8 7/187/187/187/18 7:00 14.1 14.2 13.9 1005.6 8.0 20.9 O 13.0 3.4 82 11.17/137/137/137/13 8:00 8.7 8.8 8.7 1023.5 29.0 38.6 NE -0.8 13.2 72 3.9 7/187/187/187/18 8:00 13.6 13.8 13.1 1007.1 8.0 22.5 O 12.5 3.2 84 10.97/137/137/137/13 9:00 8.7 8.8 8.6 1023.8 30.6 38.6 NE -1.4 14.5 73 4.1 7/187/187/187/18 9:00 13.7 13.8 13.3 1008.3 6.4 19.3 O 13.7 3.1 84 11.07/137/137/137/13 10:00 8.4 8.6 8.3 1024.0 30.6 37.0 NE -1.7 14.0 75 4.3 7/187/187/187/18 10:00 13.6 14.1 13.3 1008.8 9.7 19.3 SSO 11.8 4.0 79 10.17/137/137/137/13 11:00 8.2 8.3 8.1 1023.6 25.7 32.2 NE -0.7 11.7 76 4.2 7/187/187/187/18 11:00 15.7 16.4 14.8 1008.7 6.4 20.9 OSO 15.7 2.6 71 10.47/137/137/137/13 12:00 8.4 8.6 8.4 1022.6 29.0 40.2 NNE -1.2 13.5 76 4.4 7/187/187/187/18 12:00 17.7 18.1 17.3 1008.4 4.8 14.5 OSO 17.7 2.4 61 10.17/137/137/137/13 13:00 9.7 10.0 9.4 1021.3 27.4 32.2 NNE 0.9 12.7 69 4.3 7/187/187/187/18 13:00 14.7 16.0 13.8 1008.1 11.3 19.3 ESE 12.3 5.0 81 11.47/137/137/137/13 14:00 10.4 10.7 10.3 1019.4 22.5 29.0 N 3.3 10.8 68 4.8 7/187/187/187/18 14:00 12.9 13.2 12.8 1007.1 14.5 20.9 ESE 8.8 6.1 88 10.97/137/137/137/13 15:00 10.9 11.2 10.8 1018.3 16.1 22.5 NNE 5.7 7.1 65 4.6 7/187/187/187/18 15:00 13.4 13.8 12.7 1007.2 12.9 22.5 SE 10.1 6.0 90 11.87/137/137/137/13 16:00 11.6 11.7 11.5 1017.0 12.9 17.7 NNE 8.0 6.3 69 6.1 7/187/187/187/18 16:00 13.1 13.2 12.9 1007.7 8.0 11.3 N 11.9 3.4 90 11.47/137/137/137/13 17:00 12.2 12.3 12.2 1017.0 12.9 16.1 NNE 8.8 5.6 69 6.7 7/187/187/187/18 17:00 12.6 12.7 12.5 1007.6 6.4 12.9 NE 12.6 3.1 93 11.47/137/137/137/13 18:00 12.3 12.3 12.3 1017.0 9.7 11.3 ENE 10.4 4.0 72 7.4 7/187/187/187/18 18:00 10.9 11.2 10.8 1007.9 9.7 12.9 E 8.9 3.7 98 10.77/137/137/137/13 19:00 12.3 12.4 12.3 1016.7 20.9 25.7 ENE 6.2 9.3 73 7.6 7/187/187/187/18 19:00 10.8 10.9 10.8 1008.7 9.7 16.1 ESE 8.8 4.2 100 10.87/137/137/137/13 20:00 12.3 12.5 12.2 1016.5 22.5 29.0 ENE 5.8 10.5 73 7.6 7/187/187/187/18 20:00 10.6 10.8 10.5 1009.6 8.0 14.5 ESE 9.4 3.7 100 10.67/137/137/137/13 21:00 11.7 11.9 11.6 1016.7 24.1 32.2 ENE 4.5 11.4 77 7.8 7/187/187/187/18 21:00 10.8 10.9 10.6 1009.8 8.0 12.9 SE 9.6 3.7 100 10.87/137/137/137/13 22:00 11.4 11.5 11.3 1017.8 27.4 37.0 NE 3.3 12.7 77 7.5 7/187/187/187/18 22:00 11.3 11.4 11.2 1010.2 4.8 8.0 SE 11.3 2.6 100 11.37/137/137/137/13 23:00 11.5 11.6 11.3 1016.2 30.6 43.5 NNE 2.7 14.3 74 7.1 7/187/187/187/18 23:00 12.2 12.5 11.8 1010.1 11.3 16.1 ESE 9.6 5.8 90 10.67/147/147/147/14 0:00 11.6 11.7 11.6 1016.0 33.8 40.2 NNE 2.2 15.3 75 7.3 7/197/197/197/19 0:00 12.4 12.6 12.2 1009.9 16.1 20.9 ESE 7.5 7.2 90 10.87/147/147/147/14 1:00 11.4 11.5 11.3 1015.9 29.0 40.2 N 2.9 13.2 77 7.5 7/197/197/197/19 1:00 11.6 11.9 10.9 1010.0 17.7 22.5 E 6.0 8.4 96 10.97/147/147/147/14 2:00 11.4 11.6 11.3 1016.0 29.0 41.8 N 2.9 12.6 74 7.0 7/197/197/197/19 2:00 11.1 11.3 10.9 1009.1 14.5 20.9 ESE 6.7 6.6 100 11.17/147/147/147/14 3:00 11.4 11.5 11.3 1016.1 27.4 38.6 NNO 3.3 12.7 74 7.0 7/197/197/197/19 3:00 10.9 10.9 10.7 1008.2 22.5 32.2 SE 3.8 10.3 100 10.97/147/147/147/14 4:00 10.9 11.0 10.8 1016.1 20.9 30.6 NNO 4.3 9.5 76 6.8 7/197/197/197/19 4:00 10.7 10.8 10.6 1007.9 24.1 33.8 SE 3.2 11.6 100 10.77/147/147/147/14 5:00 10.6 10.7 10.6 1015.3 22.5 32.2 NNO 3.5 10.0 77 6.8 7/197/197/197/19 5:00 10.5 10.6 10.4 1006.8 27.4 33.8 ESE 2.1 12.7 100 10.57/147/147/147/14 6:00 10.3 10.4 10.2 1015.5 20.9 32.2 NO 3.5 9.5 78 6.6 7/197/197/197/19 6:00 10.6 10.7 10.4 1005.8 29.0 38.6 ESE 1.7 13.5 100 10.67/147/147/147/14 7:00 9.8 9.9 9.7 1016.0 16.1 27.4 NO 4.3 7.6 76 5.8 7/197/197/197/19 7:00 10.7 10.8 10.5 1005.3 27.4 37.0 ESE 2.3 13.0 100 10.77/147/147/147/14 8:00 9.4 9.6 9.4 1016.3 11.3 19.3 NO 6.4 5.1 77 5.6 7/197/197/197/19 8:00 11.5 11.8 11.2 1005.8 27.4 40.2 E 3.4 12.9 92 10.27/147/147/147/14 9:00 10.2 11.3 9.4 1016.8 6.4 16.1 NO 10.2 2.7 71 5.2 7/197/197/197/19 9:00 12.1 12.2 11.9 1005.0 27.4 38.6 ESE 4.2 13.0 87 9.97/147/147/147/14 10:00 12.4 12.6 12.2 1017.2 8.0 22.5 O 11.3 3.2 60 4.8 7/197/197/197/19 10:00 11.9 12.1 11.8 1003.8 33.8 49.9 ESE 2.6 15.9 85 9.47/147/147/147/14 11:00 13.6 14.4 13.1 1017.7 4.8 22.5 O 13.6 2.4 54 4.5 7/197/197/197/19 11:00 11.4 11.7 11.3 1003.6 24.1 46.7 ESE 4.1 11.4 90 9.87/147/147/147/14 12:00 15.3 15.6 15.1 1017.4 6.4 19.3 O 15.3 3.4 51 5.2 7/197/197/197/19 12:00 12.1 12.5 11.8 1002.3 22.5 32.2 ENE 5.4 10.6 94 11.27/147/147/147/14 13:00 15.3 15.4 15.0 1017.2 4.8 17.7 OSO 15.3 2.4 52 5.5 7/197/197/197/19 13:00 13.1 13.3 12.8 999.8 25.7 33.8 ENE 6.0 12.2 94 12.27/147/147/147/14 14:00 16.5 16.8 16.0 1016.9 4.8 12.9 OSO 16.5 2.3 51 6.3 7/197/197/197/19 14:00 13.8 14.0 13.6 998.9 16.1 30.6 ENE 9.2 7.4 95 13.07/147/147/147/14 15:00 17.1 17.6 16.9 1017.0 3.2 12.9 OSO 17.1 1.6 45 5.1 7/197/197/197/19 15:00 11.9 12.2 11.8 998.7 14.5 25.7 SSE 7.7 7.2 96 11.37/147/147/147/14 16:00 16.9 17.8 15.2 1016.8 4.8 14.5 OSO 16.9 2.4 59 8.9 7/197/197/197/19 16:00 12.6 13.0 12.3 998.9 16.1 38.6 SSE 7.7 7.2 94 11.67/147/147/147/14 17:00 14.2 14.9 13.8 1016.7 3.2 9.7 NNO 14.2 1.4 66 7.9 7/197/197/197/19 17:00 11.7 12.0 11.5 998.2 22.5 40.2 SE 4.9 10.8 97 11.37/147/147/147/14 18:00 13.3 13.4 13.2 1016.6 3.2 8.0 NNE 13.3 1.4 78 9.6 7/197/197/197/19 18:00 12.3 12.4 12.2 999.5 17.7 30.6 SE 6.9 7.9 96 11.77/147/147/147/14 19:00 12.7 12.9 12.5 1018.1 3.2 6.4 NNE 12.7 1.3 84 10.1 7/197/197/197/19 19:00 12.3 12.3 12.3 999.0 11.3 19.3 SSE 9.7 5.1 96 11.77/147/147/147/14 20:00 14.5 15.2 12.9 1017.4 3.2 8.0 O 14.5 1.4 75 10.1 7/197/197/197/19 20:00 12.3 12.5 12.2 999.0 12.9 25.7 SE 8.9 6.1 96 11.77/147/147/147/14 21:00 12.4 12.7 12.3 1016.9 4.8 8.0 SE 12.4 1.9 79 8.9 7/197/197/197/19 21:00 13.8 14.3 12.9 999.9 6.4 24.1 O 13.8 3.2 89 12.17/147/147/147/14 22:00 12.3 12.7 12.1 1016.6 6.4 11.3 NO 12.3 2.9 72 7.4 7/197/197/197/19 22:00 13.5 13.8 13.2 999.9 6.4 16.1 O 13.5 3.1 90 11.97/147/147/147/14 23:00 13.1 13.1 12.9 1017.0 9.7 12.9 NO 11.2 4.2 60 5.5 7/197/197/197/19 23:00 12.9 13.1 12.6 1001.2 11.3 30.6 NO 10.3 5.0 93 11.87/157/157/157/15 0:00 12.9 13.1 12.7 1017.1 4.8 9.7 NO 12.9 1.9 63 6.0 7/207/207/207/20 0:00 12.5 12.9 12.3 1001.3 11.3 29.0 O 9.8 5.0 93 11.47/157/157/157/15 1:00 12.7 12.9 12.5 1016.4 4.8 11.3 NNO 12.7 2.6 62 5.6 7/207/207/207/20 1:00 12.4 12.6 12.3 1001.3 9.7 27.4 OSO 10.5 4.3 89 10.67/157/157/157/15 2:00 11.3 11.4 11.2 1015.1 16.1 22.5 NNO 6.1 7.4 79 7.8 7/207/207/207/20 2:00 11.8 11.9 11.8 1001.5 9.7 33.8 O 9.9 4.8 89 10.17/157/157/157/15 3:00 11.5 11.6 11.4 1014.9 17.7 24.1 NNO 5.9 7.9 78 7.8 7/207/207/207/20 3:00 11.4 11.6 11.2 1002.1 9.7 22.5 OSO 9.4 4.5 88 9.57/157/157/157/15 4:00 11.4 11.7 10.9 1014.4 16.1 24.1 NNO 6.3 7.7 81 8.3 7/207/207/207/20 4:00 11.2 11.3 11.0 1002.3 9.7 25.7 O 9.2 5.0 87 9.27/157/157/157/15 5:00 10.5 10.6 10.4 1013.9 11.3 14.5 NO 7.6 5.0 82 7.6 7/207/207/207/20 5:00 11.2 11.3 10.9 1002.8 8.0 25.7 OSO 10.0 4.2 86 8.97/157/157/157/15 6:00 10.3 10.4 10.3 1013.5 8.0 11.3 NO 9.1 3.7 84 7.8 7/207/207/207/20 6:00 10.9 11.2 10.8 1003.5 9.7 25.7 O 8.9 4.8 85 8.57/157/157/157/15 7:00 10.9 10.9 10.8 1013.4 17.7 22.5 N 5.2 7.9 86 8.7 7/207/207/207/20 7:00 10.8 10.8 10.7 1004.9 9.7 29.0 O 8.7 4.5 86 8.67/157/157/157/15 8:00 10.8 10.8 10.7 1013.9 19.3 27.4 NNO 4.6 8.9 84 8.2 7/207/207/207/20 8:00 10.8 10.9 10.6 1005.8 6.4 20.9 OSO 10.8 3.5 84 8.27/157/157/157/15 9:00 10.6 10.7 10.3 1014.1 16.1 22.5 NNO 5.2 6.9 81 7.4 7/207/207/207/20 9:00 10.8 10.9 10.7 1006.7 8.0 22.5 OSO 9.6 3.9 82 7.97/157/157/157/15 10:00 10.5 10.9 10.4 1014.4 16.1 22.5 NNO 5.1 7.1 80 7.2 7/207/207/207/20 10:00 12.2 12.6 11.8 1007.3 8.0 22.5 O 11.1 3.9 74 7.77/157/157/157/15 11:00 11.7 12.1 11.3 1013.5 12.9 19.3 NNO 8.2 6.0 77 7.8 7/207/207/207/20 11:00 12.9 13.1 12.8 1008.0 9.7 27.4 OSO 11.1 4.5 73 8.27/157/157/157/15 12:00 12.2 12.5 11.9 1012.9 16.1 20.9 NNO 7.3 6.8 77 8.3 7/207/207/207/20 12:00 13.7 14.1 13.4 1008.1 12.9 30.6 O 10.4 5.8 72 8.77/157/157/157/15 13:00 11.7 11.9 11.5 1011.3 16.1 20.9 N 6.6 7.1 83 8.9 7/207/207/207/20 13:00 13.9 14.2 13.7 1007.6 12.9 35.4 SO 10.7 6.3 73 9.17/157/157/157/15 14:00 12.6 12.9 12.3 1009.9 14.5 20.9 N 8.4 6.3 81 9.4 7/207/207/207/20 14:00 14.1 14.5 13.8 1007.6 12.9 38.6 OSO 11.0 5.8 69 8.57/157/157/157/15 15:00 13.2 13.3 13.1 1008.9 16.1 20.9 N 8.4 7.6 83 10.3 7/207/207/207/20 15:00 15.1 15.6 14.8 1007.9 9.7 25.7 O 13.4 4.8 68 9.37/157/157/157/15 16:00 13.9 14.1 13.8 1008.9 11.3 16.1 N 11.5 5.0 83 11.1 7/207/207/207/20 16:00 14.4 14.9 13.9 1008.1 11.3 27.4 OSO 12.0 5.6 69 8.87/157/157/157/15 17:00 14.5 15.1 14.0 1008.9 8.0 14.5 N 13.5 3.5 84 11.8 7/207/207/207/20 17:00 13.9 14.2 13.6 1008.9 9.7 30.6 O 12.1 4.5 69 8.37/157/157/157/15 18:00 14.3 14.6 14.2 1009.0 8.0 17.7 NNO 13.3 3.9 80 10.9 7/207/207/207/20 18:00 13.6 14.1 13.2 1009.1 8.0 27.4 O 12.5 3.9 71 8.47/157/157/157/15 19:00 14.7 14.8 14.4 1008.6 9.7 16.1 NNO 13.0 4.3 81 11.4 7/207/207/207/20 19:00 12.6 12.7 12.5 1010.3 8.0 24.1 O 11.5 3.9 75 8.37/157/157/157/15 20:00 14.5 14.9 14.2 1008.4 14.5 17.7 NNE 10.7 6.6 79 10.9 7/207/207/207/20 20:00 12.2 12.2 12.1 1010.9 8.0 20.9 OSO 11.0 3.9 75 7.97/157/157/157/15 21:00 14.5 14.6 14.4 1007.6 16.1 20.9 NNE 10.1 7.9 81 11.3 7/207/207/207/20 21:00 12.7 12.8 12.6 1011.2 8.0 29.0 O 11.6 4.2 74 8.27/157/157/157/15 22:00 14.3 14.4 14.2 1007.1 16.1 24.1 NNE 9.8 7.9 83 11.4 7/207/207/207/20 22:00 12.1 12.5 11.8 1011.8 11.3 27.4 O 9.3 5.1 79 8.67/157/157/157/15 23:00 14.1 14.2 13.9 1008.1 9.7 17.7 N 12.3 4.8 84 11.4 7/207/207/207/20 23:00 11.8 11.9 11.6 1012.1 9.7 30.6 O 9.9 4.7 73 7.27/167/167/167/16 0:00 14.1 14.2 13.9 1007.7 8.0 12.9 NNO 13.1 3.7 86 11.8 7/217/217/217/21 0:00 11.7 11.9 11.5 1012.3 9.7 24.1 O 9.8 4.7 73 7.17/167/167/167/16 1:00 13.8 13.9 13.6 1007.5 11.3 24.1 NNO 11.3 5.5 87 11.7 7/217/217/217/21 1:00 10.8 10.9 10.7 1012.4 11.3 30.6 O 7.9 5.1 79 7.37/167/167/167/16 2:00 14.3 14.5 14.2 1007.0 8.0 11.3 NO 13.3 3.4 85 11.8 7/217/217/217/21 2:00 9.9 10.2 9.6 1012.5 11.3 30.6 O 6.9 5.5 80 6.67/167/167/167/16 3:00 14.2 14.4 14.1 1006.9 6.4 9.7 NO 14.2 3.2 84 11.5 7/217/217/217/21 3:00 9.2 9.4 8.9 1012.8 12.9 32.2 O 5.2 6.0 81 6.17/167/167/167/16 4:00 14.2 14.4 14.0 1006.7 9.7 12.9 NO 12.5 4.0 84 11.6 7/217/217/217/21 4:00 9.2 9.3 8.9 1013.5 12.9 32.2 O 5.3 5.6 78 5.67/167/167/167/16 5:00 14.2 14.3 14.0 1005.6 8.0 11.3 NO 13.1 3.7 87 12.1 7/217/217/217/21 5:00 9.0 9.3 8.8 1014.4 8.0 22.5 O 7.7 3.9 78 5.47/167/167/167/16 6:00 14.1 14.2 14.0 1005.6 8.0 12.9 NO 13.0 4.0 87 11.9 7/217/217/217/21 6:00 9.0 9.3 8.3 1014.7 4.8 16.1 O 9.0 2.4 79 5.67/167/167/167/16 7:00 14.2 14.3 14.1 1006.4 8.0 11.3 NO 13.2 4.0 85 11.7 7/217/217/217/21 7:00 8.4 8.6 8.2 1015.7 4.8 17.7 O 8.4 2.4 77 4.77/167/167/167/16 8:00 14.4 14.7 14.3 1007.2 9.7 16.1 NO 12.7 4.7 85 11.9 7/217/217/217/21 8:00 7.6 8.0 7.2 1016.0 9.7 24.1 OSO 5.3 4.5 79 4.27/167/167/167/16 9:00 14.0 14.1 13.9 1007.7 11.3 14.5 NO 11.6 5.5 87 11.9 7/217/217/217/21 9:00 7.8 8.0 7.7 1017.1 8.0 24.1 O 6.4 4.0 80 4.67/167/167/167/16 10:00 14.3 14.8 14.0 1008.3 11.3 16.1 NO 11.9 5.1 88 12.3 7/217/217/217/21 10:00 7.3 7.4 6.9 1017.9 9.7 25.7 O 4.9 4.0 83 4.67/167/167/167/16 11:00 14.6 15.1 14.3 1008.8 8.0 16.1 NO 13.6 4.0 86 12.3 7/217/217/217/21 11:00 7.6 7.9 7.3 1018.6 9.7 24.1 O 5.2 4.2 83 4.87/167/167/167/16 12:00 15.6 16.3 15.1 1009.5 6.4 12.9 NO 15.6 2.9 81 12.4 7/217/217/217/21 12:00 8.2 8.4 8.0 1018.5 8.0 25.7 O 6.9 3.9 80 5.07/167/167/167/16 13:00 16.7 18.4 15.6 1008.3 3.2 14.5 ONO 16.7 1.4 76 12.4 7/217/217/217/21 13:00 8.8 9.3 8.4 1018.4 6.4 20.9 O 8.8 3.2 80 5.67/167/167/167/16 14:00 20.7 21.1 20.4 1007.8 8.0 24.1 OSO 20.1 4.0 100 20.7 7/217/217/217/21 14:00 8.6 8.8 8.3 1018.4 9.7 24.1 OSO 6.3 4.0 80 5.37/167/167/167/16 15:00 18.4 21.1 15.5 1008.0 12.9 20.9 SE 16.1 6.3 82 15.3 7/217/217/217/21 15:00 9.6 9.8 9.3 1018.1 8.0 24.1 O 8.3 3.4 76 5.67/167/167/167/16 16:00 13.8 14.1 13.7 1008.0 9.7 12.9 E 12.1 4.5 91 12.4 7/217/217/217/21 16:00 10.2 10.4 9.9 1018.5 8.0 22.5 OSO 8.9 4.0 73 5.67/167/167/167/16 17:00 14.7 14.8 14.6 1008.2 6.4 12.9 ENE 14.7 3.4 88 12.8 7/217/217/217/21 17:00 10.9 11.1 10.6 1019.2 6.4 22.5 OSO 10.9 3.1 69 5.47/167/167/167/16 18:00 14.6 14.9 14.3 1008.2 9.7 19.3 ESE 12.9 4.8 89 12.8 7/217/217/217/21 18:00 10.7 11.0 10.4 1020.0 8.0 19.3 O 9.5 3.7 68 5.17/167/167/167/16 19:00 14.5 14.7 14.2 1008.6 17.7 24.1 ESE 9.7 7.9 91 13.1 7/217/217/217/21 19:00 10.8 10.9 10.4 1020.8 9.7 30.6 O 8.7 4.0 71 5.77/167/167/167/16 20:00 13.7 13.8 13.6 1008.4 22.5 29.0 SE 7.5 10.3 91 12.2 7/217/217/217/21 20:00 9.8 10.2 9.5 1021.7 9.7 29.0 OSO 7.7 4.8 67 3.97/167/167/167/16 21:00 13.7 13.8 13.6 1008.7 20.9 32.2 SE 7.9 9.8 85 11.2 7/217/217/217/21 21:00 9.1 9.3 8.6 1022.5 11.3 27.4 O 5.9 5.0 79 5.67/167/167/167/16 22:00 13.1 13.3 12.9 1008.3 19.3 32.2 SE 7.6 9.5 88 11.2 7/217/217/217/21 22:00 8.2 8.5 7.1 1023.5 12.9 30.6 SSO 4.1 5.8 86 5.97/167/167/167/16 23:00 12.1 12.2 12.1 1008.4 22.5 30.6 SE 5.4 10.3 92 10.8 7/217/217/217/21 23:00 6.7 6.7 6.6 1024.5 16.1 35.4 SSE 0.4 7.2 82 3.87/177/177/177/17 0:00 11.9 11.9 11.8 1008.7 24.1 37.0 SE 4.7 11.1 93 10.8 7/227/227/227/22 0:00 7.1 7.4 6.8 1025.3 11.3 27.4 SSE 3.8 5.1 74 2.87/177/177/177/17 1:00 11.4 11.6 11.4 1008.2 22.5 37.0 SE 4.6 10.5 95 10.7 7/227/227/227/22 1:00 7.1 7.4 6.7 1025.8 11.3 32.2 S 3.7 5.5 66 1.27/177/177/177/17 2:00 11.4 11.6 11.2 1007.6 19.3 33.8 SSE 5.4 9.2 94 10.4 7/227/227/227/22 2:00 7.4 7.6 7.3 1026.5 9.7 25.7 O 5.1 4.3 65 1.37/177/177/177/17 3:00 11.3 11.3 11.2 1006.8 17.7 30.6 SSE 5.7 8.7 94 10.3 7/227/227/227/22 3:00 7.1 7.2 6.9 1026.8 9.7 19.3 O 4.7 4.0 68 1.67/177/177/177/17 4:00 11.2 11.3 11.2 1005.8 22.5 33.8 SE 4.3 10.3 95 10.4 7/227/227/227/22 4:00 6.9 7.0 6.8 1027.0 9.7 19.3 O 4.5 3.9 69 1.67/177/177/177/17 5:00 11.4 11.5 11.4 1004.1 24.1 38.6 SE 4.1 11.7 97 11.0 7/227/227/227/22 5:00 6.4 6.8 6.2 1026.8 9.7 24.1 O 3.9 4.2 71 1.57/177/177/177/17 6:00 11.6 11.8 11.4 1004.0 25.7 38.6 SE 3.9 11.7 99 11.4 7/227/227/227/22 6:00 5.9 5.9 5.8 1026.9 9.7 22.5 ONO 3.4 3.9 77 2.27/177/177/177/17 7:00 13.2 13.4 13.0 1004.1 24.1 33.8 SE 6.5 11.1 98 12.9 7/227/227/227/22 7:00 5.9 6.2 5.7 1027.4 8.0 19.3 O 4.4 4.0 73 1.47/177/177/177/17 8:00 12.3 12.4 12.2 1003.6 20.9 41.8 SE 6.2 10.0 98 12.1 7/227/227/227/22 8:00 5.7 5.9 5.6 1027.9 8.0 22.5 O 4.2 3.9 74 1.47/177/177/177/17 9:00 12.7 12.9 12.5 1002.7 16.1 24.1 ESE 7.8 7.7 100 12.7 7/227/227/227/22 9:00 6.1 6.5 5.9 1028.4 8.0 20.9 O 4.7 3.9 70 1.17/177/177/177/17 10:00 12.8 12.9 12.7 1002.1 20.9 27.4 SE 6.8 9.8 100 12.8 7/227/227/227/22 10:00 7.1 7.3 6.9 1029.1 9.7 24.1 OSO 4.7 4.0 66 1.27/177/177/177/17 11:00 13.0 13.1 12.9 1001.5 14.5 20.9 ESE 8.9 7.1 100 13.0 7/227/227/227/22 11:00 8.3 8.7 7.8 1029.6 8.0 22.5 OSO 7.0 3.7 60 1.17/177/177/177/17 12:00 13.3 13.6 13.2 1000.4 12.9 17.7 E 10.1 5.6 99 13.2 7/227/227/227/22 12:00 9.3 10.1 7.9 1029.2 6.4 20.9 O 9.3 3.2 59 1.77/177/177/177/17 13:00 14.3 14.7 14.2 999.7 9.7 16.1 E 12.6 4.8 99 14.2 7/227/227/227/22 13:00 9.4 9.8 8.7 1028.5 6.4 24.1 O 9.4 3.1 54 0.67/177/177/177/17 14:00 17.2 17.9 16.6 998.5 1.6 6.4 E 17.2 1.0 88 15.2 7/227/227/227/22 14:00 9.7 10.7 8.7 1028.0 4.8 14.5 O 9.7 2.6 49 -0.57/177/177/177/17 15:00 17.3 17.8 16.9 997.3 8.0 12.9 E 16.5 3.7 87 15.2 7/227/227/227/22 15:00 10.6 11.3 9.6 1027.5 6.4 22.5 OSO 10.6 3.2 48 0.17/177/177/177/17 16:00 17.1 17.2 16.9 997.1 9.7 16.1 SSE 15.7 4.5 87 14.9 7/227/227/227/22 16:00 9.9 11.2 8.8 1027.7 6.4 14.5 SSE 9.9 2.7 50 -0.17/177/177/177/17 17:00 16.2 16.6 15.9 997.4 17.7 25.7 SE 11.9 8.0 93 15.1 7/227/227/227/22 17:00 8.8 9.9 8.4 1028.1 8.0 16.1 E 7.4 3.9 56 0.57/177/177/177/17 18:00 15.1 15.2 14.9 997.6 16.1 25.7 SE 10.8 7.6 94 14.1 7/227/227/227/22 18:00 8.5 8.6 8.4 1028.4 11.3 16.1 N 5.3 5.0 58 0.77/177/177/177/17 19:00 15.9 16.1 15.7 998.2 11.3 19.3 SSE 13.7 5.0 91 14.5 7/227/227/227/22 19:00 8.7 9.1 8.4 1028.3 8.0 16.1 SSE 7.3 3.4 55 0.17/177/177/177/17 20:00 15.2 15.3 15.1 998.5 8.0 12.9 SSE 14.3 4.2 93 14.1 7/227/227/227/22 20:00 8.1 8.2 8.0 1028.8 11.3 20.9 SSE 4.9 5.3 60 0.87/177/177/177/17 21:00 16.1 16.2 15.8 999.2 6.4 12.9 SSE 16.1 3.4 90 14.4 7/227/227/227/22 21:00 7.8 7.9 7.8 1029.1 9.7 19.3 SSE 5.5 4.5 62 1.07/177/177/177/17 22:00 15.9 16.3 15.6 999.5 4.8 11.3 SSE 15.9 2.4 90 14.3 7/227/227/227/22 22:00 7.4 7.7 7.3 1029.0 11.3 19.3 SSE 4.2 5.0 65 1.37/177/177/177/17 23:00 15.9 16.4 15.7 999.7 1.6 6.4 OSO 15.9 0.8 91 14.5 7/227/227/227/22 23:00 7.3 7.4 7.2 1029.1 9.7 17.7 SSE 5.0 4.8 68 1.8

S5.32
S5-A14 Central Termica Costanera Operation Data (Winter)Mwh
SMC_U1 SMC_U2 SMC_U3 SMC_U4 SMC_U6 SMC_U77/13 0 0 0 0 1793 0
7/14 0 0 0 0 0 0
7/15 0 0 0 0 0 0
7/16 0 0 0 0 0 0
7/17 0 0 0 0 0 0
7/18 0 0 0 0 0 0
7/19 0 0 0 0 0 0
7/20 0 0 0 0 0 0
7/21 0 0 0 0 0 0
7/22 0 0 0 0 6.45 0
SMC_U8 SMC_U9 SMC_U10 SMC_BATV SMC_BATG7/13 354 0 1921 0 0
7/14 339 0 1836 0 0
7/15 376 0 2116 0 0
7/16 337 0 1887 0 0
7/17 343 0 1897 0 0
7/18 202 1887 2031 0 0
7/19 0 3563 1914 0 0
7/20 0 3653 1990 0 0
7/21 0 3611 1933 0 0
7/22 0 3752 1986 0 0
S5-A15 Central Termica Costanera Emission Data (Winter)C.C.S.A CHIMENEA1 CAMMESA #1
dia NOX(mg/Nm3) SO2(mg/Nm3) O2(%) GAS FUEL OPACIDAD(%) MIN RROM MAX MIN PROM MAX MIN PROMMAX (mg/dia) tn/dia MIN PROM MAX
7/13 0 0 0 0 0 0 20.7 20.76 20.8 857 0 0 0 07/14 0 0 0 0 0 0 20.7 20.81 20.9 68 0 0 0 07/15 0 0 0 0 0 0 20.7 20.8 20.9 25 0 0 0 07/16 0 0 1 0 0 0 20.7 20.8 21.1 0 0 0 0 07/17 0 0 0 0 0 0 20.6 20.85 21.6 4 0 0 0 07/18 0 0 3 0 0 0 20.7 20.85 21 0 0 0 0 07/19 0 0 0 0 0 0 20.7 20.89 21.2 18 0 0 0 07/20 0 0 0 0 0 0 20.9 20.93 21 348 0 0 0 07/21 0 0 0 0 0 0 20.9 20.92 21.1 3263 0 0 0 07/22 0 0 0 0 0 0 19.9 20.79 21.7 4914 0 0 0.6 12
C.C.S.A CHIMENEA2 CAMMESA #2
dia NOX(mg/Nm3) SO2(mg/Nm3) O2(%) GAS FUEL OPACIDAD(%) MIN RROM MAX MIN PROM MAX MIN PROMMAX (mg/dia) tn/dia MIN PROM MAX
7/13 0 3 8 0 0 0 20.6 20.77 20.9 0 1.71 0 0 07/14 2 5 10 0 0 0 20.5 20.74 21 0 1.03 0 0 07/15 0 3 14 0 0 0 20.5 20.73 21 0 0.4 0 0 07/16 0 2 9 0 0 0 20.5 20.76 21 0 0 0 0 07/17 0 2 11 0 0 0 20.2 20.74 21.6 0 0.15 0 0.01 27/18 0 4 15 0 0 0 20.5 20.84 21.1 0 0.26 0 0 07/19 0 3 11 0 0 1 20.5 20.86 21.6 0 1.3 0 0 07/20 0 4 11 0 0 0 20.8 20.91 21 0 2.19 0 0 07/21 0 0 3 0 0 0 20.8 20.94 21.1 0 0.98 0 0 07/22 0 2 12 0 0 0 19.5 20.56 21 11523 1.72 0 0.42 12
C.C.S.A CHIMENEA4 CAMMESA #3
dia NOX(mg/Nm3) SO2(mg/Nm3) O2(%) GAS FUEL OPACIDAD(%) MIN RROM MAX MIN PROM MAX MIN PROMMAX (mg/dia) tn/dia MIN PROM MAX
7/13 0 147 323 0 0 0 11 16.22 21.2 5E+05 68.53 0 0 07/14 0 1 13 0 0 0 20.9 21.08 21.2 0 0 0 0 07/15 0 0 6 0 0 0 20.8 20.96 21.2 0 0 0 0 07/16 0 1 9 0 0 0 20.7 20.97 21.2 0 0 0 0 07/17 0 1 13 0 0 0 20.3 20.81 21.2 0 0 0 0 07/18 0 0 8 0 0 1 20.6 20.87 21.2 0 0 0 0 07/19 0 0 1 0 0 2 20.7 20.88 21.1 0 0 0 0 07/20 0 0 1 0 0 2 20.8 20.97 21.2 0 0 0 0.02 27/21 0 0 7 0 0 1 20.6 20.9 21 0 0 0 0 07/22 0 8 20 0 0 2 18.7 20.55 21.2 2366 0 0 0.44 6
C.C.S.A CHIMENEA4 CAMMESA4
dia NOX(mg/Nm3) SO2(mg/Nm3) O2(%) GAS FUEL OPACIDAD(%) MIN RROM MAX MIN PROM MAX MIN PROMMAX (mg/dia) tn/dia MIN PROM MAX
7/13 1 3 6 0 0 0 20.8 20.8 20.8 0 0 0 0.18 17/14 0 2 6 0 0 0 20.8 20.8 20.8 0 0.11 0 0.02 17/15 0 2 10 0 0 0 20.8 20.8 20.8 0 0.38 0 0.07 77/16 1 3 7 0 0 0 20.8 20.8 20.8 0 0.06 0 0.09 17/17 1 3 8 0 0 0 20.8 20.8 20.8 0 0 0 0 07/18 0 2 7 0 0 1 20.8 20.8 20.8 0 0 0 0 07/19 1 1 3 0 0 2 20.8 20.8 20.8 0 0 0- 07/20 0 1 4 0 0 2 20.7 20.75 20.8 0 0 0 0 27/21 0 1 4 0 0 1 20.7 20.7 20.7 0 0 0 0 07/22 0 1 2 0 0 2 20.7 20.7 20.7 0 0 0 0 0

S5.33
S5-A16 Central Termica Costanera Meteorological Data (Winter)Día -Hora Temp.. Temp. Humedad Humedad Vel. Dir. Sens. Presión Dew Día -Hora Temp.. Temp. Humedad Humedad Vel. Dir. Sens. Presión Dew Ext Int Ex Int Vient Vient Termica Point Ext Int Ex Int Vient Vient Termica Point
2001/7/13 1:00 10.2 17.9 79.0 49.0 9.7 3 8.1 1024.6 6.7 2001/7/18 1:00 15.7 20.8 99.0 66.0 9.7 11 14.1 1002.2 15.52001/7/13 2:00 10.1 17.8 80.0 50.0 9.7 3 7.9 1024.2 6.8 2001/7/18 2:00 15.3 20.6 97.0 70.0 9.7 11 13.7 1003.4 14.82001/7/13 3:00 10.2 17.3 78.0 53.0 9.7 3 8.1 1023.9 6.5 2001/7/18 3:00 14.8 20.6 96.0 67.0 12.9 10 11.8 1003.9 14.22001/7/13 4:00 10.2 17.3 77.0 52.0 8.0 4 9.0 1023.8 6.4 2001/7/18 4:00 14.4 20.4 97.0 66.0 12.9 10 11.4 1004.7 14.02001/7/13 5:00 10.2 17.3 79.0 51.0 4.8 3 10.2 1023.7 6.7 2001/7/18 5:00 14.2 20.4 96.0 65.0 12.9 10 11.1 1004.5 13.62001/7/13 6:00 9.9 17.2 77.0 51.0 6.4 2 9.9 1023.9 6.1 2001/7/18 6:00 14.3 20.3 95.0 64.0 9.7 9 12.5 1005.1 13.42001/7/13 7:00 9.8 17.2 77.0 51.0 4.8 1 9.8 1024.0 5.9 2001/7/18 7:00 14.1 20.3 95.0 64.0 6.4 9 14.0 1006.2 13.22001/7/13 8:00 9.8 17.1 77.0 50.0 6.4 2 9.8 1024.3 5.9 2001/7/18 8:00 13.9 20.3 94.0 64.0 3.2 8 13.9 1007.3 12.92001/7/13 9:00 9.8 17.1 77.0 50.0 6.4 3 9.8 1024.5 5.9 2001/7/18 9:00 13.8 20.2 94.0 62.0 4.8 8 13.7 1008.8 12.8
2001/7/13 10:00 9.9 17.0 77.0 50.0 6.4 0 9.9 1024.8 6.1 2001/7/18 10:00 13.8 20.8 90.0 61.0 6.4 9 13.8 1009.2 12.22001/7/13 11:00 10.2 17.0 76.0 49.0 6.4 3 10.2 1024.4 6.2 2001/7/18 11:00 14.8 20.7 89.0 60.0 4.8 9 14.7 1009.1 12.92001/7/13 12:00 10.7 17.1 75.0 49.0 6.4 0 10.7 1023.6 6.5 2001/7/18 12:00 15.4 20.6 84.0 59.0 3.2 10 15.4 1008.9 12.72001/7/13 13:00 11.6 17.1 72.0 50.0 4.8 0 11.5 1022.4 6.6 2001/7/18 13:00 16.7 21.1 81.0 60.0 3.2 7 16.7 1008.3 13.42001/7/13 14:00 13.3 17.3 65.0 50.0 6.4 0 13.2 1020.4 6.8 2001/7/18 14:00 17.7 21.3 78.0 60.0 1.6 3 17.7 1007.5 13.82001/7/13 15:00 13.8 17.7 64.0 49.0 4.8 0 13.8 1019.0 7.1 2001/7/18 15:00 17.4 21.3 82.0 60.0 1.6 5 17.4 1007.5 14.32001/7/13 16:00 13.7 17.9 72.0 50.0 1.6 1 13.7 1018.0 8.7 2001/7/18 16:00 16.7 20.9 88.0 60.0 1.6 0 16.6 1008.1 14.62001/7/13 17:00 13.1 18.2 76.0 51.0 3.2 1 13.1 1017.5 8.9 2001/7/18 17:00 15.7 20.7 90.0 60.0 3.2 0 15.7 1008.0 14.12001/7/13 18:00 12.8 18.4 82.0 51.0 1.6 1 12.7 1017.7 9.7 2001/7/18 18:00 14.7 20.9 94.0 61.0 1.6 0 14.7 1008.6 13.72001/7/13 19:00 12.3 18.5 86.0 52.0 3.2 1 12.3 1017.3 10.0 2001/7/18 19:00 14.4 21.0 92.0 61.0 1.6 1 14.4 1009.2 13.12001/7/13 20:00 12.3 18.6 85.0 52.0 4.8 3 12.3 1017.1 9.8 2001/7/18 20:00 14.2 20.8 93.0 62.0 1.6 2 14.2 1010.0 13.12001/7/13 21:00 12.3 18.6 84.0 52.0 4.8 3 12.2 1017.5 9.6 2001/7/18 21:00 14.0 20.6 91.0 62.0 1.6 0 14.0 1010.6 12.62001/7/13 22:00 12.1 18.7 84.0 52.0 6.4 3 12.1 1017.1 9.4 2001/7/18 22:00 14.2 20.6 88.0 62.0 0.0 0 14.2 1010.9 12.32001/7/13 23:00 11.9 18.7 82.0 52.0 4.8 3 11.9 1016.9 8.9 2001/7/18 23:00 14.2 20.4 90.0 62.0 0.0 2 14.2 1010.8 12.6
2001/7/14 0:00 11.9 18.7 83.0 52.0 6.4 0 11.9 1016.5 9.2 2001/7/19 0:00 14.3 20.4 90.0 62.0 1.6 2 14.2 1010.5 12.62001/7/14 1:00 12.1 18.7 82.0 52.0 9.7 1 10.1 1016.6 9.0 2001/7/19 1:00 14.1 20.4 94.0 62.0 3.2 3 14.0 1010.5 13.12001/7/14 2:00 11.9 18.8 83.0 52.0 11.3 1 9.2 1016.6 9.2 2001/7/19 2:00 13.9 19.9 93.0 68.0 1.6 3 13.9 1009.9 12.82001/7/14 3:00 12.0 18.8 82.0 52.0 14.5 1 7.7 1017.1 9.0 2001/7/19 3:00 13.8 20.0 94.0 65.0 3.2 12 13.8 1009.0 12.82001/7/14 4:00 11.9 18.9 79.0 52.0 9.7 1 10.0 1016.9 8.4 2001/7/19 4:00 13.7 19.9 95.0 65.0 1.6 9 13.7 1008.5 12.92001/7/14 5:00 11.6 18.9 82.0 52.0 4.8 1 11.6 1016.1 8.6 2001/7/19 5:00 13.4 19.9 94.0 64.0 3.2 9 13.4 1007.3 12.52001/7/14 6:00 11.3 18.9 82.0 51.0 6.4 0 11.2 1016.0 8.3 2001/7/19 6:00 13.3 19.8 96.0 63.0 4.8 13 13.2 1006.5 12.62001/7/14 7:00 11.1 18.9 80.0 52.0 3.2 0 11.1 1016.6 7.7 2001/7/19 7:00 13.2 19.8 95.0 63.0 4.8 13 13.2 1005.7 12.42001/7/14 8:00 11.2 18.8 77.0 50.0 1.6 15 11.2 1016.9 7.3 2001/7/19 8:00 13.2 19.9 95.0 63.0 6.4 4 13.2 1006.3 12.42001/7/14 9:00 11.3 18.9 75.0 52.0 1.6 14 11.2 1017.5 6.9 2001/7/19 9:00 13.4 20.1 92.0 62.0 4.8 14 13.4 1005.5 12.2
2001/7/14 10:00 11.8 19.1 70.0 53.0 4.8 12 11.7 1018.0 6.4 2001/7/19 10:00 13.6 20.2 90.0 60.0 4.8 12 13.5 1004.0 11.92001/7/14 11:00 12.1 19.2 67.0 53.0 6.4 11 12.1 1018.5 6.1 2001/7/19 11:00 13.4 20.3 99.0 62.0 6.4 14 13.4 1004.2 13.32001/7/14 12:00 13.2 19.2 62.0 53.0 8.0 10 12.1 1018.3 6.1 2001/7/19 12:00 13.2 20.4 99.0 62.0 4.8 4 13.2 1002.6 13.12001/7/14 13:00 13.6 19.3 63.0 52.0 4.8 9 13.6 1018.0 6.7 2001/7/19 13:00 13.8 20.4 100.0 63.0 4.8 3 13.7 1000.1 13.72001/7/14 14:00 14.2 19.4 62.0 52.0 4.8 9 14.2 1018.0 7.0 2001/7/19 14:00 14.1 20.5 100.0 63.0 6.4 0 14.1 999.9 14.12001/7/14 15:00 14.8 19.6 59.0 53.0 3.2 9 14.8 1017.7 6.8 2001/7/19 15:00 13.2 20.4 100.0 63.0 6.4 9 13.2 998.8 13.22001/7/14 16:00 15.3 19.8 55.0 54.0 3.2 10 15.3 1017.5 6.3 2001/7/19 16:00 13.2 20.4 100.0 63.0 6.4 9 13.2 999.2 13.22001/7/14 17:00 15.1 19.9 53.0 54.0 1.6 11 15.0 1017.5 5.5 2001/7/19 17:00 12.9 20.4 100.0 64.0 6.4 7 12.9 998.9 12.92001/7/14 18:00 14.8 19.9 78.0 55.0 1.6 11 14.7 1017.4 10.9 2001/7/19 18:00 13.2 20.4 100.0 64.0 4.8 8 13.2 1000.1 13.22001/7/14 19:00 13.8 19.7 84.0 55.0 0.0 13.7 1018.2 11.1 2001/7/19 19:00 13.2 20.2 100.0 64.0 3.2 8 13.2 999.5 13.22001/7/14 20:00 13.3 19.4 67.0 55.0 0.0 8 13.3 1018.5 7.3 2001/7/19 20:00 13.3 20.1 100.0 64.0 1.6 8 13.2 999.8 13.22001/7/14 21:00 13.1 19.3 70.0 54.0 0.0 13.1 1017.9 7.7 2001/7/19 21:00 13.3 19.9 100.0 63.0 3.2 10 13.2 1000.6 13.22001/7/14 22:00 12.5 19.2 76.0 54.0 0.0 8 12.5 1017.3 8.4 2001/7/19 22:00 13.2 19.8 100.0 63.0 4.8 10 13.2 1000.4 13.22001/7/14 23:00 12.4 19.1 81.0 54.0 0.0 12.4 1017.5 9.3 2001/7/19 23:00 13.2 19.8 100.0 63.0 4.8 10 13.2 1002.0 13.2
2001/7/15 0:00 12.4 19.0 76.0 54.0 0.0 12.4 1017.8 8.3 2001/7/20 0:00 12.8 19.6 100.0 63.0 12.9 10 9.3 1001.7 12.72001/7/15 1:00 12.2 18.9 79.0 54.0 0.0 12.2 1017.4 8.6 2001/7/20 1:00 12.6 19.4 100.0 63.0 11.3 10 9.8 1002.0 12.52001/7/15 2:00 11.8 18.8 86.0 54.0 3.2 1 11.8 1015.8 9.5 2001/7/20 2:00 12.3 19.4 99.0 62.0 11.3 10 9.6 1002.1 12.12001/7/15 3:00 11.7 18.7 88.0 55.0 6.4 2 11.7 1015.7 9.7 2001/7/20 3:00 11.9 19.3 97.0 61.0 11.3 10 9.2 1002.5 11.52001/7/15 4:00 11.7 18.7 86.0 55.0 6.4 1 11.7 1015.3 9.4 2001/7/20 4:00 11.8 19.2 96.0 61.0 11.3 10 9.1 1003.1 11.22001/7/15 5:00 11.6 18.6 87.0 55.0 6.4 2 11.5 1014.8 9.4 2001/7/20 5:00 11.7 19.1 94.0 61.0 9.7 10 9.8 1003.9 10.82001/7/15 6:00 11.4 18.5 87.0 55.0 4.8 1 11.4 1014.0 9.3 2001/7/20 6:00 11.5 19.1 94.0 60.0 11.3 10 8.7 1004.3 10.62001/7/15 7:00 11.4 18.4 92.0 55.0 6.4 1 11.4 1013.9 10.1 2001/7/20 7:00 11.4 18.9 93.0 60.0 8.0 10 10.3 1005.6 10.32001/7/15 8:00 11.3 18.3 89.0 55.0 11.3 1 8.4 1014.4 9.5 2001/7/20 8:00 11.4 18.9 93.0 58.0 8.0 10 10.2 1006.4 10.32001/7/15 9:00 11.1 18.3 89.0 55.0 8.0 1 9.8 1014.6 9.3 2001/7/20 9:00 11.1 18.5 92.0 56.0 6.4 10 11.1 1007.3 9.8
2001/7/15 10:00 11.3 18.3 86.0 55.0 8.0 1 10.1 1014.7 9.0 2001/7/20 10:00 11.3 17.9 87.0 59.0 8.0 10 10.1 1008.0 9.22001/7/15 11:00 12.3 18.4 81.0 55.0 8.0 0 11.2 1014.3 9.1 2001/7/20 11:00 12.4 18.8 83.0 58.0 9.7 10 10.5 1008.4 9.62001/7/15 12:00 13.3 18.5 81.0 55.0 8.0 0 12.2 1013.3 10.1 2001/7/20 12:00 13.1 19.1 83.0 57.0 11.3 10 10.4 1008.8 10.22001/7/15 13:00 14.0 18.6 76.0 55.0 9.7 0 12.3 1012.0 9.8 2001/7/20 13:00 13.8 19.2 81.0 57.0 12.9 10 10.6 1008.6 10.62001/7/15 14:00 15.2 18.6 75.0 55.0 4.8 1 15.2 1010.5 10.8 2001/7/20 14:00 14.3 19.3 75.0 57.0 11.3 10 11.9 1008.2 9.92001/7/15 15:00 15.8 18.7 79.0 55.0 3.2 1 15.8 1009.6 12.2 2001/7/20 15:00 14.9 19.4 77.0 56.0 9.7 10 13.2 1008.6 10.92001/7/15 16:00 15.8 18.8 83.0 55.0 6.4 0 15.7 1009.2 12.8 2001/7/20 16:00 14.2 19.6 78.0 56.0 11.3 10 11.8 1008.9 10.42001/7/15 17:00 15.3 18.9 87.0 55.0 4.8 1 15.2 1009.3 13.1 2001/7/20 17:00 13.5 19.7 78.0 57.0 9.7 10 11.7 1009.6 9.72001/7/15 18:00 14.7 18.9 88.0 56.0 4.8 1 14.7 1009.3 12.8 2001/7/20 18:00 13.2 19.6 81.0 56.0 6.4 10 13.2 1009.9 10.12001/7/15 19:00 14.3 18.9 89.0 57.0 4.8 1 14.3 1009.1 12.5 2001/7/20 19:00 12.8 19.5 84.0 57.0 6.4 10 12.8 1011.0 10.22001/7/15 20:00 14.3 18.9 90.0 57.0 3.2 1 14.2 1009.0 12.6 2001/7/20 20:00 12.5 19.4 85.0 57.0 6.4 10 12.5 1011.3 10.12001/7/15 21:00 14.0 18.9 92.0 58.0 1.6 1 14.0 1008.4 12.7 2001/7/20 21:00 12.4 19.4 86.0 57.0 6.4 10 12.4 1012.0 10.22001/7/15 22:00 13.9 19.0 94.0 58.0 4.8 1 13.9 1007.8 13.0 2001/7/20 22:00 12.2 19.3 87.0 57.0 6.4 9 12.2 1012.4 10.12001/7/15 23:00 14.0 19.0 94.0 58.0 6.4 0 14.0 1008.5 13.1 2001/7/20 23:00 11.9 19.1 83.0 58.0 6.4 9 11.9 1012.7 9.2
2001/7/16 0:00 14.1 19.0 93.0 58.0 3.2 0 14.0 1008.4 12.9 2001/7/21 0:00 11.7 19.0 83.0 57.0 6.4 9 11.7 1013.0 8.92001/7/16 1:00 14.0 19.1 95.0 59.0 6.4 1 14.0 1008.2 13.2 2001/7/21 1:00 11.3 18.9 85.0 57.0 8.0 9 10.1 1013.3 8.82001/7/16 2:00 14.1 18.9 94.0 68.0 4.8 0 14.1 1007.8 13.1 2001/7/21 2:00 10.7 18.7 88.0 57.0 6.4 9 10.7 1013.2 8.82001/7/16 3:00 14.3 18.9 93.0 65.0 6.4 1 14.3 1007.6 13.2 2001/7/21 3:00 10.2 18.6 86.0 57.0 8.0 10 9.0 1013.3 8.02001/7/16 4:00 14.4 19.0 94.0 63.0 4.8 1 14.4 1007.1 13.4 2001/7/21 4:00 9.9 18.5 86.0 57.0 8.0 10 8.6 1014.1 7.72001/7/16 5:00 14.6 19.0 94.0 62.0 8.0 1 13.5 1006.4 13.6 2001/7/21 5:00 9.7 18.4 86.0 57.0 6.4 10 9.7 1014.6 7.42001/7/16 6:00 14.3 19.0 95.0 61.0 8.0 1 13.3 1006.1 13.5 2001/7/21 6:00 9.4 18.3 84.0 57.0 4.8 10 9.4 1015.4 6.92001/7/16 7:00 14.3 19.0 94.0 61.0 6.4 1 14.2 1006.9 13.3 2001/7/21 7:00 9.3 18.2 84.0 57.0 3.2 10 9.2 1016.3 6.72001/7/16 8:00 14.3 19.1 95.0 61.0 4.8 1 14.3 1007.7 13.5 2001/7/21 8:00 8.9 18.2 85.0 56.0 4.8 9 8.9 1016.9 6.52001/7/16 9:00 14.6 19.1 95.0 63.0 4.8 1 14.6 1008.0 13.8 2001/7/21 9:00 8.7 18.0 87.0 55.0 6.4 9 8.7 1017.8 6.6
2001/7/16 10:00 14.9 19.3 94.0 62.0 4.8 1 14.9 1008.7 14.0 2001/7/21 10:00 8.4 17.9 88.0 55.0 8.0 9 7.1 1018.7 6.62001/7/16 11:00 15.6 19.6 95.0 65.0 3.2 0 15.5 1009.5 14.7 2001/7/21 11:00 8.7 17.7 87.0 54.0 6.4 9 8.7 1019.3 6.72001/7/16 12:00 16.1 19.5 93.0 68.0 1.6 0 16.1 1009.7 14.9 2001/7/21 12:00 9.1 17.7 86.0 54.0 6.4 9 9.0 1019.2 6.82001/7/16 13:00 17.2 19.8 83.0 67.0 3.2 0 17.1 1009.4 14.2 2001/7/21 13:00 9.4 17.7 85.0 55.0 4.8 9 9.4 1019.0 7.02001/7/16 14:00 18.3 20.3 81.0 66.0 6.4 9 18.3 1008.2 15.0 2001/7/21 14:00 9.5 17.7 85.0 55.0 6.4 10 9.5 1019.1 7.12001/7/16 15:00 18.8 20.6 81.0 65.0 4.8 8 18.8 1008.3 15.4 2001/7/21 15:00 9.8 17.7 84.0 55.0 6.4 9 9.7 1018.9 7.22001/7/16 16:00 17.7 20.6 87.0 63.0 4.8 3 17.7 1008.3 15.5 2001/7/21 16:00 10.1 17.7 81.0 55.0 4.8 9 10.0 1019.2 6.92001/7/16 17:00 16.7 20.6 89.0 64.0 1.6 1 16.6 1008.6 14.8 2001/7/21 17:00 10.4 17.7 80.0 54.0 6.4 8 10.4 1020.1 7.22001/7/16 18:00 16.3 20.1 92.0 65.0 1.6 1 16.3 1008.7 15.0 2001/7/21 18:00 10.4 17.7 78.0 54.0 6.4 9 10.4 1020.7 6.72001/7/16 19:00 16.1 20.2 92.0 65.0 1.6 1 16.1 1009.1 14.8 2001/7/21 19:00 10.3 17.7 80.0 54.0 6.4 9 10.2 1021.5 6.92001/7/16 20:00 15.8 20.4 91.0 63.0 1.6 12 15.7 1009.4 14.3 2001/7/21 20:00 9.8 17.7 78.0 54.0 8.0 9 8.5 1022.5 6.12001/7/16 21:00 15.3 20.7 92.0 62.0 3.2 8 15.2 1009.3 13.9 2001/7/21 21:00 9.4 17.6 87.0 54.0 8.0 10 8.2 1023.2 7.42001/7/16 22:00 14.8 20.7 91.0 62.0 1.6 8 14.8 1009.2 13.3 2001/7/21 22:00 8.9 17.6 92.0 54.0 8.0 9 7.6 1024.3 7.72001/7/16 23:00 14.4 20.6 90.0 61.0 4.8 7 14.4 1009.4 12.8 2001/7/21 23:00 8.6 17.5 83.0 54.0 4.8 8 8.6 1025.3 5.8
2001/7/17 0:00 14.2 20.6 91.0 61.0 3.2 9 14.2 1009.5 12.8 2001/7/22 0:00 8.4 17.4 78.0 53.0 4.8 9 8.4 1026.0 4.82001/7/17 1:00 13.9 20.6 92.0 60.0 4.8 8 13.9 1009.1 12.6 2001/7/22 1:00 8.3 17.4 74.0 53.0 4.8 9 8.2 1026.6 3.92001/7/17 2:00 13.6 20.2 93.0 65.0 4.8 7 13.6 1008.7 12.4 2001/7/22 2:00 7.9 17.3 76.0 53.0 4.8 8 7.8 1027.0 3.92001/7/17 3:00 13.4 20.1 94.0 63.0 4.8 7 13.4 1008.1 12.5 2001/7/22 3:00 7.5 17.2 79.0 53.0 4.8 9 7.5 1027.5 4.12001/7/17 4:00 13.4 20.1 94.0 63.0 4.8 7 13.4 1006.7 12.4 2001/7/22 4:00 7.3 17.2 80.0 53.0 4.8 10 7.2 1027.7 4.02001/7/17 5:00 13.4 20.0 95.0 62.0 3.2 7 13.4 1005.5 12.7 2001/7/22 5:00 7.0 17.1 81.0 53.0 4.8 10 7.0 1027.7 3.92001/7/17 6:00 13.4 20.0 100.0 62.0 4.8 8 13.4 1005.0 13.4 2001/7/22 6:00 6.7 17.0 83.0 53.0 4.8 10 6.6 1027.8 3.92001/7/17 7:00 13.6 20.1 100.0 62.0 4.8 7 13.5 1003.9 13.5 2001/7/22 7:00 6.3 16.8 84.0 53.0 4.8 10 6.3 1028.2 3.82001/7/17 8:00 13.4 19.7 100.0 64.0 3.2 7 13.4 1004.6 13.4 2001/7/22 8:00 6.1 16.7 84.0 53.0 6.4 10 6.0 1028.8 3.52001/7/17 9:00 13.6 19.7 100.0 63.0 3.2 2 13.6 1003.7 13.6 2001/7/22 9:00 5.8 16.6 84.0 52.0 4.8 10 5.8 1029.3 3.3
2001/7/17 10:00 13.9 20.1 100.0 62.0 3.2 7 13.9 1003.1 13.9 2001/7/22 10:00 6.2 16.5 78.0 52.0 4.8 9 6.1 1030.0 2.62001/7/17 11:00 14.2 20.3 100.0 63.0 3.2 8 14.2 1002.1 14.2 2001/7/22 11:00 7.7 16.4 71.0 52.0 4.8 9 7.6 1030.3 2.72001/7/17 12:00 14.9 20.6 100.0 63.0 6.4 3 14.9 1001.1 14.9 2001/7/22 12:00 8.8 16.4 67.0 52.0 4.8 9 8.7 1030.0 2.92001/7/17 13:00 15.9 20.8 100.0 63.0 3.2 3 15.9 1000.2 15.9 2001/7/22 13:00 9.7 16.4 59.0 51.0 4.8 8 9.7 1029.1 2.12001/7/17 14:00 16.6 21.0 100.0 62.0 1.6 3 16.6 999.4 16.6 2001/7/22 14:00 10.8 16.5 55.0 51.0 4.8 11 10.7 1028.7 2.12001/7/17 15:00 17.7 21.2 100.0 64.0 3.2 8 17.6 997.7 17.6 2001/7/22 15:00 10.6 16.6 54.0 51.0 3.2 10 10.6 1028.2 1.72001/7/17 16:00 17.4 20.9 99.0 71.0 3.2 7 17.4 997.6 17.3 2001/7/22 16:00 10.5 16.7 56.0 50.0 3.2 7 10.5 1028.5 2.12001/7/17 17:00 17.2 20.7 99.0 71.0 1.6 7 17.1 998.0 16.9 2001/7/22 17:00 9.8 16.7 57.0 51.0 1.6 7 9.8 1028.7 1.72001/7/17 18:00 16.4 20.2 98.0 69.0 1.6 8 16.4 998.1 16.1 2001/7/22 18:00 9.8 16.8 60.0 51.0 1.6 7 9.8 1029.2 2.42001/7/17 19:00 16.0 19.8 97.0 70.0 1.6 8 16.0 998.9 15.5 2001/7/22 19:00 9.4 16.8 67.0 51.0 1.6 8 9.4 1029.1 3.62001/7/17 20:00 16.0 19.8 99.0 68.0 1.6 7 16.0 999.3 15.8 2001/7/22 20:00 9.0 16.8 70.0 51.0 3.2 8 9.0 1029.6 3.82001/7/17 21:00 16.1 20.4 98.0 67.0 0.0 7 16.1 999.9 15.7 2001/7/22 21:00 8.7 16.8 71.0 52.0 3.2 9 8.7 1029.6 3.82001/7/17 22:00 16.3 20.6 98.0 66.0 0.0 7 16.3 999.9 16.0 2001/7/22 22:00 8.4 16.8 74.0 52.0 1.6 9 8.4 1029.6 4.12001/7/17 23:00 16.4 20.7 100.0 66.0 0.0 7 16.4 1000.2 16.4 2001/7/22 23:00 8.3 16.8 75.0 52.0 1.6 9 8.3 1029.8 4.1
2001/7/18 0:00 16.7 20.8 100.0 66.0 4.8 11 16.6 1001.5 16.6 2001/7/23 0:00 8.2 16.8 76.0 52.0 1.6 9 8.2 1030.1 4.2

S5.34
S5-A17 Lujan de Cuyo Manual Monitoring Data (2001.2)
No 1 No 2 No 3 No 4 No 5 No 6 No 7 No 8
hr SO2 NOx TSP SO2 NOx TSP SO2 NOx TSP SO2 NOx TSP SO2 NOx TSP SO2 NOx TSP SO2 NOx TSP SO2 NOx TSP
12 44 <4 <9 <4 23 ND - ND 213 <4 48 <4 23 <4 28 <416 56 <4 <9 <4 19 <4 - <4 23 <4 28 <4 24 <4 33 <420 43 <4 74 <4 66 <4 - <4 61 17.72 26 <4 31 <4 37 <40 61 <4 47 <4 45 <4 - <4 41 <4 32 <4 - <4 - <44 46 <4 36 <4 32 <4 - <4 44 <4 57 <4 41 <4 33 <48 34 <4 41 <4 32 <4 39 <4 62 <4 35 <4 36 <4 47 <412 102 <4 37 <4 52 <4 56 <4 44 <4 54 6 49 <4 39 <416 57 <4 29 <4 38 4.34 34 <4 32 <4 37 <4 72 <4 34 <420 39 <4 36 <4 32 <4 27 <4 36 <4 34 <4 46 <4 35 <40 29 4.58 26 4.07 26 5.61 26 8.19 28 8.19 22 7.16 - ND - ND4 29 <4 58 6.13 27 <4 36 <4 44 4.58 27 5.1 32 <4 31 <48 40 <4 32 <4 33 <4 42 <4 31 <4 37 <4 32 <4 31 <412 189 6.44 41 13.28 36 15.28 106 11.37 29 12.45 53 11.99 132 11.38 32 11.5816 87 ND 22 30.92 27 19.91 22 26.91 33 26.19 22 22.74 18 21.97 44 13.6420 58 <4 52 4.27 45 <4 35 7.83 39 11.02 35 4.84 33 8.70 31 <40 27 10.76 22 5.97 28 6.74 28 8.24 24 9.32 29 6.23 27 8.24 29 6.394 57 4.58 34 9.37 41 5.41 27 6.03 30 6.8 27 10.71 37 7.93 33 7.888 34 5.36 26 <4 26 4.23 25 <4 19 4.18 19 6.13 29 6.75 43 6.3312 29 9.53 57 8.53 80 9.94 37 10.09 53 8.18 37 8.60 104 8.29 87 9.5316 225 <4 92 <4 53 <4 147 <4 91 <4 44 <4 136 <4 69 <420 86 <4 95 <4 61 <4 92 <4 57 <4 47 <4 34 <4 36 <40 44 <4 45 <4 57 9.45 72 <4 37 <4 47 <4 76 <4 41 <44 37 <4 33 <4 40 <4 41 <4 57 <4 52 <4 41 <4 208 <48 62 <4 62 <4 36 <4 39 <4 37 <4 49 <4 67 <4 36 <412 139 <4 68 <4 46 <4 142 <4 72 <4 47 <4 44 <4 67 <416 115 <4 41 10 47 12.1 50 <4 44 <4 42 <4 33 <4 42 <420 41 <4 55 <4 44 <4 44 <4 87 <4 48 <4 48 <4 35 <40 233 <4 190 <4 295 <4 157 <4 375 <4 225 <4 46 <4 27 <44 34 <4 135 <4 41 <4 174 <4 64 <4 176 <4 99 <4 59 <48 46 <4 37 <4 47 <4 36 <4 42 <4 215 <4 214 <4 165 <412 39 <4 30 <4 61 <4 27 <4 48 <4 32 <4 41 <4 - <416 135 <4 44 5.46 36 4.44 39 4.44 67 <4 39 <4 31 <4 27 <420 248 4.95 77 <4 60 <4 154 8.51 152 5.7 157 5.05 79 6.22 97 <40 40 <4 37 4.44 42 5.46 - <4 40 <4 34 <4 27 <4 49 <44 127 <4 136 4.44 155 <4 124 5.46 174 4.95 77 4.95 111 7.49 48 <48 66 6.98 47 11.1 34 11.1 32 17.16 33 10.54 27 5.96 136 6.98 116 8.9712 56 <4 - 12.2 68 <4 52 <4 62 <4 49 <4 22 <4 82 5.8616 40 <4 32 5 29 5.62 27 <4 27 <4 31 <4 37 <4 38 <420 157 <4 44 <4 79 <4 90 7.05 48 4.42 41 4.42 216 7.05 43 8.56
0 62 <4 142 4.73 132 <4 56 <4 59 <4 37 5.36 29 <4 36 <44 197 6.94 94 4.73 119 6.41 177 11.71 97 6.1 170 5.52 122 5.36 87 12.718 79 5.52 117 4.94 56 5.84 33 9.25 31 6.05 48 7.62 107 12.34 466 14.55
- 99 95
114
141152-
70 68 84
179 110 117
216
- 150 196 159
124
2/25
149 275 127
2/24
75
121
443 231
115
208 186 9792
217
2/22
2/23
123
2/18
2/19
2/20
2/21
139
185 315 316 203
155133339
215 90
179
265
142
203
-
215 -
196179232
240
268
254

S5.35
S5-A18 Lujan de Cuyo Automatic Data (Summer)day hour PM(Mg/m3) GSR(w/m2) SO2(ppm) NO(ppm) NO2(ppm) NOx(ppm) CO(ppm) day hour PM(Mg/m3) GSR(w/m2) SO2(ppm) NO(ppm) NO2(ppm) NOx(ppm) CO(ppm)
02/19/2001 16 0.000 980 0.034 0.099 - - 0.952 02/23/2001 15 0.060 821 0.010 0.010 0.000 0.000 0.92002/19/2001 17 0.000 0 0.023 0.028- 0.026 0.935 02/23/2001 16 0.060 205 0.010 0.000 0.000 0.000 0.74002/19/2001 18 - 0 0.016 0.119 - - 0.790 02/23/2001 17 0.000 487 0.010 0.000 0.000 0.000 0.70002/19/2001 19 - 0 0.015 0.099 - - 0.559 02/23/2001 18 0.000 232 0.010 0.010 0.000 0.000 0.60002/19/2001 20 - 0 0.013 0.085 - - 0.476 02/23/2001 19 0.000 39 0.010 0.000 0.000 0.000 0.45002/19/2001 21 - 0 0.013 0.010- 0.009 0.329 02/23/2001 20 0.000 0 0.010 0.000 0.000 0.000 0.40002/19/2001 22 - 319 0.013 0.005 0.001 0.006 0.270 02/23/2001 21 0.000 0 0.010 0.000 0.000 0.000 0.44002/19/2001 23 - 0 0.014 0.006- 0.005 0.199 02/23/2001 22 0.000 0 0.010 0.000 0.000 0.000 0.47002/20/2001 00 - 0 0.014 0.015- 0.013 0.429 02/23/2001 23 0.000 0 0.010 0.000 0.000 0.010 0.38002/20/2001 - 0 0.015 0.004 0.000 0.005 0.188 02/24/2001 00 0.000 0 0.010 0.000 0.000 0.000 0.31002/20/2001 - 0 0.016 0.003 0.002 0.006 0.161 02/24/2001 01 0.000 0 0.010 0.000 0.000 0.000 0.36002/20/2001 - 0 0.016 0.011 0.003 0.014 0.251 02/24/2001 02 0.010 0 0.010 0.000 0.000 0.000 0.38002/20/2001 - 10 0.017 0.004 0.003 0.007 0.123 02/24/2001 03 0.010 0 0.010 0.000 0.000 0.000 0.32002/20/2001 - 255 0.018 0.001 0.001 0.002 0.061 02/24/2001 04 0.010 0 0.010 0.000 0.000 0.000 0.43002/20/2001 - 417 0.018 0.003 0.001 0.004 0.273 02/24/2001 05 0.010 0 0.010 0.000 0.000 0.000 0.36002/20/2001 07 - 0 0.018 0.004- 0.004 0.233 02/24/2001 06 0.010 0 0.010 0.000 0.000 0.000 0.23002/20/2001 08 - - - - - - - 02/24/2001 07 0.010 20 0.010 0.000 0.000 0.000 0.39002/20/2001 09 - - - - - - - 02/24/2001 08 0.010 82 0.010 0.010 0.000 0.010 0.42002/20/2001 10 - 2138 0.040 0.010 0.000 0.010 - 02/24/2001 09 0.010 345 0.020 0.010 0.000 0.010 0.58002/21/2001 - 0 0.020 0.010 0.000 0.010 0.900 02/24/2001 10 0.010 577 0.020 0.010 0.000 0.010 0.95002/21/2001 - 0 0.030 0.010 0.000 0.020 1.180 02/24/2001 11 0.010 466 0.010 0.010 0.000 0.010 0.83002/21/2001 13 - 0 0.020 0.010 0.000 0.010 0.930 02/24/2001 12 0.010 856 0.010 0.010 0.000 0.010 0.88002/21/2001 14 - 0 0.010 0.010 0.000 0.010 1.200 02/24/2001 13 0.010 997 0.010 0.010 0.000 0.000 0.89002/21/2001 15 - 0 0.010 0.010 0.000 0.010 1.060 02/24/2001 14 0.010 415 0.010 0.010 0.000 0.010 0.92002/21/2001 16 - 0 0.010 0.010 0.000 0.010 1.180 02/24/2001 15 0.010 812 0.010 0.010 0.000 0.010 0.99002/21/2001 17 0.000 0 0.010 0.090 - - 0.820 02/24/2001 16 0.020 675 0.010 0.010 0.000 0.010 0.93002/21/2001 18 0.000 0 0.010 0.010 - - 0.680 02/24/2001 17 0.000 442 0.010 0.010 0.000 0.000 0.77002/21/2001 19 0.000 0 0.010 0.020 0.000 0.010 0.480 02/24/2001 18 0.000 246 0.010 0.010 0.000 0.010 0.57002/21/2001 20 0.000 0 0.010 0.000 0.000 0.010 0.300 02/24/2001 19 0.000 28 0.010 0.010 0.000 0.010 0.47002/21/2001 21 0.000 0 0.010 0.000 0.000 0.000 0.480 02/24/2001 20 0.000 0 0.010 0.000 0.000 0.000 0.30002/21/2001 22 0.000 0 0.010 0.000 0.000 0.010 0.720 02/24/2001 21 0.000 0 0.010 0.000 0.000 0.010 0.36002/21/2001 23 - 0 0.010 0.000 0.000 0.000 0.770 02/24/2001 22 0.000 0 0.010 0.000 0.000 0.000 0.31002/22/2001 00 - 0 0.010 0.030 - - 0.840 02/24/2001 23 0.000 0 0.010 0.000 0.000 0.000 0.27002/22/2001 - 0 0.010 0.000 0.000 0.010 0.780 02/25/2001 00 0.000 0 0.010 0.000 0.000 0.000 0.26002/22/2001 - 0 0.010 0.000 0.000 0.000 0.810 02/25/2001 01 0.000 0 0.010 0.000 0.000 0.000 0.26002/22/2001 - 0 0.010 0.000 0.000 0.010 0.860 02/25/2001 02 0.000 0 0.010 0.000 0.000 0.000 0.31002/22/2001 - 0 0.010 0.000 0.000 0.010 0.970 02/25/2001 03 0.000 0 0.010 0.000 0.000 0.000 0.35002/22/2001 - 0 0.010 0.000 0.000 0.010 0.720 02/25/2001 04 0.000 0 0.010 0.000 0.000 0.000 0.43002/22/2001 - 0 0.020 0.010 0.000 0.010 0.910 02/25/2001 05 0.000 0 0.010 0.000 0.000 0.000 0.41002/22/2001 - 0 0.020 0.010 0.000 0.010 1.060 02/25/2001 06 0.010 0 0.010 0.000 0.000 0.000 0.33002/22/2001 - 0 0.020 0.000 0.000 0.010 0.480 02/25/2001 07 0.010 11 0.010 0.000 0.000 0.000 0.57002/22/2001 - 0 0.020 0.000 0.000 0.000 0.590 02/25/2001 08 0.010 240 0.010 0.010 0.000 0.000 0.41002/22/2001 - 0 0.020 0.010 0.000 0.010 0.720 02/25/2001 09 0.010 397 0.020 0.010 0.000 0.010 1.31002/22/2001 - 644 0.020 0.090 - - 1.440 02/25/2001 10 0.010 598 0.020 0.010 0.000 0.010 0.76002/22/2001 0.040 769 0.010 0.060 0.000 0.060 1.250 02/25/2001 11 0.010 765 0.010 0.010 0.000 0.010 0.83002/22/2001 13 0.040 816 0.010 0.010 - - 1.370 02/25/2001 12 0.010 880 0.010 0.010 0.000 0.010 0.87002/22/2001 14 0.050 754 0.010 0.010 0.010 0.020 1.540 02/25/2001 13 0.010 442 0.010 0.010 0.000 0.010 0.93002/22/2001 15 0.050 671 0.010 0.010 0.020 0.030 1.520 02/25/2001 14 0.010 216 0.010 0.010 0.000 0.010 0.77002/22/2001 16 0.050 524 0.010 0.010 0.000 0.010 1.390 02/25/2001 15 0.010 372 0.010 0.010 0.000 0.010 0.74002/22/2001 17 0.000 362 0.010 0.000 0.000 0.010 1.160 02/25/2001 16 0.010 127 0.010 0.000 0.000 0.000 0.63002/22/2001 18 0.000 145 0.010 0.000 0.000 0.010 1.100 02/25/2001 17 0.000 16 0.010 0.010 0.000 0.000 0.76002/22/2001 19 0.010 19 0.010 0.000 0.000 0.010 0.890 02/25/2001 18 0.000 37 0.010 0.000 0.000 0.000 0.40002/22/2001 20 0.010 0 0.010 0.000 0.000 0.010 0.970 02/25/2001 19 0.000 47 0.010 0.000 0.000 0.010 0.40002/22/2001 21 0.010 0 0.010 0.000 0.010 0.010 1.000 02/25/2001 20 0.000 0 0.010 0.000 0.000 0.010 0.31002/22/2001 22 0.010 0 0.010 0.000 0.000 0.010 1.070 02/25/2001 21 0.000 0 0.010 0.000 0.000 0.010 0.25002/22/2001 23 0.020 0 0.010 0.000 0.000 0.010 0.900 02/25/2001 22 0.010 0 0.010 0.000 0.000 0.000 0.27002/23/2001 00 0.020 0 0.010 0.000 0.000 0.010 0.810 02/25/2001 23 0.010 0 0.010 0.000 0.000 0.000 0.22002/23/2001 01 0.020 0 0.010 0.000 0.000 0.000 0.630 02/26/2001 00 0.010 0 0.010 0.000 0.000 0.000 0.30002/23/2001 02 0.030 0 0.010 0.000 0.000 0.010 0.850 02/26/2001 01 0.010 0 0.010 0.000 0.000 0.000 0.34002/23/2001 03 0.030 0 0.010 0.000 0.000 0.000 0.550 02/26/2001 02 0.010 0 0.010 0.000 0.000 0.000 0.33002/23/2001 04 0.030 0 0.010 0.000 0.000 0.000 0.240 02/26/2001 03 0.010 0 0.010 0.000 0.000 0.000 0.37002/23/2001 05 0.030 0 0.010 0.000 0.000 0.000 0.350 02/26/2001 04 0.010 0 0.010 0.000 0.000 0.000 0.58002/23/2001 06 0.040 0 0.010 0.000 0.000 0.000 0.270 02/26/2001 05 0.010 0 0.010 0.000 0.000 0.000 0.30002/23/2001 07 0.040 21 0.010 0.000 0.000 0.000 0.310 02/26/2001 06 0.010 0 0.010 0.000 0.000 0.000 0.26002/23/2001 08 0.040 161 0.010 0.000 0.000 0.000 0.280 02/26/2001 07 0.010 37 0.010 0.010 0.000 0.010 0.25002/23/2001 09 0.050 379 0.010 0.000 0.000 0.000 0.250 02/26/2001 08 0.010 105 0.010 0.010 0.000 0.010 0.31002/23/2001 10 0.050 547 0.010 0.000 0.000 0.000 0.620 02/26/2001 09 0.010 200 0.010 0.010 0.000 0.000 0.42002/23/2001 11 0.050 706 0.010 0.000 0.000 0.000 0.850 02/26/2001 10 0.010 595 0.010 0.010 0.000 0.010 0.78002/23/2001 12 0.050 824 0.020 0.010 0.000 0.010 3.430 02/26/2001 11 0.010 435 0.010 0.010 0.000 0.010 0.56002/23/2001 13 0.060 614 0.010 0.010 0.000 0.000 0.940
02/23/2001 14 0.060 291 0.020 0.010 0.000 0.010 1.030

S5.36
S5-A19 Central Termica Lujan de Cuyo Generation Data (Summer)
Unit Out put Fuel burned Stack gasDay No. Unit Total Unit Total Temp NOx O2
(Mw) (Mw)
FuelType
(m3N/h) (m3N/h) (℃) (mg/m3
N) (mg/m3N)
25 170.5 GN 47568 63704 129 36.4 14.3315 8123 20 GN-GO 8068
2001/2/18
24 20
291.5
GN-GO25 172.8 GN 45984 61428 128.9 43.69 14.3715 80.523 20 GN-GO 77222001/2/19
24 20
293.3
GN-GO 772225 165 GN 44400 69172 127.8 40.8 14.3515 79.822 17 GN-GO 950014 1223 19 GN-GO 7636
2001/2/20
24 19
311.8
GN-GO 763625 176.5 GN 46944 71760 128.9 41.07 14.315 80.922 18 GN-GO 950014 1223 19.5 GN-GO 7658 120 203.2 14.8
2001/2/21
24 19.5
326.4
GN-GO 7658 120 184.4 14.625 170.8 GN 45552 70244 127.9 39.77 14.315 81.322 18 GN-GO 950014 1223 19 GN-GO 7596
2001/2/22
24 19
320.1
GN-GO 759625 176 GN 44928 69722 128.2 42.22 14.315 8222 18.4 GN-GO 950014 1223 19 GN-GO 7647
2001/2/23
24 19
326.4
GN-GO 764725 175 GN 44256 59692 127.9 42.89 14.3515 8123 20 GN-GO 77182001/2/24
24 20
296
GN-GO 771825 174 GN 45648 61290 128.5 44 14.3515 8223 20 GN-GO 7821
2001/2/25
24 20
296
GN-GO 7821

S5.37
S5-A20 Central Termica Meteorological Data (Feb/20 – Feb/25)Date Time WDD WDS Temp. RH PYRO UVB Date Time WDD WDS Temp. RH PYRO UVB
grado m/s °C % W/m2 W/m2 grado m/s °C % W/m2 W/m22001/2/20 12:30 60.5 4.817 26.57 34.72 855.1 0.603 2001/2/23 7:00 265.4 5.269 20.98 37.16 -3.7 0.0962001/2/20 13:00 88.79 3.945 27.35 35.59 924.8 0.603 2001/2/23 8:00 229.7 2.434 19.95 41.07 43.96 0.1122001/2/20 14:00 82.27 6.156 28.39 32.79 981.1 0.602 2001/2/23 9:00 213.3 3.585 22.32 27.32 212.3 0.1582001/2/20 15:00 82.03 5.899 30.1 28.16 941 0.609 2001/2/23 10:00 194.7 4.478 23.62 21.88 479.6 0.2482001/2/20 16:00 98.94 5.068 31.41 23.27 834.9 0.606 2001/2/23 11:00 213 4.234 24.2 26.68 600.2 0.3592001/2/20 17:00 78.82 6.14 31.62 18.54 661.5 0.483 2001/2/23 12:00 204.1 3.593 25.41 21.26 752.7 0.4832001/2/20 18:00 82.75 6.302 31.81 15.59 457.3 0.339 2001/2/23 13:00 173.1 4.083 26.47 22.52 857 0.5392001/2/20 19:00 88.7 5.805 30.97 22.52 214.5 0.233 2001/2/23 14:00 104.4 4.387 26.32 26.74 823.6 0.5092001/2/20 20:00 81.04 2.597 29.17 27.79 10.82 0.168 2001/2/23 15:00 125.4 4.262 27.49 29.4 765.7 0.5062001/2/20 21:00 306.7 2.633 27.97 28.51 -6.55 0.132 2001/2/23 16:00 91.83 4.365 26.95 36.74 645.3 0.4462001/2/20 22:00 256.5 2.51 26.67 30.03 -5.87 0.135 2001/2/23 17:00 81.83 3.139 26.71 39.23 367.4 0.3112001/2/20 23:00 120 2.06 25.72 31.55 -5.86 0.132 2001/2/23 18:00 86.29 3.617 27.17 37.2 438.1 0.2872001/2/20 0:00:00 249.5 2.123 25.24 35.72 -4.81 0.13 2001/2/23 19:00 91.16 2.652 26.96 37.48 187.9 0.1992001/2/21 1:00 134.2 1.366 24.09 39.23 -3.45 0.125 2001/2/23 20:00 81.79 3.005 25.94 40.66 15.6 0.1432001/2/21 2:00 274.5 2.289 23.24 41.3 -3.62 0.123 2001/2/23 21:00 85.84 2.323 24.78 45.15 -2.82 0.1252001/2/21 3:00 246.8 2.332 20.85 45.12 -3.12 0.12 2001/2/23 22:00 243.3 1.967 24.27 44.6 -1.69 0.1232001/2/21 4:00 243.7 2.547 20.71 48.29 -1.92 0.113 2001/2/23 23:00 110.5 3.147 23.53 51.84 0 0.122001/2/21 5:00 238.9 2.479 21.4 46.61 -2.2 0.11 2001/2/23 0:00:00 157.2 2.261 22.88 53.44 0 0.1132001/2/21 6:00 198.8 3.5 22.97 37.54 -4.22 0.108 2001/2/24 1:00 81.86 2.924 20.51 61.85 2.364 0.112001/2/21 7:00 197.1 3.461 21.13 31.76 -5.14 0.105 2001/2/24 2:00 195.2 1.842 19.86 64.38 3.019 0.1052001/2/21 8:00 230 4.638 22.31 25.07 62.41 0.129 2001/2/24 3:00 261.2 1.897 19.31 65.19 4.517 0.0982001/2/21 9:00 185.9 3.714 23.7 19.13 269.2 0.195 2001/2/24 4:00 260.8 2.4 19.95 62.18 3.463 0.0962001/2/21 10:00 163.5 4.11 24.39 19.1 394.2 0.287 2001/2/24 5:00 156.7 1.907 20.38 59.75 2.913 0.0932001/2/21 11:00 167.7 5.964 24.25 17.31 661 0.448 2001/2/24 6:00 284.1 2.333 18.31 67.41 4.069 0.0922001/2/21 12:00 158.2 5.452 25.12 16.79 842.4 0.613 2001/2/24 7:00 305.5 1.818 18.5 67.72 4.175 0.0862001/2/21 13:00 144.4 4.603 26.05 14.65 908 0.633 2001/2/24 8:00 133.2 1.437 19.01 65.75 61.37 0.1052001/2/21 14:00 124.6 3.606 26.77 14.38 962.6 0.62 2001/2/24 9:00 172.6 1.264 21.26 56.51 276 0.1672001/2/21 15:00 124.1 2.863 27.94 14.18 925.5 0.625 2001/2/24 10:00 213.8 2.063 22.52 50.13 400.2 0.2322001/2/21 16:00 86.97 6.029 27.78 15.33 821.5 0.605 2001/2/24 11:00 163.5 2.77 24.26 44.74 643.8 0.3642001/2/21 17:00 99.67 3.94 28.22 18.26 657.6 0.478 2001/2/24 12:00 112.7 4.157 24.18 44.85 746.4 0.4732001/2/21 18:00 82.08 4.429 27.42 21.6 450.6 0.331 2001/2/24 13:00 85.99 5.109 24.39 48.33 878.2 0.542001/2/21 19:00 122.2 2.147 27.29 25.64 182.9 0.222 2001/2/24 14:00 100.7 4.143 25.61 44.44 1026 0.5812001/2/21 20:00 255.3 1.866 26.18 28 17.78 0.155 2001/2/24 15:00 94.61 4.837 25.86 46.18 883.2 0.5482001/2/21 21:00 287.8 1.324 24.91 29.84 -6.47 0.136 2001/2/24 16:00 97.87 4.181 26.79 43.98 782 0.5152001/2/21 22:00 114.4 3.949 24.16 32.25 -4.86 0.132 2001/2/24 17:00 85.45 3.323 27.07 43.68 616 0.412001/2/21 23:00 274.3 1.894 22.31 37.73 -5.09 0.125 2001/2/24 18:00 94 2.859 27.25 44.76 405.7 0.2962001/2/21 0:00:00 126.9 1.872 21.71 37.99 -5.13 0.12 2001/2/24 19:00 104.2 2.538 26.86 43.81 136.6 0.2022001/2/22 1:00 120.2 1.903 20.76 39.4 -4.97 0.113 2001/2/24 20:00 69.88 2.915 25.42 50.29 13.16 0.1452001/2/22 2:00 263.2 2.178 18.23 42.33 -3.65 0.108 2001/2/24 21:00 83.52 3.305 24.16 55.11 0.362 0.1252001/2/22 3:00 265.8 2.26 17.86 43.75 -3.06 0.101 2001/2/24 22:00 77.53 2.504 23.59 61.15 3.125 0.122001/2/22 4:00 262.4 2.09 18.06 44.16 -2.94 0.097 2001/2/24 23:00 169 1.158 22.12 62.69 2.189 0.1142001/2/22 5:00 258.8 2.76 16.93 46.41 -2.33 0.093 2001/2/24 0:00:00 238.9 3.257 21.66 59.64 1.733 0.112001/2/22 6:00 271.2 2.191 16.78 46.5 -2.74 0.088 2001/2/25 1:00 254.6 3.787 21.14 65.81 4.191 0.1062001/2/22 7:00 266.4 3.302 17.78 45.5 -2.74 0.084 2001/2/25 2:00 255.6 3.033 21.47 62.97 2.93 0.1012001/2/22 8:00 256.7 3.27 18.02 45.13 44.91 0.095 2001/2/25 3:00 185.8 2.168 21.05 63.97 3.125 0.0982001/2/22 9:00 263.1 3.458 21.58 36.82 203.3 0.14 2001/2/25 4:00 88.43 2.41 19.18 71.46 6.592 0.0942001/2/22 10:00 209.8 1.932 24.76 27.64 399.1 0.215 2001/2/25 5:00 157.2 1.799 19.16 73.11 7.161 0.0882001/2/22 11:00 90.14 3.738 24.24 30 510.8 0.263 2001/2/25 6:00 198.7 1.36 18.14 76.4 8.919 0.0862001/2/22 12:00 86.73 4.762 24.62 32.24 699.2 0.379 2001/2/25 7:00 150.8 1.214 18.12 75.54 7.987 0.0832001/2/22 13:00 95.18 4.26 25.34 31.68 798.8 0.442 2001/2/25 8:00 284.6 2.05 18.24 73.23 30.4 0.0952001/2/22 14:00 92.46 4.158 26.31 31.93 828.5 0.439 2001/2/25 9:00 255.6 3.03 21.22 60.1 281.4 0.1662001/2/22 15:00 90.55 4.253 27.56 30.75 782.1 0.422 2001/2/25 10:00 187.9 1.424 24.34 51.72 468.3 0.2612001/2/22 16:00 81.53 4.548 28.08 28.89 667 0.378 2001/2/25 11:00 86.11 3.845 24.29 50.63 685.7 0.4182001/2/22 17:00 85.4 3.806 28.55 28.47 508.3 0.298 2001/2/25 12:00 98.35 4.527 24.46 53.02 758.7 0.5622001/2/22 18:00 96.29 4.293 28.59 29.03 327.8 0.234 2001/2/25 13:00 87.61 3.601 26.47 46.08 982 0.6282001/2/22 19:00 99.15 3.551 28.22 30.87 100.7 0.175 2001/2/25 14:00 83.22 3.598 27.57 43.32 1046 0.6442001/2/22 20:00 92.17 1.997 27.06 34.93 7.568 0.143 2001/2/25 15:00 97.43 3.307 26.49 49.02 225 0.2652001/2/22 21:00 278 2.811 24.8 38.83 -5.12 0.13 2001/2/25 16:00 89.39 3.394 26.02 50.81 189.8 0.252001/2/22 22:00 260.6 3.399 24.14 37.87 -5.07 0.125 2001/2/25 17:00 94.41 2.629 25.16 55.11 105.7 0.1922001/2/22 23:00 257 3.498 24.15 37.99 -4.7 0.12 2001/2/25 18:00 302 3.005 23.72 64.64 14.88 0.1282001/2/22 0:00:00 261.3 2.714 24.26 36.48 -5.13 0.118 2001/2/25 19:00 303.9 2.563 24.13 63.17 70.89 0.1472001/2/23 1:00 282.4 2.121 23.39 37.63 -4.55 0.113 2001/2/25 20:00 289.1 2.65 23.91 65.38 56.14 0.1282001/2/23 2:00 235.1 1.686 22.45 38.19 -3.67 0.11 2001/2/25 21:00 255.9 2.588 23.29 65.79 3.996 0.112001/2/23 3:00 252.5 2.315 22.48 36.85 -5.01 0.108 2001/2/25 22:00 294.8 2.301 22.24 69.44 5.868 0.1082001/2/23 4:00 257 3.706 23.2 30.07 -5.83 0.105 2001/2/25 23:00 267.1 2.443 22.1 68.84 5.868 0.1052001/2/23 5:00 249.2 3.013 21.82 28.12 -6.36 0.101 2001/2/25 0:00:00 248.1 1.775 22.21 69.75 7.308 0.1012001/2/23 6:00 244.9 3.111 20.99 49.01 -2.01 0.098

S5.38
S5-A21 Lujan de Cuyo Manual Monitoring Data (6,7.2001)
No 1 No 2 No 3 No 4 No 5 No 6 No 7 No 8
hr SO2 NOx TSP SO2 NOx TSP SO2 NOx TSP SO2 NOx TSP SO2 NOx TSP SO2 NOx TSP SO2 NOx TSP SO2 NOx TSP
12 165.8 26.3 366.7 31.6 175 30.3 100.8 25.7 107.5 28.4 140 27.4 35 21.7 275 36.016 516.7 33.7 155 24.6 49.2 28.9 58.3 29.7 35 28.0 12.5 29.5 22.5 34.5 62.5 24.920 57.5 - 29.2 21.7 40.8 16.5 30 18 57.5 22.2 37.5 20.6 45.8 22.0 31.7 75.5Av
0 25.8 32.3 30.8 31.1 46.7 33.4 44.2 39.3 48.3 34.3 55.8 31.9 65 30.9 76.7 31.14 14.2 13.0 15 <4 10.8 15.9 17.5 19.4 39.2 17.8 19.2 16.6 10.8 19.1 22.5 15.08 36.7 28.8 18.3 19.5 25.8 19.6 11.7 19.9 62.5 29.7 25.8 17.4 19.2 18.0 36.7 20.8
12 34.2 44.0 27.5 34.6 20.8 35.8 34.2 34.5 18.3 37.2 13.3 33.4 10.8 32.8 30 35.216 100.8 43.4 225 35.3 65.8 35.0 55 45.8 333.3 38.4 69.2 36.9 250 43.2 216.7 38.020 23.3 38.9 11.7 35.4 27.5 36.0 35 57.4 25.8 40.5 23.3 39.5 22.5 43.8 20.8 35.6Av
0 30 39.8 22.5 36.7 24.2 37.4 27.5 37.5 11.7 S/D 23.3 40 26.7 38.8 10.8 27.54 30 19.9 17.5 17.1 63.3 18.6 22.5 15.5 15.8 12.7 19.2 15.7 31.7 14.9 17.5 14.28 39.2 24.8 36.7 19.6 25.8 19.2 41.7 27.7 57.5 24.0 24.2 18.1 45 18.4 34.2 14.712 26.7 64.4 84.2 42.7 20.8 44.2 23.3 40.50 40.8 44.6 20.8 40.60 30 41.6 70.8 44.216 208.3 57.3 316.7 45.9 65.8 52.3 98.3 50.80 54.2 43.9 39.2 46.10 18.3 55.5 60 48.120 55.8 22.0 35.8 18.9 27.5 22.1 49.2 18.90 32.5 15.7 15.8 23.70 17.5 13.5 39.2 23.5Av0 32.5 29.1 62.5 25.9 24.2 30.8 40 27.70 143.3 31.9 43.3 43.10 63.3 30.0 37.5 23.94 25.8 19.0 20.8 17.4 63.3 18.3 25.8 18.60 19.2 19.4 10.8 17.60 19.2 16.8 10.8 16.58 13.3 22.4 39.2 18.9 25.8 21.5 35.8 24.10 34.2 23.9 22.5 20.70 15 18.8 9.2 21.012 46.7 26.1 28.3 13.4 125.8 14.9 24.2 17.10 19.2 18.7 62.5 14.80 28.3 18.6 31.7 13.016 63.3 <4 24.2 <4 208.3 4.5 14.2 <4 13.3 <4 14.2 <4 19.2 <4 9.2 <420 60.8 16.1 31.7 12.1 18.3 12.6 13.3 13.30 44.2 13.0 51.7 11.60 19.2 18.8 34.2 13.6Av0 10.8 <4 10.8 <4 49.2 <4 22.5 <4 15.8 <4 18.3 4.4 10.8 <4 11.7 <44 10.8 <4 28.3 <4 29.2 4.6 10.8 10.1 10.8 8.5 29.2 4.9 13.3 5.4 14.2 5.98 31.7 11.7 32.5 9.3 12.5 13.2 10.8 10.4 19.2 9.4 38.3 10.4 22.5 11.7 17.5 9.312 34.2 4.0 16.7 4.2 22.5 4.9 53.3 4 38.3 4.3 15.8 5.7 10.8 5.7 25.8 6.516 10.8 9.4 26.7 9.2 13.3 7.6 10.8 7 10.8 7.5 10.8 9 11.7 14.0 13.3 13.820 13.3 9.1 36.7 7.3 26.7 7.5 53.3 9.9 36.7 11.8 51.7 9.2 27.5 25.5 34.2 8.1Av
0 0 10.8 10.8 9.9 13.3 9.7 0 6.7 10.8 7.8 10.8 7.7 10.8 7.4 10.8 4.04 18.3 5.8 16.6 <4 15 <4 35.8 <4 31.7 <4 38.3 <4 28.3 <4 10.8 <48 21.7 21.1 30 20.1 55 21.5 32.5 27.3 51.7 26.1 60.8 18.9 28.3 20.2 17.5 20.4
12 72.5 23.7 791.7 23.7 84.2 32.6 37.5 30.3 65 35.4 87.5 29.7 50 20.2 94.2 28.616 58.3 18.5 112.5 24.5 75.8 33.0 36.7 30.7 61.7 29.1 27.5 19.9 48.3 35.8 99.2 29.120 19.2 16.2 18.3 20.0 0 22.9 37.5 32.9 30 24.0 75.8 19.8 23.3 21.7 16.7 21.5Av0 23.3 24.8 28.3 23.0 31.7 22.3 30 20.6 36.7 20.8 27.5 19.9 20 19.2 25 20.44 24.2 18.3 30.8 15.5 49.2 10.9 13.3 7.1 175 12.8 18.3 7.1 49.2 7.6 34.2 8.88 41.7 9.3 55.8 <4 57.5 <4 88.3 36.2 90 31.7 0 26.4 41.7 19.8 67.5 21.812 16.7 27.3 114.2 29.7 66.7 38 95.8 41.6 34.2 28.1 25.8 27.5 41.7 44.9 52.5 28.616 27.5 19.7 35 28.1 39.2 21.2 36.7 20.9 57.5 24.8 25 26.1 32.5 34.2 28.3 30.320 25.8 24.0 32.5 26.1 22.5 34.1 40 32.5 32.5 34.6 31.7 39.3 19.2 39.2 18.3 32.5Av0 19.2 23.3 19.2 34.4 45 21.5 21.7 18.3 108.3 16.0 25.8 23 19.2 18.7 72.5 17.24 10.8 17.0 28.3 15.7 19.2 18 25 18 53.3 15.4 19.2 15.5 55 11.1 48.3 10.98 18.3 10.5 29.2 26.4 15.8 10.5 13.3 16.5 43.3 14.7 31.7 8.7 14.2 13.8 18.3 24.4
180 175 268
56
768078249 105 148 115
346 160 157 196
8410497
7/4
47 80 171 124 96 54 79
95 93 44 67
7/3
146
98
48 118 179 118
77 141
42
148
78
11926014473
89
87
40
105 96
7/1
73
169
63
7/2
176 82
77 97
6/27
6/28
6/29
6/30

S5.39
S5-A22 Lujan de Cuyo Automatic Data (Winter)FECHA HORA PM-10(mg/m3) SO2(ppm) NO(ppm) NO2(ppm) NOx(ppm) CO(ppm) FECHA HORA PM-10(mg/m3) SO2(ppm) NO(ppm) NO2(ppm) NOx(ppm) CO(ppm)27-6 11:40 0.000 0.025 0.045 < 0.004 0.036 1.19 30-6 13:40 0.001 0.027 0.020 < 0.004 0.019 0.3727-6 12:40 0.001 0.025 0.040 < 0.004 0.031 0.68 30-6 14:40 0.002 0.027 0.021 < 0.004 0.020 0.3827-6 13:40 0.001 0.025 0.048 < 0.004 0.036 0.89 30-6 15:40 0.002 0.026 0.032 < 0.004 0.027 0.6927-6 14:40 0.002 0.024 0.037 < 0.004 0.028 0.74 30-6 16:40 0.002 0.027 0.024 < 0.004 0.023 0.9327-6 15:40 0.002 0.024 0.032 < 0.004 0.027 0.79 30-6 17:40 0.003 0.027 0.051 < 0.004 0.039 0.9027-6 16:40 0.003 0.024 0.037 < 0.004 0.033 0.90 30-6 18:40 0.003 0.026 0.064 < 0.004 0.046 1.2127-6 17:40 0.003 0.024 0.069 < 0.004 0.050 1.35 30-6 19:40 0.003 0.026 0.035 < 0.004 0.030 1.4227-6 18:40 0.004 0.025 0.053 < 0.004 0.039 1.20 30-6 20:40 0.004 0.026 0.061 < 0.004 0.044 1.7227-6 19:40 0.004 0.024 0.042 < 0.004 0.033 1.33 30-6 21:40 0.004 0.026 0.062 < 0.004 0.045 1.1527-6 20:40 0.005 0.024 0.048 < 0.004 0.036 1.04 30-6 22:40 0.005 0.026 0.077 < 0.004 0.052 1.2527-6 21:40 0.005 0.024 0.042 < 0.004 0.032 0.79 30-6 23:40 0.005 0.026 0.032 < 0.004 0.026 0.6427-6 22:40 0.005 0.025 0.032 < 0.004 0.026 0.77 1-7 0:40 0.006 0.027 0.021 < 0.004 0.019 0.4327-6 23:40 0.006 0.024 0.020 < 0.004 0.017 0.62 1-7 1:40 0.006 0.026 0.013 < 0.004 0.013 0.1228-6 0:40 0.006 0.024 0.019 < 0.004 0.017 0.42 1-7 2:40 0.006 0.027 0.016 < 0.004 0.016 0.4328-6 1:40 0.006 0.024 0.015 < 0.004 0.013 0.39 1-7 3:40 0.006 0.026 0.010 < 0.004 0.010 0.1328-6 2:40 0.006 0.025 0.016 < 0.004 0.014 0.36 1-7 4:40 0.007 0.026 0.012 < 0.004 0.012 0.1328-6 3:40 0.007 0.025 0.009 < 0.004 0.009 0.32 1-7 5:40 0.007 0.028 0.019 < 0.004 0.017 0.0528-6 4:40 0.007 0.026 0.007 < 0.004 0.008 0.36 1-7 6:40 0.007 0.028 0.039 < 0.004 0.030 0.5428-6 5:40 0.007 0.026 0.011 < 0.004 0.011 0.32 1-7 7:40 0.008 0.028 0.054 < 0.004 0.038 0.7028-6 6:40 0.008 0.026 0.013 < 0.004 0.013 0.33 1-7 8:40 0.009 0.027 0.087 < 0.004 0.058 0.8728-6 7:40 0.008 0.025 0.012 < 0.004 0.012 0.38 1-7 9:40 0.009 0.028 0.096 < 0.004 0.063 0.9228-6 8:40 0.009 0.026 0.036 < 0.004 0.027 0.71 1-7 10:40 0.010 0.028 0.054 < 0.004 0.040 0.8828-6 9:40 0.009 0.026 0.050 < 0.004 0.034 0.59 1-7 11:40 0.000 0.028 0.044 < 0.004 0.035 0.5428-6 10:40 0.009 0.025 0.050 < 0.004 0.036 0.85 1-7 12:40 0.001 0.028 0.034 < 0.004 0.030 0.3228-6 11:40 0.000 0.025 0.063 < 0.004 0.046 1.34 1-7 13:40 0.001 0.028 0.017 < 0.004 0.019 0.4128-6 12:40 0.001 0.025 0.049 < 0.004 0.036 1.08 1-7 14:40 0.002 0.028 0.029 < 0.004 0.027 0.8228-6 13:40 0.001 0.025 0.040 < 0.004 0.034 0.95 1-7 15:40 0.002 0.027 0.030 < 0.004 0.028 0.7328-6 14:40 0.002 0.024 0.029 < 0.004 0.033 1.34 1-7 16:40 0.003 0.026 0.024 < 0.004 0.024 0.7728-6 15:40 0.002 0.024 0.013 < 0.004 0.019 0.56 1-7 17:40 0.003 0.027 0.041 < 0.004 0.035 1.1928-6 16:40 0.003 0.023 0.023 < 0.004 0.028 0.64 1-7 18:40 0.004 0.026 0.046 < 0.004 0.038 1.0828-6 17:40 0.003 0.023 0.010 < 0.004 0.016 0.63 1-7 19:40 0.004 0.026 0.078 < 0.004 0.055 1.5328-6 18:40 0.003 0.023 0.025 < 0.004 0.025 0.72 1-7 20:40 0.005 0.026 0.095 < 0.004 0.085 2.4628-6 19:40 0.003 0.024 0.027 < 0.004 0.026 0.76 1-7 21:40 0.006 0.026 0.095 < 0.004 0.088 1.9928-6 20:40 0.004 0.023 0.094 < 0.004 0.062 1.43 1-7 22:40 0.007 0.026 0.119 < 0.004 0.078 1.6128-6 21:40 0.004 0.024 0.035 < 0.004 0.028 1.05 1-7 23:40 0.009 0.027 0.104 < 0.004 0.070 1.5028-6 22:40 0.004 0.023 0.038 < 0.004 0.030 1.15 2-7 0:40 0.010 0.027 0.083 < 0.004 0.057 1.2028-6 23:40 0.005 0.024 0.018 < 0.004 0.016 0.70 2-7 1:40 0.010 0.026 0.072 < 0.004 0.050 0.6329-6 0:40 0.005 0.024 0.018 < 0.004 0.016 0.50 2-7 2:40 0.011 0.027 0.051 < 0.004 0.038 1.4729-6 1:40 0.005 0.024 0.014 < 0.004 0.014 0.44 2-7 3:40 0.012 0.028 0.039 < 0.004 0.030 0.5329-6 2:40 0.006 0.025 0.020 < 0.004 0.017 0.27 2-7 4:40 0.012 0.026 0.034 < 0.004 0.026 0.6029-6 3:40 0.006 0.024 0.017 < 0.004 0.014 0.43 2-7 5:40 0.013 0.027 0.045 < 0.004 0.033 0.5529-6 4:40 0.006 0.024 0.012 < 0.004 0.011 0.17 2-7 6:40 0.013 0.027 0.077 < 0.004 0.050 0.4629-6 5:40 0.006 0.025 0.019 < 0.004 0.016 0.27 2-7 7:40 0.015 0.027 0.106 < 0.004 0.068 0.7929-6 6:40 0.006 0.025 0.013 < 0.004 0.012 0.37 2-7 8:40 0.016 0.027 0.090 < 0.004 0.082 1.4529-6 7:40 0.007 0.025 0.012 < 0.004 0.012 0.23 2-7 9:40 0.017 0.027 0.094 < 0.004 0.087 2.1729-6 8:40 0.007 0.025 0.011 < 0.004 0.010 0.10 2-7 10:40 0.017 0.028 0.101 < 0.004 0.072 1.1929-6 9:40 0.008 0.025 0.008 < 0.004 0.008 0.30 2-7 11:40 0.000 0.028 0.032 < 0.004 0.034 1.3629-6 10:40 0.008 0.025 0.009 < 0.004 0.008 0.19 2-7 12:40 0.002 0.027 0.033 < 0.004 0.032 0.7329-6 11:40 0.000 0.025 0.014 < 0.004 0.012 0.44 2-7 13:40 0.003 0.027 0.026 < 0.004 0.026 1.4929-6 12:40 0.001 0.026 0.066 < 0.004 0.044 0.70 2-7 14:40 0.003 0.026 0.034 < 0.004 0.032 0.7329-6 13:40 0.001 0.026 0.016 < 0.004 0.014 0.69 2-7 15:40 0.004 0.026 0.044 < 0.004 0.035 0.7329-6 14:40 0.002 0.026 0.009 < 0.004 0.009 0.50 2-7 16:40 0.004 0.026 0.041 < 0.004 0.037 1.0629-6 15:40 0.002 0.025 0.009 < 0.004 0.009 0.51 2-7 17:40 0.005 0.026 0.048 < 0.004 0.040 1.5529-6 16:40 0.002 0.026 0.012 < 0.004 0.012 0.40 2-7 18:40 0.005 0.025 0.085 < 0.004 0.060 1.3029-6 17:40 0.002 0.026 0.015 < 0.004 0.014 0.42 2-7 19:40 0.006 0.024 0.057 < 0.004 0.044 1.3029-6 18:40 0.003 0.026 0.015 < 0.004 0.014 0.82 2-7 20:40 0.006 0.026 0.062 < 0.004 0.048 1.0329-6 19:40 0.003 0.027 0.016 < 0.004 0.016 0.42 2-7 21:40 0.007 0.026 0.078 < 0.004 0.057 1.3829-6 20:40 0.003 0.025 0.023 < 0.004 0.022 1.17 2-7 22:40 0.009 0.026 0.053 < 0.004 0.039 0.9029-6 21:40 0.004 0.026 0.020 < 0.004 0.019 1.00 2-7 23:40 0.009 0.026 0.046 < 0.004 0.035 0.8429-6 22:40 0.004 0.026 0.020 < 0.004 0.019 0.76 3-7 0:40 0.010 0.026 0.060 < 0.004 0.044 0.8529-6 23:40 0.004 0.027 0.023 < 0.004 0.020 0.30 3-7 1:40 0.011 0.027 0.044 < 0.004 0.034 0.7230-6 0:40 0.004 0.026 0.012 < 0.004 0.013 0.50 3-7 2:40 0.012 0.026 0.037 < 0.004 0.030 0.3530-6 1:40 0.004 0.027 0.010 < 0.004 0.012 0.39 3-7 3:40 0.012 0.027 0.036 < 0.004 0.029 0.6330-6 2:40 0.005 0.028 0.008 < 0.004 0.010 0.20 3-7 4:40 0.013 0.026 0.030 < 0.004 0.024 0.3330-6 3:40 0.005 0.028 0.009 < 0.004 0.010 0.02 3-7 5:40 0.013 0.028 0.042 < 0.004 0.031 0.5230-6 4:40 0.006 0.027 0.004 < 0.004 0.006 0.09 3-7 6:40 0.014 0.028 0.051 < 0.004 0.035 0.6330-6 5:40 0.006 0.028 0.006 < 0.004 0.007 0.05 3-7 7:40 0.014 0.028 0.080 < 0.004 0.053 1.0830-6 6:40 0.006 0.027 0.010 < 0.004 0.011 0.10 3-7 8:40 0.014 0.027 0.119 < 0.004 0.075 1.1530-6 7:40 0.006 0.027 0.020 < 0.004 0.018 0.32 3-7 9:40 0.015 0.028 0.102 < 0.004 0.095 1.4030-6 8:40 0.006 0.028 0.093 < 0.004 0.060 1.14 3-7 10:40 0.016 0.027 0.068 < 0.004 0.052 1.1430-6 9:40 0.007 0.028 0.046 < 0.004 0.033 0.63 3-7 11:40 0.000 0.027 0.053 < 0.004 0.042 1.0530-6 10:40 0.007 0.027 0.023 < 0.004 0.020 0.34 3-7 12:40 0.001 0.027 0.061 < 0.004 0.047 1.1330-6 11:40 0.000 0.028 0.030 < 0.004 0.025 0.69 3-7 13:40 0.002 0.028 0.046 < 0.004 0.040 0.9630-6 12:40 0.001 0.027 0.029 < 0.004 0.026 0.60 3-7 14:40 0.003 0.027 0.024 < 0.004 0.028 0.80

S5.40
S5-A23 Centaral Termica Lujan de Cuyo Generation Data (Winter)Day Unit Out put Fuel Fuel burned Stack gas
No. Unit Total Type Unit Total Temp NOx O2
(Mw) (Mw) (m3N/h) (m3
N/h) (℃) (mg/m3N) (mg/m3
N)25 162 283.1GN 48625 69938 117.35 91 14.415 78
23 21.3 GN-GO 10698 135 179 14.82001/6/27
24 21.8 GN-GO 10615 130 182 14.82001/6/28 25 156 275.1GN 45455 66768 116.08 117 14.45
15 76 23 21.3 GN-GO 10698 135 179 14.824 21.8 GN-GO 10615 130 182 14.8
2001/6/29 25 162 283.1GN 47486 68799 117.42 95 14.3815 78 23 21.3 GN-GO 10698 135 179 14.824 21.8 GN-GO 10615 130 182 14.8
2001/6/30 25 150 267.1GN 45033 66346 115.69 106 14.4315 74 23 21.3 GN-GO 10698 135 179 14.824 21.8 GN-GO 10615 130 182 14.8
2001/7/1 25 162 282.1GN 46922 68235 116.45 123 14.3415 77 23 21.3 GN-GO 10698 135 179 14.824 21.8 GN-GO 10615 130 182 14.8
2001/7/2 25 188 317.1GN 53860 75731 116 88 14.215 86 23 21.3 GN-GO 10698 135 179 14.824 21.8 GN-GO 10615 130 182 14.8
2001/7/3 25 168 291.1GN 47487 68800 117 95 14.215 80 23 21.3 GN-GO 10698 135 179 14.824 21.8 GN-GO 10615 130 182 14.8
2001/7/4 25 128 229.1GN 38869 60209 115 75 14.315 58 23 21.3 GN-GO 10698 135 179 14.824 21.8 GN-GO 10615 130 182 14.8

S5.41
S5-A24 Central Termica Lujan de Cuyo Meteorological Data (Winter)DATEDATEDATEDATE TIMETIMETIMETIME WDWDWDWD WSWSWSWS TTTT RHRHRHRH PYROPYROPYROPYRO UVBUVBUVBUVB DATEDATEDATEDATE TIMETIMETIMETIME WDWDWDWD WSWSWSWS TTTT RHRHRHRH PYROPYROPYROPYRO UVBUVBUVBUVB
°°°° m/sm/sm/sm/s °°°°CCCC %%%% W/mW/mW/mW/m2222 W/mW/mW/mW/m2222 °°°° m/sm/sm/sm/s °°°°CCCC %%%% W/mW/mW/mW/m2222 W/mW/mW/mW/m2222
2001/6/26 16:00 87.83 3.393 14.37 31.58 356.1 0.149 2001/6/30 21:00 269.6 2.714 6.359 69.45 6.075 0.028
2001/6/26 17:00 90.17 2.566 14.34 32.04 148.5 0.092 2001/6/30 22:00 272.2 2.546 6.592 67.65 5.176 0.027
2001/6/26 18:00 84.12 2.615 13.56 34.21 54.59 0.056 2001/6/30 23:00 261.2 2.483 6.825 60.69 2.283 0.024
2001/6/26 19:00 226.8 0.943 9.224 47.75 -3.28 0.031 2001/6/30 24:00:00 245.9 1.505 6.127 64.18 3.361 0.024
2001/6/26 20:00 283.5 2.057 6.322 59.93 0.37 0.027 2001/7/1 1:00 273.7 2.427 6.946 58.14 1.152 0.022
2001/6/26 21:00 281.3 2.575 7.021 58.27 0.004 0.024 2001/7/1 2:00 275.1 3.098 6.577 58.69 1.774 0.022
2001/6/26 22:00 281 3.163 7.252 57.42 0 0.023 2001/7/1 3:00 281.3 3.069 7.114 58.1 0.72 0.021
2001/6/26 23:00 278.9 3.164 6.982 57.33 0 0.022 2001/7/1 4:00 266.1 4.285 8.03 54.3 0 0.022
2001/6/26 24:00:00 276.9 1.942 4.791 65.33 2.897 0.022 2001/7/1 5:00 244.8 2.858 8.339 51.33 -0.96 0.022
2001/6/27 1:00 277.4 3.55 5.946 59.9 1.335 0.02 2001/7/1 6:00 295.5 3.668 7.631 55.19 0.704 0.022
2001/6/27 2:00 285.6 3.439 5.902 59.63 0.928 0.02 2001/7/1 7:00 289 2.824 8.379 54.31 1.758 0.022
2001/6/27 3:00 278 2.891 4.891 62.88 2.641 0.018 2001/7/1 8:00 175.9 2.75 8.472 57.74 2.824 0.022
2001/6/27 4:00 273.9 2.932 5.001 62.24 2.608 0.017 2001/7/1 9:00 265.5 2.178 5.732 70.12 11.54 0.027
2001/6/27 5:00 280.2 2.656 4.322 63.86 3.206 0.015 2001/7/1 10:00 105.1 2.163 6.377 66.41 47.61 0.044
2001/6/27 6:00 285.4 2.327 3.992 62.5 2.686 0.015 2001/7/1 11:00 88.14 2.842 5.892 67.48 68.58 0.057
2001/6/27 7:00 278.8 2.311 3.349 64.04 3.044 0.015 2001/7/1 12:00 87.2 2.041 5.569 68.29 42.71 0.045
2001/6/27 8:00 282.1 2.41 4.12 60.98 2.315 0.015 2001/7/1 13:00 112 2.868 4.816 56.42 65.7 0.06
2001/6/27 9:00 277.7 2.15 3.174 59.68 16.01 0.022 2001/7/1 14:00 112.9 1.967 5.024 54.96 91.35 0.074
2001/6/27 10:00 294.9 1.994 4.746 59.03 70.61 0.062 2001/7/1 15:00 103.9 2.414 5.102 53.26 105.4 0.082
2001/6/27 11:00 266.3 1.314 11.87 41.62 392.3 0.141 2001/7/1 16:00 98.95 1.839 4.976 54.79 81.02 0.068
2001/6/27 12:00 99.2 1.716 11.95 42.22 478.9 0.192 2001/7/1 17:00 238 1.598 5.244 53.53 50.61 0.049
2001/6/27 13:00 98.43 2.548 12.44 40.06 528.9 0.228 2001/7/1 18:00 150.7 0.92 5.368 57.94 35.09 0.036
2001/6/27 14:00 97.27 3.229 13.02 40.28 528.1 0.233 2001/7/1 19:00 120.7 1.441 4.717 60.65 3.849 0.022
2001/6/27 15:00 90.8 2.945 13.09 40.8 447.8 0.2 2001/7/1 20:00 171 0.962 4.659 59.94 3.552 0.022
2001/6/27 16:00 94.08 3.138 13.11 42.51 301.5 0.153 2001/7/1 21:00 297.2 1.809 4.412 64.47 5.693 0.022
2001/6/27 17:00 81.08 3.158 11.84 46.69 129.5 0.099 2001/7/1 22:00 166.7 1.22 4.608 62.71 4.679 0.021
2001/6/27 18:00 82.81 2.282 10.74 50.3 53.17 0.057 2001/7/1 23:00 249.8 1.265 4.428 59.18 3.259 0.021
2001/6/27 19:00 268.5 1.228 9.385 54.68 0.191 0.037 2001/7/1 24:00:00 234 1.247 3.619 67.51 6.759 0.02
2001/6/27 20:00 242 1.334 6.27 67.64 4.032 0.034 2001/7/2 1:00 126.6 1.871 3.525 64.92 5.241 0.02
2001/6/27 21:00 269.6 3.224 6.859 67.64 4.313 0.032 2001/7/2 2:00 263.2 1.187 2.897 68.74 7.092 0.02
2001/6/27 22:00 267.9 2.95 7.265 64.82 3.52 0.027 2001/7/2 3:00 87.84 1.628 2.608 67.79 6.498 0.019
2001/6/27 23:00 272.8 3.183 8.252 58.58 0.68 0.025 2001/7/2 4:00 282 2.089 2.475 56.65 0.248 0.018
2001/6/27 24:00:00 275.6 2.637 7.406 59.94 1.017 0.024 2001/7/2 5:00 164.6 0.883 0.399 64.07 2.596 0.015
2001/6/28 1:00 283.4 1.437 6.082 62.31 2.14 0.024 2001/7/2 6:00 293.2 1.906 -0.18 76.74 9.794 0.015
2001/6/28 2:00 287.8 2.111 3.374 70.2 6.112 0.022 2001/7/2 7:00 236.2 1.623 -0.81 74.99 9.562 0.013
2001/6/28 3:00 272.6 2.286 3.423 70.42 5.981 0.02 2001/7/2 8:00 192.9 1.136 -1.13 79.82 12.05 0.012
2001/6/28 4:00 310.4 2.476 4.323 64.8 3.796 0.02 2001/7/2 9:00 201.2 0.948 -0.74 78.39 23.68 0.019
2001/6/28 5:00 292 1.96 5.865 61.43 3.097 0.019 2001/7/2 10:00 264.9 2.117 1.788 71.14 79.09 0.055
2001/6/28 6:00 306.9 1.919 6.662 56.09 0.574 0.018 2001/7/2 11:00 131.5 2.273 4.203 55.71 271.8 0.111
2001/6/28 7:00 279.3 1.236 6.89 54.43 -0.13 0.016 2001/7/2 12:00 165.4 1.187 6.964 45.19 394.7 0.167
2001/6/28 8:00 301.8 1.886 4.08 58.37 0.562 0.015 2001/7/2 13:00 110.8 2.081 7.539 42.31 520.2 0.223
2001/6/28 9:00 265.3 3.759 9.416 36.03 0.199 0.024 2001/7/2 14:00 217.6 2.298 9.062 43.19 527.4 0.231
2001/6/28 10:00 233.7 4.332 11.21 36.09 37.02 0.062 2001/7/2 15:00 101.3 3.204 10.17 41.76 518 0.22
2001/6/28 11:00 193.1 3.891 12.74 31.24 320 0.13 2001/7/2 16:00 83.72 3.454 9.924 38.23 350.8 0.152
2001/6/28 12:00 179.4 4.843 12.28 33.58 443.8 0.189 2001/7/2 17:00 101.7 2.658 8.965 42.28 66.48 0.082
2001/6/28 13:00 160.1 4.546 12.94 35.38 511.8 0.231 2001/7/2 18:00 103.4 2.179 8.422 42.61 25.42 0.055
2001/6/28 14:00 142.5 2.423 13.74 35.5 394 0.206 2001/7/2 19:00 267.4 1.792 6.858 48.03 -1.6 0.028
2001/6/28 15:00 92.56 2.576 13.51 36.02 364.1 0.19 2001/7/2 20:00 305.8 2.685 3.719 61.79 2.523 0.025
2001/6/28 16:00 99.16 2.651 13.98 34.47 375.9 0.172 2001/7/2 21:00 237.5 1.718 4.269 60.41 2.511 0.024
2001/6/28 17:00 73.57 2.927 13.86 36.61 154.4 0.109 2001/7/2 22:00 251.8 1.874 3.395 61.31 2.771 0.022
2001/6/28 18:00 76.35 2.689 12.22 41.55 37.88 0.068 2001/7/2 23:00 271.3 2.636 1.788 69.13 6.567 0.021
2001/6/28 19:00 310.9 2.051 9.836 50.47 -1.92 0.039 2001/7/2 24:00:00 213 1.603 4.173 62.78 3.638 0.02
2001/6/28 20:00 281.5 1.667 7.525 58.05 0.004 0.036 2001/7/3 1:00 211.7 1.752 5.637 58.21 1.355 0.02
2001/6/28 21:00 184.5 0.995 4.103 70.41 5.778 0.032 2001/7/3 2:00 155 1.675 3.968 63.93 3.634 0.019
2001/6/28 22:00 227.2 1.094 3.102 72.69 6.734 0.027 2001/7/3 3:00 221.1 1.564 3.012 64.73 3.992 0.016
2001/6/28 23:00 215 1.148 3.028 72.9 7.149 0.025 2001/7/3 4:00 298.8 1.812 2.043 72.95 8.11 0.015
2001/6/28 24:00:00 283.4 2.371 4.387 71.8 6.868 0.023 2001/7/3 5:00 144.7 2.089 4.288 63.58 3.748 0.015
2001/6/29 1:00 292.2 2.573 3.765 70.33 6.466 0.022 2001/7/3 6:00 232.3 1.9 3.194 66.22 4.972 0.015
2001/6/29 2:00 285.1 2.669 4.44 67.64 4.496 0.02 2001/7/3 7:00 251.4 1.214 0.782 71.18 7.178 0.015
2001/6/29 3:00 285.3 2.903 4.39 67.35 4.378 0.02 2001/7/3 8:00 267.1 2.657 1.42 74.2 9.639 0.014
2001/6/29 4:00 286 3.629 5.09 63.23 3.145 0.02 2001/7/3 9:00 260.7 2.151 2.263 69.76 28.28 0.022
2001/6/29 5:00 286.6 3.373 4.563 65.39 4.248 0.019 2001/7/3 10:00 319.4 3.234 5.261 63.79 87 0.06
2001/6/29 6:00 263.2 2.024 4.072 66.84 4.427 0.017 2001/7/3 11:00 134.6 1.871 7.699 55.78 222.7 0.11
2001/6/29 7:00 244.1 2.304 3.51 70.14 6.84 0.016 2001/7/3 12:00 109.2 3.192 10.07 50.57 289.9 0.154
2001/6/29 8:00 268.7 2.051 2.44 73.86 8.081 0.015 2001/7/3 13:00 162 1.754 11.11 51.97 283.9 0.155
2001/6/29 9:00 291.7 2.71 2.471 73.75 16.07 0.023 2001/7/3 14:00 156.2 1.948 12.07 49.87 314.1 0.173
2001/6/29 10:00 275.8 1.82 4.807 69.31 49.41 0.058 2001/7/3 15:00 108.7 2.229 13.44 46.75 410.7 0.194
2001/6/29 11:00 194 1.961 9.716 50.8 321.6 0.123 2001/7/3 16:00 151.8 1.78 14.69 45.22 299.8 0.148
2001/6/29 12:00 204.9 1.935 10.8 46.89 441.5 0.179 2001/7/3 17:00 129.3 2.288 15 44.53 150 0.103
2001/6/29 13:00 113.2 3.002 12.95 42.9 517.7 0.222 2001/7/3 18:00 289.4 2.98 14 49.1 92.31 0.065
2001/6/29 14:00 113.8 2.338 14.11 40.37 551.4 0.242 2001/7/3 19:00 134.9 1.697 11.8 56.1 0.781 0.036
2001/6/29 15:00 112.2 2.336 15.5 39.55 458.4 0.213 2001/7/3 20:00 154.5 2.612 9.13 61.06 2.616 0.034
2001/6/29 16:00 109 1.899 16.59 38.18 385.5 0.17 2001/7/3 21:00 194.4 2.147 7.618 60.95 2.38 0.032
2001/6/29 17:00 231.2 1.719 16.82 37.48 162.4 0.11 2001/7/3 22:00 262.8 2.98 6.499 63.64 3.532 0.027
2001/6/29 18:00 174.9 1.442 16.34 40.19 65.17 0.073 2001/7/3 23:00 223.3 2.08 7.999 58.38 1.42 0.026
2001/6/29 19:00 148.8 2.513 13.04 48.24 -2.56 0.046 2001/7/3 24:00:00 275.9 2.021 9.169 52.89 -0.13 0.024
2001/6/29 20:00 100.7 3.539 10.04 56.07 -0.01 0.043 2001/7/4 1:00 175.3 1.81 7.861 60.94 2.555 0.024
2001/6/29 21:00 263.7 1.805 8.832 57.26 0.02 0.037 2001/7/4 2:00 265.3 2.893 6.348 67.42 5.542 0.024
2001/6/29 22:00 300.4 2.625 6.537 67.22 3.817 0.034 2001/7/4 3:00 242.7 2.538 6.378 68.15 6.026 0.022
2001/6/29 23:00 271.9 3.58 7.088 63.11 2.612 0.032 2001/7/4 4:00 284.6 2.76 7.638 66.55 5.025 0.022
2001/6/29 24:00:00 283.7 3.366 8.122 56.2 0 0.027 2001/7/4 5:00 278.9 2.821 11.68 44.23 -2.38 0.022
2001/6/30 1:00 275.6 3.586 8.015 52.18 -1.36 0.025 2001/7/4 6:00 262.2 3.419 5.242 75.03 9.452 0.022
2001/6/30 2:00 282.6 3.207 7.558 50.64 -1.81 0.024 2001/7/4 7:00 137.7 1.092 5.631 74.38 10.81 0.022
2001/6/30 3:00 238.8 0.929 4.176 59.02 0.171 0.023 2001/7/4 8:00 100.4 2.301 5.251 71.08 9.448 0.021
2001/6/30 4:00 304 3.205 4.69 55.58 0 0.022 2001/7/4 9:00 81.16 2.905 4.973 72.1 10.71 0.022
2001/6/30 5:00 294.2 3.117 5.601 52.43 -1.17 0.022 2001/7/4 10:00 86.96 2.199 4.382 64.7 25.87 0.032
2001/6/30 6:00 287.1 3.103 5.404 51.62 -1.25 0.02 2001/7/4 11:00 264.8 1.899 4.73 62.15 63.01 0.055
2001/6/30 7:00 280.2 3.372 5.268 51.64 -1.41 0.02 2001/7/4 12:00 88.63 2.041 5.444 57.04 131.7 0.093
2001/6/30 8:00 274.5 3.69 5.143 51.08 -1.38 0.02 2001/7/4 13:00 92.4 2.664 6.083 54.12 190.3 0.124
2001/6/30 9:00 273.5 3.814 5.541 48.6 19.21 0.025 2001/7/4 14:00 75.64 3.801 6.295 51.46 384.7 0.198
2001/6/30 10:00 282 2.261 5.966 55.55 99.89 0.064 2001/7/4 15:00 76.17 3.533 7.237 48.86 433.9 0.201
2001/6/30 11:00 294.7 2.371 7.459 51.12 129.5 0.087 2001/7/4 16:00 94.5 3.192 6.976 46.73 177.8 0.122
2001/6/30 12:00 254.8 1.473 12.63 39.58 437.8 0.181 2001/7/4 17:00 93.77 3.144 6.586 44.6 62.42 0.063
2001/6/30 13:00 83.89 2.673 12.38 43.92 503.8 0.222 2001/7/4 18:00 76.59 3.062 6.344 46.23 33.99 0.041
2001/6/30 14:00 87.88 3.218 13.47 41.04 454.7 0.216 2001/7/4 19:00 82.48 2.467 5.696 49.89 0.549 0.024
2001/6/30 15:00 91.61 4.44 12.21 46.02 358.2 0.177 2001/7/4 20:00 103.7 1.336 5.327 51.64 -0.02 0.023
2001/6/30 16:00 107.7 2.855 11.25 49.5 127.9 0.109 2001/7/4 21:00 279.8 1.812 3.987 58.02 0.216 0.022
2001/6/30 17:00 201.7 1.952 11.76 47.56 183.6 0.1 2001/7/4 22:00 274.1 1.765 2.8 65.1 4.077 0.021
2001/6/30 18:00 95.08 2.271 11.34 51.54 90.3 0.065 2001/7/4 23:00 279.9 1.748 2.834 66.03 4.382 0.02
2001/6/30 19:00 216.2 1.369 8.975 58.45 0.549 0.035 2001/7/4 24:00:00 298.3 2.046 3.589 63.1 4.712 0.019
2001/6/30 20:00 271.9 3.526 6.716 66.95 4.618 0.033

S5.42
S5-A25 CTM No.23 Concentration Data (Summer)Estación Nº 23 - Centrales Termicas
Febrero de 2001 NOx Partículas en
FECHA suspensión (ppm) (µg/m3)
31-1 0.004 s/m 01-02 0.002 s/m 05-06 0.003 s/m 06-07 0.003 s/m 07-08 0.002 s/m 08-09 0.003 s/m 12-13 0.019 213-14 0.013 214-15 0.013 215-16 0.023 219-20 0.014 20-21 0.014 21-22 0.004 22-23 0.004
promedio 0.009 2.000s/m : nil
S5-A26 CTM No.23 Concentration Data (Winter)Estación Nº 23 - Centrales Termicas
Junio de 2001 NOx SO2
FECHA (ppm) (ppm)
5 0.016 0.0016 0.016 0.0017 0.010 0.018 0.009 0.011
12 0.011 0.01913 0.012 0.01814 0.007 0.00915 0.006 0.00719 0.016 0.00620 0.015 0.00621 0.016 0.00622 0.014 0.006
promedio 0.012 0.009Estación Nº 23 - Centrales Termicas
Julio de 2001 NOx SO2
FECHA (ppm) (ppm)
3 0.008 0.0034 0.008 0.0045 0.031 0.0026 0.028 0.001
17 0.014 0.00218 0.015 0.00219 0.006 0.00220 0.004 0.002
promedio 0.014 0.002

S5.43
S5-A27 San Nicolas Manual Monitoring Data (2001.2)
No 1 No 2 No 3 No 4 No 5 No 6 No 7 No 8
hr SO2 NOx TSP SO2 NOx TSP SO2 NOx TSP SO2 NOx TSP SO2 NOx TSP SO2 NOx TSP SO2 NOx TSP SO2 NOx TSP
12 160 <4 121.7 <4 86.7 <4 11.17 <4 - <4 126.7 <4 150.8 <4 132 -16 79.2 <4 152.5 <4 121.7 <4 81.7 <4 81.7 <4 70 <4 90.8 <4 - -20 48.3 <4 74.2 <4 75 <4 103.3 <4 96.7 <4 262.5 <4 44.2 <4 - -0 - <4 112.5 <4 72.5 <4 59.2 <4 35 <4 28.3 <4 35.8 <4 - -4 - <4 75.8 <4 129.2 <4 132.5 <4 65 <4 40.8 <4 63.3 <4 - -8 ND <4 10.5 <4 26.7 <4 30 <4 21.7 <4 22.5 <4 14.2 <4 - -12 ND <4 79.2 <4 19.2 <4 22.5 <4 45 <4 19.2 <4 30.8 <4 -16 61.7 <4 56 <4 95.8 <4 29.2 <4 51.7 <4 17.5 <4 19.2 <4 - -20 ND 37.8 21.7 <4 30 <4 26 <4 ND <4 15 <4 19.2 <4 - -0 15 <4 ND <4 9.2 <4 ND <4 10.8 <4 ND <4 ND <4 - -4 20.6 <4 ND <4 17.5 6.90 14.2 <4 ND <4 ND <4 9.2 <4 - -8 21.7 <4 ND 7.38 14.2 <4 35 <4 49.2 <4 52.5 13.8 37.5 4.91 - -12 31.7 <4 36.7 <4 37.5 <4 41.7 <4 29.2 <4 17.5 <4 35 <4 - -16 76.7 45.5 25.3 6.89 15 5.40 41.7 <4 81.7 <4 90.3 <4 76.7 <4 89.2 -20 58.3 <4 34.2 <4 73.3 4.00 34.2 8.82 27 <4 42.5 <4 23.3 <4 - -0 - ND 84.2 <4 62.5 <4 112.5 <4 123.3 <4 62.5 <4 91.7 <4 89.2 <44 64 ND 34.2 9.36 45 <4 10.8 <4 24.2 <4 56.7 <4 41.7 <4 4.408 26.7 <4 16.7 <4 36.7 <4 40.8 <4 45 <4 28.3 <4 48.3 <4 47.5 <412 20 4.00 61.7 <4 18.3 <4 52.5 <4 26.7 <4 12.5 <4 25.8 <4 24.2 11.3416 35 <4 18.3 <4 19.2 <4 20 5.90 30 <4 28.3 8.87 - 4.90 49.2 6.3920 ND <4 15 <4 38.3 <4 43.3 <4 40 <4 35 <4 44 <4 - <40 25.8 <4 21.7 <4 70.8 <4 49.2 <4 67.5 9.17 160 7.77 60.8 10.13 - <44 53.3 <4 41.7 <4 37.5 <4 34.2 <4 66.7 6.16 48 11.5 26.7 <4 51.7 <48 43.3 <4 55.8 6.06 45 <4 59.2 4.96 45 <4 33 <4 57.5 7.02 35 6.1712 10.8 <4 46.7 6.67 14.2 6.06 54.2 6.06 49.2 <4 37 <4 19.2 <4 14.2 10.716 39.2 <4 26.7 9.17 31.7 8.17 ND 5.16 17.5 <4 38.3 <4 79.2 5.16 44.2 13.220 24.2 <4 24.2 <4 15.8 <4 69.2 <4 28.2 <4 20.8 <4 26 <4 46.7 <40 - - - - - - - - - - - - - - - -4 - - - - - - - - - - - - - - - -8 29.2 <4 21.7 <4 19.2 <4 - <4 27.5 <4 19.2 <4 14.2 <4 22 <412 32.5 6.37 15.8 8.91 11.7 10.3 35.8 5.66 44.2 <4 16.7 <4 25.8 5.16 53.3 <416 30 4.16 24.2 <4 41.7 5.67 50.8 <4 12.5 <4 47.5 <4 19.2 <4 - ND20 39.2 <4 45 6.87 23.3 4.16 204 <4 1075 <4 25.8 <4 89.2 <4 34.2 <40 35.8 <4 44.2 7.17 42.5 6.87 62.5 <4 20.8 <4 ND 57.5 <4 25 <44 24.2 <4 27.5 6.32 17.5 6.82 15 <4 10 <4 10.8 <4 12.8 <4 - ND8 ND <4 10.8 <4 ND <4 10.8 <4 12.5 <4 ND <4 11.7 <4 - ND12 20.8 <4 10.8 <4 11.7 <4 ND <4 16.7 <4 ND <4 14.2 <4 - ND16 34.2 <4 26.7 <4 32.5 <4 20 <4 30 <4 19.2 <4 17.5 <4 - ND20 13.3 <4 25.8 <4 65 <4 37.5 <4 25.8 <4 ND <4 ND <4 48.3 ND0 9.2 <4 16.7 4.9 ND 4.40 12.5 <4 9.2 <4 34.2 <4 12.5 <4 - ND4 15 <4 75.8 <4 - <4 27.5 4.42 16.7 <4 19.2 <4 30 <4 - <48 35.8 <4 45.8 4.9 20.8 7.33 75.8 4.42 12.5 <4 - <4 19.2 <4 - <4
2/5
2/6
2/7
2/10
63 53
-
106 51
185
60
220
230
84107
149
102
20290 114 119
10618270
-153 122
52
95
102
718254
197
74
165
95117
-
115
199
75
2/12
74 95 105
32 111
139
2/11
2/8
2/9
66 72 58 53 43 48 -
174
93 197 127
132
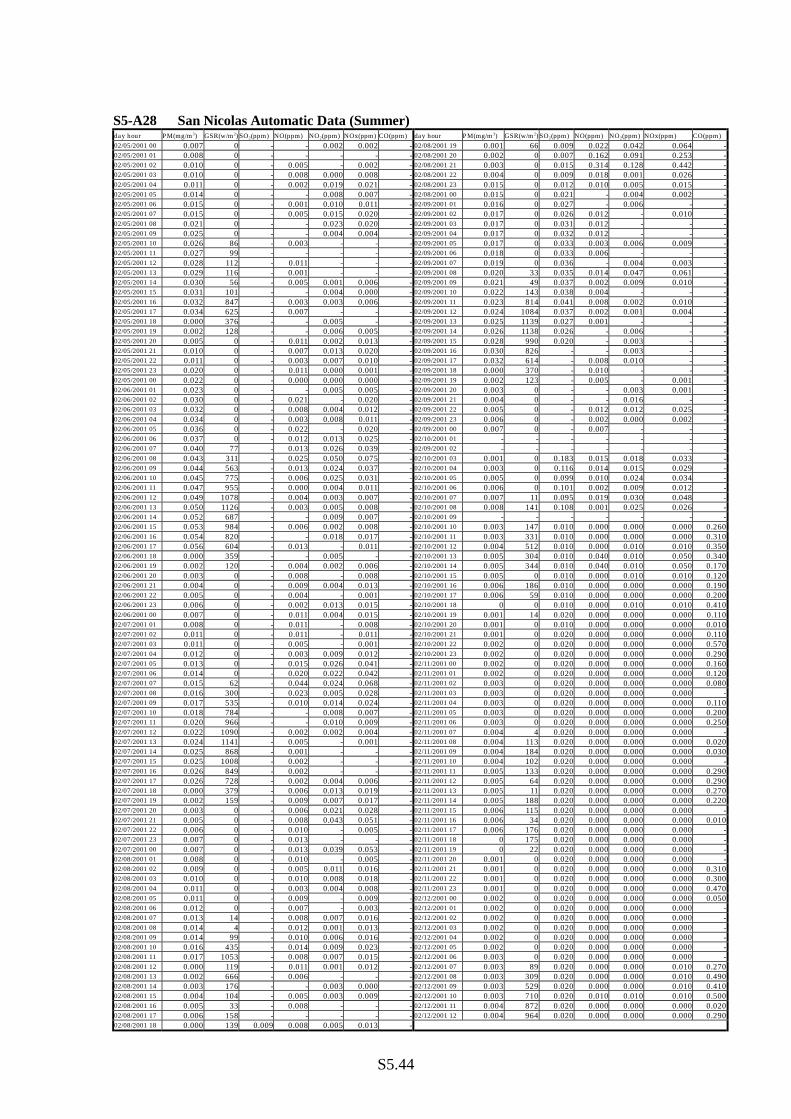
S5.44
S5-A28 San Nicolas Automatic Data (Summer)day hour PM(mg/m3) GSR(w/m2) SO2(ppm) NO(ppm) NO2(ppm) NOx(ppm) CO(ppm) day hour PM(mg/m3) GSR(w/m2) SO2(ppm) NO(ppm) NO2(ppm) NOx(ppm) CO(ppm)02/05/2001 00 0.007 0 - - 0.002 0.002 - 02/08/2001 19 0.001 66 0.009 0.022 0.042 0.064 -02/05/2001 01 0.008 0 - - - - - 02/08/2001 20 0.002 0 0.007 0.162 0.091 0.253 -02/05/2001 02 0.010 0 - 0.005 - 0.002 - 02/08/2001 21 0.003 0 0.015 0.314 0.128 0.442 -02/05/2001 03 0.010 0 - 0.008 0.000 0.008 - 02/08/2001 22 0.004 0 0.009 0.018 0.001 0.026 -02/05/2001 04 0.011 0 - 0.002 0.019 0.021 - 02/08/2001 23 0.015 0 0.012 0.010 0.005 0.015 -02/05/2001 05 0.014 0 - - 0.008 0.007 - 02/08/2001 00 0.015 0 0.021 - 0.004 0.002 -02/05/2001 06 0.015 0 - 0.001 0.010 0.011 - 02/09/2001 01 0.016 0 0.027 - 0.006 - -02/05/2001 07 0.015 0 - 0.005 0.015 0.020 - 02/09/2001 02 0.017 0 0.026 0.012 - 0.010 -02/05/2001 08 0.021 0 - - 0.023 0.020 - 02/09/2001 03 0.017 0 0.031 0.012 - - -02/05/2001 09 0.025 0 - - 0.004 0.004 - 02/09/2001 04 0.017 0 0.032 0.012 - - -02/05/2001 10 0.026 86 - 0.003 - - - 02/09/2001 05 0.017 0 0.033 0.003 0.006 0.009 -02/05/2001 11 0.027 99 - - - - - 02/09/2001 06 0.018 0 0.033 0.006 - - -02/05/2001 12 0.028 112 - 0.011 - - - 02/09/2001 07 0.019 0 0.036 - 0.004 0.003 -02/05/2001 13 0.029 116 - 0.001 - - - 02/09/2001 08 0.020 33 0.035 0.014 0.047 0.061 -02/05/2001 14 0.030 56 - 0.005 0.001 0.006 - 02/09/2001 09 0.021 49 0.037 0.002 0.009 0.010 -02/05/2001 15 0.031 101 - - 0.004 0.000 - 02/09/2001 10 0.022 143 0.038 0.004 - - -02/05/2001 16 0.032 847 - 0.003 0.003 0.006 - 02/09/2001 11 0.023 814 0.041 0.008 0.002 0.010 -02/05/2001 17 0.034 625 - 0.007 - - - 02/09/2001 12 0.024 1084 0.037 0.002 0.001 0.004 -02/05/2001 18 0.000 376 - - 0.005 - - 02/09/2001 13 0.025 1139 0.027 0.001 - - -02/05/2001 19 0.002 128 - - 0.006 0.005 - 02/09/2001 14 0.026 1138 0.026 - 0.006 - -02/05/2001 20 0.005 0 - 0.011 0.002 0.013 - 02/09/2001 15 0.028 990 0.020 - 0.003 - -02/05/2001 21 0.010 0 - 0.007 0.013 0.020 - 02/09/2001 16 0.030 826 - - 0.003 - -02/05/2001 22 0.011 0 - 0.003 0.007 0.010 - 02/09/2001 17 0.032 614 - 0.008 0.010 - -02/05/2001 23 0.020 0 - 0.011 0.000 0.001 - 02/09/2001 18 0.000 370 - 0.010 - - -02/05/2001 00 0.022 0 - 0.000 0.000 0.000 - 02/09/2001 19 0.002 123 - 0.005 - 0.001 -02/06/2001 01 0.023 0 - - 0.005 0.005 - 02/09/2001 20 0.003 0 - - 0.003 0.001 -02/06/2001 02 0.030 0 - 0.021 - 0.020 - 02/09/2001 21 0.004 0 - - 0.016 - -02/06/2001 03 0.032 0 - 0.008 0.004 0.012 - 02/09/2001 22 0.005 0 - 0.012 0.012 0.025 -02/06/2001 04 0.034 0 - 0.003 0.008 0.011 - 02/09/2001 23 0.006 0 - 0.002 0.000 0.002 -02/06/2001 05 0.036 0 - 0.022 - 0.020 - 02/09/2001 00 0.007 0 - 0.007 - - -02/06/2001 06 0.037 0 - 0.012 0.013 0.025 - 02/10/2001 01 - - - - - - -02/06/2001 07 0.040 77 - 0.013 0.026 0.039 - 02/09/2001 02 - - - - - - -02/06/2001 08 0.043 311 - 0.025 0.050 0.075 - 02/10/2001 03 0.001 0 0.183 0.015 0.018 0.033 -02/06/2001 09 0.044 563 - 0.013 0.024 0.037 - 02/10/2001 04 0.003 0 0.116 0.014 0.015 0.029 -02/06/2001 10 0.045 775 - 0.006 0.025 0.031 - 02/10/2001 05 0.005 0 0.099 0.010 0.024 0.034 -02/06/2001 11 0.047 955 - 0.000 0.004 0.011 - 02/10/2001 06 0.006 0 0.101 0.002 0.009 0.012 -02/06/2001 12 0.049 1078 - 0.004 0.003 0.007 - 02/10/2001 07 0.007 11 0.095 0.019 0.030 0.048 -02/06/2001 13 0.050 1126 - 0.003 0.005 0.008 - 02/10/2001 08 0.008 141 0.108 0.001 0.025 0.026 -02/06/2001 14 0.052 687 - - 0.009 0.007 - 02/10/2001 09 - - - - - - -02/06/2001 15 0.053 984 - 0.006 0.002 0.008 - 02/10/2001 10 0.003 147 0.010 0.000 0.000 0.000 0.26002/06/2001 16 0.054 820 - - 0.018 0.017 - 02/10/2001 11 0.003 331 0.010 0.000 0.000 0.000 0.31002/06/2001 17 0.056 604 - 0.013 - 0.011 - 02/10/2001 12 0.004 512 0.010 0.000 0.010 0.010 0.35002/06/2001 18 0.000 359 - - 0.005 - - 02/10/2001 13 0.005 304 0.010 0.040 0.010 0.050 0.34002/06/2001 19 0.002 120 - 0.004 0.002 0.006 - 02/10/2001 14 0.005 344 0.010 0.040 0.010 0.050 0.17002/06/2001 20 0.003 0 - 0.008 - 0.008 - 02/10/2001 15 0.005 0 0.010 0.000 0.010 0.010 0.12002/06/2001 21 0.004 0 - 0.009 0.004 0.013 - 02/10/2001 16 0.006 186 0.010 0.000 0.000 0.000 0.19002/06/2001 22 0.005 0 - 0.004 - 0.001 - 02/10/2001 17 0.006 59 0.010 0.000 0.000 0.000 0.20002/06/2001 23 0.006 0 - 0.002 0.013 0.015 - 02/10/2001 18 0 0 0.010 0.000 0.010 0.010 0.41002/06/2001 00 0.007 0 - 0.011 0.004 0.015 - 02/10/2001 19 0.001 14 0.020 0.000 0.000 0.000 0.11002/07/2001 01 0.008 0 - 0.011 - 0.008 - 02/10/2001 20 0.001 0 0.010 0.000 0.000 0.000 0.01002/07/2001 02 0.011 0 - 0.011 - 0.011 - 02/10/2001 21 0.001 0 0.020 0.000 0.000 0.000 0.11002/07/2001 03 0.011 0 - 0.005 - 0.001 - 02/10/2001 22 0.002 0 0.020 0.000 0.000 0.000 0.57002/07/2001 04 0.012 0 - 0.003 0.009 0.012 - 02/10/2001 23 0.002 0 0.020 0.000 0.000 0.000 0.29002/07/2001 05 0.013 0 - 0.015 0.026 0.041 - 02/11/2001 00 0.002 0 0.020 0.000 0.000 0.000 0.16002/07/2001 06 0.014 0 - 0.020 0.022 0.042 - 02/11/2001 01 0.002 0 0.020 0.000 0.000 0.000 0.12002/07/2001 07 0.015 62 - 0.044 0.024 0.068 - 02/11/2001 02 0.003 0 0.020 0.000 0.000 0.000 0.08002/07/2001 08 0.016 300 - 0.023 0.005 0.028 - 02/11/2001 03 0.003 0 0.020 0.000 0.000 0.000 -02/07/2001 09 0.017 535 - 0.010 0.014 0.024 - 02/11/2001 04 0.003 0 0.020 0.000 0.000 0.000 0.11002/07/2001 10 0.018 784 - - 0.008 0.007 - 02/11/2001 05 0.003 0 0.020 0.000 0.000 0.000 0.20002/07/2001 11 0.020 966 - - 0.010 0.009 - 02/11/2001 06 0.003 0 0.020 0.000 0.000 0.000 0.25002/07/2001 12 0.022 1090 - 0.002 0.002 0.004 - 02/11/2001 07 0.004 4 0.020 0.000 0.000 0.000 -02/07/2001 13 0.024 1141 - 0.005 - 0.001 - 02/11/2001 08 0.004 113 0.020 0.000 0.000 0.000 0.02002/07/2001 14 0.025 868 - 0.001 - - - 02/11/2001 09 0.004 184 0.020 0.000 0.000 0.000 0.03002/07/2001 15 0.025 1008 - 0.002 - - - 02/11/2001 10 0.004 102 0.020 0.000 0.000 0.000 -02/07/2001 16 0.026 849 - 0.002 - - - 02/11/2001 11 0.005 133 0.020 0.000 0.000 0.000 0.29002/07/2001 17 0.026 728 - 0.002 0.004 0.006 - 02/11/2001 12 0.005 64 0.020 0.000 0.000 0.000 0.29002/07/2001 18 0.000 379 - 0.006 0.013 0.019 - 02/11/2001 13 0.005 11 0.020 0.000 0.000 0.000 0.27002/07/2001 19 0.002 159 - 0.009 0.007 0.017 - 02/11/2001 14 0.005 188 0.020 0.000 0.000 0.000 0.22002/07/2001 20 0.003 0 - 0.006 0.021 0.028 - 02/11/2001 15 0.006 115 0.020 0.000 0.000 0.000 -02/07/2001 21 0.005 0 - 0.008 0.043 0.051 - 02/11/2001 16 0.006 34 0.020 0.000 0.000 0.000 0.01002/07/2001 22 0.006 0 - 0.010 - 0.005 - 02/11/2001 17 0.006 176 0.020 0.000 0.000 0.000 -02/07/2001 23 0.007 0 - 0.013 - - - 02/11/2001 18 0 175 0.020 0.000 0.000 0.000 -02/07/2001 00 0.007 0 - 0.013 0.039 0.053 - 02/11/2001 19 0 22 0.020 0.000 0.000 0.000 -02/08/2001 01 0.008 0 - 0.010 - 0.005 - 02/11/2001 20 0.001 0 0.020 0.000 0.000 0.000 -02/08/2001 02 0.009 0 - 0.005 0.011 0.016 - 02/11/2001 21 0.001 0 0.020 0.000 0.000 0.000 0.31002/08/2001 03 0.010 0 - 0.010 0.008 0.018 - 02/11/2001 22 0.001 0 0.020 0.000 0.000 0.000 0.30002/08/2001 04 0.011 0 - 0.003 0.004 0.008 - 02/11/2001 23 0.001 0 0.020 0.000 0.000 0.000 0.47002/08/2001 05 0.011 0 - 0.009 - 0.009 - 02/12/2001 00 0.002 0 0.020 0.000 0.000 0.000 0.05002/08/2001 06 0.012 0 - 0.007 - 0.003 - 02/12/2001 01 0.002 0 0.020 0.000 0.000 0.000 -02/08/2001 07 0.013 14 - 0.008 0.007 0.016 - 02/12/2001 02 0.002 0 0.020 0.000 0.000 0.000 -02/08/2001 08 0.014 4 - 0.012 0.001 0.013 - 02/12/2001 03 0.002 0 0.020 0.000 0.000 0.000 -02/08/2001 09 0.014 99 - 0.010 0.006 0.016 - 02/12/2001 04 0.002 0 0.020 0.000 0.000 0.000 -02/08/2001 10 0.016 435 - 0.014 0.009 0.023 - 02/12/2001 05 0.002 0 0.020 0.000 0.000 0.000 -02/08/2001 11 0.017 1053 - 0.008 0.007 0.015 - 02/12/2001 06 0.003 0 0.020 0.000 0.000 0.000 -02/08/2001 12 0.000 119 - 0.011 0.001 0.012 - 02/12/2001 07 0.003 89 0.020 0.000 0.000 0.010 0.27002/08/2001 13 0.002 666 - 0.006 - - - 02/12/2001 08 0.003 309 0.020 0.000 0.000 0.010 0.49002/08/2001 14 0.003 176 - - 0.003 0.000 - 02/12/2001 09 0.003 529 0.020 0.000 0.000 0.010 0.41002/08/2001 15 0.004 104 - 0.005 0.003 0.009 - 02/12/2001 10 0.003 710 0.020 0.010 0.010 0.010 0.50002/08/2001 16 0.005 33 - 0.008 - - - 02/12/2001 11 0.004 872 0.020 0.000 0.000 0.000 0.02002/08/2001 17 0.006 158 - - - - - 02/12/2001 12 0.004 964 0.020 0.000 0.000 0.000 0.29002/08/2001 18 0.000 139 0.009 0.008 0.005 0.013 -

S5.45
S5-A29 Central Termica San Nicolas Operation Data (Summer)
Producción/Production
CARBON - Turbio/Turbio coal GAS NATURAL/NATURAL GASCARBON - Sudafricano/South African coal
DAILY DAILY DAILY DAILY
Fecha Consumo PCI Consumo PCI Consumo PCI
Date MWh Tn/Tons kcal/kg Tn/Tons kcal/kg m3 kcal/m3
5-Feb-01 4213 75 5623 94 6068 1143127 8400
6-Feb-01 4278 39 5623 531 6068 865096 8400
7-Feb-01 4317 364 5623 56 6068 994659 8400
8-Feb-01 4305 120 5623 180 6068 1078183 8400
9-Feb-01 4306 187 5623 434 6068 846095 8400
10-Feb-01 4282 78 5623 401 6068 938886 8400
11-Feb-01 3989 138 5623 204 6068 952746 8400
12-Feb-01 4006 0 5623 431 6068 865768 8400
S5-A30 Central Termica San Nicolas Emission Data (Summer)
DATETIME SO2_B5 NO_B5 OPAC_B5 O2_B5
2001/2/5 29 76 2 4
2001/1/6 85 153 5 4
2001/2/7 88 74 3 4
2001/2/8 53 87 2 3
2001/2/9 99 129 2 8
2001/2/10 59 119 2 8
2001/2/11 65 109 1 9
2001/2/12 62 183 4 10
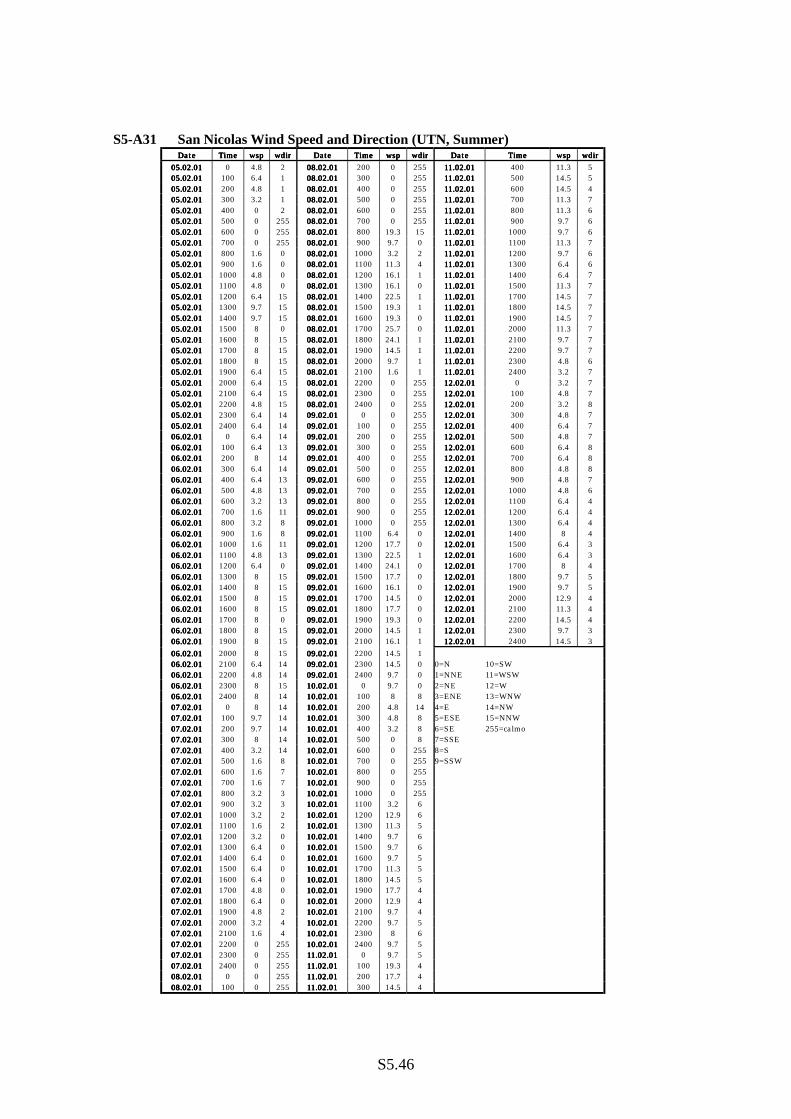
S5.46
S5-A31 San Nicolas Wind Speed and Direction (UTN, Summer)DateDateDateDate TimeTimeTimeTime wspwspwspwsp wdirwdirwdirwdir DateDateDateDate TimeTimeTimeTime wspwspwspwsp wdirwdirwdirwdir DateDateDateDate TimeTimeTimeTime wspwspwspwsp wdirwdirwdirwdir
05.02.0105.02.0105.02.0105.02.01 0 4.8 2 08.02.0108.02.0108.02.0108.02.01 200 0 255 11.02.0111.02.0111.02.0111.02.01 400 11.3 505.02.0105.02.0105.02.0105.02.01 100 6.4 1 08.02.0108.02.0108.02.0108.02.01 300 0 255 11.02.0111.02.0111.02.0111.02.01 500 14.5 505.02.0105.02.0105.02.0105.02.01 200 4.8 1 08.02.0108.02.0108.02.0108.02.01 400 0 255 11.02.0111.02.0111.02.0111.02.01 600 14.5 405.02.0105.02.0105.02.0105.02.01 300 3.2 1 08.02.0108.02.0108.02.0108.02.01 500 0 255 11.02.0111.02.0111.02.0111.02.01 700 11.3 705.02.0105.02.0105.02.0105.02.01 400 0 2 08.02.0108.02.0108.02.0108.02.01 600 0 255 11.02.0111.02.0111.02.0111.02.01 800 11.3 605.02.0105.02.0105.02.0105.02.01 500 0 255 08.02.0108.02.0108.02.0108.02.01 700 0 255 11.02.0111.02.0111.02.0111.02.01 900 9.7 605.02.0105.02.0105.02.0105.02.01 600 0 255 08.02.0108.02.0108.02.0108.02.01 800 19.3 15 11.02.0111.02.0111.02.0111.02.01 1000 9.7 605.02.0105.02.0105.02.0105.02.01 700 0 255 08.02.0108.02.0108.02.0108.02.01 900 9.7 0 11.02.0111.02.0111.02.0111.02.01 1100 11.3 705.02.0105.02.0105.02.0105.02.01 800 1.6 0 08.02.0108.02.0108.02.0108.02.01 1000 3.2 2 11.02.0111.02.0111.02.0111.02.01 1200 9.7 605.02.0105.02.0105.02.0105.02.01 900 1.6 0 08.02.0108.02.0108.02.0108.02.01 1100 11.3 4 11.02.0111.02.0111.02.0111.02.01 1300 6.4 605.02.0105.02.0105.02.0105.02.01 1000 4.8 0 08.02.0108.02.0108.02.0108.02.01 1200 16.1 1 11.02.0111.02.0111.02.0111.02.01 1400 6.4 705.02.0105.02.0105.02.0105.02.01 1100 4.8 0 08.02.0108.02.0108.02.0108.02.01 1300 16.1 0 11.02.0111.02.0111.02.0111.02.01 1500 11.3 705.02.0105.02.0105.02.0105.02.01 1200 6.4 15 08.02.0108.02.0108.02.0108.02.01 1400 22.5 1 11.02.0111.02.0111.02.0111.02.01 1700 14.5 705.02.0105.02.0105.02.0105.02.01 1300 9.7 15 08.02.0108.02.0108.02.0108.02.01 1500 19.3 1 11.02.0111.02.0111.02.0111.02.01 1800 14.5 705.02.0105.02.0105.02.0105.02.01 1400 9.7 15 08.02.0108.02.0108.02.0108.02.01 1600 19.3 0 11.02.0111.02.0111.02.0111.02.01 1900 14.5 705.02.0105.02.0105.02.0105.02.01 1500 8 0 08.02.0108.02.0108.02.0108.02.01 1700 25.7 0 11.02.0111.02.0111.02.0111.02.01 2000 11.3 705.02.0105.02.0105.02.0105.02.01 1600 8 15 08.02.0108.02.0108.02.0108.02.01 1800 24.1 1 11.02.0111.02.0111.02.0111.02.01 2100 9.7 705.02.0105.02.0105.02.0105.02.01 1700 8 15 08.02.0108.02.0108.02.0108.02.01 1900 14.5 1 11.02.0111.02.0111.02.0111.02.01 2200 9.7 705.02.0105.02.0105.02.0105.02.01 1800 8 15 08.02.0108.02.0108.02.0108.02.01 2000 9.7 1 11.02.0111.02.0111.02.0111.02.01 2300 4.8 605.02.0105.02.0105.02.0105.02.01 1900 6.4 15 08.02.0108.02.0108.02.0108.02.01 2100 1.6 1 11.02.0111.02.0111.02.0111.02.01 2400 3.2 705.02.0105.02.0105.02.0105.02.01 2000 6.4 15 08.02.0108.02.0108.02.0108.02.01 2200 0 255 12.02.0112.02.0112.02.0112.02.01 0 3.2 705.02.0105.02.0105.02.0105.02.01 2100 6.4 15 08.02.0108.02.0108.02.0108.02.01 2300 0 255 12.02.0112.02.0112.02.0112.02.01 100 4.8 705.02.0105.02.0105.02.0105.02.01 2200 4.8 15 08.02.0108.02.0108.02.0108.02.01 2400 0 255 12.02.0112.02.0112.02.0112.02.01 200 3.2 805.02.0105.02.0105.02.0105.02.01 2300 6.4 14 09.02.0109.02.0109.02.0109.02.01 0 0 255 12.02.0112.02.0112.02.0112.02.01 300 4.8 705.02.0105.02.0105.02.0105.02.01 2400 6.4 14 09.02.0109.02.0109.02.0109.02.01 100 0 255 12.02.0112.02.0112.02.0112.02.01 400 6.4 706.02.0106.02.0106.02.0106.02.01 0 6.4 14 09.02.0109.02.0109.02.0109.02.01 200 0 255 12.02.0112.02.0112.02.0112.02.01 500 4.8 706.02.0106.02.0106.02.0106.02.01 100 6.4 13 09.02.0109.02.0109.02.0109.02.01 300 0 255 12.02.0112.02.0112.02.0112.02.01 600 6.4 806.02.0106.02.0106.02.0106.02.01 200 8 14 09.02.0109.02.0109.02.0109.02.01 400 0 255 12.02.0112.02.0112.02.0112.02.01 700 6.4 806.02.0106.02.0106.02.0106.02.01 300 6.4 14 09.02.0109.02.0109.02.0109.02.01 500 0 255 12.02.0112.02.0112.02.0112.02.01 800 4.8 806.02.0106.02.0106.02.0106.02.01 400 6.4 13 09.02.0109.02.0109.02.0109.02.01 600 0 255 12.02.0112.02.0112.02.0112.02.01 900 4.8 706.02.0106.02.0106.02.0106.02.01 500 4.8 13 09.02.0109.02.0109.02.0109.02.01 700 0 255 12.02.0112.02.0112.02.0112.02.01 1000 4.8 606.02.0106.02.0106.02.0106.02.01 600 3.2 13 09.02.0109.02.0109.02.0109.02.01 800 0 255 12.02.0112.02.0112.02.0112.02.01 1100 6.4 406.02.0106.02.0106.02.0106.02.01 700 1.6 11 09.02.0109.02.0109.02.0109.02.01 900 0 255 12.02.0112.02.0112.02.0112.02.01 1200 6.4 406.02.0106.02.0106.02.0106.02.01 800 3.2 8 09.02.0109.02.0109.02.0109.02.01 1000 0 255 12.02.0112.02.0112.02.0112.02.01 1300 6.4 406.02.0106.02.0106.02.0106.02.01 900 1.6 8 09.02.0109.02.0109.02.0109.02.01 1100 6.4 0 12.02.0112.02.0112.02.0112.02.01 1400 8 406.02.0106.02.0106.02.0106.02.01 1000 1.6 11 09.02.0109.02.0109.02.0109.02.01 1200 17.7 0 12.02.0112.02.0112.02.0112.02.01 1500 6.4 306.02.0106.02.0106.02.0106.02.01 1100 4.8 13 09.02.0109.02.0109.02.0109.02.01 1300 22.5 1 12.02.0112.02.0112.02.0112.02.01 1600 6.4 306.02.0106.02.0106.02.0106.02.01 1200 6.4 0 09.02.0109.02.0109.02.0109.02.01 1400 24.1 0 12.02.0112.02.0112.02.0112.02.01 1700 8 406.02.0106.02.0106.02.0106.02.01 1300 8 15 09.02.0109.02.0109.02.0109.02.01 1500 17.7 0 12.02.0112.02.0112.02.0112.02.01 1800 9.7 506.02.0106.02.0106.02.0106.02.01 1400 8 15 09.02.0109.02.0109.02.0109.02.01 1600 16.1 0 12.02.0112.02.0112.02.0112.02.01 1900 9.7 506.02.0106.02.0106.02.0106.02.01 1500 8 15 09.02.0109.02.0109.02.0109.02.01 1700 14.5 0 12.02.0112.02.0112.02.0112.02.01 2000 12.9 406.02.0106.02.0106.02.0106.02.01 1600 8 15 09.02.0109.02.0109.02.0109.02.01 1800 17.7 0 12.02.0112.02.0112.02.0112.02.01 2100 11.3 406.02.0106.02.0106.02.0106.02.01 1700 8 0 09.02.0109.02.0109.02.0109.02.01 1900 19.3 0 12.02.0112.02.0112.02.0112.02.01 2200 14.5 406.02.0106.02.0106.02.0106.02.01 1800 8 15 09.02.0109.02.0109.02.0109.02.01 2000 14.5 1 12.02.0112.02.0112.02.0112.02.01 2300 9.7 306.02.0106.02.0106.02.0106.02.01 1900 8 15 09.02.0109.02.0109.02.0109.02.01 2100 16.1 1 12.02.0112.02.0112.02.0112.02.01 2400 14.5 3
06.02.0106.02.0106.02.0106.02.01 2000 8 15 09.02.0109.02.0109.02.0109.02.01 2200 14.5 1
06.02.0106.02.0106.02.0106.02.01 2100 6.4 14 09.02.0109.02.0109.02.0109.02.01 2300 14.5 0 0=N 10=SW
06.02.0106.02.0106.02.0106.02.01 2200 4.8 14 09.02.0109.02.0109.02.0109.02.01 2400 9.7 0 1=NNE 11=WSW
06.02.0106.02.0106.02.0106.02.01 2300 8 15 10.02.0110.02.0110.02.0110.02.01 0 9.7 0 2=NE 12=W
06.02.0106.02.0106.02.0106.02.01 2400 8 14 10.02.0110.02.0110.02.0110.02.01 100 8 8 3=ENE 13=WNW
07.02.0107.02.0107.02.0107.02.01 0 8 14 10.02.0110.02.0110.02.0110.02.01 200 4.8 14 4=E 14=NW
07.02.0107.02.0107.02.0107.02.01 100 9.7 14 10.02.0110.02.0110.02.0110.02.01 300 4.8 8 5=ESE 15=NNW
07.02.0107.02.0107.02.0107.02.01 200 9.7 14 10.02.0110.02.0110.02.0110.02.01 400 3.2 8 6=SE 255=calmo
07.02.0107.02.0107.02.0107.02.01 300 8 14 10.02.0110.02.0110.02.0110.02.01 500 0 8 7=SSE
07.02.0107.02.0107.02.0107.02.01 400 3.2 14 10.02.0110.02.0110.02.0110.02.01 600 0 255 8=S
07.02.0107.02.0107.02.0107.02.01 500 1.6 8 10.02.0110.02.0110.02.0110.02.01 700 0 255 9=SSW
07.02.0107.02.0107.02.0107.02.01 600 1.6 7 10.02.0110.02.0110.02.0110.02.01 800 0 255
07.02.0107.02.0107.02.0107.02.01 700 1.6 7 10.02.0110.02.0110.02.0110.02.01 900 0 255
07.02.0107.02.0107.02.0107.02.01 800 3.2 3 10.02.0110.02.0110.02.0110.02.01 1000 0 255
07.02.0107.02.0107.02.0107.02.01 900 3.2 3 10.02.0110.02.0110.02.0110.02.01 1100 3.2 6
07.02.0107.02.0107.02.0107.02.01 1000 3.2 2 10.02.0110.02.0110.02.0110.02.01 1200 12.9 6
07.02.0107.02.0107.02.0107.02.01 1100 1.6 2 10.02.0110.02.0110.02.0110.02.01 1300 11.3 5
07.02.0107.02.0107.02.0107.02.01 1200 3.2 0 10.02.0110.02.0110.02.0110.02.01 1400 9.7 6
07.02.0107.02.0107.02.0107.02.01 1300 6.4 0 10.02.0110.02.0110.02.0110.02.01 1500 9.7 6
07.02.0107.02.0107.02.0107.02.01 1400 6.4 0 10.02.0110.02.0110.02.0110.02.01 1600 9.7 5
07.02.0107.02.0107.02.0107.02.01 1500 6.4 0 10.02.0110.02.0110.02.0110.02.01 1700 11.3 5
07.02.0107.02.0107.02.0107.02.01 1600 6.4 0 10.02.0110.02.0110.02.0110.02.01 1800 14.5 5
07.02.0107.02.0107.02.0107.02.01 1700 4.8 0 10.02.0110.02.0110.02.0110.02.01 1900 17.7 4
07.02.0107.02.0107.02.0107.02.01 1800 6.4 0 10.02.0110.02.0110.02.0110.02.01 2000 12.9 4
07.02.0107.02.0107.02.0107.02.01 1900 4.8 2 10.02.0110.02.0110.02.0110.02.01 2100 9.7 4
07.02.0107.02.0107.02.0107.02.01 2000 3.2 4 10.02.0110.02.0110.02.0110.02.01 2200 9.7 5
07.02.0107.02.0107.02.0107.02.01 2100 1.6 4 10.02.0110.02.0110.02.0110.02.01 2300 8 6
07.02.0107.02.0107.02.0107.02.01 2200 0 255 10.02.0110.02.0110.02.0110.02.01 2400 9.7 5
07.02.0107.02.0107.02.0107.02.01 2300 0 255 11.02.0111.02.0111.02.0111.02.01 0 9.7 5
07.02.0107.02.0107.02.0107.02.01 2400 0 255 11.02.0111.02.0111.02.0111.02.01 100 19.3 4
08.02.0108.02.0108.02.0108.02.01 0 0 255 11.02.0111.02.0111.02.0111.02.01 200 17.7 4
08.02.0108.02.0108.02.0108.02.01 100 0 255 11.02.0111.02.0111.02.0111.02.01 300 14.5 4

S5.47
S5-A32 San Nicolas Manual Monitoring Data (7,8.2001)
No 1 No 2 No 3 No 4 No 5 No 6 No 7 No 8
hr SO2 NOx TSP SO2 NOx TSP SO2 NOx TSP SO2 NOx TSP SO2 NOx TSP SO2 NOx TSP SO2 NOx TSP SO2 NOx TSP8 57.5 13.7 258.3 18.8 23.3 18.6 65 13.5 36.7 13.9 16.7 13.8 35 14.8 52.5 16.4
12 76.7 10.8 15.8 12.7 33.3 13.7 75.8 11.7 35 10.5 41.7 7.8 25 17.9 12.5 10.916 57.5 11.8 22.5 15.1 40 13.7 84.2 9.7 26.7 8.5 31.7 8.5 20.8 9.4 30 11.220 60 21.9 30 20.1 31.7 25.2 66.7 25.8 15.8 15.6 14.2 20.6 21.7 17.5 32.5 10.20 10.8 8.2 18.3 10.4 10.8 14.8 216.7 17.8 16.7 16.3 10.8 22.9 10.8 15.7 10.8 S/D4 19.2 19.9 11.7 40.7 48.3 34.1 16.7 35.4 10.8 25.2 16.7 30.3 15.8 32.6 10.8 268 66.7 23.4 43.3 26.1 25.8 25 25.8 26 14.2 22.3 16.7 21.9 13.3 27.8 30.8 27.612 13.3 8.1 21.7 10.2 39.2 9.7 43.3 14.3 25.8 6.6 60.8 7.4 55.8 9.3 10.8 6.116 20 7.3 16.7 9.9 10.8 10.2 50.8 11.4 10.8 10.8 10.8 8.8 19.2 15.3 10.8 7.220 43.3 <4 10.8 9.2 10.8 10.1 10.8 10.2 10.8 8.9 11.7 6.6 16.7 9.2 30 S/DAv0 10.8 <4 10.8 8.6 35 5.8 21.7 5.1 15 <4 19.2 9.3 11.7 13.7 23.3 S/D4 10.8 7 10.8 6 16.7 6.20 12.5 7.5 11.7 6.1 11.7 <4 10.8 9.3 76.7 S/D8 10.8 7.8 10.8 8.6 25.8 6.6 10.8 13.1 10.8 6.8 23.3 5.9 12.5 5.9 16.7 S/D12 10.8 6.1 10.8 8.1 48.3 9 10.8 7.8 24.2 7.4 22.5 9.2 11.7 10.2 35.8 S/D16 10.8 6.6 10.8 13.2 34.2 12.40 53.3 14 60.8 7.3 67.5 12.2 72.5 12.1 30.8 S/D20 16.7 10.8 15 19.5 10.8 <4 61.7 12.5 55.8 <4 10.8 12 62.5 22.2 19.2 S/DAv0 19.2 <4 22.5 6.9 11.7 7.8 12.5 8.6 10.8 8.8 11.7 6.5 12.5 13.7 30.8 S/D4 14.2 21.4 16.7 6.9 11.7 20.5 16.7 6.9 32.5 12.3 27.5 11.6 42.5 17.4 19.2 13.108 13.3 10.6 17.5 9 16.7 11.5 13.3 13 10.8 12.7 10.8 9.8 10.8 10.2 12.5 10.912 21.7 <4 27.5 <4 10.8 <4 12.5 <4 11.7 <4 60 5.1 12.5 5.6 58.3 15.316 30 <4 20 7.1 11.7 11 24.2 9.50 10.8 4.4 13.3 5 76.7 7.90 20 <420 20.8 <4 54.2 13 26.7 12 13.3 10.3 17.5 <4 10.8 21.4 15.8 73.7 15.8 4Av0 23.3 87.3 26.7 32.7 20 4.8 45.8 11.5 51.7 13.2 19.2 15.80 40.8 10.1 41.7 S/D4 28.3 20.8 65 <4 14.2 11.8 21.7 10.2 24.2 <4 40.8 10.4 196.7 <4 516.7 6.38 47.5 6.4 81.7 7.1 92.5 14.5 23.3 19.4 58.3 12.4 32.5 14.1 81.7 7 40.8 9.812 50.8 <4 341.7 13 74.2 9.2 25.8 6.7 21.7 6.4 71.7 5.6 40 4.3 95 <416 44.2 14.5 146.7 15.8 113.3 16.5 11.7 <4 15 13 10.8 10 34.2 11.6 40 <420 36.7 8 86.7 29.1 12.5 27.3 37.5 19.7 35.8 9.9 20.8 <4 27.5 9.8 38.3 <4Av0 58.3 <4 35 8.8 12.5 6.1 56.7 <4 13.3 5.5 88.3 6.1 15 6.8 10.8 9.44 51.7 6.3 74.2 <4 16.7 <4 65.8 <4 15.8 <4 175 <4 15 5.8 35 <48 63.3 <4 18.3 4.4 117.5 <4 120.8 <4 14.2 7.4 43.3 7.4 30 7.4 101.7 5.2
12 50 <4 155.8 5.6 39.2 6.8 45 4.5 75 5.3 83.3 4 25.8 <4 123.3 4.916 52.5 <4 31.7 12.4 15.8 11 32.5 5.7 12.5 9.6 10.8 8.3 25.8 13.5 10.8 7.920 28.3 8.6 66.7 18.5 10.8 21.4 65 10.3 14.2 17.8 11.7 10.5 34.2 15.1 10.8 11.2Av0 65.8 12.3 32.5 17.1 10.8 14.5 28.3 16.3 20 12.4 15 13 31.7 16.4 33.3 15.84 133.3 12.4 31.7 16.5 28.3 33.8 34.2 13.9 26.7 14.6 12.5 16.6 34.2 18.6 49.2 37.58 26.7 19.1 96.7 18.3 183.3 18.1 33.3 11.2 13.3 14.8 15.8 14.4 20 16.6 29.2 16
12 63.3 12.8 135 14.3 16.7 17.2 25 9 12.5 9.8 14.2 11.1 20 11.8 55 14.916 233.3 8.1 30.8 15.2 15 14.1 30.8 14.9 30.8 16.5 27.5 9.9 22.5 19.9 37.5 17.120 49.2 <4 50 15.5 15.8 24 191.7 47.1 28.3 20 15 18.9 27.5 18.9 14.2 9.5Av0 62.5 4.4 105 8.1 17.5 5.80 113.3 12.3 10.8 10.7 10.8 9.8 85 9.8 12.5 14.44 91.7 20.6 80.8 22.9 25.8 23.9 75 23.5 25.8 24.6 20.8 24.3 71.7 26.1 33.3 36.28
218 116 181
103
210142116
85 76 174
95 89 18
147
18 124 110 61
81
8/3
36 43 51
8/2
91
39
184 183
-
53 60 3248
150
7/31
8/1
28
7/27
7/28
7/29
7/30
26
80 57 69 65
394942
63 55
190
-
254
85
118
149 75
818999
65
72
35

S5.48
S5-A33 San Nicolas Automatic Data (Winter)
FECHA,HORA SR(W/m2) SO2(PppmNO(ppm) NO2(ppm)NOX(ppm)CO(ppm) FECHA,HORA SR(W/m2) SO2(PppmNO(ppm) NO2(ppm) NOX(ppm)CO(ppm)2001/7/27 17:55 8 0.011 0.019 <0.004 -0.001 0.41 2001/7/31 01:55 0 0.048 0.001 <0.004 0.000 0.142001/7/27 18:55 0 0.034 0.073 <0.004 0.054 0.79 2001/7/31 02:55 0 0.048 0.000 <0.004 0.000 0.322001/7/27 19:55 0 0.030 0.095 <0.004 0.067 1.23 2001/7/31 03:55 0 0.051 0.001 <0.004 0.002 0.012001/7/27 20:55 0 0.032 0.099 <0.004 0.097 2.21 2001/7/31 04:55 0 0.045 0.003 <0.004 0.004 0.182001/7/27 21:55 0 0.032 0.063 <0.004 0.039 2.05 2001/7/31 05:55 0 0.048 0.005 <0.004 0.005 0.132001/7/27 22:55 0 0.034 0.048 <0.004 0.030 1.43 2001/7/31 06:55 0 0.048 0.000 <0.004 0.002 0.022001/7/27 23:55 0 0.037 0.033 <0.004 0.021 0.79 2001/7/31 07:55 18 0.049 0.001 <0.004 0.001 0.042001/7/28 00:55 0 0.038 0.019 <0.004 0.012 0.87 2001/7/31 08:55 94 0.050 0.008 <0.004 0.006 0.482001/7/28 01:55 0 0.039 0.013 <0.004 0.009 0.13 2001/7/31 09:55 287 0.049 0.002 <0.004 0.002 0.012001/7/28 02:55 0 0.042 0.008 <0.004 0.006 0.09 2001/7/31 10:55 365 0.048 0.003 <0.004 0.002 0.062001/7/28 03:55 0 0.043 0.007 <0.004 0.005 0.03 2001/7/31 11:55 408 0.045 0.004 <0.004 0.004 0.212001/7/28 04:55 0 0.045 0.005 <0.004 0.004 0.40 2001/7/31 12:55 493 0.042 0.004 <0.004 0.003 0.572001/7/28 05:55 0 0.050 0.005 <0.004 0.004 0.23 2001/7/31 13:55 458 0.043 0.002 <0.004 0.001 0.222001/7/28 06:55 0 0.052 0.006 <0.004 0.004 0.38 2001/7/31 14:55 365 0.038 0.001 <0.004 0.001 0.592001/7/28 07:55 10 0.053 0.004 <0.004 0.004 0.12 2001/7/31 15:55 255 0.042 0.004 <0.004 0.005 0.322001/7/28 08:55 166 0.056 0.007 <0.004 0.005 0.13 2001/7/31 16:55 120 0.039 0.002 <0.004 0.003 0.392001/7/28 09:55 345 0.055 0.008 <0.004 0.008 0.26 2001/7/31 17:55 7 0.040 0.002 <0.004 0.002 0.252001/7/28 10:55 469 0.057 0.001 <0.004 0.003 0.62 2001/7/31 18:55 0 0.035 0.002 <0.004 0.005 0.522001/7/28 11:55 552 0.055 0.000 <0.004 0.000 0.36 2001/7/31 19:55 0 0.038 0.002 <0.004 0.005 0.292001/7/28 12:55 574 0.055 0.000 <0.004 0.000 0.17 2001/7/31 20:55 0 0.034 0.002 <0.004 0.005 0.492001/7/28 13:55 542 0.057 0.000 <0.004 0.001 0.74 2001/7/31 21:55 0 0.035 0.001 <0.004 0.003 1.192001/7/28 14:55 412 0.053 0.000 <0.004 0.000 0.24 2001/7/31 22:55 0 0.034 0.003 <0.004 0.006 0.842001/7/28 15:55 280 0.056 0.000 <0.004 0.000 0.02 2001/7/31 23:55 0 0.034 0.000 <0.004 0.001 1.112001/7/28 16:55 106 0.057 0.000 <0.004 0.000 0.08 2001/8/1 00:55 0 0.035 0.001 <0.004 0.001 0.612001/7/28 17:55 7 0.055 0.000 <0.004 0.000 0.07 2001/8/1 01:55 0 0.036 0.002 <0.004 0.003 0.802001/7/28 18:55 0 0.055 0.000 <0.004 0.000 0.22 2001/8/1 02:55 0 0.036 0.002 <0.004 0.002 0.462001/7/28 19:55 0 0.057 0.000 <0.004 0.000 0.10 2001/8/1 03:55 0 0.035 0.000 <0.004 0.002 0.222001/7/28 20:55 0 0.057 0.000 <0.004 0.000 0.26 2001/8/1 04:55 0 0.039 0.001 <0.004 0.002 0.322001/7/28 21:55 0 0.061 0.000 <0.004 0.000 0.07 2001/8/1 05:55 0 0.038 0.009 <0.004 0.007 0.612001/7/28 22:55 0 0.063 0.001 <0.004 0.001 0.21 2001/8/1 06:55 0 0.038 0.009 <0.004 0.007 0.462001/7/28 23:55 0 0.061 0.000 <0.004 0.000 0.35 2001/8/1 07:55 14 0.043 0.002 <0.004 0.002 0.762001/7/29 00:55 0 0.063 -0.001 <0.004 0.000 0.11 2001/8/1 08:55 99 0.041 0.002 <0.004 0.002 0.502001/7/29 01:55 0 0.068 0.000 <0.004 0.000 0.13 2001/8/1 09:55 203 0.039 0.002 <0.004 0.001 0.102001/7/29 02:55 0 0.069 0.000 <0.004 0.000 0.11 2001/8/1 10:55 337 0.038 0.002 <0.004 0.001 0.472001/7/29 03:55 0 0.067 0.001 <0.004 0.000 0.25 2001/8/1 11:55 340 0.036 0.002 <0.004 0.001 0.262001/7/29 04:55 0 0.067 0.000 <0.004 0.000 0.38 2001/8/1 12:55 405 0.037 0.001 <0.004 0.001 0.162001/7/29 05:55 0 0.068 0.000 <0.004 -0.001 0.09 2001/8/1 13:55 447 0.035 0.003 <0.004 0.002 0.612001/7/29 06:55 0 0.072 -0.001 <0.004 0.000 0.40 2001/8/1 14:55 361 0.036 0.003 <0.004 0.001 0.282001/7/29 07:55 15 0.073 -0.001 <0.004 -0.001 0.16 2001/8/1 15:55 298 0.031 0.001 <0.004 0.001 0.572001/7/29 08:55 172 0.076 0.000 <0.004 0.000 0.21 2001/8/1 16:55 126 0.031 0.001 <0.004 0.001 0.702001/7/29 09:55 421 0.073 0.000 <0.004 0.000 0.33 2001/8/1 17:55 6 0.028 0.001 <0.004 0.000 0.652001/7/29 10:55 483 0.070 0.000 <0.004 0.000 0.12 2001/8/1 18:55 0 0.029 0.001 <0.004 0.001 0.332001/7/29 11:55 536 0.067 0.001 <0.004 0.000 0.10 2001/8/1 19:55 0 0.025 0.001 <0.004 0.002 0.572001/7/29 12:55 338 0.072 0.000 <0.004 0.000 0.04 2001/8/1 20:55 0 0.025 0.001 <0.004 0.000 0.392001/7/29 13:55 420 0.066 0.000 <0.004 0.000 0.32 2001/8/1 21:55 0 0.027 0.000 <0.004 0.000 0.292001/7/29 14:55 332 0.066 0.000 <0.004 0.000 0.08 2001/8/1 22:55 0 0.028 0.000 <0.004 0.000 0.332001/7/29 15:55 157 0.064 0.000 <0.004 0.000 0.10 2001/8/1 23:55 0 0.026 0.001 <0.004 0.001 0.222001/7/29 16:55 116 0.062 0.001 <0.004 0.000 0.09 2001/8/2 00:55 0 0.026 0.000 <0.004 0.000 0.252001/7/29 17:55 8 0.060 0.000 <0.004 0.000 0.16 2001/8/2 01:55 0 0.028 0.001 <0.004 0.000 0.352001/7/29 18:55 0 0.058 0.000 <0.004 0.000 0.17 2001/8/2 02:55 0 0.027 0.000 <0.004 0.000 0.272001/7/29 19:55 0 0.061 -0.001 <0.004 0.000 0.16 2001/8/2 03:55 0 0.027 0.000 <0.004 0.000 0.162001/7/29 20:55 0 0.061 0.001 <0.004 0.000 0.19 2001/8/2 04:55 0 0.025 0.000 <0.004 0.000 0.232001/7/29 21:55 0 0.061 0.000 <0.004 0.000 0.18 2001/8/2 05:55 0 0.029 0.000 <0.004 -0.001 0.232001/7/29 22:55 0 0.061 -0.001 <0.004 0.000 0.14 2001/8/2 06:55 0 0.030 0.000 <0.004 0.000 0.412001/7/29 23:55 0 0.061 0.000 <0.004 0.000 0.03 2001/8/2 07:55 15 0.027 0.001 <0.004 0.001 0.232001/7/30 00:55 0 0.063 0.000 <0.004 0.000 0.36 2001/8/2 08:55 136 0.028 0.003 <0.004 0.004 0.272001/7/30 01:55 0 0.061 0.000 <0.004 0.000 0.17 2001/8/2 09:55 299 0.030 0.000 <0.004 0.000 0.382001/7/30 02:55 0 0.062 0.000 <0.004 0.000 0.30 2001/8/2 10:55 379 0.028 0.001 <0.004 0.001 0.292001/7/30 03:55 0 0.065 0.001 <0.004 0.000 0.06 2001/8/2 11:55 484 0.025 0.001 <0.004 0.001 0.492001/7/30 04:55 0 0.063 0.000 <0.004 0.000 0.14 2001/8/2 12:55 513 0.024 0.002 <0.004 0.001 0.502001/7/30 05:55 0 0.064 -0.001 <0.004 0.000 0.19 2001/8/2 13:55 483 0.022 0.001 <0.004 0.001 0.402001/7/30 06:55 0 0.062 -0.001 <0.004 -0.001 0.19 2001/8/2 14:55 396 0.019 0.002 <0.004 0.001 0.652001/7/30 07:55 10 0.061 0.000 <0.004 0.000 0.09 2001/8/2 15:55 278 0.018 0.001 <0.004 0.001 0.632001/7/30 08:55 108 0.063 0.000 <0.004 0.000 0.37 2001/8/2 16:55 124 0.018 0.000 <0.004 0.001 0.522001/7/30 09:55 319 0.062 0.000 <0.004 -0.001 0.13 2001/8/2 17:55 6 0.014 0.002 <0.004 0.004 0.332001/7/30 10:55 427 0.065 0.001 <0.004 0.000 0.08 2001/8/2 18:55 0 0.012 0.002 <0.004 0.002 0.492001/7/30 11:55 504 0.060 0.001 <0.004 0.000 0.27 2001/8/2 19:55 0 0.015 0.001 <0.004 0.000 0.472001/7/30 12:55 540 0.058 0.002 <0.004 0.002 0.45 2001/8/2 20:55 0 0.009 0.001 <0.004 0.000 0.322001/7/30 13:55 339 0.057 0.000 <0.004 0.001 0.45 2001/8/2 21:55 0 0.013 0.000 <0.004 0.000 0.192001/7/30 14:55 251 0.050 0.000 <0.004 0.001 0.42 2001/8/2 22:55 0 0.014 0.001 <0.004 0.000 0.392001/7/30 15:55 379 0.051 0.000 <0.004 0.001 0.02 2001/8/2 23:55 0 0.015 0.001 <0.004 0.000 0.252001/7/30 16:55 131 0.050 0.001 <0.004 0.001 0.04 2001/8/3 00:55 0 0.014 0.000 <0.004 0.000 0.092001/7/30 17:55 8 0.051 0.000 <0.004 0.001 0.36 2001/8/3 01:55 0 0.016 0.000 <0.004 0.000 0.36

S5.49
S5-A34 Central Termica San Nicolas Fuel Consumption Data (Winter)No.5 TV, TG1, TG2
Gas M3 CARBON Tn Consumo de gas ciclo combinado
27/7/01 151.475 1722 2001/7/27 0
28/7/01 115.456 1559 2001/7/28 0
29/7/01 16665 1589 2001/7/29 0
30/7/01 47006 1581 2001/7/30 659.42
31/7/01 159965 1660 2001/7/31 670.9
1/8/01 0 0 2001/8/1 1637.896
2/8/01 0 0 2001/8/2 1559.082
3/8/01 0 0 2001/8/3 997
S5-A35 Central Termica San Nicolas Generation Data (Winter)Time SNICM11P SNICM12P SNICM13P SNICM14P SNICM15P TV TG 2 TG1
1 - MWhd 1 - MWhd 1 - MWhd 1 - MWhd 1 - MWhd 1 - kWhd 1 -kWhd 1 - kWhd
2001/7/26 0 0 0 0 4180.08 0 0 3691832
2001/7/27 0 0 0 0 4520.94 0 134915 2911829
2001/7/28 0 0 0 0 4121.28 0 0 0
2001/7/29 0 0 0 0 3764.76 0 0 0
2001/7/30 0 0 0 0 3918.42 823775 0 2178288
2001/7/31 0 0 0 0 3865.14 901022 2241509 0
2001/8/1 0 0 0 0 0 810289 2623919 1526868
2001/8/2 0 0 0 0 0 2619954 5536031 38745
S5-A36 Central Termica San Nicolas Emission Data (Winter)
DATETIME SO2_B5 NO_B5 OPAC_B5 O2_B5 Day NOx ppm O2 %
2001/7/27 309 336.8 10.2 5.5 27/7 TG1 32.7 14.7
TG2 43 16.06
2001/7/28 309.2 337 7.3 6 30/7 TG1 25.6 16.06
2001/7/29 309 336.5 4.9 6.9 TG2 32.7 14.7
2001/7/30 393.3 241.5 3.6 6.5
2001/7/31 438 190 3.3 6.5 31/07 TG2 42.9 15.9
01/08 TG1 33.3 15.6
TG2 41.8 16.5
02/08 TG2 45.2 19.09

S5.50
S5-A37 San Nicolas Meteoriological Data (UTN, Winter)
FechaFechaFechaFecha HoraHoraHoraHoraTemp.Temp.Temp.Temp.
ExteriorExteriorExteriorExteriorVel.Vel.Vel.Vel.
VientoVientoVientoVientoDireccióDireccióDireccióDirecció
nnnnFechaFechaFechaFecha HoraHoraHoraHora
Temp.Temp.Temp.Temp.ExteriorExteriorExteriorExterior
Vel.Vel.Vel.Vel.VientoVientoVientoViento
DirecciónDirecciónDirecciónDirección ReferenciaReferenciaReferenciaReferencia
30.07.01 0 10.4 11.3 1 01.08.01 700 13.3 11.3 5 0 N30.07.01 100 10.3 12.9 1 01.08.01 800 13.1 12.9 5 1 NNE30.07.01 200 10.4 11.3 0 01.08.01 900 13.1 12.9 4 2 NE30.07.01 300 11 12.9 0 01.08.01 1000 14.5 9.7 5 3 ENE30.07.01 400 11.2 9.7 1 01.08.01 1100 16.3 6.4 4 4 E30.07.01 500 11 9.7 2 01.08.01 1200 17.8 6.4 3 5 ESE30.07.01 600 10.8 9.7 2 01.08.01 1300 19.8 9.7 3 6 SE30.07.01 700 10.6 6.4 3 01.08.01 1400 21.9 11.3 3 7 SSE30.07.01 800 10.3 8 3 01.08.01 1500 23.4 12.9 1 8 S30.07.01 900 10.3 8 2 01.08.01 1600 24 14.5 0 9 SSW30.07.01 1000 11.8 8 2 01.08.01 1700 24.4 12.9 0 10 SW30.07.01 1100 14.4 12.9 0 01.08.01 1800 24.7 9.7 1 11 WSW30.07.01 1200 14.8 12.9 0 01.08.01 1900 24.1 9.7 3 12 WSW30.07.01 1300 16.2 14.5 0 01.08.01 2000 22.7 8 3 13 WNW30.07.01 1400 17.2 8 0 01.08.01 2100 21.1 9.7 3 14 NW30.07.01 1500 18.2 11.3 0 01.08.01 2200 20.4 6.4 2 15 NNW30.07.01 1600 19.2 9.7 0 01.08.01 2300 20.1 12.9 030.07.01 1700 20.1 11.3 2 01.08.01 2400 19.9 9.7 130.07.01 1800 19.9 11.3 3 02.08.01 0 19.9 9.7 130.07.01 1900 18.7 6.4 4 02.08.01 100 19.7 8 130.07.01 2000 18.2 9.7 3 02.08.01 200 19.4 4.8 130.07.01 2100 17.3 11.3 3 02.08.01 300 19.1 8 130.07.01 2200 16.5 8 3 02.08.01 400 18.7 6.4 130.07.01 2300 15.8 8 4 02.08.01 500 18.5 8 231.07.01 0 15.4 4.8 1 02.08.01 600 18.2 9.7 231.07.01 100 14.8 1.6 1 02.08.01 700 17.8 6.4 131.07.01 200 14.8 3.2 1 02.08.01 800 17.3 3.2 131.07.01 300 14.6 4.8 4 02.08.01 900 18.3 3.2 031.07.01 400 14.3 4.8 4 02.08.01 1000 21.1 4.8 131.07.01 500 14.2 3.2 5 02.08.01 1100 23.6 4.8 131.07.01 600 13.9 4.8 6 02.08.01 1200 23.3 11.3 031.07.01 700 13.6 4.8 6 02.08.01 1300 24.1 14.5 1531.07.01 800 13.4 8 5 02.08.01 1400 25.4 12.9 1531.07.01 900 13.8 4.8 5 02.08.01 1500 25.8 12.9 1531.07.01 1000 15.2 1.6 4 02.08.01 1600 25.8 12.9 1531.07.01 1100 18.4 1.6 3 02.08.01 1700 26 8 1531.07.01 1200 18.8 1.6 7 02.08.01 1800 25.7 4.8 031.07.01 1300 19.8 4.8 4 02.08.01 1900 25.6 6.4 131.07.01 1400 20.8 6.4 4 02.08.01 2000 23.6 6.4 031.07.01 1500 21.4 6.4 4 02.08.01 2100 22.7 4.8 031.07.01 1600 21.8 6.4 4 02.08.01 2200 22.4 4.8 131.07.01 1700 21.9 8 5 02.08.01 2300 21.7 6.4 131.07.01 1800 21.6 4.8 6 02.08.01 2400 20.9 4.8 231.07.01 1900 20.7 4.8 6 03.08.01 0 20.9 4.8 231.07.01 2000 19.9 4.8 6 03.08.01 100 20.4 6.4 131.07.01 2100 19.1 4.8 6 03.08.01 200 19.9 6.4 131.07.01 2200 18.2 8 6 03.08.01 300 19.7 6.4 231.07.01 2300 17.1 12.9 5 03.08.01 400 19.7 8 201.08.01 0 16.1 11.3 5 03.08.01 500 19.2 9.7 201.08.01 100 15.3 11.3 5 03.08.01 600 19 8 201.08.01 200 14.7 8 5 03.08.01 700 18.7 3.2 201.08.01 300 14.5 4.8 6 03.08.01 800 18.1 1.6 201.08.01 400 13.8 11.3 7 03.08.01 900 18.1 0 25501.08.01 500 13.2 8 6 03.08.01 1000 19.8 0 25501.08.01 600 13 6.4 6 03.08.01 1100 22.1 1.6 0

S5.51
S5-A38 Height of the Thermal Internal Boundary Layer
Height of the thermal internal boundary layer (TIBL) is derived from the heat conservation
equation.
( ) ( ) ( )z
z,xHC1
xxU
tx
P ∂∂
ρ−=
∂θ∂+
∂θ∂
(1)
θ(x) : potential temperature (K)
U : mean wind speed within the TIBL(m/s)
Cp : specific heat (J/kg/K)
ρ : air density (kg/m3)
H(x,z) : heat flux (W/m2/s)
x : distance from the shoreline (m)
z : height from the earth’s surface (m)
θ(x) :potential temperature (K)
It is considered that the thermal internal boundary layer is built up when wind speed is weak and
insolation is strong. The convective mixed layer developed overland keeps on growing and the
air temperature increases continually, until a sea breeze is generated at the shoreline. Once a sea
breeze blows into the shoreline, the growth of the convective mixed layer and the elevation in air
temperature are inhibited by the cold sea breeze. Therefore it can be assumed that ∂θ/∂t=0,
and the following equation (2) is derived from the equation (1).
( ) ( )z
z,xHC1
xxU
P ∂∂
ρ−=
∂θ∂
(2)
The vertical profile of the heat flux H(x,z) on the shoreline is given by the following formula,
according to the empirical result of airplane observation.
( ) ( ) ( )( )xh/z1xHz,xH t0 −= (3)
H0(x) :heat flux at the earth’s surface(W/m2/s)
ht(x) :height of thermal internal boundary layer(m)

S5.52
The heat conservation equation (2) in the steady state is integrated over height z, using equation
(3). The boundary condition at the height =z gives H=H0 and at the height = ht gives H=0.
( )t
0
P UhH
C1
xx
ρ=
∂θ∂
(4)
The profile of potential temperature in respect to the height in upper stable layer is given by the
following equation (5).
( ) γ=∂θ∂
thx
(5)
where γ is the temperature lapse rate in the upper stable layer. Based on the observation, the
overland heat flux H0(x) is a constant value.
UxH
C1)x(h 0
Pt γρ
= (6)
It is proved that the height of the thermal internal boundary layer is proportional to the square root
of the distance from the shoreline.

S5.53
S5-A39 Hourly Mean and Standard Deviations of Mixing Layer Height, and Frequency of
Occurrence of Daytime Atmospheric Stability Classes
Figure 1 Hourly Mean and Standard Deviations of Mixing Layer Height
Figure 2 Frequency of Occurrence of Daytime Atmospheric Stability Classes
(x-axis indicates Turner’s stability class)

S5.54
S5-A40 Variation of NOx, TSP and SO2 with Wind Speed or Wind Direction in Buenos Aires,
San Nicolas, and Lujan de Cuyo
0
10
20
30
40
50
60
0 2 4 6 8 10 12 14
puerto Met WS vs NOx
123456789
NOx(ug/m3)
WS(m/s)
0.02
0.01
0
0.03(ppm)
Figure 1 Variation of NOx Concentration with Wind Speed in Buenos Aires (Summer)
0
10
20
30
40
50
60puerto Met WD vs NOx
123456789
NOx(ug/m3)
WD
N NE E ES S SW W NW NNW
0.02
0.01
0
0.03(ppm)
Figure 2 Variation of NOx Concentration with Wind Direction in Buenos Aires (Summer)
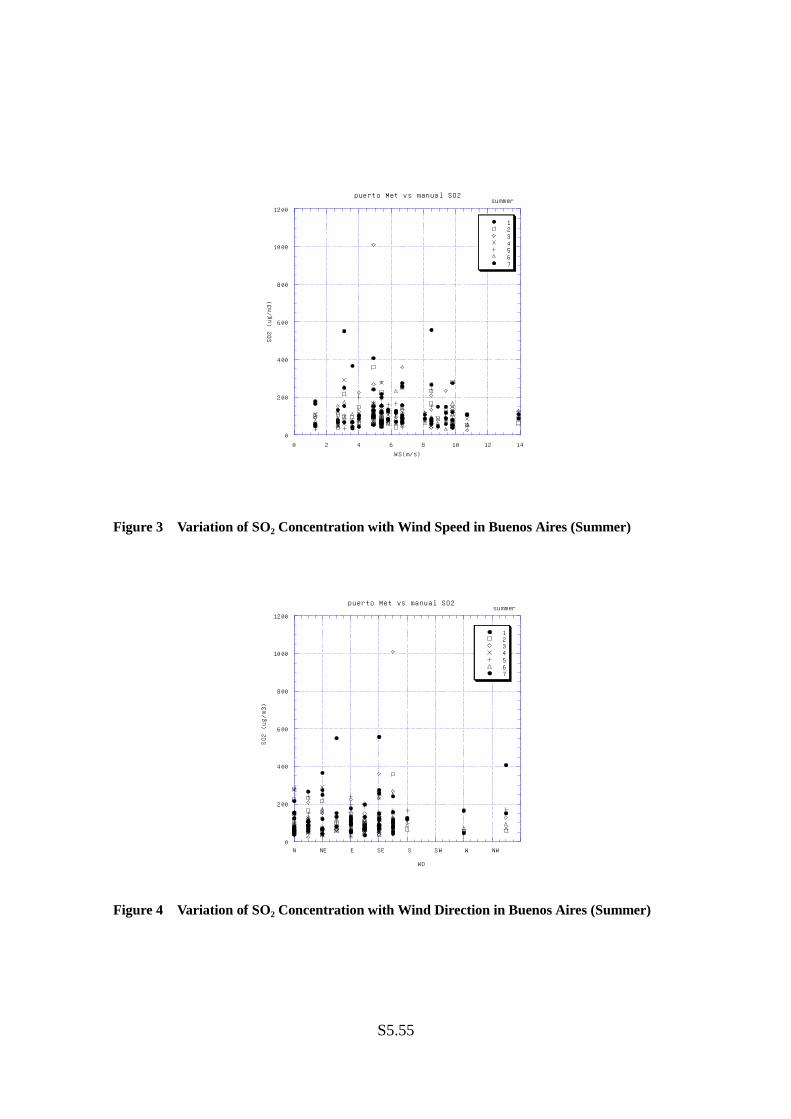
S5.55
0
200
400
600
800
1000
1200
0 2 4 6 8 10 12 14
puerto Met vs manual SO2
1234567
SO2 (ug/m3)
W S(m/s)
summer
Figure 3 Variation of SO2 Concentration with Wind Speed in Buenos Aires (Summer)
0
200
400
600
800
1000
1200
puerto Met vs manual SO2
1234567
SO2 (ug/m3)
WD
N NE E SE S SW W NW
summer
Figure 4 Variation of SO2 Concentration with Wind Direction in Buenos Aires (Summer)

S5.56
0
10
20
30
40
50
0 1 2 3 4 5 6
SN ws vs NOx
123456789
NOx(ug/m3)
WS(m/s)
0.025(ppm)
0.02
0.015
0.01
0.005
0
Figure 5 Variation of NOx Concentration with Wind Speed in San Nicolas (Summer)
0
10
20
30
40
50SN wd vs NOx
123456789
NOx(ug/m3)
W D
N NE E SE S SW W NW NNW
0.025(ppm)
0.02
0.015
0.01
0.005
0
Figure 6 Variation of NOx Concentration with Wind Direction in San Nicolas (Summer)
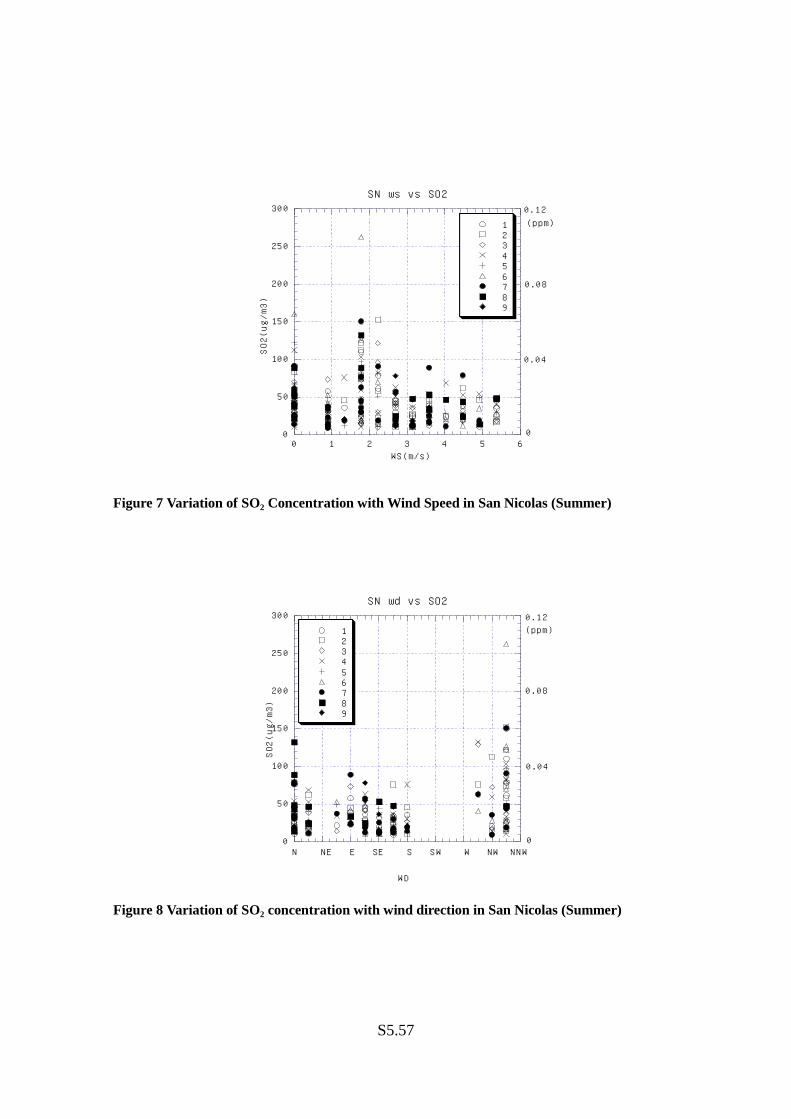
S5.57
0
50
100
150
200
250
300
0 1 2 3 4 5 6
SN ws vs SO2
123456789
SO2(ug/m3)
WS(m/s)
0.04
0
0.08
0.12(ppm)
Figure 7 Variation of SO2 Concentration with Wind Speed in San Nicolas (Summer)
0
50
100
150
200
250
300SN wd vs SO2
123456789
SO2(ug/m3)
W D
N NE E SE S SW W NW NNW
0.12(ppm)
0.04
0.08
0
Figure 8 Variation of SO2 concentration with wind direction in San Nicolas (Summer)

S5.58
0
5
10
15
20
25
30
35
40
0 1 2 3 4 5 6
LdC ws vs NOx
123456789
NOx(ug/m3)
WS(m/s)
0.02(ppm)
0.01
0
Figure 9 Variation of NOx Concentration with Wind Speed in Lujan de Cuyo (Summer)
0
5
10
15
20
25
30
35
40LdC wd vs NOx
123456789
NOx(ug/m3)
N NE E ES S SW W NW
0.02(ppm)
0.01
0
Figure 10 Variation of NOx Concentration with Wind Direction in Lujan de Cuyo (Summer)

S5.59
0
100
200
300
400
500
1 2 3 4 5 6 7
LdC ws vs SO2
123456789
SO2(ug/m3)
WS(m/s)
0.192
0.154
0.115
0.077
0.039
0
(ppm)
Figure 11 Variation of SOx Concentration with Wind Speed in Lujan de Cuyo (Summer)
0
100
200
300
400
500LdC wd vs SO2
123456789
SO2(ug/m3)
W D
0.192
0.154
0.115
0.077
0.039
0
(ppm)
N NE E SE S SW W NW NNW
Figure 12 Variation of SOx Concentration with Wind Direction in Lujan de Cuyo (Summer)

S5.60
0
50
100
150
200
250
0 2 4 6 8 10
BA manual NOx winter
1235678910
NOx (ug/m3)
ws(m/s)
Figure 13 Variation of NOx Concentration with Wind Speed in Buenos Aires (Winter)
0
50
100
150
200
250
BA manual NOx winter
1235678910
NOx (ug/m3)
N NE E SE S SW W NW
Figure 14 Variation of NOx Concentration with Wind Direction in Buenos Aires (Winter)
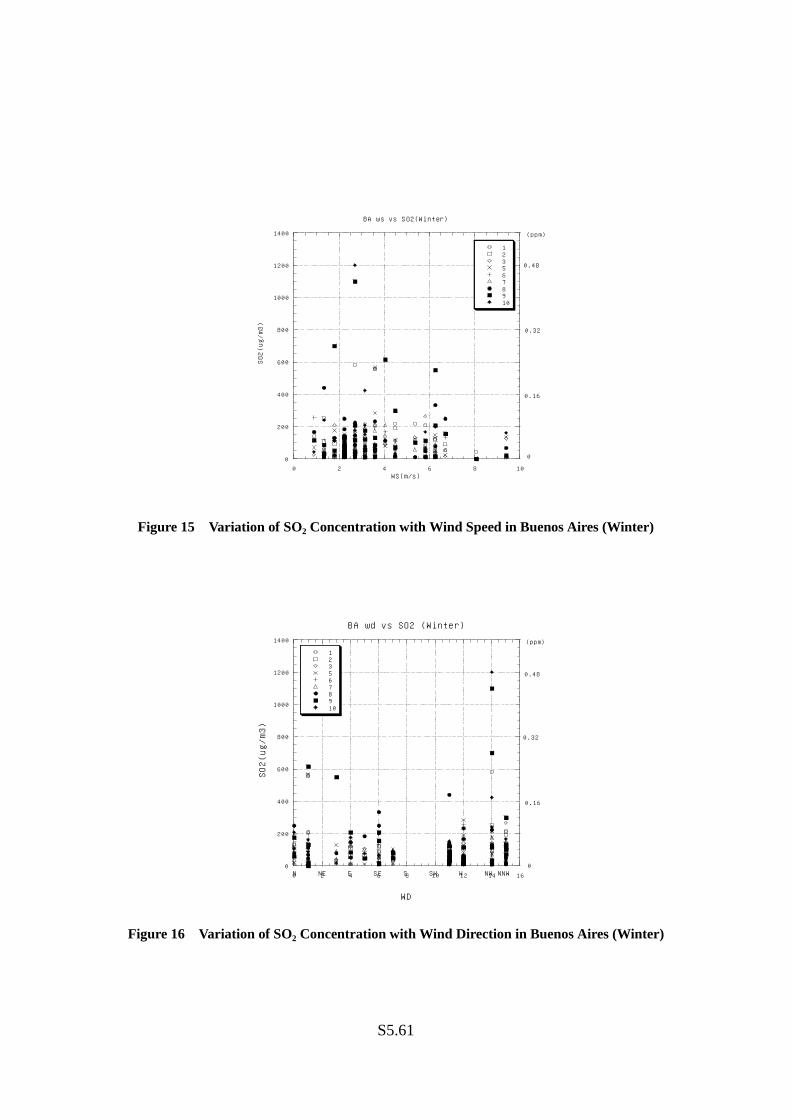
S5.61
0
200
400
600
800
1000
1200
1400
0 2 4 6 8 10
BA ws vs SO2(Winter)
1235678910
SO2(ug/m3)
WS(m/s)
0
0.16
0.32
0.48
(ppm)
Figure 15 Variation of SO2 Concentration with Wind Speed in Buenos Aires (Winter)
0
200
400
600
800
1000
1200
1400
BA wd vs SO2 (Winter)
1235678910
0 2 4 6 8 10 12 14 16
SO2(ug/m3)
WD
N NE E SE S SW W NW NNW0
0.16
0.32
0.48
(ppm)
Figure 16 Variation of SO2 Concentration with Wind Direction in Buenos Aires (Winter)

S5.62
0
20
40
60
80
100
0 1 2 3 4 5
San Nicolas manual NOx winter
123456789
NOx (ug/m3)
w s(m/s)
Figure 17 Variation of NOx Concentration with Wind Speed in San Nicolas (Winter)
0
20
40
60
80
100
San Nicolas manual NOx winter
123456789
NOx (ug/m3)
wd
N NE E SE S SW W NW
Figure 18 Variation of NOx Concentration with Wind Direction in San Nicolas (Winter)
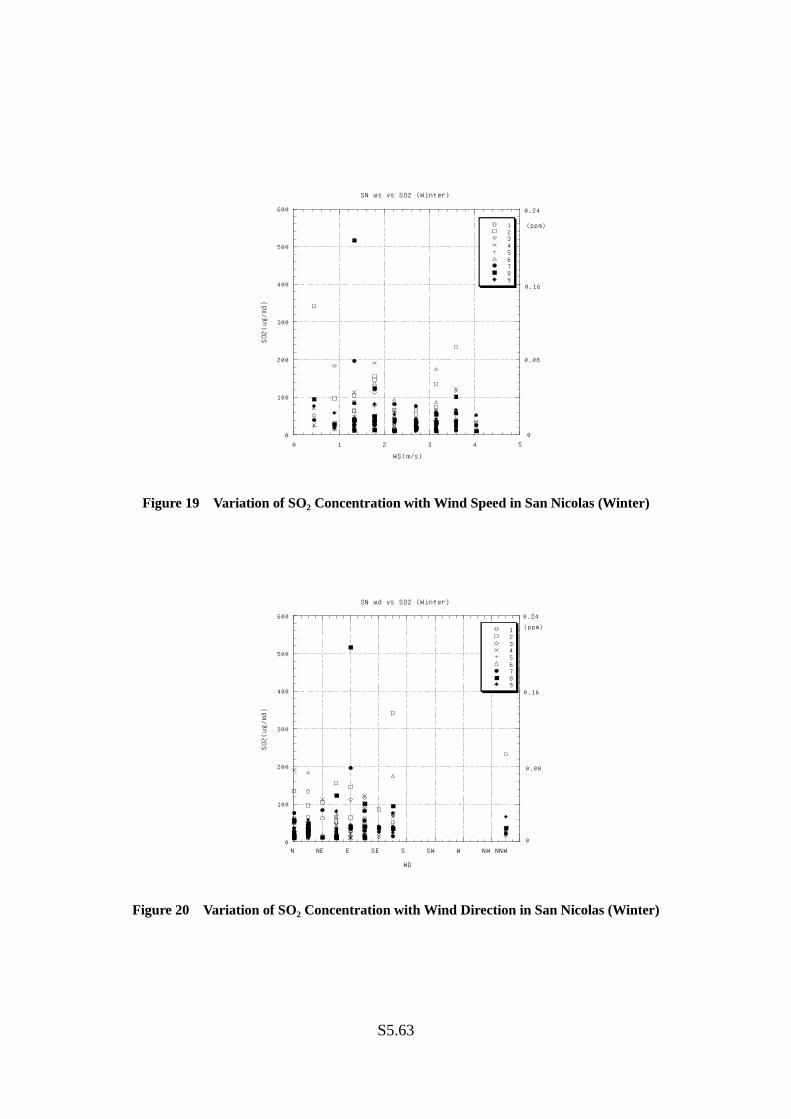
S5.63
0
100
200
300
400
500
600
0 1 2 3 4 5
SN ws vs SO2 (Winter)
123456789
SO2(ug/m3)
WS(m/s)
0
0.08
0.16
0.24
(ppm)
Figure 19 Variation of SO2 Concentration with Wind Speed in San Nicolas (Winter)
0
100
200
300
400
500
600
SN wd vs SO2 (Winter)
123456789
SO2(ug/m3)
WD
N NE E SE S SW W NW NNW0
0.08
0.16
0.24
(ppm)
Figure 20 Variation of SO2 Concentration with Wind Direction in San Nicolas (Winter)

S5.64
0
10
20
30
40
50
60
70
80
0 1 2 3 4 5
LdC manual NOx winter
123456789
NOx (ug/m3)
ws (m/s)
Figure 21 Variation of NOx Concentration with Wind Speed in Lujan de Cuyo (Winter)
0
10
20
30
40
50
60
70
80
LdC manual NOx winter
123456789
NOx (ug/m3)
WD
N NE E SE S SW W NW
Figure 22 Variation of NOx Concentration with Wind Direction in Lujan de Cuyo (Winter)

S5.65
0
100
200
300
400
500
600
700
800
0 1 2 3 4 5
LdC ws vs SO2 (Winter)
123456789
SO2(ug/m3)
WS (m/s)
0
0.08
0.16
0.24
0.32(ppm)
Figure 23 Variation of SO2 Concentration with Wind Speed in Lujan de Cuyo (Winter)
0
100
200
300
400
500
600
700
800
LdC wd vs SO2 (Winter)
123456789
SO2(ug/m3)
WD
0
0.08
0.16
0.24
0.32(ppm)
N NE E SE S SW W NW NNW
Figure 24 Variation of SO2 Concentration with Wind Direction in Lujan de Cuyo (Winter)

S5.66
S5-A41 Review of Air Quality of Buenos Aires, San Nicolas and Mendoza
In this section, the air quality of Buenos Aires, San Nicolas and Mendoza Cities is reviewed based
on the information obtained during the Field Works.
1. Buenos Aires Area
In the World Bank project “the Air Quality Situation in the Gran Buenos Aires area” (#98),
the passive tube monitoring of NO2 and SO2 was performed to measure the concentration in
May to July, 1997. The exposure time was one month. The 20 sites of the City of Buenos
Aires and the 25 extra urban sites in the province of Buenos Aires were selected for
sampling sites. The monthly average of NO2 concentration was once high, up to 0.06ppm,
in the central and southern parts of the City, which went beyond the environmental standard
value of the city (0.05ppm,1day). The highest monthly average of SO2 concentration was
0.012ppm in the Pompeya area, which was below the national environmental standard value
(0.03ppm). Accordingly, it is considered that it would not be a matter to pose health
problems. The result of passive tube monitoring indicates that the local point sources on
rivers, such as power plants and dockyards, do not contribute high concentrations of
pollutants around the area.
The concentration of TSP and PM10 in the Buenos Aires metropolitan area was also
measured in June to August 1997, using low volume air sampler, as part of the same project
of the World Bank. The monthly average concentration of TSP was 0.12 mg/m3 at Isla
Maciel and 0.11 mg/m3 at Moron, which were slightly below 0.15 mg/m3 (1day), the
environmental standard of the city. The monthly average concentrations of PM10 were 0.06
mg/m3 at Isla Maciel and 0.053 mg/m3 at Liniers.
On the other hand, JICA implemented daily measurement of the air quality in July 1993
(#161). According to the results, NO2 concentration was in the range of 0.004~0.007ppm,
which was below the environmental standard of the city (0.05ppm,1day). The SO2
concentration was 0.001~0.005ppm, which was also below the standard of the city of 0.19
ppm (20min). The TSP concentration was 0.01~0.09 mg/m3, which was below the
provincial environmental standard of 0.15 mg/m3 (1day).
2. San Nicolas Area
In November 1994, the CNEA carried out a concentration measurement of TSP and PM10
(#104). The monthly averages of TSP concentration at Prefectura Naval and Residencia
Scaglia were 0.135 mg/m3 and 0.064 mg/m3 respectively, which were both below the
provincial standard 0.15 mg/m3. The monthly averages of PM10 concentration at Barrio

S5.67
Guemes and Escuela Industrial were 0.144 mg/m3 and 0.048 mg/m3 respectively, which were
also below the provincial standard 0.15 mg/m3 (1day).
The CNEA also implemented the chemical analysis of samples and examined the sources by
the Chemical Mass Balance method (#98). As a result, it was found that the sources of
pollutants were mainly unpaved road, chemical plants and iron works, and the effect of the
power plant was slight. However, in the respect that the wind direction adopted for the
analysis was obtained at the Airport site at a distance of 70 km from this city, the results on
week wind conditions should not be absolutely interpreted as they were.
According to the daily mean measurement of the air quality implemented by JICA in July
1993(#161), the SO2 concentration was ND~0.001ppm, which was below the provincial
standard 0.14ppm (1day).
3. Lujan de Cuyo Area
The Dirección de Saneamiento y Control Ambiental del Ministerio de Medio Ambiente,
Urbanismo y Vivienda implemented an air quality measurement. According to the results,
at Lavalley and San Juan in the urban area of Mendoza City, the daily mean concentration of
NO2, TSP, and SO2 were respectively 0.01ppm, 0.018 mg/m3, and under the detection limit.
At Colegio don Bosco, also in the same urban area, the daily mean concentration of NO2 ,
TSP and SO2 were respectively 0.035ppm, 0.018 mg/m3, and under the detection limit.
According to the daily mean measurement of air quality implemented by JICA in August
1993 (#161), NO2 concentration was 0.0003~0.002ppm, which was below the provincial
standard 0.1ppm (1day), while the SO2 concentration was 0.0001~0.002ppm, which was
also below the provincial standard of 1.0 ppm (1hr). The TSP concentration was 0.03~0.25
mg/m3, which exceeded the provincial standard 0.2 mg/m3 (1day).

S5.68
S5-A42 Averaging Time Analyses Mathematical Model
Data have been analyzed and plotted by computer as a function of averaging time and frequency for
each year, and up to a 7-year period, for concentration of nitric oxide, nitrogen dioxide, sulfur
dioxide, carbon monoxide, hydrocarbons, in downtown Chicago, Cincinnati, Denver, Los Angeles,
Philadelphia, St. Louis, San Francisco, and Washington. Analysis of these plots has resulted in a
general mathematical model with the following characteristics (Larsen,1969).
(Reference)
Larsen, R.I. :A New Mathematical Model of Air Pollutant Concentration, Averaging Time, and Frequency. J. Air Poll.
Contr. Assoc. 19,24-30,1969.
Concentrations are lognormally distributed for all averaging times (Figure.1).
The median concentration is proportional to averaging time raised to an exponent ( and thus
plots as a straight line on logarithmic paper ).
The arithmetic mean concentration is the same for all averaging times.
For the longest averaging time calculated ( usually 1 year ), the arithmetic mean, geometric
mean, maximum concentration, and minimum concentration are all equal.
Maximum concentration is approximately inversely proportional to averaging time raised to an
exponent for averaging times of less than 1 month.
The following equations can be used to analyze data collected for one averaging time.
nc
m ∑= (1)
where m = the arithmetic mean,
c = the concentrations,
n = the number of concentrations measured.
( ) 5.02
nmc
S
−= ∑
(2)
where S = the standard deviation (RMS).
= ∑
ncln
expmg (3)

S5.69
where mg = the geometric mean.
( ) 5.0
gg n
mlnclnexpS
−= ∑
(4)
where Sg = the standard geometric deviation.
( )
−
=ih
ihg zz
cclnexpS (5)
where z = number of deviation a point is located away from the median.
h = one given concentration point,
i = a second given concentration point at the same averaging time as h,
−−=
5.02
g mcln2zzexpS (6)
zg
gScm = (7)
zggSmc = (8)
The following equations can be used to calculate values for one averaging time from values that are
available for another averaging time.
5.0Vgagb SS = (9)
( ) ( )( )
−−−±=
v1cclnv12wwexpS
5.0ba
2
ga (10)
( )( )atotal
btotal
ttlnttlnv = (11)
5.0ba vzzw −= (12)

S5.70
vga
gb mm
mm
= (13)
( )[ ]ga2
gagb Slnv15.0expmm −= (14)
Where a = one averaging time,
b = a second averaging time,
t = averaging time,
ttotal = total averaging time, usually 1 year (8760 hr),
z = number of deviation a point is located away from the median.
According to Larsen model (1969), daily and hourly concentration was estimated using monthly
concentration in Buenos Aires (Table 1) and Mendoza (Table 2 and 3).
Relationship between environmental standard and its to averaging time was shown in Figures 2
for NOx, Figure 3 for TSP and Figure 4 for SO2. According to the Larsen model, the maximum or
median air quality concentrations are approximately inversely proportional to averaging time raised
to an exponent for averaging times. We could estimate arbitrarily environmental concentration from
the relation based on the Larsen model.

S5.71
0.001
0.01
0.1
1
0.01 0.1 1 10 100 1000 104
SO2 concentration (ppm)
Averaging Time (hour)
Sulfur DioxideWashington D.C. 1961/12/1 - 1968/12/1
50%
60%
24hr
80%
1%
0.1%
0.01%
0.001%
30%
20%
10%
40%
1hr1month
1year
Figure 1 SO2 Concentration with Various Averaging Time

S5.72
Table 1 Estimation of Daily and Hourly Concentration of NOx in Buenos Aires (1998) using
Monthly Concentration Values
Estacion:Av. Las Herasy y O. De OcampoEstacion:Av. Las Herasy y O. De OcampoEstacion:Av. Las Herasy y O. De OcampoEstacion:Av. Las Herasy y O. De OcampoHr Day Mon Yr
NOx Mg 178 198 187 201(ug/m3) Sg 1.63 1.18 1.29 -
mg+Sg 290 234 241 -Cmax 1142 323 293 201Cmax/Cmaxhr - 0.28 0.26 0.18
Hr Day Mon YrNOx mg 0.089 0.099 0.094 0.101(ppm) Sg 1.63 1.18 1.29 -
mg+Sg 0.145 0.117 0.121 -Cmax 0.571 0.162 0.147 0.101Cmax/Cmaxhr - 0.283 0.257 0.176
Air Quality Standards in the City of Buenos AiresAir Quality Standards in the City of Buenos AiresAir Quality Standards in the City of Buenos AiresAir Quality Standards in the City of Buenos AiresPollutant ug/m3 ppm Time
NO2 100 0.053 1hr
Air Quality Standards in ArgentinaAir Quality Standards in ArgentinaAir Quality Standards in ArgentinaAir Quality Standards in Argentina(ppm)
Pollutant Normal Alert Alarm TimeNOx 0.45 0.6 1.2 1hrNOx 0.15 0.3 0.4 24hr
Mg : Geometric mean
Sg : Geometric standard deviationCmax : Maximum concentration
Cmaxhr : Maximum ratio of hourly concentration

S5.73
Table 2 Estimation of Daily and Hourly Concentration of NOx in Mendoza using Monthly
Concentration Values
(concentration unit: ppm)
NO. Item Hourly Daily Monthly YearlyNO.9 Mg 0.014 0.018 0.019 0.019
Sg 2.19 1.51 1.31 -mg+Sg 0.031 0.027 0.025 -Cmax 0.108 0.061 0.035 0.019Cmax/Cmaxhr - 0.56 0.32 0.18
NO.20 Mg 0.022 0.023 0.026 0.028Sg 2.04 1.85 1.49 -mg+Sg 0.045 0.043 0.039 -Cmax 0.148 0.142 0.048 0.028Cmax/Cmaxhr - 0.96 0.32 0.19
NO.21 Mg 0.010 0.012 0.013 0.014Sg 2.11 1.7 1.41 -mg+Sg 0.021 0.020 0.018 -Cmax 0.074 0.056 0.024 0.014Cmax/Cmaxhr - 0.76 0.32 0.19
NO.22 Mg 0.029 0.030 0.032 0.034Sg 1.75 1.56 1.33 -mg+Sg 0.051 0.047 0.043 -Cmax 0.161 0.111 0.052 0.034Cmax/Cmaxhr - 0.69 0.32 0.21
NO.23 Mg 0.009 0.010 0.010 0.010Sg 1.49 1.34 1.21 -mg+Sg 0.013 0.013 0.012 -Cmax 0.043 0.023 0.014 0.010Cmax/Cmaxhr - 0.53 0.33 0.23
Mg : Geometric mean
Sg : Geometric standard deviationCmax : Maximum concentration
Cmaxhr : Maximum ratio of hourly concentration

S5.74
Table 3 Estimation of Daily and Hourly Concentration of TSP in Mendoza using Monthly
Concentration Values
(concentration unit:ug/m3)
NO. Item Hourly Daily Monthly YearlyNO.9 Mg 57 55 57 62
Sg 1.52 1.68 1.61 -mg+Sg 87 92 92 -Cmax 269 249 87 62Cmax/Cmaxhr - 0.93 0.32 0.23
NO.20 Mg 22 23 24 25Sg 1.74 1.61 1.37 -mg+Sg 38 36 33 -Cmax 120 92 39 25Cmax/Cmaxhr - 0.77 0.33 0.21
NO.21 Mg 35 35 37 38Sg 1.53 1.58 1.35 -mg+Sg 54 55 50 -Cmax 167 133 54 38Cmax/Cmaxhr - 0.80 0.32 0.23
NO.22 Mg 131 134 139 142Sg 1.49 1.38 1.23 -mg+Sg 195 186 171 -Cmax 604 348 196 142Cmax/Cmaxhr - 0.58 0.32 0.24
Mg : Geometric mean
Sg : Geometric standard deviationCmax : Maximum concentration
Cmaxhr : Maximum ratio of hourly concentration
*) The daily value of the site No.9 was estimated by the hourly value, while in the other cases, allthe daily and hourly values were estimated based on the monthly values.

S5.75
0.001
0.01
0.1
1
0.1 1 10 100 1000 104
NOx Environmental Standards
NOx (ppm)
Sampling Time (hr)
National
Province of Buenos Aires
Japan
Buenos Aires City
USEPA
Figure 2 Relationship between NOx Environmental Standard and its Averaging Time
0.01
0.1
1
10
0.1 1 10 100 1000 104
TSP Environmental Standards
TSP(ug/m3)
Sampling Time (hr)
Buenos Aires City
Province of Mendoza
National
Figure 3 Relationship between TSP Environmental Standard and its Averaging Time

S5.76
0.001
0.01
0.1
1
0.1 1 10 100 1000 104
SO2 Environmental Standards
SO2(ppm)
Sampling Time (h)
Buenos Aires(New),Province of Buenos Aires,USEPA
National
Japan
Buenos AiresCity
Figure 4 Relationship between SO2 Environmental Standard and its Averaging Time

S5.77
PhotographsAir Quality Automatic Continuous Analyzers
Manual Air Sampling Unit

S5.78
Some of Manual Sampling Sites in Model Areas
Hospital de Pediatria “Prof. Dr. J. P. Garrahan” in the Buenos Aires Area
Aceros Cartellone S.A. in the Lujan de Cuyo Area

S5.79
TRANSIBA (Transforming station) in the San Nicolas Area