Economical and environmental impact of room air conditioners energy labels in Malaysia
12
Economical and environmental impact of room air conditioners energy labels in Malaysia T.M.I. Mahlia * , H.H. Masjuki, I.A. Choudhury, N.N.N. Ghazali Department of Mechanical Engineering, University of Malaya, 50603 Kuala Lumpur, Malaysia Received 11 June 2001; accepted 2 November 2001 Abstract The usage of residential electrical appliances for the last two decades has increased rapidly in Malaysia together with the increasing income per capita. Like other developing countries with hot and humid cli- mates, Malaysia has been experiencing dramatic growth in the number of use of air conditioners, and the usage will be higher in the future. In order to reduce energy consumption in the residential sector, the Department of Electricity and Gas Supply considers implementing energy labels for room air conditioners sometime in the coming year. This study attempts to calculate the economical and environmental impact of implementing this program in Malaysia. The study found the savings has exceeded the investment cost and the program has reduced the emissions caused by burning fossil fuel. Ó 2002 Elsevier Science Ltd. All rights reserved. Keywords: Life cycle cost; Emissions reduction; Energy efficiency; Energy labels 1. Introduction Energy labels enable consumers to compare the energy efficiency of appliances on a fair and equitable basis. It also encourages manufacturers to improve the energy performance of the ap- pliance. Energy labels act as an indicator, telling the potential buyer how energy efficient the product is. By introducing an appropriate energy label, room air conditioners with the best energy ratings and most competitive price are more likely to be sold in large numbers. The labels are not only to set a guideline of efficiency that manufactures should follow, they also encourage the manufacturers to improve their product while keeping their cost low to win the market. Energy Conversion and Management 43 (2002) 2509–2520 www.elsevier.com/locate/enconman * Corresponding author. Tel.: +60-3-7959-5283; fax: +60-3-7959-5317. E-mail address: indra@fl.um.edu.my (T.M.I. Mahlia). 0196-8904/02/$ - see front matter Ó 2002 Elsevier Science Ltd. All rights reserved. PII:S0196-8904(01)00188-1
-
Upload
independent -
Category
Documents
-
view
0 -
download
0
Transcript of Economical and environmental impact of room air conditioners energy labels in Malaysia

Economical and environmental impact of roomair conditioners energy labels in Malaysia
T.M.I. Mahlia *, H.H. Masjuki, I.A. Choudhury, N.N.N. Ghazali
Department of Mechanical Engineering, University of Malaya, 50603 Kuala Lumpur, Malaysia
Received 11 June 2001; accepted 2 November 2001
Abstract
The usage of residential electrical appliances for the last two decades has increased rapidly in Malaysiatogether with the increasing income per capita. Like other developing countries with hot and humid cli-mates, Malaysia has been experiencing dramatic growth in the number of use of air conditioners, and theusage will be higher in the future. In order to reduce energy consumption in the residential sector, theDepartment of Electricity and Gas Supply considers implementing energy labels for room air conditionerssometime in the coming year. This study attempts to calculate the economical and environmental impact ofimplementing this program in Malaysia. The study found the savings has exceeded the investment cost andthe program has reduced the emissions caused by burning fossil fuel.� 2002 Elsevier Science Ltd. All rights reserved.
Keywords: Life cycle cost; Emissions reduction; Energy efficiency; Energy labels
1. Introduction
Energy labels enable consumers to compare the energy efficiency of appliances on a fair andequitable basis. It also encourages manufacturers to improve the energy performance of the ap-pliance. Energy labels act as an indicator, telling the potential buyer how energy efficient theproduct is. By introducing an appropriate energy label, room air conditioners with the best energyratings and most competitive price are more likely to be sold in large numbers. The labels are notonly to set a guideline of efficiency that manufactures should follow, they also encourage themanufacturers to improve their product while keeping their cost low to win the market.
Energy Conversion and Management 43 (2002) 2509–2520www.elsevier.com/locate/enconman
*Corresponding author. Tel.: +60-3-7959-5283; fax: +60-3-7959-5317.
E-mail address: [email protected] (T.M.I. Mahlia).
0196-8904/02/$ - see front matter � 2002 Elsevier Science Ltd. All rights reserved.
PII: S0196-8904(01)00188-1

The impacts of introducing energy efficiency programs usually are energy, economical andenvironmental. This study discusses the economical and environmental benefit of implementingthe program in Malaysia. The economical impact of the labels is the potential bill savings, net
Nomenclature
AEIracs annual efficiency improvement of room air conditioner (%)ANSraci annualized net dollar savings in year i for room air conditioner ($)ASraci applicable stock in year i of room air conditionerASraci�1 applicable stock in year i� 1 of room air conditionerBECracs baseline energy consumption of room air conditioner (kWh/year)BSraci bill savings in year i for room air conditioner ($)CRF capital recovery factor (%)c, k constant valued interest rate per year (%)EER energy efficiency ratioEmn
p emission p for fuel type n for unit electricity generation (kg/kWh)ERrac
i emission reduction in year i of room air conditioner (kg)ESraci energy saving in year i of room air conditioner (kWh)ICrac increment cost of room air conditioner ($/kWh)IICracs initial increment cost of room air conditioner ($/unit)L life span of room air conditioner (year)l year of labels enactedLECracl label energy consumption of room air conditioner (kWh/year)Naraci number of room air conditioners in year iNaraci�1 number of room air conditioners in year i� 1Naraci�L number of room air conditioners in year i� LPEn
i percentage of electricity generation in year i for fuel type n (%)PFn
i fuel price in year i for fuel type n ($)PVðANSraci Þ present value of annualized net savings in year i for room air conditioner ($)S year standards enactedSC scenarioShraci shipments in year i of room air conditionersSSFraci shipment survival factor in year i of room air conditionersSTD standardT target yearSECracs standards energy consumption of room air conditioner (kWh/year)SEIracs total efficiency improvement of room air conditioner (%)UESraci initial unit energy savings in year i of room air conditioner (kWh/year)x year predicted year starty predicted valueYseracs year of standards enacted of room air conditionerYshraci year i of shipment of room air conditionerYtcracT year target calculation for room air conditioner
2510 T.M.I. Mahlia et al. / Energy Conversion and Management 43 (2002) 2509–2520
savings and cumulative present value, which are a function of the current electricity price. Theeconomical impact is also correlated with the energy savings and the investment for more efficientappliances.On the subject of the environment, it has been observed that there is an increasing atmospheric
concentration of greenhouse gases, especially carbon dioxide (CO2) and other emissions, thathave negative impacts on the environment, such as sulfur dioxide (SO2), nitrogen oxide (NOx)and carbon monoxide (CO). One of the main contributors of these gases is power generationbecause conventional power stations burn fossil fuels to produce electricity. Burning fossil fuelsreleases emissions, such as CO2, SO2, NOx and CO, which can cause greenhouse gas emissioneffect, acid rain and other negative environmental impacts. The study attempts to estimate thepotential reduction of these gases by implementing energy labels for room air conditioners inMalaysia.
2. Survey data
2.1. Grade of room air conditioners
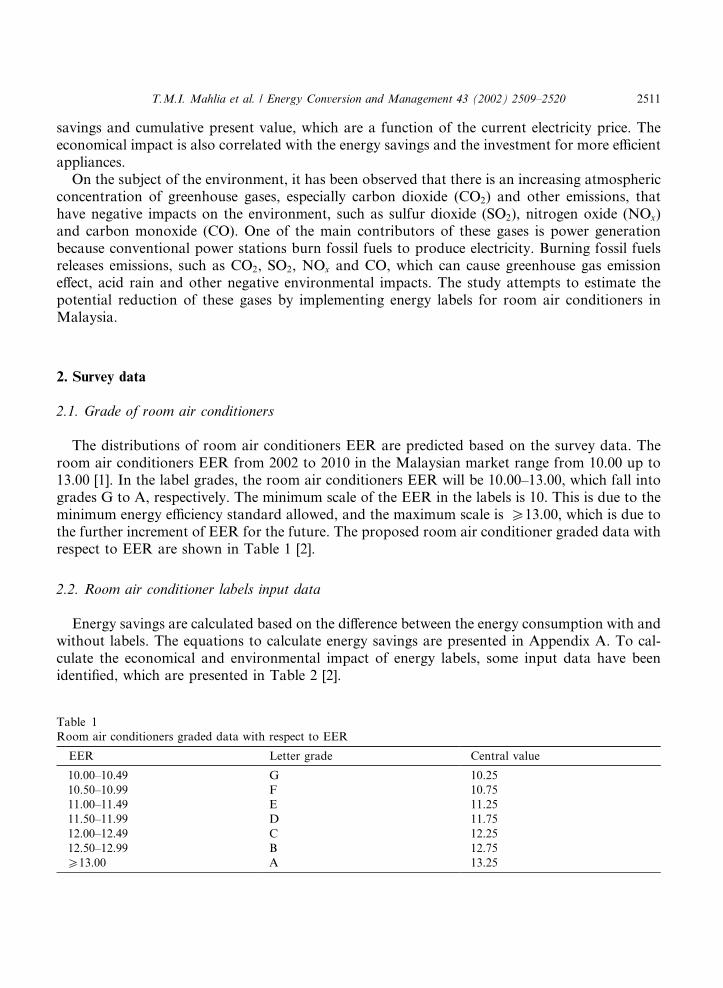
The distributions of room air conditioners EER are predicted based on the survey data. Theroom air conditioners EER from 2002 to 2010 in the Malaysian market range from 10.00 up to13.00 [1]. In the label grades, the room air conditioners EER will be 10.00–13.00, which fall intogrades G to A, respectively. The minimum scale of the EER in the labels is 10. This is due to theminimum energy efficiency standard allowed, and the maximum scale is P13.00, which is due tothe further increment of EER for the future. The proposed room air conditioner graded data withrespect to EER are shown in Table 1 [2].
2.2. Room air conditioner labels input data
Energy savings are calculated based on the difference between the energy consumption with andwithout labels. The equations to calculate energy savings are presented in Appendix A. To cal-culate the economical and environmental impact of energy labels, some input data have beenidentified, which are presented in Table 2 [2].
Table 1
Room air conditioners graded data with respect to EER
EER Letter grade Central value
10.00–10.49 G 10.25
10.50–10.99 F 10.75
11.00–11.49 E 11.25
11.50–11.99 D 11.75
12.00–12.49 C 12.25
12.50–12.99 B 12.75
P13.00 A 13.25
T.M.I. Mahlia et al. / Energy Conversion and Management 43 (2002) 2509–2520 2511

2.3. Household and electricity data
The data necessary for this study are the electricity, room air conditioner ownership, percentagefuel mix for electricity generation and fossil fuel emissions for unit electricity generation data.These data from year 1970 to year 2020 in Malaysia are given in Tables 3 and 4 [2–4].
Table 2
Room air conditioner energy labels input data
Description Values
Standards EER 10.00
Labels EER at F, D and B 10.75, 11.75 and 12.75
Baseline energy consumption 2700 kWh/year
Label energy consumption 2511, 2298 and 2117 kWh/year
Labels effective period 6 years
Year labels enacted 2002
Appliance life span 12 years
Average cooling capacity 10 692 Btu/h
Annual efficiency improvement 1%
Discount rate 7%
Initial increment cost RM 0.32/kWh/year
Current average electricity price 23.5 Sen/kWh
Table 3
Predicted electricity consumption, room air conditioners and percentage fuel mix for electricity generation data
Year Total
(GWh)
Residential
(GWh)
Room AC Coal (%) Petroleum
(%)
Gas (%) Hydro (%)
2002 66 159 11 986 604 044 14.96 4.24 65.20 15.60
2003 71 368 12 927 643 586 15.06 3.89 62.95 18.10
2004 76 779 13 905 684 406 15.24 3.56 60.80 20.40
2005 82 390 14 919 726 504 15.50 3.25 58.75 22.50
2006 88 203 15 969 769 879 15.84 2.96 56.80 24.40
2007 94 217 17 055 814 532 16.26 2.69 54.95 26.10
2008 100 433 18 178 860 462 16.76 2.44 53.20 27.60
2009 106 850 19 337 907 670 17.34 2.21 51.55 28.90
2010 113 468 20 532 956 155 18.00 2.00 50.00 30.00
2020 190 721 34 480 1 511 276 29.00 1.00 40.00 30.00
Table 4
Fossil fuel emissions for unit electricity generation
Fuels Emission (kg/kWh)
CO2 SO2 NOx CO
Coal 1.1800 0.0139 0.0052 0.0002
Petroleum 0.8500 0.0164 0.0025 0.0002
Gas 0.5300 0.0005 0.0009 0.0005
Hydro 0.0000 0.0000 0.0000 0.0000
Other 0.0000 0.0000 0.0000 0.0000
2512 T.M.I. Mahlia et al. / Energy Conversion and Management 43 (2002) 2509–2520

3. Methodology
3.1. Initial incremental cost
The initial incremental cost per unit room air conditioner is a function of the unit energysavings and incremental cost and is calculated by the following equation:
IICracl ¼ UESracl � ICrac ð1Þ
3.2. Capital recovery factor
The capital recovery factor is the correlation between the real discount rate and the lifespan ofthe room air conditioners. This correlation is calculated by the following equation:
CRF ¼ d
ð1� ð1þ dÞ�LracÞð2Þ
3.3. Bill savings
The bill savings for room air conditioner energy labels is a function of the energy savingsmultiplied by an average electricity price. The potential bill savings by introducing energy labelsfor room air conditioners is calculated by the following equation:
BSraci ¼ ESraci � PFni ð3Þ
3.4. Net savings
There are two methods to calculate the economical impact of energy labels, i.e. annualized costsand cash flow. In the first method, the incremental cost spreads over the lifetime of the room airconditioners so that the pattern of expenditures matches the flow of bill savings. The methodsmooths the net savings over time and is calculated by the following equation:
ANSraci ¼ ESraci � PFni �
XTi¼l
ASraci � CRF� IICracl ð4Þ
The second method is the cash flow over the lifetime of the appliance assuming that the roomair conditioner is paid for in full when it is installed. The purchasers incur the incremental costwhen the room air conditioner is purchased, but the benefit of higher energy efficiency is spreadover the lifetime of the appliance. The net savings in terms of actual cash flows is calculated by thefollowing equation:
NSraci ¼ ESraci � PF� Shraci � IICracl ð5Þ
T.M.I. Mahlia et al. / Energy Conversion and Management 43 (2002) 2509–2520 2513

3.5. Cumulative present value
The cumulative present value is calculated using a percentage real discount rate. The cumu-lative present value of the annualized net savings for energy labels is calculated by the followingequation:
PVðANSraci Þ ¼XTi¼1
ANSraci
ð1þ dÞði�YdrÞð6Þ
3.6. Emissions reduction by the standards and labels
As mentioned earlier, the common emissions from fossil fuel power generation consist of CO2,SO2, NOx and CO. The emissions reduction is a function of energy savings. The emissions re-duction of the labels can be calculated using the following equation:
ERai ¼ ESai ðPE1i � Em1
p þ PE2i � Em2p þ PE3i � Em3
p þ � � � þ PEni � Emn
pÞ ð7Þ
4. Results
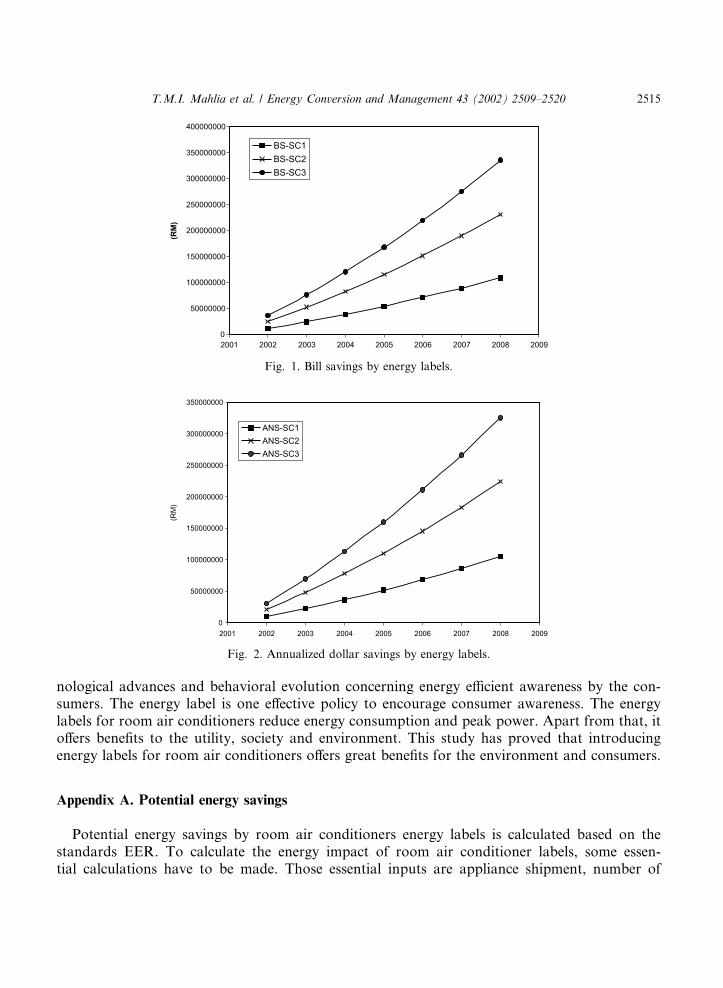
The economical and environmental impacts are also a function of the energy savings. Thepotential electricity savings of energy labels is calculated based on three scenarios (SC), each ofwhich are based on the central value of a label grade. Therefore, for calculating the economicaland environmental impacts, three scenarios are also conducted. The scenarios are minimum ex-pected (SC1), nominal (SC2) and maximum expected (SC3), which are correlated to label gradesF, D and B, respectively. The potential electricity savings by implementing energy labels for roomair conditioners in Malaysia is presented in Table 7.The economical and environmental impact is a function of energy savings and is calculated
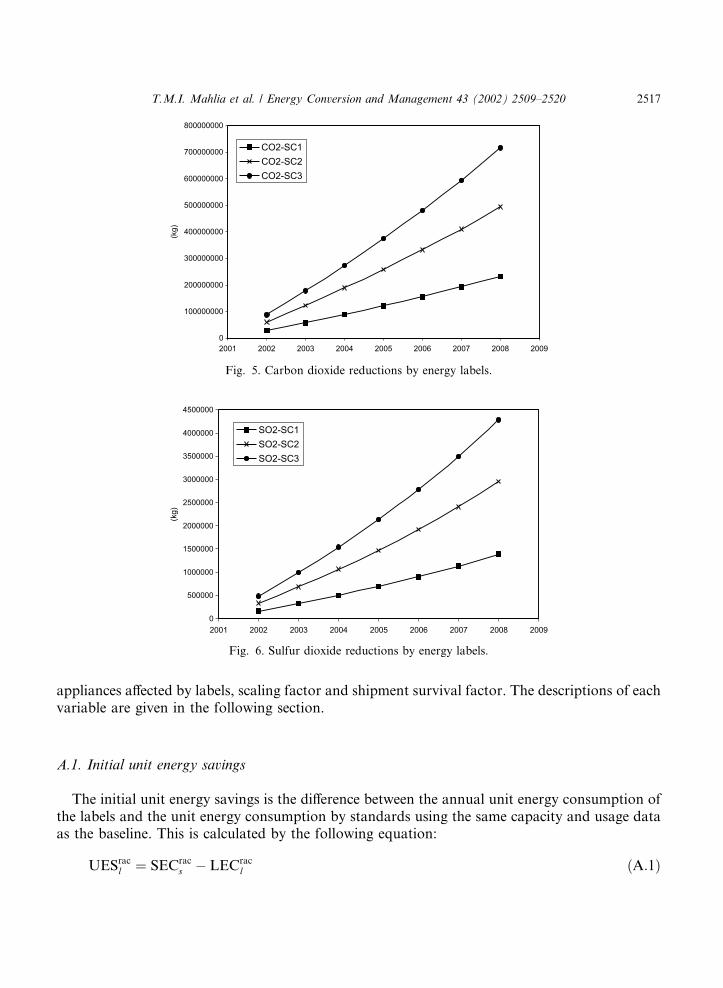
using the data given in Tables 2–4. The economical impact of the labels is calculated based on thestandards baseline and using the current average price (RM($) 0.235/kWh). The calculation re-sults are total bill savings, total annualized net dollar saving, total net savings in terms of actualcash flow and total present value using a 7% real discount rate, as presented in Figs. 1–4, re-spectively. The total potential savings by introducing energy labels is presented in Table 5.The emissions reduction of CO2, SO2, NOx and CO for each scenario is presented in Figs. 5–8,
respectively. The cumulative total emissions reduction by introducing energy labels is presented inTable 6.
5. Conclusions
The elementary units comprising the energy consumption are the appliance and the user. Thecombination of these elementary units leads to the energy consumption pattern in the residentialsector. The energy efficiency policy can only be achieved by the combination of adopting tech-
2514 T.M.I. Mahlia et al. / Energy Conversion and Management 43 (2002) 2509–2520
nological advances and behavioral evolution concerning energy efficient awareness by the con-sumers. The energy label is one effective policy to encourage consumer awareness. The energylabels for room air conditioners reduce energy consumption and peak power. Apart from that, itoffers benefits to the utility, society and environment. This study has proved that introducingenergy labels for room air conditioners offers great benefits for the environment and consumers.
Appendix A. Potential energy savings
Potential energy savings by room air conditioners energy labels is calculated based on thestandards EER. To calculate the energy impact of room air conditioner labels, some essen-tial calculations have to be made. Those essential inputs are appliance shipment, number of
Fig. 1. Bill savings by energy labels.
Fig. 2. Annualized dollar savings by energy labels.
T.M.I. Mahlia et al. / Energy Conversion and Management 43 (2002) 2509–2520 2515

Fig. 3. Net savings by energy labels.
Table 5
Total potential savings by introducing energy labels
Variable Total savings (Million RM$)
SC1 SC2 SC3
RBS 530 1127 1635
RANS 508 1080 1566
RNS 354 750 1090
RPV(ANS) 322 684 992
Fig. 4. Cumulative present values by energy labels.
2516 T.M.I. Mahlia et al. / Energy Conversion and Management 43 (2002) 2509–2520
appliances affected by labels, scaling factor and shipment survival factor. The descriptions of eachvariable are given in the following section.
A.1. Initial unit energy savings
The initial unit energy savings is the difference between the annual unit energy consumption ofthe labels and the unit energy consumption by standards using the same capacity and usage dataas the baseline. This is calculated by the following equation:
UESracl ¼ SECracs � LECracl ðA:1Þ
Fig. 5. Carbon dioxide reductions by energy labels.
Fig. 6. Sulfur dioxide reductions by energy labels.
T.M.I. Mahlia et al. / Energy Conversion and Management 43 (2002) 2509–2520 2517

Table 6
Total emissions reduction by introducing energy labels
Element Emissions reduction (ton)
SC1 SC2 SC3
CO2 1 150 108 2446 262 3 547 689
SO2 6768 14 396 20 878
NOx 3196 6798 9859
CO 711 1513 2194
Fig. 7. Nitrogen oxide reductions by energy labels.
Fig. 8. Carbon monoxide reductions by energy labels.
2518 T.M.I. Mahlia et al. / Energy Conversion and Management 43 (2002) 2509–2520

A.2. Shipment
Shipment data comprise the number of room air conditioners in predicting year minus thenumber of room air conditioners in the previous year plus number of retired room air condi-tioners in the current year. The shipment for the room air conditioners is calculated by the fol-lowing equation:
Shraci ¼ ðNaraci �Naraci�1Þ þNaraci�L ðA:2Þ
A.3. Shipment survival factor
The shipment survival factor is a function of the annual retirement rate and the retirementfunction and the lifespan of room air conditioners. The shipment survival factor for this applianceis calculated using the following equation:
SSFraci ¼ 1� ðYtcrac �Yshraci Þ � ð2=3ÞLracð4=3� 2=3Þ � Lrac
� �ðA:3Þ
A.4. Applicable stock
Since the effective period of the labels is shorter than 2/3 of the lifespan of room air condi-tioners, the applicable stock is the shipments in a particular year plus the number of appliancesaffected by labels in the previous year. The applicable stock is calculated by the followingequation:
ASraci ¼ ðShraci þASraci�1Þ ðA:4Þ
A.5. Energy savings
The energy savings is the number of appliances affected by the labels in the particular year thatstill exist multiplied by the unit energy savings associated with each label grade. Since the standardis static, there is no scaling factor used in calculating the energy labels. The room air conditionersenergy savings by labels can be calculated by the following equation:
ESraci ¼XTi¼l
ASraci �UESracl ðA:5Þ
Potential electricity savings by introducing energy labels for room air conditioners in Malaysiais tabulated in Table 7.
T.M.I. Mahlia et al. / Energy Conversion and Management 43 (2002) 2509–2520 2519

References
[1] Egan K. Building national standards regimes: regulatory and voluntary approaches in the Philippines and Thailand.
Bangkok, 1998.
[2] Mahlia TMI. Energy efficiency standards and labels of room air conditioners for Malaysia. PhD Dissertation,
University of Malaya, Kuala Lumpur, Malaysia, 2000.
[3] Masjuki HH, Mahlia TMI, Choudhury IA. Potential electricity savings by implementing energy efficiency standards
for room air conditioners in Malaysia. Energy Convers Mgmt 2001;42:439–50.
[4] Mahlia TMI, Masjuki HH, Choudhury IA. Potential CO2 reduction by implementing energy efficiency standard for
room air conditioners in Malaysia. Energy Convers Mgmt 2001;42(16).
T.M.I. Mahlia holds Ir. from University of Syiah Kuala, Indonesia, M. Eng. Sc from University of Malaya and he just
submitted his Ph.D. thesis to the University of Malaya. He is presently a lecturer in the Department of Mechanical
Engineering, University of Malaya.
H.H. Masjuki holds a B.Sc. (Hons), MSc., and Ph.D. from Leeds University, UK. At present, He is a Professor at the
Mechanical Engineering Department University Malaya. His main interests are tribology and energy efficiency.
I.A. Choudhury holds M. Eng. from Asian Institute of Technology, Thailand, M.S. from Arizona State University,
USA and Ph.D. from Dublin City University, Dublin, Ireland in Mechanical Engineering. He is presently a lecturer in
the Faculty of Engineering at the University of Malaya. His researches are Energy Conservation, Machine Tools and
Machining.
N.N.N. Ghazali holds a B.Sc. (Hons), from Bradford University, UK and MSc. from Cranfield University, UK. At
present, he is a Lecturer at the Mechanical Engineering Department University Malaya. His main interests are energy
efficiency, computational fluid dynamic and software development.
Table 7
Electricity savings by introducing energy labels
Year Electricity savings (kWh)
SC1 SC2 SC3
2002 50 548 428 107 515 704 155 924 516
2003 105 914 277 225 277 986 326 709 119
2004 166 338 900 353 800 200 513 098 300
2005 232 064 028 493 596 504 715 837 716
2006 303 330 825 645 179 850 935 671 275
2007 380 381 022 809 064 396 1 173 344 634
2008 463 455 783 985 763 094 1 429 601 701
2520 T.M.I. Mahlia et al. / Energy Conversion and Management 43 (2002) 2509–2520