Research Project on Environmental Health (Focus on Air ...
87
i INTOSAI WGEA Work Plan 2017-2019 Project 2.1 (b) Research Project on Environmental Health (Focus on Air Pollution) Further information contact: [email protected] Website: www.wgea.org Twitter ID: @WGEASecre
-
Upload
khangminh22 -
Category
Documents
-
view
4 -
download
0
Transcript of Research Project on Environmental Health (Focus on Air ...
i
INTOSAI WGEA Work Plan 2017-2019
Project 2.1 (b)
Research Project on Environmental Health
(Focus on Air Pollution)
Further information contact: [email protected]
Website: www.wgea.org
Twitter ID: @WGEASecre
ii
This publication was prepared by the INTOSAI Working Group on Environmental Auditing (WGEA). The WGEA aims to improve the use of audit mandate and audit instruments in the field of environmental protection policies, by both members of the Working Group and non-member Supreme Audit Institutions (SAIs). The WGEA has the mandate to:
▪ Assists SAIs in acquiring a better understanding of the specific issues involved in environmental auditing;
▪ Facilitates exchange of information and experience among SAIs; and ▪ Publishes guidelines and other informative material for their use.
This publication may be downloaded free of charge from the INTOSAI WGEA website
www.wgea.org Permission is granted to copy and distribute this publication, giving appropriate credit, provided that such copies are for academic, personal or professional use and are not sold or used for commercial gain.

iii
Foreword
Environmental pollution is one of the serious crises to which we are facing today. In the United Nations Environment Assembly (UNEA) held in Nairobi on 23-27 June 2014, delegates from around the world unanimously agreed to encourage governments to set standards and policies across multiple sectors to reduce air pollution emissions and manage the negative impacts of air pollution on health, the economy, and overall sustainable development.
This UNEA Resolution recognized that air pollution, responsible for seven million deaths annually, according to estimates by the World Health Organization (WHO), is a top issue that requires immediate action by the international community.
As reported by the Organization for Economic Cooperation and Development
(OECD), the cost of the health impact of air pollution in OECD countries (including deaths and illness) was about USD 1.7 trillion in 2010. In China, the cost of the health impact of air pollution was about USD 1.4 trillion and about USD 0.5 trillion in India in same year.
Similarly, in May 2015, the Sixty-eighth World Health Assembly (WHA) adopted resolution WHA68.8, in which the Director-General was requested, inter alia, to propose to the Sixty-ninth WHA a road map for an enhanced global response to the adverse health effects of air pollution. In response thereto, an early version of the draft road map was considered by the Executive Board at its 138th session.
The First WHO Global Conference on Air Pollution and Health from 30 October to 1 November 2018 brought together global, national and local leaders. Participants at the conference recognized the need for a world free of air pollution and an aspirational goal of reducing the number of deaths from air pollution by two thirds by 2030.
In the 2030 Sustainable Development Goals (SDGs), air quality and its impact on
human health was considered as one of the top priorities under Goals 3 and 11. These two Goals envision to Make Cities and Human Settlements Inclusive, Safe, Resilient and Sustainable by reducing the adverse per capita environmental impact of cities, including paying special attention to air quality and municipal and other waste management and Ensure Healthy Lives and Promote Well Being for All Ages through substantial reduction of the number of deaths and illnesses from hazardous chemicals and air pollution and contamination, among others.
The WGEA, in its Work Plan for 2017-2019, included the conduct of a research project on Environmental Health (focus on Air Pollution) and the role of SAIs in dealing with these issues and concerns.
The project aims to (a) identify and describe the issues and risks related to
environmental health, with focus on Air Pollution, in which the governments worldwide are faced with that needed concrete response measures; (b) determine the government responses on issues related to air pollution and its health effects; (c) find out how international organizations can assist/support in surmounting the effects of air pollution on health; (d) ascertain the objectives in the conduct of audit; the criteria used; and the methodologies employed by SAIs in the audit of this area; (e) describe the challenges of SAIs in auditing these issues and identify the best strategies and practices adopted to assist them to face and overcome these challenges.
Accordingly, the project will identify the role of governments and contributions of
international organizations in responding to air pollution and its effects related to health. The project will likewise gather SAI experience in auditing issues related to air pollution, through the use of case studies, wherein the SAIs helped governments identify and implement immediate cost-effective measures to reduce, if not eliminate, the sources and effects of air pollution, through their audit recommendations. The case studies will present examples of

iv
audit works of the SAIs. The project also portrays the challenges encountered in audit by SAIs and best approaches and practices adopted to achieve their audit objectives.
The work on this document was led by the SAI of Philippines. In particular, we would like to acknowledge the efforts of the authors, Wilfredo A. Agito, Ma. Corazon S. Gomez, Maribeth F. De Jesus, Jesusa R. Gauang and Evelyn V. Menciano. We also like to acknowledge the contributions made by the SAIs worldwide, especially the project sub-committee members Morocco, Czech Republic, Egypt, Iran and Pakistan. A special recognition to the INTOSAI WGEA and its Steering Committee members for their valuable help in various phases of the project.
We hope you will find this research paper useful and beneficial.
MICHAEL G. AGUINALDO Chairperson
Commission on Audit, Philippines Project Leader
PROF. DR. MOERMAHADI SOERJA DJANEGARA, CA, CPA
Chairman The Audit Board of the Republic of Indonesia
Chair of INTOSAI WGEA
v
Table of Contents Foreword ............................................................................................................................................ iii
Table of Contents ............................................................................................................................... v
List of Figures ................................................................................................................................... vii
List of Tables ................................................................................................................................... viii
Acronyms and Abbreviations ............................................................................................................. ix
Executive Summary ......................................................................................................................... xiv
Chapter I: INTRODUCTION AND BACKGROUND ........................................................................... 1
1.1. Definition of Air Pollution ......................................................................................................... 1
1.2. Categories of Air Pollution ....................................................................................................... 1
1.2.1. Household (Indoor) Air Pollution....................................................................................... 1
1.2.2. Outdoor Air Pollution ........................................................................................................ 2
1.3. Types and Sources of Air Pollutants ....................................................................................... 5
1.3.1. Primary Pollutants ............................................................................................................ 5
1.3.2. Secondary Pollutants ........................................................................................................ 8
1.3.3. Gaseous air pollutants ...................................................................................................... 9
1.3.4. Particulate air pollutants ................................................................................................. 10
1.4. Sources of Major Air Pollutants ............................................................................................. 10
1.5. Who Are Vulnerable to Air Pollution ...................................................................................... 12
1.6. Effects/Impact of Air Pollution on Health ............................................................................... 13
1.7. Financial Risks Related to Air Pollution and Human Health ................................................. 15
Chapter II: ROLE OF GOVERNMENTS IN RESPONDING TO AIR POLLUTION AND ITS
EFFECTS RELATED TO HEALTH .................................................................................................. 18
2.1. Overview ................................................................................................................................ 18
2.2. Government policies to reduce and combat air pollution and its health impact .................... 19
2.3. Instruments used by governments for measuring/monitoring air pollution ............................ 27
2.4. Non-financial and financial mechanism used by governments for pollution abatement ....... 28
2.4.1. Non-Financial Mechanism .............................................................................................. 28
2.4.2. Financial Mechanism ...................................................................................................... 28
2.5. Air quality improvement assessments/evaluation of air quality improvement tools .............. 30
2.5.1. Air quality improvement assessment .............................................................................. 30
2.5.2. Evaluation of air quality improvement tools .................................................................... 31
Chapter III: EFFORTS OF INTERNATIONAL ORGANIZATION ON AIR POLLUTION AND ITS
HEALTH EFFECTS .......................................................................................................................... 33
3.1. International Assembly/Congress on Air Pollution ................................................................ 33
3.1.1. World Health Assembly (WHA) ...................................................................................... 33
3.1.2. WHO Global Conference on Air Pollution and Health .................................................... 34
3.1.3. United Nations Environment Assembly (UNEA) ............................................................. 35
vi
3.1.4. Stockholm Convention on Persistent Organic Pollutants ............................................... 36
3.1.5. United Nations Economic Commission for Europe (UNECE) ........................................ 36
3.1.6. ASEAN Agreement on Trans-boundary Haze Pollution ................................................. 36
3.2. Responses of international organizations in helping governments reduce and combat air
pollution and its health effects ...................................................................................................... 37
3.2.1. World Health Organization ............................................................................................. 37
3.2.2. United Nations Environment Programme (UNEP) ......................................................... 39
3.2.3. United Nations Educational, Scientific and Cultural Organization (UNESCO) ............... 40
3.2.4. Organization for Economic Cooperation and Development (OECD) ............................. 40
3.3. Assistance and provision of funding sources in support of programs and projects related on
impacts of air pollution on health .................................................................................................. 40
Chapter IV: AUDITS CONDUCTED ON AIR POLLUTION ISSUES BY SAIs and CHALLENGES
ENCOUNTERED IN AUDIT AND BEST APPROACHES AND PRACTICES ADOPTED TO
ACHIEVE AUDIT OBJECTIVES ....................................................................................................... 43
4.1. Scope, Objectives, Criteria and Methodologies on Audits Conducted by SAIs and SDGs... 43
4.2. Challenges Encountered by SAIs in Auditing Air Pollution and Strategies Adopted to
Achieve Audit Objectives .............................................................................................................. 50
Appendix I ......................................................................................................................................... 53

vii
List of Figures
Figure I. Possible Places of Indoor Pollution with Potential Pollutants
Figure II. Sample Sources of Outdoor Pollution
Figure III. Six Common Outdoor Pollutants
Figure IV. Sources of Major Air Pollutants
Figure V. World's Air Pollution: Real-time Air Quality Index, January 2019
Figure VI. People vulnerable to air pollution
Figure VII. Air Pollution Related Deaths
Figure VIII. Deaths due to Household Air Pollution, 2016
Figure IX. Air Pollution Related Deaths by Continent
Figure X. Total Welfare Losses from Air Pollution, by Region: 1990–2013
Figure XI. Welfare Losses Due to Air Pollution by Region, 2013
Figure XII. Welfare Losses Due to Air Pollution by Income Group, 2013
Figure XIII. PM10 Particulate Concentration (Air Pollutants), μg/m3, Annual Mean
Figure XIV. Air Pollution in Five Sampled Countries
Figure XV. Government Policies to combat air pollution in Five Sampled Countries
Figure XVI. Projects to improve air quality in several countries
Figure XVII. Audit Focus on Air Pollution
Figure XVIII. Common Audit Objectives
Figure XIX. Similar Audit Scope
Figure XX. Typical Subjects of Audit
Figure XXI. Common Audit Methodologies
Figure XXII. Similar Audit Criteria
Figure XXIII. Goals, Targets and Indicators for Goals 3 and 11
Figure XXIV. Summary of Joint Audit on Air Pollution by EUROSAI Member States
Figure XXV. Types of Audit Conducted by SAIs

viii
List of Tables
Table 1. Major Primary Pollutants
Table 2. Sources of Secondary Pollutants
Table 3. Sources of Common Atmospheric Pollution
Table 4. Air Quality Index Scale
Table 5. Pollutants per EPA Standards
Table 6. Comparison of Current Level of Pollutants against the EPA Standards
Table 7. Financial Mechanisms Used by the Five Sampled Countries
Table 8. WHO Air Quality Guidelines
Table 9. Significant and Noteworthy Findings and Recommendations from SAIs‘ Audit Reports
Table 10. Challenges Encountered in Audit and Strategies Adopted by SAIs

ix
Acronyms and Abbreviations
ACN Air Control Net
ADB Asian Development Bank
AQI Air Quality Index
AQMF Air Quality Management Fund
AQP Air Quality Plan
ArchSD Architectural Services Department
As Arsenic
ASEAN Association of Southeast Asian Nations
BaP Benzol [a] Pyrene
BenMAP Environmental Benefits Mapping and Analysis Program
MBA Bangkok Metropolitan Administration
BENRO Bulacan Environment and Natural Resources Office
BTH Beijing-Tianjin-Hebei
CAC Command and Control
CCAC Climate and Clean Air Coalition
CCFs Capital Construction Funds
Cd Cadmium
CEMs Continuous Emissions Monitoring System
CEPA Canadian Environmental Protection Act
CETESB Companhia Ambiental do Estado de Sāo Paulo
CFCs Chlorofluorocarbons
CH4 Methane
CMAC Community Multi-scale Air Quality
CMDB Control Measure Data Base
CO Carbon Monoxide
CO2 Carbon Dioxide
CONAMA Commission Nacional de Medio Ambiente
COPD Chronic Obstructive Pulmonary Disease

x
CoST Control Strategy Tool
CPCB Central Pollution Control Board
DENR Department of Environment and Natural Resources
DOTr Department of Transportation
EAC Emissions Alert Campaign
EFs Environmental Funds
EMB Environmental Management Bureau
EMF Emission Modelling Framework
EMSD Electrical and Mechanical Services Department
EMSTF Electrical and Mechanical Services Trading Fund
EPA Environmental Protection Agency
EPD Environmental Protection Department
EPFR Environmentally Persistent Free Radical
EPL Environmental Protection Law
ESD Education for Sustainable Development
EU European Union
EU ETS European Emissions Trading Scheme
FIs Financial Institutions
FYP Five-Year Plan
GFR General Financial Rules
GHG Greenhouse Gases
HDV High Dividend ETF
HG Mercury
H2SO4 Sulphuric Acid
I-ACT Inter-Agency Council on Traffic
IAQ Indoor Air Quality
ICAC Independent Commission Against Corruption
IHME Institute for Health Metrics and Evaluation
INDCs Intended Nationally Determined Contributions
INTOSAI International Organization of Supreme Audit Institutions

xi
IRR Implementing Rules and Regulations
LDV Light Duty Vehicle
Lead Plumbum (Pb)
LPG Liquefied Petroleum Gas
LTFRB Land Transportation Franchising and Regulatory Board
MBI Market-based Instrument
MMDA Metropolitan Manila Development Authority
MoE Ministry of Environment
MT Metric Tonne
MVIS Motor Vehicle Inspection Systems
NAAQS National Ambient Air Quality Standard
NAFTA North American Free Trade Agreement
NCD Non-communicable Diseases
Ni Nickel
NLEX North Luzon Expressway
NMVOC Non-Methane Carbon Monoxide
NOx Nitrogen Oxides
N2O Nitrogen
NAQMN National Air Quality Monitoring Network
NDIR Non-dispersive infrared
NH3 Ammonia
NMCA National Air Quality Monitoring Network
NTEC National Total Emission Control
O3 Ozone
ODS Ozone Depleting Substances
OECD Organization for Economic Cooperation and Development
PAN Peroxyacetyl Nitrate
Pb Lead
PCD Pollution Control Department
PCDD/F Dioxin and furan Dioxide

xii
PM Particulate Matter
PM2.5 Fine Particles
PM10 Inhalable Coarse Particles
PMEH-MDTF Multi-Donor Trust Fund for Pollution Management and Environmental
Health
PNP-HPG Philippine National Police-Highway Patrol Group
POPs Persistent Organic Pollutants
PRD Pearl River Delta
Proconve Vehicle Air Pollution Control Program
PRONAR National Programme for Air Quality Control
PUVMP PUV Modernization Program
PUVs Public Utility Vehicles
QA/QC Quality Assurance and Quality Control
RA Republic Act
RET Roadside Emissions Test
RTI Roadside Technical Inspection
RWGEA Regional Working Group on Environmental Auditing
SAI Supreme Audit Institution
SDGs Sustainable Development Goals
SLCP Short-Lived Climate Pollutant
STAQ Sustainable Transport and Air Quality Project
SO2 Sulfur Dioxide
TRB Transportation Research Board
TRFs Technology Renovation Funds
UNEA United Nations Environment Assembly
UNECE United Nations Economic Commission for Europe
UNEP United Nations Environment Programme
UNESCO United Nations Educational, Scientific and Cultural Organization
UNFCCC UN Framework Convention on Climate Change
UNIDO United Nations Industrial Development Organization
xiii
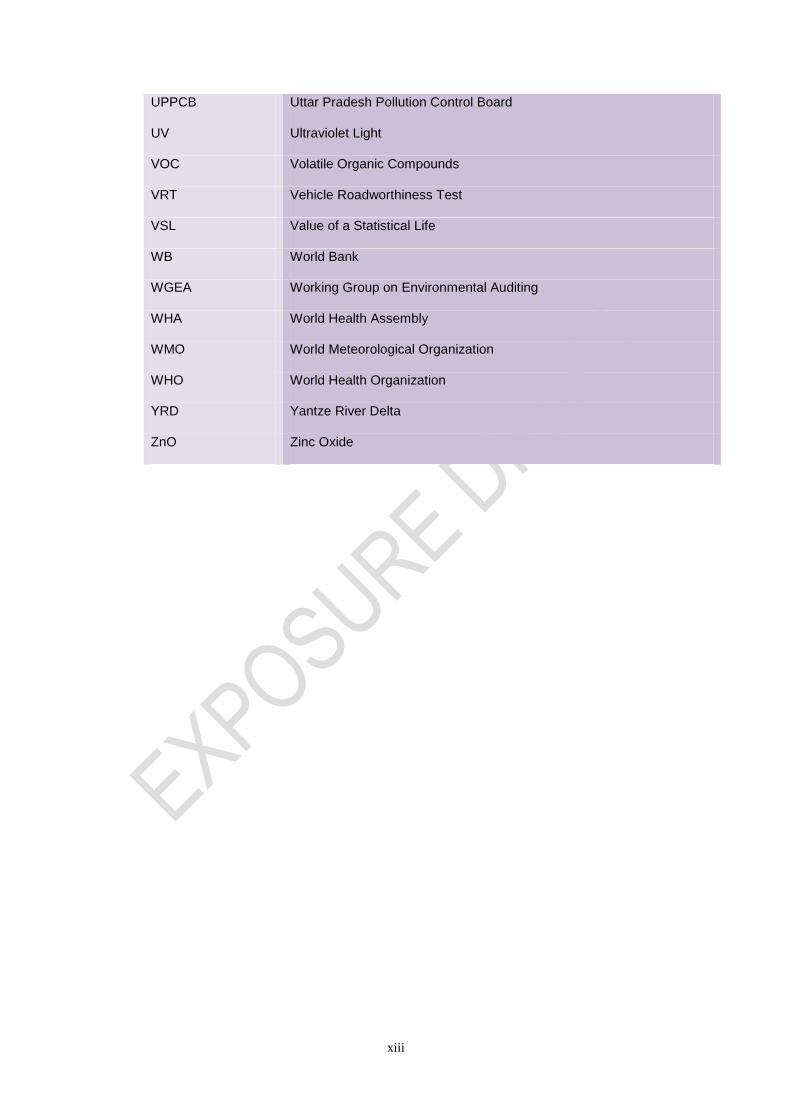
UPPCB Uttar Pradesh Pollution Control Board
UV Ultraviolet Light
VOC Volatile Organic Compounds
VRT Vehicle Roadworthiness Test
VSL Value of a Statistical Life
WB World Bank
WGEA Working Group on Environmental Auditing
WHA World Health Assembly
WMO World Meteorological Organization
WHO World Health Organization
YRD Yantze River Delta
ZnO Zinc Oxide
xiv
Executive Summary
Air pollution is defined as any visible or invisible substance found in the air that is not part of the normal composition of air. Some air pollution is natural and has always been part of the earth's history. However, over the past one hundred years or so, pollution created by humans has become a major environmental problem. Air pollutants may be either emitted into the atmosphere (primary air pollutants) or formed within the atmosphere itself (secondary air pollutants).
The categories or air pollution are (1) household (indoor) air pollution which is an air
within a building such as your home, classroom, office, shopping center, hospital or gym, and involves exposures to particulates, carbon oxides, and other pollutants carried by indoor air or dust; and (2) outdoor air pollution which involves exposures that take place outside of the built environment.
One of the most vulnerable sectors to air pollution are children since their lungs do
not complete their growth until full adult stature is reached in adolescence. Children also spend more time outdoors, and they breathe faster than adults do. Aside from children, seniors and the elderly who have weaker immune systems and whose heart function has declined are most exposed to the effects of air pollution. Adults who work or exercise outdoors for extended periods of time are likewise vulnerable to the effects of air pollution.
Air pollution continues to pose a significant threat to health worldwide. According to
the WHO assessment, air pollution is linked to seven million premature deaths. More than half of this disease burden is borne by the populations of developing countries. Air pollution has also been identified as a global health priority in the sustainable development agenda. WHO has responsibility for stewarding two air pollution-related indicators for monitoring progress against the SDGs - in health (Goal 3) and sustainable cities (Goal 11).
Air pollution is responsible for more than $5.11 trillion in welfare losses in 2013. The economic costs of air pollution have increased significantly over time, a reflection of the growing challenge of pollution. Between 1990 and 2013, total welfare losses due to premature mortality from exposure to air pollution increased by 94 percent.
Management of environment is possible only through concerted efforts of all the
components of society such as government and non-governmental organization, industrialists, agriculturists, voluntary social welfare organizations as well as the general public. The final controlling authority in most of the issues related to environmental management is the government which has the power to initiate measures to regulate and control factors that contribute to air pollution and its effects. The government is facing economic burden of air quality related health impact on people in terms of health costs and challenges in enhancing aggressive responses to the adverse health effects of air pollution. Therefore, the government has to apply various checks and controls so that the environment is managed properly.
International organizations also play important role in combating air pollution by creating awareness and sending clear message to the public on what steps to implement to mitigate the air pollution. International organizations hold international assembly/congress on air pollution, help governments on how to reduce and combat air pollution and its health effects, extend assistance and provide funding sources in support of government programs and projects related to air pollution and its impacts on health.
The issues and challenges on air pollution and its health effects showed the need for
SAIs to consider this area as among its audit priorities. Thus, it is essential for SAIs to adopt and implement an effective framework for auditing air pollution and its health effects. This research project aims to assist SAIs in pursuing to review and evaluate the governments‘ policies on this area by providing wide-ranging and comprehensive data and information.
xv
They likewise intend to provide information regarding air pollution and its health effects through case studies, audits conducted by SAIs, on this arena. The responses of 43 SAIs on the survey questionnaire showed the types of audit conducted on air pollution and its health effects, compliance and performance audits. The survey however, showed the challenges faced by SAIs in auditing this field but highlighted the strategies adopted by SAIs to overcome such hindrances which could be a good source of guidance to other SAIs in their audit of this issue/subject matter.

1
Chapter I: INTRODUCTION AND BACKGROUND
1.1. Definition of Air Pollution According to WHO, air pollution is the contamination of the indoor or outdoor air by a
range of gasses and solids that modify its natural characteristics.1
Air pollution occurs when gases, dust particles, fumes (or smoke) or odours are
introduced into the atmosphere in a way that makes it harmful to humans, animals and plant. This is because the air becomes dirty (contaminated or unclean).
Air pollution could be in the form of the emission of harmful chemical gases (e.g.
carbon monoxide) or particulates (e.g. soot) in to the air. Air pollution could also be in the form of disturbances to the normal composition of the air such that there is an undesired effect on the environment or living things.
It is also a contamination of the indoor or outdoor environment by any chemical, physical or biological agent that modifies the natural characteristics of the atmosphere. Household combustion devices, motor vehicles, industrial facilities and forest fires are common sources of air pollution. Pollutants of major public health concern include particulate matter, carbon monoxide, ozone, nitrogen dioxide and sulfur dioxide. Outdoor and indoor air pollution cause respiratory and other diseases, which can be fatal.
2
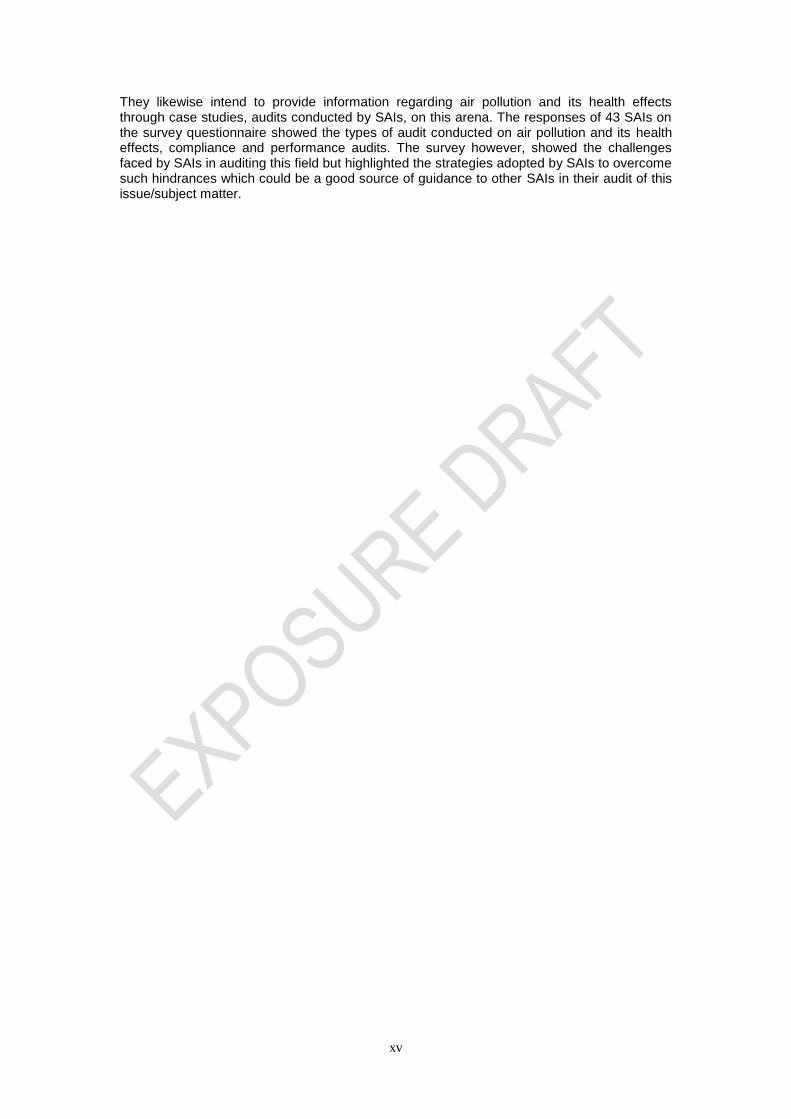
1.2. Categories of Air Pollution 1.2.1. Household (Indoor) Air Pollution
‗Indoor air‘ is air within a building such as your home, classroom, office, shopping center, hospital or gym. We say ‘Indoor Air Pollution’ if indoor air is contaminated by smoke, chemicals, smells or particles.
3
Indoor air pollution involves exposures to particulates, carbon oxides, and other pollutants carried by indoor air or dust. Examples include
4:
Gases (carbon monoxide, radon, etc.)
Household products and chemicals
Building materials (asbestos, formaldehyde, lead, etc.)
Indoor allergens (cockroach and mouse dropping, etc.)
Tobacco smoke
Mold and pollen
Around three billion people cook and heat their homes using solid fuels (i.e. wood, charcoal, coal, dung, crop wastes) on open fires or traditional stoves. Such inefficient cooking and heating practices produce high levels of household (indoor) air pollution which includes a range of health damaging pollutants such as fine particles and carbon monoxide.
5
1 http://www.searo.who.int/topics/air_pollution/what-is-air-pollution.pdf?ua=1
2 https://www.afro.who.int/health-topics/air-pollution
3 http://eschooltoday.com/pollution/air-pollution/what-is-indoor-air-pollution.html
4 https://www.niehs.nih.gov/health/topics/agents/air-pollution/index.cfm
5 https://www.who.int/news-room/fact-sheets/detail/household-air-pollution-and-health
2
Figure I – Possible Places of Indoor Pollution with Potential Pollutants
Photo source6
1.2.2. Outdoor Air Pollution
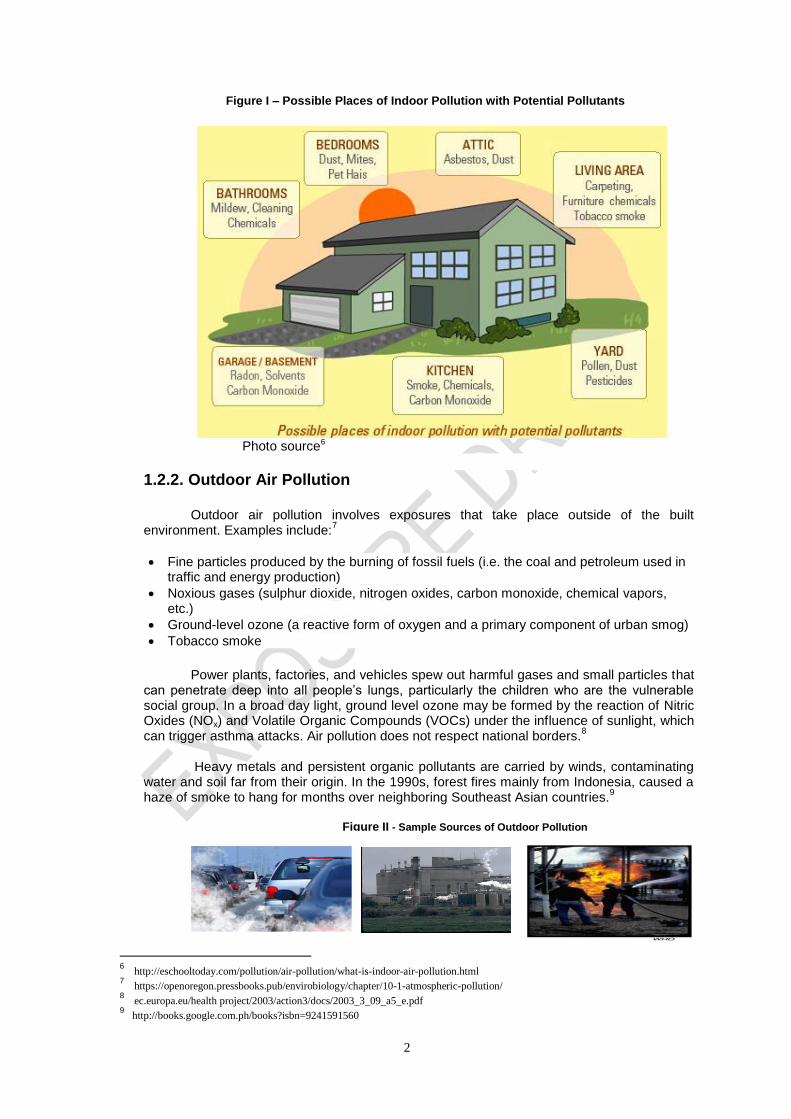
Outdoor air pollution involves exposures that take place outside of the built environment. Examples include:
7
Fine particles produced by the burning of fossil fuels (i.e. the coal and petroleum used in traffic and energy production)
Noxious gases (sulphur dioxide, nitrogen oxides, carbon monoxide, chemical vapors, etc.)
Ground-level ozone (a reactive form of oxygen and a primary component of urban smog)
Tobacco smoke
Power plants, factories, and vehicles spew out harmful gases and small particles that can penetrate deep into all people‘s lungs, particularly the children who are the vulnerable social group. In a broad day light, ground level ozone may be formed by the reaction of Nitric Oxides (NOx) and Volatile Organic Compounds (VOCs) under the influence of sunlight, which can trigger asthma attacks. Air pollution does not respect national borders.
8
Heavy metals and persistent organic pollutants are carried by winds, contaminating
water and soil far from their origin. In the 1990s, forest fires mainly from Indonesia, caused a haze of smoke to hang for months over neighboring Southeast Asian countries.
9
Figure II - Sample Sources of Outdoor Pollution
6 http://eschooltoday.com/pollution/air-pollution/what-is-indoor-air-pollution.html
7 https://openoregon.pressbooks.pub/envirobiology/chapter/10-1-atmospheric-pollution/
8 ec.europa.eu/health project/2003/action3/docs/2003_3_09_a5_e.pdf
9 http://books.google.com.ph/books?isbn=9241591560

3
Major Outdoor Pollutants Outdoor air quality is affected by:
1. Industrial and agricultural activities
Industries like energy, shipping, manufacturing, and automobiles discharge air
pollutants such as fine particulate matter, volatile organic compounds, nitrogen and carbon compounds, etc.
10
Power plants are responsible for the emission of sulphur oxides, nitrogen oxides, and
of particulates.11
The main pollutants emitted from vehicles and from gas stations during fuelling are particulates, nitrogen oxides, hydrocarbons, carbon monoxide and volatile organic compounds.
12
The nitrogen oxides (NOx) emissions as a by-product of road traffic and other fuel
combustion processes transform into aerosol particulates then combined with volatile organic compounds in the presence of sunlight to form ground-level ozone
13
Factories and other industrial installations have caused such pollution, through
chemicals, particulates or biological compounds, by burning fuels, carrying out chemical processes and releasing dust and other particulates.
14
Four main agricultural activities are linked to the production of greenhouse gases.
These include soil management, enteric fermentation, manure management and fossil fuel consumption. Methane (CH4) and nitrous oxide (N2O) were the two main gases emitted by agricultural activity. Methane was primarily produced from enteric fermentation and manure management, while soil management, such as fertilization, was the largest source of nitrous oxide.
2. Treatment of industrial effluents and domestic residues
Air emissions from wastewater treatment operations may include hydrogen sulphide,
methane, ozone (in the case of ozone disinfection), volatile organic compounds (e.g., chloroform generated from chlorination activities and other volatile organic compounds (VOCs) from industrial wastewater), gaseous or volatile chemicals used for disinfection processes
10
https://medium.com/@anasbaig/everyday-activities-that-cause-air-pollution-5ed490625635 11
http://www.sviva.gov.il/English/env_topics/Health-and-Environment/Health-Impact-of-Environmental-Nuisances/Pages/The-
Impact-of-Energy-Production-on-Public-Health.aspx 12
http://www.sviva.gov.il/English/env_topics/Health-and-Environment/Health-Impact-of-Environmental-Nuisances/Pages/The-
Impact-of-Air-Pollution-from-Transportation.aspx 13
http://www.4cleanair.org/topics/story/ships-trains-and-aviation 14
https://sciencing.com/factories-cause-air-pollution-5169.html
4
(e.g., chlorine and ammonia), and bio aerosols. Odors from treatment facilities can also be a nuisance to workers and the surrounding community.
15
3. Traffic
In many areas, vehicle emissions have become the dominant source of air pollutants,
including carbon monoxide (CO), carbon dioxide (CO2), volatile organic compounds (VOCs) or hydrocarbons (HCs), nitrogen oxides (NOx), and particulate matter (PM). The increasing severity and duration of traffic congestion have the potential to greatly increase pollutant emissions and to degrade air quality, particularly near large roadways.
16
4. Solid waste management
Around the world, waste generation rates are rising. In 2016, the worlds‘ cities
generated 2.01 billion tonnes of solid waste, amounting to a footprint of 0.74 kilograms per person per day. With rapid population growth and urbanization, annual waste generation is expected to increase by 70 percent from 2016 levels to 3.40 billion tonnes in 2050.
17
Air pollutants associated with solid waste management include, among others,
greenhouse gases, odorous gases, PCDD/Fs, heavy metals, PM, which are discharged from waste disposal and treatment processes.
18
5. Cottage industries
Cottage industries comprise a sub-group of informal sector income generation
activities which are conducted in the home environment and organized around families or households. Cottage industry workers may be at risk of exposure to harmful substances associated with their work, and given the lack of separation of cottage industry activities from living spaces, their families and neighbours may similarly be at risk of exposure.
Harmful pollutants associated with cottage industries include (a) lead; (b) mercury; (c)
arsenic; and (d) cadmium which are harmful to human health.19
6. Chemical incidents and spills
One of the most common concerns over chemical accidents and hazardous materials spills is acute, or short-term, toxicity. Acutely toxic contaminants, such as cyanide and chlorine released from hazardous materials spills, pose an immediate threat to public health. For example, a chemical accident in which chlorine gas or cyanide gas is released would likely result in widespread deaths as the plume, or toxic cloud, moved through a populated area. Another class of toxicity is chronic, or long term. One of the most common types of chronic toxicity is exposure to carcinogens that may result in cancer twenty to thirty years after the time of the spill.
20
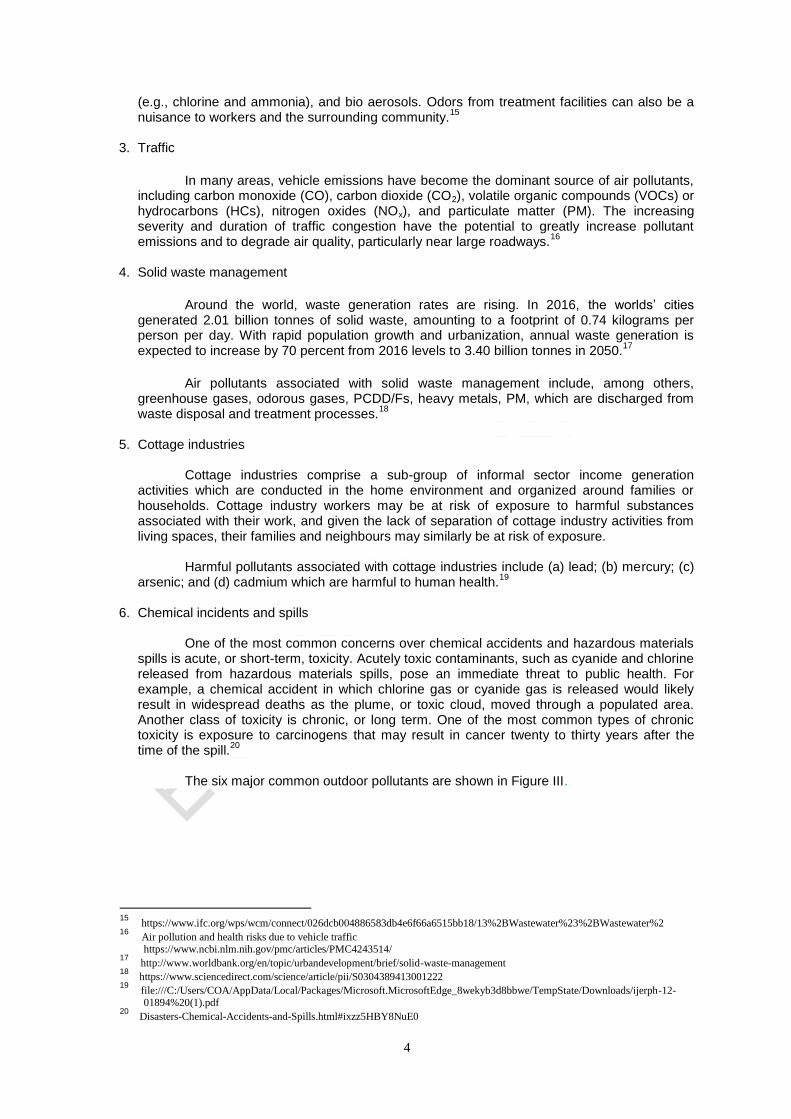
The six major common outdoor pollutants are shown in Figure III.
15
https://www.ifc.org/wps/wcm/connect/026dcb004886583db4e6f66a6515bb18/13%2BWastewater%23%2BWastewater%2 16
Air pollution and health risks due to vehicle traffic https://www.ncbi.nlm.nih.gov/pmc/articles/PMC4243514/ 17
http://www.worldbank.org/en/topic/urbandevelopment/brief/solid-waste-management 18
https://www.sciencedirect.com/science/article/pii/S0304389413001222 19 file:///C:/Users/COA/AppData/Local/Packages/Microsoft.MicrosoftEdge_8wekyb3d8bbwe/TempState/Downloads/ijerph-12-
01894%20(1).pdf 20
Disasters-Chemical-Accidents-and-Spills.html#ixzz5HBY8NuE0
5
Figure III -Six Common Outdoor Pollutants
1.3. Types and Sources of Air Pollutants
Air pollutants may be either emitted into the atmosphere (primary air pollutants) or formed within the atmosphere itself (secondary air pollutants). Apart from the physical state of pollutants (such as gaseous or particulate matter) it is important to consider the geographical location and distribution of sources. The local, urban, regional and global scale of air pollution can be distinguished, depending primarily on the atmospheric lifetime of specific air components.
21 Based on the origin/source, there are two types of common
pollutants, the primary and secondary air pollutants. These two are discussed below:
1.3.1. Primary Pollutants
Primary air pollutants are those that are emitted into the atmosphere from a source such as a factory chimney or exhaust pipe. In principle, therefore, it is possible to measure the amounts emitted at the source itself.
22 This is relatively straightforward in terms of the factory chimney;
it becomes very much more difficult when considering diffuse sources such as wind-blown dusts. When such sources are added together they comprise an emissions inventory of primary sources, as described below. Table 1 shows major primary pollutants produced by human activities.
23
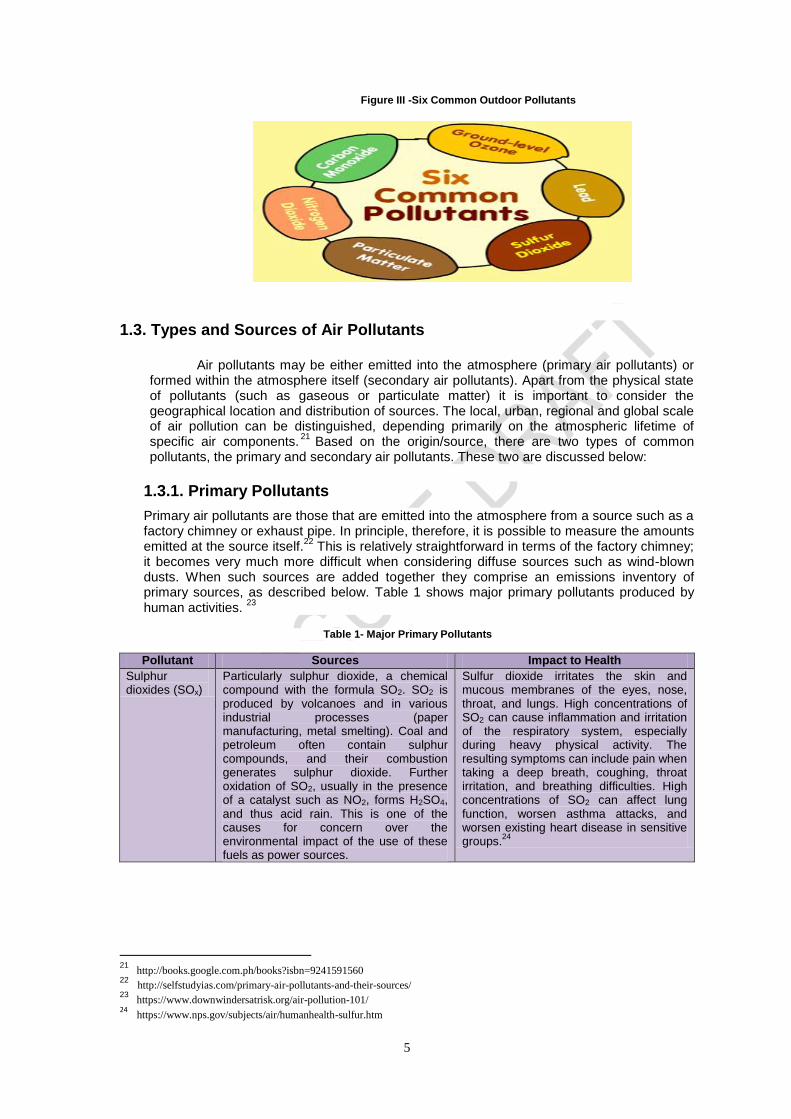
Table 1- Major Primary Pollutants
Pollutant Sources Impact to Health
Sulphur dioxides (SOx)
Particularly sulphur dioxide, a chemical compound with the formula SO2. SO2 is produced by volcanoes and in various industrial processes (paper manufacturing, metal smelting). Coal and petroleum often contain sulphur compounds, and their combustion generates sulphur dioxide. Further oxidation of SO2, usually in the presence of a catalyst such as NO2, forms H2SO4, and thus acid rain. This is one of the causes for concern over the environmental impact of the use of these fuels as power sources.
Sulfur dioxide irritates the skin and mucous membranes of the eyes, nose, throat, and lungs. High concentrations of SO2 can cause inflammation and irritation of the respiratory system, especially during heavy physical activity. The resulting symptoms can include pain when taking a deep breath, coughing, throat irritation, and breathing difficulties. High concentrations of SO2 can affect lung function, worsen asthma attacks, and worsen existing heart disease in sensitive groups.
24
21
http://books.google.com.ph/books?isbn=9241591560 22
http://selfstudyias.com/primary-air-pollutants-and-their-sources/ 23
https://www.downwindersatrisk.org/air-pollution-101/ 24 https://www.nps.gov/subjects/air/humanhealth-sulfur.htm

6
Pollutant Sources Impact to Health
Nitrogen oxides (NOx)
Nitrogen oxides, particularly nitrogen dioxide, are expelled from high temperature combustion, and are also produced during thunderstorms and very small amount from electric discharge. They can be seen as a brown haze dome above or a plume downwind of cities. Nitrogen dioxide is a chemical compound with the formula NO2. It is one of several nitrogen oxides. One of the most prominent air pollutants, this reddish-brown toxic gas has a characteristic sharp, biting odor. Burning of gasoline, natural gas, coal, oil. (Cars are a major source of Nox.)
Short-term exposures (e.g., less than 3 hours) to low levels of NO2 may lead to changes in airway responsiveness and lung function in individuals with preexisting respiratory illnesses. These exposures may also increase respiratory illnesses in children. Long-term exposures to NO2 may lead to increased susceptibility to respiratory infection and may cause irreversible alterations in lung structure.
25
Carbon monoxide (CO)
CO is a colorless, odorless, toxic yet non-irritating gas. It is a product of incomplete combustion of fuel such as natural gas, coal or wood. Vehicular exhaust is a major source of carbon monoxide. Burning of gasoline, natural gas, coal, oil
Exposure to elevated levels of CO may result in reduced ability of blood to bring oxygen to body cells and tissues that leads to (a) visual impairment; (b) reduced work capacity; (c) reduced manual dexterity; (d) poor learning ability; and (e) difficulty in performing complex tasks.
26
Volatile organic compounds (VOC)
VOCs are a well-known outdoor air pollutant. They are categorized as either methane (CH4) or non-methane (NMVOCs). Methane is an extremely efficient greenhouse gas which contributes to enhance global warming. Other hydrocarbon VOCs are also significant greenhouse gases because of their role in creating ozone and prolonging the life of methane in the atmosphere. This effect varies depending on local air quality. The aromatic NMVOCs benzene, toluene and xylene are suspected carcinogens and may lead to leukemia with prolonged exposure. 1,3-butadiene is another dangerous compound often associated with industrial use. Fuel combustion, solvents, paint (Cars are a major source of VOCs).
They have various effects, depending on their chemical compound. They may be associated with cancer, as well as adverse neurological, reproductive and developmental effects.
27
Particulates, alternatively referred to as particulate matter (PM)
PM are atmospheric particulate matter, or fine particles, are tiny particles of solid or liquid suspended in a gas. Some particulates occur naturally, originating from volcanoes, dust storms, forest and grassland fires, living vegetation, unpaved roads and sea spray. Human activities, such as the burning of fossil fuels in vehicles, power plants and various industrial processes also generate significant amounts of aerosols. More on particulate matter can be found in section 1.3.4 below.
Inhalation of these tiny particles has been linked with illness and death from heart and lung disease. Particles can aggravate respiratory conditions, such as eye, nose, and throat irritation, asthma and bronchitis, cancer, and have been associated with cardiac arrhythmias (heartbeat irregularities) and heart attacks.
28
Carbon dioxide (CO2)
This is by far the most emitted form of human caused air pollution. Although CO2 is currently only about 405 parts per million in earth's atmosphere, billions of metric tons of CO2 are emitted annually by
As the concentration CO2 in air rises it can cause headaches, dizziness, confusion and loss of consciousness.
29
25 https://www.e-education.psu.edu/egee102/node/1979 26
https://www.e-education.psu.edu/egee102/node/1952 27 https://breathe.ersjournals.com/content/breathe/1/2/108.full.pdf 28
https://www.e-education.psu.edu/egee102/node/1979 29
http://www.hse.gov.uk/carboncapture/carbondioxide.htm)
7
Pollutant Sources Impact to Health
burning of fossil fuels. CO2 increase in earth's atmosphere has been accelerating. Another common pollutant is Benzol[a]pyrene (BaP) coming from incomplete combustion of fossil fuels and bio-fuels.
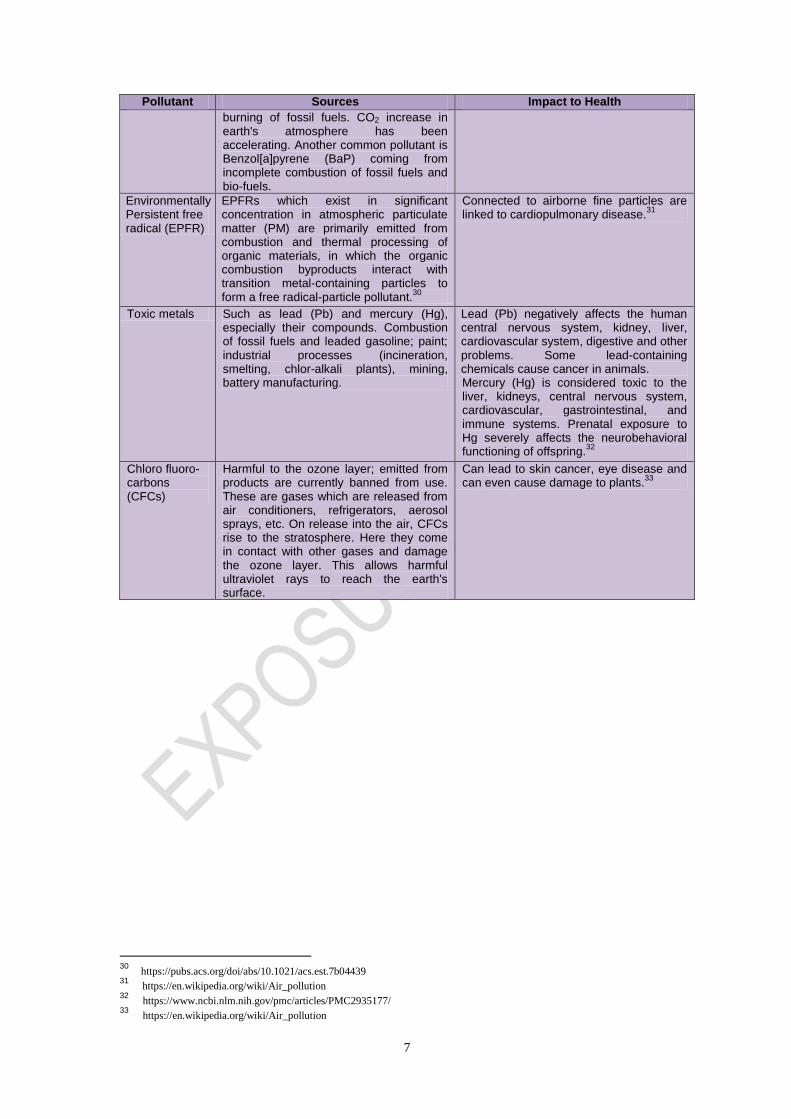
Environmentally Persistent free radical (EPFR)
EPFRs which exist in significant concentration in atmospheric particulate matter (PM) are primarily emitted from combustion and thermal processing of organic materials, in which the organic combustion byproducts interact with transition metal-containing particles to form a free radical-particle pollutant.
30
Connected to airborne fine particles are linked to cardiopulmonary disease.
31
Toxic metals Such as lead (Pb) and mercury (Hg), especially their compounds. Combustion of fossil fuels and leaded gasoline; paint; industrial processes (incineration, smelting, chlor-alkali plants), mining, battery manufacturing.
Lead (Pb) negatively affects the human central nervous system, kidney, liver, cardiovascular system, digestive and other problems. Some lead-containing chemicals cause cancer in animals. Mercury (Hg) is considered toxic to the liver, kidneys, central nervous system, cardiovascular, gastrointestinal, and immune systems. Prenatal exposure to Hg severely affects the neurobehavioral functioning of offspring.
32
Chloro fluoro-carbons (CFCs)
Harmful to the ozone layer; emitted from products are currently banned from use. These are gases which are released from air conditioners, refrigerators, aerosol sprays, etc. On release into the air, CFCs rise to the stratosphere. Here they come in contact with other gases and damage the ozone layer. This allows harmful ultraviolet rays to reach the earth's surface.
Can lead to skin cancer, eye disease and can even cause damage to plants.
33
30
https://pubs.acs.org/doi/abs/10.1021/acs.est.7b04439 31
https://en.wikipedia.org/wiki/Air_pollution 32
https://www.ncbi.nlm.nih.gov/pmc/articles/PMC2935177/ 33
https://en.wikipedia.org/wiki/Air_pollution
8
Pollutant Sources Impact to Health
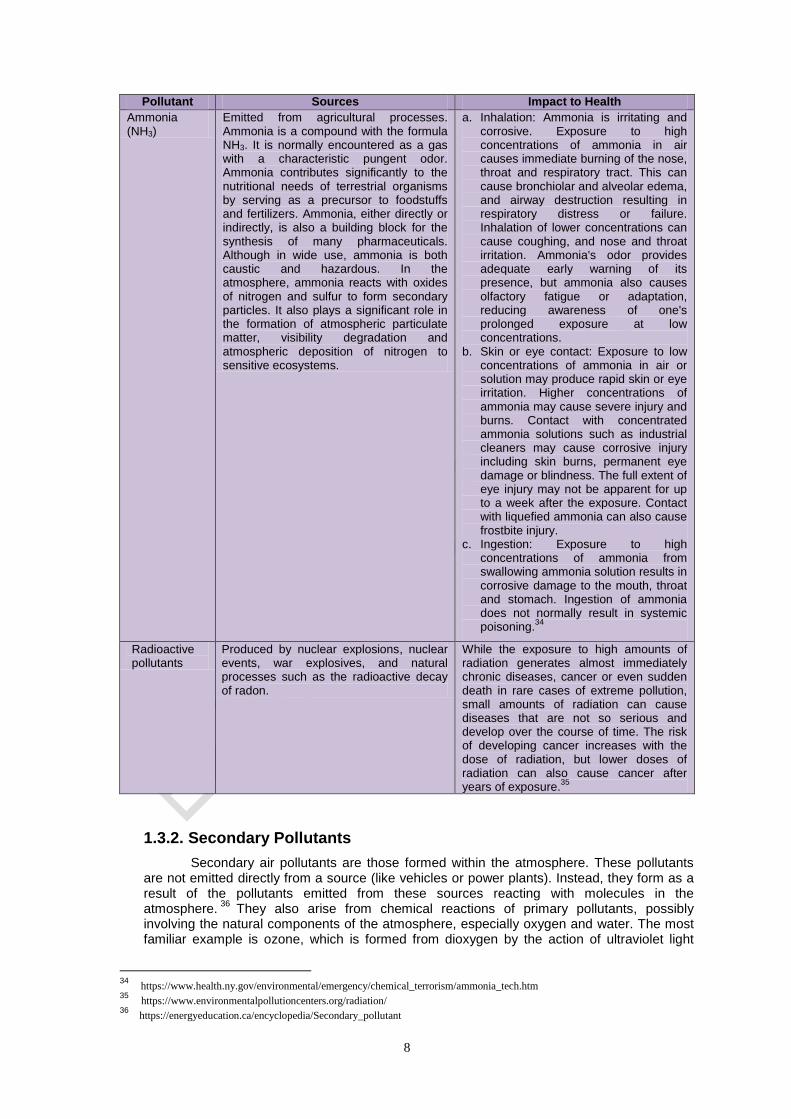
Ammonia (NH3)
Emitted from agricultural processes. Ammonia is a compound with the formula NH3. It is normally encountered as a gas with a characteristic pungent odor. Ammonia contributes significantly to the nutritional needs of terrestrial organisms by serving as a precursor to foodstuffs and fertilizers. Ammonia, either directly or indirectly, is also a building block for the synthesis of many pharmaceuticals. Although in wide use, ammonia is both caustic and hazardous. In the atmosphere, ammonia reacts with oxides of nitrogen and sulfur to form secondary particles. It also plays a significant role in the formation of atmospheric particulate matter, visibility degradation and atmospheric deposition of nitrogen to sensitive ecosystems.
a. Inhalation: Ammonia is irritating and corrosive. Exposure to high concentrations of ammonia in air causes immediate burning of the nose, throat and respiratory tract. This can cause bronchiolar and alveolar edema, and airway destruction resulting in respiratory distress or failure. Inhalation of lower concentrations can cause coughing, and nose and throat irritation. Ammonia's odor provides adequate early warning of its presence, but ammonia also causes olfactory fatigue or adaptation, reducing awareness of one's prolonged exposure at low concentrations.
b. Skin or eye contact: Exposure to low concentrations of ammonia in air or solution may produce rapid skin or eye irritation. Higher concentrations of ammonia may cause severe injury and burns. Contact with concentrated ammonia solutions such as industrial cleaners may cause corrosive injury including skin burns, permanent eye damage or blindness. The full extent of eye injury may not be apparent for up to a week after the exposure. Contact with liquefied ammonia can also cause frostbite injury.
c. Ingestion: Exposure to high concentrations of ammonia from swallowing ammonia solution results in corrosive damage to the mouth, throat and stomach. Ingestion of ammonia does not normally result in systemic poisoning.
34
Radioactive pollutants
Produced by nuclear explosions, nuclear events, war explosives, and natural processes such as the radioactive decay of radon.
While the exposure to high amounts of radiation generates almost immediately chronic diseases, cancer or even sudden death in rare cases of extreme pollution, small amounts of radiation can cause diseases that are not so serious and develop over the course of time. The risk of developing cancer increases with the dose of radiation, but lower doses of radiation can also cause cancer after years of exposure.
35
1.3.2. Secondary Pollutants
Secondary air pollutants are those formed within the atmosphere. These pollutants are not emitted directly from a source (like vehicles or power plants). Instead, they form as a result of the pollutants emitted from these sources reacting with molecules in the atmosphere.
36 They also arise from chemical reactions of primary pollutants, possibly
involving the natural components of the atmosphere, especially oxygen and water. The most familiar example is ozone, which is formed from dioxygen by the action of ultraviolet light
34 https://www.health.ny.gov/environmental/emergency/chemical_terrorism/ammonia_tech.htm 35
https://www.environmentalpollutioncenters.org/radiation/ 36
https://energyeducation.ca/encyclopedia/Secondary_pollutant

9
(UV) and electrical discharges within the Earth's atmosphere.37
Because of this mode of formation, secondary pollutants cannot readily be included in emissions inventories, although it is possible to estimate formation rates per unit volume of atmosphere per unit time. The sources of secondary pollutants are described in Table 2.
Table 2 – Sources of Secondary Pollutants
Pollutants Sources Health Effects
Smog
Classic smog results from large amounts of coal burning in an area caused by a mixture of smoke and sulphur dioxide. Modern smog does not usually come from coal but from vehicular and industrial emissions that are acted on in the atmosphere by ultraviolet light from the sun to form secondary pollutants that also combine with the primary emissions to form photochemical smog.
Coughing and throat or chest irritation: High levels of ozone can irritate your respiratory system, generally lasting for a few hours after you‘ve been exposed to smog. However, ozone can continue to harm your lungs even after symptoms disappear.
Exposure to high levels of ozone from smog can trigger asthma attacks.
Smog can make it feel difficult to breathe deeply, especially during exercise, according to the Mayo Clinic. This is because of the effects of ozone on lung function.
38
Ground level ozone (O3) formed from NOx and VOCs
Ground level Ozone (O3) is a key constituent of the troposphere. It is a colorless and highly irritating gas formed just above earth‘s surface. Photochemical and chemical reactions involving NOx and VOCs emitted from both natural and man-made sources.
It may cause eye irritation, stuffy nose, can irritate the respiratory tract, induces severe coughing, shortness of breath, asthma, and lung irritation, leads to greater susceptibility to respiratory illnesses, such as bronchitis and pneumonia.
39 It also reduces
resistance to colds and infections and premature aging of lung tissue.
Peroxyacetyl nitrate (PAN)
Similarly formed from NOx and VOCs. PANs have many adverse effects in the human body such as reduced respiratory function and eye irritation, and may also be linked to emphysema, impaired breathing and other lung problems.
40
Types of pollutants could also be classified based on the state of matter. The pollutants could be classified into two major types, gaseous air pollutants and particulate air pollutants. These two are discussed below:
1.3.3. Gaseous air pollutants
Gaseous air pollutants are those present as gases or vapours, i.e. as individual small molecules capable of passing through filters provided they do not absorb to or chemically react with the filter medium. Gaseous air pollutants are readily taken into the human respiratory
37
https://en.wikipedia.org/wiki/Ozone 38
https://www.healthline.com/health/dangers-smog-what-you-need-know-about-air-pollution#what-is-smog 39
https://breathe.ersjournals.com/content/breathe/1/2/108.full.pdf 40
https://energyeducation.ca/encyclopedia/Peroxyacyl_nitrate

10
system, although if water-soluble they may very quickly be deposited in the upper respiratory tract and not penetrate to the deep lung. The following are samples of gaseous air pollutants.
41
1.3.4. Particulate air pollutants
Particulate matter, sometimes called particle pollution or simply PM, is a term that refers to a mixture of solid particles and liquid droplets that can be found in the air. They are classified as pollutants and there are several different sizes of particulate matter. Some particulate matter, such as dust, dirt, soot, coal ash, and smoke are large enough to be seen with the naked eye. Particulate matter can also be extremely small, therefore, can only be seen with high-powered microscopes. As well as containing acids, particulate matter can contain hazardous elements such as arsenic, beryllium, cadmium, chromium, lead, manganese, and nickel.
42
Particulate matter can fall into several different categories depending on their size. These categories include inhalable coarse particles (PM10) that are between 2.5 and 10 micrometers in diameter and fine particles (PM2.5) with diameters of less than 2.5 micrometers. In addition, particulate matter can be separated into two (2) categories:
43
a. primary particulate matter: PM that is emitted directly from sources such as power plants;
and b. secondary particulate matter: PM that is formed by chemical reactions in the atmosphere.
1.4. Sources of Major Air Pollutants
Air pollutants from various sources, through their emissions, contribute to air pollution which ultimately affects the environment. Table 3 below shows the common atmospheric pollution sources.
44
Table 3 – Sources of Common Atmospheric Pollution
41
http://www.euro.who.int/__data/assets/pdf_file/0005/78638/E90038.pdf 42
https://energyeducation.ca/encyclopedia/Particulate_matter 43
Ibid. 44
http://edugreen.teri.res.in/explore/air/health.htm
Category Source Emitting Pollutants
Agriculture Open burning Suspended particulate matter, carbon monoxide, volatile organic compounds
Mining and quarrying Coal mining; crude oil and gas production; stone quarrying
Suspended particulate matter, sulphur dioxide, oxides of nitrogen, volatile organic compounds
Power generation Electricity; gas; steam Suspended particulate matter, sulphur dioxide, oxides of nitrogen, carbon monoxide, volatile organic compounds, sulphur trioxide, lead
Transport Combustion engines Suspended particulate matter, sulphur dioxide, oxides of nitrogen, carbon monoxide, volatile organic compounds, lead
Community service Municipal incinerators Suspended particulate matter, sulphur dioxide, oxides of nitrogen, carbon monoxide, volatile organic compounds, lead

11
Presented in Figure IV is the share of the different air pollutants sources in United States of America based on National Emissions Inventory Report made by U.S Government in 2014.
Figure IV – Sources of Major Air Pollutants
With regard to the level of pollution on various countries/places, shown in Figure V
is a map showing an example of real-time air quality for more than 10,000 stations in the world, the World's Air Pollution: Real-time Air Quality Index.
45
Figure V. World's Air Pollution: Real-time Air Quality Index, March 2019
45
World’s Air Pollution: Real-time Air Quality Index could be accessed at: https://waqi.info/

12
The Air Quality Index is based on measurement of particulate matter (PM2.5 and
PM10), Ozone (O3), Nitrogen Dioxide (NO2), Sulphur Dioxide (SO2) and Carbon Monoxide (CO) emissions. Most of the stations on the map are monitoring both PM2.5 and PM10 data, but there are few exceptions where only PM10 is available. All measurements are based on hourly readings: For instance, an AQI reported at 8AM means that the measurement was done from 7AM to 8AM. The map shows the air quality of the places included therein.
Presented in Table 4 is the Air Quality Index scale as defined by the US- Environmental Protection Agency (EPA) 2016 standard.
46
Table 4- Air Quality Index Scale
AQI Air Pollution Level Health Implications
0 - 50 Good Air quality is considered satisfactory, and air pollution poses little or no risk
51 -100 Moderate Air quality is acceptable; however, for some pollutants there may be a moderate health concern for a very small number of people who are unusually sensitive to air pollution.
101-150 Unhealthy for Sensitive Groups
Members of sensitive groups may experience health effects. The general public is not likely to be affected.
151-200 Unhealthy Everyone may begin to experience health effects; members of sensitive groups may experience more serious health effects
201-300 Very Unhealthy Health warnings of emergency conditions. The entire population is more likely to be affected.
300+ Hazardous Health alert: everyone may experience more serious health effects
1.5. Who Are Vulnerable to Air Pollution
Everyone can be affected by air pollution especially when exposed over prolonged periods of time. However, some groups of people may be more susceptible than others in regards to exposure to air pollution. Different pollutants may affect these groups differently.
The following people are more likely to be affected:
a. People with asthma: exposure to air pollution might worsen symptoms or trigger asthma attacks.
b. People with lung disease such as chronic bronchitis (also called chronic obstructive pulmonary disease or COPD): exposure to air pollution might worsen the symptoms.
c. People with cardiovascular (heart) disease: exposure to air pollution might induce symptoms such as palpitations, chest pain or shortness of breath.
People can be more susceptible to some type of air pollution in certain life stages:
a. Unborn babies (pregnant women): exposure to high levels of air pollution over longer time periods (i.e. weeks to months) may be linked to adverse pregnancy outcomes such as reduced birth weight or preterm birth.
b. Children are likely to be more vulnerable to exposure to air pollution compared to adults for the following reasons:
47
Their lungs are still growing and developing.
Their immune and metabolic systems are still developing.
They suffer from frequent respiratory infections.
They are more active outdoors than adults and therefore breathe in higher doses of outdoor pollutant.
46
https://aqicn.org/contact/ 47
https://www.who.int/ceh/capacity/respiratory.pdf?ua=1)

13
Some children are especially vulnerable. This includes children with underlying chronic lung conditions such as asthma and cystic fibrosis.
c. Older adults: Older people are more likely to be affected by air pollution, perhaps due to
generally weaker immune systems, or undiagnosed respiratory or cardiovascular health
conditions. As people age, their bodies are less able to compensate for the effects of
environmental hazards. Air pollution can aggravate heart disease and stroke, lung
diseases such as chronic bronchitis (also called chronic obstructive pulmonary disease or
COPD) and asthma.48
d. Adults who work or exercise outdoors for extended periods of time are also vulnerable
to the effects of air pollution.49
Figure VI. People Vulnerable to Air Pollution
Air pollution levels are rising in many of the world‘s poorest cities. More than 80 percent of people living in urban areas that monitor air pollution are exposed to air quality levels that exceed WHO limit.
50 WHO reported that most cities with low to medium income
exceeded the annual mean of WHO Air Quality Guidelines (PM2.5 = 10 μg/m³ and PM10 = 20
μg/m³).While all regions of the world are affected, populations in low-income cities are the most impacted. When dirty air blankets our cities the most vulnerable urban populations—the youngest, oldest and poorest - are the most impacted.
51
According to the latest urban air quality database, 98 percent of cities in low- and
middle income countries with more than 100,000 inhabitants do not meet WHO air quality
guidelines. However, in high-income countries, that percentage decreases to 56 percent.52
1.6. Effects/Impact of Air Pollution on Health53
According to the WHO, air pollution is linked to approximately seven million premature deaths annually due to exposure from both outdoor and household air pollution. This makes it the world‘s largest environmental health risk, comparable with ―traditional‖ health risks such as smoking, high cholesterol, high blood sugar and obesity. Figure VII below shows that most air pollution-related deaths are from heart disease and stroke, followed by chronic obstructive pulmonary disease, acute and chronic respiratory conditions and cancers.
Figure VII– Air Pollution Related Deaths
48
https://www.health.nsw.gov.au/environment/air/Pages/who-is-affected.aspx 49 https://www.ourair.org/apcd/air-pollutants-and-health/ 50
https://www.who.int/airpollution/data/cities-2016/en/). 51 https://www.who.int/news-room/detail/12-05-2016-air-pollution-levels-rising-in-many-of-the-world-s-poorest-cities)
52 https://www.who.int/phe/health_topics/outdoorair/databases/cities/en/)
53 http://www.who.int/news-room/detail/02-05-2018-9-out-of-10-people-worldwide-breathe-polluted-air-but-more-countries-are-
taking-action

14
Figure VIII below shows that ambient (outdoor) air pollution alone caused some 4.2 million deaths in 2016 due to exposure to small particulate matter of 2.5 microns or less in diameter (PM2.5), which cause cardiovascular and respiratory disease, and cancers. On the other hand, household (indoor) air pollution from cooking with polluting fuels and technologies caused an estimated 3.8 million deaths in the same period.
Figure VIII- Deaths due to Household Air Pollution, 2016
From figure IX it can be seen that more than 90 percent of air pollution-related deaths occur in low and middle-income countries, mainly in Asia and Africa, followed by low and middle-income countries of the Eastern Mediterranean region, Europe and the Americas.
Figure IX- Air Pollution Related Deaths by Continent

15
1.7. Financial Risks Related to Air Pollution and Human Health54
Based on the joint report of the World Bank and Institute for Health Metrics and
Evaluation 2016 entitled ―The Cost of Air Pollution: Strengthening the Economic Case for Action‖, one of the top risks leading to early death worldwide, air pollution is responsible for more than $5.11 trillion in welfare losses in 2013.
The economic costs of air pollution have increased significantly over time, a reflection
of the growing challenge of pollution. From figure X it can be seen that between 1990 and 2013, total welfare losses due to premature mortality from exposure to air pollution increased by 94 percent. Welfare losses in East Asia and the Pacific countries more than quintupled between 1990 and 2013, climbing to $2.306 trillion. Losses in South Asia reached $604 billion, an increase of 347 percent. North America and Europe and Central Asia were the only regions to see declines in welfare losses from air pollution since 1990, although the Middle East and North Africa saw a decline in the welfare losses from household air pollution over this period. The burden of largest loss also shifted between 1990 and 2013, from Europe and Central Asia to the East Asia and the Pacific region.
Figure X - Total Welfare Losses from Air Pollution, by Region: 1990–2013
54
World Bank and Institute for Health Metrics and Evaluation. 2016. The Cost of Air Pollution:
Strengthening the Economic Case for Action. Washington, DC: World Bank. License: Creative
Commons Attribution CC BY 3.0 IGO

16
These losses represent the cost stemming from premature mortality caused by exposure to ambient fine particulate matter (PM2.5), household air pollution from cooking with solid fuels, and ambient ozone. According to WHO, reducing the annual average of PM2.5 concentrations from level 35 μg/m³ to 10 μg/m³ could reduce air pollution-related deaths by around 15%. Despite having PM2.5 concentration complied with WHO guidelines, European Union cities have average life expectancy of 8.6 lower than it would otherwise be. Thus, it is important to pay more attention to PM2.5 concentration compare to other pollutants. Figure XI shows that the magnitude of losses is greatest in East Asia and the Pacific, where premature mortality costs reached the equivalent of 7.5 percent of GDP in 2013, closely followed by South Asia, where costs were on the order of 7.4 percent of GDP equivalent.
Figure XI - Welfare Losses Due to Air Pollution by Region, 2013
By comparison, in North America welfare losses were three percent of GDP equivalent in 2013. Losses were even lower in Latin America and the Caribbean and in the Middle East and North Africa. Although the majority of welfare losses in South Asia and Sub-Saharan Africa were caused by indoor air pollution, in all other regions losses were driven by ambient air pollution, mainly PM2.5. Losses from ambient ozone represent the smallest share of the premature mortality costs of air pollution. As a percentage of GDP equivalents, ozone-associated losses in South Asia were roughly equivalent to those in North America. Premature mortality risks and GDP equivalent welfare losses from air pollution are highest for the middle-income countries (lower and upper).
Figure XII - Welfare Losses Due to Air Pollution by Income Group, 2013
20 05 201
Welfare losses from ambient air pollution are highest in high-income non-OECD countries, followed by upper middle income, while those driven by household air pollution are the highest in lower-middle-income countries followed by low-income countries. In 2013, welfare losses in low- and middle-income countries accounted for 59 percent of the global total. Higher overall exposure, risks, and losses among middle-income countries are driven in large part by trends in India and China.

17
Over time, more of the health burden and costs of air pollution have shifted from the high income countries to the middle-income countries. From 1990 to 2013, welfare losses increased for countries at all income levels other than the OECD countries, which saw a small decline. These losses increased by 130 percent and 133 percent for lower- and upper-middle-income countries, respectively, excluding India and China, which saw even greater increases. The countries that experienced the greatest increases in welfare losses from ambient air pollution include many of the fastest-growing, fastest-urbanizing ones.
Conclusion
Air pollution that comes from natural and human-related (anthropogenic) sources
affects the country‘s economy and the health of every individual. Thus, air pollution abatement should be one of the national priorities. According to Dr. Tedros Adhanom Ghebreyesus, Director-General of WHO,
55 ―Air pollution threatens us all, but the poorest and most
marginalized people bear the brunt of the burden. It is unacceptable that over 3 billion people – most of them women and children – are still breathing deadly smoke every day from using polluting stoves and fuels in their homes. If we don‘t take urgent action on air pollution, we will never come close to achieving sustainable development.
55
http://www.who.int/news-room/detail/02-05-2018-9-out-of-10-people-worldwide-breathe-polluted-air-but-more-countries-are-
taking-actionSour

18
Chapter II: ROLE OF GOVERNMENTS IN RESPONDING TO AIR POLLUTION AND ITS EFFECTS RELATED TO HEALTH
2.1. Overview
Since air pollution affects the environment and the people, government is facing economic burden of air quality related health impact on people in terms of health costs and challenges in enhancing aggressive responses to the adverse health effects of air pollution. The government has to continuously monitor the state of environment through proper monitoring systems.
This chapter will identify the different kinds of risks to governments on environmental
health related to air pollution and the extent/degree of the effects of such risks. Economic World Forum reported that the 20 most polluted cities in the world (with the
highest annual mean of PM10 particulate concentration)56
are mostly located in Asian and African countries. To give a better illustration on how air pollution is a major problem in many cities in the world, Figure XIII below shows annual mean values of PM10 concentration (air pollutants) in 11 different cities.
57
Figure XIII - PM10 Particulate Concentration (Air Pollutants), μg/m3,
Annual Mean
In this research paper, we use five countries from three different regions as samples to illustrate how Governments deal with air pollution in those countries. This countries selection was based on the availability of data and the regional distribution. The countries are Brazil, China, Mexico, Thailand, and Philippines. Figure XIV below presents brief profile of air pollution the five sampled countries.
56 WHO Air quality guidelines for particulate matter, ozone, nitrogen dioxide and sulfur dioxide - Global update 2005 - Summary of risk
assessment 57 Ibid.

19
Figure XIV - Air Pollution in Five Sampled Countries
Brazil The country of Brazil has a high urbanization rate, with around 80 percent of Brazilians living in urban areas. This creates significant social and environmental issues in and around this city. Sao Paulo metropolitan region, which consists of 39 municipalities and 10% of Brazil's population (about 17 million people), is South America's largest metropolitan region and one of the world‘s largest urban areas and well known for pollution, overcrowding and poverty.
58 The World Health Organization (WHO) has set a
limit for average outdoor ambient air pollution of 10 μg/m³ (particulates less than 2.5 thousandths of a millimetre across). However, in urban areas, the level of pollution maybe twice of the target, for example 22 μg/m³measured in May 2015 in Sao Paulo. Generally, air quality in Brazilian cities is reasonably good, although about 7,000 lives could be saved by reducing maximum outdoor PM2.5 exposure to 15 μg/m³, the WHO third interim target.
China The war against air pollution of China is part of a broader reckoning with the health and environmental
catastrophe brought by rapid industrialization over the past few decades. Smog hangs heavy over Beijing, Shanghai and Hong Kong, where children grow up with asthma and other respiratory illnesses. Of particular concern is PM2.5 (particles with an aerodynamic diameter less than 2.5 μm) air pollution. In Beijing, Shanghai, Guangzhou and Xi‘an, PM2.5 concentration levels in all four cities exceed WHO air quality guidelines.
59
Mexico
The city‘s population and location contributed to the bad air pollution problem of Mexico City in Mexico. Mexico City is located in the crater of an extinct volcano and about 2,240 metres above sea level. Nearly 20 million people live in Mexico City and it‘s the second most populated city in the world. The lower atmospheric oxygen levels at this altitude cause incomplete fuel combustion in engines and higher emissions of carbon monoxide and other compounds. Intense sunlight turns these into higher than normal smog levels. In turn, the smog prevents the sun from heating the atmosphere enough to penetrate the inversion layer blanketing the city.
60
Thailand
Every year between February and April, dry-season aridity and rising temperatures coincide with forest fires, agricultural burning, and other sources of pollution to blanket Northern Thailand in a layer of smoke
and haze. Thailand is also experiencing high ozone (O3) pollution because of the intense emission of air pollution coupled with year-round sunlight. Even in the rural areas, forest fires and agricultural burning have contributed to high levels of air pollution, which have increased to critical levels since 2016. The expansion of petrochemical plants and industries rose sharply, which however, greatly contribute to air pollution.
61
Philippines
Manila in the Philippines suffers from air pollution due to industrial waste and automobiles, affecting 98% of the population. Annually, the air pollution causes more than 4,000 deaths. Ermita is Manila's most air polluted district due to open dump sites and industrial waste. The air quality problems in the Philippines arise principally from domestic sources.
62 According to WHO, the safe level for PM2.5 is
10 micrograms per cubic meter (μg/m3) of air in a year. In Manila, the annual average of these pollutants is at 17 μg/m3, this is 70 percent more than the recommended safe level.
2.2. Government policies to reduce and combat air pollution and its health impact
58
Wikipedia: Air Pollution in Brazil. Reuters: https://www.reuters.com/article/us-mexico-pollution-idUSKCN0WI35E 59
The Beam: https://medium.com/thebeammagazine/how-china-is-tackling-their-air-pollution-epidemic b878f0dae2b0 60
www.idrc.ca/en/stories/taking-control-air-pollution-mexico-city 61
Wikipedia:https://en.wikipedia.org/wiki/Environmental_issues_in_Thailand 62
Air Pollution Control Policy Options for Metro Manila https://ageconsearch.umn.edu/bitstream/10612/1/dp030030.pdf
20
Laws and regulation plays an important part to control pollution. Government of different countries adopt air pollution control laws and regulatory efforts to identify and categorize different air pollutants; stationary and mobile sources that contribute to air pollution; setting acceptable and implementable limits on pollution discharge as well as improving mitigation measures and treatment technologies. Government entities not only propose guidelines and emission standards but also strictly regulate their implementation.
63 With regard to air pollution
governance, governments may refer to WHO guidelines values as a key basis for air quality policies.
The policies in the five sampled countries to reduce and combat air pollution and its health impact to the environment are enumerated/ summarized in Figure XV.
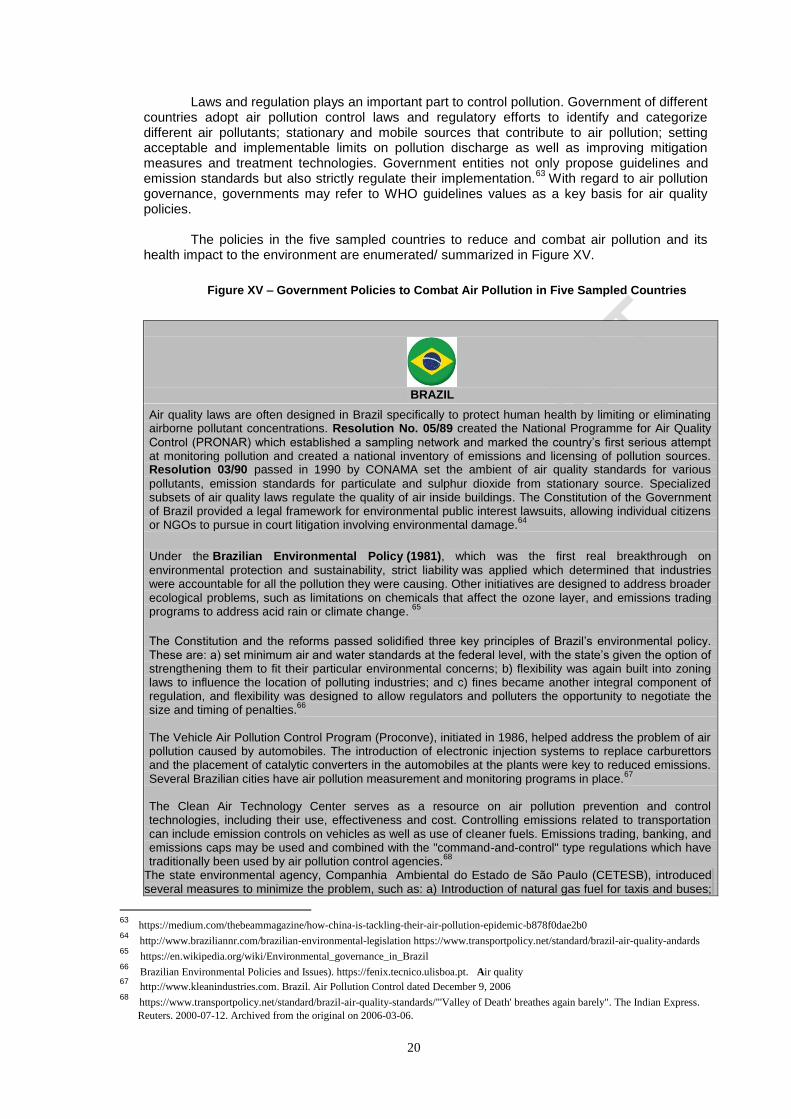
Figure XV – Government Policies to Combat Air Pollution in Five Sampled Countries
BRAZIL
Air quality laws are often designed in Brazil specifically to protect human health by limiting or eliminating airborne pollutant concentrations. Resolution No. 05/89 created the National Programme for Air Quality
Control (PRONAR) which established a sampling network and marked the country‘s first serious attempt at monitoring pollution and created a national inventory of emissions and licensing of pollution sources. Resolution 03/90 passed in 1990 by CONAMA set the ambient of air quality standards for various
pollutants, emission standards for particulate and sulphur dioxide from stationary source. Specialized subsets of air quality laws regulate the quality of air inside buildings. The Constitution of the Government of Brazil provided a legal framework for environmental public interest lawsuits, allowing individual citizens or NGOs to pursue in court litigation involving environmental damage.
64
Under the Brazilian Environmental Policy (1981), which was the first real breakthrough on
environmental protection and sustainability, strict liability was applied which determined that industries were accountable for all the pollution they were causing. Other initiatives are designed to address broader ecological problems, such as limitations on chemicals that affect the ozone layer, and emissions trading programs to address acid rain or climate change.
65
The Constitution and the reforms passed solidified three key principles of Brazil‘s environmental policy. These are: a) set minimum air and water standards at the federal level, with the state‘s given the option of strengthening them to fit their particular environmental concerns; b) flexibility was again built into zoning laws to influence the location of polluting industries; and c) fines became another integral component of regulation, and flexibility was designed to allow regulators and polluters the opportunity to negotiate the size and timing of penalties.
66
The Vehicle Air Pollution Control Program (Proconve), initiated in 1986, helped address the problem of air pollution caused by automobiles. The introduction of electronic injection systems to replace carburettors and the placement of catalytic converters in the automobiles at the plants were key to reduced emissions. Several Brazilian cities have air pollution measurement and monitoring programs in place.
67
The Clean Air Technology Center serves as a resource on air pollution prevention and control technologies, including their use, effectiveness and cost. Controlling emissions related to transportation can include emission controls on vehicles as well as use of cleaner fuels. Emissions trading, banking, and emissions caps may be used and combined with the "command-and-control" type regulations which have traditionally been used by air pollution control agencies.
68
The state environmental agency, Companhia Ambiental do Estado de São Paulo (CETESB), introduced several measures to minimize the problem, such as: a) Introduction of natural gas fuel for taxis and buses;
63
https://medium.com/thebeammagazine/how-china-is-tackling-their-air-pollution-epidemic-b878f0dae2b0 64 http://www.braziliannr.com/brazilian-environmental-legislation https://www.transportpolicy.net/standard/brazil-air-quality-andards 65 https://en.wikipedia.org/wiki/Environmental_governance_in_Brazil 66
Brazilian Environmental Policies and Issues). https://fenix.tecnico.ulisboa.pt. Air quality 67
http://www.kleanindustries.com. Brazil. Air Pollution Control dated December 9, 2006 68
https://www.transportpolicy.net/standard/brazil-air-quality-standards/"'Valley of Death' breathes again barely". The Indian Express.
Reuters. 2000-07-12. Archived from the original on 2006-03-06.

21
b) Increased controls of large black gas generators (Pingelmann scale); c) Black smoke emission controls by owners of bus and truck fleets; d) Certification requirements for noise emission by cars, truck, buses and motorcycles since 1993; e) Restriction of automobile traffic once a week in the metropolitan region; f) Introduction of environmental parameters in public transportation bids; and g) Attractive financing was also offered to the low pollution public transportation system (ex. Electric transportation).
69
Moreover, cooking in households using firewood breaths air with an average concentration of PM2.5 of 115-265 μg/m³, 11 to 26 times more than the WHO recommended level. Replacing open fires and traditional stoves with improved, well maintained cook stoves with chimneys that vent to the outsides reduces this exposure over half
70
CHINA
The laws enacted and issued by China to combat air pollution are: Third Chinese Constitution with inclusion of an Environmental Commission passed in 1978 and the Environmental Protection Law (EPL) on a trial basis enacted in 1979. Ten years after, the Environmental Protection Law on a final basis was issued but again amended in 2014. Since 1989, there are already 30 laws subsequently issued, like the Law on the Prevention and Control of Atmospheric Pollution.
71
The Chinese Government implemented/employed strategies to improve air quality. These are: a) Promote the use of integrated air quality; b) Regional multi-pollutant air quality management strategies; c) Develop frameworks and technical capacities to adopt effective emissions reduction strategies, such as emissions control and trading mechanisms; and d) Develop sulphur dioxide emissions cap and trading mechanisms.
72
Measurements by Beijing Municipal Government in January 2013 showed that highest recorded level of PM2.5 (particulate matter smaller than 2.5 micrometers in size), was at nearly 1,000 μg per cubic meter.PM2.5, consisting of K
+, Ca
2+, NO3
−, and SO4
2-, had the most fearful impact on people‘s health in
Beijing throughout the year, especially in cold seasons. Sulphur dioxide emission peaked at 2006, after which it began to decline by 10.4% in 2008 compared to 2006. This was accompanied by improvements on related phenomenon such as lower frequency of acid rainfall. The adoption by power plants of flue-gas desulfurization technology was likely the main reason for reduced SO2 emissions.
73
By January 2013 the pollution had worsened with official Beijing data showing an average AQI over 300 and readings of up to 700 at individual recording stations while the US Embassy recorded over 755 on 1 January and 800 by 12 January 2013. On 21 October 2013, record smog closed the Harbin Airport along with all schools in the area. Daily particulate levels of more than 50 times the World Health Organization recommended daily level were reported in parts of the municipality. In 2016, Beijing's yearly-average PM2.5 was 73 μg/m
3, this is 9.9% improvement compared to 2015. In
total, 39 severely polluted days were recorded, 5 fewer compared to 2015.
Eastern China, especially Beijing, is notorious for its smog, driven by the country‘s rapid industrialization. On Friday Beijing issued an orasmog alert, the second highest danger level. By Monday, levels of PM2.5 – pollution consisting of tiny particles 2.5 micro metres across or less – were up to 158 micrograms per cubic meter. Similarly high levels triggered orange alerts in Tianjin and some cities in Henan, Hebei, Shandong and Shanxi provinces.
74
MEXICO
69
http://www.kleanindustries.com. Brazil. Air Pollution Control dated December 9, 2006 70 Brazil’s Perspective: Air Pollution) (https:www.copenhagenconsensus.com/publication/brazil-perspectives-air-pollution 71
Regulation of Air Pollution: China https://www.loc.gov/law/help/air-pollution/china.php 72
EPA Collaboration with China. EPA Wave Archive-January 19, 2017
https://www.epa.gov/international-cooperation/epa-collaboration-china 73 https://en.wikipedia.org/wiki/Pollution in China. Pollution in China 74
https://www.newscientist.com/article/chinas-dreadful-air-pollution-seems-got-bit-better

22
Back in 2002, Mexico City air quality exceeded the local standards for ozone (110 ppb for 1 h) for most days of the year
75. It also has a high ambient levels of particulate matter (PM10), with concentrations at
most monitoring stations exceed the annual average standard of 50 μg /m3
. Under Mexican environmental law, all sources of air pollution are regulated. The General Law on Ecological Equilibrium and Environmental Protection is the primary environmental law governing Mexico, whereby the Federal Congress can grant federal, state and municipal leaders the authority to regulate protection of the environment, as well as presentation and restoration of the ecological balance within their jurisdiction. Under this law, a variety of regulations have been formed governing air pollution, among others.
76
The Law for the Prevention and Control of Atmospheric Contamination (The Air Regulations) became effective as of November 26, 1988. It covers environmental protection, natural resources conservation, environmental impact statements, risk determination, ecological zoning, and sanctions. The air, among others, is covered by this law.
77
New Mobility Law for Mexico City, announced in 2014, laid the foundations for a new regulatory body for mass transit corridors and transport operators and introduced the concept of mobility impact assessments, to be implemented cooperatively by the city‘s housing and mobility departments. The Mexican Government formulated the policy on Short-Lived Climate Pollutant (SLCP) reductions in its Intended Nationally Determined Contributions (INDCs). The SLCP was the commitments made under the United Nations Framework Convention on Climate Change.
78
Mexico City has tried many different approaches and implemented several programs to improve air quality, like the city‘s well known driving restrictions first introduced in 1989, which is, one or two days during the weekdays. Aside from the previous restrictions, Mexico City further implemented a car-driving ban from April 5 to June 30, 2016. Under this program, all privately owned cars must remain off streets one day per week as well as one additional Saturday per month.
79
Numerous strategies were equally applied by the Government of Mexico City to mitigate air pollution , to wit, (a) consolidate the use of on-board diagnostic system checks in the mandatory vehicle inspection and maintenance program; (b) improve the mandatory vehicle inspection program to include mechanical roadworthiness checks and to measure ultrafine particulate emissions; (c) adopt the state-of-the-art emissions standards for heavy duty diesel vehicles without delay; (d) continuously update the Hoy no Circula driving restriction system in the Metropolitan Zone of the Valle de Mexico and improve enforcement; (e) phase in a city-wide low emissions zone; (f) manage parking more effectively and consider road pricing; and (g) improve sustainable transport alternatives to cars and taxis.
80
Despite of the strategies implemented by the government of Mexico City in CY 1989, unusually high levels of ozone in the valley around Mexico City, have led authorities to activate an environmental contingency plan, restricting vehicle use and ordering factories to limit greenhouse gas emissions (GHG) by up to 40%. But the infrequency of such warnings serves as a reminder of how far the Mexican capital has come. As Mexico‘s economy grew in the '80s and '90s, the sharp rise in emissions from transport and industry landed its capital the unenviable accolade of world‘s most polluted city. Then, in 1996, city and regional governments introduced the celebrated Management Programme to Improve Air Quality (Proaire in Spanish), which harnessed the will of both civil society and business interests to tackle the problem. Whereas once levels of ozone (O3) hovered around 500 parts per billion (ppb), they now range between 120 and 150 ppb. While the EPA standards use parts per million (ppm), O3 were transformed from ppm to ppb to facilitate comparison of concentration levels with Mexico City air pollution standards.
81 Proaire now
extends to 11 cities nationwide.82
Within the Mexico City Metropolitan Area (MCMA), Sistema de Monitoreo Atmosferico de la Ciudad de Mexico monitors ambient air concentrations of six criteria air pollutants that have adverse human health and environmental effects: ground level ozone (O3), carbon monoxide (CO), sulfur oxides (SOx), nitric oxides (NOx), lead, and particulate matter (PM2.5 and PM10).
83 Highest PM2.5 and
75
McKinley et al. (2005). Quantification of Local and Global Benefits from Air Pollution Control in Mexico City. Environmental
Science Technology 39, 1954-1961. 76
https://nrdc.org/experts/amanda-maxwell/soulution-mexicos-air-pollution-problem-could-serve-model- 77
Ibid 78
http://eriroocities.org/news/new-mobility-law-mexico-city-caltalyze-safe-sustainable-transport 79
https://www.thomsonreuters.com/en/about-us-trust-principle.htm 80
https://www.itf-oecd.org/strategies-mitigating-air-pollution-mexico-city 81
An assessment of air pollutant exposure methods in Mexico City, Mexico https://sph.uth.edu/kaizhang/files/2014/01/Luis-2015.pdf 82
How Mexico City slashed air pollution levels by half- Pierre-Marc René https://www.dialogue.net/article/show/single/en/8786 83
Assessing air quality index awareness and use in Mexico City.
https://www.ncbi.nlm.nih.gov/pmc/articles/PMC5913808/pdf/12889_2018_Article_5418.pdf
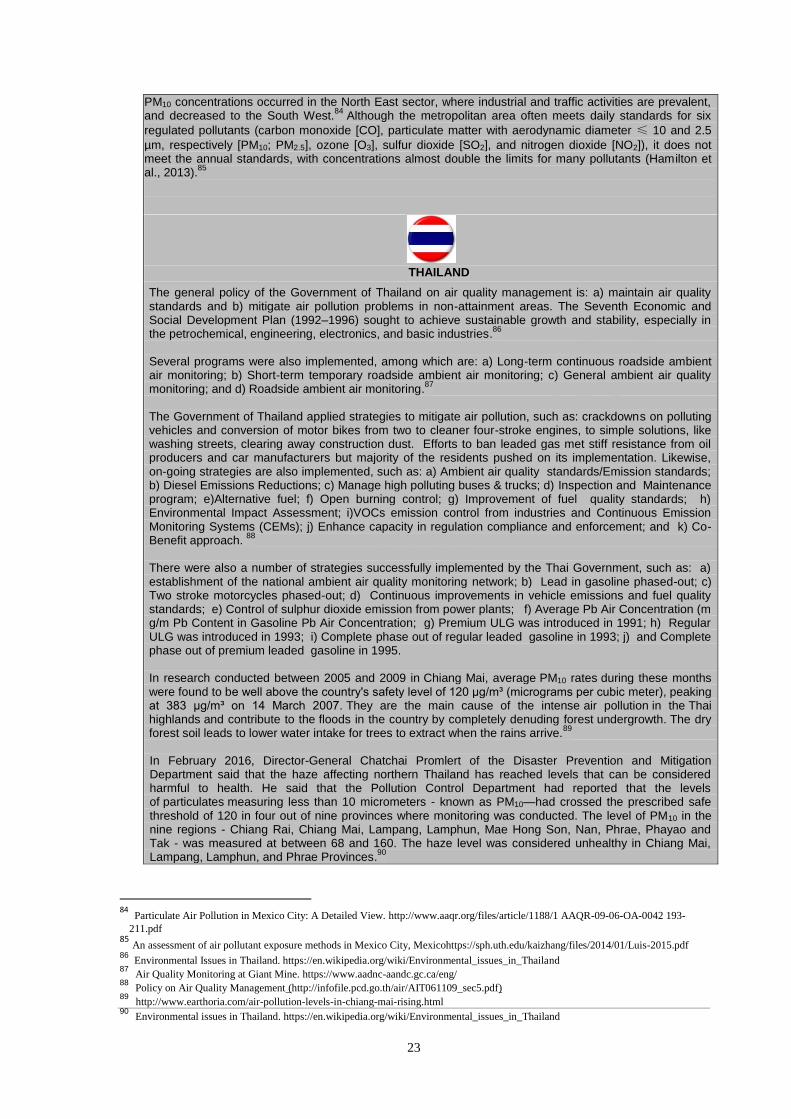
23
PM10 concentrations occurred in the North East sector, where industrial and traffic activities are prevalent, and decreased to the South West.
84 Although the metropolitan area often meets daily standards for six
regulated pollutants (carbon monoxide [CO], particulate matter with aerodynamic diameter ≤ 10 and 2.5
µm, respectively [PM10; PM2.5], ozone [O3], sulfur dioxide [SO2], and nitrogen dioxide [NO2]), it does not meet the annual standards, with concentrations almost double the limits for many pollutants (Hamilton et al., 2013).
85
THAILAND
The general policy of the Government of Thailand on air quality management is: a) maintain air quality standards and b) mitigate air pollution problems in non-attainment areas. The Seventh Economic and Social Development Plan (1992–1996) sought to achieve sustainable growth and stability, especially in the petrochemical, engineering, electronics, and basic industries.
86
Several programs were also implemented, among which are: a) Long-term continuous roadside ambient air monitoring; b) Short-term temporary roadside ambient air monitoring; c) General ambient air quality monitoring; and d) Roadside ambient air monitoring.
87
The Government of Thailand applied strategies to mitigate air pollution, such as: crackdowns on polluting vehicles and conversion of motor bikes from two to cleaner four-stroke engines, to simple solutions, like washing streets, clearing away construction dust. Efforts to ban leaded gas met stiff resistance from oil producers and car manufacturers but majority of the residents pushed on its implementation. Likewise, on-going strategies are also implemented, such as: a) Ambient air quality standards/Emission standards; b) Diesel Emissions Reductions; c) Manage high polluting buses & trucks; d) Inspection and Maintenance program; e)Alternative fuel; f) Open burning control; g) Improvement of fuel quality standards; h) Environmental Impact Assessment; i)VOCs emission control from industries and Continuous Emission Monitoring Systems (CEMs); j) Enhance capacity in regulation compliance and enforcement; and k) Co-Benefit approach.
88
There were also a number of strategies successfully implemented by the Thai Government, such as: a) establishment of the national ambient air quality monitoring network; b) Lead in gasoline phased-out; c) Two stroke motorcycles phased-out; d) Continuous improvements in vehicle emissions and fuel quality standards; e) Control of sulphur dioxide emission from power plants; f) Average Pb Air Concentration (m g/m Pb Content in Gasoline Pb Air Concentration; g) Premium ULG was introduced in 1991; h) Regular ULG was introduced in 1993; i) Complete phase out of regular leaded gasoline in 1993; j) and Complete phase out of premium leaded gasoline in 1995. In research conducted between 2005 and 2009 in Chiang Mai, average PM10 rates during these months were found to be well above the country's safety level of 120 μg/m³ (micrograms per cubic meter), peaking at 383 μg/m³ on 14 March 2007. They are the main cause of the intense air pollution in the Thai highlands and contribute to the floods in the country by completely denuding forest undergrowth. The dry forest soil leads to lower water intake for trees to extract when the rains arrive.
89
In February 2016, Director-General Chatchai Promlert of the Disaster Prevention and Mitigation Department said that the haze affecting northern Thailand has reached levels that can be considered harmful to health. He said that the Pollution Control Department had reported that the levels of particulates measuring less than 10 micrometers - known as PM10—had crossed the prescribed safe threshold of 120 in four out of nine provinces where monitoring was conducted. The level of PM10 in the nine regions - Chiang Rai, Chiang Mai, Lampang, Lamphun, Mae Hong Son, Nan, Phrae, Phayao and Tak - was measured at between 68 and 160. The haze level was considered unhealthy in Chiang Mai, Lampang, Lamphun, and Phrae Provinces.
90
84
Particulate Air Pollution in Mexico City: A Detailed View. http://www.aaqr.org/files/article/1188/1 AAQR-09-06-OA-0042 193-
211.pdf 85 An assessment of air pollutant exposure methods in Mexico City, Mexicohttps://sph.uth.edu/kaizhang/files/2014/01/Luis-2015.pdf 86 Environmental Issues in Thailand. https://en.wikipedia.org/wiki/Environmental_issues_in_Thailand 87
Air Quality Monitoring at Giant Mine. https://www.aadnc-aandc.gc.ca/eng/ 88
Policy on Air Quality Management (http://infofile.pcd.go.th/air/AIT061109_sec5.pdf) 89
http://www.earthoria.com/air-pollution-levels-in-chiang-mai-rising.html 90
Environmental issues in Thailand. https://en.wikipedia.org/wiki/Environmental_issues_in_Thailand
24
During the burning season 2016 (February–April), air pollution has shown no improvement despite the government's purported efforts to ameliorate the burning. The Mae Sai District of Chiang Rai Province recorded a record 410 µg/m
3 of harmful air particles in the early morning of 25 March 2016.
91
In February 2018, Bangkok suffered under a haze of smog and ultra-fine dust. The Pollution Control Department issued warnings that particulate levels had soared to 94 micrograms per cubic meter of air in some areas, almost double the safe limit of 50 mcg. Residents were urged to wear N95 or KN95 protective dust masks. Bangkok City Hall reassured residents that conditions will "permanently improve" in 11 years (2029) with the launch of many new and improved modes of public transport.
92
PHILIPPINES
One of the major legislations enacted in the Philippines is R.A. No. 8749 (Clean Air Act of 1999) that moves for an effective air quality management program that will mitigate the worsening problem of air pollution in the country. The primary goal is to come up with a comprehensive national program to achieve and maintain air quality that meets the National Air Quality Guidelines for Criteria Pollutants and their Emissions Standards while minimizing the possible associated negative impacts on the country‘s economy. Its Implementing Rules and Regulations (IRR) contain specific requirement that prohibit the vehicular and industrial sources from emitting pollutants in amounts that cause significant deterioration of air quality.
93
The program of the Philippine Government of promoting the use of clean and alternative fuel, and another proposing the establishments of provincial bus terminals outside Metro Manila to reduce the volume of vehicles on the road are the on-going projects of the cities and municipalities in the National Capital Region. Along with the Environmental Management Bureau (EMB) and the Metropolitan Manila Development Authority (MMDA), composite units were formed to conduct roadside apprehensions of suspected ―smoke-belchers.
94
On January 8, 2018, the Inter-Agency Council on Traffic (I-ACT) started cracking down on dilapidated and smoke-belching public utility vehicles (PUVs) plying the streets of Metro Manila under the Department of Transportation‘s (DOTr) PUV Modernization Program (PUVMP). The Motor Vehicle Inspection System (MVIS) is used in evaluating the road worthiness of PUVs currently undergoing registration process and/or those caught on road due to smoke belching, among others
.95
The Department of Environment and Natural Resources (DENR) launched a project that aims to promote the best techniques and environmental practices in open burning activities in response to the Stockholm Convention on persistent organic pollutants (POPs). The project introduced globally recognized techniques and practices in creating resource-efficient waste management systems to cut POP emissions produced unintentionally and released into the atmosphere. It aims to reduce the POP released at the identified pilot sites by 90 percent.
96
Mandatory gas emissions testing, which were implemented over the project period, the implementation of improvements in fuel composition, the monitoring of pollution from stationary sources, and development of air pollution-related registrations have improved air pollution over pre-project levels in terms of PM10 emissions and ambient concentration of TSP (both referring to suspended particulate matter) 10 , and it is considered that the project has made a certain contribution to these improvements. Total PM10 emissions had dropped to 71,181 tons in 2001 from 116,359 tons in 1998 and showed a reduction of approximately 39 percent. According to the appraisal documents prepared by the ADB, it was predicted that the projected figure for emissions of PM10 in 2001 of 125,118 tons and the incidence ofov.ph/ effects from this project would appear in 2003 or thereafter, but the reductions have reached around 57 percent of the projected level, meaning that the effects to date are greater than those anticipated at appraisal.
97
91
Ibid. 92
Ibid. 93
Air Quality Management. https://www.denr.gov.ph/news-and-features/latest-news/51-air-pollution-management.html 94
http://newsinfo.inquirer.net/578865 95
https://www.facebook.com/DOTrPH/posts/1027233944082408 96
DENR project launched to reduce air pollution from open burning https://www.philstar.com/headlines/2015/10/17/1511911/denr-
project-launched-reduce-air-pollution-open-burning 97
Philippines Metro Manila Air Quality Improvement Sector Development Program External Evaluator: Taro Tsubogo Field Survey:
December 2004 <https://www.jica.go.jp/english/our_work/evaluation/oda_loan/post/2005/pdf/2-19_full.pdf

25
The DENR, DOH, and WHO are taking steps to decrease the environmental health risk of air pollution including improving the linkage of air quality and health monitoring, reviewing the air quality index, and strengthening the health impact assessment for projects and activities that may cause air pollution. Starting 2017 until 2019, the Philippine Government also leads the regional forum on health and environment, bringing together countries in the Asia-Pacific Region where air pollution is one of the agenda.
98
All of the listed cities also failed to reach the limit set for particulate matter of 10 microns in size (PM10). Baguio ranked highest once more, with 84 μg/m3 of PM10, which is also four times the recommended level. Meanwhile, Cebu, Dagupan, and Manila also failed, registering values of 54, 51, and 55 μg/m3 respectively. While the city of Davao came close to meeting the prescribed safe level (at 21 μg/m3), it still exceeded the limit.
99 The air quality of Metro Manila is still dirty but improving in terms of TSP. For 2008,
TSP level is 138 ug/Ncm.100
Evidently, the efforts of governments to abate/reduce the ill-effects of air pollution to
environmental health manifest improvement in the five sampled countries in the succeeding years, as reflected in Table 6 when the current level of pollution in each of the selected countries/cities were compared with the status of air pollution prior to the implementation of program/strategies vis-à-vis with the EPA standards.
On the other hand, the Clean Air Act of U.S.A. requires EPA to set national ambient air
quality standards (NAAQS), shown in Table 5, for specific pollutants to safeguard human health and the environment. These standards define the levels of air quality that EPA determines are necessary to protect against the adverse impacts of air pollution based on scientific evidence. EPA work with WHO to develop guidelines for environmental standards e.g. for air and drinking water quality.
101 EPA has established standards for six common air pollutants, which are
referred to as ―criteria‖ pollutants.102 Table 5 also presents WHO value guideline for several
pollutants as comparison to EPA standards.
Table 5: Pollutants per EPA and WHO Standards/ guidelines
Pollutants Type EPA
Standard Averaging
Time Form
a
WHO Guidelines
Averaging Time
Sulphur dioxide (SO2)
Primary 75 ppb 1-hour
99th Percentile of 1-hour daily maximum
concentrations, averaged over 3
years
20 μg/m³ 24-hour
Secondary 0.5 ppm (1,300 μg/m³)
3-hour Not to be exceeded more than once per
year 500 μg/m³ 10-minute
Particulate matter (PM10)
Primary and Secondary
150 μg/m³ 24-hour Not to be exceeded more than once per
year on average over 3 years
50 μg/m³ 24-hour
140 μg/m³ 8-hour 20 μg/m³ Annual
Fine particulate matter (PM2.5)
Primary 12 μg/m³ annual Annual mean,
averaged over 3 years
10 μg/m³ Annual
Secondary 15 μg/m³ annual
Primary and Secondary
35 μg/m³ 24-hour 98th percentile, averaged over 3
years 25 μg/m³ 24-hour
98
Air Pollution: A Public Health Concern in the Philippines. September 24, 2017( https://www.denr.gov.ph/news-and-features/latest-
news/3295-air-pollution-a-public-health-concern-in-the-philippines.html) 99
How Bad is Air Pollution in the Philippines? https://www.flipscience.ph/health/how-bad-air-pollution-philippines 100 https://pcw.gov.ph/sites/default/files/documents/efiles/webmaster/gwpf_sofe_air.pdf. Air Quality in the Phils. 101
https://www.epa.gov/international-cooperation/partnering-international-organizations 102
Criteria Air Pollutants-https://www.epa.gov/criteria-air-pollutants

26
Pollutants Type EPA
Standard Averaging
Time Form
a
WHO Guidelines
Averaging Time
Carbon monoxide (CO)
Primary 35 ppm (40
mg/m³) 1-hour
Not to be exceeded more than once per
year
Primary 9 ppm
(10 mg/m³) 8-hour
Ozone (O3)
Primary and Secondary
0.12 ppm (235 μg/m³)
1-hourb
expected number of days per calendar
year, with maximum hourly average
concentration greater than 0.12 ppm, is
equal to or less than 1
Primary and Secondary
0.070 ppm (140 μg/m³)
8-hour
Annual fourth-highest daily maximum 8-
hour concentration, averaged over 3
years
100 μg/m³ 8-hour
Nitrogen dioxide (NO2)
Primary and Secondary
0.053 ppm (100 μg/m³)
annual Annual mean 40 μg/m³ Annual
Lead (Pb) Primary and Secondary
0.15 μg/m³ Rolling 3 months
Not to be exceeded
Each standard has its own criteria for how many times it may be exceeded
Agencies of the five sampled countries/cities developed strategies in order to reduce air pollution. The efforts seemed to focus on shifting to lower-emissions vehicle engines and improving public transportation since this is the common perennial problems of the five selected areas. There is no sufficient information to be compared on how the governments deal with household emission and industries within the five sampled countries despite its impact on human health.
To show the level of pollution of these five countries which implemented abatement programs, prior and current level of air pollutants in each sampled five country were compared to EPA standards and revealed favorable and unfavorable variances as presented in Table 6.
Table 6. Comparison of Current Level of Pollutants against the EPA Standards
Country
(1)
Air Pollutants/
Types (2)
Level of Pollution
EPA Standards
(5)
Variance (6=5-4)
Favourable/ (Unfavourable)
Prior
(3)
Current
(4)
Brazil PM2.5 115-265 μg/m³ 22 μg/m³ 140 μg/m³ (8 hrs.) 118
China PM2.5
1,000 μg/m³ maximum
158 μg/m³ 35 μg/m³ (24 hrs.) (123)
Mexico City Ozone (O3)
500 ppb/ppm
Between 120 to 150 ppb/ppm
0.070 ppm (8 hrs.)
Between (119.93) to
(149.93) ppb/ppm
Thailand PM10
383 ug/m3 in
2007 Between 68 to
160 in 2016
94 ug/m3
in Feb. 2018 150 ug/m3 (24
hrs.) 56
Philippines PM 10 138 μg/m³ in
2008 84 μg/m³
150 μg/m³ (24 hrs.)
66

27
As shown in Table 6, air pollutants in three countries showed some improvements and by surpassing the EPA standards while two countries have not yet meet the standards.
2.3. Instruments used by governments for measuring/monitoring air pollution
Air pollution measurement and monitoring are important for governments. Thus, reliable instruments used to measure the air pollution are needed to ensure the right information is obtained to support governments‘ decision making process. Instruments for measuring air pollutants may vary greatly in complexity and price, from the simplest passive sampler to the most advanced and expensive automatic remote monitoring system based on light absorption spectroscopy of various kinds. Relatively simple equipment is usually adequate for determining background levels, estimating long-term average concentrations and observing trends. Passive samplers may also be adequate for undertaking simple screening studies. For the complete determination of air pollution distributions and relative source impacts and the operation of warning systems, however, more complex and advanced monitoring systems are needed. Also, when data are needed for verification of model performance, expensive monitoring systems are usually needed.
The selection of representative measurement sites, as well as the use of different
measurement methods, has made the interpretation and comparisons of the data difficult. Concentration levels must be looked on as indicative of the air quality to be expected in different urban areas, in different regions and on different continents. The accuracy of the air quality data and their representativeness in space and time are important for the quality of the assessments produced from the data. Data quality objectives are set, so that when they are fulfilled one can use the data confidently for the purpose for which the monitoring objectives have been set. One example of these instruments is the data on Ambient Air Quality Standards and other related information for the Thailand Government is available on the website of the Department of Environmental Quality Promotion
.103
Data quality objectives may also include specifications of accuracy, precision, area of
representativeness and temporal coverage. Setting quality objectives and following a well-defined quality assurance and quality control (QA/QC) programme are essential for obtaining good quality data and comparable information. The measurement methods used and information concerning data quality requirements have not always been reported and controlled. Data quality may thus vary from one city to another and from region to region.
Below is the discussion on how air pollution monitoring performed in five sampled
countries:
In the Latin American countries, the City Government of Sao Paulo, the largest city in Brazil, collaborated with Telefonica Brazil (VIVO) S.A., a fixed telecommunications company, to commission Telefonica Big Data, a private telecommunications company operating worldwide, to monitor air pollution and help improve the city’s traffic management and environmental planning using the mobile network Big Data. The mobility data has been possible to predict pollution problems up to two days before they occur, allowing the city to take precautions to protect public health, such as guiding traffic via alternative routes and advising vulnerable populations, such as those with respiratory conditions, on areas of high pollution. The mobility data used also delivered greater granularity and wider reach than traditional fixed air quality and traffic sensors, which are expensive to deploy. While Sao Paulo adopted Big Data to measure air pollution in the region, the officials of Mexico City in Mexico used the Metropolitan Index of Air Quality to measure the chemical components of air in whole numbers that are easy to understand. When the Index reaches around 200 points ozone can damage skin. The city was only eight points away.
104
103
http://www.deqp.go.th/english/greendata/index_greendata.htm 104
Air Quality Guidelines- Global Updates. www.WHO.guidelines. www.WHO.guidelines

28
In the Asian Region, it’s the Government of China that built nationwide networks of monitors tracking levels of PM2.5. The government has made the data available in the public. It has done the same with measurements taken outside thousands of factories. Anyone with a smart phone in China can now check local air quality in real time.
105
In Thailand, air quality levels is measured through the automatic monitoring system,
referred to as the ‘AIRVIRO SYSTEM’, and reporting real time air quality levels through the Internet as air quality index (AQI) maps. Air quality monitors comprise 16 permanent stations and are set up at roadside and general sites. For non-automatic monitoring system used for measuring gases, analytic instruments such as optical spectroscopy or gas chromatography/mass spectrometry, NDIR (non-dispersive infrared), chemiluminescence, and the like can give a precise analysis. To substitute the typical analytical tools and adapt or extend the air quality monitoring system with a new generation of detectors, nanotechnology based metal oxide semiconductors such as: ZnO semiconductor is a viable alternative. The air quality data can eventually be transmitted through a Wireless GIS network system to the general public.
106
The Philippines, the last country in the study, used/employed the Continuous
Emissions Monitoring System (CEMS) as per the National Air Quality Status Report for CYs 2010 and 2011 of the Energy Monitoring Board (EMB) of the Department of Environment and Natural Resources (DENR). The CEMS is an equipment stipulated in the Implementing Rules and Regulations (IRR) of RA No. 8749 to be used to sample, analyze, measure, and provide a permanent record of relevant regulated polluted emissions for stack gas volumetric flow rate by recording readings at least once every 15 minutes
.107
2.4. Non-financial and financial mechanism used by governments for pollution abatement
2.4.1. Non-Financial Mechanism
Compared to financial mechanisms, non-financial interventions used by governments considered to be more effective. Government as an authority has a statutory role in assessing and improving the quality of life of its citizen including the air quality. These non-financial mechanisms could take form of:
a. Regulatory/legislative enforcement (command-and-control (CAC)) mechanism (including softer advisory policy);
b. Education/engagement activities (including raising awareness about air quality concerns, risk mitigation, and providing advice on reducing energy consumption); and
c. Measures to encourage cleaner transportation (e.g. allowing cyclist to take bicycles on trains).
Further, non-financial mechanism for air pollution abatement involves coordination among many sectors including health, energy, transport, agriculture and others. Each sector has to have a clear definition on their roles in supporting pollution abatement strategies to be implemented. For example, limiting industrial emissions policy must be supported with ―clean-fuel‖ standards from energy sector and innovative solution for cleaner technology to lower emission. A strategic approach involving legislative, policy, behavioral and technological interventions is required by government to obtain greatest impact on air pollution abatement.
2.4.2. Financial Mechanism
Policy instruments determine the style and cost-effectiveness of policy implementation and create a framework for financing mechanisms. Environmental objectives can be achieved indirectly, by influencing the decision making process on the micro level (market based
105
China-air-pollution-environment-http//www.tangshan.news.national geographic.com 106 Assessment of Air Pollution in Bangkok Metropolitan Region, Thailand. https://www.atmos-chem-phys-discuss.net/acp-2017-
1063/acp-2017-1063.pdf 107
MARPOL Annex VI on the Philippine Government’s Action on Air Pollution Source: Official website of the Philippine Embassy in
London, United Kingdom. www.londonpe.dfa.gov.ph

29
instruments (MBIs)). MBIs can induce polluters to finance pollution abatement from their own sources. The cost of pollution abatement, however, varies across polluters, and the same environmental quality could be achieved by making polluters with lower abatement cost to abate more, while others with higher costs abating less. Such a cost-effective solution can be achieved by MBIs that provide price-based choices. Polluters may decide whether to abate their emissions, or to pay pollution charges.
108 More on MBI, INTOSAI has published a document
titled ―Market based instrument for environmental protection and management (2016)‖ which is available at: https://wgea.org/media/5370/wgea-instrument-protection-and-management_isbn-ok.pdf
The discussion of financial mechanism still concentrated on the five sampled countries
selected in the study as summarized in Table 7.
Table 7 - Financial Mechanisms Used by the Five Sampled Countries
Countries Financial Mechanisms Used/Employed
Brazil
Brazil uses part of its revenues from oil and gas exploration to fund environment-related and climate mitigation expenditures. Until 2010, two types of gas and oil revenue accrued to the government, (besides corporate income taxes): royalties and windfall profit tax. Revenue from both sources roughly equal and reached US16 billion in 2012. Twenty eight per cent of the royalty revenue is allocated to the Ministry of Science, Technology and Innovation (MCTI) and the Navy. The MCTI uses the revenue to sect oral funds for research and development in various areas, including environmental ones.
109
In December 28, 2009, Brazil, through, Municipalities of Belo Horizonte, Curitiba, Sao Paolo, implemented BR-GEF Sustainable Transport and Air Quality Project (STAQ) with total project cost of US$25,500,000 by obtaining a loan from Global Environment Facility (GEF) (World Bank) of US$8,530,000, with a counter-part of UD$16,972,000. The objective of the GEF Sustainable Transport and Air Quality Project for Brazil is to assist the selected agencies to: (i) reduce Greenhouse Gas (GHG) emissions growth rates by fostering a long term increase in the promotion of less energy intensive transport modes; and (ii) promote the implementation of policies and regulatory frameworks that foster the development of sustainable transport systems. The project was closed on December 30, 2015.
110
China
Financial resources for industrial pollution abatement come from various earmarked sources in China. These are: a) Capital Construction Funds (CCFs) accumulated from 7 percent of new investment costs designated for pollution control; b) Technology Renovation Funds (TRFs) or depreciation funds that carry out the rehabilitation of existing technologies, 7 percent of which should be spent on pollution control; c) Comprehensive Utilization Profits gained from utilization of waste are allowed to remain in the industry instead of being transferred to local finance bureaus; and d) Environmental Funds (EFs) accumulated from pollution charges and fines at local environmental protection bureaus. Eighty percent of total environmental levies are earmarked for industrial pollution control investments. The largest share of industrial pollution abatement investments (45 percent in 1990), is financed from CCFs and TRFs.
111
Mexico
On December 23, 2009, Global Environment Facility (GEF), World Bank granted Mexico an Adaptable Program Loan of US$5,378,000.00, with a counterpart fund from the latter of US$31,581,000.00, or a total cost of US$36,960,000 million for the Sustainable Transport and Air Quality Project for Mexico. The Implementing Agency was Banobras; Ministry of Finance and Public Credit (Secretaría de Hacienda y Crédito Público SHCP); Secretaria de Desarrollo Agrario, Territorial y Urbano (SEDATU). The development objective of the Project was to assist the selected municipalities to (a) reduce Green House Gas (GHG) emissions growth rates by fostering long term increases in the use of less energy intensive transport modes;
108
https://www.epa.gov/economic-and-cost-analysis-air-pollution-regulations/cost-analysis-modelstools-air-pollution 109
http://books.google.com.ph/books?isbn+9264240098 110
http://projects.worldbank.org/P114010/br-gef-sustainable-transport-air-quality-project-staq?lang=en&tab=overview 111
Financial Mechanism Abatement- Financing Pollution Abatement: Theory and Practice-Magda Lovie 1995
<http://www.oecd.org/sweden/2082885.pdf

30
Countries Financial Mechanisms Used/Employed
and (b) induce policy changes in favour of sustainable transport projects. The project was closed on November 30, 2015. The project resulted in (a) estimated reduction of 62,864 tons of carbon dioxide
equivalents (CO2e) per year; and (b) GHG emission reduction target of 10 percent, among others.
112
Thailand
To support environmental protection, Thailand is now critically evaluating the use of fiscal mechanisms, i.e., environmental taxes through the application of ―Polluter Pays Principle‖ and ―User Pays Principle‖ in the management of natural resources and the environment. For the Polluter-Pays Principle, those who pollute the environment must pay for the damages they have caused. The Beneficiary-Pays Principle or User Pays Principle, assigns environmental rights to the polluters hence, those who benefit from a better environment will have to pay the pollution control costs.
113
Philippines
Pursuant to Section 14 of RA No. 8749, the Air Quality Management Fund (AQMF) was established as a special account in the National Treasury administered and managed by the DENR through EMB. A third of the AQMF is normally reserved for national purposes while two-thirds is allocated to air shed management. The Fund finances: 1) containment, removal and clean-up operations of the government in air pollution cases; 2) restoration of ecosystems and rehabilitation of areas affected by violators of RA No. 8749; 3) research, enforcement and monitoring activities, and capability-building of implementing agencies; and 4) provision of technical assistance to implementing agencies to finance similar activities undertaken within an air shed
.114
2.5. Air quality improvement assessments/evaluation of air quality improvement tools
This section will discuss about the assessment or evaluation of the air quality improvement tools
within the sampled countries. The aim of the assessment is to ensure whether the tools used have
achieved the expected results.
2.5.1. Air quality improvement assessment
Economic assessment is used to evaluate the cost and the economic impact of a policy or regulation related to air quality management and to estimate the economic value of the benefits of an air pollution policy or program. Taken together, these assessments can help identify air quality management policies needed to address the risks that have been identified, as well as to focus on the most cost effective ones. Concerted actions to improve air quality have been taken at different levels, such as through the development of Air Quality Plans (AQPs). However, air quality impacts, associated with the implementation of abatement measures included in AQPs are often neglected.
115 Below is the discussion on how air quality
improvement being assessed within the two sampled countries: In Brazil, to identify the major gaps and strengths in current knowledge, a literature
review has been informed on existing methodologies to estimate air pollution-related health impacts and subsequent external costs. Based on interviews conducted, the Impact Pathway Approach was adopted and applied within the context of MAPLIA research project to assess the health impacts and benefits (or avoided external costs) derived from improvements in air quality. Seven emission abatements scenarios, based on individual and abatement measures, were tested for the major activity sectors (traffic, residential and industrial combustion and production process) of a Portuguese urban area (Grande Porto) with severe particular matter (PM10) air pollution problems. Results revealed a strong positive correlation
112
http://projects.worldbank.org/P114012/sustainable-transport-air-quality?lang=en&tab=financial 113 Monitoring ambient air quality.www.mfe.govt.nz/publications/air/good-practice-guide-air-quality-monitoring-and-data-
management-2009/4-how-monitor 114
Ibid. 115
Assessment of health benefits related to air quality improvement strategies in urban areas: An Impact Pathway Approach [2016]
31
between population density and health benefits obtained from the assessed reduction scenarios. As a consequence, potential health benefits from reduction scenarios are largest in density populated areas with high anthropic activity and, thus where air pollution problems are most alarming. Implementation of all measures resulted in a reduction in PM10 emissions by almost 8%, improving air quality by about 1% and contributing to a benefit of €8.8 million /year for the entire study domain. The introduction of PM10 reduction technologies in industrial units was the most beneficial abatement measure.
116
In the case of China, The National Total Emission Control (NTEC) Program will continue to be implemented during its 12
th Five-year Plan period (FYP, 2011-2015). Two
pollutants (SO2 and NOx) are covered by NETC, of which NOx is a newly added pollutant under control. NTEC requires that the national total SO2 and NOx emissions be reduced by 8% and 10% respectively in 2015 from the levels of 2010. Annual mean SO2, NO2 and PM2.5
(sulphates and nitrates) concentrations in 2010 and 2015 were simulated with the Community Multi-scale Air Quality (CMAQ) model based on the national source census data and reduction targets in the NTEC Program.
117
2.5.2. Evaluation of air quality improvement tools
The Environmental Benefits Mapping and Analysis Program (BenMAP) is a tool for estimating health impacts, and the associated economic values, resulting from changes in ambient air pollution. The Control Strategy Tool (CoST) is a client-server system and is part of EPA‘s Emission Modeling Framework (EMF). The purpose of CoST is to model the emission reductions and engineering costs associated with control strategies and applied to point area, and mobile sources of air pollutant emissions to support the analyses of air pollution and regulations.
118
It was determined in 2006 that it was an appropriate time to replace the ACN
software with newer software that could provide improved functionality and transparency to support current and upcoming needs. A prototype version of the Control Strategy Tool was developed in 2006 and a fully functional version was developed in 2008. The tool has the functionality of ACN but with added capabilities, including the: a) ability to insert emissions inventories almost seamlessly from the Emissions Modelling Framework (EMF); b) the ability to insert new control measure data; c) easier for users to track their analysis and create summary reports and output files; d) Quality Assurance (QA) steps provided for identifying errors in emissions and control measure data; e) information on control efficiencies and costs is contained in the Control Measure Data Base (CMDB). This database currently focuses on criteria pollutants.
119
A wide variety of methods are available for measuring contaminants in ambient air,
with an equally wide variation in cost and precision. Specific monitoring methods should be chosen taking into consideration the purpose, objectives and budget of the monitoring program.
Monitoring methodologies can be divided into three categories according to cost and
the level of accuracy and precision.120
1. Continuous monitoring methods
These are high-resolution methods that provide continuous records of contaminant levels. They can operate over extended periods (weeks or months) with minimal operator
116
Air Quality Assessment by Contingent valuation in Ji’nan, China Yan Wang*,-Authors-Yi-Sheng Zhang School of Environmental Science and Engineering, Shandong University, Ji’nan,China/home.wlu.edu/caseyj/ wang_ 2008_Journal-of-Environmental-
Management.pdf 117
EPA Web Archive or the January 19, 2017 Web Snapshot. https://www.epa.gov/economic-and-cost-analysis-air-pollution-
regulations/cost-analysis-model stools-air-pollution 118 https://www.epa.gov/economic-and-cost-analysis-air-pollution-regulations/cost-analysis-modelstools-air-pollution 119 EPA Web Archive or the January 19, 2017 Web Snapshot. https://www.epa.gov/economic-and-cost-analysis-air-pollution-
regulations/cost-analysis-modelstools-air-pollution 120
https://en.wikipedia.org/wiki/National_Ambient_Air_Quality_Standards

32
intervention. Remote communication is possible by telemetry. They have a high degree of measurement precision, and have detection levels around one order of magnitude or more below typical background levels. As might be expected, these are the most expensive monitoring methods. A high standard of maintenance, calibration, and operational and quality control procedures are required for good data quality.
2. Gravimetric particulate methods
In the past, gravimetric particulate methods have formed the mainstay of particulate monitoring in New Zealand. The implementation of the NES for air quality, however, has shifted the use of these methods to the analysis of airborne lead, co-location studies and screening surveys.
Monitoring starts when a known volume of air is pumped through a pre-weighed filter for a known length of time (typically 24 hours). The filter is reweighed after exposure and a concentration determined. Most systems used in New Zealand require manual changes of the sampling filters between each sample, although a number of semi-automated systems are also available. This can be done on consecutive days. Manually changing filters at midnight, however, is operationally impractical when compliance monitoring (the regulations by definition require filter changes to take place at midnight.
3. Passive monitoring methods (diffusion tubes and badges) Diffusion tubes work when a contaminant is diffused into a tube containing either an adsorbent or reactive material. Analysis of the tubes following a known exposure time (typically two to four weeks) will provide a time-averaged contaminant concentration. Badges work in a similar way, the difference being the sampler configuration. Badges typically have higher uptake rates and are used more widely in New Zealand.
Because these methods are simple and cheap, they can provide a good picture of spatial variation over a large area. They are particularly useful in screening surveys and during the initial stages of an air quality monitoring program.
Though a cheap screening tool, there are a number of limitations to this method, such as lower accuracy and no indication of peak levels. Quality control and assurance during laboratory analysis must be of the highest standard to attain consistent results. The results from passive samplers can be used in conjunction with high-resolution instruments to determine spatial variation across an air shed over a relevant averaging period. This method can also be useful for comparison with annual guidelines.
Conclusion
Government has a major role in environmental health, especially in terms of air quality management. As the highest authority for regulating and controlling the air quality, government has the privilege to set regulation for air pollution and monitor its implementation (command-and-control). The government also has to ensure there is a proper coordination and concerted efforts of all the components of society like non-governmental organization, industrialists, agriculturists, voluntary social welfare organizations as well as the general public. As the highest authority, government needs to assure that the air quality policies are aligned with other policies in other sectors and implemented properly in practice. Thus, proper monitoring and evaluation system is needed to continuously improve government efforts in improving air quality.

33
Chapter III: EFFORTS OF INTERNATIONAL ORGANIZATION ON AIR POLLUTION AND ITS HEALTH EFFECTS
International organizations play important role in combating air pollution by creating awareness and sending clear message to the public on what steps to implement to mitigate the air pollution. These international organizations especially WHO plays the most important role in terms of providing the key guidance for air pollution limit values which is an important element of any governments‘ approaches in reducing air pollution. This chapter will discuss the international assembly/congress on air pollution, responses of international organizations in helping governments reduce and combat air pollution and its health effects, and assistance and provision of funding sources in support of programs and projects related on impacts of air pollution on health.
3.1. International Assembly/Congress on Air Pollution
3.1.1. World Health Assembly (WHA)
The WHA is the decision-making body of the World Health Organization. It is attended by delegations from all WHO Member States and focuses on a specific health agenda prepared by the Executive Board. The main functions of the WHA are to determine the policies of the Organization, appoint the Director-General, supervise financial policies, and review and approve the proposed program budget.
121 The World Health Assembly is being held annually
in Geneva, Switzerland, since it was first opened on June 24th, 1948.
The Resolution of 68th World Health Assembly (WHA) held in 18–26 May 2015
The 68
th WHA passed a resolution, WHA 68.8
122, which recognized air pollution as one
of the leading avoidable causes of disease and death globally with 4.3 million deaths occurring each year from exposure to household (indoor) air pollution and 3.7 million deaths each year attributed to ambient (outdoor) air pollution, at a high cost to societies.
123
The resolution identifies measures member states should strive to implement, including actions such as: enabling health authorities to raise awareness on the dangers of air pollution, developing guidelines to limit exposure; and working with relevant private and public sector actors on sustainable solutions. It calls for monitoring and research of air pollution morbidity and mortality rates and strengthening international cooperation to address health impacts of air pollution, including through facilitating transfer of expertise, technologies and scientific data in the field of air pollution, as well as exchanging of good practices.
The resolution also draws an implicit link between actions to reduce air pollution and actions to mitigate climate change, acknowledging that despite the "complexity" of certain issues, "meaningful opportunities" can exist for obtaining health and climate co-benefits.
The Resolution of 69
th World Health Assembly (WHA) held in 23–28 May 2016
At the 69
th WHA, delegates approved a resolution
124 which includes a road map for
responding to the adverse health effects of air pollution. The road map outlines actions to be taken between 2016 and 2019. The four-year road map focuses on four areas of action:
125
Expanding the knowledge base about impacts of air pollution on health;
121 About the Health Assembly<https://www.who.int/world-health-assembly/seventy-first 122
Document is available at: http://apps.who.int/gb/ebwha/pdf_files/wha68/a68_r8-en.pdf 123
World Health Assembly Passes Landmark Resolution on Air Pollution and Health https://www.unenvironment.org/news-and-stories/press-release/world-health-assembly-passes-landmark-resolution-air-pollution-
and health 124
Full document is available at: http://apps.who.int/gb/ebwha/pdf_files/WHA69-REC1/A69_2016_REC1-en.pdf#page=27 125
Enhanced global action on air pollution approved at WHA69
https://www.who.int/sustainable-development/news-events/wha69-roadmap-ap/en/
34
Monitoring and reporting on health trends and progress towards air pollution-related targets of the Sustainable Development Goals;
Leveraging the health sector to raise awareness of health benefits from air pollution reduction measures; and
Enhancing the health sector‘s capacity to work with other sectors and at all levels – local, national, regional and global – to help address the adverse health effects from air pollution through training, guidelines and national action plans.
3.1.2. WHO Global Conference on Air Pollution and Health
The First WHO Global Conference on Air Pollution and Health took place at WHO headquarters in Geneva, Switzerland from 30 October to 1 November 2018. The conference was held in response to a resolution of the 68
th World Health Assembly (WHA68.8) in 2015, in
which ministers of health asked for a major scaling-up of the response by health and other sectors to prevent air pollution diseases, exposure to air pollution and their costs to society. The ―Road map for an enhanced global response to the health effects of air pollution‖ adopted at the Sixty-ninth World Health Assembly in 2016 (A69.18), asked for a global conference to review progress and decide on further action.
Participants at the conference recognized the need for a world free of air pollution and
an inspirational goal of reducing the number of deaths from air pollution by two thirds by 2030 was highlighted. In order to reach this inspirational goal, the following elements for a Geneva Action Agenda to Combat Air Pollution were put forward.
126 Several main points of the Action
Agenda are mentioned below.
Scale up efforts and mobilize action globally.
Massively implement solutions to burn less in any form.
Strengthen action to protect the most vulnerable populations, especially children.
Greatly increase access to clean energy and technologies in Africa and other areas with populations in greatest need.
Support cities to improve urban air quality.
Enhance education on air pollution as a key factor for improving health and quality of life, within a lifelong learning approach.
Strengthen universal health coverage, health systems and health workforce capacity to engage and implement actions that prevent air pollution-related diseases, including at the primary health care level, in cooperation with other sectors, according to the national context and priorities.
Enhance joint action between the financial, health and environmental sectors, and other key sectors affecting air pollution to generate business plans and specific actions leading to improved air quality and mitigated climate change. This includes redirection of investments and adequate implementation of fiscal instruments. Develop and implement occupational safety and health regulations and measures to protect workers from occupational exposure to air pollution outdoors and indoors.
Scale up interventions to prevent non-communicable diseases (NCDs) through action to reduce air pollution.
Implement the 25 cost-effective clean air measures identified as having the potential to, if fully implemented in the Asia–Pacific Region provide one billion people in the Region with air that meets stringent WHO standards by 2030.
Recognize the urgent need to act and respond to the conference‘s call for voluntary commitment.
Continue the joint effort for harmonized air pollution monitoring.
126 CLEAN AIR FOR HEALTH: Geneva Action Agenda< https://www.who.int/phe/news/clean-air-for-health/en/

35
Implement a mechanism to take stock of actions and progress, and review governance for the prevention of air pollution and related health impacts, and for obtaining additional benefits, including voluntary commitments put forward at the conference.
Enhance gender equity through access to clean fuels and technologies in homes.
Strategically complete knowledge and share it efficiently to address health risks.
Build key partnerships, programs and initiatives to reduce air pollution to healthy levels.
3.1.3. United Nations Environment Assembly (UNEA)
UNEA is the highest-level UN body ever convened on the environment. It enjoys universal membership of all 193 UN member states as well as other stakeholder groups. With this wide reach into the legislative, financial and development areas, the new body presents a ground-breaking platform for leadership on global environmental policy.
127
UNEA encourages Member States, when taking actions across sectors to reduce all forms of air pollution, to consider joining or cooperating with relevant global initiatives and further encourages governments to pursue synergies and co-benefits between national clean air policies, stressing further information sharing through engagement in regional cooperation.
The 1st
United Nations Environment Assembly (UNEA) held in 23-27 June 2014
At the 1
st UNEA held in Nairobi on June 23-27, 2014, delegates from around the world
unanimously agreed to encourage governments to set standards and policies across multiple sectors to reduce air pollution emissions and manage the negative impacts of air pollution on health, the economy, and overall sustainable development.
128
This 1st UNEA Resolution recognized that air pollution, responsible for 7 million deaths
annually, according to estimates by the WHO, is a top issue that requires immediate action by the international community.
The 3rd
United Nations Environment Assembly (UNEA-3) held in 4-6 December 2017
The fight for clean air got a boost as world governments adopted a new resolution on air pollution during the third session of the UNEA which convened from 4-6 December 2017 at the United Nations (UN) Office at Nairobi, Kenya, under the overall theme ―Towards a Pollution-Free Planet.‖
129
The final resolution (UNEP/EA.3/L.23) acknowledges the work of some initiatives such as the UN Economic Commission for Europe‘s Batumi Action on Cleaner Air and the Association of Southeast Asian Nations‘ Agreement on Trans-boundary Haze Pollution that can inspire countries to take action to improve air quality and protect human health. It further notes the voluntary reduction commitments and cooperative efforts by some Member States to reduce black carbon emissions.
The UNEA has firmly positioned itself as the world‘s voice on the environment, while strengthening the environmental pillar of the 2030 Agenda for Sustainable Development as evidenced by more than 2.3 million pledges garnered from individuals across the world in the #BeatPollution campaign.
130
The #BeatPollution, is a campaign to get people to tell their stories about how pollution
has changed their lives and to understand more about the effect of pollution.
127
https://www.unenvironment.org/news-and-stories/press-release/first-ever-un-environment-assembly-unea-ground-breaking- platform
128 https://www.unenvironment.org/ru/node/6504
129 Earth Negotiations Bulletin (ENB): Summary of the Third Session of the United Nations Environment Assembly
http://enb.iisd.org/unep/oecpr3-unea3/ 130
web.unep.org/training/news/beat pollution-campaign
36
3.1.4. Stockholm Convention on Persistent Organic Pollutants
The Stockholm Convention on Persistent Organic Pollutants (POPs) is a global treaty to protect human health and the environment from chemicals that remain intact in the environment for long periods, become widely distributed geographically, accumulate in the fatty tissue of humans and wildlife, and have harmful impacts on human health or on the environment.
It was adopted by the Conference of Plenipotentiaries on 22 May 2001 in Stockholm, Sweden. The Convention entered into force on 17 May 2004.
131
Among others, the provisions of the Convention require each party to:
Prohibit and/or eliminate the production and use, as well as the import and export, of the intentionally produced POPs;
Restrict the production and use, as well as the import and export, of the intentionally produced POPs;
Reduce or eliminate releases from unintentionally produced POPs;
Ensure that stockpiles and wastes consisting of, containing or contaminated with POPs are managed safely and in an environmentally sound manner; and
To target additional POPs.
3.1.5. United Nations Economic Commission for Europe (UNECE)
The UNECE, one of the five regional commissions of the United Nations, was set up in 1947. UNECE's major aim is to promote pan-European economic integration. UNECE includes 56 member States in Europe, North America and Asia.
132
In 1979, 32 countries in the pan-European region signed the UNECE Convention on Long-range Trans-boundary Air Pollution, creating the first international treaty to deal with air pollution on a broad regional basis. The Convention entered into force in 1983, laying down the general principles of international cooperation for air pollution abatement and setting up an institutional framework which has since brought together research and policy. Over the years, the number of substances covered by the Convention and its protocols has been gradually extended, notably to ground-level ozone, persistent organic pollutants, heavy metals and particulate matter.
133
The Convention has substantially contributed to the development of international environmental law and has created the essential framework for controlling and reducing the damage to human health and the environment caused by trans-boundary air pollution.
3.1.6. ASEAN Agreement on Trans-boundary Haze Pollution
The Governments of the 10 ASEAN Member Countries signed the Association of Southeast Asian Nations (ASEAN) Agreement on Trans-boundary Haze Pollution on 10 June 2002 in Kuala Lumpur, Malaysia. The Agreement is the first regional arrangement in the world that binds a group of contiguous states to tackle trans-boundary haze pollution resulting from land and forest fires. It has also been considered as a global role model for the tackling of trans-boundary issues.
The Agreement requires the Parties to the Agreement to:134
(i) cooperate in developing and implementing measures to prevent, monitor, and mitigate trans-boundary haze pollution by controlling sources of land and/or forest fires, development of monitoring, assessment and early warning systems, exchange of information and technology, and the provision of mutual assistance;
131
http://chm.pops.int/TheConvention/Overview/tabid/3351/Default.aspx 132
Air Pollution-Environmental Policy-UNECE< https://www.unece.org/env/lrtap/welcome.html 133
The Convention and its Achievements www.unece.org/environmental-policy/conventions/envlrtapwelcome/the-air-convention-and-its-protocols/the-convention-and-its- achievements.html
134 ASEAN Agreement on Trans-boundary Haze Pollution https://haze.asean.org/asean-agreement-on-transboundary-haze-pollution/

37
(ii) respond promptly to a request for relevant information sought by a State or States that are or may be affected by such trans-boundary haze pollution, with a view to minimising the consequence of the trans-boundary haze pollution; and
(iii) take legal, administrative and/ or other measures to implement their obligations under the
Agreement.
The Agreement establishes an ASEAN Coordinating Centre for Trans-boundary Haze Pollution Control to facilitate cooperation and coordination in managing the impact of land and forest fires in particular haze pollution arising from such fires. The Agreement entered into force on 25 November 2003.
3.2. Responses of international organizations in helping governments reduce and combat air pollution and its health effects
3.2.1. World Health Organization
The WHO is tasked, among other things, to significantly strengthen its capacity in the field of air pollution and health in order to: provide member states with support and guidance to implement WHO air quality standards; guide and influence research strategies in the field of air pollution and health; and to exercise global health leadership that maximizes synergies and avoids duplication.
The WHO Secretariat strengthened its technical capacities to support Member States in taking action on air pollution. This includes further building capacity to: implement the "WHO air quality guidelines" and "WHO indoor air quality guidelines; conduct cost-benefit assessment of mitigation measures; and advance research into air pollution‘s health effects and effectiveness.
Air quality guidelines have been published by WHO in 1987 and they were revised in 1997. Given the wealth of new studies on the health effects of air pollution that have been published in the scientific literature since the completion of the second edition of the Air Quality Guidelines for Europe, including important new research from low-and middle-income countries where air pollution levels are at their highest, WHO has undertaken to review the accumulated scientific evidence and to consider its implications for its air quality guidelines.
135
The WHO also sets recommended limits for health-harmful concentrations of key air pollutants both outdoors and inside buildings and homes based on global synthesis of scientific evidence. WHO guideline published in 2005 covers annual and daily concentrations of fine particulates, nitrogen dioxide, sulphur dioxide, carbon monoxide and ozone. Guidelines published in 2009 and 2010 cover indoor mould and dampness and emissions of gases and chemicals from furnishings and building materials that collect indoors. WHO Guideline published in 2014 covers indoor air quality - household fuel combustion, set limits on emissions from cooking and heating stoves, as well as recommendations regarding clean fuel use.
136
Table 8 below summarizes the WHO Air Quality Guidelines useful for audit on air pollution.
Table 8 - WHO Air Quality Guidelines
WHO Air Quality Guidelines
Particulars
Air quality guidelines for particulate matter, ozone, nitrogen dioxide and sulphur dioxide - Global update 2005
These guideline offer guidance on reducing the effects on health of air pollution. It deals with the revised guideline values for the four most common air pollutants - particulate matter, ozone, nitrogen dioxide and sulphur dioxide - based on a review of the accumulated scientific evidence.
The rationale for selection of each guideline value is supported by a synthesis of information emerging from research on the health effects of each pollutant. As a result, these guidelines now also apply globally. Further, it summarizes information on: pollution sources and levels in various parts of the world population exposure and characteristics affecting sensitivity to pollution
135 https://www.who.int/phe/health_topics/outdoorair/outdoorair_aqg/en/ 136 https://www.who.int/airpollution/guidelines/en/

38
WHO Air Quality Guidelines
Particulars
methods for quantifying the health burden of air pollution the use of guidelines in developing air quality standards and other policy
tools.
Link to the document: https://apps.who.int/iris/bitstream/handle/10665/69477/WHO_SDE_PHE_OEH_06.02_eng.pdf?sequence=1
Indoor Air Quality - Dampness and Mould (2009)
These guidelines review the evidence on health impacts from indoor dampness and exposure to microbes such as mould, fungi and bacteria which emit spores into indoor air. The document also summarizes the available information on the conditions that determine the presence of mould and measures to control their growth indoors. The review concludes that the most important health effects are increased prevalence of respiratory symptoms, allergies and asthma as well as perturbation of the immunological system. The guidelines also explain how well-designed, well-constructed, well-maintained building envelopes are critical to the prevention of microbial growth and moisture. The most important means for avoiding adverse health effects is the prevention (or minimization) of persistent dampness and microbial growth on interior surfaces and in building structures.
Link to the document: https://www.who.int/airpollution/guidelines/dampness-mould/en/
Indoor air quality - selected pollutants (2010)
These guidelines make recommendations for reducing health risks from exposure to ambient emissions of gases and chemicals that may infiltrate and collect indoors, as well as from chemicals that may be used in building materials or furnishings that contribute to indoor air pollution. Pollutants covered include benzene, carbon monoxide, formaldehyde, naphthalene, nitrogen dioxide, polycyclic aromatic hydrocarbons, radon, tri-chloro-ethylene and tetra-chloro-ethylene. These substances are often found indoors in concentrations high enough to merit concern.
The guidelines aim to eliminate or reduce exposure to these pollutants, and are targeted at public health professionals, specialists and authorities involved in the design of buildings and indoor materials and products. They provide a scientific basis for legally enforceable standards.
Link to the document: http://www.euro.who.int/en/health-topics/environment-and-health/air-quality/publications/2010/who-guidelines-for-indoor-air-quality-selected-pollutants
Indoor air quality - household fuel combustion (2014)
These guidelines aim to help public health policy-makers, as well as specialists working on energy and resource issues, understand and implement best approaches to reducing household air pollution. This extensive scientific assessment identifies which energy systems can be considered clean for health in the home, and specifies the levels of emissions that pose health risks.
The guidelines also include recommendations against the use of unprocessed coal as a household fuel, and against the use of kerosene as a household fuel, in the light of health and safety risks. Another recommendation addresses the need for policies that prioritize substantial health benefits during the transition from use of solid, polluting fuels to clean fuels and technologies, especially in low-income and rural households.
Link to the document: https://www.who.int/airpollution/publications/household-fuel-combustion/en/
The WHO responses (Fact sheet updated September 2016) are as follows:
adopted a resolution and a road map for an enhanced global response to the adverse health effects of air pollution.
developed and produced "Air quality guidelines" recommending exposure limits to key air pollutants.
created detailed health-related assessments of different types of air pollutants, including particulates and black carbon particles, ozone, etc.
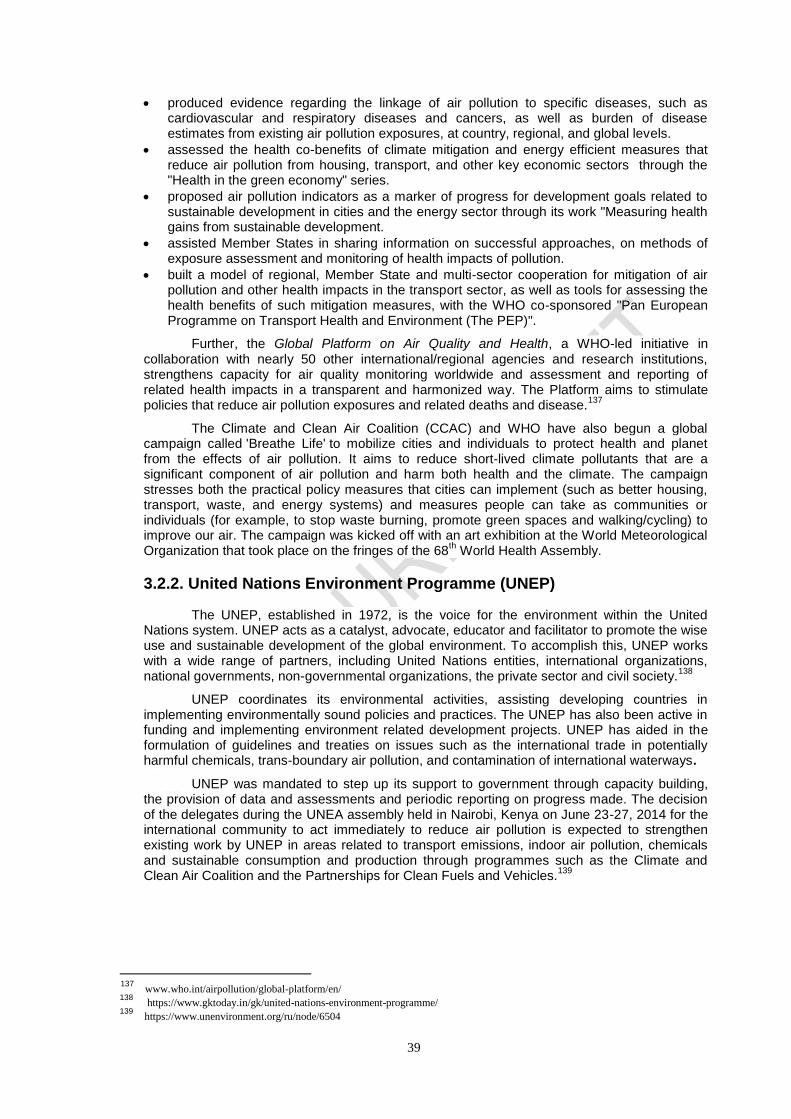
39
produced evidence regarding the linkage of air pollution to specific diseases, such as cardiovascular and respiratory diseases and cancers, as well as burden of disease estimates from existing air pollution exposures, at country, regional, and global levels.
assessed the health co-benefits of climate mitigation and energy efficient measures that reduce air pollution from housing, transport, and other key economic sectors through the "Health in the green economy" series.
proposed air pollution indicators as a marker of progress for development goals related to sustainable development in cities and the energy sector through its work "Measuring health gains from sustainable development.
assisted Member States in sharing information on successful approaches, on methods of exposure assessment and monitoring of health impacts of pollution.
built a model of regional, Member State and multi-sector cooperation for mitigation of air pollution and other health impacts in the transport sector, as well as tools for assessing the health benefits of such mitigation measures, with the WHO co-sponsored "Pan European Programme on Transport Health and Environment (The PEP)".
Further, the Global Platform on Air Quality and Health, a WHO-led initiative in collaboration with nearly 50 other international/regional agencies and research institutions, strengthens capacity for air quality monitoring worldwide and assessment and reporting of related health impacts in a transparent and harmonized way. The Platform aims to stimulate policies that reduce air pollution exposures and related deaths and disease.
137
The Climate and Clean Air Coalition (CCAC) and WHO have also begun a global campaign called 'Breathe Life' to mobilize cities and individuals to protect health and planet from the effects of air pollution. It aims to reduce short-lived climate pollutants that are a significant component of air pollution and harm both health and the climate. The campaign stresses both the practical policy measures that cities can implement (such as better housing, transport, waste, and energy systems) and measures people can take as communities or individuals (for example, to stop waste burning, promote green spaces and walking/cycling) to improve our air. The campaign was kicked off with an art exhibition at the World Meteorological Organization that took place on the fringes of the 68
th World Health Assembly.
3.2.2. United Nations Environment Programme (UNEP)
The UNEP, established in 1972, is the voice for the environment within the United Nations system. UNEP acts as a catalyst, advocate, educator and facilitator to promote the wise use and sustainable development of the global environment. To accomplish this, UNEP works with a wide range of partners, including United Nations entities, international organizations, national governments, non-governmental organizations, the private sector and civil society.
138
UNEP coordinates its environmental activities, assisting developing countries in implementing environmentally sound policies and practices. The UNEP has also been active in funding and implementing environment related development projects. UNEP has aided in the formulation of guidelines and treaties on issues such as the international trade in potentially harmful chemicals, trans-boundary air pollution, and contamination of international waterways.
UNEP was mandated to step up its support to government through capacity building, the provision of data and assessments and periodic reporting on progress made. The decision of the delegates during the UNEA assembly held in Nairobi, Kenya on June 23-27, 2014 for the international community to act immediately to reduce air pollution is expected to strengthen existing work by UNEP in areas related to transport emissions, indoor air pollution, chemicals and sustainable consumption and production through programmes such as the Climate and Clean Air Coalition and the Partnerships for Clean Fuels and Vehicles.
139
137 www.who.int/airpollution/global-platform/en/ 138
https://www.gktoday.in/gk/united-nations-environment-programme/ 139
https://www.unenvironment.org/ru/node/6504

40
3.2.3. United Nations Educational, Scientific and Cultural Organization (UNESCO)
On 28 November 2016, the UNESCO, very concerned about the air pollution in Nepal, has organized a brainstorming meeting to address the critical situation in the Kathmandu Valley. The consultations with presentations on air pollution and climate change in the country brought together government officials, experts and activists from the region. The goal was to provide a platform to facilitate exchange of knowledge, experiences and follow up.
140
3.2.4. Organization for Economic Cooperation and Development (OECD)
The OECD, which traces its roots to the Marshall Plan, groups 35 member countries committed to democratic government and the market economy. It provides a forum where governments can compare and exchange policy experiences, identify good practices and adopt decisions and recommendations. Dialogue, consensus, and peer review and pressure are at the very heart of the OECD.
The OECD is working for a stronger, cleaner and fairer world economy. The principal aim of the OECD is to promote policies for sustainable economic growth and employment, a rising standard of living, and trade liberalisation. By ―sustainable economic growth‖ the OECD means growth that balances economic, social and environmental considerations.
141
The OECD is one of the world‘s largest and most reliable sources of comparable statistical, economic and social data. It monitors trends, collects data, analyses and forecasts economic development, and investigates evolving patterns in a broad range of public policy areas such as agriculture, development co-operation, education, employment, taxation and trade, science, technology, industry and innovation in addition to environment.
The OECD report The Economic Consequences of Outdoor Air Pollution published on June 09, 2016, provides a comprehensive assessment of the economic consequences of outdoor air pollution in the coming decades, focusing on the impacts on mortality, morbidity, and changes in crop yields as caused by high concentrations of pollutants. Unless more stringent policies are adopted, findings point to a significant increase in global emissions and concentrations of air pollutants, with severe impacts on human health and the environment. The market impacts of outdoor air pollution are projected to lead to significant economic costs, which are illustrated at the regional and sector levels, and to substantial annual global welfare costs.
142
Similarly, the OECD Environmental Outlook to 2050: Consequences of Inaction provides for the first time a plausible global projection of the magnitude of the economic consequences of outdoor air pollution in absence of policy action other than those already in place. The projections thus reflect the costs of inaction of outdoor air pollution.
The report focuses on the impacts of outdoor air pollution caused by high concentrations of particulate matter (PM2.5) and ground level ozone for the period 2015-2060. The report projects the market costs of outdoor air pollution (focusing on labour productivity, health care expenditures due to illness and changes in crop yields) using a modelling approach, which links economic activity to emissions of air pollutants, concentrations, biophysical impacts and finally feedback effects from these impacts on the economy. The analysis also evaluates non-market health impacts (mortality and morbidity) using results from direct valuation studies.
3.3. Assistance and provision of funding sources in support of programs and projects related on impacts of air pollution on health
140
Air Pollution< http://www.unesco.org/new/en/kathmandu/natural-sciences/air-pollution/ 141
Environment - OECD.org < http://www.oecd.org/env/OECD-work-on-environment-2017-2018.pdf 142 http://www.oecd.org/env/the-economic-consequences-of-outdoor-air-pollution-9789264257474-en.htm

41
The World Bank (WB) Group works with developing countries and development partners to reduce pollution, implement proper waste management, improve water and air quality, and promote clean development for healthier lives and better economic opportunity.
143
World Bank provides technical assistance, financing and knowledge products that cover, among others:
improving air quality through the reduction of indoor/outdoor air pollution;
reducing short lived climate pollutants for climate change mitigation;
promoting environmental sustainability through cleaner production and pollution prevention; and
strengthening environmental institutions by helping countries improve environmental governance, regulation and enforcement.
Between Fiscal Years 2009 and 2016, WB commitments (IBRD/IDA) to pollution management and environmental health amounted to more than US$ 7 billion.
In 2014, the WB established a Multi-donor Trust Fund for Pollution Management and Environmental Health (PMEH-MDTF) to promote more systematic and effective responses to deadly and costly air pollution in selected low income countries including Egypt, India, Nigeria, South Africa and Vietnam.
Working jointly with client countries, the Bank also carries out analytical work to identify environmental priorities for poverty alleviation. Among the analytical work completed recently, the Bank worked with Pakistan, whose cities have some of the world's least healthy air, to develop policy options to combat air pollution.
Recently approved loans in FYs 2015 and 2016, include projects to improve air quality in several countries, such as presented in Figure XVI below.
144
Figure XVI. Projects to improve air quality in several countries
1. China - reducing emissions of specific air pollutants in the Province of Hebei and increasing energy efficiency and clean energy in the Beijing-Tianjin-Hebei region
Photo Source
145
2. Peru - supporting air and water quality monitoring systems. It helped improve air quality in the country‘s largest cities by reducing the content of sulphur in diesel, converting vehicles so they can run on natural gas instead of other polluting fuels, and setting up a system to ensure that vehicles‘ emissions are within permissible limits.
Photo source
146
3. Zambia - remediating critically polluted mining sites.
Photo source 147
143
Reducing Pollution < http://www.worldbank.org/en/topic/environment/brief/pollution 144
Ibid. 145
http://en.chinagate.cn/2016-03/23/content_38091784.htm 146
https://www.theguardian.com/environment/andes-to-the-amazon/2017/may/01/perus-plans-cut-air-quality- rules-smooth-sale-major-polluter
147 http://www.miningne.ws/2016/11/30/zambia-mines-say-proposed-copper-import-duty-will-hurt-smelters/#

42
4. Bangladesh (Dhaka) - helping modernize brick kilns to reduce air
pollution; mitigate greenhouse gas emissions; and increase productivity. Carbon emission reduction credits generated by the project are helping improve working conditions, protect people‘s health and provide better pay for workers.
Photo source148
5. Mexico (Mexico City) - policy-based loan aimed at reducing pollution
Photo source149
6. Chile (Santiago) - policy-based loan aimed at reducing pollution. Anti-pollution actions taken bring health and economic benefits to local residents
Photo source150
7. Thailand- policy-based loan aimed at reducing pollution. Anti-pollution actions taken bring health and economic benefits to local residents
Photo source
151
8. Morocco - adoption of policies to reduce the emission of air pollutants and greenhouse gas emissions.
Photo source152
Conclusion
Air pollution is an international concern. International organizations put their best efforts to cope with this problem by crafting several international agreements and provision of funds to address the limited levels of financing, administrative support and infrastructure of governments towards full implementation of their policies on air pollution. It is important for SAIs to understand the importance of several international agreements such WHO air quality guidelines as standards to
148
Sandrine Boukerche, World Bank Group http://www.worldbank.org/en/news/feature/2016/07/20/modern-brick-kilns-yield-development-benefits-in-bangladesh
149 http://www.humanosphere.org/environment/2016/04/mexico-city-bans-cars-one-day-a-week-to-combat-ongoing
- pollution-problem/ 150
http://www.worldbank.org/en/news/feature/2015/04/13/from-santiago-to-bangkok-cleaner-air-brings-healthier-lives 151
Ibid 152 http://www.worldbank.org/en/news/feature/2015/11/23/ green-growth-putting-morocco-in-the-lead-against-climate-change

43
compare with the real practice in their own countries and to support the governments in improving the air quality.
Chapter IV: AUDITS CONDUCTED ON AIR POLLUTION ISSUES BY SAIs and CHALLENGES ENCOUNTERED IN AUDIT AND BEST APPROACHES AND PRACTICES ADOPTED TO ACHIEVE AUDIT OBJECTIVES
As discussed in Chapter 1, air pollution has become a growing concern in the past few years. Air pollution affects practically all countries in the world and all parts of society. It continues to pose a significant threat to health worldwide and that air pollution is linked to seven million premature deaths. The World Health Assembly noted with deep concern that indoor and outdoor air pollution are both among the leading avoidable causes of disease and death globally, and the world‘s largest single environmental health risk.
The SAIs also recognized the potential health risks and problems of air pollution. As such, many SAIs had conducted audits of issues related to air pollution as shown in the case studies.
4.1. Scope, Objectives, Criteria and Methodologies on Audits Conducted by SAIs and SDGs
The aim of this section is to gather/obtain information/data on best practices and knowledge of the INTOSAI WGEA community in auditing issues on air pollutions and its health impact as well as their audit objectives, scope, methodologies adopted/employed, audit criteria used, audit findings and the recommendations offered to address observations noted during the audit. These best practices gathered can serve as guide and references of SAIs in their audit works related to air pollution issues.
These studies present the different audits conducted by 12 SAIs which covered different
topics but with focus on air pollution153
. Based on the 12 case studies, several conclusions are withdrawn and presented in figures below.
153
SAI of France: Public Action to Control and Decrease Air Contamination https://www.ccomptes.fr/fr/publications/les-politiques-publiques-de-lutte-contre-la-pollution-de-lair
SAI of Romania: Air Quality Monitoring and Efficient Management of Greenhouse Gas Emissions Certificates, allocated to Romania
under the Kyoto Protocol http://curteadeconturi:ro/publicatii.aspx?catog=11/24/2015%2010:19:49%20AM SAI of Thailand: Performance Audit on Air Quality Control Measures: Bangkok Metropolitan Administration (BMA)
https://slideplayer.com/slide/13324923/
SAI of Republic of Macedonia: Measures to Improve Air Quality http://www.dzr.mk/Uploads/56_RU_Kvalitet_na_vozduhot_2017_REDUCE.pdf
SAI of South Korea: Seoul Metropolitan Air Quality Improvement Plan
intosai-korea-national_report
SAI of Norway: Investigation into How Authorities Work to Ensure Good Ambient Air Quality in Citie
https://www.riksrevisjonen.no/presserom/Pressemeldinger/Sider/LuftkvalitetBy.aspx
SAI of Kuwait: Emissions Resulting from Oil Refineries kuwait_s_eng_emission-resulting-from-oil-refineries
SAI of Finland: Consideration of the Health and Cost Impacts of Fine Particles in the Preparation of Strategies
summary_english_17_2015_considerationof_the_health_and_impacts_of_fine_particles_in_the_preparation_of_strategies SAI of Philippines: Compliance with Republic Act (RA). No. 9003 otherwise known as the Ecological Solid Waste Management Act of
2000 (with focus on air pollution) www.coa.gov.ph
SAI of Mexico: Compliance with Regulation on Prevention and Control of Pollution https://www.asf.gob.mx/Trans/Informes/IR2014i/Documentos/Fichas/Ficha_DE_a.pdf
SAI of India: Implementation of Environmental Rules and Laws by Uttar Pradesh Pollution Control
Boardhttps://www.cag.gov.in/sites/default/files/audit_report_files/Report_No.1_of_2017_E2893_Economic_Sector_Government_of_Uttar_Pradesh.pdf
SAI o European Court of Auditors: Air pollution: Our health still insufficiently protected
E:/Project Plan Final Outputs/Audit Reports/ECA/SR 023_2018 Air pollution
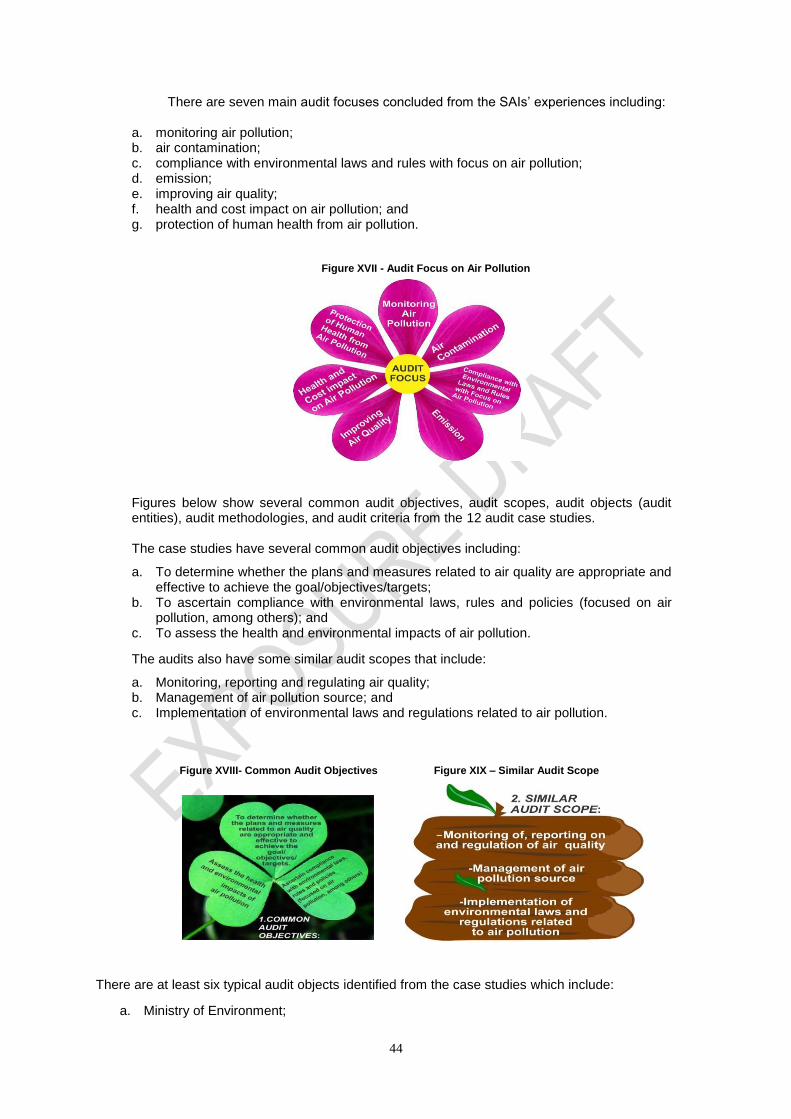
44
There are seven main audit focuses concluded from the SAIs‘ experiences including:
a. monitoring air pollution; b. air contamination; c. compliance with environmental laws and rules with focus on air pollution; d. emission; e. improving air quality; f. health and cost impact on air pollution; and g. protection of human health from air pollution.
Figure XVII - Audit Focus on Air Pollution
Figures below show several common audit objectives, audit scopes, audit objects (audit entities), audit methodologies, and audit criteria from the 12 audit case studies. The case studies have several common audit objectives including:
a. To determine whether the plans and measures related to air quality are appropriate and effective to achieve the goal/objectives/targets;
b. To ascertain compliance with environmental laws, rules and policies (focused on air pollution, among others); and
c. To assess the health and environmental impacts of air pollution.
The audits also have some similar audit scopes that include:
a. Monitoring, reporting and regulating air quality; b. Management of air pollution source; and c. Implementation of environmental laws and regulations related to air pollution.
Figure XVIII- Common Audit Objectives Figure XIX – Similar Audit Scope
There are at least six typical audit objects identified from the case studies which include:
a. Ministry of Environment;

45
b. Environment Protection Authority (EPA); c. Pollution Control Department; d. National Air Quality Monitoring Network; e. Local Government; and f. Plans for Air Quality - Short Term Action Plans and Air Quality Maintenance Plans.
Several common audit methodologies used are also identified among these 12 case
studies such as:
a. Verification of the relevant/pertinent records; b. Examination/study/analysis/review of records, reports, data and documents (internal and
external); c. Conduct/use of surveys/questionnaires; d. Observation/inspection; e. Interviews, data collection, and statistics; f. Statistical analysis.
Similar audit criteria are were used by the SAIs in auditing the air pollution-related topics, for example:
a. Laws and regulations related to environment (air pollution); b. Relevant national legislative framework; c. Indicators reported to the European Commission and/or to the UNFCCC Secretariat; d. Audit standards of the SAIs, international standards on auditing published by INTOSAI,
general framework and the performance audit manual developed by SAIs; e. Objectives reflected in plans/strategies; f. European Union (EU) Air Quality Directives; g. Government established public policy of environmental protection.
Figure XX- Typical Subjects of Audit Figure XXI – Common Audit Methodologies
Figure XXII – Similar Audit Criteria
In addition to the above audit criteria adopted/used by the SAIs included in the case
studies, the SDGs can also be relevant and suitable sources thereon. SDGs are the blueprint to
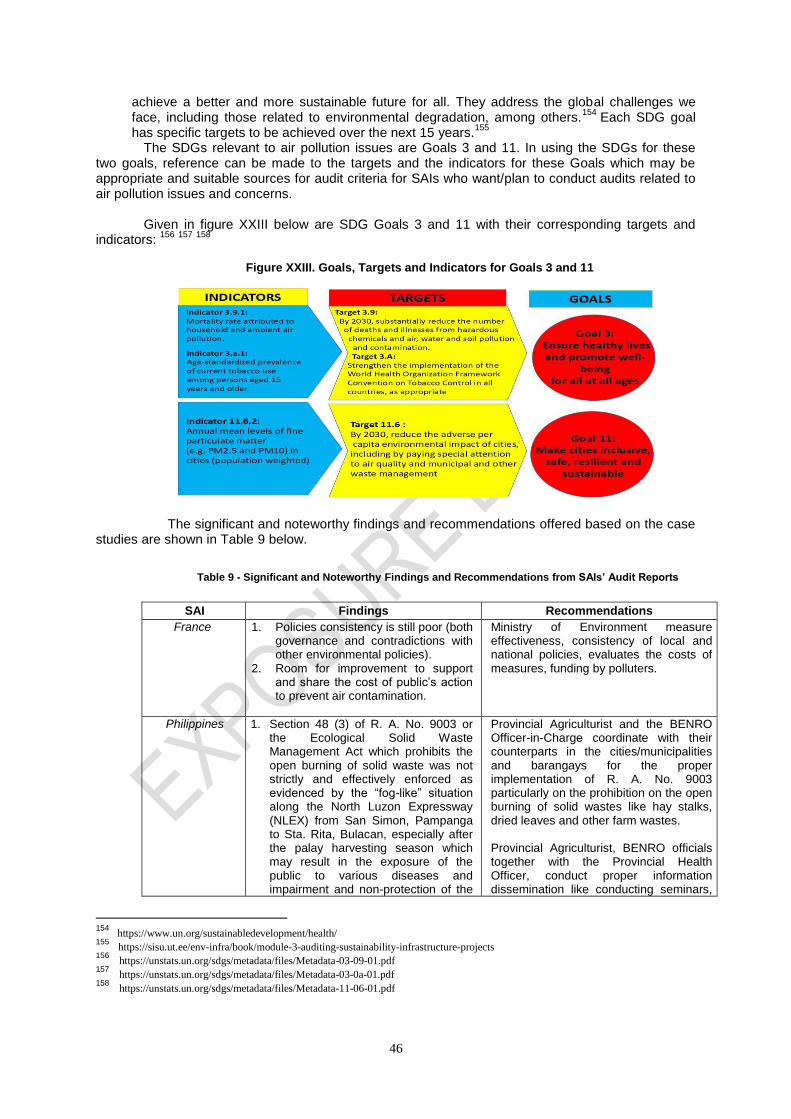
46
achieve a better and more sustainable future for all. They address the global challenges we face, including those related to environmental degradation, among others.
154 Each SDG goal
has specific targets to be achieved over the next 15 years.155
The SDGs relevant to air pollution issues are Goals 3 and 11. In using the SDGs for these
two goals, reference can be made to the targets and the indicators for these Goals which may be appropriate and suitable sources for audit criteria for SAIs who want/plan to conduct audits related to air pollution issues and concerns.
Given in figure XXIII below are SDG Goals 3 and 11 with their corresponding targets and
indicators: 156
157
158
Figure XXIII. Goals, Targets and Indicators for Goals 3 and 11
The significant and noteworthy findings and recommendations offered based on the case studies are shown in Table 9 below.
Table 9 - Significant and Noteworthy Findings and Recommendations from SAIs’ Audit Reports
SAI Findings Recommendations
France 1. Policies consistency is still poor (both governance and contradictions with other environmental policies).
2. Room for improvement to support and share the cost of public‘s action to prevent air contamination.
Ministry of Environment measure effectiveness, consistency of local and national policies, evaluates the costs of measures, funding by polluters.
Philippines 1. Section 48 (3) of R. A. No. 9003 or the Ecological Solid Waste Management Act which prohibits the open burning of solid waste was not strictly and effectively enforced as evidenced by the ―fog-like‖ situation along the North Luzon Expressway (NLEX) from San Simon, Pampanga to Sta. Rita, Bulacan, especially after the palay harvesting season which may result in the exposure of the public to various diseases and impairment and non-protection of the
Provincial Agriculturist and the BENRO Officer-in-Charge coordinate with their counterparts in the cities/municipalities and barangays for the proper implementation of R. A. No. 9003 particularly on the prohibition on the open burning of solid wastes like hay stalks, dried leaves and other farm wastes. Provincial Agriculturist, BENRO officials together with the Provincial Health Officer, conduct proper information dissemination like conducting seminars,
154
https://www.un.org/sustainabledevelopment/health/ 155 https://sisu.ut.ee/env-infra/book/module-3-auditing-sustainability-infrastructure-projects 156
https://unstats.un.org/sdgs/metadata/files/Metadata-03-09-01.pdf 157
https://unstats.un.org/sdgs/metadata/files/Metadata-03-0a-01.pdf 158
https://unstats.un.org/sdgs/metadata/files/Metadata-11-06-01.pdf

47
SAI Findings Recommendations
environment.
2. Lack of awareness of the ordinance especially in the barangays which should be directly involved in the implementation.
production of posters/tarpaulins on the harmful effects to the health of the public of smoke from burning of solid wastes.
India 1. Uttar Pradesh Pollution Control Board (UPPCB) UPPCB failed to take adequate measures to control the level of PM10 and to monitor the remaining nine parameters as it did not have facility to monitor all parameters of air quality under NAAQS.
2. UPPCB had not installed the necessary software and hardware at its headquarter for centralised data collection and its analysis so far (March 2016). As a result, UPPCB could not link online even with the industries that have installed online monitoring devices.
3. No monitoring was being done and no directions were issued by UPPCB on the volume of fly ash generated.
UPPCB should take necessary measures to improve the quality of the air, install Continuous Ambient Air Quality Monitoring Stations, continuous emission and effluent monitoring mechanism and monitor full utilisation of fly ash as directed by Central Pollution Control Board (CPCB)/MoEF.
ECA Public awareness and information has a critical role in addressing air pollution, a pressing public health issue. Recently, citizens have been getting more involved in air quality issues and have gone to national Courts, which have ruled in favour of their right to clean air in several Member States. Yet, ECA found that the Ambient Air Quality Directive protects citizens‘ rights to access to justice less explicitly than some other environmental Directives. The information made available to citizens on air quality was sometimes unclear.
1. Identify and compile, with the help of health professionals, the most critical information that the Commission and Member States authorities should make available to citizens (including health impacts and behavioural recommendations).
2. Support the Member States to adopt best practices to communicate with and involve citizens in air quality matters.
3. Develop an online tool that allows citizens to report on air quality violations and provide feedback to the Commission on issues related to Member States‘ actions on air quality.
Kuwait By reviewing Kuwait National Petroleum Company's air pollution measurement of Al-Ahmadi refinery for the year 2009, and comparing it with air emissions from fixed sources, Annex No. (20), decision no. 210 of 2001, the following was found: 1. The measurement results of sulphur
dioxide (SO2) exceeded the standard rates in fluidized catalytic cracker factor (9.8kg).
2. The measurement results of sulphur dioxide (SO2) exceeded the standard rates (250 ppmv).
3. The measurement results of sulphur dioxide (SO2) exceeded the standard rates of Claus Sulphur Recovery Unit due to the compulsory stopping of one of the two units and putting extra load on the other unit.
4. The measurement results of Hydrogen sulphide in fuel gas (H2S) exceeded the standard rates
Monitor air quality in oil refineries areas and define sources that cause air pollutants emissions, and find solutions to limit the problem in order to ensure a clean and healthy work environment.
48
SAI Findings Recommendations
(230mg).
South Korea The data of the performance report was not reliable and the feedback system was not proper for amending the plan.
Set-up adequate performance evaluation and verification on the plan, and proper feedback system to amend with reflecting the performance evaluation result.
Romania
1. Air quality data from stations is available to the public in real time via the website www.calitateaer.ro, on external panels (in densely populated areas of cities) and on indoor panels (located at the headquarters of the authorities/ organization).
2. Due to the insufficient funds allocated
to the maintenance of the National Air Quality Monitoring Network, monitoring stations with faulty physical equipment as well as a number of indoor and outdoor panels to inform the public about air quality that did not work were identified.
Periodic request for data and statistics from the public health authority on research and studies on the relationship between pollution and public health and their publication on the official website in order to inform and raise awareness of the effects of pollutant emissions on the health of the population.
Ensure that people are informed about the concentration of pollutants in the atmosphere in all possible environments and that the official website should be updated in real time about the risks that affect air quality.
Former Yugoslav Republic of Macedonia
1. Republic of Macedonia is not subject to sanctions for non-compliance with the goals of air quality policies at EU level, nor there are national / local sanctions. Because there are no penalties for not implemented measures in the plans for ambient air quality protection, the process of implementation is very slow. This creates a risk for achievement of established goals, overcoming air pollution and preventing new sources of air pollution.
2. Measures in the National Plan for Ambient Air Protection are complex and cover different areas that should be implemented by institutions at central and local level as well as by individual installations. There is no system for monitoring the implementation of each measure. The National Plan does not contain indicators to measure the effectiveness of policy implementation, which makes monitoring and realization of measures difficult for achieving the goals and policies for combating air pollution.
Imposition of sanctions for non-compliance with the goals of air quality policies and limit values of certain pollutants in the air.
Establish a monitoring system for implementation of measures in the National plan for ambient air protection and indicators to measure the effectiveness of the policy implementation.
Finland Most strategies lacked preliminary impact assessments or the assessments were of fairly general nature. There was little examination of the health impacts of fine particles. Moreover, the strategies did not contain any assessments of the costs arising from the health impacts of fine particles. Furthermore, no strategy options were formulated or assessed as
The audited ministries should, under the auspices of the Ministry of Employment and the Economy, prepare an overall cost assessment of the health impacts generated by fine particles in Finland.
49
SAI Findings Recommendations
part of the preparatory work and no cost-benefit comparisons of the options were produced.
Based on the information given in Table 9, majority of the findings are related to data
availability, monitoring system, compliance to threshold and public awareness. These findings show that SAIs are in one accord that environmental health, with focus on air pollution, is a significant audit area to consider due to its impact and effect to the health of people/public. The SAIs case studies related to air pollution issues are presented in Appendix I.
In addition to the 12 audit reports, a recent report published by EUROSAI Working Group
on Environmental Auditing (EUROSAI WGEA) in 2019 is a valuable source of information for SAIs in auditing air pollution. The audit initiative was taken by EUROSAI WGEA members in regard to the European Union (EU)‘s 2008 Ambient Air Quality Directive (AAQ Directive) implementation that sets air quality standards throughout the EU for concentrations of those air pollutants that have biggest impact on health. The report
159 could be summarized in Figure XXIV below:
Figure XXIV. Summary of Joint Audit on Air Pollution by EUROSAI Member States
Joint Audit Report on Air Quality (2019)
Joint Audit Participants Netherlands (Coordinator), Poland (Coordinator), European Court of Auditors (ECA), Albania, Bulgaria, Estonia, Georgia, Hungary, Israel, Kosovo, Moldova, Romania, Slovakia, Spain, Switzerland, and the Former Yugoslav Republic of Macedonia.
Audit Objective
The joint audit aims to assess how air quality policies and actions are implemented in the participating countries and to generate shared conclusions and recommendations. Lastly, the joint audit will inspire SAIs by sharing good practices and passing on knowledge.
The main audit question was: What is known about the effectiveness and efficiency of measures taken by national and local governments to improve air quality, and are these measures compliant with international and national legislation?
Scope
The joint audit focused on the efficiency and cost-effectiveness policy implementation by 15 member states (participating SAIs) in improving air quality in their country and the effectiveness of EU action to protect human health from air pollution. Audit Criteria
European Union (EU)‘s 2008 Ambient Air Quality Directive (AAQ Directive) which contains criteria for location and the minimum number of sampling points. Findings More than half (eight SAIs) of participating SAIs were not able to audit the effectiveness and efficiency of their respective governments‘ measures due to the absence of adopted policy, the absence of specified performance indicators, and inadequate monitoring information. The overall conclusions of the joint audit were as follow: a. most participating countries do not comply with national and international standards and still exceed limit or
target values; b. not all countries have adopted a national policy; not all have performance indicators; c. there is a lack of coordination among actors and policies; d. governments have limited information on budgets;
159
Full report can be accessed at: https://www.eurosaiwgea.org/audits/Audit%20documents/Joint_report_on_air_quality_2019-
MQ_updated2.pdf

50
e. where there is a budget, this is not always sufficient; f. monitoring systems do not always function properly; and g. there is scope for improving public information.
Recommendations
a. prepare and implement air quality plans; b. measure the effectiveness of action taken; c. improve coordination; d. provide relevant data and perform a full cost-benefit analysis; e. improve monitoring systems; and f. raise public awareness.
4.2. Challenges Encountered by SAIs in Auditing Air Pollution and Strategies Adopted to Achieve Audit Objectives
SAIs encounter/face various challenges and obstacles in conducting audit of issues connected/associated to Environmental Health (focused on Air Pollution). These challenges and obstacles may cause obstructions which may prevent SAIs from pursuing audits relative thereto or if permitted to do so, may render the audit process difficult or time-consuming. However, the SAIs may also develop tactics to help them overcome the hindrances to capacitate their audit personnel and carry out audit engagements efficiently and effectively and attain their audit objectives.
To identify these challenges and obstacles faced by SAIs as well as the strategies
adopted by them to overcome the deterrents in pursuing their audits and achieving their audit objectives, based on their experience, a survey questionnaire was disseminated to the different SAIs, through the WGEA Secretariat. Based on the survey conducted in February 2018, the respondent SAIs totaling 43, identified the audit streams conducted, the various challenges/obstacles faced by them in conducting audit of issues related to Air Pollution and how these barriers were dealt with through employment of appropriate approaches and schemes to lessen their impact, if not totally avoid them.
Figure XXV shows that most SAI respondents conducted performance audit when
auditing air pollution theme while the rest conducted compliance audit. The survey also identified the challenges encountered by SAIs in auditing air pollution and the strategies adopted by SAIs to cope with those challenges.
Figure XXV - Types of Audit Conducted by SAIs
Table 10. Challenges Encountered in Audit and Strategies Adopted by SAIs
Challenges Strategies
Policy (Macro) Level Challenges
Insufficient formulation of government environmental policy, such as goals that are not measurable, absence of a strategy, or insufficient regulatory framework
Cooperate with other government agencies, universities or research institutes.

51
Challenges Strategies
Lack of established environmental norms and standards
Use standards of international organizations
Cooperate with other government agencies, universities or research institutes
Develop performance indicators
Agreed performance criteria with the auditees
Use benchmarking with international/other SAI‘s standards
Scattered and somewhat unclear roles and responsibilities between different ministries, and between local/regional/national government
Exchange of knowledge and experience with other SAIs
Use standards of international organizations
Non/partial compliance with guidelines issued by the State Pollution Control boards and Non-compliance with statutory regulations
Exchange of knowledge and experience with other SAIs
External Challenges
Lack/difficulty in accessing data Cooperate with other government agencies, universities or research institutes
Exchange of knowledge and experience with other SAIs
Risk in validating reported data/information
Location of the monitoring points Monitoring with the auditee in terms of site visits and
use historical data
Lack/insufficient monitoring and reporting systems Engage services of experts
Use of standards of international organizations
Cooperate with other government agencies, universities or research institutes
Use benchmarking with international/other SAIs‘ standards
Exchange of knowledge and experience with other SAIs
Lack/insufficient data on the state of air pollution and its health impact and access to the same
Cooperate with other government agencies, universities or research institutes
Exchange of knowledge and experience with other SAIs
Lack/insufficient suitable and relevant audit criteria Exchange of knowledge and experience with other SAIs
Engage services of experts
Use of standards of international organizations
Agreed performance criteria with the auditees
Use benchmarking with international/other SAIs‘ standards
Cooperate with other government agencies, universities or research institutes
Internal Challenges
Lack of mandate of SAIs Modify/Amend SAI mandate
Lack of/inadequate human resources of SAI Engage services of experts
Lack of/inadequate skills or expertise and trainings within the SAI
Peer review by other SAIs
Train/send SAI personnel to training programs of other organizations
Exchange of knowledge and experience with

52
Challenges Strategies
other SAIs
Engage services of experts
External training of staff
Negative responses from the auditee Agreed performance criteria with the auditees
Exchange of knowledge and experience with other SAIs
Lack of cooperation of the auditee
Conclusion SAIs consider air pollution and its effects a significant and relevant audit topics due to its adverse impact on public. With this consideration, the SAIs included this audit area in their audits.
Although there have been challenges and barriers in the conduct of audit of issues related to
air pollution and its impact, the SAIs have devised/adopted approaches and strategies to address these hindrances in order to pursue their mandates, attain audit objectives and help the governments find ways on how to resolve and minimize, if not abate, the issues and concerns related to air pollution.

53
Appendix I SAIs Case Studies
I. On Air Contamination
Topic 1: Public Action to Control and Decrease Air Contamination
2016: SAI of France Audit objectives: Evaluate the public action to control and decrease air contamination Audit scope:
1. European context 2. National objectives, policy, regulatory framework, funding and taxation 3. Public response to contamination events
Audit methodologies:
1. Interviews, data collection, statistics 2. Online survey of regional entities 3. Survey of NGO involved in air quality monitoring 4. European survey (Germany, Italy, Netherlands, UK and Switzerland) 5. Auditions of experts and ministerial directors
Audit criteria:
1. Policies consistency 2. Efficiency 3. Utility and effectiveness 4. Adaptability and ability to react quickly
Audit findings:
1. Public concern for air contamination has raised and is more precise. 2. Policies consistency is still poor (both governance and contradictions with other environmental
policies). 3. Room for improvement to support and share the cost of publics action to prevent air
contamination.
Recommendations:
1. 1 for Ministry of Agriculture (consistency with agriculture policy) 2. 1 for Ministry of Health (sharing information)
3. 10 for Ministry of Environment (measure effectiveness, consistency of local and national policies, evaluate the costs of measures, funding by polluters)
Available at: https://www.ccomptes.fr/fr/publications/les-politiques-publiques-de-lutte-contre-la-pollution-de-lair
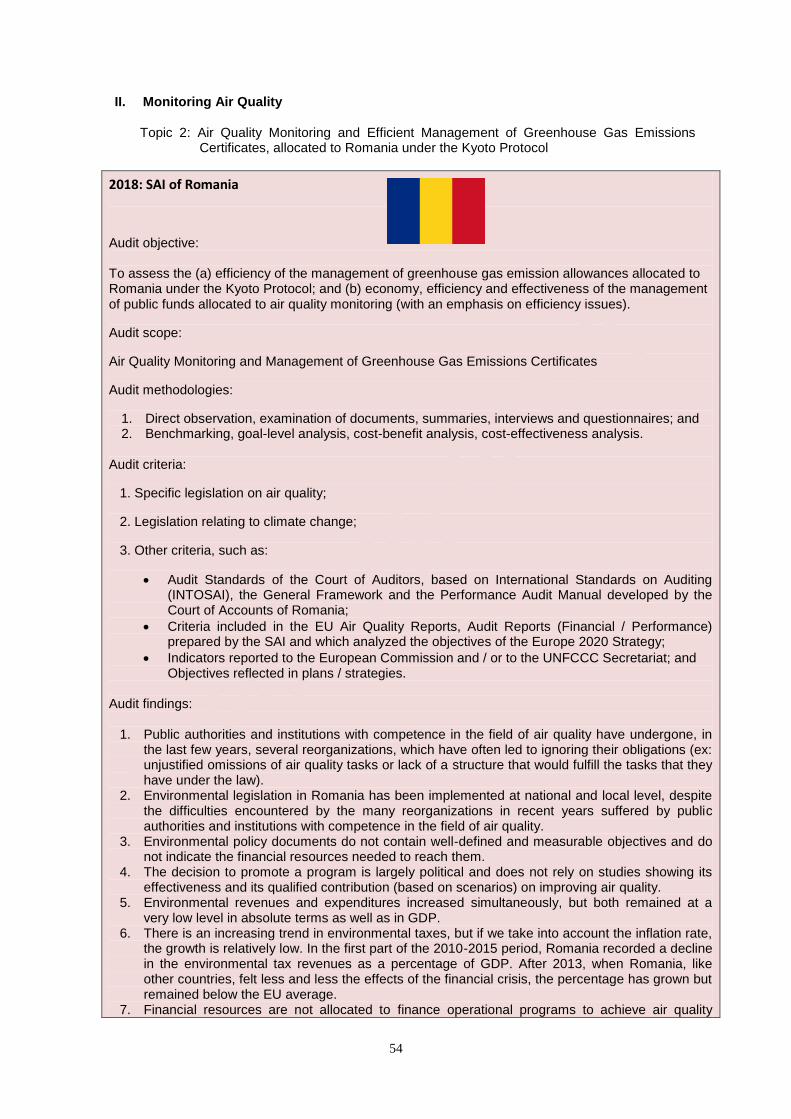
54
II. Monitoring Air Quality
Topic 2: Air Quality Monitoring and Efficient Management of Greenhouse Gas Emissions Certificates, allocated to Romania under the Kyoto Protocol
2018: SAI of Romania
Audit objective: To assess the (a) efficiency of the management of greenhouse gas emission allowances allocated to Romania under the Kyoto Protocol; and (b) economy, efficiency and effectiveness of the management of public funds allocated to air quality monitoring (with an emphasis on efficiency issues).
Audit scope:
Air Quality Monitoring and Management of Greenhouse Gas Emissions Certificates
Audit methodologies:
1. Direct observation, examination of documents, summaries, interviews and questionnaires; and 2. Benchmarking, goal-level analysis, cost-benefit analysis, cost-effectiveness analysis.
Audit criteria:
1. Specific legislation on air quality;
2. Legislation relating to climate change;
3. Other criteria, such as:
Audit Standards of the Court of Auditors, based on International Standards on Auditing (INTOSAI), the General Framework and the Performance Audit Manual developed by the Court of Accounts of Romania;
Criteria included in the EU Air Quality Reports, Audit Reports (Financial / Performance) prepared by the SAI and which analyzed the objectives of the Europe 2020 Strategy;
Indicators reported to the European Commission and / or to the UNFCCC Secretariat; and Objectives reflected in plans / strategies.
Audit findings:
1. Public authorities and institutions with competence in the field of air quality have undergone, in the last few years, several reorganizations, which have often led to ignoring their obligations (ex: unjustified omissions of air quality tasks or lack of a structure that would fulfill the tasks that they have under the law).
2. Environmental legislation in Romania has been implemented at national and local level, despite the difficulties encountered by the many reorganizations in recent years suffered by public authorities and institutions with competence in the field of air quality.
3. Environmental policy documents do not contain well-defined and measurable objectives and do not indicate the financial resources needed to reach them.
4. The decision to promote a program is largely political and does not rely on studies showing its effectiveness and its qualified contribution (based on scenarios) on improving air quality.
5. Environmental revenues and expenditures increased simultaneously, but both remained at a very low level in absolute terms as well as in GDP.
6. There is an increasing trend in environmental taxes, but if we take into account the inflation rate, the growth is relatively low. In the first part of the 2010-2015 period, Romania recorded a decline in the environmental tax revenues as a percentage of GDP. After 2013, when Romania, like other countries, felt less and less the effects of the financial crisis, the percentage has grown but remained below the EU average.
7. Financial resources are not allocated to finance operational programs to achieve air quality

55
objectives. 8. The funds allocated for the maintenance of air quality monitoring equipment were insufficient. 9. The main sources of pollution are generated mainly by economic and industrial activities, by the
transport sector, by residential heating, by agricultural activities, but there are also natural sources such as vegetation fires, extreme meteorological phenomena leading to increased dust levels in the air.
10. Air pollutants, considered in the assessment of ambient air quality in Romania, are suspended particles (PM10 and PM2,5), sulfur dioxide (SO2), nitrogen dioxide (NO2), nitrogen oxides (NOx), lead (Pb), benzene (C6H6), carbon monoxide (CO), ozone (O3), arsenic (As), cadmium (Cd), nickel (Ni). According to the provisions of the Law, in Romania the responsibility for the monitoring of the ambient air quality lies with the authorities for environmental protection. The National Air Quality Monitoring Network (NNMCA) is a national objective of national interest and operates under the Ministry of Environment. At present, the NNMCA includes 148 air quality monitoring stations, 41 analytical laboratories and 41 data collection and processing centers operating at the level of each county and Bucharest Municipality in the field of environmental protection.
11. Air quality data from stations is available to the public in real time via the website www.calitateaer.ro, on external panels (in densely populated areas of cities) and on indoor panels (located at the headquarters of the authorities / organization).
12. Air quality plans and air quality maintenance plans for 2016-2020, although initiated, have not been finalized.
13. Due to the insufficient funds allocated to the maintenance of the National Air Quality Monitoring Network, monitoring stations with faulty physical equipment as well as a number of indoor and outdoor panels to inform the public about air quality that did not work were identified.
Recommendations:
1. Perform an analysis regarding the equipment of the National Air Quality Monitoring Network (NAQMN) with new measurement locations (points) in relation to the classification of areas and agglomerations in air quality assessment regimes as well as the need to relocate existing measurement points for certain pollutants. Depending on the outcome of the analysis, for the measurement points to be redefined or relocated, the steps will be taken to obtain the opinion of the European Commission.
2. Complete the general overhaul and repair services of the equipment that form the National Air Quality Monitoring Network so that Romania can provide full air quality reports.
3. Take the necessary measures to ensure the functioning of all indoor and outdoor public information panels.
4. Periodic request for data and statistics from the public health authority on research and studies on the relationship between pollution and public health and their publication on the official website in order to inform and raise awareness of the effects of pollutant emissions on the health of the population.
5. Ensure that people are informed about the concentration of pollutants in the atmosphere in all possible environments, the official website should be updated in real time about the risks that affect air quality.
6. It is necessary to complete the legal framework with provisions sanctioning non-compliance with the Air Quality Plans Methodology, Short-Term Action Plans and Air Quality Maintenance Plans.
7. Coordinate the activities of the authorities with the responsibilities in the field of air quality management at governmental level or to design a coordination body at national level for all activities in this field.
Available on line at: http://curteadeconturi:ro/publicatii.aspx?catog=11/24/2015%2010:19:49%20AM

56
Topic 3: Performance Audit on Air Quality Control Measures: Bangkok Metropolitan Administration (BMA)
SAI of Thailand (Year Report Published not included in the report)
Audit objectives: To determine whether the activities to control air quality of BMA achieved the target.
Audit scope:
Reviewed three activities to control air quality of BMA.
1. Reviewed the implements activities of BMA to detect, monitor and impose restrictions on motor vehicles emitting black smoke.
2. BMA, the Traffic Police Division and Pollution Control Department have set up 50 emission check points with data-link with the vehicle registration database of Land Transport Department.
3. The smoke detection data link system improves emission detections via real-time emission data records and data link-up with the central database at BMA for decision making to solve air pollution issues.
Audit methodologies:
1. Data collection
Primary data: questionnaire, interview and observation.
Secondary data: review documents from BMA and analysis. 2. Questionnaire
50 directors of 50 district offices. 140
Traffic Polices who work in the areas that the PM10 higher than a standard 3. Interview
Director of Air Quality and Noise Management Division, Department of Environment of BMA and 2 staff of the division
4. Observation
44 construction sites in 5 district offices.
Audit criteria:
The Enhancement and Conservation of National Environmental Quality Act Audit findings:
1. Results of black smoke detection had not been reported via the BMA data link system
District offices have not reported the result of black smoke detection through the BMA data link system. BMA has set up the black smoke detection target in year 2009 to accomplish the task district office and traffic police have to closely work in the field together monthly and report the black smoke detection result through the system from the total of 50 district offices.
Two district offices from the total of 50 have cancelled the black smoke checkpoint. Among the 48 district offices that implement the black smoke detection, there is only one of them that report the detection result through the BMA data link system.
2. BMA has not determined the criteria for district offices to define the frequency of road cleaning in each areas.
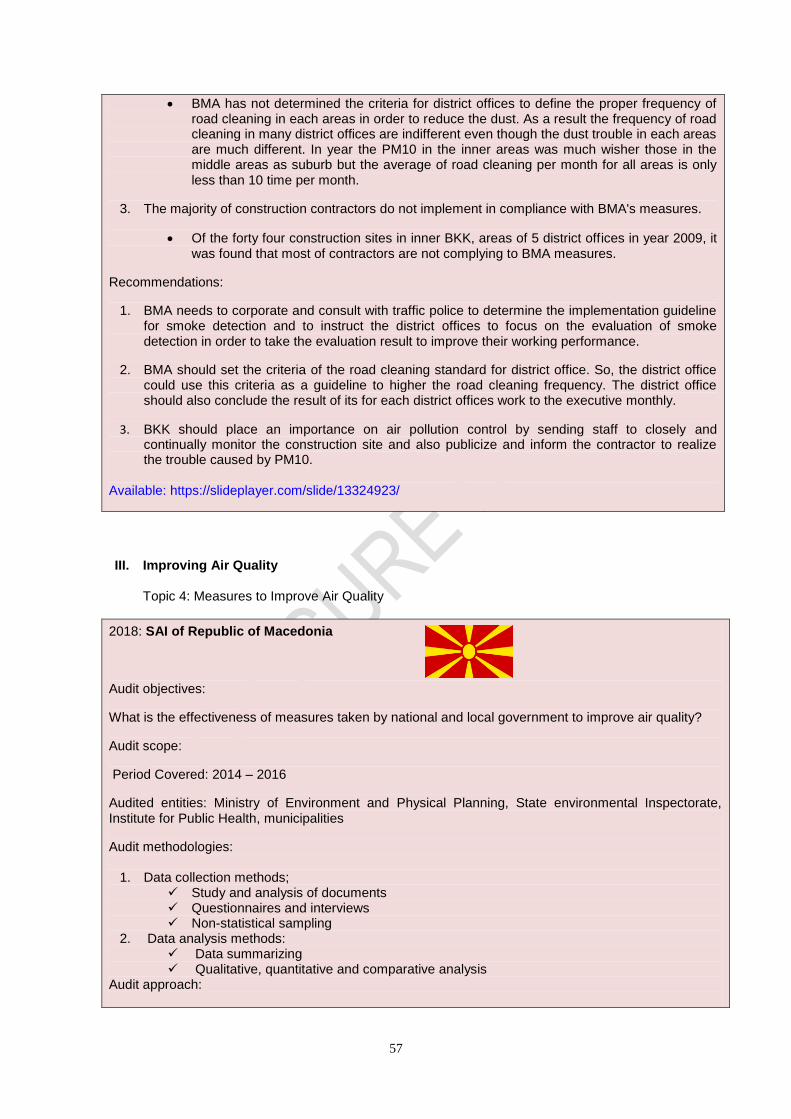
57
BMA has not determined the criteria for district offices to define the proper frequency of road cleaning in each areas in order to reduce the dust. As a result the frequency of road cleaning in many district offices are indifferent even though the dust trouble in each areas are much different. In year the PM10 in the inner areas was much wisher those in the middle areas as suburb but the average of road cleaning per month for all areas is only less than 10 time per month.
3. The majority of construction contractors do not implement in compliance with BMA's measures.
Of the forty four construction sites in inner BKK, areas of 5 district offices in year 2009, it was found that most of contractors are not complying to BMA measures.
Recommendations:
1. BMA needs to corporate and consult with traffic police to determine the implementation guideline for smoke detection and to instruct the district offices to focus on the evaluation of smoke detection in order to take the evaluation result to improve their working performance.
2. BMA should set the criteria of the road cleaning standard for district office. So, the district office could use this criteria as a guideline to higher the road cleaning frequency. The district office should also conclude the result of its for each district offices work to the executive monthly.
3. BKK should place an importance on air pollution control by sending staff to closely and continually monitor the construction site and also publicize and inform the contractor to realize the trouble caused by PM10.
Available: https://slideplayer.com/slide/13324923/
III. Improving Air Quality Topic 4: Measures to Improve Air Quality
2018: SAI of Republic of Macedonia
Audit objectives:
What is the effectiveness of measures taken by national and local government to improve air quality?
Audit scope:
Period Covered: 2014 – 2016
Audited entities: Ministry of Environment and Physical Planning, State environmental Inspectorate, Institute for Public Health, municipalities
Audit methodologies:
1. Data collection methods; Study and analysis of documents Questionnaires and interviews Non-statistical sampling
2. Data analysis methods: Data summarizing Qualitative, quantitative and comparative analysis
Audit approach:
58
Result-oriented; whether activities for improving air quality are carried out as planned and their effects on the reduction of air pollution emissions
Audit criteria:
1. EU Air Quality Directives 2. Relevant national legislative framework 3. Strategic documents at national and local level
Effectiveness – the size of investment, plans and programme implementation and achieved results for improving air quality
Audit findings:
1. Audit aspect -The main problem in Macedonia regarding air pollution
Assessment of the ambient air quality is not complete: o The state monitoring network has not provided constant monitoring of ambient air quality
because some of the analyzers within the measuring stations in the period 2014-2016 were not in operation, and they do not measure all necessary parameters, some of the parameters are measured only indicatively and representative measurements are not conducted.
o The application of the dispersion models for assessing the impact of certain sources of emissions and categories of sources on air quality are limited due to the poor availability of quality input data, longer time series with reliable and detailed emission data, as well as valid data from the meteorological stations of the National Hydro-meteorological Service.
2. Audit aspect- Organization of the air quality management system
Inappropriate Organization and coordination of air quality management system: o Environmental Inspection does not correspond fully with the EU law. Inspection
surveillance in the field of environment is carried out at central and local level without coordination. Lack of a unique system of environmental inspection, inadequate structure to coordinate and supervise inspection at central and local level, lack of a unique plan and annual programmes, do not provide efficient inspection control. Because of that, in January 2016 a new Law on Environmental Inspection has been prepared, but it is still in procedure for adoption.
o Inter-sectoral Working Group on Air Quality and Committee for Health and Environment have been established to improve inter-sectoral cooperation, but coordination between institutions is insufficient and there is no system for monitoring the implementation of each measure. It is also necessary to improve the existing information and communication system in terms of providing data at various levels of disaggregation.
o The administrative capacity of key institutions (MOEPP, SEI, LSGU, IPH) for implementing air quality management policies is insufficient at all levels: central, and especially at local level. Insufficient staffing capacity, large number of competencies and responsibilities, lack of financial resources cause inefficiency in fulfillment of obligations and achievement of goals set by the policies. Republic of Macedonia is not subject to sanctions for non-compliance with the goals of air quality policies at EU level, nor there are national/local sanctions. Because there are no penalties for not implemented measures in the plans for ambient air quality protection, the process of implementation is very slow. This creates a risk for achievement of established goals, overcoming air pollution and preventing new sources of air pollution.
3. Audit aspect- Legal framework for air quality
National legal framework for air quality is mainly harmonized with EU Air Quality Directives o The legal and strategic framework regulating ambient air quality in the Republic of
Macedonia is harmonized with EU Directives in the field of ambient air quality: Directive 2008/50/EC, Directive 2004/107/EC, and Directive 2001/81/EC (NEC Directive), but MOEPP has not taken activities regarding transposition of amendments to the directives, that is, updating the secondary legislation. The incomplete transposition of EU Directives on air quality in the national legislation and the untimely updating of the secondary legislation contributes to their delayed implementation.
o In Macedonia, the PM10 are the most critical pollutants, which over the course of the year

59
often exceed the daily limit value. This imposes the need to define thresholds for information and alert in order to take short-term measures by competent authorities. MOEPP prepared an amendment on limit values of levels and types of pollutants in ambient air and alert thresholds, deadline for achieving limit values, margins of tolerance of the limit value, target values and long-term, but it has not been adopted yet. Not adopting a legal act on information and alert threshold means inability to undertake timely and appropriate short-term measures and recommendations in case of high concentrations of polluting substances in the air.
4. Audit aspect - Air quality policy on national and local level
Insufficient implementation of Air quality policy on national and local level o Measures in the National Plan for Ambient Air Protection are complex and cover different
areas that should be implemented by institutions at central and local level as well as by individual installations. There is no system for monitoring the implementation of each measure. The National Plan does not contain indicators to measure the effectiveness of policy implementation, which makes monitoring and realization of measures difficult for achieving the goals and policies for combating air pollution.
o Due to the insufficient administrative capacity, despite the fact that most municipalities belong to zones and agglomerations where there is a risk that levels of polluting substances exceed one or more alert thresholds, only the municipalities of Tetovo, Bitola and Skopje have prepared short-term action plans for ambient air protection. The local plans do not precisely define the deadlines for implementation of each measure, nor the required funds, sources of funds, indicators to measure the effectiveness and the responsible body for control and evaluate their implementation.
o There is no integrated approach between policies from different area such as economy, transport, energy, that are in connection with the basic national policy for air quality improvement. According to Law on Waste Management, MOEPP and mayors of municipalities have obligation to close and re-cultivate illegal landfills, but they still function. There are 54 municipal landfills in the country that pollute groundwater, soil and air, but they are still functional. Policies regarding passenger vehicles and the structure of public transport were not in accordance with the principles of sustainable development, and therefore produced long-term environmental problems. According to data from the Customs Administration, by 2015, about 70% of the vehicles belong to high-emission classes (EURO 0, 1 and 2), and relatively large share (around 10-18%) of those belong to the oldest category of vehicles (EURO 0).
5. Audit aspect - Financing measures/activities for improving air quality and measurable benefits
Insufficient budget funds for implementation of air quality policy o Financing and realization of activities in the field of environment are carried out on the
basis of the Annual Program for Environmental Investment. For the years 2014, 2015 and 2016, the implementation of the Environmental Investment Program allocates budget funds in the same, unchanged amount, and no funds were allocated for projects that are in direct connection with improvement of air quality;
o From the planned funds in the Annual work program of the State Automatic Monitoring System only 31 % - 42 % are approved, which is insufficient for the realization of its activities. For these reasons there is no regular maintenance, purchase of spare parts for measuring stations, dislocation of two existing monitoring stations for air quality, procurement of laboratory equipment and chemical reagents, accreditation of the calibration laboratory and training of the employees. Incomplete financing of this program questions the continuous operation of monitoring system.
o Although certain measures of the National Plan for Ambient Air Protection have been implemented in the key sectors for air pollution, they are insufficient to achieve satisfactory results in terms of reducing the suspended particulate concentrations. Effective implementation requires integrated approach by all stakeholders and provision of more financial resources. According to State Statistical Office data for the period under review, the investments and the costs for air protection participates with 0.1% in GDP, while in the total investments and environmental costs participate with 13% for 2014 and 2015, and with 6% in 2016. Regarding data, most of the investments are made in the industry and the specialized producers around 83-96%, while in the other sectors of economic activity the share is small and ranges from 4-17%.
60
6. Audit aspect - Air quality monitoring and reporting system
Incomplete Air quality monitoring and information systems o As a result of irregular maintenance of instruments and lack of spare parts for measuring
stations, in the period 2014-2016, from 17 monitoring stations, 3 of them are not in function, part of the others do not measure all parameters, while for some of the parameters minimal coverage of data is not provided in accordance with the national legislation.
o Benzene concentrations are not continuously measured and concentrations of heavy metals and polycyclic aromatic hydrocarbons are measured only by indicative measurement campaigns. In the period 2014-2016, measurement campaigns were carried out only on two locations: Skopje and Tetovo.
o The MOEPP has established and manages the air quality information system which is connected to the air quality web portal. The portal provides information to the public in real time and contains information for the current situation of the ambient air in the country, as well as information of pollutants, health effects and legislation. Although the air database contains a lot of data, it is still not complete. There are no emission data from stationary sources, data on ambient air quality from individual stationary sources, emission data from mobile sources and data from the Cadastre of Air Pollutants.
Recommendations: 1. MOEPP, in cooperation with the other involved institutions at central and local level and the
Government of the Republic of Macedonia, should undertake activities in order to:
Establish a unified system that will enable comprehensive and smooth exchange of data/information.
Accomplish project documents from the Twinning project ―Strengthening the administrative capacities at central and local level for implementation and enforcement of the environmental acquis‖.
Impose sanctions at the central/local level for non-compliance with the goals of air quality policies and limit values of certain pollutants in the air.
Update all necessary legal and secondary legislation for full harmonization of the national legislation with EU Air Quality Directives.
Establish a monitoring system for implementation of measures in the National plan for ambient air protection and indicators to measure the effectiveness of the policy implementation.
Prepare all planning documents at local level, establish an appropriate monitoring system for implementation and indicators to measure the effectiveness.
Provide budget funds necessary for operation and maintenance of all monitoring stations and financing measures in the planning documents.
Ensure timely submission and completeness of data from stationary sources of pollution in order to provide a comprehensive information system for ambient air quality and data integrity for the Cadastre of air pollutants.
Available at: http://www.dzr.mk/Uploads/56_RU_Kvalitet_na_vozduhot_2017_REDUCE.pdf
Topic 5: Seoul Metropolitan Air Quality Improvement Plan

61
2015: SAI of South Korea
Audit objective:
To enhance the appropriateness of the ‗Seoul Metropolitan Air Quality Improvement Plan‘ by analyzing the reason of failure in achieving the 1st plan goal and providing complementary measures to the plan.
Audit scope:
Management of air pollution source and the measurement and prediction of air pollution dispersion provided by the Ministry of Environment (MoE), National Institute of Environmental Research, and the local governments (Seoul, Gyeonggi, and Incheon)
Audit methodologies:
1. Established an audit support panel group and a research project conducted by the Korean Academy of Science and Technology from Sep. to Dec. of 2015.
2. Asked the MoE to investigate large factories which can emit air pollutants illegally. 3. Provided scientific evidences and examine the appropriateness of the plan by conducting (a) air
quality modeling under various pollution emission sources and emission control scenarios by scientists; (b) air quality monitoring data analysis and field sampling analysis; and (c) documentation screening.
Audit criteria:
1. Special act for Seoul Metropolitan City Air Quality Control (Seoul, Incheon, Gyeonggi) 2. Seoul Metropolitan Air Quality Improvement Plan
Audit findings:
1. The Seoul Metropolitan Air Quality Improvement Plan must be amended based on the areas affected by the air pollution sources.
2. The efficiency of the air pollution reduction measures (i.e., diesel particulate filter (DPF) attachment support program) in the 2nd stage of the plan has decreased compared to the 1st stage of the plan.
3. The data of the performance report was not reliable and the feedback system was not proper for amending the plan.
Recommendations:
The MoE: 1. heed the opinions of those involved in the business of reducing air pollution from diesel cars and
to provide a method of amendment to the plan (early disuse of in use diesel car etc.); and 2. set-up adequate performance evaluation and verification on the plan, and proper feedback system
to amend with reflecting the performance evaluation result.
Available on line at: intosai-korea-national_report
62
Topic 6: Investigation into How Authorities Work to Ensure Good Ambient Air Quality in Cities
2015: SAI of Norway
Audit objectives: To assess Norwegian authorities‘ work to achieve its targets for ambient air quality
Audit scope:
Fourteen municipalities/cities with relatively high levels of air pollution.
The period covered was 2005–2014. There were three main audit questions: 1. To what degree is the ambient air quality in accordance with limit values and national targets
(currently and over time)? 2. To what degree does the implementation of pollution regulations contribute to achieving the
targets for local ambient air quality? 3. To what degree do other national measures contribute to achieving the targets for local ambient
air quality?
The Norwegian SAI‘s audit mandate has limitations at the municipal level. The main auditees are therefore national authorities. Audits may however, look into how national measures and policies affect the situation at the municipal level. That aspect was covered in this audit.
Audit methodologies:
1. Statistical analysis of pollution levels (suspended dust/particles and nitrogen dioxide) in 14 Norwegian municipalities
2. Statistical analysis of developments in land use and transportation in the nine largest municipalities
3. Document analysis of reviews, studies, and formal management communication between different levels of government
4. Interviews with key actors, including the Ministry of Environment, the Norwegian Environment Agency, the Ministry of Transportation etc.
5. Survey of representatives of municipality administrations
Audit criteria:
1. Statistical analysis of pollution levels (suspended dust/particles and nitrogen dioxide) in 14 Norwegian municipalities
2. Statistical analysis of developments in land use and transportation in the nine largest municipalities
3. Document analysis of reviews, studies, and formal management communication between different levels of government
4. Interviews with key actors, including the Ministry of Environment, the Norwegian Environment Agency, the Ministry of Transportation etc.
5. Survey of representatives of municipality administrations Audit findings:
1. Local ambient air quality does not meet national targets.
In 11 out of the 14 municipalities the levels of suspended dust/particles was considerably higher than national targets.
In four of Norway‘s largest cities the limit values for nitrogen dioxide were exceeded several times since 2010.
The various targets for air quality are not coherent and it is challenging for the municipalities to relate to them.

63
2. The implementation of the pollution regulations by the municipalities and the Environment Agency is not sufficient to ensure that targets for air quality are met.
The municipalities do not carry out reviews and studies as required.
3. The division of roles and responsibilities between the various levels of government make it challenging to achieve national targets.
The Ministry of Environment has few measures it can apply to reduce pollution levels. It is dependent on the Ministry of Transportation to facilitate local measures, and on the municipalities to actually implement local measures. There is a risk that the responsibility is shared between too many actors, leading to a lack of implementation of effective measures.
Recommendations:
The Ministry of Environment should consider:
1. Simplifying the structure of the various targets for air pollution 2. Ensuring the Environment Agency strengthens its guidance towards municipalities 3. Cooperating with the Ministry of Transportation and the Roads Directorate to provide better
guidance to municipalities on the measures that are available to reduce air pollution and their likely effects
4. Together with the Ministry of Transportation, consider the division of tasks and responsibilities between various sectors and levels of government in order to increase the goal achievement and implement more effective measures.
Available at: name of website www.riksrevisjonen.no (https://www.riksrevisjonen.no/presserom/Pressemeldinger/Sider/LuftkvalitetBy.aspx
IV. Emissions
Topic 7: Emissions Resulting from Oil Refineries
SAI of Kuwait (Year Report Published not included in the report)
Audit objectives:
1. Assess the efficiency of the department in charge of monitoring air pollution in the Public Authority for Environment and its role in performing the Authority's mission in monitoring causes of air pollution.
2. Verify the commitment to comply with air quality standards and requirements under the decision no. 210 of 2001 issued by the Public Authority for Environment regarding the executive regulations of the Authority's Law of Establishment.
3. Assess the health and environmental impacts of gas emissions from oil refineries, as well as evaluating the requirements and procedures taken to reduce emissions.
Audit scope:
Gas emissions resulting from oil refineries
Audit methodologies:
1. Analysis of Air Pollution Monitoring Department of the Public Authority for Environment on 2009 measurements and comparing the results in Annex No. 1 \ 17.2 \ 17 of decision no. 210 of 2001 on air quality
2. Reviewed of the Kuwait National Petroleum Company reports, and the refinery's field inspection

64
for Al.Ahmadi Refinery. 3. Reviewed of Kuwait National Petroleum Company's air pollution measurement of Al-Ahmadi
refinery for the year 2009 and compared it with air emissions from fixed sources, Annex No. (20), decision no. 210 of 2001
Audit criteria:
1. Analysis of Air Pollution Monitoring Department of the Public Authority for Environment on 2009 measurements and comparing the results in Annex No. 1 \ 17.2 \ 17 of decision no. 210 of 2001 on air quality
2. Reviewed of the Kuwait National Petroleum Company reports, and the refinery's field inspection for Al.Ahmadi Refinery.
3. Reviewed of Kuwait National Petroleum Company's air pollution measurement of Al-Ahmadi refinery for the year 2009 and compared it with air emissions from fixed sources, Annex No. (20), decision no. 210 of 2001
Audit findings:
1. Air Pollution Monitoring Department suffers from deficiency in staff members especially the technical staff, and that the department is in need to train plant operators on the maintenance of equipment and vehicles to better service the departments.
2. The following exceeded the allowable limits/increased:
1\2 (n-CH4) gas exceeded the allowed limits (0.24 P.P.M) most of the year.
2\2 Sulfur Dioxide (SO2) exceeded the allowed daily limits on September 17 2009 by (70.8 P.P.b)
3\2 Nitrogen Dioxide (NO2) exceeded the annual allowed limits
(30 P.P.b) as it achieved an annual average of (43.5 P.P.b), it also exceeded the daily
limits reaching (50 P.P.b) in November.
4\2 Nitrogen Dioxide reported noticeable increase in comparison with previous years averages.
5\2 Wind direction indicate that the highest concentration of these pollutants move mostly toward the south, and oil facilities and other establishments in the southern region are responsible for the spread of pollutants in the air around Fahaheel residential area.
3. Kuwait National Petroleum Company reports, and the refinery's field inspection for Al.Ahmadi Refinery showed:
No presence of the Public Authority for Environment in the oil refineries areas.
Kuwait National Petroleum Company takes the inspection samples directly from outside the refinery (Alahmadi Refinery), while the Public Authority for Environment takes it from fixed and certain locations (Al-fahaheel Station).
Entities refer to different standards than the ones used by the Public Authority for Environment which are Annex (1 \ 17 ) (2 \ 17) , decision No. 210 of 2001 on air quality, while Kuwait National Petroleum Company follow Annex No. (20), decision 210 of 2001, environmental standards allowed for air emissions from fixed sources, page 340.
4. By reviewing Kuwait National Petroleum Company's air pollution measurement of Al-Ahmadi refinery for the year 2009, and comparing it with air emissions from fixed sources, Annex No. (20), decision no. 210 of 2001, the following was found:
The measurement results of sulfur dioxide (SO2) exceeded the standard rates in fluidized catalytic cracker factor (kg 9.8).
The measurement results of sulfur dioxide (SO2) exceeded the standard rates (ppmv 250).
The measurement results of sulfur dioxide (SO2) exceeded the standard rates of Claus Sulfur Recovery Unit due to the compulsory stopping of one of the two units and putting extra load on the other unit.
The measurement results of Hydrogen sulfide in fuel gas (H2S) exceeded the standard rates (mg 230).
5. The different sampling locations, the Public Authority for Environment and Kuwait National Petroleum Company, resulted in varying measurements and thus, lack of accurate pollution monitoring.

65
Recommendations:
Related to high risk: 1. Presence of technical staff of the Public Authority for Environment is required at the oil industry
areas and other industrial areas to follow up the environmental situation and conduct daily tests to
monitor and measure air pollution, as well as the possibility of environmental monitoring of
pollutants resulting from the refineries and gas emissions.
2. Strengthen cooperation between the Public Authority for Environment, the Kuwait Institute for
Scientific Research and global environmental institutions to implement studies to measure and
assess the pollution rates from oil refineries to ensure compliance with laws and regulations
protecting the environment and ensure that the areas adjacent to oil establishments are not
affected.
3. Monitor air quality in oil refineries areas and define sources that cause air pollutants emissions,
and find solutions to limit the problem in order to ensure a clean and healthy work environment.
Related to medium risk:
1. Treat deficiency of staff especially the technical staff expert in air pollution and stations management, to face the expected expansion in fixed stations and mobile labs.
2. Train stations operators on maintenance work to increase equipment efficiency, in addition to the maintenance companies' work.
3. Provide enough vehicles to serve the divisions in order to perform duties timely and efficiently, as well as provide communication means for technical staff for emergencies.
Available on line at: kuwait_s_eng_emission-resulting-from-oil-refineries
V. Health and Cost Impact
Topic 8: Consideration of the Health and Cost Impacts of Fine Particles in the Preparation of
Strategies
SAI of Finland (Year Report Published not included in the report)
Audit objective:
Assess whether the emissions of fine particles and the costs arising from their health impacts have been considered in the preparation of the five strategies that are relevant to the emissions.
Audit criteria:
Act on the Assessment of the Effects of Certain Plans and Programmes on the Environment (200/2005)
Audit findings:
1. Most strategies lacked preliminary impact assessments or the assessments were of fairly general nature. There was little examination of the health impacts of fine particles. Moreover, the strategies did not contain any assessments of the costs arising from the health impacts of fine particles. Furthermore, no strategy options were formulated or assessed as part of the preparatory work and no cost-benefit comparisons of the options were produced.
2. The fact that no strategy options, as part of the preparatory work and the preliminary impact assessments, were presented for comparison demonstrated how little consideration was given to cost- benefit factors in the preparation of the audited strategies. Moreover, in many cases only the

66
potential benefits of the strategies were highlighted, while no consideration was given to harmful health impacts.
Recommendations:
1. The audited ministries should, under the auspices of the Ministry of Employment and the Economy, prepare an overall cost assessment of the health impacts generated by fine particles in Finland.
2. When ministries prepare or update climate, energy, natural resources, transport and health strategies, they should give systematic consideration to the health impacts of fine particles and the costs arising from them the expertise of the ministries in the field of preliminary assessment of environmental and health impacts should be systematically developed under the auspices of the Ministry of the Environment.
Available at:
summary_english_17_2015_consideration_of_the_health_and_impacts_of_fine_particles_in_the_prepa
ration_of_strategies
VI. Compliance with law related to air pollution Topic 9: Compliance with Republic Act (RA). No. 9003 otherwise known as the Ecological
Solid Waste Management Act of 2000 (with focus on air pollution)
2015: SAI of Philippines
Audit objective:
Determine Compliance with R. A. No. 9003 otherwise known as the Ecological Solid Waste Management Act of 2000 (with focus on air pollution)
Audit scope: Implementation of R.A. No. 9003 by the Province of Bulacan
Audit methodologies:
1. Review of R. A. No. 9003, Sangguniang Panlalawigan Resolution No. 191-T‘11 dated August 9, 2011 and Provincial Ordinance No. 07-2011 dated June 22, 2011.
2. Verification of the Province records on apprehension on burning of hay stalks and similar materials in the Province of Bulacan.
3. Discussions with other Audit Team Leaders of the Province on awareness of the Provincial Ordinance.
4. Observation and taking pictures of the fog-like situation along the stretch from the Candaba Viaduct to the Sta. Rita Exit.
5. Discussion with the Provincial Agriculturist and with the Bulacan Environment and Natural Resources Office (BENRO) personnel on the observations.
6. Interview with the concerned Provincial personnel and Environment Management Bureau (EMB) Region III personnel.
Audit criteria:
1. Section 48(3) of R. A. No. 9003 or the Ecological Solid Waste Management Act 2. R.A. No. 7160 or the Local Government Code of 1991 3. Sangguniang Panlalawigan Resolution No. 191-T‘11 dated August 9, 2011

67
4. Provincial Ordinance No. 07-2011 dated June 22, 2011 Audit findings:
1. Section 48(3) of R. A. No. 9003 or the Ecological Solid Waste Management Act which prohibits the open burning of solid waste was not strictly and effectively enforced as evidenced by the ―fog-like‖ situation along the North Luzon Expressway (NLEX) from San Simon, Pampanga to Sta. Rita, Bulacan, especially after the palay harvesting season which may result in the exposure of the public to various diseases and impairment and non-protection of the environment.
2. Not a single person was apprehended since the issuance of the local ordinance. 3. Lack of awareness of the ordinance especially in the barangays which should be directly involved
in the implementation. 4. A ―fog-like‖ smoke enveloped along the stretch from the Candaba Viaduct to the Sta. Rita Exit
caused by the burning of hay stalks, leaves and dried grass as well as the smoke emission from factories in the area of Pulilan, Bulacan.
5. The health of the people living in the area as well as commuters along the stretch of the NLEX may be endangered due to the smoke produced from the burning hay stalks, leaves and other similar waste materials.
Recommendations:
1. Provincial Agriculturist and the BENRO Officer-in-Charge coordinate with their counterparts in the cities/municipalities and barangays for the proper implementation of R. A. No. 9003 particularly on the prohibition on the open burning of solid wastes like hay stalks, dried leaves and other farm wastes.
2. Provincial Agriculturist encourage farmers to do composting of farm waste to enrich the soil with natural fertilizers.
3. Provincial Agriculturist, BENRO officials together with the Provincial Health Officer, conduct proper information dissemination like conducting seminars, production of posters/tarpaulins on the harmful effects to the health of the public of smoke from burning of solid wastes.
4. BENRO officials assert their authority in (i) the implementation of the ordinance prohibiting the burning of hay stalks and other farm wastes; and (ii) the monitoring of smoke emitted by factories, in close coordination with other LGU and EMB officials who may share their technical knowledge and skills in safeguarding the environment.
Available on line at: www.coa.gov.ph
Topic 10: Compliance with Regulation on Prevention and Control of Pollution
2015: SAI of Mexico
Audit objectives: To determine the fulfilment of the objective of inspection actions and monitoring of compliance with applicable regulations in order to prevent and control pollution, as well as to restore the quality of air, soil and water.
Audit scope: Inspection actions and monitoring of compliance with applicable regulations in order to prevent and control pollution, as well as to restore the quality of air, soil and water.
Audit methodologies:
The audit was conducted in accordance with the regulations applicable to the Public Account Supreme Auditing, and the methodology established in the Performance Auditing Unit‘s Technical Guidelines was used to ensure the achievement of the established objective and scope. These guidelines are complementary to the institutional regulations and are consistent with the Fundamental Principles of the

68
INTOSAI Performance Audit.
Audit criteria: Federal Government established public policy of environmental protection
Audit findings:
1. The delayed and insufficient attention of the sustainable management of the environment has generated the continuous degradation of its ecosystems and its natural resources such as air, soil and water, which increases the health risks and damages the development of the country in the short and long term. The deterioration of the country's natural resources has been caused, mainly, by the increase in industrial activities without sustainability schemes, in addition to domestic activities that use natural resources without good environmental performance, which has raised the concentration levels of pollutants in the atmosphere, higher than the maximum permissible, the increase in water pollution, the concentration of highly hazardous waste and the poor management of urban solid waste.
2. In terms of prevention, in 2014, PROFEPA reviewed 4.5% (4,070) of a list of 91,340 sources of contamination, through 4,787 inspections carried out by 192 inspectors, who carried out an average of 25 inspections; therefore, this activity was marginal with respect to the number of environmental pollution sources of federal competence identified.
3. The Office of the Attorney General did not have objectives or goals to carry out the industrial inspection that would allow increasing compliance with environmental regulations. Through the assistance of environmental emergencies, it identified 809 contaminated sites, in which it carried out 624 inspections, which, from 2007 to 2014, increased 3.0% on an annual average, compared to contaminated sites that increased 43.3% annually, of which, by 2014, 37.8% (404,788.1 m2) of the affected area was remediated 1,071,446.2 m2.
4. Regarding control actions, in 2014 out of 7,394 measures issued, 28.1% (2,079) were not fulfilled; the federal delegations of PROFEPA filled 50 complaints with the federal public prosecutor for alleged criminal offenses derived from air, water and soil contamination, but did not inform the head of the General Directorate of Federal Crimes Against the Environment and Litigation, who acts as liaison to the Attorney General's Office (PGR), about the complaints presented.
5. There is no mechanism for its follow-up, besides that neither PROFEPA nor the PGR gave attention to the Collaboration Agreement for the attention and prosecution of crimes against the environment and environmental management, nor to the "Bases of Operation for the Attention, Investigation and Persecution of Crimes against the Environment and Environmental Management".
6. They did not elaborate the program to develop comprehensive policies for the prevention of damage to the environment and environmental management.
7. For restoration, PROFEPA verified compliance with 1,089 measures issued in 368 contaminated sites, obtaining that 23.9% (260 measures ordered) were not complied with.
8. The Procurator's Office has a correct design of its internal control instruments, but these have not operated properly since they do not allow the identification, evaluation, hierarchy, control and monitoring of the risks that could hinder or prevent compliance with objectives and institutional goals in the field of industrial inspection.
9. The operational capacity of PROFEPA in addressing the problem of air, soil and water pollution, through enforcement actions of compliance with environmental regulations by companies of federal competence, was formed by 192 inspectors, which was insufficient to issue administrative sanctions and restoration measures, as well as to promote criminal complaints before the competent authorities, which has had a marginal effect and has not been able to inhibit non-compliance with the regulations. Because of this, the definition and implementation of an inspection strategy to sources with greater polluting potential is fundamental, as well as the strengthening of verification actions of measures dictated to revert the negative effects caused by pollution, and compliance of the collaboration agreement signed in 2004 between PROFEPA and the Attorney General‘s Office (PGR), in order to ensure that the enforcement of environmental justice contributes to the preservation of air, soil and water.
Recommendations:
Recommendations were generated which are intended to promote the availability of a strategy to reorient inspection actions so that pollution sources comply with environmental standards and ensure

69
adequate follow-up of the measures dictated to ensure compliance, so that they have an impact in the preservation of air, soil and water quality.
Available at: https://www.asf.gob.mx/Trans/Informes/IR2014i/Documentos/Fichas/Ficha_DE_a.pdf
Topic 11: Implementation of Environmental Rules and Laws by Uttar Pradesh Pollution Control Board
(UPPCB)
2016: SAI of India
Audit objectives:
To assess whether:
1. Proper planning has been done by the UPPCB to ensure compliance of environmental Laws and Acts;
2. Financial management by UPPCB is efficient to secure optimum utilisation and that mechanism for internal control was in place and functioning effectively;
3. Mechanisms have been put in place by the UPPCB for effective implementation of the Water, Air, EP Acts and various Rules framed there- under for prevention, control and abatement of pollution; and
4. There is adequate mechanism for monitoring the various provisions of Air, Water, EP Acts and various Rules framed there under and as per norms of Central Pollution Control Board.
Audit scope:
The focus areas of audit were to examine implementation of environmental rules and laws to address environmental pollution, adequacy of measures adopted and the efficiency with which they have been executed and to assess the effectiveness in funds management and internal control in respect of programmes relating to pollution and compliance with relevant statutes. Audit also assessed whether the measures adopted in addressing pollution had the desired impact in abatement or control of pollution in the State.
Audit methodologies:
1. Examination of reports and records, analysis of documents at UPPCB Headquarter Office, two out of seven circle offices and seven3 out of 28 regional offices.
2. Conducted beneficiary survey in five cities in November 2016 to get the views of public about the pollution and role of UPPCB in prevention, control of pollution and protection of environment.
3. Use questionnaire to obtain the written opinion of a total 256 people in five cities was taken through a questionnaire regarding pollution of air, among others.
Audit criteria: The audit criteria for achievement of audit objectives were derived from the following sources:
1. The Air (Prevention and Control of Pollution) Act, 1981 as amended in 1987 (Air Act) 2. The Environment (Protection) Act, 1986 (EP Act) and various Rules1 under EP Act 3. Directions and notifications issued by the Central/State Government, Central Pollution Control
Board (CPCB) and UPPCB 4. General Financial Rules, 2005 (GFR), as amended 5. Environmental Standards evolved by CPCB
Audit findings:

70
1. CPCB notified National Ambient Air Quality Standard (NAAQS) in 2009 under section 16 of the Air Act. As per the notification, 12 parameters were to be monitored. Audit noticed that UPPCB was monitoring only three parameters of the air quality, i.e., nitrogen dioxide (NO2), particulate matter 10 (PM10) and sulphur dioxide (SO2) at 54 points in 20 cities of the State.
2. On scrutiny of test reports of 54 points in 20 cities for the years 2011 to 2015, it was noticed that the annual average level of PM10 was very high ranging from 87 to 347 microgram per cubic metre as compared to the standard of 60 microgram per cubic metre. Major cities with higher level of PM10 against required standard were Allahabad, Ghaziabad, Kanpur, Lucknow, NOIDA, Varanasi. UPPCB failed to take adequate measures to control the level of PM10 and to monitor the remaining nine parameters as it did not have facility to monitor all parameters of air quality under NAAQS.
3. Audit noticed that the process of procurement of CAAQMS was started only in three cities (Ghaziabad, Noida and Moradabad). Audit checked the procurement files and found that process of procurement was started only in July 2014. No reason for this delay for more than three years was however, found on records. Thus, UPPCB could not install CAAQMS in all the eight cities as envisaged in the action plan (March 2016).
4. UPPCB had not installed the necessary software and hardware at its headquarter for centralised data collection and its analysis so far (March 2016). As a result, UPPCB could not link online even with the industries that have installed online monitoring devices. Thus, UPPCB did not take adequate measures for compliance of the order of the CPCB for online continuous emission and effluent monitoring of all highly polluting industrial units in the State.
5. 785.34 Metric Tonne (MT) of fly ash was generated during 2011-12 to 2015-16 against which utilisation of fly ash was 216.28 MT only (28 per cent) which abets air pollution. No monitoring was being done and no directions were issued by UPPCB in this regard, though consents for operation were invariably being issued by UPPCB every year to the TPPs.
Recommendations:
UPPCB should take necessary measures to improve the quality of the air, install Continuous Ambient Air Quality Monitoring Stations, continuous emission and effluent monitoring mechanism and monitor full utilisation of fly ash as directed by CPCB/MoEF.
Available:https://www.cag.gov.in/sites/default/files/audit_report_files/Report_No.1_of_2017_%E2%80%93_Economic_Sector_Government_of_Uttar_Pradesh.pdf
VII. Protection of Human Health from Air Pollution
Topic 12: Air pollution: Our health still insufficiently protected
2018: SAI European Court of Auditors
Audit objective:
Assessed whether EU actions to protect human health from air pollution have been effective
Audit scope:
1. Provisions of the AAQ Directive related to human health and on the air pollutants with the greatest health impact: PM, NO2, SO2 and O3; and
2. Six urban centres in the EU dealt with the problem and used funding from the EU‘s Cohesion policy and LIFE programmes.
3. Covered the period from the adoption of the AAQ Directive in 2008 to March 2018.
Audit methodologies:
71
1. Examined the policy design and Commission‘s monitoring of implementation of the AAQ Directive through reviewing documents, interviewing staff and checking databases at the Commission and the EEA.
2. To examine Member States‘ implementation of the Directive and EU-funded air quality projects, carried out on-the-spot visits, examined project documentation and interviewed local stakeholders (national and local authorities, project beneficiaries, and other civil society stakeholders) in the six selected cities and in the capitals of the respective Member States.
3. For the audit work in Poland, cooperated with the Supreme Audit Office (NIK). 4. Took into account expert advice on the design, implementation and monitoring of the AAQ
Directive.
Audit criteria: The 2008 Ambient Air Quality Directive Audit findings:
1. The EU‘s air quality standards were set almost twenty years ago and some of them are much weaker than WHO guidelines and the level suggested by the latest scientific evidence on human health impacts.
2. While air quality has been improving, most Member States still do not comply with the EU‘s air quality standards and were not taking enough effective action to sufficiently improve air quality. Air pollution can be underestimated as it might not be monitored in the right places. Air Quality Plans – a key requirement of the Ambient Air Quality Directive – often did not deliver expected results.
3. The Commission faces limitations in monitoring Member States‘ performance. Subsequent enforcement by the Commission could not ensure that Member States complied with the air quality limits set by the Ambient Air Quality Directive. Despite the Commission taking legal action against many Member States and achieving favourable rulings, Member States continue to frequently breach air quality limits.
4. Many EU policies have an impact on air quality, but, given the significant human and economic costs, we consider that some EU policies do not yet sufficiently well reflect the importance of improving air quality. Climate and energy, transport, industry, and agriculture are EU polices with a direct impact on air quality, and choices made to implement them can be detrimental to clean air. We noted that direct EU funding for air quality can provide useful support, but funded projects were not always sufficiently well targeted. We also saw some good projects – particularly some projects supported by the LIFE programme.
5. Public awareness and information has a critical role in addressing air pollution, a pressing public health issue. Recently, citizens have been getting more involved in air quality issues and have gone to national Courts, which have ruled in favour of their right to clean air in several Member States. Yet, we found that the Ambient Air Quality Directive protects citizens‘ rights to access to justice less explicitly than some other environmental Directives. The information made available to citizens on air quality was sometimes unclear.
Recommendations:
1. To take more effective action to improve air quality, the Commission should:
Share best practice from Member States who have successfully reflected the requirements of the AAQ Directive in their Air Quality Plans, including on issues such as information relevant for monitoring purposes; targeted, budgeted and short-term measures to improve air quality; and planned reductions in concentration levels at specific locations.
Actively manage each stage of the infringement procedure to shorten the period before cases are resolved or submitted to the European Court of Justice.
Assist the Member States most affected by intra EU transboundary air pollution in their cooperation and joint activities, including introducing relevant measures in their Air Quality Plans.
2. The Commission should address the following issues when preparing its proposal to the legislator:
Considering updating the EU limit and target values (for PM, SO2 and O3), in line with

72
the latest WHO guidance; reducing the number of times that concentrations can exceed standards (for PM, NO2, SO2 and O3); and setting a short-term limit value for PM2.5 and alert thresholds for PM.
Improvements to the Air Quality Plans, notably by making them result oriented; and by requiring yearly reporting of their implementation; and their update whenever necessary. The number of Air Quality Plans by air quality zone should be limited.
The precision of the requirements for locating industrial and traffic measuring stations, to better measure the highest exposure of the population to air pollution; and to set a minimum number of measurement stations per type (traffic, industrial or background).
The possibility for the Commission to require additional monitoring points where it considers this is necessary to better measure air pollution.
Advancing the date (currently 30 September of year n+1) to at least 30 June n+1, to report validated data, and explicitly requiring Member States to provide up-to-date (real time) data.
Explicit provisions that ensure citizens‘ rights to access justice. 3. To further mainstream air quality into EU policies, the Commission should produce
assessments of:
other EU policies that contain elements that can be detrimental to clean air, and take action to better align these policies with the air quality objective.
the actual use of relevant funding available in support of EU air quality objectives to tackle air pollution emissions, notably PM, NOX and SOX.
4. To improve the quality of information for citizens, the Commission should:
Identify and compile, with the help of health professionals, the most critical information that the Commission and Member States authorities should make available to citizens (including health impacts and behavioural recommendations).
Support the Member States to adopt best practices to communicate with and involve citizens in air quality matters.
Publish rankings of air quality zones with the best and worst progress achieved each year and share the best practices applied by the most successful locations.
Develop an online tool that allows citizens to report on air quality violations and provide feedback to the Commission on issues related to Member States‘ actions on air quality.
Support the Member States to develop user-friendly tools for the access of general public to air quality information and monitoring (for example, smartphone apps and/or social media dedicated pages).
Together with the Member States, seek an agreement on harmonising air quality indices.
Available on line at:
E:/Project%20Plan%20Final%200Outputs/Audit%20eports/ECA/SR%2023_2018%20Air%20pollution
%200