Focus on Energy - EBN Kennisbank
100
Focus on Energy The full potential of the Dutch subsurface
-
Upload
khangminh22 -
Category
Documents
-
view
4 -
download
0
Transcript of Focus on Energy - EBN Kennisbank

Focus on Energy
The full potential of the Dutch subsurface

The Netherlands, land of…
Average yearlyinvestments oil &
gas sector 2005-2015
1,6 blnEuro per year
Natural gas 74%
Electricity 19%
Biomass 4%
Heat 3%
Offshore productionGas 14,0 Bln m3
Oil 8,18 mln barrels
Natural gas 34%
Oil 20%
Electricity 17%
Coal 15%
Heat 11%
Biomass/gas 4%
Oil 85%
Natural gas 15%
Natural 38% 32 %gas
Oil 37% 41%
Coal 17% 13%
Renewableenergy
4% 14%
Nuclear 1% 1%
Other 3% -1%
Industry 1187 PJ (46%)
Feedstock 562 PJ
Energy function 625 PJ
Mobility489 PJ (19%)
Oil 96%
Biomass 3%
Electricity 1%
Natural gas 42%
Coal 35%
Wind 7%
Biomass 4%
Nuclear 4%
Solar 1%
Other 7%
Electricity
Ca. 600offshore
producing wellsCa. 800
Onshoreproducing wells 155
offshoreplatforms
2500inactive/
decommissioned wells
200production locations
on land
Gas fields
Oil fieldsGas and oil fieldsin The Netherlands
Energy consumption Energy production
The Netherlands is an energy nation. We consume but also produce large quantities of energy. Our most important energy source is natural gas. Follow-ing the discovery of the large Groningen gas field in 1959, hundreds of small fields were discovered by the natural gas industry. To this day, new fields continue to be discovered and brought into production, with this new gas also being consumed in our complex energy system. Alongside natural gas, we use many other sources such as oil, coal, renewable energies, and nuclear energy. This infographic provides insight in the production and consumption of energy in The Netherlands and provides a glance into the future energy system in which renewable energies will play an ever growing part.
* part of final end use of energy ** Net delivery to electricity grid*** Trade, services, government, water and waste management
• Figures represent 2015 unless displayed otherwise.• Excluding changes in energy inventories and
bunkering for international shipping and aviation
4 gas storages
Gas and oil reserves
Remaining gas 891 Bln m3
Groningen 665 Bln m3
Small fields 226 Bln m3
Of which onshore 109 Bln m3
Of which offshore 117 Bln m3
Remaining oil 199 mln barrels Of which onshore 129 mln barrels Of which offshore 70 mln barrels
Gas and oil production
Gas production 49,7 Bln m3
Groningen 28,1 Bln m3
Small fields 21,6 Bln m3
Of which onshore 7,5 Bln m3
Of which offshore 14,0 Bln m3
Oil production 10,69 mln barrels Of which onshore 2,52 mln barrels Of which offshore 8,18 mln barrels
Gas and oil drillings
Number of drillings 35 of which exploration 11 of which succesful 8Succespercentage 73%% success last 10 yrs. 64%
253 producing gas fields
Geology & technology
Duration of drilling to 4km2 months
Depth of gas fields2-4 km
Production duration ofa small field5-30 years
Primary energy mix 2015 3144 PJ / 2030 2986 PJ (current policies)
Consumptionnatural gas
76%Direct use
17%Electricity
7%Feedstock
En
erg
iev
erb
ruik
Natural gas 42%
Electricity 35%
Biomass/gas 12%
Other 10%
Oil 1%
Other sectors ***345 PJ (13%)
SchoonebeekLargest oil field
in The Netherlands
Powered by EBN
24%remaining gasin Groningen field
477discoveredgas fields
Households 429 PJ (17%)
Natural gas Oil Coal Renewableenergy
Nuclear
Energy (in)dependence per source
PJ
1800
1350
900
450
0
Production in The Netherlands1.621
1.202
95
1.138
0
462
136 1380 39
Consumption in The Netherlands
2016
Natural gas 89%
Biomass/gas 8%
Heat 5%
Oil 1%
Electricity -3% **
Agriculture 136 PJ (5%)
(De)central production396 PJ
Import balance 32 PJ
17%* 5% 19% 46% 13%
Sour
ce: N
ation
ale
Ener
giev
erke
nnin
g 20
16, E
CN, P
BL, C
BS, R
VO
108
25_1
- 20
16 /
des
ign
and
real
isat
ion:
a-d
esig
n.nl
891Bln m3
Remaining reserves199mln barrels
Gas Oil
Sou
rce:
hoe
wer
ktga
swin
nen.
nl
Sour
ce: A
nnua
l rep
ort N
atur
al re
sour
ces
and
Geo
ther
mal
ene
rgy
in th
e N
ethe
rland
s 20
15 ,
TNO
Sour
ce: C
BS
Nominal Dutch state income from natural gasand oil production in bln Euro
State revenues: 280 bln Euro since 1966
10,4 10,35,3
10,7 12 14,5 152009 2010 2011 2012 2013 2014 2015
Sour
ce: C
BS
Sour
ce: I
PCC
5th
Ass
essm
ent,
2014
: Life
cycl
e an
alys
is “M
in” v
alue
s
Greenhouse gas emissionswith electricity production (generic data)
gCO
2eq
/ kW
h
800
600
400
200
0
Natural gas CoalWind Solar PV (rooftop)
Import
11328 PJ
Export
9292 PJ
Primary energy consumption
Oil 37%
Renewableenergy 4%
Other 3%
Coal 17%
Nuclear 1%
NaturalGas 38%
NaturalGas 84%3144 PJ
Energy production in The Netherlands
Oil 5%
Renewableenergy 7%
Other 4%
1927 PJ
2

Contents Foreword 4 Executive summary 6
1. Energising the transition 8
OUR DUTCH GAS 16
2. Reserves, resources, production & economics 182.1 Reserves and contingent resources 202.2 Maturation 202.3 Stranded fields and prospective resources 212.4 Industry activity 222.5 Drilling costs 242.6 Production 252.7 Recovery factor 262.8 Economics 27
3. Exploring for new prospects and play concepts 32
3.1 Exploration activity 343.2 EBN exploration studies 35
Ventoux: An Upper Jurassic lead mapped on new seismic data 35 Upper Jurassic shallow marine sandstones in the northern offshore 38 Triassic reservoir sands in the Dutch northern offshore 38 Dinantian carbonates: synergy between hydrocarbon and geothermal projects 40 Hydrocarbon shows revisited 42
4. Reservoir stimulation and production optimisation 44
4.1 New insights into hydraulic fracturing 464.2 Gas well deliquification 49
5. Infrastructure in a changing environment 52
5.1 Cost reduction initiatives 545.2 Integrating offshore wind with oil and gas production 54
RETURN TO NATURE 56 6. Decommissioning and re-use of oil and gas infrastructure 58
6.1 The decommissioning landscape in the Netherlands 606.2 Decommissioning: a joint effort 646.3 Future use of installations: re-using, repurposing and recycling 676.4 Innovative decommissioning – natural seals 68
NEW ENERGY 72
7. Geo-energy from the Dutch subsurface 747.1 EBN’s involvement in geothermal energy 767.2 Exploring the potential of ultra-deep geothermal energy 777.3 Accelerating development of geothermal energy in Brabant 787.4 Geothermal energy in the ‘heat roundabout’ 797.5 Potential synergies between geothermal energy and hydrocarbons 807.6 Carbon Capture Utilisation and Storage 80
8. Research, development and innovation 85
8.1 Joint industry efforts 868.2 In-house research 888.3 Student projects 90
Glossary 94 References 95 Acknowledgements 95 About EBN 96 Disclaimer 97
3 2

4

The energy transition: From deliberation to deedsAccording to the Energy Agenda of the Ministry of
Economic Affairs (December 2016), it is “crucial
that in the coming years, the remaining, largely
marginal, gas reserves on the Dutch part of the
continental shelf can still be connected to the infra-
structure (platforms and pipelines) present in the
North Sea. The stimulation to support the develop-
ment of small fields will therefore be continued.
The reduction of gas production in the North Sea has
the inevitable consequence of accelerating the
decommissioning, dismantling and removal of the
platforms and associated infrastructure. The terres-
trial gas-producing locations will also have to be
cleared up in the future.”
Two of our strategic pillars connect with this perfectly.
In what we call ‘Our Dutch Gas’ we are working on
optimising exploration and production of our gas
fields, in a sustainable and safe manner. Within the
theme ‘Return to Nature’ we are pioneering the
effective dismantling and repurposing of abandoned
oil and gas platforms.
One challenge arising from the energy transition that
touches on another of EBN’s areas of interest is the
search for sustainable solutions, for example to meet
the demand for both low and high temperature heat.
We have therefore added a priority to our strategy:
‘New Energy’. This theme focuses on developing
sustainable energy from the subsurface, such as deep
and ultra-deep geothermal energy, CCUS and energy
storage. We support the Ministry of Economic Affairs
in the development of geothermal energy, and
together with the Ministry and TNO we explore
partici pation in so-called ‘Green Deals’. Given our
knowledge of the subsurface and of investing in
subsurface projects, we can be an exceptionally
valuable partner in the energy transition.
We believe that it is especially important that the
energy transition proceeds smoothly. The run-up
phase is over and it is now time for the implementa-
tion of the transition and the achievement of tangible
results – in other words: there’s an urge to go from
deliberation to deeds. The parties that have joined the
so-called ‘Transition Coalition’ (of which we are one)
are attempting to speed up the energy transition
together. The fact that over 60 parties have joined,
emphasises the prevailing conviction that we are
striving to attain a CO2-neutral energy system. In
order to accomplish this, the subsurface will continue
to play an important role in the coming decades. Our
focus is therefore no longer so much on oil and gas,
but on energy – specifically, energy from the Dutch
subsurface, as is reflected by the title of this year’s
edition of Focus.
The transition to a sustainable energy mix is a joint
effort and we are proud to present interviews with
representatives of the Dutch energy world in this
publication. Add to these interviews the thorough
description of our activities and a glimpse of what the
future holds, and we believe that this edition is well
worth reading.
We would like to know your ideas about the energy
transition and look forward to have a dialogue!
Jan Willem van Hoogstraten,
CEO
Foreword
5

Executive summary
Our Dutch Gas• Total reserves from small fields developed with
EBN participation declined by 15% in 2016 com-
pared to 2015 due to falling oil and gas (O&G)
prices. Reserves accounted for 117 bcm and con-
tingent resources for 181 bcm. The prospective
resources included 200 bcm of risked, recover-
able volumes from the Rotliegend and 30 – 40 bcm
from the Triassic and Carboniferous.
• The maturation figure of 2016 is 9.3 bcm for all
small fields, which is comparable to the 2015 fig-
ure. Production from small fields was 8% less
than in 2015.
• The total invested CAPEX was 50% of that in
2015. Because of the lower costs in the service,
supply and construction industries, the potential
of the remaining reserves and contingent
resources is still high and rewarding. It is expected
that investment will recover in the longer run to
between some EUR 700 million and EUR 1 billion.
• Due to the low gas price, the net profit margin of
small fields has declined sharply, but it is still
positive. The unit OPEX has been stable since
2014 at around EUR 0.06/Nm3. Given the current
trends in gas price and expected decreasing pro-
duction costs per Nm3, profit margins are likely
to recover in 2017.
• EBN sees potential for an upside scenario from
enhanced activities such as exploration, tight gas
development, increased recovery, infrastructure
optimisation and resources that could follow
from collaboration within the energy industry.
This may add some 150 bcm until 2050.
• Additional exploration opportunities identified
by EBN include the Ventoux lead in block F08,
which consists of multiple Upper Jurassic targets
that can be tested with a single exploration
well. Furthermore, recent work shows that the
Jurassic Kimmeridgian to Volgian sands from
which hydrocarbons are produced in the UK and
Germany are also present in the Dutch sector,
opening up a potential new play.
• A regional study has found that Triassic Main
Buntsandstein reservoir sands do occur north of
the main fairway, which shines new light on
the Triassic prospectivity in the Dutch northern
offshore; 44 untested structures have been iden-
tified.
• The Lower Carboniferous Dinantian carbonates
have recently become an exploration target for
both hydrocarbons and geothermal energy.
Evaluation of recent wells and seismic mapping
show the potential for fractured and karstified
producing reservoirs.
• Tight reservoirs greatly benefit from hydraulic
fracturing. Recent modelling shows that the
benefits also apply to reservoirs with good per-
meability, even during advanced stages in their
production life. Hydraulic fracturing adds value
even when the economic time horizon is short. A
portfolio analysis of the hydraulic fractures in
the Netherlands reveals that virtually all fracking
jobs with pre-fracking production are a technical
success and almost always have a positive effect
on the NPV.
The national Energy Agenda foresees gas continuing to play a role in the decades to come. Domestic natural gas
is preferable to importing resources, due to its relative low CO2 emission during production and its important
contribution to the Dutch economy. Optimal usage of gas resources (‘Our Dutch Gas’) is one of the three pillars
on which EBN’s focus on realising the best value for Dutch geological resources rests. The other two pillars are:
taking control of the decommissioning challenge (‘Return to Nature’); and optimising geothermal developments
(‘New Energy’).
6

• Liquid loading is a common challenge for fields
in the mature or tail-end production phase.
Recent work shows that deliquification methods
that use velocity strings and foam have a success
rate over 70%, with an NPV of EUR 2 – 20 million
per well. These techniques are a very valuable
asset and justify the costs of installation.
• The transition to a sustainable energy system is
manifested by the current development of wind
farms offshore, resulting in an electricity grid to
which offshore platforms could be connected.
This would eleminate the need for local power
generation and subsequently reduce CO2 emis-
sions and operational costs dramatically, extend-
ing the lifetime of the installations.
Return to Nature• Ultimately, the O&G infrastructure will be
decommissioned. Estimated decommissioning
costs amount to some EUR 7 billion in total for
the Dutch upstream O&G industry. The total
infrastructure in line for decommissioning com-
prises 506 platforms and locations, over 5,500
km of pipelines and about 1400 wells.
• Sustainable dismantling of the infrastructure is
key and all the possibilities for future use should
be investigated. Naturally, the first choice should
be to consider re-using the infrastructure for oil
and gas. A second option would be to utilise the
infrastructure for alternative purposes, such as
power-to-gas, CO2 storage and compressed air
energy storage. Onshore, the re-use of O&G wells
for geothermal purposes is being investigated
and parts of the pipeline network could be used
in the production and transportation of biogas.
As a last option, the materials should be opti-
mally recycled.
• It is a shared responsibility of the O&G industry to
decommission safely, environmentally responsibly
and cost-effectively. Initial priorities in
The Netherlands Masterplan for Decommissioning
and Re-use, as presented in November 2016, are:
1) Establish a National Platform that drives
the agenda for decommissioning and re-use,
2) Establish a National Decommissioning Data-
base, 3) Promote effective and efficient regula-
tion, and 4) Share learnings. These priorities
have been implemented within a JIP between
nine operators and EBN.
New Energy• With its potential for geothermal energy, Carbon
Capture Utilisation and Storage (CCUS) and
energy storage, the Dutch subsurface can con-
tribute significantly to a sustainable energy mix.
EBN will explore synergies with the development
of geothermal energy and will facilitate the
development of CCUS.
• Ultra-deep geothermal energy (UDG) could
deliver an important contribution to the transi-
tion to a sustainable heating system, especially
for industrial processes where higher tempera-
tures are necessary. The first step in UDG devel-
opment will be to explore the Dinantian play in
three regions. The ultimate objective is to unlock
the UDG potential in the safest, most cost-effec-
tive way. EBN anticipates that there will be ample
room for synergy between the three sub-plays,
resulting in increased quality and reduced costs.
• Because of its expertise in approaching subsur-
face projects, EBN has worked together with TNO
and Geothermie Brabant B.V. on two concepts:
integral project development and the introduc-
tion and application of the portfolio approach
for geothermal projects in Brabant. The combi-
nation of both has great benefits for geothermal
projects.
• The geothermal and hydrocarbon sectors have
joined forces to investigate how synergies might
be exploited. EBN is hosting an exploratory
roundtable discussion on behalf of DAGO, Sticht-
ing Platform Geothermie and KVGN regarding
synergies between gas and geothermal energy.
7

8

1
En
ergi
sin
g th
e tr
ansi
tion
Energising the transition
9

Fossil fuels currently meet 92% of the
demand for energy in the Netherlands,
revealing the great chal lenge for the tran-
sition to a climate-neutral energy system.
Natural gas currently accounts for 38% of the Dutch
primary energy mix – a share that has remained
fairly constant in recent decades. What particularly
defines the versatility of natural gas are its trans-
portability, its capacity to achieve high tempera-
tures when combusted and its chemical structure.
On top of this, due to its historical availability,
natural gas is the main source of energy for house-
holds, industry and agriculture in the Netherlands,
and it is used to generate 42% of Dutch electricity.
Moreover, it is an important feedstock for several
industries. The national Energy Agenda published late
2016 by the Ministry of Economic Affairs foresees gas
continuing to play a role in the decades to come.
Making the energy system more climate-friendly
means meeting the energy demand with the right
type of supply. Natural gas occupies the middle rung
on the ‘the ladder of seven’, a system ranking the
options for energy supply with respect to CO2 emis-
sions developped by the national Dutch gas associa-
tion KVGN. Top priority is 1) energy saving, followed
by using 2) renewable sources, 3) green gas, 4) Dutch
natural gas, 5) imported natural gas, 6) oil and 7) coal.
Given the importance of natural gas for meeting the
demand for energy in the Netherlands, the best way
to reduce CO2 emissions is to use Dutch gas. The
Energy Agenda confirms that domestic natural gas
is preferable to importing resources, due to the
relative low CO2 emission during production in the
Netherlands (see Focus 2014). Furthermore, domestic
production contributes significantly to the Dutch
economy.
Additionally, the hydrocarbon assets and infra-
structure, as well as the knowledge and expertise of
the Dutch subsurface resulting from decades of oil
and gas (O&G) production, could be used effectively
to reduce CO2 emissions by developing alternatives
to natural gas. EBN and other parties in the gas
sector have defined a programme in which the
strengths of the natural gas value chain are exploited
to speed up sustainable projects. For this endeavour
to succeed, far-reaching collaboration, innovation
and creativity are required. As part of EBN’s renewed
strategy, EBN will explore synergies with the develop-
ment of geothermal energy and will facilitate the
development of CCUS (Carbon Capture Utilisation
and Storage). Other projects are offshore energy
integration, renewable gas, LNG in heavy transport
and hybrid heat pumps.
Ladder of seven
10
However, the Dutch gas industry faces many
challenges. Earthquakes in Groningen and damage
due to gas production from the Groningen field lead
to concerns of safety. Concern is also being expressed
about small field exploration and production pro-
jects. NOGEPA is currently working on a code of
conduct to improve stakeholder engagement by
operators active in the Netherlands. The current
situation regarding financial investments in explo-
ration and production in the Netherlands is rather
bleak. In 2015 and 2016 the average gas price fell
significantly, causing a drop in investments. Main-
taining high investment levels, is important to
ensure sufficient resource maturation and reserve
replacement and, consequently, to guarantee future
production levels. Furthermore, if gas prices remain
low, a significant number of platforms and facilities
will operate at a loss and will risk being decommis-
sioned at rather short notice. Once the infrastruc-
ture has been removed, the associated resources can
never be economically developed and could be lost
forever, even if gas prices would rise in the future.
The major impact of trends in gas price and resource
maturation on the viability of the offshore infra-
structure is illustrated in Figure 1 , which was
published in Focus 2016. The difference between the
worst and best case scenarios is approximately
100 bcm of reserve maturation, which has a signifi-
cant impact on the COP (cessation of production)
dates and remaining asset life. Dismantling the
infrastructure too rapidly will limit the options for
using O&G infrastructure to support the transition
to a sustainable energy system. Furthermore, this
could negatively impact the cost effectiveness of
decommissioning infrastructure, as dismantling
activities will face more time pressure. On the other
hand, the low gas price environment has sharpened
the focus on reducing unit OPEX levels. In 2016,
several opera tors succeeded in reducing these costs,
thereby improving the likelihood of production
remaining economically viable in the future. The
recent dramatic fall in rig rates, coupled with the
introduction of innovative investment solutions,
has opened up opportunities for new developments
against lower costs. In order to be able to maintain
Figure 1.1_worst best case cop platforms - reproduction of FODOG16
150
100
50
02016 2024 2032 2040 2048 2056
Number of offshore installations that reach cease of production - worst and best case scenarios
EUR 0.125/m3 and reserves only
EUR 0.25/m3 and maturation of all resources
Num
ber
of o
ffsh
ore
inst
alla
tion
s
1
The Dutch gas sector intrinsically bears a
responsibility to adapt to New Energy realities.
To start a dialogue with stakeholders based on
transparency and facts, EBN has developed an
energy infographic as shown on the inside front
cover. Created from publicly available data from
renowned institutes, the graphic accurately
depicts the role of energy sources in Dutch end
use and the relation to energy production in the
Netherlands.
11

EBN creates value and facilitates the transition to a sustainable energy systemBased on the developments in the upstream O&G industry described in this chapter, as well as those in the
energy policy arena, EBN has honed its strategy to accommodate the changing context. EBN focuses
on creating value from geological resources in a safe, sustainable and economically sound manner. This
strategy has three main pillars: optimal usage of Dutch gas resources (‘Our Dutch Gas’); taking control of
the decommissioning challenge (‘Return to Nature’); and strengthening, improving and developing geo-
thermal energy (‘New Energy’).
Our Dutch Gas Return to Nature New Energy
adequate production and maturation levels, it is
essential that the industry continues to focus on fur-
ther cost reduction, and on supporting technical and
innovative solutions and knowledge sharing.
This edition of Focus elaborates on several develop-
ments and activi ties that facilitate EBN’s strategy.
In Chapter 2 the reserves and resources are described,
as well as current activities and the related econom-
ics. The results of exploration studies regarding
promising Dutch prospects are illustrated in
Chapter 3. Chapter 4 focuses on techniques available
to maximise the economic production of oil and gas
in mature fields, and the dynamics and potential of
the offshore infrastructure are presented in Chapter 5.
These first chapters together represent ‘Our Dutch
Gas’. The objectives and activities of decommission-
ing and re-use are illustrated in Chapter 6, and
represent ‘Return to Nature’. Furthermore, ‘geo-
energy’ is represented by Chapter 7: Developments
and challenges regarding geo-energy from the
Dutch subsurface. Finally, Chapter 8 describes EBN’s
research, development and innovation activities.
Groningen production The merits of production from the Groningen field have been overshadowed by induced seismicity,
which has had a major impact on the day-to-day lives of many inhabitants of the area. Since 2013, the
Dutch government has focused on reducing the yearly production level and has been pursuing safer
production methods as well as damage control and compensation.
Over the last few years, production has decreased significantly and fluctuations in production have
been removed. EBN developed a variety of activities to contribute to a safer and improved production
plan of the Groningen field, in line with its mission and the policy of the Minister of Economic Affairs.
Several studies focused at contributing to a better understanding of the processes in the subsurface
around the earthquake-prone area. This work complements the investigations carried out by NAM and
other parties such as State Supervision of Mines and KNMI. See Chapter 8 for more information on
these studies.
12

13

The energy supply of the future
After graduating from Delft University of Tech-
nology with a degree in physics, specialising in
nuclear physics, Diederik Samsom worked for
Greenpeace and was director of the Dutch energy
supplier Echte Energie (now Greenchoice). From
2003 to 2016 he was a member of the Dutch House
of Representatives; from 2012 to 2016 he was par-
liamentary leader of the Dutch Labour Party.
During his time in the House of Representatives
he was very involved in energy issues.
What sparked your interest in the energy sector?I was 15 years old when the Chernobyl nuclear
disaster occurred. In the Netherlands we didn’t
actually suffer much from this disaster, but the
dramatic event was my wake-up call. From that
moment on, I knew that everything had to be dif-
ferent – that if we didn’t change our energy sys-
tem, things would go wrong for planet earth. And
then when I read Thea Beckman’s book Kinderen
van Moeder Aarde (Children of Mother Earth)
I knew for sure that I wanted to work for Green-
peace, to do my bit. In the years that followed, the
energy question dogged me.
Together with Jesse Klaver (currently leader of the Green Left party) you submitted a proposal for a climate Act that would help attain a completely sustainable energy mix in the Netherlands by 2050. Is such an energy supply attainable?
I think so – and even before 2050 – but maybe
I’m somewhat optimistic. Policymakers usually
tend not to want to outline exactly what the energy
mix would look like, but now we are able to sketch
out clearly what will happen. First, we’ll have
about 35 gigawatts (GW) from offshore wind.
We currently aim for 6 GW offshore wind in the
Netherlands. The amount of wind parks should
increase to 35 at sea and six to eight on land.
Further, I think that solar energy will supply up to
60 GW in 2050. That’s bizarrely massive – in
total, enough for the entire built-up environment.
As well as this we still need to have over 6 GW of
energy from geothermal sources to meet the total
demand for heat. It’s important to develop ultra-
deep geothermal energy quickly, particularly for
industrial purposes. There would then be a system
running on geothermal energy, a fairly stable
source, and on sun and wind, both of which are
not stable. As a back-up system for the lon-
ger-term variations, power-to-gas is needed:
about 4 GW. Finally, we need green gas made from
biomass: about 25 GW. Green gas is needed not
just for energy but also as a new renewable feed-
stock for the chemical industry.
Our energy supply currently consists of about 75% oil and gas, 17% coal and 3 – 4% renewables. What exactly needs to happen to achieve a sustainable energy mix by 2050?I think that in 2050, gas will no longer be extracted
in the Netherlands. Offshore wind energy and
Interview with Diederik Samsom, former leader of the Dutch Labour Party (Partij van de Arbeid)
14

The energy supply of the future
solar energy are relatively simple, because we’ve
already made good progress here. Geothermal
energy is a bit more complicated, but the biggest
challenge is green gas. Transitioning our entire
economy will also be a big job. We need to speed
up the current transition. Regarding geothermal
energy, we need to ensure that before 2025 it’s in
the same situation as offshore wind is now:
(almost) unsubsidised, with a network that we as
a society have paid for. The big challenge is to
develop a new model in which production, trans-
port and delivery are linked to each other. Gasunie
should transform itself from a gas mover into a
heat mover, and EBN from an oil and gas driller to
a geothermal driller.
So you see EBN as having a clear role in the transition to a sustainable energy mix?Yes, I advocated this years ago. I foresee EBN
being given the statutory mandate to participate
wherever energy is obtained or stored in the sub-
surface. This should result in EBN participating in
at least as many projects as it does now in the oil
and gas sector. Of course, wells will have to be
drilled for this and, as with all drilling, there are
public issues involved. That’s exactly why EBN
has such a pivotal role to play. EBN can represent
the public interest and act like a catalyst by co-
investing and contributing knowledge and expe-
rience. That’s EBN’s strength. Geothermal energy
will be EBN’s new pillar, but EBN should also play
a role in gas storage. The gas that’s converted
with power-to-gas for the energy sector as well
as the chemical industry will have to be trans-
ported and stored and the gas that’s co-produced
with geothermal energy will have to be processed.
I hope that in the future, storage of CO2 will not be
necessary and that all captured CO2 can be used.
But I think that to drastically reduce CO2 emis-
sions and achieve negative emissions, storage will
be necessary.
What are you yourself going to contribute to this sustainable future?My wake-up call when I was 15 will always play a
role in my life. So I’ll also carry on fighting for a
sustainable energy supply. In what form I don’t
know for sure yet, but my ambition is to leave the
next generation an earth as beautiful as the one
we found.
15
© T
essa
Pos
thum
a de
Boe
r

GAS STORAGEEXPLORATION AND PRODUCTION
OF OIL AND GAS FIELDS, BOTH ONSHORE AND OFFSHORE
16

The Netherlands still possesses a considerable potential of oil and gas reserves and resources. Exploration and production in a cost-efficient and safe and sustainable way is continuing to provide the necessary energy from hydro carbons during the energy transition. Whenever sustainable alternatives are insufficient, Dutch gas will remain the most preferred option. EBN will continue to encourage the oil and gas industry to innovate and develop new knowledge, and to urge its partners to improve sustainability performance.
Our Dutch Gas
17

18

2
Res
erve
s, r
esou
rces
, pro
duct
ion
& e
con
omic
s
Reserves, resources,
production & economics
19

400
350
300
250
200
150
100
50
0
Res
erve
s an
d re
sour
ces
(bcm
GE
)
2012
203 201 191 179 181
172 166 159 143 117
2013
Reserves Contingent resources
Remaining reserves and resources from small fields
2014 2015 2016
Figure 2.1
400
350
300
250
200
150
100
50
0
Res
erve
s an
d re
sour
ces
(bc
m G
E)
2012 2013
Reserves Contingent resources
Reserves and resources from small fields
2014 2015 2016
A ll the on- and offshore fields in
the Netherlands except for the giant
Groningen field are referred to as “small
gas fields”. These fields continue to be
the core of the Dutch O&G industry. In this chapter,
the status of the small fields portfolio is evaluated.
Small gas field production has been declining for
over a decade. EBN believes that if investment levels
pick up again, this decline can be slowed down or
even halted. The project portfolio of opportunities
identified in or near fields is still rich, as is the
potential for exploration in underexplored plays or
near the established margins of the known gas plays
(Chapter 3).
2.1 Reserves and contingent resourcesIn 2016, the industry was largely influenced by falling
O&G prices. The gas price declined gradually and is
now half the price in 2012. The lower gas prices have
affected EBN’s reserve base. At the end of 2016, the
total developed reserves from small fields in which
EBN is participating were 117.1 bcm, compared to
143.4 bcm at the end of 2015 (Figure 1 ). Total gas
production from small fields was 20.6 bcm in 2016.
In 2016, far fewer projects matured than in the pre-
vious year: only five gas fields were brought into
production compared to 14 in 2015. A second reason
for the reserve decline is that the tailend volumes of
some of the mature gas fields were evaluated as
sub-economic at current gas prices, and so these
volumes were transferred to contingent resources.
The contingent resource base increased by 2 bcm to
181 bcm, which still has high potential for recovery.
These volumes are either not technically mature yet
or are currently not economically attractive.
In 2016, the gas price in the Netherlands reached its
lowest value since 2010. In this challenging com-
mercial environment, many projects were being
delayed. This decrease in price, however, sparked a
pressure on costs. Under current conditions, several
of the opportunities in the contingent resource
portfolio are therefore still as attractive as they were
before the downturn in the industry. EBN foresees
more gas field developments over the next few
years. EBN’s focus to stimulate future O&G develop-
ments will be on five themes:
1. Sharing knowledge to contribute to reducing
CAPEX and OPEX;
2. Reducing the time lag on project start-up;
3. Selecting high-ranking exploration areas;
4. Supporting technological and innovative solutions;
5. Contributing to the energy transition by stimula-
ting synergies within the energy industry.
2.2 MaturationMaturation is defined as the amount of known
resources moving into the reserves category as a
result of investments and planned projects. In 2016,
the combined volumes of resources matured to
1
20

reserves plus reserves from new projects was around
13.7 bcm, which is higher than in 2015 and thereby
breaks a four-year decline (Figure 2 ). On the
downside, 4.4 bcm moved from reserves to the
resource category, mainly as a result of project
cancel lations or extended delays. This leads to a
maturation figure of 9.3 bcm for all small fields in
2016, which is comparable to the 2015 figure.
However, there is also a large negative adjustment
of the recoverable reserves within producing fields.
Due to the volatility of this category and the direct
dependence on gas price, EBN does not include these
volumes in the maturation numbers, but they do
contribute to the adjusted reserve database, as can
be seen in Figure 2 . In years with good gas prices,
less gas was expected to be left in the uneconomic
tail-end of the production due to anticipated COP
dates further in the future. In 2016 however, the
large downward revision of reserves in known fields
was seen, primarily because of COP dates moving
forward in time. These volumes, combined with
the loss of reserves due to cancelled or executed
projects, fully offset the amount of gas matured.
With a total invested CAPEX of slightly less than
EUR 600 million in 2016, investment was 50% of
that in 2015. Excluding COP date adjustments, it is
encouraging that the level of maturation has not
dropped in proportion to the decline in CAPEX. This
can be interpreted as being a direct result of lower
costs in the service, supply and construction indus-
tries. Rig rates have also dropped considerably,
resulting in significantly decreased costs for drilling
wells.
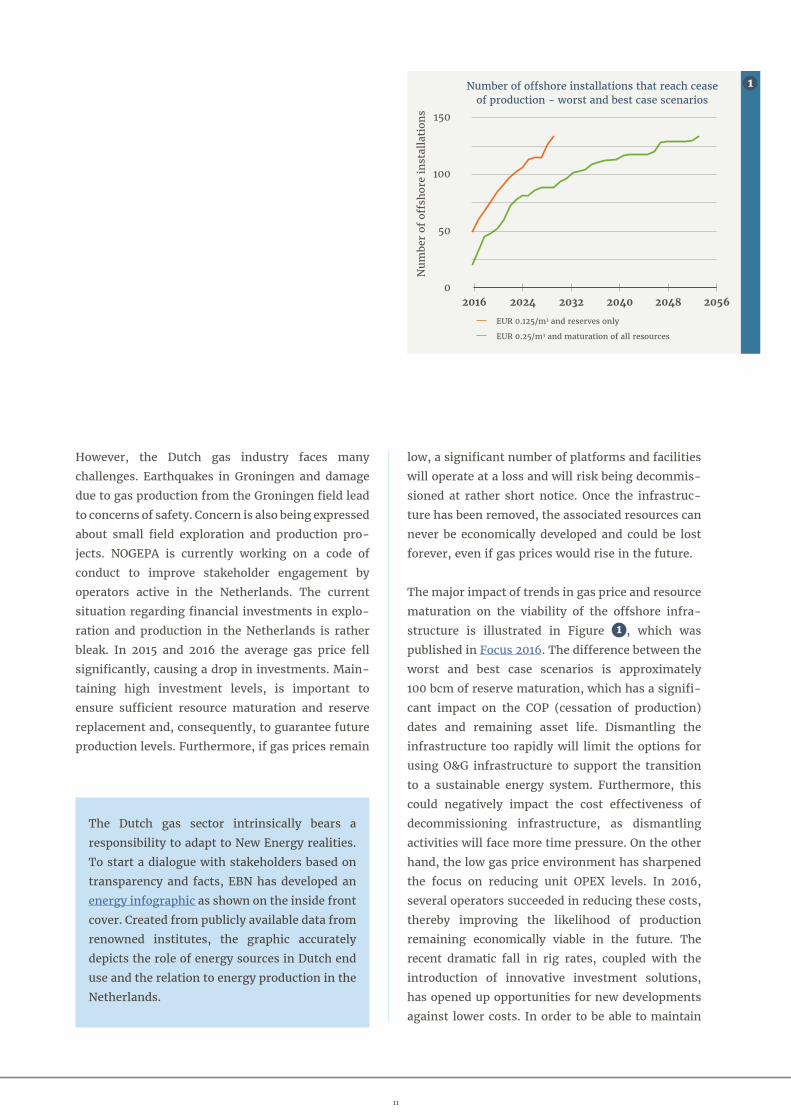
2.3 Stranded fields and prospective resourcesStranded fields are gas discoveries for which no
plans for development have been defined yet.
Obviously, the designation ‘stranded’ is not
immutable, since options for developing such
fields are often being revisited. In the analysis in
this chapter, EBN includes all stand-alone proven
gas accumulations that do not yet count as reserves.
The largest stranded gas resources are in the
Rotliegend, the dominant play in the Netherlands.
The expected ultimate recovery for these fields is
small compared to their in-place volume; poor
reservoir quality is one of the main reasons these
fields have not yet been developed. Of the more
than 65 bcm of gas in place in the Rotliegend
stranded fields, currently only 25 bcm is expected
to be recoverable (Figure 3 ). However, there is
significant scope for increasing these recoverable
volumes by using optimised development concepts
for these types of fields, such as horizontal wells
and reservoir stimulation technology (Chapter 4).
40
30
20
10
0
-10
-20
30
20
10
0
-10
-20
-30
1400
1200
1000
800
600
400
200
02012
2012
2013
2013
Changes in the status of reserves
2014
2014
2015
2015
2016
Figure 2.2 Reserves replacement 2016
Res
erve
s (1
00%
bcm
GE
) CAPE
X (E
UR
million
)
Res
erve
s (b
cm G
E)
Reserves to resources
Production
Maturation (resources to reserves)
Reserves revision in projects and fields
Reserves replacement
Capex small gas fields
Reserves added by new projects
2
21
stra
tigr
aph
ies
60
50
40
30
20
10
0
Tri
assi
c
Zec
hst
ein
Rot
lieg
end
Carb
onif
erou
s
Oth
er s
trat
igra
phie
s
Mul
tipl
e
Hydrocarbons initially in place and ultimate recoverable volumes
in stranded fields
300
250
200
150
100
50
0
Nor
th S
ea G
roup
Cret
aceo
us
Jura
ssic
Tri
assi
c
Zec
hst
ein
Rot
lieg
end
Carb
onif
erou
s
Cum
ulat
ive
volu
me
(bcm
GE
)R
iske
d cu
mul
ativ
e vo
lum
e (b
cm G
E)
Figure 2.4 Prospects Risked GIIP- IPRES Risked GIIP- IPRES Risked UR-zonder labels
Hydrocarbons initially in place and ultimate recoverable volumes
in gas prospects
Ris
ked
HCI
IP o
f ec
onom
ical
ly a
ttra
ctiv
e pr
ospe
cts
Ris
ked
HCI
IP o
f pr
ospe
cts
Ris
ked
UR
of
econ
omic
ally
att
ract
ive
pros
pect
s
Tot
al H
CIIP
of
fiel
ds
Tot
al U
R o
f fi
elds
Each year EBN re-evaluates the prospective
resources portfolio on the basis of expected future
gas prices and cost levels, resulting in a ranking
based on likelihood of being economic. Analysis of
the prospective portfolio with respect to strati-
graphic level clearly shows that the vast majority of
the volume is in the Rotliegend play (Figure 4 ).
The full Rotliegend portfolio is expected to contain
300 bcm (risked), of which over 250 bcm is expected
to be present in prospects with potential economic
viability. In turn, 200 bcm could be recovered from
these prospects. The Triassic and Carboniferous
plays are expected to yield 30 to 40 bcm of risked
recoverable resources, considering only the econo-
mically attractive prospects.
These substantial volumes are not reflected in the
number of exploration wells drilled in 2016 (section
3.1). There are three reasons for this. Firstly, most of
the individual prospects are small and their economic
development is attractive only if low-cost develop-
ment alternatives are used; there is no room for cost
overruns or for finding low case volumes. Secondly,
onshore operators are facing increasingly complex
licensing trajectories, causing them to pursue fewer
exploration opportunities, particularly when new
drilling locations are required. A final reason is that
in these figures, the expected economic lifetime of
the vital infrastructure through which the gas is to
be evacuated has not yet been taken into account.
Sometimes, exploration opportunities are not pur-
sued because of imminent COP dates, yet other
operators successfully manage to extend the COP
dates of their facilities by unlocking near-field
exploration opportunities.
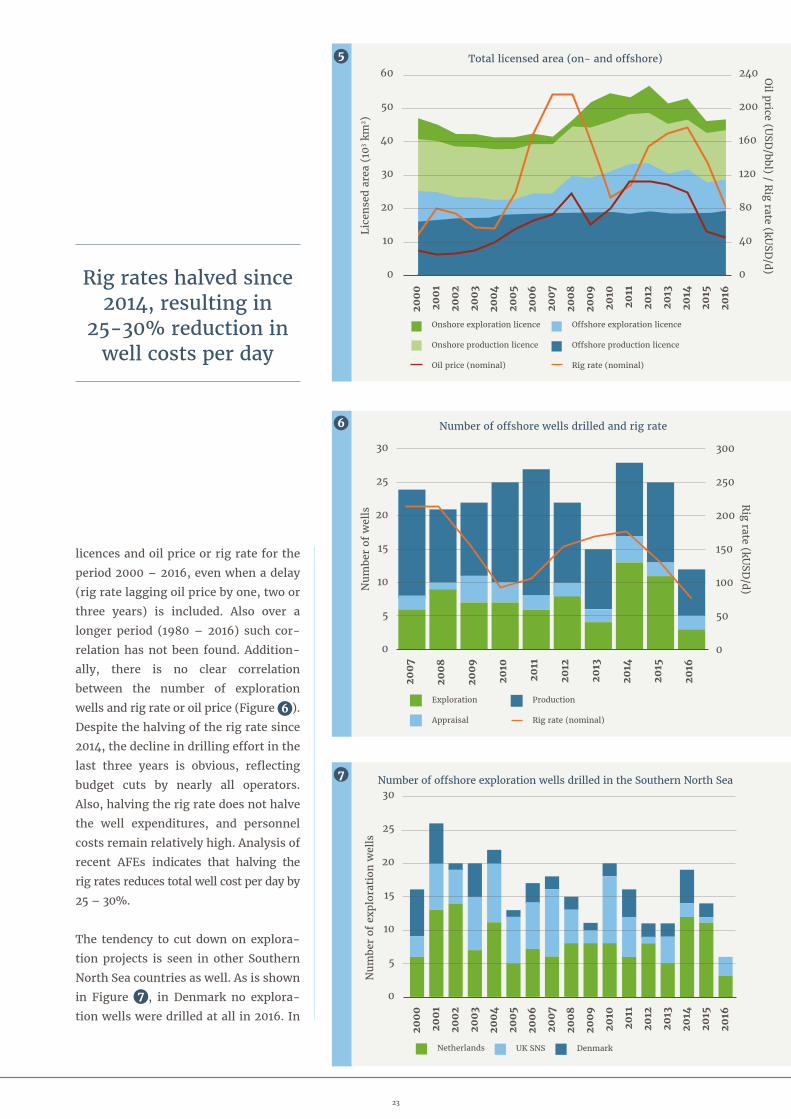
2.4 Industry activityLooking at industry activity since 2000, it is clear
that the total area covered by production licences
has remained relatively constant (Figure 5 ). This
is to be expected since many of the older licences
were granted for 40 years or even indefinitely. Con-
sequently, changes in total area licensed for produc-
tion are due to additions, rarely to relinquishments.
Recently, a duration of 25 years for production
licences has become the norm. Figure 5 shows that
for exploration licences there is more fluctuation
over time.
Statistical analysis reveals there is no significant
correlation between the total area of exploration
3 4
22
stra
tigr
aph
ies
60
50
40
30
20
10
0
Tri
assi
c
Zec
hst
ein
Rot
lieg
end
Carb
onif
erou
s
Oth
er s
trat
igra
phie
s
Mul
tipl
e
Hydrocarbons initially in place and ultimate recoverable volumes
in stranded fields
300
250
200
150
100
50
0
Nor
th S
ea G
roup
Cret
aceo
us
Jura
ssic
Tri
assi
c
Zec
hst
ein
Rot
lieg
end
Carb
onif
erou
s
Cum
ulat
ive
volu
me
(bcm
GE
)R
iske
d cu
mul
ativ
e vo
lum
e (b
cm G
E)
Figure 2.4 Prospects Risked GIIP- IPRES Risked GIIP- IPRES Risked UR-zonder labels
Hydrocarbons initially in place and ultimate recoverable volumes
in gas prospects
Ris
ked
HCI
IP o
f ec
onom
ical
ly a
ttra
ctiv
e pr
ospe
cts
Ris
ked
HCI
IP o
f pr
ospe
cts
Ris
ked
UR
of
econ
omic
ally
att
ract
ive
pros
pect
s
Tot
al H
CIIP
of
fiel
ds
Tot
al U
R o
f fi
elds
30
25
20
15
10
5
0
200
0
200
1
200
2
200
3
200
4
200
5
200
6
200
7
200
8
200
9
2010
2011
2012
2013
2014
2015
2016
Num
ber
of e
xplo
rati
on w
ells
Number of offshore exploration wells drilled in the Southern North Sea
Netherlands UK SNS Denmark
25
20
15
10
5
0
60
50
40
30
20
10
0
240
200
160
120
80
40
0
250
200
150
100
50
0
200
0
200
1
200
2
200
3
200
4
200
5
200
6
200
7
200
8
200
9
2010
2011
2012
2013
2014
2015
2016
Km
2 ('0
00)
Lice
nse
d ar
ea (
103 k
m2 )
Oil price (U
SD/bbl) / R
ig rate (kUSD
/d)
Total licensed area (all XL’s)
Total licensed area (on- and offshore)
Onshore exploration licence
Onshore production licence
Oil price (nominal)
Offshore exploration licence
Offshore production licence
Rig rate (nominal)
licences and oil price or rig rate for the
period 2000 – 2016, even when a delay
(rig rate lagging oil price by one, two or
three years) is included. Also over a
longer period (1980 – 2016) such cor-
relation has not been found. Addition-
ally, there is no clear correlation
between the number of exploration
wells and rig rate or oil price (Figure 6 ).
Despite the halving of the rig rate since
2014, the decline in drilling effort in the
last three years is obvious, reflecting
budget cuts by nearly all operators.
Also, halving the rig rate does not halve
the well expenditures, and personnel
costs remain relatively high. Analysis of
recent AFEs indicates that halving the
rig rates reduces total well cost per day by
25 – 30%.
The tendency to cut down on explora-
tion projects is seen in other Southern
North Sea countries as well. As is shown
in Figure 7 , in Denmark no explora-
tion wells were drilled at all in 2016. In
5
30
25
20
15
10
5
0
70
60
50
40
30
20
10
0
140
120
100
80
60
40
20
0
300
250
200
150
100
50
0
200
7
200
8
200
9
2010
2011
2012
2013
2014
2015
2016
1980
1982
1984
1986
1988
199
0
199
2
199
4
199
6
199
8
200
0
200
2
200
4
200
6
200
8
2010
2012
2014
Num
ber
of w
ells
Rig rate (kU
SD/d)
Km
2 ('0
00)
Nom
inal
oil
pric
e ($
/bbl
)
Number of offshore wells drilled and rig rate
Total licensed area (on- and offshore)
Onshore XL
Offshore XL
Yearly avg Brent $/bbl
Onshore PL
Offshore PL
Exploration
Appraisal
Production
Rig rate (nominal)
6
30
25
20
15
10
5
0
160
140
120
100
80
60
40
20
0
200
0
200
1
200
2
200
3
200
4
200
5
200
6
200
7
200
8
200
9
2010
2011
2012
2013
2014
2015
2016
200
0
200
1
200
2
200
3
200
4
200
5
200
6
200
7
200
8
200
9
2010
2011
2012
2013
2014
2015
Figure 2.5 & 2.6 & 2.7 & 2.8 Expl_vs_km2_1980-2016
Num
ber
of e
xplo
rati
on w
ells
N
umbe
r of
wel
ls
Offshore exploration drillingCumulative nr of wells
Number of offshore exploration wells drilled in the Southern North Sea
Netherlands
Netherlands offshore
UK SNS
UK Southern North Sea
Denmark
Danish offshore
7
Rig rates halved since 2014, resulting in
25-30% reduction in well costs per day
23

Figure 2.10 General_4_-_Production_Forecast
35
30
25
20
15
10
5
0
30
25
20
15
10
200
9
2010
2011
2012
2013
2014
2015
2016
Smal
l Fie
lds
Gas
Pro
duct
ion
* (b
cm/y
ear
GE
)
Gas price (E
UR
/MW
h)
Small field production vs. gas price
* From fields with
EBN participation
Production
Gas price
total, 137 exploration wells were drilled in the
offshore Netherlands in the period 2000 – 2016,
compared to 91 in the UK Southern North Sea and
47 in the Danish offshore. In this period the average
amount of exploration wells in the Netherlands was
8.1 wells/year, compared to 5.4 wells/year in the UK
and 2.8 wells/year in Denmark. These numbers have
dropped considerably for the UK and Denmark when
compared to the average of last five years (both
2.2 wells/year), whereas the amount of wells drilled
in the Netherlands has remained fairly constant
with 7.8 wells/year.
2.5 Drilling costsWell costs are largely governed by depth, technical
complexity and rig rates. Figure 8 shows the aver-
age total rig time and total costs for all offshore
wells drilled in the last ten years. The data is split
by stage. Generally, the deeper the target, the longer
each individual stage takes. The figure shows that
the post-TD (total depth) time differs significantly.
The difference in days between a well that has been
plugged and abandoned and a completed well with a
Jurassic or younger target is ten days, whereas this
difference increases to 20 days for a Rotliegend
well. Interestingly, all individual stages for a well
with a Carboniferous target are on average shorter
than for a Rotliegend well, a result of the fact that
many very complex wells drilled in the past had a
Rotliegend target. For Rotliegend wells, stimulation
activities have been added as an extra stage. A well
with an additional fracking job requires 54 more days
than an average Rotliegend well that has not been
fracked. Half of this extra time is due to complexity
related to long horizontal sections in the trajectory.
The remaining extra days are needed for a relatively
31
31
46
46
79
79
106
68
68
21
31
39
33
65
12
14
18
12
120 100 80 60 40 20 0 20 40 60 80 100 120
Jurassicandyounger(drywell)
Jurassicandyounger(completed andtested)
LowerTriassicandZechstein(drywell)
LowerTriassicandZechstein(completed andtested)
Rotliegend (drywell)
Rotliegend (completed andtested)
Rotliegend (stimulated wells)
Carboniferous (drywell)
Carboniferous (completed andtested)
Averageoffshorewelldurationperphase
daystodrilltoTD daystocompleteandtest daystocomplete,stimulateandtest daystoabandon
EUR 12mln
EUR 16mln
EUR 13mln
EUR 20mln
EUR 26mln
EUR 31mln
EUR 15mln
EUR 26mln
EUR 55mln
Target Average wellcost
Figure 2.9 Wells - Duration - costs
Jurassic and younger (dry well)Jurassic and younger (completed and tested)
Lower Triassic and Zechstein (dry well)Lower Triassic and Zechstein (completed and tested)
Rotliegend (dry well)Rotliegend (completed and tested)
Rotliegend (stimulated wells)
Carboniferous (dry well)Carboniferous (completed and tested)
120
100
80 60
40
20 0 20 40
60
80 100
120
Average offshore well duration per phase
Days drilled to TD
Days to abandon
Days to complete and test
Days to complete, stimulate and test
For Rotliegend wells extra days related to stimulation is shown
Target Average well costs
EUR 55 mln
EUR 26 mln
EUR 13 mln
EUR 12 mln
EUR 15 mln
EUR 31 mln
EUR 20 mln
EUR 16 mln
EUR 26 mln
31
31
12
21
79
79
18
39
68
68
12
33
46
46
14
31
106 65
8
9
24

long cleaning up and testing period after the actual
fracking job. Both factors also partly account for the
increased cost of these wells, as do the costs of the
fracking job itself. The resulting extra costs are
substantial, yet these are more than compensated for
by the incremental flow rates, as is explained in
Section 4.2.
2.6 ProductionFigure 9 shows small field gas production vs. gas
price between 2009 – 2016. In 2016, gas production
from small fields was 20.6 bcm (100%), which is 8%
less than in 2015, when 22.4 bcm was produced. In
the last eight years, a decline in production of 6 –
11% per year has been observed, with the exception
of 2012 and 2013 when the decline was 2 – 3%. In
those years, the gas price was historically the high-
est. It is not unrealistic to expect that the 4 – 6%
drop in production will be offset by a favourable
trend in gas prices in the future.
EBN aims to stabilise the gas production from small
fields at current production level. It is expected that
annual production will remain slightly below 20 bcm
in coming years. Figure 10 shows historical produc-
tion and the production forecast based on EBN’s
reserve and resource database. The volumes shown
are regarded as the business-as-usual setting, the
most likely scenario if the industry continues to drill
and develop its portfolio in the same pace as in pre-
vious years. However, EBN sees potential for an
upside scenario from enhanced activities such as
exploration, increased recovery, tight gas develop-
ment and infrastructure optimisation as described in
Chapters 3 – 5. These volumes are shown in Figure 11 .
It also includes resources that could follow from
collaboration concepts within the energy industry
such as gas-to-power, CCUS and geothermal dual-
play concepts, although this upside is difficult to
quantify. EBN’s upside is a growth scenario that is
not part of EBN’s reserves and resource database. In
total, this may add some 150 bcm until 2050. This will
enable production to be maintained above 20 bcm/
year for the next six to seven years, depending on
how fast innovative concepts will be implemented
and how quickly the gas price will recover. The (infill)
potential of remaining reserves and contingent
resources is still high and rewarding. It is vital to
continue exploration and drilling activities to main-
tain the production levels in the small field portfolio.
Figure 2.10 General_4_-_Production_Forecast
40
30
20
10
0
30
25
20
15
10
5
0
2010 2015 2020 2025 2030
2010 2015 2020 2025 2030
Prod
ucti
on*
(ris
ked,
bcm
/yea
r G
E)
Prod
ucti
on*
(bcm
/yea
r G
E)
Small field historic gas production and forecast
Small field production forecast
Reserves
Resources
Prospects
Business as usual
EBN upside
*From fields with EBN participation
*From fields with EBN participation
11
10
25

0,79 0,56 0,42 0,37 2,74%
Figure 2.13 & 2.14 graphs TLE
30
25
20
15
10
5
0
140
120
100
80
60
40
20
0
100%
90%
80%
70%
60%
50%
40%
30%
20%
10%
0%
100%
90%
80%
70%
60%
50%
40%
30%
20%
10%
0%
6,11%
10,84%
4,52%
12,4%
21,9%
10,4%
3,13%1,6%
28,7%
70%
79%85% 84%
90%
2,97
5,47 4,80 4,24 4,05
9,24
23,1522,78
21,0420,46
8,287,21 6,98
2,32 1,94 1,82
Very small fields (121)[<1 bcm]
Small fields (80)[1-3 bcm]
Medium sized fields (24)[3-5 bcm]
Large fields (43)[5-10 bcm]
Very large fields (18)[>10 bcm]
#Fields Expected Ultimate Recovery Factor
Average static GIIP
Expected ultimate
recovery factor
Average dynamic GIIP
% of technical UR wich
is uneconomic
Average UR techniocal
Relative GIIP gap
Average UR economic
Technical and economic recovery factor against field sizeV
olum
e (b
cm G
E)
+- 1 stand dev
Figure 2.13
North Sea Group
Lower Cretaceous
Scruff Group
Upper Triassic Group
Lower Triassic Group
Zechstein Group
Rotliegend Group
Carboniferous
0% 10% 20% 30% 40% 50% 60% 70% 80% 90% 100%
Expected recovery factor
#Fields 3
#Fields 8
#Fields 2
#Fields 41
#Fields 12
#Fields 11
#Fields 152
#Fields 312
Expected recovery factor
2.7 Recovery factorThe ultimate recovery factor of a field can be analysed
by using various factors, one being the impact of field
size on production characteristics (Figure 12 ). The
factor refers to the technically recoverable volume
from existing wells over the dynamic GIIP (Gas Ini-
tially in Place) at the end of the field’s life. The assets
included in the analysis are the on- and offshore
small fields in production in 2016 with EBN as a
partner. These assets have been classified into five
groups by technically recoverable volume, ranging
from very small fields (<1 bcm) up to very large fields
(>10 bcm). The GIIP gap shown in the figure is the
volume of gas that is not drainable by the current
wells but is assumed to be present.
It is important to keep in mind that the distribution
of fields is skewed: 20% of the total volume is present
in 70% of the smaller fields. In comparison, the fields
with a volume larger than 10 bcm represent some
40% of the total portfolio’s recoverable volume. A
clear relation between field size and performance is
12
13
26

Experience and knowledge greatly contribute to maximising field recovery, emphasising the urge for industry cooperation
visible: larger fields yield higher recovery factors,
show a lower relative GIIP gap and have a smaller
segment of technically recoverable volume that is
sub-economic. The main reason for this is that larger
fields justify higher CAPEX due to larger expected
revenues; investments such as higher compressor
stages and end of field life (EoFL) measures increase
the recovery factor (red line) significantly compared
to regular reservoir depletion.
Not only the field size, but also the stratigraphy is key
for a field’s ultimate recovery factor. In Figure 13 the
average ultimate recovery factor per stratigraphic
group is depicted, excluding the 19 fields producing
from multiple stratigraphies. It shows that the larger
the number of fields producing from a certain forma-
tion, the higher the recovery factor. This reflects that
experience and knowledge greatly contribute to max-
imising field recovery, emphasising the urge for
industry cooperation. For all stratigra phies with
more than ten fields, error bars depicting one
standard deviation have been included. This reveals
that the Carboniferous shows large uncertainty in
recovery factor, as is to be expected from this highly
heterogeneous stratigraphic interval.
2.8 EconomicsFigure 14 shows the investment level in small fields,
which has dropped significantly over the last years
following the low gas price environment. The low
prices have made the industry reluctant to invest in
new projects. Since the low point of the gas price in
April 2016, actual gas prices have upturned. However,
it is not expected that investments will recover to their
previous level in 2017, because most O&G projects have
long lead times. In the longer run, however, it may be
expected that annual investment levels of some EUR
700 million to EUR 1 billion are regained, depending
on future gas price developments. A recovery of the
investments is crucial to maintain adequate resource
maturation and production levels.
Figure 15 shows revenues, costs and profits that are
associated with exploration and production from
small fields on- and offshore in 2012 – 2016. The net
profit margin has declined sharply, but has remained
positive. This decline is mainly the result of the
low average gas price in 2016, which dropped
from just below EUR 0.20/Nm3 in 2015 to just above
EUR 0.13/Nm3 in 2016. Furthermore, the figure shows
that finding costs, largely based on geology and
geophysics costs (e.g. seismic surveys and dry explo-
ration wells), have decreased slightly since 2015.
This is mainly due to the reductions in general
activities and investment level as described above.
Depreciation is shown on a unit-of-production
basis, including depreciation over successful explo-
ration wells that have been capitalised in the balance
* From fields with EBN participation
Figure 2.15 production and investment levels of the small � elds Figure 2.15 production and investment levels of the small � elds
40
30
20
10
0
-10
-20
30
20
10
0
-10
-20
-30
Reserves to resources
Production (left axis)
Reserves added by new projects
Reserves revision in projects (*)
Reserves replacement
Maturation
2012 2013 2014 2015 2016
2012 2013 2014 2015
Res
erve
s (b
cm G
E)
Res
erve
s (b
cm G
E)
30
25
20
15
10
5
0
1600
1400
1200
1000
800
600
400
200
02012 2013 2014 2015 2016
Prod
ucti
on*
(bcm
GE
)
Investm
ents (E
UR
million
)
Production Investments
Production and investment levels 14
27

0.30
0.25
0.20
0.15
0.10
0.05
0
Finding costs
Depreciation
Production costs
Taxes
2012 2013 2014 2015 2016
Pric
e (E
UR
/Nm
3 )
Figure 2.16 pro� t margins small � elds
Costs and profit margins of small field production
Net profit
Figure 2.17 _ 2.18 opex production uoc o� shore gas
25
20
15
10
5
0
0.08
0.07
0.06
0.05
0.04
0.03
0.02
0.01
0
1200
1000
800
600
400
200
0
Production OPEX
2012 2013 2014 2015 2016
2012 2013 2014 2015 2016
Prod
ucti
on (
bcm
GE
)U
nit
OPE
X (
EU
R/N
m3 G
E)
OPE
X (E
UR
million
)
Offshore production vs. OPEX
Unit OPEX (offshore)
sheet and excluding any accelerated depreciation.
Production costs are the operating costs in the fig-
ure. The unit OPEX has stabilised since 2014 at
around EUR 0.06/Nm3, which means that in the last
few years the industry has been able to lower OPEX to
compensate for the decreasing production volumes.
OPEX is analysed further below. Based on the current
gas price developments and expected decreasing
production costs per Nm3, profit margins are
expected to recover in 2017.
Figure 16 shows the production level versus OPEX
for small fields, offshore only. Production from these
gas fields is steadily declining, as explained earlier.
However, since 2014, offshore OPEX has also been
declining and this trend continued in 2015 and 2016.
It is attributable not only to the lower production
levels, but also to the industry’s greater focus on
cost-cutting. For 2017, a further reduction of OPEX is
expected, in response to a continuing decline in
production and more focus on reducing costs.
Driven by a low gas price environment, operators are
increasingly focused on reducing OPEX. As a result,
the unit OPEX has decreased for offshore gas fields
in the last two years (Figure 17 ). The significant
increase in the years before 2014 has clearly been
halted, which is a welcome development, as bringing
down the unit OPEX is essential for maintaining
adequate profit margins and assuring an economi-
cally viable future for O&G production activities.
Lower OPEX is also likely to extend the window
of opportunity that the infrastructure can offer
with respect to gas production, the potential for
re-using the infrastructure and a cost-effective
decommissioning.
15
1716
Based on current gas price developments and expected decreasing unit OPEX, profit
margins are expected to recover in 2017
28
29

The energy transition in the Netherlands
As a representative of the government, what’s your take on the energy transition?We’re en route to a CO2-poor energy supply. The
energy transition is a big task that we’re tackling
by deploying various transition pathways:
built-up environment, mobility, industry, and
power and light. As you know, we use energy all
the time and it’s a basic necessity for life. The
energy transition doesn’t just have a major
social and climate objective; it also opens up
many economic opportunities. The transitioning
efforts of Dutch businesses, for example, are
also very marketable – you can already see this
happening more and more.
Are we making good progress with the energy transition?We’re still in the beginning stage. The largest
part of the work of implementation still lies
before us. Just look at the targets in the energy
agreement [an agreement for sustainable growth
between the Dutch government and over 40
Dutch organisations entered into in 2013]. In
2023, 16% sustainable – so 84% not yet. Each
transition pathway will have its own challenges.
For example, we need to make seven million
homes sustainable. That works out at 250,000
homes a year. It’s a huge job that all the parties
involved must put their full weight behind. We
can succeed only if we have sound and constructive
collaboration. It’s extraordinary to see that
everyone really sees the need for this.
What role do you envisage for the government in this?I think the government can play an important
role in several areas. The Netherlands has com-
mitted to the climate agreements made in Paris.
The targets formulated there about the warming
of the earth are also our targets. The government
will have to play an allocative role to stimulate
companies and citizens to achieve these targets.
I can see the market also obviously having an
important role. In terms of innovation, we’re
very dependent on the propositions the market
offers us. The government also has a role here,
to regulate everything economically. At the
moment, fossil energy is cheaper than sustain-
able energy, but as a government, we can give
sustainable energy the support it needs.
What can natural gas contribute in the energy transition?The fact is that natural gas is the least polluting
of all fossil fuels. In that respect, you could say
that by comparison with other fossil fuels we
could wait longer with phasing out natural gas.
In that respect, the ‘ladder of seven’ [as described
in Chapter 1] is a useful assessment framework.
At the same time, it’s a given that the natural
Interview with Sandor Gaastra, Director-General for Energy, Telecommunications and Competition at the Ministry of Economic Affairs, Agriculture and Innovation
30

The energy transition in the Netherlands
gas in the North Sea is finite and that in time it
will make up a smaller part of our energy mix.
This doesn’t alter the fact that in the coming
years it is very important that there are gas
reserves that we can use. If you decide to stop
using Dutch gas, then you have to import gas,
which means paying an extra bill for the energy
transition. We must ensure that the production
of natural gas remains a profitable activity for
operators.
How do you feel about the low investment climate in the O&G industry in the Netherlands?The low investment climate in the upstream O&G
industry has our explicit attention. Together with
the Minister it must be examined whether mea-
sures can be taken for the investment climate.
Market uncertainty has, unsurprisingly, made
the market more cautious. As the government, we
want to bring more certainty back into the market
by offering clear time limits to the industry.
What role can EBN play in the energy transition?In production from the small fields, EBN can
ensure that the O&G industry can function opti-
mally. For this, collaboration in all areas is
important, as it can limit costs. EBN plays an
important role in this. During the energy transi-
tion, EBN’s role might become broader. EBN has
a lot of expertise of the subsurface and this will
not be ignored during the energy transition. For
the energy transition, we need companies with
the right expertise. We’ll ‘repurpose’ some com-
panies. EBN is one such company. EBN could
also deploy its expertise in geothermal energy
and the underground storage of CO2. Not only
relating to its knowledge of the subsurface but
also because EBN is a party that can co-invest.
What’s your personal take on the energy transition?I’m very involved with the energy transition.
Our planet’s wellbeing is a subject close to my
heart. I have two children and I hope that they
will also be able to have a pleasant life. I believe
that we need to work seriously on the energy
transition. It’s great that this is a climate issue
that can go hand in hand with economic poten-
tial. I think that there’s a great opportunity for
the Netherlands.
31

Exploring for new prospects
and play concepts
32
Normal fault offsetting the Rotliegend and Zechstein in the Münden Quarry, Germany.

3
Exp
lori
ng
for
new
pro
spec
ts a
nd
play
con
cept
s
Exploring for new prospects
and play concepts
33

EBN’s goal is to create value from
geological resources in a safe, sustainable
and economically responsible way, by
exploiting its unique position as partici-
pant in almost 200 exploration and production
licences and infrastructure, and hence its excellent
access to data, knowledge and capital. This chapter
deals with the first step in the life cycle of subsur-
face projects: exploration (Figure 1 ). EBN stimu-
lates exploration activity in underexplored areas by
carrying out and funding studies, and by facilitating
the sharing of data and knowledge
In recent years, three regional studies have been
carried out: the DEFAB study, the G&M study and a
study focusing on the potential of the Dinantian in
the P quadrant and adjacent areas (Figure 2 ). These
projects identified significant remaining explora-
tion potential and have facilitated new exploration
activity. The DEFAB study in the northern offshore
focuses on a wide range of stratigraphic intervals.
The results comprise a regional structural frame-
work (Focus 2015), insights into the presence of
source rock bearing units and hydrocarbon shows
(Focus 2014 and 2016), the distribution of shallow
gas opportunities (Focus 2015), and the definition of
the potential of Lower Carboniferous clastics (Focus
2016), Zechstein carbonates (Focus 2014), Triassic
(this chapter), Jurassic (this chapter), Chalk and the
Devonian Kyle limestone. Studies in the G&M area
have focused mainly on the Base Cretaceous Uncon-
formity, the Lower Cretaceous (Focus 2016) and the
Jurassic. Multiple additional plays have been defined
in this area, such as the Upper Cretaceous Chalk
sealed by Tertiary shales or intra-Chalk traps and
Upper Jurassic sandstones sealed by intra-Jurassic
and/or Lower Cretaceous shales. The Dinantian
shows potential for fractured and karstified reser-
voirs in both the Dutch on- and offshore, which are
applicable for both hydrocarbon exploration and
geothermal energy (this chapter).
3.1 Exploration activity
Exploration wells and licencesIn 2016, six exploration and appraisal wells were
drilled with EBN participation, all for near-field
exploration in mature areas (Figure 2 ). In addition,
four exploration licences were granted and three
new applications were received, most of which are
in underexplored offshore areas.
Seismic acquisitionAfter several decades of 2D seismic reflection data
acquisition, the first – experimental – 3D acquisi-
tion in the Netherlands took place in 1976. Rapid
growth followed in the 1980s, with extensive on-
1
Figure 3.1 OverviewFigureExploration
Overview of the topics in this chapter
EBN studies Knowledge sharing
Industry explorationactivity
Focus 2017
Explore Appraise Develop Produce Abandon
• Triassic• Jurassic• Dinantian
• Exploration day• Seismic acquisition
symposium
• Licence applications
• Wells drilled
34

Exploration wells 2016
Appraisal wells 2016
Gas field
Oil field
Production licence
Production licence under application
Exploration licence
Exploration licence under application
Exploration licence granted in 2015/2016
EBN study areas
0 25 50 km
2 3
and offshore 3D seismic acquisition campaigns.
Since then, some 90,000 km2 3D seismic data has
been acquired, covering around 37% of the Dutch
onshore and 81% of the offshore. The time-slice
map displays locations for which 3D seismic data is
available today (Figure 3 ). Figure 4 shows the 3D
seismic acquisition activity over the years. The vari-
ation in activity is partly explained by the fluctuat-
ing oil price and partly by advances in technology
and new play concepts. Recently, novel acquisition
technologies like 4D data acquisition, broadband
seismic or wide-azimuth shooting have been deployed
successfully in the Netherlands. No acquisition took
place in the last two years, but new 3D seismic
acquisition is planned in 2017.
3.2 EBN exploration studies
Ventoux: An Upper Jurassic lead mapped onnew seismic dataThe Late Jurassic play is well established in the
Dutch Central Graben, with 11 O&G fields discovered,
including the 125 MMbbl STOIIP & 21 bcm GIIP
F03-FB field. Block F08, located in this area, has
only recently been covered by 3D seismic data. Using
the new data, EBN has evaluated the potential of the
Late Jurassic lead Ventoux; a fault-dip closure with
the Kimmeridge Clay as top seal.
Ventoux consists of multiple Upper Jurassic targets
that can be tested with a single exploration well
(Figure 5 ). Complex faulting structures are obser-
ved, soft-linked to deeper extensional faulting. Two
targets are the proven Lower and Upper Graben
Formation sands. A third target consists of Lower
Kimmeridgian sands (Figure 6 ). This stratigraphic
interval has not been tested in the wider area, yet the
seismic signature suggests that it is a regressive unit
that may well contain sands (Figure 7 ). Charge is
expected from the Lower Jurassic Posidonia Shale
Formation, as there have been O&G shows in up-dip
well F08-02. Total prospective resources amount to
15-65 MMbbl STOIIP (P90-P10, unrisked) and upside
exists in pinch-out and truncation trapping west of
the lead. The probability of success ranges from 20 to
35% for the different targets.
35
EBN exploration studies in underexplored areas and exploration & appraisal wells 2016
3D seismic coverage in the Netherlands - time slice at 1 s TWT
�ela�ve seismic am�lit�de at � s ���
-1.0
-0.79
-0.59
-0.31
-0.24
0
0.24
0.31
0.59
0.79
1.0
3D seismic coverage in the Netherlands
0 20 40 60 80 km
�r���c���: ��M, ���� 31N
Map datum: ED50
March 15, 2017
(c) EBN B.V.

In February 2017, EBN and ENGIE E&P organised
the fourth geophysical symposium. The topic
this year was seismic acquisition. The purpose
was not only to highlight recent advances in
acquisition techniques, but also to provide a
forum for contractors to present their capabili-
ties to the Dutch O&G and geothermal indus-
tries, as well as to highlight issues in acquisition
in general.
After a kick-off presentation by EBN on trends
in acquisition, the focus in the morning was on
offshore acquisition developments, with presen-
tations from PGS, Polarcus, Shearwater and
WesternGeco. Whereas in recent years compa-
nies have concentrated on more and longer
streamers, multi-azimuth surveys and broad-
band acquisitions, the recent developments are
in the area of multiple sources and use of seismic
energy generated by sea surface multiples.
Despite the bigger processing effort required,
the advantage is shorter acquisition time and
increased frequency range. Also, new sources
have been developed that suppress higher fre-
quencies (> 200 Hz), thereby reducing exposure
of marine mammals. This helps limiting the
environmental footprint of seismic acquisition.
The afternoon focused on onshore acquisition
and started with a presentation on survey design
(Cees van der Schans consultancy).
An interesting anecdote was the story of the
EAGE annual conference in 1999, where five
specialists were asked to design a 3D survey for a
specific purpose. The outcome was five different
designs, showing the non-unique character of
the solution. Uppsala University presented a
study on using 4D seismic data to monitor the
CO2 plume development in the CO2 storage in
Ketzin, Germany. The repeatability of the origi-
nal survey is key to success, but it was also
shown that relatively simple acquisition
techniques will suffice. This presentation
was followed by DMT, which presented on 3D
acquisition in the city centre of Munich and the
challenges posed by this environment.
Royal HaskoningDHV presented on the permit-
ting procedures for an onshore 3D survey
planned in 2017 in the north of the Netherlands.
Fourteen permits and exemptions are required
from MEA, Rijkswaterstaat, the Water Board,
province and municipalities. TNO closed the
programme with a presentation on a high-
resolution survey for the monitoring of potential
CO2 storage in the P18 licence. They also showed
some interesting preliminary results on passive
seismic monitoring in the De Peel area.
The day was very well received by the 70 delegates
from 28 companies and institutions. Released
presentations are available on EBN’s website.
Symposium ‘Reflections on Seismic Acquisition’
36

To further de-risk the lead it is recommended to:
• PSDM reprocess the seismic data to improve
the imaging of the complex faulting, increase
resolution and to reduce the multiples at the
Jurassic–Cretaceous boundary;
• Investigate DHIs and AVO behaviour of the reser-
voir intervals;
• Further investigate the timing/movement of
faulting and fault juxtaposition.
Ventoux lead
Dip line through the Ventoux lead, location shown in Figure 6
-3500
-350
0
-325
0
-325
0
-300
0
-300
0
-300
0
-275
0
-275
0-2
750
-250
0
-250
0
-250
0
-250
0
-225
0
-2250
-225
0
-225
0
-200
0
-2000
-200
0
-1750
-1750
-175
0
F08-02
0 500 1000 1500 2000 2500m
-6000-5500-5000-4500-4000-3500-3000-2500-2000
Elevation depth [m]
Depth top Kimmeridgian sands
MapSurface name
Depth top Kimmeridgian sandsProject
DEFAB JurassicProjection
ED50-UTM31Contour inc
50Date
09/11/2016
Eroded
W
NE
NE
SW
FOB Ventoux, target 3
Top structure map of Kimmeridgian sandstones
4
10,0009,0008,0007,0006,0005,0004,0003,0002,0001,000
0
12010896847260483624120
1980
1982
1984
1986
1988
199
0
199
2
199
4
199
6
199
8
200
0
200
2
200
4
200
6
200
8
2010
2012
2014
2016
2017
3D Seismic acquisition in the Netherlands
Onshore Offshore
Multiple streamer acquistion
Long cable acquistion
Oil price
Figure 3.4 Barchart km2 pa
Seis
mic
acq
uisi
tion
(km
2 ) Oil price (U
SD/bbl)
6
5
37

Reservoir potential of the Lower Kimmeridgian
Lower Kimmeridgian regressive unit:untested play in block F08
Upper Jurassic shallow marine sandstones in the northern offshoreExploration in the Upper Jurassic in the Dutch
Central Graben has focused on look-alikes of
F03-FB: a field that produces from Callovian–
Oxfordian Lower and Upper Graben Formation
sands. In the neighbouring UK (Fife) and German
(A6-A) sectors there are fields that produce from
younger Jurassic reservoirs: Kimmeridgian to Vol-
gian sands. These sands have also been found in
the Danish sector, where they are known as the
‘Outer Rough Sands’.
What is not widely known is that similar sands are
also present in the Dutch sector and have been
drilled in wells B13-02 and B14-02 (Figure 8 ),
where they are part of the Noordvaarder Member. A
petrophysical analysis of well B13-02 shows a net
sand thickness of 160 m, a net-to-gross ratio of 0.93
and an average porosity of 21%. Core plug measure-
ments confirm the reservoir potential of the interval.
Published regional correlations suggest that these
sands may be present in a wider part of the northern
Dutch offshore as far east as the B quadrant (Figure
9 ); more work is recommended to de-risk this new
play.
Triassic reservoir sands in the Dutch northern offshoreThe Triassic Main Buntsandstein play is well estab-
lished in the Southern North Sea area. Although the
general perception is that the chances of encounter-
ing reservoirs decrease northwards, a regional study
by EBN shows that reservoir sands do occur north of
the main fairway (Figure 10 ). The lithological char-
acter and stratigraphic extent in this area suggest
that Lower Triassic fluvial sands with northern
provenance may have developed here (Figure 11 ). In
addition, seismic interpretation indicates Early
Triassic local depocentre development in the Step
Graben area (Figure 12 ).
Noordvaarder Mb: Shallow marine sandstones
Section flattened at Base Chalk
7
8
38
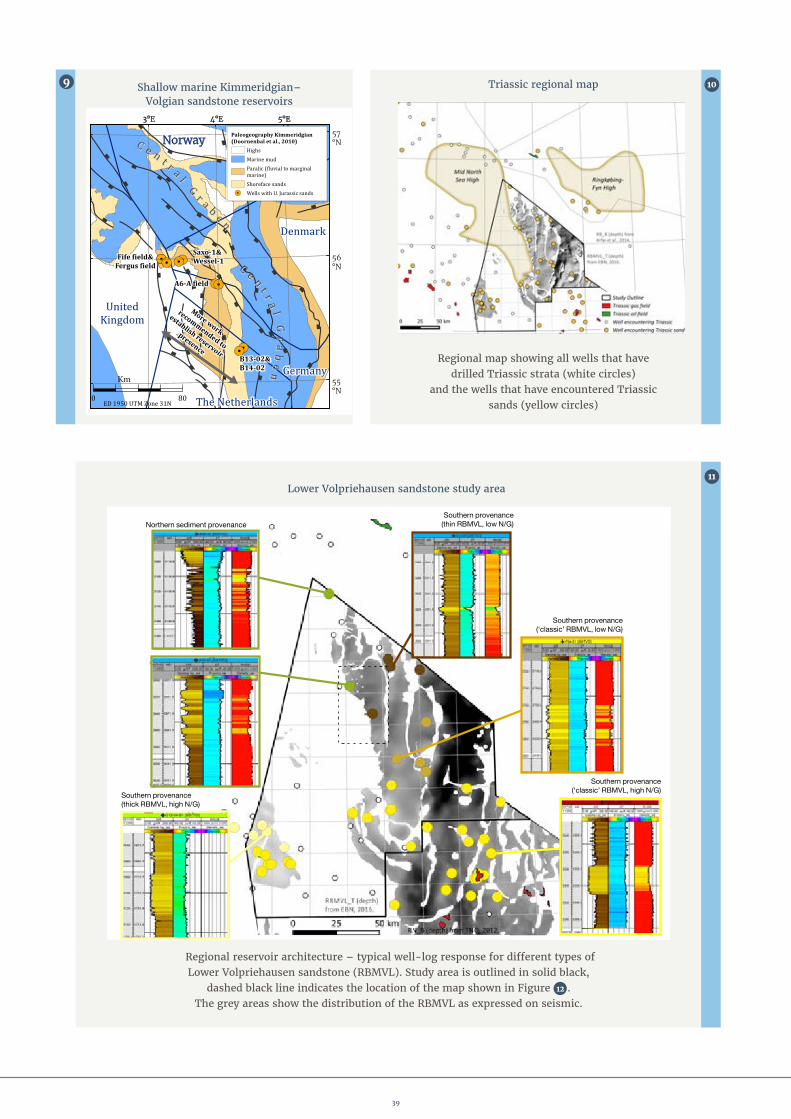
Northern sediment provenance
Southern provenance (thick RBMVL, high N/G)
Southern provenance (thin RBMVL, low N/G)
Southern provenance(‘classic’ RBMVL, low N/G)
Southern provenance(‘classic’ RBMVL, high N/G)
Figure 3.11 Trias_Fig_2_mko_log_character_20170323
Lower Volpriehausen sandstone study area
Regional reservoir architecture – typical well-log response for diff erent types of Lower Volpriehausen sandstone (RBMVL). Study area is outlined in solid black,
dashed black line indicates the location of the map shown in Figure 12 . The grey areas show the distribution of the RBMVL as expressed on seismic.
9
!.!.
!.
!.
!.
!.
!.!.
!.
5°E4°E3°E
57°N
56°N
55°N
0 80
Km
Norway
Denmark
Germany
The NetherlandsED 1950 UTM Zone 31N
B13-02& B14-02
Saxo-1&Wessel-1Fife field&
Fergus field
Paleogeography Kimmeridgian(Doornenbal et al., 2010)
HighsMarine mudParalic (fluvial to marginalmarine)Shoreface sands
!. Wells with U. Jurassic sands
UnitedKingdom
CC ee nn tt rr aa llGG rr aa bb ee nn
CC ee nn tt rr aa llGG
r raabbeenn
A6-A field
More work
recommended to
establish reservoir
presence
Shallow marine Kimmeridgian–Volgian sandstone reservoirs
10
Figure 3.10 Trias_Fig_1_mko_20170331
Triassic regional map
Regional map showing all wells that have drilled Triassic strata (white circles)
and the wells that have encountered Triassic sands (yellow circles)
11
Figure 3.10 Trias_Fig_1_mko_20170331
Triassic regional map
Regional map showing all wells that have drilled Triassic strata (white circles)
and the wells that have encountered Triassic sands (yellow circles)
39

0 10 20 km
Thickness Lower Trias (ms)
0
40
80
120
160
200
240
280
320
360
Zechstein salt
Figure 3.12 Trias_Fig_3_mko_thickness_lower_trias_20170317
Time isochore map of the Lower Triassic interval (Top Lower Volpriehausen sandstone to Top Zechstein)
Syn-tectonic strata in local depocentres may have
been formed in the northern Dutch offshore due to
early halokinesis in the Triassic. These insights
shine new light on the Triassic prospectivity in the
Dutch northern offshore: 44 untested structures
have been identified (EBN, 2016).
Dinantian carbonates: synergy between hydrocarbon and geothermal projects The Lower Carboniferous Dinantian carbonates
have recently become an exploration target in the
Netherlands, for both hydrocarbons and hot water.
Evaluation of recent oil, gas and geothermal wells in
Belgium and the Netherlands, combined with seis-
mic mapping carried out by TNO and EBN, has
Figure 3.13 Dinantian_distrubution_map_20170331
Distribution map of Dinantian carbonatesin the Netherlands
Modified from a TNO report, Boxem et al., 2016
Dutch onshore and offshore border
Wells that drilled Dinan�an age rocks
Dinan�an facies
Pla�orm
Pla�orm possible
Pla�orm unlikely (basinal facies)
London-Brabant Massif
Distribu�on of Dinan�an carbonates
0 20 40 60 80 100 km
Projec�on: UTM, Zone 31N
Map datum: ED50
Dutch onshore and offshore border
Wells that drilled Dinan�an age rocks
Dinan�an facies
Pla�orm
Pla�orm possible
Pla�orm unlikely (basinal facies)
London-Brabant Massif
Distribu�on of Dinan�an carbonates
0 20 40 60 80 100 km
Projec�on: UTM, Zone 31N
Map datum: ED50
0 20 40 60 80 100km
Figure 3.14 Dinantian karsti� ed carbonate rock core picture
Core with karstified Dinantian carbonate rock from Belgian underground gas storage well
resulted in a new distribution map of Dinantian car-
bonates (Figure 13 ) and improved understanding of
the mechanisms and conditions leading to favour-
able reservoir quality.
The main reason for the under-exploration of
Dinantian carbonates was the misconception that
these rocks are always impermeable. However,
several wells and seismic data show the potential for
a fractured and karstified (producing) reservoir. Gas
storage wells in Belgium and recent geothermal
wells in that country and the Netherlands have
found highly permeable rocks (Figure 14 ), and
therefore opinion about the reservoir potential has
changed.
12 13
14
40

Recent wells have shown that the most promising
features for identifying exploration targets are
specific depositional and/or structural configura-
tions. The conceptual diagram in Figure 15 shows
four different scenarios for karstification and frac-
turing of a Dinantian carbonate reservoir: 1) Mete-
oric karstification takes place when the rocks are
exposed at surface and fresh water flows through
faults and fractures; 2) Hydrothermal karstification
takes place when hot fluids flow upwards through
deep-seated faults. These fault zones will be frac-
tured too; 3) Intra-platform karstification takes
place during low sea level periods that alternate
with phases of carbonate development; and 4) Mixed
coastal-zone karstification can occur when a car-
bonate platform is exposed to a mix of fresh and salt
water. The edges of the platform will also be more
prone to fractures, as a result of instability. The fea-
tures indicated in Figure 15 can be recognised on
seismic data. Figure 16 shows geothermal well
CAL-GT-01 that encountered a karstified zone of at
least 30 m at the top of the Dinantian section and
produced 240 m3/h. The seismics show that the well
was drilled close to a fault zone. Evaluation of sam-
ples indicates that karstification and dolomitisation
were caused by hydrothermal diagenesis (Poty,
2014). Figure 17 shows an example of a Dinantian
carbonate platform. Well UHM-02 was drilled in the
middle of the platform and encountered a few thin
karstified zones. More fractured and karstified,
hence more permeable, carbonate rock may be found
near the edges of the platform.
Post-Triassic1
4
3
2
S N
Permo-Triassic
Upper CarboniferousNorthernNetherlandsPlatforms
Silurian-Devonian Basement
North Frisian BlackShale Basin
London-Brabant Shelf
1 Visean platforms2 Tournaisian ramp
Karst scenarios
12
1
Figure 3.14 Dinantian karsti� ed carbonate rock core picture
Scenarios for karstification and fracturing of Dinantian carbonate reservoir
Locations with a higher chance of karstification are indicated by orange ellipsoids.
0
-0.5
-1.0
-1.5
-2.0
TWT
[s]
22 kkmm
CCAALL--GGTT--0033((pprroojjeecctteedd))
CCAALL--GGTT--0011((--SS11))((pprroojjeecctteedd))WW EE
ZZeecchhsstteeiinn && LL.. GGeerrmmaanniicc TTrriiaass GGpp((PPeerrmmiiaann –– TTrriiaassssiicc))
LL..--UU.. NNoorrtthh SSeeaa GGpp((CCeennoozzooiicc))
CCaarrbboonniiffeerroouuss LLiimmeessttoonnee GGpp
((DDiinnaannttiiaann))
BBaannjjaaaarrdd GGpp
((DDeevvoonniiaann –– ??DDiinnaannttiiaann))
LLiimmbbuurrgg GGpp
((~~NNaammuurriiaann))
LLiimmbbuurrgg GGpp
((~~WWeessttpphhaalliiaann))
CChhaallkk GGpp ((UU.. CCrreettaacceeoouuss –– PPaalleeooggeennee))
DDaattaa ccoouurrtteessyy CCaalliiffoorrnniiëëWWiijjnneenn GGeeootthheerrmmiiee BB..VV..
Seismic line through geothermal well CAL-GT-01
15
16
41

Since exploration for hydrocarbons and geothermal
energy require similar type of data and geological
knowledge, both will benefit significantly by sharing
data and knowledge on the Dinantian strata, and
possibly by collaborating on projects. The successful
Californië geothermal project in the province of
Limburg and the recent award of the Dutch P quad-
rant hydrocarbon exploration licence show that this
play is ‘hot’ in both industries.
Hydrocarbon shows revisitedExploration activity requires a good overview of
proven occurrences of hydrocarbons. For that purpose,
EBN has built a database that contains observations
of gas or oil in the subsurface as recorded in wells.
Information from mud logs, drill stem tests, repeat
formation tests and cores is compiled and described
per stratigraphic level (Figure 18 ). Both the pres-
ence and absence of shows are documented and
quantified, to enable detailed analyses to be made
regarding the prospectivity of an area. This includes
analysis of maturity, migration path and the effec-
tiveness of seals. The database can also be used
to identify obviously missed pay opportunities.
Furthermore, this information can assist in well
planning, including for geothermal wells, where a
good understanding of the distribution of hydro-
carbons is important, even when hydrocarbon satu-
rations are low. Currently, the database covers the
entire northern offshore and is being expanded
towards the south including onshore.
UHM-02
-1.5
-2.0
-2.5
-3.0
-3.500 11 22 33 44 55kkmm
-10.00-7.50-5.00-2.500.002.505.007.50
Amplitude
TWT
[s]
ZZeecchhsstteeiinn ssaalltt
NNEE SSWW
RRoottlliieeggeenndd
WWeessttpphhaalliiaann
NNaammuurriiaann
DDiinnaattiiaann ccaarrbboonnaatteess
Dinantian carbonate platform visible on seismics (example)
Hydrocarbon shows per stratigraphic group
Hydrocarbon shows (normalised per group, # of shows indicated in bars)0 % 10 % 20 % 30 % 40 % 50 % 60 % 70 % 80 % 90 % 100 %
North Sea Supergroup
Chalk Group
Rijnland Group
Upper Jurassic
Altena Group
Upper Germanic Trias Group
Lower Germanic Trias Group
Zechstein Group
Rotliegend Group
Limburg Group
77 100 265 1269
46 63 66 577
52 816
106 91 91 295
11 47 73 152
45 972
70 35 56 690
87 45 86 990
122 39 56 197
69 29 48 107
GOODFAIRPOORNO SHOW
17
18
Wells and seismic data show the potential for
producing Dinantian carbonate reservoirs.
42

Dutch Exploration Day
In May 2016, EBN organised the first edition of the Dutch Exploration Day, with the theme ‘Sharing
Knowledge’. Around 60 representatives from the operators and contractors active in the Dutch O&G
industry were welcomed by EBN CEO Jan-Willem van Hoogstraten. The day was of great interest to the
industry and was fully booked. After the introduction, EBN’s exploration team presented results from
their ongoing and completed studies and their plans for upcoming projects. The morning programme
ended with a poster session, where knowledge was shared, ideas tested and new contacts made. In the
afternoon session, several contractors presented their studies to the industry. The day concluded with a
second poster session and drinks.
The day was well received and many delegates expressed the wish for a second edition. It is intended to
organise a new edition in the near future, again with the goal to strengthen cooperation within the sector.
Presentations and posters are available on the EBN website.
43

44

4
Res
ervo
ir s
tim
ulat
ion
an
d pr
oduc
tion
opt
imis
atio
n
Reservoir stimulation
and production optimisation
45

In addition to its efforts to help find new gas
resources, EBN aims at maximising recovery
from fields already discovered. These include
producing fields for which the operators
are facing increasing technical and economic
challenges. Close to 90% of the fields in which EBN
participates are in the mature or tail-end produc-
tion phase. Recent studies have contributed to opti-
mising the selection of the most valuable end of
field life (EoFL) techniques in terms of volume and
economics. Moreover, whenever possible, EBN
keeps a close eye on the so-called stranded fields,
which have not yet been developed, often because of
insufficient permeability – a challenge also faced
by some prospects. Special attention is given to
these tight reservoirs through projects relating
to advances in reservoir characterisation and by
investigating the potential for stimulation tech-
nologies such as hydraulic fracturing.
4.1 New insights into hydraulic fracturingIn the gas industry, the application of hydraulic
fracturing is a well-known technique to accelerate
production and enhance ultimate recovery
by increasing the productivity of low permeability
reservoirs. What seems less well-known, is the fact
that these benefits apply not only to high-pressure
virgin reservoirs containing low permeability rocks,
but also to reservoirs showing better production
characteristics, even during advanced stages in their
production life, the so-called brownfields.
In order to assess the benefits resulting from
stimulation of brownfields, EBN initiated a study
aiming at quantifying the additional production and
economic value, evaluating risks, and screening the
practical application to the mature gas field port-
folio. The project considered the wide range in
reservoir characteristics typically observed in the
Dutch subsurface. A total of 30 different reservoir
configurations has been investigated, each with
varying parameters such as thickness, permeability,
heterogeneity, GIIP and degree of pressure deple-
tion. It is expected that this study will help to
identify gas fields potentially benefiting from and
being eligible for hydraulic fracturing.
Figure 1 shows the modelled production increase
resulting from hydraulic fracturing for low (1 mD) to
higher (10 mD) permeability reservoirs. The extra
volume of gas yielded by fracking is biggest for the
tightest rocks, but fields with good permeability also
profit. Furthermore, the results show that in the case
of poor quality reservoirs, the highest in cremental
production can be expected after approximately five
years, whereas for higher permeability reservoirs,
0.25
0.2
0.15
0.1
0.05
0
0 2 4 6 8 10 12 14 16
Incr
emen
tal p
rodu
ctio
n (
bcm
GE
)
Additional annual production due to fracking
Time (years)2 mD 5 mD 10 mD1 mD
1
46

12 / 1816 / 2016 / 30
Proppant size20 / 40 20 / 40 and 16/2020 /40 and 16 / 30
70
60
50
40
30
20
10
0
-10
70
60
50
40
30
20
10
0
-10
0,0 0,5 1,0 1,5 2,0 2,5 3,0
0 50 100
150
200
250
300
350
40
0
450
500
Incremental NPV resulting from hydraulic fracturing
Incremental NPV resulting from hydraulic fracturing
Incr
emen
tal N
PV (
EU
R m
ln)
Incr
emen
tal N
PV (
EU
R m
ln)
Remaining connected GIP (bcm GE)
Pressure at time of frack (bar)
production acceleration occurs within the first few
years. This means that hydraulic fracturing does add
value and is attractive even when the economic time
horizon is short.
Parallel to the work described above, EBN is working
on a portfolio analysis of the historical results of
hydraulic fractures in the Netherlands, including
technical and economic benefits. This involves his-
tory matching analytical models with production
data, in order to achieve reliable production fore-
casts required for calculating the economic value of
the fracking jobs. The database contains wells with
pre-fracking production data and wells that were
fracked from the outset. The work is still ongoing,
but some preliminary results are given below.
Production benefits from hydraulic fracturing
through: 1) accelerating production, 2) reaching a
higher total recovery, and 3) connecting extra
dynamic volume. The preliminary results of the port-
folio analysis reveal that virtually all frack jobs with
pre-frac production have led to an increase of pro-
ductivity index (PI), indicating that practically all jobs
are assumed to be a technical success (Figure 2 ).
Looking at the entire set of fracks that are currently
being investigated, including wells that were fracked
from the outset, it may be concluded that hydraulic
fracturing almost always has a positive effect on the
net present value (NPV), independent on the volume
of hydrocarbons present in te reservoir (Figure 3a ).
There seems to be a linear corellation between
remaining connected volume and NPV. The negative
NPV for three fracturing jobs is due to very low reser-
voir pressures and remaining reserves at the time of
fracking for two projects (Figure 3b ) and an extremely
small connected volume for another project.
Productivity Index (PI) before and after frac job
200
150
100
50
00 20 40 60 80
Productivity Index (PI) before and after frac job
No productivity increaseDoubling of the productivityTripling of the productivity
Proppant size12/1816/2020/4020/40 and 16/20PI
wit
h f
rac
PI without frac
2
3b
3a
47

In the last few years, hydraulic fracturing has
become a contentious issue, especially in the
debate on shale gas. Fracking has been around for
many decades. Below a summary of facts related to
fracking in the Netherlands is given, largely based
on two studies by NOGEPA (NOGEPA Fact Sheet
Fracking, NOGEPA 2013) and State Supervision of
Mines (Resultaten inventarisatie fracking. De toe-
passing van fracking, de mogelijke consequenties
en de beoordeling daarvan, SodM Feb 2016).
In the Netherlands, fracking fluids are exten-
sively regulated by:
1) The EU, which regulates the use of chemicals
through EU 1906/2007 REACH and EU 528/2012
on biocides;
2) The OSPAR convention, which further regu-
lates the use of substances in offshore mining
activities;
3) The Dutch Mining Act, the General Mining
Industry (Environmental Rules) Decree, the
Environmental Management Act and the
Health and Safety in the Workplace Act, which
regulate, among other things, emissions to the
subsurface, surface waters and air, and impose
restrictions on sound and light emissions.
The regulations are also meant to protect
in habitants and aim to prevent damage due to
earth movements.
In February 2016, State Supervision of Mines
reported that in total 252 fracks have been executed
on- and offshore in the Netherlands, as shown in
the table below. The data has been updated with
the two offshore wells that since then have been
fracked with a single hydraulic fracture.
State Supervision of Mines investigated the
impact of fracking in the Netherlands with
respect to people and the environment based on
five aspects:
1) Seismic risks due to hydraulic fracturing;
2) Geochemical reactions between injected fluids
and the reservoir;
3) Wellbore integrity;
4) Integrity of cap rock and base rock to prevent
migration of fluids;
5) Exposure to chemical substances.
Results show that no negative effects for these
five aspects have been reported. The following
factors are probably contributing to this good
safety record:
• Hydraulic fractures are extensively mod-
elled. They are designed not to grow out of
the reservoir zone vertically, in order to pre-
vent fluid migration and to avoid larger
faults nearby. To further reduce the risk of
activating faults leading to tremors, pumped
injection volumes are kept to a minimum.
• Wellbores are designed for pressures to
which they are exposed during hydraulic
fracturing to prevent leakage of fluids. Well-
bore pressures are monitored while pump-
ing the hydraulic fracture, to ensure they
stay within pressure limits. Multiple layers
of steel and cement prevent fluid leakage
into potential drinking water sources. A
study on water injection wells in the Willis-
ton Basin in North Dakota (Michie and Koch,
1991) has shown that when the production
casing and surface casing extend below the
drinking water source, the risk of leaks is
smaller than 0.0007% (seven out of mil-
lion). Moreover, almost all wells in the
Netherlands are designed with more than
two casings at drinking water level.
Regulation and supervision of hydraulic fracturing
Number of Number of fracked wells fracks
Offshore 157 221
Onshore 97 119
Total 254 340
48

600
500
400
300
200
100
01 2 3 4 5 6 7 8 9 10 11 12 13 14 15
Cum
ulat
ive
prod
ucti
on (
mln
Nm
3 GE
) Volume gain by EoFL technique
Wells
Velocity string Foam
TNO deliquification tool Actual Expectation operator
4.2 Gas well deliquificationMature gas wells in which the gas flow rate is insuf-
ficient to transport the liquids to the surface suffer
from so-called liquid loading. Consequently, liquids
will accumulate in the wellbore and can eventually
cause the well to stop producing due to the back-
pressure that is induced. An EBN inventory shows
that liquid loading occurs in approximately 40% of
gas wells once the reservoir pressure drops below a
critical value of 100 bar. To mitigate liquid loading,
gas well deliquification methods can be applied. Sev-
eral gas well deliquification technologies are avail-
able, the most common being the installation of
velocity strings and foam-assisted lift. Properly
designed gas well deliquification methods are esti-
mated to increase a well’s ultimate recovery from
roughly 85% to 95%. In addition to liquid loading,
mature fields might suffer from salt precipitation.
Projects aiming at mitigating salt precipitation were
discussed in Focus 2016.
Actual gains from deliquification projectsIn 2016, EBN evaluated the five-year historical
performance of the EoFL techniques that use velocity
strings and foam. The production from a total of
64 liquid-loaded wells was examined, showing that
the volume gains using velocity strings or foam injec-
tion range widely. About half of the wells produced 10
to 15 million Nm3 more due to the application of one
of the techniques, and some of the remaining wells
even produced an extra 100 million Nm3 or more. This
wide range is attributable to well and reservoir con-
ditions. Pressure and inflow characteristics are the
important factors affecting ultimate recovery from
these techniques. 15 Wells were examined in more
detail, particularly in terms of incrementral recovery
and economics. First the volumes of the initial project
proposal from the operators (i.e. their initial expecta-
tion) have been compared with volumes calculated by
TNO’s deliquification tool (described below). Subse-
quently actual incremental recovery from the first
4
5
25
20
15
10
5
0
1 2 3 4 5 6 7 8 9 10 11 12 13 14 15
Net
pre
sen
t va
lue
(EU
R m
ln)
Net present value of EoFL techniques
Wells
Velocity string Foam
49

date of the installation until the end of 2016 has been
investigated. The volume gains per EoFL technique
for these 15 wells are shown in Figure 4 .
The deliquification methods show a high success rate
for over 70% of the 15 wells that were analysed, with an
NPV between EUR 2 – 20 million per well (Figure 5 ).
The four wells that are already abandoned show a
negative NPV, due to operational issues such as poor
wellbore conditions and tubing leaks. These EoFL
techniques have been demonstrated to be a very
valuable asset for mature gas fields. The most
important benefits are quantitative and economic
and justify the cost of the installation. EoFL methods
enable gas wells to remain in production beyond their
technical limits, which increases the ultimate recovery.
Joint Industry Projects on gas well deliquificationThe various Joint Industry Projects (JIPs) on gas well
deliquification in which EBN has participated since
2011 have contributed to the understanding of the
impact of reservoir properties on liquid loading in
gas wells. The JIPs have resulted in the development
of various qualitative and quantitative tools for
selecting deliquification techniques and optimising
foam. The first project, TNO JIP Deliquification
Techniques (2011 – 2012), included a literature study
in which US experience was translated to Dutch
wells/reservoirs. Also a qualitative tool was
developed to select the most suitable deliquification
technique for a given well. Finally, a quantitative
selection tool was developped that predicts the gains
in production and ultimate recovery resulting from
the application of a range of methods: velocity
string, eductor, wellhead compression, electric sub-
mersible pump, foam, gas lift, plunger lift and tail-
pipe extension (Figure 6 ).
In the TKI-JIP Foamers for deliquification of gas wells
(2012 – 2014), a standard procedure for foam testing
was developed, including an improved description
of the behaviour of foams under field conditions,
resulting in a foam optimisation tool. A more
fundamental project, TKI project Unstable flow in
liquid loading gas wells (2015 – 2016), was addressing
flow behaviour in a well in the unstable liquid loading
phase and the influence of reservoir properties on the
onset of liquid loading. In the laboratory, most liquid
loading experiments are performed at fixed gas and
liquid rates (mass flow controlled). In reality, well
behaviour is the manifestation of a coupled well–
reservoir system in which the reservoir characteristics
determine whether the inflow into the well is con-
trolled by pressure or by mass flow. In an innovative
experimental setting (Figure 7 ), the relationship
between pressure drop and actual flooding point was
tested for reservoir characteristics ranging from tight
to prolific. An important conclusion of the study
is that stable production (in slugging conditions) is
possible below the theoretical flooding point.
6
50

Symposium ‘Produced water handling’
In 2016, EBN organised a one-day symposium on dealing with production water, attracting delegates
from most of the Dutch O&G operators. The themes addressed during the workshop included new water-
processing technologies, innovation and sustainability, all contributing to the challenge of handling
water that is associated with mature field production. The workshop was organised jointly by EBN, TKI
Gas and ISPT and was well received:
“It is very useful and valuable to hear the prac-
tical experiences of other operators in this area.
Operators have shared a lot of knowledge with
each other, and this helps us to identify promising
technology and application methods which could
be useful for us. By running the workshop the
organisers have made it possible for everyone to
be aware of the current state of technology.”
Harry Segeren, Wintershall
“For TNO, a workshop like this is very useful. We
now understand better what kind of problems
operators are struggling with in this area and
this enables us to help them more effectively.
The workshop has definitely led to better mutual
understanding.” Maarten Bijl, TNO
Recently the TKI-JIP Foam II project (2016 – 2018)
has started. It validates the earlier mentioned foam
model with field cases and aims at improving it
further. The goal is to select the most suitable foam
and operation parameters (such as concentration
and volume) for gas well deliquification.
The overall lessons learned from these JIPs are:
• Liquid loading in gas wells can be understood and
prognosed;
• The influence of the reservoir properties on the
flow behaviour of a well in the unstable liquid
loading phase is understood and it has been
observed that stable production is possible below
the theoretical flooding point;
• The tools developed will help to select the best
method to apply to mitigate liquid loading: 1) the
selector tool identifies the most suitable deliquifi-
cation technique; 2) the quantitative selection
tool quantifies the gains; and 3) the foam optimi-
sation tool indicates the most suitable foam.
Figure 2.17 _ 2.18 opex production uoc o� shore gas
Experimental set-up JIP Unstable flow in liquid loading gas wells
The blue 300 litre pressure vessel on the right is connected to the wellbore model on the left.
7
51
52

5
Infr
astr
uctu
re in
a c
han
gin
g en
viro
nm
ent
Infrastructure in a changing environment
53

250
200
150
100
50
0
500
400
300
200
100
02000 2004 2008 2012 2016
Ope
rati
onal
cos
ts (
%) B
rent oil price (%
)
Operational costs against oil price
Large offshore platform NL
Brent oil price (indexed, real 2000)
Figure 5.1 Figure O� shore platform Operational Costs Vs Bent Oil price (Indexed, RT 2000)
As described in previous chapters, there
is a widely felt urgency to lower
CO2 emissions and at the same time
reduce the development and operational
costs. In the past, reductions in operational costs
were often the result of temporary measures
– operations were postponed until prices had
recovered – but in the current situation this may no
longer be the case. The enduring low gas prices and
the rapid decrease of the gas reserves are forcing
the industry to come up with innovative ideas. EBN
embraces these initiatives and actively supports
operators and the service industry in the Netherlands
in the joint exploration of efficient solutions.
5.1 Cost reduction initiativesFigure 1 shows the indexed operational costs of
large platforms on the Dutch continental shelf in
comparison to the Brent oil price (RT, 2000).
Clearly, cost optimisations should be well balanced
with QHSE (Quality, Health, Safety and Environ-
ment) and production performance. Therefore, the
fundamentals of operational and maintenance
strategies need to be challenged. EBN is currently
investigating a number of new projects, including
setting up a benchmark on QHSE and production
performance to assist the upstream O&G opera-
tions in the coming decades. A recent example of an
industry initiative aiming at making operations
more environmentally-friendly and cost-effective
is NAM’s Kroonborg walk-to-work service vessel.
Propelled by relatively clean gas-to-liquids fuels,
this service vessel is enabling NAM to overhaul its
logistical processes, resulting in fewer helicopter
flights. The novel vessel design incorporates several
new applications to service unmanned platforms
throughout the Southern North Sea. The Kroonborg
also enables future platforms to be cost-effective,
as functional requirements can be reduced when plat-
forms are serviced by the Kroonborg – for example,
there is no need for a platform crane. Other operators
are currently investigating the feasibility of a similar
(shared) walk-to-work service operating vessel.
Another ongoing development led by ONE B.V., with
support of several other operators and EBN, is
exploring the possible application of Zap-lok in the
Netherlands. This novel cost-effective pipe joining
method has been applied elsewhere in the world but
still needs to be certified for use in the Dutch part of
the North Sea.
5.2 Integrating offshore wind with oil and gas productionThe energy transition is being driven by the urgent
need to reduce the CO2 concentrations in the atmo-
sphere, as noted in Chapter 1. There is a move from the
dominant use of fossil fuels to a sustainable energy
system driven by wind and solar power. This change
is manifested on the Dutch continental shelf by the
development of wind farms. Increasing the number
of wind farms will in the near future result in the
emergence of an electricity grid on the Dutch conti-
nental shelf – a development that creates opportu-
nities for connecting offshore platforms to this grid.
To counteract the decline in reservoir pressure during
gas production, compression is required. Offshore
platforms far from shore generate their own power
supply for this process. For economical reasons the
design of the power generator on a platform is mainly
limited by weight and available space, resulting in
relatively inefficient power generation. Offshore wind
farms on the Dutch continental shelf provide an
1
54

2Possible scenario for power consumption of platforms
attractive alternative power supply. Connecting O&G
platforms to the wind farms eleminates the need of
local power generation on the platforms and subse-
quently reduces the CO2 emissions dramatically. The
effect iveness of the concept has been demonstrated
on the near-shore platform Q13-Amstel, which is
connected to onshore power supply.
Figure 2 shows a possible scenario for the energy
consumption of O&G platforms over time until 2050.
By way of illustration: assuming that 25% of the 40
gas production platforms that consume the most
energy during their lifetime could be connected to a
wind farm, an average reduction in CO2 emissions
from the offshore production platforms of up to 1
million tons of CO2 each year could be achieved. The
power consumption by the O&G platforms represents
in such a scenario a wind farm of 400 MW with a 40%
capacity factor.
Connecting O&G platforms to wind farms will not
only improve energy efficiency and reduce CO2
emissions on platforms, but could also benefit wind
farms by increasing the number of turbines because
of the power consumption increases. The
operational costs of O&G installations are also lower,
contributing to extending the lifetime of the instal-
lations and the production of offshore domestic gas.
Apart from the additional state profits and the
contribution to lower CO2 emmissions from Dutch
gas compared to imported gas, the strategy would
provide more time to explore opportunities for
the re-use of installations and reservoirs for inno-
vations such as CO2 storage, power-to-gas and
energy storage.
55

EXPLORATION AND PRODUCTION OF OIL AND GAS FIELDS, BOTH
ONSHORE AND OFFSHOREGAS STORAGE
DECOMMISSIONING AND RE-USE OF OIL AND GAS
INFRASTRUCTURE
INTEGRATING WIND AND GAS
56

Return to Nature
In the next few decades the upstream oil and gas industry faces a major challenge with regard to the decommissioning and re-use of infrastructure, both onshore and offshore. More and more fields are reaching the end of their economic lifetime, hence, infrastructure needs to be abandoned or re-used. EBN has taken the lead in this decommissioning issue by establishing a National Platform for decommissioning and will continue to strive for safe, sustainable and cost-efficient decommissioning of oil and gas assets.
57

58

6
Dec
omm
issi
onin
g an
d re
-use
of
oil a
nd
gas
infr
astr
uctu
re
Decommissioning and re-use of
oil and gas infrastructure
59

The production of oil and gas has
contributed considerably to the Dutch
economy over the past 50 years.
The upstream O&G industry in the
Netherlands is mature and is facing a future in
which hydrocarbon production infrastructure is to
be decommissioned. EBN expects that the decom-
missioning of this infrastructure will take several
decades. How long exactly, greatly depends on the
number and size of new finds, trends in prices and
the transition to renewable sources of energy. It is a
shared responsibility of the O&G industry to decom-
mission safely, environmentally responsibly and
cost-effectively. At the same time, criteria for
re-use and repurposing will be investigated in
light of the energy transition. This is a joint effort,
invol ving many stakeholders.
The energy transition towards a CO2 neutral economy
offers both challenges and oppor tunities for the
future use of the infrastructure. In certain areas in
the North Sea, O&G activities seem to be competing
with new initiatives such as the development of off-
shore wind farms. Yet, if a well-organised approach
is followed, there could be mutual benefits. These lie
in the electrification of O&G platforms and the use of
the infrastructure for power-to-gas and CO2 storage.
Several research projects are currently inves tigating
how to transform the North Sea into a national
‘powerhouse’, as described in Section 5.2. Onshore,
the re-use of O&G wells for geothermal purposes is
being investigated and parts of the pipeline network
could be used in the production and transportation
of biogas.
6.1 The decommissioning landscape in the NetherlandsUnder the Dutch Mining Act, disused on- and off-
shore mining installations must be decommissioned
and removed. For offshore installations, under the
OSPAR Decision 98/3, a derogation for removal may
be requested for steel substructures over 10,000 tons,
concrete gravity-based installations, concrete floating
installations and concrete anchor bases. On the
Dutch continental shelf, only four installations con-
sist of a gravity-based substructure. All other instal-
lations have a steel jacket substructure.
In addition, disused offshore pipelines are required to
be cleaned; they may be securely decommissioned
and left in situ, but the Minister of Economic Affairs
may also order their removal. Under the most recent
North Sea Policy Document (Beleidsnota Noordzee
2016 – 2021), new offshore pipeline permits will
include a requirement for the pipeline to be removed
when no longer in use, unless it can be demonstrated
through a social cost-benefit analysis that in-situ
decommissioning is to be preferred. Pipelines
onshore often cross private land. Decommissioning
of these pipelines and restoration of the pipeline tra-
jectory is typically covered in civil agreements with
the landowners. Onshore well and production loca-
tions are normally required to be removed, also based
on civil agreements with landowners. The Mining
Regulations stipulate how wells are required to be
securely plugged and decommissioned.
The estimated decommissioning costs amount to
some EUR 7 billion in total for the Dutch upstream
O&G industry, of which EBN bears approximately
40% directly through its joint ventures. Over 70% of
the total bill for decommissioning will be paid by the
Dutch State through EBN and reduced national gas
income, which makes decommissioning a topic of
national interest.
Overview of infrastructureThe total offshore infrastructure in line for decom-
missioning comprise 156 platforms, over 3,000 km
of pipelines and about 700 wells. The total amount
of steel associated with these offshore platforms
approaches some 400,000 tons (Figure 1a ). The
platform topside weights range from 150 to 8,000
tons, with over 75% of the topsides weighing
less than 2,000 tons (Figure 1b ). This means that
significant low-weight lifting vessel capacity needs
to be available for decommissioning. Onshore,
60
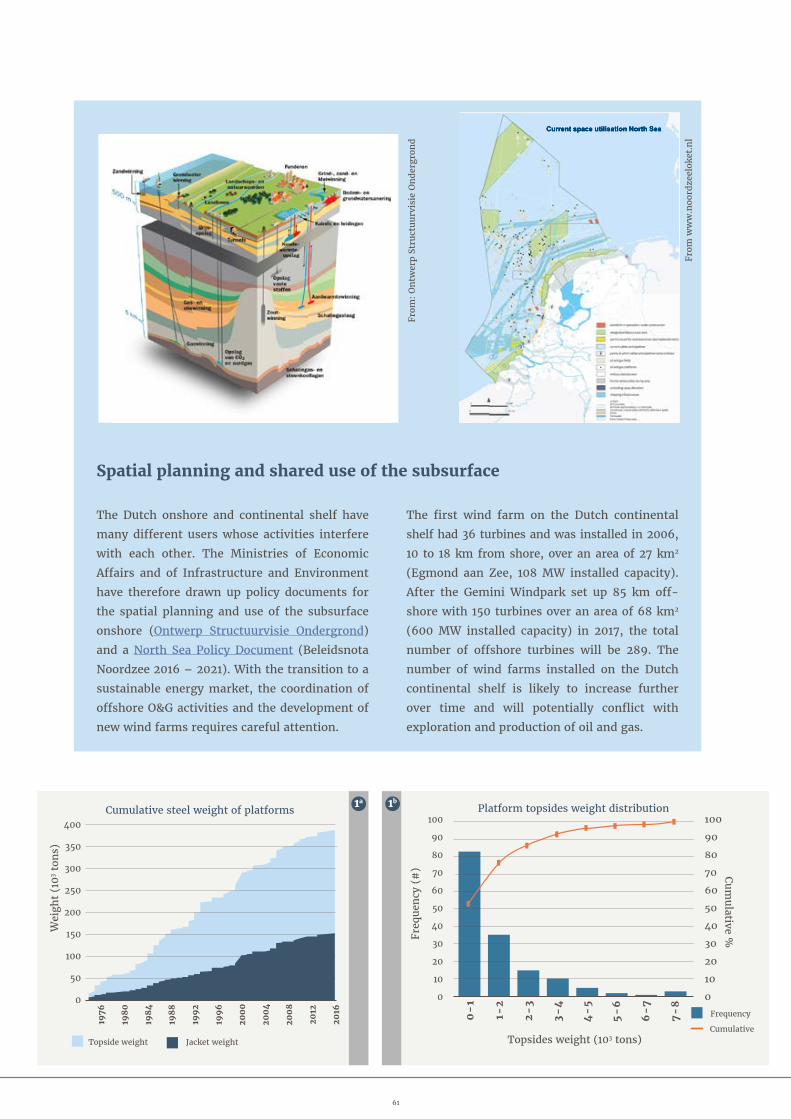
400
350
300
250
200
150
100
50
0
1976
1980
1984
1988
199
2
199
6
200
0
200
4
200
8
2012
2016
Wei
ght
(103 t
ons)
Cumulative steel weight of platforms
Topside weight Jacket weight
100
90
80
70
60
50
40
30
20
10
0
100
90
80
70
60
50
40
30
20
10
0
0 -
1
1 - 2
2 -
3
3 - 4
4 -
5
5 -
6
6 -
7
7 -
8
Freq
uen
cy (
#) Cum
ulative %
Platform topsides weight distribution
Topsides weight (103 tons)
Frequency
Cumulative
The Dutch onshore and continental shelf have
many different users whose activities interfere
with each other. The Ministries of Economic
Affairs and of Infrastructure and Environment
have therefore drawn up policy documents for
the spatial planning and use of the subsurface
onshore (Ontwerp Structuurvisie Ondergrond)
and a North Sea Policy Document (Beleidsnota
Noordzee 2016 – 2021). With the transition to a
sustainable energy market, the coordination of
offshore O&G activities and the development of
new wind farms requires careful attention.
The first wind farm on the Dutch continental
shelf had 36 turbines and was installed in 2006,
10 to 18 km from shore, over an area of 27 km2
(Egmond aan Zee, 108 MW installed capacity).
After the Gemini Windpark set up 85 km off-
shore with 150 turbines over an area of 68 km2
(600 MW installed capacity) in 2017, the total
number of offshore turbines will be 289. The
number of wind farms installed on the Dutch
continental shelf is likely to increase further
over time and will potentially conflict with
exploration and production of oil and gas.
Spatial planning and shared use of the subsurface
Current space utilisation North Sea
From
ww
w.n
oord
zeel
oket
.nl
From
: On
twer
p St
ruct
uurv
isie
On
derg
ron
d
1b1a
61

2015
2010
2005
2000
1995
1990
1985
1980
1975
K13
-DL1
0-G
top
side
sK
13-C
WK
13-C
PK
13-B
K10
-CK
11-F
A-1
L10
-KP
12-C
P2-
NE
P2-
SEK
12-E
K10
-VK
11-B
K12
-AP
14-A
Q8-
AQ
8-B
P6
-SK
10-B
WK
10-B
P
Decommissioned gas platforms - installation, COP, removal
InstallationCOP Removal
the decom missioning entails over 350 locations
(varying from processing sites and well sites to
scraper stations), over 2,500 km of pipelines (exclud-
ing the GTS transmission system) and over 700 wells.
TimingThe actual date of decommissioning depends on many
factors, the chief ones being prices and operating
costs, but cash flow is also important. Furthermore,
the investment level for new O&G projects such as
new exploration and infill wells has a large impact
on Cessation of Production (COP) dates. Historical
performance indicates that on average, the interval
between COP and physical removal is four years for
the Dutch gas sector (Figure 2 ). In Focus 2016, COP
dates for various gas price scenarios were presented:
the results for these, based on reserves and contin-
gent and prospective resources, are shown again in
Figure 3 .
The low gas price has led to a sharp drop in the
number of exploration and development activities
and has brought several fields to the economic cut-
off point. Despite the current low rates for drilling
rigs and lifting vessels, there has been only a minor
upturn in decommissioning yet, largely because of
the cash flow constraints of operators and/or joint
venture partners. Stakeholders are currently
assessing how best to prepare for decommissioning,
in order to benefit from the expected growing
demand for decommissioning services.
Actual versus provisions As presented in Focus 2016, recent decommissioning
projects have been realised at higher cost than was
provisioned for. The cost of well decommissioning
particularly seems to be likely to be underestimated.
An updated figure for the period 2011 – 2016 shows
that on average, actual expenditure on well decom-
missioning has exceeded provisions by some 75%
(Figure 4 ).
Each year, EBN receives estimates of decommis-
sioning costs from all its joint venture operators,
but the approach and details of these estimates vary
greatly between operators. To obtain more realistic
cost estimates and actuals, a guideline for using a
common breakdown structure would be required,
like the one created by Oil & Gas UK. If such data
would be incorporated in a decommissioning
2
It is a shared responsibility of the O&G industry
to decommission safely, environ mentally responsibly and cost-effectively.
62

COP of infrastructure, best and worst case scenario
2016 - 2020
COP Based on reserves & cont/prosp resources COP Based on reserves
2021 - 2025
>2025
From: Focus on
Dutch
Oil an
d Gas 2016
, EB
N
Figure 1
Gas price scenario EUR 0.25/Nm3
Gas price scenario EUR 0.12/Nm3
160
140
120
100
80
60
40
20
0
Cost
s (E
UR
mln
, 100
%)
Provisions (platforms)
Actual (platforms)
Provisions (well P&A)
Actual (well P&A)
Decommisioning costs 2011 - 2016actual vs provisions
database, benchmarking would be possible allowing
for more precise provisions for future projects.
Costs: five-year forecastEBN has budgeted for a total of EUR 133 million for
decommissioning activities in 2017 in all its joint ven-
tures (100%). In total, 28 wells (nine onshore,
19 offshore) and three platforms and associated pipe-
lines are listed for decommissioning within EBN’s
joint ventures. For the five-year period beyond 2017,
between EUR 0.8 billion and 1 billion is expected to be
spent on decommissioning (mainly offshore 100%).
According to current estimates, decommissioning is
expected to peak between 2023 and 2025 (Figure 5 ).
EBN and operators are currently scrutinising the
projected timing of decommissioning under the JIP
for decommissioning and re-use in the first half of
2017, as described later in this chapter. In the second
half of 2017, an updated and more detailed forecast
will be presented.
Decommissioning optimisation in a multi-operator landscapeGiven the large total scope of the decommissioning
work, there is considerable potential to join forces in
order to improve the efficiency and consequently
optimise costs. EBN has investigated the potential
benefits of collaborative decommissioning activi-
ties. A network optimisation model including off-
shore platforms, wells and technical reserves, has
been developed to simulate total decommissioning
costs under various scenarios and to investigate
value optimisation on a portfolio basis, considering
gas revenues, OPEX and ABEX (Abandonment
Expenditure). The optimisation is based on pre-tax
NPV. Two well-known concepts for cost savings
have been introduced: 1) learn (apply learnings from
previous projects) and 2) economies of scale (large
contract volumes). Applying these concepts is a
challenge, since the planned decommissioning
projects are scattered over 30 years, and spread
across ten operators.
3
4
63

Multiple scenarios have been run, of which three
stand out:
Reference case
No collaboration between operators, stop production
of individual installations at zero margin
Operator optimisation
No collaboration between operators, optimise within
individual operator portfolios
Decom. company
A separate company to carry out all decommissioning
activities
The preliminary results (Figure 6 ) indicate that
optimisation within each operator’s portfolio leads
to a large cost reduction compared to the reference
case, because a few large operators own most of the
platforms. The decommissioning company scenario
introduces a new type of optimisation strategy,
based on creating a constant workload, instead of
creating workload peaks, as happening in the other
scenarios. This helps in achieving both long-term
(> ten years) learning curves, as well as long-term
discounts on contract volumes. This scenario leads
to an overall cost reduction of 40% compared to the
reference case. The findings suggest that orchestrat-
ing the decommissioning for the complete offshore
of the Netherlands could potentially save hundreds
of millions of euros. Therefore a platform that unites
all partners should be organised, and industry-wide
standards (technical, QHSE, legal) and databases and
optimisation models should be developed.
6.2 Decommissioning: a joint effortGiven the opportunities and challenges ahead, it is
important that the industry partners collaborate
closely in decommissioning and re-use, as described
in the previous section. In November 2016, The
Netherlands Masterplan for Decommissioning and
Re-use was presented, calling for closer collabora-
tion in various decommissioning and re-use topics.
The Masterplan was developed jointly with NOGEPA,
IRO and EBN, and contains ten roadmaps (figure 7 ),
each with an agenda of what needs to be done to
make decommissioning a success for all. The objective
is the safe, environmentally responsible and cost-
efficient decommissioning of O&G infrastructure.
Four initial priorities have been defined:
• Establish a National Platform that drives the
Masterplan forward,
• Establish a National Decommissioning Database
to create an integrated view of the work scope
and timelines,
• Promote effective and efficient regulation in
dialogue with regulators, to improve the clarity,
efficiency and effectiveness,
• Establish mechanisms to share learnings, to
achieve continuous improvement in cost and
performance.
100%
80%
60%
40%
20%
0%
Reference case
Operator optimisation
Decom. company
Relative costs of differentdecommissioning strategies
6
20
18
16
14
12
10
8
6
4
2
0
500
400
300
200
100
0
2017
2018
2019
2020
2021
2022
2023
2024
2025
2026
2027
2028
2029
2030
Ass
ets
(#)
Costs (EU
R m
ln)
Decommissioning 2017 - 2030 (5-year smoothing)
Assets
Costs
5
64
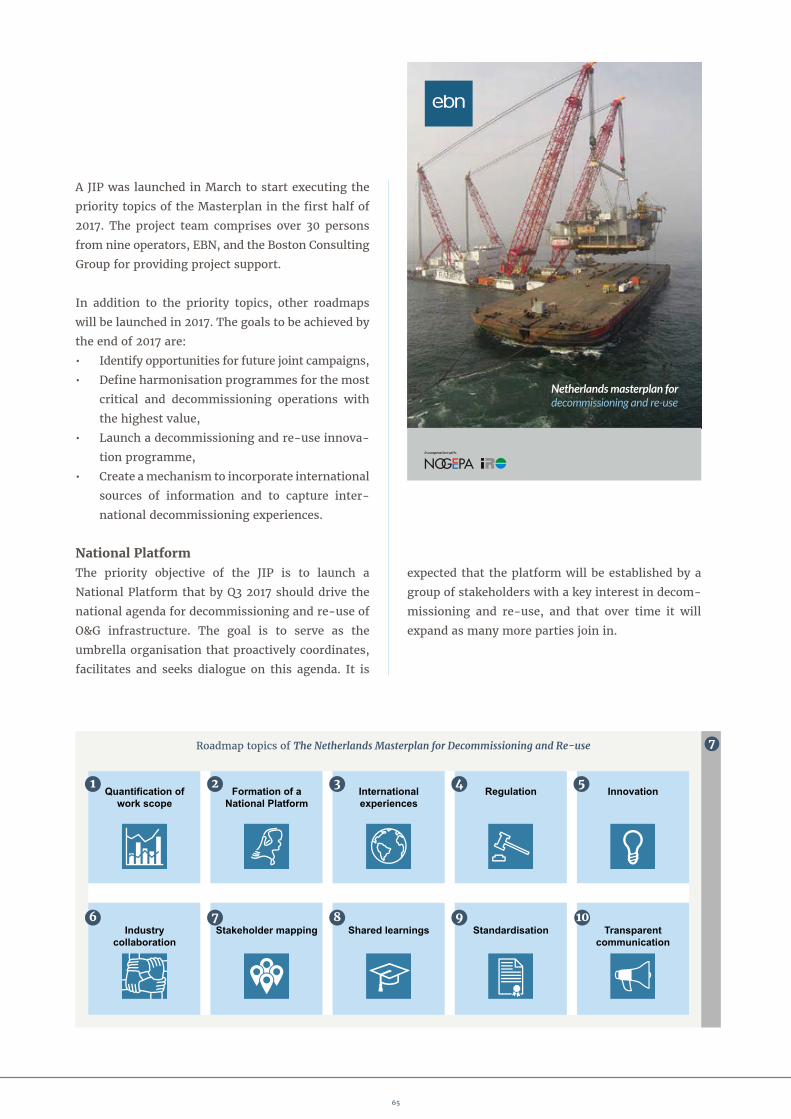
Quantification of work scope
Formation of a National Platform
International experiences
Regulation Innovation
Industry collaboration
Stakeholder mapping Shared learnings Standardisation Transparent communication
1
6
2
7
3
8
4
9
5
10
Roadmap topics of The Netherlands Masterplan for Decommissioning and Re-use
A JIP was launched in March to start executing the
priority topics of the Masterplan in the first half of
2017. The project team comprises over 30 persons
from nine operators, EBN, and the Boston Consulting
Group for providing project support.
In addition to the priority topics, other roadmaps
will be launched in 2017. The goals to be achieved by
the end of 2017 are:
• Identify opportunities for future joint campaigns,
• Define harmonisation programmes for the most
critical and decommissioning operations with
the highest value,
• Launch a decommissioning and re-use innova-
tion programme,
• Create a mechanism to incorporate inter national
sources of information and to capture inter-
national decommissioning experiences.
National PlatformThe priority objective of the JIP is to launch a
National Platform that by Q3 2017 should drive the
national agenda for decommissioning and re-use of
O&G infrastructure. The goal is to serve as the
umbrella organisation that proactively coordinates,
facilitates and seeks dialogue on this agenda. It is
expected that the platform will be established by a
group of stakeholders with a key interest in decom-
missioning and re-use, and that over time it will
expand as many more parties join in.
7
Netherlands masterplan for decommissioning and re-use
In cooperation with:
65

On the short term it is intended to achieve the
following:
• Detailed design for the National Platform,
including agreement on funding, governance
and membership;
• Tools and processes for running the National
Platform agreed and finalised;
• Agreements covering legal aspects defined for
establishing the National Platform.
National databaseAnother goal is to centrally capture general para-
meters of Dutch O&G infrastructure, in order to pro-
vide an accurate overview of this infrastructure.
This would yield accurate insight into the number of
wells and components of infrastructure, estimated
and actual costs, as well as various other details of
interest to operators, the service industry and other
possible stakeholders. The database can help to
identify potential opportunities for collaboration
between operators and/or the service industry
through joint decommissioning campaigns. Another
possible application lies in the identification of
re-use opportunities for new field developments or
repurposing opportunities such as CO2 storage,
power-to-gas, geothermal energy, and synergies
with wind farms.
RegulationThe regulatory environment will fundamentally
impact the efficiency and effectiveness of the Dutch
decommissioning agenda. Regulation ranges from
international treaties (e.g. OSPAR) to national legis-
lation (e.g. the Mining Act and ancillary regula-
tions). Most of these regulations were created at the
end of the last century and do not always reflect the
most recent practical experiences with decommis-
sioning, technical innovation and other insights.
As the industry is facing a huge decommissioning
challenge over the coming decades, a robust,
reliable and unequivocal set of rules is of essence.
Therefore, as part of the masterplan, a regulatory
joint industry working group (comprised of EBN and
operators) has been created, with the goal of
enabling the industry to work within a clear and
consistent set of regulations, in line with technical
best practices and innovations, to support safe,
effective and efficient world-class decommissioning
and re-use. The approach is to identify topics for
improvement, and to prioritise and engage stake-
holders and regulators in a structured dialogue. The
potential value and viability of the topics will be
assessed and for each, the costs and benefits of
alternatives will be considered. This analysis, along
with stakeholder feedback, will result in a list of
priority subjects.
Shared learningsIn the past few years, large international decom-
missioning projects have been able to secure signi-
ficant cost savings of up to 40% by efficient transfer
of experiences. It is more challenging to achieve
such savings in the Netherlands, because large off-
shore structures with many wells are lacking to
continuously improve on the execution of the work
scope. Well abandonments have not developed into a
core activity and often occur every few years under
new management and contractor teams. As a result,
abandonment projects go through a new learning
curve each time.
The solution for a more efficient way of executing
decommissioning projects in the Netherlands lies
first and foremost in creating a critical work volume
in which the activities can be executed for a long
and continuous period by specialised teams.
Additionally, a platform is required in which learn-
ings can be shared between peers and the support-
ing industry to ensure that smart solutions can be
repeated and previous mistakes avoided. To accom-
plish this, a new level of cooperation and mutual
trust has to be created between the various stake-
holders and within the decommissioning platform.
Workshops and conferences will be organised regu-
larly to share experiences and a database will be
created in which all relevant learnings are kept for
future reference. The shared learnings working
group is responsible for developing an environment
66

in which the goals described above can be accom-
plished efficiently.
6.3 Future use of installations: re-using, repurposing and recyclingSustainable dismantling of the infrastructure on
the Dutch continental shelf is key and all the
possibilities for future use should be investigated
(Figure 8 ). Naturally, the first choice should be to
consider re-using the infrastructure for the appli-
cation it was originally designed for (oil and gas)
and this should be taken into account when
designing the infrastructure. A second option
would be to utilise the infrastructure for alterna-
tive purposes, such as power-to-gas, CO2 storage
and CAES. As a last option, the materials should be
optimally recycled.
So far, 11 topsides have been re-used for other
hydrocarbon field developments (see Focus 2016).
An innovative option for re-use is the repurposing
of a platform or pipeline. However, without the
availability of power, a platform’s usefulness is very
limited. This could be overcome by electrifying the
8
67
Future potential of North Sea platforms
Rigs to reef
Carbon storage
Recycling
Re-use
Maintenance and service accommodation
Energy storage
Power to gas
Electrification
Wave and tidal energy
Electrical substation
Wind farms
Aqua farming
Natural gas Electricity Carbon Dioxide (CO2)
Energising the transitionA PROMISING FUTURE FOR NORTH SEA PLATFORMS
New EnergyOur Dutch Gas Return to Nature
Hydrogen (H2)
Rigs to reef
Carbon storage
Recycling
Re-use
Maintenance and service accommodation
Energy storage
Power to gas
Electrification
Wave and tidal energy
Electrical substation
Wind farms
Aqua farming
Natural gas Electricity Carbon Dioxide (CO2)
Wave and
Energising the transitionA PROMISING FUTURE FOR NORTH SEA PLATFORMS
New EnergyOur Dutch Gas Return to Nature
Hydrogen (H2)
Gas to wire
3D-infographic EBN A3-Engels.indd 1 15-06-17 17:30
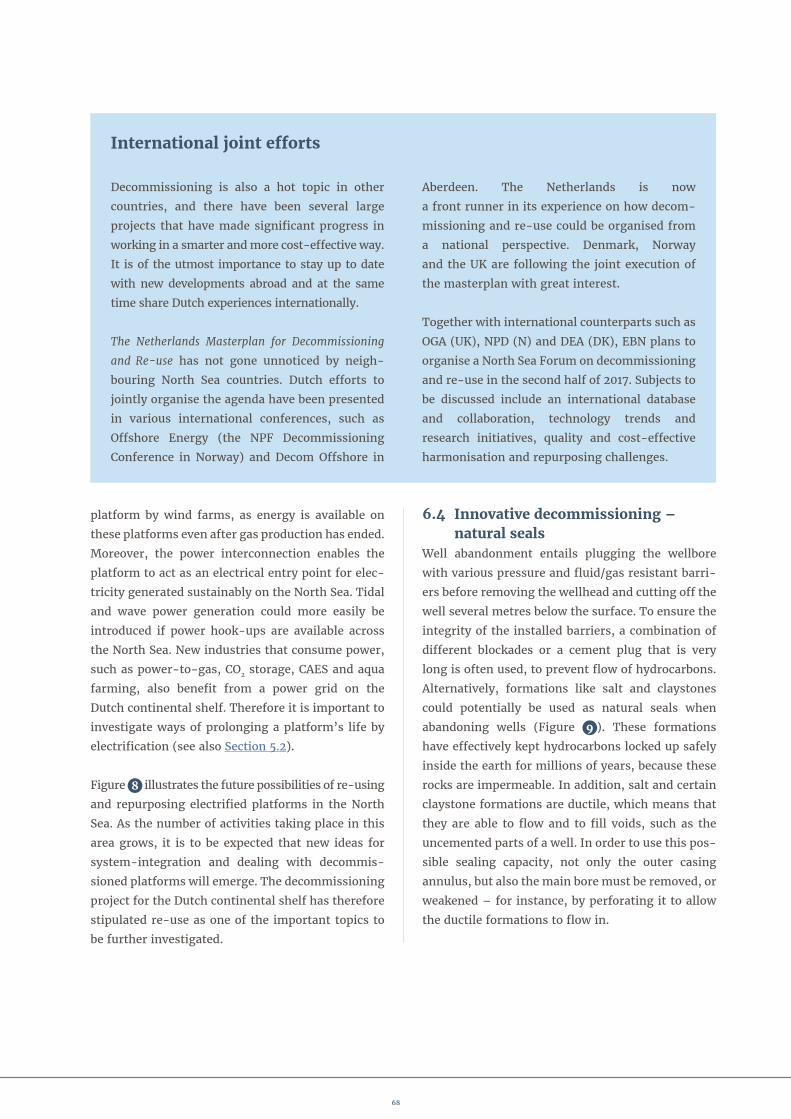
International joint efforts
Decommissioning is also a hot topic in other
countries, and there have been several large
projects that have made significant progress in
working in a smarter and more cost-effective way.
It is of the utmost importance to stay up to date
with new developments abroad and at the same
time share Dutch experiences internationally.
The Netherlands Masterplan for Decommis sioning
and Re-use has not gone unnoticed by neigh-
bouring North Sea countries. Dutch efforts to
jointly organise the agenda have been presented
in various international conferences, such as
Offshore Energy (the NPF Decommissioning
Conference in Norway) and Decom Offshore in
Aberdeen. The Netherlands is now
a front runner in its experience on how decom-
missioning and re-use could be organised from
a national perspective. Denmark, Norway
and the UK are following the joint execution of
the masterplan with great interest.
Together with international counterparts such as
OGA (UK), NPD (N) and DEA (DK), EBN plans to
organise a North Sea Forum on decommissioning
and re-use in the second half of 2017. Subjects to
be discussed include an international database
and collaboration, technology trends and
research initiatives, quality and cost-effective
harmonisation and repurposing challenges.
platform by wind farms, as energy is available on
these platforms even after gas production has ended.
Moreover, the power interconnection enables the
platform to act as an electrical entry point for elec-
tricity generated sustainably on the North Sea. Tidal
and wave power generation could more easily be
introduced if power hook-ups are available across
the North Sea. New industries that consume power,
such as power-to-gas, CO2 storage, CAES and aqua
farming, also benefit from a power grid on the
Dutch continental shelf. Therefore it is important to
investigate ways of prolonging a platform’s life by
electrification (see also Section 5.2).
Figure 8 illustrates the future possibilities of re-using
and repurposing electrified platforms in the North
Sea. As the number of activities taking place in this
area grows, it is to be expected that new ideas for
system-integration and dealing with decommis-
sioned platforms will emerge. The decommissioning
project for the Dutch continental shelf has therefore
stipulated re-use as one of the important topics to
be further investigated.
6.4 Innovative decommissioning – natural sealsWell abandonment entails plugging the wellbore
with various pressure and fluid/gas resistant barri-
ers before removing the wellhead and cutting off the
well several metres below the surface. To ensure the
integrity of the installed barriers, a combination of
different blockades or a cement plug that is very
long is often used, to prevent flow of hydrocarbons.
Alternatively, formations like salt and claystones
could potentially be used as natural seals when
abandoning wells (Figure 9 ). These formations
have effectively kept hydrocarbons locked up safely
inside the earth for millions of years, because these
rocks are impermeable. In addition, salt and certain
claystone formations are ductile, which means that
they are able to flow and to fill voids, such as the
uncemented parts of a well. In order to use this pos-
sible sealing capacity, not only the outer casing
annulus, but also the main bore must be removed, or
weakened – for instance, by perforating it to allow
the ductile formations to flow in.
68

Repurposing: rigs-to-reef pilot
Redesigning a limited number of production
jackets for ‘new nature’ is considered a viable
option to locally improve the biodiversity in the
North Sea. The approach has been shown to be
successful in several rigs-to-reef programmes
elsewhere in the world. EBN and ENGIE E&P
Nederland B.V. together with experts from uni-
versities, research institutes, NGOs, govern-
ments and fisheries, have developed a feasibility
plan for a pilot project consisting of two mining
installations that will be re-used as a structure
aimed at enriching nature in the L10 blocks. The
pilot period of 15 years will yield valuable lessons
for future projects. The proposed design will be
optimised further and then presented to the
government and other stakeholders.
Well abandonment plug concepts
Conventional abandonment cement plugs Natural seal abandonment plugs
To prove the concept and its integrity, field trials are
required. In TKI-JIP Downhole field lab – Wellbore
sealing by rock salt with TNO and various operators,
EBN is actively involved in studying the potential
use of these natural seals. The most suitable forma-
tions, and techniques to activate, monitor and test
the squeezing and sealing effect will be thoroughly
investigated before its application can be approved
by State Supervision of Mines. This innovative
method may lead to more durable and cost-efficient
down-hole seals.
9
69

70

71
The North Sea is an important source of energy for the Netherlands, where oil and gas are extracted and the building of various wind farms is proceeding apace. How can we safeguard the North Sea’s wildlife?The North Sea could be healthier – that’s indisput-
able. I am referring, for instance, to the oyster reefs
that have vanished, several species of large fish,
such as rays and sharks that have been diminished,
and the plastic and other rubbish floating in the sea.
With regard to North Sea energy, we can expect
developments in the coming years to carry on accel-
erating: more wind turbines, but a decrease in the
infrastructure for oil and gas production. That’s
what we’re facing. So, within that arena we’re try-
ing to minimise the risks and to maximise opportu-
nities from an ecological perspective. That’s a big
ask, but by adopting an integral approach it should
be possible not only to conserve wildlife but also to
reinvigorate it. The development of wind energy on
the North Sea is an activity that as well as bringing
threats also offers opportunities for new life,
because wind parks can serve as habitats for many
fish and crustacean species. Decisions made in the
coming years will determine what the North Sea will
be like in the coming years. We see huge opportuni-
ties to bring the beautiful North Sea nature in
balance with sustainable activities.
Given all the developments in the North Sea, what should be done to achieve the best result?I think we need to look for integrality. Together, we
– all the parties involved and certainly also the
government – are looking to see how we can guarantee
the long term. It’s time to make integral agreements
and to implement stable policy that contains all
present and future activities as well as nature. This
can only be done with parties that commit themselves
to the North Sea for the long term and take account of
all users and inhabitants, both existing and new.
There are about 155 platforms in the North Sea, most of which will be dismantled or repurposed in the coming years. What’s your take on this?As fields in the North Sea are rapidly nearing their
end of life, there is an urgency to consider how to
deal with all the infrastructure left redundant. We
would like to see ecological considerations being
included in discussions on different decommission-
ing scenarios. We therefore welcome ENGIE and
EBN’s decision to start a pilot project turning two
platform jackets into artificial reefs, as this can pro-
vide a factual basis for discussions surrounding the
fate of future platforms. As well, I’d like to challenge
the parties involved in the decommissioning and
repurposing issue to demonstrate – using realistic
calculations – whether or not the repurposing of
platforms is economically viable. These business
cases can change the focus of the current debate
from an interesting idea to fact-based decision
making. At the moment I miss such an approach.
After several years of exploring ideas about repur-
posing of infrastructure I feel it is time to build solid
business cases for repurposing of infrastructure and
to make these business cases publicly available.
Integral agreements are essentialInterview with Floris van Hest, Director of Stichting de Noordzee (the North Sea Foundation) ©
Ste
ven
Sn
oep

GAS STORAGE
STORAGE OF CO2
GEOTHERMAL ENERGY
72

With its potential for geothermal energy, energy storage and Carbon Capture Utilisation and Storage, the Dutch subsurface can contribute significantly to the transition towards a CO2-neutral energy system. Building on our long history in gas and oil projects and our expertise on the subsurface, EBN is exploring these possibilities and is contributing to a carbon-neutral energy future.
New Energy
73

74
© K
enn
eth
Sta
mp
on b
ehal
f of
ECW
Geothermal drilling MDM GT 06

7
G
eo-e
ner
gy f
rom
th
e D
utch
sub
surf
ace
Geo-energy from the Dutch
subsurface
75
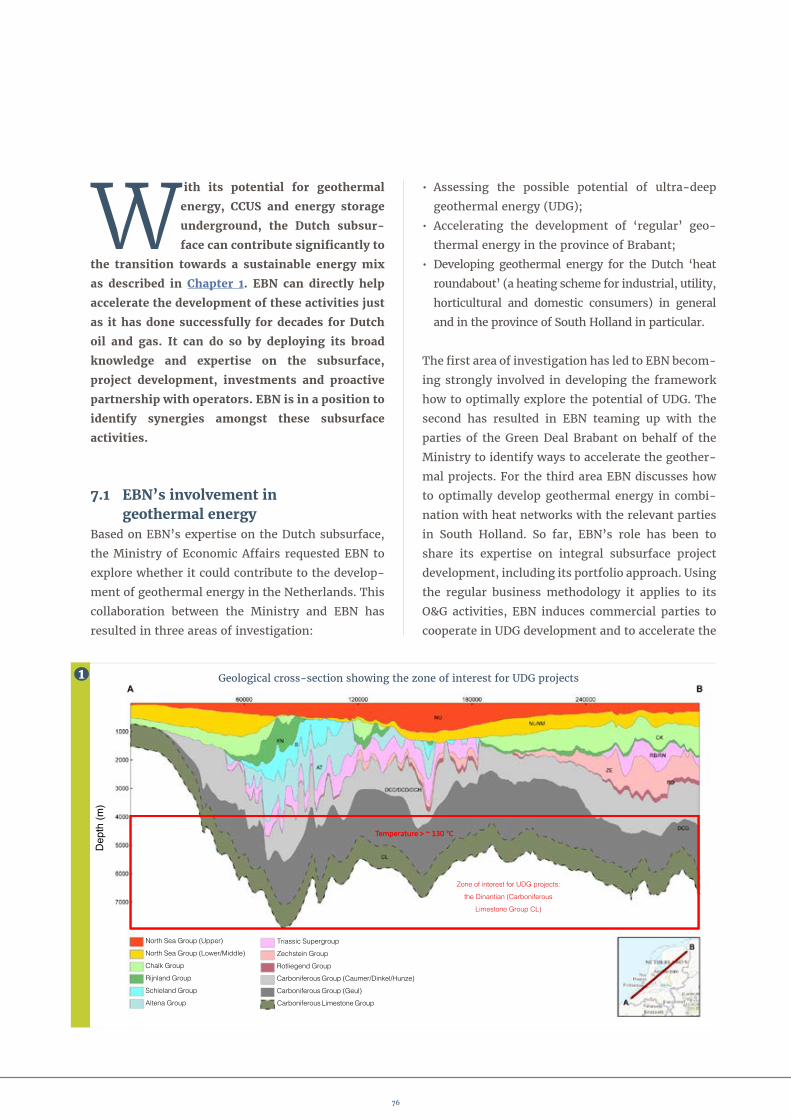
North Sea Group (Upper)
North Sea Group (Lower/Middle)
Chalk Group
Rijnland Group
Schieland Group
Altena Group
Triassic Supergroup
Zechstein Group
Rotliegend Group
Carboniferous Group (Caumer/Dinkel/Hunze)
Carboniferous Group (Geul)
Carboniferous Limestone Group
Temperature > ~ 130 °CTemperature > ~ 130 °C
Dep
th (m
)
Zone of interest for UDG projects:
the Dinantian (Carboniferous
Limestone Group CL)
Geological cross-section showing the zone of interest for UDG projects
W ith its potential for geothermal
energy, CCUS and energy storage
underground, the Dutch subsur-
face can contribute significantly to
the transition towards a sustainable energy mix
as described in Chapter 1. EBN can directly help
accelerate the development of these activities just
as it has done successfully for decades for Dutch
oil and gas. It can do so by deploying its broad
know ledge and expertise on the subsurface,
project development, investments and proactive
partnership with operators. EBN is in a position to
identify synergies amongst these subsurface
activities.
7.1 EBN’s involvement in geothermal energyBased on EBN’s expertise on the Dutch subsurface,
the Ministry of Economic Affairs requested EBN to
explore whether it could contribute to the develop-
ment of geothermal energy in the Netherlands. This
collaboration between the Ministry and EBN has
resulted in three areas of investigation:
• Assessing the possible potential of ultra-deep
geothermal energy (UDG);
• Accelerating the development of ‘regular’ geo-
thermal energy in the province of Brabant;
• Developing geothermal energy for the Dutch ‘heat
roundabout’ (a heating scheme for industrial, utility,
horticultural and domestic consumers) in general
and in the province of South Holland in particular.
The first area of investigation has led to EBN becom-
ing strongly involved in developing the framework
how to optimally explore the potential of UDG. The
second has resulted in EBN teaming up with the
parties of the Green Deal Brabant on behalf of the
Ministry to identify ways to accelerate the geother-
mal projects. For the third area EBN discusses how
to optimally develop geothermal energy in combi-
nation with heat networks with the relevant parties
in South Holland. So far, EBN’s role has been to
share its expertise on integral subsurface project
development, including its portfolio approach. Using
the regular business methodology it applies to its
O&G activities, EBN induces commercial parties to
cooperate in UDG development and to accelerate the
1
76

Platform unlikelyLondon-Brabant Massif
Dinantian drilledPlatform (northern Netherlands)Platform (southern Netherlands)Platform possiblePlatform structurePlatform unlikelyLondon-Brabant Massif
Dinantian drilledPlatform (northern Netherlands)Platform (southern Netherlands)Platform possiblePlatform structure
The three Dinantian sub-plays
development of regular geothermal projects as
safely and cost-effectively as possible. Currently,
EBN’s role in those emerging activities is being
reviewed by the Ministry of Economic Affairs.
7.2 Exploring the potential of ultra-deep geothermal energyAt the beginning of 2016 the Ministry of Economic
Affairs, EBN and TNO embarked on a collaboration
to explore the possibilities for the development of
UDG in the Netherlands. The goal is to investigate
its potential by identifying the best pilot project(s)
that can be developed in the near future, preferably
before or around 2020. It is anticipated that UDG can
potentially deliver an important contribution to the
transition to a sustainable heating system, espe-
cially to the demand for higher temperature heat for
industrial processes, where temperatures over
130 °C are necessary. To reach these temperatures,
geothermal reservoirs at depths over 4 km are
required in the Netherlands – depths in the Dutch
subsurface that very few operators have drilled.
Both geologically and technologically, these pilot
projects are exploratory and will require innovative
methods.
Together with the Ministry and TNO, EBN has
organised several workshops and meetings identi-
fying consortia with potential pilot projects that are
able to optimally develop these complex projects on
this ambitious timeline. Based on the – still limited –
amount of subsurface data and knowledge of the
Dutch subsurface at large depths, the Dinantian play
was identified as the most promising play to exploit
(Figure 1 ). The economic potential of this geo-
thermal play concept depends both on the amount of
subsurface heat it could produce and on the demand
for heat at the surface, because of the limited dis-
tances over which the heat can be transported.
2
77

At the moment all parties involved are discussing
the possible ways to move forward to cooperate and
invest in the development of the pilot project(s) to
explore the UDG potential in the Netherlands. A first
step would be to further investigate the subsurface
of the Dinantian in three regions or sub-plays:
Dinantian North (‘Friesland’), Middle (‘Midden-
Nederland’) and South (‘Rijnmond’) (Figure 2 ).
The three regions could best be modelled as joint
effort to identify the most suitable projects. EBN
anticipates there will be ample room for synergy
between the three sub-plays, resulting in increased
quality and costs reduction. The ultimate objective is
to unlock the UDG potential in the safest, most
cost-effective way.
7.3 Accelerating development of geothermal energy in BrabantOn April 14 2016 the Ministry of Economic Affairs,
the province of Brabant, several municipalities,
Energiefonds Brabant, Hydreco Geomec, several
heat users and housing corporations in the prov-
ince of Brabant signed the Green Deal Brabant. In
this Green Deal, the parties have committed to
accelerate the development of several geothermal
projects in Brabant by reaping the benefits of the
economies of scale. The Minister of Economic
Affairs subsequently asked EBN to collaborate with
Geothermie Brabant B.V. to identify, quantify and
qualify such economies of scale, and to capitalise
these benefits.
Based on its expertise in approaching subsurface
projects from the broader perspective, EBN has
worked together with Geothermie Brabant B.V. on
the analysis of two concepts: integral geothermal
project management and the introduction and
application of the portfolio approach for Brabant.
Both have great benefits compared to the develop-
ment of stand-alone geothermal projects. Integral
project management involves the contribution of
quality and attention in earlier phases of activities
in the geothermal life cycle to the predictability,
quality and cost efficiency of the later phases, e.g.
during production (Figure 3 ). The lessons learned
from one development serve as input for the next and
add to optimal project development. Besides collabo-
rating on integral project management, EBN is work-
ing together with TNO and Geothermie Brabant B.V.
on applying a portfolio approach to the potential
3
1.1 Heat demand1.2 Play analysis1.3 Quick scan subsurface1.4 Indicative business plan1.5 HSE system1.6 Necessities for exploration
licence & application1.7 Minimal requirements subsidies1.8 Plan of action continuation1.9 Communication stakeholders1.10 General organisation and project organisation
1. Feasibility study 2. Exploration 3.Development 4. Realisation 5. Production 6.
Abandonment2.1 Potentially seismic
acquisition/reprocessing2.2 Detailed geological study2.3 Regional geological studies2.4 Reservoir engineering studies2.5 Stimulation concept2.6 Energetic integration2.7 Risk matrix 2.8 Seismicity study and subsidence
of subsurface2.9 Preliminary design2.10 Prelim financial feasibility2.11 Quick scan licences (incl. EIA)2.12 Contracting heat demand2.13 Financing 2.14 Communication stakeholders2.15 General organisation and
project organisation
3.1 Final drilling plan 3.2 Detailed design surface installation3.3 Design drilling location3.4 Update risk matrix3.5 Qualitative risk assessment3.6 Potential application allocation
plan3.7 Permits3.8 Business case and financing3.9 Tendering3.10 Final investment decision 3.11 Contracting heat demand3.12 Financial closure 3.13 Communication stakeholders3.14 General organisation and
project organisation
5.1 Development of the wells 5.2 Permits 5.3 Monitoring programme during
production, monitoring flow, pump pressure, temperature, casing, water quality, gas concentrations, solid particles, surface facilities
5.4 Management and maintenance5.5 Inhibitor5.6 Monitoring seismicity 5.7 Insurances5.8 Communication stakeholders5.9 General organisation and
project organisation
6.1 Reserve financial resources for decommissioning installation and well
6.2 Compose work programme6.3 Permits6.4 Abandonment activities per
doublet6.5 Communication stakeholders6.6 General organisation and project
organisation
4.1 Selection and contracting contractors
4.2 Permits4.3 Purchase of materials4.4 Drilling 1st well and testing4.5 Drilling 2nd well and testing4.6 Monitoring seismicity when
necessary4.7 Water analysis4.8 Update reservoir model4.9 HSE system for production phase4.10 Qualitative risk assessment
production phase4.11 Production licence application4.12 Final design surface facilities 4.13 Construction surface facilities 4.14 Communication stakeholders4.15 General organisation and project
organisation
78

Re-use of a gas well for geothermal energyIn addition to its activities in KVGN, EBN also
stimulates research projects on the synergy
potential between geothermal and oil and gas.
One of these studies by University of Groningen
focuses on the combined production of heat and
gas from ‘watered-out’ gas fields with strong
aquifers, as illustrated in the figure. In this
concept, a watered-out gas field is (re)used as
geothermal aquifer: cold water is injected into
one well and gas and hot water are produced from
another well. The project will study the feasibility
of the concept, focusing on whether there is a
synergy benefit in the combined development of
the geothermal aquifer and the production of the
gas in the field.
geothermal projects in Brabant. Here too, significant
benefits have been identified. These include:
• De-risking the geology, especially during the
exploration phase of geothermal plays. This could
transform negative NPV for stand-alone develop-
ment into a positive NPV for a portfolio of projects
by means of optimal play development;
• Significant cost reduction possibilities because of
synergy of repetition and economies of scale (e.g.
standardisation, larger-scale procurement and
the build-up of expertise and track record);
• Investment benefits (risk sharing and reduction,
and cost reduction);
• Continuous improvement on safe and integral
project development through learning effects on
for example legislation, regulation, QHSE, stake-
holder management and cooperating with local
civil society;
• A more structural R&D and innovation programme
to ensure medium- and longer-term improvements.
Initial results of the analysis are very promising and
suggest that for the development of geothermal
energy in Brabant, but probably also in the
Netherlands in general, it would be beneficial to
incorporate both the concept of integral project
management and the portfolio approach.
7.4 Geothermal energy in the ‘heat roundabout’The concept of the ‘heat roundabout’, as mentioned
in Section 7.1, encompasses infrastructure to trans-
port heat from various producers (waste heat and
geothermal heat) to industrial, utility, horticultural
and domestic consumers. Recently, further investi-
gation of the contribution of geothermal energy to
this scheme started. Together with parties from the
geothermal sector but also Gasunie, the Province of
South Holland and other parties, EBN is discussing
how – from a business perspective – the transition
to a sustainable heat supply can be accelerated.
EBN’s contribution includes introducing the concept
of integral project management and investigating
how the portfolio approach could benefit both the
subsurface and surface aspects of development.
79
Combined production of heat and gas

7.5 Potential synergies between geothermal energy and hydrocarbonsIn Focus 2016 EBN addressed the potential for syner-
gies between hydrocarbons and geothermal projects.
Both sectors have now joined forces to investigate how
those synergies might be exploited: the geothermal
sector represented by SPG and DAGO is now working
together with the gas sector represented by KVGN,
a collaboration between Gasunie, GasTerra, Shell,
NOGEPA and EBN. Initiator EBN is hosting an explor-
atory roundtable discussion on behalf of KVGN called
Sustainable heat: synergy between gas and geother-
mal. Topics will address technical subjects as well as
communication, QHSE, legal and operational issues:
• Shared subsurface data, knowledge and expertise,
one of the topics mentioned by the Minister of Eco-
nomic Affairs in his letter to the House of Represen-
tatives regarding methods to stimulate sustainable
energy production. The O&G industry has vast
amounts of seismic and well data, some of which
is in the public domain. Recent wells and/or
(re)processed seismic data are confidential and as
such not yet available to the geothermal sector.
The round table will investigate how access to data
could be improved.
• Investigating re-use of O&G wells for geothermal
projects (text box) and dual-play concepts. The
possibilities of combined heat and gas production or
de-risking of geothermal projects by oil or gas wells
(or vice versa) will be assessed. This also includes
surface aspects, such as the heat demand of indus-
try, buildings and the horticulture sector.
• Safe and responsible shared use of the subsurface,
including exchange of knowledge on QHSE, but also
exploring how the O&G and geothermal communi-
ties can deal with common themes such as licensing,
seismicity, communication and regulation. Here
the successful coexistence with other subsurface
activities will also be addressed, including drinking
water projects.
7.6 Carbon Capture Utilisation and StorageThe signing of the Climate Treaty in Paris in 2015
and the goals for a carbon-neutral energy economy
by 2050 have enhanced interest in CCUS. The Minis-
try of Economic Affairs and industry parties have
already done much work on how to develop the first
pilot projects in the Netherlands. Such projects are
complex and involve much preparation. In these
trajectories EBN has worked with its partners on the
Rotterdam Opslag en Afvang Demonstratieproject
(ROAD) that is still under development. Recently,
the Ministry of Economic Affairs launched an initia-
tive to develop a roadmap for CCUS in the
Netherlands before the end of 2017. It has requested
Gasunie and EBN to execute a study that includes an
updated inventory of the storage potential in Dutch
depleted O&G fields and a number of realistic
scenarios for the first phases of offshore storage at a
larger scale. Later in 2017, EBN also plans to explore
the various options for underground energy storage.
Both these studies are examples of EBN’s active con-
tribution to studying and discussing aspects of the
energy transition that relate to EBN’s core expertise.
80

Workshop on shared data, knowledge and expertise
The subsurface is being used for a multitude of
reasons: to produce water (including drinking
water), oil, gas, minerals (salt), heat and cold
(geo-cooling). All these applications require
holes to be drilled to depths varying from 50 to
5000 m. Concerns have been raised about
whether interference can be prevented when
the boreholes are close together and about the
drilling fluids that are used. In view of future
onshore drilling for both hydrocarbons and geo-
thermal energy, a workshop for the various stake-
holders was organised, aiming at exchanging
knowledge. When comparing methods of drilling,
it appeared that the fundamental differences
were small. In particular, the types of fluid used
to drill drinking water production wells were
identical to those used to drill geothermal and
O&G wells in the same geological formations.
Isolation of drinking water layers when drilling
wells for other purposes is of prime importance
to avoid contamination. This is accomplished by
building a so-called bentonite filter cake seal
against the freshwater sands during the drilling
process to avoid penetration by drilling fluids.
Furthermore, a layer of cement between the
drilled hole and the protecting steel pipe (casing)
is permanently installed as an additional barrier
when drilling the deeper formations.
81
Well design of an O&G well
Gas production well Abandoned well

The geothermal sector in the Netherlands
How is the geothermal sector organised and what is the role of DAGO and SPG?DAGO is the Dutch Association of Geothermal
Operators, which represents the collective interest of
geothermal licence owners in the Netherlands.
Founded in 2014, its members include 22 companies.
It has the same role in geothermal exploration and
exploitation as that of NOGEPA in the gas industry.
Key activities within DAGO are the development of
industrial standards, and the exchange of know-
ledge and experience. SPG is the Dutch Geothermal
Platform (Stichting Platform Geothermie), which
was founded in 2002 and has around 85 partici-
pants, ranging from provinces to small and
medium-sized enterprises and operators. It focuses
on the promotion of geothermal energy in the
Netherlands. DAGO and SPG work closely together
on numerous topics.
What is your view on the current state of the geothermal sector in the Netherlands?Geothermal energy in the Netherlands started in
2007, when greenhouse entrepreneurs took private
initiatives to explore the possibilities of this
sustainable form of energy and drilled the first
geothermal wells. In 2016, 14 operational doublets
(1500 – 3000 m TVD) produced 2.7 PJ of heat for
greenhouses, reducing Dutch CO2 emission by about
160,000 tons. The open and interactive discussions
and knowledge-sharing of the DAGO operators are
being used to extend geothermal to new operators.
After having demonstrated its value to greenhouse
horticulture, the geothermal sector is now expanding
into more applications, regions and depths. New
projects are due to start, including some at depths of
500 – 1500 m. Furthermore, UDG is also being
investigated in a joint initiative of the Ministry of
Economic Affairs, EBN, and TNO.
What is needed for a further increase in activity level in and use of geothermal energy? Geothermal energy is one of the main pillars in the
recent Energy Agenda, the Dutch government’s
roadmap for realising a sustainable energy mix in
the Netherlands by 2050. To achieve the intended
growth, much needs to be done; the main points for
attention being lowering the cost price per MWh,
sound risk management and reliability. This requires
close collaboration between all stakeholders and
expertise contributed by the O&G sector.
How can the exploratory round table (Section 7.5) on synergy between oil and gas and geothermal energy assist this?In the round table we have to work on practical,
political and societal issues, with the aim of lower-
ing the cost price while improving risk management
and reliability. Practical matters include subsurface
Interview with Martin van der Hout (DAGO) and Frank Schoof (SPG)
82

The geothermal sector in the Netherlands
and geological aspects, environmental and
best-practice sharing, i.e. for drilling or mainte-
nance. Political and societal topics are QHSE,
risk management and public awareness and
relations. The energy transition will take many
decades, and intensification of geothermal
energy demands more key players to actively
contribute to a sustainable energy mix. This
needs to be done with realistic goal-setting,
respecting current and future generations
What do you think the round table will accomplish?We believe the round table can contribute to
sound structural interaction between gas and
geothermal companies on various topics. DAGO
has already joined one of the NOGEPA working
groups, and this is improving mutual under-
standing. Existing NOGEPA standards can be
used to formulate specific geothermal standards.
All participants in the round table should work
towards achieving the needed intensification of
geothermal energy in NL.
How can EBN and DAGO/SPG cooperate successfully? EBN is a key player in the Netherlands for data,
knowledge and networking on the subsurface
and can greatly support further development in
cost reduction, effective risk management and
reliability. Although geothermal energy differs
from oil and gas in several ways, being locally
produced and not being a commodity, EBN’s
project approach, process knowledge and position
towards our government, NGOs and gas com-
panies is valuable. EBN already participates in
several supervisory groups of the ‘Kennisagenda
Aardwarmte’, a programme to develop geother-
mal knowledge.
83
Left
: Mar
tin
van
der
Hou
t (D
AG
O)
– R
igh
t: F
ran
k Sc
hoo
f (S
PG)

84

8
Res
earc
h, d
evel
opm
ent
and
inn
ovat
ion
Research, development
and innovation
85

EBN is well aware that creating more value
from its assets often requires new, inno-
vative ideas. Hence, EBN is participating
substantially in research on various
topics, covering the full life cycle from exploration
to abandonment. A significant part of the research
is done collaboratively through JIPs. However, EBN
also carries out independent studies, partly
in-house and partly outsourced to contractors. In
recent years, in-house independent work has
included MSc thesis projects and student intern-
ships in cooperation with various universities. In
this chapter, some of the results of these research
projects are highlighted.
8.1 Joint industry effortsIn a rough business climate, joint research ventures
in which expertise is shared to optimise exploration
and production strategies are critical. The industry
is fully aware of this and many JIPs are ongoing. One
of these initiatives is the ITF-PETGAS (Petrophysics
of Tight Gas Sandstone Reservoirs) project, initiated
by the University of Leeds and sponsored by six
large operators. Many of the Dutch gas reservoirs
are prolific producers, yet some of them exhibit
tight reservoir characteristics that prevent economic
exploitation. To better understand the geological
controls leading to reservoir impairment and also to
investigate methods to mitigate the adverse effects
on productivity, EBN joined this JIP in 2008.
The project is currently in its third phase. A key
deliverable of PETGAS is the Atlas of Petrophysical
Properties of Tight Gas Sands. It contains detailed
descriptions of the characteristics of tight reservoir
samples, as well as key controls on these petro-
physical properties. This information allows reser-
voir quality and productivity to be assessed, which is
useful for prospect/field evaluation and determining
stimulation strategies. The PETGAS data is also very
valuable for geothermal, CCUS and underground gas
storage projects.
A second JIP initiative is the 21st Century Exploration
Roadmap Palaeozoic project initiated by the UK
government. In this project, the British Geological
Survey worked with the UK Oil and Gas Authority, Oil
and Gas UK and a consortium of over 45 companies to
evaluate the remaining areas with potential for hydro-
carbons on the UK Continental Shelf, including the
Mid North Sea High adjacent to the Dutch northern
offshore. The multidisciplinary work focused on the
Carboniferous and Devonian petroleum systems that
are also being explored by EBN. EBN contributed
their knowledge to ensure consistency in geological
models across the boundary. At the same time, EBN’s
evaluations in the Dutch sector benefitted from the
insights the project yielded.
A third example is the Integrated Zechstein study at
Durham University in 2015 – 2016, a JIP conducted
together with a number of North Sea operators. This
project integrates the results of several studies (such
as sequence stratigraphy, Ground Penetrating Radar
measurements, outcrop fracture analysis, dia genetic
processes and comparison of historical production
data) on outcrops of Zechstein carbonates at the
coast of northeast England and a large number of
cores from North Sea wells. Results help to confi-
dently predict the reservoir characteristics in
different parts of the Zechstein carbonate build-
ups. The insights will be used in EBN’s evaluation of
the prospects in the Zechstein carbonate play in the
Dutch northern offshore and will help to improve
understanding of the production behaviour of
numerous producing fields.
TKI Upstream GasEBN also participates actively in the Top sector
Knowledge Initiative Gas (TKI Gas) – an innovative
R&D programme on gas production and usage
facilitated by the Ministry of Economic Affairs. In
2015, TNO presented a new programme set-up for
Upstream Gas (one of the themes within TKI Gas).
It consists of seven programme lines with the fol-
lowing themes: 1) Basin analysis, 2) Field develop-
ment and performance, 3) Drilling and completion,
86

Sand box model illustrating movement of salt
0 5 10cm
Cross-section of the sand box model after extension, passive diapirism (the salt is represented by black silly putty) and continuing sedimentation during diapirism, followed by strike-slip movement.
UpstreamGas Consortium
innovation roadmap 2016-2019
Health, safety and environment
Infrastructure
Field development and performance
Well performance
Basin analysis
Decomissioning andabandonment
Programme lines within the TKI Upstream Gas Consortium
4) Well performance, 5) Infrastructure, 6) Decom-
missioning and abandonment, and 7) Health, safety
and environment. EBN participates in several of the
programme lines, as do most operators active in the
Netherlands. Collaboration between the parties
within these JIPs is important to obtain innovative
results. The objectives of TKI Upstream Gas are to
increase exploration, production and – ultimately –
recovery, while reducing risks and costs. In the
latest TKI round, EBN began participating in
projects from three programme lines (Figure 1 ):
• Basin analysis: joint industry research around
geology and exploration;
• Well and flowline performance: research on well
and flowline design and operating improvements;
• Decommissioning and abandonment: investigating
more cost-effective ways to abandon wells and
facilities.
Currently, additional projects are being defined for
the other project lines.
1
2
87

Highlighted: STEM projectThe STEM project (Salt Tectonics – Early Movement)
is an ongoing JIP within the programme line Basin
Analysis that is being carried out by TNO in
collaboration with two operators, one acquisition
contractor and EBN. The project aims at evaluating
the impact of early salt movements on Mesozoic
petroleum systems in the Dutch offshore by
incorporating regional and detailed tectonostrati-
graphic seismic analysis as well as 2D structural
restorations. The project included a one-day salt
tectonics course given by TNO, covering: 1) Mechanical
behaviour of salt, 2) Passive, active and reactive
salt tectonics, 3) Syn-sedimentary effects, and
4) The role of tectonics in basins globally. The day
also included a visit to the TecLab of Utrecht
University, where the results of a sandbox model
were presented (Figure 2 ). The workshop demon-
strated the importance of understanding the timing
of salt movement.
Energy Academy EuropeSince 2013, EBN has supported the Energy Academy
Europe in its bid to become a key player in acceler-
ating the energy transition in the Netherlands by
focusing on education, research and innovation. One
of the ongoing projects sponsored by EBN is
Energysense, which investigates how energy use,
attitudes and innovation in households relate to the
energy transition.
In 2017, the Energy Academy Europe will integrate
with Energy Delta Institute and Energy Valley to
form a single organisation. Energy Delta Institute
provides a range of courses for energy sector
profes sionals. Energy Valley focuses on business
development in the sustainable energy sector, while
the task of Energy Academy Europe is to promote
research, education and innovation. At the end of
2016 the three organisations moved into a new
building on the University of Groningen campus.
Since 2016, ESTRAC (Energy Systems Transition
Centre, part of the Energy Academy Europe) has
been the interdisciplinary and open-end innovation
centre where energy-related market parties, applied
research institutes, universities and other organisa-
tions can work together on major energy questions.
EBN, together with Gasunie, Gasterra and NAM are
among the first Associate Partners of this centre.
8.2 In-house researchIn addition to participating in extramural research,
EBN conducts in-house research projects to develop
practical knowledge for its activities. In cases where
the expertise is present within EBN and the data is
available, EBN analyses technical topics and shares
the results with partners bound by confidentiality
agreements where appropriate. Some examples are
given below.
Understanding geo drilling hazardsSafety and cost control are critical success factors in
the realm of drilling. Actual well costs frequently
exceed budget, due to incidents related to geo
drilling hazards. A significant part of the non-
productive time can be avoided if geo drilling
hazards are identified upfront. The risk assessment
for a well trajectory is largely based on the experi-
ence from offset wells: boreholes in the neighbour-
hood that have been drilled earlier, or holes drilled
through similar geological settings. Easy access to
relevant historical drilling data and the records of
geo drilling hazards encountered in offset wells is
essential for effective de-risking of future drilling
programmes. Currently, operators typically have
their own databases containing such information.
However, these often lack data from competitor
wells. Obviously, risk assessment would greatly
benefit from access to a complete set of drilling
hazard data that makes use of best practices in data.
EBN is involved in most of the O&G wells drilled in
the Netherlands. Aware of its major vested interest
88

a b
Faults and fault planes extracted from 3D data
a) Map view of faults identifi ed at top Rotliegend in the Huizinge area. Hypocentres of events recorded from 1991 until recently are plotted as circles with radius proportional to magnitude. b) Detailed northwest—southeast fault planes extracted from 3D seismic data.
in improved drilling performance, EBN has launched
a project to capture the geo drilling events that have
been observed in wells. This information has been
analysed using an advanced event classification
scheme and includes reference to the underlying geo
drilling hazards. The information has been compiled
into a database and made accessible to operators via
a web-based interface. In this way, a risk analysis
for new wells can be made effectively.
New insights into fracking fluidsAs discussed in Section 4.1, hydraulic fracturing is
an important technology in O&G production and
might also be needed in geothermal projects. EBN
research showed that fracking is a valuable method
for optimising production, but it should only be used
in a safe and responsible way. Although the cur-
rently used fracking fluids are REACH-compliant,
EBN plans to sponsor a project concerning the
potential effects of the fracking fluids on humans
and the environment. The project includes investi-
gating the conventional fracking fluids currently
used in the Netherlands, and so-called green
fracking fluids aiming at identifying what green
fracking fluids could possibly contribute to mini-
mising risks. Additionally, EBN is planning to
cooperate with a renowned water toxicology insti-
tute to investigate the effects of fracking fluids and
of fluids produced back during operations in a real-
life environment.
EBN studies on seismicity in the Groningen fieldEBN has initiated several studies on the induced
seismicity in the Groningen field area, complementing
research conducted by others. The objective is to
gain additional insights that support decisions on
production strategy leading to optimising production
while minimising seismicity. One study comprises a
detailed analysis and refinement of an existing
empirical relationship between the cumulative
number of seismic events and the gas production in
the Groningen field. Results show that a better way
to make predictions is to analyse the ratio of the
activity rate over the production rate versus the
cumulative gas production. The model shows that
the ratio of activity rate over production rate
increases linearly with volume produced (Hettema et
al., 2016). Other projects that started recently focus
on the distribution of stress in the Dutch subsurface,
on reducing uncertainty in earthquake hypocentre
location and on geomechanical behaviour of faults.
In another study, an efficient workflow to improve
the definition of natural faults based on 3D seismic
data has been developed. The use of seismic attri-
butes can significantly improve fault definition
(Figure 3a ), while geobodies extracted from these
attributes provide detailed fault plane geometries
(Figure 3b ). Detailed fault mapping contributes to
establishing relationships between earthquake
3
89

hypocentres and faults and to improving under-
standing of the dynamic behaviour of the field. The
extracted fault geobodies are also input for geo-
mechanical modelling of seismogenic behaviour.
Improved insights into which faults and fault seg-
ments are most susceptible to seismicity could be
used to define an optimal production strategy while
minimising seismic risk. The findings are currently
being used in seismicity studies at EBN, Shell and
KNMI. Fault mapping and characterisation is
of great importance in subsurface evaluation in
general and this workflow is widely applicable not
only in O&G developments, but also in geothermal
or storage projects.
8.3 Student projectsSince 2010, EBN has offered some 40 students
from Vrije Universiteit Amsterdam, Utrecht Univer-
sity and Delft University of Technology the opportu-
nity to carry out research projects in an O&G
company setting. The combination of abundant data
availability, expertise and the provision of coaching
is very attractive for students. The internships and
MSc projects typically last 6 – 9 months and offer a
mix of research and solving practical problems
encountered by EBN. Topics range from exploration
analysis, reservoir production behaviour and infra-
structure to challenges of the energy transition. The
research projects often result in interesting findings
that are of value to EBN and the Dutch O&G sector. A
list of recent student research projects is given
below. Some of these studies can be found on the
EBN website and full reports are available upon
request. Two recent interns look back on their expe-
rience with EBN on the next page. The close collab-
oration between EBN and Dutch academia goes
beyond offering internships. EBN experts are also
involved in advising on course subjects and curric-
ula and teach as guest lecturers at universities. This
support includes courses on geology, geo physics
and petrophysics.
90

Recent MSc studies
Year Subject
2009 Shallow Gas in the Dutch part of the Miocene Eridanos Delta.
2010 Onshore Shale Gas Potential of the Lower Jurassic Altena Group in the West Netherlands Basin and
Roer Valley Graben
2011 Comparison of the life cycle greenhouse gas emissions of shale gas, conventional fuels and renewable
alternatives from a Dutch perspective.
2011 Basin analysis of Tertiary deposits in the Gorredijk concession using 3D seismics and well data
2012 Subsurface sediment remobilization and polygonal faulting in the northern Dutch offshore
2012 Review of Lower Triassic play in the Roer Valley Graben
2013 Dinantian carbonate development and related prospectivity of the onshore Northern Netherlands
2013 Inventory and Analysis of hydraulically fractured wells in the Dutch on- and offshore
2013 Prospectivity analysis of the northern Dutch Central Graben
2014 Fault Mapping and Reconstruction of the Structural History of the Dutch Central Graben
2014 The Role of Reservoir Geology and Reservoir Architecture on Geothermal Doublet Performance
2014 Seismic characterization of the Zechstein carbonates in the Dutch northern offshore
2014 Identifying overlooked exploration opportunities from bypassed pay analysis
2014 The Shale Oil Potential of the Posidonia Formation in the Netherlands
2014 Indications for intra- Chalk seals in the F-blocks of the Dutch offshore by integration of seismic
and well data
2014 Volpriehausen Prospectivity Review
2015 Shallow Gas: Rock Physics and AVO: An analysis of the seismic response as a function of gas saturation
2015 An analysis of Depth and gross rock volume uncertainty
2015 Salt Tectonics in the northern Dutch offshore:
A study into Zechstein halokinesis in the Dutch Central Graben and Step Graben
2015 Comparative Analysis of Shale Permeability Measurements
2015 Application of a deterministic and stochastic approach on exploration projects in
the Dutch Oil and Gas Industry
2015 Production Performance of Radial Jet Drilled Laterals in Tight Gas Reservoirs in the Netherlands:
A Simulation Approach and Economic Analysis
2015 A Time to Depth conversion review of the Dutch North Sea area
2015 Geological evolution of the Chalk Group in the northern Dutch North Sea
2015 Towards better understanding of the highly overpressured Lower Triassic Bunter reservoir
rocks in the Terschelling Basin
2016 3-D restoration of the Dutch Central Graben: Predicting prospects in the Chalk plays
2016 Inventory of Hydrocarbon Shows in the Dutch Northern offshore
2016 Reservoir compaction in shallow gas reservoirs: The impact of production-induced reservoir
compaction on the recovery of gas from shallow reservoirs.
2016 Production Analysis of the fractured Zechstein-2 Carbonate Member in NE Netherlands:
A Dual Porosity Model Approach.
2016 Triassic reservoir development in the northern Dutch offshore
2016 Chalk facies and its petrophysical expression from core and wireline data, North Sea Basin,
the Netherlands.
2016 Reservoir Properties of Upper Jurassic to Lower Cretaceous Formations in the Northern Dutch Offshore.
2016 Inventory of Hydrocarbon Shows in the Northern Dutch offshore (Phase 2)
2017 Production- and Value Analysis of Hydraulic Fractured Wells in The Netherlands
2017 Analysis of End of Field Life Techniques and predicting Liquid Loading using Artificial Neural Networks
2017 Hydrocarbon Shows database: the power of systematic analysis
91

Hydrocarbon shows database: The power of systematic analysis
Why did you apply for an internship within EBN? I had almost completed my Master’s thesis at the
university and felt that I needed to gain experience
working in a professional environment before
entering the job market. EBN offers interesting
internships, so I applied and, luckily, I was selected.
What was the goal of your internship at EBN? The goal was to expand and improve the existing
hydrocarbon shows database. I mainly focused my
work on improving the quality of the data and sub-
sequently analysing the results.
How did you go about improving the database? There were several tasks that I carried out in order
to improve the content and structure. I started by
defining a consistent classification scheme for
observations from different datatypes: mud logs,
well tests and core data. In this way, I was able to
combine all the different hydrocarbon show classi-
fiers into a single one, which makes it a lot easier to
compare the results from the different data types.
After that, I tested and QC-ed the results. I imple-
mented automatic consistency checks, which should
prevent mistakes relating to manually entering the
data. After that, I continued with a regional analysis
of the HC shows data from the Dutch northern off-
shore. I compared the data with the distribution of
hydrocarbon source rocks and checked whether the
information from the database correlates with the
presence of source rocks in the study area.
Are you satisfied with the work you did? All my analyses confirmed that the database con-
tains very valuable data. The major strength of this
database lies in the fact that it contains quantified
and consistent information on hydrocarbon obser-
vations from mud logs, well tests and cores. EBN
might be able to share the database with its partners
and I hope that it will help EBN and partners to
make even better decisions in the search for hydro-
carbons.
What did you learn from your internship? I learned that working in a professional environ-
ment can be fun. Moreover, I found it highly moti-
vating – a lot more than my university studies. I
liked that the work I did was important for others,
but that in order to get my work done, I had to rely
on others too. This interaction is stimulating. Also,
my internship has given me insights into the bigger
picture of the Dutch O&G sector.
Would you want to work in the O&G industry? The work I did here was very interesting, challenging
and exciting. Probably more so than in other tech-
nical sectors because of the large-scale projects and
correspondingly high level of investments. I will
definitely try to pursue my career in the O&G sector.
Constantijn Blom, a Master’s student in Earth
Sciences at Utrecht University, is due to complete a
research project at EBN in 2017. During his internship
Constantijn analysed and expanded the hydrocarbon
shows database described in Section 3.2.
92
Interview with Constantijn Blom, student

Analysis of EoFL techniques and predicting liquid loading using artificial neural networks
Why did you apply for an internship within EBN? I wanted to do my internship at EBN because it is very
instructive and exciting to apply the knowledge that
you acquire during your studies to the industry. Also,
EBN is involved in many projects in the Netherlands,
enabling you to work with data from various opera-
tors, which is unique. This also gave me the opportu-
nity to visit several operators.
What was the main objective of your internship at EBN? There were two main objectives. Firstly, this study
aimed to quantify the potential volume gain of end of
field life (EoFL) techniques, particularly velocity
strings and foam, as up to now, the availability of
data on the potential of EoFL techniques has been
limited. Secondly, it is difficult to determine when to
implement these techniques, due to the unpredict-
ability of the liquid loading moment. Using big data
may allow future instability of production rates to be
predicted and may therefore be very useful in fore-
seeing the liquid loading moment in advance. In my
thesis, a first step was taken to use ANN to predict the
onset of liquid loading by applying actual field data.
What did you learn from your internship? I certainly learned a lot. Next to the knowledge
I gained about the use of EoFL techniques and ANN,
I also gained experience in the petroleum industry.
I discovered that the cases I worked on during my
time at university differed from reality. In real life,
many cases are more complex and sometimes lack
data. But the great thing is that you learn to deal with
this and that you always find a solution in the end.
Were there any difficulties?At first, I was drifting a bit, as data from various
operators was not easily accessible. However, with
the help of EBN staff I managed to get sufficiently
reliable information. The research was successful,
but it should be noted that it is only a first step in
predicting the liquid loading moment.
What does your research mean for EBN?This research can be valuable for EBN and operators,
as the knowledge that was gained by this study gives
us more insight into the usefulness of EoFL tech-
niques and provides an opportunity to predict liquid
loading at an earlier stage. This can benefit gas pro-
duction. EBN wants to continue the research and in
doing so they will train ANN using more wells. I very
much enjoyed this intership and it is great to know
that the research will be continued.
What’s next?I have found a job as a field engineer abroad. This was
something I wished for. At EBN I experienced the
theoretical side and now I am going to explore the
practical.
Ellis Bouw is a Petroleum Engineering graduate
from Delft University of Technology. She analysed
EoFL techniques during her internship at EBN
(2016) and researched how to predict liquid loading
by using artificial neural networks (ANN). Both
studies will give the petroleum industry more insight
into how to efficiently produce from mature gas
fields (her findings are discussed in Section 4.2).
93
Interview with Ellis Bouw, graduate

Glossary ABEX _______ Abandonment Expenditure AFE (AFEs) ____ Authorisation For ExpenditureAVO ________ Amplitude Versus OffsetBGS ________ British Geological SurveyCAES _______ Compressed Air Energy Storage CAPEX ______ Capital ExpenditureCCUS _______ Carbon Capture Utilisation & StorageCOP ________ Cessation of Production DAGO _______ Dutch Association of Geothermal OperatorsDEFAB ______ Study area in the offshore D-E-F-A-B blocksDHI ________ Direct Hydrocarbon IndicatorE&P ________ Exploration and ProductionEBN ________ Energy Beheer Nederland BVECN ________ Energieonderzoek Centrum NederlandEIA ________ Environmental Impact AssessmentEoFL ________ End of Field LifeESTRAC ______ Energy Systems Transition CentreG&M ________ Study area in the offshore G-M blocksGE _________ Groningen EquivalentGIIP ________ Gas Initially In PlaceGIP ________ Gas In PlaceGTS ________ Gasunie Transport ServicesIRO ________ Vereniging Industriële Raad voor de Olie en GasJIP _________ Joint Industry ProjectKNMI _______ Koninklijk Nederlands Meteorologisch InstituutKVGN _______ Koninklijke Vereniging van Gasfabrikanten in NederlandMMbbl ______ One million barrelsms _________ MillisecondMD ________ MillidarcyNAM ________ Nederlandse Aardolie MaatschappijNm3 ________ Normal cubic metreNOGEPA _____ Nederlandse Olie en Gas Exploratie en Productie AssociatieNPF ________ Norwegian Petroleum Society NPV ________ Net Present ValueO&G ________ Oil and GasONE BV ______ Oranje-Naussau Energy BVOPEX _______ Operational ExpendituresPETGAS ______ Petrophysics of Tight Gas Sandstone ReservoirsPI _________ Productivity IndexPSDM _______ PreStack Depth Migration QHSE _______ Quality, Health, Safety and EnvironmentREACH ______ Registration, Evaluation, Authorisation and Restriction of ChemicalsROAD _______ Rotterdam Opslag en Afvang DemonstratieprojectRT _________ Real TermSmall gas fields _ All gas fields except for the Groningen fieldSodM _______ State Supervision of Mines (Staatstoezicht op de Mijnen)SPG ________ Stichting Platform GeothermieSTOIIP ______ Stock-Tank Oil Initially In PlaceTD _________ Total DepthTKI GAS ______ Top Sector Knowledge Initiative GasTNO ________ De Nederlandse organisatie voor Toegepast-Natuurwetenschappelijk Onderzoek TVD ________ True Vertical DepthTWT ________ Two-way Travel TimeUDG ________ Ultra-Deep Geothermal energyUR _________ Ultimate Recovery
94

References
Boxem, T. et al., 2016.
Ultra-diepe geothermie: Overzicht, inzicht &
to-do ondergrond. TNO-report, Utrecht.
EBN, 2016.
Triassic reservoir sands in the Dutch northern
offshore – New results from seismic and cutting
analyses. PROSPEX, London.
Hettema et al., 2016.
Empirical analysis and prognosis of the induced
Seismic activity rate of a depleting gas reservoir
in time and space. Abstract [S54B-09], 2016 Fall
Meeting AGU, San Francisco.
KVGN, 2016.
Gas op Maat, Nederlandse gassector voor een
klimaatneutrale energievoorziening .
Michie and Koch, 1991.
Evaluation of injection-well risk management
in the Williston Basin, Journal of Petroleum
Technology.
Ministry of Economic Affairs, 2016.
Energy Agenda: Towards a low-carbon energy
supply .
Ministry of Infrastructure and the
Environment, 2015.
Beleidsnota Noordzee 2016-2021.
Ministry of Infrastructure and the Environment
and Ministry of Economic Affairs, 2016.
Ontwerp Structuurvisie Ondergrond .
NOGEPA, 2013.
Fact sheet: fracking nader toegelicht.
Poty, E. 2014.
Report on cuttings from the CAL (California)-
GT-01 borehole, University of Liège.
State Supervision of Mines, 2016.
Resultaten inventarisatie fracking. De toepassing
van fracking, de mogelijke consequenties en de
beoordeling daarvan.
Acknowledgements
We would like to thank the following people and organisations for their contributions to this publication:
• Maarten Bijl, TNO
• Constantijn Blom, student
• Ellis Bouw, graduate
• Sandor Gaastra, Ministry of Economic
Affairs
• Hans van Gemert, Ministry of Economic
Affairs
• Floris van Hest, North Sea Foundation
• Martin van der Hout, DAGO
• Justine Oomes, Ministry of Economic
Affairs
• Tessa Posthuma de Boer, photographer
• Diederik Samsom, former leader
of the Dutch Labour Party
• Frank Schoof, SPG
• Harry Segeren, Wintershall
• Steven Snoep, photographer
• Kenneth Stamp, photographer
• KVGN
• Ministry of Economic Affairs
• NAM B.V.
• TNO
95

About EBN
EBN’s strategy focuses on three core areas: Our
Dutch Gas, Return to Nature and New Energy.
EBN is active in exploration, production, storage and
trading of natural gas and oil from the Dutch
subsurface on behalf of the Ministry of Economic
Affairs, sole shareholder. EBN invests, facilitates
and shares knowledge. The participation in these
activities amounts to between 40% and 50%. EBN
also has interests in offshore gas collection pipe-
lines, onshore underground gas storage and a 40%
interest in gas trading company GasTerra B.V.
EBN also advises the Dutch government on the
mining climate and on new opportunities for using
the Dutch subsurface as a source for energy, such as
geothermal energy, and Carbon Capture Utilisation
and Storage. By building on our long history in gas
and oil projects and our expertise of the subsurface,
EBN explores these possibilities contributing to a
carbon-neutral energy future. Furthermore EBN has
taken the lead in the decommissioning and re-use
of ageing oil and gas infrastructure by establishing a
National Platform for decommissioning and re-use
and will continue to strive for safe, sustainable and
cost-efficient decommissioning and re-use of oil
and gas assets. EBN is headquartered in Utrecht, the
Netherlands.
Visit www.ebn.nl for more information
96

DisclaimerThe information and conclusions contained in this report represent the collective view of EBN, not that
of any individual. Any information and conclusion provided in this document are for reference purposes
only; they are not intended nor should be used as a substitute for professional advice or judgement in
any given circumstance. EBN does not guarantee the adequacy, accuracy, timeliness or completeness of
the reports content. EBN therefore disclaims any and all warranties and representations concerning said
content, expressed or implied, including warranties of fitness for a particular purpose or use.
Editor-in-chiefMijke van den Boogaard
EditorsJoy Burrough, Unclogged English
Marten ter Borgh, Jouke van Elten, Raymond Godderij, Michiel Harings,
Guido Hoetz, Bastiaan Jaarsma, Sander de Jong, Eric Kreft, Ewout Pikaar,
Eveline Rosendaal, Barthold Schroot
BoardMarcel Hoenderdos, Jan Willem van Hoogstraten, Berend Scheffers,
Thijs Starink, Peter de Vries
ProductionKiki Vergoossen, Maartje Vermeer
ContributorsAnnemiek Asschert, Marten ter Borgh, Bas Borst, Walter Eikelenboom,
Jouke van Elten, Ricardo Gijbels, Raymond Godderij, Michiel Harings,
Nora Heijnen, Marcel Hoenderdos, Guido Hoetz, Thijs Huijskes, Bastiaan
Jaarsma, Sander de Jong, Marloes Jongerius, Marloes Kortekaas, Henk
Koster, Eric Kreft, Corne van Langen, Tom Leeftink, Jan Lutgert, Erwin
Niessen, Ewout Pikaar, Berend Scheffers, Barthold Schroot, Ruud
Schulte, Pieter Slabbekoorn, Renee Stoeller, Maartje Vermeer, Roderick
Verstegen, Annelieke Vis, Peter de Vries, Jan Westerweel, Jelle Wielenga,
Ferhat Yavuz
DesignSabel Communicatie
PhotographyTessa Posthuma de Boer, Steven Snoep, Kenneth Stamp
97

98
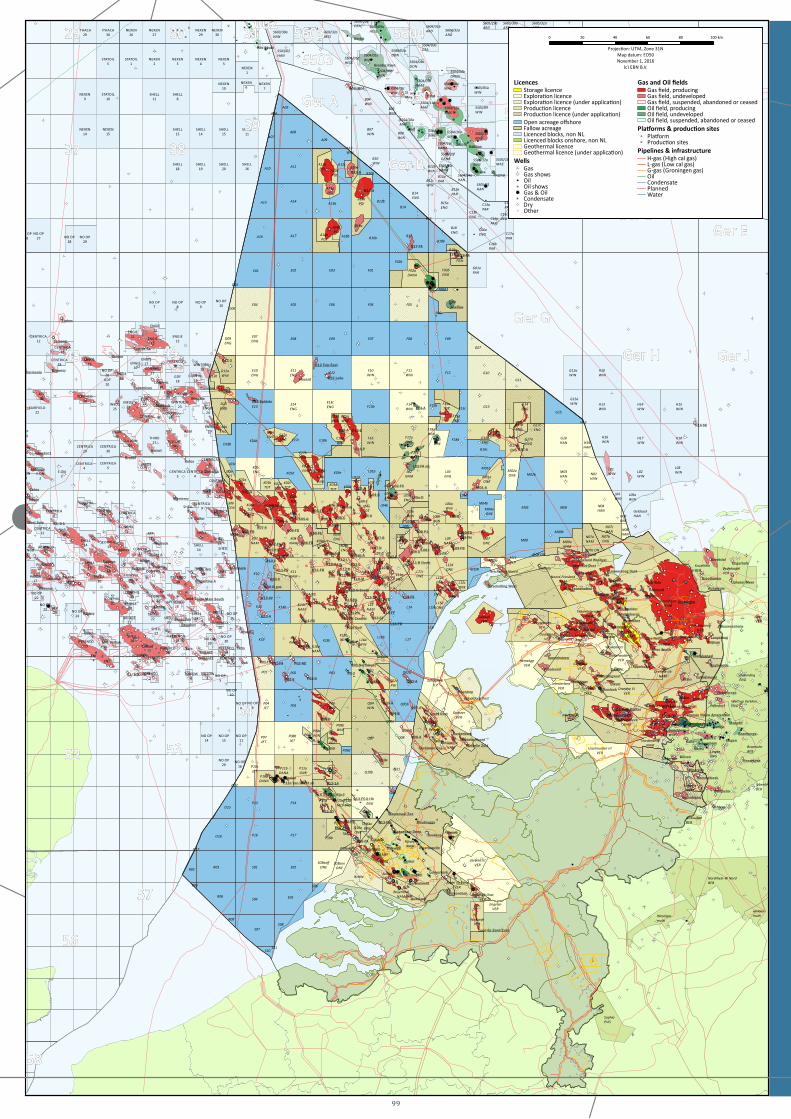
LicencesStorage licenceExplora�on licenceExplora�on licence (under applica�on)Produc�on licenceProduc�on licence (under applica�on)
Open acreage offshoreFallow acreageLicenced blocks, non NLLicenced blocks onshore, non NLGeothermal licenceGeothermal licence (under applica�on)
WellsGasGas showsOilOil showsGas & OilCondensateDryOther
Gas and Oil fieldsGas field, producingGas field, undevelopedGas field, suspended, abandoned or ceasedOil field, producingOil field, undevelopedOil field, suspended, abandoned or ceased
Pla�orms & produc�on sitesPla�ormProduc�on sites
Pipelines & infrastructureH-gas (High cal gas)L-gas (Low cal gas)G-gas (Groningen gas)OilCondensatePlannedWater
0 20 40 60 80 100 km
Projec�on: UTM, Zone 31N
Map datum: ED50
November 1, 2016
(c) EBN B.V.
99

© 2017 EBN Any part of this
publication may be copied,
reproduced or distributed
without the permission of EBN,
provided that the materials are
not copied, reproduced or
distributed for commercial gain
and provided that EBN is
credited as the source on all
copies, reproductions and
distributions of the material.
EBN. B.V.
Daalsesingel 1
3511 SV Utrecht
Phone: +31 (0)30 2339000
Mail: [email protected]