Plasma sheath kinematics and some implications on the modeling of very low energy plasma focus...
9
Plasma sheath kinematics and some implications on the modeling of very low energy plasma focus devices This article has been downloaded from IOPscience. Please scroll down to see the full text article. 2012 Plasma Phys. Control. Fusion 54 095007 (http://iopscience.iop.org/0741-3335/54/9/095007) Download details: IP Address: 146.155.94.33 The article was downloaded on 26/09/2012 at 02:42 Please note that terms and conditions apply. View the table of contents for this issue, or go to the journal homepage for more Home Search Collections Journals About Contact us My IOPscience
-
Upload
independent -
Category
Documents
-
view
1 -
download
0
Transcript of Plasma sheath kinematics and some implications on the modeling of very low energy plasma focus...

Plasma sheath kinematics and some implications on the modeling of very low energy plasma
focus devices
This article has been downloaded from IOPscience. Please scroll down to see the full text article.
2012 Plasma Phys. Control. Fusion 54 095007
(http://iopscience.iop.org/0741-3335/54/9/095007)
Download details:
IP Address: 146.155.94.33
The article was downloaded on 26/09/2012 at 02:42
Please note that terms and conditions apply.
View the table of contents for this issue, or go to the journal homepage for more
Home Search Collections Journals About Contact us My IOPscience
IOP PUBLISHING PLASMA PHYSICS AND CONTROLLED FUSION
Plasma Phys. Control. Fusion 54 (2012) 095007 (8pp) doi:10.1088/0741-3335/54/9/095007
Plasma sheath kinematics and someimplications on the modeling of very lowenergy plasma focus devicesFelipe Veloso1,2,3,5, Ariel Tarifeno-Saldivia1,2,3, Cristian Pavez1,2,3,Jose Moreno1,2,3, Marcelo Zambra1,2,3,4 and Leopoldo Soto1,2,3
1 Comision Chilena de Energıa Nuclear, Casilla 188-D, Santiago, Chile2 Center for Research and Applications in Plasma Physics and Pulsed Power–P4, Santiago, Chile3 Facultad de Ciencias Exactas, Universidad Andres Bello, Av Republica 252, Santiago, Chile4 Universidad Diego Portales, Manuel Rodriguez Sur 415, Santiago, Chile
Received 4 January 2012, in final form 29 May 2012Published 27 July 2012Online at stacks.iop.org/PPCF/54/095007
AbstractThe kinematics of the plasma sheath in two very low energy plasma focus devices (∼70 and∼300 J) is studied by means of non-perturbative optical diagnostics. Experiments areperformed in deuterium at the filling pressure where neutron emission is maximum on eachgenerator. In both devices, the sheath movement is monitored close to the anode surface, fromwhere their thicknesses and their average propagation velocities are obtained. It is found thatthe sheath thicknesses are closer to or lower than 1 mm, which is significantly smaller thanthose measured in larger devices. Moreover, it is found that the sheaths remain attached for aperiod of time close to 20–30% of the quarter period of the discharge, and it coincides withestimations using theoretical models of sheath formation. These results suggest that the usualmodeling tools used in plasma focus need further revision given that some discardedparameters such as plasma resistance and detachment time are important in very low energydevices, which is not necessarily true for high-energy devices. Some calculations andcomparison with models are presented and discussed.
(Some figures may appear in colour only in the online journal)
1. Introduction
The plasma focus is a pulsed device where the current flowingthrough the plasma produces its own confinement magneticfield, resulting in a dense z-pinch column [1–3]. In theseexperiments, a plasma sheath is produced over an insulatorsurface after a pulsed discharge from a capacitor bank. Thissheath detaches from the insulator and is accelerated alongthe axial direction of the electrodes. After reaching the openend of the coaxial electrode assembly, this sheath implodes inthe radial direction, finally pinching onto the symmetry axis.This pinching effect produces a dense and hot z-pinch column,which has been widely studied in both basic plasma physicsand applied research related to x-rays, ions and neutron sources(the latter, from fusion reactions when operated in deuterium
5 Present address: Departamento de Fisica, Pontificia Universidad Catolicade Chile, Av Vicuna Mackenna 4860, Macul, Santiago, Chile.
or deuterium–tritium gas). It has been extensively reportedthat the appropriate pinching of a plasma and the radiationemission is in close relation to the appropriate formation ofthe plasma sheath and its movement prior to the pinchingphase, i.e. the detachment, the axial and radial phases [4–7].For this reason, there have been several experimental studiesconcerning the dynamics of the current sheath prior to thepinching phase in different gases; most of them having storedenergies larger than 1 kJ in the plasma focus [8–16]. However,in the last decade there has been an increasing interest instudying such devices toward lower energies (lower than 1 kJ)for their potentiality to be used as portable devices even withrepetitive operation [15–31] in different applications such assoil humidity measurements [24] and explosives and illicitmaterial detection [32] among others. In addition to this,much effort has been made to understand the scaling lawsof operation together with their similarities and differences
0741-3335/12/095007+08$33.00 1 © 2012 IOP Publishing Ltd Printed in the UK & the USA
Plasma Phys. Control. Fusion 54 (2012) 095007 F Veloso et al
Table 1. Electrical and load parameters of PF-50J and PF-400J.
Electrical Load parametersparameters (see figure 1(a))
C0 L0 Vcharge Stored energy Quarter D2 pressure a b Zeff Lins Rins
(nF) (nH) (kV) (J) period (ns) (mbar) (mm) (mm) (mm) (mm) (mm)
PF-50J 160 ∼40 ∼29 ∼67 ∼150 6 3 11 3.32 23.9 4.76PF-400J 846 ∼37 ∼27 ∼308 ∼330 9 6 13 6.4 21 8
among the different ranges of stored energies that drive theplasma [33]. For these reasons, the experimental informationregarding plasma parameters (such as breakdown, axial andradial sheath movement, sheath parameters, pinching andradiation emission among others) is extremely important forcomplementing knowledge of these very low energy plasmadevices.
Additional to the experiments, the simulation modelsallow comparison among experimental results and plasmaproperties such as efficient energy transfer and inducedvoltage among many others. These models are mainly basedon the snowplough effect of the plasma sheath during theaxial and radial phases, using either a piston model for thesheath movement [34–38] or multiple finite two-dimensionalelements resulting in a curved plasma sheath [39, 40].However, all of these models were constructed comparingtheir results with the available data of larger energy devices(i.e. larger than 1 kJ). Regardless of the model to be used, thecomparison with experimental results is crucial in order to testthe applicability of such models in very low energy devices.There are some comparison tests for the radiation emissionand sheath structure in sub-kJ devices published elsewhere[41, 42]. Nonetheless, they require some modifications tothe load parameters (in [41]) or approximations to the sheathposition (in [42]) in order to adjust the experimental results tothe simulations. A possible explanation on the use of thesemodifications is that the models might need some correctionswhen operating in very low energy devices.
The optimization of plasma focus devices as a pulsedand portable neutron source for different applications, notonly depends on the ability to change the main parametersof the generator (e.g. electrode design, operating pressureand repetition rate), but more crucial is the understanding ofthe physics behind these devices, in particular the low energyones. There have been some reports regarding the variation ofthese parameters and their influence on the radiation emission[43–45]. Given the large quantity of possible parametercombinations for obtaining such an optimized neutron source,the use of comparative results and computer simulations seemsmandatory. There is a well-known comparative study on high-energy devices [46], but as far as the authors are aware, thereis a lack of such comparisons on smaller devices. In order toprovide a further insight into the physics of very low energyplasma foci and to compare their kinematic properties thiswork concentrates on the plasma sheath movement prior tothe pinch phase and the applicability of different models andcommonly used approximations. The latter is performed usingexperimental measurements on two devices operating at ∼70and ∼300 J using deuterium gas. These measurements were
performed using non-perturbative optical plasma diagnosticmethods. The latter discusses some implications of theseresults on the modeling of plasma foci. These results providebenchmarking data for deuterium-operated devices for neutronemission at very low energies and a guidance for improvingsimulations modeling of the discharges.
2. Experiments and results
The experiments were performed in the PF-50J [15–18] andPF-400J [7, 19, 20] devices. These generators were bothdesigned and constructed in our lab, and they are quite similarin the capacitor bank arrangement, connections and spark-gapswitching sections. The main differences among them are thebank capacitance and load section. They are characterized forbeing very low energy plasma focus devices with short quarterperiods (∼30–70 J, ∼150 ns and ∼300–400 J, ∼310–330 ns,respectively). The electrical parameters of the devices aresummarized in table 1. The load section of the generatorsconsists of two concentric electrodes separated by an aluminainsulator, inside a chamber filled with deuterium gas at a certainpressure. A common schematic diagram, useful for the loadof both generators, can be seen in figure 1(a), whereas theirparameters are included in table 1. The electrical diagnosticsof the discharge are also similar in both generators. Voltagesare monitored using resistive dividers, and current derivativesignals are obtained using Rogowski coils. Typical currenttraces for both devices can be seen in figures 1(b) and (c).The neutron emission from each generator is measured usingmoderated 3 He-filled proportional counters arranged in theside-on direction [47–50] and monitored with scintillator–photomultiplier arrangements. The neutron yield obtainedfrom the discharges is ∼3 × 10⁴ n/shot for PF-50J at 6 mbarand ∼1.06 × 10⁶ n/shot for PF-400J at 9 mbar. Further detailson the neutron emission from each generator can be foundelsewhere [18, 19, 49].
The kinematics of the plasma sheath is obtained bymeasuring the time-varying position of the plasma close tothe anode surface (closer than 0.1a; where a is the anoderadius). In the PF-50J device, this information is obtainedfrom several interferometric images at different times fromdifferent shots under similar conditions. These images aretaken using a frequency-doubled Nd : YAG laser (λ = 532 nm,8 ns pulsewidth) with Mach–Zehnder interferometry. Theimages are acquired using a CCD camera (Electrim EDC-1000N). The CCD size is 4.7 × 3.5 mm2 and the resolution is658 × 496 pixels. To produce the image in the interferometer,a magnification m = 0.384 is used, thus a resolution of
2

Plasma Phys. Control. Fusion 54 (2012) 095007 F Veloso et al
Figure 1. (a) Schematic diagram of the electrodes used in both PF-50J and PF-400J. (b), (c) Typical current derivative and voltage traces forPF-50J and PF-400J, respectively. The time to dip (tdip) is indicated.
0.019 mm/pixel is obtained. Density measurements from theseimages are outside the scope of this paper, and they can befound elsewhere (together with sequences of interferogramsfor both axial and radial phases) [16, 49]. The plasma sheathposition measurements are taken from the position of theperturbation on the interferogram due to the plasma refractionclose to the anode surface (at ∼0.25 mm from it). The positionof the plasma sheath is averaged from the measures in bothhalves of each image according to the symmetry axis. Thisposition during each movement phase (axial and radial) for thePF-50J device is shown in figure 2. In this case, the verticalerror bars correspond to the tolerance for the position of theplasma sheath, and are assigned directly from the refractivityobservations on the interferograms, while the horizontal onesare given by the temporal width of the laser pulse.
In PF-50J, the statistical analysis of electrical signalsindicates that the mean time to dip is 156±1 ns with a standarddeviation of ∼8 ns taken from a total of 63 shots. The time todip (tdip) corresponds to the period lasting from the breakdownin the load to the minimum in the dI /dt dip, as shown infigure 1. The measurements of the position in the axial phase(figure 2(e)) were analyzed by approximating the movement toa constant velocity using a linear model and a weighted least-squares. Even though observations indicated that propagationvelocities change along each phase within certain ranges,constant mean values are considered as characteristic valuesuseful for comparison purposes. Moreover, the linear modelapproximation provides correlation coefficients larger than0.92 indicating that the changes in velocity do not stronglyaffect the characteristic features of the sheath kinematics. Itis concluded that the plasma has a mean axial velocity of(3.9±0.5)×104 m s−1. In addition, the thickness of the plasmasheath has a typical value of 0.2 mm. The linear model alsoshows that breakdown, sheath formation and detachment fromthe insulator surface last around 30 ns after the start of thedischarge. After detachment, the axial transit time is ∼70 ns.The radial transit starts close to 50 ns before the dip and lasts∼40 ns. The mean implosion velocity during the radial phaseis (5.2±0.5)×104 m s−1, and the maximum implosion velocityis estimated to be around 7.8 × 10⁴ m s−1. The radial transit
time could seem proportionally too long when compared withMather-type mid-energy microsecond-long plasma foci. Butin those cases, most of the time is consumed during the axialphase, which is not necessarily the case of hybrid-type plasmafoci such as PF-50J and PF-400J.
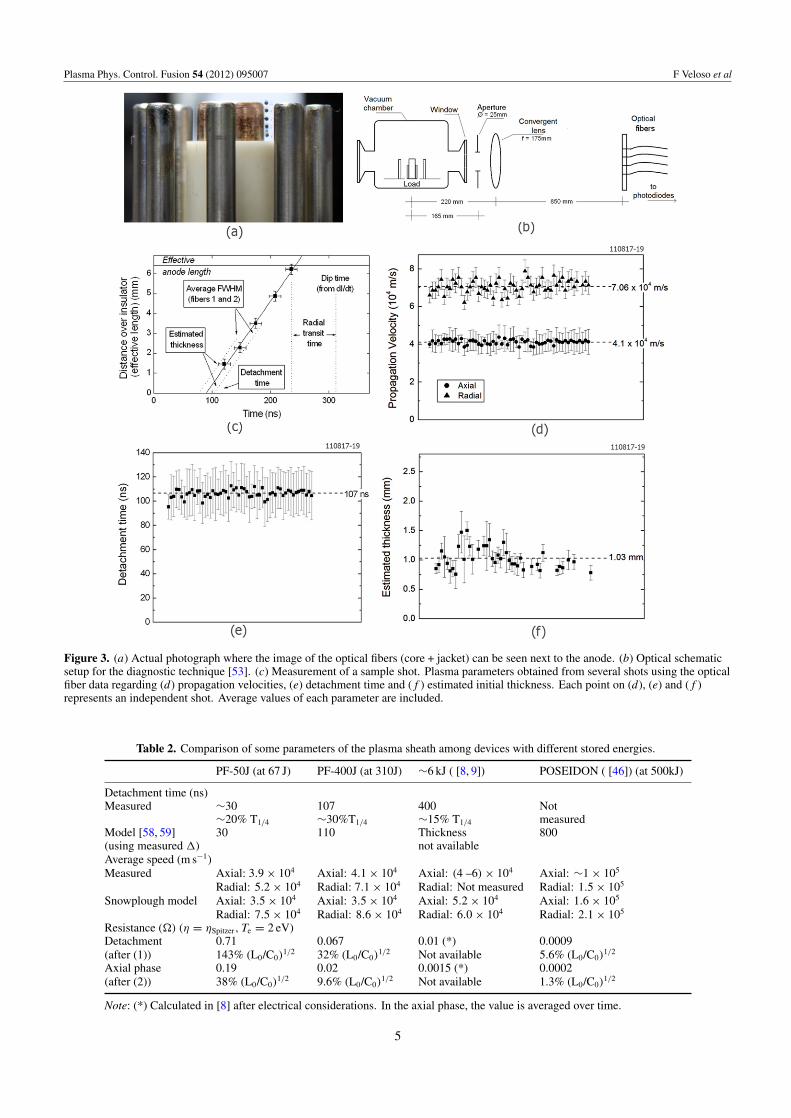
In contrast to PF-50J, the plasma sheath kinematics ofPF-400J is measured shot to shot using a different diagnosticmethod for the sheath movement similar to those describedin [51, 52] since laser probing was not available at the timeof this experimental campaign. In this case, an opticallymagnified image of the load is focused onto a screen, wherefive optical fibers are located. These fibers are arranged inthe image plane in such a way to measure the light emissionfrom the plasma sheath during its movement close to the anodeduring the axial phase. Both lens and optical fibers are locatedoutside the vacuum chamber. From the signals of the opticalfibers, a position–time plot is made, from where the linearfit provides the average axial speed and the detachment time.An actual picture of the diagnostic arrangement, together withoptical setup parameters and the linear fit of a sample shotcan be seen in figure 3. The position of optical fibers avoidsmisinterpretation from the light emitted in the same line-of-sight, since no plasma lies on it before the passage of the sheath.The optical fibers have a core diameter of 1 mm which, togetherwith the optical magnification of the system M ∼ 4, provides aspatial resolution of ∼0.25 mm in the object plane (load) witha depth-of-field of ∼0.7 mm. For the radial movement of theplasma, this diagnostic only provides the time when this phasebegins locating an optical fiber monitoring the anode corner.The average radial speed is obtained using also the pinchingtime obtained from the current derivative signal. The fibers arecoupled to fast photodiode detectors (10 ns both rise and falltimes) providing temporally resolvable signals on the scope,which are related to the position of the fiber in the object plane.Whenever possible, the temporal full-width at half-maximum(FWHM) of the two closest-to-insulator optical fiber signals isalso measured (depending on the signal-to-noise ratio), fromwhere the initial plasma sheath thickness is estimated. Furtherdetails on the diagnostic technique are described elsewhere[53]. The measured velocities, detachment time and thickness
3

Plasma Phys. Control. Fusion 54 (2012) 095007 F Veloso et al
Figure 2. Measurement of the plasma sheath kinematics in PF-50J [49]. Interferograms of the movement during the axial phase (a), (b),during the radial phase (c) and pinching (d) where arrows indicate the sheath position. In (e) and (f ), the plasma sheath position versus timeis plotted taking several different shots. Time means the dip time in the current derivative signal.
of the sheath are included in figures 3(c)–(f ). On this device,the mean time to dip is (314±7) ns, and the transit times for theplasma sheath in the PF-400J device are ∼140 ns and ∼75 nsfor the axial and radial phases, respectively.
The experimental measurements of figures 2 and 3 showthe plasma sheath kinematics during the axial and radialphases. It is interesting to point out that the measured axialspeeds are nearly 4 × 10⁴ m s−1 for both fast and very lowenergy generators, which is nearly half of the usual values of∼105 m s−1 observed in large energy devices, but within therange reported in [54]. Similarly, the average radial speedmeasurements indicate values in the range (5 –7)× 104 m s−1,which are also nearly half of those of larger devices [46, 55]and lower than the range of [54]. Despite these differencesfrom larger devices, the experimentally measured speeds ofthe sheath are in close agreement with those obtained usingthe snowplough model for the plasma movement in plasmafocus discharges [35, 41, 56], as shown in table 2. Furthermore,the differences in these values when compared with largerdevices are not so large given the orders of magnitude inenergy difference with large devices. Additionally, the ratio
of the plasma sheath velocities among the axial and radialphases remains similar with any plasma focus operated indeuterium. These observations provide further support to theidea of scalability in plasma focus devices [3, 33]. In PF-400J,the average radial speed is considered up to a final radius of0.12a, according to previous measurements from many devicesand the scaling laws obtained for plasma focus [3, 16, 33, 56].
On the other hand, it can be seen (in both generators) thatthe plasma sheath detaches from the insulator surface in theaxial phase after a certain time after the current starts flowingthrough the load (∼30 ns in PF-50J and ∼110 ns in PF-400J).This time period is defined as the detachment time and it isconsidered as the time when the center of the sheath is separatedfrom the insulator by half of the measured thickness. Prior tothis time, the plasma sheath is formed from the ionization of thebackground gas without moving and remaining attached overthe insulator surface. This observation has also been madeusing optical diagnostics in a ∼6 kJ device using hydrogen[29] and deuterium [8] and evidenced in neon on a 3.3 kJdevice [57], and additionally, on PF-400J itself using electricaldiagnostic analysis (i.e. without using images) [7]. It should be
4
Plasma Phys. Control. Fusion 54 (2012) 095007 F Veloso et al
Figure 3. (a) Actual photograph where the image of the optical fibers (core + jacket) can be seen next to the anode. (b) Optical schematicsetup for the diagnostic technique [53]. (c) Measurement of a sample shot. Plasma parameters obtained from several shots using the opticalfiber data regarding (d) propagation velocities, (e) detachment time and (f ) estimated initial thickness. Each point on (d), (e) and (f )represents an independent shot. Average values of each parameter are included.
Table 2. Comparison of some parameters of the plasma sheath among devices with different stored energies.
PF-50J (at 67 J) PF-400J (at 310J) ∼6 kJ ( [8, 9]) POSEIDON ( [46]) (at 500kJ)
Detachment time (ns)Measured ∼30 107 400 Not
∼20% T1/4 ∼30%T1/4 ∼15% T1/4 measuredModel [58, 59] 30 110 Thickness 800(using measured �) not availableAverage speed (m s−1)
Measured Axial: 3.9 × 10⁴ Axial: 4.1 × 10⁴ Axial: (4 –6) × 104 Axial: ∼1 × 10⁵
Radial: 5.2 × 10⁴ Radial: 7.1 × 10⁴ Radial: Not measured Radial: 1.5 × 10⁵
Snowplough model Axial: 3.5 × 10⁴ Axial: 3.5 × 10⁴ Axial: 5.2 × 10⁴ Axial: 1.6 × 10⁵
Radial: 7.5 × 10⁴ Radial: 8.6 × 10⁴ Radial: 6.0 × 10⁴ Radial: 2.1 × 10⁵
Resistance (�) (η = ηSpitzer, Te = 2 eV)Detachment 0.71 0.067 0.01 (*) 0.0009(after (1)) 143% (L0/C0)
1/2 32% (L0/C0)1/2 Not available 5.6% (L0/C0)
1/2
Axial phase 0.19 0.02 0.0015 (*) 0.0002(after (2)) 38% (L0/C0)
1/2 9.6% (L0/C0)1/2 Not available 1.3% (L0/C0)
1/2
Note: (*) Calculated in [8] after electrical considerations. In the axial phase, the value is averaged over time.
5

Plasma Phys. Control. Fusion 54 (2012) 095007 F Veloso et al
pointed out that this time is not negligible when compared withthe quarter period of each generator. The sheath thickness hasaverage values of ∼0.2 mm (PF-50J) and ∼1.0 mm (PF-400J).In the case of PF-400J, the sheath thickness of ∼1 mm couldbe overestimated due to the ∼20–30 ns FWHM measured fromthe signals, which is close to the resolution of the photodiodes.In any case, the measured thicknesses in both devices areconsiderably lower than the usual centimeter range thicknessmeasured in larger energy devices [10, 46].
3. Implications of sheath parameters in models
The movement of the deuterium plasma sheath is studied intwo very low energy plasma focus devices, which operateat 67 J (PF-50J) and 308 J (PF-400J) with neutron yields of∼104 n/shot and ∼106 n/shot, respectively. The kinematicsof the plasma sheath is measured using optical diagnosticsthat do not perturb it while measuring. The results showthat the sheath begins its movement after a certain period oftime after the current starts flowing through the load. Thisobservation has also been made previously in other devices, butsurprisingly it is not included in the usual modeling of plasmafocus [35–40]. The reason could be either for simplicity, orfor considering it negligible when compared with the quarterof period of the discharge usually in the microsecond range, orfor time compensation produced by using different electrodedimensions (particularly, the effective anode length) in thesimulations. However, the experiments presented here arecharacterized by their shorter quarter period of hundreds ofnanoseconds and shorter effective anode length (in addition totheir very low stored energies). Hence, this attachment time issignificant in the calculation of how the plasma sheath movesalong the effective length of the anode. A similar situation canbe described for experiments on hydrogen (at 120 J [29]), neon(at 3.3 kJ [57]) or deuterium (at 6 kJ [8]) reported elsewhere.Particularly, the simulations of PF-400J presented in [41] usingthe Lee model code [34, 35] were able to compute the neutronyield as a function of pressure within reasonable agreement.But these numerical simulations required adjustments on boththe capacitor bank and electrode parameters in order to fitthe experimental current waveform properly. The inclusionof the attachment time in the simulations should enhance theaccuracy of the simulation, which could be proved by addingthe necessary modifications on the code (which are certainlybeyond the scope of this paper). The measured time when theplasma remains attached to the insulator could be comparedwith some of the available models for the formation of theplasma sheath in plasma focus devices. Some of these modelsare given in [58, 59], where the ionization and lift-off timeshave been analytically estimated. The summation of thesetimes is taken as the detachment time. For these computations,the measured thicknesses of the sheath on the PF-50J and PF-400J devices are used and the results are included in table 2.It is interesting to point out that the analytical calculationsare in very close agreement with the experimental values,demonstrating that the prediction capability is indeed possibleeven in these very low energy devices.
The scaling laws state that the energy stored in thecapacitor bank of an operative plasma focus can be decreasedas long as the electrode dimensions decrease properly. If thesescaling laws are obeyed, the plasma parameters such as densityand temperature remain similar among devices, regardlessof the device energy [3, 33]. In particular, the anode radiusa should be chosen in such a way as to fulfill the scalingparameters accordingly. The dimension of the anode radiuscertainly influences the radius of the insulator that covers it.In very low energy devices, such as the PF-400J and PF-50Jdevices, the small diameters of both anode and insulator,together with the measurements of sheath thickness, imply animportant feature for plasma resistance when compared withlarger energy devices. The resistance of the plasma sheath canbe calculated from the following relations:
R
η=
Lins
π(�2 + 2Rins�)at detachment (1)
ln(rout/rin)
2π�axial phase (2)
zpinch
πr2pinch
≈ 6.37
aat pinching (3)
where R and η are the plasma resistance and resistivity,respectively. � is the sheath thickness and rin (rout) is theinner (outer) radius of the plasma with limiting value on theanode (cathode) radius. In equation (3), the approximationson the height zpinch = 0.8a and the pinch radius rpinch = 0.12a
are used [3, 56]. Even though this paper is not centered onthe pinch phase, it is worthwhile to mention the resistancedifferences on the pinch phase given by the anode radius(which is related to the device energy according to the scalinglaws). This observation could imply differences in the pinchstability, as mentioned in [33], and a proportionally extendedradial transit time mentioned in the previous section. Usingthese relations, the differences in resistance among differentdevices are much more clear, since it is expected that the plasmatemperature (and consequently, the resistivity) on each phasedoes not show significant variation on the different devices[58, 59]. The insulator dimensions, the sheath thickness andthe anode radius in very low energy devices are considerablylower than those in larger energy devices. Table 2 showsthe calculations for plasma resistance using the measuredvalues for the PF-50J and PF-400J devices. For the sakeof comparison, table 2 also includes similar calculations fortwo other devices; the high-energy device POSEIDON [46]operating at 500 kJ, and a low-energy device operating at 6 kJ[8]. In all cases, the Spitzer resistivity in a 2 eV fully ionizeddeuterium plasma is used. Even though other resistivityexpressions can be used instead, the differences in plasmaresistance among devices will be maintained in the same way.Additionally, these values are compared with the externalcircuit impedance (L0/C0)
1/2 when available. It can be seenthat the plasma resistance (using the Spitzer resistivity on afully ionized deuterium plasma) is comparable to and evenlarger than the circuit impedance, during the attachment andaxial phase for very low energy devices. The same is notnecessarily true for devices having stored energies larger than
6

Plasma Phys. Control. Fusion 54 (2012) 095007 F Veloso et al
1 kJ. This means that a time-varying plasma resistance shouldbe carefully evaluated if it is intended to be neglected duringmodeling of very low energy devices, as is usually done forlarger energy devices.
The study of plasma sheath movement along the axial andradial phases is important in order to provide a full pictureof the plasma focus phenomena. In the case of very lowenergy devices (stored energies <1 kJ), the results show thatthe plasma sheath moves at speeds comparable to larger energydevices, in spite of the orders of magnitude of difference inenergy. However, the lower operating energy (which leadsto reduced load sizes) produces thinner plasma sheaths inthe experiments, which imply considerations on the plasmaresistance. The observed kinematics on ∼70 and ∼300 Joperating plasma foci provide further support and knowledgeto the scaling and modeling of very low energy plasma foci,which should be considered for future design and performanceoptimization of these kinds of portable devices.
Acknowledgments
This work is supported by the 1110940 project. Theauthors are also grateful to Mr Patricio San Martin for hisvaluable technical support, to Mrs Karla Cubillos for languagereviewing and to Mr Victor Santibanez and Mr Benjamin Sotofor their assistance during acquisition of some of the data.
References
[1] Mather J W 1965 Phys. Fluids 8 366[2] Filippov N V, Filippova T I and Vinogradov V P 1962 Nucl.
Fusion Suppl. 2 577[3] Soto L 2005 Plasma Phys. Control. Fusion 47 A361[4] Zakaullah M, Waheed A, Ahmad S, Zeb S and Hussain S S
2003 Plasma Sources Sci. Technol. 12 443[5] Ahmad S, Hussain S S, Sadiq M, Shafiq M, Waheed A and
Zakaullah M 2006 Plasma Phys. Control. Fusion 48 745[6] Kies W 1986 Plasma Phys. Control. Fusion 28 1645[7] Veloso F, Pavez C, Moreno J, Galaz V, Zambra M and Soto L
2012 J. Fusion Energy 31 30[8] Tou T Y, Lee S and Kwek K H 1989 IEEE Trans. Plasma Sci.
17 311[9] Tou T Y 1995 IEEE Trans. Plasma Sci. 23 870
[10] Bruzzone H and Grondona D 1997 Plasma Phys. Control.Fusion 39 1315
[11] Bruzzone H and Martinez J F 2001 Plasma Sources Sci.Technol. 10 471
[12] Bhuyan H, Mohanty S R, Neog N K, Bujarbarua S andRout R K 2003 Meas. Sci. Technol. 14 1769
[13] Al-Hawat S 2004 IEEE Trans. Plasma Sci. 32 764[14] Aghamir F M and Behbahani R A 2011 J. Appl. Phys.
109 043301[15] Moreno J, Silva P and Soto L 2003 Plasma Sources Sci.
Technol. 12 39[16] Tarifeno-Saldivia A, Pavez C, Moreno J and Soto L 2011 IEEE
Trans. Plasma Sci. 39 756[17] Silva P, Soto L, Moreno J, Silvestre G, Zambra M,
Altamirano L, Bruzzone H, Clausse A and Moreno C 2002Rev. Sci. Instrum. 73 2583
[18] Soto L, Silva P, Moreno J, Zambra M, Kies W, Mayer R E,Clausse A, Altamirano L, Pavez C and Huerta L 2008J. Phys. D: Appl. Phys. 41 205215
[19] Silva P, Moreno J, Soto L, Birstein L, Mayer R E and Kies W2003 Appl. Phys. Lett. 83 3269
[20] Zambra M, Silva P, Pavez C, Pasten D, Moreno J and Soto L2009 Plasma Phys. Control. Fusion 51 125003
[21] Soto L, Pavez C, Moreno J, Barbaglia M and Clausse A 2009Plasma Sources Sci. Technol. 18 015007
[22] Pavez C and Soto L 2010 IEEE Trans. Plasma Sci.38 1132
[23] Verma R, Rawat R S, Lee P, Krishnan M, Springham S V andTan T L 2010 IEEE Trans. Plasma Sci. 38 652
[24] Milanese M, Moroso R and Pouzo J 2003 Eur. Phys. J. D27 77
[25] Rout R K, Mishra P, Rawool A M, Kulkarni L V and Gupta SC 2008 J. Phys. D: Appl. Phys. 41 205211
[26] Shukla R, Sharma S K, Banerjee P, Das R, Deb P, Prabahan T,Das B K, Adhikary B and Shyam A 2010 Rev. Sci. Instrum.81 083501
[27] Verma R, Roshan M V, Malik F, Lee P, Lee S, Springham S V,Tan T L, Krishnan M and Rawat R S 2008 Plasma SourcesSci. Technol. 17 045020
[28] Verma R, Rawat R S, Lee P, Springham S V, Tan T L,Roshan M V and Krishnan M 2009 J. Plasma Fusion Res.Ser. 8 1283
[29] Hassan S M et al 2006 Plasma Sources Sci. Technol.15 614
[30] Barbaglia M, Bruzzone H, Acuna H, Soto L and Clausse A2009 Plasma Phys. Control. Fusion 51 045001
[31] Barbaglia M, Soto L and Clausse A 2012 J. Fusion Energy31 105
[32] Gribkov V A, Latyshev S V, Miklaszewski R A, ChernyshovaM, Drozdowicz K, Wiacek U, Tomaszewski K andLemeshko B D 2010 Phys. Scr. 81 035502
[33] Soto L, Pavez C, Tarifeno A, Moreno J and Veloso F 2010Plasma Sources Sci. Technol. 19 055017
[34] Lee S 1984 Radiations in Plasmas vol II, ed B E McNamara(Singapore: World Scientific) pp 978–87
[35] Lee S 2010 Radiative Dense Plasma Focus ComputationalPackage: RADPF http://www.intimal.edu.my/school/fas/UFLF/
[36] Gonzalez J, Clausse A, Bruzzone H and Florido P 2004 IEEETrans. Plasma Sci. 32 1383
[37] Gonzalez J, Brollo F and Clausse A 2009 IEEE Trans. PlasmaSci. 37 2178
[38] Moreno C, Bruzzone H, Martinez J and Clausse A 2000 IEEETrans. Plasma Sci. 28 1735
[39] Moreno C, Casanova F, Correa G and Clausse A 2003 PlasmaPhys. Control. Fusion 45 1989
[40] Casanova F, Moreno C and Clausse A 2005 Plasma Phys.Control. Fusion 47 1239
[41] Lee S, Saw S H, Soto L, Springham S V and Moo S P 2009Plasma Phys. Control. Fusion 51 075006
[42] Casanova F, Tarifeno-Saldivia A, Veloso F, Pavez C, Clausse Aand Soto L 2012 J. Fusion Energy 31 279
[43] Tarifeno-Saldivia A and Soto L 2012 Neutron emission andoptimization of a tabletop plasma focus operated at tens ofjoules Phys. Plasmas submitted
[44] Beg F N, Zakaulah M, Nisar M and Murtaza G 1992 Mod.Phys. Lett. B 6 593
[45] Woo H, Chung K and Lee M 2004 Plasma Phys. Control.Fusion 46 1095
[46] Herold H, Jerzykiewicz A, Sadowski M and Schmidt H 1989Nucl. Fusion 29 1255
[47] Moreno J, Birstein L, Mayer R E, Silva P and Soto L 2008Meas. Sci. Technol. 19 087002
[48] Moreno J, Tarifeno-Saldivia A and Soto L 2010 AIP Conf.Proc. 1265 505
[49] Tarifeno-Saldivia A 2011 Experimental study of a tens ofjoules small fast plasma focus discharge emitting neutronsPhD Thesis Universidad de Concepcion (In Spanish)(available at http://pppp.cl/descarga/ATarifeno PhDTesis V0.pdf)
7
Plasma Phys. Control. Fusion 54 (2012) 095007 F Veloso et al
[50] Tarifeno-Saldivia A, Mayer R E, Pavez C and Soto L 2011Methodology for the use of proportional counters in pulsedfast neutron yield measurements arXiv:1110.2500v1
[51] Serban A and Lee S 1995 Rev. Sci. Instrum. 66 4958[52] Mahe L 1996 Soft x-rays from compact plasma focus PhD
Thesis Nanyang Technological University (available athttp://www.plasmafocus.net/IPFS/phdtheses/liumahe/Liu%20Mahe.htm)
[53] Veloso F, Moreno J, Pavez C, Tarifeno-Saldivia A, Zambra Mand Soto L 2012 Non-intrusive plasma diagnostic formeasuring sheath kinematics in plasma focus dischargesMeas. Sci. Technol. 23 087002
[54] Bernard A et al 1998 J Moscow Phys. Soc. 8 93
[55] Gribkov V A, Bienkowska B, Borowiecki M, Dubrovsky A V,Ivanova-Stanik I, Karpinski L, Miklaszewski R A,Paduch M, Scholz M and Tomaszewski K 2007 J Phys. D:Appl. Phys. 40 1977
[56] Lee S and Serban A 1996 IEEE Trans. Plasma Sci.24 1101
[57] Zhang T, Lin X, Chandra K A, Tan T L, Springham S V,Patran A, Lee P, Lee S and Rawat R S 2005 Plasma SourcesSci. Technol. 14 368
[58] Bruzzone H and Vieytes R 1993 Plasma Phys. Control. Fusion35 1745
[59] Bruzzone H, Acuna H and Clausse A 2007 Plasma Phys.Control. Fusion 49 105
8