
VLBA Imaging of the Blazar, J08053+6144
18
VLBA Imaging of the Blazar, J08053+6144 Daniel Zirzow * Jeffrey Karle † Joe Craig ‡ May 11, 2009 Contents 1 Introduction 2 2 Calibration of VLBA Data 3 3 Imaging J08053+6144 at 5 GHz & 15 GHz 4 4 Model Fitting 6 5 Polarization 8 6 Results and Analysis 12 7 Relativisitic Beaming 13 8 Faraday Rotation 15 9 Conclusion 17 * University of New Mexico, 1009 Bradbury, Albuquerque, NM 87131 USA. E-mail: [email protected] † E-mail: [email protected] ‡ E-mail: [email protected] 1
Transcript of VLBA Imaging of the Blazar, J08053+6144
VLBA Imaging of the Blazar, J08053+6144
Daniel Zirzow∗ Jeffrey Karle † Joe Craig ‡
May 11, 2009
Contents
1 Introduction 2
2 Calibration of VLBA Data 3
3 Imaging J08053+6144 at 5 GHz & 15 GHz 4
4 Model Fitting 6
5 Polarization 8
6 Results and Analysis 12
7 Relativisitic Beaming 13
8 Faraday Rotation 15
9 Conclusion 17
∗University of New Mexico, 1009 Bradbury, Albuquerque, NM 87131 USA. E-mail: [email protected]†E-mail: [email protected]‡E-mail: [email protected]
1
Abstract
We present observations of the high redshift (z = 3.03) blazar J08053+6144 at both 5 GHzand 15 GHz using the VLBA. We obtained high dynamic range Stokes I maps of J08053+6144at 5 and 15 GHz. Polarization maps plotting source intensity (Stokes I) and polarization angleare included with a rotation measure map. Using data obtained from our VLBA observations weprovide calculations for the spectral index α that characterizes the source emission (εν ∝ να).We also calculate the brightness temperature of the source at 5 and 15 GHz. The magnetic fieldstrength is also calculated using a method mentioned by Miley (1980) [1] under the conditions
that we are solving for a minimum energy condition ume = ( 73)(Bme
2
8π). We also compare our
observations with observations of this source at 5 GHz in 1998 (Taylor, et al) [2] in order tolook for bulk motion within the visible jet component of the source.
1 Introduction
Blazars are among the most energetic sources in the observable Universe. Blazars emit radiationthroughout the entire electromagnetic spectrum from Gamma Rays to Radio. Blazars are a typeof radio-loud Active Galactic Nuclei (AGN) in which the relativistic jet that is responsible for thevast majority of non-thermal emission is oriented at a very small angle with respect to our line ofsight. Though a wide variety of blazar properties can be explained by the existence of relativisticjets, understanding how jets form is still an unsolved problem in astrophysics. Relatively recentmagnetohydrodynamic (MHD) numerical simulations lend support to the theory that relativisticjets form in environments containing magnetized gas flowing around a supermassive black hole thatlies at the center of AGNs. It is believed that the difference between radio-loud and radio-quietAGN can be attributed to differences in spin of the supermassive black hole. Radio-loud sourcesseem to be associated with Kerr holes and radio-quiet sources with Schwarzschild holes that are oforder 2-4 times weaker than their radio-loud counterparts [3]. Recent data also supports the shockin jet model in which primary emission is from shock waves that move through the jet, rather thanthe jet being comprised of a homogenous plasma [4].
Blazar emission typically exhibits two generally broad components, one that peaks somewherefrom the infrared to X-rays and the other that peaks in the MeV to TeV energy range [5]. Blazarscommonly exhibit variability at all wavelengths at which they radiate, though these variations takeplace on different timescales ranging from years to less than a day [6]. The most extreme variabilitytakes places in the γ-rays with very short periods of variation. The most luminous sources haveγ-ray luminosities as high as 1049 ergs · s−1 [7]. It is believed that the γ-ray emission emanatesfrom the jet and not the core. There are two classes of models that attempt to explain the natureof the γ-ray emission, namely hadronic and leptonic, depending on whether protons or electronsare primarily responsible for the γ-ray emission. It is currently believed that the primary source ofγ-ray emission is due to inverse Compton scattering involving leptonic processes [4]. By the processof inverse Compton scattering a photon with frequency ν0 will scatter off an electron with a Lorentzfactor γ = mec
2/E with a final frequency νf = (4/3)γ2ν0 [8]. Because blazars emit extremely largequantities of γ-rays they dominate the sky at high energies. A vast majority of the high energysources detected by EGRET (The Energetic Gamma Ray Experiment Telescope) are blazars.
2
2 Calibration of VLBA Data
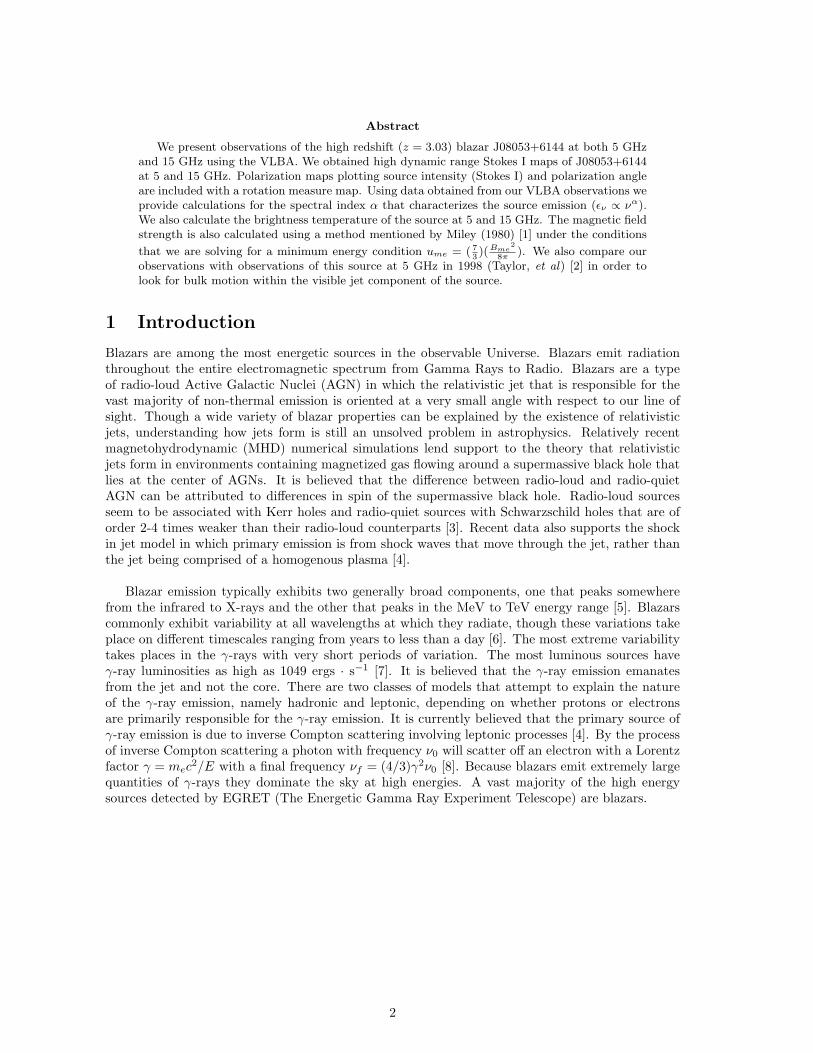
Calibration and imaging of our VLBA data for J08053+6144 was done in both AIPS and difmap.Upon receiving our data initial calibration in AIPS was performed. Using the two multi source datafiles at 5 and 15 GHz, we ran the tasks SPLIT and FITTP to create single source data files in StokesRR for both the target source and our calibrators. Our calibration sources included 3C84, 3C279,J1310+3220, and J0854+2006. Once we had single source data sets in RR we performed imagingand self calibration in difmap. Once we had achieved acceptable images of theses sources we savedthe images and models and read them back into AIPS individually using the task IMLOD. We thenused our images of all 5 sources to perform calibration at both 5 and 15 GHz using our models fromdifmap instead of a simple point source model. A point source model would not suffice as all ofthe sources were at least partially resolved. Once we had a better calibration of the data at bothfrequencies we wrote out Stokes I files for our target source J08053+6144 to image in difmap.
(a) 5 GHz (b) 15 GHz
Figure 1: Rad plots
(a) 5 GHz (b) 15 GHz
Figure 2: UV plots
3
3 Imaging J08053+6144 at 5 GHz & 15 GHz
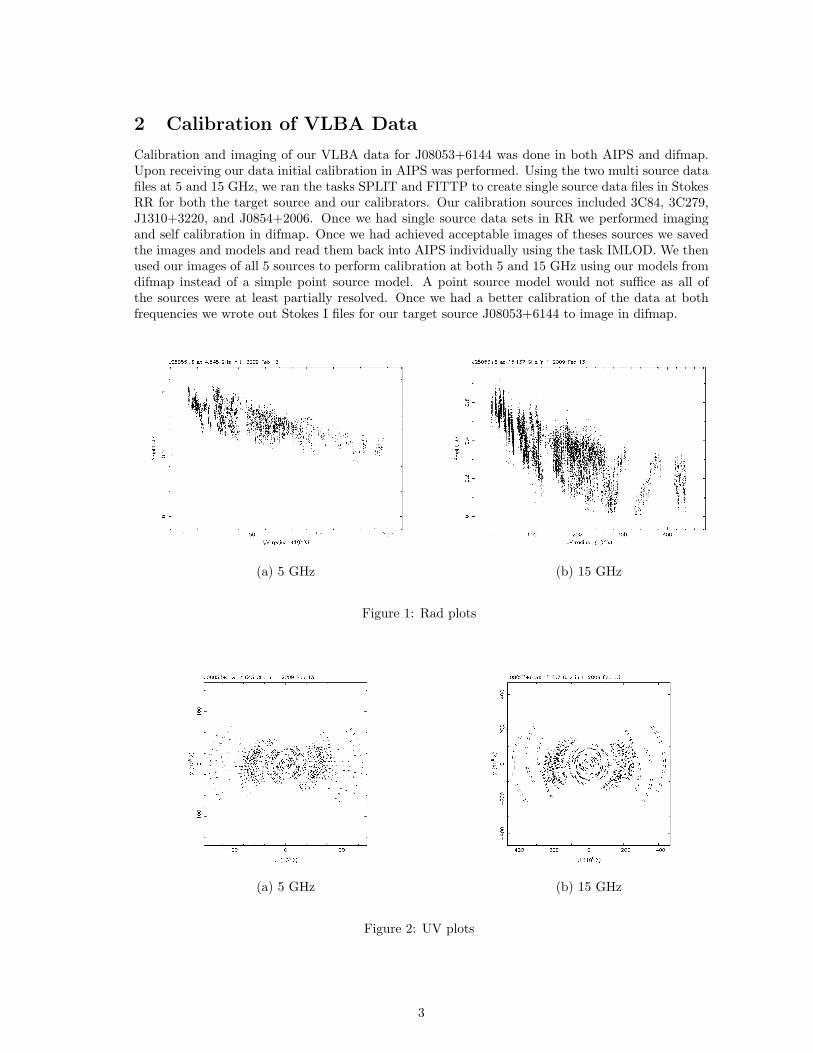
We made Stokes I maps of J08053+6144 at both 5 and 15 GHz. Imaging was performed in difmap.Using the EVN Calculator for the VLBA we calculated theoretical noise at 5 GHz with 228 minutetotal scan duration is 0.071 mJy/Beam, and 0.123 mJy/Beam at 15GHz with 236 minute scanduration. At 5 GHz our Stokes I map has an off source noise level of 0.12 mJy/Beam and a peakvalue of 789.89 mJy/Beam. At 15 GHz the Stokes I map achieved an off source noise level of 0.15mJy/Beam and a peak value of 356.38 mJy/Beam with a 236 minute total scan duration.
Figure 3: Contour Image, 5 GHz
4
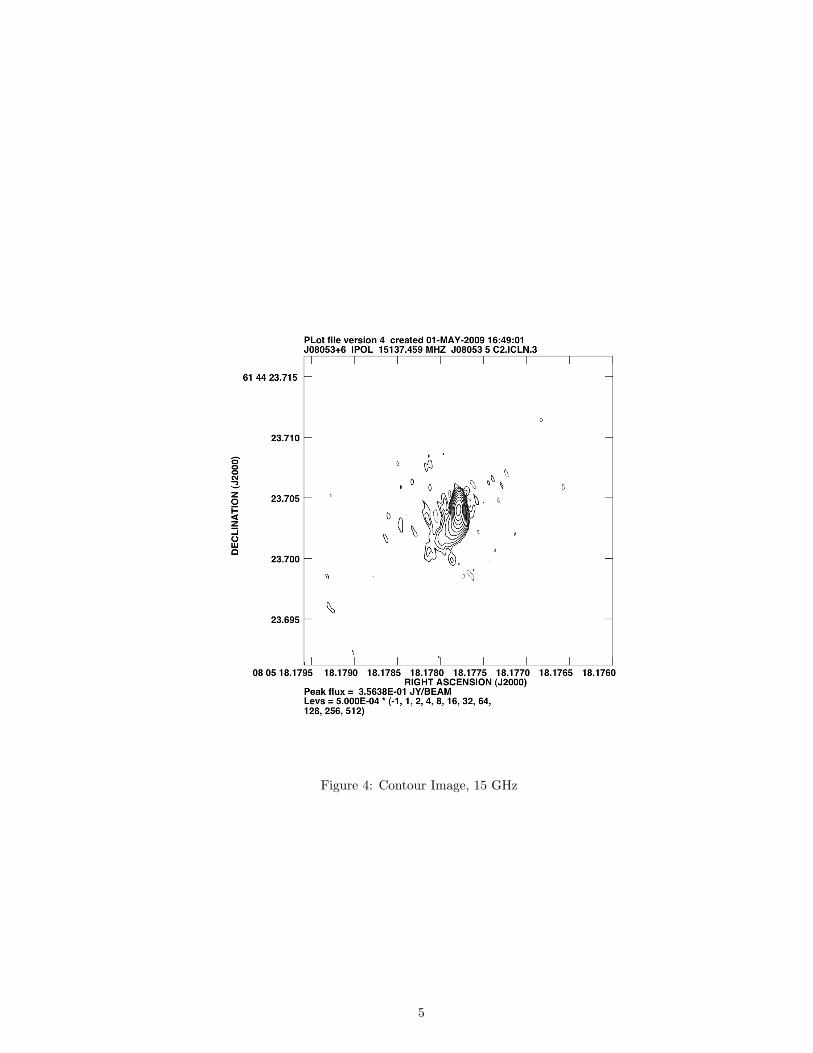
Figure 4: Contour Image, 15 GHz
5
4 Model Fitting
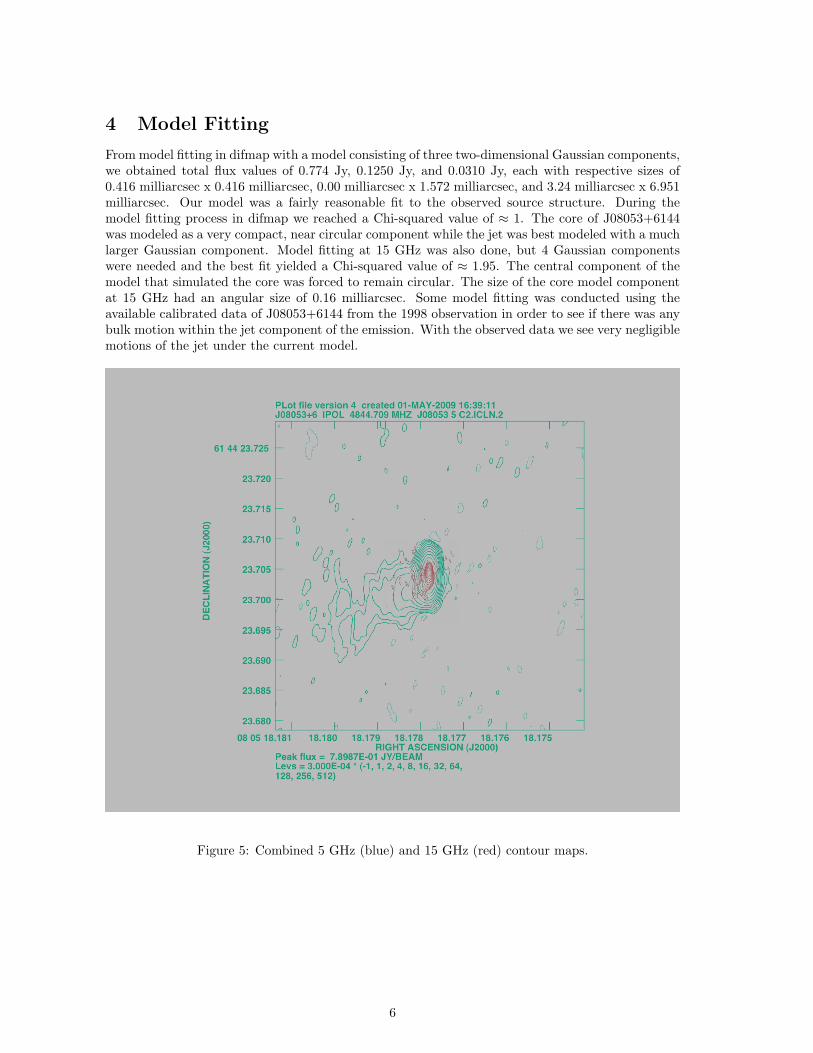
From model fitting in difmap with a model consisting of three two-dimensional Gaussian components,we obtained total flux values of 0.774 Jy, 0.1250 Jy, and 0.0310 Jy, each with respective sizes of0.416 milliarcsec x 0.416 milliarcsec, 0.00 milliarcsec x 1.572 milliarcsec, and 3.24 milliarcsec x 6.951milliarcsec. Our model was a fairly reasonable fit to the observed source structure. During themodel fitting process in difmap we reached a Chi-squared value of ≈ 1. The core of J08053+6144was modeled as a very compact, near circular component while the jet was best modeled with a muchlarger Gaussian component. Model fitting at 15 GHz was also done, but 4 Gaussian componentswere needed and the best fit yielded a Chi-squared value of ≈ 1.95. The central component of themodel that simulated the core was forced to remain circular. The size of the core model componentat 15 GHz had an angular size of 0.16 milliarcsec. Some model fitting was conducted using theavailable calibrated data of J08053+6144 from the 1998 observation in order to see if there was anybulk motion within the jet component of the emission. With the observed data we see very negligiblemotions of the jet under the current model.
Figure 5: Combined 5 GHz (blue) and 15 GHz (red) contour maps.
6
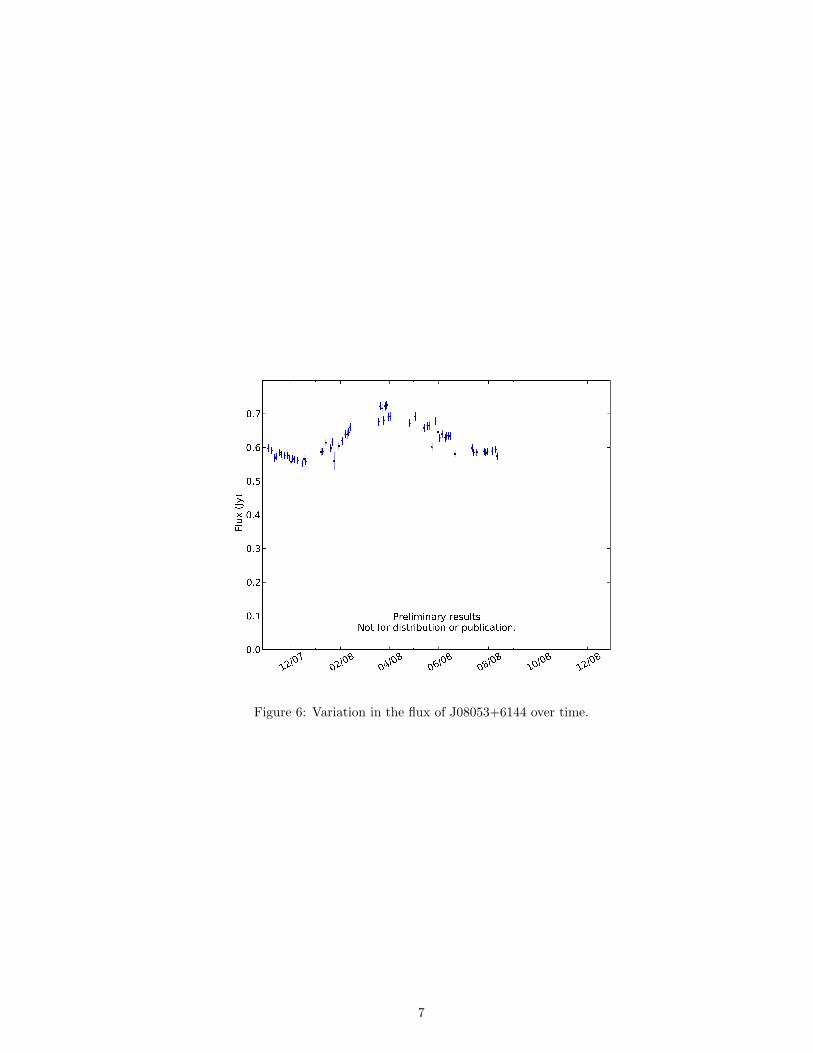
Figure 6: Variation in the flux of J08053+6144 over time.
7
5 Polarization
Polarization describes the orientation of the oscillations inherent in electric and magnetic fields, andis a fundamental property of sources of synchrotron radiation. Conventionally, polarization is labeledby specifying the direction of the electric field, which may be oriented in a single direction indicatinglinear polarization, or it may rotate as it propagates, exhibiting elliptical polarization. There existsan orthogonal state to each polarization, and incoherent light may contain many polarization states.To describe polarized light, the Stokes Parameters are identified using the perpendicular componentsof the electric field normal to the propagation direction,
Ex = ex(t) × cos(ωt+ δx) (1)
Ey = ey(t) × cos(ωt+ δy) (2)
With these, the common parameters are,
I = |e2x(t)|+ |e2y(t)| (3)
Q = |e2x(t)| − |e2y(t)| (4)
U = 2|ex(t)ey(t)cos(δx − δy)| (5)
V = 2|ex(t)ey(t)sin(δx − δy)| (6)
For telescopes such as the VLA, circular polarized feeds are used, and the Stokes parameters canbe described by,
I = RR + LLQ = RL + LR
U = i(LR - RL)V = LL - RR
From these parameters, the polarization angle and intensity can be determined from,
φ = 0.5 atan(U/Q) (7)
p =√Q2 + U2 (8)
8
VLBA IF 1, 2 VLBA IF 3, 4 VLA Dif 1,2 Dif 3,4
Source I Q U p φ I Q U p φ I p φ
J1310 920 -6.4 0.76 6.5 87◦ 912 -0.27 -1.2 1.23 -51◦ 1000 17 23◦ -64◦ 74◦
3C279 9300 134 24 136 5◦ 9300 82.3 -9.5 82.8 -3.29◦ 10200 150 116◦ -69◦ 119◦
J0854 1500 -4.2 2.78 5 73.2◦ 1500 -0.61 0.39 0.72 73.7◦ 1690 56.7 -78◦ -151.7◦ -151.7◦
Table 1: Polarization Calibrator Comparison
Corruption of the polarization signal can be due to the atmosphere, instrumental gain variations,and instrumental imperfections. To correct for this, astronomical calibration sources are chosen thatgenerally exhibit synchrotron emission with significant linear polarization and weak circular polar-ization. Calibration for the polarization was performed using difmap to create two Stokes I mapseach for the target source and three calibrator sources, J0854, 3C279, and J1310. For each source, amap was created for IF 1 and 2, and also for IF 3 and 4. Following this, a similar procedure of ’clean’and ’keep’ iterations for each source produced clean maps in Q and U for each IF pair. These Q andU maps were then read back into AIPS with IMLOD, and the IMEAN task derived the total flux inI, Q, and U for each IF pair. Utilizing the above equations for the calibrators’ polarization intensityand polarization angle, our results were compared with previous VLA observations to determine thedifference in polarization angle and select which calibrators would be most useful for applying toour target source.
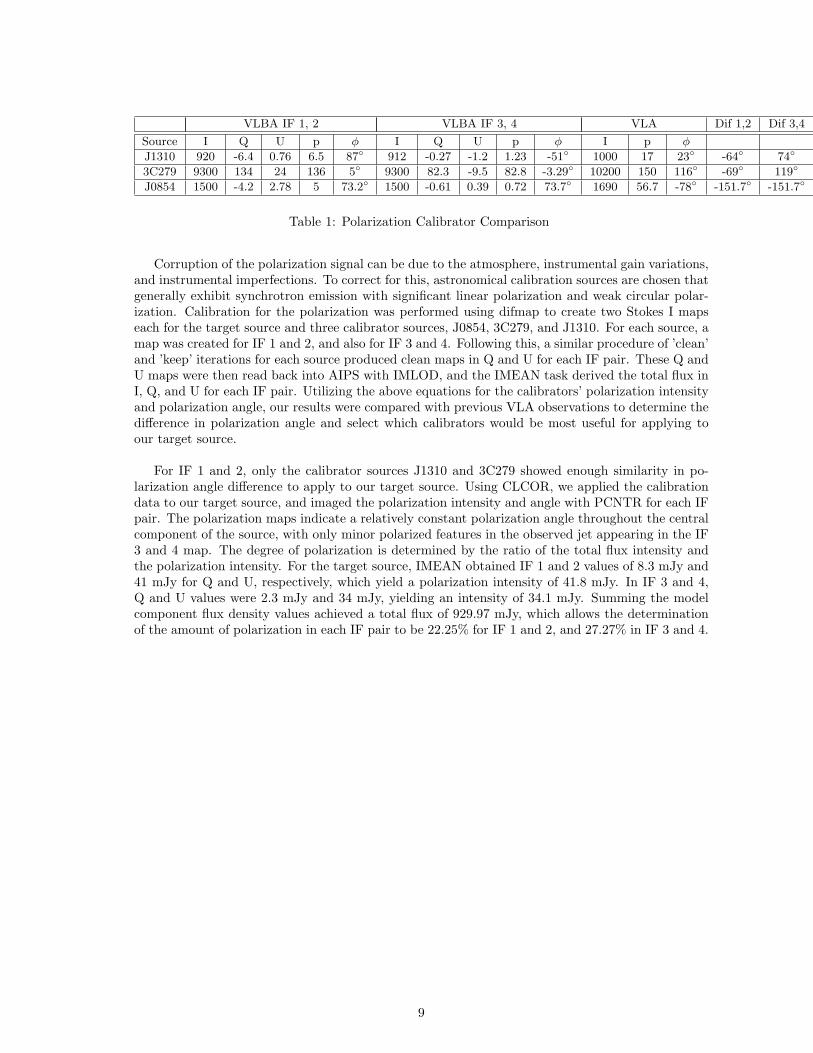
For IF 1 and 2, only the calibrator sources J1310 and 3C279 showed enough similarity in po-larization angle difference to apply to our target source. Using CLCOR, we applied the calibrationdata to our target source, and imaged the polarization intensity and angle with PCNTR for each IFpair. The polarization maps indicate a relatively constant polarization angle throughout the centralcomponent of the source, with only minor polarized features in the observed jet appearing in the IF3 and 4 map. The degree of polarization is determined by the ratio of the total flux intensity andthe polarization intensity. For the target source, IMEAN obtained IF 1 and 2 values of 8.3 mJy and41 mJy for Q and U, respectively, which yield a polarization intensity of 41.8 mJy. In IF 3 and 4,Q and U values were 2.3 mJy and 34 mJy, yielding an intensity of 34.1 mJy. Summing the modelcomponent flux density values achieved a total flux of 929.97 mJy, which allows the determinationof the amount of polarization in each IF pair to be 22.25% for IF 1 and 2, and 27.27% in IF 3 and 4.
9
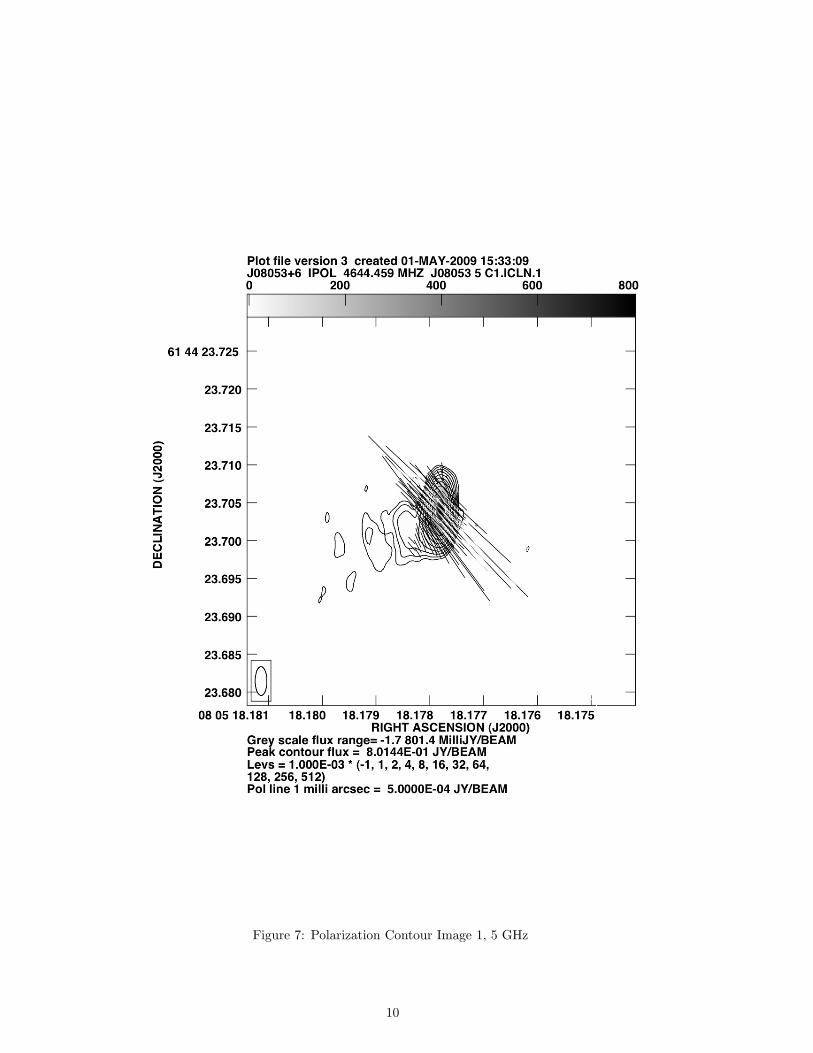
Figure 7: Polarization Contour Image 1, 5 GHz
10
Figure 8: Polarization Contour Image 2, 5 GHz
11
6 Results and Analysis
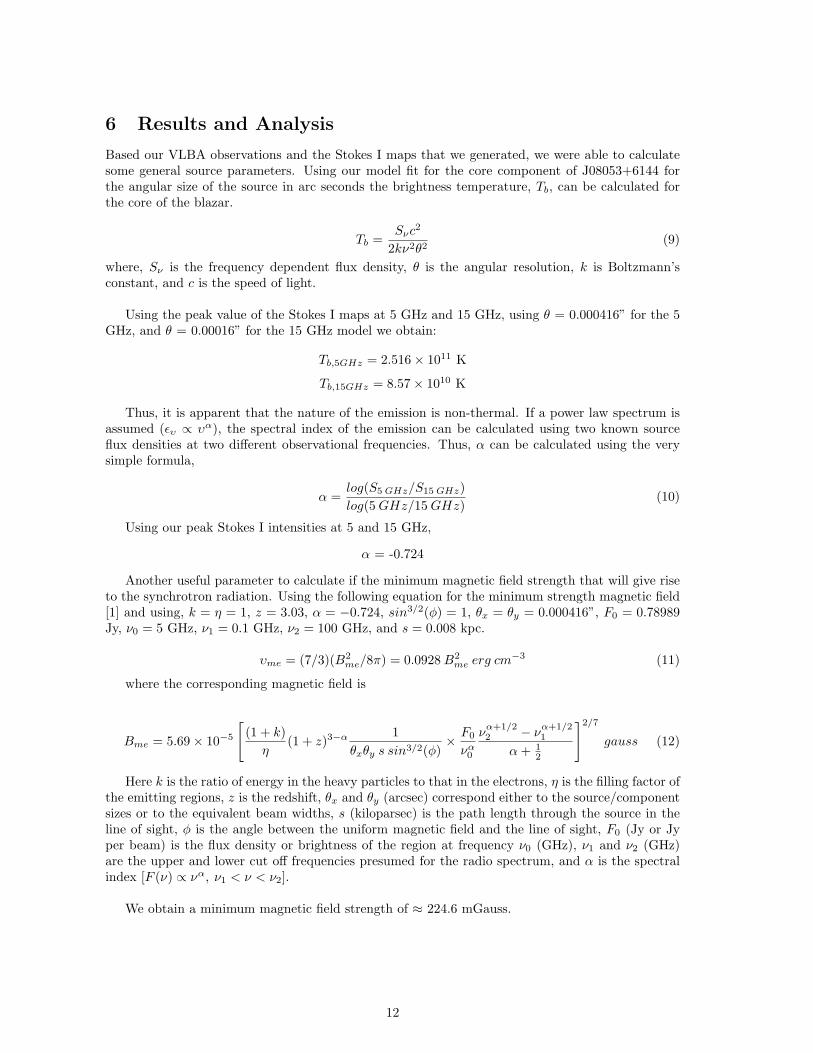
Based our VLBA observations and the Stokes I maps that we generated, we were able to calculatesome general source parameters. Using our model fit for the core component of J08053+6144 forthe angular size of the source in arc seconds the brightness temperature, Tb, can be calculated forthe core of the blazar.
Tb =Sνc
2
2kν2θ2(9)
where, Sν is the frequency dependent flux density, θ is the angular resolution, k is Boltzmann’sconstant, and c is the speed of light.
Using the peak value of the Stokes I maps at 5 GHz and 15 GHz, using θ = 0.000416” for the 5GHz, and θ = 0.00016” for the 15 GHz model we obtain:
Tb,5GHz = 2.516× 10¹¹ K
Tb,15GHz = 8.57× 10¹⁰ K
Thus, it is apparent that the nature of the emission is non-thermal. If a power law spectrum isassumed (ευ ∝ υα), the spectral index of the emission can be calculated using two known sourceflux densities at two different observational frequencies. Thus, α can be calculated using the verysimple formula,
α =log(S5GHz/S15GHz)log(5GHz/15GHz)
(10)
Using our peak Stokes I intensities at 5 and 15 GHz,
α = -0.724
Another useful parameter to calculate if the minimum magnetic field strength that will give riseto the synchrotron radiation. Using the following equation for the minimum strength magnetic field[1] and using, k = η = 1, z = 3.03, α = −0.724, sin3/2(φ) = 1, θx = θy = 0.000416”, F0 = 0.78989Jy, ν0 = 5 GHz, ν1 = 0.1 GHz, ν2 = 100 GHz, and s = 0.008 kpc.
υme = (7/3)(B2me/8π) = 0.0928B2
me erg cm−3 (11)
where the corresponding magnetic field is
Bme = 5.69× 10⁻⁵
[(1 + k)η
(1 + z)3−α1
θxθy s sin3/2(φ)× F0
να0
να+1/22 − να+1/2
1
α+ 12
]2/7
gauss (12)
Here k is the ratio of energy in the heavy particles to that in the electrons, η is the filling factor ofthe emitting regions, z is the redshift, θx and θy (arcsec) correspond either to the source/componentsizes or to the equivalent beam widths, s (kiloparsec) is the path length through the source in theline of sight, φ is the angle between the uniform magnetic field and the line of sight, F0 (Jy or Jyper beam) is the flux density or brightness of the region at frequency ν0 (GHz), ν1 and ν2 (GHz)are the upper and lower cut off frequencies presumed for the radio spectrum, and α is the spectralindex [F (ν) ∝ να, ν1 < ν < ν2].
We obtain a minimum magnetic field strength of ≈ 224.6 mGauss.
12
7 Relativisitic Beaming
Relativistic beaming is the process by which the relativistic effect modifies the apparent luminosityof a relativistic jet. Beaming occurs in AGN where a central supermassive black hole is the sourceof energy for the jets of intensely energetic plasma. Electrons inside the jet travel at speeds just atiny fraction below the speed of light and are whipped around by the magnetic field. Each change indirection by an electron is accompanied by the release of energy in the form of a photon (resultingin synchrotron emission). In the rest frame of the Earth, the radiation is approaching at speedswhich can be in the range of 95% to 98% of the speed of light, and because of Special Relativ-ity, the luminosity observed on Earth will be higher than the intrinsic luminosity measured in therest frame of the jet. This is especially true for Blazars, in which the jets are directed towards Earth.
In the simple jet model of a single homogeneous sphere the observed luminosity is related to theintrinsic luminosity by:
S0 = SeD3−α (13)
where, S0 is the observed luminosity; Se is the intrinsic luminosity (aka emitted luminosity); αis the spectral index; and D is the Doppler factor, which depends on the speed of the jet and theangle to the line of sight.
The beaming equation can be broken down into a series of three effects:
• Relativistic Abberation, which accounts for a change in luminosity of D2.
• Time Dilation, which accounts for a change in luminosity of D.
• Blue/Red Shifting, which changes the observed luminosity at a particular frequency and ac-counts for a change in luminosity of 1/Dα.
The Doppler factor is dependent on the Lorentz factor, γ, the relativistic beta, β = vj/c (wherevj is the speed of the jet, and θ (the jet’s angle to the observed line of sight on Earth) by:
D =1
γ(1− βcosθ)(14)
13
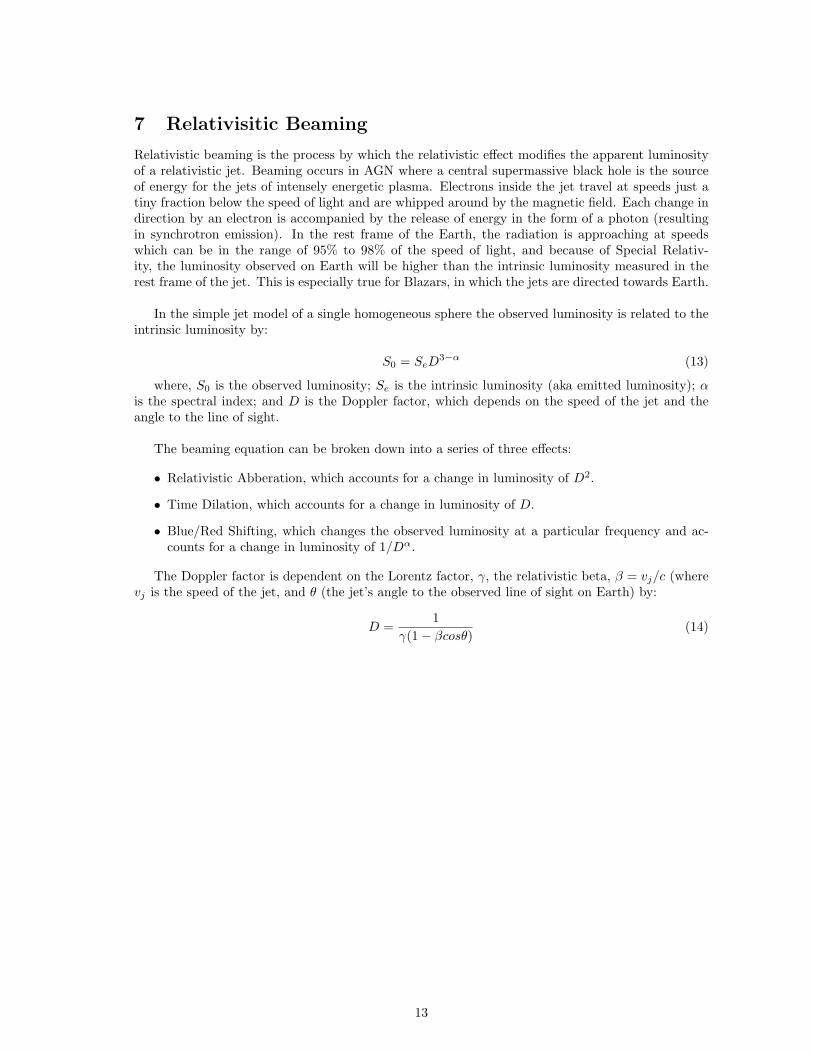
Since θ is relatively difficult to determine, we have plotted the Doppler factor for a range ofangles (figure 9), assuming γ = 5 (98% speed of light).
(a) Doppler factor as a function of jet angle (b) Ratio of observed to intrinsic luminosityfor a range of Doppler factors
Figure 9: Relativistic beaming effects for J08053+6144
Assuming the blazar J08053+6144 has a θ between 0◦ and 5◦, figure 9 (b) shows an increasein observed to intrinsic luminosity of between 2000 and 5000 times. These results are interestingbecause we get a huge amplification of the intrinsic luminosity from relativistic beaming for AGNwhich have their jets directed towards Earth. If the same source, J08053+6144, were actually nota Blazar and had jets at a 45◦ angle to Earth, the VLBA would not be sensitive enough to observethe emission.
To get the intrinsic luminosity of the jet, we use the measured flux, and our distance from thesource. If we assume the source is a sphere1, luminosity is related to flux by:
Flux =Luminosity
4πd2(15)
where d is the distance from the source to the observer (for J08053+6144, z = 3.033, d = 4.24 Gpc).
Using Flux = 0.774 Jy = 0.774 · 10−23erg · sec−1 · cm−2, we obtain an observed luminosity of1.75 · 10−3erg · sec−1. Using the results from relativistic beaming above, we can say the intrinsicluminosity of the source is roughly 5 · 10−7 · erg · sec−1.
1The blazar jet is certainly not a sphere, but for the simple purpose of illustrating the calculation for luminosity,we assume a spherical cow, or cat; whichever is prefered.
14
8 Faraday Rotation
Faraday rotation is a phenomenon by which the polarization angle of light rotates in the presenceof a magnetic field that has some component oriented parallel to the propagation direction of thelight. This effect was first discovered by Michael Faraday in 1845, and was essentially the firstexperimental evidence that light and electromagnetism are in fact related.
In astrophysics, Faraday rotation is induced by free electrons in the interstellar medium lyingbetween the Earth and any source we wish to observe. In such an environment, Faraday rota-tion is dependent on only three parameters; the wavelength of the light, the electron density, andthe component of the magnetic field that is oriented parallel to the propagation direction of the light.
We have the following relationship between the polarization angles:
Ψ = Ψ0 +RM λ2 (16)
where Ψ0 is the initial polarization angle and Ψ is the angle after rotation.
The Rotation Measure RM can be expressed in CGS units as:
RM =e3
∫ s0ηeB ds
2πm2c4(17)
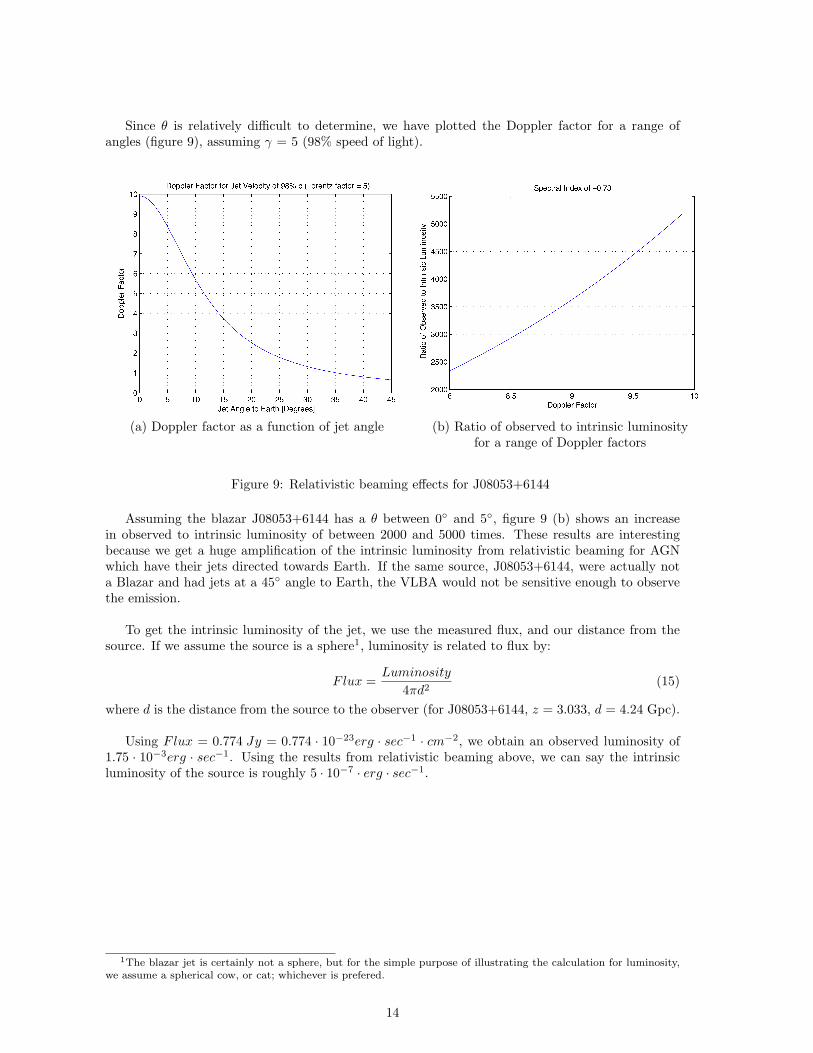
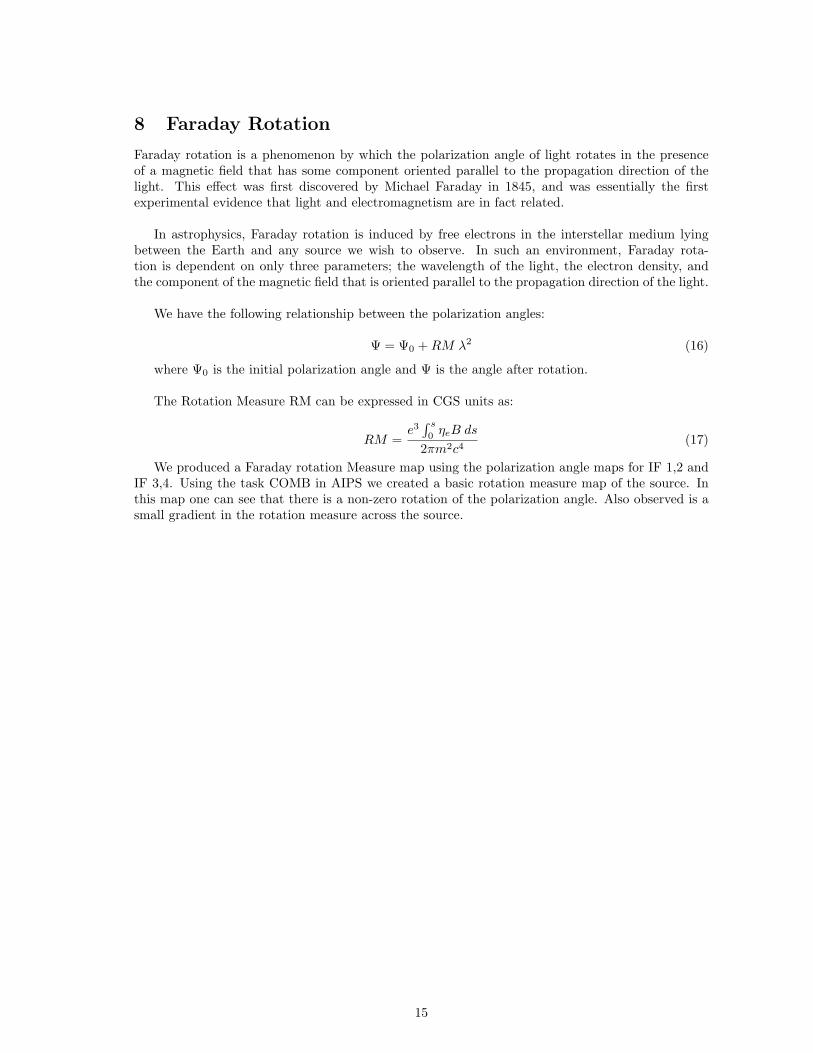
We produced a Faraday rotation Measure map using the polarization angle maps for IF 1,2 andIF 3,4. Using the task COMB in AIPS we created a basic rotation measure map of the source. Inthis map one can see that there is a non-zero rotation of the polarization angle. Also observed is asmall gradient in the rotation measure across the source.
15
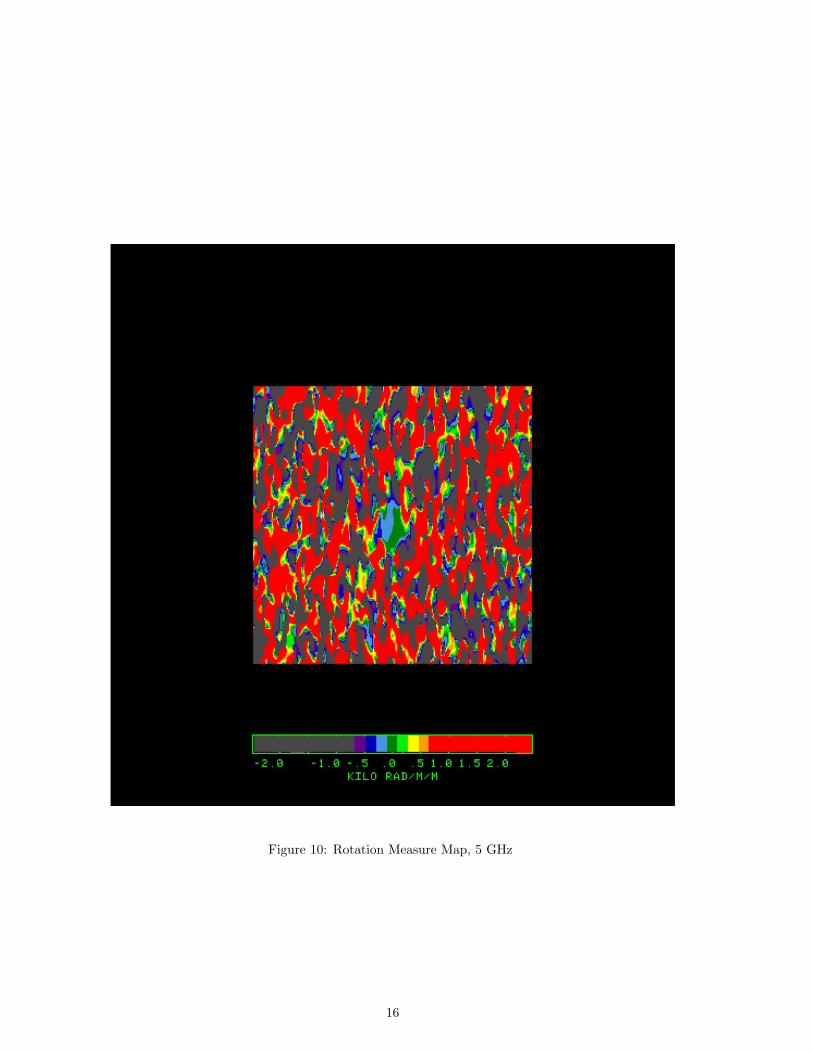
Figure 10: Rotation Measure Map, 5 GHz
16

9 Conclusion
The blazar J08053+6144 was imaged with VLBA at 5 GHz and 15 GHz. Calculations for flux density,brightness temperature, and polarization have been provided. Since blazars are highly variable radiosources, it might be of interest to observe this source over time to get a better understanding of thevariations in the jet’s luminosity. Some futher analysis of polarization might also yield interestingresults.
17
References
[1] Miley, G., The Structure of Extended Extragalactic Radio Sources, Ann. Rev. Astron. Astrophys.1980, 182-183.
[2] Taylor, G. B. et al. VIPS Observation of J08053+6144, 1998, http://www.phys.unm.edu/ gb-taylor/VIPS/vipsdat/J08053+6144.shtml.
[3] Meier, D. L., Simulations of Relativistic Jet Formation in Radio Sources, ASP, 2001.
[4] Mastichiadis, A. et al., Models of Variability in Blazar Jets, ASA, 2002.
[5] Sikora, M. et al., Blazars, American Institute of Physics, 2001.
[6] Bottcher, M., Modeling the Emission Processes in Blazars, Astrophysics and Space Science, 2006.
[7] Ghisellini, G. et al., The Blazar Sequence: A New Perspective, RAS, 2008.
[8] Daly, R. A., Inverse Compton Scattering and the Alignments Observed In High Redshift RadioGalaxies, APJ, 1992.
18