
Galileo infrared imaging spectrometry measurements at the Moon
14
JOURNAL OF GEOPHYSICAL RESEARCH, VOL. 99, NO. E3, PAGES 5587-5600, MARCH 25, 1994 Galileo infrared imaging spectrometry measurements at the Moon Thomas B. McCord, •'2 Larry A. Soderblom, • Robert W. Carlson, 4Fraser P. Fanale, Rosaly Lopes-Gautier, 4Adriana C. Ocampo, 4Jennifer Forsythe, 2Bruce Campbell, s James C. Granahan, • W. D. Smythe, 4P. R. Weissman, 4K. J.Becker, 3K. Edwards Lucas Kamp, 4Juliana Lo, 2R. Mehlman, 6J. Torson, 3G. E. Danielson, 7 D. L. Matson, 4 H. H. Kieffer, 3 and T. V. Johnson 4 Abstract.Imaging spectrometer observations were made of the surface of the Moon during the December 1990 flyby of the Earth-Moon system by the Galileo spacecraft. This article documents this data set and presents analyses of some of the data. Thenear infrared mapping spectrometer (NIMS) investigation obtained 17separate mosaics of the Moon in 408 spectral channels between about 0.7 and 5.2 gm.Theinstrument was originally designed to operate in orbit about Jupiter and therefore saturates atmany spectral channels formost measurement situations at 1 AU. However, sufficient measurements weremade of the Moon to verify theproper operation of theinstrument and todemonstrate itscapabilities. Analysis of these data show that the NIMS worked as expected and produced measurements consistent with previous ground-based telescopic studies. These are the first imaging spectrometer measurements of this type from space forthe Moon, and they illustrate several major points conceming this type of observation and about the NIMS capabilities specifically. Of major importance are the difference between framing and scanning instruments and the effects of the spacecraft and the scan platform on the performance of such an experiment. The science return of subsequent NIMS and other investigation measurements will besignificantly enhanced by theexperience and results gained. Introduction The Galileo spacecraft flew past the Earth-Moon system on December 8, 1990,in order to obtain a gravityassist and enable it to reach Jupiterorbit in 1995. This was not the initially planned trajectory, but the dramatic changes in the launch schedule, due to the Shuttle Challenger disaster, required that a new trajectory be adopted aftermost subsystems and instruments were built. The first scientifically interesting eventalong the new trajectory after launch was the encounter with Venus in February 1990. The near infrared mapping spectrometer (NIMS) results from the Venus encounter were presented previously [Carlson et al., 1991]. The spacecraft flew past the asteroid Gaspra in August1991 and again encountered the Earth-Moonsystem on December 7-8, 1992. An important andunique datasetwasproduced in the December 1990 Moon encounter, which is documented in this article. The results of the analysis of some of thesefirst Earth-Moon encounter data are also presented. Because the encounter was not part of the planned baseline mission, the capabilities of the spacecraft and instruments were not fully implemented, tested, and calibrated at the time of the encounter; but the performance of some subsystemswill be improved for later encounters. For example, of specific interest is the pointing stability of the spacecraft scan platform, which was not yet fully up to the expectedcapability, and thus the pointing direction of the NIMS, located on the scanplatform,jittered unexpectedly by several pixels while measurements were beingmade. Also of importance is the factor of 5 differencein distance from the Sun betweenthe plannedoperating environment near Jupiter and at the Moon. Thus, the brightness of the Moon was about 1Planetary Geosciences Division, School of Ocean and Earth Science 25 times greater than thatfor which the instrument was and T•hnology, University ofHawaii, Honolulu. designed. This ledto saturation of some of the detectors during 2SETS T•hnology, Incorporated, Mililani, Hawaii. some of the Moon measurements, a condition which was 3U.S. Geological Survey, Flagstaff, Arizona. anticipated when the measurements were planned after 4jet Propulsion Laboratory, Pasadena, California. instrument delivery tothe spacecraft, but about which nothing 5Center for Earth and Planetary Studies, National Air and Space could be done. Museum,Washington, D.C. q_nstitute ofGeophysics and Planetary Physics, University ofCalifor- nia, Los Angeles. 7Division of Geology and Planetary Sciences, California Institute of T•hnology, Pasadena. Copyright 1994 by the American Geophysical Union. Paper number 93JE03434. 0148-0227/94/94JE-03434505.00 The Instrument The NIMS [Carlson et al., 1992] is the first of several imaging spectrometers planned for NASA deep space and Earth-looking missions. It is basically a "whisk broom" imaging spectrometer (see Figure 1) covering the spectral range 0.7-5.2 gm with up to 408 adjacent and partially overlapping spectralchannels. An internal mirror is used to 5587
-
Upload
independent -
Category
Documents
-
view
0 -
download
0
Transcript of Galileo infrared imaging spectrometry measurements at the Moon

JOURNAL OF GEOPHYSICAL RESEARCH, VOL. 99, NO. E3, PAGES 5587-5600, MARCH 25, 1994
Galileo infrared imaging spectrometry measurements at the Moon
Thomas B. McCord, •'2 Larry A. Soderblom, • Robert W. Carlson, 4 Fraser P. Fanale, Rosaly Lopes-Gautier, 4 Adriana C. Ocampo, 4 Jennifer Forsythe, 2 Bruce Campbell, s James C. Granahan, • W. D. Smythe, 4 P. R. Weissman, 4 K. J. Becker, 3 K. Edwards Lucas Kamp, 4 Juliana Lo, 2 R. Mehlman, 6 J. Torson, 3 G. E. Danielson, 7 D. L. Matson, 4 H. H. Kieffer, 3 and T. V. Johnson 4
Abstract. Imaging spectrometer observations were made of the surface of the Moon during the December 1990 flyby of the Earth-Moon system by the Galileo spacecraft. This article documents this data set and presents analyses of some of the data. The near infrared mapping spectrometer (NIMS) investigation obtained 17 separate mosaics of the Moon in 408 spectral channels between about 0.7 and 5.2 gm. The instrument was originally designed to operate in orbit about Jupiter and therefore saturates at many spectral channels for most measurement situations at 1 AU. However, sufficient measurements were made of the Moon to verify the proper operation of the instrument and to demonstrate its capabilities. Analysis of these data show that the NIMS worked as expected and produced measurements consistent with previous ground-based telescopic studies. These are the first imaging spectrometer measurements of this type from space for the Moon, and they illustrate several major points conceming this type of observation and about the NIMS capabilities specifically. Of major importance are the difference between framing and scanning instruments and the effects of the spacecraft and the scan platform on the performance of such an experiment. The science return of subsequent NIMS and other investigation measurements will be significantly enhanced by the experience and results gained.
Introduction
The Galileo spacecraft flew past the Earth-Moon system on December 8, 1990, in order to obtain a gravity assist and enable it to reach Jupiter orbit in 1995. This was not the initially planned trajectory, but the dramatic changes in the launch schedule, due to the Shuttle Challenger disaster, required that a new trajectory be adopted after most subsystems and instruments were built. The first scientifically interesting event along the new trajectory after launch was the encounter with Venus in February 1990. The near infrared mapping spectrometer (NIMS) results from the Venus encounter were presented previously [Carlson et al., 1991]. The spacecraft flew past the asteroid Gaspra in August 1991 and again encountered the Earth-Moon system on December 7-8, 1992.
An important and unique data set was produced in the December 1990 Moon encounter, which is documented in this article.
The results of the analysis of some of these first Earth-Moon encounter data are also presented.
Because the encounter was not part of the planned baseline mission, the capabilities of the spacecraft and instruments were not fully implemented, tested, and calibrated at the time of the encounter; but the performance of some subsystems will be improved for later encounters. For example, of specific interest is the pointing stability of the spacecraft scan platform, which was not yet fully up to the expected capability, and thus the pointing direction of the NIMS, located on the scan platform, jittered unexpectedly by several pixels while measurements were being made. Also of importance is the factor of 5 difference in distance from the Sun between the planned operating environment near Jupiter and at the Moon. Thus, the brightness of the Moon was about
1Planetary Geosciences Division, School of Ocean and Earth Science 25 times greater than that for which the instrument was and T•hnology, University of Hawaii, Honolulu. designed. This led to saturation of some of the detectors during
2SETS T•hnology, Incorporated, Mililani, Hawaii. some of the Moon measurements, a condition which was 3U.S. Geological Survey, Flagstaff, Arizona. anticipated when the measurements were planned after 4jet Propulsion Laboratory, Pasadena, California. instrument delivery to the spacecraft, but about which nothing 5Center for Earth and Planetary Studies, National Air and Space could be done.
Museum, Washington, D.C. q_nstitute of Geophysics and Planetary Physics, University of Califor-
nia, Los Angeles. 7Division of Geology and Planetary Sciences, California Institute of
T•hnology, Pasadena.
Copyright 1994 by the American Geophysical Union.
Paper number 93JE03434. 0148-0227/94/94JE-03434505.00
The Instrument
The NIMS [Carlson et al., 1992] is the first of several imaging spectrometers planned for NASA deep space and Earth-looking missions. It is basically a "whisk broom" imaging spectrometer (see Figure 1) covering the spectral range 0.7-5.2 gm with up to 408 adjacent and partially overlapping spectral channels. An internal mirror is used to
5587
5588 MCCORD ET AL.: GALILEO IR IMAGING SPECTROMETRY MEASUREMENTS
GRATING MOTION
GRATI
SPECTROMETER
DETECTORS
RADIATIVE
COOLER
SECONDA MIRROR MOTION
CHOPPER
DIRECTION
CHOPPER
TELESCOPE
SCAN PLATFORM
MOTION
i!
PIX 1 ' •
, PIX 20
SECONDARY • MIRROR "'
iNSTRUMENT SCANNING PLANE
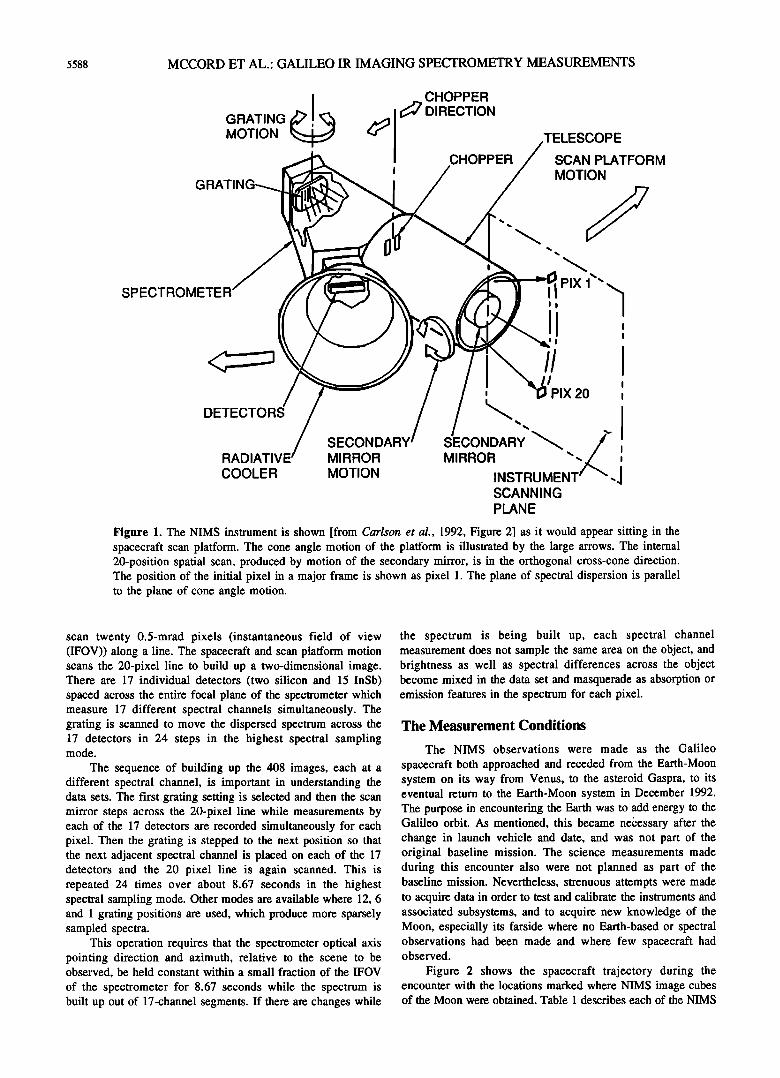
Figure 1. The NIMS instrument is shown [from Carlson et al., 1992, Figure 2] as it would appear sitting in the spacecraft scan platform. The cone angle motion of the platform is illustrated by the large arrows. The internal 20-position spatial scan, produced by motion of the secondary mirror, is in the orthogonal cross-cone direction. The position of the initial pixel in a major frame is shown as pixel 1. The plane of spectral dispersion is parallel to the plane of cone angle motion.
scan twenty 0.5-mrad pixels (instantaneous field of view (IFOV)) along a line. The spacecraft and scan platform motion scans the 20-pixel line to build up a two-dimensional image. There are 17 individual detectors (two silicon and 15 InSb) spaced across the entire focal plane of the spectrometer which measure 17 different spectral channels simultaneously. The grating is scanned to move the dispersed spectrum across the 17 detectors in 24 steps in the highest spectral sampling mode.
The sequence of building up the 408 images, each at a different spectral channel, is important in understanding the data sets. The first grating setting is selected and then the scan mirror steps across the 20-pixel line while measurements by each of the 17 detectors are recorded simultaneously for each pixel. Then the grating is stepped to the next position so that the next adjacent spectral channel is placed on each of the 17 detectors and the 20 pixel line is again scanned. This is repeated 24 times over about 8.67 seconds in the highest spectral sampling mode. Other modes are available where 12, 6 and 1 grating positions are used, which produce more sparsely sampled spectra.
This operation requires that the spectrometer optical axis pointing direction and azimuth, relative to the scene to be observed, be held constant within a small fraction of the IFOV
of the spectrometer for 8.67 seconds while the spectrum is built up out of 17-channel segments. If there are changes while
the spectrum is being built up, each spectral channel measurement does not sample the same area on the object, and brightness as well as spectral differences across the object become mixed in the data set and masquerade as absorption or emission features in the spectrum for each pixel.
The Measurement Conditions
The NIMS observations were made as the Galileo
spacecraft both approached and receded from the Earth-Moon system on its way from Venus, to the asteroid Gaspra, to its eventual return to the Earth-Moon system in December 1992. The purpose in encountering the Earth was to add energy to the Galileo orbit. As mentioned, this became necessary after the change in launch vehicle and date, and was not part of the original baseline mission. The science measurements made during this encounter also were not planned as part of the baseline mission. Nevertheless, strenuous attempts were made to acquire data in order to test and calibrate the instruments and associated subsystems, and to acquire new knowledge of the Moon, especially its farside where no Earth-based or spectral observations had been made and where few spacecraft had observed.
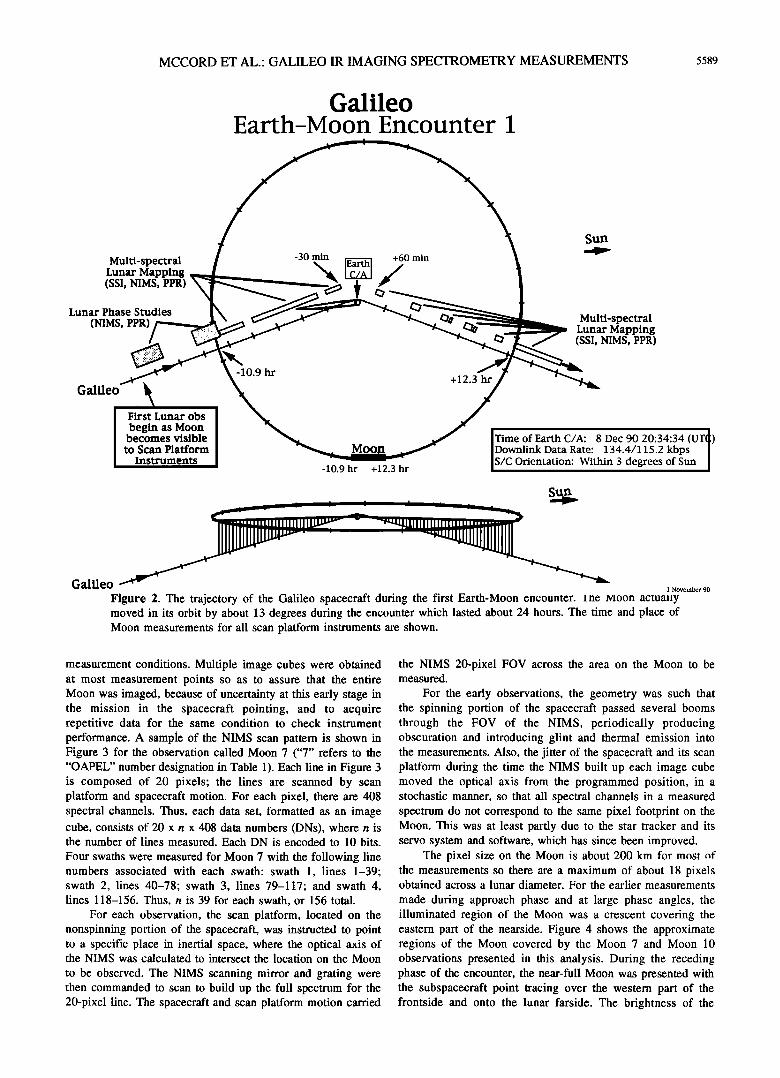
Figure 2 shows the spacecraft trajectory during the encounter with the locations marked where NIMS image cubes of the Moon were obtained. Table 1 describes each of the NIMS
MCCORD ET AL.: GALILEO IR IMAGING SPECTROMETRY MEASUREMENTS 5589
Galileo Earth-Moon Encounter 1
Multi-spectral Lunar Mapping (SSI, NIMS, PPR)
Lunar Phase Studies
(NIMS, PPR)
-30 min +60 min
Sun
Multi-spectral Lunar Mapping (SSI, NIMS, PPR)
Galileo
First Lunar obs
begin as Moon becomes visible to Scan Platform
Instruments
-10.9 hr
-10.9 hr +12.3 hr
+12.3 hr
Time of Earth C/A: 8 Dec 90 20:34:34 (ur]) Downlink Data Rate: 134.4/115.2 kbps S/C Orientation: Within 3 degrees of Sun
Sun
Galileo - 1 November 90
Figure 2. The trajectory of the Galileo spacecraft during the first Earth-Moon encounter. inc •vloon actuany moved in its orbit by about 13 degrees during the encounter which lasted about 24 hours. The time and place of Moon measurements for all scan platform instruments are shown.
measurement conditions. Multiple image cubes were obtained at most measurement points so as to assure that the entire Moon was imaged, because of uncertainty at this early stage in the mission in the spacecraft pointing, and to acquire repetitive data for the same condition to check instrument performance. A sample of the NIMS scan pattern is shown in Figure 3 for the observation called Moon 7 ("7" refers to the "OAPEL" number designation in Table 1). Each line in Figure 3 is composed of 20 pixels; the lines are scanned by scan platform and spacecraft motion. For each pixel, there are 408 spectral channels. Thus, each data set, formatted as an image cube, consists of 20 x n x 408 data numbers (DNs), where n is the number of lines measured. Each DN is encoded to 10 bits.
Four swaths were measured for Moon 7 with the following line numbers associated with each swath: swath 1, lines 1-39; swath 2, lines 40-78; swath 3, lines 79-117; and swath 4, lines 118-156. Thus, n is 39 for each swath, or 156 total.
For each observation, the scan plattbrm, located on the nonspinning portion of the spacecraft, was instructed to point to a specific place in inertial space, where the optical axis of the NIMS was calculated to intersect the location on the Moon
to be observed. The NIMS scanning mirror and grating were then commanded to scan to build up the full spectrum tbr the 20-pixel line. The spacecraft and scan platform motion carried
the NIMS 20-pixel FOV across the area on the Moon to be measured.
For the early observations, the geometry was such that the spinning portion of the spacecraft passed several booms through the FOV of the NIMS, periodically producing obscuration and introducing glint and thermal emission into the measurements. Also, the jitter of the spacecraft and its scan platform during the time the NIMS built up each image cube moved the optical axis from the programmed position, in a stochastic manner, so that all spectral channels in a measured spectrum do not correspond to the same pixel footprint on the Moon. This was at least partly due to the star tracker and its servo system and software, which has since been improved.
The pixel size on the Moon is about 200 km for most of the measurements so there are a maximum of about 18 pixels obtained across a lunar diameter. For the earlier measurements
made during approach phase and at large phase angles, the illuminated region of the Moon was a crescent covering the eastern part of the nearside. Figure 4 shows the approximate regions of the Moon covered by the Moon 7 and Moon 10 observations presented in this analysis. During the receding phase of the encounter, the near-full Moon was presented with the subspacecraft point tracing over the western part of the frontside and onto the lunar farside. The brightness of the

5590 MCCORD ET AL.' GALILEO IR IMAGING SPECTROMETRY MEASUREMENTS
o
o
o
o o
o --4- -.t' • ch (xl •4D 0

MCCORD ET AL.: GALILEO IR IMAGING SPECTROMETRY MEASUREMENTS 5591
i I
Figure 3. The NIMS scan pattern for lunar observation Moon 7 is shown superimposed over the predicted Moon position. Four swaths are apparent. Each swath has 39 lines with 20 pixels per line. The lines are numbered from 1 to 156.
Moon became so great as full Moon and smaller phase angles were approached that most NIMS detectors were saturated and no useful measurements could be obtained.
Data Reduction
The Galileo NIMS Moon data for the first Earth-Moon
encounter were processed to prepare image cubes from which spectra of individual areas could be extracted and maps of spectral properties could be prepared. All data were first reformatted after receipt on the ground and then an attempt was made to assign each DN to a specific position in inertial space. When the geometric reconstruction was first applied, it was quickly noted that the images and spectra showed large excursions from the expected products. After further investigation and analysis of the spacecraft inertial guidance system records, it became apparent that the spacecraft and scan platform had made rapid and random excursions of several NIMS IFOVs or pixels in amplitude during the 8.67 seconds required to build up an image cube. This caused many 17- detector spectral segments, which were each measured simultaneously for a pixel, to be displaced spatially from the intended location in inertial space by up to several pixels. Thus, the spectrum extracted from the resulting image cube for a particular pixel showed large amplitude excursions from the expected smooth lunar spectrum. The excursions in the spectrum amplitude are the result of the slit of the spectrometer moving quasi-randomly across albedo features and photometric function gradients on the Moon while the spectrum was being recorded, and they masquerade as spectral features.
Considerable study was required by the NIMS team and by the spacecraft operators in order to understand the unexpected scan platform motion. A major part of the problem was traced to the star tracker servo loop and its software. This became

5592 MCCORD ET AL.: GALILEO IR IMAGING SPECTROMETRY MEASUREMENTS
Figure 4. Predicted Moon position and approximate illumination for NIMS lunar observations (a) Moon 7 and (b) Moon 10. The shaded regions indicate where the Moon is not illuminated.
clear when studying a Moon data set recorded when the star tracker was turned off. The star tracker problem was the result of a mis-alignment and a lack of having installed some necessary control software since it was not scheduled to be available until later in the mission and therefore was not
provided any funding early enough to support the unplanned Earth-Moon encounter measurements.
A method was developed to attempt to correct for the spacecraft motion. This involved placing each 17-detector spectrum segment onto an inertial space grid using the record from the inertial guidance system located on the scan platform of the Galileo spacecraft. One shortcoming of this record is that the frequency of the position sampling is lower than some of the motions. Several methods were attempted to perform the spatial position correction and image cube data set reconstruction which differed in the method used to combine
the 17-detector spectral segments into a full 41}8-element spectrum for a particular location in inertial space.
One method resulted in an image cube in which 64 micropixels were created for each NIMS pixel. Then the center of each 17-detector spectrum segment was assigned a position at one of these micropixels. There were, of course, many micropixels for which there were missing 17-detector segments of the complete spectrum; thus, this new image cube is called a sparse cube. To extract a spectrum from this cube, a footprint or pixel size is selected and then all spectrum segments with spatial position centers falling within this footprint are averaged together into a complete spectrum. Each spectrum segment included in the extracted spectrum samples the optical properties of the region of space covered by one NIMS resolution element. The element is centered on a sparse cube location within the footprint chosen for extraction and its area may be entirely within the footprint or may extend outside the area of the footprint by up to half a NIMS resolution element. No measurement of an extraneous area
should be included but there may be spectral segments missing. In addition, the spatial sampling is not uniform
across the footprint, for each spectrum segment covers a slightly different area. Thus, the spectral character of the footprint is not truly represented in the retrieved spectrum and is affected by variations in the spectrum and brightness across the footprint and nearby areas.
A second spatial offset is introduced by a slight asymmetry in the way the NIMS spatial scanning mirror
_
moves. The mirror scan is boustrophedonic, that is, the first 20-pixel line is scanned in one direction and the next is scanned back in the opposite direction. The scans are slightly offset by up to a quarter of a pixel, apparently due to effects encountered during launch. Corrections have not been made for this effect because it is not yet properly calibrated. The accuracy of the geometric corrections overall is estimated to be about half a NIMS pixel.
Figure 3 showed four swaths making up the Moon 7 observation. For each observation, it was necessary to place each 20-pixel by n-pixel spatial swath measurement from the inertial space reference system onto the Moon and create a mosaic of NIMS swaths to depict the entire Moon. This was done by using the spacecraft scan platform position information and by fitting the data to the Moon limb. This step is therefore subject to any error in scan platform position.
The second method of making the spatial correction is similar but the resulting spectral segments are immediately averaged into a cube with square NIMS resolution pixels. All segments whose center falls within this footprint are averaged. The NIMS resolution was approximately 200 km for the Moon 7 data set and 175 km for the Moon 10 data set. This resulting cube was therefore less than 20 x 20 pixels in size and was called a condensed cube. This second cube was analyzed along with the sparse cube to obtain a measure of the accuracy of the spatial corrections.
The spatially reconstructed and resampled image cubes were then corrected for the signal offset from zero caused by detector thermal signal and other fixed offsets. This offset remained very stable in the original data at about 27 DNs,
MCCORD ET AL.: GALILEO IR IMAGING SPECTROMETRY MEASUREMENTS 5593
Ill
• • • • m '' '• :•'• IIt• "
.
.•.:•:..• ...
Figure 5. Two forms of the image at 0.7 gm derived
.•.
.i';.::.:• :::::-:::•:'i:'.?..-'::::j• i.- ":':•'::•'•.•:"?,i .......
• :• . :::•?::•. •.•:• ..::
?' • :-:;•:-------• .....•...•:•:;-•(•:• ................ . .....: :.::.•:: -
'L L •½•::•:.•.• .... :.. .........
:..•,.:...•:.. •:•.':::'•'•:...•4• :.:•.::.:
::,•::• ..... . .....
.............. ...: ..: ...................... :.: ...... ..... .............. . ::.:....:.:...• .:.:.:,......• ..... ...: ............... ::.....:.a ......... •.:.. .................... ..:: ....................... .:.......• .................. : .................. ..:.:. .......... ....: ........................... - •
from the Moon 10 obse•ation after treatment with a
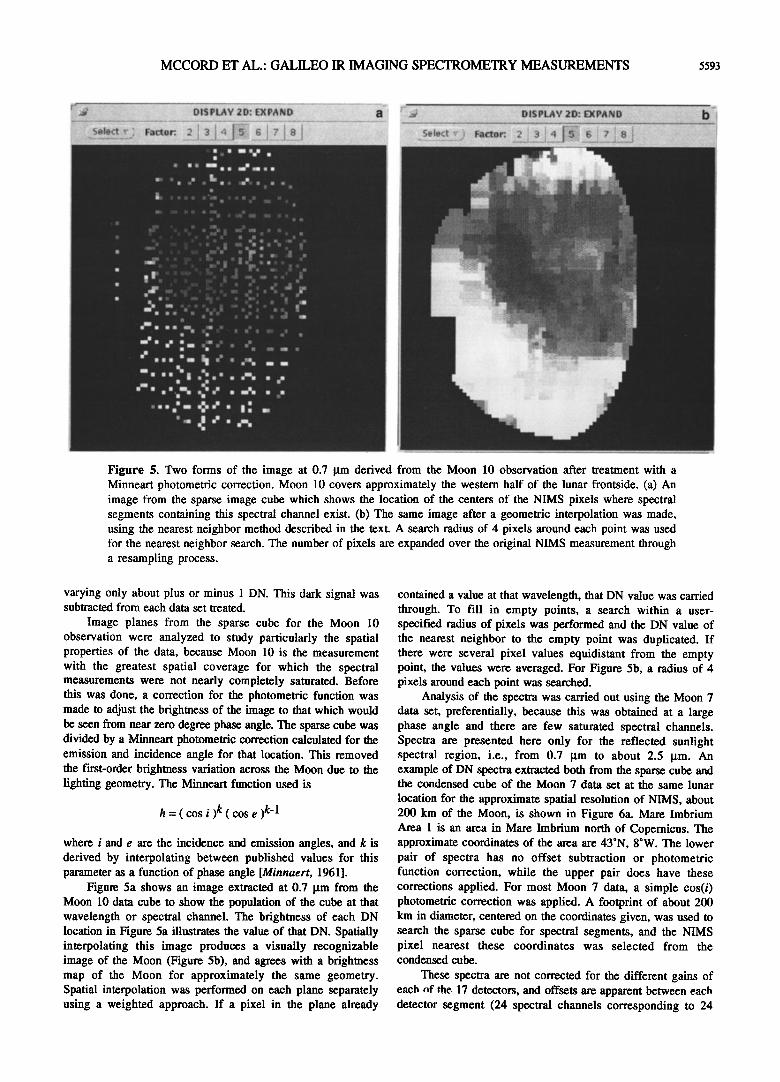
Minneart photometric correction. Moon 10 covers approximately the western half of the lunar frontside. (a) An image from the sparse image cube which shows the location of the centers of the NIMS pixels where spectral segments containing this spectral channel exist. (b) The same image after a geometric interpolation was made, using the nearest neighbor method described in the text. A search radius of 4 pixels around each point was used for the nearest neighbor search. The number of pixels are expanded over the original NIMS measurement through a resampling process.
varying only about plus or minus 1 DN. This dark signal was subtracted from each data set treated.
Image planes from the sparse cube for the Moon 10 observation were analyzed to study particularly the spatial properties of the data, because Moon 10 is the measurement with the greatest spatial coverage for which the spectral measurements were not nearly completely saturated. Before this was done, a correction for the photometric function was made to adjust the brightness of the image to that which would be seen from near zero degree phase angle. The sparse cube was divided by a Minneart photometric correction calculated for the emission and incidence angle for that location. This removed the first-order brightness variation across the Moon due to the lighting geometry. The Minneart function used is
h = ( cos i )k ( cos e )k-1
where i and e are the incidence and emission angles, and k is derived by interpolating between published values for this parameter as a function of phase angle [Minnaert, 1961].
Figure 5a shows an image extracted at 0.7 gm from the Moon 10 data cube to show the population of the cube at that wavelength or spectral channel. The brightness of each DN location in Figure 5a illustrates the value of that DN. Spatially interpolating this image produces a visually recognizable image of the Moon (Figure 5b), and agrees with a brightness map of the Moon for approximately the same geometry. Spatial interpolation was performed on each plane separately using a weighted approach. If a pixel in the plane already
contained a value at that wavelength, that DN value was carded through. To fill in empty points, a search within a user- specified radius of pixels was performed and the DN value of the nearest neighbor to the empty point was duplicated. If there were several pixel values equidistant from the empty point, the values were averaged. For Figure 5b, a radius of 4 pixels around each point was searched.
Analysis of the spectra was carried out using the Moon 7 data set, preferentially, because this was obtained at a large phase angle and there are few saturated spectral channels. Spectra are presented here only for the reflected sunlight spectral region, i.e., from 0.7 gm to about 2.5 gm. An example of DN spectra extracted both from the sparse cube and the condensed cube of the Moon 7 data set at the same lunar
location for the approximate spatial resolution of NIMS, about 200 km of the Moon, is shown in Figure 6a. Mare Imbrium Area 1 is an area in Mare Imbrium north of Copernicus. The approximate coordinates of the area are 43øN, 8øW. The lower pair of spectra has no offset subtraction or photometric function correction, while the upper pair does have these corrections applied. For most Moon 7 data, a simple cos(i) photometric correction was applied. A footprint of about 200 km in diameter, centered on the coordinates given, was used to search the sparse cube for spectral segments, and the NIMS pixel nearest these coordinates was selected from the condensed cube.
These spectra are not corrected for the different gains of each of the 17 detectors, and offsets are apparent between each detector segment (24 spectral channels corresponding to 24

5594 MCCORD ET AL.: GALILEO IR IMAGING SPECTROMETRY MEASUREMENTS
Mare Imbrium Area 1- Raw (lower) & Photo-Corrected (upper) Data
sp_raw sp_pho ......... cn_raw ......... cn_pho
4000
3OOO
2OOO
1000
0.5 I 1.5 2 2.5 3
Wavelength (l•m)
Figure 6a. Data number spectra from the Moon 7 data set for an area called Mare Imbrium Area 1 [43øN, 8øW], a maria region. The lower two spectra axe "raw" data from the NIMS; the solid line is extracted from the sparse image cube, and the dashed line is extracted from the condensed image cube, as described in the text. The upper set of spectra is the result after subtracting the offset and applying a cosine photometric function to approximate the brightness which would have been recorded if the lunar area was observed near zero phase angle. Note that the plotted line connects each detector and that at each detector barrier there is some overlap in wavelength. Eight detectors are shown with 24 points per detector.
grating steps). Note also that there is an approximately two spectral channel overlap between detectors (for this highest spectral sampling mode), so that the ending spectral channels for each detector are approximately the same as the beginning spectral channels of the next detector. This produces a double- valued spectrum at these spectral channels. Figure 7 shows the wavelength ranges for the first eight NIMS detectors. Because the in-flight calibration of the instrument could not be performed before the Moon encounter, a gain correction is not incorporated at this stage.
Note also that the spectra in Figure 6a show a number of features which axe periodic with the grating settings. These are due to the spatial excursions of the NIMS IFOV on the Moon during and between grating settings which have been incompletely removed by the correction process attempted. Because the Moon has strong albedo boundaries and photometric function gradients at the resolution of the NIMS IFOV and because the motion of the IFOV had a magnitude of up to two NIMS IFOVs within the period of a grating step, it is very difficult to correct for all the effects. A method of removing these residual features was devised which uses the
periodicity of the excursions seen in the spectra. An algorithm was constructed which searched for and removed features in the
spectrum which occurred at the same grating settings for each of the 17 detectors. The algorithm reads an input spectrum, computes an average value across all detectors for each grating position, and divides the input spectrum by this average, matching the appropriate grating positions. Our knowledge of the lunar spectrum assures us that this will not remove the broad spectral features associated with the Moon. Figure 6b shows the smoother depatterned spectra for the same Mare Imbrium area as Figure 6a. The wavelength overlap at detector breaks shown in Figure 7 is still apparent in the smoothed data.
Analysis
As mentioned, the NIMS was designed to observe Jupiter, a much darker object than the Moon, and for this reason, the infrared portion of the array of detectors saturated longward of about 1.3 Bm at the phase angle of Moon l0 and smaller. Although the spatial coverage of the Moon 7 data is worse due to the illuminated area being closer to the apparent limb, less

Mare Imbrium Area 1' Depatterned (vlonorm) Data
sp_vlo ......... cn_vlo
4000
3OOO
2OOO
lOOO
0.5 1 1.5 2 2.5
Wavelength (lzm)
Figure 6b. Data number spectra for the same lunar area, Mare Imbrium Area 1, of the Moon 7 data set, after the depatterning algorithm was run to remove most of the periodic artificial spectral features due to incomplete compensation in the geometric correction process for scan platform movements during the measurement of the image cube.
NIMS Detector Ranges
0.5 1 1.5 2 2.5
Wavelength (l•m)
Figure 7. The wavelength ranges covered by the first eight detectors are shown for the NIMS instrument operating in long map mode (24 spectral channels per detector segment, corresponding to 24 grating steps). The overlap of each detector is approximately two channels.

Mare Imbrium Area 1' Normalized Ratio to Alphonsus
sp_nrm ......... cn_nrm
1.2
1.1
0.9
0.8
0.5 I 1.5 2 2.5
Wavelength (gm)
Figure 8a. Spectrum ratio from Moon 7 data for a maria area divided by a highlands area using the DN spectra for the Mare Imbrium area shown in Figure 6a and a highlands area around Alphonsus [14øS, 2øW]. Note that a relative absorption band near 1 gm and a weaker band near 2 gm is evident with a band depth of about 5% of continuum for the stronger band.
Mare Imbrium Area 1: Boxfilter of Size 5 on Final Normalized Ratio
sp_bx5 ......... cn_bx5
1.2
1.1
0.9
0.8
0.5 I 1.5 2 2.5
Wavelength (gm)
Figure 8b. The same ratio spectrum as shown in Figure 8a but after a five-channel running average was calculated to remove the higher frequency variations.
MCCORD ET AL.: GALILEO IR IMAGING SPECTROMETRY MEASUREMENTS 5597
Sinus Medii' Normalized Ratio to Alphonsus
sp_nrm ......... cn_nrm
1.2
1.1
0.9
0.8
0.5 1 1.5 2 2.5
Wavelength (gm)
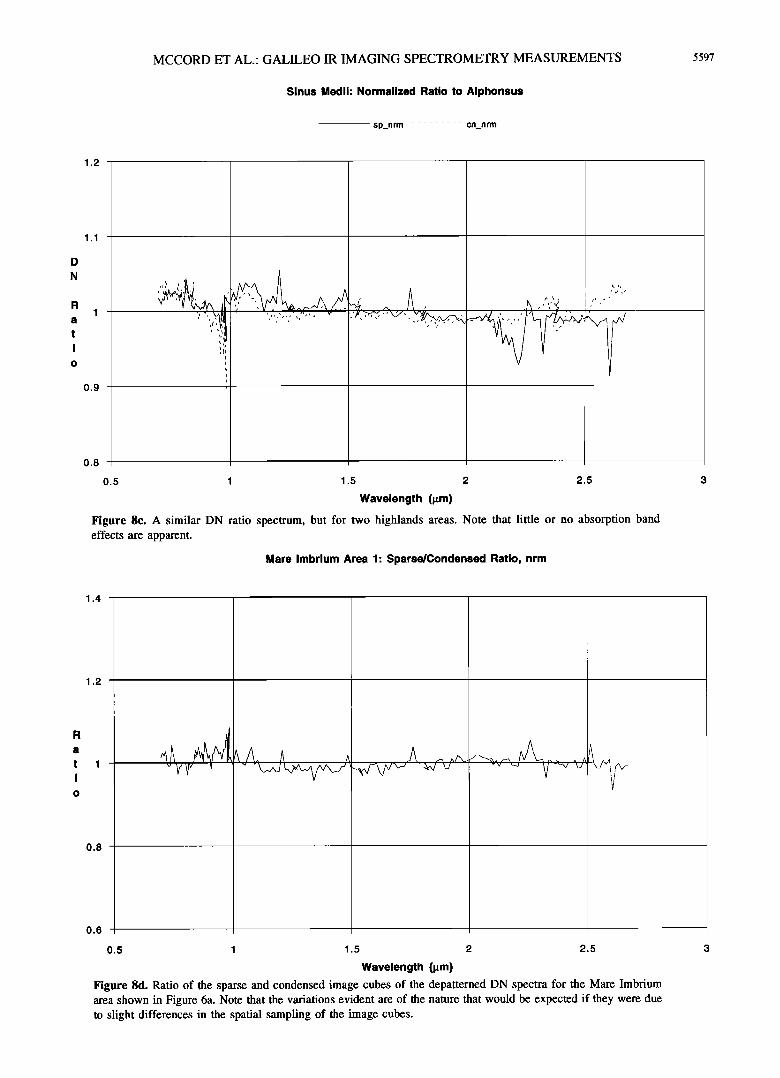
Figure 8c. A similar DN ratio spectrum, but for two highlands areas. Note that little or no absorption band effects are apparent.
Mare Imbrium Area 1- Sparse/Condensed Ratio, nrm
1.4
1.2
0.8
0.6
0.5 1 1.5 2 2.5
Wavelength (gm)
Figure 8d. Ratio of the sparse and condensed image cubes of the depatterned DN spectra for the Mare Imbrium area shown in Figure 6a. Note that the variations evident are of the nature that would be expected if they were due to slight differences in the spatial sampling of the image cubes.

5598 MCCORD ET AL.: GALILEO IR IMAGING SPECTROMETRY MEASUREMENTS
saturation is encountered. Therefore, the analysis of spectral signatures in the Moon 7 data, in which the signal was lower, was pursued. Of particular interest in this study was the identification of the I gm and 2 gm absorption bands associated with the mafic minerals olivine and pyroxene.
Again, note that the image cubes obtained to this point in the analysis have had no instrument calibration applied, except dark subtraction, since inflight calibrations could not be made near the Earth-Moon 1 encounter due to mission
operations restrictions, and since ground calibrations may not be accurate enough because of changes in detector and electronic performance over the unusually extended time period between ground calibration and flight due to delays in launch.
A way of proceeding to derive spectral information from the Moon data is to calculate ratios of spectra from different lunar regions. This was and is a standard technique using ground-based telescopic observations. Figure 8a, shows a ratio spectrum for the Mare Imbrium Area 1 treated in Figure 6 (a mostly maria region) divided by a region near the Alphonsus crater (a mostly highlands region centered on 14øS, 2øW). This ratio spectrum shows the familiar approximately 1 gm and 2 •m pyroxene absorption bands with the strength difference expected for these two areas, based on ground-based telescope measurements [e.g., McCord et al., 1981; Pieters, 1991]. The ratio spectrum calculated was again treated by the depatterning algorithm and also scaled to have an average near unity. There is still residual jitter in the ratio spectra mostly due to incomplete removal of the 17-detector periodic amplitude components. Treating these spectra with a 5-spectral-channel running boxcar filter produces a smoother spectrum [Figure 8b]. The feature just shortward of 1 gm is probably due to the effect of a much reduced signal at the crossover point between the silicon and InSb detectors and their filters [Carlson et al., 1992].
A check on this analysis and the conclusion can be made by treating another lunar area. Figure 8c shows a ratio spectrum for two mostly upland areas; Sinus Medii [0øN, 2øW] divided by Alphonsus. In this case, no pyroxene bands are visible, as expected from ground-based spectral studies.
Figure 8d shows a ratio of the sparse and condensed cubes spectra for the Mare Imbrium area. This tests for the types of features introduced by slightly different spatial sampling. The sparse/condensed ratio clusters its values around 1.0 which suggests that the larger trends (1 gm and 2 gm bands) still observed in Figures 8a and 8b could not be influenced by the spatial sampling errors/variances.
With this knowledge of the validity of the spectral information in the data sets, we return to the spatial analysis for the Moon 10 data set to display the spatial extent of spectral properties. An analysis was undertaken to calculate absorption band strength maps for the 1-gm mafic mineral band, due mostly to the mineral pyroxene. First, an average spectrum for the lunar surface was calculated using the entire Imbrium/Procellarum region of the Moon 10 data set. The photometrically corrected image cube was then divided by this average spectrum to obtain a normalized cube. No depatterning algorithm was applied for this analysis.
The next step was to calculate band depths in the mafic mineral absorption region by the method:
2 * (DNc) / (DN/+ DNs)
where DN c is the DN at band center, DN/is the DN longward of
the band, and DN s is the DN shortward of the band. This technique will produce low values for deeper absorption features relative to the reference spectrum, and high values for areas with bands shallower than the reference area. The
technique used, which preserved the spatial resolution of the data while avoiding the effects of dividing values with different spatial footprints (due to the scan platform jitter), involved the following steps: 1. Choose five neighboring bands in each of the three spectral regions (short, center, long) required for the band depth map. These three sets must cover the same five grating positions. 2. Combine the corrected DN values for the sparse data into a single image plane for each group of five bands. Where two or more original DN values overlap, take their average. In practice, overlaps occurred for a small percentage of the points, and the variance between values was relatively small. 3. Interpolate the three combined maps by a nearest neighbor search, which averages any equidistant nearest values.
4. Form the band depth ratio t¾om the three interpolated average band images.
This technique produced band depth maps with the highest possible spatial sampling, but avoided the problems which arose when the scan platform jitters were not considered. In this method, some data are still averaged, which presumably introduces pointing errors into the resultant means. The weighting for data points in all three images however is identical in the combination process, so large fluctuations in the ratios are not likely.
Figure 5 presented the photometrically corrected "red" (0.7 gm) albedo for Moon 10. Figure 9 presents the interpolated 0.94 gm band depth map. The band-depth map is based on a short continuum in the 0.792-0.818 gm region, a band center in the 0.931-0.957 gm region, and a long continuum in the 1.167-1.219 gm region. These locations were largely decided by the need to stay within certain grating positions, which are spaced 24 spectral channels apart, and by the detector saturation longward of 1.3 gm for this Moon measurement. The original orthographic projection is shown.
The overall behavior of the band depth is consistent with known lunar properties. The southern highlands have higher ratio values, because they are more deficient in mafic minerals than the mare reference. The Apennine Mountains are also visible in this map as high ratio values. The mare regions have lower ratio values, again consistent with the location of the reference region. Two regions with low ratio values are associated with the crater Kepler and the Aristarchus region. These data suggest that there are greater exposures of immature mare material in these two regions, consistent with previous studies [e.g., McCord et al., 1981; Pieters, 1991]. Copernicus crater is not well defined in these maps because it exposes highland material from beneath the Maria. There is also a subtle band-depth ratio boundary in northeastern Mare Imbrium.
Conclusions
The first Galileo-NIMS Moon Encounter data set is
presented and documented, and a portion of the NIMS Moon data has been analyzed. Ratio spectra are derived which show the classical 1-gm and 2-gm mafic mineral absorption bands. Band-depth maps were calculated and show lunar features

MCCORD ET AL.' GALILEO IR IMAGING SPECTROMETRY MEASUREMENTS 5599
. •
Figure 9. An image showing the variations in strength of the 1 gm mafic mineral absorption band in the lunar spectrum. This is derived from the Moon 10 data set illustrated in Figure 4. The image has been spatially interpolated using the same nearest neighbor approach as Figure 5b but with a search radius of 2 pixels around each point.
known to be associated with mineralogical differences. These spectral data products are similar to and consistent with those derived from ground-based measurements. These results demonstrate that the NIMS is functioning as planned and is producing useful data. Now that the idiosyncrasies of the spacecraft and the instrument are understood, further analysis can be pursued productively.
This effort reported here also demonstrates the importance of measuring all spectral channels simultaneously, or at least having a very stable plattom while scanning a spectrum. Finally, this exercise indicates the value of having actual operational experience with a complicated instrument, including having to deal with actual data, before the baseline measurements are begun.
The Galileo spacecraft again encountered the Earth-Moon system in December 1992. More NIMS measurements were made at that time. Many of the spacecraft problems encountered in 1990 were corrected, and the encounter distance
was reduced by about a factor of 4. Thus, higher-quality NIMS data sets have been acquired and will be reported. The results presented here are greatly aiding in their analysis.
References
Carlson, R. W.,et.al.,Galileo infrared imaging spectroscopy measurements at Venus, Science, 253, 1541, 1991.
Carlson, R. W., P. R. Weissman, W. D. Smythe, J. C. Mahoney, and the NIMS Science and Engineering Teams, Near-infrared mapping spectrometer experiment on Galileo, Space Sci. Rev., 60, 457-502, 1992.
McCord, T. B., R. N. Clark, R. R. Hawke, L. A. McFadden, P. D.
Owensby, C. M. Pieters, and J. B. Adams, Moon: Near-infrared spectral reflectance, A first good look., J. Geophys. Res., 86, 10833- 10892, 1981.
Minnaert M., Photometry of the Moon, in Planets and Satellites, chap. 6; edited by G. P. Kuiper and B. M. Middlehurst, pp. 213-248, University of Chicago Press,Chicago, Ill., 1961.
Pieters C. M., Compositional diversity and stratigraphy of the lunar crust derived from reflective spectroscopy, in Remote Geochemical Analysis: Elemental and Mineralogical Composition, edited by C. Pieters and P. Engler, Cambridge University Press, New York, 1991.
K. J.Becker, K. Edwards, H.H. Kiefer, L.A. Soderblom, and J.
Totson, U.S. Geological Survey, 2255 North Gemini Drive., Flagstaff, AZ 86001.
B. Campbell, Center for Earth and Planetary Studies, NASM, Washington, DC 20560.
R. W.Carlson, M/S 183-603, Jet Propulsion Laboratory, Pasadena, CA 91109.
G. E. Danielson, Division of Geology & Planetary Sciences, California Institute of Technology, Pasadena, CA 91125.
F. P.Fanale, and J.C. Granahan, Planetary Geosciences Division,

5600 MCCORD ET AL.: GALILEO IR IMAGING SPECTROMETRY MEASUREMENTS
SOEST, University of Hawaii, 2525 Correa Road, Honolulu, HI 96822. J. Forsythe, J. Lo, and T.B. McCord, SETS Technology, Inc., 300
Kahelu Avenue, Suite 10, Mililani, HI 96789.
T. V. Johnson, R. Lopes-Gautier, and D. L. Matson, M/S 183-501, Jet Propulsion Laboratory, Pasadena, CA 91109.
L. Kamp, M/S 168-427, Jet Propulsion Laboratory, Pasadena, CA 91109.
R. Mehlman, UCLA/IGPP, 1704 Geology, Los Angeles, CA 90024- 1567.
A. C. Ocampo, W.D. Smythe, and P. R. Weissman, M/S 183-60!, Jet Propulsion Laboratory, Pasadena, CA 91109.
(Received July 13, 1993; revised November 22, 1993: accepted December 3, 1993.)