
impact transport on the moon - Amazon AWS
225
IMPACT TRANSPORT ON THE MOON A Dissertation Submitted to the Faculty of Purdue University by Ya-Huei Huang In Partial Fulfillment of the Requirements for the Degree of Doctor of Philosophy December 2018 Purdue University West Lafayette, Indiana
-
Upload
khangminh22 -
Category
Documents
-
view
0 -
download
0
Transcript of impact transport on the moon - Amazon AWS
IMPACT TRANSPORT ON THE MOON
A Dissertation
Submitted to the Faculty
of
Purdue University
by
Ya-Huei Huang
In Partial Fulfillment of the
Requirements for the Degree
of
Doctor of Philosophy
December 2018
Purdue University
West Lafayette, Indiana

ii

iii
THE PURDUE UNIVERSITY GRADUATE SCHOOL
STATEMENT OF DISSERTATION APPROVAL
Dr. Briony Horgan, Chair
Department of Earth, Atmospheric, and Planetary Sciences
Dr. Jay Melosh
Department of Earth, Atmospheric, and Planetary Sciences
Dr. James Richardson
Planetary Science Institute
Dr. Chris Andronicus
Department of Earth, Atmospheric, and Planetary Sciences
Dr. David Minton
Department of Earth, Atmospheric, and Planetary Sciences
Approved by:
Dr. Darryl Granger
Head of the School Graduate Program

iv
To my beloved families and friends and life time here.
v
ACKNOWLEDGMENTS
Thanks to everyone that I met during the time I spent in Indiana, I would not have
come this far without you all. I would like to express my enormous gratitude to all
of people who helped and supported me during this period. I would like to especially
thank my Ph.D. advisor, David Minton, for all of his support and advice. He has a
strong work ethic and and is one of the best mentors that I have ever worked with.
His passion toward research and deep knowledge and perspective of the planetary
science always inspire me to not give up. His brilliant ideas always motivate me to
form new ideas on my own. I owe him a huge thank to his endless support and effort
teaching me how to write better and also teaching me American idioms. He is also
one of people that I know who loves learning and has a deep knowledge in a variety
of topics. I would not have made it this far without his support and help. As well,
I would like to thank Juliet Minton for her wonderful company during my research
and advice on writing.
I thank Caleb Fassett for his great insight and bright ideas for how to interpret
many of my simulation results. I thank Nicolle Zellner for her fascinating lunar
impact glass spherule data, deep knowledge to 40Ar/39Ar dating method, as well as
her prompt responses regarding my research questions. I thank Jay Melosh for his
enthusiasm and brilliant thoughts to any question we come up with; he always sends
out inspiring research papers. I also thank him for hosting Crater Cafe and bringing
us Ellen’s yummy cookies. I thank all the present and past members of Crater Cafe
for exciting scientific discussions: Jenny Larson, Kelsey Warden, Alex Trowbridge,
Brandon Johnson, Tim Bowling, Jordan Steckloff, Jordan Kendall, and Dave Blair.
I thank Toshi Hirabayashi for his inspiring discussions and critical thinking during
my research. I thank Briony Horgan for all her lovely and inspiring classes and
her support of my research. I thank Chris Andronicus for his passion for petrology
vi
regardless a planetary body and his help on my first postdoctoral job application. I
thank Jim Richardson for allowing me to work on his code, CTEM, and his support
of my research.
I am happy to thank my awesome Minton group colleagues, Andy Hesselbrock,
Kevin Graves, Carlisle Wishard, and Jennifer Pouplin, the 2263 colleagues, Sheri-
dan Ackiss, Jake Elliott, Marie McBride, Noel Scudder, Becky Smith, Laura Camila
Chaves, and Prakhar Sinha. I would not have enjoyed much of my time in Indiana
without you guys’ laughs and conversations. I am happy to thank my friends, Mindy
Lowery, Troy Lowery, Chin-Chai Huan (Hugo), Cathy Liu, Chuan-Hsun Li, Fangyu
Hsu, Tuncer Asunakutlu, Chisa Fukusumi, Becky Bobick, Frank Fiarito, Collin Cof-
fey, Sarah Wolf and my dear housemates, Kate Brubaker and Meaghan Murphy for
their friendship and wonderful laughs and stories. Furthermore, I would like to thank
all my friends, whose names are too many to list, for accompanying me during this
journey.
Lastly, but most importantly, I would like to thank my mum, Huang Zhang Leng,
sister, Ya-Ling Huang, my husband, Tsung-Han Lee, for always bearing with me.
Also, I thank my parents-in-law, Bong-Che Lee and Sau-Chin Ting for always being
there to support me pursuing my dreams. I have came a long way, and you guys are
always there. Thank you all so much for the laughs and tears.

vii
PREFACE
The texts of primary modeling results (chapters 3, 4 and 5) in this current thesis
appear in the following previous publications from years of 2017 and 2018.
(Huang et al., 2017) Ya-Huei Huang, David A. Minton, Masatoshi Hirabayashi, Ja-
cob R. Elliott, James R. Richardson, Caleb I. Fassett, Nicolle E. B. Zellner (2017),
“Heterogeneous Impact Transport on the Moon.” Journal of Geophysical Research:
Planets, 122, 1158-1180. (on Research Spotlight in Eos, June 7 2017)
(Huang et al., 2018) Ya-Huei Huang, David A. Minton, Nicolle E. B. Zellner, Masatoshi
Hirabayashi, James R. Richardson, Caleb I. Fassett (2018), “No Change in the Re-
cent Lunar Impact Flux Required Based on Modeling of Impact Glass Spherule Age
Distributions.” Geophysical Research Letters, 45, 68056813. (On Daily News in
NewScientist, “Why a rake on the moon messed up our theories of life on Earth”,
September 14 2018 and News in Phys.org, “Age bias exists even in outer spacein
samples collected by Apollo astronauts”, September 11 2018.)
The current thesis presents three primary modeling results based on four observed
data sets from 1) Clementine Ultraviolet-visible (UV-VIS) light spectrometer multi-
spectral data (Li and Mustard, 2000), 2) lunar in-situ samples and lunar meteorites
(Rhodes, 1977; Marvin, 1978; Delano, 1986; Wentworth et al., 1979; Vaniman and Pa-
pike, 1977; Neal et al., 1994; Rhodes et al., 1977; Papike et al., 1976; Laul and Papike,
1980; Morris et al., 1983; Wentworth et al., 1994; Naney et al., 1976; Ridley et al.,
1973; Kempa et al., 1980; Meyer et al., 1971; Norman et al., 2010; Korotev et al., 2003)
(for lunar returned sample description refers to Lunar Sample Compendium website
https://curator.jsc.nasa.gov/lunar/samplecatalog/index.cfm), 3) 40Ar/39Ar

viii
age measurements of Apollo impact glass spherules (Zellner et al., 2009; Zellner and
Delano, 2015), and 4) assembled data sets of terrestrial impact melt products and
microtektites (terrestrial analogue of lunar impact glass spherules) (Glass et al., 1997;
Coney et al., 2010; Horton et al., 2007; Pope et al., 1999; Jehanno et al., 1992; Schulte
et al., 2003; Kyte et al., 1996; Fazio et al., 2014; Osae et al., 2005; Engelhardt et al.,
1995).
Finally, Ya-Huei Huang was supported by Purdue Research Foundation Research
Assistantship and NASA Earth and Space Science Fellowship between 2014 and 2018.
ix
TABLE OF CONTENTS
Page
LIST OF TABLES . . . . . . . . . . . . . . . . . . . . . . . . . . . . . . . . . . xi
LIST OF FIGURES . . . . . . . . . . . . . . . . . . . . . . . . . . . . . . . . . xii
ABSTRACT . . . . . . . . . . . . . . . . . . . . . . . . . . . . . . . . . . . . . xx
1 INTRODUCTION . . . . . . . . . . . . . . . . . . . . . . . . . . . . . . . . 11.1 A brief history of lunar impact craters . . . . . . . . . . . . . . . . . . 21.2 Impact cratering mechanics . . . . . . . . . . . . . . . . . . . . . . . . 41.3 Morphology of impact craters . . . . . . . . . . . . . . . . . . . . . . . 91.4 Lunar crater based chronology and the origin of a planetary cratered
surface . . . . . . . . . . . . . . . . . . . . . . . . . . . . . . . . . . . . 121.5 Lunar origin and bombardment environment . . . . . . . . . . . . . . . 161.6 The first billion lunar bombardment record and a relationship with
returned samples . . . . . . . . . . . . . . . . . . . . . . . . . . . . . . 171.7 The last three billion years lunar bombardment record and a relation-
ship with returned samples . . . . . . . . . . . . . . . . . . . . . . . . . 22
2 METHODS . . . . . . . . . . . . . . . . . . . . . . . . . . . . . . . . . . . . 252.1 Introduction to CTEM . . . . . . . . . . . . . . . . . . . . . . . . . . . 25
2.1.1 Background: A stochastic process of a cratered surface . . . . . 272.1.2 Cratering and ejecta scaling model . . . . . . . . . . . . . . . . 30
2.2 Overview: A Three-Dimensional Regolith Transport Model . . . . . . . 362.3 The Dynamic Stream Tube-Based Transport Model . . . . . . . . . . . 372.4 Glass spherule production model . . . . . . . . . . . . . . . . . . . . . 442.5 Impact shock pressure destruction . . . . . . . . . . . . . . . . . . . . . 512.6 An Empirical Model for the Spatial Geometry of Crater Rays . . . . . 532.7 A Vertical Mixing Model for Craters Under the Resolution Limit of
CTEM . . . . . . . . . . . . . . . . . . . . . . . . . . . . . . . . . . . . 582.8 Modeling super-domain craters . . . . . . . . . . . . . . . . . . . . . . 61
3 HETEROGENEOUS IMPACT TRANSPORT ON THE MOON . . . . . . . 653.1 Introduction . . . . . . . . . . . . . . . . . . . . . . . . . . . . . . . . . 663.2 Two Sets of Contradictory Observational Constraints on Material Trans-
port . . . . . . . . . . . . . . . . . . . . . . . . . . . . . . . . . . . . . 713.3 Mare/Highland Boundary Diffusion Simulation . . . . . . . . . . . . . . 74
3.3.1 Mare/Highlands Contact Simulation Setup . . . . . . . . . . . . 753.3.2 Results of Our Mare/Highland Contact Simulations . . . . . . . 80

x
Page3.4 Implications of Our Impact Transport Model for Evolution of Lunar
Surface Materials . . . . . . . . . . . . . . . . . . . . . . . . . . . . . . 843.5 Conclusion . . . . . . . . . . . . . . . . . . . . . . . . . . . . . . . . . . 87
4 NO CHANGE IN THE RECENT LUNAR IMPACT FLUX REQUIREDBASED ON MODELING OF IMPACT GLASS SPHERULE AGE DIS-TRIBUTIONS . . . . . . . . . . . . . . . . . . . . . . . . . . . . . . . . . . . 954.1 Introduction . . . . . . . . . . . . . . . . . . . . . . . . . . . . . . . . . 954.2 Lunar impact glass spherule simulation modeling . . . . . . . . . . . . 98
4.2.1 Constraining lunar impact glass spherule production . . . . . . 994.2.2 Evaulating the importance of spherule breakage by high velocity
landing . . . . . . . . . . . . . . . . . . . . . . . . . . . . . . . 1064.2.3 Modeling the distribution of spherule ages in lunar soil samples 109
4.3 Results . . . . . . . . . . . . . . . . . . . . . . . . . . . . . . . . . . . 1114.4 Discussion and Conclusion . . . . . . . . . . . . . . . . . . . . . . . . 113
5 WHAT HAPPENED ON THE MOON 800 MILLION YEARS AGO? . . . 1295.1 Introduction . . . . . . . . . . . . . . . . . . . . . . . . . . . . . . . . 1305.2 Provenance Analysis of Observed “Exotic” Impact Glass Spherules . . 1375.3 Materials and Methods . . . . . . . . . . . . . . . . . . . . . . . . . . 148
5.3.1 A possible size frequency distribution of Copernicus Crater-forming sesquinary craters . . . . . . . . . . . . . . . . . . . . 149
5.3.2 A possible glass spherule production of Copernicus Crater’ssesquinaries . . . . . . . . . . . . . . . . . . . . . . . . . . . . 152
5.4 Results and Discussion . . . . . . . . . . . . . . . . . . . . . . . . . . 1565.5 Conclusion . . . . . . . . . . . . . . . . . . . . . . . . . . . . . . . . . 160
6 SUMMARY . . . . . . . . . . . . . . . . . . . . . . . . . . . . . . . . . . . 167
REFERENCES . . . . . . . . . . . . . . . . . . . . . . . . . . . . . . . . . . . 174

xi
LIST OF TABLES
Table Page
4.1 Data re-compilation of 40Ar/39Ar-derived age measurements of lunar im-pact glass spherules and shards . . . . . . . . . . . . . . . . . . . . . . . 117
4.2 The data of size and spatial distribution of terrestrial microtektites. . . . 124
4.3 The impact conditions using for estimating transient crater sizes in thisstudy. . . . . . . . . . . . . . . . . . . . . . . . . . . . . . . . . . . . . . 125
4.4 The data of size and spatial distribution of impact melt products. . . . . 126
4.5 The five Apollo soil samples with corresponding collected depth . . . . . 127
5.1 Summary of provenance analysis and 40Ar/39Ar ages of fifteen “exotic”lunar impact glass spherules. . . . . . . . . . . . . . . . . . . . . . . . . . 141
5.2 Summary of REBOUND simulation result on the fraction of our 1000 testparticles remaining in geocentric orbit system of Earth and Moon. . . . . 150
xii
LIST OF FIGURES
Figure Page
1.1 Release adiabat curves after a high shock pressure. The Rayleigh line is astraight line connecting the initial pressure and volume to the final pres-sure and volume (final shock state). The Hugoniot curve depicts shocked(compressed) materials in the P–V diagram, in which shock compression isirreversible. Release from high shock pressure follows the adiabatic trendin the P–V diagram (reversible process). The final volume of release fromhigh shock pressure is larger than the initial volume (V0) because a frac-tion of materials is melted. The difference between triangle-shaped areabound by the Rayleigh line and vertical line at specific volume of V andhorizontal line at zero pressure and an area bound by the Hugoniot curveis approximately heat waste by shock. The diagram to the right shows dif-ferent release curves for different shock states (shock state 1, 2, 3, and 4),and the final state of those release curves depending on a phase diagram(S: solid; L: liquid; V: vapor) for a given geological material. Modifiedfrom Figure 3.10 in (Melosh, 1989). . . . . . . . . . . . . . . . . . . . . . . 6
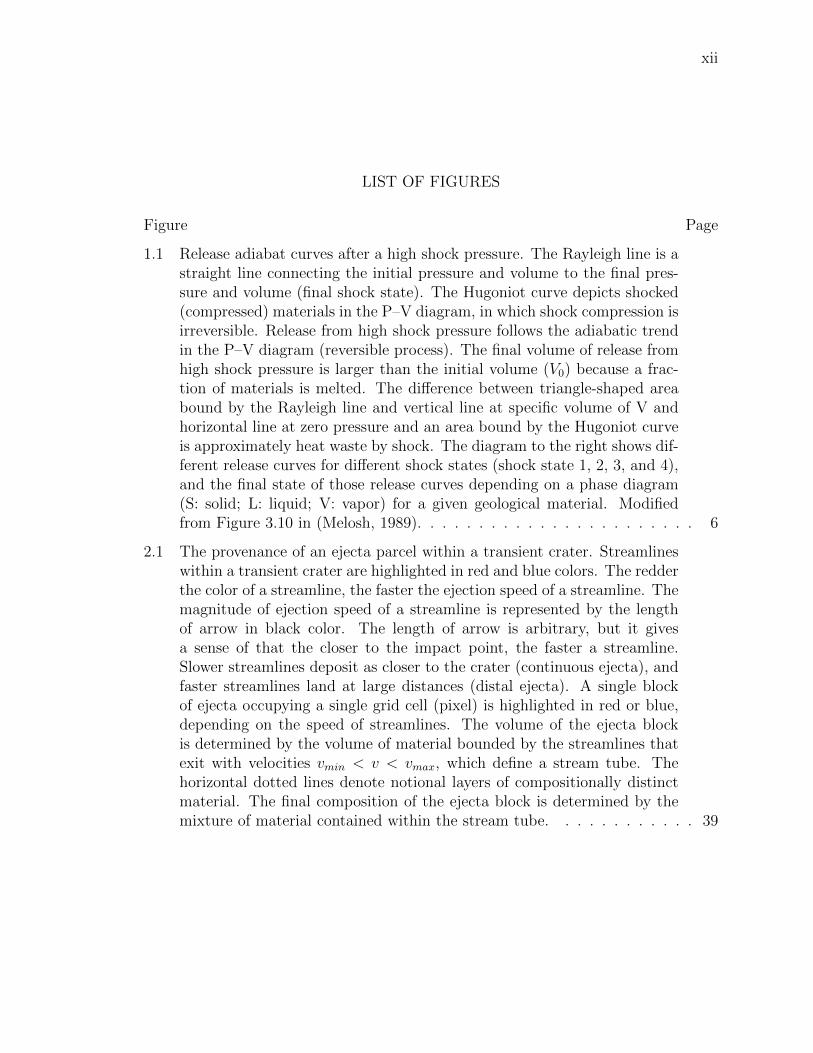
2.1 The provenance of an ejecta parcel within a transient crater. Streamlineswithin a transient crater are highlighted in red and blue colors. The redderthe color of a streamline, the faster the ejection speed of a streamline. Themagnitude of ejection speed of a streamline is represented by the lengthof arrow in black color. The length of arrow is arbitrary, but it givesa sense of that the closer to the impact point, the faster a streamline.Slower streamlines deposit as closer to the crater (continuous ejecta), andfaster streamlines land at large distances (distal ejecta). A single blockof ejecta occupying a single grid cell (pixel) is highlighted in red or blue,depending on the speed of streamlines. The volume of the ejecta blockis determined by the volume of material bounded by the streamlines thatexit with velocities vmin < v < vmax, which define a stream tube. Thehorizontal dotted lines denote notional layers of compositionally distinctmaterial. The final composition of the ejecta block is determined by themixture of material contained within the stream tube. . . . . . . . . . . . 39
xiii
Figure Page
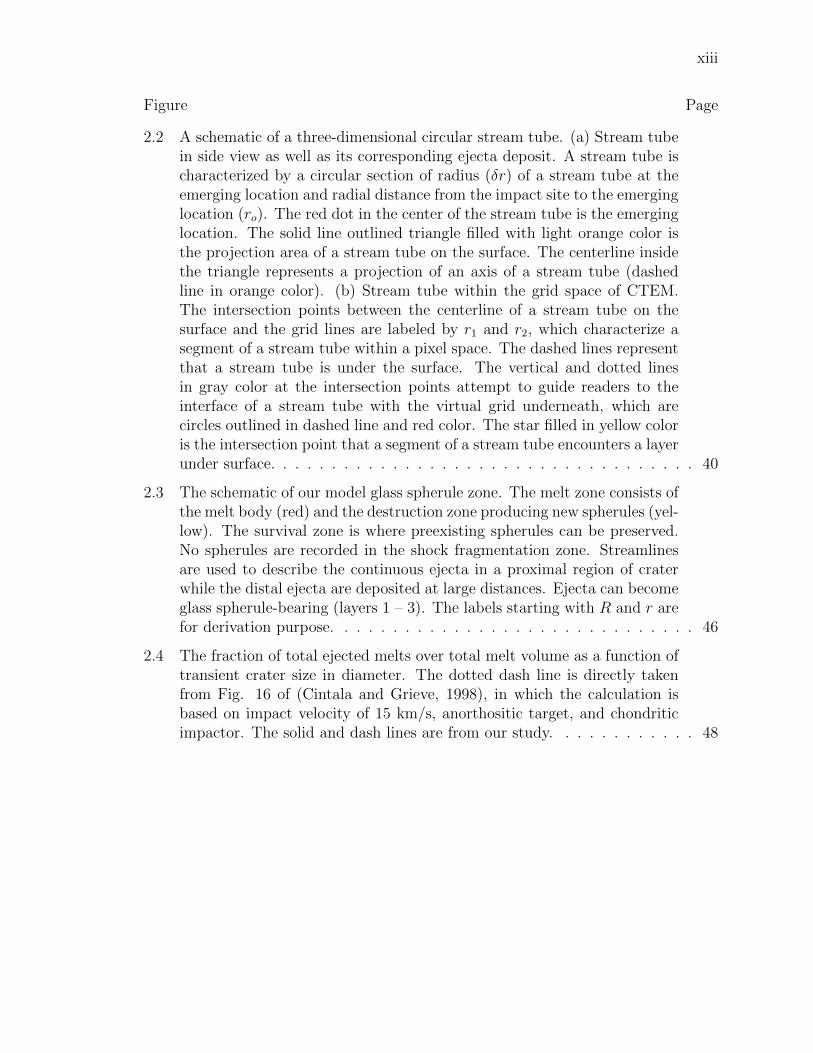
2.2 A schematic of a three-dimensional circular stream tube. (a) Stream tubein side view as well as its corresponding ejecta deposit. A stream tube ischaracterized by a circular section of radius (δr) of a stream tube at theemerging location and radial distance from the impact site to the emerginglocation (ro). The red dot in the center of the stream tube is the emerginglocation. The solid line outlined triangle filled with light orange color isthe projection area of a stream tube on the surface. The centerline insidethe triangle represents a projection of an axis of a stream tube (dashedline in orange color). (b) Stream tube within the grid space of CTEM.The intersection points between the centerline of a stream tube on thesurface and the grid lines are labeled by r1 and r2, which characterize asegment of a stream tube within a pixel space. The dashed lines representthat a stream tube is under the surface. The vertical and dotted linesin gray color at the intersection points attempt to guide readers to theinterface of a stream tube with the virtual grid underneath, which arecircles outlined in dashed line and red color. The star filled in yellow coloris the intersection point that a segment of a stream tube encounters a layerunder surface. . . . . . . . . . . . . . . . . . . . . . . . . . . . . . . . . . . 40
2.3 The schematic of our model glass spherule zone. The melt zone consists ofthe melt body (red) and the destruction zone producing new spherules (yel-low). The survival zone is where preexisting spherules can be preserved.No spherules are recorded in the shock fragmentation zone. Streamlinesare used to describe the continuous ejecta in a proximal region of craterwhile the distal ejecta are deposited at large distances. Ejecta can becomeglass spherule-bearing (layers 1 – 3). The labels starting with R and r arefor derivation purpose. . . . . . . . . . . . . . . . . . . . . . . . . . . . . . 46
2.4 The fraction of total ejected melts over total melt volume as a function oftransient crater size in diameter. The dotted dash line is directly takenfrom Fig. 16 of (Cintala and Grieve, 1998), in which the calculation isbased on impact velocity of 15 km/s, anorthositic target, and chondriticimpactor. The solid and dash lines are from our study. . . . . . . . . . . . 48

xiv
Figure Page
2.5 Normalized peak shock pressure within a transient crater from differenthydrocode simulations. The points marked “P” are from CTH simula-tions (Pierazzo et al., 1997), and the points marked “M” are from iSALEsimulations (Monteux and Arkani-Hamed, 2016). The numbers indicatethe impact velocity in km/s. M10(A) is a simulation with acoustic flu-idization. The x-axis is the distance normalized by the radius of impactorwithin a transient crater, and the y-axis is the relative peak shock pres-sure. The two straight lines are exponential fits for asymptotic behaviorsof shock pressures beyond the isobaric pressure zone, and the numbers arethe fitted exponents. . . . . . . . . . . . . . . . . . . . . . . . . . . . . . . 53
2.6 Comparison between an actual rayed crater and a model rayed crater. (a)Example of a fresh crater (LROC stamp: M1136364148RE) with a radiusof ∼6 m in radius. (b) Regolith map of a crater with our crater ray model.The crater is 0.146 km in diameter at 10 m/pixel resolution. The floweryrays surrounding the continuous ejecta extend to 7 radii from the craterscenter, and the spike rays extends outward until the regolith thicknessreaches the cutoff value of 108 m (not shown here). The variation in colorrepresents the thickness of regolith (ejecta), ranging from none (black) tomaximum (red). . . . . . . . . . . . . . . . . . . . . . . . . . . . . . . . . . 57
2.7 The fraction of surface that mixes to a given depth for a time intervalfrom our vertical mixing model for subpixelsized craters. The x axis is themixing depth, and the y axis is the fraction of area that is mixed to thatdepth. Each curve is labeled with its corresponding time, 1 Myr, 10 Myr,100 Myr, 1 Gyr, and 10 Gyr. For 1 Myr time interval, the probability ofa surface that mixes to 1 cm (0.01 m) is <0.2, yet in that time, the wholesurface has already mixed to 1 mm. Note that the 10 Gyr period at thisconstant impact flux rate is equivalent to a 3.65 Ga age accounting for theexponentially higher impact rate prior to 3 Ga (Neukum et al., 2001). . . 62
3.1 Abundance of nonmare material as a function of sampling distance fromthe highland and mare contact as measured by Clementine, Apollo, andLuna missions. This plot is modified from (Rhodes, 1977, Figure 1), withthe addition of Clementine UV/VIS camera data for Grimaldi Crater (solidline) that is directly taken from (Li and Mustard, 2000, Figure 6). Thevertical line at zero distance in the x axis is the geological contact betweenanorthositic highlands on the left-hand side (shadowed in gray color) andmare on the right-hand side. The Apollo 11, 12, 15, and 17 and Luna 16data are hand samples assembled by (Rhodes, 1977). Apollo 15 and 16samples are compared with Clementine data for all four contacts in greaterdetail in the inset. . . . . . . . . . . . . . . . . . . . . . . . . . . . . . . . 69
xv
Figure Page
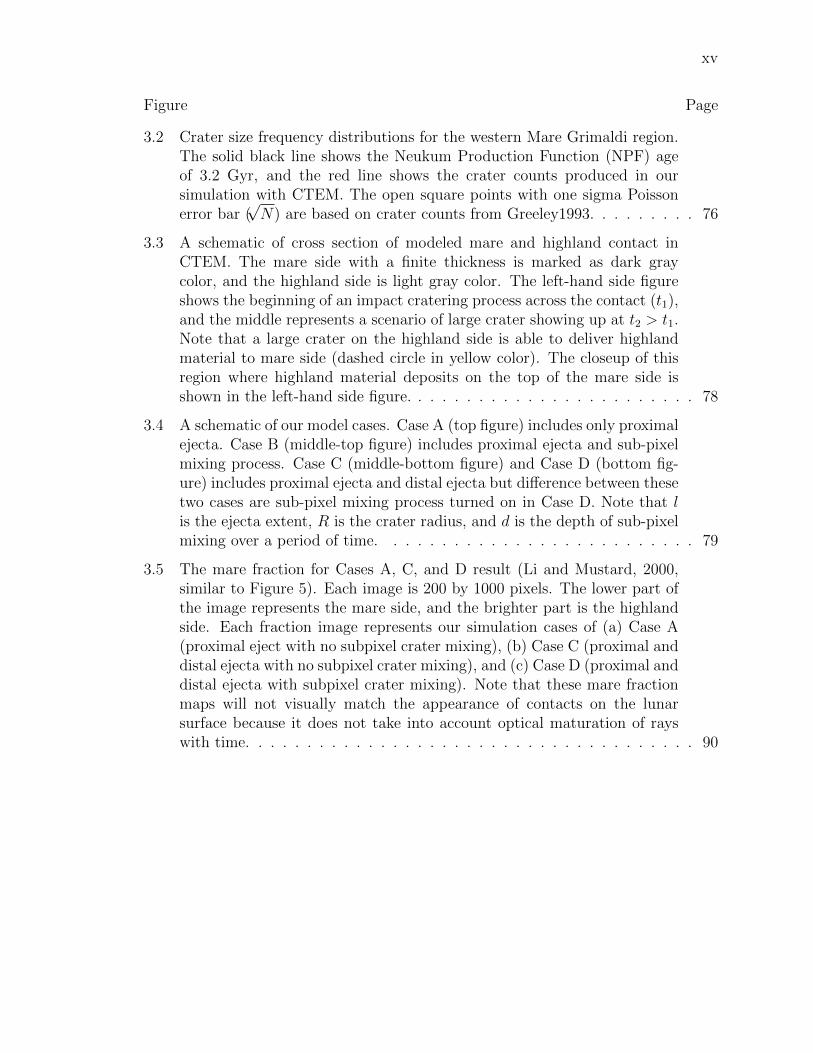
3.2 Crater size frequency distributions for the western Mare Grimaldi region.The solid black line shows the Neukum Production Function (NPF) ageof 3.2 Gyr, and the red line shows the crater counts produced in oursimulation with CTEM. The open square points with one sigma Poissonerror bar (
√N) are based on crater counts from Greeley1993. . . . . . . . . 76
3.3 A schematic of cross section of modeled mare and highland contact inCTEM. The mare side with a finite thickness is marked as dark graycolor, and the highland side is light gray color. The left-hand side figureshows the beginning of an impact cratering process across the contact (t1),and the middle represents a scenario of large crater showing up at t2 > t1.Note that a large crater on the highland side is able to deliver highlandmaterial to mare side (dashed circle in yellow color). The closeup of thisregion where highland material deposits on the top of the mare side isshown in the left-hand side figure. . . . . . . . . . . . . . . . . . . . . . . . 78
3.4 A schematic of our model cases. Case A (top figure) includes only proximalejecta. Case B (middle-top figure) includes proximal ejecta and sub-pixelmixing process. Case C (middle-bottom figure) and Case D (bottom fig-ure) includes proximal ejecta and distal ejecta but difference between thesetwo cases are sub-pixel mixing process turned on in Case D. Note that lis the ejecta extent, R is the crater radius, and d is the depth of sub-pixelmixing over a period of time. . . . . . . . . . . . . . . . . . . . . . . . . . 79
3.5 The mare fraction for Cases A, C, and D result (Li and Mustard, 2000,similar to Figure 5). Each image is 200 by 1000 pixels. The lower part ofthe image represents the mare side, and the brighter part is the highlandside. Each fraction image represents our simulation cases of (a) Case A(proximal eject with no subpixel crater mixing), (b) Case C (proximal anddistal ejecta with no subpixel crater mixing), and (c) Case D (proximal anddistal ejecta with subpixel crater mixing). Note that these mare fractionmaps will not visually match the appearance of contacts on the lunarsurface because it does not take into account optical maturation of rayswith time. . . . . . . . . . . . . . . . . . . . . . . . . . . . . . . . . . . . . 90
xvi
Figure Page
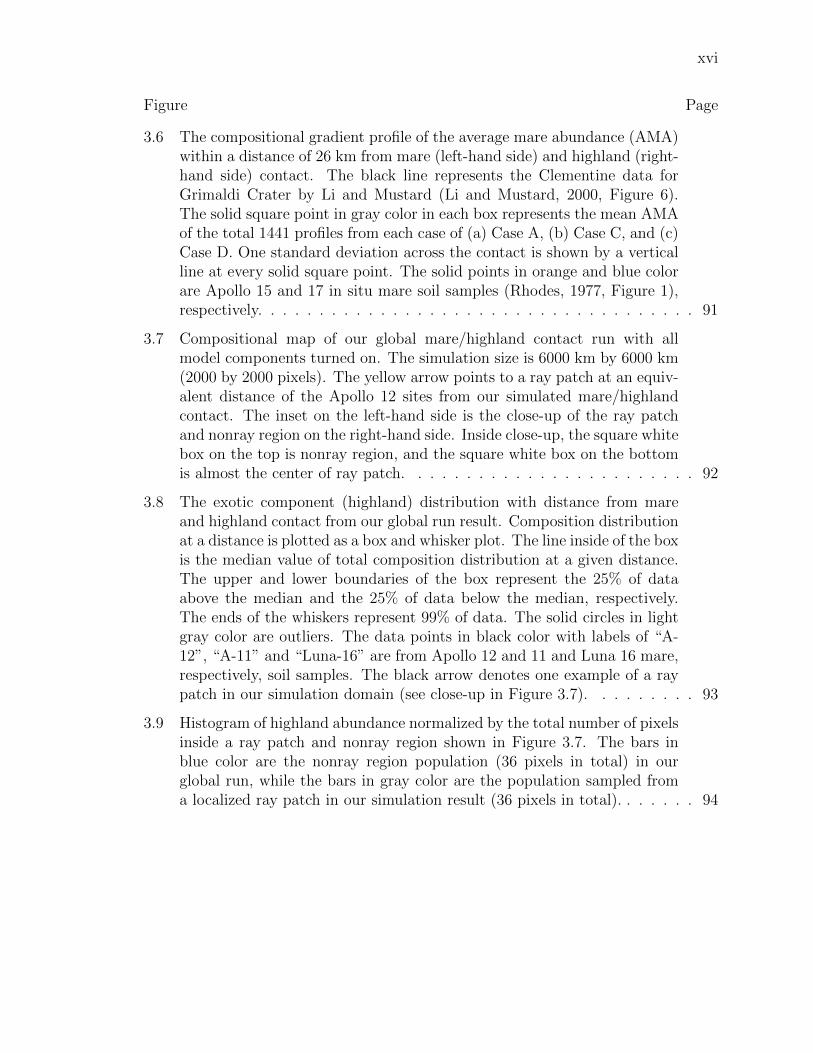
3.6 The compositional gradient profile of the average mare abundance (AMA)within a distance of 26 km from mare (left-hand side) and highland (right-hand side) contact. The black line represents the Clementine data forGrimaldi Crater by Li and Mustard (Li and Mustard, 2000, Figure 6).The solid square point in gray color in each box represents the mean AMAof the total 1441 profiles from each case of (a) Case A, (b) Case C, and (c)Case D. One standard deviation across the contact is shown by a verticalline at every solid square point. The solid points in orange and blue colorare Apollo 15 and 17 in situ mare soil samples (Rhodes, 1977, Figure 1),respectively. . . . . . . . . . . . . . . . . . . . . . . . . . . . . . . . . . . . 91
3.7 Compositional map of our global mare/highland contact run with allmodel components turned on. The simulation size is 6000 km by 6000 km(2000 by 2000 pixels). The yellow arrow points to a ray patch at an equiv-alent distance of the Apollo 12 sites from our simulated mare/highlandcontact. The inset on the left-hand side is the close-up of the ray patchand nonray region on the right-hand side. Inside close-up, the square whitebox on the top is nonray region, and the square white box on the bottomis almost the center of ray patch. . . . . . . . . . . . . . . . . . . . . . . . 92
3.8 The exotic component (highland) distribution with distance from mareand highland contact from our global run result. Composition distributionat a distance is plotted as a box and whisker plot. The line inside of the boxis the median value of total composition distribution at a given distance.The upper and lower boundaries of the box represent the 25% of dataabove the median and the 25% of data below the median, respectively.The ends of the whiskers represent 99% of data. The solid circles in lightgray color are outliers. The data points in black color with labels of “A-12”, “A-11” and “Luna-16” are from Apollo 12 and 11 and Luna 16 mare,respectively, soil samples. The black arrow denotes one example of a raypatch in our simulation domain (see close-up in Figure 3.7). . . . . . . . . 93
3.9 Histogram of highland abundance normalized by the total number of pixelsinside a ray patch and nonray region shown in Figure 3.7. The bars inblue color are the nonray region population (36 pixels in total) in ourglobal run, while the bars in gray color are the population sampled froma localized ray patch in our simulation result (36 pixels in total). . . . . . . 94

xvii
Figure Page
4.1 The relative probability plot of five reported lunar regolith samples. Therelative impact flux is calculated from the fraction of impact glass spherulesand shards normalized by the overall number of impact glass spherules andshards from all five Apollo regolith samples. The data is directly takenfrom two studies, Zellner and Levine (Zellner and Delano, 2015; Levineet al., 2005). The spherule data of Culler and Hui (Culler et al., 2000; Huiet al., 2009) are not included. . . . . . . . . . . . . . . . . . . . . . . . . . 97
4.2 An illustration of spherule production, transport, and destruction in CTEM.a) Spherules are produced within the melt zone for those streamlines thatemerge inward of the onset distance for spherule production. b) Pre-existing spherules within regolith layers are destroyed in the melt andshock fragmentation zone. Old spherules entrained within streamlinesthat intersect the survival zone are mixed with fresh spherules producedas in a). . . . . . . . . . . . . . . . . . . . . . . . . . . . . . . . . . . . . 100
4.3 Our modeled impact glass spherule production model based on terrestrialimpact crater glass/melt size data. The lower x axis represents the esti-mated launching position scaled by the calculated transient crater radius.The y axis is the reported maximum size of the impact melt product inmillimeters (mm). The upper x axis is the equivalent landing distanceunder lunar gravity. . . . . . . . . . . . . . . . . . . . . . . . . . . . . . . 104
4.4 The relative probability plots calculated from all of our fifty simulatedsurfaces with our two free parameters varied: sampling depth (a and b)and glass distribution onset distance, where R is the crater radius (c-f).The x-axis is age (Ma), with the present day at the left. The relativeprobability of all model samples is calculated in a similar fashion as theobserved data set given in Figure 4.1, but with the constant model resolu-tion σ of 50 Ma.Panel f (highlighted in black, bold line) shows our resultwith a sampling/mixing depth most similar to the Apollo sampling depth,and with a glass onset distance closest to that from obtained from theterrestrial microtektite constraint. It shows a prominent bias in <500 Maages qualitatively similar to our observational data shown in Figure 4.1. . 112
4.5 The relative probability plot calculated from all of our fifty simulatedsurfaces in the case of glass onset distance > 5 radii with three samplingdepths: a) 3 m, b) 1 m, and c) 10 cm. The black curve represents theoverall relative probability summed from all fifty simulated surfaces. Thex-axis is age (Ma), with the present day at the left. . . . . . . . . . . . . 113
4.6 The half life of model glass spherules due to shielding as a function ofsampling depth. . . . . . . . . . . . . . . . . . . . . . . . . . . . . . . . . 115
xviii
Figure Page
4.7 The fraction of super-domain spherule population as function of time withtwo sampling/mixing depths: a) 6 m, and b) 10 cm. The x-axis representsthe time since the formation of each spherule population; the y-axis isthe normalized distribution of spherules by the total amount of spherulesgenerated. Points in colors depict different spherule populations that wereproduced in our fifty simulations. The arrow in a) shows excavation eventsoccurring to this particular spherule population. . . . . . . . . . . . . . . 116
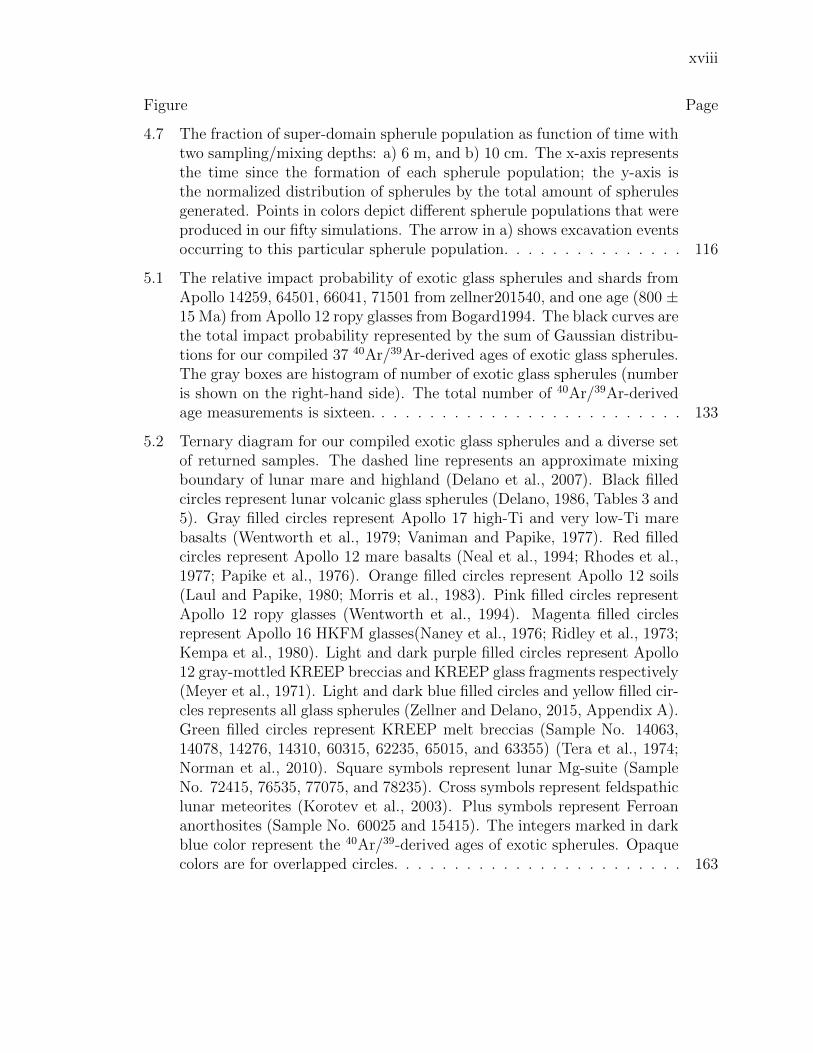
5.1 The relative impact probability of exotic glass spherules and shards fromApollo 14259, 64501, 66041, 71501 from zellner201540, and one age (800 ±15 Ma) from Apollo 12 ropy glasses from Bogard1994. The black curves arethe total impact probability represented by the sum of Gaussian distribu-tions for our compiled 37 40Ar/39Ar-derived ages of exotic glass spherules.The gray boxes are histogram of number of exotic glass spherules (numberis shown on the right-hand side). The total number of 40Ar/39Ar-derivedage measurements is sixteen. . . . . . . . . . . . . . . . . . . . . . . . . . 133
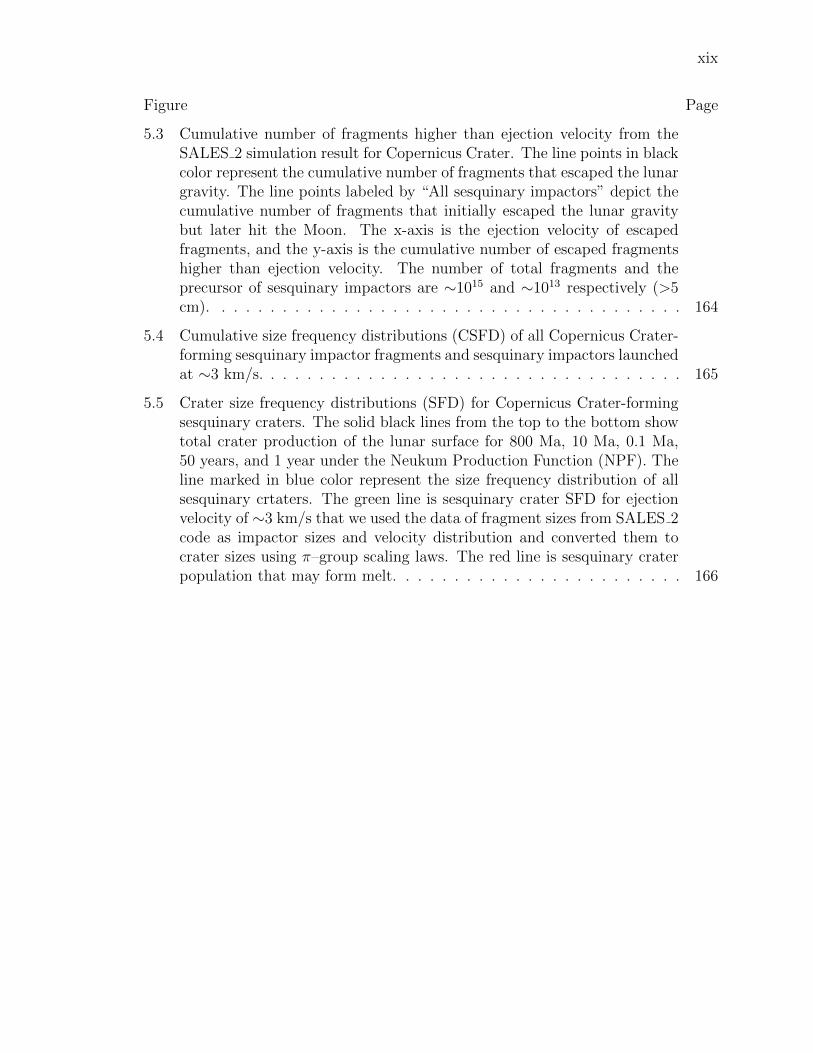
5.2 Ternary diagram for our compiled exotic glass spherules and a diverse setof returned samples. The dashed line represents an approximate mixingboundary of lunar mare and highland (Delano et al., 2007). Black filledcircles represent lunar volcanic glass spherules (Delano, 1986, Tables 3 and5). Gray filled circles represent Apollo 17 high-Ti and very low-Ti marebasalts (Wentworth et al., 1979; Vaniman and Papike, 1977). Red filledcircles represent Apollo 12 mare basalts (Neal et al., 1994; Rhodes et al.,1977; Papike et al., 1976). Orange filled circles represent Apollo 12 soils(Laul and Papike, 1980; Morris et al., 1983). Pink filled circles representApollo 12 ropy glasses (Wentworth et al., 1994). Magenta filled circlesrepresent Apollo 16 HKFM glasses(Naney et al., 1976; Ridley et al., 1973;Kempa et al., 1980). Light and dark purple filled circles represent Apollo12 gray-mottled KREEP breccias and KREEP glass fragments respectively(Meyer et al., 1971). Light and dark blue filled circles and yellow filled cir-cles represents all glass spherules (Zellner and Delano, 2015, Appendix A).Green filled circles represent KREEP melt breccias (Sample No. 14063,14078, 14276, 14310, 60315, 62235, 65015, and 63355) (Tera et al., 1974;Norman et al., 2010). Square symbols represent lunar Mg-suite (SampleNo. 72415, 76535, 77075, and 78235). Cross symbols represent feldspathiclunar meteorites (Korotev et al., 2003). Plus symbols represent Ferroananorthosites (Sample No. 60025 and 15415). The integers marked in darkblue color represent the 40Ar/39-derived ages of exotic spherules. Opaquecolors are for overlapped circles. . . . . . . . . . . . . . . . . . . . . . . . 163
xix
Figure Page
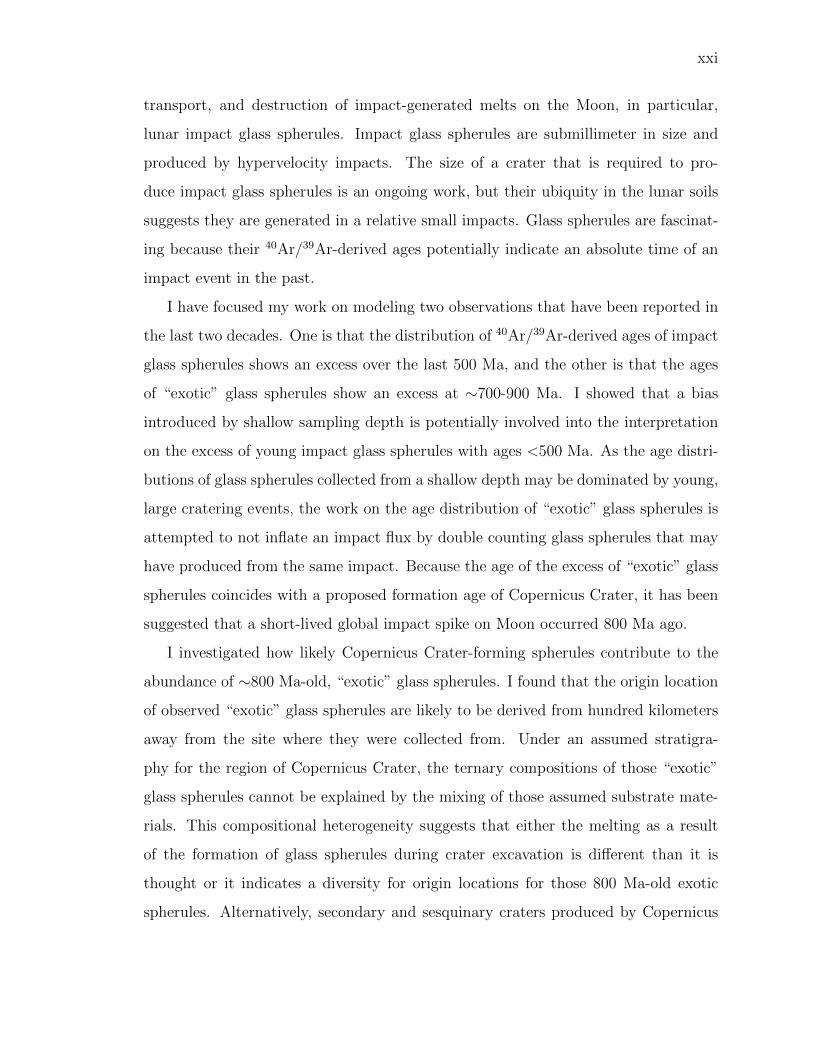
5.3 Cumulative number of fragments higher than ejection velocity from theSALES 2 simulation result for Copernicus Crater. The line points in blackcolor represent the cumulative number of fragments that escaped the lunargravity. The line points labeled by “All sesquinary impactors” depict thecumulative number of fragments that initially escaped the lunar gravitybut later hit the Moon. The x-axis is the ejection velocity of escapedfragments, and the y-axis is the cumulative number of escaped fragmentshigher than ejection velocity. The number of total fragments and theprecursor of sesquinary impactors are ∼1015 and ∼1013 respectively (>5cm). . . . . . . . . . . . . . . . . . . . . . . . . . . . . . . . . . . . . . . 164
5.4 Cumulative size frequency distributions (CSFD) of all Copernicus Crater-forming sesquinary impactor fragments and sesquinary impactors launchedat ∼3 km/s. . . . . . . . . . . . . . . . . . . . . . . . . . . . . . . . . . . 165
5.5 Crater size frequency distributions (SFD) for Copernicus Crater-formingsesquinary craters. The solid black lines from the top to the bottom showtotal crater production of the lunar surface for 800 Ma, 10 Ma, 0.1 Ma,50 years, and 1 year under the Neukum Production Function (NPF). Theline marked in blue color represent the size frequency distribution of allsesquinary crtaters. The green line is sesquinary crater SFD for ejectionvelocity of ∼3 km/s that we used the data of fragment sizes from SALES 2code as impactor sizes and velocity distribution and converted them tocrater sizes using π–group scaling laws. The red line is sesquinary craterpopulation that may form melt. . . . . . . . . . . . . . . . . . . . . . . . 166

xx
ABSTRACT
Huang, Ya-Huei Ph.D., Purdue University, December 2018. Impact Transport on theMoon. Major Professor: David A. Minton.
The ultimate goal of this dissertation was to better understand what the Apollo
sample collection tells us about the impact history of the Moon. My main research
tool is a computer code called Cratered Terrain Evolution Model (CTEM). CTEM
is a Monte Carlo landscape evolution code developed to model a planetary surface
subjected to impacts. While the main effect of impact cratering that CTEM simulates
is elevation changes of the landscape through the excavation process of craters and the
deposition of ejecta, I worked to extend the capabilities of the code to study problems
in material transport. As impact cratering is a dominant process on the surface of
Moon, the stratigraphy of lunar geology is thought to be composed of stacks of impact-
generated ejecta layers. Each individual impact generates ejecta that is sourced from
varying depths of the subsurface. This ejecta contains a rich abundance of material
containing information, including composition and datable impact products, such as
impact glasses. The extensions to the CTEM code that I developed allows me to
track all ejecta generated during a simulation and model the complex history of the
lunar regolith.
The new impact-driven material transport component of the regolith transport
code based on CTEM was calibrated with published remote sensing observations
across mare and highland contacts on the Moon measured by Clementine UV/VIS
camera. Material mixing process across mare and highland contacts is modeled by
diffusion problem. With CTEM, I showed that spatial heterogeneity of crater rays
(distal ejecta) is critical to model the impact-driven material transport process. An-
other new component that I have added to the CTEM code includes the production,
xxi
transport, and destruction of impact-generated melts on the Moon, in particular,
lunar impact glass spherules. Impact glass spherules are submillimeter in size and
produced by hypervelocity impacts. The size of a crater that is required to pro-
duce impact glass spherules is an ongoing work, but their ubiquity in the lunar soils
suggests they are generated in a relative small impacts. Glass spherules are fascinat-
ing because their 40Ar/39Ar-derived ages potentially indicate an absolute time of an
impact event in the past.
I have focused my work on modeling two observations that have been reported in
the last two decades. One is that the distribution of 40Ar/39Ar-derived ages of impact
glass spherules shows an excess over the last 500 Ma, and the other is that the ages
of “exotic” glass spherules show an excess at ∼700-900 Ma. I showed that a bias
introduced by shallow sampling depth is potentially involved into the interpretation
on the excess of young impact glass spherules with ages <500 Ma. As the age distri-
butions of glass spherules collected from a shallow depth may be dominated by young,
large cratering events, the work on the age distribution of “exotic” glass spherules is
attempted to not inflate an impact flux by double counting glass spherules that may
have produced from the same impact. Because the age of the excess of “exotic” glass
spherules coincides with a proposed formation age of Copernicus Crater, it has been
suggested that a short-lived global impact spike on Moon occurred 800 Ma ago.
I investigated how likely Copernicus Crater-forming spherules contribute to the
abundance of ∼800 Ma-old, “exotic” glass spherules. I found that the origin location
of observed “exotic” glass spherules are likely to be derived from hundred kilometers
away from the site where they were collected from. Under an assumed stratigra-
phy for the region of Copernicus Crater, the ternary compositions of those “exotic”
glass spherules cannot be explained by the mixing of those assumed substrate mate-
rials. This compositional heterogeneity suggests that either the melting as a result
of the formation of glass spherules during crater excavation is different than it is
thought or it indicates a diversity for origin locations for those 800 Ma-old exotic
spherules. Alternatively, secondary and sesquinary craters produced by Copernicus
xxii
Crater-forming debris are too small and low in impact velocity for a sufficient amount
of glass spherules. As a result, the Copernicus Crater alone cannot be responsible
for the excess of “exotic” glass spherules. It further implies that either the global
lunar impact flux increased ∼800 Ma ago or a better understanding on “exotic” im-
pact glass spherules is needed. In summary, we still have plenty of room for a better
understanding of Earth’s Moon.

xxiii
“All is Void and there is no Buddha.” Dajian Huineng

xxiv

1
1 INTRODUCTION
“ ... I distinguish two parts of it, which I call respectively the brighter and the darker.
The brighter seems to surround and pervade the whole hemisphere; but the darker
part, like a sort of cloud, discolours the Moons surface and makes it appear covered
with spots. Now these spots, as they are somewhat dark and of considerable size,
are plain to everyone and every age has seen them, wherefore I will call them great
or ancient spots, to distinguish them from other spots, smaller in size, but so thickly
scattered that they sprinkle the whole surface of the Moon, but especially the brighter
portion of it. These spots have never been observed by anyone before me; and from
my observations of them, often repeated, I have been led to the opinion which I
have expressed, namely, that I feel sure that the surface of the Moon is not perfectly
smooth, free from inequalities and exactly spherical but that, on the contrary, it is full
of inequalities, uneven, full of hollows and protuberances, just like the surface of the
Earth itself, which is varied everywhere by lofty mountains and deep valleys. Some
have learned the truth earlier and some have special talents.” The Sidereal Messenger
(1610) by Galileo Galilei, translated by Edward Stafford Carlos (Galilei et al., 1880).
Impact cratering is not only a fascinating process to study but craters also provide
us with a record of the bombardment history of our Solar System. Nearly every
imaged planetary surface is visibly marked by one or more impact craters, and impact
cratering is a dominant process among many planetary bodies. The study of impact
craters itself has a long and rich history (Drake and Komar, 1984).
2
1.1 A brief history of lunar impact craters
With the invention of the telescope in the sixteenth century, in 1609 Galileo be-
came the first to sketch the face of the Moon using a 5–6 inch long refraction telescope.
In his notes, Galileo mentions “spots”, uneven or crude surface of the Moon that cast
long shadows, for which he offered little explanation.
Lunar “spots”, circular depressions on the surface of Moon, were further studied
by Hooke in 1665. Hooke believed these “spots” to be pits on the top of lunar hills,
and that these pits were emptied of materials due to an eruptive force caused by
Moon’s internal movement (quakes). However, it was later learned that the center
depressions on the Moon are lower than their surrounding rims, leaving Hooke’s pits
hypothesis unconvincing. Nevertheless, Hooke continued to study the formation of
these depressions. He found that alabaster, after being removed from a boiling pot
of water, had small pits all over the surface as a result of gas bubbles bursting after
escaping the liquid. Unfortunately, there was no evidence supporting a liquid surface
of the Moon, and again leaving Hooke’s pit hypothesis disfavored.
In 1790-1800, Johann Hieronymus Schroter and William Herschel and others
started a systematic and comparative study of lunar craters, producing detailed lunar
crater maps. The term “crater” was commonly used to describe circular depressions
on the surface of the Moon visible through refraction telescopes from Earth (Shee-
han and Baum, 1995). Because of their resemblance to volcanic craters, the features
observed on the Moon were favorably accepted to be of the volcanic origin through
nineteenth and early twentieth century.
In 1893, Grove Karl Gilbert presented a serious discussion of various hypotheses,
including the impact theory or meteoritic origin of lunar craters (Gilbert, 1893).
In his famous impact experiment, Gilbert dropped clay balls vertically onto clay
surfaces and observed the outcome. Their resemblance to volcanic craters called into
question the volcanic origin of lunar craters (Pyne, 1980; El-Baz, 1980). However, his
experiment predicted an elliptical shape of a crater if the impactor was not dropped
3
exactly vertical to the surface. This seemed to suggest that the circularity of most
lunar craters would require all impactors that struck the Moon to have dropped to
the surface vertically, which is implausible.
The origin of lunar “craters” became clearer between 1910 and the mid-1950s.
In 1916, Ernst Julius Opik was the first to propose the idea that the lunar craters
are associated with meteors and high-velocity collisions (Opik, 1916; Racki et al.,
2014). Opik and Morozov used the physics of explosion to explain the fundamentals
of impact cratering. This pioneering work was brilliant but not appreciated widely
at that time. Despite opposition to Gilbert’s impact theory, in 1920-21, eight years
after his hypothesis of continental drift, Alfred Lothar Wegener (Wegener, 1920a;
Wegener, 1920b; Wegener, 1921) considered the impact origin of lunar craters. He
realized that a lunar impact projectile must travel at a high velocity, greater than the
lunar escape velocity of 2.38 km/s. Wegener experimented with cement powder for
target and projectile (Wegener, 1921). During impact, the projectile disintegrated as
it impacted into the target, and the target surface was hollowed because pre-existing
materials were pushed outward. Furthermore, Wegener varied the color of the cement
projectiles and observed ray patterns streaking across the gray colored target cement.
These ray patterns are similar to the observed streaks surrounding some lunar craters.
As more and more explosion experiments were tested in World War I and World
War II, the understanding of the impact cratering process improved. The progress is
reflected in the literature terms used to describe lunar craters. For example, Ralph
Belknap Baldwin in 1949 and Kathleen Mark in 1987 used the terms like “bomb
craters” and “meteorite craters” to describe impact craters (Baldwin, 1949; Mark,
1987). Intriguingly, it is unknown who initially joined together “impact” and “craters”
into the term that we used today (personal communication with Jay Melosh).

4
1.2 Impact cratering mechanics
Impact craters form when a projectile or impactor, moving at up to tens of kilo-
meters per second, hitS a planetary surface. The impact transfers a tremendous
amount of energy to the target surface and immediately alters the geology of the
region. When discussing the physics of impact cratering, it is common to divide the
cratering process into three main stages (Melosh, 1989). The first stage, contact and
compression, begins once a projectile touches down on a surface. This is a rapid
process and creates a strong shock wave within the target surface and the projectile.
Once the shock wave reaches the side of the projectile opposite the contact point, it
reflects, and the rarefaction wave travels back toward the contact point. The target
materials are compressed by the impactor until the shock rarefaction wave travels
from the contact point to the end of the impactor. At this point the second stage,
excavation, takes effect. The flow of excavating materials opens up a cavity, carry-
ing with it fragmented, melted or vaporized target materials. The flow carries this
mixture of materials and ejects it from the cavity, leaving behind a deep depression
called transient crater. Meanwhile, materials left within the crater cavity begin to feel
the force of gravity and undergo a collapse. This stage is called crater modification.
Excluding post-cratering process in which high temperatures can linger for long after
crater formation, the crater modification stage is the most protracted process. The
modification stage has the most control over the final crater shape (simple crater,
complex crater, peak-ring crater, or multi-ring basin) (Melosh, 1989).
The contact and compression stage lasts for as long as the projectile is penetrating
the target (Shoemaker, 1959). Resistance upon penetration causes physical changes,
including the distortion of an impactor and a high pressure phase of compressed
materials. Materials within a region where the free surface of the target meets an
edge of the impactor can be ejected the earliest (spallation)(Melosh, 1984). Once the
propagating shock wave produced at the initial contact point reaches the rear side
of the impactor, it reflects off as a rarefaction wave (tensional waves or expanding

5
waves). The complicated relationship between shock release and compressed mate-
rials, which are likely inhomogeneous geological materials, is commonly visualized
by a P-V plot (pressure-volume diagram) and continuous thermodynamic paths (see
Figure 1.1) (Melosh, 1989). The maximum shock pressure is achieved during the
contact and compression stage. The average shock pressure, though lower than the
maximum shock pressure that a material actually experiences, can be approximated
by the planar impact approximation. In this approximation, a slab with a finite
thickness moving at some velocity collides with an infinite half space (Melosh, 1989,
Section 4.5). Since the contact and compression stage readily determines the dis-
tribution of shock pressure, a planar impact approximation provides the first order
approximation of vapor and melt production for a given impact (Melosh, 1989). In
the literature, researchers often combine the planar impact approximation (the esti-
mates of maximum shock pressure) with a semi-analytical model, called the Gamma
Model (Croft, 1982), to describe the distribution of shock pressure (see Section 2.5).
Examples of the limitation on planar impact approximation include the inability to
model either an oblique impact or effects of the shapes of the projectile. This ap-
proximation works the best along the normal direction of a moving projectile to the
target surface (Melosh, 1989).
When rarefaction waves reflect off the rear side of an impactor, the tensile waves
execute an upward motion through the compressed materials due to a reduction in
pressure, unloading the compressed materials of the impactor (Bjork et al., 1967,
Figure 2-1c). After unloading, the next phase, the excavation stage, roughly begins
(Melosh, 1989). The excavation stage can be divided into two different physical
processes: 1) shock detachment and 2) crater excavation flow (Bjork et al., 1967).
Shock detachment occurs where shock fronts propagate away from the impact point
(downward direction). Shock waves continue to accelerate more target materials as
the wave propagates and weakens. The shock pressure falls off approximately as the
inverse square of the distance from the impact point (Melosh, 1985). In a far-reaching

6
Figure 1.1.: Release adiabat curves after a high shock pressure. The Rayleigh line
is a straight line connecting the initial pressure and volume to the final pressure
and volume (final shock state). The Hugoniot curve depicts shocked (compressed)
materials in the P–V diagram, in which shock compression is irreversible. Release
from high shock pressure follows the adiabatic trend in the P–V diagram (reversible
process). The final volume of release from high shock pressure is larger than the
initial volume (V0) because a fraction of materials is melted. The difference between
triangle-shaped area bound by the Rayleigh line and vertical line at specific volume
of V and horizontal line at zero pressure and an area bound by the Hugoniot curve is
approximately heat waste by shock. The diagram to the right shows different release
curves for different shock states (shock state 1, 2, 3, and 4), and the final state of
those release curves depending on a phase diagram (S: solid; L: liquid; V: vapor) for
a given geological material. Modified from Figure 3.10 in (Melosh, 1989).
field, the shock pressure essentially drops to zero. Once the shock waves are detached,
it no longer interacts with the rest of the propagating shock waves (Bjork et al., 1967).

7
In nuclear explosion experiments, it was discovered that target materials far away
from the center of an explosion still move at some residual velocity instead of zero
velocity (Bjork et al., 1967). Although a shock pressure drops to almost zero in a
large distance, the thermodynamic irreversible process of shock deformation during
cratering causes a residual velocity field remaining in the target materials that begin to
flow along with the opening of a crater cavity (Melosh, 1985). The residual velocity
also relates to the movement of shock detachments and the growth of a transient
crater (Bjork et al., 1967; O’Keefe and Ahrens, 1981). The opening and growth of
a crater cavity stops as the strength of target surface and lithostatic pressure from
surrounding rocks halts the motion. The growth of a crater cavity is approximately
developed into vertical and lateral directions. The cessation of lateral direction of a
crater cavity growth controls the crater diameter; it is relative easier to comprehend
and may be analytically described using the concepts of Maxwell Z-model, the π-
scaling laws, and residual velocity (Ivanov, 1983; Yamamoto et al., 2006; Richardson
et al., 2007; Barnouin-Jha et al., 2007; Yamamoto et al., 2009; Yamamoto et al.,
2017; Kurosawa and Takada, 2019). Excavation flow near the surface intersecting a
growing hemisphere continues to move outward until reaching the maximum diameter.
Right before a cavity undergoes gravitational collapse, the cavity is referred to as a
transient crater (its diameter is measured from rim to rim). As for the vertical growth
of a crater cavity (crater depth), it depends on the resistance raised from the target
material strength and isostatic pressures of surrounding rocks during the downward
displacement of an excavation flow (Croft, 1980; O’Keefe and Ahrens, 1981; Stewart
and Valiant, 2006).
While the main shock wave sends materials downward, rarefaction waves moving
downward reduce the pressure gradient and cause some shocked materials to move
in an upward direction (Melosh, 1989). Assuming that the concept of residual ve-
locity can characterize materials during excavation stage, the regions closer to the
free surface attain more upward velocity from rarefaction waves than the regions in
a lower part of the target surface (due to its weaker rarefaction). Overall, the inter-
8
action between the strong shock waves created by the plunging projectile inducing
strong shock waves and rarefaction waves reflecting off from the free surface leads a
unique geometry for the crater excavation flow (Melosh, 1989). Moreover, the max-
imum velocity of this excavation flow does not exceed the residual velocity, so the
excavation flow can be considered as subsonic and treated as an incompressible flow
or as streamlines. The sound speed of a geological material is on the order of few
kilometers per second if the material is not porous.
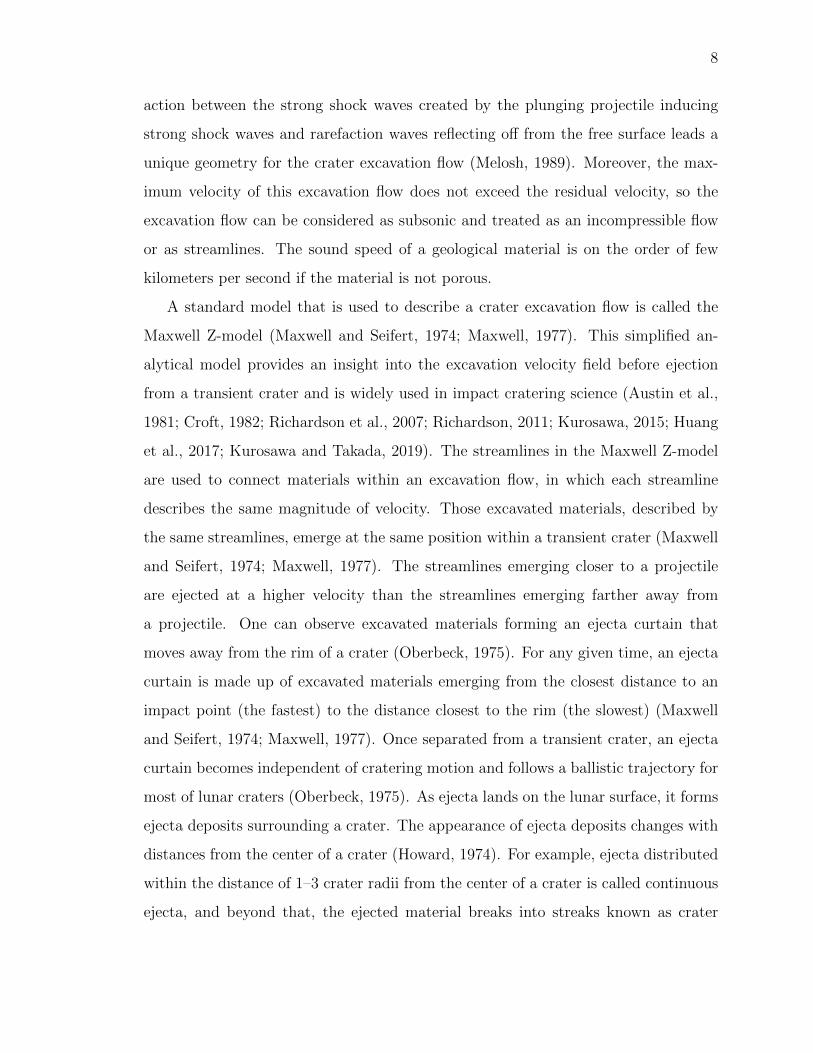
A standard model that is used to describe a crater excavation flow is called the
Maxwell Z-model (Maxwell and Seifert, 1974; Maxwell, 1977). This simplified an-
alytical model provides an insight into the excavation velocity field before ejection
from a transient crater and is widely used in impact cratering science (Austin et al.,
1981; Croft, 1982; Richardson et al., 2007; Richardson, 2011; Kurosawa, 2015; Huang
et al., 2017; Kurosawa and Takada, 2019). The streamlines in the Maxwell Z-model
are used to connect materials within an excavation flow, in which each streamline
describes the same magnitude of velocity. Those excavated materials, described by
the same streamlines, emerge at the same position within a transient crater (Maxwell
and Seifert, 1974; Maxwell, 1977). The streamlines emerging closer to a projectile
are ejected at a higher velocity than the streamlines emerging farther away from
a projectile. One can observe excavated materials forming an ejecta curtain that
moves away from the rim of a crater (Oberbeck, 1975). For any given time, an ejecta
curtain is made up of excavated materials emerging from the closest distance to an
impact point (the fastest) to the distance closest to the rim (the slowest) (Maxwell
and Seifert, 1974; Maxwell, 1977). Once separated from a transient crater, an ejecta
curtain becomes independent of cratering motion and follows a ballistic trajectory for
most of lunar craters (Oberbeck, 1975). As ejecta lands on the lunar surface, it forms
ejecta deposits surrounding a crater. The appearance of ejecta deposits changes with
distances from the center of a crater (Howard, 1974). For example, ejecta distributed
within the distance of 1–3 crater radii from the center of a crater is called continuous
ejecta, and beyond that, the ejected material breaks into streaks known as crater

9
rays (Howard, 1974). In addition, the landing process of ejecta deposits may cause
ballistic sedimentation as energetic ejecta churns up the surface materials (Oberbeck,
1975).
The modification stage begins as soon as the transient crater forms (Melosh, 1989).
Upward and outward motion of the transient crater cease, and subsequently the crater
is subjected to the downward force of gravity, especially for materials at the rims of
the transient crater (Melosh, 1989). Before the modification stage, the material in
the rim were more or less fragmented and shocked in varying degrees. The downward
pull of gravity turns those loose materials to flow easily. The outcome of this stage
determines the final morphology of the impact crater. At this stage, the influence of
gravity on the gravitational collapse is significant (see Section 1.3).
1.3 Morphology of impact craters
Just after formation, the morphology of most impact craters fits into one of four
main types, which depends on most strongly on the size of the crater and the surface
gravity of the target body: 1) simple craters, 2) complex craters, 3) peak-ring craters,
and 4) multi-ring basins. Simple craters are pits with a bowl-shape and elevated
rims. Most simple craters resemble the initial transient crater, but shallower. The
bottom of a simple crater is usually filled with a mixture of fragmented, shocked,
and melted rocks called breccia lens, which forms as a consequence of debris sliding
back into the crater after the collapse of the transient crater (Shoemaker, 1959). The
breccia lens is porous and if the crater formed in competent rock may be detected
as a gravity anomaly (negative gravity anomaly or mass deficiency) (Pilkington and
Grieve, 1992). The floor beneath the fragmented breccia lens is thought to be the
bottom of a transient crater.
On the Moon, simple craters have a depth to diameter ratio of roughly 1:5 (Pike,
1977). This ratio changes when a final crater diameter reaches ∼15–20 km (simple-to-
complex crater transition) (Dence, 1965). This transition is abrupt; the morphology
10
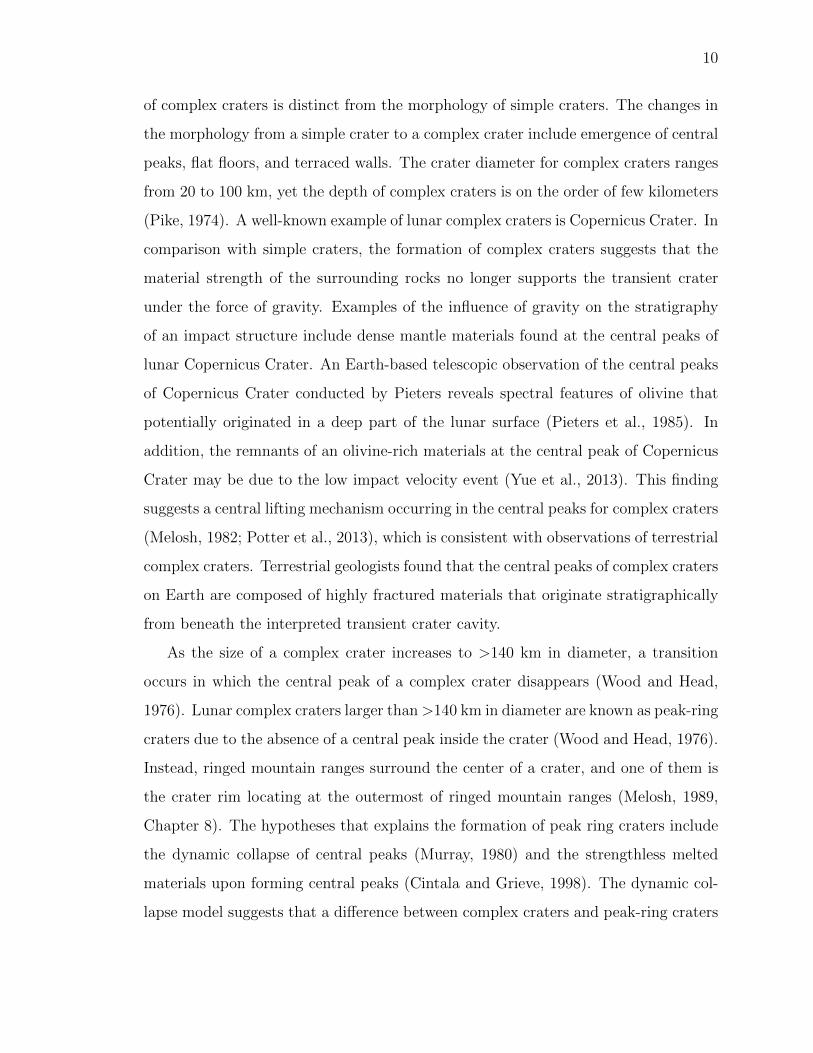
of complex craters is distinct from the morphology of simple craters. The changes in
the morphology from a simple crater to a complex crater include emergence of central
peaks, flat floors, and terraced walls. The crater diameter for complex craters ranges
from 20 to 100 km, yet the depth of complex craters is on the order of few kilometers
(Pike, 1974). A well-known example of lunar complex craters is Copernicus Crater. In
comparison with simple craters, the formation of complex craters suggests that the
material strength of the surrounding rocks no longer supports the transient crater
under the force of gravity. Examples of the influence of gravity on the stratigraphy
of an impact structure include dense mantle materials found at the central peaks of
lunar Copernicus Crater. An Earth-based telescopic observation of the central peaks
of Copernicus Crater conducted by Pieters reveals spectral features of olivine that
potentially originated in a deep part of the lunar surface (Pieters et al., 1985). In
addition, the remnants of an olivine-rich materials at the central peak of Copernicus
Crater may be due to the low impact velocity event (Yue et al., 2013). This finding
suggests a central lifting mechanism occurring in the central peaks for complex craters
(Melosh, 1982; Potter et al., 2013), which is consistent with observations of terrestrial
complex craters. Terrestrial geologists found that the central peaks of complex craters
on Earth are composed of highly fractured materials that originate stratigraphically
from beneath the interpreted transient crater cavity.
As the size of a complex crater increases to >140 km in diameter, a transition
occurs in which the central peak of a complex crater disappears (Wood and Head,
1976). Lunar complex craters larger than>140 km in diameter are known as peak-ring
craters due to the absence of a central peak inside the crater (Wood and Head, 1976).
Instead, ringed mountain ranges surround the center of a crater, and one of them is
the crater rim locating at the outermost of ringed mountain ranges (Melosh, 1989,
Chapter 8). The hypotheses that explains the formation of peak ring craters include
the dynamic collapse of central peaks (Murray, 1980) and the strengthless melted
materials upon forming central peaks (Cintala and Grieve, 1998). The dynamic col-
lapse model suggests that a difference between complex craters and peak-ring craters
11
is the maximum height of central peaks reached during the formation. During the
formation, it is theoretically possible that the maximum height of central peaks in
peak ring craters tend to be higher than the ground surrounding the crater, leading to
the collapse of the central peaks (not observed from the shape of the final crater) (see
Figure 8.14 in the book by Melosh, 1989) (Murray, 1980). Alternatively, target rocks
beneath the impact point would have been melted such that does not raise above
the rim of a transient crater (Cintala and Grieve, 1998). The recent advances in-
cluding numerical simulations, remote sensed data, and terrestrial drilling expedition
appear to support the dynamic collapse model. For example, the drilling expedition
to the peak ring of Chicxulub Crater by the International Ocean Discovery Program
(IODP) and International Continental Scientific Drilling Program (ICDP) sampled a
fractured and shocked materials sourced from the crystalline basement (Morgan et al.,
2016), which is consistent with the prediction by the numerical simulation result for
Chicxulub Crater (Collins et al., 2008).
With increasing the size of a crater, more than one ringed mountain range as
seen in a peak-ring crater form surrounding the center of a crater. Multi-ring basins
(Hartmann and Kuiper, 1962), such as Imbrium Basin and Orientale Basin, are among
the largest impact features on the Moon. South Pole-Aitkin (SPA) Basin is the largest
multi-ring impact basin on the Moon, but any of rims may have been gone. Orientale
Basin is the youngest and best-preserved multi-ring basin on the Moon, consisting
of at least four circular rings surrounding the center of the basin. The four rings of
Orientale Basin form mountain ranges, with the outermost ring being the tallest. The
highest peak formed by Orientale Basin is up to 6 km in elevation likely produced by
Orientale Basin ejecta (Moore et al., 1974, Figure 13). In comparison, Mt. Everest,
the highest continental mountain peak on Earth, is 8 km in elevation. Besides ring
mountains, structures like escarpments, flat-lying plains and radial troughs scoured
by energetic basin ejecta are also prominent geological features of multi-ring basins
(Head, 1974; Moore et al., 1974). Large basins have a dominant positive gravity
anomaly at the basin center due to a dense mantle plug formed during cratering
12
process (Melosh and McKinnon, 1978). These gravity anomalies, called mascons
(Muller and Sjogren, 1968), can have a significant effect on the trajectory of a passing
spacecraft. The origin of multi-ring basins is still debated, but the ring tectonic theory
(Melosh and McKinnon, 1978) appears to achieve several predictions by numerical
simulations and geophysical observation data for large lunar basins (Potter, 2015;
Johnson et al., 2016). In particular, the observation data of GRAIL measurement
and photometric examination of faults for Orientale Basin suggest that the ringed
mountains are associated with the large-scale fault structures (Head, 1974; Nahm
et al., 2013; Zuber et al., 2016). It is likely that due to the collapse of a transient
crater of a multi-ring basin, the mantle materials that were initially uplifted slash
inward and plunge into crust, creating an extensive fracture along the pull of cold
crust materials with it (Potter, 2015; Johnson et al., 2016).
1.4 Lunar crater based chronology and the origin of a planetary cratered
surface
Since the realization that lunar craters were formed by impact, speculation began
as to the sources of the projectiles. In 1918, Hirayama proposed that some asteroids
formed as a consequence of breakup of a larger body (Hirayama, 1918). Because those
asteroids are fragments broken from their parent body, they share similar orbital
elements. Asteroids with similar orbital elements are grouped as an asteroid family.
As a small asteroid on a collision course with a massive body will accelerate to a
velocity greater than the escape velocity, forming an impact crater on the surface of
the massive body (Opik, 1916; Gilbert, 1893). The distribution of impact craters
on the surface is a potential record of the impactor population since the formation
of the massive body. Knowing impactor populations in the past is important to
us because those impactor populations may not exist today. Consequently, sampling
impact records from different surfaces from either the same planetary body or different

13
planetary bodies can help us to understand how a primordial distribution of fragments
leftover from the formation of the Sun may have evolved.
In 1960, Opik was first to recognize the relationship between the dynamic origin
of our Solar system and the evolution of a cratered surface (Opik, 1960). Opik in
1958 estimated the probability of small bodies (Apollo Near-Earth Objects and non-
periodic comets) hitting the planets, such as Mars (Oplk, 1958). He used the 812
lunar craters on Western Mare Imbrium over 465,000 km−2 counted by the author
of a print from Mt. Wilson Observatory in 1919 (Fitzgerald, 1953). He assumed
that those 812 lunar impact craters were formed over the 4.5 Gy of the Solar System
history. The diameters of 812 counted craters, measured from rim to rim, range from
600 m to 73.2 km.
Opik noticed that the formation of the maria must be more recent than the high-
lands (the continents in his original paper) due to the less-densely cratered surface
of the maria (Opik, 1960). Earlier, Baldwin had the statement on the observation of
a younger maria than highlands in his book of The Face of the Moon in 1949. Opik
argued that small meteorites were prevented from forming craters by the dust cover
of the maria that remnants of impact vapor and fragments had accumulated, so only
large meteorites were responsible for craters forming on the top of the maria. As
a result, the size frequency distribution of the crater population of the maria more
closely related to the present-day size frequency distribution of asteroids than the size
frequency distribution of the highlands. Once the scaling between impactor size and
crater size is accounted for, Opik used 20 for the size ratio of a crater to a projectile
assuming impact velocity of 15 km/s (Opik, 1958). The cumulative number of esti-
mated projectiles in 4.5 Gy is consistent with his partly observed, partly extrapolated
numbers of asteroids. In 1963, Baldwin in his book of The Measure of the Moon also
recognized that the cratering rate in the past must have been higher than the present
day.
Opik concluded that the present frequency distribution of small bodies interpreted
from the crater count of the maria might have remained constant since the formation

14
of the maria. The present-day size frequency distribution of samll bodies might also
be different from the primordial planetesimal distribution because the planetesimals
were rapidly swept out in the early Moon. Opik suggested that the surface of the
maria serves as a “counter”, which records the impacts of present small bodies. In
1965, Hartmann used the known number of craters and average age of the Canadian
Shield to estimate the terrestrial and lunar impact flux. He used an exposure age
of <2 billion years for the Canadian Shield (Hartmann, 1965). Using his estimated
impact flux, Hartmann obtained an age of 3 Gy for the average lunar mare, which is
within the radiogenic ages of mare basalts returned from the later Apollo missions.
It is noteworthy that Opik was perhaps the first to adopt the concept of the cu-
mulative size-frequency distribution to characterize the distribution of impact craters
on a planetary body (Opik, 1960). In the same year, Kreiter converted the table data
compiled by Opik to a figure (Kreiter, 1960). Two years before 1960, Kuiper found
that the mass distribution of asteroids in his systematic survey can be expressed as
either a cumulative or incremental size-frequency distribution (Kuiper et al., 1958).
The cumulative SFD is preferred over the incremental size-frequency distribution in
which lists the number of craters within a range of sizes in diameter from Di to Di+1
per unit area. The cumulative SFD calculates the number of craters greater than D
per unit area, independent of bin size. More importantly, both size-frequency dis-
tribution are well-approximated using power-law functions of crater diameter, over
some range,
N(> D) = CDb (1.1)
where N(> D) represents the number of craters larger than the diameter of a crater
(D) per unit area, C is a constant, equivalent to N(> 1), which is the total number
of counted craters per unit area for D = 1 in whichever the unit system is being used
(typically km) Ds is the smallest crater in a counted area and b is an exponent or a
population index in (Opik, 1960). In modern crater counting, the cumulative crater
15
size-frequency distribution is widely used, and the selection of a crater count area is
set to a homogeneous geological unit.
The production function for a given cratered surface represents a time-dependent
size distribution of impactors (Neukum and Ivanov, 1994). To create a production
function, a crater count study must be calibrated with radiogenic ages that are asso-
ciated with surfaces of a single age and crater number density across a range of sizes.
Because a production function serves as a chronology of a cratered surface, it can be
used to assign a specific age to a crater counted unit (Neukum and Ivanov, 1994).
Due to radiometrically-dated lunar samples from the U.S. Apollo and Soviet Luna
programs and a rich bombardment record of the Moon, the lunar production function
or lunar chronology is widely used and applied to planetary bodies other the Moon
using models to extrapolate the lunar cratering record to other bodies (Chapman and
McKinnon, 1986).
One of the most commonly-used lunar chronology is the Neukum Production
Function (NPF). The NPF is an 11th-degree polynomial function, which describes
the cumulative size-frequency distributions of lunar craters larger than a specific size
in diameter, and a mixed exponential decay and a linear function to describe the
rate of crater accumulation over the age of the Solar System. The function was
fit from crater counts obtained from different parts of the lunar surface for various
ages (Neukum, 1983; Neukum et al., 2001; Neukum and Ivanov, 1994). The NPF
is expressed as the cumulative number of craters with diameters larger than a given
diameter of D normalized by the size of a crater counted area and an assigned surface
age (impact flux, km−2 Gyr−1). By normalizing area and time for a given counted
surface, it is possible to account for all range of sizes of craters. For example, the
small area of the Apollo 15 landing site does not contain larger craters (e.g., 20 km
in diameter) because large craters are only statistically expected over a long-term
period and a large area. On the other hand, small craters on a large area are subject
to degradation and obliteration processes that make them uncountable. Normalized
SFDs obtained from different areas of a lunar surface can be used to construct a full

16
range of a production function. However, the NPF assumes that the size-frequency
distribution of an impactor population was remained the same over time (<4 Ga).
1.5 Lunar origin and bombardment environment
Not only has the Moon been a constant companion to us and our ancestors, the
Moon is also the site of the first extraterrestrial human exploration. The Apollo
missions have inspired many generations of scientists. The valuable samples returned
by the Apollo missions contain physical evidence of geological processes that have
occurred on the Moon over time (Wood, 1970; Wood et al., 1970c; Wood et al.,
1970a). For example, dark basaltic fragments found in returned lunar soils originate
in the extensive volcanic mare plains. These basalt plains are visible to the naked eye
as dark patches on the lunar surface. Light-toned anorthosites found in lunar mare
soils originate in the relative brighter highland plains. The anorthositic highlands
dominate the lunar surface, occuping 83% of the surface (Head and Wilson, 1992).
This observation supports the hypothesis that the primary compositional highlands
units formed as a floating layer on an early magma ocean (Wood et al., 1970b). The
oldest anorthosites returned from the Apollo missions range from 4.56 Gyr to 4.29
Gyr in age and may represent the most ancient lunar crust (Alibert et al., 1994; Borg
et al., 1999).
As soon as the first crust formed on the Moon, it was subjected to intense impact
cratering, which formed the fractured and porous surface layer called “regolith” and
“megaregolith” (Hartmann, 1975; McKay et al., 1991). This continuous cratering
process operated when lunar volcanism may have been active, and the impact rate
was much higher than it is today. Just a few grams of lunar soils contain a variety
of materials, including from mare basalt fragments, impact breccias, agglutinates,
impact glass spherules, and lunar highland crustal materials. In particular, impact
breccias and impact glass spherules are of great interest to the lunar bombardment
community because these can be used to derive a radiogenic age for the sample. In

17
many case, the radiogeneic age of these melts is that of the cratering event that
formed it. A compiled radiogenic age distribution of impact-related fragments from
a landing site may be correlated to an impact rate experienced by the landing site
over its history. By linking samples collected from various lunar landing sites, it
is possible to derive a global lunar impact rate or a lunar bombardment history,
potentially dating back to the very beginning of our Solar System.
Radiometrically-dated age distributions of impact generated melt or glass samples
have created at least two long-standing open questions concerning the lunar impact
flux, 1) the duration and magnitude of Late Heavy Bombardment (LHB) 3.9 Ga ago,
and 2) whether or not the impact rate has been constant over the last three billion
years. This dissertation will focus on the second of these two questions, however, for
completeness, the rest of the introduction here will be devoted to a brief description
to the first of these two controversies.
1.6 The first billion lunar bombardment record and a relationship with
returned samples
The most well-known controversy in the field of a lunar bombardment is the
hypothesis of Late Heavy Bombardment ending at ∼3.9 Ga (Tera et al., 1974; Turner
and Cadogan, 1975). Most recently, the Late Heavy Bombardment has been linked
to a dynamical scenario called the Nice Model, which suggests that a giant planet
orbital instability-driven impactor population bombarded the inner Solar System 500-
600 million years after the early phase of planetesimal accretion (Gomes et al., 2005).
This model was initially created to explain an excess of the radiometrically-dated age
distributions of returned lunar impact melt rocks and breccias (Bottke and Norman,
2017). Impact melt rocks (whole rocks broken from a massive impact-generated melt
body) and impact melt breccias (assemblage of broken rocks with different types that
may be glued together by fine-grained matrix such as silicate melts for the Moon)
are considered melt products of basin scale cratering events. The U–Pb, Rb–Sr, and
18
Ar–Ar-derived ages of impact melt rocks and breccias in Apollo 12, 14, 15, and 16
samples show that a cluster of impact events occurred at ∼3.9 Ga, and very few ages
are older than 4.1 Ga (Tera et al., 1973; Tera et al., 1974). The initial finding by Tera
et al. shows that in the Apollo 14 impact melt breccias, several U–Pb radiometric
ages with a wide range of composition were clustered in less than two hundred million
years (Tera et al., 1974). Because the wide range of composition among their analyzed
samples indicates different provenances of the lunar surface, they suggested that one
or more impacts must have occurred at ∼3.9 Ga.
In order to explain an excess of radiogenic ages at ∼3.9 Ga derived from impact
melt rocks and breccias, Tera et al. proposed the terminal lunar cataclysm hypothesis
(Tera et al., 1973; Tera et al., 1974). The terminal lunar cataclysm hypotesis states
that our Moon experienced several possible episodes of intense bombardment in a
short period of time. The most recent bombardment all ended at ∼3.9 Ga, and
that they all formed Imbrium, Crisium, Orientale Basin and also possibly others
formed within a period of ∼30 Ma. Ryder proposed a scenario of the terminal lunar
cataclysm in which essentially very few impacts occurred before ∼3.9 Ga, and then
all large basins on the lunar nearside formed in a very short period of time around
3.85 Ga (Ryder, 1990; Dalrymple and Ryder, 1993; Dalrymple and Ryder, 1996).
Besides a similarity in ages, many of the lunar impact samples carry an enhanced
concentration of incompatible elements and heat-producing elements, such as Potas-
sium (K), Rare Earth Elements (REE), and Phosphor (P), also known as KREEP.
KREEP was first discovered as a mysterious component in Apollo 12 mare soil sam-
ples but the link between KREEP and Imbrium Basin was not recognized until the
Apollo 14 mission, and the geological provenance now known as KREEP terrain where
Imbrium Basin formed was not mapped until Apollo 15 and 16 (Metzger et al., 1973;
Metzger et al., 1977).
Planners for the Apollo 14 mission hoped to sample impact ejecta from Imbrium
Basin, the second largest impact basin on the Moon (LSPET, 1971). The purpose of
obtaining Imbrium basin ejecta samples was to determine the absolute age of Imbrium

19
Basin, and in doing so to determine the ages of the other large basins that appear
to have formed in the same period of time (LSPET, 1971). The Apollo 14 crew and
spacecraft landed in the Fra Mauro Formation, thought to have been formed from
Imbrium Basin ejecta. A local young crater, Cone Crater, ∼340 meters in diameter,
would have excavated the Imbrium Basin ejecta, bringing it to the surface and allow-
ing it to be sampled by the Apollo 14 crew (Swann et al., 1977). Interestingly, many
Apollo 14 rocks and mare soil samples are enriched in KREEP material (LSPET,
1971). It was not until the Apollo 15 and 16 missions, with their orbital X-Ray and
Gamma-Ray spectrometer experiments that it was understood that Imbrium Basin
lies entirely in a region with a high concentration of Thorium (Metzger et al., 1973;
Metzger et al., 1977). Thorium behaves chemically similar to rare earth elements,
so it is used to map the boundary of the Procellarum KREEP Terrane (Jolliff et al.,
2000). It is highly likely, therefore, that KREEP materials sampled by the Apollo
14 crew and the Procellarum KREEP Terrane mapped by Apollo 15 and 16 orbital
spectrometers have a similar origin. The relative chronological order of the Imbrium
Basin forming event and the formation of the enhanced Thorium region are still de-
bated, but it is likely that Imbrium Basin has poked through the underlying enhanced
Thorium region and excavated them to the surface (Wilhelms, 1987).
The age of Imbrium Basin is estimated from 3770 Ma to 3938 Ma based on Apollo
15 KREEP basalt rock (Appennine Bench Formation), Apollo 16 melt rocks, and
Apollo 14 impact melt breccias (BVSP, 1981; Deutsch and Stoffler, 1987; Stadermann
et al., 1991; Merle et al., 2014). An exact age of Imbrium Basin is still controversial
because some suggest the high concentration of KREEP material in impact breccias
does not necessarily prove the Imbrium Basin’s ejecta (Merle et al., 2014). Despite
this, those radiometric ages can be linked to the crater density that has been counted
on Imbrium Basin’s ejecta. Other crater densities counted from geological units can
be compared to the crater density of Imbrium Basin ejecta, thus their approximate
ages can be inferred. The inferred ages based on Imbrium Basin ejecta’s radiometric
age are one of the calibration points used to establish the lunar chronology (Neukum,

20
1983; Neukum et al., 2001), and other radiometric ages obtained for the purpose of
calibration include mare basalt rocks and ejecta or rimmed material of local young
craters such as North Ray Crater from Apollo 16 landing site and Cone Crater from
Apollo 14 landing site.
Using the age of impact basins to calibrate the lunar chronology is problematic
for two main reasons. First, a correlation between an impact melt and an individual
basin is unclear. Even today, there are major uncertainties regarding the relationship
between the formation of Imbrium Basin and KREEPy materials that the Apollo
astronauts sampled. Second, almost all the samples returned from the lunar manned
missions are sourced from the region around Imbrium Basin. It is likely that Im-
brium Basin ejecta could be a main contributor to the radiometrically-derived ages
of KREEPy materials. Regardless, attempts have been made to distinguish those ra-
diogenic ages of ∼3.9 Ga and associate it to specific basins (Stoffler et al., 1985). As
a consequence of basing the lunar chronology on those radiogenic ages derived from
samples highly contaminated by KREEPy materials, the chronology prior to the old-
est dated mare basalts (James and Wright, 1972, e.g., 3.8 Ga-old sample 10062) could
be biased.
The origin of ∼3.9 Ga-old impact melt samples still remains debated. One of the
uncertainties regarding their origin is related to compositional variation. Researchers
are not in agreement about the interpretation of compositional variation in the 3.9
Ga-old melt samples collected from different landing site (e.g., Apollo 16) (Ryder,
1990; Haskin et al., 1998). We noted that the abundance of KREEP concentration or
Uranium measured from returned lunar samples appears to correlate with radiogenic
ages (Maurer et al., 1978; Norman and Nemchin, 2014). For example, Maurer show
that potassium contents in Apollo 17 sample 73215 and several grouped Apollo 16
samples (63503,17, 67603,1 and 67703,1) tend to be higher in younger fragments (<4
Ga) (Maurer et al., 1978).
Other hypotheses disputing the LHB are concerned with the preservation of an-
cient impact records, as well as reliability of radiometric techniques. The stonewall

21
hypothesis proposed in Hartmann describes an impact rate prior to 4 Ga as being so
high that all older datable impact melt products were destroyed due to the pulver-
ization of grains (Hartmann, 1975). Although modeling of the pulverization of melt-
bearing lunar grains is needed for a further examination of the stonewall hypothesis,
evidence for preservation of older impact records is not uncommon. Volcanic basalts
older than 4 Ga have not been dispersed or buried, suggesting destruction from pre-
vious impacts >4 Ga is not the primary cause for a perceived spike around 3.9 Ga
(Ryder, 1990). Moreover, impact melt ages of L and H chondrites (though no LL) as
old as 4.4 Ga can survive (Swindle and Kring, 2008). This opposes the destruction
sampling bias described by the stonewall hypothesis. Besides destruction sampling
bias as proposed by the stonewall hypothesis, other types of sampling bias, such as
partial argon resetting and impact gardening, call the interpretation of bombardment
history into question (Boehnke and Harrison, 2016; Michael et al., 2018).
Alternatively, impact glass spherules and zircons, as opposed to impact melt rocks
and breccias, may provide some insights to the occurrence of Late Heavy Bombard-
ment. Zellner reported that lunar impact glass spherules older than 3.8 Ga are un-
common in regolith samples (Zellner, 2018). They proposed that, over time, im-
pacts might destroy older glass spherules (Zellner and Delano, 2015; Zellner, 2017).
Moreover, thermal destruction of a glass spherule, especially argon diffusion, has a
selection preference on composition of glass spherules (basaltic versus anorthositic)
(Zellner and Delano, 2015). Zircons also appear to tell a different story about the
early bombardment history of the Moon. Instead of a spike at 3.9 Ga, the U–Pb
zircon geochronology from Apollo 16 melt breccia and 14 and 17 melt breccias show
a wide range of age distribution prior to 4 Ga (Hopkins and Mojzsis, 2015; Nemchin
et al., 2008; Nemchin et al., 2009; Grange et al., 2009; Norman and Nemchin, 2014).
In these studies, the relative probability for an age of 4.35 Ga is actually more promi-
nent than a LHB-like spike at ∼3.9 Ga (Hopkins and Mojzsis, 2015). As a result,
some researcher proposed multiple cataclysms occurring prior to 4 Ga (Hopkins and
Mojzsis, 2015).
22
1.7 The last three billion years lunar bombardment record and a rela-
tionship with returned samples
The second long-standing open question in the field of lunar bombardment re-
gards the more recent lunar impact flux and is the primary focus of this dissertation.
According to the standard crater based lunar chronology by Neukum, the Moon ex-
perienced little change in the impact rate over the last three billion years. However,
two independent sets of lunar impact glass spherules from different regolith samples
collected from different landing sites suggest that their 40Ar/39Ar-derived age distri-
butions may be contradictory to a constant impact flux model. The first data set
shows an apparent excess of impact glass spherules and shards (spherule fragments)
with ages of ∼500 Ma (Culler et al., 2000; Levine et al., 2005; Hui et al., 2009). The
second data set was obtained by selecting only “exotic” glass spherules, which are
geochemically-distinct to local regolith. The exotic spherules show a higher number
of ages between 700 and 900 Ma; that range of ages overlaps with the formation age
of Copernicus Crater at ∼800 Ma (Zellner et al., 2009; Zellner et al., 2003).
Our aim goal was to examine whether or not the lunar impact flux has remained
constant over the last three billion years. It appears that both long-standing open
questions in lunar cratering history (the LHB and the impact flux <3 Ga) might in-
volve with some degree of sampling bias. The LHB is interpreted from returned lunar
impact melt rocks and breccias, and the recent impact flux is challenged by at least
two independent data sets of lunar impact glass spherules. As an interpretation of
these samples has not always been straightforward, this dissertation is devoted to re-
solving observational inconsistencies and to explaining a phenomenon that is coupled
with lunar sampling bias. Much research has been devoted to studying the formation
of single craters in isolation. However, the lunar surface has been bombarded by
countless craters, not a single crater in isolation. Therefore, a sample picked up from
the lunar surface has experienced the collective effects of numerous cratering events.

23
The sheer number of impact craters on the lunar surface makes the impact history of
a single sample challenging to model.
Fortunately, computer technology has advanced rapidly in recent years and tools
are available to deal with large amounts of data. We developed a three-dimensional re-
golith tracking model based on Cratered Terrain Evolution Model (CTEM) (Richard-
son, 2009; Minton et al., 2015; Huang et al., 2017), a Monte-Carlo code that models
a heavily cratered surface, to track a variety of information (e.g., composition, glass
spherules, and ages) during a bombardment simulation (Huang et al., 2017; Huang
et al., 2018). I present the model in Section 2 in which I describe the concept of crater
excavation flow model (Maxwell Z-model), its implementation in CTEM, and other
critical model components such as impact gardening by craters smaller than a pixel
resolution of CTEM and ejecta deposition in the form of crater rays. The streamline
based model, the crater scaling laws used in CTEM, and the regolith tracking com-
ponent in CTEM make the code more or less a study of the redistribution and mixing
of materials driven by impacts, To validate the code, I used two independent data
sets: Clementine UV/VIS reflectance measurements taken across mare and highland
contacts at Grimaldi Crater, and non-mare abundance of lunar mare soils (see results
in Chapter 3). In Chapters 4 and 5, we extended the code and work to investigate the
possibility of sampling bias on 40Ar/39Ar-derived age distributions of lunar impact
glass spherules, assuming a constant impact flux model. Although the code appears
to work successfully explaining observation data sets that this dissertation presented
here, a summary is discussed in Chapter 6.

24
25
2 METHODS
”FORTRAN is not a flower but a weed – it is hardy, occasionally blooms, and grows
in every computer.” Alan J. Perlis. Computer scientist and professor (Yale).
2.1 Introduction to CTEM
The Cratered Terrain Evolution Model (CTEM) was initially proposed and de-
veloped by James E. Richardson for his dissertation work on crater-induced seismic
shaking process for small bodies back in 2005. The code uses the Monte-Carlo tech-
nique (Press et al., 1992) to populate a discretized surface with model impact craters
over time. Similar computer models also worked to study the evolution of a cratered
surface (Cross and Fisher, 1968; Woronow, 1978; Chapman and McKinnon, 1986).
CTEM takes advantage of modern computation technology (high performing mem-
ory), crater counting calibration, and crater and ejecta scaling laws to understand
the erasing mechanisms of impact craters on a given target surface. For the erasing
mechanisms, it includes cookie cutting of old craters by new craters, sandblasting that
erodes craters by smaller craters, ejecta burial, and crater degradation induced by dis-
tal ejecta. CTEM was written in Fortran 77 by James E. Richardson but transitioned
to Fortran 2003 for more extensibility and modularity at ease of code development.
26
The current version of CTEM is suitable for problems such as crater saturation and
equilibrium, surface porosity evolution, material transport and numerical sampling
process (Richardson, 2009; Minton et al., 2015; Minton et al., 2018; Huang et al.,
2017; Huang et al., 2018; Hirabayashi et al., 2018).
A bombardment simulation setup in CTEM initially discretizes a user-defined
planetary surface grid into square pixels that each represents a portion of the modeled
planetary surface. Each pixel is available to store a variety of data in order to perform
further analysis. For example, the elevation data for an entire grid constructs a Digital
Elevation Model (DEM) of a surface. An elevation that a specific pixel stores can be
altered in response to the topographic changes due to the formation and degradation
of craters. The elevation information stored in a pixel serves as a three dimensional
parameter in our grid space; an advantage of it allows us to simulate subsequent
physical processes such as crater collapse or other types of degradation. Also, the
square grid of pixels possesses periodic boundary conditions so that the grid represents
a single contiguous surface.
The current CTEM can only readily produce a crater size-frequency distribu-
tion that mimics observed lunar impact craters, and for other celestial objects it
requires further investigation for generating a production function for calibration
purpose. Based on determinations of the size of a grid space that a user sets up
in CTEM, CTEM chooses the impactor’s size and velocity distribution and multiple
sets of scaling law parameters from appropriate probability distributions such that
the numerically-obtained crater size-frequency distribution matches a standard crater-
based lunar chronology, such as Neukum Production Function (NPF) (Neukum, 1983;
Neukum et al., 2001). Once the impactor size, the impact velocity and the impact
angle are determined, CTEM creates the crater based on π-group scaling laws. Sub-
sequently, CTEM is programmed to perform the following steps in order: 1) crater
formation, 2) ejecta deposition, and 3) crate collapse or subsequent degradation pro-
cesses. The location of a crater in CTEM is randomly chosen, but the form of a final
crater comfortably aligns to the direction of a local slope that is averaged out by
27
all pixels where this crater occupies. Using the chosen impactor parameters, CTEM
creates a crater whose morphology is determined using appropriate crater scaling
relationships. The size of each crater is determined based on the π-group scaling
laws (see Section 2.1.2, in which we combined the work from Melosh, Holsapple, and
Richardson to have a coherent derivation (Holsapple, 1993; Melosh, 1989; Richardson,
2009). CTEM modifies the surface elevation to reflect the effect of a local slope on a
final crater shape.
Regarding the formation of ejecta of a given size of a crater in CTEM, the code
emplaces it to corresponding pixels by adding the numerical value of ejecta thickness
to an elevation that is stored at a pixel. The emplacement of ejecta concerning with
ejecta thickness and spatial distribution is adopted from observational constraints.
Lastly, CTEM models slope collapses when the calculated topographic slopes exceed
the angle of repose. We noted that CTEM does not require information of time step
in the sense of a finite difference algorithm. Instead, a time step in CTEM uses the
time elapsed during the generation of every single crater, which corresponds to a
variable time in Poisson statistics. The overview of CTEM as described here is given
for an interested reader to find more details in the following sub-sections that include
derivation of crater scaling laws, as well as technical details on crater degradation
mechanisms and crater counting calibration in the work of Minton (Minton et al.,
2015).
2.1.1 Background: A stochastic process of a cratered surface
A fascinating, long-standing problem regarding the evolution of a planetary cratered
surface is saturation state, and CTEM, of course, is one of many numerical codes to
address this issue. The evolution of a cratered surface itself is exciting because it
is hoped to restore an impactor population from a planetary cratered surface (e.g.,
the Moon). However, our ability to do so has also been controversial, especially for a
heavily cratered surface (e.g., the ancient highlands) (Cross and Fisher, 1968; Marcus,
28
1970; Woronow, 1978; Chapman and McKinnon, 1986; Strom et al., 2005; Hartmann,
1984; Hartmann, 1988; Hartmann, 1995; Hartmann and Gaskell, 1997).
An inference of an impactor distribution can be made if a surface is young or
overlapping craters on the top of a surface can be distinguished. For an interpretation
of a heavily-cratered surface, it becomes tricky because craters start to obliterate
other craters generated from previous impact processes. The obliteration process of
older craters is initiated when subsequent craters overlap with one or more craters. An
overlapped crater loses parts of a rim and may be buried by a thick ejecta blanket until
it cannot be recognized. The obliteration process is important because it continuously
erases any old craters that are superposed by new craters.
The definition of crater saturation is somewhat ambiguous because the process
that populates craters on a surface depends on the size of a crater and the spatial
distribution of craters. For the spatial distribution parameter, geometric saturation
and randomly-distributed saturation yield a different efficiency of packing craters into
a surface. The simplest saturation problem is when we pack craters with the same
diameter of a size (D) into an area. For geometric saturation, it packs craters with
the same diameter into a surface in a hexagonal configuration. This is considered as
the maximum number of craters without overlaps (Ns) or equivalent to the maximum
size of an occupied area using the same number of craters. The fraction of cratered
area over the reference area (cratered area and non-cratered area) is about 0.905,
equivalent to ∼10% of an entire area that is not occupied by craters (Gault, 1970).
Randomly-distributed saturation is to randomly populate a surface with the same
sized craters; overlapping of craters decreases the size of an occupied area. For the
same distribution of craters, the size of an occupied area for randomly-distributed
saturation is smaller than the size of an occupied area for geometric saturation so a
random distribution requires more number of craters to reach saturation. In crater
counting community it uses the maximum number of craters that reaches geometric
saturation as a reference to describe the degree of saturation of a cratered area that
they perform a crater counting (Gault, 1970).

29
In a realistic planetary cratered surface, we deal with a randomly distributed
impactor population that is often characterized by a power-law function of sizes and
is converted to crater sizes (N ∝ Db) (see Section 1.5). Without testing the evolution
of craters with each class of sizes on a surface, Gault generated craters with size ratios
of 1:5, 1:10, and 1:16 in a 2.5 cm-square and 30 cm-deep sandbox filled with quartz
sand that correspond to the various exponents of b from -2.5 to -4.0 (Gault, 1970).
The laboratory experiment conducted by Gault shows that for all ratios the area of a
cratered surface increases with the number of impacts until reaching ∼1–10% of Ns
(Gault, 1970). Beyond 10% of Ns, the number of countable craters remaining on the
surface of a sandbox changes a little. Gault suggested that once reaching this state,
the appearance of a surface looks similar, but just the locations of craters are different
(Gault, 1970). So-called crater equilibrium expresses an idea that the formation of
a new crater simultaneously destroys an old crater. They also found that crater
equilibrium is a size-dependent process; a cratered surface can be saturated with
a larger crater for a sufficient amount of time. For example, in the most densely
cratered parts of ancient lunar farside highlands as an example, the crater densities
for craters larger than 20 km in diameter (N(20)) are in the range between 100 and
280 are equivalent to 3% to 10% geometric saturation (Head et al., 2010).
As observed by Gault in his laboratory work and the others, it is intriguing that
after the surface reaches a crater equilibrium, the distribution of observable craters
remained on the surface (the number of craters) is in a power-law function of diameter
with the exponent of b from -1.8 and -2 regardless of the original exponent of an im-
pactor distribution (<-2) (Gault, 1970; Hartmann, 1984; Chapman and McKinnon,
1986; Xiao and Werner, 2015; Hirabayashi et al., 2017). The “magic number” of -2
in crater size-frequency distribution yields a dimensionless crater density, suggesting
a scale-free crater density for all sizes of craters (Melosh, 2011). We noted that the
exponent of b in a power-law function of crater diameter is conventionally called a
slope. This phenomenon has been reported by not only the laboratory experiment of
Gault but also several crater count studies, as well as the theoretical and numerical
30
framework (Cross and Fisher, 1968; Woronow, 1978; Chapman and McKinnon, 1986;
Marcus, 1970; Richardson, 2009; Hirabayashi et al., 2017; Hirabayashi et al., 2018;
Minton et al., 2018). The underlying causes of a change in the crater size-frequency
distribution are mainly driven by erasure of craters. Erasure mechanism of craters
includes cookie cutting (a new crater cuts an old crater), sandblasting (erosion of a
crater by small craters), ejecta blanket burial (infilling of an old crater), and erosion
by distal ejecta. Contributions of each erasure mechanism to characterize a crater
equilibrium have also been analytically examined (Hirabayashi et al., 2017; Minton
et al., 2018; Ross, 1968; Soderblom, 1970). In summary, the previous analytical work
on the contribution of sandblasting to the distribution of craters that reach equilib-
rium by Ross and Soderblom found the slope of a crater size-frequency distribution
to be -2 (Ross, 1968; Soderblom, 1970). Recent Monte-Carlo computation work from
CTEM and their theoretical analyses successfully characterized each contribution of
erasure mechanism to equilibriums and explained an observational deviation seen in
the slope (Hirabayashi et al., 2017; Minton et al., 2018).
2.1.2 Cratering and ejecta scaling model
CTEM is primarily constructed of cratering and ejecta scaling-laws. Scaling-laws
are established by a series of experiments, utilizing the same outcome under different
experimental conditions, in which variables can be scaled. Once scaled constants of
variables are derived, one uses the set of scaling laws to predict the outcome from
the other condition. In the field of impact cratering, the first use of scaling-laws
was in TNT explosions studied by Lampson in 1950. Lampson found that the either
crater size or depth excavated by an explosion is proportional to the cubic root of the
explosive energy (Lampson, 1950). Later it was found that the depth of a burial of
an explosive influences the estimate of the excavated size. Still, the explosion scaling
laws provide an insight to the understanding of cratering scaling-laws.

31
CTEM uses impact crater size scaling laws to model a crater with calculated
size under a given impact conditions. In the example of deriving impact crater size
scaling-laws, a series of impact experiments is designed to produce impact craters
with the same size while varying an impact velocity or impactor size. Because an
impact velocity and impactor size, possibly other parameters that can be factored in,
relate the size of a final impact crater, those impact experiment outcome are used to
determine the dependence of impact crater size on those parameters. The purpose
of impact crater size scaling-laws is to estimate a entire range of sizes of impact
craters. This is considered significant because we have not witnessed or been able to
produce an impact crater larger than tens of meters. As a planetary impact crater
easily exceeds the size of tens of meters, impact crater size scaling-laws allow us to
extrapolate it to a larger crater.
The consequence of using cratering scaling-laws neglects the complex process of
impact cratering (early stage of shock wave development) and physical parameters
of impactor (shape, size and composition). The neglect of complex process and
projectile-related parameters in deriving cratering scaling-laws is reasonable after
considering the concept of “late-stage equivalence” (Dienes and Walsh, 1970) or a
mathematical assumption of point source (impact energy in an infinitesimal area).
“Late-stage equivalence” was discovered by Dienes and Walsh in their numerical im-
pact flow calculations in 1960s. In their hypervelocity impact calculations, the results
with a specific combination of diameter and velocity of an impactor can be grouped
together. Each group of numerical calculations yields the same value of scaling laws
(Lvni where n is derived from numerical calculations). Despites of the complex pro-
cess of cratering in a hypervelocity impact, “Late-stage equivalence” states that the
complex process of cratering would not influence the outcome that appears in later
stages.
In 1980s, Holsapple proposed a similar concept to late-stage equivalence, “cou-
pling parameter”, that uses point source solutions to approximate the energy and
momentum of an impactor into target (Holsapple and Schmidt, 1987). A point source

32
solution is a single source identified, in which the extent of the source is negligible
relative to the scale of a modeling. A point source approximation mathematically
simplifies an analysis. In particular, when using a point source approximation to ob-
tain cratering scaling-laws, it is useful to study the asymptotic behavior of cratering
scaling-law functions. For example, the limit of a point source solution for a cratering
scaling-law should reach a finite number as the size of an impactor approaches zero
and an impact velocity is exceedingly large or fixed. The point source approximation
approach also yields a single coupling parameter. In other words, one single valued
function controls the outcome of a cratering. Whether or not more than one coupling
parameter involve with an interpretation of cratering outcome, a further investigation
is needed (Melosh, 1989).
In “coupling parameter” approach, it provides a systematic way to factor in vari-
ables that are involved during different stages of a cratering process (Holsapple and
Schmidt, 1987; hol, ). Regarding the impact crater size scaling laws, Hoalsapple
expressed the volume of a transient crater as a functional with functions of coordi-
nates, time, gravity, size and impact velocity of a projectile, and material properties
in response to a wide range of pressures and temperatures. For a given time frame
of a transient crater, the coordinates and time in the functional of a transient crater
volume can be eliminated. If experimenting the same set of impactor and projectile,
this functional can be further reduced to depend on gravity, size and impact velocity
of a projectile, material densities, and target strength:
V = F (vi, ρi, ρt, Y, g,m) (2.1)
where V is the transient crater volume, F is the functional of V , vi is the impact
velocity, ρi is the impactor density, ρt is target density, Y is target strength, g is the
gravitational acceleration, and m is the impactor mass (ρi × 4π3a3i , where ai is the
radius of an impactor). The functional as well as its functions are dimensionless, such
that the importance of different physical processes is evaluated. Among dimensionless

33
analyses, researchers commonly use the π-theorem, originally proposed by Bucking-
ham in 1914, to group all relevant physical variables to a number of dimensionless
parameters. In equation 2.1, the dimensions on both sides of the equation must be
the same. Since there are six unknown variables in the equation 2.1, the number
of unknown dimensionless parameters is three after subtracting three dimensions in-
volved (mass, length, and time). These three required dimensionless parameters are
conventionally chosen in the following:
π2 =g
v2i
(mi
ρi
)1/3
= 3.22gaiv2i
(2.2)
π3 =Y
ρtv2i(2.3)
π4 =ρtρi
(2.4)
where π2 is “gravity-scale size” (Melosh, 1989, page 177), which is related to the
importance of a gravity in a cratering event, and the factor of 3.22 given by (4π/3)1/3
is neglected, π3 is “non-dimensional strength” (Richardson, 2009, Equation 3), which
is the measure of importance of target strength, π4 is the ratio of target and impactor
densities. Lastly, the crater volume term on the left-hand side of the equation 2.1
must be expressed in the dimensionless form, πV :
πV = v
(ρtmi
)(2.5)
This dimensionless measure of a transient crater volume is well-known as “crater
efficiency”, πV (simply defined as the volume ratio of crater cavity and impactor).
The dimensionless form of the equation 2.1 can be rewritten, F ′:
πV = F ′(π2, π3, π4) (2.6)
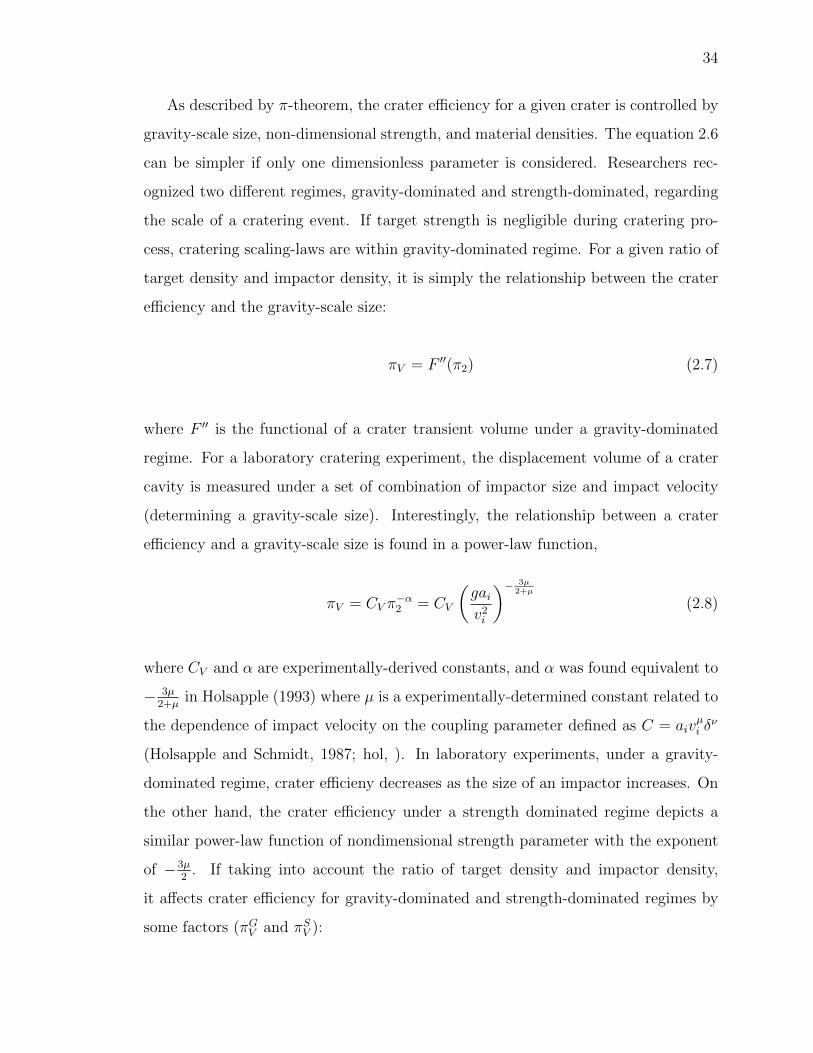
34
As described by π-theorem, the crater efficiency for a given crater is controlled by
gravity-scale size, non-dimensional strength, and material densities. The equation 2.6
can be simpler if only one dimensionless parameter is considered. Researchers rec-
ognized two different regimes, gravity-dominated and strength-dominated, regarding
the scale of a cratering event. If target strength is negligible during cratering pro-
cess, cratering scaling-laws are within gravity-dominated regime. For a given ratio of
target density and impactor density, it is simply the relationship between the crater
efficiency and the gravity-scale size:
πV = F ′′(π2) (2.7)
where F ′′ is the functional of a crater transient volume under a gravity-dominated
regime. For a laboratory cratering experiment, the displacement volume of a crater
cavity is measured under a set of combination of impactor size and impact velocity
(determining a gravity-scale size). Interestingly, the relationship between a crater
efficiency and a gravity-scale size is found in a power-law function,
πV = CV π−α2 = CV
(gaiv2i
)− 3µ2+µ
(2.8)
where CV and α are experimentally-derived constants, and α was found equivalent to
− 3µ2+µ
in Holsapple (1993) where µ is a experimentally-determined constant related to
the dependence of impact velocity on the coupling parameter defined as C = aivµi δ
ν
(Holsapple and Schmidt, 1987; hol, ). In laboratory experiments, under a gravity-
dominated regime, crater efficieny decreases as the size of an impactor increases. On
the other hand, the crater efficiency under a strength dominated regime depicts a
similar power-law function of nondimensional strength parameter with the exponent
of −3µ2
. If taking into account the ratio of target density and impactor density,
it affects crater efficiency for gravity-dominated and strength-dominated regimes by
some factors (πGV and πSV ):
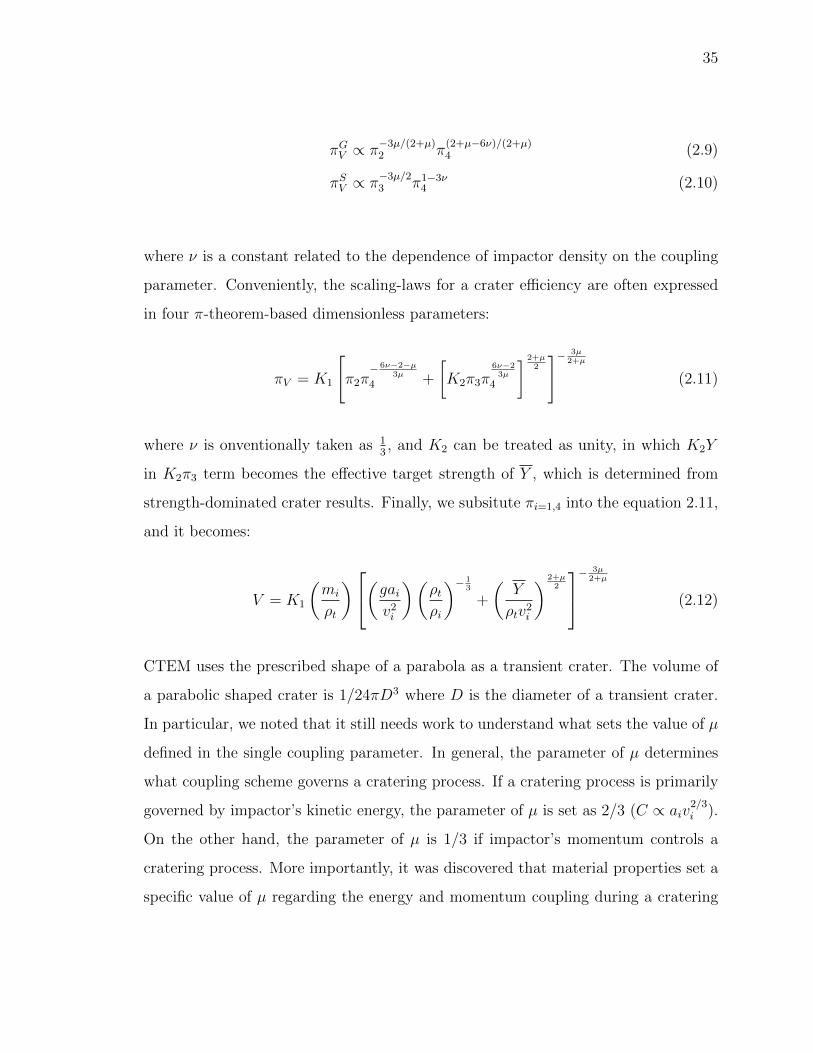
35
πGV ∝ π−3µ/(2+µ)2 π
(2+µ−6ν)/(2+µ)4 (2.9)
πSV ∝ π−3µ/23 π1−3ν
4 (2.10)
where ν is a constant related to the dependence of impactor density on the coupling
parameter. Conveniently, the scaling-laws for a crater efficiency are often expressed
in four π-theorem-based dimensionless parameters:
πV = K1
[π2π
− 6ν−2−µ3µ
4 +
[K2π3π
6ν−23µ
4
] 2+µ2
]− 3µ2+µ
(2.11)
where ν is onventionally taken as 13, and K2 can be treated as unity, in which K2Y
in K2π3 term becomes the effective target strength of Y , which is determined from
strength-dominated crater results. Finally, we subsitute πi=1,4 into the equation 2.11,
and it becomes:
V = K1
(mi
ρt
)(gaiv2i
)(ρtρi
)− 13
+
(Y
ρtv2i
) 2+µ2
−3µ2+µ
(2.12)
CTEM uses the prescribed shape of a parabola as a transient crater. The volume of
a parabolic shaped crater is 1/24πD3 where D is the diameter of a transient crater.
In particular, we noted that it still needs work to understand what sets the value of µ
defined in the single coupling parameter. In general, the parameter of µ determines
what coupling scheme governs a cratering process. If a cratering process is primarily
governed by impactor’s kinetic energy, the parameter of µ is set as 2/3 (C ∝ aiv2/3i ).
On the other hand, the parameter of µ is 1/3 if impactor’s momentum controls a
cratering process. More importantly, it was discovered that material properties set a
specific value of µ regarding the energy and momentum coupling during a cratering
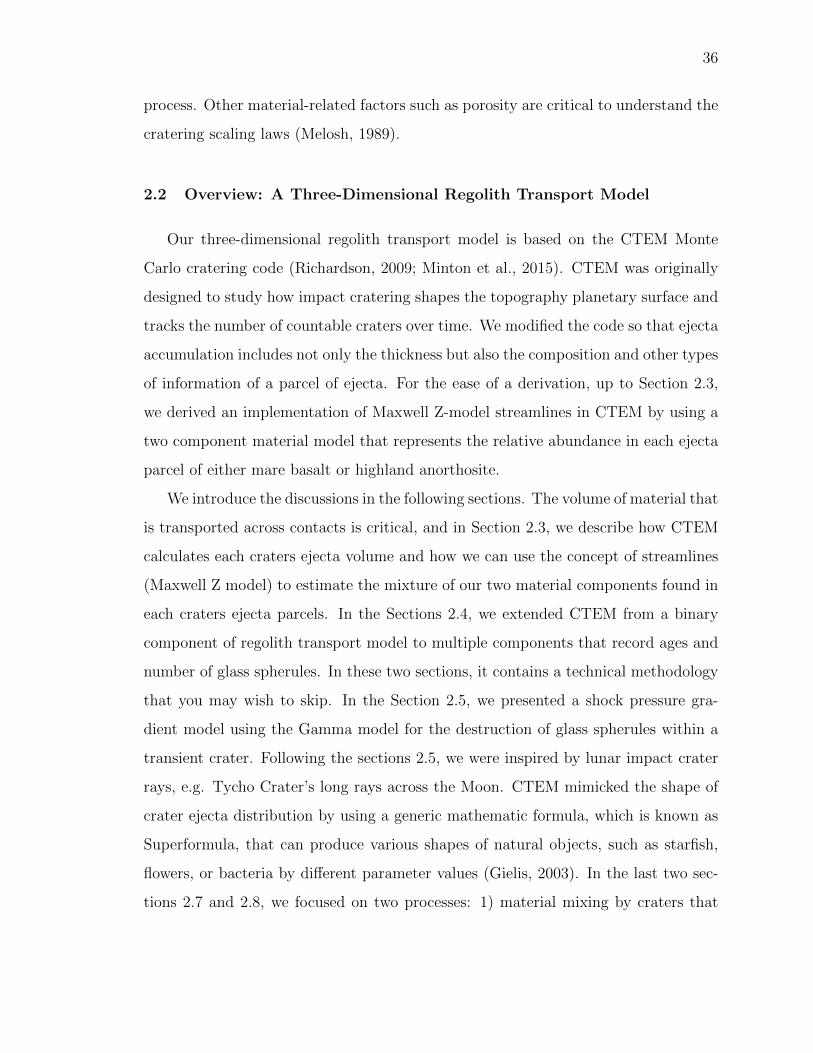
36
process. Other material-related factors such as porosity are critical to understand the
cratering scaling laws (Melosh, 1989).
2.2 Overview: A Three-Dimensional Regolith Transport Model
Our three-dimensional regolith transport model is based on the CTEM Monte
Carlo cratering code (Richardson, 2009; Minton et al., 2015). CTEM was originally
designed to study how impact cratering shapes the topography planetary surface and
tracks the number of countable craters over time. We modified the code so that ejecta
accumulation includes not only the thickness but also the composition and other types
of information of a parcel of ejecta. For the ease of a derivation, up to Section 2.3,
we derived an implementation of Maxwell Z-model streamlines in CTEM by using a
two component material model that represents the relative abundance in each ejecta
parcel of either mare basalt or highland anorthosite.
We introduce the discussions in the following sections. The volume of material that
is transported across contacts is critical, and in Section 2.3, we describe how CTEM
calculates each craters ejecta volume and how we can use the concept of streamlines
(Maxwell Z model) to estimate the mixture of our two material components found in
each craters ejecta parcels. In the Sections 2.4, we extended CTEM from a binary
component of regolith transport model to multiple components that record ages and
number of glass spherules. In these two sections, it contains a technical methodology
that you may wish to skip. In the Section 2.5, we presented a shock pressure gra-
dient model using the Gamma model for the destruction of glass spherules within a
transient crater. Following the sections 2.5, we were inspired by lunar impact crater
rays, e.g. Tycho Crater’s long rays across the Moon. CTEM mimicked the shape of
crater ejecta distribution by using a generic mathematic formula, which is known as
Superformula, that can produce various shapes of natural objects, such as starfish,
flowers, or bacteria by different parameter values (Gielis, 2003). In the last two sec-
tions 2.7 and 2.8, we focused on two processes: 1) material mixing by craters that

37
are smaller than the grid cell resolution that produces both primary craters and their
distal ejecta, and 2) material deposition by craters that are larger than the total grid
space where we simulate all primary craters (we called ‘super-domain” craters).
2.3 The Dynamic Stream Tube-Based Transport Model
Our task is somewhat more complex. We must be able to quickly determine the
fraction of mare and highland material that is entrained in the excavation flow that
makes up each parcel of ejecta. A parcel of ejecta in CTEM is a cuboid of material
that occupies a single grid cell with a height determined by the paraboloid shell-
based ejecta thickness calculation (Richardson, 2009, Equation 22). To determine
the amount of mare and highland material of a parcel of ejecta during excavation,
we need to know the makeup of material that was intersected by the streamlines
that made up the excavation flow of each ejecta parcel. As regolith is reworked, the
composition of any given grid cell will take on a very complex layered structure. By
overlying each ejecta parcels streamlines onto the preexisting compositional layers at
the site of the excavation, we can estimate the new composition of each ejecta parcel.
The relationship between radial distance of an ejecta and its ejection velocity
or launching velocity is key to ejecta emplacement in CTEM. CTEM uses crater
ejecta scaling laws derived from the work of (Housen et al., 1983). CTEM traces
the ejecta to the transient crater and uses the paraboloid shell to approximate the
total volume of ejecta in any direction at the distance. The thickness of ejecta at
this distance is averaged over the landed area (Richardson, 2009, Equations 25-27).
Because the geometry of the true excavation flow is different than a paraboloid shell,
this technique is inaccurate when attempting to map the provenance of ejecta back
to the excavation flow volume. We therefore will use a hybrid approach, where the
ejecta thickness is obtained by a simple empirically derived power law function, but
the compositional ratio of ejecta is determined using the Maxwell Z model. We must
note that the implementation of Maxwell Z-model in CTEM is only for the first-order
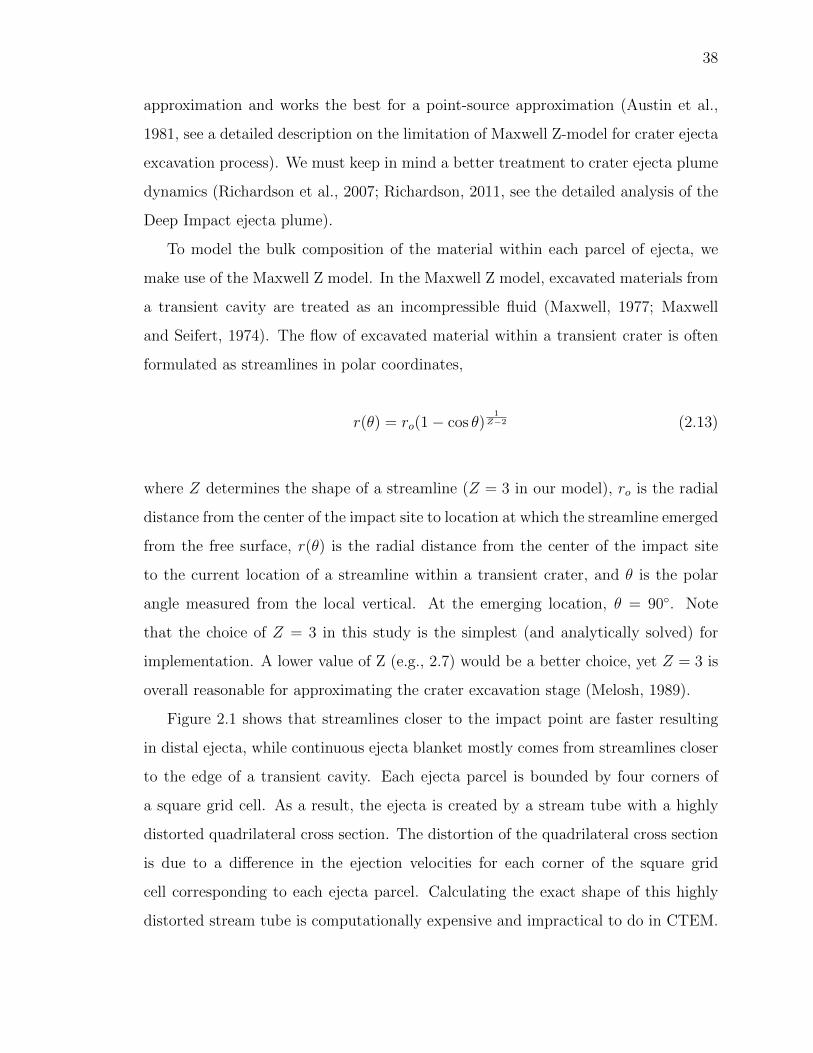
38
approximation and works the best for a point-source approximation (Austin et al.,
1981, see a detailed description on the limitation of Maxwell Z-model for crater ejecta
excavation process). We must keep in mind a better treatment to crater ejecta plume
dynamics (Richardson et al., 2007; Richardson, 2011, see the detailed analysis of the
Deep Impact ejecta plume).
To model the bulk composition of the material within each parcel of ejecta, we
make use of the Maxwell Z model. In the Maxwell Z model, excavated materials from
a transient cavity are treated as an incompressible fluid (Maxwell, 1977; Maxwell
and Seifert, 1974). The flow of excavated material within a transient crater is often
formulated as streamlines in polar coordinates,
r(θ) = ro(1− cos θ)1
Z−2 (2.13)
where Z determines the shape of a streamline (Z = 3 in our model), ro is the radial
distance from the center of the impact site to location at which the streamline emerged
from the free surface, r(θ) is the radial distance from the center of the impact site
to the current location of a streamline within a transient crater, and θ is the polar
angle measured from the local vertical. At the emerging location, θ = 90◦. Note
that the choice of Z = 3 in this study is the simplest (and analytically solved) for
implementation. A lower value of Z (e.g., 2.7) would be a better choice, yet Z = 3 is
overall reasonable for approximating the crater excavation stage (Melosh, 1989).
Figure 2.1 shows that streamlines closer to the impact point are faster resulting
in distal ejecta, while continuous ejecta blanket mostly comes from streamlines closer
to the edge of a transient cavity. Each ejecta parcel is bounded by four corners of
a square grid cell. As a result, the ejecta is created by a stream tube with a highly
distorted quadrilateral cross section. The distortion of the quadrilateral cross section
is due to a difference in the ejection velocities for each corner of the square grid
cell corresponding to each ejecta parcel. Calculating the exact shape of this highly
distorted stream tube is computationally expensive and impractical to do in CTEM.
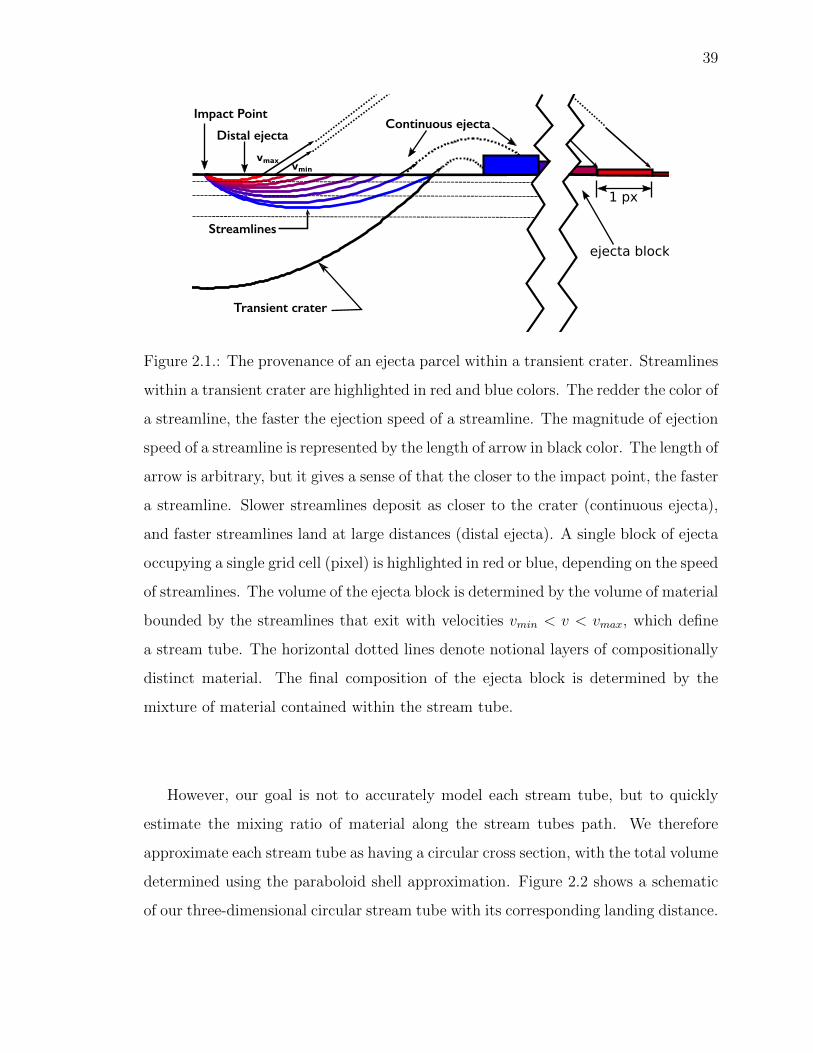
39
Streamlines
Impact Point
Distal ejecta
1 px
Transient crater
Continuous ejecta
ejecta block
vmaxvmin
Figure 2.1.: The provenance of an ejecta parcel within a transient crater. Streamlines
within a transient crater are highlighted in red and blue colors. The redder the color of
a streamline, the faster the ejection speed of a streamline. The magnitude of ejection
speed of a streamline is represented by the length of arrow in black color. The length of
arrow is arbitrary, but it gives a sense of that the closer to the impact point, the faster
a streamline. Slower streamlines deposit as closer to the crater (continuous ejecta),
and faster streamlines land at large distances (distal ejecta). A single block of ejecta
occupying a single grid cell (pixel) is highlighted in red or blue, depending on the speed
of streamlines. The volume of the ejecta block is determined by the volume of material
bounded by the streamlines that exit with velocities vmin < v < vmax, which define
a stream tube. The horizontal dotted lines denote notional layers of compositionally
distinct material. The final composition of the ejecta block is determined by the
mixture of material contained within the stream tube.
However, our goal is not to accurately model each stream tube, but to quickly
estimate the mixing ratio of material along the stream tubes path. We therefore
approximate each stream tube as having a circular cross section, with the total volume
determined using the paraboloid shell approximation. Figure 2.2 shows a schematic
of our three-dimensional circular stream tube with its corresponding landing distance.
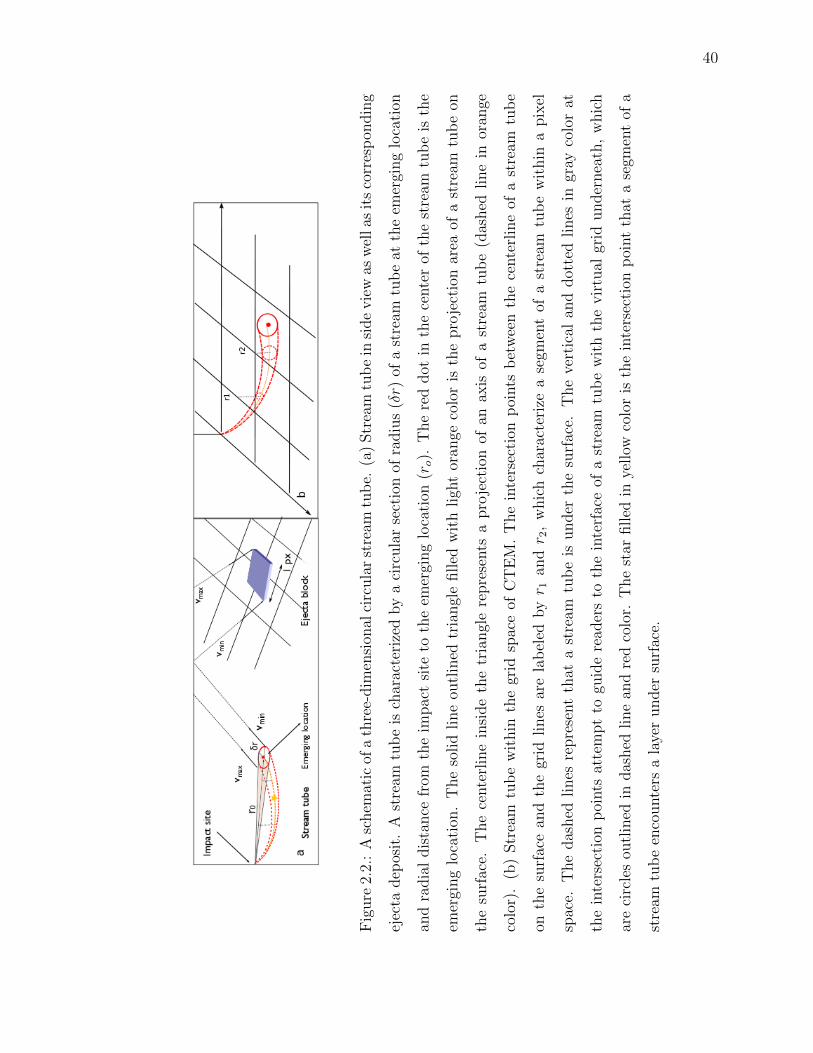
40
Fig
ure
2.2.
:A
schem
atic
ofa
thre
e-dim
ensi
onal
circ
ula
rst
ream
tub
e.(a
)Str
eam
tub
ein
side
vie
was
wel
las
its
corr
esp
ondin
g
ejec
tadep
osit
.A
stre
amtu
be
isch
arac
teri
zed
by
aci
rcula
rse
ctio
nof
radiu
s(δr)
ofa
stre
amtu
be
atth
eem
ergi
ng
loca
tion
and
radia
ldis
tance
from
the
impac
tsi
teto
the
emer
ging
loca
tion
(ro).
The
red
dot
inth
ece
nte
rof
the
stre
amtu
be
isth
e
emer
ging
loca
tion
.T
he
solid
line
outl
ined
tria
ngl
efilled
wit
hligh
tor
ange
colo
ris
the
pro
ject
ion
area
ofa
stre
amtu
be
on
the
surf
ace.
The
cente
rlin
ein
side
the
tria
ngl
ere
pre
sents
apro
ject
ion
ofan
axis
ofa
stre
amtu
be
(das
hed
line
inor
ange
colo
r).
(b)
Str
eam
tub
ew
ithin
the
grid
spac
eof
CT
EM
.T
he
inte
rsec
tion
poi
nts
bet
wee
nth
ece
nte
rlin
eof
ast
ream
tub
e
onth
esu
rfac
ean
dth
egr
idlines
are
lab
eled
byr 1
andr 2
,w
hic
hch
arac
teri
zea
segm
ent
ofa
stre
amtu
be
wit
hin
apix
el
spac
e.T
he
das
hed
lines
repre
sent
that
ast
ream
tub
eis
under
the
surf
ace.
The
vert
ical
and
dot
ted
lines
ingr
ayco
lor
at
the
inte
rsec
tion
poi
nts
atte
mpt
togu
ide
read
ers
toth
ein
terf
ace
ofa
stre
amtu
be
wit
hth
evir
tual
grid
under
nea
th,
whic
h
are
circ
les
outl
ined
indas
hed
line
and
red
colo
r.T
he
star
filled
inye
llow
colo
ris
the
inte
rsec
tion
poi
nt
that
ase
gmen
tof
a
stre
amtu
be
enco
unte
rsa
laye
runder
surf
ace.
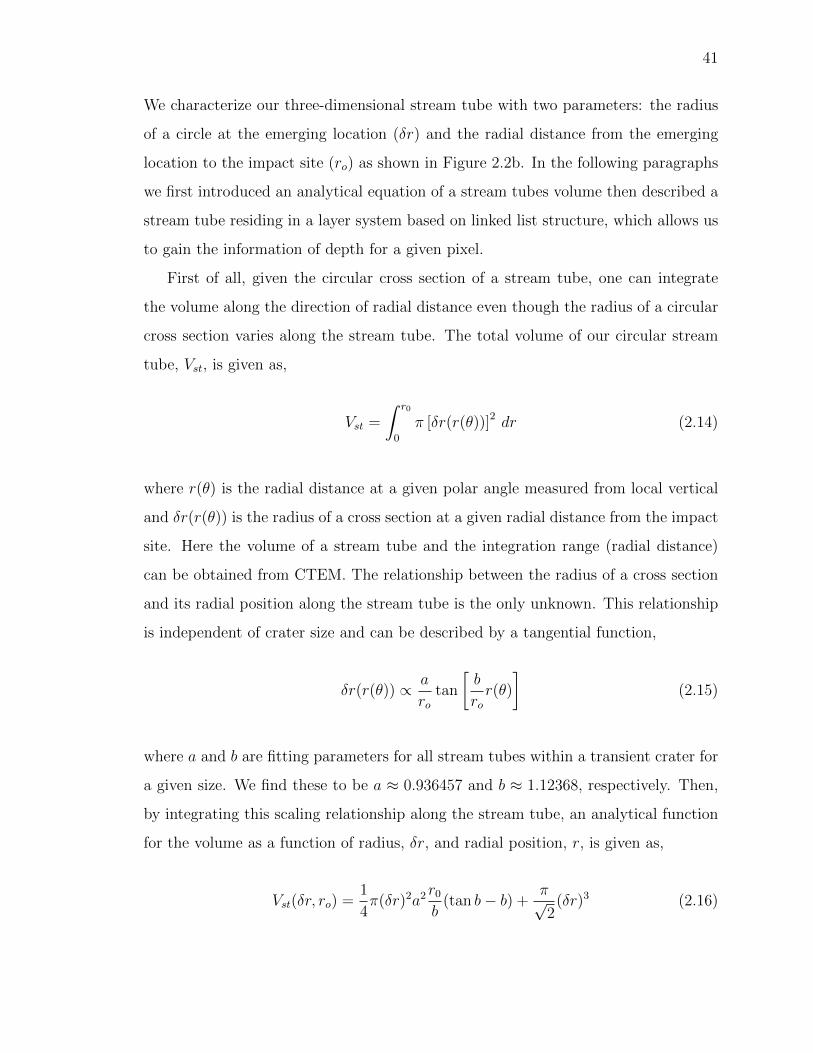
41
We characterize our three-dimensional stream tube with two parameters: the radius
of a circle at the emerging location (δr) and the radial distance from the emerging
location to the impact site (ro) as shown in Figure 2.2b. In the following paragraphs
we first introduced an analytical equation of a stream tubes volume then described a
stream tube residing in a layer system based on linked list structure, which allows us
to gain the information of depth for a given pixel.
First of all, given the circular cross section of a stream tube, one can integrate
the volume along the direction of radial distance even though the radius of a circular
cross section varies along the stream tube. The total volume of our circular stream
tube, Vst, is given as,
Vst =
∫ r0
0
π [δr(r(θ))]2 dr (2.14)
where r(θ) is the radial distance at a given polar angle measured from local vertical
and δr(r(θ)) is the radius of a cross section at a given radial distance from the impact
site. Here the volume of a stream tube and the integration range (radial distance)
can be obtained from CTEM. The relationship between the radius of a cross section
and its radial position along the stream tube is the only unknown. This relationship
is independent of crater size and can be described by a tangential function,
δr(r(θ)) ∝ a
rotan
[b
ror(θ)
](2.15)
where a and b are fitting parameters for all stream tubes within a transient crater for
a given size. We find these to be a ≈ 0.936457 and b ≈ 1.12368, respectively. Then,
by integrating this scaling relationship along the stream tube, an analytical function
for the volume as a function of radius, δr, and radial position, r, is given as,
Vst(δr, ro) =1
4π(δr)2a2
r0b
(tan b− b) +π√2
(δr)3 (2.16)
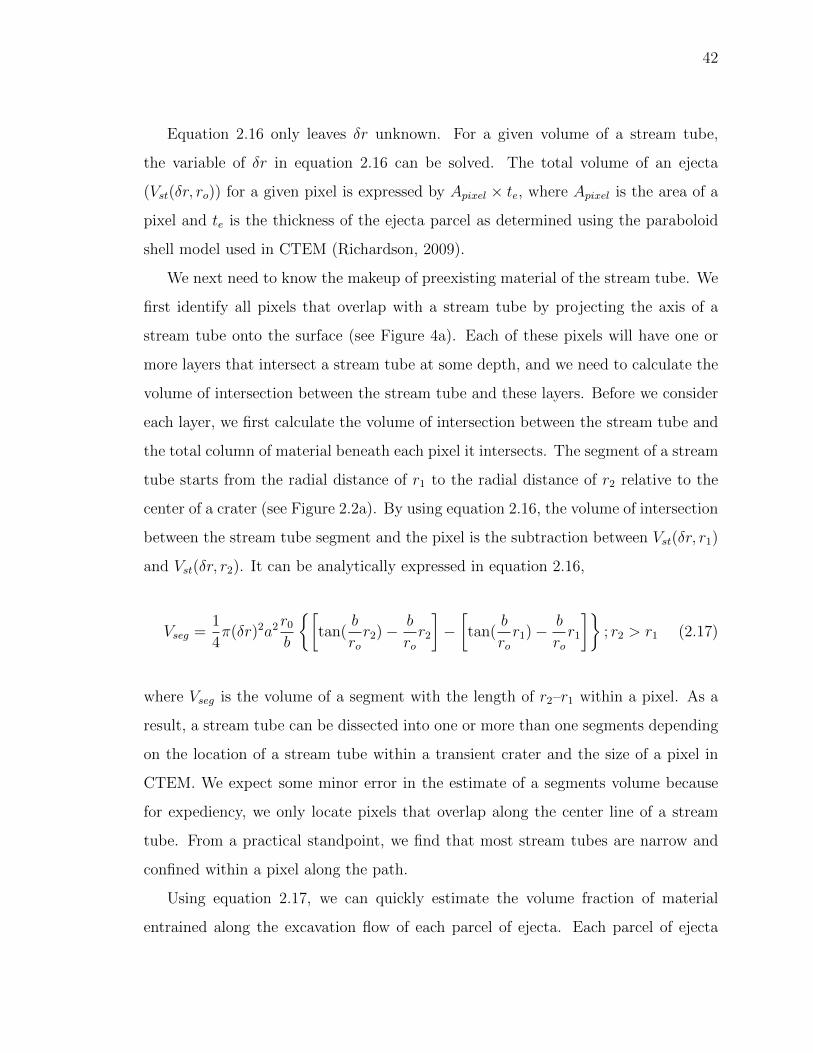
42
Equation 2.16 only leaves δr unknown. For a given volume of a stream tube,
the variable of δr in equation 2.16 can be solved. The total volume of an ejecta
(Vst(δr, ro)) for a given pixel is expressed by Apixel × te, where Apixel is the area of a
pixel and te is the thickness of the ejecta parcel as determined using the paraboloid
shell model used in CTEM (Richardson, 2009).
We next need to know the makeup of preexisting material of the stream tube. We
first identify all pixels that overlap with a stream tube by projecting the axis of a
stream tube onto the surface (see Figure 4a). Each of these pixels will have one or
more layers that intersect a stream tube at some depth, and we need to calculate the
volume of intersection between the stream tube and these layers. Before we consider
each layer, we first calculate the volume of intersection between the stream tube and
the total column of material beneath each pixel it intersects. The segment of a stream
tube starts from the radial distance of r1 to the radial distance of r2 relative to the
center of a crater (see Figure 2.2a). By using equation 2.16, the volume of intersection
between the stream tube segment and the pixel is the subtraction between Vst(δr, r1)
and Vst(δr, r2). It can be analytically expressed in equation 2.16,
Vseg =1
4π(δr)2a2
r0b
{[tan(
b
ror2)−
b
ror2
]−[tan(
b
ror1)−
b
ror1
]}; r2 > r1 (2.17)
where Vseg is the volume of a segment with the length of r2–r1 within a pixel. As a
result, a stream tube can be dissected into one or more than one segments depending
on the location of a stream tube within a transient crater and the size of a pixel in
CTEM. We expect some minor error in the estimate of a segments volume because
for expediency, we only locate pixels that overlap along the center line of a stream
tube. From a practical standpoint, we find that most stream tubes are narrow and
confined within a pixel along the path.
Using equation 2.17, we can quickly estimate the volume fraction of material
entrained along the excavation flow of each parcel of ejecta. Each parcel of ejecta

43
is tracked as a compositionally distinct layer and is emplaced on the top of any
preexisting layers. As subsequent craters may excavate one or more than one of those
compositionally distinct pixels, recording all deposits from each cratering event is
mandatory for this study. For our current problem, each ejecta block is tracked with
a single number that stores the mare fraction: 0 equals pure highlands and 1 equals
pure mare.
To keep track of each distinct ejecta layer from a cratering event over time, we
use a dynamic data structure called a linked list to record every ejecta block as a
distinct layer at each grid cell. This dynamic data structure has more flexibility
than a fixed array, as the number of layers can be redefined on the fly using two
main operations (executed in a first in/last out manner). When an ejecta block is
deposited in a given grid cell, a “push” operation is executed, basically adding a new
layer of specified thickness and mixing ratio on the top of the surface at that location.
If a grid cell experiences an excavating event, such as within a transient crater, for
example, a “pop” operation is executed, and a layer, or several layers depending on
the excavation depth, will be removed from that location. Each grid cell location
records a compositionally unique layered structure as a result of impact excavation
and deposition.
To obtain the amount of mare and highland material of each ejecta parcel, we
need to estimate the intersected volume between a segment of a stream tube and a
layer. Figure 2.2b shows how a segment of a stream tube looks like under a surface.
We traced the centerline of a stream tube in a layer structure and projected the
intersection point to the surface for obtaining the radial distance so that the volume
between neighboring intersection points can be calculated by equation (5). Continue
to the example of Figure 2.2a, if this segment with the length of r2–r1 is sitting
between two layers, we can obtain the location of an intersection point between the
depth of the first layer and the centerline of a segment (see yellow star in Figure 2.2a).
Assuming that each of these two layer contains a mare fraction, f1 and f2, the final

44
mare fraction of a segment is the total mare volume normalized by the total volume
of the segment,
fseg =f1 × V 1
seg + f2 × V 2seg
Vseg(2.18)
where V 1seg and V 2
seg are the volume of a segment intersected with the first and second
layers, respectively. Here we illustrate a calculation of mare fraction for a segment of
a stream tube for an example of a two-layer structure. As more ejecta layers build
up over time, a segment of a stream tube may overlap with several layers. Note that
the approximated volume of a segment with a layer is not aligned up with horizontal
layer but perpendicular to the layer. However, we confirm that our estimates are
efficient and only have some small difference from exact volume. The total volume
of both materials is conserved over the course of a single full simulation. Finally,
CTEM loops over all pixels that a stream tube superposes, and the calculation of a
mare fraction for a whole stream tube follows the same manner.
2.4 Glass spherule production model
Previously, we obtained an analytical expression of crater excavation flow by us-
ing the concept of Maxwell Z-model (see the section 2.3). This analytical expression
allows us to approximate the volume and provenance of an excavation flow emerg-
ing from a crater transient crater that depends on different impact conditions. This
expression can be worked with the geometry of a subsurface structure. We have
demonstrated that our streamtube calculation can be adjusted to a dynamic sub-
surface structure in which consists of stack of cratered materials from the formation
of each crater over time. All pixels where stores this rich information such as the
amounts of basaltic and anorthostic materials are accessed and approximated before
a next crater forms in CTEM. By doing so, we can fast approximate the composi-
45
tion of a subsurface structure where a crater forms in CTEM and extract all possible
information before forming subsequent craters.
Our streamtube based transport code is capable of estimating bulk volumes of bi-
nary materials in a target surface where a crater forms and placing those compositionally-
distinct materials to varying distances in a ballistic manner. We made use of remote
sensing reflectance measurements taken on lunar mare and highland contacts for the
calibration purpose of our transport code (see Chapter 3). As the use of Maxwell
Z-model to approximate the crater excavation flow appears successful (see Figure
3.6), this implies that the information other than binary composition during a crater
excavation flow can be approximated. For example, the intense shock heating dur-
ing contact stage melts target materials, and sooner after crater excavation begins a
portion of this impact-generated melt was ejected.
In particular, lunar impact glass spherules, a kind of Impact melt products, are
thought to have originated in am impact-generated melt. Radiometric age measure-
ments of those glass spherules, such as 40Ar/39Ar ages, provide some insight to lunar
impact flux. Because of their formation upon high temperatures induced by impact
argon within a spherule that had retained before the impact occurred were degassed.
As a result, initial zero argon upon the formation of a spherule is interpreted as the
time when the impact that formed it occurred. By the time we sampled, a spherule
(potassium-bearing material) would have retained argon since the last heating event,
which could be the impact event that formed it.
Fortunately, scaling laws for impact melts are relatively well-established; estimates
of impact melts’ volume and distribution in terms of impact conditions can be ob-
tained. This set of scaling laws for impact-generated melts is valuable to a code like
CTEM that takes an analytical approach, because the CTEM code must be able to
simulate glass spherules produced by large numbers of craters in a single simulation.
Using the concept of streamlines, as well as the scaling laws for the volume of impact
melts, it allows us to estimate the provenance of glass spherules in a very simple way.
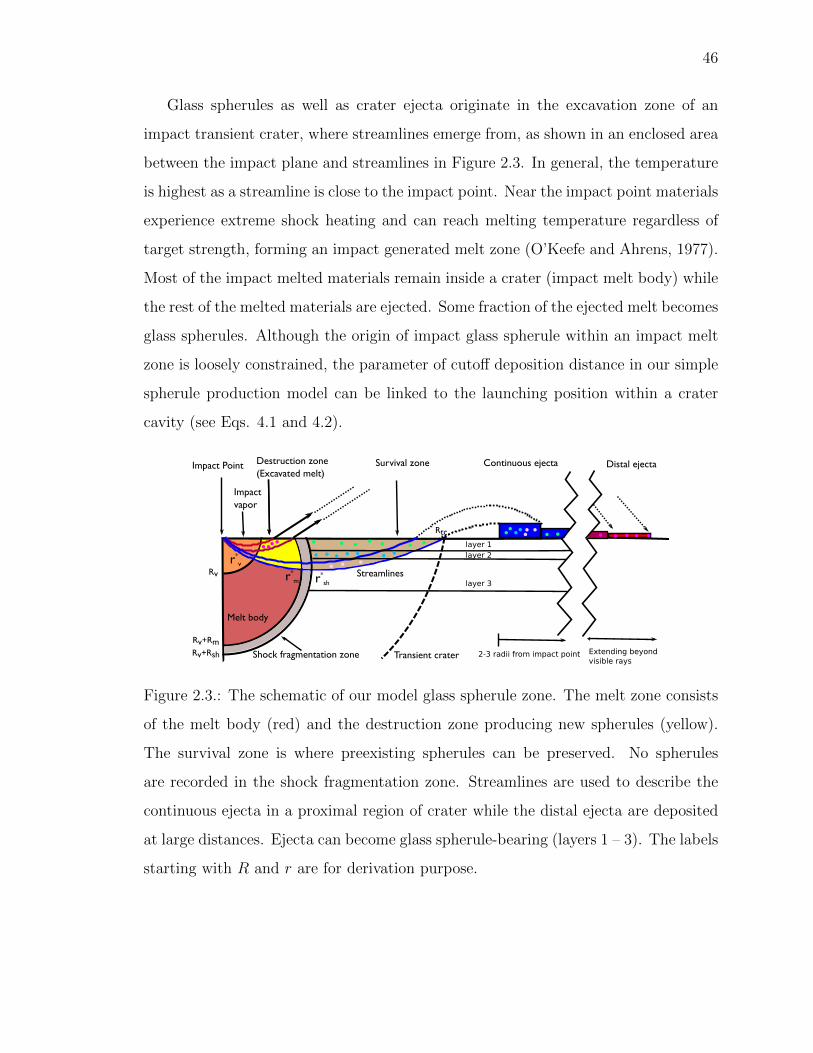
46
Glass spherules as well as crater ejecta originate in the excavation zone of an
impact transient crater, where streamlines emerge from, as shown in an enclosed area
between the impact plane and streamlines in Figure 2.3. In general, the temperature
is highest as a streamline is close to the impact point. Near the impact point materials
experience extreme shock heating and can reach melting temperature regardless of
target strength, forming an impact generated melt zone (O’Keefe and Ahrens, 1977).
Most of the impact melted materials remain inside a crater (impact melt body) while
the rest of the melted materials are ejected. Some fraction of the ejected melt becomes
glass spherules. Although the origin of impact glass spherule within an impact melt
zone is loosely constrained, the parameter of cutoff deposition distance in our simple
spherule production model can be linked to the launching position within a crater
cavity (see Eqs. 4.1 and 4.2).
Rv
Rv+Rm
Rv+Rsh
Rtc
Streamlines
Melt body
Distal ejectaContinuous ejecta
2-3 radii from impact point Extending beyond
visible rays
layer 1
layer 2
layer 3r*
m
r*v
Impact Point Survival zone
Shock fragmentation zone
Destruction zone
(Excavated melt)
Impact
vapor
Transient crater
r*sh
Figure 2.3.: The schematic of our model glass spherule zone. The melt zone consists
of the melt body (red) and the destruction zone producing new spherules (yellow).
The survival zone is where preexisting spherules can be preserved. No spherules
are recorded in the shock fragmentation zone. Streamlines are used to describe the
continuous ejecta in a proximal region of crater while the distal ejecta are deposited
at large distances. Ejecta can become glass spherule-bearing (layers 1 – 3). The labels
starting with R and r are for derivation purpose.
47
An excavation flow within a crater cavity may carry not only newly-forming
spherules that originate in a melt zone but also any preexisting spherules outside
a melt zone. The volume of an excavation flow, including a volume that is intersected
with a melt zone, and any glass spherule bearing layers must be estimated. Based on
the Maxwell-Z model of excavation dynamics developed in Section 2.3, we can use its
analytical approach to obtain this excavation flow volume and provenance informa-
tion. Starting with the volume that an melt zone intersects with an excavation zone,
we defined our impact-generated melt zone by using an analytical expression describ-
ing the size of an impact melt zone based on varying impact conditions (Abramov
et al., 2012),
VmeltVtc
= 2.9E−0.85m D0.66i g0.66v0.37i (2.19)
where Vmelt is the total impact melt volume, Vtc is the impact transient crater volume,
Em is the specific internal of melting the target material, Di is the impactor diameter,
g is the lunar gravitational acceleration, and vi is the impact velocity. Here we used
3.42 × 10⁶ J/Kg of specific internal energy for highland anorthostic material, as the
lunar surface is composed of 83% of highland (Head and Wilson, 1992). The center
of an impact melt zone is placed at the depth of one radius of impactor (Pierazzo
et al., 1997). Figure 2.4 shows that our ejected melt calculation for a given size of a
crater is consistent with the previous theoretical study, in which the trend of fraction
of total ejected melts over the total impact-generated melts decreases with increasing
size of a crater (Cintala and Grieve, 1998; Dence, 1971). The calculated melt zone is
where CTEM models impact melt products; otherwise no melt outside the melt zone
is produced. As a result, we assumed a sharp boundary of temperatures between an
impact melt zone and the rest of an excavation zone. To be cautious our modeled
impact melt zone only provides an approximate location of melted materials, due to
a limitation of that CTEM is not a hydrodynamic based code.

48
Figure 2.4.: The fraction of total ejected melts over total melt volume as a function
of transient crater size in diameter. The dotted dash line is directly taken from Fig.
16 of (Cintala and Grieve, 1998), in which the calculation is based on impact velocity
of 15 km/s, anorthositic target, and chondritic impactor. The solid and dash lines
are from our study.
To model the evolution of glass spherules, we needed to track how many of them
survived or were destroyed, by either re-melting or mechanical shattering by the pas-
sage of a strong shock wave. As shown in Figure 2.3, the excavated melt zone consists
of a destruction zone (Zone I), survival zone (Zone II), and a shock fragmentation
zone (Zone III). Zone I is where the newly-formed excavated melt is generated, which
overlaps our calculated melt zone (Eq. 2.19) and the excavation zone described by
streamlines. Any age information from modeled glass spherules in Zone I is destroyed
and CTEM may instead generate new model glass spherules tagged with the time of
the new crater’s formation. Zone II is called the impact glass spherule survival zone,
which is outside the melt zone, and any original age information and abundance of
preexisting glass spherules are kept and recorded in new ejecta layers. However, a
49
small fraction of the survival zone that the overlaps with shock fragmentation zone
contains no surviving spherules, because its impact shock is expected to exceed the
yield strength of spherules. For each ejecta voxel, we calculate the total volume of
material within the streamtubes that originate from these three zones, and deposit a
new layer downrange with a mix of old and new spherules.
The volume of materials in Zone I, which are newly-forming excavated melts, can
be obtained by the same method we employed in Section 2.3:
V mst =
1
4π(δr)2a2
r0b
{[tan(
b
r0r∗m)− b
r0r∗m
]−[tan(
b
r0r∗v)−
b
r0r∗v
]}(2.20)
where V mst is the melted-only part of a streamtube (excavated melt), δr is the cross
section of radius of a circular streamtube, r0 is the radial distance of emerging point
of a streamtube, a and b are derived constants, r∗m is the distances from the impact
point to the intersection point between a melt zone and a streamtube, and r∗v is the
distance from the impact point to the intersection point between a vapor zone, which
is the size of an impactor, and a streamtube. For Zone III, the volume of shock
damaged material within a streamtube is V shst ,
V shst =
1
4π(δr)2a2
r0b
{[tan(
b
r0r∗sh)−
b
r0r∗sh
]−[tan(
b
r0r∗m)− b
r0r∗m
]}(2.21)
where r∗sh is the distance from the impact point to the intersection point between
a shock zone (>5 GPa) and a streamtube (see Figure 2.5). For a shock zone, we
used a semi-analytical model, the Gamma Model, to describe the maximum shock
distribution within a transient crater (see details in Section 2.5). As a result, the
volume of materials in the survival zone is Vst − V mst − V sh
st . A stream tube within an
impact glass survival zone must contain information for a preexisting surface layer
structure. Our regolith transport model applied a dynamic layer structure (linked-
list data structure) to allow each pixel to stack a collection of ejecta layers over time.

50
Each ejecta layer is unique and contains information about thickness, composition,
and the amount of glass spherules. As craters populate our simulated surface, layers
are stacked up or excavated from the top of the grid space forming a subsurface
structure. As the excavation flow from each new crater traverses the source region,
the streamtubes that supply each ejecta voxel may contain multiple layers of pre-
existing deposited ejecta. By obtaining intersection points between a streamtube
and layers, a streamtube is dissected. Each dissected tube contains a portion of
information of a layer that is assumed to be uniformly distributed. The portion of
information of a layer retained by a dissected tube is based on the ratio of the volume
of the dissected tube to the volume of a layer,
V survi =
ViVlayer
× (V mlayer − V sh
layer) (2.22)
where V survi is the volume of the i-th dissected tube, which is located in Zone II,
that retains melted-only materials from a layer that this i-th dissected tube resides
in, Vi is the total volume of the i-th dissected tube, which can be computed using
Eq. 2.20, Vlayer is the total volume of a layer that the dissected tube resides in, V mlayer
is the volume of melted-only material stored in the layer, and V shlayer is the volume of
material in the layer inside the shock fragmentation zone.
To record the formation age and the amount of model spherules through a simula-
tion, each newly-generated layer in CTEM is binned into 50 Ma age bins, yielding 60
bins stored in each layer. Through the 3 Ga-long bombardment, the volume of melted
material is either added into or subtracted from one of 60 bins that is based on its
modeled age, regardless of newly-formed spherules and previous spherule populations.
By doing so, each layer carries a unique age distribution, which experiences a varying
degree of deposition and excavation, such as an addition of newly-formed spherules,
retention of previous spherule populations, or a loss of spherule populations due to
destruction in Zone I or III. Our dynamic streamtube approach takes into account the
subsurface structure dynamically as the simulation evolves. The glass onset distance
51
model for the production of glass spherules simplifies how we interpret the amount
of model glass spherules (Zone 1) within a crater cavity. While CTEM estimates the
relative abundance of materials from three zones for any deposition distance up to
∼200 crater radii for a given crater, we only treat newly-forming excavated melts as
model glass spherules when their deposition distance exceeds a onset distance that
depends on which of four onset distances is used.
2.5 Impact shock pressure destruction
Beyond the destruction zone where newly-forming glass spherules are produced,
impact shock waves may not have enough energy to melt target materials, yet the
magnitude of few GPa of shock exceeds the yield strength of impact glass spherules.
We adopted the value of 5 GPa as the yield strength of lunar impact glass spherules
(Rasorenov et al., 1991). We characterized the region where materials are shocked
up to 5 GPa as an impact-generated shock fragmentation zone.
While impact shock waves propagate fast, they decay rapidly due to energy dis-
sipation by material frictional heating and acoustic fluidization (Melosh, 1979). In
impact cratering literature, a semi-analytical approach, the Gamma model, is used
to describe the maximum impact shock distribution within a transient crater, also
called peak shock pressure (Croft, 1982). The peak pressure is the maximum shock
pressure experienced by a parcel of material for a given distance from an impact cen-
ter. The Gamma model describes two distinct regimes where peak shock pressure
remains constantly high in an isobaric core, and decays in a power law relationship
as a function of distance,
Psh(r) = P0rn (2.23)
where Psh(r) is the peak shock pressure as a function of distance from impact center
(r), P0 is the constant peak shock pressure within an isobaric core, and n is the index
52
of power law (< 0). In one study, the size of an isobaric core is assumed to be the size
of an impactor (Pierazzo et al., 1997). And the magnitude of P0 can be estimated by
the planar impact approximation (Melosh, 1989). We used the simplest solution, in
which impactor and target are the same materials,
P0 = ρushup (2.24)
where the particle velocity, up = 12vimp, is the half of impact velocity, the shock
velocity, ush, is approximated by a linear relationship with the particle velocity, ush =
c + sup, in which the parameters of c and s are empirically derived (Melosh, 1989,
Table AII.2).
The size of our shock fragmentation zone is mainly controlled by the isobaric
shock pressure as well as the index of power law, n. The index of the power law in
describing shock decay regime is dependent on the impact velocity. From our two
collected data sets, in which one (“P”) used impact velocities ≥10 km/s (Pierazzo
et al., 1997) and the other (“M”) used impact velocities of ≤10 km/s (Monteux
and Arkani-Hamed, 2016), we normalized the measured peak shock pressures by our
estimated isobaric pressure from Eq. (2.24). In particular, as shown in Figure A1 the
asymptotic behavior of peak shock pressures at the distance of >2–3 impactor radii
shows that the fitted power law index becomes more negative with increasing impact
velocity changing from −1.4 to −2.85.
A discrepancy between these two asymptotic behaviors may be caused by a tran-
sition between different impact velocity regimes. Figure 2.5 also shows the “M” data
set for 10 km/s with acoustic fluidization turned on in their iSALE simulation runs.
It appears that acoustic fluidization significantly decreases the shock pressure in the
far field, aligning with the “P” data points for 60 km/s. As acoustic fluidization
may decrease shock pressure, thus increasing the survival of glass spherules, we chose
a faster decay rate of -2.85 in this study. A further investigation on a relationship
between acoustic fluidization and shock pressure is needed but beyond our scope.

53
Figure 2.5.: Normalized peak shock pressure within a transient crater from different
hydrocode simulations. The points marked “P” are from CTH simulations (Pierazzo
et al., 1997), and the points marked “M” are from iSALE simulations (Monteux and
Arkani-Hamed, 2016). The numbers indicate the impact velocity in km/s. M10(A)
is a simulation with acoustic fluidization. The x-axis is the distance normalized by
the radius of impactor within a transient crater, and the y-axis is the relative peak
shock pressure. The two straight lines are exponential fits for asymptotic behaviors
of shock pressures beyond the isobaric pressure zone, and the numbers are the fitted
exponents.
2.6 An Empirical Model for the Spatial Geometry of Crater Rays
In observed lunar craters, the continuous ejecta blanket usually extends to 2-3
radii from the center of the crater. Beyond this range, the ejecta breaks up into dis-
continuous structures in the form of crater rays and secondary craters. The anomalous
diffusion model by Li and Mustard did not take into account the discontinuous nature
of distal ejecta but instead modeled each crater as having an infinite continuous ejecta
blanket (Li and Mustard, 2000). The Lunar Reconnaissance Orbiter Camera (LROC)
instrument (50 cm/pixel) has imaged fresh crater rays (Robinson et al., 2010), which
54
display the nearly pristine original ejecta pattern of a fresh crater. Initial crater ray
material may be brighter than surrounding background material, but cosmic rays, so-
lar wind, or micrometeoroids weather that bright material, resulting in a decrease in
their albedo over time until they are no longer distinguishable from the surrounding
lunar background. Most craters have no visible rays, which is accounted for by their
long exposure time on the lunar surface.
Elliott mapped lunar rayed craters and performed a systematic study of the dis-
tribution of their morphology, length, number, and width (Elliott et al., 2018). In
general, ray morphology is divided into two types: flowery rays and spike-like rays.
Flowery rays exhibit feathered boundaries that often overlap with neighboring flow-
ery rays. Spike-like rays show a sharp boundary between rays and surroundings and
are commonly observed in large or fresh craters. These two types of crater rays are
usually found together in a single crater. For some craters those flowery rays are
shorter than spike-like rays. Some craters may be dominated by one of these two
patterns. For example, the ray system of Copernicus Crater is dominated by flowery
rays. The ray morphology data of Elliott suggests that the number of spike-like rays
ranges from 6 to 14 per crater (Elliott et al., 2018). The average length of flowery
rays is about 5 to 7.5 crater radii, and the average length of the observable spike-like
rays ranges from 5 to 55 crater radii.
Ray length highly depends on the efficiency of transport of distal ejecta. Baldwin
studied crater ray length distribution of 50 lunar craters (Baldwin, 1963) using photo-
metric images of lunar crater taken by Kuiper (Kuiper, 1960). Baldwin summarized
the measurements of 50 lunar crater ray lengths in “diameter” in Table 32 of his
book (Baldwin, 1963). It is unclear about what he meant by crater ray diameter; yet,
suggestions to the measurement method were offered (Baldwin, 1963; Moore et al.,
1974; Elliott et al., 2018, Figure 14). Likely, the “diameter” of a crater ray length is
determined from drawing a circle that goes from the end of a longest ray to the end(s)
of ray(s) along the direction (Elliott et al., 2018). Moore used least square method to
fit the data directly from Table 32 of Baldwin and obtained a power law function of a

55
crater’s radius for observed craters’ length (Moore et al., 1974). Elliott suggests that
their least square analysis mistook the value of Ray Diameter as a single ray length,
leading to a ray length as twice as the measured ray length in Baldwin (Elliott et al.,
2018). This empirical power law function that is corrected:
Rray = 5.25R1.25crat, (2.25)
where Rray is the median length of a crater’s observable rays, and Rcrat is crater
radius. The original power law function is simply multiply 2 to 5.25 in front of Rcrat
to compensate for a realistic crater’s ray length. In addition, Elliott found that the
end of rays may be determined by the point where the primary crater ejecta have
become too small to overturn space-weathered “skin” that exists on the lunar surface
(Borg et al., 1976).
This hypothesis suggests that the measured length of crater rays is likely shorter
than the true length because the ejecta material becomes too small to affect the sur-
face enough to be seen. Li and Mustard reproduced the width of the mare/highland
mixing zone from Clementine UV/VIS data, assuming an infinite extent of distal
ejecta in their mathematical model (Li and Mustard, 2000). Therefore, we assume
that a crater ray could potentially reach farther than we observe them, but for nu-
merical expediency, our crater ray extends until its vertical thickness reaches 10−8 m,
which is an order of magnitude smaller than the penetration depth of the UV/VIS
wavelength region measured by Clementine.
We currently model ejecta blankets and rays as symmetrical, although we know
that oblique impacts have an asymmetric ejecta distribution (Moore and Baldwin,
1968; Howard and Wilshire, 1973; Gault and Wedekind, 1978). We assume that
the effects of oblique impact angles are averaged out over a large number of cratering
events. Using an empirically derived number and length of rays based on the mapping
data of Elliott, we use a function called the Superformula to approximate the spatial
geometry of rays on the lunar surface (Gielis, 2003) . This formula can reproduce

56
a wide variety of morphologies found in nature, ranging from basic shapes (circle,
square, ellipse, and rose curve) to biological shapes (starfish, marine diatom, and
flowers). It is not meant to model any kind of physical process that gives rise to crater
rays, but rather to approximately mimic ray morphology and allow us to model the
spatial heterogeneity of distal ejecta in a way constrained from observations of ray
morphology.
The Superformula in polar coordinates is defined as,
r(φ) =
{[|1a
cos(m
4φ)|n2 + |1
bsin(
m
4φ)|n3
] 1n1
}−1(2.26)
in which the six parameters: a, b, m, n1, n2, and n3, control shape (see detail
below); φ is polar angle ranging from 0 to 2π; and r(φ) is the radius or distance
from a point in polar coordinates to the origin of coordinates and can be expressed as√x2 + y2 in Cartesian coordinates. In general, a is always equal to b for symmetric
shapes. We used a specific parameter set for both spike-like and flowery rays in CTEM
and superpose them to generate the complete ray geometry. The superposition of the
Superformula equations that we developed for both ray patterns outlines the contour
of rays (Figure 2.6).
The parameter of m determines the number of rays. For spike-like rays, it ranges
from 6 to 14 per crater, and as a result, the values of m within the range of 6 and
14 with the exact number of any particular crater are determined using a random
number generator. For flowery rays, we use 20 for the values of m parameter. The
parameter of n1 controls the shape. We use 4.0 for spike-like rays and 1.0 for flowery
rays. The parameters of n2 and n3 have an equal value, but their values depend on
the length of the ray. By equaling the r(φ) of the Superformula in equation 2.27 to a
desired ray length, we are able to derive a relationship between the value of n2 (n3)
and a desired ray length,

57
n2 = n3 = 8×[log10(0.5×
rrayrCE
)
]+ 2 (2.27)
where rray can be the length of either spike-like rays or flowery rays, in which
default length of spike-like ray is set 100 times longer than the extent of continuous
ejecta blanket, rCE. The output of shape of our crater rays is shown in Figure 2.6b.
Figure 2.6.: Comparison between an actual rayed crater and a model rayed crater.
(a) Example of a fresh crater (LROC stamp: M1136364148RE) with a radius of ∼6
m in radius. (b) Regolith map of a crater with our crater ray model. The crater
is 0.146 km in diameter at 10 m/pixel resolution. The flowery rays surrounding the
continuous ejecta extend to 7 radii from the craters center, and the spike rays extends
outward until the regolith thickness reaches the cutoff value of 108 m (not shown here).
The variation in color represents the thickness of regolith (ejecta), ranging from none
(black) to maximum (red).
The Superformula gives the spatial geometry of the ray, but we must also adjust
the ejecta thickness within the ray to account for the inhomogeneity of the distal
ejecta. In the distal ejecta regime in our model, only the rays contain ejecta mass. To
conserve the total mass of ejecta in the distal rays, we calculate the areal fraction that
58
is covered by ray material at any given landing distance, f(r). The ejecta thickness
inside a ray at a given landing distance (t′e) is then modified from an equivalent
thickness (te) if the ejecta were continuous by t′e = te/f(r). The ejecta thickness
outside a ray is zero. In other words, at any given radial distance in the distal ejecta
region, the amount of ejecta volume contained in rays is equal to the total volume
of the excavation flow at the launching point corresponding to that distance, just as
it is in the continuous ejecta blanket. This makes the ejecta thickness versus radial
distance slightly less steep along the centerpoint of a ray compared to what it is in
the continuous ejecta blanket.
2.7 A Vertical Mixing Model for Craters Under the Resolution Limit of
CTEM
The excavation flow model developed in section 2.3 accounts for the mixing and
transport of material from craters that CTEM can resolve. Craters smaller than the
size of a grid cell cannot be generated, and as a result, we lose information about how
small craters affect material mixing. The mixing of material by small craters was
investigated by Gault, who developed a framework for understanding the reworking
zone based on Poisson statistics (Gault et al., 1974). They parameterized the time
scale for the overturn of material by impacts as the time needed to cover a surface
completely by craters of a given size. After a surface is completely covered by craters
of size Dcrat, the whole area of the surface will have been mixed to a depth at which
the deepest streamline in the excavation flow can reach, which Gault took as Dcrat/8.
Because each cratering event occurs independently, regardless of crater size, the total
overturning time scale is simply a superposition of overturning time scales of all
craters in the crater production population.
To derive the probability that a surface has been excavated to some depth h,
we developed a model similar to that of Gault and also Hirabayashi and Costello
(Hirabayashi et al., 2017; Costello et al., 2018). From Poisson statistics, Gault found
59
that for a model of a production population with a single crater size, the probability
that any point on a cratered surface has been filled by craters that occupy an area of
A = πr2 is,
P (r, t) = 1− exp
[−dN(r)
drAt
](2.28)
where P (r, t) is the fraction of a surface occupied by craters with a radius r as a
function of time t and dN(r)dt
is the number of craters that fall within the range of
r and r + dr that form per unit area per unit time (the differential form of impact
flux size-frequency distribution). Because each crater size has its own independent
probability given by equation 2.28, the probability that the surface is covered by
craters over the size range (rmin < r < rmax):
P (r, t) = 1− exp
[−t∫ rmax
rmin
dN(r)
drA dr
](2.29)
For equation 2.29 we seek a fraction of a surface that is excavated to a depth. We
assume that the shape of the excavation zone is approximately parabolic (Melosh,
1989). Therefore, the excavation depth for each crater is given by a function, h(x, r),
which,
h(x, r) = hexcav(1−x2
r2) (2.30)
where x is radial distance from the center of each crater of radius r and hexcav is
the excavation depth at the crater center, which is where the excavation depth is a
maximum. In this model, the area of the mixing zone in equation 2.29 is A = πx2.
Equation 2.29 becomes,
P (r, t) = 1− exp
[−t∫ rmax
rmin
dN(r)
drπx2 dr
](2.31)

60
We can link the relationship between a mixing zone and the size of a crater from
equation 2.30,
x2
r2=
1− h/hexcav if x < r
0 if x ≥ r
(2.32)
The maximum excavation depth, hexcav, is given by hexcav = αD = 2αr, where α is
a parameter that sets the maximum excavation of a crater relative to its diameter. The
value of can range from α = 1/8, assuming that mixing is due to the excavation and
deposition of the proximal ejecta blanket (Gault et al., 1974), to α = 1/3, assuming
that the area between the floor of the final crater and the floor of the transient
crater is fully mixed (Collins, 2014). In this study, we only consider the value of
maximum excavation depth as hexcav = Dcrat/8 because our preliminary investigation
for excavation depth as great as Dcrat/3 yields significant inconsistencies with the
Clementine observational data. This may be because the region between the floor of
the final crater and the floor of the transient crater is only partially mixed.
Equation 2.32 defines the mixing zone for a given crater size r, in which the mixing
zone is limited to the radius of a crater. We then substituted equation 2.32 to A into
equation 2.31, and we now have for our mixing probability equation:
P (h, t) = 1− exp
[−t∫ rmax
max(rmin,h2α
)
dN(r)
drπr2(1− h
2αr) dr
](2.33)
The reason the lower limit on the integral in equation 2.33 can take two possible
values is because at any given depth h, only craters with hexcav > h can contribute
to mixing.
Using an input of time and a crater size frequency distribution, equation 2.33
allows us to calculate the probability that the regolith at depth h has been mixed at
time t. Because equation 2.33 considers a constant impact flux, we can convert the
61
time scale into actual time scale by using the Neukum chronology function (Neukum
et al., 2001). Figure 2.7 shows the mixing depth probability at different time intervals
(1 Myr-10 Gyr) under a constant impact flux rate. The 10 Gyr constant impact flux
rate is equivalent to a 3.65 Ga age in the Neukum chronology. Our median mixing
depth in 3.65 Ga is ∼4 m, which falls into the range of 210 m for typical regolith depth
in mare regions (Oberbeck and Quaide, 1967; Oberbeck and Quaide, 1968; Quaide
and Oberbeck, 1968; Quaide and Oberbeck, 1975; Oberbeck et al., 1973; Bart et al.,
2011).
We use equation 2.33 to implement a subpixel vertical mixing model into CTEM.
Our subpixel crater mixing model runs between each creation of a resolvable crater.
For the time interval between a resolvable craters production, one can draw a proba-
bility function as shown in Figure 2.7. The short time interval gives a greater prob-
ability of a shallow mixing depth; however, there is a chance that a deeper mixing
depth could occur. A random depth is drawn from the probability function given by
equation 2.33 and then we create a mixed layer of material at each grid cell with this
random depth.
2.8 Modeling super-domain craters
We included a model for what we call “super-domain” craters. These are large
craters that form outside our simulation domain, but whose ejecta cross the domain.
We do not model the formation of the crater cavity of super-domain craters inside
our simulated domain. To obtain the numbers and sizes for super-domain craters oc-
curring in our simulated domain, we first applied the same crater production function
that is used in our simulated domain. Even though many more craters with all sizes
are expected in our super domain due to its larger area, the actual ejecta deposition of
a crater depends on the distance between the super-domain crater and our simulated
domain. This affected area is defined as the circle area with a radius of length of its
ejecta extent, which is ∼200 radii, subtracted by the total simulated domain area. A

62
Figure 2.7.: The fraction of surface that mixes to a given depth for a time interval
from our vertical mixing model for subpixelsized craters. The x axis is the mixing
depth, and the y axis is the fraction of area that is mixed to that depth. Each curve
is labeled with its corresponding time, 1 Myr, 10 Myr, 100 Myr, 1 Gyr, and 10 Gyr.
For 1 Myr time interval, the probability of a surface that mixes to 1 cm (0.01 m)
is <0.2, yet in that time, the whole surface has already mixed to 1 mm. Note that
the 10 Gyr period at this constant impact flux rate is equivalent to a 3.65 Ga age
accounting for the exponentially higher impact rate prior to 3 Ga (Neukum et al.,
2001).
larger crater has a bigger affected area than smaller craters. When we calculated the
numbers of craters from crater production distribution, we kept a crater as long as
its affected area is larger than the total area of a simulated domain, but otherwise
it is discarded. Then the number of super-domain craters given by the elapsed time
between the formations of two resolvable craters and its affected area was obtained.
To estimate ejecta deposition from super-domain craters as well as modeled glass
spherules, we must calculate the size of the transient crater of each super-domain
63
crater. To do so, some assumptions such as impact velocity and impact angle are
useful to obtain the amount of modeled glass spherules inside the ejecta. We assume
for these craters that they have an impact velocity of ∼18.3 km/s, which is similar to
the root mean square of the velocity distribution of asteroidal impactors on the Moon
(Yue et al., 2013). The impact angle is assumed to be 45 degrees. We applied the
same impact conditions to each generated super-domain crater. With these prescribed
values, we can estimate the location of ejecta inside a melt zone and obtain melt
fraction within its stream tube. The fraction of modeled glass spherules inside the
ejecta depends on whether its deposition distance reaches the glass onset distance
for the production of impact glass spherules. Because we do not model the detailed
formation of super-domain craters outside our simulated domain and cannot obtain
information of the subsurface, each super-domain crater ejecta only deposits newly-
formed glass spherules, and only does so within the segment of the crater ray that
crosses the simulated domain.

64
HERE MEN FROM THE PLANET EARTH
FIRST SET FOOT UPON THE MOON
JULY 1969, A.D.
WE CAME IN PEACE FOR ALL MANKIND
Neil Armstrong

65
3 HETEROGENEOUS IMPACT TRANSPORT ON THE MOON
Acknowledgement: A version of this chapter has been published in Journal of Geo-
physical Research: Planets. Reference: Huang, Y. H., Minton, D. A., Hirabayashi,
M., Elliott, J. R., Richardson, J. E., Fassett, C. I., and Zellner, N. E. (2017). Hetero-
geneous impact transport on the Moon. Journal of Geophysical Research: Planets,
122(6), 1158-1180, DOI:10.1002/2016JE005160
Abstract: Impact cratering is the dominant process for transporting material
on the Moon’s surface. An impact transports both proximal material (continuous
ejecta) locally and distal ejecta (crater rays) to much larger distances. Quantifying
the relative importance of locally derived material versus distal material requires
understandings of lunar regolith evolution and the mixing of materials across the
lunar surface. The Moon has distinctive albedo units of darker mare basalt and
brighter highland materials, and the contacts between these units are ideal settings
to examine this question. Information on the amount of material transported across
these contacts comes from both the sample collection and remote sensing data, though
earlier interpretations of these observations are contradictory. The relatively narrow
(∼4-5 km wide) mixing zone at mare/highland contacts had been interpreted as
consistent with most material having been locally derived from underneath mare
plains. However, even far from these contacts where the mare is thick, highland
material is abundant in some soil samples (>20%), requiring transport of highland
material over great distances. Any model of impact transport on the Moon needs
to be consistent with both the observed width of mare/highland contacts and the
commonality of nonmare material in mare soil samples far from any contact. In this
study, using a three-dimensional regolith transport model, we match these constraints
and demonstrate that both local and distal material transports are important at the
66
lunar surface. Furthermore, the nature of the distal material transport mechanism in
discrete crater rays can result in substantial heterogeneity of surface materials.
3.1 Introduction
Impactors not only bombard the Moon but also initiate the transport of material
across the Moons surface. An impact excavates material from below the surface and
emplaces it as a continuous ejecta blanket surrounding the crater and distal ejecta
in rays at large distances. The proximal material in the continuous ejecta deposit is
transported at low velocities and thus deposited locally. Most of the excavated mass
is deposited locally. On the other hand, material originating in a region closer to the
impact point can be thrown to much larger distances, forming secondary crater fields
and crater rays (Shoemaker, 1965). This distal ejecta is widely dispersed, relatively
low in mass, and mixes more with preexisting material upon deposition (Oberbeck,
1975). The first Apollo mare soil samples returned to Earth consisted of material
of a variety of compositions, including both local mare basalts and more distantly
sourced highland anorthosites (Wood, 1970; Wood et al., 1970c; Wood et al., 1970a).
The anorthositic material in mare soil samples could either been derived from the
underlying highland layer beneath mare surface or may have originated far from
the sampling site (Arvidson et al., 1975; Rhodes, 1977; Horz, 1978; McKay et al.,
1978; Labotka et al., 1980; Laul and Papike, 1980; Simon et al., 1981; Simon et al.,
1990; Farrand, 1988; Fischer and Pieters, 1995). The hypothesis that the source of
anorthositic material in a mare soil came from beneath the mare deposit was favored
until it came to be understood that the majority of mare plains are thick: up to
kilometers at their center, decreasing to approximately hundred meters at the edges
of the plains (De Hon, 1974; Horz, 1978; Head, 1982; Budney and Lucey, 1998; Evans
et al., 2016). Only the largest postmare craters can excavate underlying highland
materials, and the presence of a substantial anorthositic component in a mare soil
samples must therefore originate from far away. Material transport by impacts is an
67
important process across all size scales. Small impacts constantly mix the uppermost
layers of the lunar soil. Mixing of local materials leads to a well-mixed layer called the
reworking zone (Gault et al., 1974; Morris, 1978; McKay et al., 1991). For example,
the Apollo 15 deep drilling core has been interpreted as having ∼242 well-mixed layers
with thicknesses between a few millimeters and ∼13 cm (Taylor, 1982). Additionally,
the transport of material by impacts is apparent in the Apollo 14 impact glasses
(Zellner et al., 2002). For example, impact glasses with feldspathic compositions
are abundant even though the typical Apollo 14 regolith is mostly potassium, rare
earth element, and phosphorus (KREEPy). It remains unclear, however, how much
proximal ejecta versus distal ejecta contributes to the makeup of lunar regolith.
One way to evaluate the relative importance of proximal ejecta and distal ejecta is
to examine how the basalt/anorthosite material mixing ratio changes as a function of
distance from a mare/highland boundary (Schonfeld and Meyer, 1972; Rhodes et al.,
1974; Rhodes, 1977; Li et al., 1997; Li and Mustard, 2000). The material mixing
process across mare/highland contacts is driven by impacts, and the area where this
mixing occurs is called the mixing zone. Immediately following the eruption and
emplacement of the mare basalts, this mixing zone was a very narrow and sharp
contact existed between the mare and highland plains. If local material transport
dominates, then an insignificant amount of material would be transported across the
contact, so the expectation is that boundaries would remain relatively sharp. On
the other hand, if distal ejecta dominates, one would expect a wider mixing zone.
The Apollo and Luna sample sites were located at a wide range of distances from
mare/highlands boundaries, allowing us to see how the basalt/anorthosite mixing
ratio varies with distance.
The mare soil samples of Apollo 15/17, Apollo 12, Apollo 11, and Luna 16 were
taken at less than 0-4 km, ∼20 km, ∼50 km, and ∼110 km from their nearest
mare/highland boundary, respectively. When we examine the basaltic/anorthositic
mixing ratio with each sampling distance, it appears that the samples collected further
away from the nearest contacts are not as strongly correlated to sampling distance
68
as the samples collected at a much closer distance. The amount of nonmare material
in Apollo 11, Apollo 12, and Luna 16 mare soil samples, which extend up to 100
km from the nearest highland contact, is about 20% on average, with the exception
of a few Apollo 12 samples, which are ∼20 km from the highlands and reach non-
mare fractions of up to 70% (Figure 3.1) (Wood, 1970; Goles et al., 1971; Hubbard
et al., 1971; Schnetzler and Philpotts, 1971; Schonfeld and Meyer, 1972; Wanke et al.,
1972). The elevated abundance of nonmare material found in most mare soil samples
at these large distances would suggest their origin as distal ejecta.
In contrast, the Apollo 15 and 17 missions were near the edge of the maria and
close to the contact with highlands. The astronauts collected samples at varying
distances but all within 4 km of the contact (NASA Technical Report Server, 1972;
NASA Technical Report Server, 1973). The amount of highland material in mare soils
sampled by both missions decreased rapidly with distance from the contact (Figure 1).
The narrow mixing zones observed in these near-contact sampling sites are suggestive
of a different trend in exotic material abundance as a function of distance compared
to the more distant Apollo 11 and 12 and Luna 16 samples. The observations of an
active reworking zone and narrow mixing zones seen at the Apollo 15 and 17 sites
imply that a proximal ejecta-dominated local mixing process is most important, while
the amount of nonmare material in the more distant mare soils implies distal ejecta-
dominated mixing (Shoemaker, 1970; Wasson and Baedecker, 1972; Oberbeck et al.,
1973; Gault et al., 1974; Rhodes, 1977; Horz, 1978). This discrepancy has remained
unresolved.
The impact transport process can be further constrained using remote sensing
observations. The Clementine UV/VIS (ultraviolet/visible) camera obtained 120-170
m/pixel resolution multispectral reflectance data for the Moon (Nozette et al., 1994).
Because of the albedo contrast between darker basaltic mare and brighter anorthositic
highlands, Li and Mustard used this Clementine reflectance data to quantitatively
estimate how much material has been transported across mare/highland contacts for
four basins (Li and Mustard, 2000). The UV/VIS imaging data revealed a sharp
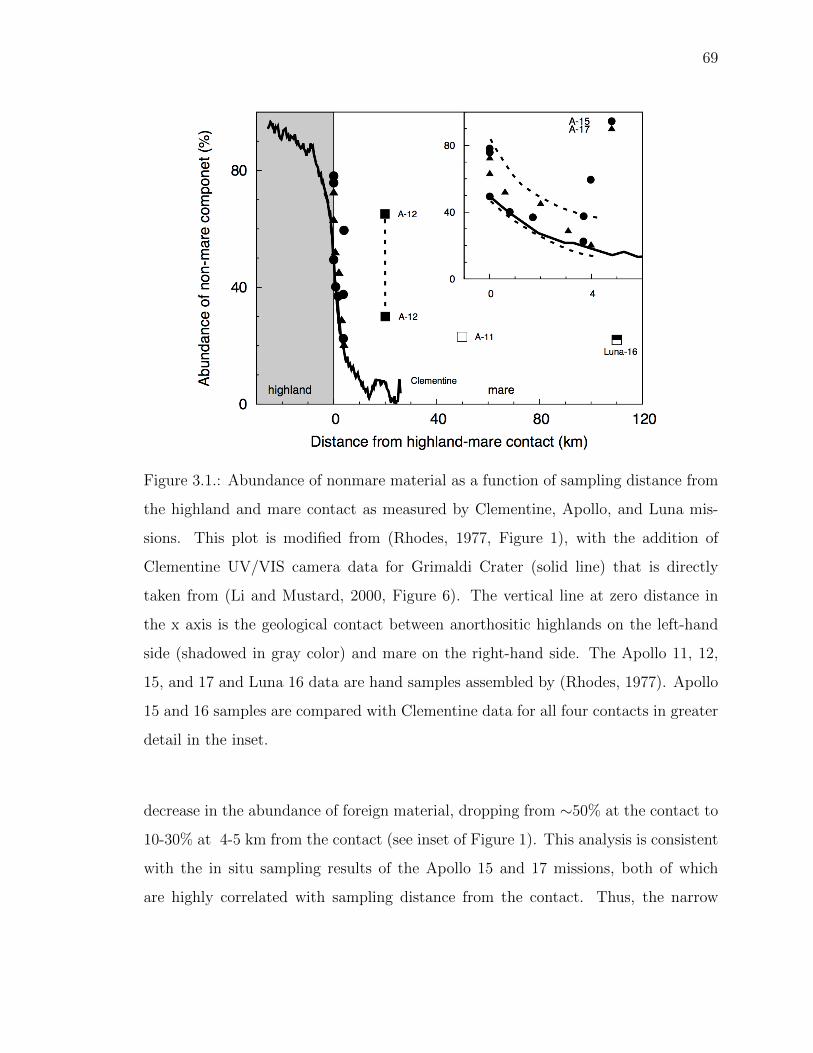
69
Figure 3.1.: Abundance of nonmare material as a function of sampling distance from
the highland and mare contact as measured by Clementine, Apollo, and Luna mis-
sions. This plot is modified from (Rhodes, 1977, Figure 1), with the addition of
Clementine UV/VIS camera data for Grimaldi Crater (solid line) that is directly
taken from (Li and Mustard, 2000, Figure 6). The vertical line at zero distance in
the x axis is the geological contact between anorthositic highlands on the left-hand
side (shadowed in gray color) and mare on the right-hand side. The Apollo 11, 12,
15, and 17 and Luna 16 data are hand samples assembled by (Rhodes, 1977). Apollo
15 and 16 samples are compared with Clementine data for all four contacts in greater
detail in the inset.
decrease in the abundance of foreign material, dropping from ∼50% at the contact to
10-30% at 4-5 km from the contact (see inset of Figure 1). This analysis is consistent
with the in situ sampling results of the Apollo 15 and 17 missions, both of which
are highly correlated with sampling distance from the contact. Thus, the narrow
70
mixing zones seen in both the Apollo 15 and 17 sampling and Clementine data seem
to support the hypothesis that local material dominates at the lunar surface.
If locally derived materials dominate on the lunar surface, and distal ejecta is
insignificant, then the mixing process across mare/highland contacts can be modeled
by only considering deposition of the proximal continuous ejecta. Li modeled the
material exchange between mare and highland plains as a classical diffusion process
(Li et al., 1997), which describes the movement of a particle as random walk, with
each step of motion spanning a finite distance. The finite step that a crater generates
is limited to the extent of the continuous ejecta blanket. However, the classical
diffusion model results in an even narrower mixing zone (<1 km) than is observed,
which conflicts with both the Clementine and Apollo 15 and 17 results. Thus, Li
concluded that local material transport could not be the dominant mixing process
at mare/highland contacts (Li et al., 1997). Therefore, some amount of distal ejecta
must play an important role in transporting material across mare/highland contacts.
Instead of the classical diffusion model, Li and Mustard used an anomalous diffu-
sion model in which the movement step is not limited to the extent of the continuous
ejecta blanket but can be larger or even infinite (Li and Mustard, 2000). The anoma-
lous model is more realistic because large craters deposit material far from their
source region. Their anomalous diffusion model successfully reproduced the 45 km
wide mixing zone seen in the Clementine data. They suggested that distal ejecta
is what determines the width of this narrow mixing zone. With some simplifying
assumptions, such as that the ejecta was radially homogeneous and followed a simple
power law thickness profile that extended to infinite distance, Li and Mustard were
able to reveal the relative importance of proximal (local) ejecta and distal ejecta on
the Moon. Yet this result is still at odds with the observed elevated abundances of
exotic material seen in the Apollo 11 and 12 and Luna 16 samples that are much
farther away from the source of highland material.
Here we propose a new model that accounts for the spatially heterogeneous nature
of distal ejecta. The ejecta are only continuous to ∼2-3 radii distance, and beyond
71
that, they break into discontinuous rays (Howard, 1974). By accounting for this
nature of the ejecta, we investigate both the 45 km wide mixing zone across contacts
and the elevated nonmare abundances at further distances. We model the impact-
driven material transport and mixing processes across mare/highland contacts with
a fully three-dimensional regolith tracking code. Our code includes treatments of the
reworking zone of locally derived material, as well as both continuous proximal and
discontinuous distal ejecta (crater rays, see Chapter 2). In section 3.2 we discuss the
observational constraints on transport of material by impacts in detail.
In section 3.3 we apply our new code to the problem of material transport across
the mare and highland boundary of Grimaldi Crater. In section 3.4 we discuss how
discontinuous distal ejecta may explain the discrepancy between the wide mixing zone
implied by the Apollo 11 and 12 and Luna 16 samples and the narrower mixing zone
implied by the Apollo 15 and 17 samples and Clementine remote sensing observations.
Finally, in section 3.5 we use our simulation results to discuss the implications of the
heterogeneous nature of distal ejecta.
3.2 Two Sets of Contradictory Observational Constraints on Material
Transport
In our study, we wish to understand what processes are responsible for trans-
porting and mixing material at the lunar surface. We will use two data sets that
will constrain the material fraction as a function of distance from a highland/mare
contact. These data sets are distinguished by their sampling distance from the near-
est mare/highland contact. The first data set includes Apollo 12 and 11 and Luna
16 soil samples, which are sampled at large distances from the contact: 20, 50, 110
km, respectively. Wood (1970) classified 1676 lithic fragments in the 1-5 mm size
range from 11.1 g of the Apollo 11 coarse fines (sample (10085,24) with sizes >1
mm) (Wood, 1970). The visible anorthositic fragment (5%) and some anorthositic
component embedded in basalt breccia amount to 20% in their Apollo 11 soil sample.

72
The chemical mixing model of Schonfeld and Meyer also showed the Luna 16 soil
has 20% anorthositic gabbro and 2% KREEP as representative of nonmare compo-
nents (Schonfeld and Meyer, 1972). Intensive compositional analysis on Apollo 12
soil samples presents a mixture of up to 30-70% KREEP material and basalt (Goles
et al., 1971; Hubbard et al., 1971; Schnetzler and Philpotts, 1971; Wanke et al.,
1972). These mare soil samples show >20% anorthositic material, with some Apollo
12 samples reaching up to 70% (Figure 3.1). Later, the Apollo 15 and 16 orbital
X-ray experiments created compositional maps of several mare surfaces (e.g., Mare
Imbrium and Mare Serenitatis). The compositional maps closely match the soil sam-
ples, with elevated levels of aluminous or anorthositic material (Trombka et al., 1974).
The more anorthositic mare surfaces indicate that distal materials from the highlands
contaminate the mare surfaces.
The second data set consists of Apollo 15 and 17 mare soil samples and Clementine
remote sensing data sets that sampled the spectral reflectances of Mares Grimaldi,
Tsiolkovsky, Orientale, and Fecunditatis from mare/highland contacts at a short dis-
tance (4-5 km). Rhodes assembled component estimates of those in situ Apollo 15
and 17 mare soil sample collected from mare plains (Rhodes, 1977; Rhodes et al.,
1974; Schonfeld and Meyer, 1972; Duncan et al., 1975). The inset of Figure 1 shows
the strong correlation between nonmare abundance and distance. Although the abun-
dances of the anorthositic component in the Apollo 15 and 17 mare soil samples appear
to vary by location, they still show a decrease from 50-80% at the mare/highland con-
tact to 20-40% at the edge of the mixing zone. Despite the compositional variability
seen in the Apollo 15 and 17 samples, Clementine UV/VIS data sets for all four basins
fall within the range of the samples, except for Mare Tsiolkovsky, whose mixing zone
is narrower than that of each of the other three basins. Both Clementine UV/VIS
data sets and Apollo 15/17 mare soil samples are consistent with each other, although
the Apollo 15 and 17 mare soil samples were taken only on the mare side and only
within 4 km of the mare/highland contact. The Clementine data sets cover a much
larger distance and contain observations from both the mare and highland side of the
73
boundaries. The Clementine data suggest <10% exotic material at a distance of 20
km from the boundary, while the Apollo 11 and 12 and Luna 16 mare soil samples
are composed of >20% nonmare component at further distances.
As crater rays commonly cross mare surfaces, they may deliver anorthositic ma-
terial from highland regions. For example, the ray material from Theophilus Crater
(100 km in diameter), which is ∼8 crater radii away from the Apollo 11 landing site,
may be a significant contributor to the highland component of the Apollo 11 sam-
ples (Pieters et al., 1985; Hawke et al., 1999). Similarly, the ejecta from Copernicus
Crater (96 km in diameter), which is ∼8-9 radii from the Apollo 12 and 14 landing
sites, could contribute a large portion of the material in the samples collected at
those sites (Pieters et al., 1985). The Copernicus ejecta are potentially sourced from
the highland-like layers beneath the mare plain. As a result, the Apollo 12 landing
site, which is crossed by a ray of Copernicus Crater, could have higher abundances of
anorthositic materials than other nearby mare plains. In addition, rays from either
Autolycus or Aristarchus Crater are seen crossing the Apollo 15 landing site area
(Carr et al., 1971).
We propose a hypothesis that could account for the discrepancy between the in-
ferred widths of the mixing zones seen in the different data sets. We suggest that
because distal impact ejecta are concentrated into thin rays, there is large spatial
variability, on small spatial scales, in the abundance of nonlocal material. Therefore,
samples from the surface should show greater variability in nonlocal abundance com-
pared to remote sensing observations, which average out the spatial heterogeneities.
For example, the Apollo 15 lunar module site was in the secondary field (South Clus-
ter) of rays of either Autolycus or Aristarchus Crater (Swann et al., 1972). Li suggest
that distal ejecta from distances of >100 km away could explain an elevated amount
of nonlocal material in a sampling location (Li and Mustard, 2005), though, again,
they did not consider the heterogeneous nature of this distal ejecta.
The above demonstrates a need for a material-transport model that takes into
account the spatial heterogeneity due to crater ray emplacement. In Chapter 2,
74
we have presented our three-dimensional regolith transport model including the main
three components. The first component is an efficient approximation to the excavation
flow within a transient crater that is based on the Maxwell Z model (Maxwell and
Seifert, 1974; Maxwell, 1977). This component of our model allows us to model the
mixture of material that is incorporated into ejecta during the excavation process.
The second component is an empirically derived geometric model for crater rays.
This component allows us to model the spatial heterogeneity of distal ejecta deposits.
The last component is a mixing component that allows us to model the local zone
reworked by those craters that are smaller than our code can directly resolve.
3.3 Mare/Highland Boundary Diffusion Simulation
For our simulations of the mare and highland contact, the CTEM grid space is split
in half, where one half contains a layer of mare basalt 4 km thick on top of a highland
anorthosite layer and another half is purely highlands anorthosite (Figure 3.3). Figure
3.3 illustrates a schematic of the cross section of our modeled mare and highland
contact both near the beginning of the simulation and later as the simulation has
progressed and impacts have redistributed material around the domain. To model the
transportation process, the ejecta from each impact must be traced back to its source
location within the transient crater in order to calculate its unique compositional
mixture (see full description of methodology in the section 2.1).
Our goal is to model material transport by impacts at a mare/highland contact.
We use the Clementine UV/VIS reflectance data set compiled by Li and Mustard
for Grimaldi Crater as a constraint on our model, which shows a symmetric material
fraction distribution on either side of the contact (Li and Mustard, 2000). We will also
use the measured abundances of nonmare material within Apollo mare soil samples
as additional constraints. These data are plotted in Figure 3.1. Then we will test the
hypothesis of Li and Mustard that the 4-5 km width of the mixing zone across this
contact is determined primarily by the transport of distal ejecta.
75
Grimaldi Crater is a 173 km diameter mare-filled crater and one of the four basins
studied by Li and Mustard. Grimaldi Crater is located on the western shore of
Oceanus Procellarum; thus, the lava that filled it is thought to have the same source
as Oceanus Procellarum, which is the largest mare area on the Moon. The crater itself
is a double-ring impact structure that is pre-Nectarian in age (Wilhelms, 1987). Later
Orientale basin-forming material, the Hevelius Formation, may have covered much of
the Grimaldi region (Hawke et al., 1995). When the mare basaltic lava was initially
emplaced, it formed a sharp boundary with the older anorthositic highland bedrock.
The mare abundance at the center of the geological contact between Grimaldi’s mare
and the surrounding highlands is about 50% (Li and Mustard, 2000), which suggests
that the influence of large craters outside Grimaldi is not significant to the makeup
of the regolith near the mare/highland contact.
Inside Grimaldi Crater, there is an up to 3.6 km thick mare basalt layer at the
center of the crater, sitting atop of possible Orientale basin-forming ejecta and pre-
Nectarian highland crustal material (Solomon and Head, 1980). The largest crater
found in the Mare Grimaldi is about 4 km in diameter (Figure 3.2), suggesting that
locations where the mare basalt thickness is thinner than ∼400 m could have ex-
posed the underlying highland material. However, we neglect this contamination of
highland material because there are few large craters, and the contamination of high-
land material from the mare side to the highland side by these large craters would
be insignificant. In addition, because the observed material fraction distribution is
symmetrical across the contact, this local mixing of highlands from beneath the mare
must be negligible; otherwise, the highland material fraction would be skewed toward
the mare side.
3.3.1 Mare/Highlands Contact Simulation Setup
For our simulation domain, we took the area of Grimaldi Crater (D = 175 km)
as the total area of our simulated mare. We also assume that the size of our simu-
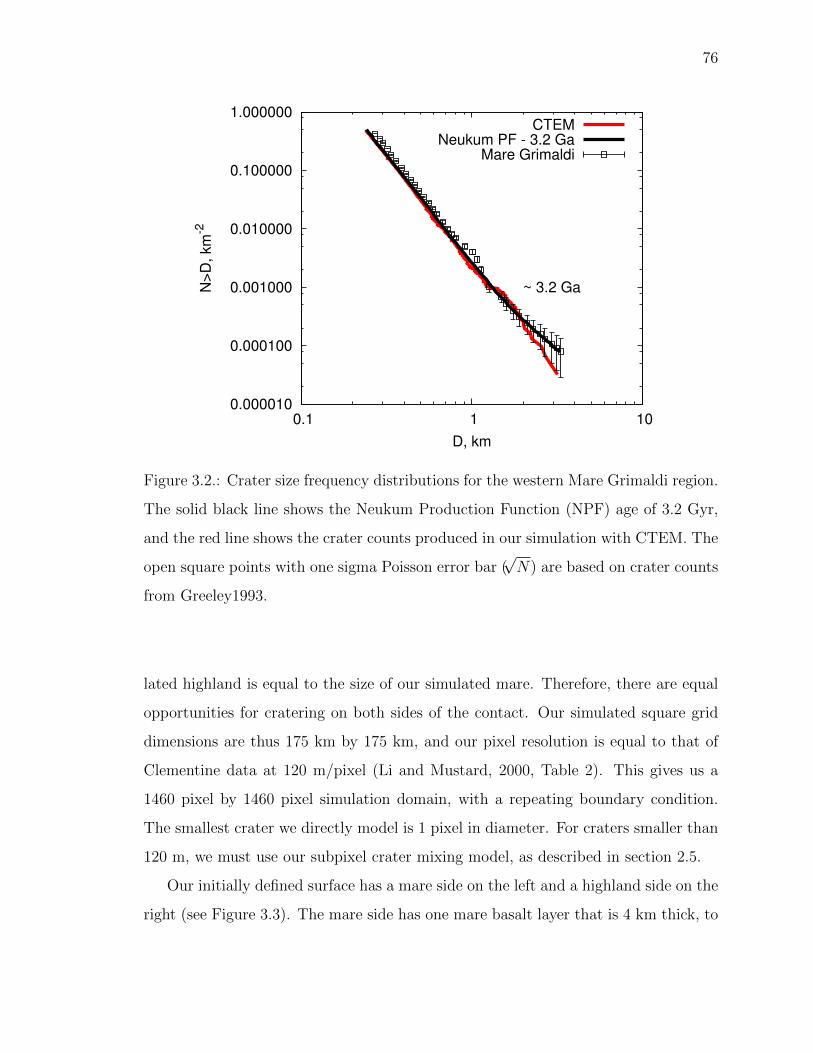
76
0.000010
0.000100
0.001000
0.010000
0.100000
1.000000
0.1 1 10
~ 3.2 GaN>
D, km
-2
D, km
CTEMNeukum PF - 3.2 Ga
Mare Grimaldi
Figure 3.2.: Crater size frequency distributions for the western Mare Grimaldi region.
The solid black line shows the Neukum Production Function (NPF) age of 3.2 Gyr,
and the red line shows the crater counts produced in our simulation with CTEM. The
open square points with one sigma Poisson error bar (√N) are based on crater counts
from Greeley1993.
lated highland is equal to the size of our simulated mare. Therefore, there are equal
opportunities for cratering on both sides of the contact. Our simulated square grid
dimensions are thus 175 km by 175 km, and our pixel resolution is equal to that of
Clementine data at 120 m/pixel (Li and Mustard, 2000, Table 2). This gives us a
1460 pixel by 1460 pixel simulation domain, with a repeating boundary condition.
The smallest crater we directly model is 1 pixel in diameter. For craters smaller than
120 m, we must use our subpixel crater mixing model, as described in section 2.5.
Our initially defined surface has a mare side on the left and a highland side on the
right (see Figure 3.3). The mare side has one mare basalt layer that is 4 km thick, to
77
match the observed thickness of the Grimaldi Crater mare (Solomon and Head, 1980),
sitting on the top of the highland layer that has effectively infinite thickness. The
highland side is one single layer that has infinite thickness of only highland material.
We model the thickness of the mare layer as uniform and neglect the underlying
shape of Grimaldi basin near the rim (gradual decrease of mare thickness toward the
contact). If this thinning out of the mare near the boundary were important, we
might expect an asymmetric material fraction distribution, with proportionally more
highland material on the mare side. However, this is not observed in the data, and
therefore, we assume that this component is future lunar missions. We also ignore
topography differences between the mare and highland. Although the steeper slopes
of the highlands along the contact would tend to transport material downward to
the mare side, the material was only found to extend to several hundred meters for
high slopes (Young, 1976), and again, one would expect the material distribution to
be asymmetric at the boundary if this effect were important. This suggests that the
slope effect of the highlands plays a less important role in transporting to the mare
side, as the observed mixing zone has a scale of a few kilometers.
Our simulation time is set by the crater-derived age of the southwestern part of
the mare deposit examined by Li and Mustard, which is 3.2 Gyr old based on crater
counts (Greeley et al., 1993). This region has no evidence for discrete resurfacing
events occurring after the mare basalt emplacement. We use an impactor population
and velocity distribution that result in a crater production function that is identical to
the Neukum Production Function (Neukum et al., 2001). Figure 3.2 shows the crater
size frequency distribution from CTEM compared with both the crater counting study
of Greeley and the Neukum production function for a 3.2 Gyr old lunar surface. Note
that the largest crater that we allow in a simulation is constrained by the Grimaldi
Crater count so as to attempt to mimic Grimaldi Crater’s western mare/highland
contact. Because the compositional profile that Li and Mustard obtained from the
western mare/highland contact of Grimaldi Crater does not include a crater larger
than 4 km near the contact, we restricted our simulation to craters between 120 m
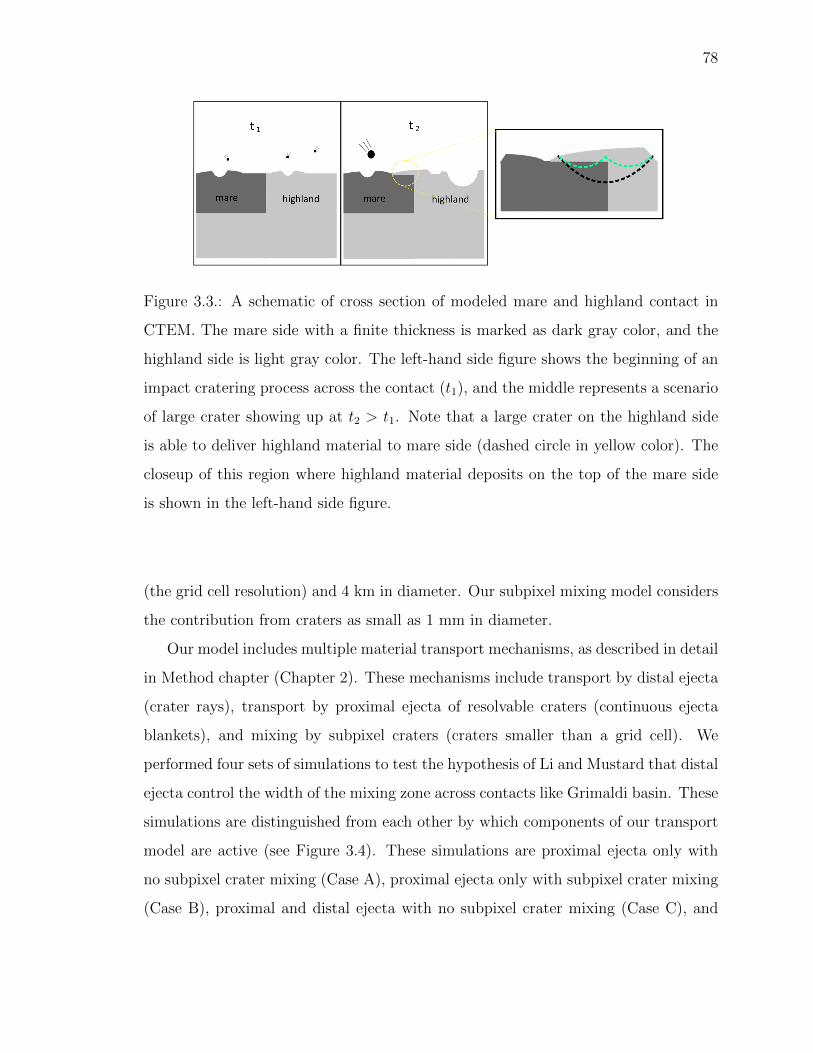
78
Figure 3.3.: A schematic of cross section of modeled mare and highland contact in
CTEM. The mare side with a finite thickness is marked as dark gray color, and the
highland side is light gray color. The left-hand side figure shows the beginning of an
impact cratering process across the contact (t1), and the middle represents a scenario
of large crater showing up at t2 > t1. Note that a large crater on the highland side
is able to deliver highland material to mare side (dashed circle in yellow color). The
closeup of this region where highland material deposits on the top of the mare side
is shown in the left-hand side figure.
(the grid cell resolution) and 4 km in diameter. Our subpixel mixing model considers
the contribution from craters as small as 1 mm in diameter.
Our model includes multiple material transport mechanisms, as described in detail
in Method chapter (Chapter 2). These mechanisms include transport by distal ejecta
(crater rays), transport by proximal ejecta of resolvable craters (continuous ejecta
blankets), and mixing by subpixel craters (craters smaller than a grid cell). We
performed four sets of simulations to test the hypothesis of Li and Mustard that distal
ejecta control the width of the mixing zone across contacts like Grimaldi basin. These
simulations are distinguished from each other by which components of our transport
model are active (see Figure 3.4). These simulations are proximal ejecta only with
no subpixel crater mixing (Case A), proximal ejecta only with subpixel crater mixing
(Case B), proximal and distal ejecta with no subpixel crater mixing (Case C), and

79
proximal and distal ejecta with subpixel crater mixing (Case D). These different cases
allow us to see the relative importance of each component of our model.
Case A
mare highland
l=2-3R
d
reworking zone
mare highland
l=2-3R
R
R
Case B
Case C
mare highland
l~200RR
mare highland
l~200R
d
reworking zone
R
Case D
Figure 3.4.: A schematic of our model cases. Case A (top figure) includes only
proximal ejecta. Case B (middle-top figure) includes proximal ejecta and sub-pixel
mixing process. Case C (middle-bottom figure) and Case D (bottom figure) includes
proximal ejecta and distal ejecta but difference between these two cases are sub-pixel
mixing process turned on in Case D. Note that l is the ejecta extent, R is the crater
radius, and d is the depth of sub-pixel mixing over a period of time.
The simulation set, Case D, combines all components of our transport model and is
closest to what the lunar surface experiences, while Case A is the most restricted and
simulates only regolith transport due to resolvable craters. The Case D simulation is
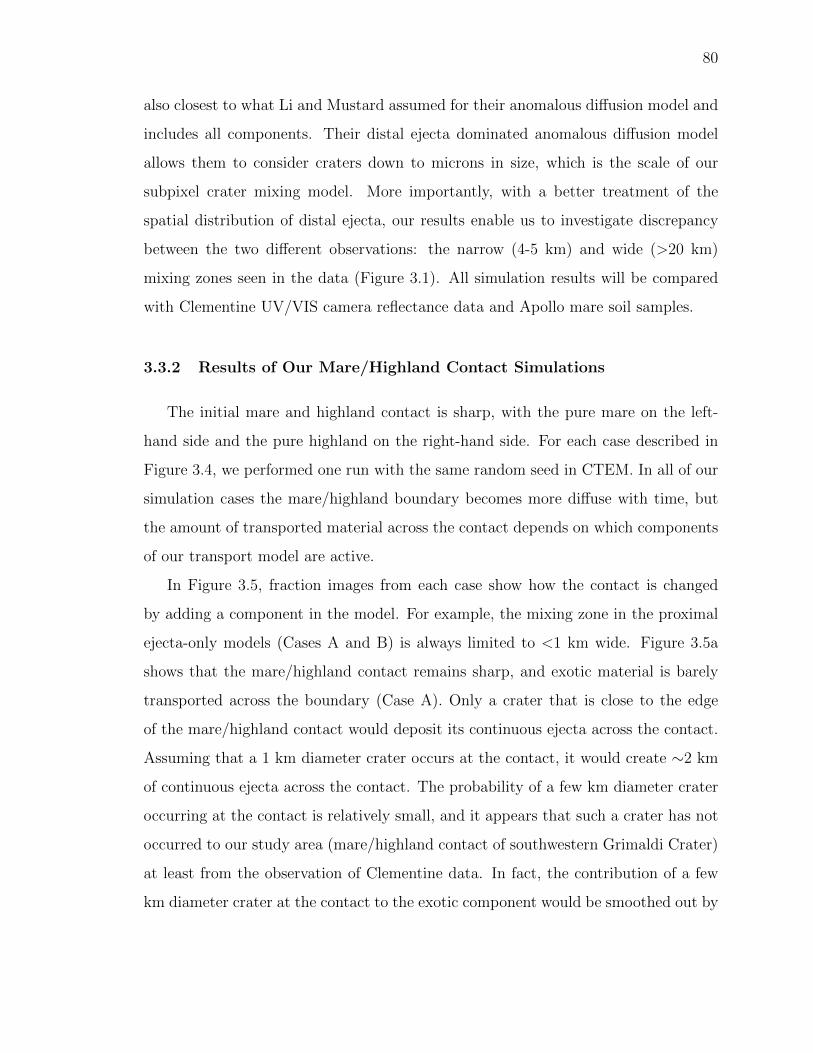
80
also closest to what Li and Mustard assumed for their anomalous diffusion model and
includes all components. Their distal ejecta dominated anomalous diffusion model
allows them to consider craters down to microns in size, which is the scale of our
subpixel crater mixing model. More importantly, with a better treatment of the
spatial distribution of distal ejecta, our results enable us to investigate discrepancy
between the two different observations: the narrow (4-5 km) and wide (>20 km)
mixing zones seen in the data (Figure 3.1). All simulation results will be compared
with Clementine UV/VIS camera reflectance data and Apollo mare soil samples.
3.3.2 Results of Our Mare/Highland Contact Simulations
The initial mare and highland contact is sharp, with the pure mare on the left-
hand side and the pure highland on the right-hand side. For each case described in
Figure 3.4, we performed one run with the same random seed in CTEM. In all of our
simulation cases the mare/highland boundary becomes more diffuse with time, but
the amount of transported material across the contact depends on which components
of our transport model are active.
In Figure 3.5, fraction images from each case show how the contact is changed
by adding a component in the model. For example, the mixing zone in the proximal
ejecta-only models (Cases A and B) is always limited to <1 km wide. Figure 3.5a
shows that the mare/highland contact remains sharp, and exotic material is barely
transported across the boundary (Case A). Only a crater that is close to the edge
of the mare/highland contact would deposit its continuous ejecta across the contact.
Assuming that a 1 km diameter crater occurs at the contact, it would create ∼2 km
of continuous ejecta across the contact. The probability of a few km diameter crater
occurring at the contact is relatively small, and it appears that such a crater has not
occurred to our study area (mare/highland contact of southwestern Grimaldi Crater)
at least from the observation of Clementine data. In fact, the contribution of a few
km diameter crater at the contact to the exotic component would be smoothed out by

81
averaging methods that are used in processing Clementine data and our simulation
results. As a result, the material transport of proximal ejecta in Cases A and B
appears limited.
Figure 3.5b shows a mixing zone that is ∼10 km wide for Case C. The sharp
boundary seen in Cases A and B is now crossed by rays. The contrast is high between
rays and background surface material (mare or highland side). The fresh appearance
of rays at the contact would be similar to how a ray may appear as soon as it forms
and before small crater gardening mixes and dilutes the exotic material. Because
small crater gardening is not modeled in Case C, any exotic material in a ray stays
at the surface until a subsequent excavation or deposition occurs. Figure 3.5c shows
the fuzzy appearance of the boundary in our Case D simulation, in which subpixel
mixing is turned on. When we turn on subpixel mixing in Case D, the transported
exotic material gets reworked into the local regolith and the surface albedo looks
much closer to the natural surface at the Grimaldi crater contact.
To quantitatively compare our simulation results with Clementine data, we ob-
tained a compositional gradient profile similar to that which Li and Mustard used
to analyze all four basin measurements taken by the Clementine UV/VIS camera.
The compositional gradient profile describes the mare abundance at a specific dis-
tance from the mare/highland contacts, and one can plot how the mare abundance
changes with distance from the contacts. For each compositional gradient profile, Li
and Mustard extracted reflectance values averaged over 20 pixels, each at a specific
distance from a mare/highland contact, to mitigate the effects of noise of Clementine
UV/VIS reflectance measurements, variability in apparent reflectance due to surface
roughness, and other pixel-scale sources of stochastic variability. They created only
two compositional gradient profiles for each of the four basins. In each of our simu-
lations, we ran through all pixels parallel to the contact and collected 1441 profiles
in which each profile is averaged over 20 pixels to enable direct comparison with the
measurements of Li and Mustard. We can calculate the mean mare abundance at a
specific distance from those 1441 profiles as well as the standard deviation of mare

82
abundance. Figure 3.6 shows the average mare abundance and one standard deviation
among all 1441 profiles for each case.
The results of the Cases A and B simulations, which include only continuous ejecta,
lead to a mixing zone less than 1 km in width, closely consistent with the classical
diffusion model result of Li (Figure 3.6a) (Li et al., 1997). In Figures 3.6b and 3.6c,
the Cases C and D simulations, which include both continuous and distal ejecta, have
mixing zones wider than 1 km. The Case C result (Figure 3.6b) contains the largest
width of mixing zone, up to 10 km on a side. This is much wider than the Clementine
UV/VIS measurement for Grimaldi Crater’s contact. Case C also has the largest
variation of mare abundance across the contact, indicating that the compositional
gradient profile is highly affected by distal ejecta in rays. As a result, the dependence
of mare abundance on the sampling distance is the smallest. As we added the subpixel
crater mixing component and, eventually, the ray mixing component into Case C, the
result of Case C shows a larger variability of composition across the contact than in
Case D. With consideration of subpixel craters mixing, the mean mare abundances
across the contact show a match with Clementine data. The addition of subpixel
crater mixing component in Case D is important because both rework the resolvable
crater ejecta deposits that are only generated in Case C. Among resolvable crater
ejecta deposits, their crater rays often transport exotic material across mare/highland
contacts; thus, their deposits are relatively less mixed.
Because the scale of excavation depth for a resolvable crater that generates crater
rays is usually larger than the thickness of preexisting ejecta layers created by pre-
vious impacts, it deposits mostly pure exotic material to the other side. When sub-
pixel crater mixing and ballistic sedimentation are neglected (Case C), both proximal
and distal ejecta stay on the surface. For the same deposit, but with the subpixel
craters mixing model enabled (Cases D), the subsequent small impacts or energetic
ejecta penetrate through this ejecta deposit layer and mix it with the underlying local
(nonexotic) material. In this case, the exotic component becomes mixed with local
material, leading to a lower exotic abundance compared to the exotic abundance in

83
Case C. Thus, as expected, Case C results in a higher exotic component at the sur-
face on either side of the contact (Figure 3.6b). The role of both the subpixel crater
mixing model is to process (and dilute) distal material. A significant reduction of the
exotic component on both sides of the contact in Case D result can be explained by
this diluting process. Both results suggest that all scales of craters are important to
determine what material is at the surface across the Moon, as well as the ultimate
fate of material transported across contacts.
The variability of mare abundance in results from Case D is smaller than in Case C
because subpixel crater mixing may bury fresh distal material. For example, the range
of one standard deviation in the Case C simulation result completely encompasses the
variability of mare abundance revealed in both Apollo 15 and 17 mare soil samples
(see Figure 3.6b). Yet the average mare abundance from Case C is highly inconsistent
with the observed compositional profile of Clementine data. On the other hand, the
Apollo 15/17 sample data are within the error bars of the Case D results, except for
one data point at the distance of 4 km, only 40%, compared to the average mare
abundance of 60-80% of the other soil samples. The Case D simulation results show
a slightly higher exotic abundance on both sides than the Clementine data.
In general, the majority of spatial variation of composition within this 4-5 km
wide mixing zone can be accounted for by local craters near the mare and highland
contact. Beyond the local scale, the stochastic nature of cratering process sometimes
means that large specific craters act as a source for exogenic material that is trans-
ported more broadly and may be present in many mare soil samples. For example,
there are two Apollo 15 mare soil samples (15101 and 15923) collected at stations
2 and 6 closer to the contact (Apennine Front) with low mare abundances (<30%).
Their relatively high nonmare abundances could be associated with a ray from nearby
craters Aristillus or Autolycus, which were large enough to excavate below the mare
(Carr et al., 1971; LSPET, 1972; Spudis and Ryder, 1985). Russ used low-energy
fluence data from the Apollo 15 drill core (the lunar module site) to show that there
was no indication of the ray deposition, which contradicts the explanation of ray

84
material in a sample (Russ et al., 1972). The distances from Autolycus or Aristillus
Crater to the Apollo 15 landing site are 150 km and 250 km respectively, which are
greater than the length of our simulation domain. Craters of similar diameter, ∼39
km for Autolycus Crater and ∼55 km for Aristarchus Crater, were not generated in
our simulation. Large craters may have randomly thrown a broad ray patch contain-
ing considerable amounts of nonmare material or KREEP material to the landing site
(see section 3.4). As a result, the higher nonmare abundance observed in the mare
soil sample collected at the Apollo 15 lunar module site might have been affected by
a ray from a large crater beyond the local scale of the mare and highland contact.
3.4 Implications of Our Impact Transport Model for Evolution of Lunar
Surface Materials
Based on comparisons of our Case C and Case D results, we suggest that larger
craters are capable of delivering exotic material to a distal location, while small and lo-
cal craters serve to bury those exotic and distal ejecta materials (due to reworking and
mixing). Without large craters, exotic material from one side of the mare/highland
contact cannot reach the other side. Once those distal ejecta materials arrive at the
other side, they are buried or comminuted or recycled by local small craters. The
combination of these two transport processes leads to this 4-5 km wide mixing zone.
Our new three-dimensional regolith transport model provides more detail about how
impacts transport material over the lunar surface.
For all of our simulation results, mean mare abundance profiles at an equivalent
distance of the Apollo 11 and 12 landing sites (Luna 16 is beyond our simulated mare
domain) remain >90%; therefore, the nonmare abundance is less than 10%. All our
final results (Figure 3.6) appear to fail to explain the elevated nonmare abundances
present in Apollo 11 and 12 and Luna 16 mare soil samples. The <10% of nonmare
abundance in our simulation is about half that of Apollo 11 and 12 and Luna 16

85
mare soils (>20-70%), even though we take into account the variation of nonmare
abundance in Case C (the largest variation of all cases).
Our results suggest that the primary difference between the Clementine data for
the contact of Grimaldi Crater and Apollo 11 and 12 and Luna 16 mare soil samples
is sampling scale. The remote sensing data, and our simulation results, are averaged
over a spatially extended region of ∼120 m, while the scale of Apollo 11 and 12
and Luna 16 mare soil samples is limited to a handful amount of soils (centimeter,
finer scale compared to the order of 100 m) at “astronaut” scales (∼m). This scale
discrepancy between data sets at these different spatial scales may be a direct result
of the high spatial heterogeneity inherent in distal transport of ejecta because it is
concentrated into rays. The averaging methods that were used in our simulations
and the processed Clementine data might have smoothed out spatially dependent
anomalies of nonmare abundance that result from crater rays caused by the random
nature of the cratering process.
Li suggested that large craters >100 km away from contacts may explain the
elevated nonmare abundance of >20% in most mare soil samples (Li and Mustard,
2005). To test this large crater hypothesis, we performed a global run to account for
the effect of larger craters at large distances from the mare/highland contact. Ideally,
it would be best to test how large craters distribute their distal ejecta on a spherical
globe, yet at present, CTEM cannot account for lunar curvature. In this study, we
simulated the global lunar surface as 6000 km by 6000 km square, which is 2000 pixels
by 2000 pixels at a resolution of 3 km/pixel. Our global square is 17% mare plains
and 83% highlands (Head and Wilson, 1992). We assume that the contamination of
the underlying highland material beneath our global mare layer to a mare soil sample
can be neglected. This assumption allows us to see the contribution of distal ejecta
from larger craters to mare soil samples without worrying about locally excavated
contamination.
We set the thickness of mare in our global domain as 4 km and the underlying
highland material that is effectively infinitely deep. On the highland side, there is
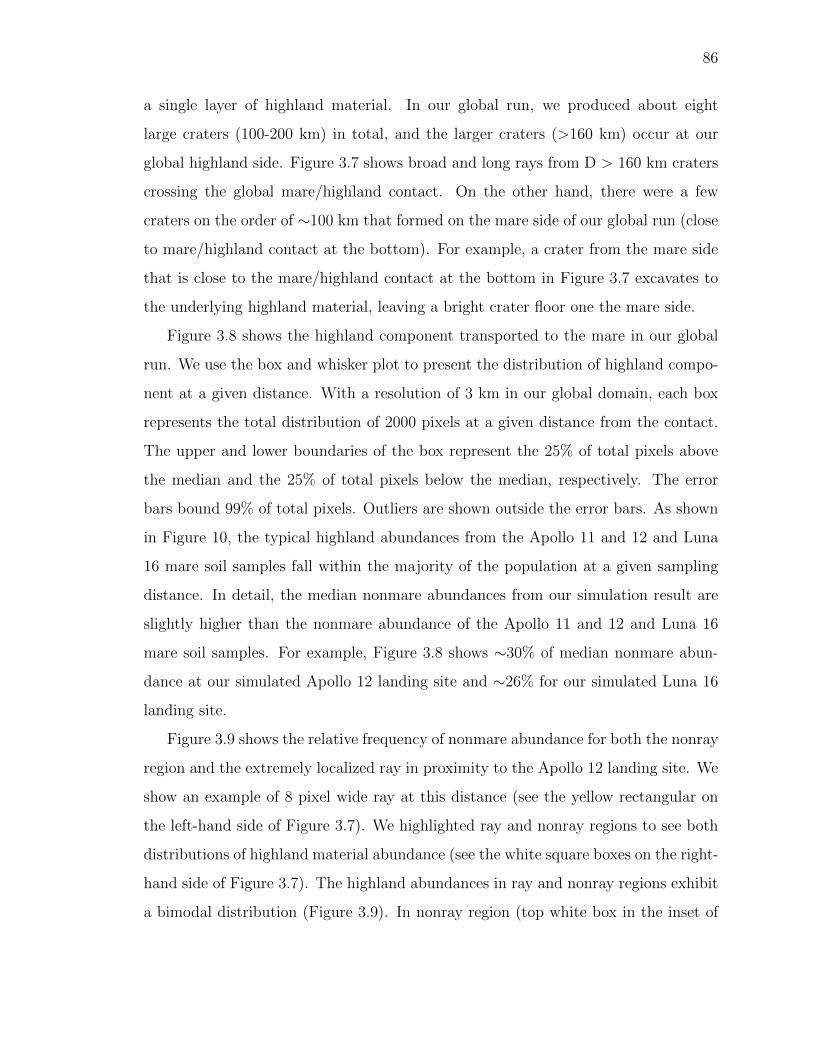
86
a single layer of highland material. In our global run, we produced about eight
large craters (100-200 km) in total, and the larger craters (>160 km) occur at our
global highland side. Figure 3.7 shows broad and long rays from D > 160 km craters
crossing the global mare/highland contact. On the other hand, there were a few
craters on the order of ∼100 km that formed on the mare side of our global run (close
to mare/highland contact at the bottom). For example, a crater from the mare side
that is close to the mare/highland contact at the bottom in Figure 3.7 excavates to
the underlying highland material, leaving a bright crater floor one the mare side.
Figure 3.8 shows the highland component transported to the mare in our global
run. We use the box and whisker plot to present the distribution of highland compo-
nent at a given distance. With a resolution of 3 km in our global domain, each box
represents the total distribution of 2000 pixels at a given distance from the contact.
The upper and lower boundaries of the box represent the 25% of total pixels above
the median and the 25% of total pixels below the median, respectively. The error
bars bound 99% of total pixels. Outliers are shown outside the error bars. As shown
in Figure 10, the typical highland abundances from the Apollo 11 and 12 and Luna
16 mare soil samples fall within the majority of the population at a given sampling
distance. In detail, the median nonmare abundances from our simulation result are
slightly higher than the nonmare abundance of the Apollo 11 and 12 and Luna 16
mare soil samples. For example, Figure 3.8 shows ∼30% of median nonmare abun-
dance at our simulated Apollo 12 landing site and ∼26% for our simulated Luna 16
landing site.
Figure 3.9 shows the relative frequency of nonmare abundance for both the nonray
region and the extremely localized ray in proximity to the Apollo 12 landing site. We
show an example of 8 pixel wide ray at this distance (see the yellow rectangular on
the left-hand side of Figure 3.7). We highlighted ray and nonray regions to see both
distributions of highland material abundance (see the white square boxes on the right-
hand side of Figure 3.7). The highland abundances in ray and nonray regions exhibit
a bimodal distribution (Figure 3.9). In nonray region (top white box in the inset of
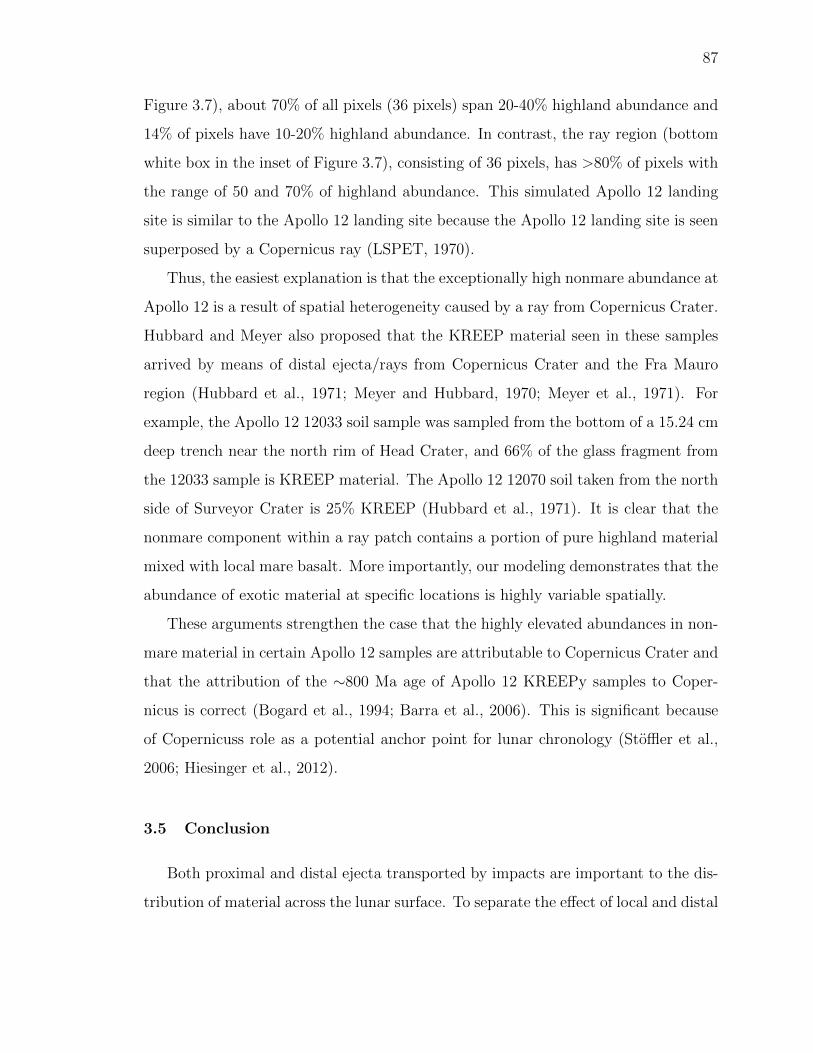
87
Figure 3.7), about 70% of all pixels (36 pixels) span 20-40% highland abundance and
14% of pixels have 10-20% highland abundance. In contrast, the ray region (bottom
white box in the inset of Figure 3.7), consisting of 36 pixels, has >80% of pixels with
the range of 50 and 70% of highland abundance. This simulated Apollo 12 landing
site is similar to the Apollo 12 landing site because the Apollo 12 landing site is seen
superposed by a Copernicus ray (LSPET, 1970).
Thus, the easiest explanation is that the exceptionally high nonmare abundance at
Apollo 12 is a result of spatial heterogeneity caused by a ray from Copernicus Crater.
Hubbard and Meyer also proposed that the KREEP material seen in these samples
arrived by means of distal ejecta/rays from Copernicus Crater and the Fra Mauro
region (Hubbard et al., 1971; Meyer and Hubbard, 1970; Meyer et al., 1971). For
example, the Apollo 12 12033 soil sample was sampled from the bottom of a 15.24 cm
deep trench near the north rim of Head Crater, and 66% of the glass fragment from
the 12033 sample is KREEP material. The Apollo 12 12070 soil taken from the north
side of Surveyor Crater is 25% KREEP (Hubbard et al., 1971). It is clear that the
nonmare component within a ray patch contains a portion of pure highland material
mixed with local mare basalt. More importantly, our modeling demonstrates that the
abundance of exotic material at specific locations is highly variable spatially.
These arguments strengthen the case that the highly elevated abundances in non-
mare material in certain Apollo 12 samples are attributable to Copernicus Crater and
that the attribution of the ∼800 Ma age of Apollo 12 KREEPy samples to Coper-
nicus is correct (Bogard et al., 1994; Barra et al., 2006). This is significant because
of Copernicuss role as a potential anchor point for lunar chronology (Stoffler et al.,
2006; Hiesinger et al., 2012).
3.5 Conclusion
Both proximal and distal ejecta transported by impacts are important to the dis-
tribution of material across the lunar surface. To separate the effect of local and distal
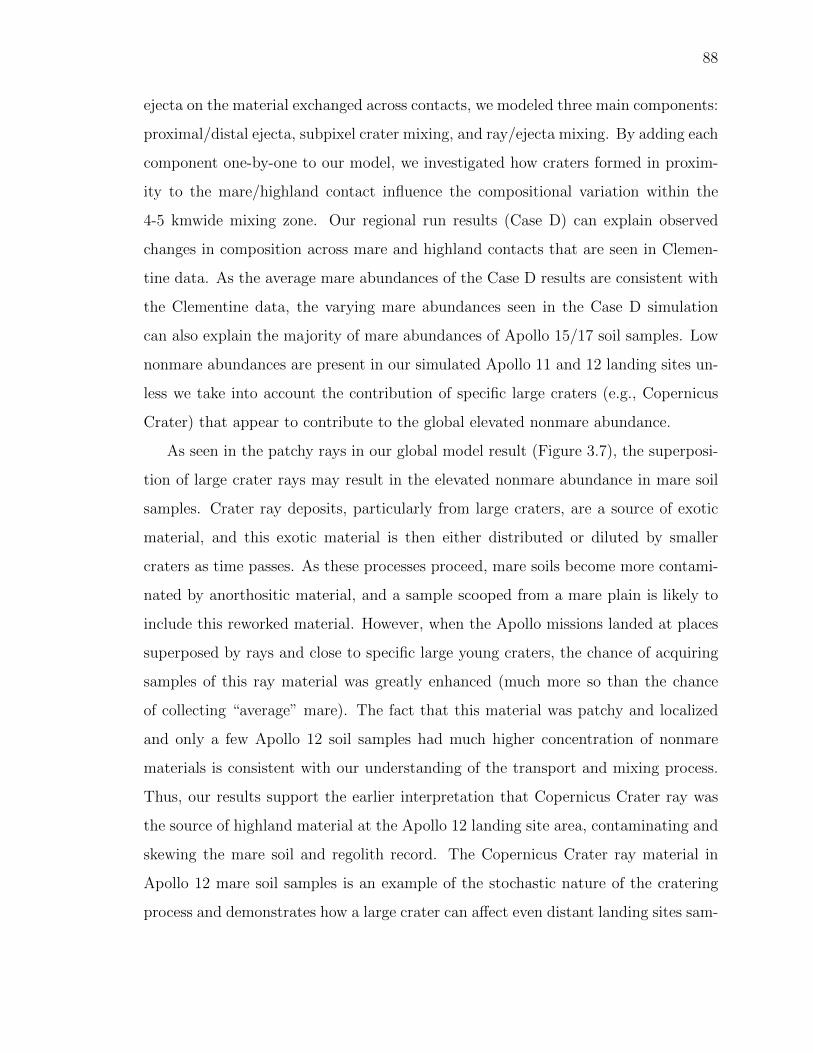
88
ejecta on the material exchanged across contacts, we modeled three main components:
proximal/distal ejecta, subpixel crater mixing, and ray/ejecta mixing. By adding each
component one-by-one to our model, we investigated how craters formed in proxim-
ity to the mare/highland contact influence the compositional variation within the
4-5 kmwide mixing zone. Our regional run results (Case D) can explain observed
changes in composition across mare and highland contacts that are seen in Clemen-
tine data. As the average mare abundances of the Case D results are consistent with
the Clementine data, the varying mare abundances seen in the Case D simulation
can also explain the majority of mare abundances of Apollo 15/17 soil samples. Low
nonmare abundances are present in our simulated Apollo 11 and 12 landing sites un-
less we take into account the contribution of specific large craters (e.g., Copernicus
Crater) that appear to contribute to the global elevated nonmare abundance.
As seen in the patchy rays in our global model result (Figure 3.7), the superposi-
tion of large crater rays may result in the elevated nonmare abundance in mare soil
samples. Crater ray deposits, particularly from large craters, are a source of exotic
material, and this exotic material is then either distributed or diluted by smaller
craters as time passes. As these processes proceed, mare soils become more contami-
nated by anorthositic material, and a sample scooped from a mare plain is likely to
include this reworked material. However, when the Apollo missions landed at places
superposed by rays and close to specific large young craters, the chance of acquiring
samples of this ray material was greatly enhanced (much more so than the chance
of collecting “average” mare). The fact that this material was patchy and localized
and only a few Apollo 12 soil samples had much higher concentration of nonmare
materials is consistent with our understanding of the transport and mixing process.
Thus, our results support the earlier interpretation that Copernicus Crater ray was
the source of highland material at the Apollo 12 landing site area, contaminating and
skewing the mare soil and regolith record. The Copernicus Crater ray material in
Apollo 12 mare soil samples is an example of the stochastic nature of the cratering
process and demonstrates how a large crater can affect even distant landing sites sam-

89
ples. It would be useful for future lunar missions to test whether or not the elevated
nonmare abundance seen in Apollo 11 and 12 and Luna 16 samples and orbital data
is biased by rays by sampling at regions with less contamination by rays.
An example of a region with less complicated geology is the contact between mare
and highlands in the western part of Grimaldi Crater. Our model is able to reproduce
the 4-5 km width of the mixing zone in this region and demonstrates that both distal
and proximal ejecta materials are important for regolith evolution.
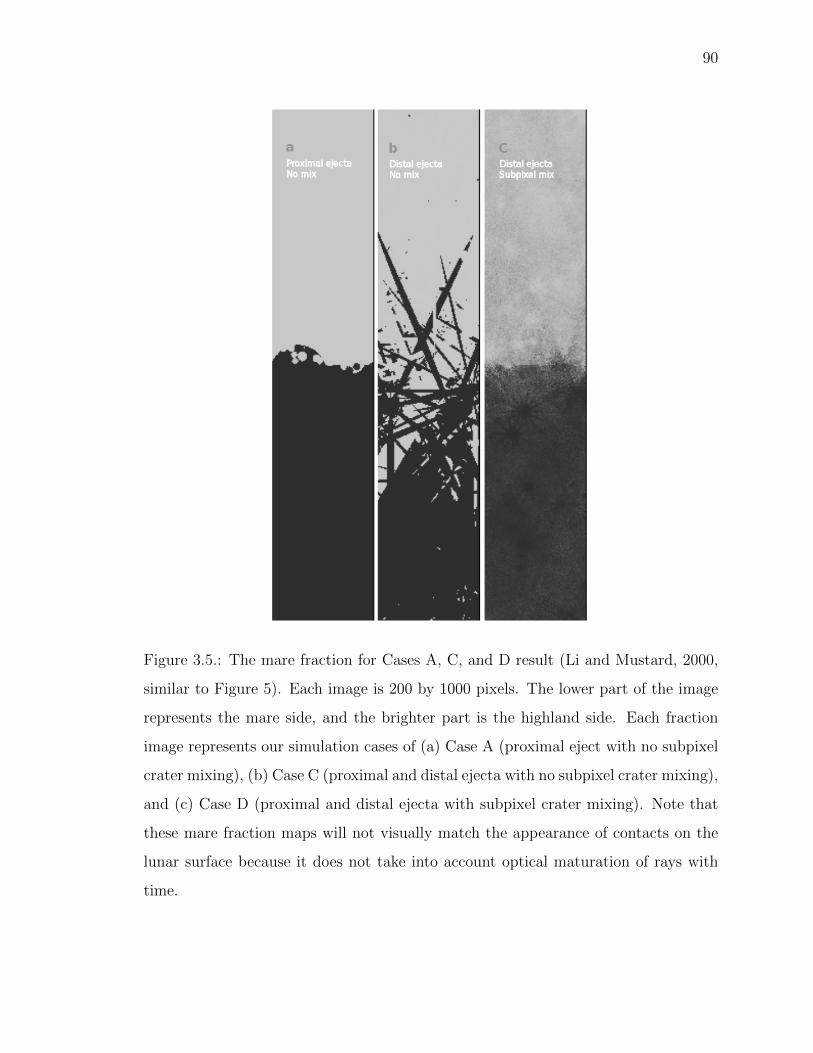
90
Figure 3.5.: The mare fraction for Cases A, C, and D result (Li and Mustard, 2000,
similar to Figure 5). Each image is 200 by 1000 pixels. The lower part of the image
represents the mare side, and the brighter part is the highland side. Each fraction
image represents our simulation cases of (a) Case A (proximal eject with no subpixel
crater mixing), (b) Case C (proximal and distal ejecta with no subpixel crater mixing),
and (c) Case D (proximal and distal ejecta with subpixel crater mixing). Note that
these mare fraction maps will not visually match the appearance of contacts on the
lunar surface because it does not take into account optical maturation of rays with
time.

91
0
20
40
60
80
100
-20-10 0 10 20
a
AM
A,
%
Distance, km
-20-10 0 10 20
b
Distance, km
-20-10 0 10 20
c
Distance, km
Figure 3.6.: The compositional gradient profile of the average mare abundance (AMA)
within a distance of 26 km from mare (left-hand side) and highland (right-hand side)
contact. The black line represents the Clementine data for Grimaldi Crater by Li and
Mustard (Li and Mustard, 2000, Figure 6). The solid square point in gray color in
each box represents the mean AMA of the total 1441 profiles from each case of (a)
Case A, (b) Case C, and (c) Case D. One standard deviation across the contact is
shown by a vertical line at every solid square point. The solid points in orange and
blue color are Apollo 15 and 17 in situ mare soil samples (Rhodes, 1977, Figure 1),
respectively.
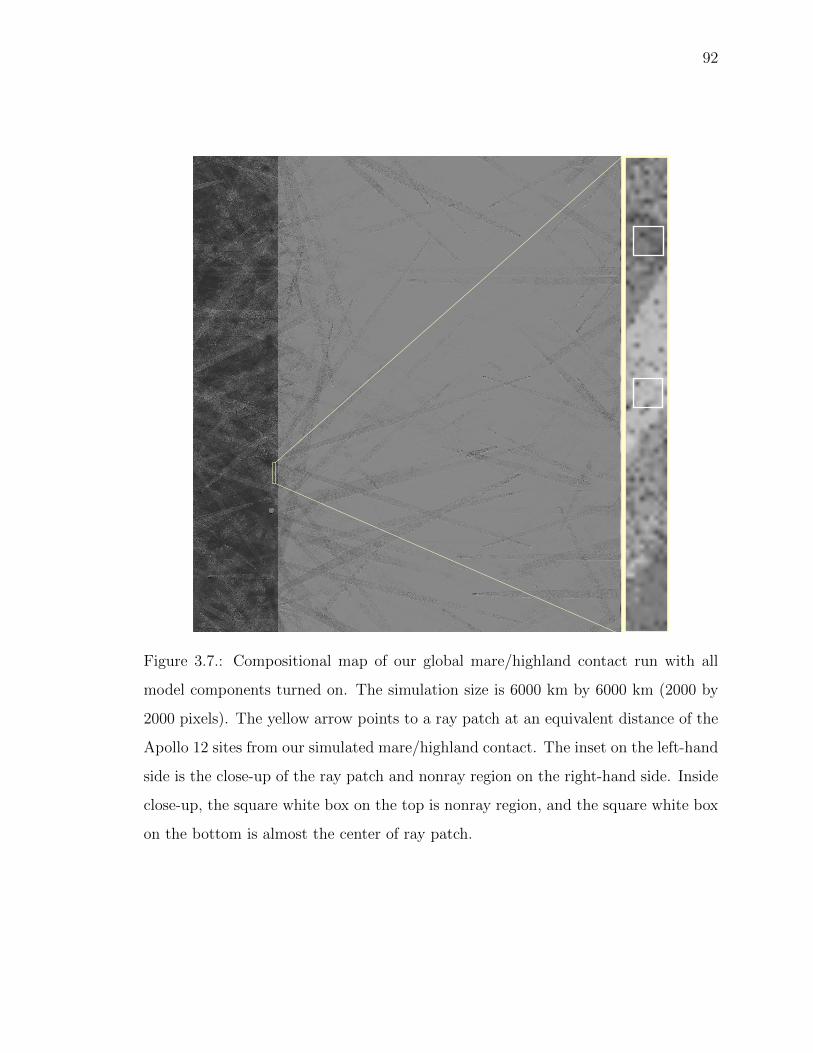
92
Figure 3.7.: Compositional map of our global mare/highland contact run with all
model components turned on. The simulation size is 6000 km by 6000 km (2000 by
2000 pixels). The yellow arrow points to a ray patch at an equivalent distance of the
Apollo 12 sites from our simulated mare/highland contact. The inset on the left-hand
side is the close-up of the ray patch and nonray region on the right-hand side. Inside
close-up, the square white box on the top is nonray region, and the square white box
on the bottom is almost the center of ray patch.
93
0
20
40
60
80
100
-120 -100 -80 -60 -40 -20 0
A-12
A-11Luna-16Hig
hla
nd A
dundance (
%)
Distance from boundary (km)
Figure 3.8.: The exotic component (highland) distribution with distance from mare
and highland contact from our global run result. Composition distribution at a dis-
tance is plotted as a box and whisker plot. The line inside of the box is the median
value of total composition distribution at a given distance. The upper and lower
boundaries of the box represent the 25% of data above the median and the 25% of
data below the median, respectively. The ends of the whiskers represent 99% of data.
The solid circles in light gray color are outliers. The data points in black color with
labels of “A-12”, “A-11” and “Luna-16” are from Apollo 12 and 11 and Luna 16
mare, respectively, soil samples. The black arrow denotes one example of a ray patch
in our simulation domain (see close-up in Figure 3.7).
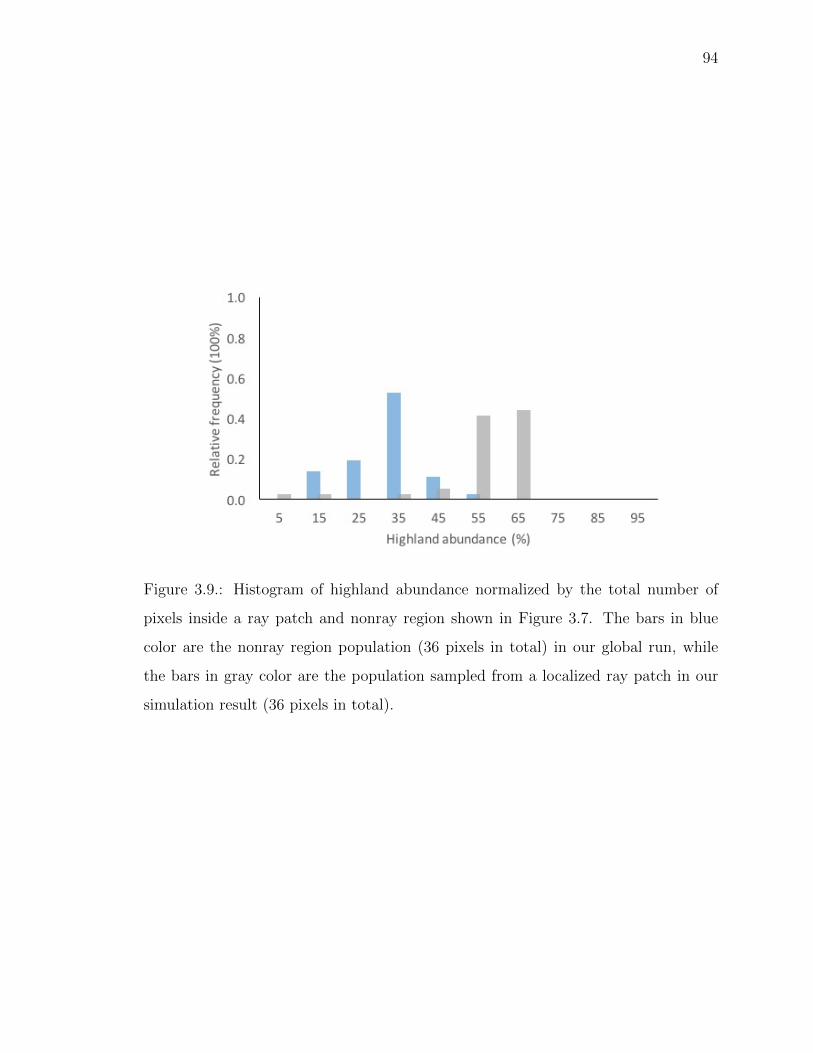
94
Figure 3.9.: Histogram of highland abundance normalized by the total number of
pixels inside a ray patch and nonray region shown in Figure 3.7. The bars in blue
color are the nonray region population (36 pixels in total) in our global run, while
the bars in gray color are the population sampled from a localized ray patch in our
simulation result (36 pixels in total).
95
4 NO CHANGE IN THE RECENT LUNAR IMPACT FLUX REQUIRED
BASED ON MODELING OF IMPACT GLASS SPHERULE AGE
DISTRIBUTIONS
Acknowledgement: A version of this chapter has been published in Geophysical Re-
search Letters. Reference: Huang, Y. H., Minton, D. A., Zellner, N. E., Hirabayashi,
M., Richardson, J. E., and Fassett, C. I. No Change in the Recent Lunar Impact Flux
Required Based on Modeling of Impact Glass Spherule Age Distributions. Geophys-
ical Research Letters, DOI:10.1029/2018GL077254
Abstract: The distributions of 40Ar/39Ar-derived ages of impact glass spherules
in lunar regolith samples show an excess at <500 Ma relative to older ages. It has
not been well understood whether this excess of young ages reflects an increase in
the recent lunar impact flux or is due to a bias in the samples. We developed a
model to simulate the production, transport, destruction, and sampling of lunar glass
spherules. A modeled bias is seen when either (1) the simulated sampling depth is 10
cm, consistent with the typical depth from which Apollo soil samples were taken, or
(2) when glass occurrence in the ejecta is limited to >10 crater radii from the crater,
consistent with terrestrial microtektite observations. We suggest that the observed
excess of young ages for lunar impact glasses is likely due to limitations of the regolith
sampling strategy of the Apollo program, rather than reflecting a change in the lunar
impact rate.
4.1 Introduction
Most lunar crater chronologies assume that the impact flux in the inner Solar
System has been constant for the last ∼3 Ga (Neukum, 1983; Neukum et al., 2001;
96
Robbins, 2014). Some researchers have suggested that the impact rate over this
time period instead increased sometime in the last ∼1 Ga (McEwen et al., 1997;
Grieve, 1984; Shoemaker et al., 1990; Culler et al., 2000; Fassett and Thomson, 2014;
Mazrouei et al., 2015; Vokrouhlicky et al., 2017) or possibly declined (Hartmann et al.,
2007; Quantin et al., 2007). Impact melts provide one of the most important records
for constraining the lunar impact flux. Impact glass spherules, a kind of impact melt
product, are up to 1 mm diameter in size and produced by hypervelocity impacts
(Reid et al., 1977; Delano et al., 1982; Melosh and Vickery, 1991). The ubiquity
of spherules and their age distribution suggests that they are produced in relatively
small impacts (Horz and Cintala, 1997; Norman et al., 2012; Zeigler et al., 2006;
Delano, 1991; Symes et al., 1998; Korotev et al., 2010), and therefore are potentially
a powerful record of the impact history since the end of the basin-forming epoch at
3.9 Ga (Tera et al., 1974; Tera et al., 1973; Turner and Cadogan, 1975).
The analysis of lunar regolith soil samples collected from the Apollo 12, 14, 16,
and 17 landing sites shows an excess of impact glass spherules with derived 40Ar/39Ar
ages of <400-500 Ma (Culler et al., 2000; Levine et al., 2005; Hui et al., 2009; Zellner
and Delano, 2015) (see Figure 4.1). A straightforward explanation for the excess of
impact glass spherules in this period is an increase in the impact flux by a factor of
2–3 during the late Copernican. Because the impact flux is a potentially important
factor for biotic evolution on Earth (Alvarez et al., 1980), understanding its history is
an important issue. However, it is not known how much the observed age distribution
of lunar glass spherules is affected by biases (Horz, 2000; Hartmann et al., 2007).
A young age bias in the 40Ar/39Ar age distribution of impact glass spherules could
arise as a result of several processes. Once formed, spherules in the lunar regolith
can be destroyed by subsequent impacts over time, resulting in a preservation bias
(Zellner and Delano, 2015). In addition, lunar diurnal temperature cycling may cause
argon diffusion of glass spherules exposed on the surface, leading to a lower abundance
of argon that is measured as a younger age in a sample (Zellner and Delano, 2015).
After accounting for an argon diffusion bias for spherules from several Apollo 14, 16,

97
0 500 1000 1500 2000 2500 3000
~50% of glass spherules
are <500 Ma in age
Re
lative
pro
ba
bili
ty
Age (Ma)
All samplesApollo 12 Sample No. 12023Apollo 14 Sample No. 14259Apollo 16 Sample No. 64501Apollo 16 Sample No. 66041Apollo 17 Sample No. 71501
Figure 4.1.: The relative probability plot of five reported lunar regolith samples. The
relative impact flux is calculated from the fraction of impact glass spherules and
shards normalized by the overall number of impact glass spherules and shards from
all five Apollo regolith samples. The data is directly taken from two studies, Zellner
and Levine (Zellner and Delano, 2015; Levine et al., 2005). The spherule data of
Culler and Hui (Culler et al., 2000; Hui et al., 2009) are not included.
and 17 regolith samples, Zellner and Delano show a uniform age distribution over
the last one billion years (Zellner and Delano, 2015). Even after correcting for a bias
arising from diffusive loss of argon, the glass spherules from Apollo 12 12023 regolith
still show a prominent spike in the late Copernican (see Figure 4.1). The geochemical
composition data of the Apollo 12 12023 regolith were not available for argon diffusion
bias correction, and therefore further analysis is needed to understand the source of
this late Copernican excess of glass ages. This motivates us to seek other possible
sources of young age bias that are inherently present in lunar regolith samples.
To date there is no comprehensive, three-dimensional model that tracks the fate
of spherules from the time of their production on the lunar surface through their
98
sampling by the Apollo astronauts. Here, we used the model that is introduced in
Section 2.4 to understand the expected age distribution of impact glass spherules in
the lunar regolith. Using the new capabilities of the code, we generate the expected
age distribution of glass spherules for a model impact flux. We then compare our
calculated age distributions of glass spherules with the observed age distribution
collected from lunar regolith samples. In our model, we set the impact rate to be
constant over the last 3 Ga to show that the excess of spherules with ages of <500 Ma
can be due to a sampling bias (see Figure 4.1). We cannot rule out a possibility of that
the lunar impact flux increased, however we will show the spherule age distribution
does not require any temporal change.
4.2 Lunar impact glass spherule simulation modeling
We divide our problem into four model components, which simulate the processes
involved in spherule production, transport, destruction, and sampling. In this work
“production” refers to the component of the code that models both the total abun-
dance of spherules that are generated in any given impact, and how those spherules
are distributed in the ejecta of their source crater. We derived a model constrained
by terrestrial microtektite data for the production and distribution of lunar impact
glass spherules in Section 4.2.1. “Transport” refers to the component of the code that
models how subsequent impacts re-distribute spherules, which makes use of methods
developed Section 2.4 (Huang et al., 2017). “Destruction” refers to the component of
the code that models how impacts destroy old spherules (see Section 2.5). In Section
4.2.2, we evaluated the destruction of a glass spherule caused by physical breakage
upon high-speed landing. Finally, in Section 4.2.3, “sampling” refers to the way we
process the output of our simulations to obtain a representative age distribution of
spherules such that we mimic the sampling of lunar regolith by the Apollo astro-
nauts. In this section we give an overview of how each of these model components
was implemented and constrained by observations.
99
4.2.1 Constraining lunar impact glass spherule production
Lunar impact glass spherules form as molten droplets entrained within impact-
excavated ejecta during hypervelocity impact cratering events (Delano, 1991; Melosh
and Vickery, 1991). In order to model the production of impact glasses within indi-
vidual lunar impact events in CTEM, we require constraints on both the abundance
of mm-sized spherules produced by an impact of a given size, as well as how those
spherules are distributed within the ejecta of their source crater.
Despite efforts to detect impact glasses remotely, their abundance and distribution
within the ejecta and abundance relative to the crater’s size remain unknown for
the Moon (Tompkins and Pieters, 2010; Schultz and Mustard, 2004; Cannon and
Mustard, 2015). This motivates us to look to the terrestrial impact record for possible
constraints on the abundance and distribution of impact glasses in ejecta. The closest
terrestrial analogue to the lunar impact spherules used in our observational data
shown in Figure 4.1 are the terrestrial microtektites (Donnelly and Chao, 1973).
Microtektites are glassy mm-sized or smaller impactites that are morphologically
similar to lunar impact glass spherules (Glass and Simonson, 2012).
We use observational constraints on the abundance and distribution of terres-
trial microtektites relative to their source craters to provide constraints on our glass
spherule production model. To do so, we need to understand the relationship between
the spatial distribution of spherules relative to their source crater. Because CTEM
generates large numbers of craters in a single simulation, it uses a very simplified
impact excavation scheme based on the Maxwell Z-model, which connects parcels of
ejecta back to the excavation flow within the transient crater (Maxwell and Seifert,
1974; Maxwell, 1977). A 2D schematic of the simplified model is shown in Figure 4.2,
though in CTEM the calculations are done in 3D (see Figure 2.1 in section 2.1).
For this work we conceptualize spherules (or microtektites) as originating in the
melt zone of the transient crater. We only produce spherules in our model arising from
resolved primary craters, not secondary craters or subpixel craters. Secondary craters

100
layer 1
layer 2
layer 3
Survival zone
Shock fragmentation zone
Pre-existing spherules
mixed and transported
a) Schematic of the glass spherule production model
Impact Point
Transient crater
Onset of glass spherule production Onset of glass spherule distribution
Crater interior Crater exterior
Streamline (no new spherules)
Excavated meltsImpact vaporMelt body
Excavated ejecta
Landing ejecta
New glass spherules
Streamline (new spherules)
Ejecta outward produce
new spherulesStreamlines inward produce
new spherules
Final crater
Final crater
b) Schematic of the glass spherule destruction and transport model
Pre-existing glass spherules
Survival zone
Shock fragmentation zone
Figure 4.2.: An illustration of spherule production, transport, and destruction in
CTEM. a) Spherules are produced within the melt zone for those streamlines that
emerge inward of the onset distance for spherule production. b) Pre-existing spherules
within regolith layers are destroyed in the melt and shock fragmentation zone. Old
spherules entrained within streamlines that intersect the survival zone are mixed with
fresh spherules produced as in a).
are less energetic and produce little melt (Bjorkman and Holsapple, 1987). While
Horz proposed micrometeorites as a source of spherules (Horz and Cintala, 1997),
we consider this unlikely based on the fact that micrometeorites form agglutinates,
which are a distinct kind of melt product from the spherules modeled in our study.
Figure 4.2a shows the relevant processes in our spherule production model. Inside
the transient crater we have included a vapor zone and a melt zone, whose volumes
101
are constrained by π–scaling laws in the literature study (Cintala and Grieve, 1998;
Abramov et al., 2012). The pixels that make up an ejecta block can be traced back to
volumes that are bounded by the streamlines within the transient crater. We further
restrict spherule production to occur only in the melt zone for those streamtubes
that emerge inward what we call the spherule production onset distance. Because
the streamtubes that emerge closest to the impact point have the highest ejection
velocity, fresh glass spherules are only distributed in the ejecta outward of a specific
range. The onset distance for glass spherule distribution in the ejecta for lunar craters
is calculated assuming ballistic flight in lunar gravity from the ejecta launch position
given by:
l(r, Rtc) = r +2v2e(r, Rtc) sin θe cos θe
g(4.1)
where l(r, Rtc) is the ballistic range from impact center as function of launching po-
sition (r) and transient crater radius (Rtc), ve(r, Rtc) is the launching velocity as
function of launching position and transient crater size, and θe is launching angle,
in which 45 degree is assumed. Using the Pi theorem of dimensional analysis, the
launching velocity of an ejecta can be associated with its source transient crater size
(Housen et al., 1983).
The spherule production onset distance that we used also implies that not all exca-
vated melt will form spherules. While the provenance of impact glass spherules within
the melt zone is poorly constrained, we assume that lunar impact glass spherules are
a terrestrial analogue of lunar impact glass spherules. From the three well-recognized
microtektite strewn fields (Lake Bosumtwi, Chesapeake Bay, and Chicxulub Crater),
microtektites are found ∼100–1000 km away from their source crater center with di-
ameters of 10.8, 85, and 180 km respectively (Glass, 1968; Donnelly and Chao, 1973;
Glass et al., 1973; Alvarez et al., 1980; Smit and Hertogen, 1980; Bohor et al., 1984).
Assuming that microtektites follow a ballistic trajectory, we can infer their launching
position (provenance) within a transient crater from a given ballistic range (Eq. 4.1).

102
Using the π–group theorem of dimensional analysis, the launching velocity of an
ejecta can be associated with its source transient crater size (Housen et al., 1983),
ve(r, Rtc) =
[C2vpggERtc
(r
Rtc
)−2/µ− C2
vpggr − C2vps
Y
ρt
] 12
(4.2)
where µ, Cvpg =√2
0.85µµ+1
, and Cvps are constants, which depend on target materials, Y
is the effective target strength, ρt is the target density, and gE is terrestrial gravita-
tional acceleration. We collected the size versus spatial distribution of microtektites
from the three terrestrial craters as shown in Table 4.2. For such large craters, the
term of Cvps can be neglected. Equation 4.1 and 4.2 can be solved together for the
launching position of r if one estimates the size of a transient crater.
To properly estimate the size of a transient crater, we referred to each individ-
ual impact simulation study from the literature for their impact conditions where
possible. The types of target materials chosen for these three terrestrial craters in
previous impact simulations are competent rock or sedimentary rocks, except for a
lower density wet tuff used in simulating Chesapeake Bay Crater (Artemieva et al.,
2004; Collins and Wunnemann, 2005; Collins et al., 2008). As a result, we chose
hard rock scaling laws for our estimated transient crater size, in which µ = 0.55,
the strength of target material is 18 MPa, and the density of target is 2500 kg/m3
(Holsapple, 1993). Assuming that the same density of projectiles as target material,
impact conditions for these three impact craters as well as our calculated transient
crater sizes are summarized in Table 4.3. Given that we estimated transient crater
sizes for these three craters, we can infer launching positions of microtektites.
In addition, we also estimated the provenance of other forms of impact melt prod-
ucts collected from terrestrial craters (Lake Lonar, Kamil, Ries) and lunar ropy glasses
that are thought to have come from Copernicus Crater (Wentworth et al., 1994). Ta-
ble 4.4 lists the size data from various studies, impact conditions for the crater sizes
of Kamil, Lake Lonar, Apollo 12 ropy glasses. For Ries Crater we used a numerical
simulation result in the literature (Artemieva et al., 2013). All estimations of craters’

103
transient craters also refer to the hard rock scaling law. Consequently, we suggest
that an integrated approach regarding melt fragmentation, e.g. glass spherules and
melt breccia, during cratering is beyond the scope of this study. Here we provided the
first-order approximation of types of melt products with varying deposition distances
from the center of a crater. Often mixed types of melt products are found along
deposition distances, because an interaction between the impact vapor plume and
ejecta curtain is dynamic and requires a physical modeling to constrain the relative
abundance of different melt products within ejecta curtain.
Figure 4.3 shows our estimated launching position with the maximum sizes of melt
products that have been linked to terrestrial craters and found at a specific site. The
reason we only use the maximum size data of microtektites is to reduce the effect of
atmosphere and terrestrial impact vapor plume on the further breakup process of melt
particles. Because the lunar impact environment experiences little atmosphere and
impact vapor plume, using the data of maximum sizes of terrestrial microtektite is
more likely to reflect the actual distribution of impact glass spherules. The results of
this calculation for all of the impact-generated melt products with associated craters
is plotted as the lower x-axis of Figure 4.3. We can then estimate the equivalent
deposition distance of products for the Moon, which shown as the upper x-axis of
Figure 4.3.
The sizes of Chicxulub microtektite-like spherules that were found in Beloc and
La Sierrita site are ∼10 mm, which is larger than the typical size range of terrestrial
microtektites (Thein, 1987) and the sizes of lunar impact glass spherules. These two
data points depict corresponding lunar landing distances of 14 and 23 radii. For the
rest of Chicxulub microtektites, the data point at Shell Creek (∼3 mm) reaches the
shortest distance of 26 radii under lunar gravity. We used 20 radii for our modeled
impact glass spherules by averaging 14 and 26 radii.
We caution that glass spherules can be deposited at proximal distances, smaller
than 20 radii, yet the types of more proximal melt particles appear to be larger and
mixed with solid fragments (as seen from terrestrial impact records), as shown in the
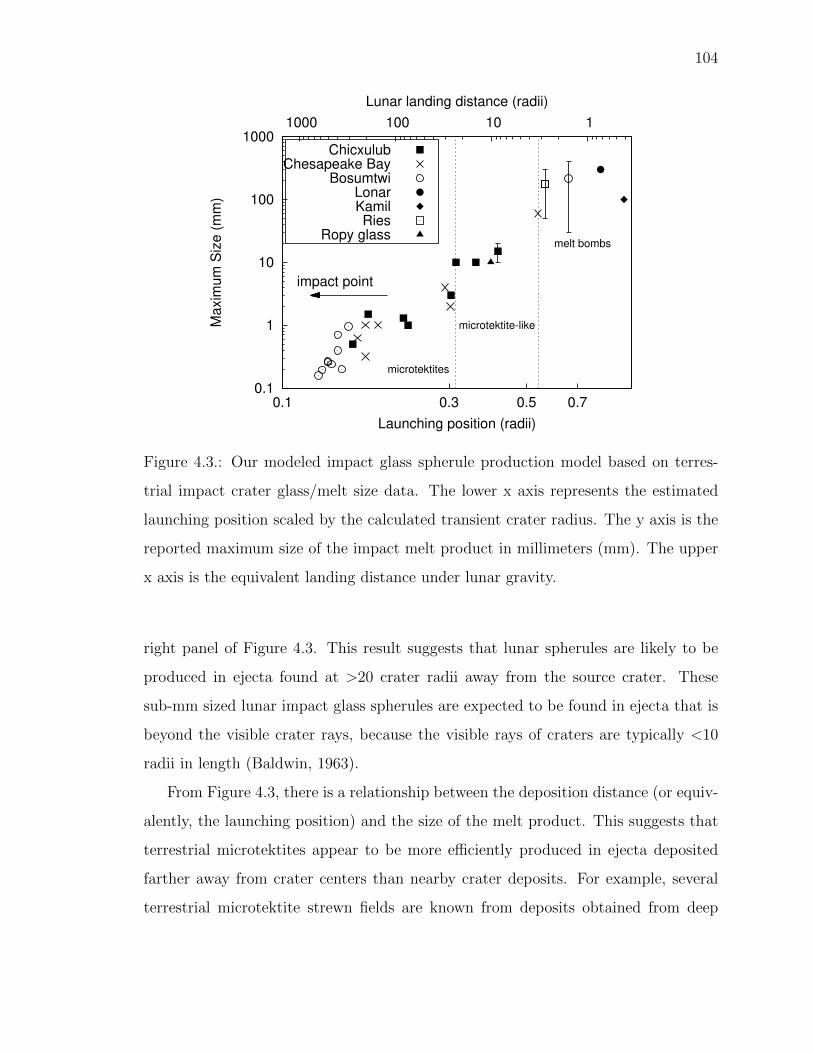
104
0.1
1
10
100
1000
0.1 0.3 0.5 0.7
1 10 100 1000
impact point
microtektites
microtektite-like
melt bombs
Maxim
um
Siz
e (
mm
)
Launching position (radii)
Lunar landing distance (radii)
ChicxulubChesapeake Bay
BosumtwiLonarKamilRies
Ropy glass
Figure 4.3.: Our modeled impact glass spherule production model based on terres-
trial impact crater glass/melt size data. The lower x axis represents the estimated
launching position scaled by the calculated transient crater radius. The y axis is the
reported maximum size of the impact melt product in millimeters (mm). The upper
x axis is the equivalent landing distance under lunar gravity.
right panel of Figure 4.3. This result suggests that lunar spherules are likely to be
produced in ejecta found at >20 crater radii away from the source crater. These
sub-mm sized lunar impact glass spherules are expected to be found in ejecta that is
beyond the visible crater rays, because the visible rays of craters are typically <10
radii in length (Baldwin, 1963).
From Figure 4.3, there is a relationship between the deposition distance (or equiv-
alently, the launching position) and the size of the melt product. This suggests that
terrestrial microtektites appear to be more efficiently produced in ejecta deposited
farther away from crater centers than nearby crater deposits. For example, several
terrestrial microtektite strewn fields are known from deposits obtained from deep
105
drilling in the Pacific Ocean (Glass and Simonson, 2012). From this, we can estimate
the onset distance for production of microtektites as 0.3 radii, which becomes an
onset distance for spherule deposition of >20 crater radii distance for the Moon (see
Figure 4.2a).
Those modeled glass spherules, due to higher kinetic energy, are subsequently dis-
persed in the form of crater rays in CTEM. The spatial distribution of glass spherules
with their source crater’s ejecta deposit is also uncertain. Yet, the spatial distribu-
tion of glass spherules is likely correlated with the ray pattern that forms the distal
ejecta of fresh craters (Bohor and Glass, 1995). Although impact glass spherules have
not been reported to occur in association with crater rays, other impact-generated
melt products, e.g. Apollo 16 impact glass bombs and Apollo 12 ropy glasses, were
found to be associated with rays of craters (Meyer et al., 1971; Morris et al., 1986).
In addition, the locations of microtektite layers associated with the Chicxulub and
Chesapeake crater on Earth have been suggested to appear ray-like (Pollastro, 1993;
Bohor and Glass, 1995; McHugh et al., 1998).
To obtain our onset distances for glass spherule production and distribution, we
made many simplifying assumptions. To account for uncertainties we consider in our
modeling four different values for our glass distribution onset distances of 0, 5, 10,
and 20 crater radii from the rim of the crater. The onset distance of 0 is equivalent to
assuming that all ejected melts that were produced during cratering are in the form
of mm diameter glass spherules, which is highly unlikely, but we included it to test
the limits of our model. Although further investigation is needed to understand the
origin of lunar impact glass spherules, our analysis suggests that they are deposited
in distal ejecta, and their abundance and scales linearly with crater size. Thus, we
applied this simple spherule production model to all sizes of craters in CTEM.

106
4.2.2 Evaulating the importance of spherule breakage by high velocity
landing
We estimate here whether we need to consider breakage of spherules that arrive
from distant impact craters. Contact mechanics has been used to study the defor-
mation of two approaching objects (Hertz, 1896, Chapter 5). The contact behavior
between two elastic bodies is demonstrated by Hertz, who considered the pressure
on a curved surface. For brittle materials such as glass spherules, we can use an
elastic loading estimation for a lower bound of destruction conditions in which a glass
spherule is not broken (before reaching plastic deformation).
The approach to estimate the critical landing speed for glass spherule breakage
on the lunar surface is to calculate the average pressure at the contact area between
a finite size glass sphere and an infinite flat surface. The applied force on the sphere
can be obtained from the impulse over the contact time, in which the impulse is the
change of an object’s momentum assuming the mass of an object is unchanged before
breakage. It is written in a simple form,
∆p = mvf −mvi (4.3)
where ∆p is impulse, m is the mass of a glass sphere, vi and vf are initial landing
velocity and rebound velocity respectively. As a result, the pressure at the contact
of a glass sphere is the impulse over both contact time (tcontact) and contact area
(Acontact). Our master equation is,
P =∆p/tcontactAcontact
(4.4)
Assuming the circular shape for a contact area, the radius of the contact area
can be estimated based on the elasticities of the target surface and glass sphere, and
normal loading (Timoshenko and Goodier, 1982, Chapter 13),
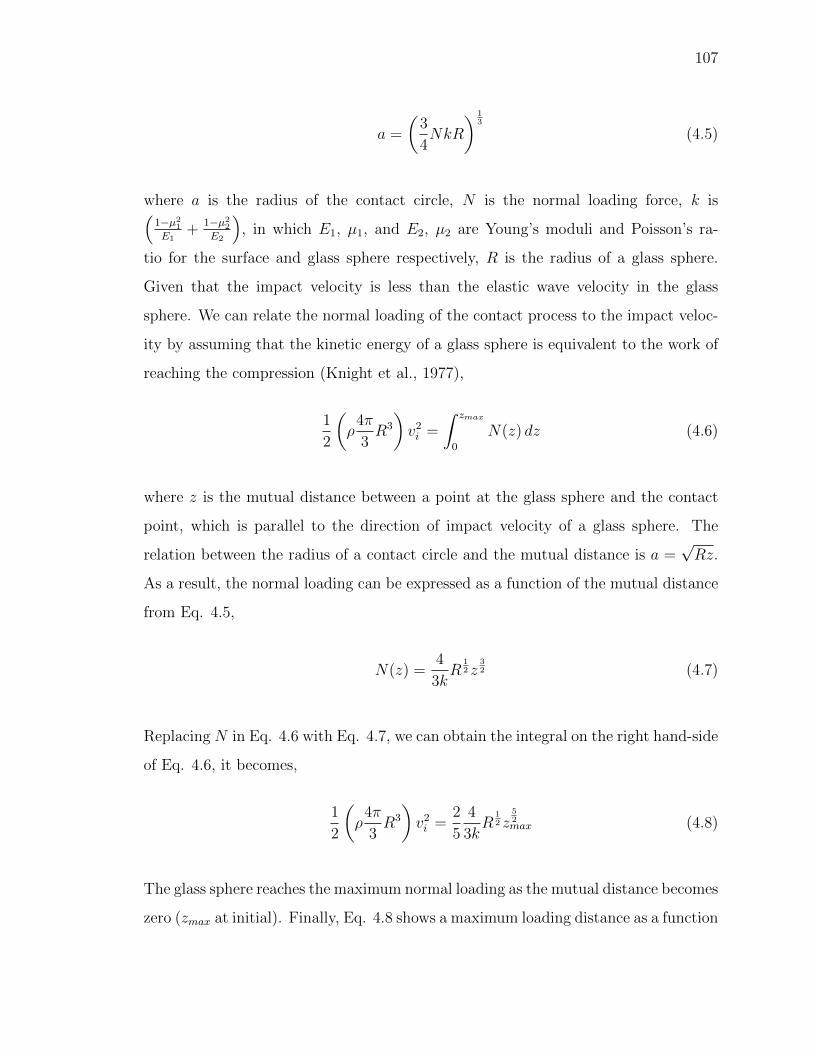
107
a =
(3
4NkR
) 13
(4.5)
where a is the radius of the contact circle, N is the normal loading force, k is(1−µ21E1
+1−µ22E2
), in which E1, µ1, and E2, µ2 are Young’s moduli and Poisson’s ra-
tio for the surface and glass sphere respectively, R is the radius of a glass sphere.
Given that the impact velocity is less than the elastic wave velocity in the glass
sphere. We can relate the normal loading of the contact process to the impact veloc-
ity by assuming that the kinetic energy of a glass sphere is equivalent to the work of
reaching the compression (Knight et al., 1977),
1
2
(ρ
4π
3R3
)v2i =
∫ zmax
0
N(z) dz (4.6)
where z is the mutual distance between a point at the glass sphere and the contact
point, which is parallel to the direction of impact velocity of a glass sphere. The
relation between the radius of a contact circle and the mutual distance is a =√Rz.
As a result, the normal loading can be expressed as a function of the mutual distance
from Eq. 4.5,
N(z) =4
3kR
12 z
32 (4.7)
Replacing N in Eq. 4.6 with Eq. 4.7, we can obtain the integral on the right hand-side
of Eq. 4.6, it becomes,
1
2
(ρ
4π
3R3
)v2i =
2
5
4
3kR
12 z
52max (4.8)
The glass sphere reaches the maximum normal loading as the mutual distance becomes
zero (zmax at initial). Finally, Eq. 4.8 shows a maximum loading distance as a function
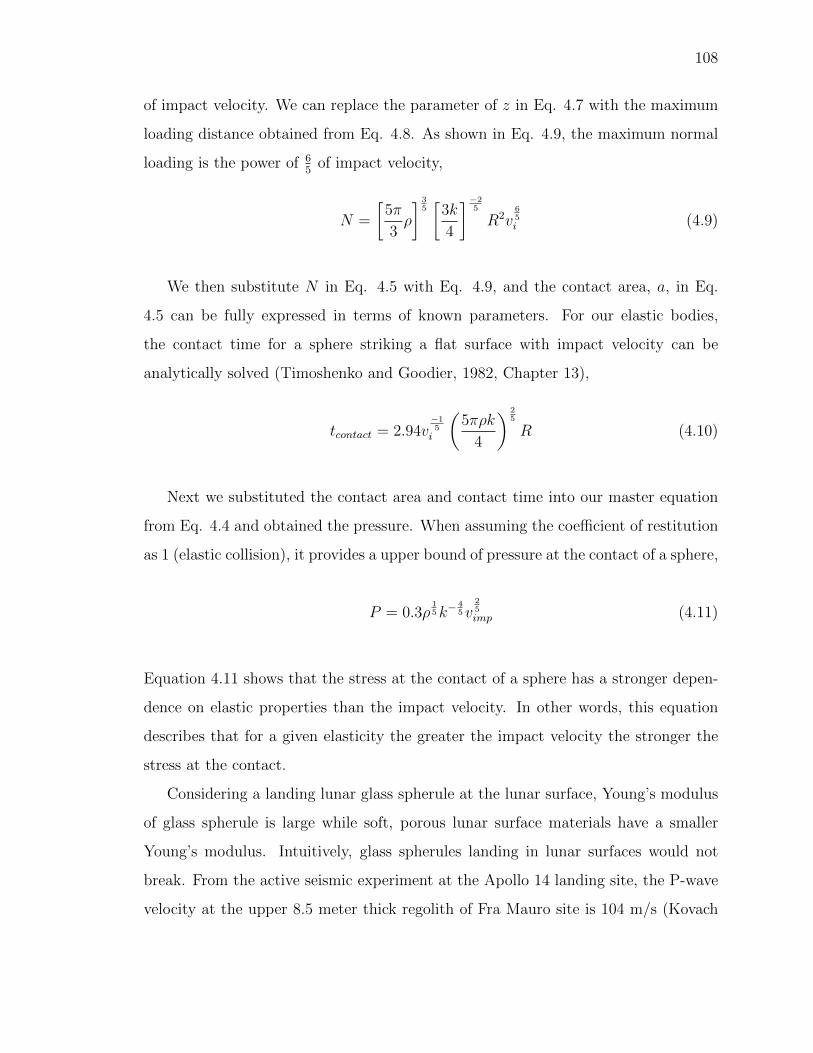
108
of impact velocity. We can replace the parameter of z in Eq. 4.7 with the maximum
loading distance obtained from Eq. 4.8. As shown in Eq. 4.9, the maximum normal
loading is the power of 65
of impact velocity,
N =
[5π
3ρ
] 35[
3k
4
]−25
R2v65i (4.9)
We then substitute N in Eq. 4.5 with Eq. 4.9, and the contact area, a, in Eq.
4.5 can be fully expressed in terms of known parameters. For our elastic bodies,
the contact time for a sphere striking a flat surface with impact velocity can be
analytically solved (Timoshenko and Goodier, 1982, Chapter 13),
tcontact = 2.94v−15i
(5πρk
4
) 25
R (4.10)
Next we substituted the contact area and contact time into our master equation
from Eq. 4.4 and obtained the pressure. When assuming the coefficient of restitution
as 1 (elastic collision), it provides a upper bound of pressure at the contact of a sphere,
P = 0.3ρ15k−
45v
25imp (4.11)
Equation 4.11 shows that the stress at the contact of a sphere has a stronger depen-
dence on elastic properties than the impact velocity. In other words, this equation
describes that for a given elasticity the greater the impact velocity the stronger the
stress at the contact.
Considering a landing lunar glass spherule at the lunar surface, Young’s modulus
of glass spherule is large while soft, porous lunar surface materials have a smaller
Young’s modulus. Intuitively, glass spherules landing in lunar surfaces would not
break. From the active seismic experiment at the Apollo 14 landing site, the P-wave
velocity at the upper 8.5 meter thick regolith of Fra Mauro site is 104 m/s (Kovach

109
et al., 1971). The Young’s modulus estimates range from 1 MPa to 20 MPa (Mitchell
et al., 1972). On the other hand, the Young’s modulus of a glass sphere on the order
of 10 GPa is 3–4 order of magnitudes of Young’s modulus of lunar soil (Swain and
Hagan, 1976). This gives us an estimation of elastic constant (k). Given that the
highest impact velocity of 2.38 km/s as lunar escape velocity, our estimated stress
from Eq. 4.11 is much lower than the yield strength of a glass sphere.
We conclude that glass spherules impacting the Moon at high velocity as distal
ejecta should be able to maintain their intact shape from our sphere stress estimation.
Therefore in our model we assumed no destruction of modeled glass spherules occurs
upon landing.
4.2.3 Modeling the distribution of spherule ages in lunar soil samples
We next simulated a 1 km by 1 km lunar surface with 10 m by 10 m pixels that
is subject to 3 Ga of impact bombardment. The area of 1 km by 1 km for our
initial simulated surface is roughly on the order of Apollo mission traverse scale; the
astronaut traverse scales range from 100 meter for Apollo 11 mission to tens of km for
Apollo 17 mission. We used a constant bombardment rate with a crater size-frequency
distribution as defined by the Neukum Production Function (NPF) (Neukum et al.,
2001).
CTEM generated a few tens of thousands of primary craters in total for each
run, ranging from 10–500 m in diameter. To track all ejecta that is produced by
each crater, CTEM creates a distinct layer for each ejecta blanket at a corresponding
deposition distance. This ejecta layer originates in a crater cavity and contains a
mixture of transported old spherules as well as fresh spherules (see Figure 4.2b).
Craters smaller than the 10 m were modeled using subcrater mixing of our layer
system. We also model spherules produced by large craters that form outside of the
simulated domain, which we call “super-domain” craters, which can be as large as
100 km diameter (see Section 2.8). During the excavation of each crater on the simu-
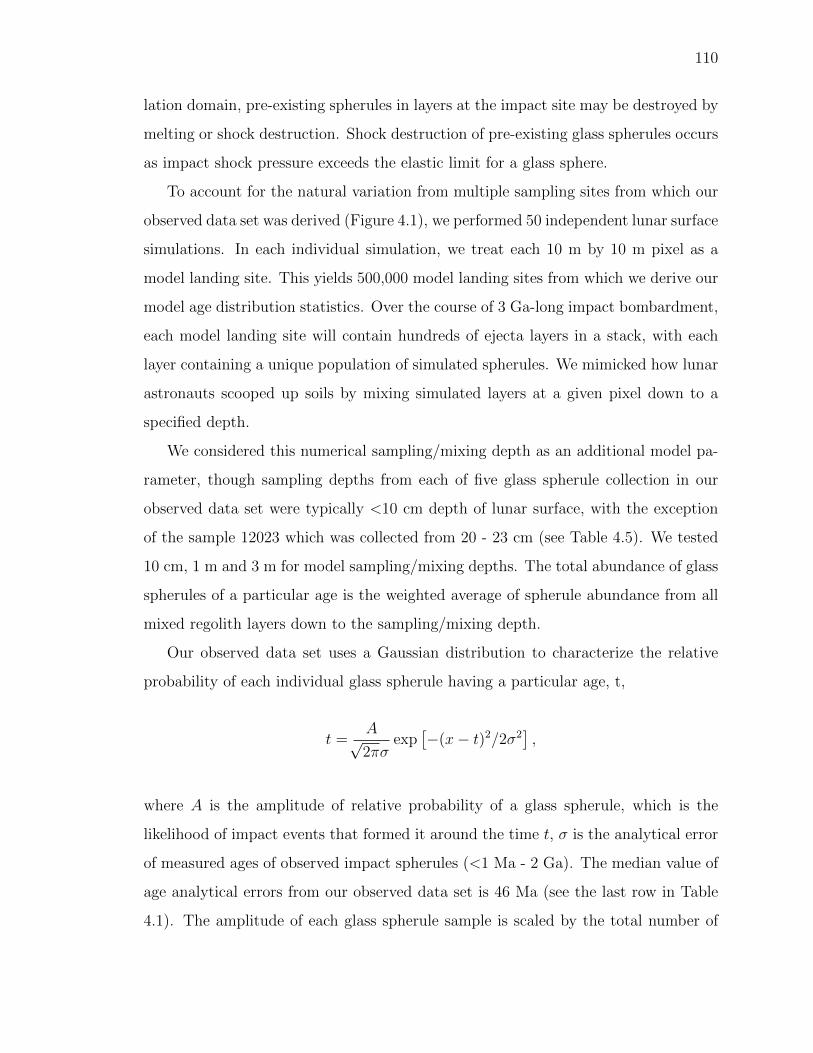
110
lation domain, pre-existing spherules in layers at the impact site may be destroyed by
melting or shock destruction. Shock destruction of pre-existing glass spherules occurs
as impact shock pressure exceeds the elastic limit for a glass sphere.
To account for the natural variation from multiple sampling sites from which our
observed data set was derived (Figure 4.1), we performed 50 independent lunar surface
simulations. In each individual simulation, we treat each 10 m by 10 m pixel as a
model landing site. This yields 500,000 model landing sites from which we derive our
model age distribution statistics. Over the course of 3 Ga-long impact bombardment,
each model landing site will contain hundreds of ejecta layers in a stack, with each
layer containing a unique population of simulated spherules. We mimicked how lunar
astronauts scooped up soils by mixing simulated layers at a given pixel down to a
specified depth.
We considered this numerical sampling/mixing depth as an additional model pa-
rameter, though sampling depths from each of five glass spherule collection in our
observed data set were typically <10 cm depth of lunar surface, with the exception
of the sample 12023 which was collected from 20 - 23 cm (see Table 4.5). We tested
10 cm, 1 m and 3 m for model sampling/mixing depths. The total abundance of glass
spherules of a particular age is the weighted average of spherule abundance from all
mixed regolith layers down to the sampling/mixing depth.
Our observed data set uses a Gaussian distribution to characterize the relative
probability of each individual glass spherule having a particular age, t,
t =A√2πσ
exp[−(x− t)2/2σ2
],
where A is the amplitude of relative probability of a glass spherule, which is the
likelihood of impact events that formed it around the time t, σ is the analytical error
of measured ages of observed impact spherules (<1 Ma - 2 Ga). The median value of
age analytical errors from our observed data set is 46 Ma (see the last row in Table
4.1). The amplitude of each glass spherule sample is scaled by the total number of
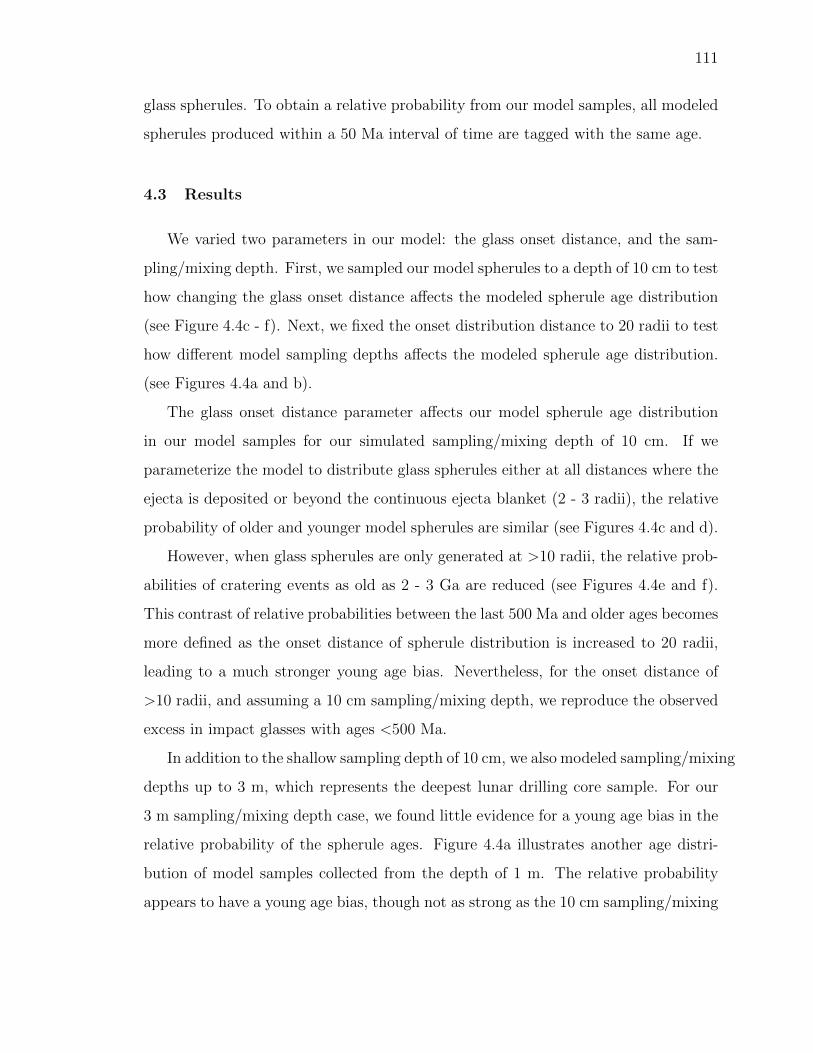
111
glass spherules. To obtain a relative probability from our model samples, all modeled
spherules produced within a 50 Ma interval of time are tagged with the same age.
4.3 Results
We varied two parameters in our model: the glass onset distance, and the sam-
pling/mixing depth. First, we sampled our model spherules to a depth of 10 cm to test
how changing the glass onset distance affects the modeled spherule age distribution
(see Figure 4.4c - f). Next, we fixed the onset distribution distance to 20 radii to test
how different model sampling depths affects the modeled spherule age distribution.
(see Figures 4.4a and b).
The glass onset distance parameter affects our model spherule age distribution
in our model samples for our simulated sampling/mixing depth of 10 cm. If we
parameterize the model to distribute glass spherules either at all distances where the
ejecta is deposited or beyond the continuous ejecta blanket (2 - 3 radii), the relative
probability of older and younger model spherules are similar (see Figures 4.4c and d).
However, when glass spherules are only generated at >10 radii, the relative prob-
abilities of cratering events as old as 2 - 3 Ga are reduced (see Figures 4.4e and f).
This contrast of relative probabilities between the last 500 Ma and older ages becomes
more defined as the onset distance of spherule distribution is increased to 20 radii,
leading to a much stronger young age bias. Nevertheless, for the onset distance of
>10 radii, and assuming a 10 cm sampling/mixing depth, we reproduce the observed
excess in impact glasses with ages <500 Ma.
In addition to the shallow sampling depth of 10 cm, we also modeled sampling/mixing
depths up to 3 m, which represents the deepest lunar drilling core sample. For our
3 m sampling/mixing depth case, we found little evidence for a young age bias in the
relative probability of the spherule ages. Figure 4.4a illustrates another age distri-
bution of model samples collected from the depth of 1 m. The relative probability
appears to have a young age bias, though not as strong as the 10 cm sampling/mixing

112
Age (Ma)
500 1000 1500 2000 2500 3000 500 1000 1500 2000 2500 3000
Age (Ma)
Rela
tive P
robabilit
yR
ela
tive P
robabilit
y
Age (Ma)
500 1000 1500 2000 2500 30000
c) 0 R glass onset distance
d) 5 R glass onset distance
e) 10 R glass onset distance
f) 20 R glass onset distance
Fixed glass onset distance (20 R)
Variable sampling depth
b) 3 m sampling depth
a) 1 m sampling depth
Variable glass onset distance
Fixed sampling depth (10 cm)
Figure 4.4.: The relative probability plots calculated from all of our fifty simulated
surfaces with our two free parameters varied: sampling depth (a and b) and glass
distribution onset distance, where R is the crater radius (c-f). The x-axis is age
(Ma), with the present day at the left. The relative probability of all model samples
is calculated in a similar fashion as the observed data set given in Figure 4.1, but
with the constant model resolution σ of 50 Ma.Panel f (highlighted in black, bold
line) shows our result with a sampling/mixing depth most similar to the Apollo
sampling depth, and with a glass onset distance closest to that from obtained from
the terrestrial microtektite constraint. It shows a prominent bias in <500 Ma ages
qualitatively similar to our observational data shown in Figure 4.1.
depth case. We found that a young age bias in the case of other glass onset distance
(e. g. >5 radii) does not correlate well with sampling/mixing depths (see Figure 4.5).
Several older cratering events can still be seen from our shallowly-collected sam-
ples, yet the fraction of their population within the depth of 10 cm is much smaller
than for the younger cratering events. We found that those spherules typically come
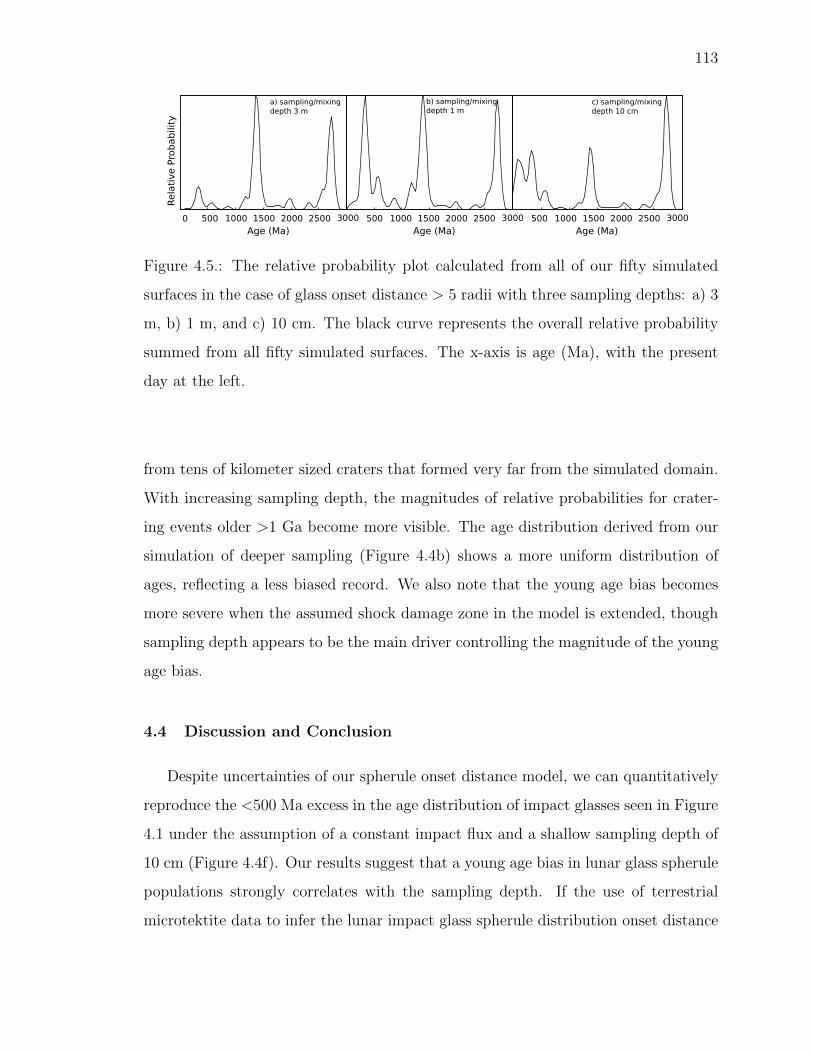
113
3000500 1000 1500 2000 2500 30000 500 1000 1500 2000 2500 3000 500 1000 1500 2000 2500 3000
a) sampling/mixing
depth 3 m
Age (Ma) Age (Ma) Age (Ma)
Rela
tive P
robabilit
y
b) sampling/mixing
depth 1 mc) sampling/mixing
depth 10 cm
Figure 4.5.: The relative probability plot calculated from all of our fifty simulated
surfaces in the case of glass onset distance > 5 radii with three sampling depths: a) 3
m, b) 1 m, and c) 10 cm. The black curve represents the overall relative probability
summed from all fifty simulated surfaces. The x-axis is age (Ma), with the present
day at the left.
from tens of kilometer sized craters that formed very far from the simulated domain.
With increasing sampling depth, the magnitudes of relative probabilities for crater-
ing events older >1 Ga become more visible. The age distribution derived from our
simulation of deeper sampling (Figure 4.4b) shows a more uniform distribution of
ages, reflecting a less biased record. We also note that the young age bias becomes
more severe when the assumed shock damage zone in the model is extended, though
sampling depth appears to be the main driver controlling the magnitude of the young
age bias.
4.4 Discussion and Conclusion
Despite uncertainties of our spherule onset distance model, we can quantitatively
reproduce the <500 Ma excess in the age distribution of impact glasses seen in Figure
4.1 under the assumption of a constant impact flux and a shallow sampling depth of
10 cm (Figure 4.4f). Our results suggest that a young age bias in lunar glass spherule
populations strongly correlates with the sampling depth. If the use of terrestrial
microtektite data to infer the lunar impact glass spherule distribution onset distance
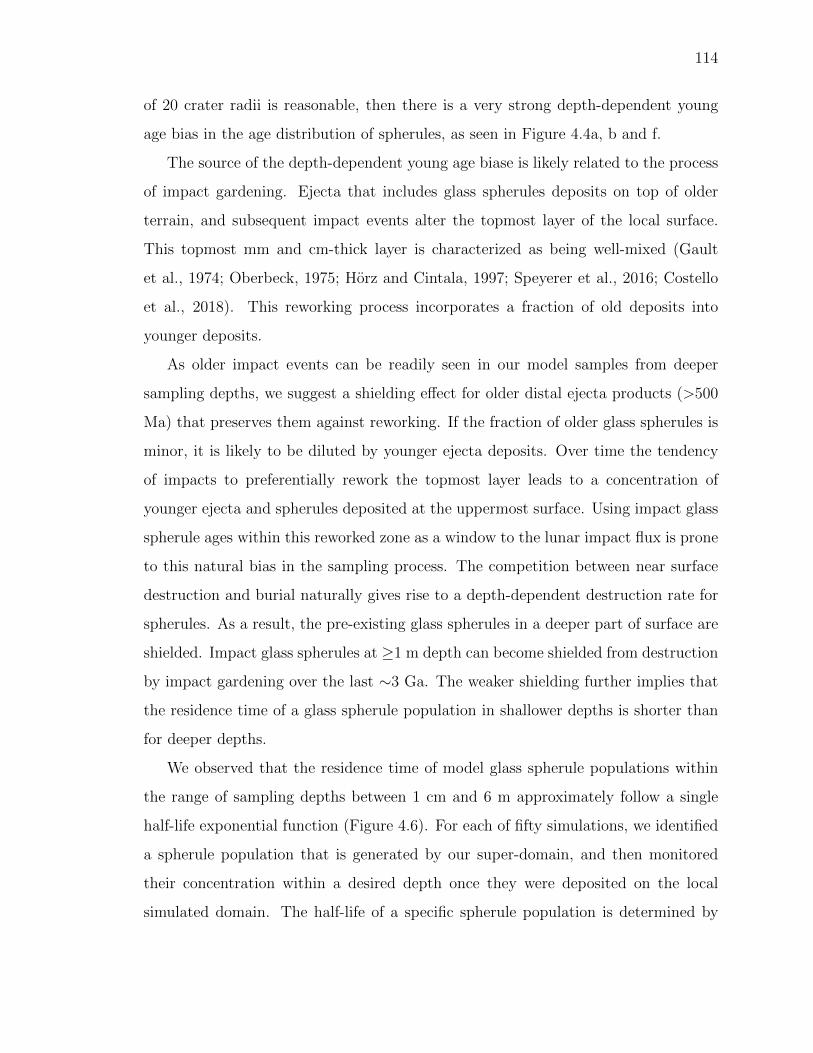
114
of 20 crater radii is reasonable, then there is a very strong depth-dependent young
age bias in the age distribution of spherules, as seen in Figure 4.4a, b and f.
The source of the depth-dependent young age biase is likely related to the process
of impact gardening. Ejecta that includes glass spherules deposits on top of older
terrain, and subsequent impact events alter the topmost layer of the local surface.
This topmost mm and cm-thick layer is characterized as being well-mixed (Gault
et al., 1974; Oberbeck, 1975; Horz and Cintala, 1997; Speyerer et al., 2016; Costello
et al., 2018). This reworking process incorporates a fraction of old deposits into
younger deposits.
As older impact events can be readily seen in our model samples from deeper
sampling depths, we suggest a shielding effect for older distal ejecta products (>500
Ma) that preserves them against reworking. If the fraction of older glass spherules is
minor, it is likely to be diluted by younger ejecta deposits. Over time the tendency
of impacts to preferentially rework the topmost layer leads to a concentration of
younger ejecta and spherules deposited at the uppermost surface. Using impact glass
spherule ages within this reworked zone as a window to the lunar impact flux is prone
to this natural bias in the sampling process. The competition between near surface
destruction and burial naturally gives rise to a depth-dependent destruction rate for
spherules. As a result, the pre-existing glass spherules in a deeper part of surface are
shielded. Impact glass spherules at ≥1 m depth can become shielded from destruction
by impact gardening over the last ∼3 Ga. The weaker shielding further implies that
the residence time of a glass spherule population in shallower depths is shorter than
for deeper depths.
We observed that the residence time of model glass spherule populations within
the range of sampling depths between 1 cm and 6 m approximately follow a single
half-life exponential function (Figure 4.6). For each of fifty simulations, we identified
a spherule population that is generated by our super-domain, and then monitored
their concentration within a desired depth once they were deposited on the local
simulated domain. The half-life of a specific spherule population is determined by
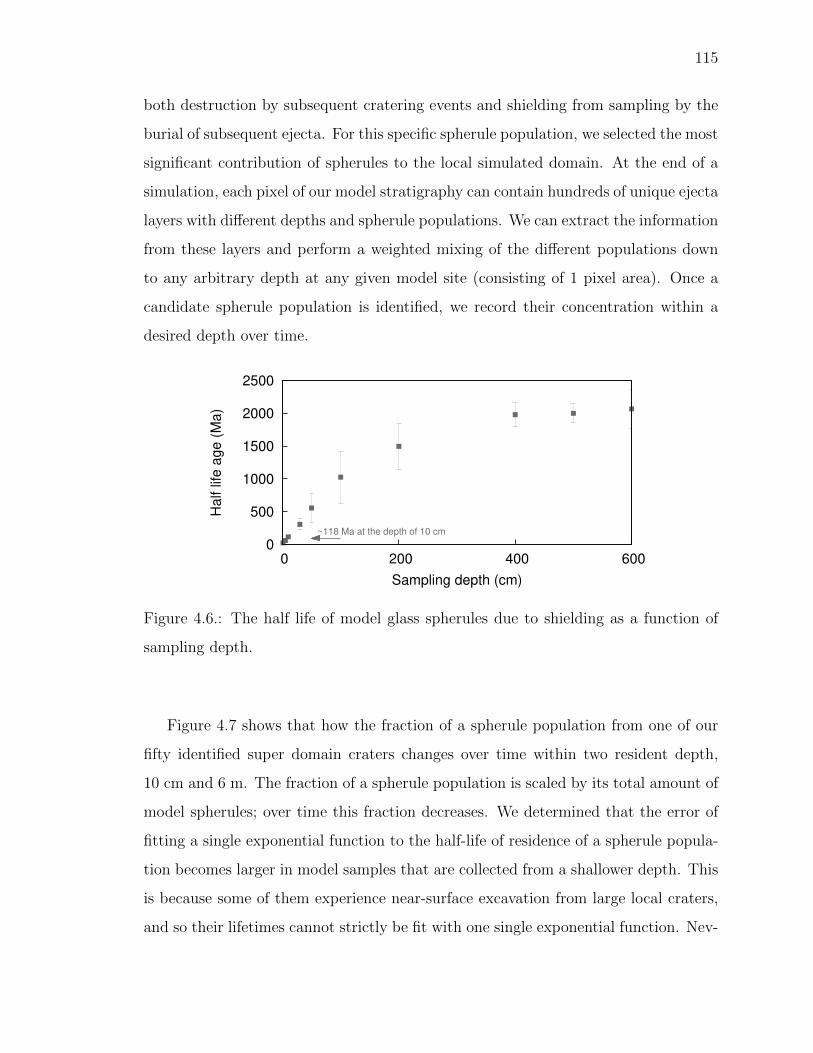
115
both destruction by subsequent cratering events and shielding from sampling by the
burial of subsequent ejecta. For this specific spherule population, we selected the most
significant contribution of spherules to the local simulated domain. At the end of a
simulation, each pixel of our model stratigraphy can contain hundreds of unique ejecta
layers with different depths and spherule populations. We can extract the information
from these layers and perform a weighted mixing of the different populations down
to any arbitrary depth at any given model site (consisting of 1 pixel area). Once a
candidate spherule population is identified, we record their concentration within a
desired depth over time.
0
500
1000
1500
2000
2500
0 200 400 600
~118 Ma at the depth of 10 cm
Half life a
ge (
Ma)
Sampling depth (cm)
Figure 4.6.: The half life of model glass spherules due to shielding as a function of
sampling depth.
Figure 4.7 shows that how the fraction of a spherule population from one of our
fifty identified super domain craters changes over time within two resident depth,
10 cm and 6 m. The fraction of a spherule population is scaled by its total amount of
model spherules; over time this fraction decreases. We determined that the error of
fitting a single exponential function to the half-life of residence of a spherule popula-
tion becomes larger in model samples that are collected from a shallower depth. This
is because some of them experience near-surface excavation from large local craters,
and so their lifetimes cannot strictly be fit with one single exponential function. Nev-

116
ertheless, using a simple exponential function, we were able to obtain 37 out of 50
spherule populations for resident depth of 10 cm, and 42 for resident depth of 6 m.
Figure 4.7.: The fraction of super-domain spherule population as function of time
with two sampling/mixing depths: a) 6 m, and b) 10 cm. The x-axis represents the
time since the formation of each spherule population; the y-axis is the normalized
distribution of spherules by the total amount of spherules generated. Points in colors
depict different spherule populations that were produced in our fifty simulations. The
arrow in a) shows excavation events occurring to this particular spherule population.
We computed the half-life for glass spherule preservation for the 10 cm sampling
depth to be 118+8−12 Ma, while the half-lives of spherule populations at deeper sampling
depths can increase to ∼2 Ga. It should be noted that an individual spherule popu-
lation may experience anomalous episodes of excavation or ejecta shielding such that
a single half-life exponential function will not necessarily fit at any specific location.
To conclude, our modeling results are consistent with the excesses of young impact
glass spherule ages in the last 500 Ma being a result of a depth-dependent age bias
and the shallow sampling depth of the Apollo regolith samples, and that the spherule
age distributions are consistent with a constant impact flux over the last 3 Ga.

117
Table 4.1.: Data re-compilation of 40Ar/39Ar-derived age
measurements of lunar impact glass spherules and shards
Apollo 14, 14259,624
Spherule number Age (Ma) Age error (±σ, Ma)
7 45 12
10 1624 140
31 1300 200
66 1037 32
88 116 66
100 783 76
168 451 228
14 983 216
30 681 200
44 250 250
54 2040 100
74 500 500
90 783 8
124 603 160
130 155 20
135 769 8
143 2292 100
154 2476 92
165 345 10
Apollo 16, 64501,225
195 686 10
202 1530 70
239 778 18
continued on next page
118
Table 4.1.: continued
Spherule number Age (Ma) Age error (±σ, Ma)
209 1860 1883
211 165 40
247 250 250
250 432 100
251 805 218
254 847 14
Apollo 17, 71501,262
292 2500 1500
301 102 20
304 1540 140
311 774 114
322 1289 415
349 1650 400
352 1400 300
360 250 250
291 2750 60
361 1733 40
382 2960 1600
383 2533 632
Apollo 16, 66041,127
427 361 10
437 2786 64
438 257 22
443 510 16
455 988 44
continued on next page
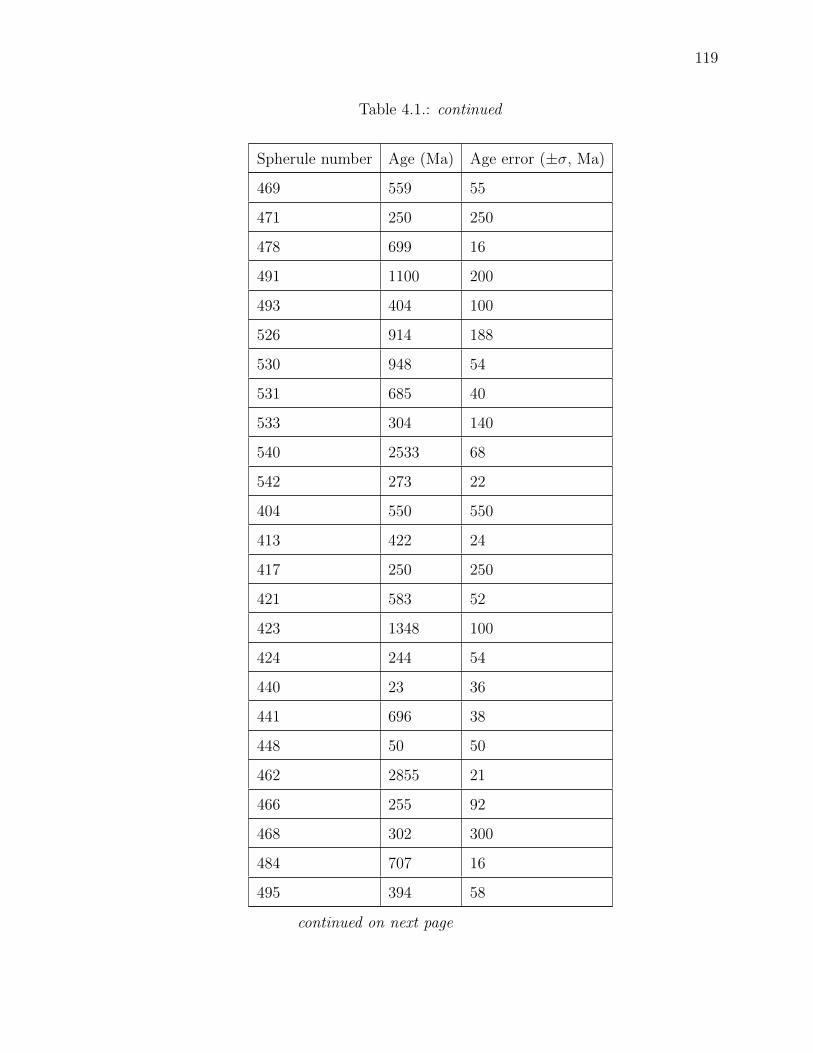
119
Table 4.1.: continued
Spherule number Age (Ma) Age error (±σ, Ma)
469 559 55
471 250 250
478 699 16
491 1100 200
493 404 100
526 914 188
530 948 54
531 685 40
533 304 140
540 2533 68
542 273 22
404 550 550
413 422 24
417 250 250
421 583 52
423 1348 100
424 244 54
440 23 36
441 696 38
448 50 50
462 2855 21
466 255 92
468 302 300
484 707 16
495 394 58
continued on next page
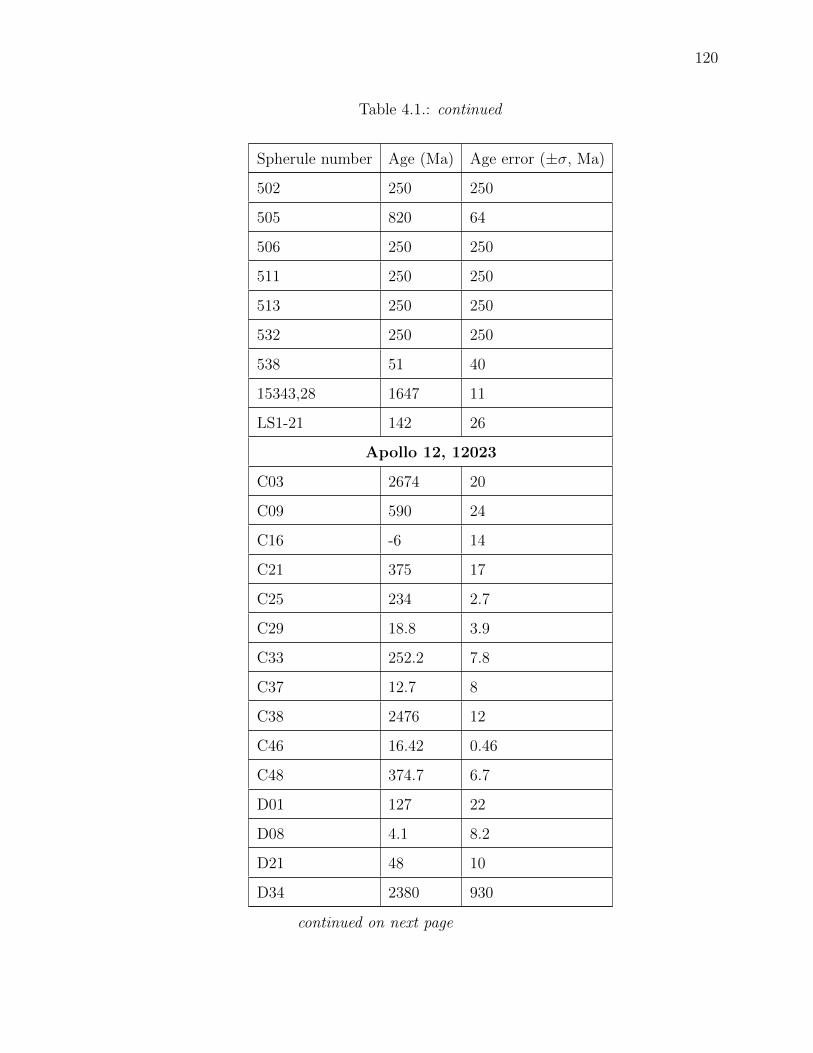
120
Table 4.1.: continued
Spherule number Age (Ma) Age error (±σ, Ma)
502 250 250
505 820 64
506 250 250
511 250 250
513 250 250
532 250 250
538 51 40
15343,28 1647 11
LS1-21 142 26
Apollo 12, 12023
C03 2674 20
C09 590 24
C16 -6 14
C21 375 17
C25 234 2.7
C29 18.8 3.9
C33 252.2 7.8
C37 12.7 8
C38 2476 12
C46 16.42 0.46
C48 374.7 6.7
D01 127 22
D08 4.1 8.2
D21 48 10
D34 2380 930
continued on next page
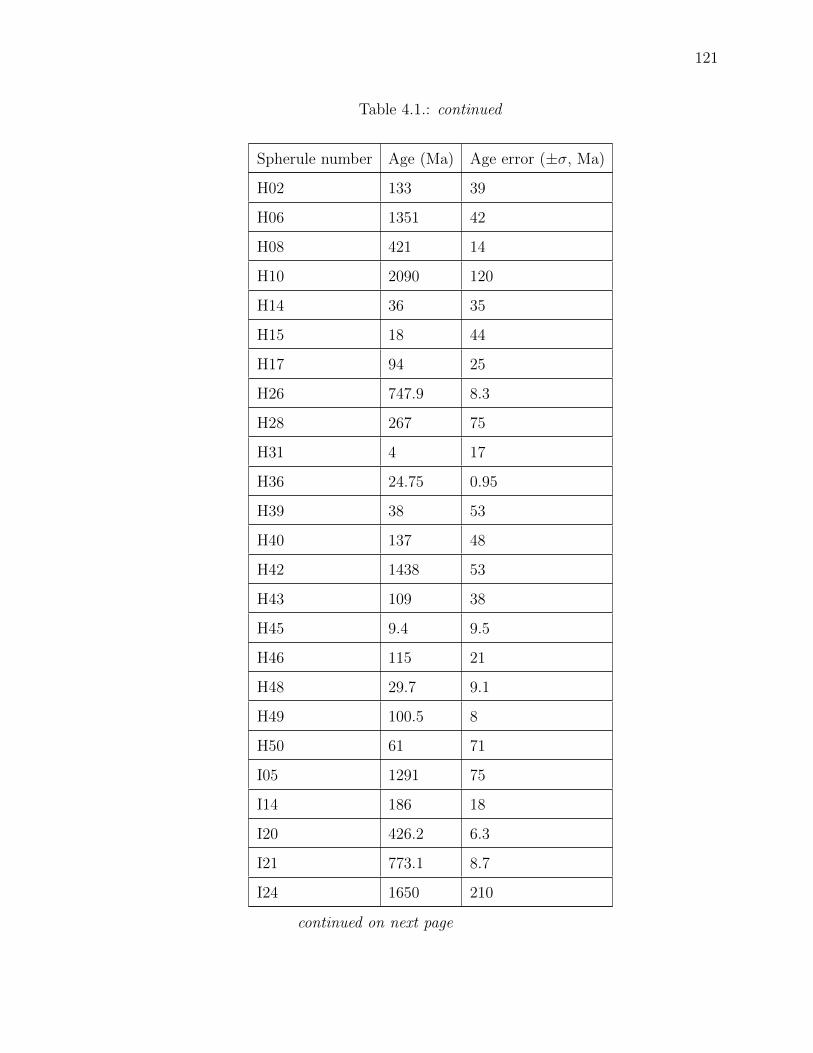
121
Table 4.1.: continued
Spherule number Age (Ma) Age error (±σ, Ma)
H02 133 39
H06 1351 42
H08 421 14
H10 2090 120
H14 36 35
H15 18 44
H17 94 25
H26 747.9 8.3
H28 267 75
H31 4 17
H36 24.75 0.95
H39 38 53
H40 137 48
H42 1438 53
H43 109 38
H45 9.4 9.5
H46 115 21
H48 29.7 9.1
H49 100.5 8
H50 61 71
I05 1291 75
I14 186 18
I20 426.2 6.3
I21 773.1 8.7
I24 1650 210
continued on next page

122
Table 4.1.: continued
Spherule number Age (Ma) Age error (±σ, Ma)
I27 562 42
I29 791 17
I30 23 45
I31 587 53
I36 443 14
I40 3250 210
J03 163 98
J05 745.4 9.6
J26 2050 230
J27 62 22
J28 165 32
J44 100 40
K08 135 32
K10 498.5 6
K32 2962 13
L01 229 47
L39 1132 61
L40 1040 130
L51 244 22
M13 20.6 6
M15 146 88
M18 2827 23
M23 2540 120
M31 2552 21
M43 225 85
continued on next page
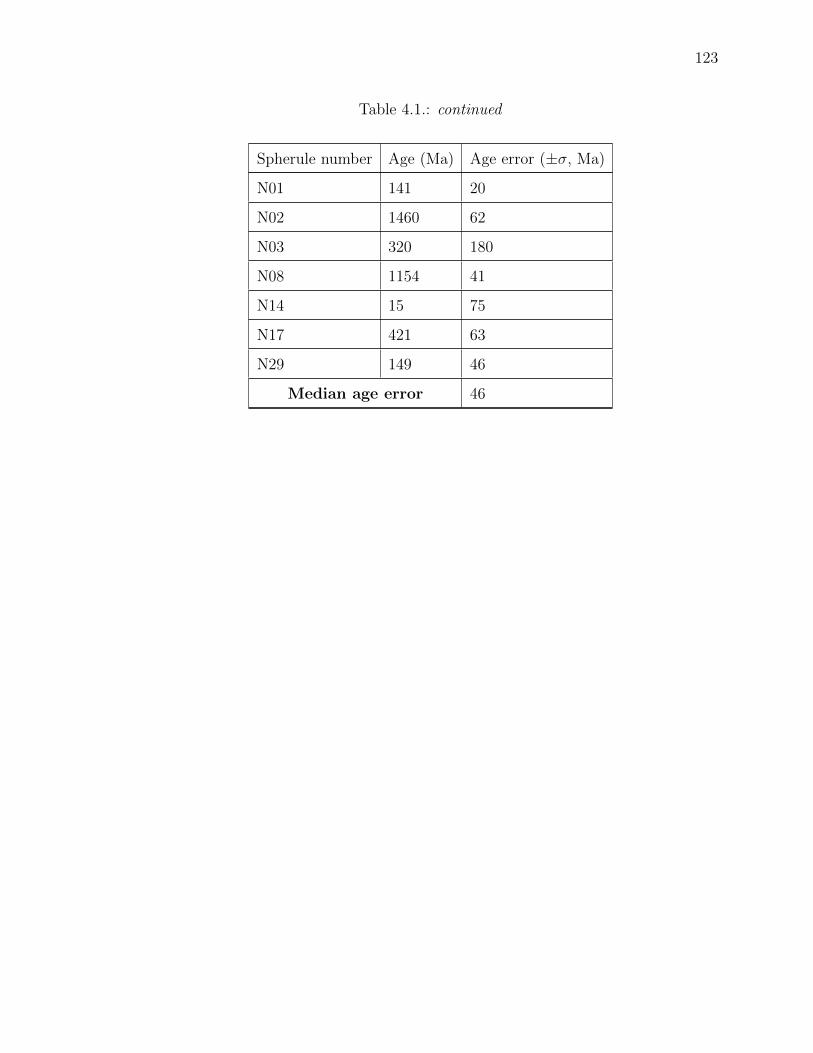
123
Table 4.1.: continued
Spherule number Age (Ma) Age error (±σ, Ma)
N01 141 20
N02 1460 62
N03 320 180
N08 1154 41
N14 15 75
N17 421 63
N29 149 46
Median age error 46

124
Table 4.2.: The data of size and spatial distribution of terrestrial microtektites.
Core/site Distance from crater (km) Maximum size (mm)
Ivory Coast strewnfield (Glass et al., 1997)
Outcrop 4 (Coney et al., 2010) 7.8 400.0
Outcrop 3 (Coney et al., 2010) 7.8 30.0
V19-297 1250 0.95
ODP 663 1441 0.2
V27-239 1585 0.4
K9-56 1613 0.7
RC13-213 1881 0.24
V19-300 1996 0.26
RC13-210 2009 0.27
K9-57 2287 0.195
ODP 664 2529 0.16
North American strewnfield (Glass et al., 1997)
USGS North core (Horton et al., 2007) 39.0 60
ODP 904 332 4
DSDP 612 339 2
DSDP 94 1888 1
DSDP 149 2545 1
RC9-58 2569 0.32
Barbados 3145 0.62
K/T boundary strewnfield
Albion Island (Pope et al., 1999) 300 10-20
Beloc (Jehanno et al., 1992) 500 10
La Sierrita (Schulte et al., 2003) 800 10
Shell Creek (Schulte et al., 2003) 900 3
Dogie Creek (Schulte et al., 2003) 2500 1
DSDP 396 (Schulte et al., 2003) 2800 1.3
ODP 886 (Kyte et al., 1996) 6450 1.5
DSDP 577 (Kyte et al., 1996) 9300 0.5
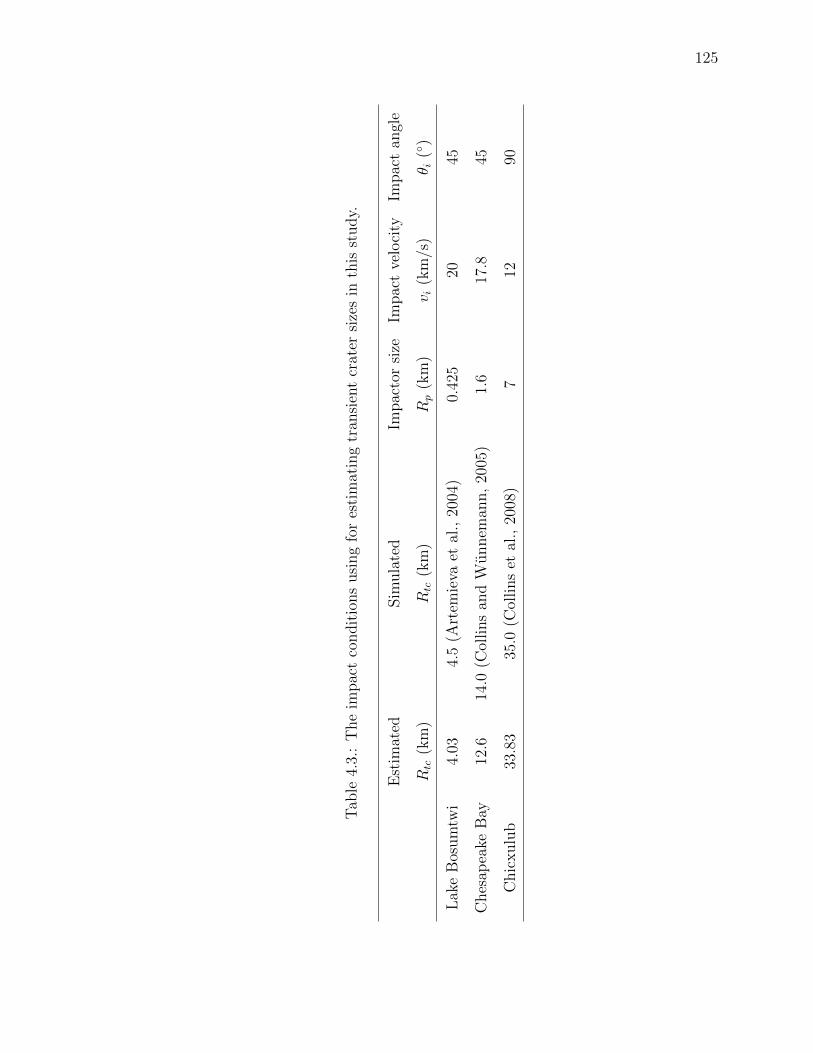
125
Tab
le4.
3.:
The
impac
tco
ndit
ions
usi
ng
for
esti
mat
ing
tran
sien
tcr
ater
size
sin
this
study.
Est
imat
edSim
ula
ted
Impac
tor
size
Impac
tve
loci
tyIm
pac
tan
gle
Rtc
(km
)Rtc
(km
)Rp
(km
)v i
(km
/s)
θ i(◦
)
Lak
eB
osum
twi
4.03
4.5
(Art
emie
vaet
al.,
2004
)0.
425
2045
Ches
apea
keB
ay12
.614
.0(C
ollins
and
Wunnem
ann,
2005
)1.
617
.845
Chic
xulu
b33
.83
35.0
(Col
lins
etal
.,20
08)
712
90
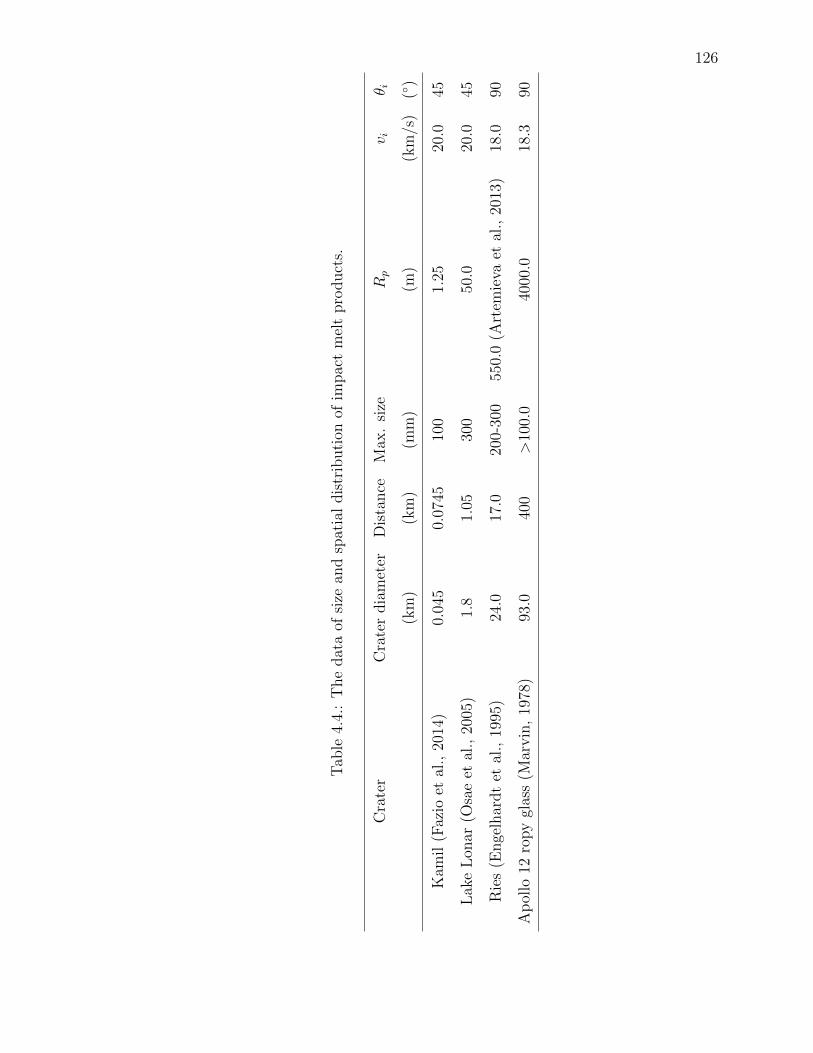
126
Tab
le4.
4.:
The
dat
aof
size
and
spat
ial
dis
trib
uti
onof
impac
tm
elt
pro
duct
s.
Cra
ter
Cra
ter
dia
met
erD
ista
nce
Max
.si
zeRp
v iθ i
(km
)(k
m)
(mm
)(m
)(k
m/s
)(◦
)
Kam
il(F
azio
etal
.,20
14)
0.04
50.
0745
100
1.25
20.0
45
Lak
eL
onar
(Osa
eet
al.,
2005
)1.
81.
0530
050
.020
.045
Rie
s(E
nge
lhar
dt
etal
.,19
95)
24.0
17.0
200-
300
550.
0(A
rtem
ieva
etal
.,20
13)
18.0
90
Ap
ollo
12ro
py
glas
s(M
arvin
,19
78)
93.0
400
>10
0.0
4000
.018
.390

127
Tab
le4.
5.:
The
five
Ap
ollo
soil
sam
ple
sw
ith
corr
esp
ondin
gco
llec
ted
dep
th
Soi
lsa
mp
len
o.A
pol
lom
issi
onD
epth
1202
3(S
hoem
aker
etal
.,19
70)
12>
20cm
and<
23cm
1425
9(S
wan
net
al.,
1977
)14
<1
cm
6450
116
<10
cm
6604
116
<10
cm
7150
1(B
erg
etal
.,19
73)
17<
4cm

128

129
5 WHAT HAPPENED ON THE MOON 800 MILLION YEARS AGO?
Acknowledgement: A version of this chapter is being prepared for submission. Ref-
erence: Huang, Y. H., Minton, D. A., Elliott, J. R., Nguyen, P. Q., and Zellner, N.
E. (2018). A short-lived lunar impact spike induced by Copernicus Crater-forming
sesquinaries against a possibly long-duration global impact resurfacing 800 Ma ago
from modeling perspective.
Abstract: Lunar “exotic” impact glass spherules most likely originated in geo-
chemically distinct regions that are few hundred kilometers away from the sites where
they were collected. There have been reported that “exotic” glass spherules clustered
at ∼700-900 Ma. Coincidentally, a well-known cratering event of Copernicus Crater
possibly formed 800 Ma ago on the Moon. As a consequence of this concurrence,
the excess of ∼700-900 Ma ages of “exotic” glass spherules may suggest either that a
global lunar impact spike that also formed Copernicus Crater occurred at the same
time or that exotic glass spherules were a direct product of the formation of Coperni-
cus Crater. In this study, we attempted to clarify the relation between the formation
of Copernicus Crater and the excess of ∼700-900 Ma ages of “exotic” glass spherules.
We examined the contribution of glass spherules directly produced by Copernicus
Crater, as well as through the re-impact of ejecta that initially escaped lunar grav-
ity, but not Earth’s, which formed “sesquinary craters”. We found that Copernicus
Crater-forming glass spherules cannot be a primary contributor to the excess of ∼700-
900 Ma old “exotic” glass spherules. A compositional diversity in the provenances
of our compiled ∼700-900 Ma-old exotic spherules is challenging to reconcile with
mixing substrate materials potentially sourced from beneath Copernicus Crater. On
the other hand, Copernicus Crater sesquinary-forming glasses, if exist, are too low
in comparison with the amount of glasses produced by primary bombardment. Our

130
result suggests that the formation of Copernicus Crater is independent of the con-
currence of the excess of ∼700-900 Ma ages of “exotic” glass spherules. This further
implies that either a short-lived lunar impact spike occurred 800 Ma ago or a better
understanding of how “exotic” glass spherules form is needed.
5.1 Introduction
The heavily cratered surface of the Moon contains a unique bombardment record
in the Solar System. As far as biotic evolution is concerned, interpreting a recent
impact rate from the current lunar surface is challenging. The state of the current
lunar surface may have reached crater saturation for small craters. Nevertheless, a
few lunar crater count studies reported a possible change in a lunar impact flux in the
last 3 billion years. The first example comes from the crater count study for young
rayed craters on the farside of the Moon, suggesting an increase in a global lunar
impact flux by a factor of 2-3 (McEwen et al., 1997). Another example is a crater
count study concerning the formation age of Copernicus Crater (Neu, ). Using the
age of 800 Ma from the derived ages of the Apollo 12 ropy glasses that are thought
to be Copernicus Crater’s ejecta, the number of craters on the top of Copernicus
Crater’s ejecta blanket larger than 1 km in diameter is considered too high (treated
as an outlier in the standard lunar chronology). Interestingly, a careful crater count
study for Copernicus Crater that avoided some areas for visible secondary craters
suggests that the scenario of a constant lunar impact rate may still hold (Hiesinger
et al., 2012).
Terrestrial impact record is often compared with lunar bombardment record. On
Earth, instead of crater counting as for Moon, fireballs or meteorite falls are used
to establish a recent terrestrial impact record (Shoemaker et al., 1990). Terrestrial
meteorites are unusual samples because they could be collisional remnants directly
from asteroid breakup events (primary sources of impacts). A well-known collisional
breakup event of a large asteroid dated back to ∼400–500 Ma ago, which is thought
131
to be the parent body of L chondrite (Schmitz et al., 2003). From hydrodynamic
modeling results for Earth’s meteorite re-entry simulation (taking into account de-
celeration, ablation, and fragmentation) such an event can lead to an increase in the
Earth’s impact flux by a factor of 2 within <1 Ma. A detailed examination on the
orbit dynamics of Flora Family breakup event, a potential candidate of L-chondrite
parent body (Nesvorny et al., 2002), suggests that a few tens of kilometer sized aster-
oids struck the Moon between 900 Ma and 1.2 Ga(Bottke et al., 2018). As a breakup
event can reset the radiometric isotope systems of fragments or parent body, multiple,
old heating events are well-documented in some of the meteorites. For example, Cat
Mountain and Northwest Africa 091 meteorite samples are shown experiencing old
heating events at ∼800-900 Ma (Kring et al., 1996). While the source of which aster-
oid family accounts for those heating, breakup events that bombarded Earth remain
debated, it makes sense to assume that lunar surface, in proximity to Earth, could
have also been bombarded by a similar breakup event. The returned lunar samples
are a treasure for this kind of a recent record because the ages of <1 Ga is relatively
young that this kind of a recent record may still be present at the lunar surface (Kring
et al., 1996; Swindle et al., 2009; Weirich et al., 2012; Righter et al., 2015; Park et al.,
2015; Lindsay et al., 2015).
One of the clues of a possible change in an impact rate on Moon is lunar impact
glass spherules (Culler et al., 2000; Levine et al., 2005; Hui et al., 2009; Zellner et al.,
2009; Zellner and Delano, 2015). Lunar impact glass spherules, up to 1-mm diameter
in size, are melt products formed in a hypervelocity impact (Reid et al., 1977; Delano
et al., 1982; Melosh and Vickery, 1991; Johnson and Melosh, 2014). A particular
kind of impact glass spherules, referred to as “exotic”, can be geochemically sepa-
rated from the local regolith where the “exotic” spherule was collected (Zellner et al.,
2003; Zellner et al., 2005). An “exotic glass spherule carries a unique provenance, re-
vealing the location of the source crater that formed it. Where an impact probability
is concerned, the purpose of using only “exotic”-origin glasses is not to inflate the
impact flux by double-counting a glass spherule population produced from the same
132
impact event (Zellner et al., 2009). The impact probability interpreted from the age
distributions of “exotic” glass spherules may reflect distant, large cratering events.
A successful application of geochemical provenance analysis onto “exotic” Apollo
16 impact glass spherules reveals an individual cratering event occurring at ∼800 Ma
while several other “exotic” glass spherules spikes in the Late Heavy Bombardment era
(3.8 Ga) (Zellner et al., 2003). This particular age, 800 Ma, is similar to the estimated
formation age for Copernicus Crater; the age determination for the formation of
Copernicus Crater was interpreted from returned Apollo 12 samples including ropy
glasses (Delano et al., 2007) and coarse, non-mare fines (Wentworth et al., 1994; Barra
et al., 2006; Bogard et al., 1994). An impact glass bomb, other type of melt products,
collected from Apollo 16 landing site (sample No. 67567,4) also shows an age of ∼800
Ma. The origin of the sample 67567,4 glass bomb is considered exotic because its
composition cannot be achieved by mixing local regolith (Borchardt et al., 1986).
Followed by the analyses of 800 Ma-old glassy and exotic materials, Zellner re-
ported more exotic lunar impact glass spherules and shards (spherule fragments) from
Apollo 14, 16, and 17 landing sites (Zellner et al., 2009). The 40Ar/39Ar-derived age
distributions of “exotic” lunar impact glass spherules and shards from Apollo 14, 16,
and 17 regolith samples show an excess of glasses with ages of ∼700-900 Ma than
glasses at other ages (see Figure 5.1 and Table 5.1). As an “exotic” glass spherule is
associated with a specific impact crater on Moon, multiple “exotic” glass spherules,
in which their provenance are not overlapped, represent multiple impacts. Reason-
ably, it seems straightforward to interpret that several other large cratering events,
including Copernicus Crater, occurred 800 Ma ago on Moon. As a result, Zellner
et al., 2009 have suggested that the excess of “exotic” impact glasses with measured
ages of ∼700-900 Ma implies an increase in the lunar impact flux 800 Ma ago (Zellner
et al., 2006; Zellner et al., 2009).
A relation between the ages of ∼700-900 Ma of “exotic” impact glasses from
Apollo 14, 16, and 17 regolith samples and the formation age of Copernicus Crater is
uncertain. As the most of those ∼700-900 Ma-old “exotic” glasses from the Apollo

133
1
2
3
4
5
Num
ber
0 200 400 600 800 1000
Rela
tive p
robabili
ty
Age (Ma)
Exotic glass spherules ONLY
Figure 5.1.: The relative impact probability of exotic glass spherules and shards from
Apollo 14259, 64501, 66041, 71501 from zellner201540, and one age (800 ± 15 Ma)
from Apollo 12 ropy glasses from Bogard1994. The black curves are the total impact
probability represented by the sum of Gaussian distributions for our compiled 37
40Ar/39Ar-derived ages of exotic glass spherules. The gray boxes are histogram of
number of exotic glass spherules (number is shown on the right-hand side). The total
number of 40Ar/39Ar-derived age measurements is sixteen.
14, 16, and 17 landing sites is geochemically different from the composition of Apollo
12 ropy glasses (representative of Copernicus Crater), Copernicus Crater alone is
unlikely to generate glasses that derive from multiple source locations (Zellner et al.,
2009). Consequently, this concurrence is mainly attributed to an increased impact
flux that the formation of Copernicus Crater was one of them. However, considering
that this 800 Ma-old coincidence is less investigated, we cannot easily rule out the
possibility that an impact record may be affected as a consequence of the formation of
Copernicus Crater. For example, Barra found that the most of their examined twenty-
one coarse, non-mare fines from Apollo 12 landing site (only one mare basaltic fine is

134
included) experienced some degree of degassing events at 700-800 Ma (Barra et al.,
2006). Barra suggested that Copernicus Crater may have directly added degassed
material to a local site or its warm ejecta deposit degassed localities, yet being as
part of global cratering events cannot be excluded (Barra et al., 2006).
Given the concurrence of the formation age of Copernicus Crater and the glass
spherules, we feel this confusion can be better clarified by ruling out the most-likely
cases that the excess of glasses with ages of ∼700-900 Ma can be accounted for
by the formation of Copernicus Crater. Copernicus Crater-forming event owns two
possible sources of glass spherules to alter the abundance of “exotic” glass spherules
occurring at 800 Ma. For such a large crater, it is expected to generate an extensive
amount of melts that some of them also forms glass spherules. Melts and glass
spherules are re-melting of materials that underlie the target surface of Copernicus
Crater. Heterogeneity of composition of 800 Ma-old exotic glass spherules may be
consistent with the fact that Copernicus Crater is sitting in a region where a diverse
lithology of a lunar surface is present. For example, where Copernicus Crater situates
is suggested to be covered by a relative thin mare basalt lying on the top of a thick
Imbrium Basin ejecta underlain by the pre-Imbrium megaregolith materials (Schmitt
et al., 1967; McGetchin et al., 1973; Pike, 1974; De Hon, 1979; Haskin et al., 2000;
Jolliff et al., 2000; Gaddis et al., 2006; Bugiolacchi et al., 2011). Extensive studies
of spectral reflectance analysis for the range of geological features within the interior
of Copernicus Crater (e.g., central peak, sinuous melt features, fresh craters) show
a diversity of compositions of olivine-bearing materials, Mg-spinel, Mg-rich pyroxene
and Fe/Ca-pyroxene (Pieters, 1982; Dhingra and Pieters, 2011; Dhingra et al., 2013;
Bugiolacchi et al., 2011). However, it appears at odds with how melting of different
lithological materials remains un-mixed with each individual lithology.
The other most likely mechanism is via the production of impact glass spherules
by a Copernicus Crater sesquinary crater population. Secondary craters are excluded
because they formed by a much lower impact velocity; below the escape velocity of
the Moon results in a small peak pressure and a low melt production (Schaal and
135
Horz, 1980; Horz and Cintala, 1997; Kowitz et al., 2013). Sesquinary impact craters
are formed via impact ejecta that escapes a satellite, going into the orbit around
the primary, and later re-impact the same satellite (Zahnle et al., 2008). Such a
large impact crater like Copernicus Crater may be capable of producing sesquinary
impact craters (Kreslavsky, 2017). The impact velocity of possible lunar sesquinaries,
just above lunar escaped velocity, has been suggested to be enough to produce melts
that were subsequently ejected and formed melt droplets that are precursor of glass
spherules (Schaal and Horz, 1980; Horz and Cintala, 1997; Kowitz et al., 2013). If so,
Copernicus Crater-forming sesquinaries are likely to be the first choice for a global
impact spike because it takes less than 10,000 years from geocentric orbit phase to
re-impact the Moon (Kreslavsky, 2017). Once ejecta entered geocentric orbit, they
lose their initial configurations and re-impact the Moon randomly (Gladman et al.,
1995).
In order for hypothetical Copernicus sesquinary-forming spherules to be the source
of the excess of “exotic” glass spherules seen in the regolith sample, the contribution
of Copernicus sesquinary-forming spherules must be able to compete with the pro-
duction of spherules by large craters under the nominal constant impact flux. The
production of spherules by our hypothetical Copernicus Crater-forming sesquinary
craters is highly dependent on at least three observational constraints: 1) the origin lo-
cations of Copernicus Crater sesquinary-forming spherules must match with observed
“exotic” glass spherules, 2) sufficient debris must be generated by the Copernicus
Crater-forming event to account for the excess of “exotic” glass spherules, and 3)
sufficient melt (glass) is produced by moderately low velocity that formed sesquinary
craters.
We have utilized a set of models including a fragmentation code, SALES 2, (Melosh
et al., 1992; Head et al., 2002; Elliott and Melosh, 2018), an N-body orbit dynam-
ics, REBOUND, (Rein and Liu, 2012), and abundance map data acquired by Lunar
Prospector Gamma-Ray Spectrometer (Prettyman et al., 2006) to investigate whether
or not our assumed glass spherules produced by Copernicus Crater-forming sesquinary

136
craters is sufficient to account for the excess of “exotic” glass spherules. Regarding
the provenance of our “exotic” glass spherules, we used chemical oxide abundance
maps acquired by Lunar Prospector Gamma-Ray Spectrometer with a linear least
square method to provide a numerical quantification of provenance of “exotic glass
spherules in Section 5.2. In Section 5.3, we have used a fragmentation code, SALES 2,
combined with an orbit dynamic code, REBOUND, to obtain the final size frequency
distribution of a possible Copernicus Crater-forming sesquinary craters that could
have remained on the lunar surface. For the last constraint, we used planar impact
approximation to estimate maximum shock pressures for a range of impact velocity
that formed sesquinary craters (see Section 5.3). We presented an overall result in
Section 5.4 and concluded our study in Section 5.5.
Our modeling result shows the Copernicus-forming sesquinary craters, if exists,
are no larger than 500 m in diameter. Such a sub-kilometer sizes of craters ap-
pears to be inconsistent with the estimate provenances of our compiled “exotic” glass
spherules that range from few hundred kilometers to up to 900 km away from collec-
tion sites. As all of our compiled “exotic” glass spherules have an origin location at
least hundred kilometers away from the sites where regolith samples were collected, it
is implausible to deliver glass spherules produced by Copernicus-forming sesquinary
craters to a distance of hundred kilometers. Even though glass spherules experienced
a considerable amount of impact transport on the Moon, the nature of low impact
of lunar sesquinary crater yields a negligible amount of melt. Essentially, the melt,
if ever produced by Copernicus Crater sesquinary-forming spherules, is too scarce to
compete with the spherules delivered from large, distant cratering events. Our study
presented one particular scenario and have attempted to clarify the relation between
the formation age of Copernicus Crater and measured ages of ∼700-900 Ma from “ex-
otic” glasses. It is possible that the current understanding to the target heterogeneity
of Copernicus Crater region is sufficient to account for the compositional variation
of those ∼800 Ma-old exotic glass spehrules. Alternatively, a better understanding
of how impact glass spherules form, as well as a characterization on the provenance
137
of “exotic” glass spherules regarding their source crater may be helpful in addressing
the question about those ∼800 Ma-old “exotic” glasses.
5.2 Provenance Analysis of Observed “Exotic” Impact Glass Spherules
Our observed data set was compiled mainly from the 40Ar/39-derived age mea-
surements of lunar impact glass spherules of Zellner and Delano (2015), one age data
point for the formation age of Copernicus Crater from the study of Bogard et al.
(1994), and three new 40Ar/39Ar-derived age measurements for this study. Our com-
piled “exotic glass spherules, fifteen in total, were calculated from 42 glass spherules
out of 103 impact glass spherules in Zellner and Delano. This yields forty-five glass
spherules in total for further quantification of provenance of a glass spherule. Those
42 spherules are younger than 1 Ga (post-Copernican age) and have an impact ori-
gin, almost no inclusions and crusty/dusty outer rims, and non-crystalline textures
(Zellner and Delano, 2015). Those dated ages are inferred from >50% of released
40Ar/39 in which “fair” and “good” are recommended for assessment of age (Zellner
and Delano, 2015). We did not include one high silica glass spherule in the Apollo
14259 regolith sample because the formation mechanism of high silica sphere is less
known and perhaps different from the formation of impact glass spherules. Table 5.1
summarized the geochemical data (TiO2, MgO, Al2O3, and K2O), 40Ar/39-derived
ages with analytical errors (±2σ), our estimated provenance for fifteen “exotic” im-
pact glass spherules and one data point of Apollo 12 ropy glasses that we used for
our observed data set as shown in Figure 5.1.
The exotic origin of a glass spherule has been qualitative described (Delano, 1991;
Zellner et al., 2003; Zellner et al., 2009), yet a quantitative analysis of origin location
of a glass spherule has not been studied. To quantify the origin location of a glass
spherule, we used the concept of the nearness of distance (NOD), in which the distance
is defined from where the regolith sample containing a glass spherule was collected and
the region where a chemical composition acquired by Lunar Prospector Gamma-Ray
138
Spectrometer matches (see Table 5.1). For a given composition of a glass spherule,
a larger distance inferred from the chemical oxide abundance map gives us more
confidence to the interpretation of the exotic origin of a glass spherule. We performed
two sets of geochemical provenance analysis for our compiled forty-five glass spherules,
ternary diagram and chemical oxide abundance maps. The use of ternary diagram
is sufficient to filter out local glass spherules, leaving only “exotic” glass spherules
for our study. In addition, one may be concerned with a higher abundance of local
glass spherules as a consequence of this hypothetical Copernicus Crater sesquinary-
forming event if exists. We believe it is difficult to be resolved those local hypothetical
sesquinary-forming spherules from an impact record by local glass spherules because
local spherules are subject to biases (Zellner and Delano, 2015; Huang et al., 2018),
and their trace element measurements are not available (Norman, 2018). For the first
order approximation, we focus on “exotic” glass spherule population.
The first set of geochemical provenance analysis is ternary diagram. We plot
Titanium (Ti), Magnesium (Mg), and Aluminum (Al) in a triangle-shaped diagram,
where Ti and Al are specific for characterizing a target surface crust, considering
that Ti and Al are the most refractory lithophile elements (Lodders, 2003). The use
of Magnesium in a ternary diagram characterizes mare basaltic surface. From the
top corner of a triangle-shaped ternary diagram clock-wisely, it represents Ti, Al,
and Mg. The specific multipliers of 25, 3, and 1 for Ti, Mg, and Al respectively are
to enlarge the chemical difference among geological materials that are plotted in a
ternary diagram (Delano et al., 2007). The sum of each point in a ternary diagram
for these three elements is 100%. We used the Eq. 5.1 to calculate the quantities for
Ti, Mg, and Al that considers the oxide weight, element weight, and multiplier,
QT i,Mg,Al =WT iO2,MgO,Al2O3 × EWT i,Mg,Al ×MTi,Mg,Al
TAWT i,Mg,Al
(5.1)
where QT i,Mg,Al is quantity for an oxide as a function of weight percent of oxide
(WT i,Mg,Al), element weight (EWT i,Mg,Al), multiplier (MT i,Mg,Al, and the percent of

139
total atomic weight (TAWT i,Mg,Al). The element weight is to convert from the molec-
ular weight of the oxide to the weight of the element. For the oxides of Ti, Mg, and
Al, their element weights are 0.5995, 0.60317, and 0.52913 respectively. The percent
of total atomic weight is the ratio of the atomic weight of the element to the total
atomic weight of all elements. For the Ti, Mg, and Al of the total atomic weight,
these factors are 0.4827, 0.2452, and 0.2721 respectively. Each of these three quanti-
ties must be scaled by its total sum. Equation 5.2 calculate the relative position of
Ti, Mg, and Al (expressed in 100%), PT i,Mg,Al,
PT i,Mg,Al =QT i,Mg,Al
QT i +QMg +QAl
× 100%. (5.2)
Using equations 1 and 2, we plotted a ternary diagram of thirty-two impact glass
spherules. These thirty-two impact glass spherules contain seventeen spherules with
possible local origin and fifteen spherules with possible exotic origins. The relative
positions of all those “exotic” fifteen impact glass spherules in Figure 5.1 are sep-
arate from the relative positions drawn for local regolith samples (see Figure 5.2).
Not only these fifteen glass spherules carry a geochemically-distinct signature to their
corresponding sampling site, but also their nearly non-overlapping 40Ar/39Ar ages
indicate a unique impact event. As a result, it suggests that at least fifteen inde-
pendent impact events occurred in the last 1 Ga. For ∼800 Ma ages, they were
present in all four landing sites; those specific ages are 783 Ma for Apollo 14 landing
site, 820 Ma for Apollo 16 landing site, 800 Ma for Apollo 12 landing site (possibly
Copernicus Crater), and 774 Ma for Apollo 17 landing site. There has four impact
events occurring from 800 Ma to 1000 Ma. Two impact events occurred in the recent
1 million years (spherules 7 and 301 in Table 5.1). For the rest of “exotic” glass
spherules, it appears an impact occurred every 100 Ma between 100 Ma and 700 Ma
ago. The overall impact frequency ∼800 Ma ago seems higher than other periods
of time. Overall, 26 out of 45 spherules are exotic origin but 11 out of 26 exotic
140
spherules are found geochemically and temporally associated with our 15 identified
cratering events (see the Dataset in supplementary materials).
The geochemical data of glass spherules with orbital data has demonstrated infor-
mative to provide geochemical constraints to lunar local and regional geology (Spudis
et al., 2002; Zellner et al., 2002; Zellner et al., 2003). Prettyman determined the
elemental abundance by using gamma ray spectral un-mixing method (Prettyman
et al., 2006). Although the majority of mission phases acquired data from a high
altitude (100 km), Prettyman derived a high resolution data set (2 degrees per pixel,
<69 km) from comparing observation data acquired at low altitude phase (30 km)
with Clementine reflectance data (Prettyman et al., 2006) . Using the 2-degree abun-
dance map by LP–GRS, we performed a linear least square regression for those fifteen
“exotic” spherules by comparing them to a derived elemental abundance from each
pixel of Lunar Prospector Gamma Ray and Neutron Spectrometer surface map (11306
pixels in total).
For each of fifteen impact glass spherules, we exhaustively compare the glass
spherule chemical abundance with any pixel in the Lunar Prospector derived surface
map starting from the center of a landing site outward to the whole lunar surface.
We obtained the latitude and longitude of the landing site where the corresponding
regolith sample was collected and treated it as the center site where we started to
calculate a linear least squares. For any neighboring pixels, we summed a difference
of abundances of four chemical oxides between the sampled glass spherule and a
pixel in the LP–GRS map and recorded the distance between the center site and the
calculated pixel. For any pixels being equal distance from the center site, we obtained
the pixel that scores the minimum difference of four chemical oxide abundances. If
the four oxide abundances of this pixel, plus <2 standard deviations, fall in the four
oxide abundances of the sampled spherule, the distance between the location of this
pixel and the center site is defined as “the nearest distance” (NOD). If not satisfying,
we moved to the next pixel where it is further from the center site.
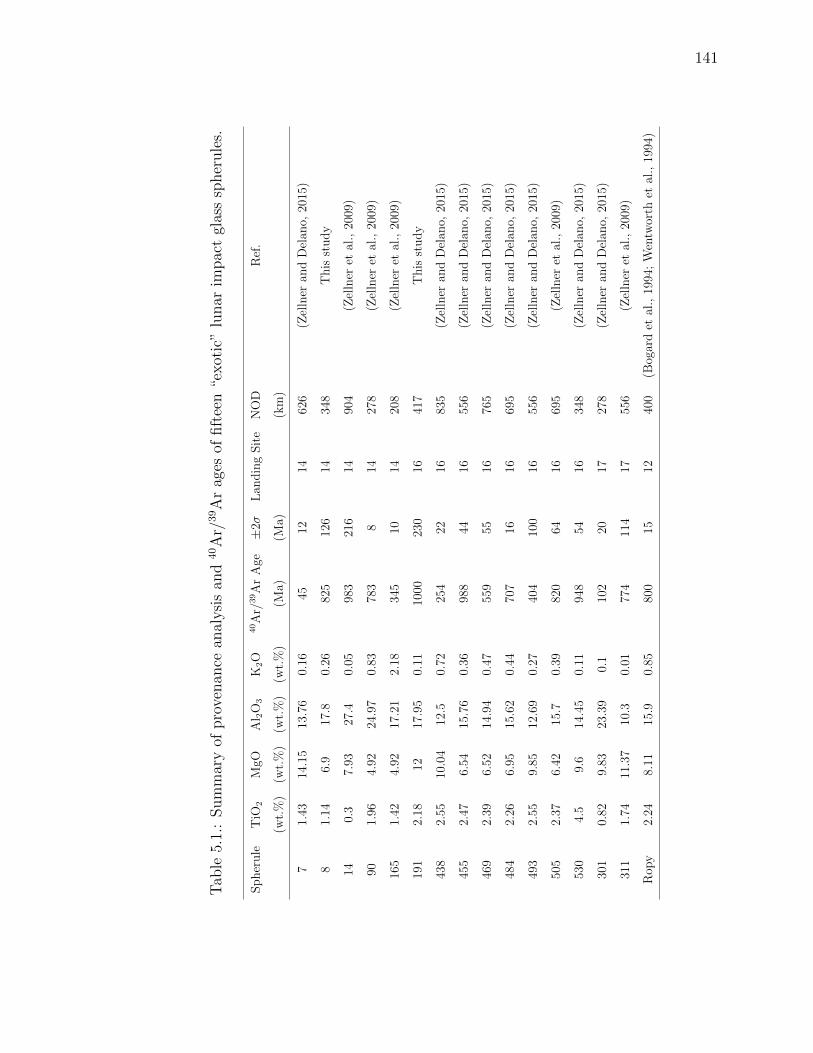
141
Tab
le5.
1.:
Sum
mar
yof
pro
venan
cean
alysi
san
d40A
r/39A
rag
esof
fift
een
“exot
ic”
lunar
impac
tgl
ass
spher
ule
s.
Spher
ule
TiO
2M
gOA
l 2O
3K
2O
40A
r/39A
rA
ge±
2σL
andin
gSit
eN
OD
Ref
.
(wt.
%)
(wt.
%)
(wt.
%)
(wt.
%)
(Ma)
(Ma)
(km
)
71.
4314
.15
13.7
60.
1645
1214
626
(Zel
lner
and
Del
ano,
2015
)
81.
146.
917
.80.
2682
512
614
348
This
study
140.
37.
9327
.40.
0598
321
614
904
(Zel
lner
etal
.,20
09)
901.
964.
9224
.97
0.83
783
814
278
(Zel
lner
etal
.,20
09)
165
1.42
4.92
17.2
12.
1834
510
1420
8(Z
elln
eret
al.,
2009
)
191
2.18
1217
.95
0.11
1000
230
1641
7T
his
study
438
2.55
10.0
412
.50.
7225
422
1683
5(Z
elln
eran
dD
elan
o,20
15)
455
2.47
6.54
15.7
60.
3698
844
1655
6(Z
elln
eran
dD
elan
o,20
15)
469
2.39
6.52
14.9
40.
4755
955
1676
5(Z
elln
eran
dD
elan
o,20
15)
484
2.26
6.95
15.6
20.
4470
716
1669
5(Z
elln
eran
dD
elan
o,20
15)
493
2.55
9.85
12.6
90.
2740
410
016
556
(Zel
lner
and
Del
ano,
2015
)
505
2.37
6.42
15.7
0.39
820
6416
695
(Zel
lner
etal
.,20
09)
530
4.5
9.6
14.4
50.
1194
854
1634
8(Z
elln
eran
dD
elan
o,20
15)
301
0.82
9.83
23.3
90.
110
220
1727
8(Z
elln
eran
dD
elan
o,20
15)
311
1.74
11.3
710
.30.
0177
411
417
556
(Zel
lner
etal
.,20
09)
Rop
y2.
248.
1115
.90.
8580
015
1240
0(B
ogar
det
al.,
1994
;W
entw
orth
etal
.,19
94)

142
In addition, if fitting with all major oxides and Phosphorus (P), Thorium (Th),
and Uranium (U) for our 42 impact glass spherules, we found the estimated prove-
nances of all glass spherules are far away from a landing site. It should not be the case
for some local origin glass spherules because some glass spherules from the observed
data set in this study are geochemically similar to a local regolith samples. Although
this may be caused by a parameter over-fitting problem, it appears that using these
four chemical oxides is sufficient to characterize the provenance of a glass spherule.
We noted that the provenance characterization of using only four chemical oxides
may seem simple in comparison to the source crater identification of microtektites, a
terrestrial analogue of lunar glass spherules. The source crater identification for mi-
crotektites uses a thorough analysis of major, trace elements and isotopes for target
materials by which the source crater formed. However, the lunar surface compo-
sition is relatively straightforward. For example, the lunar nearside, where glass
spherules used in our study collected, is dominated by KREEP signature while the
lunar farside is essentially free of KREEP except for South Pole-Aitken (Jolliff et al.,
2000). Although the measurements of Th and U for these fifteen lunar glass spherules
are unavailable, the measurements of potassium oxide (K2O) must be performed for
40Ar/39Ar-derived ages of glass spherules. Based on our provenance analysis, we sug-
gest that the abundance of K2O may be a potential candidate for distinguishing the
origin of a glass spherule from a lunar surface.
One may also concern the chemical volatility of potassium element. Because
potassium is considered moderately-volatile, its abundance would have been reduced
by cratering-related process, such as bubble striping due to a high acceleration and
diffusion from interacting with impact vapor (Folco et al., 2010b; Folco et al., 2010a;
Melosh and Artemieva, 2004; Moynier et al., 2010). In fact, the abundance of K2O
for Australasian microtektites decreases with increasing distance from a proposed
source crater (Folco et al., 2010b; Folco et al., 2010a). We neglected any reduction
of potassium oxides by cratering process because the amount of impact vapor as well
as acceleration rate on Moon are not as large as they are on Earth.

143
Our calculation result shows that seventeen out of our compiled 42 impact glass
spherules including three new spherules can match the derived LP-GRS surface map
within 2 pixels (<150 km), suggesting a local origin for those 17 spherules. On the
other hand, twenty-five glass spherules are suggestive of exotic origin. Only fifteen
impact glass spherules are possibly a representative of 15 independent impact events.
For example, spherules 455 and 207 show a similarity in ages and geochemistry data
(almost overlapped in ternary diagram). Table 5.1 shows the estimations of the
nearest distance for the provenance of those fourteen spherules. The NODs of majority
of exotic spherules (10 out of 15) are >500 km away from the landing site. Only two
glass spherules are truly highland-derived (spherules 14 and 311), but many of them
appear to originate in highland/mare boundaries (Zellner et al., 2003). It suggests
the composition of glass spherules is nearside-origin that highland and mare basalt
materials are well-mixed.
Regarding the specific provenance of our calculation result, several estimated
provenances are associated with rayed craters. For example, spherules 505 and 438
are estimated to come from Mosting Crater (26 km in diameter); spherule 505 has
an age around 820 Ma, and the age of spherule 438 is 254 Ma. Spherule 493 is close
to Crater Triesnecker (26 km in diameter), appearing to be a rayed crater. The age
of spherule 493 is 404 Ma. Mosting and Triesnecker Craters are about 60 radii from
the Apollo 16 landing site. Spherule 165 collected from Apollo 14 landing site is
close to a fresh, unnamed rayed crater. The diameter of this crater is ∼12 km, and
∼25 radii away from the Apollo 14 landing site. The age of spherule 165 is 345 Ma.
Spherule 530 is close to Dionysius Crater, 17 km in diameter, that develops a dark
ray pattern (Giguere et al., 2006). The age of spherule is 102 Ma. Dionysius Crater
is 40 radii from Apollo 16 landing site. Spherule 7 from Apollo 14 landing site is close
to Herigonius Crater (15 km in diameter), appearing to be a faint rayed crater. The
age of spherule 7 is 45 Ma. It is unlikely since 45 Ma old crater would have prominent
rays.
144
We considered how plausible all our compiled 800 Ma-old exotic glass spherules
could have formed from melting subsurface materials of Copernicus Crater. To inves-
tigate this question, we compiled the samples that could best represent Copernicus
Craters melts and its subsurface lithology. Apollo 12 mare basalts, soils, ropy glasses,
KREEP melt breccias (KREEP glass fragments, Apollo 12 gray-mottled breccias
and Imbrium-like melt breccias), and highland like materials serve as representatives
of melts and subsurface lithology of Copernicus Crater (Figure 5.2). Those sam-
ples provide a constraint to the mixing ratio of subsurface materials upon melting
during the formation of Copernicus Crater. First of all, the straightforward consid-
eration is about whether any of our compiled 800 Ma-old exotic glass spherule could
match the Apollo 12 ropy glasses that are thought to have originated from Coperni-
cus Crater. The assignment of the origin location of Apollo 12 ropy glasses to the
Copernicus Crater is reasonable because the composition of ropy glasses falls within
one standard deviation of chemical oxide abundances for the center region of Coper-
nicus Crater. The match between the composition of Apollo 12 ropy glasses and the
spacecraft-derived compositions of center region of Copernicus Crater suggests a well
calibration data of LP-GRS performed by Prettyman and supports the Copernicus
Crater provenance for Apollo 12 ropy glasses. We found only spherule 505 shares a
similar origin of Apollo 12 ropy glasses and is ∼820 Ma-old. In addition, we noted
that the prescribed provenance for Apollo 12 ropy glasses points out a limitation of
Nearness of Distance method. The linear least squares method implemented with
the concept of Nearness of Distance is programmed to score the nearest pixel of the
abundance maps that satisfies the composition of a glass spherule, neglecting the
regions farther away from the center site that may also match the composition of a
glass spherule. For example, our estimate NOD for the origin location of Apollo 12
ropy glasses is 200 km, but the prescribed origin location of Copernicus Crater for
the ropy glasses is 400 km from Apollo 12 site.
Like Apollo 12 ropy glasses, Copernicus Crater-forming spherules must have de-
rived from the materials from its subsurface structure, in which the stratigraphy of

145
Copernicus Crater consists of local regolith, mare basalt, Imbrium Basin ejecta, and
pre-Imbrium megaregolith materials (Schmitt et al., 1967; McGetchin et al., 1973;
Pike, 1974; De Hon, 1979; Haskin et al., 2000; Jolliff et al., 2000; Gaddis et al., 2006).
Figure 5.2 shows the ternary diagram with the relative positions of all our exotic
glass spherules and representative samples for the stratigraphy of Copernicus Crater.
Regarding the members of the stratigraphy of Copernicus Crater, its youngest mem-
ber is local regolith and is represented by Apollo 12 regolith samples (Apollo 12 ropy
glasses and Apollo 12 KREEP glass fragments are also included in this category for
clarity) (Laul and Papike, 1980; Morris et al., 1983; Wentworth et al., 1994; Meyer
et al., 1971). Underneath the local regolith is relatively thin mare basalts (De Hon,
1979), in which their thickness and iron content inferred from Clementine UV/VIS
reflectance measurements on the crater walls of Copernicus Crater are suggested to
decrease from the southern wall to the northern wall of the crater interior (Pieters
et al., 1994). Four types of mare basalts collected from the Apollo 12 landing site in-
clude olivine, pigeonite, ilmenite, and feldspathic basalts (Papike et al., 1976; Rhodes
et al., 1977; Neal et al., 1994), assuming as a possible mare basaltic layer in the region
Copernicus Crater in this study. It is noteworthy that the low content of Ti in Apollo
12 mare basalts is consistent with the estimated abundance of Ti for Procellarum
Oceanus Terrane from Clementine UV/VIS camera (Lucey et al., 2000).
Imbrium Basin ejecta likely covered the majority of the lunar nearside, including
the region of Copernicus Crater (Haskin et al., 2000; Jolliff et al., 2000). Despite
an active debate regarding the association of a KREEP melt breccia with a specific
basin (e.g., Imbrium Basin) (James and Wright, 1972; Stoffler et al., 1985; Norman
et al., 2010; Merle et al., 2014), we avoided KREEP impact melt breccias, in par-
ticular collected from Apollo 15 and 17 landing sites due to a uncertainty on their
association with other basins (Deutsch and Stoffler, 1987; Stadermann et al., 1991;
Dalrymple and Ryder, 1993). We focused on the data of Apollo 14 and 16 KREEP
melt breccias that have been recommended in the literature for a possible candidate of
Imbrium Basin ejecta as our representative of Imbrium Basin ejecta layer underneath
146
the region of Copernicus Crater (Tera et al., 1974; Norman et al., 2010). Apollo 14
KREEP samples numbers include 14063, 14078, 14276, and 14310. Most importantly,
we specifically chose the data on the bulk composition of melt in a melt breccia. The
reason for this selection is that if those 800 Ma-old exotic glass were formed from the
substrate of Imbrium basin ejecta, the melting of Copernicus Crater forming event
would have homogenized this compositionally-heterogeneous substrate. This is rea-
sonable assumption for the case of impact-generated melt breccia because the matrix
(melt) that binds fragments were formed from melting local substrate materials. For
comparison, we also compiled the bulk chemical composition data of Apollo 16 low
Fra-Mauro KREEP (LFMK) melt breccia samples that are thought to be brought
from Imbrium Basin forming event (Korotev, 1994, sample No. are 60315, 62235,
65015, and 63355 in 1M and 1F types of Table 2). The 40Ar/39Ar-derived age mea-
surements for the sample 60315, 62235, and 65015 are similar to the proposed age
for Imbrium Basin, however, it is still challenging to tell whether or not those LFKM
melt breccias were produced by Imbrium Basin (Norman et al., 2006).
For the lowest member of stratigraphy of Copernicus Crater, the data of ferroan
anorthosites (FANs), feldspathic lunar meteorites, Mg-suite, and local Apollo 16 glass
spherules are considered. In general, Figure 5.2 shows that the compositions of ∼800
Ma-old exotic glass spherules lie in between Apollo 12 mare basalts and Apollo 16
local regolith. Despite the small number of our data, the composition of ∼800 Ma-old
exotic spherules uniformly spreads over a mare-like Apollo 12 site and a highland-like
Apollo 16 site, suggesting a continuous mechanical mixing and material transport
between the highland and mare over time (Huang et al., 2017). The provenance of
spherules 505 and 455 collected from Apollo 16 site are closer to the provenance of
Apollo 12 mare soils and ropy glasses. Specifically, spherules 505 and 455 including
Apollo 12 soils and ropy glasses are of high KREEP Fra Mauro affinity (HKFM)
(Naney et al., 1976; Ridley et al., 1973; Zeigler et al., 2004) that is thought to be
exotic to Apollo 16 landing site (Zellner et al., 2003). The provenance of spherule 311
collected from Apollo 17 landing site lies in between the provenances of very low-Ti
147
(VLT) mare basaltic fragments found at Apollo 17 landing site and Apollo 12 mare
basalts, suggesting a mare origin. The abundance of very low-Ti mare basalts in
Apollo 17 landing site (present in lithic fragments instead of whole rocks) is scarce
but not uncommon at the lunar surface (e.g., Mare Imbrium) (Vaniman and Papike,
1977; Giguere et al., 2000). Either Apollo 17 very low Ti basalt-origin or Apollo 12
mare basalt-origin suggest the exotic origin of spherule 311. The direct comparison of
major element and trace elements (Na2O and K2O) between spherule 311 and Apollo
17 VLT mare basalt and Apollo 12 mare basalts shows that the contents of Na2O
and K2O of spherule 311 are lower than Apollo 17 VLT and Apollo 12 mare basalts,
but the content of TiO2 in the spherule 311 is higher than the content of TiO2 of
Apollo 17 VLT basalts and lower than the content of TiO2 of Apollo 12 mare basalts.
The provenance of spherule 8 is near to the provenance of our compiled Imbrium-like
KREEP melt breccia. However, the amount of FeO of spherule 8 (15 wt%) differs
from the contents of average Apollo 14 KREEP melt breccias (5-9wt%). Spherule 14
is evidently highland-origin; its provenance is closer to the provenance of feldspathic
lunar meteorites. Finally, the provenances of spherules 90 and 191 is challenging to
be interpreted; the spherule 191 appears to closer to the mare and highland mixing
boundary as show in Figure 5.2.
Lastly, we noted that a particular set of Apollo 12 samples, gray-mottled KREEP
breccias (Anderson Jr et al., 1971) or light-colored particles (Meyer et al., 1971;
Marvin et al., 1971), shows a wide range of variation in ternary compositions (Figure
5.2). Those gray-mottled KREEP breccias (Anderson Jr et al., 1971) also sometimes
refer to orthopyroxene-plagioclase assemblage that are commonly attached to Apollo
12 ropy glasses (yellow-brown glasses) (Meyer et al., 1971) or Type A norite-anorhosite
(Wood, 1972). The gray-mottled KREEP breccias must be brought from a cratering
event because the anorthositic origin is evidently exotic to Apollo 12 site. Gray-
mottled KREEP breccias attached to brown-yellow glasses are suggested to have
not recrystallized and remained pristine mineral textures but assembled by a violent
excavation of coarse-grained anorthositic bedrock, possibly Imbrium event (Marvin
148
et al., 1971). Because inclusions in Apollo 12 ropy glasses are noritic and basaltic
in nature, Marvin suggested the mixture of both materials (gray-mottled materials
and mare basalts) form ropy glasses from Copernicus Crater event. Figure 5.2 shows
that Apollo 12 ropy glasses and Apollo 12 KREEP glass fragments have a narrow
variation in ternary compositions than gray-mottled KREEP breccias. Although
the composition of our compiled 800 Ma-old exotic spherules fall in between our
prescribed stratigraphy of Copernicus Crater, it is challenging to reconcile with a
seemingly small amount of mixing between our prescribed substrate materials for
the region of Copernicus Crater. Overall, it appears that each of our compiled 800
Ma-old exotic spherules is better to be described by a specific substrate that is used
to model the stratigraphy of Copernicus Crater without invoking a mixing process
between different substrate materials.
5.3 Materials and Methods
One of our ultimate goals in this study is to see that under a constant impact rate
how prominent an impact record that contains our hypothetical spherule population
is compared to an impact record without this population. In the following Materials
and Methods section, we investigated if Copernicus Crater-forming event and possi-
ble sesquinary craters could contribute to some portion of “exotic” glass spherules.
The fraction of those sesquinary-forming glass spherules would determine if Coper-
nicus Crater-forming sesquinary craters can make up the abundance of ∼800 Ma-old
“exotic” glass spherules seen in Apollo regolith samples. If too small, it suggests
the excess of ages at ∼700-900 Ma of “exotic” glass spherules may be predominantly
produced by primary craters. If primary craters are responsible for the excess of
ages of ∼700-900 Ma-old exotic glass spherules, it may imply an increase in a lunar
impact flux over the last 1 Ga. Furthermore, the coincidence of the formation age
of Copernicus Crater and ∼700-900 Ma-old ages from exotic glass spherules can be
clarified.
149
In order to obtain a reasonable model for our hypothetical glass spherule popu-
lation of Copernicus Crater sesquinaries, we generated the size frequency distribu-
tion (SFD) of a possible Copernicus Crater’s sesquinaries and then adopted some
assumptions to estimate the production of melt and glass spherules. Using two in-
dependent sets of models, an impact fragmentation code, SALES 2, (Melosh et al.,
1992; Head et al., 2002; Elliott and Melosh, 2018) and an N-body orbit dynamics,
REBOUND, (Rein and Liu, 2012), allow us to obtain a plausible SFD of Copernicus
Crater’s sesquinaries (see Section 5.3.1). Given that the size and ejection velocity of
fragments are relatively known, we can approximate a glass spherule production of a
sesquinary crater. Assume the sesquinary craters, on the order of hundreds of meters,
are a low velocity impact formed in a porous target. Melt production in low velocity
impact and porous target is still a work in progress, yet we applied knowledgeable con-
straints from the literature to the production of our hypothetical sesquinary-forming
glass spherule (see Section 5.3.2). Indeed, our calculation shows a negligible fraction
of Copernicus Crater-forming sesquinary craters are able to produce melt. Such a
negligible amount of melt generated by Copernicus Crater-forming sesquinary craters
suggests that the source of excess of “exotic” glass spherules must be more than
Copernicus Crater-forming event, including its sesquinary craters if exists.
5.3.1 A possible size frequency distribution of Copernicus Crater-forming
sesquinary craters
To compute Copernicus Crater-forming sesquinary crater distribution, we ob-
tained the fraction of ejecta from Copernicus Crater that initially escapes the Moon
and later re-impacts the Moon (see Table 5.2) and estimated the total mass and num-
ber of ejecta fragments that become Copernicus Crater-forming sesquinary craters.
For the second estimation, we used a hybrid approach of the SALES 2 and iSALE
codes to estimate the total amount of escaped ejecta in terms of size frequency dis-
tribution of fragments (Elliott and Melosh, 2018). For a given location of a cell in
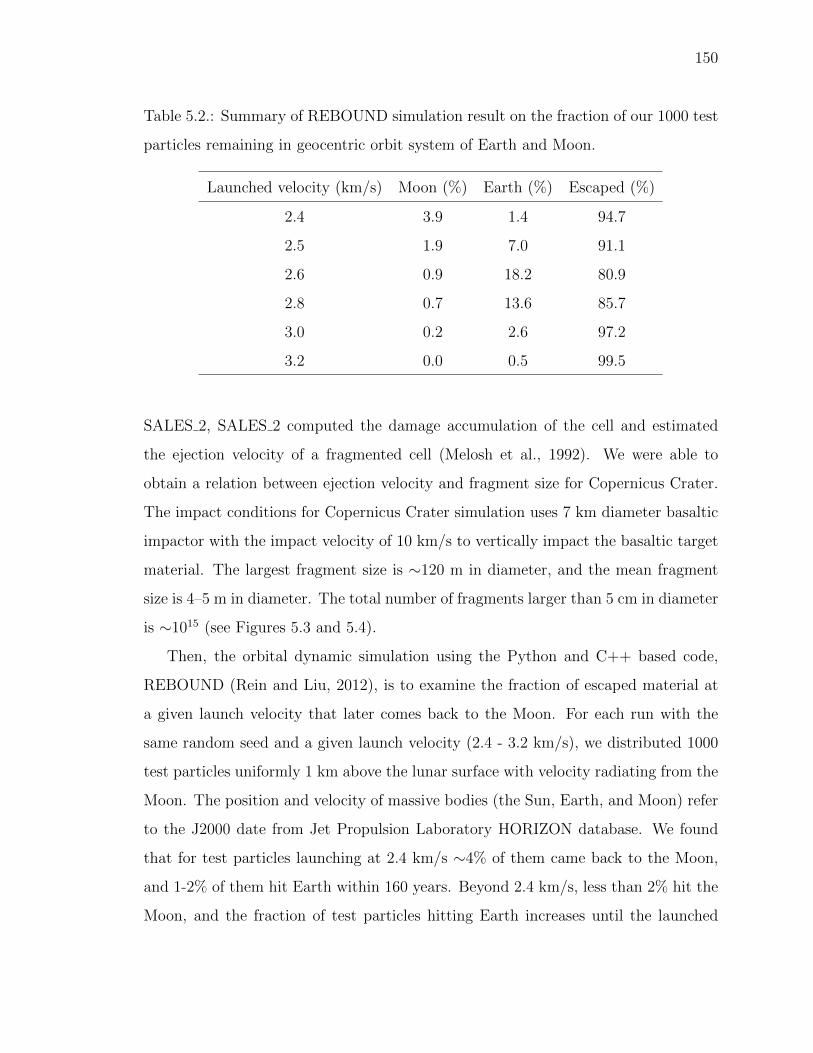
150
Table 5.2.: Summary of REBOUND simulation result on the fraction of our 1000 test
particles remaining in geocentric orbit system of Earth and Moon.
Launched velocity (km/s) Moon (%) Earth (%) Escaped (%)
2.4 3.9 1.4 94.7
2.5 1.9 7.0 91.1
2.6 0.9 18.2 80.9
2.8 0.7 13.6 85.7
3.0 0.2 2.6 97.2
3.2 0.0 0.5 99.5
SALES 2, SALES 2 computed the damage accumulation of the cell and estimated
the ejection velocity of a fragmented cell (Melosh et al., 1992). We were able to
obtain a relation between ejection velocity and fragment size for Copernicus Crater.
The impact conditions for Copernicus Crater simulation uses 7 km diameter basaltic
impactor with the impact velocity of 10 km/s to vertically impact the basaltic target
material. The largest fragment size is ∼120 m in diameter, and the mean fragment
size is 4–5 m in diameter. The total number of fragments larger than 5 cm in diameter
is ∼1015 (see Figures 5.3 and 5.4).
Then, the orbital dynamic simulation using the Python and C++ based code,
REBOUND (Rein and Liu, 2012), is to examine the fraction of escaped material at
a given launch velocity that later comes back to the Moon. For each run with the
same random seed and a given launch velocity (2.4 - 3.2 km/s), we distributed 1000
test particles uniformly 1 km above the lunar surface with velocity radiating from the
Moon. The position and velocity of massive bodies (the Sun, Earth, and Moon) refer
to the J2000 date from Jet Propulsion Laboratory HORIZON database. We found
that for test particles launching at 2.4 km/s ∼4% of them came back to the Moon,
and 1-2% of them hit Earth within 160 years. Beyond 2.4 km/s, less than 2% hit the
Moon, and the fraction of test particles hitting Earth increases until the launched
151
velocity reaches 2.6 km/s. Our calculations as shown in Table 5.2 are consistent
with the previous estimates (Gladman et al., 1995; Kreslavsky, 2017). For ejecta
launched at velocity larger than 3.2 km/s, the fraction of ejecta fell back to Moon is
neglected. With the fractions of escaped ejecta that fall back to Moon, the impactor
size frequency distribution for our model Copernicus Crater sesquinary craters can be
determined. We applied the fractions of escaped ejecta with different velocities from
REBOUND simulation to the size frequency distribution of fragments from SALES 2
simulation.
Figure 5.5 shows the sesquinary crater size frequency distribution for our model
Copernicus Crater-forming debris population. We used π–group scaling laws to
convert the mean fragment sizes that we combined REBOUND simulations with
SALES 2 simulation result to the crater sizes. For any given cell in our SALES 2
simulation, we can obtain the number of fragments and mean ejection velocity in a
cell. We counted the fragmented cells ejecting at above lunar escape velocity and
obtained an impact velocity distribution. When converting to a crater size, we ran-
domly drew from this impact velocity distribution. The range of the impact velocity
distribution is the same as the range of launched velocities for REBOUND simulation
(2.4 km/s - 3.2 km/s). It is reasonable to use the same launched velocity as the
re-impacted velocity of a test particle because we found the re-impacted velocities are
only few 10 m/s of difference of the initial launched velocity (we tested at least for the
100 test particles). An impact velocity is randomly drawn from the impact velocity
distribution constructed from the fraction of our 1000 test particles that re-impacted
the Moon. Our final size frequency distribution of Copernicus Crater’s sesquinary
craters is close to the total production of primary craters generated over 0.1 Ma us-
ing the Neukum Production Function, yet the SFD of craters >200 m in diameter
decreases rapidly. The impact rate caused by a possible Copernicus Crater-forming
debris is the number of ∼4 for craters >10 m in diameter over the area of 1 km−2
during tens of thousand years.

152
5.3.2 A possible glass spherule production of Copernicus Crater’s sesquinar-
ies
Considering orbital dynamics of Copernicus Crater-forming ejecta that escaped
the Moon, the remaining debris population that re-impacts the Moon appears equiv-
alent to the production of primary craters over 0.1 Ma under a constant impact rate.
Although the total number of sesquinary craters appears lesser than the total num-
ber of primary craters that have been generated over 800 Ma, it is still interesting
to see how this impact record affects a bombardment record generated by primary
crater-forming glass spherule populations. Regarding low impact velocity in the for-
mation of lunar sesquinary craters, we noted that the production of glass spherules
by sesquinary craters is highly variable.
Physical parameters of impact velocity and target properties are critical to de-
termine if an incipient melting during cratering process can occur. In principle, as
the impact velocity increases, the shock pressure intensifies. When a shock pressure
reaches a certain threshold, a melting occurs. This critical shock pressure of incipient
melting for a given material is of interest experimentally and theoretically. In ex-
perimental approach the measurement of critical shock pressure for incipient melting
was performed using a single crystal. The experimental critical pressure for a single
quartz crystal is 30 GPa. To our interest, the lunar surface and subsurface where tens
of meter sized sesquinary craters form should be porous. Porous target can lead shock
waves to decay faster, but as a result of collapse of pores within the material the shock
pressure was observed to exceed the initial pressure. Therefore, it has been suggested
that the critical pressure required for melting in a porous target is lower than the crit-
ical pressure melting non-porous materials (Wunnemann et al., 2008). Recently, the
laboratory experiment and meso-scale numerical simulation in a low pressure range
between 2.5 and 17.5 GPa in a dry, porous sandstone (20–30% of porosity) suggest
a reduction in a critical pressure for incipient melting (kowitz2013diaplectic). They

153
found initial melting occurs as low as 5 GPa, and up to 80 vol.% of glass is produced
when a shock pressure reaches 17.5 GPa.
We used planar impact approximation to estimate a peak pressure for impact
velocities in a range of 2.4 km/s and 3.2 km/s. Planar impact approximation assumes
an infinite slab with thickness equivalent to the diameter of a projectile impacts into a
half space of a target surface. Applying a linear relation between shock wave velocity
and particle velocity into Hugoniot’s conservation equations, the simplest solution of
a maximum shock pressure, assuming the same density of target and projectile, can
be obtained (Melosh, 1989, Section 4.5), P0,
P0 = ρushup (5.3)
where the particle velocity, up = 12vimp, is the half of an impact velocity of a projectile,
the shock velocity, ush, is approximated by a linear relationship with the particle
velocity, ush = c + sup, in which the parameters of c and s are empirical-derived
constants. The constant, c, is the intersection value at y-axis of the Hugoniot’s curve
in the particle velocity and shock wave velocity space (the unit is m/s), and the
constant, s, is the slope of a roughly straight line between the particle velocity and
shock wave velocity. If a target is porous, shock wave velocity is slower than the shock
velocity in nonporous target for a given particle velocity. The constants of c and s for
a porous target are needed to derive from shock experiments. Guldemeister conducted
a series of numerical experiments to study the porosity effect on a reduction of shock
pressures. For their numerical samples with 20% of porosity and ∼1955–2297.0 kgm−3
of density (GULdemeister et al., 2013, Figure 12), the constant of c is estimated ∼500
m/s, and the constant of s is roughly 3.17. Although applying these constants that
were derived from shock experiments tested on terrestrial porous material to a lunar
surface may seem arbitrary, it only serves the first order approximation for estimating
melt and glass spherule production of our hypothetical sesquinary crater population.
154
Assuming a vertical impact, we obtained the maximum shock pressures of 11–20.4
GPa for the range of impact velocities between 2.4 and 3.2 km/s respectively.
If using the 30 GPa for criteria of incipient shock melting, none of our hypothetical
sesquinary craters can produce melts, as well as glass spherules. Yet, Kowitz reported
that up to 80% of melts was observed as the shock pressure applied to samples
reaches 17.5 GPa (Kowitz et al., 2013). We feel reasonable to investigate the case
where sesquinary craters were generated by the highest impact velocity, 3 km/s. For
this impact velocity, there is still a very small fraction of escaped ejecta, 0.2%, that
formed sesquinary craters. For impact velocity smaller than 3 km/s, a larger fraction
of escaped material came back and hit the Moon but considering the inefficiency of
melt production we neglected the escaped material ejected at <3 km/s. We calculated
a conservative melt volume from a volume that is shocked from peak pressure (18.1
GPa) to the pressure of 17.5 GPa using a semi-analytical Gamma model for estimating
the decay of shock pressure (decay exponent is -2.85),
17.5GPa = 18.1GPa
(r
rimp
)−2.85(5.4)
where rimp is the radius of a projectile, and r is the distance from the radius of a
projectile to a point where the pressure of 17.5 GPa is reached. In fact, the thickness
of shocked volume between 17.5 GPa and 18.1 GPa is ∼ 1% of a projectile’s radius.
The exponent of -2.85 yields a faster decay of shock pressures, derived from fitting
numerical shock pressure data in CTH and iSale simulations (Pierazzo et al., 1997;
Monteux and Arkani-Hamed, 2016; Ruedas, 2017).
More importantly, the form of impact-generated melts produced by these low
impact velocity sesquinary craters may not be melt droplets (glass spherules) even
though the impact velocity of 3 km/s can produce melts. To investigate whether
melts, forming in a porous surface, low impact velocity, is as the same as glass
spherules produced by hypervelocity impact, we estimated the ejection velocity dis-
tribution of possible sesquinary-forming melts. Ejection velocity of impact-generated
155
melt products are critical; because melts behave like a liquid, for a high traveling
speed the liquid breaks up to minimize its surface tension energy. In the field ob-
servation, it appears that the shapes and sizes of impact-generated melt products
vary as a function of distance from where they were collected. For example, for
a sufficiently large crater, the melt body partially filled up the cavity of a crater,
and individual melt products with the range of sizes from centimeters to microns
are common through ejecta deposits. An empirically-derived model primarily based
on terrestrial melt products suggests a linear relationship between the sizes of melt
products and the distances where melt products were collected from the center of a
crater; the larger the melt products the nearer the distance to the center of a crater
(Huang et al., 2018). They found lunar impact glass spherules are most efficiently to
be produced at distances beyond 20 radii from a crater’s center.
Assuming sesquinary craters formed in a porous surface, the porosity of a target
surface can be a significant contributor to reduction in ejection velocity, therefore
leading a slower ejecta upon a crater excavation. We adopted an equation derived
empirically from π-group scaling laws and experiment work of Housen and Holsapple
on weakly cemented basalts (porosity is 20%) (Housen and Holsapple, 2011, Table 3),
vej = C1vimp
[r
rimp
(ρtρimp
)ν]−1/µ(5.5)
where vej is the ejection velocity of ejecta generated by a sesquinary crater-forming
event, C1, ν, and µ are constants determined from experiments for weakly cemented
basalt, 0.18, 0.4, and 0.46 respectively. Assume the same density for a projectile and
a lunar surface, impact velocity of 3 km/s, the maximum ejection velocity, 540 m/s
(C1vimp), occurs where ejecta is close to the edge of a projectile; this region is also
where the most of melts is produced. Due to a low impact velocity, the generation
of impact vapor appears implausible but the ejection velocity of melts within the
distance of 1% of a projectile’s radius from the impact center ranges in 526 and 540

156
m/s. This further suggests that those melts are likely in the form of melt droplets
regardless of scarcity of possible glass spherules.
5.4 Results and Discussion
Ultimately, we are interested in how the total abundance of glass spherules for
this hypothetical sesquinary crater population across the lunar surface is compared
with the abundance of glass spherules generated by primary craters. Assuming the
shocked zone between 17.5 GPa and 18 GPa is melted (see Eq. 5.4), the fraction of
our defined melted zone should be ejected considering a residual particle velocity as a
consequence of shock rarefaction (Melosh, 1985). Using Maxwell Z-model, the volume
of ejected melts where a thin-shell shocked volume overlaps with an excavation flow
can be analytically estimated. Previous empirical data on the spatial distribution
of terrestrial microtektites suggests ejected melts at such distances (∼150 km) for
sub-km sized craters are likely to be in the form of glass spherules. We considered
fragment larger than 5 cm that were ejected at the velocity ranging from 2950 to
3050 m/s and re-impacted to the Moon; we set 5 cm as the cutoff size of fragments
to converse mass from our SALE 2 simulation result.
In addition, we took into account the impact angle on the fraction of sesquinary
craters launched from 2950 to 3050 m/s in terms of melt production. We considered
only sesquinary craters that produce peak pressure higher than a critical pressure for
melting in the 20% porosity of target. The total volume of glass spherules according
to our definition for this population is ∼1200 m3. If we average this total glass
spherule volume over the lunar surface, the number density of glass spherules with
the prescribed size of 200 µm in diameter per meter square is less than one spherule.
Regarding the abundance of our defined glass spherule generated by primary craters
under a constant impact rate, we used the root mean squared value of impact velocity
for Moon, 18.3 km/s (Yue et al., 2013), and 45◦ of impact angle for all impactor larger
than 5 cm in diameter (hard rock scaling law for transient crater size estimates: µ
157
= 0.55, ρ=2500 km/m3). We found that the volume of our defined glass spherules is
∼134 m3 for 3 years-long impact bombardment across the lunar surface. For 3 years
under Neukum Production Function, the lunar surface received one largest crater
with the size of ∼50 m in diameter.
Regarding the relative contribution of sesquinary craters to “exotic” glass spherules,
only a negligible fraction of 0.1 Ma-long bombardment of sesquinary craters produce
melts. The total amount of sesquinary-forming glass spherules is approximately the
total abundance of glass spherules produced by 3 year-long bombardment resulting
from impactor population with diameter of >5 cm. Based on this estimate, our
sesquinary-forming glass hypothesis is considered unsatisfying because it conflicts
with each of our three main observational constraints. For the first observational
constraint, we demonstrated that the origin locations of our compiled fifteen “exotic”
glass spherules are at least few hundred kilometers away from where regolith sample
were collected. Take 200 km at face value, the largest diameter of sesquinary craters
from the results of SALES 2 and REBOUND simulations, 500 m, is 800x crater radii
away from a collection site. At this far distance, the ejecta thickness for ∼500 m sized
crater in diameter is estimated roughly 1 µm using an empirical power law relation
between ejecta thickness and radial distance from a crater center (McGetchin et al.,
1973). The distribution of glass spherules for the majority of sesquinary craters (∼10
m - 100 m) remains much more localized than sub-kilometer sized sesquinary craters.
If exists, the origin of the majority of sesquinary-forming spherules is considered local.
Thus, at the first glance, the Copernicus Crater-forming sesquinary craters cannot
be responsible for the excess of ages of ∼700-900 Ma measured from “exotic” glass
spherules.
Even though our hypothetical Copernicus Crater sesquinary-forming spherules are
expected to be not exotic initially, our second and third observational constraints raise
a possibility that those sesquinary-forming spherules may become exotic during an 800
Ma-long post-Copernican bombardment. If sesquinary-forming spherules from Coper-
nicus Crater event were sufficient, one cannot neglect the impact-driven transport
158
process of spherules during a post-Copernican bombardment. A complex exposure
history of cratered materials is common at a lunar surface as revealed from returned
lunar samples. For example, the Apollo 14 regolith breccia sample, 14315, contains
multiple generations of microbreccia with varying abundance of KREEP material
from highland basalt to high KREEPy (Wentworth and McKay, 1991). However,
as the impact velocity that forms sesquinary craters is much lower than heliocentric
velocity for primary crater population (almost one magnitude order larger from the
lunar escape velocity), the primary crater-forming spherules outnumber sesquinary-
forming spherules. If the simplifying assumptions for the estimate of melt production
are correct, our sesquinary hypothesis also cannot satisfy the second and third obser-
vation constraints. As a consequence of unsatisfying explanations, the excess of ages
of ∼700-900 Ma for “exotic” glass spherules may remain puzzling. Under a particular
scenario of Copernicus Crater-forming sesquinary craters we proposed in this study,
we minimally clarified the concurrence of the formation age of Copernicus Crater and
the excess of ∼700-900 Ma ages of “exotic” glass spherules.
Our result does not support that Copernicus Crater-forming sesquinary crater
contributes to the excess of 800 Ma-old “exotic” glass spherules. This finding may
be reasonable because we did not see an excess of ages at ∼100 Ma that coincides
with the proposed formation age of Tycho Crater. A younger, similar sized Ty-
cho Crater (85 km in diameter) would produce a sufficient amount of ejecta debris
like Copernicus Crater. If Copernicus Crater-forming sesquinary craters are efficient
at producing glass spherules that contribute to observed 800 Ma-old “exotic” glass
spherules, Tycho Crater sesquinary craters should do the same. Because our compiled
40Ar/39Ar-derived age distributions of “exotic” glass spherule only spike at ∼800 Ma,
not 100 Ma, it suggests that either we have an insufficient number of samples to
address this inconsistency or physical properties of target surfaces where Copernicus
Crater and Tycho Crater formed are different, or sesquinary-froming glass spherules
generated from craters as large as ∼100 km in diameter are negligible. From our
study, the abundance of sesquinary-forming glass spherules on Moon is suggested to

159
be negligible, at least for the size of Copernicus Crater, due to a low impact ve-
locity of lunar escape velocity. However, for larger terrestrial planets such as Mars
the martian escape velocity of 5 km/s is readily for incipient melting (Wunnemann
et al., 2017). With more production of impact melts, the ejected volume of impact
melts also increases. Thus, the abundance of post-cratering induced glass spherules
on other celestial bodies, such as Mars, may not be neglected.
Possibly, Copernicus Crater-forming event alone may be sufficient to explain the
excess of ∼700-900 Ma ages of “exotic” glass spherules. Considering a Copernicus
Crate ray passing through the region of Apollo 12 landing site, it is expected that
we have sampled Copernicus Crater-forming melt products (Apollo 12 ropy glasses).
As slaggy, ropy glasses with mm-to-cm sizes predominate in the Apollo 12 landing
site relative to other Apollo landing sites, the glass spherule population of Coperni-
cus Crater-forming event may be also present at a lunar surface. The glass spherule
population of Copernicus Crater-forming event have not been reported yet. Interest-
ingly, our provenance analysis for the average composition of Apollo 12 ropy glasses
(Wentworth et al., 1994, Table 4) match with the chemical oxide abundances within
one standard deviation that are obtained from the center region of Copernicus Crater
acquired from Lunar Prospector Gamma-Ray Spectrometer. We compared the com-
position of each of our compiled thirty-four glass spherules to the spacecraft-measured
composition of center region of Copernicus Crater (within one standard deviation).
Among ∼700-900 Ma-old exotic glass spherules, we found spherule 505 from Apollo 16
landing site is potentially a candidate for Copernicus Crater-forming glass spherules.
If the glass spherule 505 were generated by Copernicus Crater-forming event, this
reduces the magnitude of relative impact probability at ∼700-900 Ma from 6 impacts
to 5 impacts. We also investigated how mixing prescribed substrate materials under-
neath the region of Copernicus Crater can account for the compositional diversity of
∼800 Ma-old glass spherules. Unfortunately, we were unable to draw a conclusion
due to the lack of understanding in the formation of impact glass spherules under the
condition of a heterogeneous target surface (e.g., Copernicus Crater).
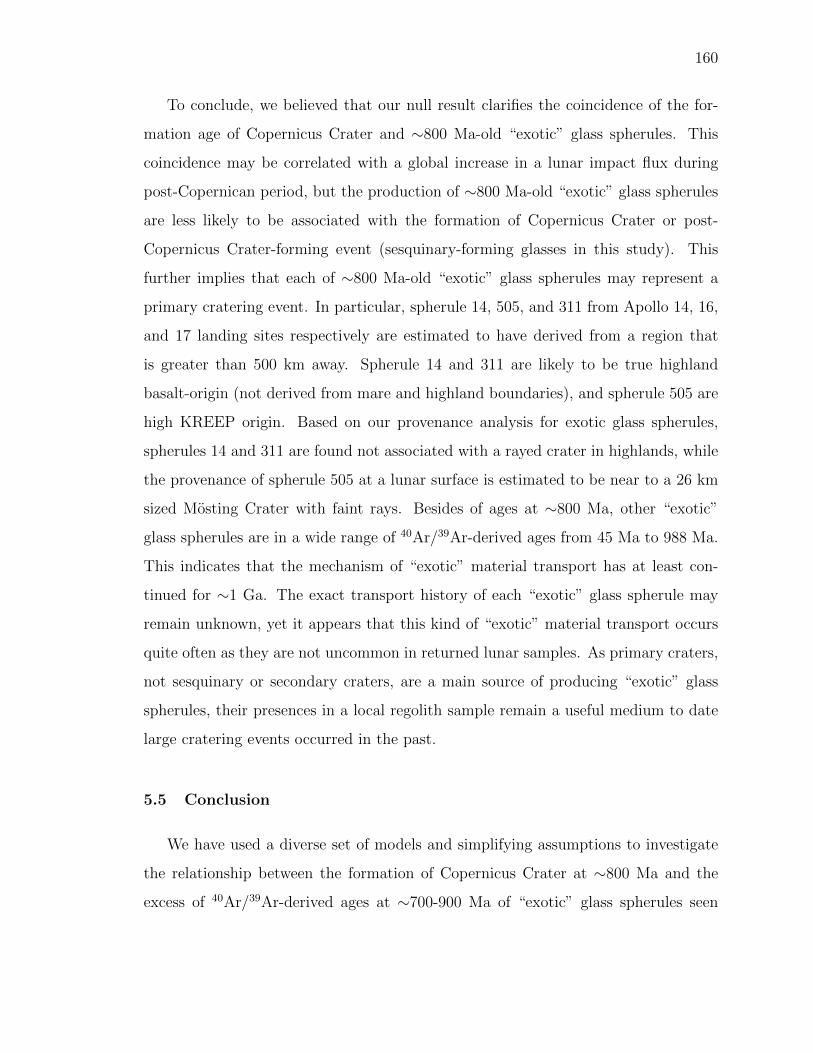
160
To conclude, we believed that our null result clarifies the coincidence of the for-
mation age of Copernicus Crater and ∼800 Ma-old “exotic” glass spherules. This
coincidence may be correlated with a global increase in a lunar impact flux during
post-Copernican period, but the production of ∼800 Ma-old “exotic” glass spherules
are less likely to be associated with the formation of Copernicus Crater or post-
Copernicus Crater-forming event (sesquinary-forming glasses in this study). This
further implies that each of ∼800 Ma-old “exotic” glass spherules may represent a
primary cratering event. In particular, spherule 14, 505, and 311 from Apollo 14, 16,
and 17 landing sites respectively are estimated to have derived from a region that
is greater than 500 km away. Spherule 14 and 311 are likely to be true highland
basalt-origin (not derived from mare and highland boundaries), and spherule 505 are
high KREEP origin. Based on our provenance analysis for exotic glass spherules,
spherules 14 and 311 are found not associated with a rayed crater in highlands, while
the provenance of spherule 505 at a lunar surface is estimated to be near to a 26 km
sized Mosting Crater with faint rays. Besides of ages at ∼800 Ma, other “exotic”
glass spherules are in a wide range of 40Ar/39Ar-derived ages from 45 Ma to 988 Ma.
This indicates that the mechanism of “exotic” material transport has at least con-
tinued for ∼1 Ga. The exact transport history of each “exotic” glass spherule may
remain unknown, yet it appears that this kind of “exotic” material transport occurs
quite often as they are not uncommon in returned lunar samples. As primary craters,
not sesquinary or secondary craters, are a main source of producing “exotic” glass
spherules, their presences in a local regolith sample remain a useful medium to date
large cratering events occurred in the past.
5.5 Conclusion
We have used a diverse set of models and simplifying assumptions to investigate
the relationship between the formation of Copernicus Crater at ∼800 Ma and the
excess of 40Ar/39Ar-derived ages at ∼700-900 Ma of “exotic” glass spherules seen
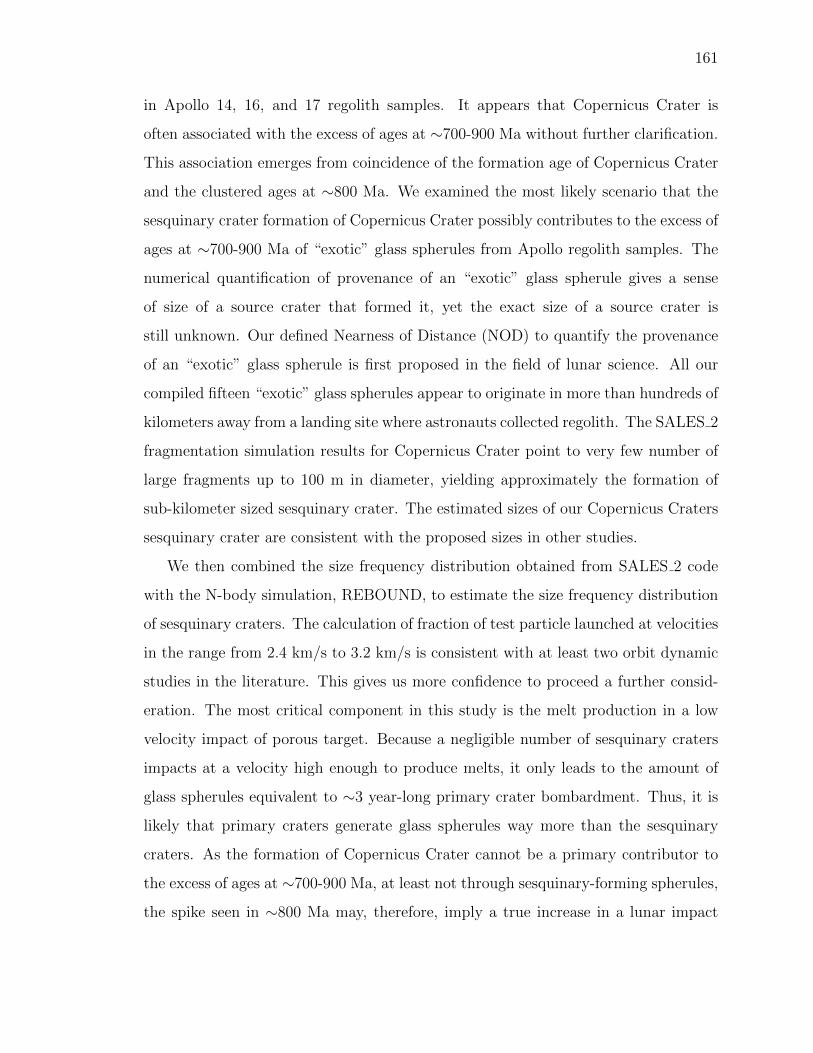
161
in Apollo 14, 16, and 17 regolith samples. It appears that Copernicus Crater is
often associated with the excess of ages at ∼700-900 Ma without further clarification.
This association emerges from coincidence of the formation age of Copernicus Crater
and the clustered ages at ∼800 Ma. We examined the most likely scenario that the
sesquinary crater formation of Copernicus Crater possibly contributes to the excess of
ages at ∼700-900 Ma of “exotic” glass spherules from Apollo regolith samples. The
numerical quantification of provenance of an “exotic” glass spherule gives a sense
of size of a source crater that formed it, yet the exact size of a source crater is
still unknown. Our defined Nearness of Distance (NOD) to quantify the provenance
of an “exotic” glass spherule is first proposed in the field of lunar science. All our
compiled fifteen “exotic” glass spherules appear to originate in more than hundreds of
kilometers away from a landing site where astronauts collected regolith. The SALES 2
fragmentation simulation results for Copernicus Crater point to very few number of
large fragments up to 100 m in diameter, yielding approximately the formation of
sub-kilometer sized sesquinary crater. The estimated sizes of our Copernicus Craters
sesquinary crater are consistent with the proposed sizes in other studies.
We then combined the size frequency distribution obtained from SALES 2 code
with the N-body simulation, REBOUND, to estimate the size frequency distribution
of sesquinary craters. The calculation of fraction of test particle launched at velocities
in the range from 2.4 km/s to 3.2 km/s is consistent with at least two orbit dynamic
studies in the literature. This gives us more confidence to proceed a further consid-
eration. The most critical component in this study is the melt production in a low
velocity impact of porous target. Because a negligible number of sesquinary craters
impacts at a velocity high enough to produce melts, it only leads to the amount of
glass spherules equivalent to ∼3 year-long primary crater bombardment. Thus, it is
likely that primary craters generate glass spherules way more than the sesquinary
craters. As the formation of Copernicus Crater cannot be a primary contributor to
the excess of ages at ∼700-900 Ma, at least not through sesquinary-forming spherules,
the spike seen in ∼800 Ma may, therefore, imply a true increase in a lunar impact

162
flux in the last 800 Ma. Considering high uncertainties in our model, our conclusion
may be elusive, but we hope to devote our understanding to the possibility of a global
impact spike in the most recent lunar impact history.
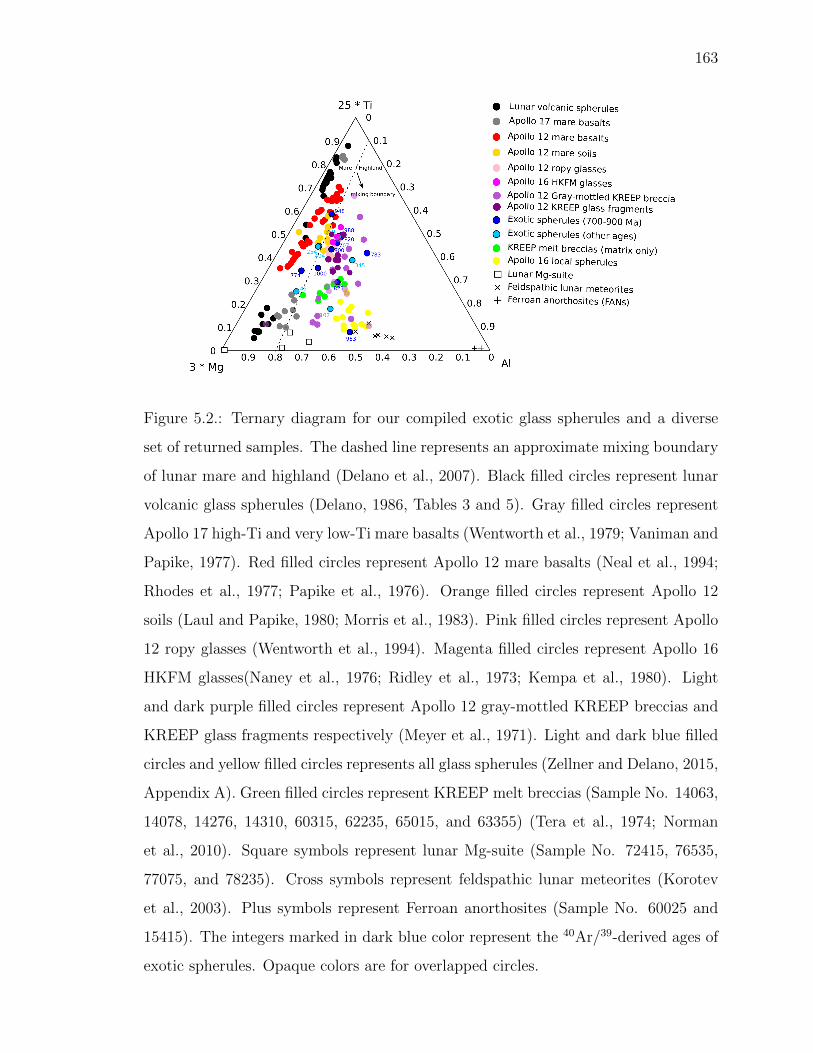
163
0.9 0.8 0.7 0.6 0.5 0.4 0.3 0.2 0.1 0
0.9
0.8
0.7
0.6
0.5
0.4
0.3
0.2
0.1
0
0.9
0.8
0.7
0.6
0.5
0.4
0.3
0.2
0.1
0
3 * Mg Al
25 * Ti
Apollo 12 mare basalts
Lunar volcanic spherules
Apollo 17 mare basalts
Apollo 12 mare soils
Apollo 12 ropy glasses
Apollo 16 HKFM glasses
Exotic spherules (other ages)
Exotic spherules (700-900 Ma)
KREEP melt breccias (matrix only)Apollo 16 local spherules
Lunar Mg-suite
Feldspathic lunar meteoritesFerroan anorthosites (FANs)
Mare / Highland
mixing boundary Apollo 12 Gray-mottled KREEP brecciaApollo 12 KREEP glass fragments
774
800
820707
988
1000
825
783
983
948
559
345
102
45
254404
Figure 5.2.: Ternary diagram for our compiled exotic glass spherules and a diverse
set of returned samples. The dashed line represents an approximate mixing boundary
of lunar mare and highland (Delano et al., 2007). Black filled circles represent lunar
volcanic glass spherules (Delano, 1986, Tables 3 and 5). Gray filled circles represent
Apollo 17 high-Ti and very low-Ti mare basalts (Wentworth et al., 1979; Vaniman and
Papike, 1977). Red filled circles represent Apollo 12 mare basalts (Neal et al., 1994;
Rhodes et al., 1977; Papike et al., 1976). Orange filled circles represent Apollo 12
soils (Laul and Papike, 1980; Morris et al., 1983). Pink filled circles represent Apollo
12 ropy glasses (Wentworth et al., 1994). Magenta filled circles represent Apollo 16
HKFM glasses(Naney et al., 1976; Ridley et al., 1973; Kempa et al., 1980). Light
and dark purple filled circles represent Apollo 12 gray-mottled KREEP breccias and
KREEP glass fragments respectively (Meyer et al., 1971). Light and dark blue filled
circles and yellow filled circles represents all glass spherules (Zellner and Delano, 2015,
Appendix A). Green filled circles represent KREEP melt breccias (Sample No. 14063,
14078, 14276, 14310, 60315, 62235, 65015, and 63355) (Tera et al., 1974; Norman
et al., 2010). Square symbols represent lunar Mg-suite (Sample No. 72415, 76535,
77075, and 78235). Cross symbols represent feldspathic lunar meteorites (Korotev
et al., 2003). Plus symbols represent Ferroan anorthosites (Sample No. 60025 and
15415). The integers marked in dark blue color represent the 40Ar/39-derived ages of
exotic spherules. Opaque colors are for overlapped circles.
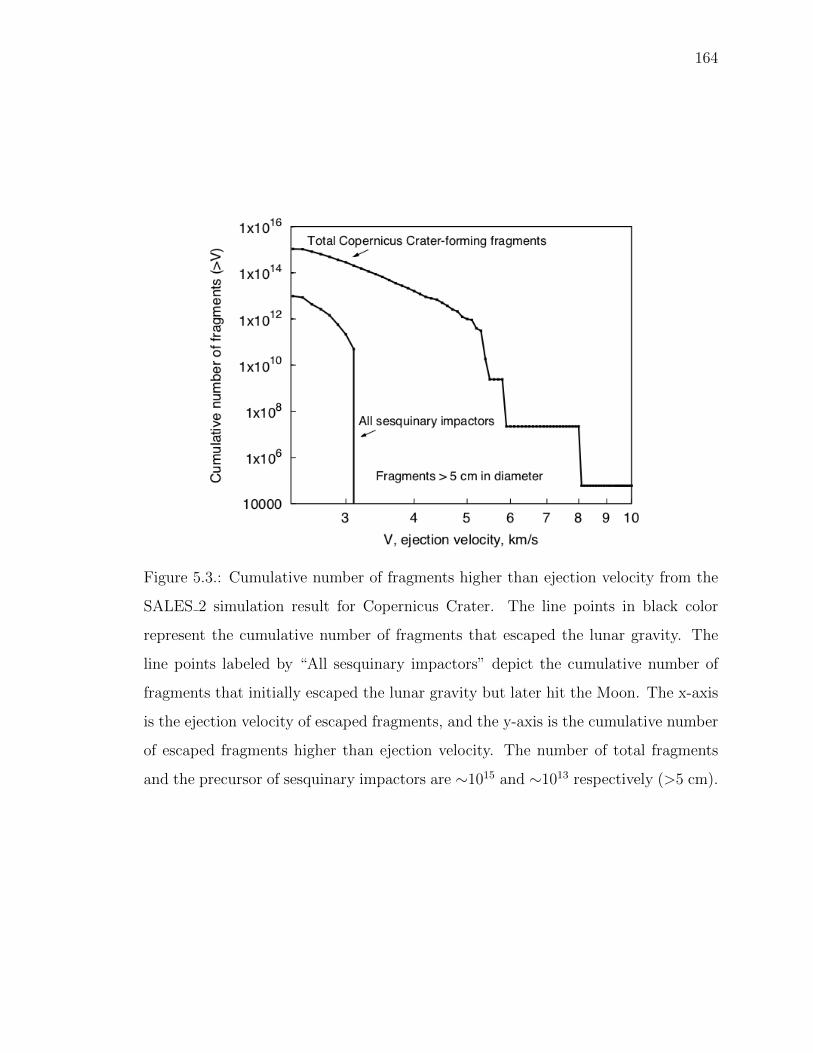
164
Figure 5.3.: Cumulative number of fragments higher than ejection velocity from the
SALES 2 simulation result for Copernicus Crater. The line points in black color
represent the cumulative number of fragments that escaped the lunar gravity. The
line points labeled by “All sesquinary impactors” depict the cumulative number of
fragments that initially escaped the lunar gravity but later hit the Moon. The x-axis
is the ejection velocity of escaped fragments, and the y-axis is the cumulative number
of escaped fragments higher than ejection velocity. The number of total fragments
and the precursor of sesquinary impactors are ∼1015 and ∼1013 respectively (>5 cm).

165
Figure 5.4.: Cumulative size frequency distributions (CSFD) of all Copernicus Crater-
forming sesquinary impactor fragments and sesquinary impactors launched at ∼3
km/s.

166
Figure 5.5.: Crater size frequency distributions (SFD) for Copernicus Crater-forming
sesquinary craters. The solid black lines from the top to the bottom show total crater
production of the lunar surface for 800 Ma, 10 Ma, 0.1 Ma, 50 years, and 1 year under
the Neukum Production Function (NPF). The line marked in blue color represent the
size frequency distribution of all sesquinary crtaters. The green line is sesquinary
crater SFD for ejection velocity of ∼3 km/s that we used the data of fragment sizes
from SALES 2 code as impactor sizes and velocity distribution and converted them to
crater sizes using π–group scaling laws. The red line is sesquinary crater population
that may form melt.
167
6 SUMMARY
The lunar samples returned to Earth provide some of our best data for understand-
ing Earth’s moon. The first soil samples from the Moon that were returned from the
Apollo 11 mission are fascinating because these samples reveal diverse mineralogy,
hinting at a variety of processes that have operated at the surface over a long period.
Impact cratering is one of the most important driving forces in the lunar surface evo-
lution; it continually altered the lunar surface over all of lunar history. In particular,
this persistent process allows us to investigate the changes in the impact flux in the
Solar System over time, as well as to study the physics of impact cratering. The
impact environment of the Moon can also hinder our understanding of the returned
lunar samples. Because the impactors vary in a wide range of sizes from microme-
teoroid impacts to basin formation, how to reliably address the makeup of a lunar
surface can be a challenging process to model.
In fact, the makeup of a lunar surface is more or less regolith layers that were
deposited by impact debris over the lunar impact bombardment history. For example,
the texture of the Apollo 15 drilling core has been interpreted as composed of ∼242
well-mixed layers with a thickness between a few millimeters to ∼13 cm. Each ejecta
layer depicts a unique history through its journey at the surface. Several models have
been proposed to capture the stochastic nature of impact cratering process, including
regolith accumulation, exposure history of regolith, and frequency of mixing process
driven by impacts. Those quantitative models tell us that more than few kilometer-
thick regoliths that have accumulated at a landing site, and the very topmost 1-
millimeter layer of a lunar surface has been impact-gardened more than few times
within one million years. Those models laid the groundwork for Monte Carlo typed
cratering process and awaited further computational advancement. The improved
168
understanding of impact cratering allowed us to numerically simulate the evolution
of the lunar landscape as it has been shaped by impact cratering process over time.
Cratered Terrain Evolution Model (CTEM), originally developed by Jim Richard-
son and modernized by David Minton, is a Monte Carlo code that can simulate the
topography of heavily cratered surface and track the number of countable craters over
time. The main effect of impact cratering that CTEM models is elevation changes of
the landscape throughout the excavation process of craters, the deposition of ejecta,
and the degradation by topographic diffusion and distal ejecta. However, the bulk of
Moon underneath the topography contains a stack of impact-generated ejecta layers
that carry a rich abundance of information, including composition and datable im-
pact products, such as impact glasses. Therefore, understanding how an individual
impact-generated ejecta sourced from varying depths of the subsurface is essential.
The end result needs to be calibrated with analysis of lunar samples, as well as remote
sensing data. In order to model the distribution of material with varying types in a
sample, I developed extensions to the CTEM code that can track all ejecta generated
during a simulation. The ultimate goal of this dynamic ejecta tracking system was
to mimic the complex history of the lunar regolith, and better understand what the
lunar sample collection tells us about the impact history of the Moon.
I tested the foundation of this dynamic ejecta tracking system using two different
aspects of material transport on the Moon, 1) binary composition (mare basalt and
highland anorthosite) and 2) impact glasses. First of all, the calibration data that
I used for this binary composition on the Moon is to constrain the bulk of impact-
generated ejecta over the most recent 3 billion years of impacts (more certain as
compared to early lunar impact bombardment). We looked into material transport
across mare and highland contacts; both remote sensing data and surface samples
provide a simple and well-calibrated data set. Correlations between abundances of
two end members (basalt and anorthosite) and distance from the contact shows a non-
linear mixing profile within the distance of 4-5 km from the contact. The non-linear
behavior across the contact is accounted for by the source of non-mare components.

169
For example, the excess of non-mare materials in mare soil samples that were collected
over 100 km from the contact is significant (up to 70%).
Examining an effect of impact-generated ejecta (distal ejecta versus proximal
ejecta) in a sample was limited until we had a better understanding of impact cra-
tering and available computation simulation. I set up a numerical experiment that
examined four related factors: 1) distal ejecta, 2) proximal ejecta, 3) cm-to-mm scaled
cratering, and 4) the spatial heterogeneity of distal ejecta. I demonstrated that distal
ejecta is critical to both the width of 4-5 km of non-linear mixing zones and the excess
of non-mare materials in observed soil samples. While a large portion of distal ejecta
with a high concentration of exotic materials is delivered to a local site, it is further
buried with pre-existing materials by cm-to-mm scale impact gardening.
Distal ejecta is spatially heterogeneous, due to being confined into ray structures.
My work showed that the spatial heterogeneity of distal ejecta may be the primary
reason for some soil samples that contain an anomalously high concentration of non-
mare materials even though they were collected far from mare/highlands contacts.
Impact-generated ejecta is concentrated into those relative narrow ray structures, so
an in-situ sample that is collected within a rayed region can contain materials with a
distinct composition than other local soil samples. The excess of exotic materials seen
in mare soils collected in over 100 km away from a mare/highlands contact may be
due to the samples being taken within the ray of a distant, large crater. The Apollo
12 landing site, where one of the discrepant soil samples was taken, is crossed by a
ray from Copernicus Crater.
As the binary component tracking system (mare and highland materials) driven by
impacts in CTEM produces a consistent result with remote sensed data and returned
lunar samples, we are more comfortable extend the work of the binary material track-
ing system to multiple component. Among impact-generated ejecta on the Moon, a
melt (glass) component inside the ejecta has been a fascinating subject for the age-
dating purposes. In particular, an impact glass spherule is considered as a direct
product of an impact event. As impact glass spherules are quite common in a lunar
170
soil, the data set from 40Ar/39Ar derived age measurements of impact glass spherules
is beneficial to understanding an abundance of a different type of lunar materials,
more importantly to the impact history of the Moon. In Chapter 4, we studied an
intriguing, common observation that were reported from at least four different re-
search groups (Culler, Levine, Hui, and Zellner). Several research groups found that
an excess of 40Ar/39Ar-derived ages of impact glass spherules have been generated
within the last 500 Ma. One interpretation suggests that more impacts occurred in
the last 500 Ma, producing relatively more young spherules than prior to 500 Ma.
Quantitative relative probability from age distributions of impact glass spherules im-
plies that the impact flux has increased by a factor of 2-3 during post-Copernican
period. Though this young spike seen in <500 Ma is no longer present after argon
diffusion correction for glass spherules has been made. This has been brought to our
attention that a sampling bias needs to be evaluated to the age distribution of impact
glass spherules. And the scenario that an impact flux has remained constant over the
last 3 Gy may still hold.
We cautioned that processes related to impact spherules can potentially induce
a bias. Those relevant processes we modeled are 1) their formation upon impact-
induced melting, 2) distribution during excavation stage, 3) transport and destruction
subject to subsequent impacts, and finally 4) sampling process by lunar astronauts.
It appears that each of those four process has some degree of uncertainty, as well
as observational constraints. The glassy nature of impact glass spherules indicates
that they originated in a region where intense heating and vaporizing occur and were
rapidly quenched in the space. As being quenched rapidly in the space it is suggestive
of a high initial ejection speed upon the creation of an impact glass spherule. In fact,
this information is consistent with observations on the distribution of microtektite
strewn fields, terrestrial analogue of lunar impact glass spherules, which were found
hundred-to-thousand kilometers away from a source crater. Another major uncer-
tainty is related to a sampling process performed by Apollo astronauts. We noted
that lunar soil samples were collected from a limited depth, on the order of a few

171
centimeters by the Apollo astronauts. The shallow depth together with the distribu-
tion and production of impact glass spherules determines how much it makes those
impact glass spherules available to the very topmost surface. I found that even if the
impact rate has remained constant over the last 3 Ga, I could reproduce the observed
age distribution of glass spherules using a simulated 10 cm sampling depth.
Following the glass spherule work, the final chapter of this dissertation continued
to work on another interesting observation: an excess of ∼700-900 Ma ages of “exotic”
impact glass spherules. A similar age of 800 Ma on a lunar chronology commonly
refers to the formation of Copernicus Crater. However, the concurrence of excess of
∼700-900 Ma ages and the formation age of Copernicus Crater has not been clari-
fied. We created a most likely scenario to understand how possible the Copernicus
Crater-forming event contributes to the excess of ∼700-900 Ma ages of “exotic” glass
spherules. The main scenario in this study is that Copernicus Crater forming event
generates sufficient amount of glass spherules. We first investigated the compositional
provenance of those ∼800 Ma-old exotic spherules by comparing with an extensive
data set of lunar returned samples that could potentially represent the stratigraphy of
Copernicus Crater region. Also, we have employed a fragmentation code (SALES 2),
orbit dynamic code (REBOUND), and planar impact approximation technique to
obtain the total abundance of sesquinary-forming spherules. We found this scenario
unlikely because of that 1) the ternary compositions of exotic spherules is contra-
dictory with mixing substrate materials assumed for Copernicus Crater region, and
2) lunar sesquinary craters produce a scarce amount of glass spherules due to its
moderately low impact velocity.
We noted that the origin of impact glass spherules is critical for future investiga-
tion. Assume that the composition of a glass spherule is representative of a fraction
of a lunar surface. We applied a linear least squares method to the chemical oxide
abundance maps acquired by Lunar Prospector Gamma-Ray Spectrometer for a given
composition of an impact glass spherule. This quantitative method returns the value
of a distance measured from the collection site to the estimate origin location that
172
matches the composition of an impact glass spherule within <2 standard deviations.
It appears that more than half of geochemically-distinct glass spherules are estimated
to have an origin location at least 500 km away from collection sites (treated as a
local origin if falling into one pixel). In addition, we also applied this method to our
compiled glass spherules for a potential candidate of Copernicus glass spherules. We
found only one spherule matching with the composition of center region of Copernicus
Crater interpreted from Lunar Prospector Gamma-Ray Spectrometer. For the rest of
∼800 Ma-old exotic spherules, their compositional diversity appears to not reconcile
with mixing of assumed lunar samples that are prescribed to be the stratigraphy of
Copernicus Crater region.
Returned lunar samples have demonstrated a hard evidence of intense material
transport driven by impacts on the Moon. In this dissertation, I focused on impact-
driven material transport over the last three billion years. Controversy may remain
in the assumption of a constant impact rate over the last three billion years, yet I
found the assumption of a constant impact rate particularly useful in modeling re-
turned lunar samples. In order to simulate returned samples, our three-dimensional
regolith transport model based on Cratered Terrain Evolution Model (CTEM) was
calibrated with theoretical and empirical cratering laws. Our dynamic data structure
implemented with the concept of Maxwell Z-model was applied to study the diffusion
problem across mare and highland contacts. With the assumption of the constant im-
pact rate, the result of material transport across mare and highland contacts matches
with the observational diffusion profile across the contacts. In hindsight over ∼ 3 Ga
may smash out the stochastic nature of impact cratering or the change in a lunar
impact flux. In the chapters 4 and 5 our numerical framework demonstrated a novel
approach for modeling returned lunar samples. We have found some interesting facts;
examples include how sampling depth affects an interpretation of impact age record
and how “exotic” versus local origins of impact glass spherules tell a different story
about a lunar impact flux. It is fascinating and rewarding when I applied this new ap-
proach to study old problems that some of them lasts for several decades. In the end,

173
I strongly encourage everyone to look at some pre-existing and excellent problems
and go for science.

REFERENCES

174
REFERENCES
Abramov, O., Wong, S. M., and Kring, D. A. (2012). Differential melt scaling foroblique impacts on terrestrial planets. Icarus, 218(2):906–916.
Alibert, C., Norman, M. D., and McCulloch, M. T. (1994). An ancient sm-ndage for a ferroan noritic anorthosite clast from lunar breccia 67016. Geochimica etCosmochimica Acta, 58(13):2921–2926.
Alvarez, L. W., Alvarez, W., Asaro, F., and Michel, H. V. (1980). Extraterrestrialcause for the Cretaceous-Tertiary extinction. Science, 208(4448):1095–1108.
Anderson Jr, A., Newton, R., and Smith, J. (1971). Apollo 12 mineralogy andpetrology: Light-colored fragments, minor-element concentrations, and petrologicdevelopment of moon. In Second Lunar Science Conference (unpublished proceed-ings).
Artemieva, N., Karp, T., and Milkereit, B. (2004). Investigating the Lake Bo-sumtwi impact structure: Insight from numerical modeling. Geochemistry, Geo-physics, Geosystems, 5(11).
Artemieva, N., Wunnemann, K., Krien, F., Reimold, W., and Stoffler, D. (2013).Ries crater and suevite revisited–Observations and modeling Part II: Modeling. Me-teoritics & Planetary Science, 48(4):590–627.
Arvidson, R., Drozd, R. J., Hohenberg, C. M., Morgan, C. J., and Poupeau, G.(1975). Horizontal transport of the regolith, modification of features, and erosionrates on the lunar surface. The Moon, 13(1-3):67–79.
Austin, M., Thomsen, J., Ruhl, S., Orphal, D., Borden, W., Larson, S., and Schultz,P. (1981). Z-model analysis of impact cratering-an overview. In Multi-ring basins:Formation and Evolution, pages 197–205.
Baldwin, R. (1949). The Face of the Moon. University of Chicago Committee onPublications in the Physical Sciences. University of Chicago Press.
Baldwin, R. B. (1963). The Measure of the Moon. University of Chicago, Chicago,1st edition.
Barnouin-Jha, O. S., Yamamoto, S., Toriumi, T., Sugita, S., and Matsui, T. (2007).Non-intrusive measurements of crater growth. Icarus, 188(2):506–521.
175
Barra, F., Swindle, T. D., Korotev, R. L., Jolliff, B. L., Zeigler, R. a., and Olson,E. (2006). 40Ar/39Ar dating of Apollo 12 regolith: Implications for the age ofCopernicus and the source of nonmare materials. Geochimica et Cosmochimica Acta,70(24):6016–6031.
Bart, G. D., Nickerson, R. D., Lawder, M. T., and Melosh, H. J. (2011). Globalsurvey of lunar regolith depths from LROC images. Icarus, 215(2):485–490.
Berg, O., Richardson, F., and Burton, H. (1973). Apollo 17 preliminary sciencereport. NASA SP-330, 16.
Bjork, R., Kreyenhagen, K., and Wagner, M. (1967). Analytical study of impacteffects as applied to the meteoroid hazard. Number 757. National Aeronautics andSpace Administration.
Bjorkman, M. D. and Holsapple, K. A. (1987). Velocity scaling impact melt volume.International Journal of Impact Engineering, 5(1-4):155–163.
Boehnke, P. and Harrison, T. M. (2016). Illusory late heavy bombardments. Pro-ceedings of the National Academy of Sciences, 113(39):10802–10806.
Bogard, D. D., Garrison, D. H., Shih, C. Y., and Nyquist, L. E. (1994). 39Ar-40Ardating of two lunar granites: The age of Copernicus. Geochimica et CosmochimicaActa, 58(14):3093–3100.
Bohor, B. F., Foord, E. E., Modreski, P. J., and Triplehorn, D. M. (1984). Miner-alogic evidence for an impact event at the Cretaceous-Tertiary boundary. Science,224:867–870.
Bohor, B. F. and Glass, B. P. (1995). Origin and diagenesis of K/T impact spherules–From Haiti to Wyoming and beyond. Meteoritics & Planetary Science, 30(2):182–198.
Borchardt, R., Stoffler, D., Spettel, B., Palme, H., Wanke, H., Wacker, K., andJessberger, E. (1986). Composition, structure, and age of the apollo 16 subregolithbasement as deduced from the chemistry of post-imbrium melt bombs. Journal ofGeophysical Research: Solid Earth, 91(B13):E43–E54.
Borg, J., Comstock, G. M., Langevin, Y., and Maurette, M. (1976). A Monte Carlomodel for the exposure history of lunar dust grains in the ancient solar wind. Earthand Planetary Science Letters, 29(1):161–174.
Borg, L., Norman, M., Nyquist, L., Bogard, D., Snyder, G., Taylor, L., and Lind-strom, M. (1999). Isotopic studies of ferroan anorthosite 62236: a young lunar crustalrock from a light rare-earth-element-depleted source. Geochimica et CosmochimicaActa, 63(17):2679–2691.
Bottke, W. F. and Norman, M. D. (2017). The late heavy bombardment. AnnualReview of Earth and Planetary Sciences, 45.
Bottke, W. F., Vokrouhlicky, D., and Nesvorny, D. (2018). Forming the flora fam-ily: Implications for the near-earth asteroid population and large terrestrial planetimpactors. In AAS/Division for Planetary Sciences Meeting Abstracts, volume 50.
176
Budney, C. J. and Lucey, P. G. (1998). Basalt thickness in Mare Humorum: Thecrater excavation method. Journal of Geophysical Research, 103(E7):16855–16870.
Bugiolacchi, R., Mall, U., Bhatt, M., McKenna-Lawlor, S., Banaszkiewicz, M.,Brønstad, K., Nathues, A., Søraas, F., Ullaland, K., and Pedersen, R. B. (2011). Anin-depth look at the lunar crater copernicus: Exposed mineralogy by high-resolutionnear-infrared spectroscopy. Icarus, 213(1):43–63.
BVSP (1981). Basaltic volcanism on the terrestrial planets.
Cannon, K. M. and Mustard, J. F. (2015). Preserved glass-rich impactites on Mars.Geology, 43(7):635–638.
Carr, M. H., Howard, K. A., and El-Baz, F. (1971). Geologic maps of the Apennine-Hadley region of the moon, map 1-72. U.S. Geological Survey, Washington, D.C.
Chapman, C. R. and McKinnon, W. B. (1986). Cratering of planetary satellites. InIAU Colloq. 77: Some Background about Satellites, pages 492–580.
Cintala, M. J. and Grieve, R. A. (1998). Scaling impact melting and crater dimen-sions: Implications for the lunar cratering record. Meteoritics & Planetary Science,33(4):889–912.
Collins, G. S. (2014). Numerical simulations of impact crater formation with dila-tancy. Journal of Geophysical Research E: Planets, 119(12):2600–2619.
Collins, G. S., Morgan, J., Barton, P., Christeson, G. L., Gulick, S., Urrutia, J.,Warner, M., and Wunnemann, K. (2008). Dynamic modeling suggests terrace zoneasymmetry in the Chicxulub crater is caused by target heterogeneity. Earth andPlanetary Science Letters, 270(3):221–230.
Collins, G. S. and Wunnemann, K. (2005). How big was the Chesapeake Bay impact?Insight from numerical modeling. Geology, 33(12):925–928.
Coney, L., Reimold, W. U., Gibson, R. L., Koeberl, C., and Ogilvie, P. (2010). Meltparticle characteristics of the within-and out-of-crater suevites from the Bosumtwiimpact structure, Ghana: Implications for crater formation. Geological Society ofAmerica Special Papers, 465:411–442.
Costello, E. S., Ghent, R. R., and Lucey, P. G. (2018). The mixing of lunar regolith:Vital updates to a canonical model. Icarus, 314:327–344.
Croft, S. K. (1980). Cratering flow fields-implications for the excavation and tran-sient expansion stages of crater formation. In Lunar and Planetary Science Confer-ence Proceedings, volume 11, pages 2347–2378.
Croft, S. K. (1982). A first-order estimate of shock heating and vaporization inoceanic impacts. Geological Society of America Special Papers, 190:143–152.
Cross, C. and Fisher, D. (1968). The computer simulation of lunar craters. MonthlyNotices of the Royal Astronomical Society, 139(2):261–272.
Culler, T. S., Becker, T. A., Muller, R. A., and Renne, P. R. (2000). Lunar impacthistory from 40Ar/39Ar dating of glass spherules. Science, 287(5459):1785–1788.
177
Dalrymple, G. B. and Ryder, G. (1993). 40ar/39ar age spectra of apollo 15 impactmelt rocks by laser step-heating and their bearing on the history of lunar basinformation. Journal of Geophysical Research: Planets, 98(E7):13085–13095.
Dalrymple, G. B. and Ryder, G. (1996). Argon-40/argon-39 age spectra of apollo 17highlands breccia samples by laser step heating and the age of the serenitatis basin.Journal of Geophysical Research: Planets, 101(E11):26069–26084.
De Hon, R. (1979). Thickness of the western mare basalt. In Lunar and PlanetaryScience Conference, volume 10, pages 274–276.
De Hon, R. A. (1974). Thickness of mare material in the Tranquillitatis and Nectarisbasins. Proceedings of the Fifth Lunar Conference, 1:53–59.
Delano, J., Lindsley, D., and Rudowski, R. (1982). Glasses of impact origin fromApollo 11, 12, 15, and 16 - Evidence for fractional vaporization and mare/highlandmixing. In Lunar and Planetary Science Conference Proceedings, volume 12, pages339–370.
Delano, J., Zellner, N., Barra, F., Olson, E., Swindle, T., Tibbetts, N., and Whittet,D. (2007). An integrated approach to understanding Apollo 16 impact glasses:Chemistry, isotopes, and shape. Meteoritics & Planetary Science, 42(6):993–1004.
Delano, J. W. (1986). Pristine lunar glasses: Criteria, data, and implications. Jour-nal of Geophysical Research: Solid Earth, 91(B4):201–213.
Delano, J. W. (1991). Geochemical comparison of impact glasses from lunar mete-orites alha81005 and mac88105 and apollo 16 regolith 64001. Geochimica et Cos-mochimica Acta, 55(11):3019–3029.
Dence, M. R. (1965). The extraterrestrial origin of canadian craters. Annals of theNew York Academy of Sciences, 123(2):941–969.
Dence, M. R. (1971). Impact melts. Journal of Geophysical Research, 76(23):5552–5565.
Deutsch, A. and Stoffler, D. (1987). Rb-sr-analyses of apollo 16 melt rocks and a newage estimate for the imbrium basin: Lunar basin chronology and the early heavybombardment of the moon. Geochimica et Cosmochimica Acta, 51(7):1951–1964.
Dhingra, D. and Pieters, C. (2011). Mg-spinel rich lithology at crater copernicus.In Annual Meeting of the Lunar Exploration Analysis Group, volume 1646, page 9.
Dhingra, D., Pieters, C. M., Head, J. W., and Isaacson, P. J. (2013). Large miner-alogically distinct impact melt feature at copernicus crater–evidence for retention ofcompositional heterogeneity. Geophysical Research Letters, 40(6):1043–1048.
Dienes, J. and Walsh, J. (1970). Theory of impact: Some general principles and themethod of eulerian codes. High-velocity impact phenomena, 45.
Donnelly, T. and Chao, E. (1973). Microtektites of late eo-cene age from the easterncaribbean sea: in edgar, nt, saunders, jb, et al. Initial Reports of the Deep SeaDrilling Project, Washington, DC: US Government Printing Office, 7:607–672.
Drake, E. T. and Komar, P. D. (1984). Origin of impact craters: Ideas and experi-ments of hooke, gilbert, and wegener. Geology, 12(7):408–411.

178
Duncan, A. R., Sher, M. K., Abraham, Y. C., Erlank, A. J., Willis, J. P., andAhrens, L. H. (1975). Compositional variability of the Apollo 15 regolith. 6th LunarScience Conference, 6:220–222.
El-Baz, F. (1980). Gilbert and the moon. The scientific ideas of GK Gilbert, pages69–80.
Elliott, J. and Melosh, H. (2018). The effects of target heterogeneities on impact spal-lation and fragmentation. In Lunar and Planetary Science Conference, volume 49.
Elliott, J. R., Huang, Y. H., Minton, D. A., and Freed, A. M. (2018). The length oflunar crater rays explained using secondary crater scaling. Icarus, 312:231–246.
Engelhardt, W., Arndt, J., Fecker, B., and Pankau, H. (1995). Suevite brecciafrom the Ries crater, Germany: Origin, cooling history and devitrification of impactglasses. Meteoritics & Planetary Science, 30(3):279–293.
Evans, A. J., Soderblom, J. M., Andrew-Hanna, J. C., Solomon, S. C., and Zuber,M. T. (2016). Identification of buried lunar impact craters from GRAIL data andimplications for the nearside maria. Geophysical Research Letters, 43(6):2445–2455.
Farrand, W. H. (1988). Highland Contamination and Minimum Basalt Thickness inNorthern Mare Fecunditatis. Proc. Lunar Planet. Sci. Conf. 18th, pages 319–329.
Fassett, C. I. and Thomson, B. J. (2014). Crater degradation on the lunar maria:Topographic diffusion and the rate of erosion on the Moon. Journal of GeophysicalResearch: Planets, 119(10):2255–2271.
Fazio, A., Folco, L., D’Orazio, M., Frezzotti, M. L., and Cordier, C. (2014). Shockmetamorphism and impact melting in small impact craters on Earth: Evidence fromKamil crater, Egypt. Meteoritics & Planetary Science, 49(12):2175–2200.
Fischer, E. M. and Pieters, C. M. (1995). Lunar surface aluminum and iron concen-tration from Galileo solid state imaging data, and the mixing of mare and highlandmaterials. Journal of Geophysical Research, 100(E11):23279.
Fitzgerald, A. (1953). A new feature: Plates illustrating celestial objects. IrishAstronomical Journal, 2:159.
Folco, L., Glass, B., D’Orazio, M., and Rochette, P. (2010a). A common volatiliza-tion trend in transantarctic mountain and australasian microtektites: Implicationsfor their formation model and parent crater location. Earth and Planetary ScienceLetters, 293(1-2):135–139.
Folco, L., Perchiazzi, N., D’Orazio, M., Frezzotti, M., Glass, B., and Rochette, P.(2010b). Shocked quartz and other mineral inclusions in australasian microtektites.Geology, 38(3):211–214.
Gaddis, L., Skinner Jr, J., Hare, T., Tanaka, K., Hawke, B., Spudis, P., Bussey,B., Pieters, C., and Lawrence, D. (2006). The lunar geologic mapping programand status of copernicus quadrangle mapping. In 37th Annual Lunar and PlanetaryScience Conference, volume 37.
Galilei, G., Kepler, J., and Carlos, E. (1880). The Sidereal Messenger of GalileoGalilei: And a Part of the Preface to Kepler’s Dioptrics Containing the OriginalAccount of Galileo’s Astronomical Discoveries. Rivingtons.
179
Gault, D. E. (1970). Saturation and equilibrium conditions for impact cratering onthe lunar surface: Criteria and implications. Radio Science, 5(2):273–291.
Gault, D. E. and Wedekind, J. A. (1978). Experimental studies of oblique impact.Proc. Lunar Sci. Conf. 9th, 9:3843–3875.
Gault, E. D., Horz, F., Brownlee, E., and Hartung, B. J. (1974). Mixing of the lunarregolith. Proceedings of the Fifth Lunar Conference, 3:2365–2386.
Gielis, J. (2003). A generic geometric transformation that unifies a wide range ofnatural and abstract shapes. American journal of botany, 90(3):333–338.
Giguere, T., Hawke, B., Gaddis, L., Blewett, D., Gillis-Davis, J., Lucey, P., Smith,G., Spudis, P., and Taylor, G. (2006). Remote sensing studies of the dionysius regionof the moon. Journal of Geophysical Research: Planets, 111(E6).
Giguere, T. A., Taylor, G. J., HAWKE, B. R., and Lucey, P. G. (2000). The titaniumcontents of lunar mare basalts. Meteoritics & Planetary Science, 35(1):193–200.
Gilbert, G. K. (1893). The Moon’s face: A study of the origin of its features. Philo-sophical Society of Washington.
Gladman, B. J., Burns, J. A., Duncan, M. J., and Levison, H. F. (1995). Thedynamical evolution of lunar impact ejecta. Icarus, 118(2):302–321.
Glass, B., Muenow, D., Bohor, B., and Meeker, G. (1997). Fragmentation andhydration of tektites and microtektites. Meteoritics & Planetary Science, 32(3):333–341.
Glass, B. P. (1968). Glassy objects (microtektites?) from deep-sea sediments nearthe Ivory Coast. Science, 161(3844):891–893.
Glass, B. P., Baker, R. N., Storzer, D., and Wagner, G. A. (1973). North Americanmicrotektites from the Caribbean sea and their fission track age. Earth and PlanetaryScience Letters, 19(2):184–192.
Glass, B. P. and Simonson, B. M. (2012). Distal impact ejecta layers: A record oflarge impacts in sedimentary deposits. Springer-Verlag Berlin Heidelberg.
Goles, G. G., Duncan, A. R., Lindstrom, D. J., Martin, M. R., Beyer, R. L., Osawa,M., Randle, K., Meek, L. T., Steinborn, T. L., and McKay, S. M. (1971). Analyses ofApollo 12 specimens: Compositional variations, differentiation processes, and lunarsoil mixing models. Proc. 2nd Lunar Sci. Conf., 2:1063–1081.
Gomes, R., Levison, H. F., Tsiganis, K., and Morbidelli, A. (2005). Origin ofthe cataclysmic late heavy bombardment period of the terrestrial planets. Nature,435(7041):466.
Grange, M., Nemchin, A., Pidgeon, R., Timms, N., Muhling, J., and Kennedy,A. (2009). Thermal history recorded by the apollo 17 impact melt breccia 73217.Geochimica et Cosmochimica Acta, 73(10):3093–3107.
180
Greeley, R., Kadel, S. D., Williams, D. A., Gaddis, L. R., Head, J. W., Mcewen,A. S., Murchie, S. L., Nagel, E., Neukum, G., Pieters, C. M., Sunshine, J. M., Wag-ner, R., and Belton, M. J. S. (1993). Galileo Imaging Observations of Lunar Mariaand Related Deposits. Journal of Geophysical Research-Planets, 98(E9):17183–17205.
Grieve, R. A. F. (1984). The impact cratering rate in recent time. Journal ofGeophysical Research, 89:B403–B408.
GULdemeister, N., WUNnemann, K., Durr, N., and Hiermaier, S. (2013). Propaga-tion of impact-induced shock waves in porous sandstone using mesoscale modeling.Meteoritics & Planetary Science, 48(1):115–133.
Hartmann, W. (1988). Crater saturation equilibrium in the solar system: Newevidence. In Lunar and Planetary Science Conference, volume 19.
Hartmann, W. and Kuiper, G. P. (1962). Concentric structures surrounding lunarbasins. Communications of the Lunar and Planetary Laboratory, 1:51–66.
Hartmann, W. K. (1965). Terrestrial and lunar flux of large meteorites in the lasttwo billion years. Icarus, 4(2):157–165.
Hartmann, W. K. (1975). Lunar cataclysm: A misconception? Icarus, 24(2):181–187.
Hartmann, W. K. (1984). Does crater saturation equilibrium occur in the solarsystem? Icarus, 60(1):56–74.
Hartmann, W. K. (1995). Planetary cratering 1. the question of multiple impactorpopulations: Lunar evidence. Meteoritics, 30(4):451–467.
Hartmann, W. K. and Gaskell, R. W. (1997). Planetary cratering 2: Studies ofsaturation equilibrium. Meteoritics & Planetary Science, 32(1):109–121.
Hartmann, W. K., Quantin, C., and Mangold, N. (2007). Possible long-term de-cline in impact rates: 2. Lunar impact-melt data regarding impact history. Icarus,186(1):11–23.
Haskin, L. A., Gillis, J. J., Korotev, R. L., and Jolliff, B. L. (2000). The materialsof the lunar procellarum kreep terrane: A synthesis of data from geomorphologicalmapping, remote sensing, and sample analyses. Journal of Geophysical Research:Planets, 105(E8):20403–20415.
Haskin, L. A., Korotev, R. L., Rockow, K. M., and Jolliff, B. L. (1998). The casefor an imbrium origin of the apollo thorium-rich impact-melt breccias. Meteoritics& Planetary Science, 33(5):959–975.
Hawke, B. R., Blewett, D. T., Lucey, P. G., Peterson, C. A., Campbell, B. A., andRobinson, M. S. (1999). The compositional and origin of selected lunar crater rays.Workshop on New Views of the Moon II, page 22.
Hawke, B. R., Peterson, C. A., Lucey, P. G., and Coombs, C. R. (1995). Remotesensing studies of the Grimaldi region of the Moon. Lunar and Planetary ScienceXXVI, 26:561–562.

181
Head, J. N., Melosh, H. J., and Ivanov, B. A. (2002). Martian meteorite launch:High-speed ejecta from small craters. Science, 298(5599):1752–1756.
Head, J. W. (1974). Orientale multi-ringed basin interior and implications for thepetrogenesis of lunar highland samples. The Moon, 11(3-4):327–356.
Head, J. W. (1982). Lava flooding of ancient planetary crusts - Geometry, thickness,and volumes of flooded lunar impact basins. The Moon and the Planets, 26:61–88.
Head, J. W., Fassett, C. I., Kadish, S. J., Smith, D. E., Zuber, M. T., Neumann,G. A., and Mazarico, E. (2010). Global distribution of large lunar craters: Implica-tions for resurfacing and impactor populations. science, 329(5998):1504–1507.
Head, J. W. and Wilson, L. (1992). Lunar mare volcanism: Stratigraphy, eruptionconditions, and the evolution of secondary crusts. Geochimica et CosmochimicaActa, 56(6):2155–2175.
Hertz, H. (1896). Miscellaneous papers. Macmillan.
Hiesinger, H., Bogert, C. H. V. D., Pasckert, J. H., Funcke, L., Giacomini, L.,Ostrach, L. R., and Robinson, M. S. (2012). How old are young lunar craters ?Journal of Geophysical Research, 117(E12):E00H10.
Hirabayashi, M., Howl, B., Fassett, C., Soderblom, J., Minton, D., and Melosh, H.(2018). The role of breccia lenses in regolith generation from the formation of small,simple craters: Application to the apollo 15 landing site. Journal of GeophysicalResearch: Planets, 123(2):527–543.
Hirabayashi, M., Minton, D. A., and Fassett, C. I. (2017). An analytical model ofcrater count equilibrium. Icarus, 289:134–143.
Hirayama, K. (1918). Groups of asteroids probably of common origin. Proceedingsof the Tokyo Mathematico-Physical Society. 2nd Series, 9(17):354–361.
Holsapple, K. and Schmidt, R. (1987). Point source solutions and coupling pa-rameters in cratering mechanics. Journal of Geophysical Research: Solid Earth,92(B7):6350–6376.
Holsapple, K. A. (1993). The scaling of impact processes in planetary sciences.Annual Review of Earth and Planetary Sciences, 21:333–73.
Hopkins, M. and Mojzsis, S. (2015). A protracted timeline for lunar bombardmentfrom mineral chemistry, ti thermometry and u–pb geochronology of apollo 14 meltbreccia zircons. Contributions to Mineralogy and Petrology, 169(3):30.
Horton, J. W., Gohn, G. S., Powars, D. S., and Edwards, L. E. (2007). Origin andemplacement of impactites in the Chesapeake Bay impact structure, Virginia, USA.Geological Society of America Special Papers, 437:73–97.
Horz, F. (1978). How thick are lunar mare basalts? Proc. Lunar Sci. Conf. 9th,pages 3311–3331.
Horz, F. (2000). Time-variable cratering rates? Science, 288(5474):2095–2095.

182
Horz, F. and Cintala, M. (1997). The barringer award address presented 1996 july 25,berlin, germany: Impact experiments related to the evolution of planetary regoliths.Meteoritics & Planetary Science, 32(2):179–209.
Housen, K. R. and Holsapple, K. A. (2011). Ejecta from impact craters. Icarus,211(1):856–875.
Housen, K. R., Schmidt, R. M., and Holsapple, K. A. (1983). Crater Ejecta ScalingLaws: Fundamental Forms Based on Dimensional Analysis. Journal of GeophysicalResearch, 88(B3):2485–2499.
Howard, K. and Wilshire, H. (1973). Flows of Impact Melt at Lunar Craters. Ab-stracts of the Lunar and Planetary Science Conference, 4:389.
Howard, K. A. (1974). Fresh Lunar Impact Craters: Reveiw of Variations with SIze.Proceedings of Fifth Lunar Conference, 1(5):61–69.
Huang, Y.-H., Minton, D. A., Hirabayashi, M., Elliott, J. R., Richardson, J. E.,Fassett, C. I., and Zellner, N. E. B. (2017). Heterogeneous impact transport on themoon. Journal of Geophysical Research: Planets, 122(6):1158–1180.
Huang, Y.-H., Minton, D. A., Zellner, N. E., Hirabayashi, M., Richardson, J. E., andFassett, C. I. (2018). No change in the recent lunar impact flux required based onmodeling of impact glass spherule age distributions. Geophysical Research Letters,45(14):6805–6813.
Hubbard, N. J., Meyer, C., Gast, P. W., and Wiesmann, H. (1971). The compositionand derivation of Apollo 12 soils. Earth and Planetary Science Letters, 10(3):341–350.
Hui, M. S., Norman, M., and Jourdan, F. (2009). Tracking formation and transportof Apollo 16 lunar impact glasses through chemistry and dating. In Proc. 9th Aus-tralian Space Sci. Conf. (eds. Wayn Short and Ive Cairns). National Space Societyof Australia Ltd., Sydney, pages 43–54.
Ivanov, B. (1983). The model of cratering in ideal-plastic media. In Lunar andPlanetary Science Conference, volume 14, pages 343–344.
James, O. B. and Wright, T. L. (1972). Apollo 11 and 12 mare basalts and gab-bros: Classification, compositional variations, and possible petrogenetic relations.Geological Society of America bulletin, 83(8):2357–2382.
Jehanno, C., Boclet, D., Froget, L., Lambert, B., Robin, E., Rocchia, R., and Turpin,L. (1992). The Cretaceous-Tertiary boundary at Beloc, Haiti: No evidence for animpact in the Caribbean area. Earth and Planetary Science Letters, 109(1-2):229–241.
Johnson, B. and Melosh, H. (2014). Formation of melt droplets, melt fragments,and accretionary impact lapilli during a hypervelocity impact. Icarus, 228:347–363.
Johnson, B. C., Blair, D. M., Collins, G. S., Melosh, H. J., Freed, A. M., Taylor,G. J., Head, J. W., Wieczorek, M. A., Andrews-Hanna, J. C., Nimmo, F., et al.(2016). Formation of the orientale lunar multiring basin. Science, 354(6311):441–444.

183
Jolliff, B. L., Gillis, J. J., Haskin, L. A., Korotev, R. L., and Wieczorek, M. A.(2000). Major lunar crustal terranes: Surface expressions and crust-mantle origins.Journal of Geophysical Research: Planets, 105(E2):4197–4216.
Kempa, M. J., Papike, J., and White, C. (1980). The apollo 16 regolith-apetrographically-constrained chemical mixing model. In Lunar and Planetary Sci-ence Conference Proceedings, volume 11, pages 1341–1355.
Knight, C., Swain, M. V., and Chaudhri, M. (1977). Impact of small steel sphereson glass surfaces. Journal of Materials Science, 12(8):1573–1586.
Korotev, R. L. (1994). Compositional variation in apollo 16 impact-melt brecciasand inferences for the geology and bombardment history of the central highlands ofthe moon. Geochimica et Cosmochimica Acta, 58(18):3931–3969.
Korotev, R. L., Jolliff, B. L., Zeigler, R. A., Gillis, J. J., and Haskin, L. A. (2003).Feldspathic lunar meteorites and their implications for compositional remote sens-ing of the lunar surface and the composition of the lunar crust. Geochimica etCosmochimica Acta, 67(24):4895–4923.
Korotev, R. L., Zeigler, R. A., and Floss, C. (2010). On the origin of impact glassin the apollo 16 regolith. Geochimica et Cosmochimica Acta, 74(24):7362–7388.
Kovach, R., Watkins, J., and Landers, T. (1971). Active seismic experiment. Apollo14 Preliminary Science Report NASA Spec Paper SP-272, 163.
Kowitz, A., Guldemeister, N., Reimold, W., Schmitt, R., and Wunnemann, K.(2013). Diaplectic quartz glass and sio2 melt experimentally generated at only 5gpa shock pressure in porous sandstone: Laboratory observations and meso-scalenumerical modeling. Earth and Planetary Science Letters, 384:17–26.
Kreiter, T. (1960). Dating lunar surface features by using crater frequencies. Publi-cations of the Astronomical Society of the Pacific, 72(428):393–398.
Kreslavsky, M. (2017). Sesquinary craters on the moon can form clusters. In Lunarand Planetary Science Conference, volume 48.
Kring, D. A., Swindle, T. D., Britt, D. T., and Grier, J. A. (1996). Cat mountain:A meteoritic sample of an impact-melted asteroid regolith. Journal of GeophysicalResearch: Planets, 101(E12):29353–29371.
Kuiper, G. P. (1960). Photographic Lunar Atlas: Based on Photographs Taken atthe Mount Wilson, Lick, Pic Du Midi, McDonald, and Yerkes Observatories. Withthe Collaboration of DWG Arthur [and Others. University of Chicago Press.
Kuiper, G. P., Fujita, Y., Gehrels, T., Groeneveld, I., Kent, J., Van Biesbroeck,G., and Van Houten, C. (1958). Survey of asteroids. The Astrophysical JournalSupplement Series, 3:289.
Kurosawa, K. (2015). Impact-driven planetary desiccation: The origin of the dryvenus. Earth and Planetary Science Letters, 429:181–190.
Kurosawa, K. and Takada, S. (2019). Impact cratering mechanics: A forward ap-proach to predicting ejecta velocity distribution and transient crater radii. Icarus,317:135–147.
184
Kyte, F. T., Bostwick, J. A., and Zhou, L. (1996). The Cretaceous-Tertiary bound-ary on the Pacific plate: Composition and distribution of impact debris. In Ryder,G., Fastovsky, D., and Gartner, S., eds., The Cretaceous-Tertiary event and othercatastrophes in Earth history: Geological Society of America Special Paper, volume307, pages 389–401.
Labotka, T. C., Kempa, M. J., White, C., Papike, J. J., and Laul, J. C. (1980). Thelunar regolith: Comparative petrology of the Apollo sites. Proc. Lunar Planet. Sci.Conf. 11th, pages 1285–1305.
Lampson, C. (1950). Effects of atomic weapons.
Laul, J. C. and Papike, J. J. (1980). The lunar regolith: Comparative chemistry ofthe Apollo sites. Proc. Lunar Planet. Sci. Conf. 11th, pages 1307–1340.
Levine, J., Becker, T. A., Muller, R. A., and Renne, P. R. (2005). 40Ar/39Ar datingof Apollo 12 impact spherules. Geophysical Research Letters, 32:L15201.
Li, L. and Mustard, J. F. (2000). Compositional gradients across mare-highlandcontacts: Importance and geological implication of lateral transport. Journal ofGeophysical Research, 105(E8):20431.
Li, L. and Mustard, J. F. (2005). On lateral mixing efficiency of lunar regolith.Journal of Geophysical Research E: Planets, 110(11):1–16.
Li, L., Mustard, J. M., and He, G. (1997). Compositional Gradients across mare-highland contacts: The importance of lateral mixing. Lunar and Planetary ScienceXXVIII.
Lindsay, F. N., Delaney, J. S., Herzog, G. F., Turrin, B. D., Park, J., and Swisher,C. C. (2015). Rheasilvia provenance of the kapoeta howardite inferred from 1 ga40 ar/39 ar feldspar ages. Earth and Planetary Science Letters, 413:208–213.
Lodders, K. (2003). Solar system abundances and condensation temperatures of theelements. The Astrophysical Journal, 591(2):1220.
LSPET (1970). Preliminary Examination of Lunar Samples from Apollo 12. Science,167(3923):1325–1339.
LSPET (1971). Preliminary examination of lunar samples from apollo 14. Science,173(3998):681–693.
LSPET (1972). The Apollo 15 Lunar Samples : A Preliminary Description. Science,175(4020):363–375.
Lucey, P. G., Blewett, D. T., and Jolliff, B. L. (2000). Lunar iron and titanium abun-dance algorithms based on final processing of clementine ultraviolet-visible images.Journal of Geophysical Research: Planets, 105(E8):20297–20305.
Marcus, A. H. (1970). Comparison of equilibrium size distributions for lunar craters.Journal of Geophysical Research, 75(26):4977–4984.
Mark, K. (1987). Meteorite craters.
185
Marvin, U. B. (1978). Apollo 12 Course Fines (2-10): Sample Locations, Descriptionand Inventory. National Aeronautics and Space Administration, Lyndon B. JohnsonSpace Center.
Marvin, U. B., Wood, J., Taylor, G., Reid Jr, J., Powell, B., Dickey Jr, J., andBower, J. (1971). Relative proportions and probable sources of rock fragments inthe apollo 12 soil samples. In Lunar and Planetary Science Conference Proceedings,volume 2, page 679.
Maurer, P., Eberhardt, P., Geiss, J., Grogler, N., Stettler, A., Brown, G., Peckett,A., and Krahenbuhl, U. (1978). Pre-imbrian craters and basins: ages, compositionsand excavation depths of apollo 16 breccias. Geochimica et Cosmochimica Acta,42(11):1687–1720.
Maxwell, D. and Seifert, K. (1974). Modeling of cratering, close-in displacements,and ejecta. Tech. rep., Defense Nuclear Agency, Washington, DC.
Maxwell, D. E. (1977). Simple Z model for cratering, ejection, and the over-turned flap. Impact and Explosion Cratering: Planetary and Terrestrial Implica-tions, 1:1003–1008.
Mazrouei, S., Ghent, R., and Bottke, W. (2015). Has the lunar impact flux ratechanged in the past billion years? In Lunar and Planetary Science Conference,volume 46, page 2331.
McEwen, A. S., Moore, J. M., and Shoemaker, E. M. (1997). The phanerozoicimpact cratering rate: Evidence from the farside of the moon. Journal of GeophysicalResearch: Planets, 102(E4):9231–9242.
McGetchin, T. R., Settle, M., and Head, J. (1973). Radial thickness variation inimpact crater ejecta: Implications for lunar basin deposits. Earth and PlanetaryScience Letters, 20(2):226–236.
McHugh, C. M., Snyder, S. W., and Miller, K. G. (1998). Upper Eocene ejecta of theNew Jersey continental margin reveal dynamics of Chesapeake Bay impact. Earthand Planetary Science Letters, 160(3):353–367.
McKay, D., Heiken, G., Basu, A., Blanford, G., Simon, S., Reedy, R., French, B. M.,and Papike, J. (1991). The lunar regolith. Lunar sourcebook, pages 285–356.
McKay, D. S., Heiken, G. H., and Waits, G. (1978). Core 74001/2 Grain size andpetrology as a key to the rate of in-situ reworking. Proc. Lunar Sci. Conf. 9th, pages1913–1932.
Melosh, H. (1982). A simple mechanical model of valhalla basin, callisto. Journalof Geophysical Research: Solid Earth, 87(B3):1880–1890.
Melosh, H. (1984). Impact ejection, spallation, and the origin of meteorites. Icarus,59(2):234–260.
Melosh, H. (1985). Impact cratering mechanics: Relationship between the shockwave and excavation flow. Icarus, 62(2):339–343.
Melosh, H. and Artemieva, N. (2004). How does tektite glass lose its water? InLunar and Planetary Science Conference, volume 35.
186
Melosh, H. and McKinnon, W. B. (1978). The mechanics of ringed basin formation.Geophysical Research Letters, 5(11):985–988.
Melosh, H., Ryan, E., and Asphaug, E. (1992). Dynamic fragmentation in impacts:Hydrocode simulation of laboratory impacts. Journal of Geophysical Research: Plan-ets, 97(E9):14735–14759.
Melosh, H. and Vickery, A. (1991). Melt droplet formation in energetic impactevents. Nature, 350(6318):494.
Melosh, H. J. (1979). Acoustic fluidization: A new geologic process? Journal ofGeophysical Research: Solid Earth, 84(B13):7513–7520.
Melosh, H. J. (1989). Impact Cratering: A Geologic Process. Oxford Univ. Press,New York.
Melosh, H. J. (2011). Planetary surface processes, volume 13. Cambridge UniversityPress.
Merle, R., Nemchin, A., Grange, M., Whitehouse, M., and Pidgeon, R. (2014). Highresolution u-pb ages of ca-phosphates in apollo 14 breccias: Implications for the ageof the imbrium impact. Meteoritics & Planetary Science, 49(12):2241–2251.
Metzger, A., Haines, E., Parker, R., and Radocinski, R. (1977). Thorium concen-trations in the lunar surface. i-regional values and crustal content. In Lunar andPlanetary Science Conference Proceedings, volume 8, pages 949–999.
Metzger, A., Trombka, J., Peterson, L., Reedy, R., and Arnold, J. (1973). Lunarsurface radioactivity: Preliminary results of the apollo 15 and apollo 16 gamma-rayspectrometer experiments. Science, 179(4075):800–803.
Meyer, C. J., Brett, R. J., Hubbard, N. J., Morrison, D. A., Mckay, D. S., Aitken,F. K., Takeda, H., and Schonfeld, E. (1971). Mineralogy, chemistry, and origin ofthe KREEP component in soil samples from the Ocean of Storms. Proc. 2nd LunarSci. Conf., 1:393–411.
Meyer, C. J. and Hubbard, N. J. (1970). High potassium, high phosphorous glassas important rock type in the Apollo 12 soil samples. Meteoritics, 5(9):210–211.
Michael, G., Basilevsky, A., and Neukum, G. (2018). On the history of the early me-teoritic bombardment of the moon: Was there a terminal lunar cataclysm? Icarus,302:80–103.
Minton, D., Fassett, C., Hirabayashi, M., Howl, B., and Richardson, J. (2018).Topographic degradation by impact cratering on airless bodies is dominated bydiffusive erosion from distal ejecta. In Lunar and Planetary Science Conference,volume 49.
Minton, D. A., Richardson, J. E., and Fassett, C. I. (2015). Re-examining the mainasteroid belt as the primary source of ancient lunar craters. Icarus, 247:172–190.
Mitchell, J. K., Bromwell, L. G., Carrier, W. D., Costes, N. C., and Scott, R. F.(1972). Soil mechanical properties at the Apollo 14 site. Journal of GeophysicalResearch, 77(29):5641–5664.

187
Monteux, J. and Arkani-Hamed, J. (2016). Scaling laws of impact induced shockpressure and particle velocity in planetary mantle. Icarus, 264:246–256.
Moore, H., Hodges, C., and Scott, D. (1974). Multiringed basins-illustrated byorientale and associated features. In Lunar and Planetary Science Conference Pro-ceedings, volume 5, pages 71–100.
Moore, H. J. and Baldwin, R. B. (1968). Ranger VIII and Gravity Scaling of LunarCraters. Science, 159:333–4.
Morgan, J. V., Gulick, S. P., Bralower, T., Chenot, E., Christeson, G., Claeys, P.,Cockell, C., Collins, G. S., Coolen, M. J., Ferriere, L., et al. (2016). The formationof peak rings in large impact craters. Science, 354(6314):878–882.
Morris, R. (1978). In situ reworking (gardening) of the lunar surface: Evidence fromthe Apollo cores. Proc. Lunar Planet. Sci. Conf. 9th, pages 1801–1811.
Morris, R., Score, R., Dardano, C., and Heiken, G. (1983). Handbook of lunar soils,planetary materials branch pub. 67.
Morris, R. V., See, T. H., and Horz, F. (1986). Composition of the Cayley Formationat Apollo 16 as inferred from impact melt splashes. Journal of Geophysical Research:Solid Earth, 91(B13).
Moynier, F., Koeberl, C., Beck, P., Jourdan, F., and Telouk, P. (2010). Isotopicfractionation of cu in tektites. Geochimica et Cosmochimica Acta, 74(2):799–807.
Muller, P. M. and Sjogren, W. L. (1968). Mascons: Lunar mass concentrations.Science, 161(3842):680–684.
Murray, J. (1980). Oscillating peak model of basin and crater formation. The moonand the planets, 22(3):269–291.
Nahm, A. L., Ohman, T., and Kring, D. A. (2013). Normal faulting origin for thecordillera and outer rook rings of orientale basin, the moon. Journal of GeophysicalResearch: Planets, 118(2):190–205.
Naney, M., Crowl, D., and Papike, J. (1976). The apollo 16 drill core-statisticalanalysis of glass chemistry and the characterization of a high alumina-silicapoor/hasp/glass. In Lunar and Planetary Science Conference Proceedings, volume 7,pages 155–184.
NASA Technical Report Server (1972). Apollo 15 Preliminary Science Report. Tech-nical report.
NASA Technical Report Server (1973). Apollo 17 Preliminary Science Report. Tech-nical report.
Neal, C. R., Hacker, M. D., Snyder, G. A., Taylor, L. A., Liu, Y.-G., and Schmitt,R. A. (1994). Basalt generation at the apollo 12 site, part 1: New data, classification,and re-evaluation. Meteoritics, 29(3):334–348.
Nemchin, A., Pidgeon, R., Healy, D., Grange, M., Whitehouse, M., and Vaughan,J. (2009). The comparative behavior of apatite-zircon u-pb systems in apollo 14breccias: Implications for the thermal history of the fra mauro formation. Meteoritics& Planetary Science, 44(11):1717–1734.
188
Nemchin, A., Pidgeon, R., Whitehouse, M., Vaughan, J. P., and Meyer, C. (2008).Sims u–pb study of zircon from apollo 14 and 17 breccias: implications for theevolution of lunar kreep. Geochimica et Cosmochimica Acta, 72(2):668–689.
Nesvorny, D., Morbidelli, A., Vokrouhlicky, D., Bottke, W., and Broz, M. (2002).The flora family: A case of the dynamically dispersed collisional swarm? Icarus,157(1):155–172.
Neukum, G. (1983). Meteorite bombardment and dating of planetary surfaces. dis-sertation on attaining venia legendi (tenure) in the geophysics department in thefaculty of geological sciences of the ludwig-maximilians university, munich, west ger-many. 186 pp. (translated from german).
Neukum, G. and Ivanov, B. (1994). Crater size distributions and impact probabilitieson earth from lunar, terrestrial-planet, and asteroid cratering data. Hazards due toComets and Asteroids, 359.
Neukum, G., Ivanov, B. A., and Hartmann, W. K. (2001). Cratering records inthe inner solar system in relation to the lunar reference system. In Chronology andevolution of Mars, pages 55–86. Springer.
Norman, M., Adena, K., and Christy, A. (2012). Provenance and pb isotopic ages oflunar volcanic and impact glasses from the apollo 17 landing site. Australian Journalof Earth Sciences, 59(2):291–306.
Norman, M., Duncan, R. A., and Huard, J. J. (2010). Imbrium provenance for theapollo 16 descartes terrain: Argon ages and geochemistry of lunar breccias 67016and 67455. Geochimica et Cosmochimica Acta, 74(2):763–783.
Norman, M. D. (2018). Impact ages, compositions, and bio-tectonic implications oflunar regolith glasses. In The Geological Society America Annual Meeting.
Norman, M. D., Duncan, R. A., and Huard, J. J. (2006). Identifying impact eventswithin the lunar cataclysm from 40ar–39ar ages and compositions of apollo 16 impactmelt rocks. Geochimica et Cosmochimica Acta, 70(24):6032–6049.
Norman, M. D. and Nemchin, A. A. (2014). A 4.2 billion year old impact basin onthe moon: U–pb dating of zirconolite and apatite in lunar melt rock 67955. Earthand Planetary Science Letters, 388:387–398.
Nozette, S., Rustan, P., Pleasance, L. P., Kordas, J. F., Lewis, I. T., Park, H. S.,Priest, R. E., Horan, D. M., Regeon, P., Lichtenberg, C. L., Shoemaker, E. M.,Eliason, E. M., McEwen, a. S., Robinson, M. S., Spudis, P. D., Acton, C. H., Buratti,B. J., Duxbury, T. C., Baker, D. N., Jakosky, B. M., Blamont, J. E., Corson, M. P.,Resnick, J. H., Rollins, C. J., Davies, M. E., Lucey, P. G., Malaret, E., Massie,M. a., Pieters, C. M., Reisse, R. a., Simpson, R. a., Smith, D. E., Sorenson, T. C.,Breugge, R. W., and Zuber, M. T. (1994). The Clementine mission to the Moon:scientific overview. Science, 266(5192):1835–1839.
Oberbeck, V., Quaide, W., Mahan, M., and Paulson, J. (1973). Monte Carlo calcu-lations of lunar Regolith thickness distributions. Icarus, 19(1):87–107.
Oberbeck, V. R. (1975). The Role of Ballistic Erosion and Sedimentation in LunarStratigraphy. Reviews of Geophysics, 13(2):337–362.
189
Oberbeck, V. R. and Quaide, W. L. (1967). Estimated Thickness of a Frag-mental Surface Layer of Oceanus Procellarum. Journal of Geophysical Research,72(18):4697–4704.
Oberbeck, V. R. and Quaide, W. L. (1968). Genetic Implications of Lunar RegolithThickness Variations. Icarus, 9(1-3):446–465.
O’Keefe, J. D. and Ahrens, T. J. (1977). Impact-induced energy partitioning, melt-ing, and vaporization on terrestrial planets. In Lunar and Planetary Science Con-ference Proceedings, volume 8, pages 3357–3374.
O’Keefe, J. D. and Ahrens, T. J. (1981). Impact cratering: The effect of crustalstrength and planetary gravity. Reviews of Geophysics, 19(1):1–12.
Opik, E. (1958). Meteor impact on solid surface. Irish Astronomical Journal, 5:14.
Opik, E. (1960). The lunar surface as an impact counter. Monthly Notices of theRoyal Astronomical Society, 120(5):404–411.
Opik, E. J. (1916). A note on the meteoric theory of lunar craters. Mirovedenie,5:125–34. In Russian. [Reprinted in unpublished posthumous collection of early pa-pers of Opik from 19121921, compiled by J. McFartland in the Armagh Observatoryin 1985, pp. 93102].
Oplk, E. (1958). On the catastrophic effect of collisions with celestial bodies. IrishAstronomical Journal, 5:34.
Osae, S., Misra, S., Koeberl, C., Sengupta, D., and Ghosh, S. (2005). Target rocks,impact glasses, and melt rocks from the Lonar impact crater, India: Petrographyand geochemistry. Meteoritics & Planetary Science, 40(9-10):1473–1492.
Papike, J., Hodges, F., Bence, A., Cameron, M., and Rhodes, J. (1976). Marebasalts: crystal chemistry, mineralogy, and petrology. Reviews of Geophysics,14(4):475–540.
Park, J., Turrin, B. D., Herzog, G. F., Lindsay, F. N., Delaney, J. S., Swisher III,C. C., Uesugi, M., Karouji, Y., Yada, T., Abe, M., et al. (2015). 40ar/39ar age ofmaterial returned from asteroid 25143 itokawa. Meteoritics & Planetary Science,50(12):2087–2098.
Pierazzo, E., Vickery, A., and Melosh, H. (1997). A reevaluation of impact meltproduction. Icarus, 127(2):408–423.
Pieters, C. M. (1982). Copernicus crater central peak: Lunar mountain of uniquecomposition. Science, 215(4528):59–61.
Pieters, C. M., Adams, J. B., Smith, M. O., Mouginis-Mark, P. J., and Zisk, S. H.(1985). The nature of crater rays: The Copernicus example. Journal of GeophysicalResearch, 90(B14):12393–12413.
Pieters, C. M., Staid, M. I., Fischer, E., Tompkins, S., and He, G. (1994). A sharperview of impact craters from clementine data. Science, 266(5192):1844–1848.

190
Pike, R. (1977). Apparent depth/apparent diameter relation for lunar craters. InLunar and planetary science conference proceedings, volume 8, pages 3427–3436.
Pike, R. J. (1974). Depth/diameter relations of fresh lunar craters: Revision fromspacecraft data. Geophysical Research Letters, 1(7):291–294.
Pilkington, M. and Grieve, R. (1992). The geophysical signature of terrestrial impactcraters. Reviews of Geophysics, 30(2):161–181.
Pollastro, R. M. (1993). Origin and clay-mineral genesis of the Cretaceous/Tertiaryboundary unit, western interior of North America. Clays and Clay Minerals, 41:7–25.
Pope, K. O., Ocampo, A. C., Fischer, A. G., Alvarez, W., Fouke, B. W., Webster,C. L., Vega, F. J., Smit, J., Fritsche, A. E., and Claeys, P. (1999). Chicxulub impactejecta from Albion island, Belize. Earth and Planetary Science Letters, 170(4):351–364.
Potter, R. W. (2015). Investigating the onset of multi-ring impact basin formation.Icarus, 261:91–99.
Potter, R. W., Kring, D. A., and Collins, G. S. (2013). Quantifying the attenua-tion of structural uplift beneath large lunar craters. Geophysical Research Letters,40(21):5615–5620.
Press, W. H., Teukolsky, S. A., Vetterling, W. T., and Flannery, B. P. (1992).Numerical recipes in fortran 77, vol. 1. New York, NY: Press Syndicate of theUniversity of Cambridge.
Prettyman, T., Hagerty, J., Elphic, R., Feldman, W., Lawrence, D., McKinney,G., and Vaniman, D. (2006). Elemental composition of the lunar surface: Analysisof gamma ray spectroscopy data from lunar prospector. Journal of GeophysicalResearch: Planets, 111(E12).
Pyne, S. J. (1980). a great engine of researchg. us geological survey. The ScientificIdeas of GK Gilbert: An Assessment on the Occasion of the Centennial of the UnitedStates Geological Survey (1879-1979), 183:1.
Quaide, W. and Oberbeck, V. (1975). Development of the mare regolith: Somemodel considerations.
Quaide, W. L. and Oberbeck, V. R. (1968). Thickness determinations of the lu-nar surface layer from lunar impact craters. Journal of Geophysical Research,73(16):5247–5270.
Quantin, C., Mangold, N., Hartmann, W. K., and Allemand, P. (2007). Possiblelong-term decline in impact rates: 1. Martian geological data. Icarus, 186(1):1–10.
Racki, G., Koeberl, C., Viik, T., Jagt-Yazykova, E. A., and Jagt, J. W. (2014).Ernst julius opik’s (1916) note on the theory of explosion cratering on the moon’ssurfacethe complex case of a long-overlooked benchmark paper. Meteoritics & Plan-etary Science, 49(10):1851–1874.
Rasorenov, S., Kanel, G., Fortov, V., and Abasehov, M. (1991). The fracture ofglass under high-pressure impulsive loading. International Journal of High PressureResearch, 6(4):225–232.
191
Reid, A. M., Duncan, A. R., and Richardson, S. H. (1977). In search of LKFM. InLunar and Planetary Science Conference Proceedings, volume 8, pages 2321–2338.
Rein, H. and Liu, S.-F. (2012). Rebound: an open-source multi-purpose n-bodycode for collisional dynamics. Astronomy & Astrophysics, 537:A128.
Rhodes, J., Blanchard, D., Dungan, M., Brannon, J., and Rodgers, K. (1977). Chem-istry of apollo 12 mare basalts-magma types and fractionation processes. In Lunarand Planetary Science Conference Proceedings, volume 8, pages 1305–1338.
Rhodes, J. M. (1977). Some Compositional Aspects of Lunar Regolith Evolution.Philosophical Transactions of the Royal Society A: Mathematical, Physical and En-gineering Sciences, 285(1327):293–301.
Rhodes, J. M., Rodgers, K. V., Shih, C., Bansal, B. M., and Nyquist (1974). Therelationships between geology and soil chemistry at the Apollo 17 landing site. Proc.5th Lunar Sci. Conf., Geochim. cosmochim. Acta Suppl., 5(2):1097–1117.
Richardson, J. E. (2009). Cratering saturation and equilibrium : A new model looksat an old problem. 204:697–715.
Richardson, J. E. (2011). Modeling impact ejecta plume evolution: A comparisonto laboratory studies. Journal of Geophysical Research: Planets, 116(E12).
Richardson, J. E., Melosh, H. J., Lisse, C. M., and Carcich, B. (2007). A ballisticsanalysis of the Deep Impact ejecta plume: Determining Comet Tempel 1’s gravity,mass, and density. Icarus, 191(2 SUPPL.):176–209.
Ridley, W., Reid, A., Warner, J., Brown, R., Gooley, R., and Donaldson, C. (1973).Glass compositions in apollo 16 soils 60501 and 61221. In Lunar and PlanetaryScience Conference Proceedings, volume 4, page 309.
Righter, K., Abell, P., Agresti, D., Berger, E. L., Burton, A. S., Delaney, J. S., Fries,M., Gibson, E., Haba, M. K., Harrington, R., et al. (2015). Mineralogy, petrology,chronology, and exposure history of the chelyabinsk meteorite and parent body.Meteoritics & Planetary Science, 50(10):1790–1819.
Robbins, S. J. (2014). New crater calibrations for the lunar crater-age chronology.Earth and Planetary Science Letters, 403:188–198.
Robinson, M. S., Brylow, S. M., Tschimmel, M., Humm, D., Lawrence, S. J.,Thomas, P. C., Denevi, B. W., Bowman-Cisneros, E., Zerr, J., Ravine, M. a.,Caplinger, M. a., Ghaemi, F. T., Schaffner, J. a., Malin, M. C., Mahanti, P., Bar-tels, a., Anderson, J., Tran, T. N., Eliason, E. M., McEwen, a. S., Turtle, E., Jolliff,B. L., and Hiesinger, H. (2010). Lunar Reconnaissance Orbiter Camera (LROC)Instrument Overview. Space Science Reviews, 150(1-4):81–124.
Ross, H. P. (1968). A simplified mathematical model for lunar crater erosion. Journalof Geophysical Research, 73(4):1343–1354.
Ruedas, T. (2017). Globally smooth approximations for shock pressure decay inimpacts. Icarus, 289:22–33.
Russ, P. G., Burnett, D. S., and Wasserburg, G. J. (1972). Lunar neutron stratig-raphy. Earth and Planetary Science Letters, 15(2):172–186.

192
Ryder, G. (1990). Lunar samples, lunar accretion and the early bombardment ofthe moon. Eos, Transactions American Geophysical Union, 71(10):313–323.
Schaal, R. and Horz, F. (1980). Experimental shock metamorphism of lunar soil. InLunar and Planetary Science Conference Proceedings, volume 11, pages 1679–1695.
Schmitt, H. H., Trask, N. J., and Shoemaker, E. M. (1967). Geologic map of theCopernicus quadrangle of the Moon. US Geological Survey.
Schmitz, B., Haggstrom, T., and Tassinari, M. (2003). Sediment-dispersed extrater-restrial chromite traces a major asteroid disruption event. Science, 300(5621):961–964.
Schnetzler, C. C. and Philpotts, J. A. (1971). Alkali, alkaline earth, and rare-earthelement concentrations in some Apollo 12 soils, rocks, and separated phases. Proc.2nd Lunar Sci. Conf., 2:1101–1122.
Schonfeld, E. and Meyer, C. J. (1972). The abundances of components of the lunarsoils by a least-squares mixing model and the formation age of KREEP. Proc. 3rdLunar Sci. Conf. (Suppl. 3, Geochemica et Cosmochimica Acta), 2:1397–1420.
Schulte, P., Stinnesbeck, W., Stuben, D., Kramar, U., Berner, Z., Keller, G., andAdatte, T. (2003). Fe-rich and K-rich mafic spherules from slumped and channelizedChicxulub ejecta deposits in the northern La Sierrita area, NE Mexico. InternationalJournal of Earth Sciences, 92(1):114–142.
Schultz, P. H. and Mustard, J. F. (2004). Impact melts and glasses on Mars. Journalof Geophysical Research: Planets, 109:E01001.
Sheehan, W. and Baum, R. (1995). Observations and inference: Johann Hi-eronymous Schroeter, 1745-1816. Journal of the British Astronomical Association,105:171–175.
Shoemaker, E., Batson, R., Bean, A., Conrad Jr, C., Dahlem, D., Goddard, E.,Hait, M., Larson, K., Schaber, G., Schleicher, D., et al. (1970). Preliminary geologicinvestigation of the Apollo 12 landing site: Part A: Geology of the Apollo 12 landingsite. NASA SP-235, pages 113–156.
Shoemaker, E. M. (1959). Impact mechanics at meteor crater, arizona. Technicalreport, US Geological Survey],.
Shoemaker, E. M. (1965). Preliminary Analysis of the Fine Structure of the LunarSurface in Mare Cognitum.
Shoemaker, E. M. (1970). Origin of fragmental debris on the lunar surface and thehistory of bombardment of the Moon.
Shoemaker, E. M., Wolfe, R. F., and Shoemaker, C. S. (1990). Asteroid and cometflux in the neighborhood of Earth. Geological Society of America Special Papers,247:155–170.
Simon, S. B., Papike, J. J., Gosselin, D. C., Laul, J. C., Hughes, S. S., and Schmitt,R. A. (1990). Petrology and Chemistry of Apollo 17 Regolith Breccias: A Historyof Mixing of Highland and Mare Basalt. Proceeding of 20th Lunar and PlanetaryScience Conference, pages 219–230.
193
Simon, S. B., Papike, J. J., and Laul, J. C. (1981). The lunar regolith: Comparativestudies of the Apollo and Luna sites. Petrology of soils from Apollo 17, Luna 16, 20,and 24. Proc. Lunar Planet. Sci. Conf. 12B, pages 371–388.
Smit, J. and Hertogen, J. (1980). An extraterrestrial event at the Cretaceous-Tertiary boundary. Nature, 285(5762):198–200.
Soderblom, L. A. (1970). A model for small-impact erosion applied to the lunarsurface. Journal of Geophysical Research, 75(14):2655–2661.
Solomon, S. C. and Head, J. W. (1980). Lunar Mascon Basins ’ Lava Filling ,Tectonics , and Evolution of the Lithosphere. Reviews of Geophysics and SpacePhysics, 18:107–141.
Speyerer, E. J., Povilaitis, R. Z., Robinson, M. S., Thomas, P. C., and Wagner,R. V. (2016). Quantifying crater production and regolith overturn on the moonwith temporal imaging. Nature, 538(7624):215.
Spudis, P., Zellner, N., Delano, J., Whittet, D., and Fessler, B. (2002). Petrologicmapping of the moon: a new approach. In Lunar and Planetary Science Conference,volume 33.
Spudis, P. D. and Ryder, G. (1985). Geology and petrology of the Apollo 15 landingsite: Past, present, and future understanding. Eos. Trans. AGU, 66(43):721–726.
Stadermann, F. J., Heusser, E., Jessberger, E. K., Lingner, S., and Stoffler, D.(1991). The case for a younger imbrium basin: New 40ar-39ar ages of apollo 14rocks. Geochimica et Cosmochimica Acta, 55(8):2339–2349.
Stewart, S. T. and Valiant, G. J. (2006). Martian subsurface properties and craterformation processes inferred from fresh impact crater geometries. Meteoritics &Planetary Science, 41(10):1509–1537.
Stoffler, D., Bischoff, A., Borchardt, R., Burghele, A., Deutsch, A., Jessberger, E.,Ostertag, R., Palme, H., Spettel, B., Reimold, W., et al. (1985). Compositionand evolution of the lunar crust in the descartes highlands, apollo 16. Journal ofGeophysical Research: Solid Earth, 90(S02):C449–C506.
Stoffler, D., Ryder, G., Ivanov, B. A., Artemieva, N. A., Cintala, M. J., and Grieve,R. A. F. (2006). Cratering History and Lunar Chronology. Reviews in Mineralogy& Geochemistry, 60(4):519–596.
Strom, R. G., Malhotra, R., Ito, T., Yoshida, F., and Kring, D. A. (2005). The originof planetary impactors in the inner solar system. Science, 309(5742):1847–1850.
Swain, M. and Hagan, J. (1976). Indentation plasticity and the ensuing fracture ofglass. Journal of Physics D: Applied Physics, 9(15):2201.
Swann, G. A., Bailey, N. C., Batson, R. M., Freeman, V. L., Hait, M. H., Head,J. W., Holt, H. E., Howard, K. A., Irwin, J. B., Larson, K. B., Muehlberger, W. R.,Reed, V. S., Rennilson, J. J., Schaber, G. G., Scott, D. R., Silver, L. T., Sutton,R. L., Ulrich, G. E., Wilshire, H. G., and Wolfe, E. W. (1972). Preliminary geologicinvestigation of the Apollo 15 landing site. Apollo 15 Preliminary Science Report,NASA SP-289.

194
Swann, G. A., Bailey, N. G., Batson, R. M., Eggleton, R. E., Hait, M. H., Holt,H. E., Larson, K. B., Reed, V. S., Schaber, G. G., Sutton, R. L., Trask, N., Ulrich,G. E., and Wilshire, H. G. (1977). Geology of the Apollo 14 landing site in the FraMauro highlands. Geological Survey Professional Paper 880.
Swindle, T. and Kring, D. (2008). Chronological evidence for the late heavy bom-bardment in ordinary chondrite meteorites. In Workshop on the Early Solar SystemImpact Bombardment, volume 1439, pages 59–60.
Swindle, T. D., Isachsen, C. E., Weirich, J. R., and Kring, D. A. (2009). 40ar-39ar ages of h-chondrite impact melt breccias. Meteoritics & Planetary Science,44(5):747–762.
Symes, S. J., Sears, D. W., Akridge, D., Huang, S., and BENOIT, P. H. (1998).The crystalline lunar spherules: Their formation and implications for the origin ofmeteoritic chondrules. Meteoritics & Planetary Science, 33(1):13–29.
Taylor, S. R. (1982). Planetary Science: A Lunar Perspective. Lunar and PlanetaryInstitute.
Tera, F., Papanastassiou, D., and Wasserburg, G. (1973). A lunar cataclysm at˜ 3.95ae and the structure of the lunar crust. In Lunar and Planetary Science Conference,volume 4.
Tera, F., Papanastassiou, D., and Wasserburg, G. (1974). Isotopic evidence for aterminal lunar cataclysm. Earth and Planetary Science Letters, 22(1):1–21.
Thein, J. (1987). A tektite layer in Upper Eocene sediments of the New-Jerseycontinental-slope (site-612, leg-95). Initial reports of the deep sea drilling project,95:565–579.
Timoshenko, S. and Goodier, J. (1982). Theory of Elasticity. Engineering societiesmonographs. McGraw-Hill.
Tompkins, S. and Pieters, C. M. (2010). Spectral characteristics of lunar impactmelts and inferred mineralogy. Meteoritics & Planetary Science, 45(7):1152–1169.
Trombka, J. I., Arnold, J. R., Adler, I., Metzger, A. E., and Reedy, R. C. (1974).Lunar elements analysis obtained from the Apollo Gamma-Ray and X-ray remotesensing experiment. THE PROCEEDINGS OF THE SOVIET-AMERICAN CON-FERENCE ON THE COSMOCHEMISTRY OF THE MOON AND PLANETS.
Turner, G. and Cadogan, P. H. (1975). The history of lunar bombardment inferredfrom Ar-40-Ar-39 dating of highland rocks. In Lunar and Planetary Science Confer-ence Proceedings, volume 6 of Lunar and Planetary Science Conference Proceedings,pages 1509–1538.
Vaniman, D. and Papike, J. (1977). Very low ti/vlt/basalts-a new mare rock typefrom the apollo 17 drill core. In Lunar and Planetary Science Conference Proceed-ings, volume 8, pages 1443–1471.
Vokrouhlicky, D., Bottke, W. F., and Nesvorny, D. (2017). Forming the Florafamily: Implications for the Near-Earth asteroid population and large terrestrialplanet impactors. The Astronomical Journal, 153(4):172.

195
Wanke, H., Baddenhausen, H., Balacesu, A., Teschke, F., Spettel, B., Dreibus, G.,Palme, H., Quijano-Rico, M., Kruse, H., Wlotzka, F., and Begemann, F. (1972).Multielement analyses of lunar samples and some implications of the results. Proc.3rd Lunar Sci. Conf., Supplement:1251–1268.
Wasson, J. T. and Baedecker, P. A. (1972). Provenance of Apollo 12 KREEP. Proc.3rd Lunar Sci. Conf., 2:1315–1326.
Wegener, A. L. (1920a). Die aufsturzhypothese der mondkrater. Sirius, 53:189–194.
Wegener, A. L. (1920b). Versuche zur aufsturztheorie der mondkrater: Nova actaabhandlungen der leopoldina-carolinae deutschen akademie der naturforscher 106,111 p.
Wegener, A. L. (1921). Die entstehung der mondkrater: Braunschweig, druck undverlag von friedrich vieweg und sohn, 48 p. (translated by a. m. clal sengr, 1975, inthe origin of lunar craters: The moon, v. 14, p. 211-236.).
Weirich, J., Swindle, T., and Isachsen, C. (2012). 40ar-39ar age of northwest africa091: More evidence for a link between l chondrites and fossil meteorites. Meteoritics& Planetary Science, 47(8):1324–1335.
Wentworth, S. and McKay, D. (1991). Apollo 14 glasses and the origin of lunar soils.In Lunar and Planetary Science Conference Proceedings, volume 21, pages 185–192.
Wentworth, S., McKay, D., Lindstrom, D., Basu, A., Martinez, R., Bogard, D.,and Garrison, D. (1994). Apollo 12 ropy glasses revisited. Meteoritics & PlanetaryScience, 29(3):323–333.
Wentworth, S., Taylor, G., Warner, R., Keil, K., Ma, M.-S., and Schmitt, R. (1979).The unique nature of apollo 17 vlt mare basalts. In Lunar and Planetary ScienceConference Proceedings, volume 10, pages 207–223.
Wilhelms, D. E. (1987). The geologic history of the Moon. U.S. Geological SurveyProfessional Paper 1348, pages 283–292.
Wood, C. and Head, J. (1976). Comparison of impact basins on mercury, mars andthe moon. In Lunar and Planetary Science Conference Proceedings, volume 7, pages3629–3651.
Wood, J. A. (1970). Petrology of the Lunar Soil and Geophysical Implications.Journal of Geophysical Research, 75(32):6497–6513.
Wood, J. A. (1972). Fragments of terra rock in the apollo 12 soil samples and astructural model of the moon. Icarus, 16(3):462–501.
Wood, J. A., Dickey, J. S., J., Marvin, U. B., and Powell, B. N. (1970a). Lunaranorthosites and a geophysical model of the moon. Proceeding of the Apollo 11Lunar Science Conference, 1:965–988.
Wood, J. A., Dickey Jr, J., Marvin, U. B., and Powell, B. (1970b). Lunar anorthositesand a geophysical model of the moon. Geochimica et Cosmochimica Acta Supple-ment, 1:965.
196
Wood, J. A., Marvin, U. B., Powell, B. N., and Dickey, J. S., J. (1970c). Mineralogyand petrology of the Apollo 11 lunar samples. Smithsonian Astrophys. Observ. Spec.Rep., 307.
Woronow, A. (1978). A general cratering-history model and its implications for thelunar highlands. Icarus, 34(1):76–88.
Wunnemann, K., Collins, G., and Osinski, G. (2008). Numerical modelling of impactmelt production in porous rocks. Earth and Planetary Science Letters, 269(3-4):530–539.
Wunnemann, K., Engelmann, J., Luther, R., and Hamann, C. (2017). Impact-induced shock melting and ejection of material in an asteroidal environment-implications for the deficit in melt agglutinates in itokawa samples. In Lunar andPlanetary Science Conference, volume 48.
Xiao, Z. and Werner, S. C. (2015). Size-frequency distribution of crater populationsin equilibrium on the moon. Journal of Geophysical Research: Planets, 120(12):2277–2292.
Yamamoto, S., Barnouin-Jha, O. S., Toriumi, T., Sugita, S., and Matsui, T. (2009).An empirical model for transient crater growth in granular targets based on directobservations. Icarus, 203(1):310–319.
Yamamoto, S., Hasegawa, S., Suzuki, A., and Matsunaga, T. (2017). Impact velocitydependence of transient cratering growth. Journal of Geophysical Research: Planets,122(5):1077–1089.
Yamamoto, S., Wada, K., Okabe, N., and Matsui, T. (2006). Transient crater growthin granular targets: An experimental study of low velocity impacts into glass spheretargets. Icarus, 183(1):215–224.
Young, R. A. (1976). The morphological evolution of mare-highland contacts: Apotential measure of relative mare surface age. Proc. Lunar Sci. Conf. 7th, pages2801–2816.
Yue, Z., Johnson, B., Minton, D., Melosh, H., Di, K., Hu, W., and Liu, Y. (2013).Projectile remnants in central peaks of lunar impact craters. Nature Geoscience,6(6):435.
Zahnle, K., Alvarellos, J. L., Dobrovolskis, A., and Hamill, P. (2008). Secondaryand sesquinary craters on europa. Icarus, 194(2):660–674.
Zeigler, R., Korotev, R., Jolliff, B., Haskin, L., and Floss, C. (2004). Apollo 16 maficglass: Geochemistry, provenance, and implications. In Lunar and Planetary ScienceConference, volume 35.
Zeigler, R. A., Korotev, R. L., Jolliff, B. L., Haskin, L. A., and Floss, C. (2006). Thegeochemistry and provenance of apollo 16 mafic glasses. Geochimica et Cosmochim-ica Acta, 70(24):6050–6067.
Zellner, N. (2018). The first billion years: Impacts and life on earth (and mars?).LPI Contributions, 2107.

197
Zellner, N. and Delano, J. (2015). 40Ar/39Ar ages of lunar impact glasses: Rela-tionships among ar diffusivity, chemical composition, shape, and size. Geochimicaet Cosmochimica Acta, 161:203–218.
Zellner, N., Delano, J., Swindle, T., Barra, F., Olsen, E., and Whittet, D. (2006).Did a transient increase in the impact flux occur 800 ma ago? In 37th Annual Lunarand Planetary Science Conference, volume 37.
Zellner, N., Delano, J., Swindle, T., Barra, F., Olsen, E., and Whittet, D. (2009).Evidence from 40ar/39ar ages of lunar impact glasses for an increase in the impactrate 800 ma ago. Geochimica et Cosmochimica Acta, 73(15):4590–4597.
Zellner, N., Spudis, P., Delano, J., Whittet, D., and Swindle, T. (2003). Geochem-istry and impact history at the apollo 16 landing site. In Lunar and PlanetaryScience Conference, volume 34.
Zellner, N., Swindle, T., Barra, F., Delano, J., Tibbetts, N., Whittet, D., andSpudis, P. (2005). Chemical and isotopic analyses of apollo 16 glasses: an integratedapproach. In 36th Annual Lunar and Planetary Science Conference, volume 36.
Zellner, N. E. (2017). Cataclysm no more: new views on the timing and delivery oflunar impactors. Origins of Life and Evolution of Biospheres, 47(3):261–280.
Zellner, N. E. B., Spudis, P. D., Delano, J. W., and Whittet, D. C. B. (2002). Impactglasses from the Apollo 14 landing site and implications for regional geology. Journalof Geophysical Research, 107:1–13.
Zuber, M. T., Smith, D. E., Neumann, G. A., Goossens, S., Andrews-Hanna, J. C.,Head, J. W., Kiefer, W. S., Asmar, S. W., Konopliv, A. S., Lemoine, F. G., et al.(2016). Gravity field of the orientale basin from the gravity recovery and interiorlaboratory mission. Science, 354(6311):438–441.

198
VITA YA-HUEI HUANG 黃雅惠
EDUCATION Ph.D. in Earth, Atmospheric, and Planetary Sciences, Purdue University, USA 2012-2018 (defended, November 2 2018) M. Sc. in Physics, National Tsing Hua University, Taiwan 2008-2010 B. Sc. in Physics, National Chung Cheng University, Taiwan, 2003-2008 EMPLOYMENT Graduate Research Assistant, Purdue University, 2014-present (Advisor: Dr. David Minton) Graduate Teaching Assistant, Purdue University, 2012-2014 Research Assistant, National Taiwan Normal University, 2010-2012 (Employer: Dr. Chi-Ming Chen) Graduate Research Assistant, National Tsing Hua University 2008-2010 (Advisor: Dr. Ing-Guey Jiang) Undergraduate Research Assistant, National Chung Cheng University, 2007 (Advisor: Dr. Chih-Yung Chien, Johns Hopkins University) RESEARCH PUBLICATIONS Y.- H. Huang, D.A. Minton, N.E.B. Zellner, M. Hirabayashi, J.E. Richardson, C.I. Fassett (2018). “No Change in Recent Lunar Impact Flux Required Based on Modeling of Impact Glass Spherule Age Distributions.” Geophysical Research Letters, 45, 6805-6813. J. R. Elliott, Y.-H. Huang, D.A. Minton, A.M. Freed (2018). ”The Length of Lunar Crater Rays Explained Using Secondary Crater Scaling.” Icarus, 312, 231-246. Y.-H. Huang, D.A. Minton, M. Hirabayashi, J.R. Elliott, C.I. Fassett, N.E.B. Zellner (2017), ”Heterogeneous Impact Transport on the Moon.” Journal of Geophysical Research: Planets, 122, 1158-1180. Y.-H. Huang, and C.-M. Chen (2012), ”Statistical Analysis and Computational Prediction of Helical Kinks in Membrane Proteins.” Journal of Computer-Aided Molecular Design, 10, 1171-1185. Y.-H. Huang, and I.-G. Jiang (2010), ”The Velocity-Size Relation for Members of Asteroid Families.” (Master thesis) AWARDS NASA Earth and Space Science Fellowship 2015-2018 “No Change in Recent Lunar Impact Flux Required Based on Modeling of Impact Glass Spherule Age Distributions” on Daily News in NewScientist “Why a rake on the moon messed up our theories of life on Earth”, September, 14 2018. “No Change in Recent Lunar Impact Flux Required Based on Modeling of Impact Glass Spherule Age Distributions” on News in Phys.org “Age bias exists even in outer spacein samples collected by Apollo astronauts”, September 11, 2018. “Heterogeneous Impact Transport on the Moon” on Research Spotlight in Eos, June 7 2017 Purdue Research Foundation Research Assistantship 2014-2015 Taiwan Fund for Children and Families Scholarship 2003-2010 Private Ming-Da High School Scholarship 2000-2003
199
TEACHING AND OUTREACH ScienceScape Camp held by Purdue’s The Science Diversity Office, June 2018 Second Annual Earth Science Passport Day held in Imagination Station 2017 Imagination Station Outreach Event 2016 Certification for Classroom Communication in ESL for TAs (Purdue University) 2014 Spring Fest Event (Department of Earth, Atmospheric, and Planetary Sciences Purdue University) 2013 International Global Fest (International Center, Purdue University) 2012 General Physics I and II Teaching Assistant (National Tsing Hua University) 2010 CONFERENCE ABSTACTS
• Y.-H. Huang, D.A. Minton, N.E.B. Zellner, M. Hirabayashi, J.R. Elliott, C.I. Fassett (2018) “WHAT DO APOLLO IMPACT GLASSES TELL US ABOUT POST-COPERNICAN IMPACT FLUX?” Geological Society of America Annual Meeting held in Indianapolis, U.S. A. (Invited talk).
• Y.-H. Huang, D.A. Minton, J.R. Elliott, N.E.B. Zellner. (2018) “WHAT HAPPENED 800 MILLION YEARS AGO ON THE MOON?” Bombardment: Shaping Planetary Surfaces and Their Environments workshop (Talk).
• Y.-H. Huang, D.A. Minton, N.E.B. Zellner, M. Hirabayashi, J.E. Richardson, C.I. Fassett. (2018) “No Change in the Lunar Impact Flux Through the Copernican Period from Modeling Impact Glass Spherule Age Distribution in Lunar Regolith.” 49th Lunar Planetary Science Conference (Talk).
• Y.-H. Huang, D.A. Minton, N.E.B. Zellner, M. Hirabayashi, J.E. Richardson, C.I. Fassett. (2017) “No Change in the Lunar Impact Flux Through the Copernican Period from Modeling Impact Glass Spherule Age Distribution in Lunar Regolith.” Geological Society of America Annual Meeting held in Seattle, U.S.A. (Talk).
• Y.-H. Huang, D.A. Minton, M. Hirabayashi, J.R. Elliott, C.I. Fassett, N.E.B. Zellner. (2017) “Heterogeneous Impact Transport on the Moon.” New View of the Moon 2 Conference (Talk).
• Y.-H. Huang, T. Hirabayashi, D.A. Minton, J.R. Elliott, A. Freed, C.I. Fassett, J.E. Richardson. (2016) “The Role of Vertical Mixing Process Across Mare and Highland Contacts.” 47th Lunar and Planetary Science Conference. (Poster)
• T. Hirabayashi, D.A. Minton, H.J. Melosh, C. Milbury, Y.-H. Huang, J.M. Soderblom. (2016) “Equilibrium State in Impact-Generated Porosity on a Lunar Surface.” 47th Lunar and Planetary Science Conference. (Poster)
• J. R. Elliott, Y.-H. Huang, D.A. Minton, A.M. Freed. (2016) “The Length of Lunar Crater Rays Explained Using Secondary Crater Scaling.” 47th Lunar and Planetary Science Conference. (Poster)
• Y.-H. Huang, D.A. Minton, J. Richardson, B. Cohen, C. Fassett, and N. Zeller. (2015) “Simulating Three-Dimensional Regolith Transport with the Cratered Terrain Evolution Model.” Workshop on Issues in Crater Studies and the Dating of Planetary Surfaces. (Talk)
• Y.-H. Huang and D.A. Minton (2014). “Modeling the Provenance of Crater Ejecta.” Division for Planetary Sciences Meeting. (Poster)
• S. Saikia, A. Das, F. Laipert, C. Dapkus, J. Kendall, T. Bowling, J. Steckloff, S. Holbert, K. Graves, T. Antony, R. Bobick, Y.-H. Huang, J. Stuart, D. A. Minton, J. M. Longuski. (2014) “Marching Towards Troy: Exploration of Jupiter Trojian Asteroids.” 11th International Planetary Probe Workshop (First Prize Outstanding Student Poster).
• S. Saikia, A. Das, F. Laipert, C. Dapkus, J. Kendall, T. Bowling, J. Steckloff, S. Holbert, K. Graves, T. Antony, R. Bobick, Y.-H. Huang, J. Stuart, D. A. Minton, J. M. Longuski. (2014) “Voyage to Troy: A

200
Mission Concept for the Exploration of the Trojian Asteroids.” Asteroids, Comets, and Meteors (ACM).
• Y.-H. Huang, D.A. Minton, J.E. Richardson (2014). “Modeling Topographic Change by the Ballistic Sedimentation from Orientale Ejeccta.” 45th Lunar and Planetary Science Conference.
• Y.-H. Huang, and I.-G. Jiang (2010). ”The Velocity-Size Relation for Members of Asteroid Families.” The Royal Physcial Society of Republic of China. (Poster)