Ultrafast, Cross-Correlated Harmonic Imaging Through Scattering Media
Upload
independentCategory
view
0download
0
Harmonic Optical Microscopy and Fluorescence LifetimeImaging Platform for Multimodal ImagingVITOR B. PELEGATI,1,2 JAVIER ADUR,1,2* ANDRE A. DE THOMAZ,1 DIOGO B. ALMEIDA,1
MARIANA O. BARATTI,1 LILIANA A. L. A. ANDRADE,3 FATIMA. BOTTCHER-LUIZ,4
AND CARLOS. L. CESAR1
1Biomedical Lasers Application Laboratory. Optics and Photonics Research Center, ‘‘Gleb Wataghin’’ Institute of Physics. StateUniversity of Campinas (UNICAMP). Departamento de Eletronica Quontica. Rua Sergio Buarque de Holanda, 777. CidadeUniversitaria ‘‘Zeferino Vaz’’. Campinas 13083-859. Sao Paulo. Brazil2Microscopy Laboratory Applied to Molecular and Cellular Studies. School of Bioengineering. National University of Entre Rıos(UNER). Ruta 11, km 10, Oro Verde 3101. Entre Rıos. Argentina3Department of Pathology. State University of Campinas (UNICAMP). Faculdade de Ciencias Medicas, Departamento de AnatomiaPatologica. Cidade Universitaria ‘‘Zeferino Vaz’’. Campinas 13083-970. Sao Paulo. Brazil4Department of Obstetrics and Gynecology. State University of Campinas (UNICAMP). Faculdade de Ciencias Medicas, Departamentode Tocoginecologia. Cidade Universitaria ‘‘Zeferino Vaz’’. CAISM. Laboratœrio de Citogenetica e Cultivo Celular. 13083-970 Campinas.Sao Paulo. Brazil
KEY WORDS two-photon excitation fluorescence; second and third harmonic generation;fluorescence lifetime
ABSTRACT In this work, we proposed and built a multimodal optical setup that extends a com-mercially available confocal microscope (Olympus VF300) to include nonlinear second harmonicgeneration (SHG) and third harmonic generation (THG) optical (NLO) microscopy and fluorescencelifetime imaging microscopy (FLIM). We explored all the flexibility offered by this commercial con-focal microscope to include the nonlinear microscopy capabilities. The setup allows image acquisi-tion with confocal, brightfield, NLO/multiphoton and FLIM imaging. Simultaneously, two-photonexcited fluorescence (TPEF) and SHG are well established in the biomedical imaging area, becauseone can use the same ultrafast laser and detectors set to acquire both signals simultaneously.Because the integration with FLIM requires a separated modulus, there are fewer reports ofTPEF1SHG1FLIM in the literature. The lack of reports of a TPEF1SHG1THG1FLIM system ismainly due to difficulties with THG because the present NLO laser sources generate THG in anUV wavelength range incompatible with microscope optics. In this article, we report the develop-ment of an easy-to-operate platform capable to perform two-photon fluorescence (TPFE), SHG,THG, and FLIM using a single 80 MHz femtosecond Ti:sapphire laser source. We described themodifications over the confocal system necessary to implement this integration and verified thepresence of SHG and THG signals by several physical evidences. Finally, we demonstrated the useof this integrated system by acquiring images of vegetables and epithelial cancer biological sam-ples. Microsc. Res. Tech. 00:000–000, 2012. VVC 2012 Wiley Periodicals, Inc.
INTRODUCTION
Nonlinear optical (NLO) microscopy evolved as an al-ternative to conventional single-photon confocal mi-croscopy and has been shown to provide several advan-tages. These include 3D resolved fluorescence imagingof living cells deep within thick, strongly scatteringsamples, and reduced phototoxicity, enabling long-termimaging (Diaspro, 2011). NLO signals depend on theprobability of finding more than one photon in spaceand time, which is dramatically enhanced at the focusof a pulsed femtosecond laser. Moreover, the light pulserepetition is a natural clock to perform fluorescencelifetime imaging microscopy (FLIM). These nondes-tructive techniques have the potential to offer newinsights into complex developmental processes of manybiological settings. Two-photon excited fluorescence(TPEF) provides functional information of molecules,while second harmonic generation (SHG) and thirdharmonic generation (THG) microscopy can be used to
image organized biological extracellular and subcellu-lar structures and interfaces (Chu et al., 2001). Fur-thermore, FLIM is sensitive to the chemical microen-vironment around the fluorophores such as pH, ion,and oxygen concentration (Bird et al., 2004; Proven-zano et al., 2009).
Any single modality typically only furnishes anincomplete picture of the tissue; hence, an approachthat integrates complementary optical imaging modal-ities is needed for a more comprehensive nondestruc-
*V.B.P. and J.A. contributed equally to this work.
*Correspondence to: Javier Adur, National University of Entre Rıos, Departa-mento Biologıa, Ruta 11 Km10, Oro Verde 3101, Entre Rıos Argentina.E-mail: [email protected]
Received 22 December 2011; accepted in revised form 28 April 2012
Contract grant sponsors: CEPOF (the Optics and Photonics Research Center,FAPESP); National Institute of Photonics Applied to Cell Biology (INFABIC).
DOI 10.1002/jemt.22078
Published online inWiley Online Library (wileyonlinelibrary.com).
VVC 2012 WILEY PERIODICALS, INC.
MICROSCOPY RESEARCH AND TECHNIQUE 00:000–000 (2012)

tive and minimally invasive tissue characterization.Integration of the various techniques is one of theevolving areas in bioimaging. Different modalities ofNLO microscopy have been developed and combinedfor imaging complex tissue samples with inherent 3Dspatial resolution.
Two-photon fluorescence (TPFE) microscopy firstappeared in the 1990 (Denk et al., 1990) using a laserscanning Bio-Rad microscope and a femtosecond collid-ing pulse mode (CPM) dye laser. Non-scanning SHGmicroscopy can be traced back to Hellwarth and Chris-tensen in 1975 (Hellwarth and Christensen, 1975). In1978, Gannaway and Sheppard used a sample scan-ning microscope to acquire images of inorganic crystals(Gannaway and Sheppard, 1978). The first biologicalimage was acquired by Freund in 1986 (Freund et al.,1986), still by scanning the sample and not the laser,who observed the orientation of collagen fibers in rat-tailtendon. In the late 90s, Alfano’s group published asequence of articles showing TPEF, SHG, and THG on bi-ological samples. They started with a CPM dye laser andevolved to Ti:sapphire laser, performing the spectroscopicstudies to show that the signals were indeed due to theharmonic generation. In terms of imaging, they used asample scanning to acquire a tomography (y vs z) imageof chicken tissue and even different kinds of tumors(Alfano et al., 2001; Guo et al., 1996, 1997a, 1997b, 1998,1999). The quality of confocal images has been alwaysrelated to the scanning method, laser or sample scan-ning. Only after Amos and White developed a laser scan-ning system in 1987 (Amos and White, 2003) a successfulcommercial system appeared, the Bio-Rad MRC 500. Toour knowledge, the first laser scanning high-resolutionSHG image was obtained in 1999 by Campagnola whoobserved TPEF and SHG of several biological samples(Campagnola et al., 1999). THG tomography (x vs z) ofoptical fiber glasses was observed in 1997 (Barad et al.,1997). Squier et al. showed a laser scanning image ofbiological materials in 1998 (Squier et al., 1998). Chuet al. then showed a multimodal imaging includingTPEF1SHG1THG in 2001 (Chu et al., 2001).
FLIM was observed in laser scanning system in 1989(Bugiel et al., 1989) and combined with TPFE in 1996(Konig et al., 1996; Yu et al., 1996). Since then, itbecame clear that FLIM is a technique that can be inte-grated with all different NLO microscopies providingimportant information about the molecules chemicalenvironment (Zoumi et al., 2002).
The most common commercial excitation source fornonlinear microscopy is the Ti:sapphire laser with fem-tosecond pulses, average output power of several watts,repetition rate around 80 MHz, and a tuning wave-length range approximately between 690 and 1,040nm. For THG microscopy, however, the THG signal isgenerated in the 230–350-nm UV wavelength rangewhere there is a strong absorption, which limits itsapplication to thin biological specimens. Moreover, thecommercial microscope optics, coatings and transmis-sion, are usually not adequate for this UV region. Toavoid these problems, several groups are using lasersources with wavelengths longer than 1,200 nm.Cr:Forsterite laser at excitation wavelength of 1,230nm and repetition rate of 110 MHz is widely used(Chan et al., 2008; Chu et al., 2001). Other lasersinclude optical parametric oscillators (OPO) working at
the wavelength of 1,500 nm and repetition rate of �80MHz (Canioni et al., 2001); optical parametric ampli-fiers at 1,200 nm and 250 kHz repetition rate pumpedby a Ti:sapphire laser (Squier et al., 1998); and fiberlasers at 1,560 nm with repetition rate of 50 MHz(Millard et al., 1999). Some new laser sources beingused for nonlinear microscopy are Yb:glass, Nd:glass,Cr:LiSAF, and fiber lasers. However, these laser sour-ces are expensive and difficult to use.
Recently, a multimodal microscopic technique wasimplemented by a combination of THG, SHG, andMPEF image contrast methods on the same microscope(Gualda et al., 2008). Similarly, in the last year, webuilt a multimodal microscopic combining TPFE, SHG,and THG in the same platform (Adur et al., 2011).Other important reports on confocal setups modifiedfor harmonic generation could be find at (Carrileset al., 2009; Cox et al., 2005; Sun, 2005; Sun et al.,2004). However, these home built systems lack theFLIM modality.
In this work, we show how to build a nonlinear/mul-tiphoton microscope on a commercial confocal systemplatform (inverted Olympus IX81 with FV300 scanhead), easy-to-operate, capable to perform TPFE, SHG,THG, and FLIM imaging, using only the standard fem-tosecond Ti:sapphire laser. To our knowledge, this isthe first report of a multimodal system includingTPEF1SHG1THG1FLIM. We demonstrated that it ispossible to obtain good THG signal, even for thick bio-logical samples, with excitation wavelength below1,000 nm. We show the modifications over the scanhead and the detector we made to acquire THG signals,present the physical evidences of the higher harmonicspresence and applied this multimodal system to ac-quire images of plant samples and ovarian cancer tis-sues.
MATERIALS ANDMETHODSConstruction of a Multimodal Nonlinear Optical
Imaging Platform
In this section, we provide details of our multimodalworkstation, including the excitation source, confocalmicroscope and the implementation of the backwardand forward detection systems.
The Excitation Source and Confocal Micro-scope. The schematic of the setup is shown in Figure 1.The femtosecond laser is a Ti:Sapphire Mai Tai high-pass (HP) spectra-physics (Irvine), which provides<100 fs pulses from 690 to 1,040 nm with 80-MHz repe-tition rate and output power from 1 to 3.5 W. It wasequipped with a DeepSee for group-velocity dispersioncompensation and a broadband half-wave plate,coupled to a calcite polarizing beam splitter, as anattenuator. The beam is coupled to the scan headthrough a custom made port and a dichroic mirror. Acollimating telescope (L1, L2) is used to adjust both thebeam diameter to fill the objective back-aperture of thePLANAPO 403 high numerical aperture (NA) (1.3 NA)oil immersion objective and the beam focus position onthe microscope focal plane.
An Olympus FV300 scanner and the laser combinerFV-5 COMB 2 by Olympus (Olympus, Tokyo, Japan)system built onto an Olympus inverted research micro-scope IX-81 is used in the setup. The FV300 scannerunit has two input ports, one for a continuous wave
Microscopy Research and Technique
2 PELEGATI ET AL.

(CW) laser, and the other specifically designed for thepulsed Ti:Sapphire laser. The other components in theexcitation pathway are dichroic mirror to couple both,CW and pulsed lasers, excitation dichroic mirror, XYgalvanometer mirror scanners, and pupil lens. The ex-citation for confocal microscopy is provided by an Ar-gon ion laser. Light from the laser source is broughtinto the scan head using an optical fiber cable. Theinverted IX-81 microscope used in the setup is a fullymotorized advanced research microscope, which pro-vides halogen lamp as well as epifluorescent imagingusing an epifluorescent attachment and UV lamp.Standard differential interference contrast (DIC) mi-croscopy could also be obtained simultaneously withconfocal imaging.
The system offers standard three-channel detection,two internal (inside of scan head), and one external, fortransmitted light imaging. The epidetected fluorescencelight is collected with the objective, descanned at thegalvo-mirrors, separated from the excitation by adichroic emission beam splitter, and focused on the pin-hole with a collector lens. Our pinhole turret has 60,100, 150, 200, and 300 lm confocal apertures. A dichroicfilter after the pinhole allows the selection of two wave-length windows, each one with a barrier filter in front ofthe internal photomultiplier detector to completelyblock the laser. The microscope back ports and two sideports were used for harmonic and FLIM detection.
Detection of Nonlinear Signals. NLO imageswere acquired with the 940 nm excitation, generating aTPFE above 500 nm, SHG at 470 nm and THG at 313nm. For this work, FLIM data were acquired with the890 nm excitation, which excites mainly the fluores-
cence of flavin adenine dinucleotide (FAD) (Skala et al.,2007).
TPEF and FLIM signals were detected in backwardconfiguration. In particular, the TPEF signal was des-canned detected with the internal scan head photomul-tiplier tubes (PMT) [R3896 PMTs; Hamamatsu Pho-tonics, Hamamatsu City, Japan] after a blocking filter(SP) E-700-SP (Omega Filters) to prevent back-reflected laser light with a completely open pinhole.FLIM signal was non-descanned detected using an in-ternal dichroic beamsplitter and one side port of the IX-81 microscope. Data were collected pixel by pixel with afast photon-counting PMT detector (Becker & Hickl,PMH-100) and time correlated single photon-countingelectronics (Becker & Hickl, SPC-830), after a HP filter(E-690-HP, Omega Filters). This non-descanned FLIMdetector is equipped with overload shutdown and elec-tronically controlled shutters to minimize the risk of de-tector damage. The shutter assembly also contains thelens that transfers the photons to the detector. FLIMand TPEF can be acquired simultaneously.
SHG and THG signals were collected in forwarddirection using an external detector. THG UV signal isgenerated at the sample, but it can be absorbed by opti-cal elements in the beam pathway. To avoid this, wedecided to place the detector right after the sample.For that, we replaced the microscope condenser with aspecial homemade PMT support and hold it as close tothe sample as possible, without touching it, but withenough space for the optical filters (Fig. 2, top photo-graphs). The PMT large area assured a good NA collec-tion angle. To detect SHG signal, we used an E700-SPshort pass-filter followed by a narrow (10 nm full width
Fig. 1. Schematic diagram of a multimodal NLO microscope usinga femtosecond laser source. The Mai Tai output at 940 nm is couple tothe FV300 confocal scanning head and inverted microscope OlympusIX-81 (Olympus, Japan). The 940-nm beam is used for TPEF, SHG,and THG imaging. The signal beam at 890 nm is used also for TPEFand FLIM imaging. One internal PMT detector is used for TPEF
backward analysis and other PMT external detectors is added for for-ward SHG and THG detection. Backward FLIM signal is detected inNDD way with B&H detector. k/2, half wave plate; PBS, polarizingbeam splitter; L1-L2, telescope lens; DM1 and DM2, dichroic mirrors;SP, short pass filter; LP, long past filter. [Color figure can be viewed inthe online issue, which is available at wileyonlinelibrary.com.]
Microscopy Research and Technique
3MULTIMODAL OPTICAL SETUP FOR NLO MICROSCOPES

at half maximum (FWHM)) bandpass optical filter cen-tered at half the excitation wavelength (475BP, Bio-Rad) to reject the excitation laser beam and anyunwanted fluorescence. To collect THG images, wereplaced both SHG filters with two colored glass filtersU340 6 30 nm (Hoya Corporation). SHG and THGimages were acquired one after the other due to theexchange of the optical filters, but simultaneously withthe TPEF images. Both TPEF were compared to makesure that the sample did not move during the opticalfilter exchange procedure. Except for this exchange offilters, the system is very friendly to use.
A complete illustration of the different light paths,filters, dichroic mirrors, and detectors distributionsthat compose this multimodal system can be found inFigure 2. Blue and dark red lines indicate CW Argonlaser and pulsed near infrared (NIR) excitation lightdirected onto the sample for confocal and NLO modal-ity, respectively. Green lines indicate fluorescenceemission light from confocal and epifluorescencemodes. Red and blue lines indicate forward propagat-
ing SHG and THG signal, respectively, while yellowlines indicate the backward propagating FLIM signal.
Acquisition and Analysis. All TPFE, SHG, andTHG images were acquired with 512 3 512 pixel spa-tial resolution, using 5ms for the pixel dwell time, withtotal scanning time of the order of 3 s, after a five-frames Kalman filtering. Images (pseudogreen TPEF,pseudored SHG, and pseudomagenta THG) were com-bined into a single image for visualization using Olym-pus Fluoview Image Browser. For visual presentation,images were optimized by background thresholdingand histogram stretching. Although these techniquesimproved visual image contrast and presentation, allimage analyses processed with ImageJ (NIH, availablefrom http://rsb.info.nih.gov/ij) were performed on theunprocessed images to avoid any artifacts. FLIM datawere collected for 60 s with a 256 3 256-pixel framesize. The imaging program (SPCImage Ver. 2.9, Becker& Hickl) determines the best exponential fit to the his-tograms at each pixel and displays lifetime data utiliz-ing a color-mapping scheme.
Fig. 2. Real setup showing in the center: laser way and OlympusFV300 confocal scanning head coupled to the inverted microscopeOlympus IX-8, in the top: external PMT and special holder and in thebottom: internal vision of scan head and FLIM setup detection. 1: MaiTai laser and DeepSee module, 2: reflected IR mirror, 3: half waveplate and polarizing beam splitter, 4: telescope, 5: reflected IR mirror,6: scan head 7: inverted microscopy, 8: holder and box filters, 9: exter-
nal PMT, 10: Argon laser, 11: input port to Argon laser, 12: input portto Mai Tai, 13 and 14: dichroic mirrors, 15: galvanometer mirror scan-ners, 16: collector lens, 17: short pass filter, 18: pinhole, 19: internalPMT, 20: FLIM NDD port, 21: shutter and 22: photon-counting PMTdetector. [Color figure can be viewed in the online issue, which isavailable at wileyonlinelibrary.com.]
Microscopy Research and Technique
4 PELEGATI ET AL.

Sample Preparation
For the illustration of the workstation capabilities,we utilized different biological samples. For a quickand easy evaluation of our system, we first workedwith vegetables and used fresh Solanum tuberosum(potato) and Allium cepa (onion samples). Using a scal-pel, thick sections (�300 lm) were obtained for tridi-mensional reconstruction. Finally, to demonstrate theutility of this multimodal system, we work with humanbiopsies and recognized differences between varioussubtypes of mucinous ovarian tumor. These biopsieswere obtained from women attending at Women’sHealth Center CAISM, Campinas, SP, Brazil, and theproject was approved by the Institutional Ethics Com-mittee (Faculty of Medical Sciences, Unicamp). Ovar-ian specimens collected during surgical procedureswere prepared following a standard histological proce-dure: fixed in 10% buffered formalin, embedded in par-affin, cut in 4-lm thick sections and mounted on slides.Slides from serial sections were stained with H&E andcovered with coverslips. We also used unstained slidesto perform FLIM analysis. Each H&E stained tissuesection was evaluated by a certified pathologist, basedon established World Health Organization histologicalcriteria.
RESULTS AND DISCUSSIONCharacteristics and Contrast Mechanism of the
Implemented Techniques
TPEF is a third-order NLO resonant process wheretwo photons excite an electron from the ground state.It is an inelastic process where photon energy isreleased at the sample. Two-photon absorption hap-pens only when the energy of the incident photons fallinto the two-photon excitation band which is specificfor each fluorescent marker. The two-photon excitationband is not exactly half of the one photon excitationband because the selection rules are different. The factthat two-photon excitation (TPE) depends on the squareof the incident light provides its confocal characteristics,that is, a process happening only at a focal point vol-ume. On the other hand, the emission after the excita-tion is an incoherent optical process with a lifetime thatdepends not only on the excited molecule, but on thechemical environment around it. Photobleaching issmaller in TPFE compared to single photon excitationbecause the excited volume is smaller. Therefore, TPEFallow the observation of specific markers, by choosingboth, the excitation and emission wavelength, as well asby observing different fluorescence lifetimes.
SHG and THG, on the other hand, are coherent sec-ond/third-order elastic NLO processes. Because two/three photons generate another photon with two/threetimes the energy of the incident photons, there is noenergy released to the medium, meaning no infocuscell photodamages are expected from these processes,although there is always a damage threshold intensity,or fluence, for ultrafast laser pulses due to multiphotonionization. Both SHG/THG can be isolated from fluo-rescence by the wavelength or even by time gating,because the coherent processes are practically instan-taneously. The fact that SHG signal is proportional toI2 while THG signal is proportional to I3, where I is theincident light intensity, which provides confocality for
both techniques. For the same wavelength of the inci-dent light, THG has better optical sectioning resolutionthan SHG. One practical problem with THG is the factthat its wavelength range in the UV-blue part of thespectrum tends to become resonant with molecule’selectron level transitions, with higher absorption.Besides, scattering also increases in the UV-blue range.(Carriles et al., 2009).
Usually, the third-order nonlinear susceptibility (v3),responsible for THG, is much smaller than the second-order nonlinear susceptibility (v2), responsible forSHG. In principle, this would mean that THG shouldbe much harder to observe. However, v2, as well as anyother even susceptibilities coefficients, must be null inthe presence of inversion symmetry. Therefore, SHGshall be zero in the presence of centrosymmetric mole-cules, unless an external parameter, such as electricfields or interfaces, breaks the symmetry. On the otherhand, all materials have nonzero third-order suscepti-bility v3. Moreover, v3 can be several orders ofmagnitude larger or smaller for different materials.Compared to only a fractional difference �20% of therefractive indexes, (v1) of most materials, this wouldmean a much higher contrast than phase contrast orDIC microscopy. However, THG is null in a homogene-ous material, no matter how high v3 could be, becausethe Gouy-phase shift of p across the focus of a Gaussianexcitation beam creates a destructive interferencebetween signals generated before and after the focus(Boyd, 1992). However, for a nonhomogeneous focalvolume a measurable amount of THG is generated(Debarre and Beaurepaire, 2007). Because heterogene-ity is more common in biology than homogeneity, THGprovides an important tool for bioimaging, with thewarning that it tends to be brighter at the interface oflarge granules, droplets or other biostructures com-pared to the internal signal.
SHG imaging modality can probe molecular organi-zation on the microscale as well as the nanoscale. SHGcancellation occurs whenever emitters are aligned inopposing directions within the focal volume of the laser.Such situation occurs in isotropic media and mediawith cubic symmetry. Nonlinear emission dipolesaligned in an antiparallel arrangement produce SHGexactly out of phase; and hence, the signals cancel dueto destructive interference. Selective SHG cancellationdue to central symmetry has recently been observed inseveral biologically relevant systems including lipidvesicles infused with styryl dye, anisotropic bands inmuscle cells, and plant starch granules (Moreauxet al., 2000; Prent et al., 2008). In biological materialswhere SHG emitters are well organized in noncentro-symmetric microcrystalline structures, the SHG fromdifferent emitters adds coherently resulting in veryintense SHG. Some examples of such structuresinclude the starch granules, other polysaccharides, col-lagen, striated muscle, and chloroplasts (Campagnolaand Yuan-Dong, 2011; Chu et al., 2001).
THG have been used to monitor embryo developmentand mitosis in zebra fish (Chu et al., 2003; Sun et al.,2004), to observe human glial cells (Barille et al.,2001), cardiomyocites (Barzda et al., 2005), green algaerhizoids (Squier et al., 1998), chloroplasts (Mulleret al., 1998), erythrocytes (Millard et al., 1999), epithe-lial, neuron, and muscle cells (Yelin et al., 2002), and
Microscopy Research and Technique
5MULTIMODAL OPTICAL SETUP FOR NLO MICROSCOPES

Ca21 intracellular dynamics (Canioni et al., 2001). Ourexperience with both techniques using the systemdescribed in this article to study cancer tumors is thatSHG is excellent to observe collagen network of extrac-ellular tissue, whereas THG can display clearly thenuclei, two very important information for pathologists(Adur et al., 2011).
Characterization of SHG and THG Signal
We first evaluate the ability of our system to detectSHG and THG signal using a wavelength of the excita-tion below 1,000 nm. We used 940 nm in this work gen-erating a SHG signal at 470 nm (visible) and a THGsignal at 313 nm (ultraviolet), respectively. To collecttransmitted SHG and THG simultaneously, we wouldneed to use a high NA (Cox et al., 2005; Millard et al.,2003) condenser to collect both signal and then splitthem with a dichroic to two PMTs. The condenser shallhave a NA similar or higher than the objective lens toachieve optimal collection of the signals and also agood transmission curve in UV region (Carriles et al.,2009). However, our specific condenser had neither theright NA nor the good UV transmission, probably dueto the lenses optical coatings. Therefore, we decided tosimply remove the condenser and place the PMT asclose as possible to the sample to increase the collectionangle. Figure 3 shows a comparison of SHG and THGsignal generated by a fixed breast tissue sample col-lected with (row A) and without (row B) the condenser.For all laser powers tested (100–400 mW), good SHG(red) and THG (magenta) signal were detected usingthe PMT directly over the sample (without condenserlens, row B) but only good SHG signal was detectedusing the condenser (row A). A weak THG signal wasdetected only at the highest power (400 mW, row A)with the condenser. At this laser power without thecondenser (row b), the SHG signal was saturated and
the sample was damaged after sometime. The mainproblem with the condenser was the poor UV transmis-sion, because its collection NA was better than the col-lection NA of the PMT directly over the sample. We,therefore, demonstrated that removing the condenserlens and using a special support for an external PMT(Fig. 2, top photographs), it is possible to get good THGsignal from a femtosecond Ti:sapphire laser. However,in this geometry, it was impossible to collect both,transmitted SHG and THG, simultaneously.
We also tested the THG contrast to local heterogene-ities of size smaller or comparable to the beam focus(Debarre and Beaurepaire, 2007). To do that we ana-lyzed the THG generated by the 940-nm laser beam inthe air-glass interface shown in Figure 4 where theMai Tai laser was focused with a lens into a coverslippositioned in a translation stage. The resultant emis-sion was registered using a monochromator/charge-coupled device (CCD) system (Acton Research modeloSpectra-Pro 300i/CCD ‘‘back-illuminated’’ PrincetonInstruments). THG signal only appeared, visible to anaked eye, when the laser was focused at the air-glassinterface. It disappeared when we removed the lensbut not the 940 nm excitation, which was also detectedby the CCD. We varied the laser power from 430 to1,140 mW, measured before the lens, and performedthe same measurements shown in Figure 4A for differ-ent laser intensities. Figure 4B (black plot) shows theresult of the wavelength integrated THG signal versuslaser power in a log-log plot, which presented theexpected THG signal proportional to the cube of thelaser intensity. We then performed a similar experi-ment directly in the microscope setup shown in Figure1 by placing a coverslip (170 lm thickness) in the objec-tive focus and acquiring several scanning images at dif-ferent depths (Fig. 4C). The THG intensity wasobtained with the Olympus Fluoview software. Figure
Fig. 3. Representative SHG and THG images from a thin section(�5 lm) of normal human breast sample stained with H&E. The sig-nals were obtained using different setup (A) with condenser lens and(B) without condenser lens. All images were captured with same gain
of PMT and varying the power laser between 100 and 400 mW. THGwas difficult to detect (setup A) due to poor UV transmission of thecondenser lens. Scale bar 5 50 lm. [Color figure can be viewed in theonline issue, which is available at wileyonlinelibrary.com.]
Microscopy Research and Technique
6 PELEGATI ET AL.

4D shows the plot of the THG intensity vs focal posi-tion, which presents a peak at the focal position anddisappeared after �1 lm dislocation for each side.Next, we exchanged the filters to detect the SHG signalfrom ovary tissues specimen, which has rich collagen
content in the stroma (Kirkpatrick et al., 2007), a pro-tein well known as a good source of SHG signal (Cam-pagnola and Yuan-Dong, 2011). Using this sample, weperformed two experiments. First, we measured theSHG intensity as a function of laser power varying
Fig. 4. THG and SHG characterizations. A: Schematic setup usedto analyze the THG generated in the air-glass interface. B: Log–loggraph of THG intensity (black plot) and SHG intensity (red plot) forlaser output power. The circles and triangles are experimental dataand the solid lines are lines with slopes near to 2 (red) and 3 (black),respectively. C: Several THG images at different depth of glass-airinterface of coverslip. D: TGH intensity of signal shows in C, the max-imum is obtained when the interface are in focal position. E: In theleft, images used to perform log–log graph of SHG intensity (B),obtained at the different excitation power conditions (10–450 mW).
The specimens are serial sections of fixed stained-H&E and unstainedpiece of a human ovary excited at 940 nm. In the right, SHG andFLIM images of ovarian stroma excited at 890 nm. Collagen fibers(yellow arrows) show very fast lifetime components (blue color) com-parative to auto fluorescence of epithelial cells (yellow/green color). k/2, half wave plate; PBS, polarizing beam splitter; L, lens; U340, THGfilter; St, stroma; Ep, epithelium; epithelial/stromal interface is indi-cated (white outline). Scale bar 5 20 lm. [Color figure can be viewedin the online issue, which is available at wileyonlinelibrary.com.]
Microscopy Research and Technique
7MULTIMODAL OPTICAL SETUP FOR NLO MICROSCOPES

from 10 to 450 mW (Fig. 4E) and checked that it wasproportional to the second power of the incident light(Fig. 4B, red plot). The intensity value is an average ofthe whole image and was measured using ImageJ soft-ware. Second, we acquired a lifetime (FLIM) imageover the same sample and checked that the lifetimewas within the instrument response function in theregions correspondent to collagen fibers (Fig. 4E, yel-low arrows). Taken all these results together we veri-fied, therefore, that we were actually observing secondand THG signal.
Simultaneous Acquisition Signals with TPFE
To demonstrate the system flexibility and easy touse, we show in Figure 5 the different acquisition modesand possibilities of combination into a single imageusing the Olympus Fluoview Image Browser (Fig. 5, or-ange shading). We first checked that SHG (red) andTHG (magenta) signal are superposed correctly afterthe exchange of filters. To do this, we use the TPFE(green) signal captured simultaneously with both, SHGand THG, as an image superposition control. This proce-dure was repeated with FLIM images as well. Figure 5shows the good correspondences obtained with thissetup and that our filter box, careful designed to allowan easy displacement, was working properly. Next, wethen proceed to image acquisition of several samples.
Figure 5 shows representative NLO images froma thin section (�5 lm) of normal human ovary sam-ple stained with H&E. Recent reports (Adur et al.,2011; Tuer et al., 2010;) showed that H&E tradi-tional staining method is not only useful to generateTPFE signal but that it also enhanced the THG sig-
nal without any harm to the SHG signal. We cansee that TPEF signal corresponding to eosin fluores-cence was strong outside the nuclei but weak in thenuclear regions. The SHG corresponds to collagenwithin the stromal connective tissue and the THGsignal strongly highlights the nuclei. The FLIMimages provide more information and allow the cor-relation of the lifetime to these different structures.These results agree with the literature (Nadiarnykhet al., 2010; Williams et al., 2010) and shows thatthe structural information revealed by each nonlin-ear contrast mechanism can be isolated and ana-lyzed separately with this system, while their super-imposition allows a better comparison and under-standing of the spatial organization of the tissue.
SHG and THG Microscopes in Thick Samples
After checking that SHG and THG can be superim-posed correctly, we demonstrated that our system canalso work with thick unstained fresh samples. Figure 6shows maximum projection images of Allium cepa (on-ion, Fig. 6A) and Solanum tuberosum (potato, Fig. 6B)samples. Approximately, between 50- and 300-lm thicksections were immediately analyzed after removal.Final SHG and THG images superposition are pre-sented. The superposition of SHG and THG images inpotato do not correlate well probably due to tissuedehydration that happened between the image acquisi-tion and filter exchange, resulting in a deformation ofthe structures. In onion samples, elongated and ovalbig cells are observed by the harmonic signal origi-nated at the interface of secondary cell wall (Mizutaniet al., 2000). The nucleus is observed principally by
Fig. 5. Representative NLO images from a thin section (�5 lm) ofnormal human ovary sample stained with H&E. Different acquisitionmodes and possibilities of combination using NLO microscopy plat-form are presented. SHG (red), THG (magenta), and FLIM (blue/yel-low/green) images were obtained simultaneity with TPEF (green)
images. Superimposition of each modality is show inside orange shad-ing rectangle. St, stroma; Ep, epithelium; epithelial/stromal interfaceis indicated (white outline). Scale bars 5 20 lm. [Color figure canbe viewed in the online issue, which is available at wileyonlinelibrary.com.]
Microscopy Research and Technique
8 PELEGATI ET AL.
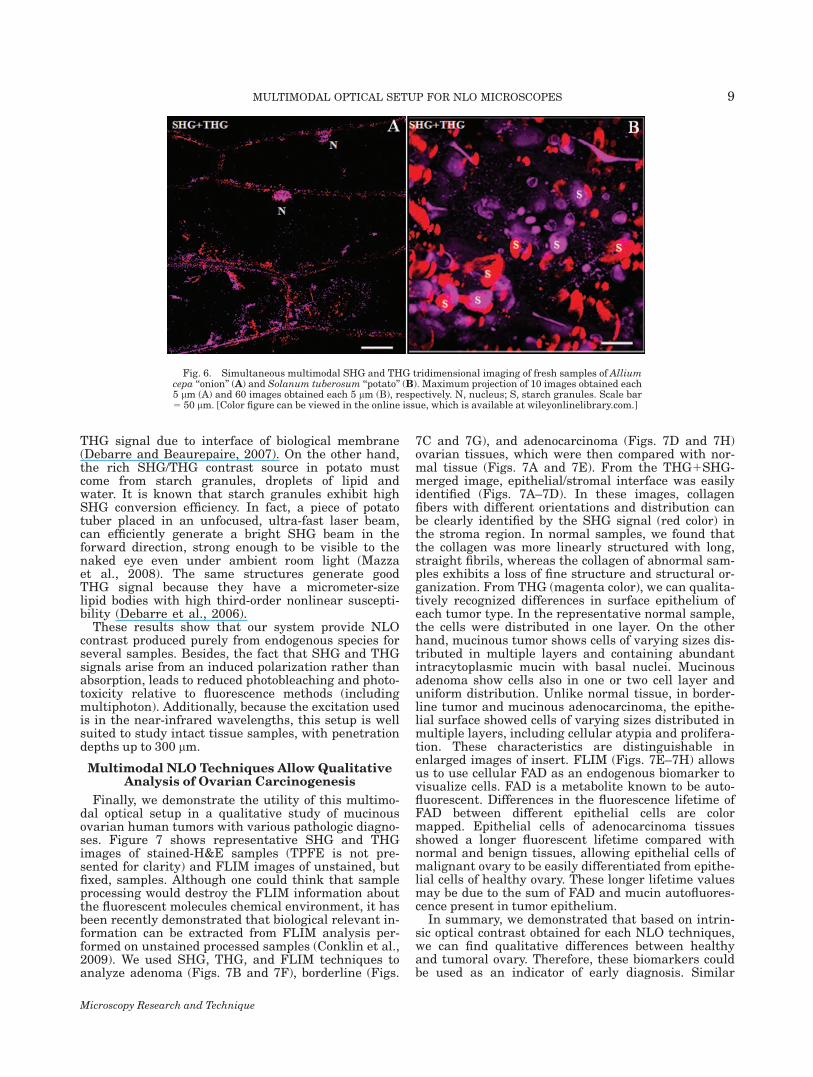
THG signal due to interface of biological membrane(Debarre and Beaurepaire, 2007). On the other hand,the rich SHG/THG contrast source in potato mustcome from starch granules, droplets of lipid andwater. It is known that starch granules exhibit highSHG conversion efficiency. In fact, a piece of potatotuber placed in an unfocused, ultra-fast laser beam,can efficiently generate a bright SHG beam in theforward direction, strong enough to be visible to thenaked eye even under ambient room light (Mazzaet al., 2008). The same structures generate goodTHG signal because they have a micrometer-sizelipid bodies with high third-order nonlinear suscepti-bility (Debarre et al., 2006).
These results show that our system provide NLOcontrast produced purely from endogenous species forseveral samples. Besides, the fact that SHG and THGsignals arise from an induced polarization rather thanabsorption, leads to reduced photobleaching and photo-toxicity relative to fluorescence methods (includingmultiphoton). Additionally, because the excitation usedis in the near-infrared wavelengths, this setup is wellsuited to study intact tissue samples, with penetrationdepths up to 300 lm.
Multimodal NLO Techniques Allow QualitativeAnalysis of Ovarian Carcinogenesis
Finally, we demonstrate the utility of this multimo-dal optical setup in a qualitative study of mucinousovarian human tumors with various pathologic diagno-ses. Figure 7 shows representative SHG and THGimages of stained-H&E samples (TPFE is not pre-sented for clarity) and FLIM images of unstained, butfixed, samples. Although one could think that sampleprocessing would destroy the FLIM information aboutthe fluorescent molecules chemical environment, it hasbeen recently demonstrated that biological relevant in-formation can be extracted from FLIM analysis per-formed on unstained processed samples (Conklin et al.,2009). We used SHG, THG, and FLIM techniques toanalyze adenoma (Figs. 7B and 7F), borderline (Figs.
7C and 7G), and adenocarcinoma (Figs. 7D and 7H)ovarian tissues, which were then compared with nor-mal tissue (Figs. 7A and 7E). From the THG1SHG-merged image, epithelial/stromal interface was easilyidentified (Figs. 7A–7D). In these images, collagenfibers with different orientations and distribution canbe clearly identified by the SHG signal (red color) inthe stroma region. In normal samples, we found thatthe collagen was more linearly structured with long,straight fibrils, whereas the collagen of abnormal sam-ples exhibits a loss of fine structure and structural or-ganization. From THG (magenta color), we can qualita-tively recognized differences in surface epithelium ofeach tumor type. In the representative normal sample,the cells were distributed in one layer. On the otherhand, mucinous tumor shows cells of varying sizes dis-tributed in multiple layers and containing abundantintracytoplasmic mucin with basal nuclei. Mucinousadenoma show cells also in one or two cell layer anduniform distribution. Unlike normal tissue, in border-line tumor and mucinous adenocarcinoma, the epithe-lial surface showed cells of varying sizes distributed inmultiple layers, including cellular atypia and prolifera-tion. These characteristics are distinguishable inenlarged images of insert. FLIM (Figs. 7E–7H) allowsus to use cellular FAD as an endogenous biomarker tovisualize cells. FAD is a metabolite known to be auto-fluorescent. Differences in the fluorescence lifetime ofFAD between different epithelial cells are colormapped. Epithelial cells of adenocarcinoma tissuesshowed a longer fluorescent lifetime compared withnormal and benign tissues, allowing epithelial cells ofmalignant ovary to be easily differentiated from epithe-lial cells of healthy ovary. These longer lifetime valuesmay be due to the sum of FAD and mucin autofluores-cence present in tumor epithelium.
In summary, we demonstrated that based on intrin-sic optical contrast obtained for each NLO techniques,we can find qualitative differences between healthyand tumoral ovary. Therefore, these biomarkers couldbe used as an indicator of early diagnosis. Similar
Fig. 6. Simultaneous multimodal SHG and THG tridimensional imaging of fresh samples of Alliumcepa ‘‘onion’’ (A) and Solanum tuberosum ‘‘potato’’ (B). Maximum projection of 10 images obtained each5 lm (A) and 60 images obtained each 5 lm (B), respectively. N, nucleus; S, starch granules. Scale bar5 50 lm. [Color figure can be viewed in the online issue, which is available at wileyonlinelibrary.com.]
Microscopy Research and Technique
9MULTIMODAL OPTICAL SETUP FOR NLO MICROSCOPES

results are shown in the literature using SHG andTHG in ovarian tumors from mouse model (Kirkpatricket al., 2007; Nadiarnykh et al., 2010; Williams et al.,2010). Recently, we quantify these differences in serousovarian human tumor type (Adur et al., 2011), but thisis the first time that FLIM results are presented inhuman ovarian tumor of this type.
CONCLUSION AND PERSPECTIVES
In this work, we presented a multimodal opticalsetup that extends a commercially available confocal
microscope to include NLO microscopy techniques.We demonstrated that our setup, built on a confocalsystem platform, is easy-to-operate and can operatewith a single standard excitation femtosecond pulseTi:sapphire laser source. This method provides acost-efficient way to maximize the bioimaging capa-bilities of NLO microscopy. Ti:sapphire lasers tuningrange in the near IR region, from 690 to 1,040 nm,represents a golden window for tissue imaging,while the femtosecond pulses allow efficient genera-tion of TPEF, SHG, THG and FLIM, signals. We
Fig. 7. Representative multimodal images of stained-H&E sam-ples for SHG and THG analyses (A–D) and unstained samples forFLIM study (E–H). SHG (red), THG (magenta) and FLIM (blue/yel-low/green) images of normal (A, E), adenoma (B, F), borderline (C, G)and adenocarcinoma (D, H) mucinous ovarian human tissues. St,
stroma; Ep, epithelium; epithelial/stromal interface is indicated(white outline). Mucin content is indicated with yellow and white as-terisk; and epithelial cells are indicated with yellow arrowhead. Scalebars 5 20 lm. [Color figure can be viewed in the online issue, which isavailable at wileyonlinelibrary.com.]
Microscopy Research and Technique
10 PELEGATI ET AL.

used this platform to obtain good THG signal inthin and thick fresh biological with 940-nm excita-tion wavelength.
Although the results presented in this work demon-strate only a small subset of the capabilities of the sys-tem, numerous other applications exist in which com-bined linear and NLO techniques can be important. Inthis article, we present some practical applications ofthe developed platform in the field of cancer pathology.Nevertheless, there is a vast field of possible applica-tions that could benefit with the use of this tool. Thepresented system has great potential for improve-ments. The first one would be to build a system capa-ble to acquire SHG and THG images simultaneously,by adding a condenser lens with higher NA and UVlenses, and two independent PMTs, avoiding thenecessity to exchange filters. Also, OPO lasers can beadded to obtain CARS images. The integration ofCARS, SHG, THG, FLIM, and multiphoton fluores-cence on the same microscope platform will greatlyenhance the capability, applicability, and versatility ofNLO microscopy.
In summary, the multimodal workstationdescribed here offers a highly flexible, versatile, andcomplete solution, providing an extremely usefultool of investigation in biology by a simultaneoususe of a combination of linear and NLO techniques.The integration of the various microscopy techni-ques is one of the evolving areas in bioimaging thatpromises to have a strong impact on the under-standing and early detection of various diseases. Inthis work, we demonstrate qualitatively that multi-modal NLO microscopy successfully visualized char-acteristic features found in benign and malignantlesions of the human ovary. Distinctive SHG, THG,and FLIM patterns were observed in the epithelial/stromal interface of the adenoma, borderline, andadenocarcinoma samples.
ACKNOWLEDGMENTS
The authors are grateful to FAPESP. This work isalso linked with CEPOF (the Optics and PhotonicsResearch Center, FAPESP) and the National Instituteof Photonics Applied to Cell Biology (INFABIC).
REFERENCES
Adur J, Pelegati VB, Costa LF, Pietro L, de Thomaz AA, Almeida DB,Bottcher-Luiz F, Andrade LA, Cesar CL. 2011. Recognition of serousovarian tumors in human samples by multimodal nonlinear opticalmicroscopy. J Biomed Opt 16:096017.
Alfano RR, Guo Y, Liu F, Ho PP. Non-linear optical tomography of tur-bid media, US Patent#6,208,886 B1, March 27, 2001.
Amos WB, White JC. 2003. How the confocal laser scanning micro-scope entered biological research. Biol Cell 95:335–342.
Barad Y, Eisenberg H, Horowitz M, Silberberg Y. 1997. Nonlinearscanning laser microscopy by third harmonic generation. Appl PhysLett 70:922–924.
Barille R, Canioni L, Rivet S, Sarger L, Vacher P, Ducret T. 2001. Vis-ualization of intracellular Ca21 dynamics with simultaneous two-photon-excited fluorescence and third-harmonic generation micro-scopes. Appl Phys Lett 79:4045–4047.
Barzda V, Greenhalgh C, der Au JA, Elmore S, van Beek J, Squier J.2005. Visualization of mitochondria in cardiomyocytes by simulta-neous harmonic generation and fluorescence microscopy. OptExpress 13:8263–8276.
Bird DK, Eliceiri KW, Fan CH, White JG. 2004. Simultaneous two-photon spectral and lifetime fluorescence microscopy. Appl Opt43:5173–5182.
Boyd R. 1992. Nonlinear optics,1st edn. New York: Academic Press.
Bugiel I, Konig K, Wabnitz H. 1989. Investigations of cells by fluores-cence laser scanning microscopy with subnanosecond time resolu-tion. Lasers Life Sci 3:47–53.
Campagnola PJ, Wei MD, Lewis A, Loew LM. 1999. High-resolutionnonlinear optical imaging of live cells by second harmonic genera-tion. Biophys J 77:3341–3349.
Campagnola1 PJ, Yuan Dong C. 2011. Second harmonic generationmicroscopy: principles and applications to disease diagnosis. LaserPhoton Rev 5:13–26.
Canioni L, Rivet S, Sarger L, Barille R, Vacher P, Voisin P. 2001.Imaging of Ca21 intracellular dynamics with a third-harmonic gen-eration microscope. Opt Lett 26:515–517.
Carriles R, Schafer DN, Sheetz KE, Field JJ, Cisek R, Barzda V, Syl-vester AW, Squier JA. 2009. Invited review article: Imaging techni-ques for harmonic and multiphoton absorption fluorescence micros-copy. Rev Sci Instrum 80:081101. Review.
Chan MC, Chu SW, Tseng CH, Wen YC, Chen YH, Su GD, Sun CK.2008. Cr:Forsterite-laser-based fiber-optic nonlinear endoscopewith higher efficiencies. Microsc Res Tech 71:559–563.
Chu SW, Chen IH, Liu TM, Chen PC, Sun CK, Lin BL. 2001. Multimo-dal nonlinear spectral microscopy based on a femtosecond Cr:for-sterite laser. Opt Lett 26:1909–1911.
Chu SW, Chen SY, Tsai TH, Liu TM, Lin CY, Tsai HJ, Sun CK. 2003.In vivo developmental biology study using noninvasive multi-har-monic generation microscopy. Opt Express 11:3093–3099.
Cox G, Moreno N, Feijo J. 2005. Second-harmonic imaging of plantpolysaccharides. J Biomed Opt 10:024013.
Conklin MW, Provenzano PP, Eliceiri KW, Sullivan R, Keely PJ. 2009.Fluorescence lifetime imaging of endogenous fluorophores in histo-pathology sections reveals differences between normal and tumorepithelium in carcinoma in situ of the breast. Cell Biochem Biophys53:145–157.
Debarre D, Beaurepaire E. 2007. Quantitative characterization of bio-logical liquids for third harmonic generation microscopy. Biophys J92:603–612.
Debarre D, Supatto W, Pena AM, Fabre A, Tordjmann T, CombettesL, Schanne-Klein MC, Beaurepaire E. 2006. Imaging lipid bodies incells and tissues using third-harmonic generation microscopy. NatMeth 3:47–53.
Denk W, Strickler JH, Webb WW. 1990. Two-photon laser scanningfluorescence microscopy. Science 248:73–76.
Diaspro A. 2011. Optical fluorescence microscopy. New York: Springer.258 p.
Freund I, Deutsch M, Sprecher A. 1986. Connective tissue polarity.Optical second-harmonic microscopy, crossed-beam summation,and small-angle scattering in rat-tail tendon. Biophys J 50:693–712.
Gannaway J, Sheppard CJR. 1978. Second harmonic imaging in thescanning optical microscope. Opt Quant Elec 10:435–439.
Gualda EJ, Filippidis G, Voglis G, Mari M, Fotakis C, TavernarakisN. 2008. In vivo imaging of cellular structures in Caenorhabditiselegans by combined TPEF, SHG and THG microscopy. J Microsc229:141–150.
Guo Y, Ho PP, Tirksliunas A, Liu F, Alfano RR. 1996. Optical har-monic generation from animal tissues by the use of picosecond andfemtosecond laser pulses. Appl Opt 35:6810–6813.
Guo Y, Wang QZ, Zhadin N, Liu F, Demos S, Calistru D, TirksliunasA, Katz A, Budansky Y, Ho PP, Alfano RR. 1997a. Two-photon exci-tation of fluorescence from chicken tissue. Appl Opt 36:968–970.
Guo Y, Ho PP, Savage H, Harris D, Sacks P, Schantz S, Liu F, ZhadinN, Alfano RR. 1997b. Second harmonic tomography of tissues. OptLett 22:1323–1325.
Guo Y, Ho PP, Liu F, Wang QZ, Alfano RR. 1998. Noninvasive two-photon-excitation imaging of tryptophan distribution in highly scat-tering biological tissues. Optic Commun 154:383–389.
Guo Y, Savage HE, Liu F, Schantz SP, Ho PP, Alfano RR. 1999. Sub-surface tumor progression investigated by noninvasive optical sec-ond harmonic tomography. Proc Natl Acad Sci USA 96:10854–10856.
Hellwarth R, Christensen P. 1975. Nonlinear optical microscope usingsecond harmonic generation. Appl Opt 14:247–248.
Kirkpatrick ND, Brewer MA, Utzinger U. 2007. Endogenous opticalbiomarkers of ovarian cancer evaluated with multiphoton micros-copy. Cancer Epidemiol Biomarkers Prev 16:2048–2057.
Konig K, So PTC, Mantulin WW, Tromberg BJ, Gratton E. 1996. Two-photon excited lifetime imaging of autofluorescence in cells duringUVA and NIR photostress. J Microsc 183:197–204.
Mazza D, Bianchini P, Caorsi V, Cella F, Mondal PP, Ronzitti E, TestaI, Vicidomini G, Diaspro A. 2008. Non-linear microscopy. In: PavesiL, Fauchet PM, editors. Biological and medical physics, biomedicalengineering. Biophotonics. Berlin: Springer, pp. 47–66.
Microscopy Research and Technique
11MULTIMODAL OPTICAL SETUP FOR NLO MICROSCOPES

Millard AC, Wiseman PW, Fittinghoff DN, Wilson KR, Squier JA,Muller M. 1999. Third-harmonic generation microscopy by use of acompact femtosecond fiber laser source. Appl Opt 38:7393–7397.
Millard AC, Campagnola PJ, Mohler W, Lewis A, Loew LM. 2003.Bio-photonics, Part B: Methods in enzymology. New York, Washington,DC: Academic Press. Vol. 361, pp.47–69.
Mizutani G, Sonoda Y, Sano H, Sakamoto M, Takahashi T, Ushioda S.2000. Detection of starch granules in a living plant by opticalsecond harmonic microscopy. J Lumin 87:824–826.
Moreaux L, Sandre O, Blanchard-Desce M, Mertz J. 2000. Membraneimaging by simultaneous second-harmonic generation and two-pho-ton microscopy. Opt Lett 25:320–322.
Muller M, Squier J, Wilson KR, Brakenhoff GJ. 1998. 3D microscopyof transparent objects using third harmonic generation. J Microsc-Oxford 191:266–274.
Nadiarnykh O, LaComb RB, Brewer MA, Campagnola PJ. 2010. Alter-ations of the extracellular matrix in ovarian cancer studied by sec-ond harmonic generation imagingmicroscopy. BMCCancer 10:1–14.
Prent N, Green C, Greenhalgh C, Cisek R, Major A, Stewart B,Barzda V. 2008. Intermyofilament dynamics of myocytes revealedby second harmonic generation microscopy. J Biomed Opt13:041318.
Provenzano PP, Eliceiri KW, Keely PJ. 2009. Multiphoton microscopyand fluorescence lifetime imaging microscopy (FLIM) to monitormetastasis and the tumor microenvironment. Clin Exp Metastasis26:357–370.
Skala MC, Riching KM, Bird DK, Gendron-Fitzpatrick A, Eickhoff J,Eliceiri KW, Keely PJ, Ramanujam N. 2007. In vivo multiphoton
fluorescence lifetime imaging of protein-bound and free nicotina-mide adenine dinucleotide in normal and precancerous epithelia.J Biomed Opt 12:024014.
Squier J, Muller M, Brakenhoff G, Wilson KR. 1998. Third harmonicgeneration microscopy. Opt Express 3:315–324.
Sun CK. 2005. Higher harmonic generation microscopy. Adv. BiochemEng/Biotechnol 95:17–56.
Sun CK, Chu SW, Chen SY, Tsai TH, Liu TM, Lin CY, Tsai HJ. 2004.Higher harmonic generation microscopy for developmental biology.J Struct Biol 147:19–30.
Tuer A, Tokarz D, Prent N, Cisek R, Alami J, Dumont DJ, Bakueva L,Rowlands J, Barzda V. 2010. Nonlinear multicontrast microscopy ofhematoxylin-and-eosin-stained histological sections. J Biomed Opt15:026018.
Williams RM, Flesken-Nikitin A, Ellenson LH, Connolly DC, Hamil-ton TC, Nikitin AY, Zipfel WR. 2010. Strategies for high resolutionimaging of epithelial ovarian cancer by laparoscopic nonlinear mi-croscopy. Transl Oncol 3:181–194.
Yelin D, Oron D, Korkotian E, Segal M, Silberberg Y. 2002. Third-har-monic microscopy with a titanium sapphire laser. Appl Phys B-Lasers O 74:S97–S101.
Yu W, So PTC, French T, Gratton E. 1996. Fluorescence generalizedpolarization of cell membranes: a two-photon scanning microscopyapproach. Biophys J 70:626–636.
Zoumi A, Yeh A, Tromberg BJ. 2002. Imaging cells and extracellu-lar matrix in vivo by using second-harmonic generation andtwo-photon excited fluorescence. Proc Natl Acad Sci USA 99:11014–11019.
Microscopy Research and Technique
12 PELEGATI ET AL.
Copyright © 2022 FDOKUMEN