
Kinetics of noncatalytic, nonisothermal, gas-solid reactions: Hydrofluorination of uranium dioxide
Upload
independentCategory
view
2download
0
Imaging the dynamics of gas phase reactions
Michael N. R. Ashfold,*aN. Hendrik Nahler,
aAndrew J. Orr-Ewing,
aOlivier P. J.
Vieuxmaire,aRachel L. Toomes,
bTheofanis N. Kitsopoulos,
bIvan Anton Garcia,
c
Dmitri A. Chestakov,cShiou-Min Wu
cand David H. Parker
c
Received 1st July 2005, Accepted 22nd August 2005
First published as an Advance Article on the web 18th October 2005
DOI: 10.1039/b509304j
Ion imaging methods are making ever greater impact on studies of gas phase molecular reaction
dynamics. This article traces the evolution of the technique, highlights some of the more
important breakthroughs with regards to improving image resolution and in image processing and
analysis methods, and then proceeds to illustrate some of the many applications to which the
technique is now being applied—most notably in studies of molecular photodissociation and of
bimolecular reaction dynamics.
1. Introduction
The huge technological progress seen in the past quarter
century has enabled spectacular advances in our ability to
probe the detailed dynamics of gas phase reactions. Fifty years
ago, flash photolysis was still in its infancy.1 Norrish and co-
workers were able to record the spectra of vibrationally excited
O2 products from the reactions of ground state oxygen atoms
with NO2 and ClO2.2 Shortly thereafter, Cashion and Polanyi
were reporting first observations of infrared (IR) chemilumi-
nescence from vibrationally excited products of bimolecular
reactions.3 Studies of the dynamics of molecular photodisso-
ciation processes started to become feasible. Pulsed broadband
ultraviolet (UV) excitation of a static sample of, for example,
ClNO was shown to yield highly vibrationally excited NO
products.4 By the late 1970’s, tuneable dye lasers had found
their way into the laboratories of many of the leading players
in the reaction dynamics community, and the implementation
of techniques like laser induced fluorescence (LIF),5,6 coherent
anti-Stokes Raman spectroscopy (CARS)7 and resonance
enhanced multiphoton ionisation (REMPI)8 was beginning
to allow detailed investigation of the internal (e.g. rotation,
vibration, spin–orbit, lambda doublet, etc.) quantum state
population distributions within a wide range of products from
both unimolecular (i.e. photofragmentation) and bimolecular
reactions.
First measurements of product velocity distributions also
appeared around this time, following the introduction of
photofragment translational spectroscopy (PTS) methods.9,10
These experiments involved pulsed photolysis of a chosen
target molecule, seeded in a molecular beam, and measure-
ment of the times-of-flight (TOFs), and hence the velocity
distributions, of the resulting photofragments. Product
selectivity was achieved by employing electron impact ionisa-
tion and mass spectrometric detection—a method that is both
sensitive and universal, though not quantum state specific.
Fragments arising in a molecular photodissociation may be
formed with an anisotropic distribution of recoil velocities.
PTS experiments allow measurement of product angular dis-
tributions also, through use of polarized photolysis laser
radiation and/or rotating sources or detectors.11 These con-
cepts have been extended to bimolecular collision processes,
using two crossed molecular beams (at least one of which is
‘chopped’ to give the zero of time necessary for any TOF
experiment).
Such experiments have yielded a wealth of dynamical
information. For example, such studies can reveal whether a
given reaction yields translationally or internally excited pro-
ducts, the nature of the internal vibrational and rotational
excitation (if present), and whether or not the product scatter-
ing is anisotropic. Since the form of the product energy
disposal reflects the details of the forces acting between the
embryonic fragments at their moment of creation, such mea-
surements provide insight into the nature of the electronic
states—and the potential energy surfaces (PESs)—controlling
the fragmentation (or collision) process. Consider the case of
photodissociations, for example. Products formed with fast,
anisotropic recoil velocity distributions are generally viewed as
arising in one of two ways. In the first of these, the molecules
of interest are excited to, and dissociate on, a repulsive PES.
Alternatively, it may be that the photo-excited molecules have
to evolve, non-radiatively, from the initially prepared state to
another excited PES, upon which fragmentation then occurs—
either directly, or via passage over an exit channel barrier. The
radiationless transition (predissociation) involved in the latter
mechanism may involve a time delay comparable to (or longer
than) the rotational period of the photo-excited parent mole-
cule. Such rotation of the molecular frame in the period
between excitation and fragmentation is one mechanism for
degrading fragment recoil anisotropy. Conversely, there are
many other photofragmentations that yield essentially isotro-
pic product recoil velocity distributions, peaking at velocities
close to zero. Energy and angular momentum conservation
a School of Chemistry, University of Bristol, Bristol, UK BS8 1TS.E-mail: [email protected]; Fax: þ44 117 9250612;Tel: þ44 117 9288312/3
bDepartment of Chemistry, University of Crete and Institute ofElectronic Structure and Laser, Foundation of Research andTechnology-Hellas, 711 10 Heraklion, Crete, Greece
cUniversity of Nijmegen, Department of Molecular and Laser Physics,Toernooiveld 1, 6525 ED Nijmegen, The Netherlands
26 | Phys. Chem. Chem. Phys., 2006, 8, 26–53 This journal is �c the Owner Societies 2006
INVITED ARTICLE www.rsc.org/pccp | Physical Chemistry Chemical Physics
dictates that most of the excess energy (i.e. the energy supplied
by the photon over and above that required to break the bond)
is partitioned into internal (vibrational) excitation of the one
or more molecular products. Such ‘statistical’ energy disposal
tends to arise in cases where the photo-excited molecule
evolves via a radiationless transition (normally internal con-
version (IC)) to the ground electronic state, redistribution of
energy among the various vibrational modes in the highly
internally excited ground state molecule that results, and
subsequent unimolecular decay.12–14
An obvious next challenge was to measure velocity distribu-
tions of products formed in specified internal quantum states.
Optical spectroscopy offers the clearest route to product state
selection; provided the product of interest, P, has a well
resolved and well characterised LIF or REMPI excitation
spectrum, population in any chosen quantum state (q) of P
can be monitored simply by tuning to the appropriate probe
laser wavelength. Let us again focus attention on the (simpler)
case of a pulsed photolysis process. The resulting P(q) frag-
ments are created in a localised volume, at a well-defined
instant in time, and begin to expand in a series of concentric
spheres the radii of which (at any particular instant in time)
will be determined by the recoil velocities. These are known as
Newton spheres. Each pair of product quantum states will
expand with its own associated Newton sphere. Several meth-
ods have been developed to allow determination of the (one-
dimensional (1-D)) speed distribution of quantum state se-
lected products. For example, the P(q) products can be tagged
by REMPI, and the resulting ions extracted into a TOF mass
spectrometer (MS). In an appropriately designed experiment,
the temporal form of the P1 peak in the TOF spectrum will be
sensitive to (i) the extraction voltages employed, (ii) any time
delay between creation (photolysis) and REMPI tagging and/
or switching on the extraction voltages, and (iii) the original
speed distribution of the P(q) fragments along the TOF axis.
Simulation allows determination of (iii)—one of the main
objectives of such experiments.15 Similar arguments apply in
the case of photo-initiated bimolecular reactions, wherein a
photolysis laser is used to create fragments (e.g. Cl atoms).
These serve as one of the reactants in a subsequent bimolecular
reaction, one or more of the products of which (e.g. HCl) are
then probed, state-specifically, by REMPI–TOF methods.16
Rydberg tagging methods offer higher TOF resolution, but
sample only that small fraction of P products that happen to
be formed with recoil velocities falling within the solid angle
subtended by the detector; such methods have thus far been
limited to H17–21 and O22,23 atom products.
Doppler spectroscopy offers an alternative route to deter-
mining 1-D speed distributions of state selected reaction
products. This technique relies on the fact that the precise
frequency at which a P(q) product of interest will absorb (in an
LIF or REMPI detection scheme) will depend on the projec-
tion of its recoil velocity along the probe laser propagation
axis. The lineshape of the probe transition will thus be
sensitive to this 1-D speed distribution (i.e. through the
distribution of Doppler shifts). How well this distribution
can be determined depends on a number of factors, including:
(i) The fragment speed: fast moving fragments can be
investigated with greater confidence since the Doppler shift
scales linearly with the lab. frame velocity, v. Self-evidently, the
intrinsic kinematics of a system plays a crucial role. Given that
the Doppler shift is proportional to v, and that this is the sum
of the centre of mass velocity vCM and the velocity w of the
detected fragment in the centre of mass frame, a simple vector
diagram suffices to confirm that the ‘best’ conditions (i.e. those
for which the range of lab. frame velocities will be maximal) is
obtained when vCM and w are equal. Conversely, if w is small
compared with vCM, then the product velocity in the lab. frame
will be very similar to vCM irrespective of the scattering angle,
and the spread of detected Doppler shifts will be small;
(ii) The velocity spread of the parent molecules (in the case
of a photolysis experiment) or in the collision encounters (in
the case of a bimolecular reaction dynamics experiment); and
(iii) The probe laser bandwidth—which, ideally, should be
as small as possible relative to the Doppler contribution to the
overall spectral linewidth.
Interpreting Doppler lineshapes requires some care and
caution, since quite different 3-D velocity distributions can
give rise to rather similar 1-D Doppler projections. Velocity
aligned Doppler spectroscopy, wherein Doppler lineshapes of
the selected P(q) fragments are probed with progressively
longer time delays between the photolysis and probe laser
pulses, offered one route to removing potential ambiguities.24
Many other studies have demonstrated how comparisons of
the Doppler lineshapes of a given P(q) product recorded with
different interaction geometries (e.g. counter-propagating ver-
sus orthogonal photolysis and probe laser propagation axes),
pump and probe laser polarisations, and/or different probe
transitions (e.g. DJ ¼ 0 versus DJ ¼ �1 transitions) can reveal
the extent of correlations between various vectorial properties
of the P(q) products: informative examples include product
orientation and alignment (i.e. the distribution of the product
angular momentum (J) relative to l, the parent transition
dipole moment, and thus to ephot, the electric vector of the
photolysis radiation) and correlations between J and the
product recoil velocity, v.25,26 The concept of Doppler line-
shape analysis has been extended and applied, very profitably,
to studies of products (e.g. OH) arising in photo-initiated
bimolecular collision processes.27
Imaging techniques, the focus of this Invited Article, give
two-dimensional (2-D) velocity projections of a given P(q)
product, and enable detailed study of any alignment and/or
orientation of the products, and of any correlations between
the product v and J vectors. The first illustration of the use of
ion imaging methods to study a molecular photodissociation
process appeared in 1986.28 This pioneering investigation
involved pulsed laser photolysis of CH3I molecules, at a
wavelength of 266 nm. C–I bond fission resulted in formation
of CH3 radicals and I atoms. Energetically, at least, it is
possible that these I atom products could be formed in their
ground (2P3/2) state or in the spin–orbit excited (2P1/2) state—
which lies 7603 cm�1 higher in energy. By suitable choice of
probe wavelength, 2 þ 1 REMPI allowed state-selective
sampling of just CH3(v00 ¼ 0) fragments. The resulting cloud
of CH31 ions expanded with a velocity distribution dictated by
the energetics and dynamics of the dissociation process, but
was simultaneously accelerated through a TOF-MS onto a
time and position sensitive detector. Analysis of the 2-D image
This journal is �c the Owner Societies 2006 Phys. Chem. Chem. Phys., 2006, 8, 26–53 | 27

of these CH31 ion impacts showed that the I atoms partnering
the CH3(v00 ¼ 0) fragments were predominantly in their spin–
orbit excited state (this conclusion followed from measure-
ment of the image radius, which scales with the fragment recoil
velocity) and—from the shape of the image—that the frag-
mentation of the parent molecule occurred promptly following
an excitation the transition moment for which was aligned
parallel to the C3 symmetry axis.
Imaging studies have come a very long way since Chandler
and Houston’s ground-breaking demonstration work.29–33
Image resolution has improved greatly.34 Image processing
and analysis methods have developed substantially.35 Most
striking of all, however, has been the range and the diversity of
the scientific problems to which imaging techniques have now
been usefully applied. This Invited Article will chart many of
the more important technical developments, highlight the
impact of imaging methods in studies of molecular photodis-
sociations and of bimolecular collision processes, and con-
clude with a very brief summary of many other imaging
applications that remain outside the scope of this review.
2. Experimental methods
Imaging methods for characterizing the products of molecular
dynamics processes have advanced rapidly in the past 15 years,
both in quality of data and in range of application. Imaging
now sets the standard for studies of photodissociation, is
becoming well established for inelastic scattering, and has
recently provided beautifully resolved data of crossed-beam
chemical reaction products. In this section we describe the
current experimental state-of-the-art of imaging,34 its advan-
tages and limitations, and prospects for the future. We limit
our discussion to ion and velocity map imaging, which are
single-product detection methods. Coincidence imaging meth-
ods36 including the elegant electron–ion correlated imaging
method37 for photodissociation/ionization studies are not
included here.
The main limitation to imaging resolution in all early ion
imaging experiments was the birthplace of the detected species.
Imaging experiments generally employ a 2-D position sensitive
detector (PSD) to measure velocity at a fixed flight time from
its position on the detector. For most experiments, especially
those designed to capture the entire Newton sphere, the
uncertainty in determining distance arises from the uncertainty
in where the product particle of interest was formed. Even
when using a focused laser beam, e.g., for photodissociation,
the starting volume is as long as the confocal parameter of the
laser beam, typically a few mm, compared to a typical PSD
radius of 20–40 mm. Imaging took a great leap forward in
1997 with the realisation that it was possible to remove the
starting volume from the uncertainty in determining velocity,
using velocity mapping38 of ionic Newton spheres. Velocity
mapping has a three-fold advantage: the Newton spheres are
superimposed, open lenses without grids are used for the
electrodes, and the removal of any sensitivity to the precise
birthplace of the ion also means that a large starting volume
can be used. This allows lower ion densities and thus reduced
blurring from effects of space charge, i.e., the mutual repulsion
of ions of like-charge. Grids lower the lens transmission and
perturb the ion trajectories. Space charge, the bane of ion
measurements, changes the nascent velocity of the investigated
species. Velocity map imaging (VMI) works directly for ionic
Newton spheres formed in processes such as photoioniza-
tion,38,39 photodissociation of state-selected cations,40 electron
impact ionisation,41 photo-detachment,42–44 Penning or asso-
ciative ionisation,45 and ion-molecule reactions.46 For other
experiments such as photodissociation,47 inelastic,48 or reac-
tive scattering,49 and deflection of molecular beams by a laser-
formed lens,50 the initially formed neutral Newton spheres are
converted to ions and then velocity-mapped.
2.1 Apparatus design
Ion imaging, Fig. 1, involves the following experimental steps.
(a) creation of Newton spheres (in this example by photodis-
sociation); (b) conversion of the photofragment spheres to ion
spheres by laser ionization; (c) projection of the ion Newton
spheres onto a 2-D detector; and (d) recovery of the desired
information from the 2-D image, either directly from the
middle slice of the ion packet (experimental slicing), or via a
mathematical transformation. The result of (d) should be
Fig. 1 A: The imaging approach for measuring Newton spheres from
photodissociation. (a) Photodissociation of molecules in a molecular
beam using a linearly polarized laser with the polarization direction
parallel to the detector face. (b) Conversion of the photofragment
molecules making up the Newton spheres into ions by laser ionization.
(c) Projection of the ion spheres onto a two-dimensional (2-D)
detector. (d) Mathematical transformation of the 2-D image back to
the three-dimensional data of step (a). This slice through the middle of
the Newton sphere is displayed in (d) as either a false colour 2-D
diagram or 3-D contour diagram. With experimental slicing techni-
ques it is possible to avoid step (d). B: Apparatus layout showing the
electrostatic lens used for velocity map imaging of photodissociation.
A skimmed molecular beam passes through a small hole in the repeller
(R) plate. Laser beam(s) cross the molecular beam between the repeller
and extractor (E) plates. Field lines are shown for the electrostatic
immersion lens, which is created by open, flat, annular electrodes. Ions
formed are accelerated past the ground (G) electrode and fly through
the time-of-flight tube to the imaging detector, which is monitored by a
CCD camera. The dimensions of a typical apparatus are shown, with
electrostatic lens spacing of 15 mm and flight tube length 360 mm.
28 | Phys. Chem. Chem. Phys., 2006, 8, 26–53 This journal is �c the Owner Societies 2006
equivalent to taking a thin slice through the middle of the
Newton sphere formed in step (a).
2.2 Ultimate resolution
An optimized dual-chevron mounted multi-channel plate de-
tector assembly with event centroiding software can estimate
the arrival position of an ion to within B20 mm over the
20 mm detector radius. This implies for the apparatus shown
in Fig. 1 a velocity resolution of 0.1%, thus requiring a CCD
camera resolution of 1000 � 1000 (1 M) pixels. A top-grade
detector of 60 mm radius and 10 mm spatial resolution would
yield a 0.02% velocity resolution and require a 5000 � 5000
(25 M pixel) camera. Velocity resolution r0.1% is compar-
able to the highest resolution competitive methods such as
Rydberg tagging.13,18
Ion-imaging and VMI actually map the square root of the
kinetic energy, i.e. E1/2—all particles with the same E1/2 arrive
at the same radius on the detector regardless of their mass/
charge ratio. For a typical imaging apparatus shown in Fig. 1
a maximum repeller voltage of þ5000 V limits the maximum E
to B4 eV, which is B7000 m s�1 for an O atom product. The
ultimate velocity resolution of 0.1% corresponds to 7 m s�1 in
this case.
An image recorded with a 1 M pixel camera must usually
register B2 M ions, corresponding to 20 000 laser pulses at
100 ion pulse�1, or 33 minutes recording time using a 10 Hz
laser. This is around the maximum time that all other experi-
mental conditions such as laser pulse energy, molecular beam
concentration, nanosecond timing circuits, etc., can be kept
constant. 100 ion pulse�1, however, can result in significant
distortion of the image due to space charge.51 A safer 1 ion
pulse�1 would require a kilohertz laser system, and very fast
CCD system to avoid down-time during image acquisition,
neither of which are readily available at present. This ultimate
resolution, however, has not yet been achieved due to a variety
of effects listed in the next section.
2.3 Practical aspects of imaging techniques
Improvements, limitations, and new applications of imaging
are discussed here, organized following the creation–conversion
–projection–recovery scheme of the imaging experiment.
2.3.1 Creation. When creating product Newton spheres by
photodissociation the velocity spread of the parent molecule
beam parallel to the detector face must be minimized, since
this spread will be velocity mapped onto the product velocity.
For unimolecular processes such as photodissociation this is
rather straightforward: as shown by Chandler and Houston,28
the parent beam is simply directed along the imaging TOF
axis, onto the detector face. The velocity spread along the
propagation direction of the parent beam is negligible com-
pared to the final velocity of the ionic spheres in that direction
(e.g. B102 m s�1 cf. B105 m s�1 for O21 ions in an O2 beam).
Directing a beam of charged or reactive species onto an active
MCP detector is not advisable. In these cases the steering
assembly, described later, can be used to deflect the ion image
to an off-axis detector,52 or deflect slower charged species
away from the detector after faster species such as photoelec-
trons have arrived.43
The transverse velocity spread, which is mapped onto the
image, is small for most molecular beams, typically corre-
sponding to a temperature of B1–2 K. For example, Softley
and coworkers53 have measured a transverse velocity corre-
sponding to a temperature of B1 K in a spatial imaging study
of electric field deflection of high Rydberg states of H2.
Gericke and coworkers54 have reported a detailed analysis of
parent beam velocity spreads on imaging resolution for (1 þ 1)
ionization of NO and estimated a contribution of just 0.04 m
s�1 (B2 mK) for an experimental geometry designed to mini-
mize this effect. For bimolecular imaging studies the velocity
spread in the parent beams is the dominant limiting factor in
image resolution. A discussion of various different approaches
for lowering the effects of velocity spreads in crossed-beam
studies appears in section 4.
The rotational temperature of the parent molecule can play
an important role in the appearance of the image. Wrede
et al.55 evaluated the effects of the rotational distribution in a
cooled supersonic beam on product images. Near the thres-
hold for photodissociation, the 15 K rotational distribution of
their IBr parent molecule beam added a 25 m s�1 FWHM
spread to the 60 m s�1 Br atom product velocity. Each internal
state of the parent molecule yields a separate but non-resolved
set of Newton spheres, leading to an apparent broadening of
the image. Furthermore, near the threshold for photodissocia-
tion, parent rotation can compete with direct dissociation, i.e.,
the axial approximation becomes invalid. This tends to reduce
any angular anisotropy in the distribution of product recoil
velocities—to an extent that increases with increasing rota-
tion.56 For many molecular photodissociation studies, the
distribution of populated rotational states in the parent mo-
lecule limits the ultimate resolution of the photofragment
image.
Vibrational cooling in a supersonic beam is usually much less
efficient compared to rotational cooling. A resident vibrational
population when rotationally cooled usually leads to well
separated rings in the images. Vibrational population in
several different modes of CH3I resulted in resolved rings in
the CH3 and I fragment images.57
Saturation due to the use of excessive dissociation (or
detection) laser flux has the effect of lowering the anisotropy
of the surface pattern of the image, by exciting molecules with
increasingly less favourable orientations with respect to the
laser polarization. High laser pulse energies also increase the
probability of multiphoton absorption, which can introduce
new and overlapping product channels. Chestakov et al.58
have shown that focusing the dissociation laser with a cylind-
rical lens not only lowers saturation effects, but is also
favourable for ‘sheet-dot’ optical slicing as discussed later.
2.3.2 Conversion. After creation, the photofragments are
converted to ions, state-selectively, using REMPI. Ideally,
neutrals are converted to ions without changing their nascent
velocity, and all products of the selected internal state are
converted with equal probability independent of their velocity.
In practice, the quality of the captured surface pattern, which
is one of the main outputs of an imaging experiment, is
governed by this conversion step.
This journal is �c the Owner Societies 2006 Phys. Chem. Chem. Phys., 2006, 8, 26–53 | 29
As mentioned previously, space charge due to too many ions
in the ionization volume can significantly lower the image
resolution. Wolf and Helm51 have shown that as few as two
ions in the ionization volume can measurably perturb the ion
trajectories. This density limitation includes all ions formed—
not just the selectively-detected ions. Another reason for
keeping the ion count as low as possible is to avoid under-
counting when using event counting software (as described
later).
Ionization can induce a small but significant velocity-chan-
ging ion recoil in the parent ion due to the excess energy above
the ionization threshold (i.e. 3hn c IP for a 2 þ 1 REMPI
process). Detailed studies of ion-recoil have been reported for
Rb,51 and NO.54 Recoil effects are most pronounced for H
atoms—as has been demonstrated in some detail in studies of
hydrogen halide photolyses59,60—but can play a resolution-
limiting role for any product. Ionization induced recoil takes
place after the photolysis (or collision) process and thus affects
all nascent product velocities in the same way, i.e., the ion-
recoil image is projected on every point of the velocity map.
Recoil effects thus increase quadratically when converting
velocity to kinetic energy. Table 1 lists the ion-recoil velocities
of typical product species using the most common REMPI
detection methods. Detection of O(3P) oxygen atoms at
226 nm, for example, adds an ion-recoil image of diameter
40 m s�1, to all velocities. This greatly exceeds the previously
estimated ultimate velocity resolution of 7 m s�1. Recoil is
significant even for such heavy (and slow) species as Br and I.
Avoidance of ion-recoil effects will require the development of
more complicated REMPI detection schemes.
State-selective ionization requires a resonant bound–bound
transition, which implies that each fragment will exhibit a
velocity-dependent Doppler-shift. The ionization laser wave-
length must thus be scanned back and forth equally over the
full Doppler profile, which can be a time-consuming and error-
prone procedure. Doppler-free two-photon techniques have
been proposed as one way of overcoming this problem.61 This
approach involves retro-reflecting or splitting the ionization
laser into two counter-propagating time-overlapped beams
tuned to the centre of the Doppler profile. Each beam inde-
pendently creates a partial (sub-Doppler) image but the entire
image appears when one photon from each beam is absorbed.
The ratio of the Doppler-free to single-beam images is en-
hanced when the laser bandwidth is a small fraction of the
Doppler width. For this reason, images of energetic H atoms
with their wide Doppler profiles are the most favourable
targets for Doppler-free ionization when using a normal
(40.1 cm�1) bandwidth tuneable dye laser for ionization.
Unfortunately, as Table 1 showed, H atoms are also most
susceptible to recoil problems with 2 þ 1 REMPI. This
problem has been relieved by use of a 3 þ 1 REMPI scheme
involving 364.6 nm photons.60 The energy sum of four such
photons corresponds to threshold ionization, which solves the
recoil problem also. Under the experimental conditions de-
monstrated thus far, the homogeneous linewidth of the final
one photon transition is found to exceed the Doppler width
(presumably because of power broadening of the ionization
step in the case of delayed pulsed field extraction,60 or because
of lowering of the ionisation threshold by the electric field
present in the source region in the case of more traditional ion
imaging62), thus obviating the need for Doppler-scanning.
2.3.3 Projection
Field-free initial conditions. Electrostatic fields can re-orient
state-selected molecules, ionize atoms or molecules excited to
Rydberg states, and deflect charged species from the interac-
tion zone. For all these types of species, it is crucial that field-
free conditions are maintained until after the photo-excitation
or collision of interest has taken place. Bergmann and cow-
orkers63 have described an imaging apparatus that includes a
permanently field-free ionization zone and velocity mapping
conditions for projecting the ions. They report photodissocia-
tion studies of electronically state-selected alkali molecules.
Weisshaar and coworkers46 used a different approach in their
VMI studies of ion-molecule reactions. They maintain the
repeller and extractor lenses at 0 V until the reaction has
taken place, and pulse the fields on later for VMI of TOF-
selected reaction products. Harland et al.41 have described the
field-switching conditions needed to combine electron-mole-
cule scattering and VMI. Chestakov et al.58 have described
conditions where optimal velocity mapping for photodissocia-
tion occurs under field-free conditions followed by pulsing on
the electrostatic lens fields.
Electrostatic lens designs. Once the neutral Newton spheres
are converted to ion spheres the electrostatic lens assembly
accelerates them into a time-of-flight region and onto the PSD.
The original VMI lens design used flat annular electrodes
spaced 15 mm apart with 20 mm open inner diameters for
the accelerator and ground electrodes. Vrakking et al.64 have
described how addition of an Einzel lens after the velocity
mapping lenses can enable significant (420) magnification of
low velocity electron images. Wrede et al.55 carried out an
extensive ion trajectory analysis that illustrated improvements
in resolution that can be obtained by using more complex
electrode shaping. Vrakking65 showed that use of a genetic
algorithm for the electrostatic lens design (such as described in
ref. 66), but optimized for velocity mapping, should yield even
better resolution. Townsend et al.67 and Lin et al.68 have both
reported lens designs with ‘zooming’ capability that provide
velocity mapping without ‘pan-caking’ the image. These are
discussed later, in the section on Slicing.
Steering. Even with the best construction methods, the
image rarely arrives exactly at the centre of the detector
without a little help. Active steering methods can be imple-
mented by tilting the electrostatic lens38 or with deflection
electrodes (such as a 12-pole design demonstrated by Suzuki
and colleagues52) that are placed in the TOF region, after the
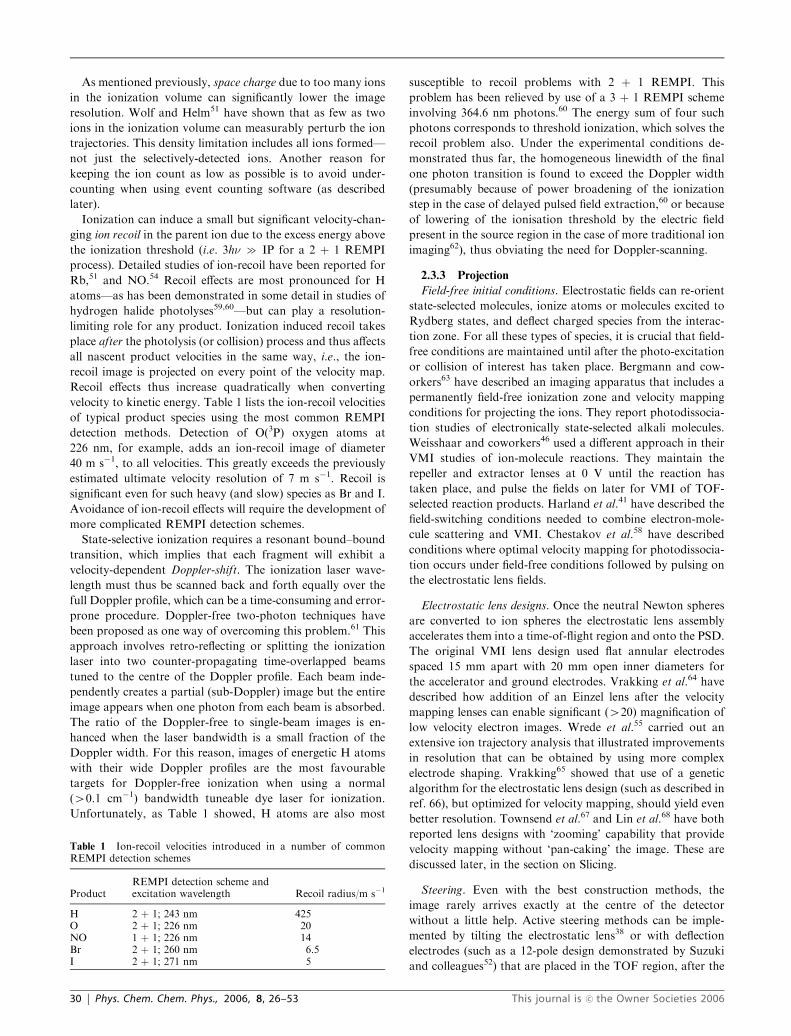
Table 1 Ion-recoil velocities introduced in a number of commonREMPI detection schemes
ProductREMPI detection scheme andexcitation wavelength Recoil radius/m s�1
H 2 þ 1; 243 nm 425O 2 þ 1; 226 nm 20NO 1 þ 1; 226 nm 14Br 2 þ 1; 260 nm 6.5I 2 þ 1; 271 nm 5
30 | Phys. Chem. Chem. Phys., 2006, 8, 26–53 This journal is �c the Owner Societies 2006
electrostatic lens. This steering lens design has been used to
displace a velocity mapped image of Na1 product atoms to an
off-axis detector so as to avoid detector contamination by the
primary metal atom beam.63 Neumark and coworkers43 use
steering electrodes to deflect their anion beam away from an
on-axis photoelectron detector. In a similar type of pulsed,
mass-selected, anion photodissociation experiment, Bordas
and coworkers69 used an off-axis beam geometry and static
imaging fields chosen so as to project the photoelectron image
without substantially deflecting the anion beam.
Detector gating. Mass selection is achieved by selectively
gating the gain of the PSD at the TOF arrival time of the
species of interest. For conventional VMI the detector gain
should remain constant during the full arrival time of the ion
packet which, for high velocity Newton spheres, can be as
long as 50–60 ns.58 Velocity mapping conditions do not
provide as high mass-resolution as, for example, Wiley-McLa-
ren space focusing conditions. Using an overly long detector
gate can lead to overlap with a neighbouring mass species,
while a too-short detector gate results in slicing of the image,
as described in the next section. When detecting photoelec-
trons, nanosecond gating of the PSD synchronized with the
excitation laser can be used to generate time-resolved images
of competing electron emission processes. Bordas and cow-
orkers69 have described such an experiment for electrons
emitted from photoexcited xenon atoms and small carbon
cluster anions.
Event counting. By 1998 the benefits of using the event
counting/centroiding mode of modern CCD cameras for
imaging studies were starting to appear.70,71 Centroiding im-
proves the resolution when using detectors that produce large
single-event spot sizes, especially with image intensified CCD
cameras. For all detectors, the event counting or thresholding
mode alleviates inhomogeneous position-dependent gain pro-
blems associated with the PSD. Event counting can lead to
undercounting artefacts, however, when two events occur
close together on the detector. Furthermore, not all inversion
programs can handle the highly pixelated nature of an event-
counted image.
2.3.4 Recovery. Much attention has been given lately to
methods for converting a fully crushed 2-D image back to a
2-D slice through the 3-D Newton sphere.35 Much the most
widely used has been the inverse Abel approach,29 which is a
direct mathematical transform. Direct inversion is possible
only for systems with cylindrical symmetry, which includes
atomic photodissociation products with J ¼ 0 or 1/2, such as
H(2S) or Cl(2P1/2) atoms, where no atomic mJ alignment is
possible. Rakitzis72 has shown that, by careful choice of a
series of experimental geometries in which the pump and
probe laser polarizations are parallel, it is possible to use the
inverse Abel transform in aligned systems. In many experi-
mental systems, however, the geometries required for this
approach are not straightforward to set up and, as a conse-
quence, many alignment studies have used forward convolu-
tion methods where images are simulated based on a trial
scattering distribution and compared with the experimental
data. The trial distribution may then be adjusted iteratively
until satisfactory agreement is obtained.
A variation of the forward convolution approach, involves
simulation and fitting of a set of ‘‘basis images’’ to the
experimental images in order to extract the parameters of
interest. The most popular of these methods at present is
BASEX,73 which expands the projection in a basis set of
functions that are analytical projections of well-behaved
Gaussian-like functions. The original 3-D image is then re-
constructed as a linear combination of these well-behaved
functions. Another example of the iterative approach exploits
the similarities that exist for cylindrically symmetric systems
between the form of the angular and radial distributions of the
3-D distribution and of its 2-D projection.74 While, like the
Abel inversion and BASEX, the method is limited to distribu-
tions with an axis of symmetry, the returned 3-D distributions
are virtually noise-free. The above-mentioned approaches, as
well as the back-projection ‘onion-peeling’ method,75 have
been compared for a variety of experimental conditions in
ref. 35. While no method excels for all practical conditions, the
BASEX method was found to be, in general, a very efficient
and easy-to-use method.
Several new approaches have appeared since the evaluation
in ref. 35. Bass et al.76 presented a Fourier moment image
fitting method based on Dixon’s bipolar moment formalism.25
This method allows extraction of speed and angular distribu-
tions, as well as angular momentum alignment and orientation
information, from raw images, without the necessity of cy-
lindrical symmetry. The method also allows an efficient angu-
lar smoothing of noisy images. In order to use the Fourier
moment analysis scheme, however, it is necessary to collect a
set of images on two different REMPI transitions and using a
series of experimental geometries, defined by the polarizations
and relative propagation directions of the pump and probe
laser beams. Processing of images with a large number of rings
is also slow in this approach. Manzhos and Loock77 intro-
duced another approach, based on pattern recognition, which
does require cylindrical symmetry. As in the Fourier moment
method, image parameters are extracted without inversion,
and the exact image centre and any distortion from circularity
are automatically identified. This method compares well with
the ‘onion-peeling’ approach from the same authors and is
most effective for images with well-spaced rings.
Slicing. Since the inception of ion imaging the advantages of
recording only the central portion of the Newton sphere
instead of crushing the full 3-D sphere were obvious. An
approximation to the final recovered thin slice is measured
directly, without the need for an inversion treatment. In some
cases this procedure is invalid due to product alignment
effects72 or to an inhomogeneous flux-to-density transforma-
tion,78 or it is just too noisy; alternative experimental methods
have thus been introduced which ‘slice’ out the desired in-
formation directly from the 3-D distribution. Kitsopoulos and
coworkers79 were the first to show that experimental slicing
can be combined with the high resolution advantages of
velocity mapping. Slicing has grown in importance and several
different approaches have emerged which are shown in Fig. 2
and discussed in more detail in this section.
This journal is �c the Owner Societies 2006 Phys. Chem. Chem. Phys., 2006, 8, 26–53 | 31
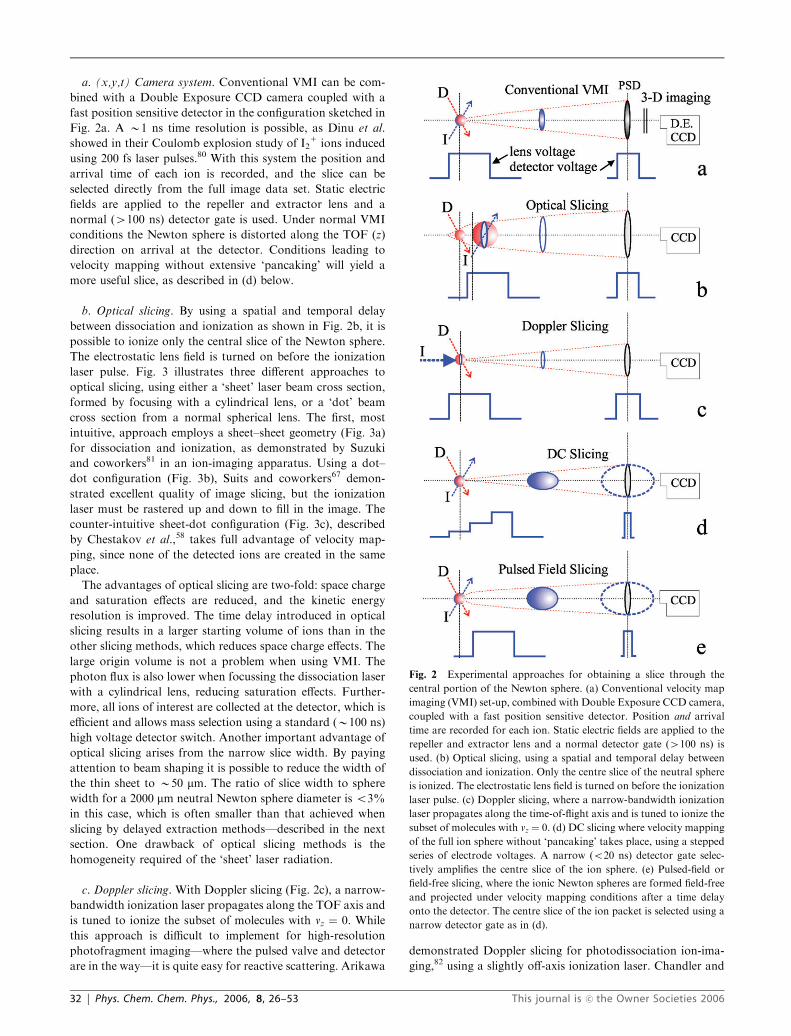
a. (x,y,t) Camera system. Conventional VMI can be com-
bined with a Double Exposure CCD camera coupled with a
fast position sensitive detector in the configuration sketched in
Fig. 2a. A B1 ns time resolution is possible, as Dinu et al.
showed in their Coulomb explosion study of I21 ions induced
using 200 fs laser pulses.80 With this system the position and
arrival time of each ion is recorded, and the slice can be
selected directly from the full image data set. Static electric
fields are applied to the repeller and extractor lens and a
normal (4100 ns) detector gate is used. Under normal VMI
conditions the Newton sphere is distorted along the TOF (z)
direction on arrival at the detector. Conditions leading to
velocity mapping without extensive ‘pancaking’ will yield a
more useful slice, as described in (d) below.
b. Optical slicing. By using a spatial and temporal delay
between dissociation and ionization as shown in Fig. 2b, it is
possible to ionize only the central slice of the Newton sphere.
The electrostatic lens field is turned on before the ionization
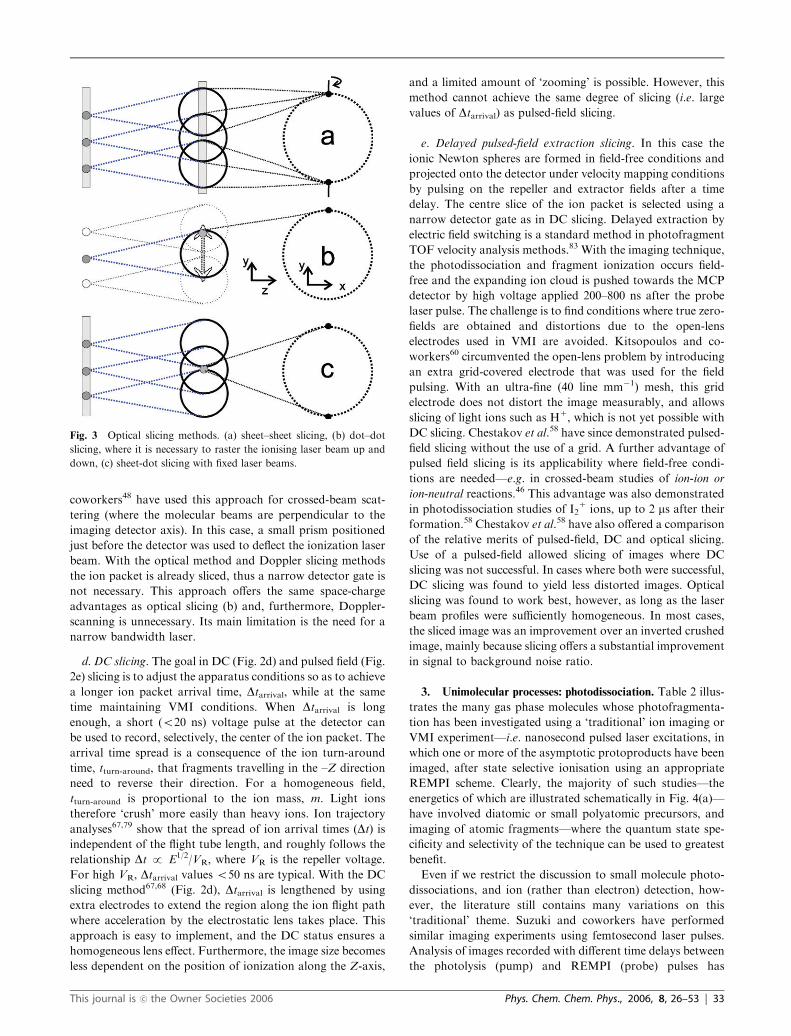
laser pulse. Fig. 3 illustrates three different approaches to
optical slicing, using either a ‘sheet’ laser beam cross section,
formed by focusing with a cylindrical lens, or a ‘dot’ beam
cross section from a normal spherical lens. The first, most
intuitive, approach employs a sheet–sheet geometry (Fig. 3a)
for dissociation and ionization, as demonstrated by Suzuki
and coworkers81 in an ion-imaging apparatus. Using a dot–
dot configuration (Fig. 3b), Suits and coworkers67 demon-
strated excellent quality of image slicing, but the ionization
laser must be rastered up and down to fill in the image. The
counter-intuitive sheet-dot configuration (Fig. 3c), described
by Chestakov et al.,58 takes full advantage of velocity map-
ping, since none of the detected ions are created in the same
place.
The advantages of optical slicing are two-fold: space charge
and saturation effects are reduced, and the kinetic energy
resolution is improved. The time delay introduced in optical
slicing results in a larger starting volume of ions than in the
other slicing methods, which reduces space charge effects. The
large origin volume is not a problem when using VMI. The
photon flux is also lower when focussing the dissociation laser
with a cylindrical lens, reducing saturation effects. Further-
more, all ions of interest are collected at the detector, which is
efficient and allows mass selection using a standard (B100 ns)
high voltage detector switch. Another important advantage of
optical slicing arises from the narrow slice width. By paying
attention to beam shaping it is possible to reduce the width of
the thin sheet to B50 mm. The ratio of slice width to sphere
width for a 2000 mm neutral Newton sphere diameter is o3%
in this case, which is often smaller than that achieved when
slicing by delayed extraction methods—described in the next
section. One drawback of optical slicing methods is the
homogeneity required of the ‘sheet’ laser radiation.
c. Doppler slicing. With Doppler slicing (Fig. 2c), a narrow-
bandwidth ionization laser propagates along the TOF axis and
is tuned to ionize the subset of molecules with vz ¼ 0. While
this approach is difficult to implement for high-resolution
photofragment imaging—where the pulsed valve and detector
are in the way—it is quite easy for reactive scattering. Arikawa
demonstrated Doppler slicing for photodissociation ion-ima-
ging,82 using a slightly off-axis ionization laser. Chandler and
Fig. 2 Experimental approaches for obtaining a slice through the
central portion of the Newton sphere. (a) Conventional velocity map
imaging (VMI) set-up, combined with Double Exposure CCD camera,
coupled with a fast position sensitive detector. Position and arrival
time are recorded for each ion. Static electric fields are applied to the
repeller and extractor lens and a normal detector gate (4100 ns) is
used. (b) Optical slicing, using a spatial and temporal delay between
dissociation and ionization. Only the centre slice of the neutral sphere
is ionized. The electrostatic lens field is turned on before the ionization
laser pulse. (c) Doppler slicing, where a narrow-bandwidth ionization
laser propagates along the time-of-flight axis and is tuned to ionize the
subset of molecules with vz ¼ 0. (d) DC slicing where velocity mapping
of the full ion sphere without ‘pancaking’ takes place, using a stepped
series of electrode voltages. A narrow (o20 ns) detector gate selec-
tively amplifies the centre slice of the ion sphere. (e) Pulsed-field or
field-free slicing, where the ionic Newton spheres are formed field-free
and projected under velocity mapping conditions after a time delay
onto the detector. The centre slice of the ion packet is selected using a
narrow detector gate as in (d).
32 | Phys. Chem. Chem. Phys., 2006, 8, 26–53 This journal is �c the Owner Societies 2006
coworkers48 have used this approach for crossed-beam scat-
tering (where the molecular beams are perpendicular to the
imaging detector axis). In this case, a small prism positioned
just before the detector was used to deflect the ionization laser
beam. With the optical method and Doppler slicing methods
the ion packet is already sliced, thus a narrow detector gate is
not necessary. This approach offers the same space-charge
advantages as optical slicing (b) and, furthermore, Doppler-
scanning is unnecessary. Its main limitation is the need for a
narrow bandwidth laser.
d. DC slicing. The goal in DC (Fig. 2d) and pulsed field (Fig.
2e) slicing is to adjust the apparatus conditions so as to achieve
a longer ion packet arrival time, Dtarrival, while at the same
time maintaining VMI conditions. When Dtarrival is long
enough, a short (o20 ns) voltage pulse at the detector can
be used to record, selectively, the center of the ion packet. The
arrival time spread is a consequence of the ion turn-around
time, tturn-around, that fragments travelling in the –Z direction
need to reverse their direction. For a homogeneous field,
tturn-around is proportional to the ion mass, m. Light ions
therefore ‘crush’ more easily than heavy ions. Ion trajectory
analyses67,79 show that the spread of ion arrival times (Dt) isindependent of the flight tube length, and roughly follows the
relationship Dt p E1/2/VR, where VR is the repeller voltage.
For high VR, Dtarrival values o50 ns are typical. With the DC
slicing method67,68 (Fig. 2d), Dtarrival is lengthened by using
extra electrodes to extend the region along the ion flight path
where acceleration by the electrostatic lens takes place. This
approach is easy to implement, and the DC status ensures a
homogeneous lens effect. Furthermore, the image size becomes
less dependent on the position of ionization along the Z-axis,
and a limited amount of ‘zooming’ is possible. However, this
method cannot achieve the same degree of slicing (i.e. large
values of Dtarrival) as pulsed-field slicing.
e. Delayed pulsed-field extraction slicing. In this case the
ionic Newton spheres are formed in field-free conditions and
projected onto the detector under velocity mapping conditions
by pulsing on the repeller and extractor fields after a time
delay. The centre slice of the ion packet is selected using a
narrow detector gate as in DC slicing. Delayed extraction by
electric field switching is a standard method in photofragment
TOF velocity analysis methods.83 With the imaging technique,
the photodissociation and fragment ionization occurs field-
free and the expanding ion cloud is pushed towards the MCP
detector by high voltage applied 200–800 ns after the probe
laser pulse. The challenge is to find conditions where true zero-
fields are obtained and distortions due to the open-lens
electrodes used in VMI are avoided. Kitsopoulos and co-
workers60 circumvented the open-lens problem by introducing
an extra grid-covered electrode that was used for the field
pulsing. With an ultra-fine (40 line mm�1) mesh, this grid
electrode does not distort the image measurably, and allows
slicing of light ions such as H1, which is not yet possible with
DC slicing. Chestakov et al.58 have since demonstrated pulsed-
field slicing without the use of a grid. A further advantage of
pulsed field slicing is its applicability where field-free condi-
tions are needed—e.g. in crossed-beam studies of ion-ion or
ion-neutral reactions.46 This advantage was also demonstrated
in photodissociation studies of I21 ions, up to 2 ms after their
formation.58 Chestakov et al.58 have also offered a comparison
of the relative merits of pulsed-field, DC and optical slicing.
Use of a pulsed-field allowed slicing of images where DC
slicing was not successful. In cases where both were successful,
DC slicing was found to yield less distorted images. Optical
slicing was found to work best, however, as long as the laser
beam profiles were sufficiently homogeneous. In most cases,
the sliced image was an improvement over an inverted crushed
image, mainly because slicing offers a substantial improvement
in signal to background noise ratio.
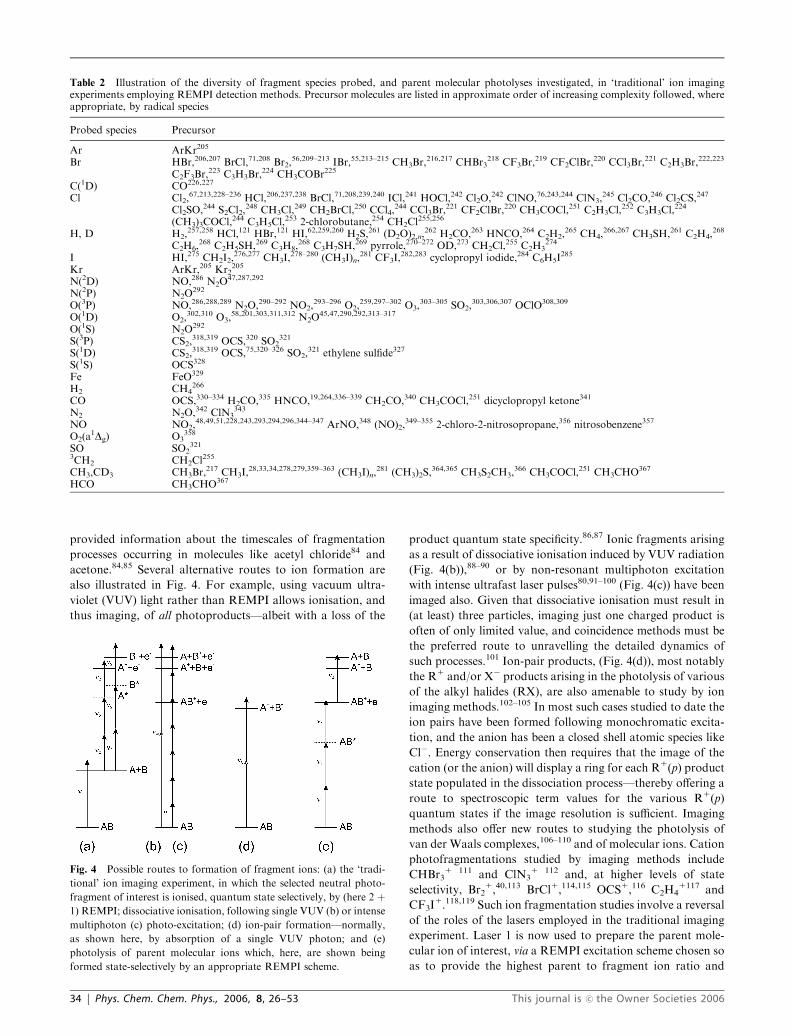
3. Unimolecular processes: photodissociation. Table 2 illus-
trates the many gas phase molecules whose photofragmenta-
tion has been investigated using a ‘traditional’ ion imaging or
VMI experiment—i.e. nanosecond pulsed laser excitations, in
which one or more of the asymptotic protoproducts have been
imaged, after state selective ionisation using an appropriate
REMPI scheme. Clearly, the majority of such studies—the
energetics of which are illustrated schematically in Fig. 4(a)—
have involved diatomic or small polyatomic precursors, and
imaging of atomic fragments—where the quantum state spe-
cificity and selectivity of the technique can be used to greatest
benefit.
Even if we restrict the discussion to small molecule photo-
dissociations, and ion (rather than electron) detection, how-
ever, the literature still contains many variations on this
‘traditional’ theme. Suzuki and coworkers have performed
similar imaging experiments using femtosecond laser pulses.
Analysis of images recorded with different time delays between
the photolysis (pump) and REMPI (probe) pulses has
Fig. 3 Optical slicing methods. (a) sheet–sheet slicing, (b) dot–dot
slicing, where it is necessary to raster the ionising laser beam up and
down, (c) sheet-dot slicing with fixed laser beams.
This journal is �c the Owner Societies 2006 Phys. Chem. Chem. Phys., 2006, 8, 26–53 | 33
provided information about the timescales of fragmentation
processes occurring in molecules like acetyl chloride84 and
acetone.84,85 Several alternative routes to ion formation are
also illustrated in Fig. 4. For example, using vacuum ultra-
violet (VUV) light rather than REMPI allows ionisation, and
thus imaging, of all photoproducts—albeit with a loss of the
product quantum state specificity.86,87 Ionic fragments arising
as a result of dissociative ionisation induced by VUV radiation
(Fig. 4(b)),88–90 or by non-resonant multiphoton excitation
with intense ultrafast laser pulses80,91–100 (Fig. 4(c)) have been
imaged also. Given that dissociative ionisation must result in
(at least) three particles, imaging just one charged product is
often of only limited value, and coincidence methods must be
the preferred route to unravelling the detailed dynamics of
such processes.101 Ion-pair products, (Fig. 4(d)), most notably
the R1 and/or X� products arising in the photolysis of various
of the alkyl halides (RX), are also amenable to study by ion
imaging methods.102–105 In most such cases studied to date the
ion pairs have been formed following monochromatic excita-
tion, and the anion has been a closed shell atomic species like
Cl�. Energy conservation then requires that the image of the
cation (or the anion) will display a ring for each R1(p) product
state populated in the dissociation process—thereby offering a
route to spectroscopic term values for the various R1(p)
quantum states if the image resolution is sufficient. Imaging
methods also offer new routes to studying the photolysis of
van der Waals complexes,106–110 and of molecular ions. Cation
photofragmentations studied by imaging methods include
CHBr31 111 and ClN3
1 112 and, at higher levels of state
selectivity, Br21,40,113 BrCl1,114,115 OCS1,116 C2H4
1117 and
CF3I1.118,119 Such ion fragmentation studies involve a reversal
of the roles of the lasers employed in the traditional imaging
experiment. Laser 1 is now used to prepare the parent mole-
cular ion of interest, via a REMPI excitation scheme chosen so
as to provide the highest parent to fragment ion ratio and
Table 2 Illustration of the diversity of fragment species probed, and parent molecular photolyses investigated, in ‘traditional’ ion imagingexperiments employing REMPI detection methods. Precursor molecules are listed in approximate order of increasing complexity followed, whereappropriate, by radical species
Probed species Precursor
Ar ArKr205
Br HBr,206,207 BrCl,71,208 Br2,56,209–213 IBr,55,213–215 CH3Br,
216,217 CHBr3218 CF3Br,
219 CF2ClBr,220 CCl3Br,
221 C2H3Br,222,223
C2F3Br,223 C3H3Br,
224 CH3COBr225
C(1D) CO226,227
Cl Cl2,67,213,228–236 HCl,206,237,238 BrCl,71,208,239,240 ICl,241 HOCl,242 Cl2O,242 ClNO,76,243,244 ClN3,
245 Cl2CO,246 Cl2CS,247
Cl2SO,244 S2Cl2,248 CH3Cl,
249 CH2BrCl,250 CCl4,
244 CCl3Br,221 CF2ClBr,
220 CH3COCl,251 C2H3Cl,252 C3H3Cl,
224
(CH3)3COCl,244 C3H5Cl,253 2-chlorobutane,254 CH2Cl
255,256
H, D H2,257,258 HCl,121 HBr,121 HI,62,259,260 H2S,
261 (D2O)2,n,262 H2CO,263 HNCO,264 C2H2,
265 CH4,266,267 CH3SH,261 C2H4,
268
C2H6,268 C2H5SH,269 C3H8,
268 C3H7SH,269 pyrrole,270–272 OD,273 CH2Cl,255 C2H3
274
I HI,275 CH2I2,276,277 CH3I,
278–280 (CH3I)n,281 CF3I,
282,283 cyclopropyl iodide,284 C6H5I285
Kr ArKr,205 Kr2205
N(2D) NO,286 N2O47,287,292
N(2P) N2O292
O(3P) NO,286,288,289 N2O,290–292 NO2,293–296 O2,
259,297–302 O3,303–305 SO2,
303,306,307 OClO308,309
O(1D) O2,302,310 O3,
58,201,303,311,312 N2O45,47,290,292,313–317
O(1S) N2O292
S(3P) CS2,318,319 OCS,320 SO2
321
S(1D) CS2,318,319 OCS,75,320–326 SO2,
321 ethylene sulfide327
S(1S) OCS328
Fe FeO329
H2 CH4266
CO OCS,330–334 H2CO,335 HNCO,19,264,336–339 CH2CO,340 CH3COCl,251 dicyclopropyl ketone341
N2 N2O,342 ClN3343
NO NO2,48,49,51,228,243,293,294,296,344–347 ArNO,348 (NO)2,
349–355 2-chloro-2-nitrosopropane,356 nitrosobenzene357
O2(a1Dg) O3
358
SO SO2321
3CH2 CH2Cl255
CH3,CD3 CH3Br,217 CH3I,
28,33,34,278,279,359–363 (CH3I)n,281 (CH3)2S,
364,365 CH3S2CH3,366 CH3COCl,251 CH3CHO367
HCO CH3CHO367
Fig. 4 Possible routes to formation of fragment ions: (a) the ‘tradi-
tional’ ion imaging experiment, in which the selected neutral photo-
fragment of interest is ionised, quantum state selectively, by (here 2 þ1) REMPI; dissociative ionisation, following single VUV (b) or intense
multiphoton (c) photo-excitation; (d) ion-pair formation—normally,
as shown here, by absorption of a single VUV photon; and (e)
photolysis of parent molecular ions which, here, are shown being
formed state-selectively by an appropriate REMPI scheme.
34 | Phys. Chem. Chem. Phys., 2006, 8, 26–53 This journal is �c the Owner Societies 2006
maximal parent state specificity. Photolysis of the resulting
parent ions, with a second pulsed laser, yields a fragment ion
and a neutral product. The former can be imaged directly and,
as with the ion pair studies, image analysis can yield new and
detailed spectroscopic, thermochemical and/or photophysical
data for both the parent and fragment ions.
The remainder of this Section focuses on illustrations of the
insights into molecular photofragmentation dynamics that can
be gained from high resolution ion imaging studies.
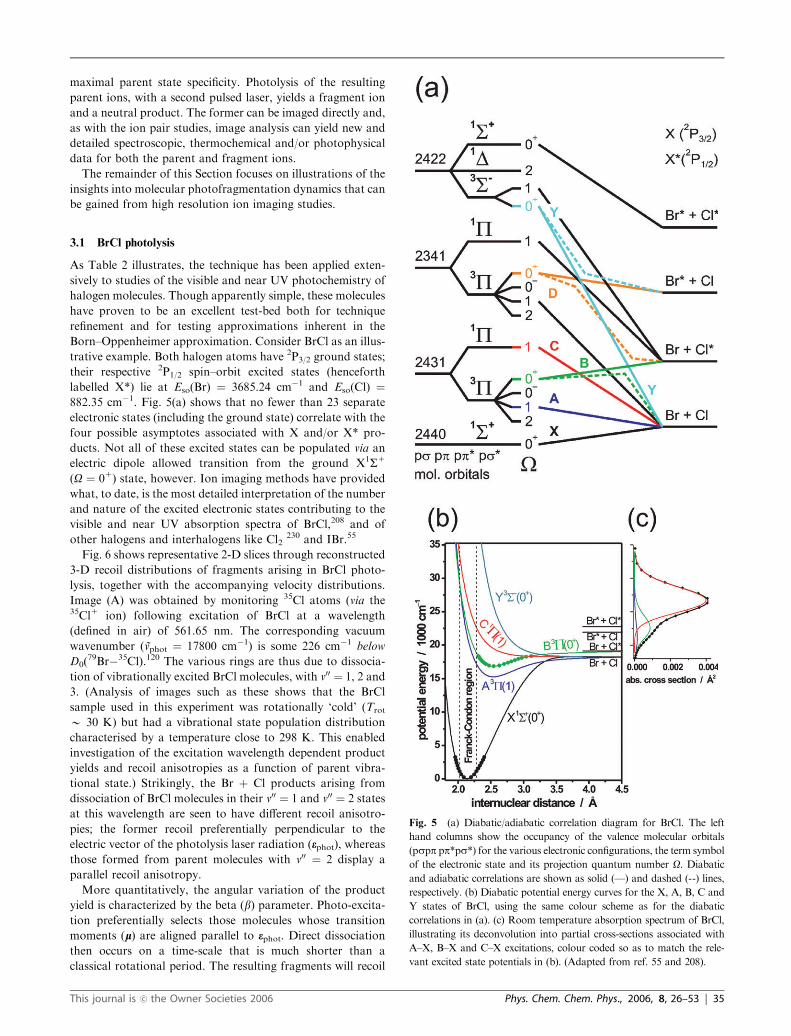
3.1 BrCl photolysis
As Table 2 illustrates, the technique has been applied exten-
sively to studies of the visible and near UV photochemistry of
halogen molecules. Though apparently simple, these molecules
have proven to be an excellent test-bed both for technique
refinement and for testing approximations inherent in the
Born–Oppenheimer approximation. Consider BrCl as an illus-
trative example. Both halogen atoms have 2P3/2 ground states;
their respective 2P1/2 spin–orbit excited states (henceforth
labelled X*) lie at Eso(Br) ¼ 3685.24 cm�1 and Eso(Cl) ¼882.35 cm�1. Fig. 5(a) shows that no fewer than 23 separate
electronic states (including the ground state) correlate with the
four possible asymptotes associated with X and/or X* pro-
ducts. Not all of these excited states can be populated via an
electric dipole allowed transition from the ground X1S1
(O ¼ 01) state, however. Ion imaging methods have provided
what, to date, is the most detailed interpretation of the number
and nature of the excited electronic states contributing to the
visible and near UV absorption spectra of BrCl,208 and of
other halogens and interhalogens like Cl2230 and IBr.55
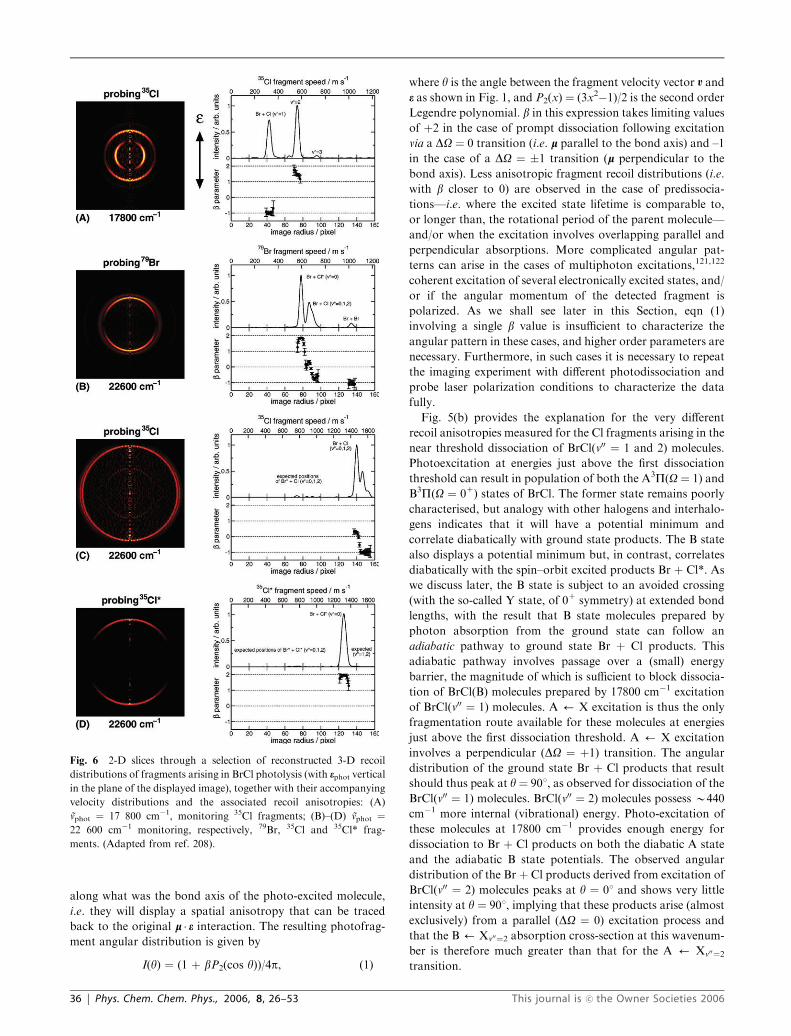
Fig. 6 shows representative 2-D slices through reconstructed
3-D recoil distributions of fragments arising in BrCl photo-
lysis, together with the accompanying velocity distributions.
Image (A) was obtained by monitoring 35Cl atoms (via the35Cl1 ion) following excitation of BrCl at a wavelength
(defined in air) of 561.65 nm. The corresponding vacuum
wavenumber (vphot ¼ 17800 cm�1) is some 226 cm�1 below
D0(79Br�35Cl).120 The various rings are thus due to dissocia-
tion of vibrationally excited BrCl molecules, with v00 ¼ 1, 2 and
3. (Analysis of images such as these shows that the BrCl
sample used in this experiment was rotationally ‘cold’ (Trot
B 30 K) but had a vibrational state population distribution
characterised by a temperature close to 298 K. This enabled
investigation of the excitation wavelength dependent product
yields and recoil anisotropies as a function of parent vibra-
tional state.) Strikingly, the Br þ Cl products arising from
dissociation of BrCl molecules in their v00 ¼ 1 and v00 ¼ 2 states
at this wavelength are seen to have different recoil anisotro-
pies; the former recoil preferentially perpendicular to the
electric vector of the photolysis laser radiation (ephot), whereas
those formed from parent molecules with v00 ¼ 2 display a
parallel recoil anisotropy.
More quantitatively, the angular variation of the product
yield is characterized by the beta (b) parameter. Photo-excita-
tion preferentially selects those molecules whose transition
moments (l) are aligned parallel to ephot. Direct dissociation
then occurs on a time-scale that is much shorter than a
classical rotational period. The resulting fragments will recoil
Fig. 5 (a) Diabatic/adiabatic correlation diagram for BrCl. The left
hand columns show the occupancy of the valence molecular orbitals
(pspp pp*ps*) for the various electronic configurations, the term symbol
of the electronic state and its projection quantum number O. Diabatic
and adiabatic correlations are shown as solid (—) and dashed (--) lines,
respectively. (b) Diabatic potential energy curves for the X, A, B, C and
Y states of BrCl, using the same colour scheme as for the diabatic
correlations in (a). (c) Room temperature absorption spectrum of BrCl,
illustrating its deconvolution into partial cross-sections associated with
A–X, B–X and C–X excitations, colour coded so as to match the rele-
vant excited state potentials in (b). (Adapted from ref. 55 and 208).
This journal is �c the Owner Societies 2006 Phys. Chem. Chem. Phys., 2006, 8, 26–53 | 35
along what was the bond axis of the photo-excited molecule,
i.e. they will display a spatial anisotropy that can be traced
back to the original l � e interaction. The resulting photofrag-
ment angular distribution is given by
I(y) ¼ (1 þ bP2(cos y))/4p, (1)
where y is the angle between the fragment velocity vector v and
e as shown in Fig. 1, and P2(x) ¼ (3x2�1)/2 is the second order
Legendre polynomial. b in this expression takes limiting values
of þ2 in the case of prompt dissociation following excitation
via a DO ¼ 0 transition (i.e. l parallel to the bond axis) and –1
in the case of a DO ¼ �1 transition (l perpendicular to the
bond axis). Less anisotropic fragment recoil distributions (i.e.
with b closer to 0) are observed in the case of predissocia-
tions—i.e. where the excited state lifetime is comparable to,
or longer than, the rotational period of the parent molecule—
and/or when the excitation involves overlapping parallel and
perpendicular absorptions. More complicated angular pat-
terns can arise in the cases of multiphoton excitations,121,122
coherent excitation of several electronically excited states, and/
or if the angular momentum of the detected fragment is
polarized. As we shall see later in this Section, eqn (1)
involving a single b value is insufficient to characterize the
angular pattern in these cases, and higher order parameters are
necessary. Furthermore, in such cases it is necessary to repeat
the imaging experiment with different photodissociation and
probe laser polarization conditions to characterize the data
fully.
Fig. 5(b) provides the explanation for the very different
recoil anisotropies measured for the Cl fragments arising in the
near threshold dissociation of BrCl(v00 ¼ 1 and 2) molecules.
Photoexcitation at energies just above the first dissociation
threshold can result in population of both the A3P(O ¼ 1) and
B3P(O ¼ 01) states of BrCl. The former state remains poorly
characterised, but analogy with other halogens and interhalo-
gens indicates that it will have a potential minimum and
correlate diabatically with ground state products. The B state
also displays a potential minimum but, in contrast, correlates
diabatically with the spin–orbit excited products Br þ Cl*. As
we discuss later, the B state is subject to an avoided crossing
(with the so-called Y state, of 01 symmetry) at extended bond
lengths, with the result that B state molecules prepared by
photon absorption from the ground state can follow an
adiabatic pathway to ground state Br þ Cl products. This
adiabatic pathway involves passage over a (small) energy
barrier, the magnitude of which is sufficient to block dissocia-
tion of BrCl(B) molecules prepared by 17800 cm�1 excitation
of BrCl(v00 ¼ 1) molecules. A ’ X excitation is thus the only
fragmentation route available for these molecules at energies
just above the first dissociation threshold. A ’ X excitation
involves a perpendicular (DO ¼ þ1) transition. The angular
distribution of the ground state Br þ Cl products that result
should thus peak at y¼ 901, as observed for dissociation of the
BrCl(v00 ¼ 1) molecules. BrCl(v00 ¼ 2) molecules possess B440
cm�1 more internal (vibrational) energy. Photo-excitation of
these molecules at 17800 cm�1 provides enough energy for
dissociation to Br þ Cl products on both the diabatic A state
and the adiabatic B state potentials. The observed angular
distribution of the Br þ Cl products derived from excitation of
BrCl(v00 ¼ 2) molecules peaks at y ¼ 01 and shows very little
intensity at y ¼ 901, implying that these products arise (almost
exclusively) from a parallel (DO ¼ 0) excitation process and
that the B ’ Xv00¼2 absorption cross-section at this wavenum-
ber is therefore much greater than that for the A ’ Xv00¼2transition.
Fig. 6 2-D slices through a selection of reconstructed 3-D recoil
distributions of fragments arising in BrCl photolysis (with ephot vertical
in the plane of the displayed image), together with their accompanying
velocity distributions and the associated recoil anisotropies: (A)
vphot ¼ 17 800 cm�1, monitoring 35Cl fragments; (B)–(D) vphot ¼22 600 cm�1 monitoring, respectively, 79Br, 35Cl and 35Cl* frag-
ments. (Adapted from ref. 208).
36 | Phys. Chem. Chem. Phys., 2006, 8, 26–53 This journal is �c the Owner Societies 2006
Images (B)�(D) in Fig. 6, obtained at lphot ¼ 442.35 nm
(vphot ¼ 22 600 cm�1), serve to illustrate the increasing
complexity of images recorded at shorter excitation wave-
lengths. The image radius is proportional to the fragment
recoil velocity, i.e. to E1/2, so peaks arising from different
parent v00 levels dissociating to a common limit become
progressively less well-separated. All four asymptotes asso-
ciated with the various X and X* product combinations are
energetically possible at this photolysis energy. Cl* products
are observed but, fortunately, Br* products only contribute at
much shorter excitation wavelengths. In principle, therefore,
an image of the ground state Br products should contain rings
associated with both Br þ Cl and Br þ Cl* products, the
analysis of which should yield the Cl*/(Cl þ Cl*) product
branching ratio, G, and the angular anisotropies of the respec-
tive product channels. In practice, analysis is complicated by
the possible formation of Br atoms from dissociation of Br2(that is present in equilibrium with BrCl and Cl2) and, in the
present experiments, by the accidental degeneracy (to within
the experimental resolution) between Br þ Cl products arising
from dissociation of BrCl(v00 ¼ 0) molecules and Br þ Cl*
products from dissociation of BrCl(v00 ¼ 2) molecules. None-
theless, these complications can all be circumvented by careful
imaging measurements of the Br, Cl and Cl* products, as a
function of excitation wavelength, thereby yielding G and the
angular anisotropies of the two fragmentation yields—as a
function of v00 and of vphot.
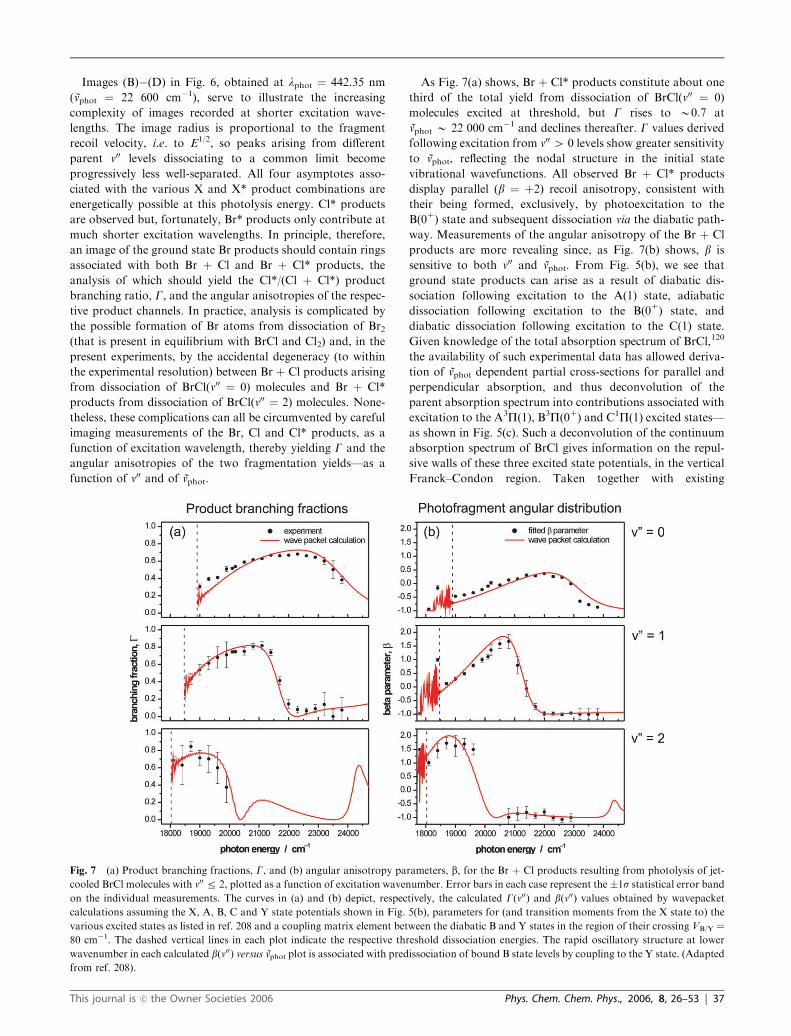
As Fig. 7(a) shows, Br þ Cl* products constitute about one
third of the total yield from dissociation of BrCl(v00 ¼ 0)
molecules excited at threshold, but G rises to B0.7 at
vphot B 22 000 cm�1 and declines thereafter. G values derived
following excitation from v004 0 levels show greater sensitivity
to vphot, reflecting the nodal structure in the initial state
vibrational wavefunctions. All observed Br þ Cl* products
display parallel (b ¼ þ2) recoil anisotropy, consistent with
their being formed, exclusively, by photoexcitation to the
B(01) state and subsequent dissociation via the diabatic path-
way. Measurements of the angular anisotropy of the Br þ Cl
products are more revealing since, as Fig. 7(b) shows, b is
sensitive to both v00 and vphot. From Fig. 5(b), we see that
ground state products can arise as a result of diabatic dis-
sociation following excitation to the A(1) state, adiabatic
dissociation following excitation to the B(01) state, and
diabatic dissociation following excitation to the C(1) state.
Given knowledge of the total absorption spectrum of BrCl,120
the availability of such experimental data has allowed deriva-
tion of vphot dependent partial cross-sections for parallel and
perpendicular absorption, and thus deconvolution of the
parent absorption spectrum into contributions associated with
excitation to the A3P(1), B3P(01) and C1P(1) excited states—
as shown in Fig. 5(c). Such a deconvolution of the continuum
absorption spectrum of BrCl gives information on the repul-
sive walls of these three excited state potentials, in the vertical
Franck–Condon region. Taken together with existing
Fig. 7 (a) Product branching fractions, G, and (b) angular anisotropy parameters, b, for the Br þ Cl products resulting from photolysis of jet-
cooled BrCl molecules with v00 r 2, plotted as a function of excitation wavenumber. Error bars in each case represent the�1s statistical error band
on the individual measurements. The curves in (a) and (b) depict, respectively, the calculated G(v00) and b(v00) values obtained by wavepacket
calculations assuming the X, A, B, C and Y state potentials shown in Fig. 5(b), parameters for (and transition moments from the X state to) the
various excited states as listed in ref. 208 and a coupling matrix element between the diabatic B and Y states in the region of their crossing VB/Y ¼80 cm�1. The dashed vertical lines in each plot indicate the respective threshold dissociation energies. The rapid oscillatory structure at lower
wavenumber in each calculated b(v00) versus vphot plot is associated with predissociation of bound B state levels by coupling to the Y state. (Adapted
from ref. 208).
This journal is �c the Owner Societies 2006 Phys. Chem. Chem. Phys., 2006, 8, 26–53 | 37
spectroscopic data for the ground electronic state and for the
bound levels supported by the B state potential, this has
allowed determination of key regions of the potential energy
curves for, and transition moments to, these three excited
states. The diabatic potentials so derived were shown in Fig.
5(b). The solid curves in Fig. 7(a) and (b) show G(v00) and b(v00)values obtained by wavepacket calculations assuming the
potentials shown in Fig. 5(b), parameters for (and transition
moments from the X state to) the various excited states
as listed in ref. 208, and a coupling matrix element between
the bound (B) and dissociative (Y) diabatic states in the
region of their crossing that has a value of VB/Y ¼ 80 cm�1.
The excellent agreement between experiment and theory
serves to highlight the value of careful, high resolution ion
imaging methods in ‘continuum state spectroscopy’ studies of
this kind.
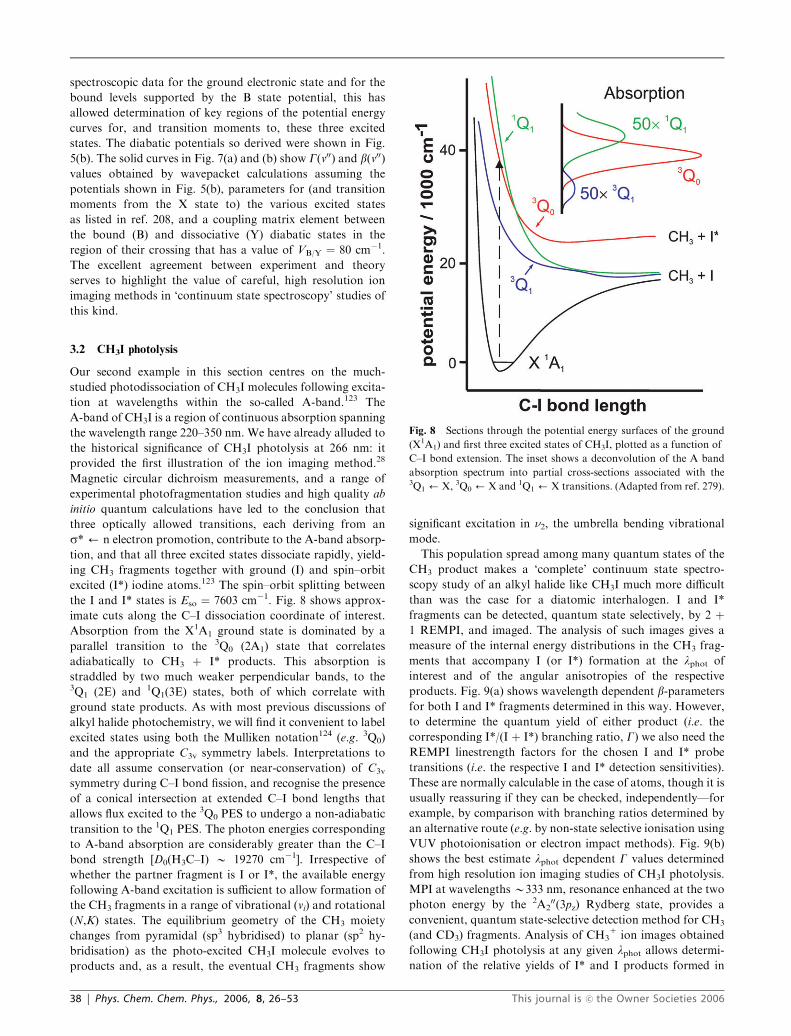
3.2 CH3I photolysis
Our second example in this section centres on the much-
studied photodissociation of CH3I molecules following excita-
tion at wavelengths within the so-called A-band.123 The
A-band of CH3I is a region of continuous absorption spanning
the wavelength range 220–350 nm. We have already alluded to
the historical significance of CH3I photolysis at 266 nm: it
provided the first illustration of the ion imaging method.28
Magnetic circular dichroism measurements, and a range of
experimental photofragmentation studies and high quality ab
initio quantum calculations have led to the conclusion that
three optically allowed transitions, each deriving from an
s*’ n electron promotion, contribute to the A-band absorp-
tion, and that all three excited states dissociate rapidly, yield-
ing CH3 fragments together with ground (I) and spin–orbit
excited (I*) iodine atoms.123 The spin–orbit splitting between
the I and I* states is Eso ¼ 7603 cm�1. Fig. 8 shows approx-
imate cuts along the C–I dissociation coordinate of interest.
Absorption from the X1A1 ground state is dominated by a
parallel transition to the 3Q0 (2A1) state that correlates
adiabatically to CH3 þ I* products. This absorption is
straddled by two much weaker perpendicular bands, to the3Q1 (2E) and 1Q1(3E) states, both of which correlate with
ground state products. As with most previous discussions of
alkyl halide photochemistry, we will find it convenient to label
excited states using both the Mulliken notation124 (e.g. 3Q0)
and the appropriate C3v symmetry labels. Interpretations to
date all assume conservation (or near-conservation) of C3v
symmetry during C–I bond fission, and recognise the presence
of a conical intersection at extended C–I bond lengths that
allows flux excited to the 3Q0 PES to undergo a non-adiabatic
transition to the 1Q1 PES. The photon energies corresponding
to A-band absorption are considerably greater than the C–I
bond strength [D0(H3C–I) B 19270 cm�1]. Irrespective of
whether the partner fragment is I or I*, the available energy
following A-band excitation is sufficient to allow formation of
the CH3 fragments in a range of vibrational (vi) and rotational
(N,K) states. The equilibrium geometry of the CH3 moiety
changes from pyramidal (sp3 hybridised) to planar (sp2 hy-
bridisation) as the photo-excited CH3I molecule evolves to
products and, as a result, the eventual CH3 fragments show
significant excitation in n2, the umbrella bending vibrational
mode.
This population spread among many quantum states of the
CH3 product makes a ‘complete’ continuum state spectro-
scopy study of an alkyl halide like CH3I much more difficult
than was the case for a diatomic interhalogen. I and I*
fragments can be detected, quantum state selectively, by 2 þ1 REMPI, and imaged. The analysis of such images gives a
measure of the internal energy distributions in the CH3 frag-
ments that accompany I (or I*) formation at the lphot of
interest and of the angular anisotropies of the respective
products. Fig. 9(a) shows wavelength dependent b-parameters
for both I and I* fragments determined in this way. However,
to determine the quantum yield of either product (i.e. the
corresponding I*/(I þ I*) branching ratio, G) we also need the
REMPI linestrength factors for the chosen I and I* probe
transitions (i.e. the respective I and I* detection sensitivities).
These are normally calculable in the case of atoms, though it is
usually reassuring if they can be checked, independently—for
example, by comparison with branching ratios determined by
an alternative route (e.g. by non-state selective ionisation using
VUV photoionisation or electron impact methods). Fig. 9(b)
shows the best estimate lphot dependent G values determined
from high resolution ion imaging studies of CH3I photolysis.
MPI at wavelengths B333 nm, resonance enhanced at the two
photon energy by the 2A200(3pz) Rydberg state, provides a
convenient, quantum state-selective detection method for CH3
(and CD3) fragments. Analysis of CH31 ion images obtained
following CH3I photolysis at any given lphot allows determi-
nation of the relative yields of I* and I products formed in
Fig. 8 Sections through the potential energy surfaces of the ground
(X1A1) and first three excited states of CH3I, plotted as a function of
C–I bond extension. The inset shows a deconvolution of the A band
absorption spectrum into partial cross-sections associated with the3Q1 ’X, 3Q0 ’X and 1Q1 ’X transitions. (Adapted from ref. 279).
38 | Phys. Chem. Chem. Phys., 2006, 8, 26–53 This journal is �c the Owner Societies 2006
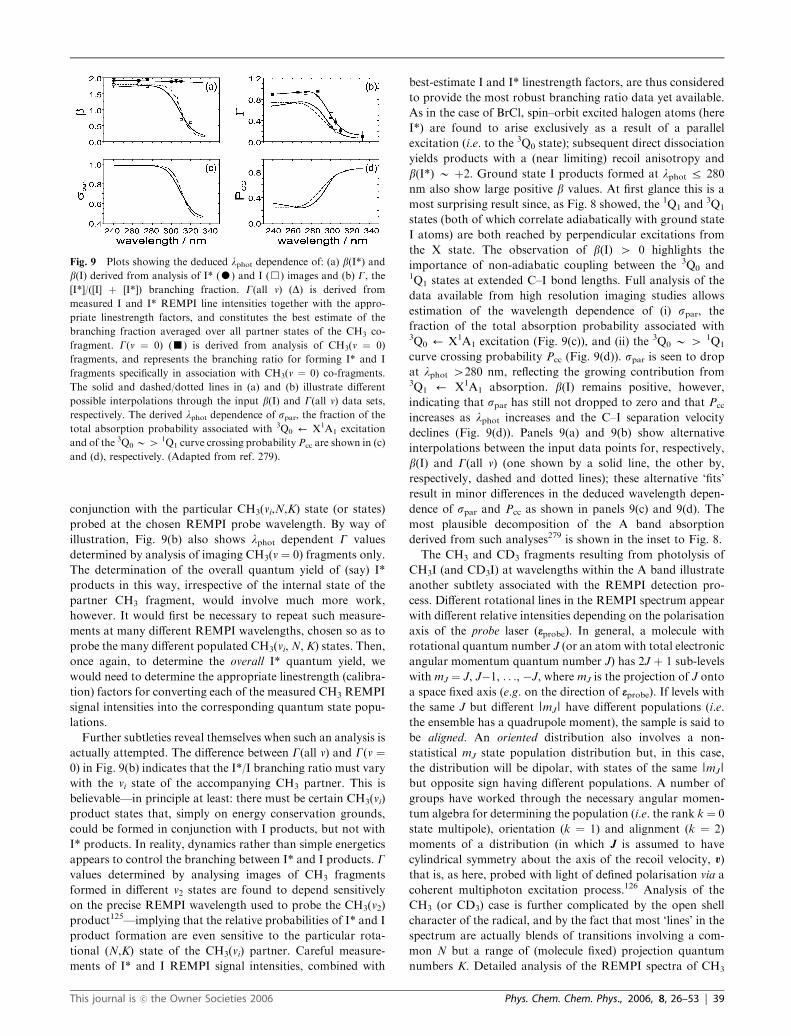
conjunction with the particular CH3(vi,N,K) state (or states)
probed at the chosen REMPI probe wavelength. By way of
illustration, Fig. 9(b) also shows lphot dependent G values
determined by analysis of imaging CH3(v ¼ 0) fragments only.
The determination of the overall quantum yield of (say) I*
products in this way, irrespective of the internal state of the
partner CH3 fragment, would involve much more work,
however. It would first be necessary to repeat such measure-
ments at many different REMPI wavelengths, chosen so as to
probe the many different populated CH3(vi,N, K) states. Then,
once again, to determine the overall I* quantum yield, we
would need to determine the appropriate linestrength (calibra-
tion) factors for converting each of the measured CH3 REMPI
signal intensities into the corresponding quantum state popu-
lations.
Further subtleties reveal themselves when such an analysis is
actually attempted. The difference between G(all v) and G(v ¼0) in Fig. 9(b) indicates that the I*/I branching ratio must vary
with the vi state of the accompanying CH3 partner. This is
believable—in principle at least: there must be certain CH3(vi)
product states that, simply on energy conservation grounds,
could be formed in conjunction with I products, but not with
I* products. In reality, dynamics rather than simple energetics
appears to control the branching between I* and I products. Gvalues determined by analysing images of CH3 fragments
formed in different v2 states are found to depend sensitively
on the precise REMPI wavelength used to probe the CH3(v2)
product125—implying that the relative probabilities of I* and I
product formation are even sensitive to the particular rota-
tional (N,K) state of the CH3(vi) partner. Careful measure-
ments of I* and I REMPI signal intensities, combined with
best-estimate I and I* linestrength factors, are thus considered
to provide the most robust branching ratio data yet available.
As in the case of BrCl, spin–orbit excited halogen atoms (here
I*) are found to arise exclusively as a result of a parallel
excitation (i.e. to the 3Q0 state); subsequent direct dissociation
yields products with a (near limiting) recoil anisotropy and
b(I*) B þ2. Ground state I products formed at lphot r 280
nm also show large positive b values. At first glance this is a
most surprising result since, as Fig. 8 showed, the 1Q1 and3Q1
states (both of which correlate adiabatically with ground state
I atoms) are both reached by perpendicular excitations from
the X state. The observation of b(I) 4 0 highlights the
importance of non-adiabatic coupling between the 3Q0 and1Q1 states at extended C–I bond lengths. Full analysis of the
data available from high resolution imaging studies allows
estimation of the wavelength dependence of (i) spar, the
fraction of the total absorption probability associated with3Q0 ’ X1A1 excitation (Fig. 9(c)), and (ii) the 3Q0 B 4 1Q1
curve crossing probability Pcc (Fig. 9(d)). spar is seen to drop
at lphot 4280 nm, reflecting the growing contribution from3Q1 ’ X1A1 absorption. b(I) remains positive, however,
indicating that spar has still not dropped to zero and that Pcc
increases as lphot increases and the C–I separation velocity
declines (Fig. 9(d)). Panels 9(a) and 9(b) show alternative
interpolations between the input data points for, respectively,
b(I) and G(all v) (one shown by a solid line, the other by,
respectively, dashed and dotted lines); these alternative ‘fits’
result in minor differences in the deduced wavelength depen-
dence of spar and Pcc as shown in panels 9(c) and 9(d). The
most plausible decomposition of the A band absorption
derived from such analyses279 is shown in the inset to Fig. 8.
The CH3 and CD3 fragments resulting from photolysis of
CH3I (and CD3I) at wavelengths within the A band illustrate
another subtlety associated with the REMPI detection pro-
cess. Different rotational lines in the REMPI spectrum appear
with different relative intensities depending on the polarisation
axis of the probe laser (eprobe). In general, a molecule with
rotational quantum number J (or an atom with total electronic
angular momentum quantum number J) has 2J þ 1 sub-levels
with mJ ¼ J, J�1, . . ., �J, where mJ is the projection of J onto
a space fixed axis (e.g. on the direction of eprobe). If levels with
the same J but different |mJ | have different populations (i.e.
the ensemble has a quadrupole moment), the sample is said to
be aligned. An oriented distribution also involves a non-
statistical mJ state population distribution but, in this case,
the distribution will be dipolar, with states of the same |mJ |
but opposite sign having different populations. A number of
groups have worked through the necessary angular momen-
tum algebra for determining the population (i.e. the rank k¼ 0
state multipole), orientation (k ¼ 1) and alignment (k ¼ 2)
moments of a distribution (in which J is assumed to have
cylindrical symmetry about the axis of the recoil velocity, v)
that is, as here, probed with light of defined polarisation via a
coherent multiphoton excitation process.126 Analysis of the
CH3 (or CD3) case is further complicated by the open shell
character of the radical, and by the fact that most ‘lines’ in the
spectrum are actually blends of transitions involving a com-
mon N but a range of (molecule fixed) projection quantum
numbers K. Detailed analysis of the REMPI spectra of CH3
Fig. 9 Plots showing the deduced lphot dependence of: (a) b(I*) andb(I) derived from analysis of I* (K) and I (&) images and (b) G, the[I*]/([I] þ [I*]) branching fraction. G(all v) (D) is derived from
measured I and I* REMPI line intensities together with the appro-
priate linestrength factors, and constitutes the best estimate of the
branching fraction averaged over all partner states of the CH3 co-
fragment. G(v ¼ 0) (’) is derived from analysis of CH3(v ¼ 0)
fragments, and represents the branching ratio for forming I* and I
fragments specifically in association with CH3(v ¼ 0) co-fragments.
The solid and dashed/dotted lines in (a) and (b) illustrate different
possible interpolations through the input b(I) and G(all v) data sets,
respectively. The derived lphot dependence of spar, the fraction of the
total absorption probability associated with 3Q0 ’ X1A1 excitation
and of the 3Q0 B4 1Q1 curve crossing probability Pcc are shown in (c)
and (d), respectively. (Adapted from ref. 279).
This journal is �c the Owner Societies 2006 Phys. Chem. Chem. Phys., 2006, 8, 26–53 | 39
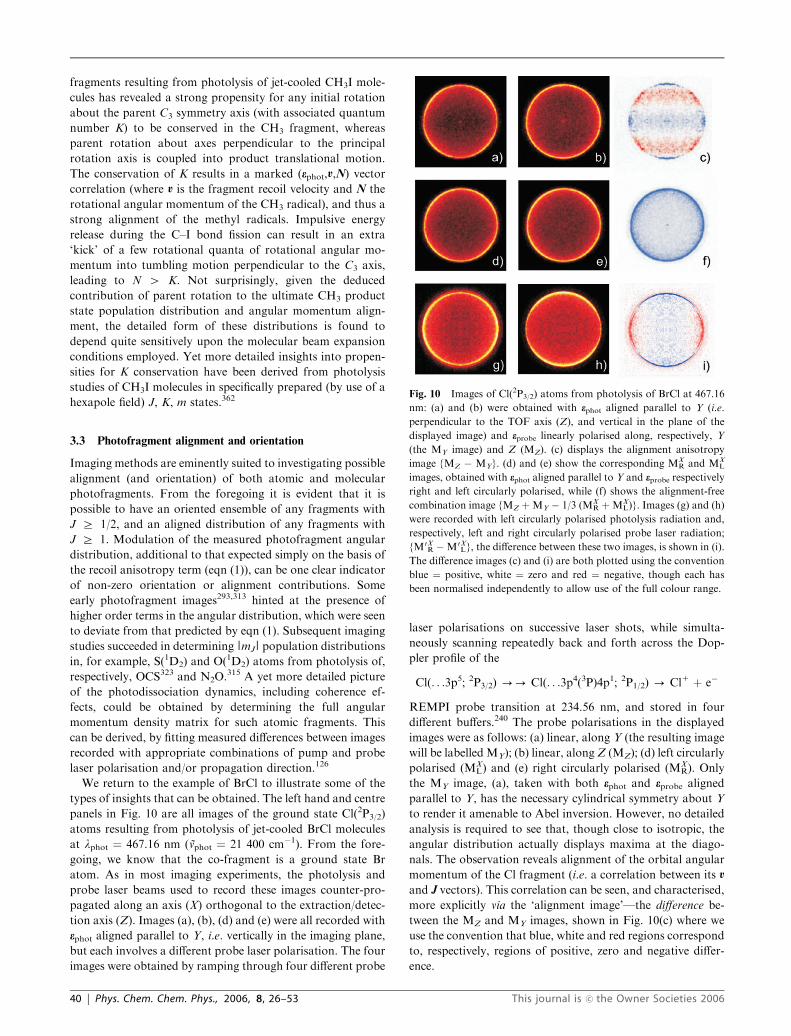
fragments resulting from photolysis of jet-cooled CH3I mole-
cules has revealed a strong propensity for any initial rotation
about the parent C3 symmetry axis (with associated quantum
number K) to be conserved in the CH3 fragment, whereas
parent rotation about axes perpendicular to the principal
rotation axis is coupled into product translational motion.
The conservation of K results in a marked (ephot,v,N) vector
correlation (where v is the fragment recoil velocity and N the
rotational angular momentum of the CH3 radical), and thus a
strong alignment of the methyl radicals. Impulsive energy
release during the C–I bond fission can result in an extra
‘kick’ of a few rotational quanta of rotational angular mo-
mentum into tumbling motion perpendicular to the C3 axis,
leading to N 4 K. Not surprisingly, given the deduced
contribution of parent rotation to the ultimate CH3 product
state population distribution and angular momentum align-
ment, the detailed form of these distributions is found to
depend quite sensitively upon the molecular beam expansion
conditions employed. Yet more detailed insights into propen-
sities for K conservation have been derived from photolysis
studies of CH3I molecules in specifically prepared (by use of a
hexapole field) J, K, m states.362
3.3 Photofragment alignment and orientation
Imaging methods are eminently suited to investigating possible
alignment (and orientation) of both atomic and molecular
photofragments. From the foregoing it is evident that it is
possible to have an oriented ensemble of any fragments with
J Z 1/2, and an aligned distribution of any fragments with
J Z 1. Modulation of the measured photofragment angular
distribution, additional to that expected simply on the basis of
the recoil anisotropy term (eqn (1)), can be one clear indicator
of non-zero orientation or alignment contributions. Some
early photofragment images293,313 hinted at the presence of
higher order terms in the angular distribution, which were seen
to deviate from that predicted by eqn (1). Subsequent imaging
studies succeeded in determining |mJ | population distributions
in, for example, S(1D2) and O(1D2) atoms from photolysis of,
respectively, OCS323 and N2O.315 A yet more detailed picture
of the photodissociation dynamics, including coherence ef-
fects, could be obtained by determining the full angular
momentum density matrix for such atomic fragments. This
can be derived, by fitting measured differences between images
recorded with appropriate combinations of pump and probe
laser polarisation and/or propagation direction.126
We return to the example of BrCl to illustrate some of the
types of insights that can be obtained. The left hand and centre
panels in Fig. 10 are all images of the ground state Cl(2P3/2)
atoms resulting from photolysis of jet-cooled BrCl molecules
at lphot ¼ 467.16 nm (vphot ¼ 21 400 cm�1). From the fore-
going, we know that the co-fragment is a ground state Br
atom. As in most imaging experiments, the photolysis and
probe laser beams used to record these images counter-pro-
pagated along an axis (X) orthogonal to the extraction/detec-
tion axis (Z). Images (a), (b), (d) and (e) were all recorded with
ephot aligned parallel to Y, i.e. vertically in the imaging plane,
but each involves a different probe laser polarisation. The four
images were obtained by ramping through four different probe
laser polarisations on successive laser shots, while simulta-
neously scanning repeatedly back and forth across the Dop-
pler profile of the
Cl(. . .3p5; 2P3/2) -- Cl(. . .3p4(3P)4p1; 2P1/2) - Cl1 þ e�
REMPI probe transition at 234.56 nm, and stored in four
different buffers.240 The probe polarisations in the displayed
images were as follows: (a) linear, along Y (the resulting image
will be labelled MY); (b) linear, along Z (MZ); (d) left circularly
polarised (MXL) and (e) right circularly polarised (MX
R). Only
the MY image, (a), taken with both ephot and eprobe aligned
parallel to Y, has the necessary cylindrical symmetry about Y
to render it amenable to Abel inversion. However, no detailed
analysis is required to see that, though close to isotropic, the
angular distribution actually displays maxima at the diago-
nals. The observation reveals alignment of the orbital angular
momentum of the Cl fragment (i.e. a correlation between its v
and J vectors). This correlation can be seen, and characterised,
more explicitly via the ‘alignment image’—the difference be-
tween the MZ and MY images, shown in Fig. 10(c) where we
use the convention that blue, white and red regions correspond
to, respectively, regions of positive, zero and negative differ-
ence.
Fig. 10 Images of Cl(2P3/2) atoms from photolysis of BrCl at 467.16
nm: (a) and (b) were obtained with ephot aligned parallel to Y (i.e.
perpendicular to the TOF axis (Z), and vertical in the plane of the
displayed image) and eprobe linearly polarised along, respectively, Y
(the MY image) and Z (MZ). (c) displays the alignment anisotropy
image {MZ � MY}. (d) and (e) show the corresponding MXR and MX
L
images, obtained with ephot aligned parallel to Y and eprobe respectively
right and left circularly polarised, while (f) shows the alignment-free
combination image {MZ þMY � 1/3 (MXR þMX
L)}. Images (g) and (h)
were recorded with left circularly polarised photolysis radiation and,
respectively, left and right circularly polarised probe laser radiation;
{M0XR �M0X
L}, the difference between these two images, is shown in (i).
The difference images (c) and (i) are both plotted using the convention
blue ¼ positive, white ¼ zero and red ¼ negative, though each has
been normalised independently to allow use of the full colour range.
40 | Phys. Chem. Chem. Phys., 2006, 8, 26–53 This journal is �c the Owner Societies 2006
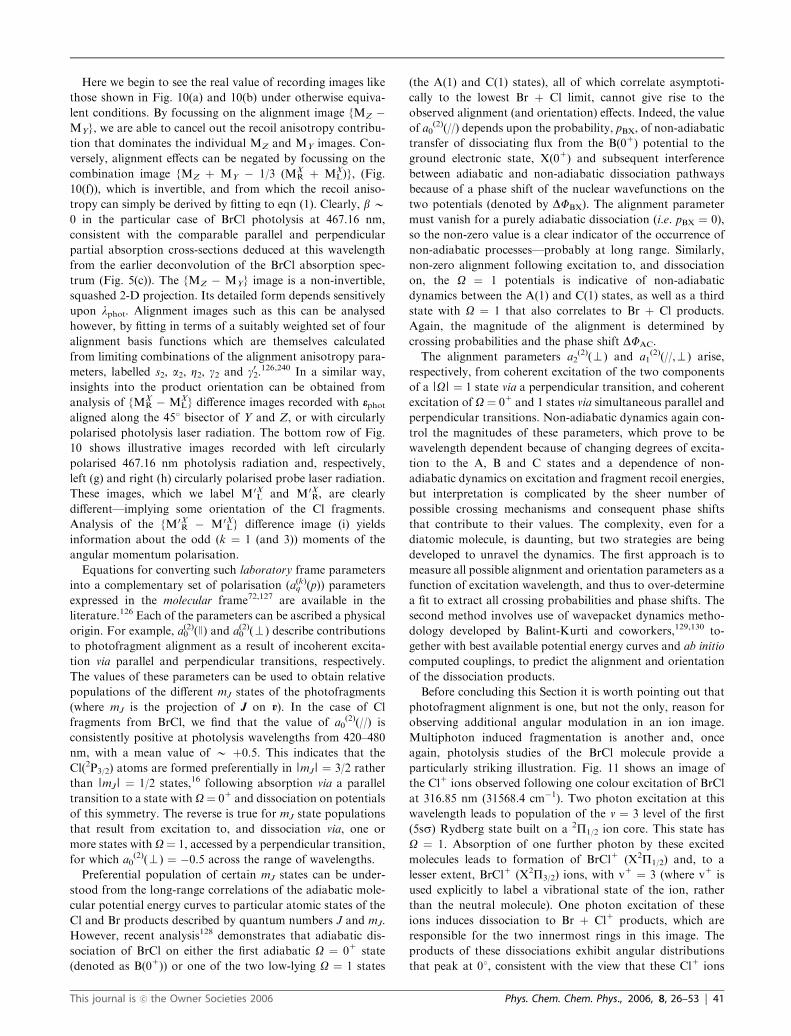
Here we begin to see the real value of recording images like
those shown in Fig. 10(a) and 10(b) under otherwise equiva-
lent conditions. By focussing on the alignment image {MZ �MY}, we are able to cancel out the recoil anisotropy contribu-
tion that dominates the individual MZ and MY images. Con-
versely, alignment effects can be negated by focussing on the
combination image {MZ þ MY � 1/3 (MXR þ MX
L)}, (Fig.
10(f)), which is invertible, and from which the recoil aniso-
tropy can simply be derived by fitting to eqn (1). Clearly, b B0 in the particular case of BrCl photolysis at 467.16 nm,
consistent with the comparable parallel and perpendicular
partial absorption cross-sections deduced at this wavelength
from the earlier deconvolution of the BrCl absorption spec-
trum (Fig. 5(c)). The {MZ � MY} image is a non-invertible,
squashed 2-D projection. Its detailed form depends sensitively
upon lphot. Alignment images such as this can be analysed
however, by fitting in terms of a suitably weighted set of four
alignment basis functions which are themselves calculated
from limiting combinations of the alignment anisotropy para-
meters, labelled s2, a2, Z2, g2 and g02.126,240 In a similar way,
insights into the product orientation can be obtained from
analysis of {MXR � MX
L} difference images recorded with ephotaligned along the 451 bisector of Y and Z, or with circularly
polarised photolysis laser radiation. The bottom row of Fig.
10 shows illustrative images recorded with left circularly
polarised 467.16 nm photolysis radiation and, respectively,
left (g) and right (h) circularly polarised probe laser radiation.
These images, which we label M0XL and M0X
R, are clearly
different—implying some orientation of the Cl fragments.
Analysis of the {M0XR � M0X
L} difference image (i) yields
information about the odd (k ¼ 1 (and 3)) moments of the
angular momentum polarisation.
Equations for converting such laboratory frame parameters
into a complementary set of polarisation (a(k)q (p)) parameters
expressed in the molecular frame72,127 are available in the
literature.126 Each of the parameters can be ascribed a physical
origin. For example, a(2)0 (J) and a(2)0 (>) describe contributions
to photofragment alignment as a result of incoherent excita-
tion via parallel and perpendicular transitions, respectively.
The values of these parameters can be used to obtain relative
populations of the different mJ states of the photofragments
(where mJ is the projection of J on v). In the case of Cl
fragments from BrCl, we find that the value of a0(2)(//) is
consistently positive at photolysis wavelengths from 420–480
nm, with a mean value of B þ0.5. This indicates that the
Cl(2P3/2) atoms are formed preferentially in |mJ | ¼ 3/2 rather
than |mJ | ¼ 1/2 states,16 following absorption via a parallel
transition to a state with O¼ 01 and dissociation on potentials
of this symmetry. The reverse is true for mJ state populations
that result from excitation to, and dissociation via, one or
more states with O¼ 1, accessed by a perpendicular transition,
for which a0(2)(>) ¼ �0.5 across the range of wavelengths.
Preferential population of certain mJ states can be under-
stood from the long-range correlations of the adiabatic mole-
cular potential energy curves to particular atomic states of the
Cl and Br products described by quantum numbers J and mJ.
However, recent analysis128 demonstrates that adiabatic dis-
sociation of BrCl on either the first adiabatic O ¼ 01 state
(denoted as B(01)) or one of the two low-lying O ¼ 1 states
(the A(1) and C(1) states), all of which correlate asymptoti-
cally to the lowest Br þ Cl limit, cannot give rise to the
observed alignment (and orientation) effects. Indeed, the value
of a0(2)(//) depends upon the probability, pBX, of non-adiabatic
transfer of dissociating flux from the B(01) potential to the
ground electronic state, X(01) and subsequent interference
between adiabatic and non-adiabatic dissociation pathways
because of a phase shift of the nuclear wavefunctions on the
two potentials (denoted by DFBX). The alignment parameter
must vanish for a purely adiabatic dissociation (i.e. pBX ¼ 0),
so the non-zero value is a clear indicator of the occurrence of
non-adiabatic processes—probably at long range. Similarly,
non-zero alignment following excitation to, and dissociation
on, the O ¼ 1 potentials is indicative of non-adiabatic
dynamics between the A(1) and C(1) states, as well as a third
state with O ¼ 1 that also correlates to Br þ Cl products.
Again, the magnitude of the alignment is determined by
crossing probabilities and the phase shift DFAC.
The alignment parameters a2(2)(>) and a1
(2)(//,>) arise,
respectively, from coherent excitation of the two components
of a |O | ¼ 1 state via a perpendicular transition, and coherent
excitation of O ¼ 01 and 1 states via simultaneous parallel and
perpendicular transitions. Non-adiabatic dynamics again con-
trol the magnitudes of these parameters, which prove to be
wavelength dependent because of changing degrees of excita-
tion to the A, B and C states and a dependence of non-
adiabatic dynamics on excitation and fragment recoil energies,
but interpretation is complicated by the sheer number of
possible crossing mechanisms and consequent phase shifts
that contribute to their values. The complexity, even for a
diatomic molecule, is daunting, but two strategies are being
developed to unravel the dynamics. The first approach is to
measure all possible alignment and orientation parameters as a
function of excitation wavelength, and thus to over-determine
a fit to extract all crossing probabilities and phase shifts. The
second method involves use of wavepacket dynamics metho-
dology developed by Balint-Kurti and coworkers,129,130 to-
gether with best available potential energy curves and ab initio
computed couplings, to predict the alignment and orientation
of the dissociation products.
Before concluding this Section it is worth pointing out that
photofragment alignment is one, but not the only, reason for
observing additional angular modulation in an ion image.
Multiphoton induced fragmentation is another and, once
again, photolysis studies of the BrCl molecule provide a
particularly striking illustration. Fig. 11 shows an image of
the Cl1 ions observed following one colour excitation of BrCl
at 316.85 nm (31568.4 cm�1). Two photon excitation at this
wavelength leads to population of the v ¼ 3 level of the first
(5ss) Rydberg state built on a 2P1/2 ion core. This state has
O ¼ 1. Absorption of one further photon by these excited
molecules leads to formation of BrCl1 (X2P1/2) and, to a
lesser extent, BrCl1 (X2P3/2) ions, with v1 ¼ 3 (where v1 is
used explicitly to label a vibrational state of the ion, rather
than the neutral molecule). One photon excitation of these
ions induces dissociation to Br þ Cl1 products, which are
responsible for the two innermost rings in this image. The
products of these dissociations exhibit angular distributions
that peak at 01, consistent with the view that these Cl1 ions
This journal is �c the Owner Societies 2006 Phys. Chem. Chem. Phys., 2006, 8, 26–53 | 41
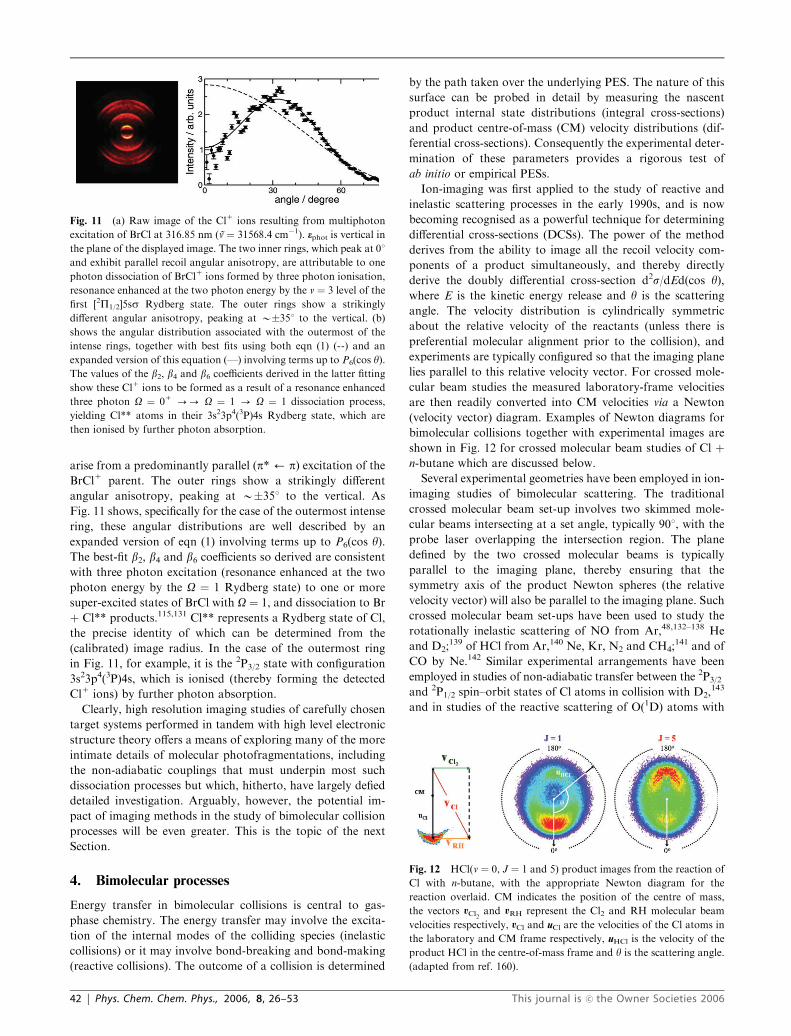
arise from a predominantly parallel (p* ’ p) excitation of the
BrCl1 parent. The outer rings show a strikingly different
angular anisotropy, peaking at B�351 to the vertical. As
Fig. 11 shows, specifically for the case of the outermost intense
ring, these angular distributions are well described by an
expanded version of eqn (1) involving terms up to P6(cos y).The best-fit b2, b4 and b6 coefficients so derived are consistent
with three photon excitation (resonance enhanced at the two
photon energy by the O ¼ 1 Rydberg state) to one or more
super-excited states of BrCl with O ¼ 1, and dissociation to Br
þ Cl** products.115,131 Cl** represents a Rydberg state of Cl,
the precise identity of which can be determined from the
(calibrated) image radius. In the case of the outermost ring
in Fig. 11, for example, it is the 2P3/2 state with configuration
3s23p4(3P)4s, which is ionised (thereby forming the detected
Cl1 ions) by further photon absorption.
Clearly, high resolution imaging studies of carefully chosen
target systems performed in tandem with high level electronic
structure theory offers a means of exploring many of the more
intimate details of molecular photofragmentations, including
the non-adiabatic couplings that must underpin most such
dissociation processes but which, hitherto, have largely defied
detailed investigation. Arguably, however, the potential im-
pact of imaging methods in the study of bimolecular collision
processes will be even greater. This is the topic of the next
Section.
4. Bimolecular processes
Energy transfer in bimolecular collisions is central to gas-
phase chemistry. The energy transfer may involve the excita-
tion of the internal modes of the colliding species (inelastic
collisions) or it may involve bond-breaking and bond-making
(reactive collisions). The outcome of a collision is determined
by the path taken over the underlying PES. The nature of this
surface can be probed in detail by measuring the nascent
product internal state distributions (integral cross-sections)
and product centre-of-mass (CM) velocity distributions (dif-
ferential cross-sections). Consequently the experimental deter-
mination of these parameters provides a rigorous test of
ab initio or empirical PESs.
Ion-imaging was first applied to the study of reactive and
inelastic scattering processes in the early 1990s, and is now
becoming recognised as a powerful technique for determining
differential cross-sections (DCSs). The power of the method
derives from the ability to image all the recoil velocity com-
ponents of a product simultaneously, and thereby directly
derive the doubly differential cross-section d2s/dEd(cos y),where E is the kinetic energy release and y is the scattering
angle. The velocity distribution is cylindrically symmetric
about the relative velocity of the reactants (unless there is
preferential molecular alignment prior to the collision), and
experiments are typically configured so that the imaging plane
lies parallel to this relative velocity vector. For crossed mole-
cular beam studies the measured laboratory-frame velocities
are then readily converted into CM velocities via a Newton
(velocity vector) diagram. Examples of Newton diagrams for
bimolecular collisions together with experimental images are
shown in Fig. 12 for crossed molecular beam studies of Cl þn-butane which are discussed below.
Several experimental geometries have been employed in ion-
imaging studies of bimolecular scattering. The traditional
crossed molecular beam set-up involves two skimmed mole-
cular beams intersecting at a set angle, typically 901, with the
probe laser overlapping the intersection region. The plane
defined by the two crossed molecular beams is typically
parallel to the imaging plane, thereby ensuring that the
symmetry axis of the product Newton spheres (the relative
velocity vector) will also be parallel to the imaging plane. Such
crossed molecular beam set-ups have been used to study the
rotationally inelastic scattering of NO from Ar,48,132–138 He
and D2;139 of HCl from Ar,140 Ne, Kr, N2 and CH4;
141 and of
CO by Ne.142 Similar experimental arrangements have been
employed in studies of non-adiabatic transfer between the 2P3/2
and 2P1/2 spin–orbit states of Cl atoms in collision with D2,143
and in studies of the reactive scattering of O(1D) atoms with
Fig. 11 (a) Raw image of the Cl1 ions resulting from multiphoton
excitation of BrCl at 316.85 nm (v ¼ 31568.4 cm�1). ephot is vertical in
the plane of the displayed image. The two inner rings, which peak at 01
and exhibit parallel recoil angular anisotropy, are attributable to one
photon dissociation of BrCl1 ions formed by three photon ionisation,
resonance enhanced at the two photon energy by the v ¼ 3 level of the
first [2P1/2]5ss Rydberg state. The outer rings show a strikingly
different angular anisotropy, peaking at B�351 to the vertical. (b)
shows the angular distribution associated with the outermost of the
intense rings, together with best fits using both eqn (1) (--) and an
expanded version of this equation (—) involving terms up to P6(cos y).The values of the b2, b4 and b6 coefficients derived in the latter fitting
show these Cl1 ions to be formed as a result of a resonance enhanced
three photon O ¼ 01 -- O ¼ 1 - O ¼ 1 dissociation process,
yielding Cl** atoms in their 3s23p4(3P)4s Rydberg state, which are
then ionised by further photon absorption.
Fig. 12 HCl(v ¼ 0, J ¼ 1 and 5) product images from the reaction of
Cl with n-butane, with the appropriate Newton diagram for the
reaction overlaid. CM indicates the position of the centre of mass,
the vectors vCl2 and vRH represent the Cl2 and RH molecular beam
velocities respectively, vCl and uCl are the velocities of the Cl atoms in
the laboratory and CM frame respectively, uHCl is the velocity of the
product HCl in the centre-of-mass frame and y is the scattering angle.
(adapted from ref. 160).
42 | Phys. Chem. Chem. Phys., 2006, 8, 26–53 This journal is �c the Owner Societies 2006
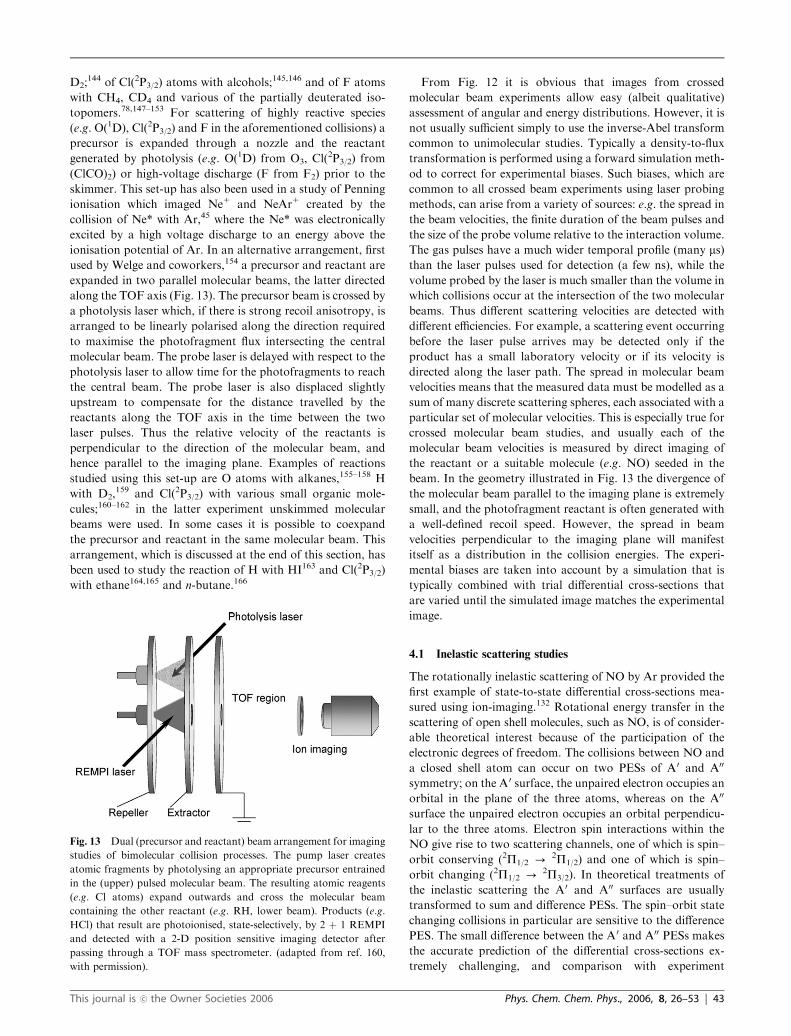
D2;144 of Cl(2P3/2) atoms with alcohols;145,146 and of F atoms
with CH4, CD4 and various of the partially deuterated iso-
topomers.78,147–153 For scattering of highly reactive species
(e.g. O(1D), Cl(2P3/2) and F in the aforementioned collisions) a
precursor is expanded through a nozzle and the reactant
generated by photolysis (e.g. O(1D) from O3, Cl(2P3/2) from
(ClCO)2) or high-voltage discharge (F from F2) prior to the
skimmer. This set-up has also been used in a study of Penning
ionisation which imaged Ne1 and NeAr1 created by the
collision of Ne* with Ar,45 where the Ne* was electronically
excited by a high voltage discharge to an energy above the
ionisation potential of Ar. In an alternative arrangement, first
used by Welge and coworkers,154 a precursor and reactant are
expanded in two parallel molecular beams, the latter directed
along the TOF axis (Fig. 13). The precursor beam is crossed by
a photolysis laser which, if there is strong recoil anisotropy, is
arranged to be linearly polarised along the direction required
to maximise the photofragment flux intersecting the central
molecular beam. The probe laser is delayed with respect to the
photolysis laser to allow time for the photofragments to reach
the central beam. The probe laser is also displaced slightly
upstream to compensate for the distance travelled by the
reactants along the TOF axis in the time between the two
laser pulses. Thus the relative velocity of the reactants is
perpendicular to the direction of the molecular beam, and
hence parallel to the imaging plane. Examples of reactions
studied using this set-up are O atoms with alkanes,155–158 H
with D2,159 and Cl(2P3/2) with various small organic mole-
cules;160–162 in the latter experiment unskimmed molecular
beams were used. In some cases it is possible to coexpand
the precursor and reactant in the same molecular beam. This
arrangement, which is discussed at the end of this section, has
been used to study the reaction of H with HI163 and Cl(2P3/2)
with ethane164,165 and n-butane.166
From Fig. 12 it is obvious that images from crossed
molecular beam experiments allow easy (albeit qualitative)
assessment of angular and energy distributions. However, it is
not usually sufficient simply to use the inverse-Abel transform
common to unimolecular studies. Typically a density-to-flux
transformation is performed using a forward simulation meth-
od to correct for experimental biases. Such biases, which are
common to all crossed beam experiments using laser probing
methods, can arise from a variety of sources: e.g. the spread in
the beam velocities, the finite duration of the beam pulses and
the size of the probe volume relative to the interaction volume.
The gas pulses have a much wider temporal profile (many ms)than the laser pulses used for detection (a few ns), while the
volume probed by the laser is much smaller than the volume in
which collisions occur at the intersection of the two molecular
beams. Thus different scattering velocities are detected with
different efficiencies. For example, a scattering event occurring
before the laser pulse arrives may be detected only if the
product has a small laboratory velocity or if its velocity is
directed along the laser path. The spread in molecular beam
velocities means that the measured data must be modelled as a
sum of many discrete scattering spheres, each associated with a
particular set of molecular velocities. This is especially true for
crossed molecular beam studies, and usually each of the
molecular beam velocities is measured by direct imaging of
the reactant or a suitable molecule (e.g. NO) seeded in the
beam. In the geometry illustrated in Fig. 13 the divergence of
the molecular beam parallel to the imaging plane is extremely
small, and the photofragment reactant is often generated with
a well-defined recoil speed. However, the spread in beam
velocities perpendicular to the imaging plane will manifest
itself as a distribution in the collision energies. The experi-
mental biases are taken into account by a simulation that is
typically combined with trial differential cross-sections that
are varied until the simulated image matches the experimental
image.
4.1 Inelastic scattering studies
The rotationally inelastic scattering of NO by Ar provided the
first example of state-to-state differential cross-sections mea-
sured using ion-imaging.132 Rotational energy transfer in the
scattering of open shell molecules, such as NO, is of consider-
able theoretical interest because of the participation of the
electronic degrees of freedom. The collisions between NO and
a closed shell atom can occur on two PESs of A0 and A00
symmetry; on the A0 surface, the unpaired electron occupies an
orbital in the plane of the three atoms, whereas on the A00
surface the unpaired electron occupies an orbital perpendicu-
lar to the three atoms. Electron spin interactions within the
NO give rise to two scattering channels, one of which is spin–
orbit conserving (2P1/2 - 2P1/2) and one of which is spin–
orbit changing (2P1/2 - 2P3/2). In theoretical treatments of
the inelastic scattering the A0 and A00 surfaces are usually
transformed to sum and difference PESs. The spin–orbit state
changing collisions in particular are sensitive to the difference
PES. The small difference between the A0 and A00 PESs makes
the accurate prediction of the differential cross-sections ex-
tremely challenging, and comparison with experiment
Fig. 13 Dual (precursor and reactant) beam arrangement for imaging
studies of bimolecular collision processes. The pump laser creates
atomic fragments by photolysing an appropriate precursor entrained
in the (upper) pulsed molecular beam. The resulting atomic reagents
(e.g. Cl atoms) expand outwards and cross the molecular beam
containing the other reactant (e.g. RH, lower beam). Products (e.g.
HCl) that result are photoionised, state-selectively, by 2 þ 1 REMPI
and detected with a 2-D position sensitive imaging detector after
passing through a TOF mass spectrometer. (adapted from ref. 160,
with permission).
This journal is �c the Owner Societies 2006 Phys. Chem. Chem. Phys., 2006, 8, 26–53 | 43
provides a stringent test of the accuracy of the PESs. In all the
inelastic scattering experiments the NO scattered into different
rotational states is ionised state-selectively by 1 þ 1 REMPI
via the A2S1 state. In the first ion-imaging studies of NO with
Ar132,133 two maxima in the rotationally inelastic scattering
angular distributions, known as rotational rainbows, were
observed—as expected for a heteronuclear diatomic scattering
from an atom.
Later ion-imaging135 and VMI studies134 of this system,
with increased resolution and sensitivity, have shown good
agreement (for both spin–orbit state conserving and spin–orbit
state changing collisions) with calculated differential cross-
sections based on coupled cluster CCSD(T) PESs.167 At a CM
collision energy (ECM) of 0.066 eV,135 low J products are
observed to be strongly forward scattered, with sideways and
backward scattering becoming significant at J 4 4.5, and
undulations at all J—which become wider and shift to higher
angle with increasing J. These undulations have been related
to the ellipsoidal nature of the atom-molecule interaction.
Effects of reagent vibrational excitation have been studied
also;48 only a slight shift to smaller scattering angles was noted
for NO(v ¼ 5) compared to NO(v ¼ 0) scattered from Ar at
ECM ¼ 0.181 eV, consistent with a slight increase in the
angular anisotropy in the intermolecular potential. Lorenz
et al.48 were able to deduce the preferred sense of rotation of
NO following collision with Ar at ECM ¼ 0.066 eV, by
comparing images obtained with right circularly polarised
(RCP) and left circularly polarised (LCP) probe laser radiation.
The scattered NO molecules in these experiments were probed
via the R21 branch within the A2S1 ’ X2P1/2 transition.
Analysis of the appropriate difference images (i.e. (MR � ML)
/(MR þ ML)) yields a direct measure of product orientation.
NO molecules in high j states displayed substantial rotational
orientation. Such observations have been rationalised by as-
suming that some of the collision encounters scatter product
into lower J states via chattering (i.e. multiple) collisions with
the recoiling Ar atom. The sense of rotation of the lower J state
products was found to vary with deflection angle in a compli-
cated way, which is reproduced well by quantum calculations
on the coupled cluster CCSD(T) PES for Ar-NO. This oscilla-
tory pattern in the preferred sense of rotation is thought to arise
from interference between product trajectories. The rotational
alignment of NO scattered from Ar137 has also been measured
from images recorded with the probe laser linearly polarised
either parallel (Z) or perpendicular (X) to the detection axis. As
in the photodissociation studies described earlier, analysis of the
angular distribution in the normalised alignment image (MZ �MX)/(MZ þ MX) can yield alignment parameters, some of
which are dependent on the azimuthal deflection and are not
available with other detection methods.
When a diatomic molecule collides with an atom at rela-
tively low collision energies, such as in the Ar–NO examples
above, any transferred energy can only be partitioned into
translational and rotational excitation of the diatomic. Thus
each rotationally resolved image of the diatomic molecule
contains the projection of a single scattering sphere, with its
CM velocity constrained by energy and momentum conserva-
tion. This offers a route to forming translationally ‘cold’
molecules, as Chandler and coworkers168 have demonstrated
for the specific case of the J ¼ 7.5 products in the crossed-
beam inelastic scattering of Ar atoms with NO(X2P1/2, v ¼ 0,
J ¼ 0.5) molecules. After due attention to reactant beam
preparation and appropriate selection of collision energy,
these authors succeeded in demonstrating J ¼ 7.5 products
with a LAB-frame rms velocity r14.8 � 1.1 m s�1, corre-
sponding to a translational temperature of just 406 � 28
mK.168
When a diatomic molecule collides with another molecular
species, several internal modes of the (unobserved) partner
may be populated in association with any particular rotational
state of the diatomic. Each image is thus the projection of a
number of scattering spheres. In the study of the scattering of
HCl from N2 and CH4 by Wade et al.,141 for example, the
image resolution was not sufficient to extract pair-correlated
DCSs. Nonetheless, it was clear that HCl products that had
experienced a large change in J (i.e. high DJ) correlated with
high DJ N2 or CH4 partners, while low DJ HCl products
correlated with low DJ in the collider. It was also clear from
the images that the DCSs for HCl–N2 and HCl–CH4 collisions
were different from one another, and from those of HCl
scattered from Ne, Ar and Kr. The DCSs of the latter were
compared to those predicted from the potential energy surface
H6(3,4,0) for HCl-Ar by Hutson,169 scaled to account for mass
and velocity differences, and very good agreement was
found.141
Measuring the inelastic scattering of HCl is more difficult
than NO, mainly because detection of the former requires use
of a 2 þ 1 REMPI scheme rather than the 1 þ 1 REMPI
process used for monitoring NO. Much higher photon den-
sities are required to drive a 2 þ 1 REMPI transition; these are
achieved by focussing the laser more tightly. The smaller size
of the probed volume means that less product is detected,
resulting in lower signal-to-noise. The H(D) atom is the only
species, other than NO, that traditionally has been detected by
1 þ 1 REMPI in ion-imaging studies.
4.2 Reactive scattering processes
Two colour 1þ 10 REMPI schemes (via Lyman-a excitation to
the 2p state) were used to detect D atom products in two early
ion imaging studies of reactive processes: H þ D2 - HD þD159 and O(1D) þ D2 - OD þ D.144 In the former experi-
ment, the precursor (HI) and reagent (D2) molecular beams
were parallel, with the latter directed along the TOF axis (Fig.
13). The precursor beam was photolysed at 266 nm, yielding
two sub-groups of H atom velocities that can intersect the D2
molecular beam. Slower H atoms are produced in conjunction
with I* atoms, via a perpendicular transition (yielding a recoil
distribution that varies as cos2 y), whereas faster H atoms are
produced in combination with I atoms via a parallel transition
(sin2y distribution). Thus two collision energies (ECM B1.29
and 0.54 eV) could be explored, simply by varying the
polarisation axis of the linearly polarised photolysis light.
The distance and timing between the photolysis and probe
lasers were set so as to ensure that the relative velocity of the
reaction was parallel to the imaging plane, and the inverse
Abel transform was applied to the resulting image to obtain a
2-D section through the D atom velocity distribution. This
44 | Phys. Chem. Chem. Phys., 2006, 8, 26–53 This journal is �c the Owner Societies 2006
early ion-imaging experiment did not use velocity mapping
and distinct rings in the D atom velocity distribution asso-
ciated with the individual quantum states of the HD co-
product were not resolved. Nonetheless, the images clearly
revealed that fast D atoms (formed in association with HD co-
products with low internal excitation) were forward scattered,
whereas the scattering of slower D atoms shifted to wider
angles. The results at the lower collision energy were in good
agreement with quasi-classical trajectory calculations based on
the LSTH (Liu–Siegbahn–Truhlar–Horowitz) PES, but the
agreement at the higher collision energy was less impressive.
As already commented, relatively few species can be de-
tected by 1 þ 1 REMPI. To circumvent this problem, Suits
and coworkers have investigated H atom abstraction from
alkanes (by reaction with O atoms)155–157 and from alcohols
(by Cl atoms)145,146 by so-called universal detection of the
alkyl and hydroxyalkyl co-products. Universal detection in
this case involved direct one-photon ionisation of the radical
by 157 nm (7.9 eV) photons from a F2 excimer laser. This
photon energy is sufficient to ionise radicals created by re-
moval of a secondary or tertiary H atom, but not of a primary
H atom (though this limitation could be circumvented by
using VUV radiation from a tuneable synchrotron source).
Cl(2P3/2), O(3P) and O(1D) reagents were generated by 193 nm
photolysis of (ClCO)2, SO2 and N2O, respectively. For the Cl
atom plus alcohol (methanol, ethanol and isopropanol) reac-
tions, the (ClCO)2 and alcohol molecular beams were directed
at 901 to one other, and the imaging detector was parallel to
the plane of the molecular beams. In contrast, the O atom
reaction studies employed a geometry analogous to that
shown in Fig. 13. SO2 photolysis generates O(3P) atoms with
a wide range of recoil velocities. The average collision energy
could thus be tuned, simply by varying the time delay between
the photolysis and detection lasers. Detection of residual
product from earlier collisions (with faster O(3P) atoms) that
was still in the detection volume when the probe laser pulse
arrived caused only modest distortions, which could be simu-
lated. For both experimental set-ups, the forward scattering
region was obscured by photodissociation from the parent
alcohol or alkane. This is a major disadvantage of universal
detection, which severely limits the reliability of the data in the
forward direction. Image analysis revealed predominately
sideways/backwards scattering for Cl with methanol at
ECM¼ 0.38 eV,145,146 backwards scattering for Cl with ethanol
at ECM ¼ 0.26 eV with increasing sideways scattering at higher
ECM (0.42 eV),146 and backwards scattering for Cl with
isopropanol at ECM ¼ 0.52 eV.146 The images for O(3P)
reactions with cyclohexane, n-butane and isobutene155,156
revealed backwards scattering, which broadened as ECM in-
creased from 0.20 to 0.64 eV. The reaction of O(1D) with
n-pentane at ECM ¼ 0.6 eV showed isotropic/forward scatter-
ing, whereas O(3P) with n-pentane at a similar collision energy
showed sideways/backwards scattering.157 The contrasting
angular distributions reflect a change in reaction mechanism.
The reactions of ground-state Cl atoms with alcohols, and of
O(3P) atoms with alkanes, proceed via direct mechanisms with
a small barrier, whereas the O(1D) þ n-pentane reaction is
generally assumed to proceed via a long-lived intermediate.
That said, it has been suggested that the highly vibrationally
excited OH products observed in O(1D) þ alkene reactions
may arise via a direct mechanism,170 as has been shown for the
simpler (but related) O(1D) þ H2 reaction.171,172 The images
also revealed that most of the reaction exoergicity (B60–70%,
rising to B80% in the case of O(1D) þ n-pentane) was
partitioned into internal modes of the alkyl (or hydroxyalkyl)
radical products.155–157 In reaching these conclusions, the
authors had to assume that the radical ionisation efficiency
is independent of its degree of internal excitation. Obviously, if
radicals with excited internal modes are ionised preferentially,
then the fractions of the available energy partitioned into
internal energy quoted above will be overestimates. Moreover,
the observed angular distributions could be biased due to
unequal sampling of the trajectories in the reactive scattering
process. Such a biasing has been suggested to account for the
discrepancy between the results obtained using universal
ionisation and Doppler-resolved polarised LIF of the OH
products from the reaction of O(3P) atoms with isobutane
and cyclohexane.173
Several limitations of universal detection schemes involving
direct one-photon ionisation have been mentioned above: the
lack of state-to-state information, background due to parent
photodissociation, and possible biasing in favour of products
with greater levels of internal excitation. Its main advantage is
that it allows study of a very wide variety of reactions, with
high sensitivity. This should be contrasted with the various
REMPI detection schemes. As already commented, relatively
few species may be probed conveniently by 1 þ 1 REMPI,
while 2 þ 1 REMPI schemes generally suffer from substan-
tially lower detection sensitivities. Nonetheless, as Fig. 14
illustrates, 2 þ 1 REMPI detection has recently been used to
great effect by Liu and coworkers to detect CD3 products from
the reaction of F with CD4 at ECM ¼ 0.233 eV.147 Their
apparatus comprised two rotatable double skimmed molecular
beams and a fixed, gated detector—to allow slice imaging.
Different vibrational states of the CD3 products formed in the
intersection region of the two molecular beams were ionised by
2 þ 1 REMPI at the peak of the associated Q branches, giving
partial rotational state resolution. As Fig. 14(a) shows, the
image of the CD3(v ¼ 0) products showed well-resolved rings,
reflecting the formation of different vibrational states of the
coincident DF product. The narrow widths of the rings reveal
that the partner DF products are formed with little rotational
excitation. A density-to-flux transformation (and corrections
for imperfect time slicing) give the pair-correlated DCSs
directly (see Fig. 14b), which are very reminiscent of the
vibrational level resolved DCSs for the reaction of F atoms
with H2 or D2 obtained using traditional crossed molecular
beam and detection methods.174,175 Integration of the total
signal associated with each ring yields the pair-correlated
vibrational state population distributions—which show a dis-
tinct anti-correlation between the vibrational populations of
the two products. The umbrella mode of the CD3 and the
stretch of the DF are both expected to couple with the reaction
co-ordinate, and it was suggested that ‘chattering’ of the D
atom between the F and CD3 may allow energy flow between
the two nascent products resulting in the observed anti-
correlation. In another study by the same group, the probe
laser wavelength was scanned to obtain a rotationally
This journal is �c the Owner Societies 2006 Phys. Chem. Chem. Phys., 2006, 8, 26–53 | 45
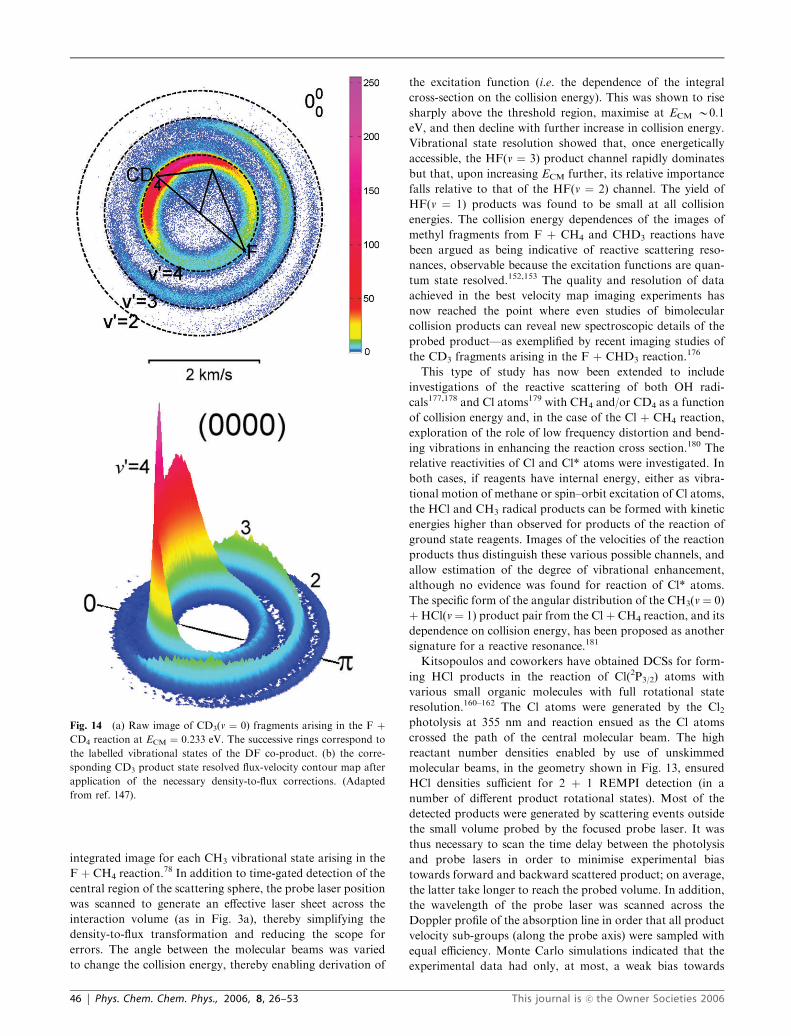
integrated image for each CH3 vibrational state arising in the
F þ CH4 reaction.78 In addition to time-gated detection of the
central region of the scattering sphere, the probe laser position
was scanned to generate an effective laser sheet across the
interaction volume (as in Fig. 3a), thereby simplifying the
density-to-flux transformation and reducing the scope for
errors. The angle between the molecular beams was varied
to change the collision energy, thereby enabling derivation of
the excitation function (i.e. the dependence of the integral
cross-section on the collision energy). This was shown to rise
sharply above the threshold region, maximise at ECM B0.1
eV, and then decline with further increase in collision energy.
Vibrational state resolution showed that, once energetically
accessible, the HF(v ¼ 3) product channel rapidly dominates
but that, upon increasing ECM further, its relative importance
falls relative to that of the HF(v ¼ 2) channel. The yield of
HF(v ¼ 1) products was found to be small at all collision
energies. The collision energy dependences of the images of
methyl fragments from F þ CH4 and CHD3 reactions have
been argued as being indicative of reactive scattering reso-
nances, observable because the excitation functions are quan-
tum state resolved.152,153 The quality and resolution of data
achieved in the best velocity map imaging experiments has
now reached the point where even studies of bimolecular
collision products can reveal new spectroscopic details of the
probed product—as exemplified by recent imaging studies of
the CD3 fragments arising in the F þ CHD3 reaction.176
This type of study has now been extended to include
investigations of the reactive scattering of both OH radi-
cals177,178 and Cl atoms179 with CH4 and/or CD4 as a function
of collision energy and, in the case of the Cl þ CH4 reaction,
exploration of the role of low frequency distortion and bend-
ing vibrations in enhancing the reaction cross section.180 The
relative reactivities of Cl and Cl* atoms were investigated. In
both cases, if reagents have internal energy, either as vibra-
tional motion of methane or spin–orbit excitation of Cl atoms,
the HCl and CH3 radical products can be formed with kinetic
energies higher than observed for products of the reaction of
ground state reagents. Images of the velocities of the reaction
products thus distinguish these various possible channels, and
allow estimation of the degree of vibrational enhancement,
although no evidence was found for reaction of Cl* atoms.
The specific form of the angular distribution of the CH3(v ¼ 0)
þHCl(v ¼ 1) product pair from the Cl þ CH4 reaction, and its
dependence on collision energy, has been proposed as another
signature for a reactive resonance.181
Kitsopoulos and coworkers have obtained DCSs for form-
ing HCl products in the reaction of Cl(2P3/2) atoms with
various small organic molecules with full rotational state
resolution.160–162 The Cl atoms were generated by the Cl2photolysis at 355 nm and reaction ensued as the Cl atoms
crossed the path of the central molecular beam. The high
reactant number densities enabled by use of unskimmed
molecular beams, in the geometry shown in Fig. 13, ensured
HCl densities sufficient for 2 þ 1 REMPI detection (in a
number of different product rotational states). Most of the
detected products were generated by scattering events outside
the small volume probed by the focused probe laser. It was
thus necessary to scan the time delay between the photolysis
and probe lasers in order to minimise experimental bias
towards forward and backward scattered product; on average,
the latter take longer to reach the probed volume. In addition,
the wavelength of the probe laser was scanned across the
Doppler profile of the absorption line in order that all product
velocity sub-groups (along the probe axis) were sampled with
equal efficiency. Monte Carlo simulations indicated that the
experimental data had only, at most, a weak bias towards
Fig. 14 (a) Raw image of CD3(v ¼ 0) fragments arising in the F þCD4 reaction at ECM ¼ 0.233 eV. The successive rings correspond to
the labelled vibrational states of the DF co-product. (b) the corre-
sponding CD3 product state resolved flux-velocity contour map after
application of the necessary density-to-flux corrections. (Adapted
from ref. 147).
46 | Phys. Chem. Chem. Phys., 2006, 8, 26–53 This journal is �c the Owner Societies 2006
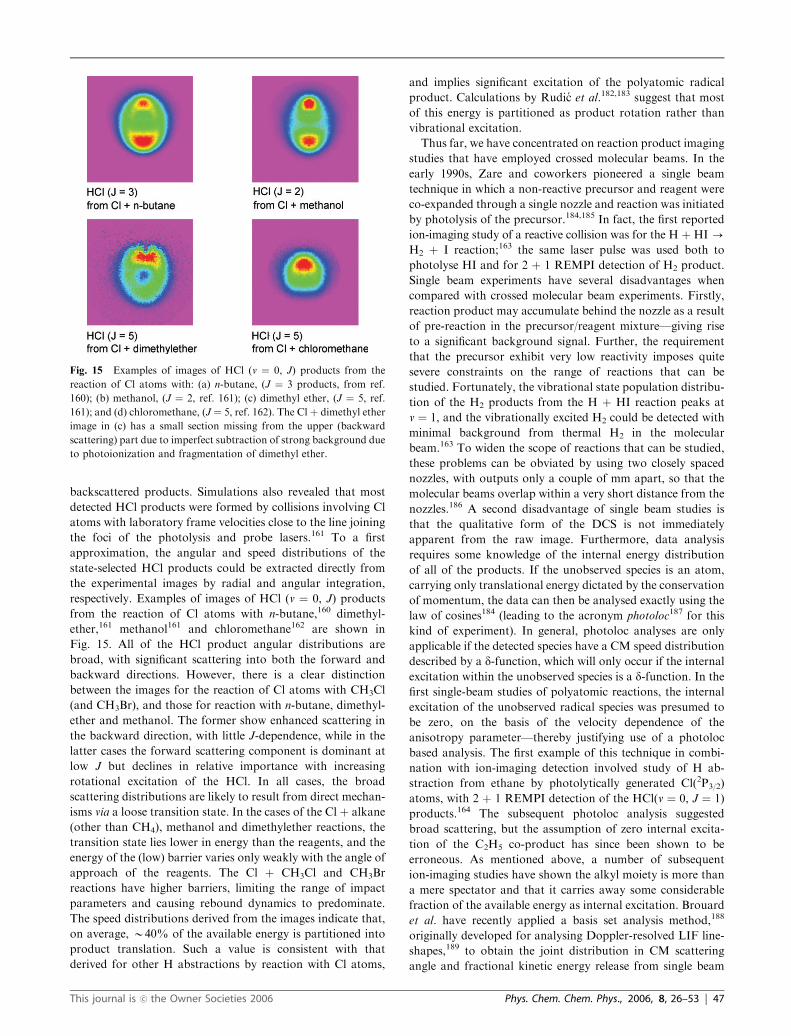
backscattered products. Simulations also revealed that most
detected HCl products were formed by collisions involving Cl
atoms with laboratory frame velocities close to the line joining
the foci of the photolysis and probe lasers.161 To a first
approximation, the angular and speed distributions of the
state-selected HCl products could be extracted directly from
the experimental images by radial and angular integration,
respectively. Examples of images of HCl (v ¼ 0, J) products
from the reaction of Cl atoms with n-butane,160 dimethyl-
ether,161 methanol161 and chloromethane162 are shown in
Fig. 15. All of the HCl product angular distributions are
broad, with significant scattering into both the forward and
backward directions. However, there is a clear distinction
between the images for the reaction of Cl atoms with CH3Cl
(and CH3Br), and those for reaction with n-butane, dimethyl-
ether and methanol. The former show enhanced scattering in
the backward direction, with little J-dependence, while in the
latter cases the forward scattering component is dominant at
low J but declines in relative importance with increasing
rotational excitation of the HCl. In all cases, the broad
scattering distributions are likely to result from direct mechan-
isms via a loose transition state. In the cases of the Cl þ alkane
(other than CH4), methanol and dimethylether reactions, the
transition state lies lower in energy than the reagents, and the
energy of the (low) barrier varies only weakly with the angle of
approach of the reagents. The Cl þ CH3Cl and CH3Br
reactions have higher barriers, limiting the range of impact
parameters and causing rebound dynamics to predominate.
The speed distributions derived from the images indicate that,
on average, B40% of the available energy is partitioned into
product translation. Such a value is consistent with that
derived for other H abstractions by reaction with Cl atoms,
and implies significant excitation of the polyatomic radical
product. Calculations by Rudic et al.182,183 suggest that most
of this energy is partitioned as product rotation rather than
vibrational excitation.
Thus far, we have concentrated on reaction product imaging
studies that have employed crossed molecular beams. In the
early 1990s, Zare and coworkers pioneered a single beam
technique in which a non-reactive precursor and reagent were
co-expanded through a single nozzle and reaction was initiated
by photolysis of the precursor.184,185 In fact, the first reported
ion-imaging study of a reactive collision was for the H þ HI-
H2 þ I reaction;163 the same laser pulse was used both to
photolyse HI and for 2 þ 1 REMPI detection of H2 product.
Single beam experiments have several disadvantages when
compared with crossed molecular beam experiments. Firstly,
reaction product may accumulate behind the nozzle as a result
of pre-reaction in the precursor/reagent mixture—giving rise
to a significant background signal. Further, the requirement
that the precursor exhibit very low reactivity imposes quite
severe constraints on the range of reactions that can be
studied. Fortunately, the vibrational state population distribu-
tion of the H2 products from the H þ HI reaction peaks at
v ¼ 1, and the vibrationally excited H2 could be detected with
minimal background from thermal H2 in the molecular
beam.163 To widen the scope of reactions that can be studied,
these problems can be obviated by using two closely spaced
nozzles, with outputs only a couple of mm apart, so that the
molecular beams overlap within a very short distance from the
nozzles.186 A second disadvantage of single beam studies is
that the qualitative form of the DCS is not immediately
apparent from the raw image. Furthermore, data analysis
requires some knowledge of the internal energy distribution
of all of the products. If the unobserved species is an atom,
carrying only translational energy dictated by the conservation
of momentum, the data can then be analysed exactly using the
law of cosines184 (leading to the acronym photoloc187 for this
kind of experiment). In general, photoloc analyses are only
applicable if the detected species have a CM speed distribution
described by a d-function, which will only occur if the internal
excitation within the unobserved species is a d-function. In the
first single-beam studies of polyatomic reactions, the internal
excitation of the unobserved radical species was presumed to
be zero, on the basis of the velocity dependence of the
anisotropy parameter—thereby justifying use of a photoloc
based analysis. The first example of this technique in combi-
nation with ion-imaging detection involved study of H ab-
straction from ethane by photolytically generated Cl(2P3/2)
atoms, with 2 þ 1 REMPI detection of the HCl(v ¼ 0, J ¼ 1)
products.164 The subsequent photoloc analysis suggested
broad scattering, but the assumption of zero internal excita-
tion of the C2H5 co-product has since been shown to be
erroneous. As mentioned above, a number of subsequent
ion-imaging studies have shown the alkyl moiety is more than
a mere spectator and that it carries away some considerable
fraction of the available energy as internal excitation. Brouard
et al. have recently applied a basis set analysis method,188
originally developed for analysing Doppler-resolved LIF line-
shapes,189 to obtain the joint distribution in CM scattering
angle and fractional kinetic energy release from single beam
Fig. 15 Examples of images of HCl (v ¼ 0, J) products from the
reaction of Cl atoms with: (a) n-butane, (J ¼ 3 products, from ref.
160); (b) methanol, (J ¼ 2, ref. 161); (c) dimethyl ether, (J ¼ 5, ref.
161); and (d) chloromethane, (J ¼ 5, ref. 162). The Cl þ dimethyl ether
image in (c) has a small section missing from the upper (backward
scattering) part due to imperfect subtraction of strong background due
to photoionization and fragmentation of dimethyl ether.
This journal is �c the Owner Societies 2006 Phys. Chem. Chem. Phys., 2006, 8, 26–53 | 47
data. Application of these methods to data obtained from the
reaction of Cl(2P3/2) atoms with ethane165 and n-butane166 at
ECM B0.24 and 0.32 eV, respectively, suggests that B22%
and B30% of the available energy is deposited into the
internal modes of the ethyl and butyl, respectively—results
in good accord with crossed molecular beam data for the same
systems. In the case of n-butane, the channels for abstraction
of primary and secondary H atoms were distinguished—there-
by leading to an estimation of the contribution of each channel
to each rotational state of the HCl product. The basis set
analysis method has the disadvantage of being less transparent
than the more direct analysis of crossed molecular beam data
but, on the upside, there is less scope for bias in the detection
of different velocities, provided the pump–probe delay times
are sufficiently short to avoid fly-out. Thus the transformation
between density and flux is less prone to error.
5. Conclusions and future prospects
The foregoing is intended to provide a reasonably complete
overview of a selected sub-set of the many applications where-
by imaging methods have been used to probe the dynamics of
gas phase chemical reactions. Our survey has been limited to
applications involving ion detection; to survey the many
complementary studies focussing on electron imaging would
require as much space again. Thus we have not discussed the
benefits and additional insights that can be obtained by adding
an imaging capability to the traditional REMPI-photoelectron
spectroscopy (PES) experiment,298 or the application of ima-
ging methods in studies of electron photodetachment from
anions190 and anion clusters.191,192 We have not described any
of the beautiful new insights into photoionisation dynamics
that have resulted from imaging very slow photoelectrons
released in threshold ionisation processes.193–195 Similarly,
we have glossed over the many new insights that ultra-fast
photoelectron imaging methods are providing to our under-
standing of radiationless transitions (isomerisations, internal
conversion and/or intersystem crossing processes) within mo-
lecules,196–198 and not done justice to the pioneering ultra-fast,
time-resolved studies of Hayden and co-workers in which
parent and fragment ions, and electrons, arising in a REMPI
process were imaged, in coincidence.37,199 Given the increasing
availability of fast time and position sensitive (delay line)
detectors, we envisage many extensions of this type of co-
incidence study.
Instead, we have concentrated on describing some of the
many new insights into chemical reaction dynamics afforded
by ion imaging methods. Clearly, the technique has come a
very long way since the time of Chandler and Houston’s
landmark study.28 Image resolution and fidelity have im-
proved enormously and, as this Review illustrates, ion imaging
methods have now been applied to an impressively diverse
range of gas phase processes—both unimolecular and bimo-
lecular. For completeness, we also draw attention to pioneer-
ing imaging studies of the products of ion—surface scattering
processes.200 Experimental imaging methods continue to de-
velop, both in the achieved resolution and in their range of
application. The ultimate resolution should be approachable
by solving the ion-recoil problem, reducing space charge
effects and circumventing the problem of insufficient rota-
tional cooling using, for example, electrostatic state-selection
or double resonance excitation. Slicing techniques are offering
new solutions to probing systems that lack cylindrical sym-
metry—as illustrated, for example, by the recent study of the
wavelength and recoil velocity dependence of the orbital
orientation of the O(1D) atoms arising in the near UV photo-
lysis of O3.201 Pulsed-field slicing, in particular, opens the way
to studies of reactions involving charged species, and intro-
duces a t ¼ 0 for TOF mass selection in cases where pulsed
laser ionization is not used. Photodissociation studies of
progressively larger molecules will have to address not just
the resolution issue, but also the problem of rapid intramole-
cular relaxation to the electronic ground state—as pointed out
by Lee and coworkers,202 who also demonstrated the utility of
multiple mass imaging using a radial cylindrical energy analy-
zer. Dissociation from the highly vibrationally excited ground
state molecules that generally arise in such intramolecular
relaxation processes can be much slower than the 0–20 ns
dissociation-ionization time delay typically used in most cur-
rent imaging studies. With some effort, time delays approach-
ing 10 ms should be possible using VMI, and simultaneous
two-mass, 2-D imaging may be achievable using a double-
exposure CCD camera. Reports describing the extension of
the Rydberg tagging method to species other than H atoms,
and its combination with VMI, are starting to appear.203,204
Clearly, both the technology and the range of possible appli-
cations for imaging the dynamics of gas phase reactions have
some way yet to go!
Acknowledgements
The participating groups are grateful to the Commission of the
European Communities for funding via the IHP Network
HPRN-CT-2002-00183 (PICNIC), to Prof. B. J. Whitaker
(Leeds) for his support and encouragement as Coordinator
of this Network, and to Professor Kopin Liu for providing
Fig. 14. The Bristol authors also wish to acknowledge financial
support from EPSRC (Portfolio Partnership award LASER),
the EU (Marie-Curie Fellowship MEIF-CT-2003-500999
(PHOSPHOR) to NHN), and the important contributions
made to the local imaging programme by, among others, M.
Beckert, R. N. Dixon, C. Murray, K. N. Rosser, A. D. Webb,
E. Wrede and E. R. Wouters. TNK is grateful to the Alex-
ander von Humboldt Foundation, for support through the
Friedrich von Bessel Award. DHP also wishes to acknowledge
the Dutch National Science Foundation—FOM programme
‘‘Molecular Atmospheric Processes’’ for support, and contri-
butions from the Nijmegen imaging group members including
M. Coroiu, A. Eppink, D. Radenovic, A. van Roij, K. Vidma,
A. Zawadska and Y. Zhang.
References
1 G. Porter, Proc. R. Soc. London, Ser. A, 1950, 9, 60.2 F. J. Lipscomb, R. G. W. Norrish and B. A. Thrush, Proc. R. Soc.London, Ser. A, 1956, 233, 455.
3 J. K. Cashion and J. C. Polanyi, J. Chem. Phys., 1959, 30, 317.4 N. Basco and R. G. W. Norrish, Nature, 1961, 189, 455.5 R. N. Zare and P. J. Dagdigian, Science, 1974, 185, 739.
48 | Phys. Chem. Chem. Phys., 2006, 8, 26–53 This journal is �c the Owner Societies 2006
6 J. L. Kinsey, Annu. Rev. Phys. Chem., 1977, 28, 349.7 J. J. Valentini, Spectrometric Techniques, Academic, London,1985.
8 M. N. R. Ashfold and J. D. Howe, Annu. Rev. Phys. Chem., 1994,45, 57, and references therein.
9 R. W. Diesen, J. C. Wahr and S. E. Adler, J. Chem. Phys., 1969,50, 3635.
10 S. J. Riley and K. R. Wilson, Faraday Discuss. Chem. Soc., 1972,53, 132.
11 A. M. Wodtke and Y. T. Lee, in Molecular PhotodissociationDynamics, eds. M. N. R. Ashfold and J. E. Baggott, RoyalSociety of Chemistry, London, 1987, pp. 31–59.
12 R. Bersohn, in Molecular Photodissociation Dynamics, eds. M. N.R. Ashfold and J. E. Baggott, Royal Society of Chemistry,London, 1987, pp. 1–30.
13 M. N. R. Ashfold, I. R. Lambert, D. H. Mordaunt, G. P. Morleyand C. M. Western, J. Phys. Chem., 1992, 96, 2938.
14 L. J. Butler and D. M. Neumark, J. Phys. Chem., 1996, 100,12801.
15 G. Hancock, P. J. Pearson, G. A. D. Ritchie and D. F. Tibbetts,Phys. Chem. Chem. Phys., 2003, 5, 5386, and references therein.
16 A. J. Orr-Ewing and R. N. Zare, Annu. Rev. Phys. Chem., 1994,45, 315.
17 L. Schnieder, W. Meier, K. H. Welge, M. N. R. Ashfold and C.M. Western, J. Chem. Phys., 1990, 92, 7027.
18 M. N. R. Ashfold, D. H. Mordaunt and S. H. S. Wilson, inPhotochemistry, ed. D. C. Neckers, D. H. Volman and G. vonBunau, Wiley, New York, 1996, 21, 217.
19 E. Wrede, L. Schnieder, K. H. Welge, F. J. Aoiz, L. Banares, J. F.Castillo, B. Martinez-Haya and V. J. Herrero, J. Chem. Phys.,1999, 110, 9971.
20 R. N. Dixon, D. W. Hwang, X. F. Yang, S. Harich, J. J. Lin andX. Yang, Science, 1999, 285, 1249.
21 F. J. Aoiz, L. Banares, J. F. Castillo, V. J. Herrero, B. Martinez-Haya, P. Honvault, J. M. Launay, X. Liu, J. J. Lin, S. A. Harich,C. C. Wang and X. Yang, J. Chem. Phys., 2002, 116, 10692.
22 J. A. Mueller, S. A. Rogers and P. L. Houston, J. Phys. Chem. A,1998, 102, 9666.
23 C. Lin, M. F. Witinski and H. F. Davis, J. Chem. Phys., 2003,119, 251.
24 Z. Xu, B. Koplitz and C. Wittig, J. Chem. Phys., 1989, 90, 2692.25 R. N. Dixon, J. Chem. Phys., 1986, 85, 1866.26 G. E. Hall and P. L. Houston, Annu. Rev. Phys. Chem., 1989, 40,
375.27 M. Brouard, I. Burak, D. Minayev, P. O’Keeffe, C. Vallance, F. J.
Aoiz, L. Banares, J. F. Castillo, D. H. Zhang and M. A. Collins,J. Chem. Phys., 2003, 118, 1162, and references therein.
28 D. W. Chandler and P. L. Houston, J. Chem. Phys., 1986, 87,1445.
29 A. J. R. Heck and D. W. Chandler, Annu. Rev. Phys. Chem., 1995,46, 335.
30 P. L. Houston, Acc. Chem. Res., 1995, 28, 453.31 Imaging in Chemical Dynamics, eds. A. G. Suits and R. E.
Continetti, American Chemical Society, Washington, DC,2001.
32 Imaging in Molecular Dynamics, Technology and Applications, ed.B. J. Whitaker, Cambridge University Press, Cambridge, 2003.
33 C. Vallance, Philos. Trans. R. Soc. London, Ser. A, 2004, 362,2591.
34 D. H. Parker and A. T. J. B. Eppink, ch. 2 in ref. 32.35 A. T. J. B. Eppink, S.-M. Wu and B. J. Whitaker, ch. 3 in ref. 32.36 H. Helm, D. P. Debruijn and J. Los, Phys. Rev. Lett., 1984, 53,
1642.37 J. A. Davies, R. E. Continetti, D. W. Chandler and C. C. Hayden,
Phys. Rev. Lett., 2000, 84, 5983.38 A. Eppink and D. H. Parker, Rev. Sci. Instrum., 1997, 68, 3477.39 C. Bordas, F. Paulig, H. Helm and D. L. Huestis, Rev. Sci.
Instrum., 1997, 67, 2257.40 M. Beckert, S. J. Greaves and M. N. R. Ashfold, Phys. Chem.
Chem. Phys., 2003, 5, 308.41 P. W. Harland, B. R. Cameron, M. Bart and M. O. Pearce, Rev.
Sci. Instrum., 2002, 73, 2398.42 R. S. E. Mabbs and A. Sanov, Analyst, 2003, 128, 765.43 A. V. Davis, R. Wester, A. E. Bragg and D. M. Neumark, J.
Chem. Phys., 2003, 118, 999.
44 A. L. Sanov and W. C. Lineberger, Phys. Chem. Chem. Phys.,2004, 6, 2018.
45 R. F. Delmdahl, B. L. G. Bakker and D. H. Parker, J. Chem.Phys., 2000, 113, 7728.
46 E. L. Reichert, G. Thurau and J. C. Weisshaar, J. Chem. Phys.,2002, 117, 653.
47 D. H. Parker, in Photoionization and Photodetachment, AdvancedSeries in Physical Chemistry, World Scientific Publishing Co.Ltd., Singapore, 2000, vol. 10A and 10B.
48 K. T. Lorenz, D. W. Chandler, J. W. Barr, W. W. Chen, G. L.Barnes and J. I. Cline, Science, 2001, 293, 2063.
49 M. Ahmed, D. S. Peterka and A. G. Suits, Abstr. Pap. Am. Chem.Soc., 1998, 215, U164.
50 H. S. Chung, B. S. Zhao, S. H. Lee, S. G. Hwang, K. C. Cho, S.H. Shim, S. M. Lim, W. K. Kang and D. S. Chung, J. Chem.Phys., 2001, 114, 8293.
51 S. Wolf and H. Helm, Phys. Rev. A, 1997, 56, R4385.52 N. Yonekura, C. Gebauer, H. Kohguchi and T. Suzuki, Rev. Sci.
Instrum., 1999, 70, 3265.53 Y. Yamakita, S. R. Procter, A. L. Goodgame, T. P. Softley and F.
Merkt, J. Chem. Phys., 2004, 121, 1419.54 A. I. Chichinin, T. S. Einfeld, C. M. Maul and K. H. Gericke,
Chem. Phys. Lett., 2004, 390, 50.55 E. Wrede, S. Laubach, S. Schulenberg, A. Brown, A. J. Orr-
Ewing and M. N. R. Ashfold, J. Chem. Phys., 2001, 114, 2629.56 E. Wrede, E. R. Wouters, M. Beckert, R. N. Dixon and M. N. R.
Ashfold, J. Chem. Phys., 2002, 116, 6064.57 A. Eppink and D. H. Parker, J. Chem. Phys., 1999, 110, 832.58 D. A. Chestakov, S. M. Wu, G. R. Wu, D. H. Parker, A. T. J. B.
Eppink and T. N. Kitsopoulos, J. Phys. Chem. A, 2004, 108, 8100.59 D. H. Parker, R. F. Delmdahl, B. Bakker and H. P. Loock, J.
Chin. Chem. Soc., 2001, 48, 327.60 R. L. Toomes, P. C. Samartzis, T. P. Rakitzis and T. N.
Kitsopoulos, Chem. Phys., 2004, 301, 209.61 A. E. Pomerantz and R. N. Zare, Chem. Phys. Lett., 2003, 370,
515.62 P. M. Regan, D. Ascenzi, E. Wrede, P. A. Cook, M. N. R.
Ashfold and A. J. Orr-Ewing, Phys. Chem. Chem. Phys., 2000, 2,5364.
63 O. Kaufmann, A. Ekers, K. Bergmann, N. Bezuglov, K. Miculis,M. Auzinsh and W. Meyer, J. Chem. Phys., 2003, 119, 3174.
64 H. L. Offerhaus, C. Nicole, F. Lepine, C. Bordas, F. Rosca-Prunaand M. J. J. Vrakking, Rev. Sci. Instrum., 2001, 72, 3245.
65 M. J. J. Vrakking, private communication.66 S. D. Carpenter, C. P. Schick and P. M. Weber, Rev. Sci.
Instrum., 1999, 70, 2262.67 D. Townsend, M. P. Minitti and A. G. Suits, Rev. Sci. Instrum.,
2003, 74, 2530.68 J. J. Lin, J. G. Zhou, W. C. Shiu and K. P. Liu, Rev. Sci. Instrum.,
2003, 74, 2495.69 B. Baguenard, J. B. Wills, F. Pagliarulo, F. Lepine, B. Climen, M.
Barbaire, C. Clavier, M. A. Lebeault and C. Bordas, Rev. Sci.Instrum., 2004, 75, 324.
70 B. Y. Chang, R. C. Hoetzlein, J. A. Mueller, J. D. Geiser and P.L. Houston, Rev. Sci. Instrum., 1998, 69, 1665.
71 M. J. Cooper, P. J. Jackson, L. J. Rogers, A. J. Orr-Ewing, M. N.R. Ashfold and B. J. Whitaker, J. Chem. Phys., 1998, 109, 4367.
72 T. P. Rakitzis, Chem. Phys. Lett., 2001, 342, 121.73 V. Dribinski, A. Ossadtchi, V. A. Mandelshtam and H. Reisler,
Rev. Sci. Instrum., 2002, 73, 2634.74 M. J. J. Vrakking, Rev. Sci. Instrum., 2001, 72, 4084.75 S. Manzhos and H. P. Loock, Comput. Phys. Commun., 2003,
154, 76.76 M. J. Bass, M. Brouard, A. P. Clark and C. Vallance, J. Chem.
Phys., 2002, 117, 8723.77 S. Manzhos and H. P. Loock, Rev. Sci. Instrum., 2004, 75, 2435.78 W. Shiu, J. J. Lin, K. Liu, M. Wu and D. H. Parker, J. Chem.
Phys., 2004, 120, 117.79 C. R. Gebhardt, T. P. Rakitzis, P. C. Samartzis, V. Ladopoulos
and T. N. Kitsopoulos, Rev. Sci. Instrum., 2001, 72, 3848.80 L. Dinu, A. Eppink, F. Rosca-Pruna, H. L. Offerhaus, W. J. van
der Zande and M. J. J. Vrakking, Rev. Sci. Instrum., 2002, 73,4206.
81 K. Tonokura and T. Suzuki, T. Chem. Phys. Lett., 1994, 224, 1.82 T. Kinugawa and T. Arikawa, J. Chem. Phys., 1992, 96, 4801.
This journal is �c the Owner Societies 2006 Phys. Chem. Chem. Phys., 2006, 8, 26–53 | 49
83 M. A. Young, J. Chem. Phys., 1995, 102, 7925, and referencestherein.
84 T. Shibata and T. Suzuki, Chem. Phys. Lett., 1996, 262, 115.85 T. Shibata, H. Y. Li, H. Katayanagi and T. Suzuki, J. Phys.
Chem. A, 1998, 102, 3643.86 N. Hemmi and A. G. Suits, J. Phys. Chem. A, 1997, 101, 6633.87 M. Ahmed, D. Blunt, D. Chen and A. G. Suits, J. Chem. Phys.,
1997, 106, 7617.88 D. S. Peterka, M. Ahmed, C. Y. Ng and A. G. Suits, Chem. Phys.
Lett., 1999, 312, 108.89 W. Li, L. Poisson, D. S. Peterka, M. Ahmed, R. R. Lucchese and
A. G. Suits, Chem. Phys. Lett., 2003, 374, 334.90 J. R. Greene, J. S. Francisco, J. H. Huang, D. D. Xu and W. M.
Jackson, J. Chem. Phys., 2004, 121, 5868.91 J. J. Larsen, N. J. Morkbak, J. Olesen, N. Bjerre, M. Machholm,
S. R. Keiding and H. Stapelfeldt, J. Chem. Phys., 1998, 109, 8857.92 P. C. Samartzis, B. L. G. Bakker, D. H. Parker and T. N.
Kitsopoulos, J. Phys. Chem. A, 1999, 103, 6106.93 B. L. G. Bakker, D. H. Parker, P. C. Samartzis and T. N.
Kitsopoulos, J. Chem. Phys., 2000, 112, 5654.94 B. L. G. Bakker, D. H. Parker, P. C. Samartzis and T. N.
Kitsopoulos, J. Chem. Phys., 2000, 113, 9044.95 W. G. Roeterdink and M. H. M. Janssen, Chem. Phys. Lett.,
2001, 345, 72.96 S. Unny, Y. Du, L. C. Zhu, R. J. Gordon, A. Sugita, M.
Kawasaki, Y. Matsumi and T. Seideman, Phys. Rev. Lett.,2001, 86, 2245.
97 H. Yamada, N. Taniguchi, M. Kawasaki, Y. Matsumi and R. J.Gordon, J. Chem. Phys., 2002, 117, 1130.
98 W. G. Roeterdink and M. H. M. Janssen, J. Chem. Phys., 2002,117, 6500.
99 W. G. Roeterdink and M. H. M. Janssen, Phys. Chem. Chem.Phys., 2002, 4, 601.
100 A. T. J. B. Eppink, B. J. Whitaker, E. Gloaguen, B. Soep, A. M.Coriou and D. H. Parker, J. Chem. Phys., 2004, 121, 7776.
101 J. A. Davies, J. E. LeClaire, R.E. Continetti and C. C. Hayden, J.Chem. Phys., 1999, 111, 1.
102 K. Suto, Y. Sato, C. L. Reed, V. Skorokhodov, Y. Matsumi andM. Kawasaki, J. Phys. Chem. A, 1997, 101, 1222.
103 M. Ahmed, D. S. Peterka, P. Regan, X. H. Liu and A. G. Suits,Chem. Phys. Lett., 2001, 339, 203.
104 X. H. Liu, R. L. Gross and A. G. Suits, Science, 2001, 294,2527.
105 W. Li, R. R. Lucchese, A. A. Doyuran, Z. L. Wu, H. Loos, G. E.Hall and A. G. Suits, Phys. Rev. Lett., 2004, 92, 083002.
106 L. M. Yoder, J. R. Barker, K. T. Lorenz and D. W. Chandler,Chem. Phys. Lett., 1999, 302, 602.
107 R. K. Sampson and W. D. Lawrance, Aust. J. Chem., 2003, 56,275.
108 S. M. Bellm and W. D. Lawrance, J. Chem. Phys., 2003, 118,2581.
109 B. F. Parsons and D. W. Chandler, J. Phys. Chem. A, 2003, 107,10544.
110 K. V. Vidma, A. V. Baklanov, E. B. Khvorostov, V. N. Ishchen-ko, S. A. Kochubei, A. T. J. B. Eppink, D. A. Chestakov and D.H. Parker, J. Chem. Phys., 2005, 122, 204301.
111 J. H. Huang, D. D. Xu, J. S. Francisco and W. M. Jackson, J.Chem. Phys., 2003, 118, 3083.
112 N. Hansen, A. M. Wodtke, A. V. Komissarov, K. Morokumaand M. C. Heaven, J. Chem. Phys., 2003, 118, 10485.
113 O. P. J. Vieuxmaire, M. G. D. Nix, J. A. J. Fitzpatrick, M.Beckert, R. N. Dixon and M. N. R. Ashfold, Phys. Chem. Chem.Phys., 2004, 6, 543.
114 N. H. Nahler, O. P. J. Vieuxmaire, J. R. Jones, M. N. R. Ashfold,A. T. J. B. Eppink, A. M. Coriou and D. H. Parker, J. Phys.Chem. A, 2004, 108, 8077.
115 O. P. J. Vieuxmaire, N. H. Nahler, J. R. Jones, R. N. Dixon andM. N. R. Ashfold, Mol. Phys., 2005, 103, 2437.
116 C. Chang, C.-Y. Luo and K. Liu, J. Phys. Chem. A, 2005, 109,1022.
117 M. H. Kim, B. D. Leskiw and A. G. Suits, J. Phys. Chem. A,in press.
118 F. Aguirre and S. T. Pratt, J. Chem. Phys., 2003, 118, 6318.119 F. Aguirre and S. T. Pratt, J. Chem. Phys., 2003, 118, 9467.120 J. Tellinghuisen, J. Phys. Chem. A, 2003, 107, 753.
121 S. Manzhos, C. Romanescu, H. P. Loock and J. G. Underwood,J. Chem. Phys., 2004, 121, 11802.
122 R. N. Dixon, J. Chem. Phys., 2005, 122, 194302.123 B. R. Johnson, C. Kittrell, P. B. Kelly and J. L. Kinsey, J. Phys.
Chem., 1996, 100, 7743.124 R. S. Mullikan, J. Chem. Phys., 1940, 8, 382.125 R. Ogorzalek Loo, H. P. Haerri, G. E. Hall and P. L. Houston, J.
Chem. Phys., 1989, 90, 4222.126 E. R. Wouters, M. Ahmed, D. S. Peterka, A. S. Bracker, A. G.
Suits and O. S. Vasyutinskii, in ref. 31, pp. 238–284, andreferences therein.
127 T. P. Rakitzis, G. E. Hall, M. L. Costen and R. N. Zare, J. Chem.Phys., 1999, 111, 8751.
128 A. J. Orr-Ewing and O. S. Vasyutinskii, 2005, unpublishedresults.
129 G. G. Balint-Kurti, A. J. Orr-Ewing, A. Brown, J. A. Beswick andO. S. Vasyutinskii, J. Chem. Phys., 2002, 116, 10760.
130 A. Brown, G. G. Balint-Kurti and O. S. Vasyutinskii, J. Phys.Chem. A, 2004, 108, 7790.
131 O. P. J. Vieuxmaire, N. H. Nahler, J. R. Jones, M. N. R. Ashfoldand R. N. Dixon, to be published.
132 A. G. Suits, L. S. Bontuyan, P. L. Houston and B. J. Whitaker, J.Chem. Phys., 1992, 96, 8618.
133 L. S. Bontuyan, A. G. Suits, P. L. Houston and B. J. Whitaker, J.Phys. Chem., 1993, 97, 6342.
134 H. Kohguchi, T. Suzuki andM. H. Alexander, Science, 2001, 294,832.
135 M. S. Elioff and D. W. Chandler, J. Chem. Phys., 2002, 117, 6455.136 A. A. Dixit, P. J. Pisano and P. L. Houston, J. Phys. Chem. A,
2001, 105, 11165.137 J. I. Cline, K. T. Lorenz, E. A. Wade, J. W. Barr and D. W.
Chandler, J. Chem. Phys., 2001, 115, 6277.138 E. A. Wade, K. T. Lorenz, D. W. Chandler, J. W. Barr, G. L.
Barnes and J. I. Cline, Chem. Phys., 2004, 301, 261.139 M. S. Westley, K. T. Lorenz, D. W. Chandler and P. L. Houston,
J. Chem. Phys., 2001, 114, 2669.140 K. T. Lorenz, M. S. Westley and D. W. Chandler, Phys. Chem.
Chem. Phys., 2000, 2, 481.141 E. A. Wade, K. T. Lorenz, J. L. Springfield and D. W. Chandler,
J. Phys. Chem. A, 2003, 107, 4976.142 K. T. Lorenz, D. W. Chandler and G. C. McBane, J. Phys. Chem.
A, 2002, 106, 1144.143 B. F. Parsons and D. W. Chandler, J. Chem. Phys., 2005, 122,
174306.144 M. Ahmed, D. S. Peterka and A. G. Suits, Chem. Phys. Lett.,
1999, 301, 372.145 M. Ahmed, D. S. Peterka and A. G. Suits, Chem. Phys. Lett.,
2000, 317, 264.146 M. Ahmed, D. S. Peterka and A. G. Suits, Phys. Chem. Chem.
Phys., 2000, 2, 861.147 J. J. Lin, J. Zhou, W. Shiu and K. Liu, Science, 2003, 300, 966.148 J. G. Zhou, J. J. Lin, W. C. Shiu, S. C. Pu and K. P. Liu, J. Chem.
Phys., 2003, 119, 2538.149 J. G. Zhou, J. J. Lin, W. C. Shiu and K. P. Liu, J. Chem. Phys.,
2003, 119, 4997.150 J. G. Zhou, J. J. Lin and K. P. Liu, J. Chem. Phys., 2003, 119,
8289.151 J. G. Zhou, W. C. Shiu, J.J. Lin and K. P. Liu, J. Chem. Phys.,
2004, 120, 5863.152 W. Shiu, J. J. Lin and K. P. Liu, Phys. Rev. Lett., 2004, 92,
103201.153 J. G. Zhou, J. J. Lin and K. P. Liu, J. Chem. Phys., 2004, 121, 813.154 L. Schnieder, K. Seekamp-Rahn, F. Liedeker, H. Steuwe and K.
H. Welge, Faraday Discuss., 1991, 91, 259.155 X. H. Liu, R. L. Gross and A. G. Suits, J. Chem. Phys., 2002, 116,
5341.156 X. H. Liu, R. L. Gross, G. E. Hall, J. T. Muckerman and A. G.
Suits, J. Chem. Phys., 2002, 117, 7947.157 R. L. Gross, X. H. Liu and A. G. Suits, Chem. Phys. Lett., 2003,
376, 710.158 B. Zhang and K. Liu, J. Phys. Chem. A, 2005, 109, 1022.159 T. N. Kitsopoulos, M. A. Buntine, D. P. Baldwin, R. N. Zare and
D. W. Chandler, Science, 1993, 260, 1605.160 R. L. Toomes and T. N. Kitsopoulos, Phys. Chem. Chem. Phys.,
2003, 5, 2481.
50 | Phys. Chem. Chem. Phys., 2006, 8, 26–53 This journal is �c the Owner Societies 2006

161 C. Murray, A. J. Orr-Ewing, R. L. Toomes and T. N. Kitsopou-los, J. Chem. Phys., 2004, 120, 2230.
162 R. L. Toomes, A. J. van den Brom, T. N. Kitsopoulos, C. Murrayand A. J. Orr-Ewing, J. Phys. Chem. A, 2004, 108, 7909.
163 M. A. Buntine, D. P. Baldwin, R. N. Zare and D. W. Chandler, J.Chem. Phys., 1991, 94, 4672.
164 P. C. Samartzis, D. Smith, T. P. Rakitzis and T. N. Kitsopoulos,Chem. Phys. Lett., 2000, 324, 337.
165 M. J. Bass, M. Brouard, C. Vallance, T. N. Kitsopoulos, P. C.Samartzis and R. L. Toomes, J. Chem. Phys., 2003, 119, 7168.
166 M. J. Bass, M. Brouard, C. Vallance, T. N. Kitsopoulos, P. C.Samartzis and R. L. Toomes, J. Chem. Phys., 2004, 121, 7175.
167 M. H. Alexander, J. Chem. Phys., 1999, 111, 7426.168 M. S. Elioff, J. J. Valentini and D. W. Chandler, Eur. Phys. J. D,
2004, 31, 385.169 J. M. Hutson, J. Phys. Chem., 1992, 96, 4237.170 I. Anton Garcia, PhD thesis, University La Rioja, Logrono, 2004.171 F. J. Aoiz, L. Banares, M. Brouard, J. E. Castillo and V. J.
Herrero, J. Chem. Phys., 2000, 113, 5339.172 F. J. Aoiz, L. Banares, J. E. Castillo, M. Brouard, W. Denzer, C.
Vallance, P. Honvault, J. M. Launay, A. J. Dobbyn and P. J.Knowles, Phys. Rev. Lett., 2001, 86, 1729.
173 H. Tsurumaki, Y. Fujimura and O. Kajimoto, J. Chem. Phys.,2000, 112, 8338.
174 D. M. Neumark, A. M. Wodtke, G. N. Robinson, C. C. Haydenand Y. T. Lee, J. Chem. Phys., 1985, 82, 3045.
175 D. M. Neumark, A. M. Wodtke, G. N. Robinson, C. C. Hayden,K. Shobatake, R. K. Sparks, T. P. Schafer and Y. T. Lee, J.Chem. Phys., 1985, 82, 3067.
176 B. L. Zhang, J. H. Zhang and K. P. Liu, J. Chem. Phys., 2005,122, 104310.
177 B. Zhang, W. Shiu, J. J. Lin and K. Liu, J. Chem. Phys., 2005,122, 131102.
178 B. Zhang, W. Shiu and K. Liu, J. Phys. Chem. A, 2005, 109, 8983;B. Zhang, W. Shiu and K. Liu, J. Phys. Chem. A, 2005, 109,8989.
179 J. Zhou, B. Zhang, J. J. Lin and K. Liu, Mol. Phys., 2005, 103,1757.
180 J. Zhou, J. J. Lin, B. Zhang and K. Liu, J. Phys. Chem. A, 2004,108, 7832.
181 B. L. Zhang and K. P. Liu, J. Chem. Phys., 2005, 122, 101102.182 S. Rudic, C. Murray, D. Ascenzi, H. Anderson, J. N. Harvey and
A. J. Orr-Ewing, J. Chem. Phys., 2002, 117, 5692.183 S. Rudic, C. Murray, J. N. Harvey and A. J. Orr-Ewing, J. Chem.
Phys., 2004, 120, 186.184 N. E. Shafer, A. J. Orr-Ewing, W. R. Simpson, H. Xu and R. N.
Zare, Chem. Phys. Lett., 1993, 212, 155.185 W. R. Simpson, A. J. Orr-Ewing and R. N. Zare, Chem. Phys.
Lett., 1993, 212, 163.186 S. Rudic, C. Murray, D. Ascenzi, H. Anderson, J. N. Harvey and
A. J. Orr-Ewing, J. Chem. Phys., 2002, 117, 5692.187 N. E. Shafer, A. J. Orr-Ewing and R. N. Zare, J. Phys. Chem.,
1995, 99, 7591.188 M. Brouard, P. O’Keefe and C. Vallance, J. Phys. Chem. A, 2002,
106, 3629.189 M. Brouard, S. P. Duxon, P. A. Enriquez and J. P. Simons, J.
Chem. Phys., 1992, 97, 7414.190 E. Surber, R. Mabbs and A. Sanov, J. Phys. Chem. A, 2003, 107,
8215.191 A. Sanov and W. C. Lineberger, Phys. Chem. Chem. Phys., 2004,
6, 2018, and references therein.192 A. Osterwalder, M. J. Nee, J. Zhou and D. M. Neumark, J.
Chem. Phys., 2004, 121, 6317.193 C. Nicole, I. Sluimer, F. Rosca-Pruna, M. Warntjes, M. Vrak-
king, C. Bordas, F. Texier and F. Robicheaux, Phys. Rev. Lett.,2000, 85, 4024.
194 A. Wetzels, A. Gurtler, L. D. Noordam, F. Robicheaux, C. Dinu,H. G. Muller, M. J. J. Vrakking and W. J. van der Zande, Phys.Rev. Lett., 2002, 89, 273003.
195 A. Osterwalder, M. J. Nee, J. Zhou and D. M. Neumark, J.Chem. Phys., 2004, 121, 6317.
196 T. Suzuki and B. J. Whitaker, Int. Rev. Phys. Chem., 2001, 20,313, and references therein.
197 K. L. Reid, Annu. Rev. Phys. Chem., 2003, 54, 397, and referencestherein.
198 A. Stolow, A. E. Bragg and D. M. Neumark, Chem. Rev., 2004,104, 1719, and references therein.
199 O. Gessner, E. T. H. Chrysostom, A. M. D. Lee, D. M. Wardlaw,M. L. Ho, S. J. Lee, B. M. Cheng, M. Z. Zgierski, I. C. Chen, J. P.Shaffer, C. C. Hayden and A. Stolow, Faraday Discuss., 2004,127, 193, and references therein.
200 M. Maazouz, P. L. Maazouz and D. C. Jacobs, J. Chem. Phys.,2002, 117, 10917.
201 S. K. Lee, D. Townsend, O. S. Vasyutinskii and A. G. Suits, Phys.Chem. Chem. Phys., 2005, 7, 1650.
202 S. T. Tsai, C. K. Lin, Y. T. Lee and C. K. Ni, Rev. Sci. Instrum.,2001, 72, 1963.
203 T. P. Softley, Int. Rev. Phys. Chem., 2004, 23, 1.204 H. A. Cruse and T. P. Softley, J. Chem. Phys., 2004, 121, 4089.205 A. J. R. Heck, D. W. Neyer, R. N. Zare and D. W. Chandler, J.
Phys. Chem., 1995, 99, 17700.206 T. P. Rakitzis, P. C. Samartzis, R. L. Toomes, L. Tsigaridas, M.
Coriou, D. Chestakov, A. T. J. B. Eppink, D. H. Parker and T. N.Kitsopoulos, Chem. Phys. Lett., 2002, 364, 115.
207 T. P. Rakitzis, P. C. Samartzis, R. L. Toomes and T. N.Kitsopoulos, J. Chem. Phys., 2004, 121, 7222.
208 M. Beckert, E. R. Wouters, M. N. R. Ashfold and E. Wrede, J.Chem. Phys., 2003, 119, 9576.
209 M. J. Cooper, E. Wrede, A. J. Orr-Ewing and M. N. R. Ashfold,J. Chem. Soc., Faraday Trans., 1998, 94, 2901.
210 Y. J. Jee, M. S. Park, Y. S. Kim, Y. J. Jung and K. H. Jung,Chem. Phys. Lett., 1998, 287, 701.
211 P. C. Samartzis, T. N. Kitsopoulos and M. N. R. Ashfold, Phys.Chem. Chem. Phys., 2000, 2, 453.
212 Y. J. Jee, Y. J. Jung and K. H. Jung, J. Chem. Phys., 2001, 115,9739.
213 T. P. Rakitzis and T. N. Kitsopoulos, J. Chem. Phys., 2002, 116,9228.
214 Y. S. Kim, Y. J. Jung and K. H. Jung, J. Chem. Phys., 1997, 107,3805.
215 E. Wrede, S. Laubach, S. Schulenburg, A. J. Orr-Ewing and M.N. R. Ashfold, Chem. Phys. Lett., 2000, 326, 22.
216 W. P. Hess, D. W. Chandler and J. W. Thoman, Chem. Phys.,1992, 163, 277.
217 T. Gougousi, P. C. Samartzis and T. N. Kitsopoulos, J. Chem.Phys., 1998, 108, 5742.
218 D. D. Xu, J. S. Francisco, J. Huang and W. M. Jackson, J. Chem.Phys., 2002, 117, 2578.
219 T. K. Kim, M. S. Park, K. W. Lee and K. H. Jung, J. Chem.Phys., 2001, 115, 10745.
220 S. H. Lee and K. H. Jung, Chem. Phys. Lett., 2001, 350, 306.221 Y. J. Jung, M. S. Park, Y. S. Kim, K. H. Jung and H. R. Volpp, J.
Chem. Phys., 1999, 111, 4005.222 H. Katayanagi, N. Yonekuira and T. Suzuki, Chem. Phys., 1998,
231, 345.223 K. S. Lee, K. W. Lee, T. K. Kim, R. Ryoo and K. H. Jung, J.
Chem. Phys., 2005, 122, 034308.224 M. S. Park, K. W. Lee and K. H. Jung, J. Chem. Phys., 2001, 114,
10368.225 K. W. Lee, Y. J. Jee and K. H. Jung, J. Chem. Phys., 2002, 116,
4490.226 B. L. G. Bakker and D. H. Parker, Chem. Phys. Lett., 2000, 330,
293.227 N. Hansen and A. M. Wodtke, Chem. Phys. Lett., 2002, 356, 340.228 P. C. Samartzis, T. Gougousi and T. N. Kitsopoulos, Laser
Chem., 1997, 17, 185.229 P. C. Samartzis, I. Sakellariou, T. Gougousi and T. N. Kitso-
poulos, J. Chem. Phys., 1997, 107, 43.230 P. C. Samartzis, B. L. G. Bakker, T. P. Rakitzis, D. H. Parker and
T. N. Kitsopoulos, J. Chem. Phys., 1999, 110, 5201.231 A. S. Bracker, E. R. Wouters, A. G. Suits and O. S. Vasyutinskii,
J. Chem. Phys., 1999, 110, 6749.232 C. R. Gebhardt, T. P. Rakitzis, P. C. Samartzis, V. Ladopoulos
and T. N. Kitsopoulos, Rev. Sci. Instrum., 2001, 72, 3848.233 D. H. Parker, B. L. G. Bakker, P. C. Samartzis and T. N.
Kitsopoulos, J. Chem. Phys., 2001, 115, 1205.234 A. Sugita, K. Suto, M. Kawasaki and Y. Matsumi, Chem. Phys.
Lett., 2001, 340, 83.235 A. I. Chichinin, T. Einfeld, C. Maul and K. H. Gericke, Rev. Sci.
Instrum., 2002, 73, 1856.
This journal is �c the Owner Societies 2006 Phys. Chem. Chem. Phys., 2006, 8, 26–53 | 51
236 M. J. Bass, M. Brouard, A. P. Clark, C. Vallance and B.Martinez-Haya, Phys. Chem. Chem. Phys., 2003, 5, 856.
237 T. P. Rakitzis, P. C. Samartzis, R. L. Toomes, T. N. Kitsopoulos,A. Brown, G. G. Balint-Kurti, O. S. Vasyutinskii and J. A.Beswick, Science, 2003, 300, 1936.
238 C. Romanescu, S. Manzhos, D. Boldovsky, J. Clarke and H. P.Loock, J. Chem. Phys., 2004, 120, 767.
239 M. S. Park, Y. J. Jung, S. H. Lee, D. C. Kim and K. H. Jung,Chem. Phys. Lett., 2000, 322, 429.
240 E. R. Wouters, M. Beckert, L. J. Russell, K. N. Rosser, A. J. Orr-Ewing, M. N. R. Ashfold and O. S. Vasyutinskii, J. Chem. Phys.,2002, 117, 2087.
241 L. J. Rogers, M. N. R. Ashfold, Y. Matsumi, M. Kawasaki andB. J. Whitaker, Chem. Phys. Lett., 1996, 258, 159.
242 Y. Tanaka, M. Kawasaki, Y. Matsumi, H. Fujiwara, T. Ishiwata,L. J. Rogers, R. N. Dixon and M. N. R. Ashfold, J. Chem. Phys.,1998, 109, 1315.
243 V. Skorokhodov, Y. Sato, K. Suto, Y. Matsumi and M. Kawa-saki, J. Phys. Chem., 1996, 100, 12321.
244 M. Kawasaki, K. Suto, Y. Sato, Y. Matsumi and R. Bersohn, J.Phys. Chem., 1996, 100, 19853.
245 N. Hansen and A. M. Wodtke, J. Phys. Chem. A, 2003, 107,10608.
246 T. Einfeld, A. Chichinin, C. Maul and K. H. Gericke, J. Chem.Phys., 2002, 116, 2803.
247 T. S. Einfeld, C. Maul, K. H. Gericke and A. Chichinin, J. Chem.Phys., 2002, 117, 1123.
248 T. S. Einfeld, C. Maul, K. H. Gericke and A. Chichinin, J. Chem.Phys., 2002, 117, 4214.
249 D. Townsend, S. K. Lee and A. G. Suits, J. Phys. Chem. A, 2004,108, 8106.
250 S. H. Lee, Y. J. Jung and K. H. Jung,Chem. Phys., 2000, 260, 143.251 S. Deshmukh, J. D. Myers, S. S. Xantheas and W. P. Hess, J.
Phys. Chem., 1994, 98, 12535.252 K. Tonokura, L. B. Daniels, T. Suzuki and Y. Yamashita, J.
Phys. Chem. A, 1997, 101, 7754.253 Y. Liu and L. J. Butler, J. Chem. Phys., 2004, 121, 11016.254 R. L. Gross, X. H. Liu and A. G. Suits, Chem. Phys. Lett., 2002,
362, 229.255 V. Dribinski, A. B. Potter, A. V. Demyanenko and H. Reisler, J.
Chem. Phys., 2001, 115, 7474.256 A. B. Potter, V. Dribinski, A. Demyanenko and H. Reisler, Chem.
Phys. Lett., 2001, 349, 257.257 M. A. Buntine, D. P. Baldwin and D. W. Chandler, J. Chem.
Phys., 1992, 96, 5843.258 F. Aguirre and S. T. Pratt, J. Chem. Phys., 2004, 121, 9855.259 D. H. Parker, R. F. Delmdahl, B. B. L. G. Bakker and H. P.
Loock, J. Chin. Chem. Soc., 2001, 48, 327.260 S. Manzhos, H. P. Loock, B. L. G. Bakker and D. H. Parker, J.
Chem. Phys., 2002, 117, 9347.261 L. J. Rogers, M. N. R. Ashfold, Y. Matsumi, M. Kawasaki and
B. J. Whitaker, J. Chem. Soc., Faraday Trans., 1996, 92, 5181.262 M. Kawasaki, A. Sugita, C. Ramos, Y. Matsumi and H. Tachi-
kawa, J. Phys. Chem. A, 2004, 108, 8119.263 L. R. Valachovic, M. F. Tuchler, M. Dulligan, T. Droz-Georget,
M. Zyrianov, A. Kolessov, H. Reisler and C. Wittig, J. Chem.Phys., 2000, 112, 2752.
264 A. Sanov, T. Droz-Georget, M. Zyrianov and H. Reisler, J.Chem. Phys., 1997, 106, 7013.
265 D. P. Baldwin, M. A. Buntine and D. W. Chandler, J. Chem.Phys., 1990, 93, 6578.
266 A. J. R. Heck, R. N. Zare and D. W. Chandler, J. Chem. Phys.,1996, 104, 3399.
267 A. J. R. Heck, R. N. Zare and D. W. Chandler, J. Chem. Phys.,1996, 104, 4019.
268 W. M. Jackson, R. J. Price, D. D. Xu, J. D. Wrobel, M. Ahmed,D. S. Peterka and A. G. Suits, J. Chem. Phys., 1998, 109,4703.
269 J. H. Zhang, B. Jiang, X. M. Yang and J. C. Xie, Chem. Phys.Lett., 2002, 364, 80.
270 J. Wei, A. Kuczmann, J. Riedel, F. Renth and F. Temps, Phys.Chem. Chem. Phys., 2003, 5, 315.
271 J. Wei, J. Riedel, A. Kuczmann, F. Renth and F. Temps, FaradayDiscuss., 2004, 127, 267.
272 A. J. van den Brom, M. Kapelios, T. N. Kitsopoulos, N. H.Nahler, B. Cronin and M. N. R. Ashfold, Phys. Chem. Chem.Phys., 2005, 7, 892.
273 D. C. Radenovic, A. J. A. van Roij, D. A. Chestakov, A. T. J. B.Eppink, J. J. ter Meulen, D. H. Parker, M. P. J. van der Loo, G.C. Groenenboom, M. E. Greenslade and M. I. Lester, J. Chem.Phys., 2003, 119, 9341.
274 M. Ahmed, D. S. Peterka and A. G. Suits, J. Chem. Phys., 1999,110, 4248.
275 H. P. Loock, B. L. G. Bakker and D. H. Parker, Can. J. Phys.,2001, 79, 211.
276 H. F. Xu, S. L. Liu, X. X. Ma, D. X. Dai, J. C. Xie and G. H. Sha,Acta Physica Sinica, 2002, 51, 240.
277 H. F. Xu, Y. Guo, S. L. Liu, X. X. Ma, D. X. Dai and G. H. Sha,J. Chem. Phys., 2002, 117, 5722.
278 M. H. M. Janssen, J. W. G. Mastenbroek and S. Stolte, J. Phys.Chem. A, 1997, 101, 7605.
279 A. T. J. B. Eppink and D. H. Parker, J. Chem. Phys., 1998, 109,4758.
280 A. T. J. B. Eppink and D. H. Parker, J. Chem. Phys., 1999, 110,832.
281 Y. Tanaka, M. Kawasaki and Y. Matsumi, Bull. Chem. Soc. Jpn.,1998, 71, 2539.
282 Y. S. Kim, W. K. Kang and K. H. Jung, J. Chem. Phys., 1996,105, 551.
283 F. Aguirre and S. T. Pratt, J. Chem. Phys., 2003, 118, 1175.284 P. A. Arnold, B. R. Cosofret, S. M. Dylewski, P. L. Houston and
B. K. Carpenter, J. Phys. Chem. A, 2001, 105, 1693.285 S. Unny, Y. Du, L. C. Zhu, K. Truhins, R. J. Gordon, A. Sugita,
M. Kawasaki, Y. Matsumi, R. Delmdahl, D. H. Parker and A.Berces, J. Phys. Chem. A, 2001, 105, 2270.
286 B. R. Cosofret, H. M. Lambert and P. L. Houston, J. Chem.Phys., 2002, 117, 8787.
287 B. R. Cosofret, H. M. Lambert and P. L. Houston, Bull. KoreanChem. Soc., 2002, 23, 179.
288 B. L. G. Bakker, A. T. J. B. Eppink, D. H. Parker, M. L. Costen,G. Hancock and G. A. D. Ritchie, Chem. Phys. Lett., 1998, 283,319.
289 B. L. G. Bakker, D. H. Parker, G. Hancock and G. A. D. Ritchie,Chem. Phys. Lett., 1998, 294, 565.
290 J. M. Teule, G. C. Groenenboom, D. W. Neyer, D. W. Chandlerand M. H. M. Janssen, Chem. Phys. Lett., 2000, 320, 177.
291 M. Brouard, A. P. Clark, C. Vallance and O. S. Vasyutinskii, J.Chem. Phys., 2003, 119, 771.
292 H. M. Lambert, E. W. Davis, O. Tokel, A. A. Dixit and P. L.Houston, J. Chem. Phys., 2005, 122, art. no. 174304.
293 V. P. Hradil, T. Suzuki, S. A. Hewitt, P. L. Houston and B. J.Whitaker, J. Chem. Phys., 1993, 99, 4455.
294 K. Tonokura and T. Suzuki, Chem. Phys. Lett., 1994, 224, 1.295 M. Ahmed, D. S. Peterka, A. S. Bracker, O. Vasyutinskii and A.
G. Suits, J. Chem. Phys., 1999, 110, 4115.296 A. V. Demyanenko, V. Dribinski, H. Reisler, H. Meyer and C. X.
W. Qian, J. Chem. Phys., 1999, 111, 7383.297 A. T. J. B. Eppink and D. H. Parker, Rev. Sci. Instrum., 1997, 68,
3484.298 D. H. Parker and A. T. J. B. Eppink, J. Chem. Phys., 1997, 107,
2357.299 B. Buijsse, W. J. van der Zande, A. T. J. B. Eppink, D. H. Parker,
B. R. Lewis and S. T. Gibson, J. Chem. Phys., 1998, 108, 7229.300 B. L. G. Bakker and D. H. Parker, J. Chem. Phys., 2000, 112,
4037.301 D. H. Parker, Acc. Chem. Res., 2000, 33, 563.302 H. M. Lambert, A. A. Dixit, E. W. Davis and P. L. Houston, J.
Chem. Phys., 2004, 121, 10437.303 R. J. Wilson, J. A. Mueller and P. L. Houston, J. Phys. Chem. A,
1997, 101, 7593.304 J. D. Geiser, S. M. Dylewski, J. A. Mueller, R. J. Wilson, R.
Toumi and P. L. Houston, J. Chem. Phys., 2000, 112, 1279.305 P. L. Houston, B. R. Cosofret, A. Dixit, S. M. Dylewski, J. D.
Geiser, J. A. Mueller, R. J. Wilson, P. J. Pisano, M. S. Westley, K.T. Lorenz and D. W. Chandler, J. Chin. Chem. Soc., 2001, 48,309.
306 B. R. Cosofret, S. M. Dylewski and P. L. Houston, J. Phys.Chem. A, 2000, 104, 10240.
52 | Phys. Chem. Chem. Phys., 2006, 8, 26–53 This journal is �c the Owner Societies 2006
307 M. Brouard, R. Cireasa, A. P. Clark, T. J. Preston, C. Vallance,G. C. Groenenboom and O. S. Vasyutinskii, J. Phys. Chem. A,2004, 108, 7965.
308 R. F. Delmdahl, B. L. G. Bakker and D. H. Parker, J. Chem.Phys., 2000, 112, 5298.
309 R. F. Delmdahl, D. H. Parker and A. T. J. B. Eppink, J. Chem.Phys., 2001, 114, 8339.
310 A. T. J. B. Eppink, D. H. Parker, M. H. M. Janssen, B. Buijsseand W. J. van der Zande, J. Chem. Phys., 1998, 108, 1305.
311 N. Taniguchi, K. Takahashi, Y. Matsumi, S. M. Dylewski,J. D. Geiser and P. L. Houston, J. Chem. Phys., 1999, 111,6350.
312 S. M. Dylewski, J. D. Geiser and P. L. Houston, J. Chem. Phys.,2001, 115, 7460.
313 T. Suzuki, H. Katayanagi, Y. X. Mo and K. Tonokura, Chem.Phys. Lett., 1996, 256, 90.
314 M. Ahmed, E. R. Wouters, D. S. Peterka, O. S. Vasyutinskii andA. G. Suits, Faraday Discuss., 1999, 113, 425.
315 D. W. Neyer, A. J. R. Heck, D. W. Chandler, J. M. Teule and M.H. M. Janssen, J. Phys. Chem. A, 1999, 103, 10388.
316 T. Nishide and T. Suzuki, J. Phys. Chem. A, 2004, 108, 7863.317 A. G. Smolin, O. S. Vasyutinskii, E. R. Wouters and A. G. Suits,
J. Chem. Phys., 2004, 121, 6759.318 P. C. Samartzis and T. N. Kitsopoulos, J. Phys. Chem. A, 1997,
101, 5620.319 T. N. Kitsopoulos, C. R. Gebhardt and T. P. Rakitzis, J. Chem.
Phys., 2001, 115, 9727.320 H. Katayanagi, Y. X. Mo and T. Suzuki, Chem. Phys. Lett., 1995,
247, 571.321 A. A. Dixit, Y. Lei, K. W. Lee, E. Quinones and P. L. Houston, J.
Phys. Chem. A, 2005, 109, 1770.322 Y. X. Mo, H. Katayanagi, M. C. Heaven and T. Suzuki, Phys.
Rev. Lett., 1996, 77, 830.323 T. Suzuki, H. Katayanagi, S. Nanbu and M. Aoyagi, J. Chem.
Phys., 1998, 109, 5778.324 T. P. Rakitzis, P. C. Samartzis and T. N. Kitsopoulos, J. Chem.
Phys., 1999, 111, 10415.325 T. P. Rakitzis, P. C. Samartzis and T. N. Kitsopoulos, Phys. Rev.
Lett., 2001, 87, 123001.326 M. H. Kim, W. Li, S. K. Lee and A. G. Suits, Can. J. Chem.,
2004, 82, 880.327 D. Townsend, S. K. Lee and A. G. Suits, Chem. Phys., 2004, 301,
197.328 S.-M. Wu, X. Yang and D. H. Parker, Mol. Phys., 2005, 103,
1797.329 D. A. Chestakov, D. H. Parker and A. V. Baklanov, J. Chem.
Phys., 2005, 122, 084302.330 Y. Sato, Y. Matsumi, M. Kawasaki, K. Tsukiyama and R.
Bersohn, J. Phys. Chem., 1995, 99, 16307.331 A. Sugita, M. Mashino, M. Kawasaki, Y. Matsumi, R. Bersohn,
G. Trott-Kriegeskorte and K. H. Gericke, J. Chem. Phys., 2000,112, 7095.
332 A. J. van den Brom, T. P. Rakitzis, J. van Heyst, T. N.Kitsopoulos, S. R. Jezowski and M. H. M. Janssen, J. Chem.Phys., 2002, 117, 4255.
333 T. P. Rakitzis, A. J. van den Brom and M. H. M. Janssen,Science, 2004, 303, 1852.
334 A. J. van den Brom, T. P. Rakitzis and M. H. M. Janssen, J.Chem. Phys., 2004, 121, 11645.
335 D. Townsend, S. A. Lahankar, S. K. Lee, S. D. Chambreau, A.G. Suits, X. Zhang, J. Rheinecker, L. B. Harding and J. M.Bowman, Science, 2004, 306, 1158.
336 M. Kawasaki, Y. Sato, K. Suto, Y. Matsumi and S. H. S. Wilson,Chem. Phys. Lett., 1996, 251, 67.
337 T. Droz-Georget, M. Zyrianov, A. Sanov and H. Reisler, Ber.Bunsen-Ges. Phys. Chem., 1997, 101, 469.
338 T. Droz-Georget, M. Zyrianov, H. Reisler and D. W. Chandler,Chem. Phys. Lett., 1997, 276, 316.
339 M. Zyrianov, T. Droz-Georget and H. Reisler, J. Chem. Phys.,1999, 110, 2059.
340 J. Liu, F. Wang, H. Wang, B. Jiang and X. Yang, J. Chem. Phys.,2005, 122, 104309.
341 S. M. Clegg, B. F. Parsons, S. J. Klippenstein and D. L. Osborn,J. Chem. Phys., 2003, 119, 7222.
342 D. W. Neyer, A. J. R. Heck and D. W. Chandler, J. Chem. Phys.,1999, 110, 3411.
343 N. Hansen, A. M. Wodtke, A. V. Komissarov and M. C. Heaven,Chem. Phys. Lett., 2003, 368, 568.
344 V. K. Nestorov and J. I. Cline, J. Chem. Phys., 1999, 111, 5287.345 T. Suzuki, V. P. Hradil, S. A. Hewitt, P. L. Houston and B. J.
Whitaker, Chem. Phys. Lett., 1991, 187, 257.346 Y. X. Mo, H. Katayanagi and T. Suzuki, J. Chem. Phys., 1999,
110, 2029.347 O. L. A. Monti, H. Dickinson, S. R. Mackenzie and T. P. Softley,
J. Chem. Phys., 2000, 112, 3699.348 B. F. Parsons, D. W. Chandler, E. C. Sklute, S. L. Li and E. A.
Wade, J. Phys. Chem. A, 2004, 108, 9742.349 E. A. Wade, J. I. Cline, K. T. Lorenz, C. Hayden and D. W.
Chandler, J. Chem. Phys., 2002, 116, 4755.350 A. V. Demyanenko, A. B. Potter, V. Dribinski and H. Reisler, J.
Chem. Phys., 2002, 117, 2568.351 A. B. Potter, V. Dribinski, A. V. Demyanenko and H. Reisler, J.
Chem. Phys., 2003, 119, 7197.352 M. Tsubouchi and T. Suzuki, Chem. Phys. Lett., 2003, 382, 418.353 M. Tsubouchi, C. A. de Lange and T. Suzuki, J. Chem. Phys.,
2003, 119, 11728.354 V. Dribinski, A. B. Potter, I. Fedorov and H. Reisler, Chem.
Phys. Lett., 2004, 385, 233.355 V. Dribinski, A. B. Potter, I. Fedorov and H. Reisler, J. Chem.
Phys., 2004, 121, 12353.356 V. K. Nestorov, R. D. Hinchliffe, R. Uberna, J. I. Cline, K. T.
Lorenz and D. W. Chandler, J. Chem. Phys., 2001, 115, 7881.357 T. J. Obernhuber, U. Kensy and B. Dick, Phys. Chem. Chem.
Phys., 2003, 5, 2799.358 A. G. Suits, R. L. Miller, L. S. Bontuyan and P. L. Houston, J.
Chem. Soc., Faraday Trans., 1993, 89, 1443–3667.359 D. W. Chandler, J. W. Thoman, M. H. M. Janssen and D. H.
Parker, Chem. Phys. Lett., 1989, 156, 151.360 D. W. Chandler, M. H. M. Janssen, S. Stolte, R. N. Strickland, J.
W. Thoman and D. H. Parker, J. Phys. Chem., 1990, 94, 4839.361 M. H. M. Janssen, D. H. Parker, G. O. Sitz, S. Stolte and D. W.
Chandler, J. Phys. Chem., 1991, 95, 8007.362 J. W. G. Mastenbroek, C. A. Taatjes, K. Nauta, M. H. M.
Janssen and S. Stolte, J. Phys. Chem., 1995, 99, 4360.363 A. J. van den Brom, M. Lipciuc and M. H. M. Janssen, Chem.
Phys. Lett., 2003, 368, 324.364 P. Quintana, R. F. Delmdahl, D. H. Parker, B. Martinez-Haya,
F. J. Aoiz, L. Banares and E. Verdasco, Chem. Phys. Lett., 2000,325, 146.
365 B. Martinez-Haya, P. Quintana, L. Banares, P. Samartzis, D. J.Smith and T. N. Kitsopoulos, J. Chem. Phys., 2001, 114, 4450.
366 B. Martinez-Haya, M. J. Bass, M. Brouard, C. Vallance, I. Torresand J. Barr, J. Chem. Phys., 2004, 120, 11042.
367 H. A. Cruse and T. P. Softley, J. Chem. Phys., 2005, 122, 124303.
This journal is �c the Owner Societies 2006 Phys. Chem. Chem. Phys., 2006, 8, 26–53 | 53
Copyright © 2022 FDOKUMEN