Kinetics of noncatalytic, nonisothermal, gas-solid reactions: Hydrofluorination of uranium dioxide
12
Kinetics of Noncatalytic, Nonisothermal, Gas-Solid Reactions: Hydrofluorination of Uranium Dioxide EDUARDO C. COSTA and J. M. SMITH University of California, Davis, California A single-pellet, stirred-tank reactor was used to measure temperatures, compasi- tions, and rates of reaction for the hydrofluorination of UO,.,, ot atmospheric pressure. By correlating the rate with conditions at the reacting surface, the acti- vation energy of the first-order reaction was found to be 6,070 cal./g.-mole. Since the product forms an unreactive layer around the core of UO,.,,, and since the heat of reaction is high, significant concentration and temperature differences develop between the gas phase and the reaction surface. The temperature and rate data were used to calculate the effective diffusivity and thermal conductivity of the product layer under reaction conditions. An adaptation of a pseudosteady state method was developed for predicting the conversion and temperature history of a pellet. Using rate constants for reaction ond mass and energy transfer derived from the experimental data, this method gave good results. Predictions with estimated rate constants were poor, indicating that an accurate value was necessary for the effective diffusivity in the product layer. Reactions between gaseous and solid reactants to form solid and gaseous products provide a challenging combina- tion of physical and chemical processes. If a solid reac- tant pellet is surrounded by the reactant gas, a layer of porous solid product of increasing thickness will form around the unreacted core. The overall reaction results from the following sequence of consecutive steps: mass transfer of reactant from the bulk gas to the outer surface of the pellet, diffusion through the porous product layer to the surface of the unreacted core, chemical reaction (com- bined with intrapellet diffusion if the solid reactant is porous), and, finally, diffusion of the product gas out through the layer of product and into the gas phase. There have been several isothermal analyses (1 to 7) of this type of process leading to prediction methods for the conversion of solid reactant as a function of time. However, if the heat of reaction and activation energy are appreciable, non- isothermal effects are important. Temperature differences between bulk gas and pellet surface will exist, and may be large even when concentration differences are negligible (8). Furthermore, intrapellet gradients will develop both in the product layer and unreacted core. Apparently the only treatment of the nonisothermal case is the analysis of Shen and Smith (9). They developed a conversion-time relation- ship for a spherical pellet of constant size undergoing a first-order reaction, in terms of the reaction and transport rate constants. Very little well-defined experimental data are available for gas-solid noncatalytic reactionsand none was found for the nonisothermal case. Cannon and Denbigh (10) pre- sented a remarkable study of the oxidation of pellets of zinc oxide at different temperatures, and showed that a vapor phase could exist between the product layer and the unreacted core. However, they did not obtain conversion- time data. It seemed to us that the proper test of a prediction method for the conversion-time relationship for nonisother- mal conditions should consist of the following steps: (1) Determine experimentally the rate equation, including the activation energy, for the chemical step at the reacting Eduardo C. Costa is on leave from the Brazilian Atomic Energy Institute, Sag Paulo. Brazil. AlChE Journal (Vol. 17, No. 4) interface. (2) Measure, or predict from available informa- tion, the rate constants for mass and energy transfer. (3) Obtain conversion-time data experimentally over a large interval. (4) Predict conversion and temperature versus time curves, using the rate constants from steps 1 and 2, for comparison with the data of step 3. measuring only conversion-time data for comparison with the theory. The only evaluation in this second approach would be whether the rate constants, determined by fitting the conversion data, had reasonable values. This paper is a report of the first approach applied to the hydrofluorination of porous spheres of nonstoichiomet- ric (O/U = 2.14) uranium dioxide (UOJ at nonisothermal conditions. This system was chosen in spite of the ex- perimental difficulties in handling UO, and HF, because the kinetics of reacting pellets had not been studied here- tofore using measured temperatures at the reacting inter- face. The experimental method was to suspend a pellet of UO,.,, in a stirred-tank reactor and measure the pellet weight and temperatures as a function of time. Analysis of the data during the initial time period provided the in- formation for step 1, while measurements for the whole time period up to high conversions provided the data for step 3. Intrapellet mass and energy rate constants for step 2 were evaluated from temperature and concentration measurements during a run. The work of Shen and Smith served as the basis for the prediction method used in step 4. This procedure should be preferable to the simpler one of APPARATUS AND PROCEDURE The apparatus (Figure 1) consisted of a hydrofluorination unit and a gas disposal section. The nitrogen and HF lines to the reactor were %-in. tubing of copper and Monel 400. respectively. Nitrogen flows were metered with glass rotameters and HF with a Kel-F rotameter. The disposal section received the gases from the reactor and consisted of a cooler (II), a spray-packed at- sorption column (131, and a water, suction pump ( 14). The latter maintained the reactor (5) at nearly atmospheric pressure and also dissolved any unabsorbed gases before disposal to the drain. An aqueous KOH solution was circulated through the absorber. The stirred reactor (Figure 2) was built by joining two 2%-in. I.D. hemispheres, press-formed out of 16 gauge Monel 400 plate. July, 1971 Page 947
-
Upload
independent -
Category
Documents
-
view
1 -
download
0
Transcript of Kinetics of noncatalytic, nonisothermal, gas-solid reactions: Hydrofluorination of uranium dioxide

Kinetics of Noncatalytic, Nonisothermal, Gas-Solid Reactions: Hydrofluorination of Uranium Dioxide
EDUARDO C. COSTA and J. M. SMITH University of California, Davis, California
A single-pellet, stirred-tank reactor was used to measure temperatures, compasi- tions, and rates of reaction for the hydrofluorination of UO,.,, o t atmospheric pressure. By correlating the rate with conditions a t the reacting surface, the acti- vation energy of the first-order reaction was found to be 6,070 cal./g.-mole.
Since the product forms an unreactive layer around the core of UO,.,,, and since the heat of reaction i s high, significant concentration and temperature differences develop between the gas phase and the reaction surface. The temperature and rate data were used to calculate the effective diffusivity and thermal conductivity of the product layer under reaction conditions.
An adaptation of a pseudosteady state method was developed for predicting the conversion and temperature history of a pellet. Using rate constants for reaction ond mass and energy transfer derived from the experimental data, this method gave good results. Predictions with estimated rate constants were poor, indicating that an accurate value was necessary for the effective diffusivity in the product layer.
Reactions between gaseous and solid reactants to form solid and gaseous products provide a challenging combina- tion of physical and chemical processes. If a solid reac- tant pellet is surrounded by the reactant gas, a layer of porous solid product of increasing thickness will form around the unreacted core. The overall reaction results from the following sequence of consecutive steps: mass transfer of reactant from the bulk gas to the outer surface of the pellet, diffusion through the porous product layer to the surface of the unreacted core, chemical reaction (com- bined with intrapellet diffusion if the solid reactant is porous), and, finally, diffusion of the product gas out through the layer of product and into the gas phase. There have been several isothermal analyses (1 to 7) of this type of process leading to prediction methods for the conversion of solid reactant as a function of time. However, if the heat of reaction and activation energy are appreciable, non- isothermal effects are important. Temperature differences between bulk gas and pellet surface will exist, and may be large even when concentration differences are negligible (8). Furthermore, intrapellet gradients will develop both in the product layer and unreacted core. Apparently the only treatment of the nonisothermal case i s the analysis of Shen and Smith (9). They developed a conversion-time relation- ship for a spherical pellet of constant s ize undergoing a first-order reaction, i n terms of the reaction and transport rate constants.
Very little well-defined experimental data are available for gas-solid noncatalytic reactionsand none was found for the nonisothermal case. Cannon and Denbigh (10) pre- sented a remarkable study of t h e oxidation of pellets of zinc oxide at different temperatures, and showed that a vapor phase could exis t between the product layer and the unreacted core. However, they did not obtain conversion- time data.
It seemed to us that the proper test of a prediction method for the conversion-time relationship for nonisother- mal conditions should consist of the following steps: (1) Determine experimentally the rate equation, including the activation energy, for the chemical s tep at the reacting
Eduardo C. Costa is on leave from the Brazilian Atomic Energy Institute, Sag Paulo. Brazil.
AlChE Journal (Vol. 17, No. 4)
interface. ( 2 ) Measure, or predict from available informa- tion, the rate constants for mass and energy transfer. (3) Obtain conversion-time data experimentally over a large interval. (4) Predict conversion and temperature versus time curves, using the rate constants from steps 1 and 2, for comparison with the data of step 3.
measuring only conversion-time data for comparison with the theory. The only evaluation in this second approach would be whether the rate constants, determined by fitting the conversion data, had reasonable values.
This paper i s a report of the first approach applied to the hydrofluorination of porous spheres of nonstoichiomet- ric (O/U = 2.14) uranium dioxide (UOJ at nonisothermal conditions. This system was chosen in spite of the ex- perimental difficulties in handling UO, and HF, because the kinetics of reacting pellets had not been studied here- tofore using measured temperatures at the reacting inter- face. The experimental method was to suspend a pellet of UO,.,, in a stirred-tank reactor and measure the pellet weight and temperatures as a function of time. Analysis of the data during the initial time period provided the in- formation for s tep 1, while measurements for the whole time period up to high conversions provided the data for step 3. Intrapellet m a s s and energy rate constants for step 2 were evaluated from temperature and concentration measurements during a run. The work of Shen and Smith served a s the basis for the prediction method used in s tep 4.
This procedure should be preferable to the simpler one of
APPARATUS AND PROCEDURE
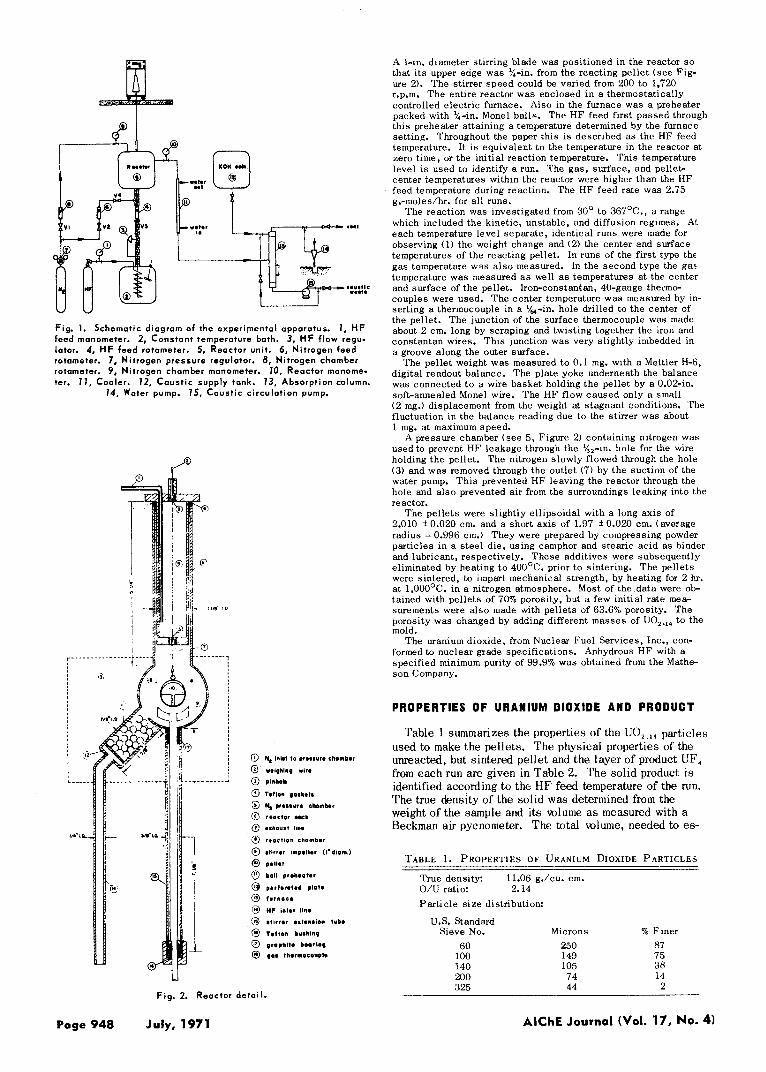
The apparatus (Figure 1) consisted of a hydrofluorination unit and a gas disposal section. The nitrogen and HF lines to the reactor were %-in. tubing of copper and Monel 400. respectively. Nitrogen flows were metered with glass rotameters and HF with a Kel-F rotameter. The disposal section received the gases from the reactor and consisted of a cooler (II), a spray-packed at- sorption column (131, and a water, suction pump ( 14). The latter maintained the reactor (5) at nearly atmospheric pressure and also dissolved any unabsorbed gases before disposal to the drain. An aqueous KOH solution was circulated through the absorber.
The stirred reactor (Figure 2) was built by joining two 2%-in. I.D. hemispheres, press-formed out of 16 gauge Monel 400 plate.
July, 1971 Page 947
... I
I . Y * l I C ...I.
Fig. 1. Schematic diagram of the experimental apparatus. 7, HF feed manometer. 2, Constant temperature both. 3, HF f low regu- lator, 4, HF feed rotameter. 5, Reactor unit. 6, Nitrogen feed rotameter. 7. Nitrogen pressure regulator. 8. Nitrogen chamber rotameter. 9 , Nitrogen chamber manometer. 70, Reactor manome- ter. 7 1 , Cooler. 72, Caustic supply tank. 73, Absorption column.
14, Water pump. 75, Caustic circulation pump.
Page 948
Fig. 2. Reactor detai l .
July, 1971
A 1-in. diameter stirring blade was positioned in the reactor so that i t s upper edge was $-in. from the reacting pellet ( see Fig- ure 2). The stirrer speed could be varied from 200 to 1,720 r.p.m. The entire reactor was enclosed in a thermostatically controlled electric furnace. Also in the furnace was a preheater packed with %-in. Monel balls. The H F feed first passed through this preheater attaining a temperature determined by the furnace setting. Throughout the paper this i s described a s the HF feed temperature. It i s equivalent to the temperature in the reactor at zero time, or the initial reaction temperature. This temperature level i s used to identify a run. The gas , surface, and pelletr center temperatures within the reactor were higher than the HF feed temperature during reaction. The H F feed rate was 2.75 g.-moleslhr. for all runs.
The reaction was investigated from 30O to 367OC., a range which included the kinetic, unstable, and diffusion regimes. At each temperature level separate, identical runs were made for observing (1) the weight change and (2) the center and surface temperatures of the reacting pellet. In runs of the first type the gas temperature w q s a lso measured. In the second type the gas temperature was measured a s well a s temperatures a t the center and surface of the pellet. Iron-constantan, 40-gauge thermo- couples were used. The center temperature was measured by in- serting a thermocouple in a ,/,-in. hole drilled to the center of the pellet. The junction of the surface thermocouple was made about 2 cm. long by scraping and twisting together the iron and constantan wires. This junction was very slightly imbedded in a groove along the outer surface.
digital readout balance. The plate yoke underneath the balance was connected to a wire basket holding the pellet by a 0.02-in. softrannealed Monel wire. The HF flow caused only a small ( 2 mg.) displacement from the weight at stagnant conditions. 'The fluctuation in the balanct reading due to the stirrer was about 1 mg. a t maximum speed.
A pressure chamber ( see 5, Figure 2) containing nitrogen was used to prevent HF leakage through the %,-in. hole for the wire holding the pellet, The nitrogen slowly flowed through the hole (3) and was removed through the outlet (7) by the suction of the water pump. This prevented HF leaving the reactor through the hole and also prevented air from the surroundings leaking into the reactor.
2.010 f 0.020 cm. and a short axis of 1.97 f 0.020 cm. (average radius = 0.996 cm.) They were prepared by compressing powder particles in a s teel die, using camphor and stearic acid a s binder and lubricant, respectively. These additives were subsequently eliminated by heating to 4OOOC. prior to sintering. The pellets were sintered, to impart mechanical strength, by heating for 2 hr. a t l,OOO°C. in a nitrogen atmosphere. Most of the data were ob- tained with pellets of 70% porosity, but a few initial rate mea- surements were also made with pellets of 63.6% porosity. The porosity was changed by adding different masses of UO,.,, to the mold.
The uranium dioxide, from Nuclear Fuel Services, Inc., con- formed to nuclear grade specifications. Anhydrous HF with a specified minimum purity of 99.9% was obtained from the Mathe- son Company.
The pellet weight was measured to 0.1 mg. with a Mettler H-6,
The pellets were slightly ellipsoidal with a long axis of
PROPERTIES OF URANIUM DIOXIDE AND PRODUCT
Table 1 summarizes the properties of the UO,.,, particles used to make the pellets. The physical properties of the unreacted, but sintered pellet and the layer of product UF, from each run are given in Table 2. The solid product i s identified according to the HF feed temperature of the run. The true density of the solid was determined from the weight of the sample and its volume as measured with a Beckman air pycnometer. The total volume, needed to es-
TABLE 1. PROPERTIES O F URANIUM DIOXIDE PARTICLES
True density: 11.06 g./cu. cm. O/U ratio: 2.14 Particle s ize distribution:
U.S. Standard Sieve No. Microns % Finer
60 250 a7 100 149 75 140 105 38 200 74 14 325 44 2
AlChE Journal (Vol. 17, NO. 4)

TABLE 2. PROPERTIES OF THE SOLID REACTANT AND SOLID PRODUCT
Porosities HF feed True Apparent Average Macrosurface
area, pore difm. sq. m./g.
temperature, density p t , density p , Total Macro Micro OC. g./cu. cm. g./cu. cm. € 2 &a E z 2a,, .
Unreacted pellet 11.06 3.29 0.702 0.657 0.045 2740 2.9 1 69 9.48 3.43 0.640 0.594 0.046 2760 2.51 80 9.67 3.24 0.665 0.638 0.027 2820 2.80 85 9.26 3.14 0.662 0.610 0.052 2930 2.65 90 8.16 3.08 0.625 0.507 0.022 3000 2.21
100 8.53 3.02 0.645 0.635 0.010 2930 2.87 150 6.93 2.83 0.592 0.579 0.013 2530 3.24 250 6.68 2.76 0.586 0.565 0.021 2550 3.22 367 7.57 3.20 0.577 0.544 0.034 2400 2.83
tablish the apparent density of the porous solid, was deter- mined by mercury displacement at atmospheric pressure. The total porosity was calculated from the densities by the express ion
Pore s ize distribution data were measured with a mercury porosimeter. This instrument had a maximum pres ure such
penetrated. The macroporosity shown in Table 2 was the ratio of the volume of the pores 2 350 A. to the total vol- ume. The microporosity was determined by difference
difference i s small, indicating that nearly all the pores are larger than 3508. Thus the particles of UO,.,, from which the pellet was made were essentially nonporous. The pores in the pellet and reaction product are due primarily to the space between original UO,.,, particles.
The average macropore diameter was determined from the equation
that equivalent cylindricai pores as small as 350 1 . can be
- E, and i s subject to uncertainty. In any event the
V %,=$J’, a d V ( 2)
The final column in Table 2 contains the macrosurface area, based upon cylindrical pores, and calculated by
4 v a,
s, = _
Figure 3 gives the pore s ize distribution curves for the un- reacted pellet and the porous product from the 150°, 250°,
Fig. 3. (0.70 porosity) and rsoction products of the 150°, 250°,
ond 367OC. runs.
Pore size distribution curves for the reactant
and 367°C. runs. Figure 3 and Table 2 show that the prod- uct has a slightly broader s i z e range and a smaller porosity than the unreacted UO,. Furthermore, the porosity of the product decreases with increasing reaction temperatye, probably due to sintering and to plugging. Examination of the pellets after reaction at high temperatures indicated cracks i n the product layer. The data in Table 2 and Fig- ure 3 do not include the effects of cracks since the mate- rial was broken into small pieces (- %-in.) for the pmosi- meter measurements. The average pore diameters shown in Table 2 are large enough for bulk rather than Knudsen dif- fusion to govern mass transport.
HYDROF LUORlNATlON RESULTS
Calculation of the Rate
(86% UO,, 14% UO,) which reacted to produce a product consisting of UF, and UO,F,, according to the reactions:
The uOz.1, pellets behaved as mixtures of UO, and UO,
UO,(s) + 4 H F ( g ) -UF,(s) + ZH,O(g) ( 3)
(4) UO,(s) + 2HF(g) --UO,F,(s) + H,O(g)
A mass balance shows that the conversion X of UO,.,, can be calculated from the measured pellet weight by the expression
X = 6.65 ( w / w ~ - 1)
The rate of reaction was expressed as the moles of UO,.,, reacting per unit surface at the radius rc. This radius would locate the reaction interface, that is , the boundary between unreacted core of UO,.,, and surrounding product layer, if the UO,.,, were completely nonporous. A sharp reaction boundary of this type was observed a t high tem- peratures (see later discussion). Even when the reaction occurred over a region, an equivalent value of rc could be calculated from the total radius r o by the expression
( 5 )
rc = [r:(l- X ) I ~ (6) The apparent densities in Table 2 were used to calculate ro. On this basis the rate was evaluated from the equation
(7) -R = L( n r) dX
using the experimental conversion-time data to establish the derivative. Water vapor concentrations in the reactor chamber, needed to evaluate the depenaency of the rate upon concentrations, were calculated from the rate of re- action by assuming a well-mixed chamber and negligible holdup.
4 n r ;
QUALITATIVE OBSERVATIONS
A plot of initial ra tes calculated from Equation ( 7 ) at X ---.. 0 is shown in Figure 4. Three ranges of operation
AlChE Journal (Vol. 17, No. 4) July, 1971 Page 949
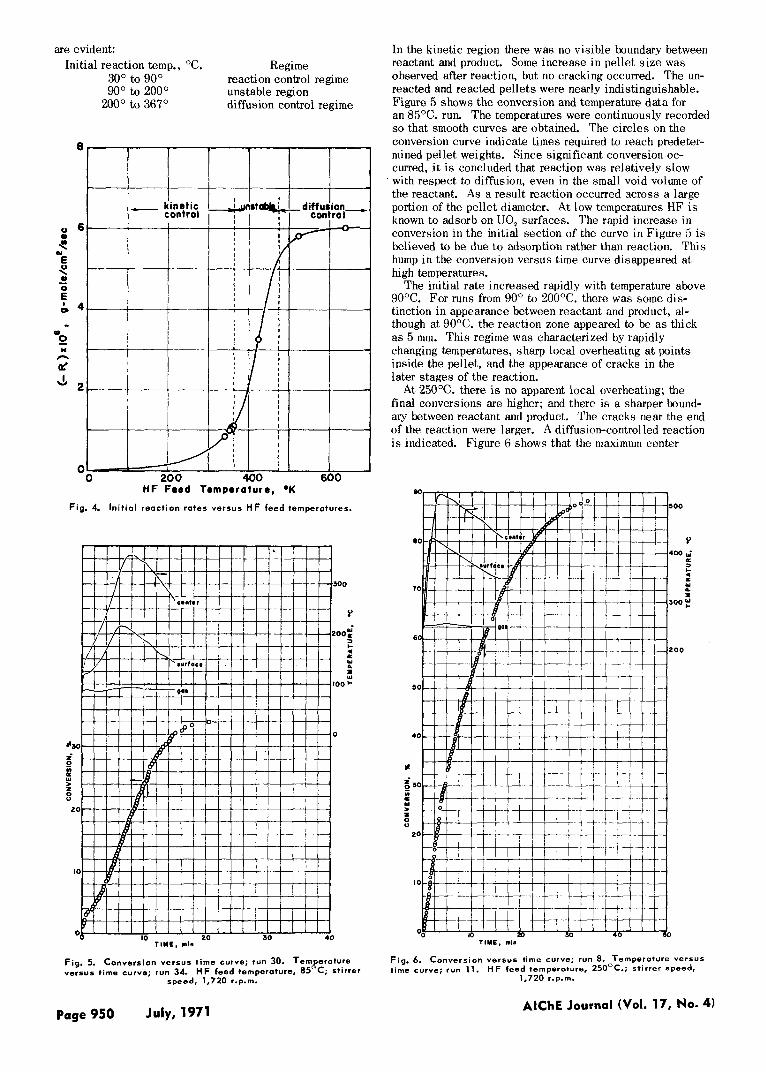
are evident: Initial reaction temp., "C. Regime
30" to 90" 90" to 200° unstable region
200" to 367"
reaction control regime
diffusion control regime
Fig. 4. In i t ia l reaction rates versus HF feed temperatures.
i 0 a >
8 LO
10
O & " " " " ' ' ' 2 10 20 30 40
TIYE. nln
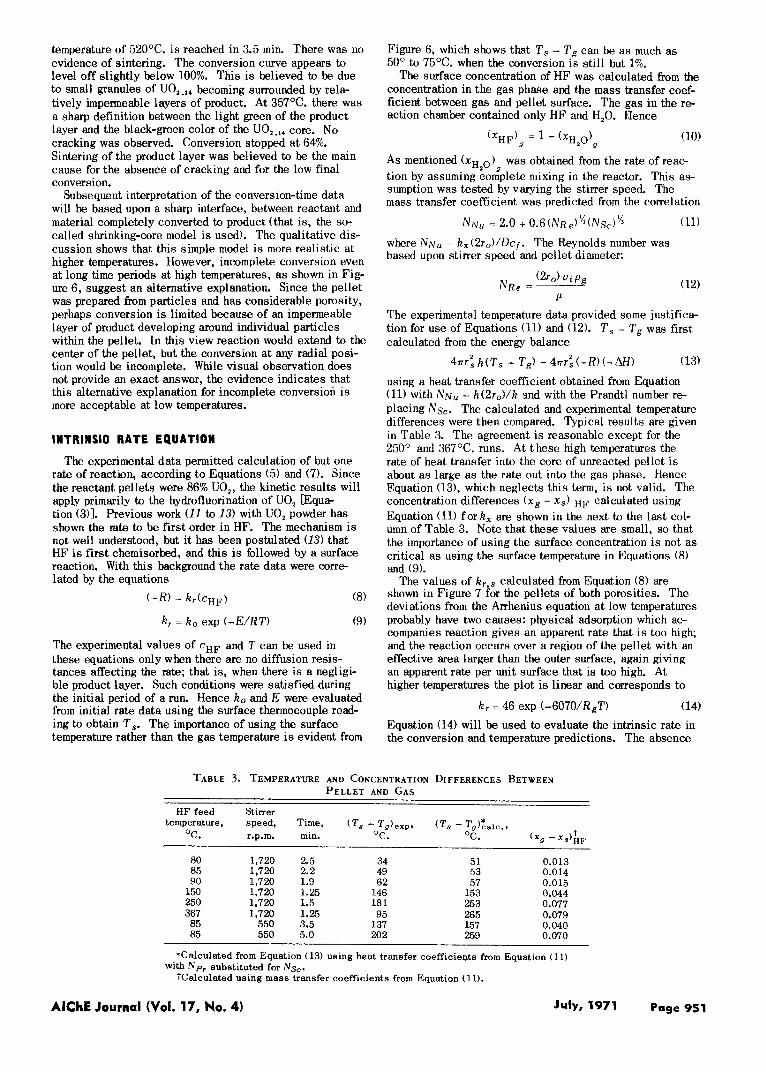
Fig. 5. Conversion versus t ime curve; run 30. Tern 8 erature versus time curve; run 34. HF feed temperature, 85 C; stirrer
speed, 1,720 r.p.m.
Page 950 July, 1971
In the kinetic region there was no visible boundary between reactant and product. Some increase in pellet s ize was observed after reaction, but no cracking occurred. The un- reacted and reacted pellets were nearly indistinguishable. Figure 5 shows the conversion and temperature data for an 85°C. run. The temperatures were continuously recorded so that smooth curves are obtained. The circles on the conversion curve indicate times required to reach predeter- mined pellet weights. Since significant conversion oc- curred, i t is concluded that reaction was relatively slow with respect to diffusion, even in the small void volume of the reactant. A s a result reaction occurred across a large portion of the pellet diameter. At low temperatures HF is known to adsorb on UO, surfaces. The rapid increase in conversion in the initial section of the curve in Figure 5 i s believed to be due t o adsorption rather than reaction. This hump i n the conversion versus time curve disappeared at high temperatures.
The initial rate increased rapidly with temperature above 90°C. For runs from 90" to 200°C. there was some dis- tinction in appearance between reactant and product, al- though at 90°C. the reaction zone appeared to be as thick as 5 mm. This regime was characterized by rapidly changing temperatures, sharp local overheating at points inside the pellet, and the appearance of cracks in the later stages of the reaction.
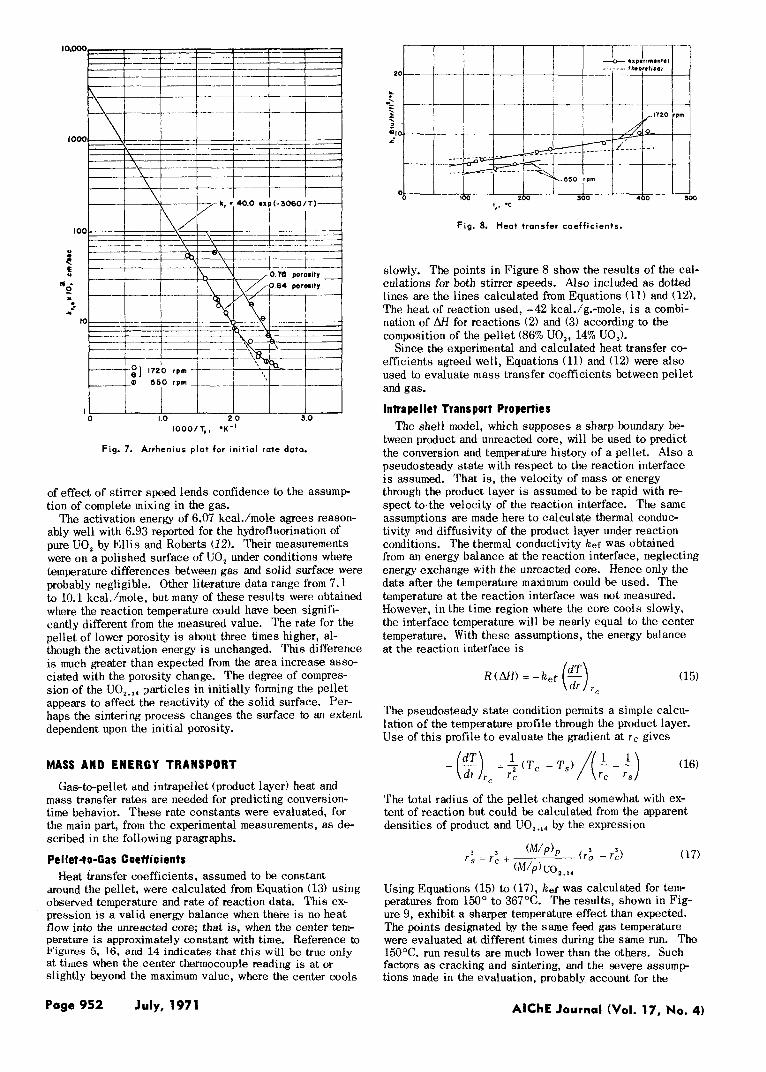
At 250°C. there is no apparent local overheating; the final conversions are higher; and there is a sharper bound- ary between reactant and product. The cracks near the end of the reaction were larger. A diffusion-controlled reaction i s indicated. Figure 6 shows that the maximum center
TINE, mln
Fig. 6. time curve; run 11.
Conversion versus time curve; run 8. Temperature versus H F feed temperature, 250OC.; stirrer speed,
1,720 r.p.m.
AlChE Journal (Vol. 17, No. 4)
temperature of 520°C. i s reached in 3.5 min. There was no evidence of sintering. The conversion curve appears to level off slightly below 100%. This is believed to be due to small granules of Uo, .14 becoming surrounded by rela- tively impermeable layers of product. At 357OC. there was a sharp definition between the light green of the product layer and the black-green color of the UO,.,, core. No cracking was observed. Conversion stopped at 64%. Sintering of the product layer was believed to be the main cause for the absence of cracking and for the low final conversion.
Subsequent interpretation of the conversion-time data will be based upon a sharp interface, between reactant and material completely converted to product (that is, the so- called shrinking-core model is used). The qualitative dis- cussion shows that this simple model i s more realistic at higher temperatures. However, incomplete conversion even at long time periods at high temperatures, as shown in Fig- ure 6, suggest an alternative explanation. Since the pellet was prepared from particles and has considerable porosity, perhaps conversion i s limited because of an impermeable layer of product developing around individual particles within the pellet. In this view reaction would extend to the center of the pellet, but the conversion at any radial posi- tion would be incomplete. While visual observation does not provide an exact answer, the evidence indicates that this alternative explanation for incomplete conversion is more acceptable at low temperatures.
INTRINSIC RATE EQUATION
The experimental data permitted calculation of but one rate of reaction, according to Equations ( 5 ) and (7). Since the reactant pellets were 86% UO,, the kinetic results will apply primarily to the hydrofluorination of UO, [Equa- tion (3)l. Previous work (11 to 13) with UO, powder has shown the rate to be first order in HF. The mechanism i s not well understood, but it has been postulated (13) that HF is first chemisorbed, and this i s followed by a surface reaction. With this background the rate data were corre- lated by the equations
(8)
kr = k o exp (-E/RT) (9)
The experimental values of cHF and T can be used in these equations only when there are no diffusion resis- tances affecting the rate; that is, when there is a negligi- ble product layer. Such conditions were satisfied during the initial period of a run. Hence ko and E were evaluated from initial rate data using the surface thermocouple read- ing to obtain T,. The importance of using the surface temperature rather than the gas temperature is evident from
Figure 6, which shows that T, - T, can be as much as 50° to 75OC. when the conversion is still but 1%.
The surface concentration of H F was calculated from the concentration in the gas phase and the mass transfer coef- ficient between gas and pellet surface. The gas in the re- action chamber contained only HF and H,O. Hence
(10)
As mentioned (xHz0) was obtained from the rate of reac- tion by assuming cogplete mixing in the reactor. This as- sumption was tested by varying the stirrer speed. The mass transfer coefficient was predicted from the correlation
(11)
where N N ~ = k,(2ro)/Dcf. The Reynolds number was based upon stirrer speed and pellet diameter:
The experimental temperature data provided some justifica- tion for use of Equations (11) and (12). T, - T, was first calculated from the energy balance
47rrih(Ts - T,) = 47rri(-R)(-AH) (13)
using a heat transfer coefficient obtained from Equation (11) with N N ~ = h(2ro)/k snd with the Prandtl number re- placing Nsc. The calculated and experimental temperature differences were then compared. Typical results are given in Table 3. The agreement i s reasonable except for the 250° and 367°C. runs. At these high temperatures the rate of heat transfer into the core of unreacted pellet i s about as large as the rate out into the gas phase. Hence Equation (13), which neglects this term, i s not valid. The concentration differences ( x g - x , ) HF calculated using Equation (11) fork, are shown in the next to the las t col- umn of Table 3. Note that these values are small, so that the importance of using the surface concentration is not as critical as using the surface temperature in Equations (8) and (9).
The values of kr,, calculated from Equation (8) are shown in Figure 7 for the pellets of both porosities. The deviations from the Arrhenius equation at low temperatures probably have two causes: physical adsorption which ac- companies reaction gives an apparent rate that i s too high; and the reaction occurs over a region of the pellet with an effective area larger than the outer surface, again giving an apparent rate per unit surface that is too high. At higher temperatures the plot is linear and corresponds to
k r = 46 exp (-6070/RgT) Equation (14) will be used to evaluate the intrinsic rate in the conversion and temperature predictions. The absence
(14)
TABLE 3 . TEMPERATURE AND CONCENTRATION DIFFERENCES BETWEEN PELLET AND GAS
HF feed Stirrer temperature, speed, Time, (T, - T g ) e x p , (T, - Tg)Falc.,
OC. r.p.m. min. OC. OC. ( x g - ,,)AF 80 85 90
150 250 367 85 85
1,720 2.5 1,720 2.2 1.720 1.9 1,720 1.25 1,720 1.5 1,720 1.25
550 3.5 550 5.0
34 49 62
146 18 1 95
137 202
51 53 57
153 253 265 157 259
0.013 0.014 0.015 0.044 0.077 0.079 0.040 0.070
*Calculated from Equation ( 13) using heat transfer coefficients from Equation (11)
?Calculated using mass transfer coefficients from Equation (11). with Np, substituted for Nsc.
AlChE Journal (Vol. 17, No. 4) July, 1971 Page 951
1000
I00
t c : “5 I
a 10
I 0 1.0 2 0 3.0
IOOO/T,, .K-’
Fig. 7. Arrhenius p lat for in i t ia l rate data.
of effect of stirrer speed lends confidence to the a s s u m p tion of complete mixing in the gas.
ably well with 6.93 reported for the hydrofluorination of pure UO, by El l i s and Roberts (12 ) . Their measurements were on a polished surface of UO, under conditions where temperature differences between gas and solid surface were probably negligible. Other literature data range from 7.1 to 10.1 k c a l h o l e , but many of these results were obtained where the reaction temperature could have been signifi- cantly different from the measured value. The rate for the pellet of lower porosity i s about three times higher, al- though the activation energy i s unchanged. This difference i s much greater than expected from the area increase asso- ciated with the porosity change. The degree of compres- sion of the UO,.,, particles in initially forming the pellet appears to affect the reactivity of the solid surface. Per- haps the sintering process changes the surface to an extent dependent upon the initial porosity.
The activation energy of 6.07 kcal./mole agrees reason-
MASS AND ENERGY TRANSPORT
Gas-to-pellet and intrapellet (product layer) heat and mass transfer rates are needed for predicting conversion- t ime behavior. These rate constants were evaluated, for the main part, from the experimental measurements, as de- scribed in the following paragraphs.
Pellet-to-Gat Coefficients
around the pellet, were calculated from Equation (13) using observed temperature and rate of reaction data. This ex- pression i s a valid energy balance when there i s no heat flow into the unreacted core; that is, when the center tem- perature is approximately constant with time. Reference to Figures 5. 16, and 14 indicates that this will be true only at tirlles when the center thermocouple reading is at or slightly beyond the maximum value, where the center cools
Heat transfer coefficients, assumed to be constant
I I I I I I I I I I 100 200 360 460 5m
1,’ .C
Fig. 8. Heat transfer coefficients.
slowly. The points in Figure 8 show the results of the cal- culations for both stirrer speeds. Also included as dotted lines are the lines calculated from Equations (11) and (12). The heat of reaction used, -42 kcal./g.-mole, i s a combi- nation of M for reactions (2) and (3) according to the composition of the pellet (86% UO,, 14% UOJ.
Since the experimental and calculated heat transfer co- efficients agreed well, Equations (11) and (12) were also used to evaluate mass transfer coefficients between pellet and gas.
lntape I let Trans port Properties The shell model, which supposes a sharp boundary be-
tween product and unreacted core, will be used to predict the conversion and temperature history of a pellet. Also a pseudosteady s ta te with respect to the reaction interface i s assumed. That is, the velocity of mass or energy through the product layer i s assumed to be rapid with re- spect to.the velocity of the reaction interface. The same assumptions are made here to calculate thermal conduc- tivity and diffusivity of the product layer under reaction conditions. The thermal conductivity hef was obtained from an energy balance at the reaction interface, neglecting energy exchange with the unreacted core. Hence only the data after the temperature maximum could be used. The temperature at the reaction interface was not measured. However, in the time region where the core cools slowly, the interface temperature will be nearly equal to the center temperature. With these assumptions, the energy balance at the reaction interface i s
(15)
The pseudosteady state condition permits a simple calcu- lation of the temperature profile through the product layer. Use of this profile to evaluate the gradient at r c gives
The total radius of the pellet changed somewhat with ex- tent of reaction but could be calculated from the apparent densities of product and UO,.,, by the expression
Using Equations (15) to (17), k e f was calculated for tem- peratures from 150” to 367°C. The results, shown in Fig- ure 9, exhibit a sharper temperature effect than expected. The points designated by the same feed gas temperature were evaluated at different times during the same run. The 150°C. run results are much lower than the others. Such factors a s cracking and sintering, and the Severe assump tions made in the evaluation, probably account for the
Page 952 July, 1971 AlChE Journal (Vol. 17, No. 4)
0.12, I I I I 1 I I
10-
i s constant, the gradient evaluated at rc is
1 I I I 1 I I I 300 400 500 600
(1;. t p z , *c
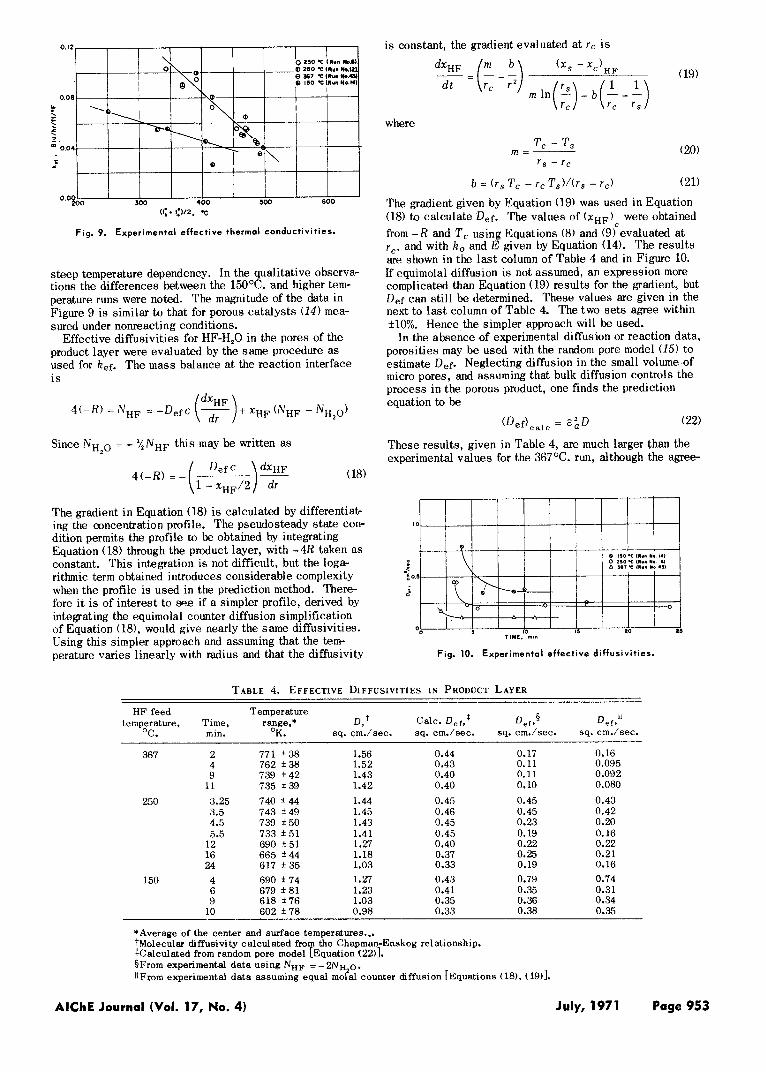
Fig. 9. Experimental effective thermal conductivities.
steep temperature dependency. In the qualitative observa- tions the differences between the 15OOC. and higher tem- perature runs were noted. The magnitude of the data in Figure 9 i s similar to that for porous catalysts (14) mea- sured under nonreacting conditions.
Effective diffusivities for HF-H,O in the pores of the product layer were evaluated by the same procedure as used for kef. The mass balance at the reaction interface i s
Since NH,O = - f/,NHF this may be written as
The gradient in Equation (18) is calculated by differentiat- ing the concentration profile. The pseudosteady state con- dition permits the profile to be obtained by integrating Equation (18) through the product layer, with -4R taken as constant. This integration i s not difficult, but the loga- rithmic term obtained introduces considerable complexity when the profile i s used in the prediction method. There- fore i t i s of interest to see if a simpler profile, derived by integrating the equimolal counter diffusion simplification of Equation (18), would give nearly the same diffusivities. Using this simpler approach and assuming that the tem- perature varies linearly with radius and that the diffusivity
b = ( r S T, - T , T s ) / ( r s - r c ) (21) The gradient given by Equation (19) was used in Equation (18) to calculate Def. The values of (x,,)~ were obtained from - R and T , using Equations (8) and (9) evaluated at r,, and with ho and E given by Equation (14). The results are shown in the las t column of Table 4 and in Figure 10. If' equimolal diffusion is not assumed, an expression more complicated than Equation (19) results for the gradient, but Def can still be determined. These values are given in the next to las t column of Table 4. The two sets agree within +lo%. Hence the simpler approach will be used.
porosities may be used Nith the random pore model (15 ) to estimate Def. Neglecting diffusion in the small volume of micro pores, and assuming that bulk diffusion controls the process in the porous product, one finds the prediction equation to be
In the absence of experimental diffusion or reaction data,
These results, given in Table 4, are much larger than the experimental values for the 367OC. run, although the agree-
Fig. 10. Experimental effective diffusivit ier.
TABLE 4. EFFECTIVE DIFFUSIVITIES I N PRODUCT LAYER
HF feed Temperature temperature, Time, range,* D, Calc. D, f ,$ DeP§ Deft''
O C . min. OK. SQ. cm./sec. sq. cm./sec. sq. cm./sec. sq. cm./sec.
367 2 4 9
11 250 3.25
3.5 4.5 5.5
12 16 24
150 4 6 9
10
771 + 3 8 762 + 3 8 739 + 4 2 735 i 3 9 740 + 4 4 743 + 4 9 739 *50 733 * 5 1 690 t 5 1 665 k44 617 * 3 5 690 f 7 4 679 + 8 1 618 *76 602 +7a
1.56 1.52 1.43 1.42 1.44 1.45 1.43 1.41 1.27 1.18 1.03 1.27 1.23 1.03 0.98
0.44 0.43 0.40 0.40 0.45 0.46 0.45 0.45 0.40 0.37 0.33 0.43 0.41 0.35 0.33
0.17 0.11 0.11 0.10 0.45 0.45 0.23 0.19 0.22 0.25 0.19 0.79 0.35 0.36 0.38
0.16 0.095 0.092 0.080 0.43 0.42 0.20 0.16 0.22 0.21 0.16 0.74 0.31 0.34 0.35
*Average of the center and surface temperatures ... tMolecular diffusivity calculated from the Chapman-Enskog relationship. $Calculated from random pore model [Equation 122)1. §From experimental data using NH, = - ~ N H , o . 11 From experimental data assuming equal molal counter diffusion [Equations (18), ( 19)I.
AlChE Journal (Vol. 17, No. 4) July, 1971 Page 953
ment a t lower temperatures i s about all that could be ex- pected. I t i s possible that sintering blocks off a signifi- cant fraction of the pores at high temperatures, thus reduc- ing the diffusivity. The effect of temperature level i s also apparent in Figure 10. The rapid fall in Def with time i s probably due to plugging of pores, due to expansion while the product i s formed. The effects of sintering, which in- creases with temperature, perhaps explain the relative po- sition of three curves. Note that the temperature of the product layer changes with time along any one curve in Figure 10. However, temperatures for the 367°C. run were always higher than those for the 250°C. run. These re- sults suggest that diffusivities are very sensitive to ef- fects of cracking, sintering, and plugging of the pores. This makes accurate prediction of Def a difficult task.
PREDICTION OF CONVERSION AND TEMPERATURE CURVES
With the intrinsic rate equation established and values available for the transport rate constants, the tools are at hand for predicting temperature and conversioil as a func- tion of time. The method used i s that of a uniformly shrinking, unreacted core with an expanding product layer. Pseudosteady state i s assumed for mass transfer (16) . The same assumption i s l e s s suitable for calculating the tem- perature profile in the product layer, because there can be significant heat transfer from the reaction interface at r c into the core. Hence Equation (15) i s not valid and also the center temperature will change rapidly with time. Com- parison of Figures 5 , 6, and 15 indicates that the effect will be more severe at high temperatures. Shen and Smith (9) developed a prediction method neglecting heat exchange with the core. This method will be compared first with the data, and then an unsteady state modification will be intro- duced to correct for the inadequacy of Equation (15).
Pseudosteady State
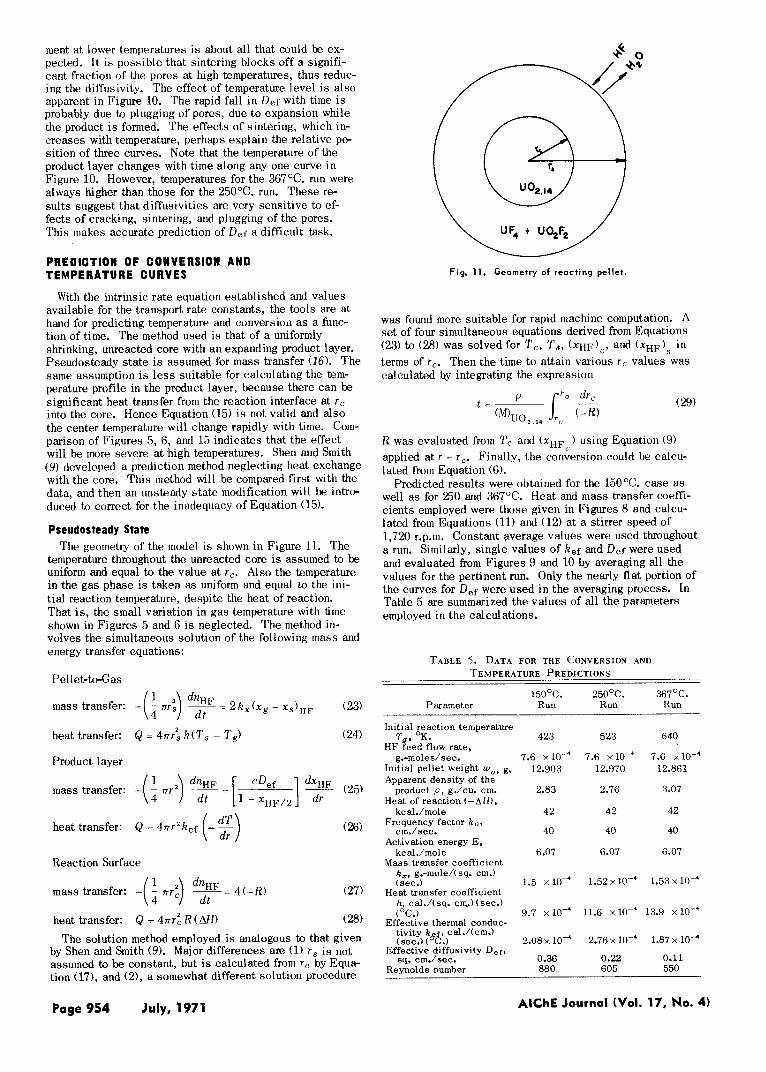
temperature throughout the unreacted core is assumed to be uniform and equal to the value at rc . Also the temperature in the gas phase i s taken as uniform and equal to the ini- tial reaction temperature, despite the heat of reaction. That is, the small variation in gas temperature with time shown in Figures 5 and 6 i s neglected. The method in- volves the simultaneous solution of the following mass and energy transfer equations:
The geometry of the model i s shown in Figure 11. The
Pellet-to-Gas
mass transfer: -(: mi) = 2k,(xg - xs)HF (23)
heat transfer: Q = 4n:, h ( T s - Tg) (24)
Product 1 ayer
heat transfer: Q = 4nr2kef (- 5) ( 26)
Reaction Surface
mass transfer: -( : nr$ dnHF = 4(-R) dt
(27)
heat transfer: Q = 4nr: R(AH) (28)
The solution method employed is analogous to that given by Shen and Smith (9). Major differences are (1) r s i s not assumed to be constant, but i s calculated from rc by Equa- tion (17), and (2), a somewhat different solution procedure
(i "'2.14
$ 0
UF, + U4F2 u Fig. 11. Geometry of reacting pellet.
was found more suitable for rapid machine computation. A set of four simultaneous equations derived from Equations (23) to (28) was solved for T,, ' f S , (xHF),, and (xHF), in terms of rc. Then the time to attain various rc values was calculated by integrating the expression
P
R was evaluated from T , and ( x H F ) using Equation (9) applied at r = r,. Finally, the conversion could be calcu- lated from Equation (6).
Predicted results were obtained for the 150OC. case as well as for 250 and 367°C. Heat and mass transfer coeffi- cients employed were those given in Figures 8 and calcu- lated from Equations (11) and (12) at a stirrer speed of 1,720 r.p.m. Constant average values were used throughout a run. Similarly, single values of hef and Def were used and evaluated from Figures 9 and 10 by averaging all the values for the pertinent run. Only the nearly flat portion of the curves for Def were used in the averaging process. In Table 5 are summarized the values of all the parameters employed in the calculations.
c
TABLE 5 . DATA FOR THE CONVERSION AND TEMPERATURE PREDICTIONS
150°C. 250°C. 367OC. Parameter Run Run Run
Initial reaction temperature
H F feed flow rate, T,, OK.
g.-moles/sec. Initial pellet weight wo, g. Apparent density of the
product p , g./cu. em. Heat of reaction ( - A H ) ,
kcal./mole Frequency factor ko,
cm./sec. Activation energy E,
kcal ./mole Mass transfer coefficient
k,, g.-mole/( sq. cm.) (sec.)
Heat transfer coefficient
423
7.6 x ~ O - ~ 12.903
2.83
42
40
6.07
1.5 x10⁴
523
7.6 x 1 0 - ~ 12.970
2.76
42
40
6.07
1.52 x lo-'
6 40
7.6 x10⁻⁴ 12.861
3.07
42
40
6.07
1.53 x lo4 h, cal./(sq. C I I I . ) (see.)
Effective thermal conduc- tivity k f , cal./(cm.) (sec. ) c'c.) 2.08 x lo4
Effective diffusivity D,f , sq. cm./sec. 0.36
Reynolds number 88 0
( O C . ) 9.7 x10-' 11.6 xlO-' 13.9 ~ 1 0 ~ '
2.76 x lo-' 1.87 x lo-' 0.22 0.11 605 550
Page 954 July, 1971 AlChE Journal (Vol. 17, No. 4)
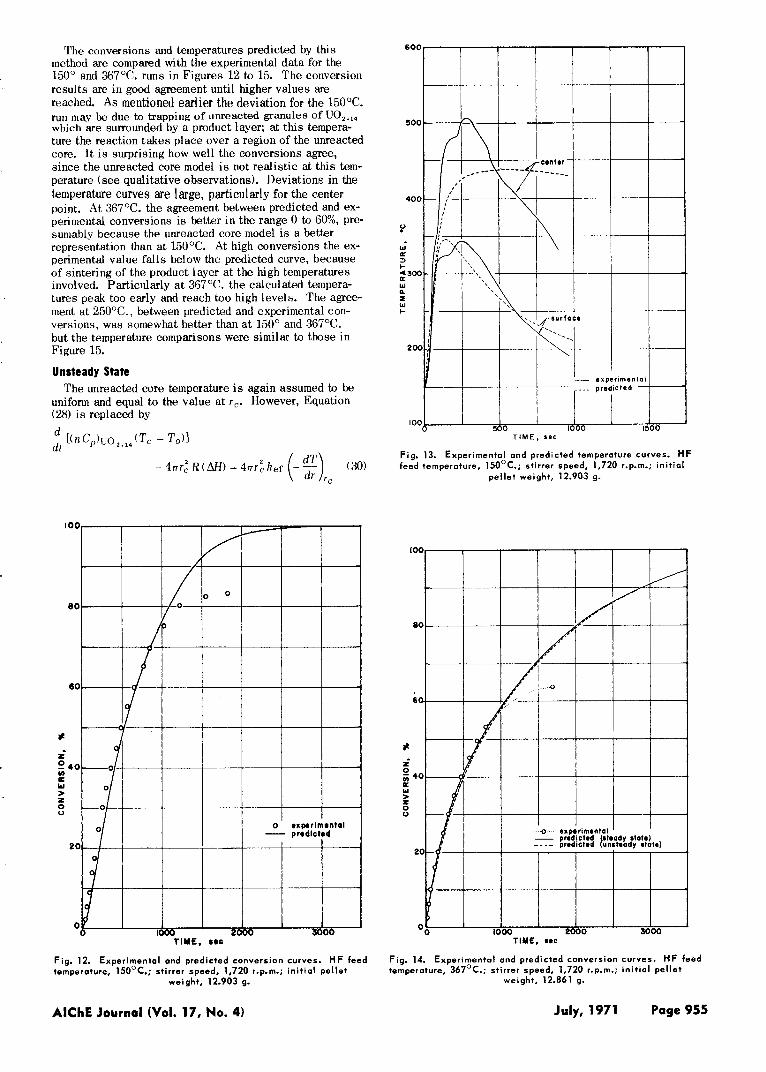
The conversions and temperatures predicted by this method are compared with the experimental data for the 150" and 367°C. runs in Figures 12 to 15. The conversion results are in good agreement until higher values are reached. A s mentioned earlier the deviation for the 15OOC. run may be due to trapping of unreacted granules of UO,.,, which are surrounded by a product layer; a t this tempera- ture the reaction takes place over a region of the unreacted core. I t i s surprising how well the conversions agree, since the unreacted core model is not realistic at this tem- perature (see qualitative observations). Deviations in the temperature curves are large, particularly for the center point. A t 367°C. the agreement between predicted and ex- perimental conversions is better in the range 0 to 60%, pre- sumably because the unreacted core model i s a better representation than at 150°C. At high conversions the ex- perimental value falls below the predicted curve, because of sintering of the product layer at the high temperatures involved. Particillarly at 367°C. the calculated tempera- tures peak too early and reach too high levels. The agree- ment a t 250°C., between predicted and experimental con- versions, was somewhat better than at 150' and 367'C. but the temperature comparisons were similar to those in Figure 15.
Unsteady State The unreacted core temperature i s again assumed to be
uniform and equal to the value at r c . However, Equation (28) i s replaced by
Fig. 12. Experimental and predicted conversion curves. HF feed temperature, 150°C.; stirrer speed, 1,720 r.p.m.; in i t ia l pellet
weight, 12.903 g.
Fig. 13. Experimental and predicted temperature curves. HF feed temperature, 150OC.; stirrer speed, 1,720 r.p.m.; in i t ia l
pe l le t weight, 12.903 g.
Fig. 14. Experimental and predicted conversion curves. HF feed temperature, 367°C.; stirrer speed, 1,720 r.p.m.; in i t ia l pellet
weight. 12.861 g.
AlChE Journal (Vol. 17, No. 4) July, 1971 Page 955
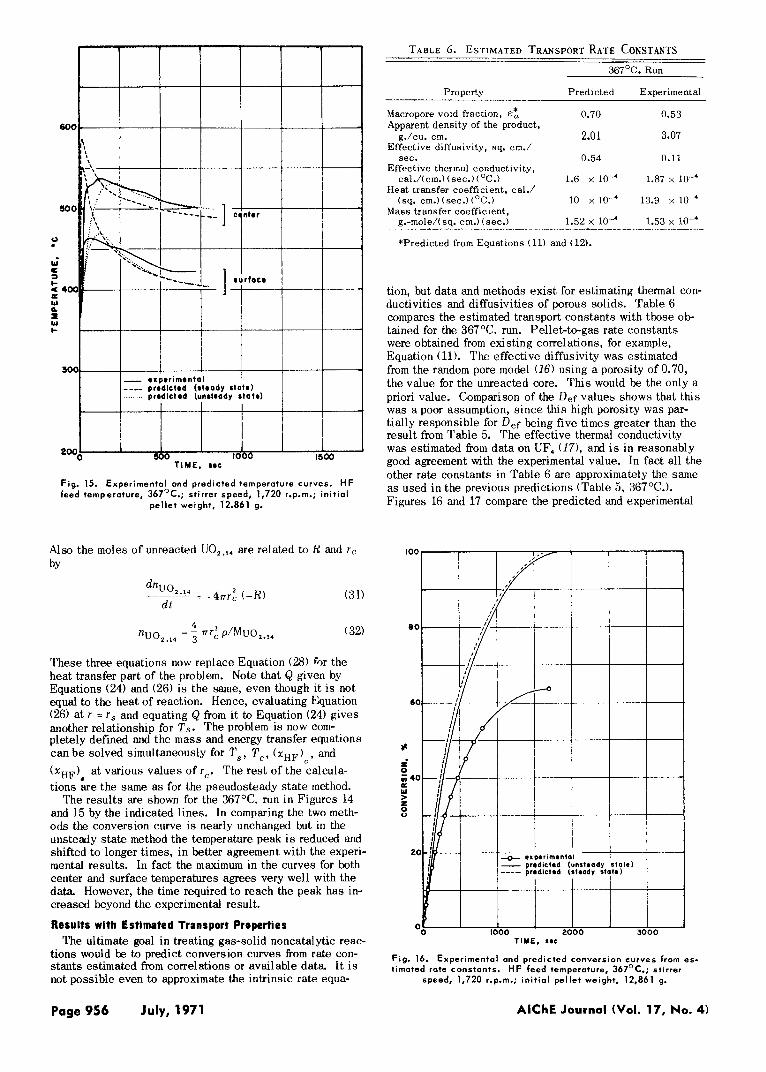
TABLE 6. ESTIMATED TRANSPORT RATE CONSTANTS
Fig. 15. Experimental and predicted temperature curves. HF feed temperature, 367OC.; stirrer speed, 1,720 r.p.m.; in i t ia l
pellet weight, 12.861 g.
Also the moles of unreacted UO,.,, are related to R and rc bY
These three equations now replace Equation (28) S r the heat transfer part of the problem. Note that Q given by Equations (24) and (26) i s the same, even though it i s not equal to the heat of reaction. Hence, evaluating Equation (26) at T = r S and equating Q from i t to Equation (24) gives another relationship for T s . The problem i s now com- pletely defined and the mass and energy transfer equations can be solved simultaneously for Ts, T,, (xHF) , and ( X ) at various values of rc. The rest of the calcula-
HF 8
tions are the same as for the pseudosteady state method. The results are shown for the 367OC. run in Figures 14
and 15 by the indicated lines. In comparing the two meth- ods the conversion curve i s nearly unchanged but in the unsteady state method the temperature peak i s reduced and shifted to longer times, in better agreement with the experi- mental results. In fact the maximum in the curves for both center and surface temperatures agrees very well with the data. However, the time required to reach the peak has in- creased beyond the experimental result.
Results with Estimated Transport Properties
tions would be to predict conversion curves fiom rate con- stants estimated from correlations or available data. I t is not possible even to approximate the intrinsic rate equa-
C
The ultimate goal in treating gas-solid noncatalytic reac-
~
367OC. Run
ProDertv Predicted ExDerimental
Macropore vold fraction. 0.70 0.53 Apparent density of the product,
g./cu. cm. 2.01 3.07 Effective diffusivity. sq. cm./
sec. 0.54 0.11 Effective thermal conductivity,
cal./(cm.) (sec.) (OC.) 1.6 x loA 1.87 x low4 Heat transfer coefficient, cal.1
(sq. cm.)(sec.)(°C.) 10 x lo-' 13.9 x loa Mass transfer coefficient,
g.-mole/( sq. cm.) (sec.) 1.52 x lo-' 1.53 x lo4 *Predicted from Equations (11) and (12).
tion, but data and methods exist for estimating thermal con- ductivities and diffusivities of porous solids. Table 6 compares the estimated transport constants with those ob- tained for the 367OC. run. Pellet-to-gas rate constants were obtained from existing correlations, for example, Equation (11). The effective diffusivity was estimated from the random pore model (16) using a porosity of 0.70, the value for the unreacted core. This would be the only a priori value. Comparison of the Def values shows that this was a poor assumption, s ince this high porosity was par- tially responsible for Def being five times greater than the result from Table 5. The effective thermal conductivity was estimated from data on UF, (17), and i s in reasonably g o d agreement with the experimental value. In fact all the other rate constants in Table 6 are approximately the same as used in the previous predictions (Table 5, 367OC.). Figures 16 and 17 compare the predicted and experimental
Fig. 16. timated rate constants. H F feed temperature, 367'C.; stirrer
Experimental and predicted conversion curves from es-
speed, 1,720 r.p.m.; in i t ia l pellet weight, 12,861 g.
Page 956 July, 1971 AlChE Journal (Vol. 17, No. 4)
,,.----------- --- center
I I t
800
2 600
W
0 1000 2000 3000 200
TIME, sac
i
\ 4
', - t
Fig. 17. timated rate constants. HF feed temperature, 367OC.; stirrer
Experimental and predicted temperature curves from es-
speed, 1,720 r.p.m.; in i t ia l pellet weight, 12.861 g.
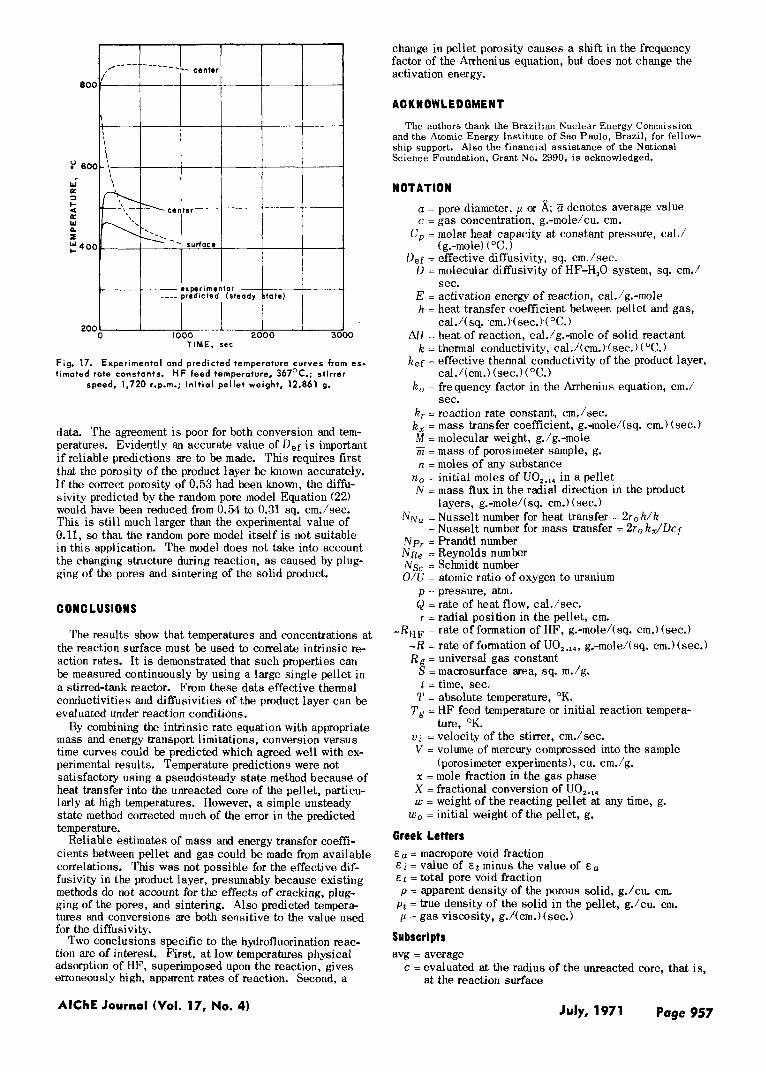
data. The agreement i s poor for both conversion and tem- peratures. Evidently an accurate value of Def is important if reliable predictions are to be made. This requires first that the porosity of the product layer be known accurately. If the correct porosity of 0.53 had been known, the diffu- sivity predicted by the random pore model Equation (22) would have been reduced from 0.54 to 0.31 sq. cm./sec. This i s still much larger than the experimental value of 0.11, so that the random pore model itself i s not suitable in this application. The model does not take into account the changing structure during reaction, as caused by plug- ging of the pores and sintering of the solid product.
CONCLUSIONS
The results show that temperatures and concentrations at the reaction surface must be. used to correlate intrinsic re- action rates. I t i s demonstrated that such properties can be measured continuously by using a large single pellet in a stirred-tank reactor. From these data effective thermal conductivities and diffusivities of the product layer can be evaluated under reaction conditions.
By combining the intrinsic rate equation with appropriate mass and energy transport limitations, conversion versus time curves could be predicted which agreed well with ex- perimental results. Temperature predictions were not satisfactory using a pseudosteady state method because of heat transfer into the unreacted core of the pellet, particu- larly at high temperatures. However, a simple unsteady state method corrected much of the error in the predicted temperature.
Reliable estimates of mass and energy transfer coeffi- cients between pellet and gas could be made from available correlations. This was not possible for the effective dif- fusivity in the product layer, presumably because existing methods do not account for the effects of cracking, plug- ging of the pores, and sintering. Also predicted tempera- tures and conversions are both sensitive to the value used for the diffusivity.
Two conclusions specific to the hydrofluorination reac- tion are of interest. First, at low temperatures physical adsorption of HF, superimposed upon the reaction, gives erroneously high, apparent rates of reaction. Second, a
change in pellet porosity causes a shift in the frequency factor of the Arrhenius equation, but does not change the activation energy.
ACKNOWLEDGMENT
The authors thank the Brazilian Nuclear Energy Commission and the Atomic Energy Institute of Sao Paulo, Brazil, for fellow- ship support. Also the financial ass is tance of the National Science Foundation, Grant No. 2990, is acknowledged.
NOTATION
a = pore diameter, p or h;; iz denotes average value c = gas concentration, g.-mole/cu. cm.
C, = molar heat capacity at constant pressure, c a l l
Def = effective diffusivity, sq. cm./sec. (g.-mole) ("C.)
D = molecular diffusivity of HF-H,O system, sq. cm./
E = activation energy of reaction, cal./g.-mole h = heat transfer coefficient between pellet and gas,
sec.
cal./(sq. cm.)(sec.) ( O C . ) AH = heat of reaction, cal./g.-mole of solid reactant
kef = effective thermal conductivity of the product layer,
k , = frequency factor in the Arrhenius equation, cm.1
k, = reaction rate constant, cm./sec. k , = mass transfer coefficient, g.-mole/(sq. cm.) (sec.) M = molecular weight, g./g.-mole m = mass of porosimeter sample, g. n = moles of any substance
N = mass flux in the radial direction in the product
k = thermal conductivity, cal./(cm.)(sec.) ( O C . )
cal./(cm.) (sec.) ("C.)
sec.
-
no = initial moles of UO,.,, in a pellet
layers, g.-mole/(sq. cm.) (sec.) N N ~ = Nusselt number for heat transfer = 2 r o h / k
N p , = Prandtl number N R ~ = Reynolds number Nsc = Schmidt number O/U = atomic ratio of oxygen to uranium
p = pressure, atm. Q = rate of heat flow, cal./sec. r = radial position in the pellet, cm.
= Nusselt number for mass transfer = 2ro h,/Dcf
-RHF = rate of formation of HF, g.-mole/(sq. cm.) (sec.) -R = rate of formation of UO,.,,, g.-mole/(sq. cm.)(sec.) R g = universal gas constant
S = macrosurface area, sq. m./g. t = time, sec.
T = absolute temperature, O K .
T, = HF feed temperature or initial reaction tempera-
u I = velocity of the stirrer, cm./sec. V = volume of mercury compressed into the sample
x = mole fraction in the gas phase X = fractional conversion of UO,.,, w = weight of the reacting pellet at any time, g.
ture, "K.
(porosimeter experiments), cu. cm./g.
w o = initial weight of the pellet, g.
Greek Letters E a = macropore void fraction & = value of E t minus the value of E a ~t = total pore void fraction p = apparent density of the porous solid, g./cu. cm.
pt = true density of the solid in the pellet, g./cu. cm. p = gas viscosity, g./(cm.)(sec.)
Subscripts avg = average
c = evaluated at the radius of the unreacted core, that is, a t the reaction surface
AlChE Journal (Vol. 17, NO. 4) July, 1971 Page 957
f = evaluated at the average film temperature,
g = evaluated at conditions of the gas in the reaction chamber
o = evaluated at the initial conditions p = solid product r = solid reactant s = evaluated a t the external surface of the pellet
t ; = ct: + t ; n
LITERATURE CITED 1. Beveridge, G. S. G., and K. G. Denbigh, Trans. Inst . Chem.
2. Dunoyer, J. M.. J. Chim. Phys., 47, 290 (1950). Eng., 40, 23 (1962).
3. Jost.-W.. Chem. Enp. Sci.. 2, 199 (1953). . . 4. Levenspiel, 0.. “Chemical Reaction Engineering,” Chap. 12,
5. Philbrook, W. O., F. S. Manning, and M. A. Osman, AIChE J . , Wiley, New York (1962).
12, 685 (1966). 6. Weisz, P. B., and R. D. Goodwin, J . Cata ly s i s , 2, 397 (1963). 7. Tamman, G., Z. Anorg. Chem.. 111, 78 (1920).
8. Maymo, J. A., and J. M. Smith, AIChJZ J., 12, 845 (1966). 9. Shen, J., and J. M. Smith, Ind. Eng. Chem. Fundamentals, 4,
293 (1965).
(1957).
NLCO-675 (Apr. 19571.
10. Cannon, K. J., and K. G. Denbigh, Chem. Eng. Sci., 6 , 145
11. DeMarco, R. E., D. C. Bonfer, and R. C. Abbot, USAEC Rept.
12, Ellis, W. P., J. Chem. Phys., 39, 1172 (1963). 13. Tomlinson, L., S. A. Morrow, .and S. Graves, Trans. Faraday
Soc., 57, 1008 (1961). 14. Satterfield, C. N., and T. K. Sherwood, “The Role of Diffu-
sion in Catalysis,” p. 87, Addison-Wesley, Reading, Mass. (1963).
(1962). 15. Wakao, Noriaki, and J. M. Smith, Chem. Eng. Sci., 17, 825
16. Bischoff, K. B., ibid., 18, 711 (1963). 17. Belle, J., ed., “Uranium Dioxide: Properties and Nuclear
Applications,” U.S. Atomic Energy Commission, U.S. Govt. Printing Office, Washington D. C. (1961).
Manuscript received April 21, 1969; revis ion received October 2, 1969; paper accepted October 6 , 1969.
Experi mental Heats of Mixing for Gaseous Nitrogen and Methane
R. R. KLEIN, C. 0. BENNETT, and B. F. DODGE Yale University, N e w Haven, Connecticut
The excess enthalpy of binary gas phase mixtures has been measured by direct experiment, using a continuous flow, isothermal calorimeter. Heat of mixing data are presented for the methane-nitrogen system for compositions of 25 to 80 mole % methane in nitrogen, a t temperatures of 40°, Oo, -209 -40°, -60°, and -78OC. and pressures from 250 to 1,500 lb./sq. in. abs. These data are i n agreement with the literature to within the experimental uncertainty of this work, 4%.
The experimental results agree well with values predicted using the Benedict- Webb-Rubin and the Redlich-Kwong equations of state. The v i r ia l equation of state truncated after the third coefficient f i ts the low density data only. The l iquid theories of Scott predict the entholpies of the mixtures i n a qualitative way.
The heat of mixing or excess enthalpy i s defined by the -quation
H E = H , - y i H i (constant p and T ) (1) 1
It provides one means of obtaining the enthalpy of' solu- tions whose practical importance for the design and analy- s i s of heat exchange equipment i s obvious. It i s also of scientific importance since it provides a test of mixing rules for an equation of state and a test of theories of molecular interactions. Experimental data on the enthalpy of gas mixtures are quite limited and engineers have been
R. R. Klein is at Uniroyal Corporation, Naugatuck, Connecticut. C. 0. Bennett is at the University of Connecticut, Storrs. Con- necticut.
obliged to calculate values needed for design by various approximate methods.
METHODS OF PREDICTING H,
Before describing the experiments it seems appropriate to consider various ways by which H, can be calculated. The differential equations relating H , to the variables of state are well known and rigorous but their integration re- quires either an equation of state or the equivalent pressure- volume-temperature data. The application of equations of state to a mixture involves empirical mixing rules whose validity is uncertain, and in many cases there are no ex- perimental data against which to test the methods. In the course of this work we have tested three equations of state: a modified Redlich-Kwong (R-K) equation, the Benedict-
Page 958 July, 1971 AlChE Journal (Vol. 17, No. 4)