Uranium tailings sampling manual
95
NATIONAL URANIUM TAILINGS PROGRAM URANIUM TAILINGS SAMPLING MANUAL NUTP-1E Energy, Mines and Er Canada
-
Upload
khangminh22 -
Category
Documents
-
view
1 -
download
0
Transcript of Uranium tailings sampling manual

NATIONALURANIUMTAILINGSPROGRAM
URANIUM TAILINGSSAMPLINGMANUAL
NUTP-1E
Energy, Mines and Er Canada

URANIUM TAILINGS SAMPLING MANUAL
Golder Associates: S. Feenstra, D. W. Reades, J.A. Cherryand
SENES Consultants: D.B. Chambers, G.G. Case,B.G. Ibbotson
National Uranium Tailings Program
NUTP-1E
CANMET
Canada Centre Centre canadientor Mineral de la technologieand Energy des minerauxTechnology et de I'Gnergie

c Minister of Supply and Services Canada 1985
Available in Canada through
Authorized Bookstore Agentsand other bookstores
or by mail from
Canadian Government Publishing CentreSupply and Services CanadaOttawa. Canada K1A0S9
Catalogue No. M39-15/I-1985F Canada: $6.7?
ISBN 0-660-1 18H0-7 Other Countries: $8.10
Price subject to change wiihout notice

FOREWORD
There are currently about 130 million tonnes of mine wastes (tailings) produced from the mining andmilling of uranium ore that are on, or near, the surface in Canada. At public hearings and other forumsheld in connection with proposals for new uranium production facilities, concern has been expressedfc.ix>ut the impact that these wastes may have on the environment in the future. Governmentregulatory agencies believe that there may be long-term environmental and health consequencesassociated with uranium tailings that are not yet fully understood.
As a result of a year-long study, undertaken by a group of experts from government, industry, and theuniversities, into the possible long-term problems of uranium tailings management, the decision wastaken by the Federal Government to launch an R & D program to assist in clarifying the nature andextent of problems that may arise in the future. It is anticipated that the results of such a program willbe of use to the Atomic Energy Control Board and to provincial regulatory agencies in the establish-ment of criteria for the decommissioning and abandonment of uranium tailings. To this end, theNational Uranium Tailings Program of CANMET has been funded to the extent of $9.5 million for aperiod of five years.
The main objective of this Program is to provide a scientifically credible information base that willassist government regulatory agencies in making confident, knowledgeable decisions, and in estab-lishing criteria for the long-term protection of the environment and human health. The scientificinformation base will, among other things, describe the chemical and physical processes that involvetailings constituents and their movement along pathways from the tailings into the biosphere.
The National Uranium Tailings Program's activities, which have been entirely contracted out, haveincluded research into the processes involved in the behaviour and movement of contaminants fromtailings, field sampling and measurements, chemical analyses, and predictive modelling. As animportant part of the Program output, manuals have been prepared that incorporate the results of thiswork.
This manual has been prepared for the purpose of making available up-to-date information and datathat will be of interest and practical use to those directly concerned with operational aspects ofuranium tailings management and regulation.
W.G. JefferyDirector GeneralCanada Centre for Mineral and EnergyTechnology

PREFACE
This manual was prepared undercontract to the National Uranium Tailings Program (NUTP). NUTP isa federally-funded research program designed, among other things, to obtain data and information onuranium tailings constituents with the purpose of predicting the probabilities of contaminant releasesand their impact on the environment in the long-term. It is essential that any samples taken during afield program on behalf of NUTP should be collected in the most scientific and accurate way possible.It is also important that any contractor working on behalf of NUTP uses sampling techniques thatmeet the quality standards required for the Program. For this reason, NUTP staff commissioned thismanual, one of a series of manuals, to ensure that an acceptable reference is available. It is alsohoped that this manual will be useful to others working on field sampling programs.
ACKNOWLEDGEMENTS
As with any such endeavour, a large number of people made many helpful cor.-iribuiions to thedevelopment of this manual. I would like to thank the staff of NUTP, Victor Haw, Walter Harrison, GrantFeasby, and Gi/les Tremblay for their input. I would particularly like to thank Garry Grove of theNational Hydrological Research Institute, Environment Canada, for all his many efforts. Lastly, Iwould like to thank Doug Chambers, Glen Case, Bret Ibbotson of SENES Consultants, and JohnCherry and the two principal authors, Stan Feenstra and Denys Reades of Golder Associates.
Roy JohnProject Manager, MeasurementsNational Uranium Tailings Program
DISCLAIMER
Any mention of, or reference to, manufacturers' products should not be construed as an endorsementfor those specific products.

CONTENTSPAGE
FOREWORD iii
PREFACE vAcknowledgements v
1 INTRODUCTION 11.1 Purpose of Sampling Manual 11.2 Uranium Mine Tailings in Canada 11.3 Principal Environmental Concerns 21.4 References 3
2 DEFINITION OF A SAMPLING PROGRAM 42.1 Objectives 42.2 Scope 4
3 PRELIMINARY DATA COLLECTION 5
4 TAILINGS SOLIDS 64.1 Objectives 64.2 Selection of Sampling Locations 64.3 Physical Characterization 9
4.3.1 Parameters 94.3.2 Sample collection methods 94.3.3 Sample handling and preservation methods 134.3.4 Laboratory analytical methods 144.3.5 In situ testing 14
4.4 Chemical/Mineralogical Characterization 174.4.1 Parameters 174.4.2 Sample collection methods 184.4.3 Sample handling and preservation methods 184.4.4 Laboratory analytical methods 18
4.5 Radiological Characterization 184.5.1 Parameters 184.5.2 In situ testing 184.5.3 Sample collection methods 184.5.4 Sample handling and preservation methods 194.5.5 Laboratory analytical methods 19
4.6 Quality Assurance for Solids Sampling '. 194.7 Program Costs 214.8 References 23
5 SURFACE WATER AND SEEPAGE 245.1 Objectives 245.2 Selection of Sampling Locations 245.3 Surface Water 24
5.3.1 Flow measurements 245.3.2 Chemical sampling 25
5.3.2.1 Parameters 255.3.2.2 Sample collection methods 265.3.2.3 Sample handling and preservation methods 265.3.2.4 Analytical methods 28
5.4 Seepage 29
VII

5.4.1 Flow measurements 295.4.2 Chemical sampling 30
5.4.2.1 Parameters 305.4.2.2 Sample collection methods 305.4.2.3 Sample handling and preservation methods 315.4.2.4 Analytical methods 31
5.5 Quality Assurance for Water Sampling 315.5.1 Recording of field data 315.5.2 Quality control for sample collection 315.5.3 Independent assessment of data reliability 33
5.6 Program Costs 345.7 References 35
6 TAILINGS POREWATER 366.1 Objectives 366.2 Selection of Sampling Locations 366.3 Piezometer Construction and Installation 366.4 Hydraulic Head Measurements 406.5 Hydraulic Conductivity Testing 406.6 Porewater Sampling 45
6.6.1 Parameters 456.6.2 Sample collection r lethods 456.6.3 Sample handling a id preservation methods 526.6.4 Analytical methods; 52
6.7 Quality Assurance for Porewater Sampling 536.8 Program Costs 536.9 References 55
7 WIND-BLOWN DUST AND RADON 567.1 Objectives 567.2 Selection of Sampling Locations 567.3 Wind-Blown Dust 57
7.3.1 Parameters 577.3.2 Sample collection methods 587.3.3 Analytical methods 60
7.4 Radon 607.4.1 Parameters 607.4.2 Radon exhalation measurements 617.4.3 In situ radon measurements 627.4.4 Ambient air monitoring 62
7.5 Quality Assurance 627.6 Program Costs 627.7 References 64
8 CASE HISTORY - SAMPLING PROGRAMS AT DENISON MINES,ELLIOT LAKE, ONTARIO 65
8.1 Introduction 658.2 Williams Lake Tailings Impoundment 65
8.2.1 Introduction 658.2.2 Tailings solids sampling 678.2.3 Surface water sampling 708.2.4 Piezometer installation 708.2.5 Tailings porewater sampling 728.2.6 Wind-blown dust and radon 73
8.3 Long Lake Tailings Impoundment 778.3.1 Introduction 778.3.2 Physical properties of tailings 778.3.3 Tailings discharge, decant and seepage sampling 798.3.4 Tailings porewater sampling 798.3.5 Wind-blown dust and radon 79
viii

8.4 Summary 828.5 References 83
APPENDIX A - Uranium-238 and Thorium-232 Decay Series 85
TABLES
No.3.1 Types and sources of background data 54.1 Parameters for physical characterization of tailings solids 94.2 Tailings solids sampling techniques 104.3 Methods for in situ determination of physical parameters of tailings solids 144.4 Analyses for chemical/mineralogical characterization of tailings solids 174.5 Parameters for radiological characterization of tailings solids 194.6 Tailings radionuclide analysis by size class 205 1 Key parameters for water sampling 255.2 Water sample handling and preservation techniques 275.3 Empirical electrical conductance (EC)-ionic sum (B) relationships 346.1 Types of piezometers for measurement of hydraulic head and porewater sampling . . . 376.2 Types of hydraulic conductivity testing techniques 426.3 Porewater sample collection methods 468.1 Summary of chemical analyses of tailings solids 678.2 Example of results of surface water sampling - Williams Lake tailings
impoundment, Station D-3 718.3 Suspended particulate results for Williams Lake and other inactive
tailings impoundments 758.4 Radiological analyses of suspended particulate samples collected near
inactive tailings impoundments 768.5 Summary of total dustfall data collected in the Elliot Lake area during 1976- 1980 .. 768.6 Uranium and radium-226 in dustfall during the 1976-1978 period 768.7 Ambient radon measurements for inactive tailings areas 778.8 Example of tailings discharge to Long Lake tailings impoundment - 1982 808.9 Example of results of surface water sampling - Long Lake tailings impoundment -
tailings decant 808.10 Suspended particulate results for active tailings impoundments 818.11 Radionuclide analyses of suspended particulate samples collected near
active tailings impoundments 818.12 Total dustfall data collected at Long Lake tailings impoundment by
Denison Mines Limited 828.13 Ambient radon measurements for active tailings areas 82
FIGURES
No.1.1 Potential environmental concerns at uranium tailings impoundments 24.1 Example of selection of sampling locations at a tailings impoundment 84.2 Manually operated thin-wailed tube sampling equipment 114.3 Benthos gravity core sampler for collection of submerged tailings samples 114.4 Details of split-spoon sampler 124.5 Operation of thin-walled Shelby tube sampler 124.6 Operation of fixed piston thin-walled tube sampler 134.7 Details of thin-walled tube sampler cutting-edge 134.8 Typical configuration of in situ nuclear moisture testing equipment 154.9 Vane testing equipment for determination of in situ shear strength 164.10 Example of field borehole log 225.1 Example of a small V-notch weir of plywood construction 255.2 Example of depth-specific water sampler (Kemmerer) 26

5.3 Typical portable pH and electrical conductance meters 285.4 Seepage meters for determination of rate of groundwater discharge to
surface water 295.5 Installation of mini-piezometers in stream or lake bed 305.6 Example of surface water sampling form 326.1 Conventional monitoring well 386.2 Large diameter drive-point piezometer and manual installation proced'ire 386.3 Small diameter drive-point piezometer and drill rig installation procedure 396.4 Bundle-type piezometer 396.5 Gas-drive water sampler 406.6 Tensiometer for measurement of hydraulic head in the unsaturated zone 416.7 Single-well response test configuration and analysis to determine horizontal
hydraulic conductivity (Kh) 436.8 Pumping test configuration and analysis to determine hydraulic conductivity 446.9 Permeameter apparatus for laboratory determination of hydraulic conductivity 456.10 Bailer for water sampling from wells and piezometers 476.11 Syringe sampler for water sampling from wells and piezometers 476.12 Example of peristaltic sampling pump 476.13 Air-lift device for water sampling from wells and piezometers 486.14 Selection of piezometer type and porswater sampling method 506.15 Suction lysimeter for porewater sampling above the water table 516.16 Tailings core squeezing apparatus for collection of porewater from tailings samples .. 516.17 142 mm filter holder for filtration of porewater samples 526.18 Example of porewater (groundwater) sampling form 547.1 Selection of sampling locations for wind-blown dust 577.2 Selection of sampling locations for wind-blown dust with land-use effect 587.3 High volume air sampler for determination of suspended particulate 597.4 Dustfall sampler 607.5 Apparatus for measurement of radon flux from tailings surface 617.6 Example of high volume air sampling form 638.1 Location of Denison Mines tailings impoundments 668.2 Williams Lake and Long Lake tailings impoundments 688.3 Example of tailings stratigraphy and tailings solids chemistry - Williams Lake 698.4 Chemical composition of tailings solids versus tailings grain size - Williams Lake . . . 708.5 Example of piezometer nest at Williams Lake 728.6 Hydraulic head vertical profile - Williams Lake 738.7 Porewater chemistry vertical profile - Williams Lake 748.8 Water content, density and in situ shear strength profiles - Long Lake 78

1. INTRODUCTION1.1 PURPOSE OF SAMPLING MANUALThe purpose of this manual is to describe the requi-site sampling procedures for the application of uni-form high-quality standards to detailed geotechnical,hydrogeological, geochemical and air quality mea-surements at Canadian uranium tailings disposalsites. The selection and implementation of applicablesampling procedures for such measurements at ura-nium tailings disposal sites are complicated by twoprimary factors.
Firstly, the physical and chemical nature of uraniummine tailings and effluent is considerably differentfrom natural soil materials and natural waters. Con-sequently, many conventional methods for the collec-tion and analysis of natural soils and waters are notdirectly applicable to tailings. Secondly, there is awide range in the physical and chemical nature ofuranium tailings. The composition of the ore, themilling process, the nature of tailings deposition, andeffluent treatment vary considerably and are highlysite-specific. Therefore, the definition and implemen-tation of sampling programs for uranium tailings dis-posal sites require considerable evaluation, and ofteninnovation, to ensure that appropriate sampling andanalysis methods are used which provide the flex-ibility to take into account site-specific considera-tions.
The following chapters describe the objective andscope of a sampling program, preliminary data col-lection, and the procedures for sampling of tailingssolids, surface water and seepage, tailings pore-water, and wind-blown dust and radon.
1.2 URAN'UM MINE TAILINGS IN CANADAUranium mining and milling operations began in theNorthwest Territories in 1943 and have been con-ducted in Ontario and northern Saskatchewan sincethe mid 1950's. Since that time, 19 uranium miningoperations have produced approximately 126 milliontonnes of tailings. Of this total, approximately 117 mil-lion tonnes have been deposited in a variety of sur-face impoundments covering a total of 635 ha, withthe remainder deposited underwater in lakes or usedas mine backfill. The bulk of the uranium mine tail-ings, 81 per cent (102 million tonnes), are located inthe Elliot Lake area of Ontario. Approximately 14 percent (18 million tonnes) are located in northern Sas-katchewan and 5 per cent (6 million tonnes) arelocated in the Bancroft area of Ontario.
Of the total quantity of tailings, approximately 34 percent, or 43 million tonnes, are located in inactive ordecommissioned tailings impoundments which nolonger receive tailings. The majority of these tailingsimpoundments were operated from the mid 1950's tothe mid 1960's and have been inactive since that time.The remaining 66 per cent or 83 million tonnes oftailings are located in active tailings impoundments
which currently receive tailings. With the exception ofthe Eldorado Nuclear Limited (now called EldoradoResources Ltd.) Beaverlodge operation which usedan alkaline-leach process, all the mine-mill opera-tions used an acid-leach process for the extraction oturanium from the ore. At the present time there areseven operating mines in Elliot Lake and northernSaskatchewan which produce approximately 7 mil-lion tonnes of tailings per year.
The various active and inactive tailings impound-ments in Ontario and northern Saskatchewan varyconsiderably in character due to differences in size,age, construction of the tailings impoundment andcomposition of the tailings, as well as regional differ-ences in climate and physiographic setting. Thesevariations make each tailings impoundment unique interms of the specific considerations for the detaileddesign and implementation of sampling programs.
The uranium tailings impoundments in Canadarange in size from the small inactive Dyno tailingsimpoundment at Bancroft which covers 4 ha andcontains only 0.36 million tonnes of tailings, to theactive Long Lake tailings impoundment at Elliot Lakewhich covers 125 ha and contains 40 million tonnesof tailings. The Nordic tailings impoundment at ElliotLake is currently the largest inactive tailings im-poundment covering 107 ha and containing 10.9 mil-lion tonnes of tailings.
There is also considerable variation in the age ofvarious tailings impoundments. For example, theDyno tailings impoundment only operated for a shortperiod from 1958 to 1960 whereas the Long Laketailings impoundment has been in continuous opera-tion since 1959. The Rabbit Lake tailings impound-ment in northern Saskatchewan did not begin opera-tions until 1975. The wide ranges in size and age ofthe uranium tailings impoundments naturally result indifferences in the designs of the impoundments, themethods of tailings deposition and the types of millingprocess at the various sites. The specific importanceof these differences to the design of sampling pro-grams will be described in the following sections forthe different components of a sampling program.
There is a considerable variation in the chemical andmineralogical composition of the tailings due to differ-ences in the ore derived from the different mines, anddifferences in the milling and treatment processes.Ore deposits in the Elliot Lake area are large, rela-tively low-grade deposits with uranium and thoriumoccurring in brannerite, uraninite and monazite min-erals. The principal accessory metallic mineral in theElliot Lake ores is pyrite (iron sulfide). In contrast, therecently developed northern Saskatchewan oredeposits are typically small, high-grade deposits withuranium occurring in pitchblende but with little thor-ium. These deposits typically have substantial quan-tities of accessory metallic minerals such as

gersdorffite (nickel arsenic sulfide) cobaltite (cobaltarsenic sulfide) and millerite (nickel sulfide). Theseaccessory minerals can have a considerable effecton the chemical composition of the tailings. The spe-cific importance of the differences in the compositionof the tailings to the design of sampling programs willbe described for the different components of a sam-pling program.
1.3 PRINCIPAL ENVIRONMENTAL CONCERNSThe principal environmental concerns related to ura-nium tailings impoundments arise from the potentialmovement of chemical and/or radioactive constitu-ents out of the tailings impoundments into the sur-rounding environment. The major pathways for themovement of chemical and/or radioactive constitu-ents out of a tailings impoundment are shown inFig. 1.1. These pathways include:
- surface water runoff from the tailings impound-ment;
- localized seepage from within the tailings intosurrounding surface water;
- exfiltration of porewater from the tailings intothe underlying groundwater system;
- removal of tailings as wind-blown dust;
- exhalation of radon from the tailings into theatmosphere.
In this report, seepage refers to tailings porewaterthat emerges from the tailings and discharges tosurface water in the immediate vicinity of the tailingsimpoundment. Exfiltration refers to tailings porewaterthat moves out of the tailings and enters the ground-water system underlying the tailings impoundment.
Because of the considerable variation in differenttailings impoundments, any combination of thesemechanisms may be applicable to a particular tail-ings impoundment. The following are examples ofvarious uranium tailings impoundments at whichthese pathways have been evaluated.
Surface Water RunoffThe effects of surface water runoff and erosion at theinactive Gunnar tailings impoundment in northernSaskatchewan have increased the total suspendedsolids, total dissolved solids and various radionuclideconcentrations in Langley Bay (Swanson andAbouguendia, 1981). As a result, the aquatic biota ofLangley Bay are bioconcentrating radionuclides.
SeepageLocalized seepage of contaminated water from tail-ings into surface water through pervious retainingdams has been documented at the inactive Stanrocktailings impoundment at Elliot Lake (Feenstra et a!.,1981). The chemical composition of seepage emerg-ing from the dams has been strongly influenced bythe oxidation of pyrite within the tailings, and is
NOT DRAWN TO SCALE
Fig. 1.1 - Potential environmental concerns at uranium tailings impoundments

characterized by low pH (2-3) and high concen-trations of iron and sulfate (up to 2000 mg.'L and 6000mg/L respectively). The seepage from the Stanrockimpoundment is currently collected and treated priorto discharge.
ExfiltrationThe exfiltration of contaminated water from failingsinto the underlying groundwater systems has beendocumented at the inactive Nordic tailings impound-ment at Elliot L=ike (Cherry et al., 1980; Morin et al.,1982). The chemical composition of porewater fromthe tailings has been strongly influenced by theoxidation of pyrite within the tailings and this por-ewater has moved down into an underlying sandaquifer. The exfiltration of porewater from the tailingsinto the groundwater has resulted in an extensivecontaminant plume in the aquifer, characterized byhigh concentrations of iron and sulfate (500 mg. L and3000 mg/L respectively), which is migrating at thevelocity of the groundwater. In addition, there existsan inner, smaller, more highly contaminated plume,characterized by low pH (<4) and elevated con-centrations of heavy metals, iadium-226, iron, andsulfate (several mg/L, 4.5 Bq/L, 5000 mg/L and12 000 mg/L respectively), but which is migrating atless than one per cent of the groundwater velocitydue to chemical attenuation in the aquifer.
Wind-blown DustAbout 16 per cent of the measurements of sus-pended particulate matter, made at the inactiveStanrock tailings impoundment at Elliot Lake duringJune to September 1977 (James F. MacLaren Ltd.,1978), exceeded Environment Canada's 24-hoursuspended particulate air quality criterion (120 ng/m3) at stations within 100 m of the tailings impound-ment.
Radon ExhalationRadon exhalation measurements at the inactive Nor-dic tailings impoundment at Elliot Lake ranged from4.5 to 14.5 Bq/m2 s (James F. MacLaren Ltd., 1978).These radon exhalation rates are approximately twoorders of magnitude greaier than exhalation rates onnative soils in the Elliot Lake area.
1.4 REFERENCESCherry, J.A.; Blackport, R.J.; Dubrovsky, N.; Gillham.
R.W.; Lim, T.P.; Murray, D.; Reardon, E.J. andSmyth, D.J.A. (1980). "Subsurface hydrology andgeochemical evolution of inactive pyritic tailings inthe Elliot Lake uranium district. Canada". Sym-posium on Uranium Mill Tailings Management,pp. 535-585, 1980.
Feenstra, S.; Blair, R.D.; Cherry, J.A.; Chakravatti.J.L. and La Rocque, E. (1981). "Hydrogeochemicalinvestigations of two inactive tailings areas in theElliot Lake Uranium District, Ontario, Canada". InProceedings of the Fourth Symposium on UraniumMill Tailings Management, pp. 367-389,1981.
James F. MacLaren Limited (1978). EnvironmentalAssessment of the Proposed Elliot Lake UraniumMines Expansion, Volume 4 - EnvironmentalAssessment.
Morin, K.A.; Cherry, J.A.; Lim, T.P. and Vivyurka, A.J.(1982). "Contaminant migration in a sand aquifernear an inactive uranium tailings impoundment.Elliot Lake, Ontario". Canadian Geotechnical Jour-nal, 19:1:49-62.
Swanson, S. and Abouguendia, Z. (1981). "The prob-lem of abandoned uranium tailings in northernSaskatchewan: an overview". SaskatchewanResearch Council Publication No. 81, C-805-48-C-81.

2. DEFINITION OF A SAMPLING PROGRAM
2.1 OBJECTIVESThe overall objective of a sampling program at auranium tailings impoundment is to effectivelycharacterize the appropriate components of thephysical and chemical environment in and aroundthe impoundment. This characterization could beintended to fulfill regulatory requirements regardingthe potential environmental impact of the tailingsimpoundment, to provide a basis for the design ofremedial measures or reclamation programs, or tocontribute to basic research on uranium tailings. Theimportant components of the physical and chemicalenvironment of the tailings impoundment include:
-physical, chemical, mineralogical and radi-ological characteristics of the tailings solids;
- chemical and radiological characteristics ofthe tailings porewater;
- physical, chemical and radiological character-istics of surface water flow from, and seepageout of, the tailings impoundment;
- hydrogeological conditions within and aroundthe tailings impoundment and the charac-teristics of exfiltration out of the tailings;
- air quality and meteorological conditions overand around the tailings impoundment.
The tailings solids and tailings porewater are thesources for potential chemical and radiological con-tamination, and as described in Section 1.3, surfacewater flow, seepage, exfiltration, wind-blown dust andradon exhalation are the potential pathways for themovement of contaminants out of the tailingsimpoundment.
2.2 SCOPEThe overall scope or level of effort applied to a sam-pling program for a uranium tailings imDoundmentdepends primarily on the purpose cf the samplingprogram. Sampling programs intended to contributeto basic tailings research or to provide a basis for thedesign of remedial or reclamation programs may begenerally more detailed and extensive than samplingprograms intended to fulfill monitoring requirementsfor regulatory agencies.
As noted in the preceeding discussions, there is awide variation in the character of uranium tailingsimpoundments and the nature of environmental con-cerns, and consequently sampling programs mustgenerally be designed to be site-specific. The de-tailed scope of a sampling program will depend onthe nature and complexity of the physical and chemi-cal environment in and around the tailings impound-ment, and the nature and severity of the potentialenvironmental concerns. For example, a tailingsimpoundment into which tailings have been dis-charged from several locations around the impound-ment may require more extensive sampling to char-acterize the impoundment compared to an impound-ment into which tailings were deposited from a singlelocation. Similarly, a sampling program for a tailingsimpoundment which is partially submerged or vege-tated may not emphasize the sampling of wind-blowndust as may a sampling program for a dry unvege-tated impoundment.
More detailed discussions regarding the scope of asampling program are found in the following chapterswhich relate to the different components of a sam-pling program.

3. PRELIMINARY DATA COLLECTIONThe initial step in the design and implementation of asampling program is the collection of all applicablebackground data regarding the uranium tailingsimpoundment. These data include information on thephysical, chemical, hydrologic, meteorological andoperational aspects of the tailings impoundment andcan be obtained from a variety of sources such asmine-mill records and personnel, aerial photographs,and government records. The various types and pos-sible sources for these background data are sum-marized in Table 3.1.
These data are used for the design of a samplingprogram and the evaluation of the results of a sam-pling program. For example, information on the depo-sitional history of a tailings impoundment operated inthe 1950's is generally not included in the mine-millrecords. In the absence of recorded data on informa-
tion such PS this, interviews with past mine-mill per-sonnel and archival aerial photographs can be usefulto provide this information. Information such as thetailings discharge locations and consequently ap-proximate delineation of the areas of coarse- andfine-grained tailings is valuable in the selection oftailings sampling locations and the selection of sam-pling methods.
At the present time, CANMET is sponsoring thedevelopment of a computer database for uraniummine tailings. The database will be named CANUT(Canadian Uranium Tailings) and will ultimatelyinclude operational history and results of water, soiland biological sampling at uranium tailings impound-ments in Canada. This database, when developed,will be extremely valuable for the collection of much ofthe noted background data.
Table 3.1 - Types and sources of background data
Type Source
1. Physical and Chemical
(a) Present topography of tailings and surrounding area
(b) Topography underlying tailings area
(c) Local and regional geological conditions of overburdenand bedrock
(d) Chemical composition and mineralogy of the ore.
Mine-Mill recordsGovernment mappingRecent aerial photographs
Mine-Mill recordsGovernment mappingArchival aerial photographs
Mine recordsExploration drilling and mappingGovernment mapping
Mine-Mill recordsPublished research
(a) Local and regional hydrologic data on drainage patterns,sireamflow, runoff, lake levels, precipitation, evapotrans-piration, water quality
(b) Local and regional hydrogeological data on groundwaterlevels, groundwater quality and uses.
3. Meteorological
(a| Climatic records on temperature, windspeed and winddirection
(b) Air quality and dustfall.
4. Operational
(a) Present and past milling and extraction processes. Inparticular: ore grade, reagents used, production rates,effluent treatment
(b) History of tailings deposition. In particular: dischargelocations, spills, revegetation, surface treatment
(c) Physical jnd chemical character of tailings dischargeand decant.
Government recordsMine-Mill records
Government recordsExploration drillingMine-Mill records
Government recordsMine-Mill records
Government recordsMine-Mill records
Mine-Mill recordsPresent and past mine-mill personnel
Mine-Mill recordsPresent and past mine-mill personnelArchival aerial photographs
Mine-Mil) recordsGovernment recordsPresent and past mine-mill personnel

4. TAILINGS SOLIDS
4.1 OBJECTIVESThe overall objective of tailings solids sampling is tocharacterize the physical and chemical properties ofthe tailings solids. The properties of the tailings solidswill influence:
- quantity and quality of surface water runoff;- quantity and quality of seepage and exfiltra-
tion;- quantity and quality of wind-blown dust;- radon exhalation.
The tailings solids provide the principal source forpotential chemical and radiological contaminationbut also provide important controls on the pathwaysby which contaminants can exit tailings impound-ments.
The physical properties of the tailings solids such asgrain size and permeability will influence the quantityof surface water runoff, seepage and exfiltration fromthe tailings impoundments. For example, in an areaof a tailings impoundment with silty tailings of rela-tively low permeability (10'6 cm/s or less), seepageand exfiltration out of the impoundment will berestricted while surface water runoff from the im-poundment will be enhanced compared to thoseareas characterized by highly permeable sandy tail-ings (10"4 cm/s or greater). The grain size of thetailings solids will influence the quantity of wind-blown dust removed from the tailings impoundment.Fine-grained tailings particles may be more readilyremoved from the surface of the tailings unless theyremain wet and/or form a crust. The grain size andwater retention characteristics of the tailings solidswill influence the degree of radon exhalation from thetailings impoundments, because radon exhalation isinhibited in wet, fine-grained tailings. In addition,physical properties such as density and shearstrength of the tailings are important in the considera-tion of future settlement of the tailings and/or theoverall stability of the tailings impoundments.
Although the chemical quality of surface water runoff,seepage and exfiltration from tailings impoundmentsis influenced by the chemical composition of the liq-uid mill effluent, it may also be strongly influenced bychemical reactions which occur in the tailings due tothe chemical and mineralogical nature of the tailingssolids.
For example, in chemically unbuffered (low acid neu-tralization capacity) tailings which contain significantconcentrations of sulfide minerals (high acid genera-tion capacity), sulfide mineral oxidation can occurclose to the surface of tailings. These conditions maybe reflected in poor quality runoff, seepage andexfiltration from tailings impoundments.The chemical composition of the tailings solids is alsoreflected in the chemical composition of wind-blown
dust removed from the tailings impoundment. Theradionuclide activities in the tailings solids and anyresultant wind-blown dust are of particular concern.Similarly, the radium-226 activity of the tailingsstrongly influences the potential radon exhalationfrom fre tailings impoundment. Higher radium-226activities increase potential radon exhalation.
The following discussions consider equipment andprocedures for sampling tailings solids to determinetheir principal physical and chemical properties.General geophysical techniques which might beused to determine characteristics such as the thick-ness and volume of tailings in an impoundment arenot discussed in this manual. Details of the principlesand application of geophysical techniques in subsur-face investigations are found in Telford et al. (1976).Similarly, sophisticated sampling and testing pro-cedures for an assessment of the susceptibility oftailings to liquefaction are not considered in this man-ual. Such test procedures are described in AmericanSociety of Civil Engineers (ASCE) (1981) and (1982).Lastly, the sampling of natural soils or the bedrockbeneath a tailings impoundment is not discussed inthis manual.
A general overview of designing subsurface inves-tigations, field investigation methods and reporting isgiven by ASCE (1976). Detailed subsurface inves-tigation methods are reviewed by Naval FacilitiesEngineering Command (NAVFAC) (1982) and U.S.Department of the Interior (1974).
4.2 SELECTION OF SAMPLING LOCATIONSLocations for the sampling of tailings solids should beselected in order that the samples are representativeof the conditions within the tailings impoundment.The sampling locations must be distributed bothareally and vertically throughout the tailings im-poundment to allow adequate definition of the spatialvariability in the character of the tailings solids. Tail-ings are generally discharged to the impoundmentsas a slurry of low solids density (less than 50 per cent)and may thus undergo considerable segregation dur-ing deposition. The coarser grained sandy tailingsare generally deposited close to the point of dis-charge whereas the finer grained silty tailings areusually deposited away from the discharge. In addi-tion, at any given location within the tailings there maybe considerable interlayering of sandy and silty tail-ings as depositional conditions vary. Depositionalconditions may vary as a result of changes in the rateof the tailings discharge and changes in the locationof the tailings discharge points. Depositional condi-tions will also vary considerably between winter andsummer. Consequently, the character of the tailingssolids will be spatially heterogeneous.

Sampling programs for surficial soils are often basedon the selection of sampling locations according to asystematic sampling grid (Black, 1965). Samplingbased on a systematic grid involves the collection ofsamples at a relatively large number of regularlyspaced sampling locations, and generally ensuresrepresentative sampling coverage. However, thelarge size of most tailings impoundments and therelatively high cost of collecting tailings solids sam-ples from depth generally preclude the use of suchsystematic grids, and necessitate the judiciousselection of sampling locations according to theanticipated conditions. Although the tailings are spa-tially heterogeneous, the variability is to some extentpredictable if the history of tailings deposition isknown. If this is the case, representative samplinglocations can be selected relatively easily.
When the history of deposition at a tailings impound-ment is not precisely known, a phased approach to aninvestigation may be desirable (ASCE, 1976). In thefirst stage, a number of widely spaced simple explo-ratory borings can be made in which 'disturbed' sam-ples are obtained. Based upon the results of theseborings, additional borings can be made between theinitial borings to define the conditions in better detail.Samples in these additional borings could also be'disturbed' or 'undisturbed', and could be taken con-tinuously or at selected intervals. In general, sam-pling is most commonly performed at 0.75 or 1.5 mintervals of depth.
If soil conditions in a given area are well known andthe stratification is simple with fairly thick individualstrata of consistent physical properties, relativelywidely spaced borings may be sufficient. If, however,soil conditions vary appreciably from place to place,more closely spaced borings could be required(ASCE, 1976). The number and spacing of boreholesmust be determined by judgement as the work pro-gresses. There should be a sufficient number todetermine the stratification and interlayering of thevarious sized tailings solids. However, it should beemphasized that whereas relatively extensive inves-tigation and testing might be appropriate where thesubsurface conditions vary systematically, suchextensive work may not be justified when the tailingsvary erratically. In this situation, the investigationshould concentrate on areas of the tailings impound-ment which provide a conservative estimate of theitem under investigation. This could include boringsat each end of the basin but relatively few in-between.
Above all, it must be remembered that the validity ofinvestigations carried out in laboratory tests restssolely on the quality of the samples and on how farthey are representative of the stratum from which theyare taken. An elaborate testing technique cannotcompensate for the disturbance caused by sampling,transport and storage of the samples. Sampling tech-
nique and degree of sample disturbance are oftenquestions of cost. The cost for a sample with a 125mm diameter is in general three to four times higherthan that for a 75 mm sample (Broms, 1980). Costsincrease approximately with the square of the diame-ter. The quality of the samples must be related to therequired accuracy of the results. In many cases, onlya rough estimate is required of shear strength, com-pressibility or permeability and the maximum size ofsample for tailings sampling is usually restricted to75 mm.
An example of the selection of tailings sampling loca-tions at a hypothetical tailings impoundment is illus-trated in Fig. 4.1. Tailings were deposited at thisimpoundment in two stages, initially from the nortiiside of the impoundment and subsequently from thewest end. This discharge scheme resulted in deposi-tion of recent sandy tailings at the west side, and oidsilty tailings underlying recent silty tailings at the eastside. The old tailings and recent tailings may bedifferent in character due to different ore grades, millprocesses or weathering. The sandy tailings and siltytailings can differ considerably in physical and chemi-cal character. Consequently, representative tailingssampling locations should be situated in each ofthese different areas to characterize the varioustypes of tailings present in the impoundment.
Geostatistical methods such as those used in themineral exploration and ore reserve estimation fieldswould, in most cases, be of limited application toinvestigations of tailings impoundments. The basictool of geostatistical methods is the variogram. Thevariogram relates the distance between samples to ameasure of the spatial variation in a specified param-eter. The examination of variograms of, for example,metal content in an ore deposit as developed from theresults cf a preliminary exploration drilling program,may be useful in characterizing the variation or anydirectionality (anisotropy) in the variation of the metalcontent. Such information on the variation or direc-tionality in the variation could be used to determinethe drillhole spacings and patterns required to furtherdetail the ore deposit most effectively. Details of theuse of variograms in ore reserve estimation are pro-vided by David (1977).
The use of variograms is of most benefit in situationswhere there is little prior knowledge or understandingof the factors controlling the spatial variability of aparameter. With regard to uranium tailings, there isgenerally a reasonable degree of prior knowledge somuch of the information gained from the geosta-tistical methods may be already known. In addition,the development of appropriate variograms doesrequire a considerable amount of data, whichalthough relatively small in terms of an intensive min-eral exploration program, may be substantial relativeto a tailings investigation program.

OLD TAILINGS DISCHARGE POINT
OLD SANDY TAILINGSRECENT TAILINGS
DISCHARGE POINT
A
A T l V f SAMPLINGLOCATIONS
RECENT SANDY /TAILINGS RECENT SILTY
TAILINGSDECANT
TAILINGS AREA - PLAN VIEW
RECENT SANDY RECENT SILTY
OLD SILTY TAILINGS
TAILINGS AREA-SECTION VIEW
Fig. 4.1 - Example of selection of sampling locations at a tailings impoundment

4.3 PHYSICAL CHARACTERIZATION4.3.1 ParametersA variety of parameters are important for the physicalcharacterization of tailings solids. These parametersinclude: grain size, water content, density and shearstrength and may be determined in situ or from tail-ings samples collected in the field and tested in thelaboratory. Table 4.1 summarizes the parameters forphysical characterization, the type of testing, and theimportance of the various parameters.
As shown in Table 4.1, the grain size and watercontent of the tailings solids will influence a largenumber of factors within the tailings impoundment.Because of the importance cf these parameters, asampling program should characterize both the arealand vertical variations (tailings stratigraphy) of theseparameters. Tailings grain si;:e is readily determinedfrom visual examination and laboratory tests on rep-resentative samples of tailings solids, and is normallyincluded in most investigations of tailings impound-ments. Parameters such as density and shearstrength of the tailings solids are important for inves-tigations which consider potential settlement or sta-bility of tns tailings.
In logging soils, the basic group to which they belongshould be determined (e.g., sand, silt, etc.). Adjec-tives describing the tailings in greater detail such as,consistency, colour, odour, shape of grains wherevisible, and other factors should also be noted(ASCE, 1976; ASTM, 1983: D2488-69). Since tail-ings are hydraulically deposited in the tailingsimpoundments, stratification of the fine-grained andcoarse-grained tailings often occur?. This stratifica-tion can significantly affect the permeability of a tail-ings deposit and should always be recorded, if pres-ent. Stratification is usually visible in undisturbed orsplit-spoon samples of coarse-grained materials(e.g., sands). In fine-grained soils (silts and clays) theoutside of the sample may be smeared. In this case,portions of the samples should be split with a sharpknife and, if necessary, permitted to dry partially.Finally, it should be noted that a soil description
should cover all soil components contained in thetailings. A driller may sense the presence of gravel,cobbles, boulders, or even rock through the action ofthe drilling tools, but such materials may not berecovered due to the small diameter of the sampler.
4.3.2 Sample Collection Methods
There is a wide variety of techniques available for thecollection of tailings solids samples for the purpose ofphysical and chemical characterization. Althoughsurface grab samples or shallow test pits are some-times used in the qualitative investigation of surfacelayers in a tailings area, borings are the most com-monly used method of investigating the subsurfaceconditions in a tailings area. In making borings, a holeis advanced by drilling. At intervals, the drilling isstopped and samples of the soil beneath the bottomof the drill hole are obtained by driving or pushing asuitable sampling device into the soil. Alternatively,continuous sampling may be used, with drilling onlyas necessary to ream the hole between samplingoperations.
Sample collection methods generally comprise twobasic categories: hand operated and drill rig oper-ated. Hand operated methods are limited to samplingwithin a few metres of the tailings surface. Drill rigoperated sampling methods are normally required forcollection of tailings samples from greater depths.
For both hand operated and drill rig operated sam-pling methods, there are different methods availablefor the collection of different types of samplesdepending on the testing requirements. Thick-walledsamplers will be suitable for obtaining 'disturbed'tailings samples for identification and index propertytests and for determining the relative density of thetailings. However, tailings solids samples collectedfor the determination of physical parameters such asshear strength, and chemical parameters require rel-ativeiy undisturbed samples which can be suitablypreserved to avoid changes in the character of thesample. Only certain sample collection methodsrecover this type of sample. The various sample col-
Table 4.1 - Parameters for physical characterization of tailings solids
Parameter
Grain size
Water Content
Density
Shear Strength
Type of Test
— Field examination— Laboratory
— Laboratory— In situ
— Laboratory— In situ
— Laboratory— In situ
Importance
— Grain size of tailings will affect many factors intailings areas such as hydraulic conductivity ofthe tailings, radon exhalation, wind-blown dust,chemical reactions.
— Water contenl of tailings will affect radonexhalation, wind-blown dust, oxygenpenetration into tailings which is important topyrite oxidation.
— In situ density will affect tailings settlement andstability.
—- In situ shear strength will affect tailing stability.

lection methods together with their applications andlimitations are described in Table 4.2. Details of thesesample collection methods are found in the refer-ences noted in Table 4.2.
Hand operated tailings sampling methods are nor-mally used where samples are required only fromshallow depths, or the tailings impoundment is inac-cessible to heavy machinery such as drill rigs. Of the
Table 4.2 - Tailings solids sampling techniques
Technique Application Limitations Reference
Hand Operated (Shallow)
1) Surface grab
2) Hand augers
Preliminary examination ortailings surface surveys
Collection of samples forgeneral characterization.
3) Hand piston sampler — Collection of samples tordetailed characterization.Samples are less disturbedthan auger samples. Samplescan be retained in samplingtubes.
4) Thin-walled tubesampler
5) Gravity core sampler(Benthos, Alpine.Phleger)
- Collection ol samples fordetailed physical andchemical testing. Samplesretained and readily preservedin sampling tube. Long,continuous, relativelyundisturbed samples can beobtained.
Collection of tailings sampleswhich are submerged beneathsurface water bodies.
Drill Rig Operated (Deep)
1) Split-spoon sampler — Collection of samples for fieldcharacterization
— Collection of undisturbedsamples for detailed physicaland chemical testing.Samples retained in samplingtube and readily preserved.
•— Same as Shelby tube samplerbut piston prevents any entryof tailings until propersampling depth is reached.
— Collection of long (up fo10 m). continuous, relativelyundisturbed cores. Samplesretained in sampling tubes.
— Ideal for examination oftailings stratigraphy.
2) Shelby tube sampler
3) Piston sampler
4) Long thin-walledtube sampler
- Samples will not representdeeper conditions due toeffects of erosion, leaching,weathering.
- Samples are highly disturbed 0 ) ( 2 )and more difficult to preserve.Generally limited to abovewaler table.
• Samples are relatively short in (1)length, cannot be examined hthe field if preserved insampling tubes.
Cannot be examined in the (3)field if preserved in samplingtubes.
• Generally limited to depthsless than 5 m.
- Cannot be examined in the (4)field if preserved in samplingtubes.
Samples relatively short inlength.
— Samples relatively disturbed. (1) (5)
— Samples are relatively short in (1) (6)length. (Typically 0.75 m).Only ends can be examined inthe field if preserved insampling tubes.
— Samples are relatively short in (1) (6)length. (Typically 0.75 m).Only ends can be examined inthe field if preserved insampling tubes.
— Long cores are awkward io (7)handle and transport.
— Samples may not besufficiently undisturbed fordetailed physical lesting.
References1) Acker (1974)2) ASTM Volume 04.08: D1452-803) Patterson et al. (1978)4) Environment Canada (1983)5) ASTM Volume 04.08: D1586-676) ASTM Volume 04.08: D1587-747) Personal Communication, Mr. J. Hayes. Site Investigations Limited, Peterborough. Ontario.
10

hand operated techniques shown in Table 4.2, handpiston samplers and thin-walled tube samplers aremost applicable to detailed investigation of tailingsimpoundments. Hand operated piston samplers aresimilar to drill rig operated piston samplers and arediscussed later in this section. Thin-walled tube sam-pling involves the advance of tubing (normally alumi-num) using a hammer or drive weight. The tubing isadvanced to the desired depth, sealed with a pistonto retain the tailings in the tube and removed using aportable tripod and winch. The configuration of thisequipment is shown in Fig. 4.2. Long thin-walled tubesamples (as long as 3 m) can be cut to more man-ageable lengths in the field using pipe cutters.
PISTON LINE
DRIVE WEIGHT
TRIPOD
VALVE ASSEMBLY
DRIVE WEIGHTS
CORE TUBE
„ CORE TUBE— DRIVE SHOE
Fig. 4.2 — Manually operated thin-walled tube sampling equipment Fig. 4.3—Benthos gravity core sampler for collection of submergedtailings samples
Manually operated gravity core samplers such as theBenthos, Alpine or Phleger samplers can be used tocollect tailings core samples submerged beneathsurface water bodies. These samplers are advancedinto the tailings by their own weight and can be readilyoperated from a small boat or raft. A Benthos sampleris shown in Fig. 4.3.
Drill rig operated tailings sampling methods areused where samples are required from depthsgreater than several metres. Small diameter (7.5 to10 cm O.D.) solid stem augers can be used above thewater table if the tailings being sampled are not soloose or dry that they collapse into the borehole.Tailings sampling methods usually require a drill rigwhich can advance hollow drill string or casing,
because boreholes extended below the water tabledo not stand open sufficiently to allow tailings sam-pling. This same consideration applies for theinstallation of piezometers in tailings. Hollow stemauger drilling orwash boring methods in which casingis advanced allow the use of the various tailingssampling techniques described in Table 4.2. Thesedrilling methods and equipment are described byAcker (1974), and specific procedures for split-spoon, Shelby tube and piston sampling aredescribed in ASTM (1983) Volume 04.08: Designa-tions D1586-67 and D1587-74.
A split-spoon sampler is shown in Fig. 4.4. Thesampler is a thick-walled sampler mounted on drillrods and extended down through hollow stem augers
11

or drill casing to the desired depth in the tailings. Thesampler is advanced by hammer into the tailings tocollect the tailings sample (see Section 4.3.5) Onrecovery of the sampler, the tube of the split-spoon issplit and the sample is removed. Split-spoon samplesare relatively disturbed and cannot be adequatelypreserved when the tailings are chemically unstable.In addition, it is sometimes necessary to use a sam-ple retainer in the shoe of the sampler to prevent theloss of the tailings samples.
soft or loose deposits and are not suitable for hard,dense or gravelly soil. However, taking good qualityundisturbed samples in even soft tailings requires theuse of a thin-walled sampler with proper clearance atthe cutting edge. The sampler should have an arearatio, as defined by Hvorslev (1949), not exceeding10 per cent. To meet this requirement, the wall thick-ness plus relief of the cutting edge of the samplershould not exceed 1.9 mm for a 76 mm diametersampler (See Fig. 4.7). It is extremely important tonote that the cutting edge of the sampler must besharpened and not simply rolled in.
B
—THREADED CONNECTIONTO DRILL ROD
BALL CHECK
SPLIT TUBE
-̂
•
1
SAND TRAP
- HARDENED SHOE
Fig. 4.4 - Details of spiit-spoon sampler (sand (rap may be requiredfor cohesionless tailings)
The operation of thin-walled Shelby tube and fixedpiston samplers are shown in Fig. 4.5 and 4.6 respec-tively. These samplers are also operated on drill rodsthrough hollow stem augers or drill casings but arenormally advanced hydraulically or manually pushedinto the tailings to minimize disturbance of the sam-ple. Thin-walled samplers will only work in relatively
DRILL ROD
— BOREHOLE
SAMPLERHE ACT)
SAMPLINGTUBE
Fig. 4.5 - Operation of thin-walled Shelby lube samplerA. Lowering of tube Jo bottom of boreholeB. Pushing of lube into formation
In the case of the piston sampler, the fixed pistonprevents any material from entering the sampler as itis extended down through the augers or casing andhelps minimize disturbance during sampling. Forsampling, the piston remains stationary and the thin-walled barrel is advanced into the tailings. The tail-ings samples are retained within the Shelby tube andpiston sampler tubes, although due to the usualcohesionless nature of tailings it may often be neces-sary to wait up to 15 minutes after the sampler hasbeen advanced to allow the sample to set up withinthe sampling tube. In addition, extreme care isrequired not to jar the sampler while pulling it back upthe hollow stem augers or casing. However, whenrecovered, such samples are relatively undisturbed
12

Jl
m
DRILL ROD -
- BOREHOLE —
- SAMPLER -HEAD
PISTONROD
PISTON —
-SAMPLINGTUBE
Fig. 4.6 - Operation of fixed piston thin-walled tube samplerA. Lowering of tube to bottom of borehole. Piston prevents for-
eign material from entering sampling tube until sampler isactivated
B. Pushing of tube into formalion
and can be readily preserved. Sample handling andpreservation are described in Section 4.3.3.
Hydraulic piston samplers (Osterberg samplers)have been used in Europe for sampling silts and claysbut have not been widely used for tailings sampling,probably due to the difficulty in obtaining adequatehydraulic capacity on most drill rigs to properly acti-vate the sampler.
Long thin-walled tube sampling using a drill rig iscomparable to hand operated thin-walled tube sam-pling. This type of sampling is applicable when longcontinuous cores of tailings are required, such as fordetailed examination of the tailings stratigraphy. Longthin-walled tube samples can be cut into more man-ageable lengths in the field using pipe cutters.
4.3.3 Sample Handling and PreservationMethods
Suitable handling and preservation methods arerequired for the collection of tailings solids samples inorder to avoid changes in the character of the sam-ples between the time the samples are collected andanalysed. For physical testing of tailings solids sam-
ples, the primary concern is the prevention of mois-ture loss from the samples. Moisture loss from dis-turbed samples collected using hand augers or split-spoon samplers can be controlled by retention of thesamples in plastic bags or preferably glass jars. Sam-ple containers should be filled so as to exclude asmuch air as possible and should be tightly sealed.
Moisture loss from undisturbed samples which areretained in their original sampling tubes can be con-trolled effectively by sealing the samples into thesampling tubes using paraffin or epoxy sealants anacaps. In situations where there is less than total sam-ple recovery (i.e., the sampling tube is not completelyfilled), paraffin or epoxy sealants should be used to fillthe empty portions of the tube in order to contain thesample with no air space.
In all cases, it is preferable to conduct detailed geo-technical analyses of the samples as soon as possi-ble following collection to minimize possible changesin the character of the sample. Maximum recom-mended sample storage times for disturbed samplesrange from several days for plastic bags to severalmonths for glass jars. Undisturbed samples in Shelbytubes should not be stored for longer than severalweeks.
Because of the generally corrosive nature of tailingsand tailings porewater, sampling tubes should haveresistant plastic liners or be constructed of relativelyresistant metals such as aluminum, coated steel orstainless steel. The selection of sampling tubes of aparticular construction will depend on the samplecollection method used and the physical and chemi-cal nature of the tailings. Special considerations forthe preservation of tailings solids samples for chemi-cal analyses are discussed in Section 4.4.3.
ROLL END
STEP I
REAM WITHPARALLEL SIDED
REAMER
Fig. 4.7 - Details of thin-walled tube sampler cutting-edge
13

4.3.4 Laboratory Analytical Methods
Laboratory analysis of physical parameters such asgrain size, water content, densities and shearstrength of tailings solids can be conducted usingstandard testing methods used for natural soils. Thegrain-size distributions of the tailings solids are deter-mined by sieve and hydrometer tests. Water contentsare determined by weight loss on drying. Standardprocedures for the preparation of soil or tailings sam-ples for laboratory testing are described in ASTM(1983) Volume 04.08: D421-58 and D2217-66. Stan-dard methods of laboratory testing of grain size,water content, density and shear strength aredescribed in ASTM (1983) Volume 04.08: D422-63,D2216-80, D1557-78, and D3080-73 respectively.The drained or undrained shear strength of the tail-ings can be assessed by triaxial tests on carefullytrimmed specimens of undisturbed samples. Onloose tailings, sample disturbance can be a signifi-cant problem.
There are, however, special considerations for thelaboratory testing of uranium tailings solids. The ra-dioactivity of the tailings and emanation of radon gasfrom the tailings necessitates adequate dust controland ventilation in the testing laboratory to preventingestion or inhalation of radioactive materials. Tail-ings samples should also be handled using rubbergloves due to the chemically corrosive nature of tail-ings and tailings porewater.
4.3.5 In Situ Testing
Various in situ testing techniques are available for thedetermination of physical properties of tailings suchas water content, density and shear strength. In con-cept, in situ testing of physical properties should bepreferable to laboratory testing because the diffi-culties of sample disturbance during collection andhandling are avoided. In reality, however, most in situtesting techniques have significant limitations whichmust be considered. The various in situ testing tec.vniques are listed in Table 4.3. Details regardingthese techniques are found in the references noted inTable 4.3.
The in situ water content of tailings can be deter-mined using nuclear moisture testing methods. Theconfiguration of typical nuclear moisture testingequipment is shown in Fig. 4.8. The nuclear moistureprobe is normally operated inside a borehole casedwith thin-walled aluminum, steel or plastic tubing.The operation of the probe is based on the detectionof the degree of scattering and slowing of high energyneutrons emitted from a radioactive source in theprobe. Water molecules are most effective in themoderation and capture of the emitted neutrons sothat the resultant neutron radiation measured at thedetector is inversely proportional to the water contentof the tailings material surrounding the borehole.
Table 4.3 - Methods for in situ determination of physical parametersof tailings solids
Parameter
1. Water Content
2. Density
3. Shear Strength
References1) Keys and MacCarty (1971)2) Black (1965)3) Mittal and Morgenstern (1975)4) Acker (1974)5) ASTM Volume 04.08: D1586-67
Test Melhou
— Nuclear moisture probe
— Nuclear density probe— Standard penetration test— Cone penetrometer
Common Methods:
— Standard penetration test— Cone penetrometer— Vane shear (est
Specialized Methods:
— Pressuremeter— Borehole Shear— Plate bearing load— Field direct shear
6) Schmertman (1975)7) ASTM Volume 04.08: D3441-798) Arman et al. (1975)9) ASTM Volume 04.08: D2573-72
Reference
d ) (2)
(2) (3)(4) (5)
(4) (6) (7)
(6) (7)(6) (7)(8) (9)
(6)(6)(6)
14

CASING L0G3ING EQUIPMENT
SPACERS -
I • —
D-
•- DETECTOR
il* A-NEUTRONS
RADIOACTIVESOURCE
— -BOREHOLE
Fig. 4.8 - Typical configuration of in situ nuclear moisture lestingequipment
There will also be some degree of neutron scatteringdue to the tailings solids. Large variations in tailingsdensity such as are possible in tailings impound-ments, may be reflected in apparent variations in thewater content of the tailings. Consequently, nuclearmoisture testing methods may not be suitable for theprecise determination of water content in the tailings.Nuclear moisture testing methods are, however,highly suitable for monitoring relative temporal varia-tions in water content because repeated measure-ments can be made at the same locations inboreholes.
Nuclear moisture testing equipment should be cali-brated according to manufacturer's specifications forthe particular borehole casing used and the tailingsdensity.
Nuclear density testing methods are comparable tonuclear moisture testing methods. The configurationof typical nuclear density testing equipment is similarto that shown in Fig. 4.8 with a down-hole radioactivesource and detector. The probe is operated inside aborehole cased with thin-walled aluminum, steel orplastic tubing. The operation of the probe is based onthe detection of the degree of scattering of gammaradiation from the source by the tailings solids sur-rooding the borehole. Nuclear density testing meth-ods have been used successfully in base metal minetailings (Mittal and Morgenstern, 1975), but may beinfluenced by the higher ambient gamma radiation inuranium tailings.
Nuclear density testing equipment should be cali-brated according to manufacturers' specifications forthe particular borehole casing used and the ambientgamma radiation.
Standard penetration tests are performed during col-lection of tailings solids samples from boreholesusing split-spoon sampling. Procedures for standardpenetration tests are described in ASTM (1983) Vol-ume 04.08: D1586-67. The test involves the advanceof a 46 cm long, 5 cm diameter sampler into thetailings using a 63.5 kg hammer. The rate of advanceis expressed as blows per specified incrementaldepth (generally 0.3 m), and reflects the relative den-sity and shear strength of the tailings materials.Higher blow counts represent higher density andstrength.
Experience and some test data indicate that either a2.5 cm extra heavy pipe or an N rod can be used todepths of about 18 m (ASCE, 1976). Below this depthN rods should be used. Care should be taken to makejoints up tight on the drill rod. Any lengths of rodhaving damaged couplings, or which are bent, shouldnot be used. The drill hole in which penetration testsare to be made should not exceed about 9.0 cm indiameter. Larger drill holes significantly affect theresults. The most common sources of error are inad-equately cleaning the boring of all loose material;allowing the base of the borehole to become dis-turbed if the water level in the borehole is significantlybelow that of the water level in the surrounding tail-ings; not maintaining the sampler shoe properlysharpened; and not dropping the sampling hammerfreely through the required distance for a full squareblow. Usually, the hammer is hoisted by a rope over acathead and dropped by slacking the rope. Two turnsof the rope on the cathead is considered the max-imum allowable but one turn is considered preferableto obtain a free fall. Wire lines attached to the hoistingdrum should not be used since it is difficult to obtain afree fall.
Cone penetration testing is comparable to standardpenetration testing but involves the advance of acone-shaped probe while recording blows per incre-mental advance or actually measuring penetrationresistance using a load transducer. Procedures forcone penetration testing are described in ASTM(1983) Volume 04.08; D3441-79. Cone penetrationhas increased in popularity in recent years (Wilsonand Ohya, 1981). The most commonly used cone testis the Dutch cone test. The resistance to penetrationis the sum of point resistance and f rictional resistanceon the sides of the shaft. The more sophisticatedsystems can differentiate between the point and fric-tional components of the resistance, and the ratiobetween frictional and point resistance (FrictionRatio) is one aid in differentiating between varioussoil types. Clean sands generally exhibit very lowratios (low friction component in comparison to pointresistance), while an increase in clay content will
15

usually result in a higher ratio, more often the result ofa reduction in point resistance rather than anincrease in the frictional component (NAVFAC, 1982).
Although the speed of operation of static cone testsallows considerable data to be obtained in a relativelyshort period of time, it should be noted that a majordrawback is that samples are not recovered for log-ging and identification. Cone tests should not there-fore be used in isolation but in combination with bor-ings where they can be used to supplement theexisting borehole data. Sampled borings adjacent tothe cone penetration tests can be used lo calibratethe cone penetration response for further testing.Cone penetration tests are discussed in detail bySangerlat (1972), and in FHA (1977).
Vane shear testing is used for the determination ofthe in situ shear strength of soft fine-grained tailings(slimes), and involves the insertion and rotation of a4-bladed vane in the tailings. The resistance to rota-tion of the vane is related to the shear strength of thetailings. Vane testing can be conducted at differentdepths down a borehole casing or drill string duringdrilling. The configuration of vane shear testingequipment is shown in Fig. 4.9. Procedures for vaneshear testing are described in ASTM (1983) Vol-ume 04.08: D2573-72. Vane tests should not be per-formed if sand layers, gravel, roots or other organicmaterials are believed to be present.
TENSIONHEAD
CASING — TYPICAL VANECONFIGURATION
BOTTOM GUIDE
— VANE
Fig. 4.9 - Vane testing equipment for determination of in situ shear strength
16

Pressuremeter testing is also sometimes used for thedetermination of in situ shear strength or the stress-strain properties of tailings, and involves the expan-sion of an elastic pressuremeter cell in a boreholewhile recording changes in the cell volume withincreasing cell pressure. The relationship betweenthe cell volume change and cell pressure is related tothe shear strength of the tailings materials. Pres-suremeiers have not been widely used in tailingsinvestigations although the new self-boring pres-suremeters (Bagueiin & Jezequel, 1980 and Wroth,1980) which drill their own way through the soft soilbeneath them may be able to produce very highquality test data. However, again no actual soil sam-ples are obtained.
Borehole shear, plate bearing and field direct sheartests are specialized techniques that are not com-monly used to determine the in situ shear strength oftailings.
4.4 CHEMICAL/MINERALOGICALCHARACTERIZATION
4.4.1 Parameters
Laboratory testing for the chemical and rrvneralogicalcharacterization of tailings solids can be categorizedinto two basic types:
1) Chemical analysis - to determine the bulkchemical properties of the tailings solids andinfer the mineralogy;
2) Mineralogical identification and analysis - todetermine the minerals present in the tailingsand the chemical composition of the minerals.
The analyses for the chemical and mineralogical char-acterization of tailings solids are listed in Table 4.4.
The acid generation potential arid the acid neu-tralization potential are important parameters for theassessment of acid generation in tailings impound-ments. The acid generation potential of tailings is afunction of the sulfide mineral content. The oxidationof sulfide minerals (commonly pyrite) in the tailingscan result in the production of sulfuric acid. The abilityof the tailings solids to neutralize the effect of acidproduction, or the acid neutralization capacity, is afunction of the concentration of acid consuming min-erals such as carbonates, oxyhydroxides, alumino-silicates and chemicals added to the tailings.
The cation exchange capacity of the tailings indi-cates the overall ability of the tailings solids to adsorbcations from the tailings porewater. Generally, constit-uents such as heavy metals and various radio-nuclides are preferentially adsorbed on geologicmaterials, and consequently the cation exchangecapacity can be important to the mobility of theseconstituents in tailings impoundments. The analysisof constituents which are water and acid leachablefrom the tailings solids can indicate those constitu-ents which may be mobilized in the tailings impound-ment by the infiltration of precipitation into the tailingsor the movement of acid water from pyrite oxidationthrough the tailings. Total elemental analyses of thetailings solids can be used to infer the bulk miner-alogy of the tailings.
A variety of techniques is used for mineralogical iden-tification and analysis of the tailings. X-ray diffrac-tometry and ore microscopy are used to identify theminerals present in the tailings. Techniques such asSEM-energy dispersive X-ray fluorescence andQuantimet analysis are used to identify the mineralspresent and determine their respective chemicalcompositions.
Table 4.4 - Analyses for chemical /mineralogical characterizationof tailings solids
Chemical Analysis
Acid Generation Potential(sulfide mineral content)
Acid Neutralization Potential
Cation Exchange Capacity
Water Leachable Constituents(i.e.. sulfate)
Acid Leachable Constituents(i.e.. iron, manganese, carbonate)
Total Elemental Analysis
Mineralogical Identification and Analysis
X-ray Diffractometry
Ore Microscopy
SEM-Energy Dispersive X-ray Fluorescence
Quantimet Analysis
17

4.4.2 Sample Collection Methods
The collection of tailings solids samples for chemicaland mineralogical characterization is generally con-ducted in conjunction with the collection of samplesfor physical characterization. The possible samplecollection methods discussed in Section 4.3.2 arealso applicable to chemical sampling depending onthe chemical and mineralogical nature of the tailingsand tailings porewater. In most cases, for the collec-tion of tailings solids samples for chemical analyses,it is necessary to use Shelby tube or thin-walled tubesampling methods to recover relatively undisturbedsamples which can be effectively sealed to preventmoisture loss and exposure to the atmosphere.
The loss of moisture from tailings solids samples canresult in the precipitation of mineral phases from thetailings porewater and significant changes in thechemical and mineralogical composition of the tail-ings solids. Tailings solids samples which containsignificant concentrations of sulfide minerals or fer-rous iron in the porewater can undergo significantoxidation when exposed to the atmosphere duringsampling and storage. The oxidation of sulfide miner-als or ferrous iron in the tailings samples will result inthe generation of acid in the tailings solids sampleswhich can significantly alter the chemical and miner-alogical composition of the tailings.
4.4.3 Sample Handling and PreservationMethods
As discussed in the preceding section, tailings solidssamples for chemical and mineralogical analyses aregenerally collected using methods which enable theretention of the samples directly in the samplingtubes. In order to prevent moisture loss and exposureto the atmosphere, the tailings samples are sealedinto the sampling tubes using plastic caps or rubberplugs sealed with paraffin wax or epoxy. The samplesshould be stored at 4°C to inhibit chemical reactionsin the samples. Samples which are anticipated to behighly chemically unstable or which need to be stored(or long periods of time before analysis can be frozen.Freezing may, however, affect physical parameterssuch as shear strength. The tailings solids samplesshould remain sealed and appropriately stored untilanalyses are performed. In all cases it is preferable toconduct analyses as soon as possible to minimizestorage times and the possibility of chemicalchanges.
4.4.4 Laboratory Analytical Methods
The chemical and mineralogical analysis of uraniumtailings solids can generally be conducted usingstandard analytical methods for soils and rocks.These methods are described by Black (1965),Donaldson (1980) and Johnson and Maxwell (1981).Analysis for the determination of acid producingpotential is described by Duncan (1972).
4.5 RADIOLOGICAL CHARACTERIZATION4.5.1 Parameters
Members of the uranium-238 radioactive decayseries will be present in the tailings. The decay chainheaded by uranium-235 will also be present but inenvironmentally insignificant quantities because ofits low abundance (0.7%) in natural uranium. Also,natural thorium (thorium-232) and its decay productsmay be present in amounts depending on the miner-alogy of the ore mined. The uranium-238 and tho-rium-232 decay chains are shown in Appendix A.
The radionuclides in these decay chains do not allhave the same potential environmental effects. Theirspecific activity in tailings material, half-lives, modeand energy of radioactive decay, and their mobilitythrough the environment are a few of the many fac-tors that affect their potential impact. Table 4.5 liststhe major radionuclides that should be measured inassessing the radiological characteristics of tailingssolids. Because of the insensitivity and general inac-curacy of gross radioactivity measurements (grossalpha or beta) of collected samples, such measure-ments are not recommended for the radiologicalcharacterization of tailings solids other than perhapsas a screening technique.
4.5.2 In Situ Testing
The major techniques used for the in situ determina-tion of the radiological character of uranium tailingsare surface radiation surveys and subsurface gammaprobes.
Surface radiation surveys are carried out using porta-ble beta gamma sensitive radiation meters that incor-porate either a scintillation or ionization tube detector.The response of the meter is measured either incounts per minute, or Gray (Gy) or Coulomb per kilo-gram (C kg) per hour. Typically, the meter is heldapproximately 1 m from the ground and the area to besurveyed is traversed on a grid. Background mea-surements at locations away from known sources ofcontamination are also recorded for purposes ofcomparison. The survey instruments usually respondto the total ambient radiation field but instrumentscapable of energy discrimination are available thatrespond only to radiation from the natural uraniumchain or tho.ium chain or potassium (potassium-40)radionuclides.Subsurface gamma surveys involve lowering agamma detector down a borehole and recording thegamma field at various depths. This is done eithermanually or automatically with a motor-driven raisingand lowering device and a chart recorder. This tech-nique is valuable in determining the vertical variabilityof radioactive constituents in the tailings.
4.5.3 Sample Collection MethodsSample collection methods are generally similar tothe methods used in collecting samples for chemical
18

Table 4.5 - Parameters for radiological characterizationof tailings solids
Parameter
Uranium Decay Series
Thorium Decay Series
Gross gamma
Natural uraniumThorium-230Radium-226Lead-210Polonium-210
Thorium-232 (natural thorium)'Radium-228"ThOiium-228"Radium-224
'Not generally important unless significant concentrations ot thorium-232 are present in the tailings.
analyses (see Section 4.3.2). As usual, the samplesshould be selected to be as representative as possi-ble of the area under study. While gross sample sizesof 100 to 200 g are sufficient for complete radio-nuclide analyses, it may be desirable to collect largersamples which could be split for archival or qualitycontrol purposes. It is often very important to knowthe grain-size distribution of the radionuclides on thesurface tailings material. This is because the inhala-tion of suspended uranium tailings particulate mattercan be an important radiation exposure pathway andspecific radioactivity (radioactivity per unit mass) ishighly dependent on particle size. Measurements onElliot Lake tailings taken from the Elliot Lake Environ-mental Assessment (James F. MacLaren Ltd., 1978)are shown in Table 4.6 and indicate that specificactivity tends to be highest in the smallest particlesize range (<38 |xm). For these reasons, sufficientsurface material should be collected to enable repre-sentative radionuclide determinations in each of theselected particle size ranges.
4.5.4 Sample Handling and PreservationMethods
Sample handling and preservation methods are iden-tical to those used for chemical characterization (seeSection 4.3.3). The containers should be suitablyidentified to indicate their radioactive nature.
Of the radionuclides shown in Table 4.5, polo-nium-210 has the shortest half-life of 138 days.Unless lead-210 and polonium-210 are assumed tobe in secular equilibrium, the time between samplecollection and analysis should be kept as short aspossible, preferably less than 30 days. A correctionfor the decay of polonium-210 can be calculated ifsampling and analysis dates and lead-210 con-centrations (the grandparent of polonium-210) areknown. However, a lengthy sampling-analysis delaygreatly reduces the accuracy of this correction.
It is also important to keep tailings samples tightlysealed in their containers or sampling tubes to pre-vent the loss of radon gas and the consequent loss ofradon daughters from the samples.
4.5.5 Laboratory Analytical Methods
Radionuclide analyses generally involve chemicalseparations followed by the counting of radiations(alpha, beta or gamma) specific to the radionuclidebeing analysed using energy discriminating countingsystems. Details of standard techniques may befound in Smithson et al. (1978). (Note: A revised man-ual on the techniques for radionuclide analyses isbeing prepared, under contract with NUTP, and willbe available in 1985.)
4.6 QUALITY ASSURANCE FOR SOLIDSSAMPLING
A soil sample may be disturbed at any time betweenthe point of sampling and the time at which ii isextruded (ASCE, 1976). Some of the more importantareas of concern are:
1) During drilling of the borehole- Inadequate clearing of the borehole. The
depth to which the borehole is cleanedshould be regularly checked with a sound-ing tape;
-Failure to maintain sufficient hydrostatichead within the boring. In sands the waterlevel in the borehole should, if at all possi-ble, be maintained above the piezometriclevel of the formation being sampled, or thesoil at the bottom of the borehole may beloosened;
- Using too large a pump which could loosenthe soil at the base of the borehole.
2) During sampling- Excessively thick-walled samplers;- Excessive vibration.
3) During recovery of the sample- Undisturbed samples should not be jarred
or tapped.
4) During transport of the samples to the labora-tory- Samples for detailed geotechnical testing
should not be allowed to freeze;
19

Table 4.6 - Tailings radionuclide analysis by size class
Location
Stanrock(Inactive)
Nordic(Inactive)
Long Lake(Active)
Quirke(Active)
Radioisotope
Lead-210Polonium-210Radium-226Radium-228Thonum-228Thorium-230Thorium-232Uranium-234Uranium-235Uranium-238Uranium ('Naturar-measured as pig g)
Lead-210Polonium-210Radium-226Radium-228Thorium-228Thorium-230Thorium-232Uranium-234Uranium-235Uranium-238Uranium ('Natural-measured as ng'g)
Lead-210Polonium-210Radium-226Radium-228Thorium-228Thorium-230Thorium-232Uranium-234Uranium-235Uranium-238Uranium ('Natural-measured as (ig'g)
Lead-210Polonium-210Radium-226Radium-228Thorium-228Thorium-230Thorium-232Uranium-234Uranium-235Uranium-238Uranium ('Natural'-rneasured as ng/g)
Results given as Bq g except where noted
•212
_
—0.67—
0.0560.110.026———
5
—3.7—
0.221.10.096———
11
—2.1—
0.0890.630.0850.410.0120.30—
_—
1.0—
0.161.40.110.290.0100.21—
70
150-212
_
—1.7—
0.180.480.0850.18——
9
—2.0—
0.120.590.044———
9
—1.9—
0.160.480.067———
22
—9.25—
0.0930.590.078———
60
Tyler Sieve Series100 140
Particle Size (jim)
106-150
_
—0.67—
0.320.700.21———
10
—1.3—
0.210.890.096———
11
—0.89—
0.100.670.096———
38
—0.52—
0.191.70.13———
48
75-106
_
—3.6—
2 60.440.212.6——
13
—0.37—
0.0700.310.041———
12
—.0.37—
0.311.60.26———
21
—6.70—
0.483.00.37———
35
200
38-75
_
—1.0—0.850.700.70———
15
—0.52—0.331.30.17-_——
13
—6.70—
0.371.10.37———
52
_—1.1—0.261.90.23
——
52
400
38
16.57.88.152.01.71.80.410.700.0080.21—
8.902.6
20.5—0.671.50.150.670.0080.18—
—2.33.70.965.60.93———
87
—35.0
—1.1
10.51.1
——
113
NoteAnalysis not undertaken for items marked '—'.
Reproduction of Table 3.7, Volume II of Elliot Lake Environmental Assessment by James F. MacLaren (1978).
20
- Undisturbed samples should be carefullytransported in wooden crates separated bypolystyrene, wood chips or the like.
Of the above factors, those related to drilling of theborehole are the most critical. It is essential that theengineer, hydrogeologist and/or engineering techni-cian supervising the borehole be aware at all times ofthe depth to the base of the drill-string, the water levelinside and probable water level outside the borehole,and the depth to which the borehole is open. Anywater level changes during drilling must also berecorded.
The accurate and comprehensive recording of fieldobservations and field data is a vital component oftailings solids sampling programs. Field data from atailings solids sampling program will include the sam-ple locations and depths, sample type, samplingmethods, sample character, and field measure-ments. Field data such as these from a drilling pro-gram are best recorded on prepared borehole logforms to ensure that all pertinent observations aremade and the information is recorded in a standardmanner. An example of a field borehole log form isshown in Fig. 4.10.
The radiological characterization of the tailingsinvolves both in situ field measurements and labora-tory analyses, each of which requires quality assur-ance programs.
The portable radiation survey instruments used forthe in situ testing must give readings that refer tostandard units. Thus, prior to use, each instrumentshould be calibrated with a known reference source.For the gamma/beta instruments, this involves mea-suring exposure rates at certain fixed distances fromthe source. Allowance is made for source decay andthe exposure rates at each distance are calculated.Instrument calibration potentiometers are then ad-justed to indicate the computed exposure rates at thespecified distances. Alternatively, if the instrumentuses other measurement units (e.g., counts/s), themeasured values are noted. All instruments shouldbe calibrated if possible near the centre of the meterscale on each exposure range.
A common gamma calibration source is radium-226.Standard tailings samples can also be used. Calibra-tion of beta measuring instruments can be performedwith a Technetium-99 source.
Following the initial calibration, the instrumentsshould be checked daily at a reference distance fromthe calibration sources. Battery checks of the self-
powered instruments should be made before anyseries of measurements are to be carried out.
Quality assurance for the laboratory radionuclideanalyses involves the calibration of the completecounting system using reference source materialsdesignated by the U.S. Nuclear Regulatory Commis-sion or National Bureau of Standards. Basically, theentire measurement procedure from chemical sepa-ration to sample counting, is performed using refer-ence sources specific to the radionuclide being ana-lysed. Details of the techniques used are referencedin Smithson et al. (1978) (see Section 4.5.5).
4.7 PROGRAM COSTSThe cost of a tailings solids sampling program willdepend on the intensity of the program as reflectedby the number of sampling locations and individualsamples; the depth from which samples are re-covered; and the actual sampling methods used. Thefollowing are general unit cost estimates for several ofthe key solids sampling and testing procedures,which can be used to develop estimates for overallprogram costs.
Manual sampling of the tailings solids using thin-walled tube methods for the collection of continuouscores from shallow depth requires two field personsand typically yields approximately 1 to 2 metres oftailings core per hour.
Drill rig operated sampling methods for the recoveryof tailings solids samples with split-spoon, Shelbytube or piston samplers can advance at rates of 2 to 4metres per hour for split-spoon sampling at 1.5 metredepth intervals, but at only 1 to 2 metres per hourwhen continuous sampling or Shelby piston samplesare required. Drill rig operated methods require adriller, driller's helper and drilling/sampling super-visor. Typical hourly rates for a drill rig with driller andhelper range from $75 to $100 per hour in 1984.
In situ testing such as cone penetration tests andvane shear tests also require a drill rig. Cone penetra-tion test rates are typically 5 to 10 metres per hour.Vane shear tests require 15 to 30 minutes per test.
Manual and drill rig sampling methods, and in situtesting methods generally require experienced spe-cialist field personnel to supervise the field opera-tions, accurately record field observations and mea-surements, and properly recover and preserve thesamples. Typical consultants' rates for such spe-cialist personnel range from $25 to $35 per hour fortechnicians, from $35 to $50 per hour for engineers/hydrogeologists in 1984.
21

FCLO BOREHOLE LOG
mixxaKm.ji* f..f«J.!f.l*i.f.A...nxmrmf9H:9sMi\t\t*m.jtiJ!if.jeiA- i.oTrrtcr iM..fyn.iY£. connucTBi. ti?«!*5l«5 tmu.EK i.*....-CASKS IIIMMCT wT...r..—L». au»...-.. .mum tnmjm wiatacii WT....'.V?. L I . oMor.^^.HocsTI»CTAnilg.../.y «f WEATHCT jLt?{YX..UMtCOWroM •I-HMRUVLC M - K M OK»
to.- TiMi mum.nrnii r - n>r tw i rn w i m&T - flUOTTfo TUHffC-NOCK UWC
at-MMU WN.-WHONT, HMC* - CMM m - MEMUV, MY0R4ULKiL-WBILIva PM.^PKSSUME, MANUALV. -MffTU M M M M TCtT FL - MC9SUHC, L CVC H
SOt, STRATIGRAPHY
1JSAMPLE DESCRIPTIONS AND SORING NOTES
OCPTH Of MOLE
UlilLLWi
3ii.TrTAIUMCS
• /— TAIL i *J a*
(5A ''Ih—cr-sr SUSY sii-rr SAHV
O M P A C r
PEN5E QRvulhl Mi
SA>OD, SOME
U Atlo f
~ *>ITH 4'
HCKNIS STA1DEPTH OF I CASIN6 " . . . O C P T W TO
Golder Asaociatat
Fig. 4.10 - Example of field borehole? log (completed for a typical tailings borinc;?
22

4.8 REFERENCESAcker, W.L. (1974). Basic Procedures for Soil Sam-
pling and Core Drilling, Scranton, Pennsylvania:Acker Drill Co. Inc.
Arman, A.; Poplin, J.K. and Ahmad. N. (1975). "Astudy of the vane shear". In Proceedings of theConference on In Situ Measurement of Soil Proper-ties, Volume 1-4, American Society of Civil Engi-neers, Geotechnical Engineering Division, Vol-ume I, pp. 93-120.
American Society of Civil Engineers (ASCE) (1976)."Subsurface investigation for design and con-struction of foundations for buildings". ASCE Man-ual No. 56.
ASCE (1981). "In-situ testing to evaluate liquefactionsusceptibility: Session No. 24, ASCE NationalConvention, St. Louis, Missouri". ASCE Report81-544.
ASCE (1982). "Dynamic stability of tailings dams:ASCE National Convention, New Orleans, Loui-siana". ASCE Reprint 82-539.
American Society for Testing and Materials (ASTM)(1983). 1982 Annual Book of ASTM Standards,Part 04.08: Soil and Rock; Building Stones; Peat.D421 -58 Method of dry preparation of soil samples for
particle size analysis and determination ofsoil constants.
D422-63 Method for particle-size analysis of soils.D1452-80 Practice for soil investigations and sampling
by auger borings.D1557-78 Test methods for moisture-density relations
of soils and soil-aggregate mixtures.D1586-67 Method for penetration test and split-barrel
sampling of soils.D1587-74 Method for thin-walled tube sampling of
soils.D2216-80 Method for laboratory determination of
water (moisture) content of soil, rock andsoil-aggregate mixtures.
D2217-66 Method for wet preparation of soil samplesfor particle-size analysis and determinationof soil constants.
D2488-69 Recommended practice for description otsoils (visual-manual methods).
D2573-72 Method for field vane shear test in cohesivesoil.
D3080-72 Method for direct shear tes»t of soils underconsolidated drained conditions.
D3441 -79 Method of deep, quasi-static, cone and fric-tion-cone penetration tests of soil.
Baguelin, F. and Jezequel, J.F. (1980). "French self-boring pressuremeter, PAF 68-PAF 72 and PAF76". Report No. FHWA-TS-80-202. Federal High-way Administration, Washington, D.C.
Black, C.A. (1965). "Methods of soil analysis" Mono-graph No. 9. American Society of Agronomy.
Broms, B.B. (1980). "Soil sampling in Europe: state ofthe art". Journal of Geotechnical Engineering Divi-sion, American Society of Civil Engineers106:GT-1:65-100.
David, M. (1977). Geostatistical Ore Reserve Estima-tion. Elsevier, Amsterdam.
Donaldson, E.M. (1980). "Methods for the analysis ofores, rocks and related materials". Monograph 88J.CANMET, Energy, Mines and Resouces Canada.Ottawa, Ontario.
Duncan, D.W. (1972). •Measurement of acid produc-ing potential - project report". British ColumbiaResearch Foundation, Division of Applied Biology.
Environment Canada (1983). "Sampling for waterquality". Water Quality Branch, Inland WatersDirectorate, Ottawa, Ontario.
Federal Highway Administration (FHA) (1977)."Guidelines for cone penetration tests perfor-mance and design". FHWA Report TS.
Hvorslev, M.J. (1949). Subsurface Exploration andSampling of Soils for Civil Engineering Purposes.Reprint, New York: Engineering Foundation.
James F. MacLaren Limited (1978). EnvironmentalAssessment of Proposed Elliot Lake UraniumMines Expansion, Volume 4 - EnvironmentalAssessment.
Johnson, W.M. and Maxwell. J.A. (1981). Rock andMineral Analysis. Toronto: J. Wiley and Sons !nc.
Keys, W.S. and MacCarty, L.M. (1971). "Application ofborehole geophysics to water-resources investiga-tions". In Techniques of Water-Resources Inves-tigations of the U.S. Geological Survey. Book 2.
Mittal, H.K. and Morgenstern. N.R. (1975). "Param-eters for the design of tailings dams". CanadianGeotechnical Journal, 12:235-261.
NAVFAC (1982). Soil mechanics - Design Manual7.1. Department of the Navy, Navy Facilities Engi-neering Command.
Patterson, R.J.;Frape. S.K.; Dykes, L.S and McLeod,R.A. (1978). 'A coring and squeezing technique forthe detailed study of subsurface water chemistry".Canadian Journal of Earth Sciences. 15:162-169.
Sangerlat, G. (1972). The Penetrometer and SoilExploration. Elsevier Publishing Co.
Schmertman, J.H. (1975). "Measurement of in situshear strength". In Proceedings of Conference onIn Situ Measurement or Soil Properties. AmericanSociety of Civil Engineers.
Smithson, G.L.; Dalton, J.L and Mason, G.L. (1978)."Radiochemical procedure for determination ofselected members of the uranium and thoriumseries." Report 78-22, CANMET, Energy, Minesand Resources Canada, Ottawa.
Telford, W.M.; Geldart, L.P.; Sheriff, R.E. and Keys.D.A. (1976). Applied Geophysics. New York:Cambridge University Press.
U.S. Department of the Interior (1974). Earth Manual.Bureau of Reclamation, 2nd Edition.
Worth, C.P. (1980). "Cambridge in-situ probe, PAF68-PAF 72 and PAF 76". Report No. FHWA-TS-80-202. Washington, D.C.: Federal HighwayAdministration.
Wilson, S.D. and Ohya, S. (1981). "Present state ofsite investigation". In Proceedings of the TenthInternational Conferance on Soil Mechanics andFoundation Engineering, pp. 475-425.
23

5. SURFACE WATER AND SEEPAGE5.1 OBJECTIVESThe migration of chemical or radioactive constituentsout of a uranium tailings impoundment in surfacewater runoff or localized seepage can have an impor-tant impact on surrounding lakes and streams.Therefore, the objective of a surface water andseepage sampling program at a tailings impound-ment is to characterize the quantity and quality ofsurface water flow and seepage from the tailingsimpoundment in order to assess potential environ-mental impact.
Surface water runoff refers to water that exits a tail-ings impoundment by surface water flow. This runoffcan be derived from precipitation, from surface waterthat originates outside an impoundment or from tail-ings porewater which discharges to surface waterinside the tailings impoundment. Seepage refers toporewater which emerges from the ground and dis-charges into surface water in the immediate (withintens of metres) vicinity of a tailings impoundment.This differs from porewater which exfiltrates from thetailings into the groundwater system and is not imme-diately discharged to surface water.
Characterization of runoff and seepage is also impor-tant in the calculation of an overall hydrologic budgetfor a tailings impoundment. The hydrologic budgetcan be used to estimate the amount of precipitationthat infiltrates the tailings, and consequently theamount that exfiltrates from the tailings into thegroundwater system.
5.2 SELECTION OF SAMPLING LOCATIONSFor the purpose of assessing the potential impact ofsurface water runoff on the surrounding environment,sampling locations are normally situated where sur-face water collects on, or exits from, a tailings im-poundment. At such locations, measurements ofrunoff quantity and quality can be made to estimateloadings to surface water bodies surrounding thetailings impoundment. To develop a hydrologic bud-get for a tailings impoundment, sampling locationsshould also be situated where surface water flowsenter the tailings impoundment, and at selected loca-tions where surface water collects or travels acrossthe tailings impoundment. At such locations, mea-surements of surface water quantity and quality canbe made to determine changes in quantity or qualityas the surface water travels across the tailingsimpoundment.
Locations for sampling of seepage from a tailingsimpoundment are established where the seepage isobserved to emerge. Seepages can be diffusesources such as a series of emergent flows distrib-uted along the toe of a dam, or can be highly localizedsuch as one that emerges from a fissure in bedrock.
Regardless of the nature of the seepage, it is prefera-ble to situate sampling locations as near to ihe pointof emergence as possible so that representativequantities and qualities can be measured and soiladsorption be minimized.
5.3 SURFACE WATER5.3.1 Flow MeasurementsSurface flows in and around tailings impoundmentsmay include streams, channels, ditches and pondoutfalls. In all instances, the basic technique used toestimate fiow is to develop a 'rating curve' at eachspecific location which correlates the depth of flowand flow rate from repeated measurements of bothwater depth and flow over a wide range of flows.Depth readings are made using a staff gauge, float,pressure or electronic sensor. Flow measurementsare normally made using current velocity meter-stream area calculations for the development of rat-ing curves. Procedures for this method of stream flowmeasurement are described in ASTM (1983) Volume11.01: D3858-79. Velocity-area methods can also beused for periodic point measurements.Staff gauges are relatively inexpensive and requirelittle in the way of maintenance. When a staff gauge isused, flowrates are only known for those times whenthe gauge is visited and the depth read. To obtainmore frequent or continuous measurements of flow,float, pressure or electronic depth measuring devicescan be connected to automatic recorders. Recordersare more expensive but the information they providecan be used to better understand flow behaviour andthey do not require frequent attention.
Regardless of whether manual or automatic depthreading methods are used, the location of a flowmeasuring station must be such that backwatereffects or other conditions that can induce errors intomeasurement are avoided.
The surface water flow that leaves a tailings impound-ment area typically is discharged via a collectionpond. Such outflows can be measured using weirs orflumes. V-notch or rectangular weirs are the morecommonly used method due to the relatively highercosts of flumes and the difficulties in installing flumescorrectly. An example of a small V-notch weiris shown in Fig. 5.1. V-notch weirs are more suit-ed to measuring relatively low flow rates (less than0.3 m3/s or 10 cfs) but may be more susceptible toclogging by floating debris. The flows through weirsand flumes are also derived by measuring waterdepth and using a rating curve for the specific type ofinstallation. Either manual or automatic depth record-ing can be used. Flow measurement techniques aredescribed in detail in ASTM Volume 11.01:D2034-68, and D1941-67.
24

Fig 5 1-- Example ol a small V-nolch weir o( plywood construction
5.3.2 Chemical Sampling
5.3.2.1 Parameters
A wide variety of chemical and radiological param-eters may be potentially important for the sampling ofsurface water runoff from a tailings impoundment.Key parameters for water sampling are shown inTable 5.1 and include various indicator parameterssuch as pH. electrical conductance (EC) and total
dissolved solids (TDS). major ions, trace metals, andradionuclides. For a given tailings impoundment, thislist can serve the basis for the selection of appropriatesampling parameters, but parameters could beadded or deleted according to site-specific consid-erations such as the chemical composition of thetailings solids and mill effluent, or requirements byregulatory agencies.
Table 5.1 - Key parameters for water sampling
pHElectrical Conductance lEClTemperatureDissolved Oxygen (DO)Total Dissolved Solids (TDS)Total Suspended Solids ITSSlAcidilyAlkalinity
r Ions Calcium, magnesium, sodium, potassium,chloride, sullale. nitrale. ammonia
Metals
Radionuclides Total uranium, thorium-232. radium-226 Iead-21U
Iron, aluminum, arsenic, cadmium copper, cobalt,lead, nickel, zinc, molybdenum
25

5.3.2.2 Sample collection methods
The most common type of surface water samplecollected is referred to as the discrete 'grab' sample.A grab sample represents the conditions which existat the sampling location at the time of sampling. Totake grab samples, the container is immersed intothe stream to be sampled and filled. It is desirable forthe container to be held well below the surface (mid-depth is preferred) although this may not be possiblein shallow streams. Samples should also be takenfrom the middle of streams or channels if possible.
For deep bodies of water such as ponds or lakes,grab samples may be collected at the surface(approx. 0.5 metres), at specific depths, or as depth-integrated samples depending on the purpose of thesampling program. A variety of surface water sam-pling techniques are outlined by Environment Can-
MESSENGER
UPPER VALVE
CABLE
GUIDE-
-SPRING
LOWER VALVE-
Fig. 5.2 - Example of depth-specific water sampler (Kemmerer)
ada (1983). An example of a depth-specific Kem-merer sampler is shown in Fig. 5.2. This type ofsampler is lowered to the depth of sampling in anopen position and closed via a messenger to retainthe water sample. A common type of depth-inte-grated sampler is the sampling iron, in which anempty two-litre bottle is lowered to the bottom andraised at a constant rate so that the bottle is just filledas it reaches the surface.
Sampling personnel should be familiar with the gen-eral area where samples are taken. Prior to samplecollection, sampling personnel should walk aroundthe sampling location and note anything unusual thatmay influence the quality of the sample. Where possi-ble, samples should be taken upstream of artificialconstrictions (such as a culvert or bridge) or otherfeatures that might alter water quality at the samplinglocation. The principal objective is to collect samplesthat are representative of the conditions at the sam-pling location. Care should be taken to avoid includ-ing floating debris such as leaves in the sample. Theact of taking a sample can stir up sediment from thebanks or bottom and such turbidity should also beavoided.
A composite sample is obtained by mixing severaldiscrete samples of equal or weighted volume into asingle sample container. Composite samples provideestimates of average water quality conditions withoutthe need to analyse many discrete samples. Com-posite samples may be time composites or flow pro-portional composites. Time composite samples aremade up by mixing equal water volumes collected atregular time intervals. For example, a time compositeof 12 monthly discrete samples of water from a spe-cific location may be made to estimate the annualaverage water quality at that location. Flow propor-tional composite samples are made up by mixingdiscrete samples of water collected from severallocations or at several time intervals whose volumesare proportional to the flows at the time of sampling.For example, a flow proportional composite samplemay be made to estimate the average water quality ofsurface water inflow to a pond where there are severalinflows of differing magnitudes. In this situation, thecomposite sample would consist of various aliquotsof water from discrete samples of each inflow, with thevolume of each aliquot proportional to the flow ateach sample location.
Automatic sampling devices are also available whichcollect discrete samples at regular time intervals orcombine the discrete samples to produce compositesamples. Automatic samplers are relatively expen-sive but can perform unattended.
5.3.2.3 Sample handling and preservationmethods
Prior to collecting samples, sampling personnelshould be aware of which parameters are to be ana-
26

lyzed. Depending on the parameters being investi-gated, there are certain requirements regarding con-tainer types and sizes and the addition of chemicalpreservatives to the samples (see Table 5.2). The useof some preservatives precludes the analysis of cer-tain parameters; sampling personnel should recog-nize these restrictions and take appropriate steps toavoid contamination and ensure that sufficient num-bers of samples are collected. Time and trouble canoften be saved if sampling personnel and the labora-tory analyst confer in advance regarding the besttechniques for sample handling and preservation.
In general, surface water samples should be col-lected in 1-litre containers. Polyethylene is preferredbecause it is rugged and does not react with mostsample constituents. For samples that do not have achemical preservative already in the collection bottle,both the bottle and the cap should be rinsed with thewater to be sampled several times if possible.
Following collection, samples should be kept cool(approximately 4°C is recommended) until analyzed.
The storage at cool temperatures inhibits chemicalreactions such as oxidation and precipitation whichcan alter sample quality. If the possible growth ofmicro-organisms is a concern, samples should alsobe kept in the dark. Samples should be sent to thelaboratory as quickly as possible because samplecomposition may change with time.
Surface water samples are not generally filteredbecause the 'total' concentrations (the dissolved plussuspended components) of constituents are usuallyof most concern in assessing the effects of loadingsto surface waters. If analysis of dissolved con-centration is required, water samples should be fil-tered prior to adding chemical preservatives. Filtra-tion methods are described in Section 6.6.3. It shouldbe noted that although 0.45 (JLITI membranes are mostcommonly used for water samples, there is noaccepted standard filter for preparation of dissolvedradium analyses. Filters ranging from 0.45 to 3.0 u.mhave been used by different organizations and yielddifferent results.
Table 5.2 - Water sample handling and preservation techniques
Parameter
pHElectrical
ConductanceTemperatureDissolved OxygenTDSTSSAcidityAlkalinityCalciumMagnesiumSodiumPotassiumChlorideSulfateNitrateAmmoniaTotal IronFerrous IronAluminumSilicaArsenicCadmiumCopperCobaltLeadNickelZincUraniumThoriumRadium-226Lead-210
Fieldanalysis
XX
XX
Glass
XXXX
XXX
Sample Container
orororor
ororor
Poly-ethylene
XXXXXXXXXXXXXXXXXXXXXXXXXXX
Preservationwith
HN03 to pH- 2
XXXX
XXX
XXXXXXXXXXX
Maximumstoragetime
—
7 days7 days24 hours24 hours6 months6 months6 months6 months7 days7 days24 hours24 hours6 months24 hours6 months7 days6 months6 months6 months6 months6 months6 months6 months6 months6 months6 months6 months
Modified from Environment Canada (1983) and Environment Ontario (1981).All samples should be stored at 4°C.
27
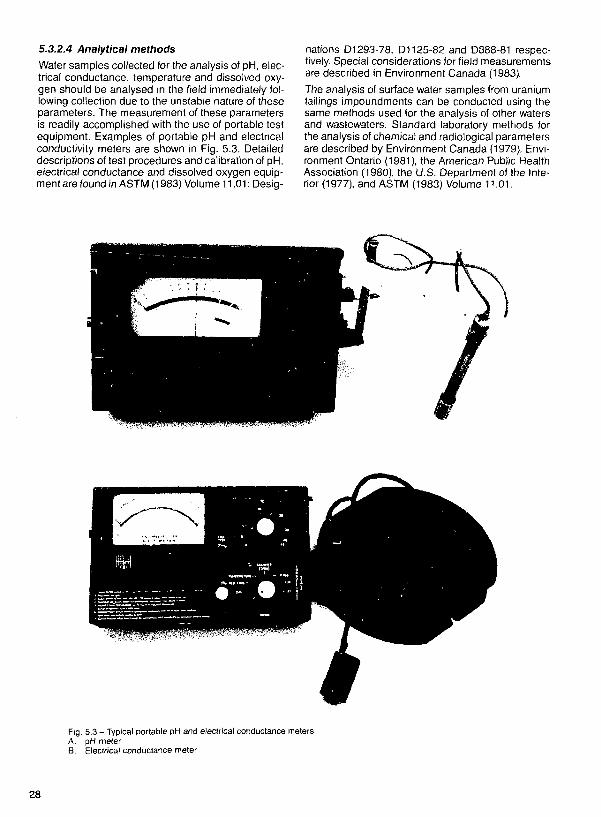
5.3.2.4 Analytical methods
Water samples collected for the analysis of pH, elec-trical conductance, temperature and dissolved oxy-gen should be analysed in the field immediately fol-lowing collection due to the unstable nature of theseparameters. The measurement of these parametersis readily accomplished with the use of portable testequipment. Examples of portable pH and electricalconductivity meters are shown in Fig. 5.3. Detaileddescriptions of test procedures and calibration of pH,electrical conductance and dissolved oxygen equip-ment are found in ASTM (1983) Volume 11.01: Desig-
nations D1293-78. D1125-82 and D888-81 respec-tively. Special considerations for field measurementsare described in Environment Canada (1983).
The analysis of surface water samples from uraniumtailings impoundments can be conducted using thesame methods used for the analysis of other watersand wastewaters. Standard laboratory methods forthe analysis of chemical and radiological parametersare described by Environment Canada (1979), Envi-ronment Ontario (1981), the American Public HealthAssociation (1980), the U.S. Department of the Inte-rior (1977), and ASTM (1983) Volume 11.01.
Fig. 5.3 - Typical portable pH and electrical conductance metersA. pH meterB. Electrical conductance meter
28

5.4 SEEPAGE5.4.1 Flow Measurements
Seepage from tailings impoundments does not lenditself to easy measurement because flows are gener-ally low, and there is a large potential for dilution byother surface waters. In the case of both distributedand localized seepage, the seepage flow must insome way be contained or collected for a flow mea-surement while excluding other sources of water. Thismay involve the construction of collector ditches orsumps in the areas of seepage. High volume seep-ages which result in significant surface water flowscan be measured using surface water flow measure-ment techniques as described in Section 5.3.1. Lowvolume seepages from granular soils or throughearth fill dams which do not produce readily mea-sureable surface water flows can sometimes be esti-mated using seepage-meter techniques.
Seepage meters have been used to investigate shal-low groundwater discharge to surface water streamsand lakes (Lee and Cherry, 1978; Lee et al.. 1980).Seepage meters consist of collection devices in-stalled on the stream or lake bed which intercept andmeasure the rate of discharge of groundwater into thesurface water. An example of a seepage meter isshown in Fig. 5.4. In areas of groundwater dischargeor seepage, water flows upward into the seepagemeter and fills the collection bag. The rate at whichthe collection bag fills is monitored, and the rate ofgroundwater discharge or seepage is calculated. Theidentification of groundwater discharge or seepagezones for the installation of seepage meters can becomplemented by the use of mini-piezometers. Mini-piezometers consist of small diameter (<1 cm)piezometers installed manually to shallow depths(<1 m) below the stream or lake bed (see Fig. 5.5).Groundwater discharge or seepage zones are identi-fied where water levels in the mini-piezometers arehigher than the water level in the stream or pond.
y WATER LEVEL
STOPPER
STREAM OR LAKEBOTTOM
FLEXIBLE PLASTIC BAGFILLS AS SEEPAGE ISCOLLECTED
INVERTED COLLECTORDISH
- / - . • • • • - • . . •
GROUNDWATER SEEPAGE
Fig. 5.4 - Seepage meters for determination of rate of groundwater discharge to surface water
29

PIEZOMETER
CASING
-
PLUGFig. 5.5 - Installation of mini-piezometers in stream or lake bedA. Driving of casing with removable plugB. Insertion of piezometer into casingC. Removal of casing
5.4.2 Chemical Sampling
5.4.2.1 Parameters
The key chemical parameters which will be importantfor the sampling of localized seepage are the sameas those identified in Table 5.1 for surface water sam-pling. These parameters include indicator param-eters, major ions, metals and radionuclides. As forsurface water sampling this listing provides a basisfor the selection of sampling parameters, but param-eters may be added or deleted according to site-specific considerations.
5.4.2.2 Sample collection methods
High volume seepages which result in significantsurface water flows can be sampled using the same
WATER LEVEL
STREAM OR LAKEBOTTOM
INTAKE
collection methods described in Section 5.3.2.2 forsurface water. Grab sampling is the most commontype of collection method but automatic samplingdevices can also be used.
Water samples from seepage meters and mini-piezometers can be collected from the installationsas seepage fills the collection bags. The samples arethen transferred to appropriate sample containers forpreservation and storage. However, it should benoted that the chemical composition of water col-lected in seepage meters may be altered by chemicalreactions with the stream/lake bottom sediments inthe seepage meter. Consequently, water samplesfrom mini-piezometers would generally be preferablefor detailed assessment of seepage chemistry.
30

5.4.2.3 Sample handling and preservationmethods
The sample handling and preservation methodsdescribed in Section 5.3.2.3 for surface water sam-ples are also applicable to seepage samples. Therecommended methods for handling and preserva-tion of water sampies are shown in Table 5.2. Asnoted in Section 5.3.2.3, surface water samples arenot generally filtered because the 'total' (dissolvedplus suspended) concentrations are usually of mostinterest in assessing the effects of loadings to sur-rounding surface water bodies. Similarly, when theeffect of seepage loadings to surrounding surfacewater is of interest, the seepage samples are not fil-tered. However, when seepage sampling is intendedto assist the characterization of the tailings porewaterfrom which the seepage is derived, it is the dissolvedconcentrations that are of interest and consequentlythe seepage samples are filtered. Filtration of sam-ples is described in Section 6.6.3.
5.4.2.4 Analytical methods
As with surface water samples, parameters such aspH, electrical conductance, temperature and dis-solved oxygen should be analysed in the field imme-diately following collection. Detailed procedures forthese measurements are referenced in Section5.3.2.4.
The analysis of seepage samples can be conductedusing the same laboratory methods used for the anal-ysis of other waters and wastewaters. Standard meth-ods for the laboratory analysis of chemical and radio-logical parameters are described by EnvironmentCanada (1979), Environment Ontario (1981), theAmerican Public Health Association (1980), the U.S.Department of the Interior (1977) and ASTM (1983),Volume 11.01.
5.5 QUALITY ASSURANCE FOR WATERSAMPLING
5.5.1 Recording of Field DataThe accurate and comprehensive recording of fielddata is a vital component of surface water samplingprograms. Reid data from a sampling program willinclude sample identification numbers, samplinglocations, weather conditions, field measurementsand observations, and the numbers and types ofsamples collected for laboratory analyses. Theresults of the water quality analyses cannot be prop-erly interpreted without this type of supporting infor-mation. Field data are best recorded on preparedwater sampling forms to ensure that all pertinentobservations are made and the information isrecorded in a standardized manner. An example of asurface water sampling form of the type recom-mended by Environment Canada (1983) is shown inFig. 5.6.
5.5.2 Quality Control for Sample Collection
Water sampling equipment and sampling proceduresused in water quality sampling programs will have animportant influence on the reliability of the water qual-ity results. Consequently, quality control proceduresfor water sample collection are important compo-nents of a comprehensive water sampling program.
Sampling equipment and sample containers shouldbe constructed of materials which will not affect thechemical composition of the water samples. Forexample, as noted in Section 5.3.2.3, water samplesfor the detailed analysis of silica, sodium or potas-sium should be retained in polyethylene containersbecause these constituents can be leached fromglass containers. Leaching of constituents couldresult in erroneously high results. Similarly, watersamples for the detailed analyses of heavy metalsshould bs retained in polyethylene containersbecause heavy metals may be adsorbed on the wallsof glass containers. Adsorption of metals could resultin erroneously low results.
It is also important that sampling equipment andsample containers be adequately cleaned prior touse. Sample container cleaning procedures for spe-cific types of chemical analyses are described inEnvironment Canada (1983). In general, sample con-tainer cleaning procedures for parameters of interestin uranium tailings would involve:
- clean tap water rinse;
- dilute acid rinse;
- distilled water rinse.
Sample containers that are excessively soiled mayrequire additional water/detergent or chromic acidwashing prior to the final acid rinse and distilled waterrinse.
As noted in Section 5.3.2.3, water samples for theanalyses of cations, heavy metals and radionuclidesshould be preserved by the addition of concentratednitric acid to a pH <2. It is important to ensure thepreservative acid is pure and will not result in con-tamination of the samples.
Given the potential for errors resulting from equip-ment and impure preservatives, quality control pro-cedures involving the use of field blanks and fieldstandards can be implemented to identify thesesources of error in a water sampling program.
Field blanks are generally used to evaluate potentialcontamination of samples from contact with the sam-pling equipment, sample containers or sample pre-servatives. Field blanks are prepared in the field usinglaboratory-analysed distilled water. The distilledwater is used to fill the water sampler and the fieldblank is then handled, preserved and analysed in a
31

STATION NO.
DESCRIPTION:
DATE OF SAMPLING
TIME OF SAMPLING
SAMPLED BY
5-/2MC* 0
Or
HR
<Jp«tJ
POlOP OK
2</
/ '
rre-eT
MOMI
MAYI"*
YR it 0^yTIME ZONE *TT? 7 "
FIELD MEASURED PARAMETERS
Water Temp. °C tO- S
PH 3. 2
Depth of Water
Ice Thickness _
Other
Remarks
Air Temp. °c
Specific Cond. L('$W/* S DiBs. Oxygen V-
Depth at which sample Taken a ~
PO*JO
INSTRUMENT CALIBRATION
Diss. Oxygen Meter Model YST ~ Kinkier Calibration I2.oMeter Reading before Adjustment
Conductivity Meter Model YST S-C-T
11.8mg/L
pU Meter Model CtfglJltJC t*OOeL S Calibration Buffers Used V- ° anut 1.0
Remarks
WATER QUANTITY MEASUREMENT DATA
Location Description W £ / T O
Description of Gauge v ~~ ̂ ° ' '
stage Height <̂ . £"V "1T i m e f l : l f A M
SAMPLING APPARATUS USED AND PROCEDURES
— GfifieQ S4fiPI~G 1V/T
— 0HCi<-€~T « /* iset j /A)
pot) o ou
ru wet (?
AQo\)G
U f t
rueT
ReFeftevce /M/i/i<
SAMPLE SPECIFICS
Major IonaMetals *' C«.+I"OAS
Organics
Pesticides & Herbicides
Mercury
Phenols
Nutrients
BOD & COD
Others R<«il'iw>«*«.<l4*»
QUALITY CONTROL REMARKS
GENERAL REMARKS
MODE OF TRANSPORT
SHIPPING DATE
ContainerMaterial
Vol.Collected Preservation
QualityControl
Plot^tC>'
—————
P'O-i+iC
1 U1 U
I (_
—
/£) n,L HlO°3
¥ V*iO &OTr<-ZS t^li.LSi'3 g#i>IOCJUCL IO€S
To Of * s SAMPLES S-IS. 5-38
9 e BY Mif-i.SToflflGE CM
MAY V •• 3o PM
Fig. 5.6 - Example of surface water sampling form (completed for a typical tailings surface water sample)
32

manner identical to the actual water samples col-lected. In this way any significant amounts of dis-solved constituents which are released to the sam-ples from the sampling equipment, samplecontainers or sample preservatives will be indicatedin the analyses of the field blanks. If contamination ofthe field blanks is indicated, more detailed studiescan be conducted to determine the source of thecontamination. Field standards can be used to evalu-ate the potential loss of dissolved constituents due toadsorption on sampling equipment or sample con-tainers. Field standards are prepared using watersamples of known concentration and are treated inthe same manner as field blanks. In this way, anysignificant adsorption or loss of dissolved constitu-ents from the samples will be indicated by decreasedconcentrations in the field standards.
The reliability of water quality results will also dependon the laboratory procedures and analytical tech-niques used. Quality control procedures in a wateranalysis laboratory will include reagent/methodblanks, calibration standards, laboratory controls,spiked samples, duplicate samples and replicateanalyses. These procedures are described in detailby USEPA (1979) and will not be discussed here.
As an independent check of precision or repro-ducibility of laboratory chemical analyses, field repli-cate samples can be collected. Field replicate sam-ples are two or more samples split in the field from asingle water sample and are submitted to the labora-tory under separate designations. The analyticalresults of the field replicate samples should be com-parable to the expected range of precision of theanalytical techniques.
5.5.3 Independent Assessment of DataReliability
In addition to the field sampling and laboratory qualitycontrol procedures discussed in the previous sec-tions, there are several procedures available for theindependent assessment of the general reliability ofwater quality data. These procedures include:
- ionic balance calculations;
- EC-TDS relationships;
- EC-ionic sum relationships;
- summed TDS-measured TDS relationships.
These procedures can be used to assess the generalreliability/completeness of major ion analyses ofwater samples by identifying possible analyticalproblems not detected by the laboratory quality con-trol program, or more commonly, identifying arith-metic, transcription or reporting errors in the ana-lytical results. These procedures are described indetail by Keith et al. (1983).
Ionic balance calculations are the most commonly
used procedure for assessing water quality datareliability. The ionic balance calculation is based onthe fact that water is electrically neutral and the ionicsum of the cations should equal the ionic sum of theanions. The ionic sums are calculated as the sum ofthe concentrations of the individual ions in equivalentparts per million (epm). Epm concentrations are cal-culated as the analytical concentration in parts permillion (ppm) or milligrams per litre divided by themolecular weight of the ion, multiplied by the ioniccharge.
The ionic balance is calculated as a percentage by:
Cx cations - ^ anions) x 1 0 0
( i ! cations + i l anions)
With this expression, for a water sample in which allmajor ions have been analyzed and each analysis isaccurate, the resultant ionic balance should be zero.
In most cases, however, the ionic balance will rangefrom positive to negative suggesting an apparent ex-cess of cations or anions in the analysis. Acceptableranges for the ionic balance will vary depending onthe TDS concentrations in the samples and therequired accuracy of the analyses. In general, ionicbalances will be poorer (either higher or lower) forvery low-TDS waters and for very high-TDS watersbecause of poorer accuracy of analyses in theseranges. For most water samples an acceptable ionicbalance will be plus or minus 5 to 10 per cent.
Ionic balance calculations larger than those consi-dered acceptable suggest that either the water analy-sis is incomplete (i.e., a major constituent was notanalysed) or there are errors in some of the analyticalresults. Poor ionic balances are a signal that theanalytical results should be very carefully examinedin order to identify the potential errors. Errors in labo-ratory sample dilution calculations and transcriptionof data are those most commonly identified by ionicbalance calculations.
As a quality control procedure, ionic balance calcula-tions are limited by several factors. Firstly, the ionicbalance indicates only that errors may exist in themajor ion analyses and does not indicate which spe-cific analyses may be in error. Large errors in minor ortrace constituents may go undetected. In addition,compensating errors in major ion analyses may goundetected.
Electrical conductance (EC)-total dissolved solids(TDS) relationships can also be used to assess thegeneral reliability of major ion analyses. The elec-trical conductance of a water sample depends pri-marily on the concentrations of dissolved constitu-ents and consequently will be related to the TDSconcentrations. Hem (1970) reported that for mostwaters the TDS (in mg/L) equals 0.55 to 0.75 EC (in(xmhos/cm at 25°C). When the EC-TDS relations of awater sample do not fall in this range, it may suggest
33

that the major ion analyses are incomplete or thereare errors in the analyses.
Similarly, Logan (1961) proposed several empiricalformulae which can be used as a general check ofmajor ion analyses. These formulae are shown inTable 5.3 and relate the electrical conductance (EC)to the ionic sum (B) for various conditions. When themeasured EC of a water sample is significantly dif-ferent than the predicted EC from these empirical EC-ionic sum relationships, it may suggest that the majorion analyses are incomplete or are in error.
A comparison of measured TDS concentrations andthe sum of the individual major ion analyses (ppm ormg/L) can also be used as a quick check for major ionanalyses.
5.6 PROGRAM COSTSThe costs of a surface water sampling program willdepend primarily on the intensity of the program asreflected by the number of sampling and flow mea-
surement locations, and the number of individualsamples. In comparison to tailings solids and tailingsporewater s \<npling programs, surface water sam-pling programs generally require little in the way ofspecialized or costly equipment and procedures.
An exception to this is the installation of stream flowmeasurement devices such as weirs and flumes.These devices require installation by experiencedspecialist field personnel to obtain accurate streamflow data. As an example, the installation of a smallweir with a water level recorder would require approxi-mately one day of a two person field crew plusapproximately $500 to $1000 for materials and therecorder in 1984.
The collection of surface water samples is not nor-mally labour intensive. For example, a surface watersampling program conducted by a single field personwill typically involve collection of 10 to 25 samples perday depending on the accessibility of the samplinglocations and the field measurements which arerequired.
Table 5.3 - Empirical electrical conductance (EC)-ionic sum(B) relationships
From Logan (1961)
Conditions Formula
1.
2.
3.
4.
Where
B < 1.01.0 < B < 3.0
3.0 < B <10.0
B > 10.0Bicarbonate DominantAnion
B > 10.0Chloride DominantAnton
B > 10.0Sulfate DominantAnion
B = 2 cations (epm) - i2
anions (epm)
EC =EC =
EC =
EC =
EC =
EC =
100 B12.27 + 83.388 + 0.835 B2
13 [95.5 - 5.54 (log B)J
90 B
123 B° 9 3 9
101 B09"9
34

5.7 REFERENCESAmerican Public Health Association (1980). Stan-
dard Methods for the Examination of Water andWastewater.
American Society for Standards and Testing (ASTM)(1983). 1982 Annual Book of ASTM Standards,Part 11.01: Water.D888-81 Test methods for dissolved oxygen in water.D1125-82 Test methods for electrical conductivity and
resistivity of water.D1293-78 Test methods for pH of water.D1941 -67 Method for open channel flow measurement
of water and wastewater by the Parshallflume.
D2034-68 Method for open channel flow measure-ment of water by weirs.
D3370-82 Practices for sampling water.D3858-79 Practices for open channel flow measure-
ment of water by velocity-area method.Environment Canada (1979). Analytical Methods
Manual. Inland Waters Directorate, Ottawa, On-tario.
Environment Canada (1983) Sampling for WaterQuality. Water Quality Branch, Inland WatersDirectorate, Ottawa, Ontario.
Hem, J.D. (1970). "Study and interpretation of thechemical characteristics of natural water". Water-Supply Paper 1473, U.S. Geological Survey.
Environment Ontario (1981). Outlines of AnalyticalMethods. Laboratory Services Branch, Rexdale,Ontario.
Keith, S.J.; Frank, M.T.; McCarty, G. and Mossman,G. (1983). "Dealing with the problem of obtainingaccurate groundwater quality analytical results".In Proceedings of the Third National Symposiumon Aquifer Rehabilitation and Groundwater Moni-toring. National Water Well Association.
Lee, D.R. and Cherry, J.A. (1978). "A field exercise ongroundwater flow using seepage meters and mini-piezometers". Journal of Geological Education,27:6-10.
Lee, D.R.; Cherry, J.A. and Pickens, J.F. (1980)."Groundwater transport of a salt tracer through asandy lake bed". Journal of Limnology andOceanography, 25:1:45-61.
Logan, J. (1961). "Estimation of electrical conductivityfrom chemical analyses of natural waters". Journalof Geophysical Research, 66:8:2479-2483.
U.S. Department of the Interior (1977). NationalHandbook of Recommended Methods for Water-data Acquisition. Office of Water Data Co-ordina-tion, Reston, Virginia.
USEPA (1979). "Handbook for analytical qualitycontrol in water and wastewater laboratories".EPA-600/4-79-019. Environmental Monitoring andSupport Laboratory, U.S. Environmental Protec-tion Agency.
35

6. TAILINGS POREWATER
6.1 OBJECTIVESThe overall objective of tailings porewater sampling isto characterize and monitor the movement andchemical composition of the porewater which occursin the tailings. The movement and chemical composi-tion of the porewater in the tailings will have a greatinfluence on the quantity and quality of surface waterrunoff, localized seepage and exfiltration from thetailings impoundment.
The movement of porewater through the tailings iscontrolled by the hydrogeologic conditions within andaround the tailings impoundment. The chemicalcomposition of the tailings porewater is controlled bythe chemical composition of the mill effluent andchemical reactions within the tailings.
The characterization of the movement and chemicalcomposition of tailings porewater in the saturatedzone of the tailings (below the water table) normallyinvolves the installation of piezometers or monitoringwells. The piezometers allow the measurement ofhydraulic head and consequently porewater flowdirections, the measurement of hydraulic conduc-tivity, and the collection of porewater samples forchemical analysis. There is also a wide variety ofspecialized hydraulic, pneumatic, and vibrating-wirepiezometers available for the measurement ofhydraulic head. These do not allow hydraulic con-ductivity testing or water sampling. These devicesare generally of limited application in tailings sam-pling programs. The movement and chemical com-position of porewater in the unsaturated zone (abovethe water table) can also be important in some situa-tions. For example, in poorly buffered pyritic tailings,pyrite oxidation occurs predominantly in the unsatu-rated zone close to the surface of the tailings and cancontrol the chemical composition of the porewater inthe saturated zone. Characterization of the move-ment and quality of the porewater in the unsaturatedzone of the tailings normally involves the installationof tensiometers and lysimeters or the use of coring-squeezing methods.
6.2 SELECTION OF SAMPLING LOCATIONSLocations for the sampling of tailings porewatershould be selected in order that porewater levels andporewater samples are representative of the condi-tions within the tailings impoundment. Samplinglocations must be distributed both areally and ver-tically throughout the tailings impoundment to allowadequate definition of the range in porewater chemis-try and porewater flow directions. The large size ofmost tailings impoundments and the general highcost of materials, installation and sampling precludesthe selection of sampling locations according to asystematic sampling grid. Therefore, sampling loca-tions are selected on the basis of the anticipatedhydrogeologic conditions within the tailings impound-
ment. Factors such as the physical and chemicalcharacter of the tailings, and the depth to the watertable should be considered in the selection of sam-pling locations. The example illustrated in Section 4.2for the selection of tailings solids sampling locationsis directly applicable to the selection of porewatersampling locations. Generally, tailings porewatersampling is conducted in conjunction with a tailingssolids sampling program so that the results of theporewater sampling can be related to the physicaland chemical character of the tailings.
6.3 PIEZOMETER CONSTRUCTION ANDINSTALLATION
Piezometers are installed in the saturated zone of thetailings to allow the measurement of porewater levels,the determination of the in situ hydraulic conductivityof the tailings and the collection of porewater samplesfor chemical analysis.
In this manual, piezometers or sampling wells refer toinstallations having relatively short intakes (<150cm) in order to monitor hydraulic head and collectsamples from specific depths. These installationsdiffer from wells with long intakes (>150 cm) whichare used for pumping tests or the collection of depth-integrated porewater samples. Because tailings aregenerally heterogeneous and may exhibit large varia-tions in hydraulic head, hydraulic conductivity andporewater chemical composition with depth, profilesof these parameters with depth are generally re-quired. Depth profiles can be obtained from a clusteror nest of individual piezometers installed at increas-ing depths in the tailings, from multiple piezometersstacked in a single borehole, or from multiple-depthpiezometers. Multiple small diameter piezometers orwater samplers can be stacked at various depths in asingle borehole. These stacked installations dependon reliable placement of sand filter packs and lowpermeability backfill seals for each piezometer (seeFigures 6.1 and 6.5), but caving of the borehole andpiping of tailings into the drill casing may prevent suchinstallations. Although multiple-depth piezometershave been used extensively for hydrogeologic inves-tigations in sand aquifers, they may be of limited usein most tailings. The installation of multiple-depthpiezometers relies on adequate caving of the geo-logic materials around the piezometer to prevent ver-tical leakage along the piezometers. In layered siltytailings caving may not be sufficient. Consequently,nests of piezometers are normally used in tailings.
Piezometers and wells for use in tailings impound-ments should be constructed of PVC or other plasticdue to the normally corrosive nature of tailings andtailings porewater. Mild steel or galvanized steelpiezometers may corrode and contaminate pore-water samples with heavy metals. Stainless steelwould be suitable but is 5 to 10 times the cost of PVC.
36

Piezometers can be driven or pushed into the tailingsby hand or by machine, or can be installed in hand ormachine drilled boreholes. The installation of pie-zometers and wells by hand is an advantage ontailings impoundments where the site is inaccessibleto equipment such as drill rigs. Hand installedpiezometers are, however, often restricted to rela-tively shallow depths of less than 5 to 8 m, particularlyin coarse sandy tailings. In addition, the installation ofpiezometers by hand does not normally allow thecollection of tailings solids samples, as would beobtained by drill rig methods. The various types ofpiezometers which are applicable for use in uraniumtailings impoundments in various situations are listedin Table 6.1 together with their respective applicationsand limitations. The construction of these types ofpiezometers is illustrated in Fig. 6.1 to 6.5. Furtherdetails regarding the construction and use of thesepiezometers are found in the references noted inTable 6.1. Of these piezometer types, only the con-
ventional monitoring wells and some gas-drivesamplers are available commercially. The remaindermust be specially constructed.
From Table 6.1 it is evident that no single type ofpiezometer installation will be ideally suited to allsituations. The selection of the type of piezometer foruse in a sampling program will depend on factorssuch as the accessibility of the tailings impoundmentfor drilling equipment, the chemical stability of theporewater and the anticipated porewater sample col-lection methods. The cost of the piezometer installa-tions will be another factor to be considered. In gen-eral, small diameter (<2 cm) piezometers are muchless expensive than large diameter piezometers.This difference in cost may be significant when multi-plied by a large number of installations for an exten-sive sampling program. The rationale for the selec-tion of the type of piezometer required is discussedtogether with the selection of sample collection meth-ods in Section 6.6.2.
Table 6.1 - Types of piezometers for measurement of hydraulic headand porewater sampling
Type Application Limitations Reference
1) Conventional — Installation of one well per borehole.Monitoring — Large diameter wells allow the greatestWell flexibility for the use of different
sampling methods.
2) Drive-point — Can be installed manually to eliminateneed for drill rig when accessibility is aproblem.
3) Gas-driveSamplers
Multiple-DepthInstallations
4) Bundle-typePiezometers
- Can be installed individually or atmultiple depths in a single borehole.
- Will readily allow collection of sampleswhere water levels are deep ( '8 m).
- Installation of multiple small diameterpiezometers in a single borehole.
- Inexpensive method for obtaining datafrom several depths.
- Collection of data from several depths (1)requires additional installations and canbecome costly.
- Depth of installation may be limited bythe nature of the tailings.
- Tailings samples are not recoveredduring installation.
(2)
- Costly (3)- Samples can only be collected by air-lift
and may be relatively disturbed.
- Small diameter piezometers limit the useof many sample collection methods.
- Can only be installed properly incohesionless geologic materials.
References1) USEPA(1977)2) Desaulniers (1983)3) Morrison and Brewer (1981)4) Gillham et al. (1983)
37

PROTECTIVE CAP
P V C CASING
GEOTEXTILEFILTER WRAPPEDPERFORATED ORSLOTTED PVC
INTAKE
GROUND SURFACE
LOW PERMEABILITYBACKFILL
SAND FILTER PACK
Fig. 6.1 - Conventional monitoring well
COUPLING -
PERFORATED-BARREL
POROUS PLASTICCARTRIDGE
PV.C. DRIVEPOINT
3.1 cm IDSCHEDULE 80PVC PIPE
;l5cm .
PIEZOMETER TIP
DRIVE WEIGHT
— DRIVE HEAD
o •
- GROUND SURFACE
COUPLING
RISER PIPE
- PIEZOMETER TIP
MANUAL INSTALLATION
Fig. 6.2 Large diameter drive-point piezometer and manual installation procedure
38

10cm
- 1.25 cm. ID.CPVC PIPE
REMOVABLE EW DRILL3 8 cm CASING
— COMPRESSEDBENTONITE RINGS
-PVC WASHER
-PIEZOMETER INTAKE
-RUBBER GASKET
-CPVC DRIVE POINT
=Q
PIEZOMETER TIP INSTALLATION WITHDRILL RIG
Fig. 6.3 - Small diameter drive-point piezometer and drill rig installation procedure
1.9 cm PVC PIEZOMETER
0.95 cm. POLYETHYLENEPIEZOMETERS
: . - — BUNDLE STRAPPING
. PERFORATED AND SCREENEDINTAKES
Fig. 6.4 - Bundle-type piezometer
39

GAS PRESSUREDELIVERY LINE
BOREHOLE
WATER LEVEL
SAND FILTERPACK
/
• SAMPLE RETURNLINE
GROUND SURFACE
LOW PERMEABILITYBACKFILL
SAMPLE RESERVOIR
' ONE "WAV VALVE
SAMPLER INTAKE
Fig. 6.5 - Gas-drive water sampler
6.4 HYDRAULIC HEAD MEASUREMENTSHydraulic head measurements in tailings impound-ments are used to determine porewater flow direc-tions, and are used together with hydraulic con-ductivity measurements to determine porewater flow-rates. Hydraulic head in the saturated zone of thetailings is determined from the elevation of waterlevels measured in piezometers. Water levels inpiezometers are normally measured periodicallyusing electric water sounding tapes. Such devicesoperate by the closing of an electric circuit uponcontact with the water in the piezometer and arenormally accurate to within less than one centimetre.Electric water sounding tapes can be obtained com-mercially or can be specially constructed. Long-termcontinuous hydraulic head recording can be accom-plished in piezometers or wells using commerciallyavailable float recorders, pressure transducers orelectric sensors which are installed and left in thepiezometer.
Hydraulic head in the unsaturated zone of the tailingsis determined from the degree of soil suction mea-sured in tensiometers. Tensiometers are used rou-tinely in agriculture and soil science applications andare described in detail by Black (1965). An example of
a mercury column tensiometer is shown in Fig. 6.6.Although the measurement of hydraulic head in theunsaturated zone of a tailings impoundment is notnormally a consideration, the evaluation of the dis-charge of tailings porewater to surface water streamson the tailings and the influence of infiltration into thetailings would require such measurements.
6.5 HYDRAULIC CONDUCTIVITY TESTINGAs noted in the preceding section, hydraulic con-ductivity measurements in the tailings are usedtogether with hydraulic head measurements to deter-mine porewater flow rates in the tailings. The twobasic types of testing which can be used to determinethe hydraulic conductivity of saturated tailings are:
- in situ tests in piezometers and wells;
- laboratory tests on tailings samples.
In situ hydraulic conductivity testing includes single-well response tests and pumping tests. The applica-tion and limitations of these tests are shown in Table6.2. The basic principles of these in situ tests areillustrated in Figures 6.7 and 6.8. Details of thesetesting procedures are found in the references notedin Table 6.2.
40

GROUND SURFACE
WATER FILLEDTUBE
MERCURY MANOMETER
WATER FILLED RESERVOIR
POROUS INTAKE
WATER TABLE
Fig. 6.6 — Tensiometer tor measurement of hydraulic head in the unsaturated zone
Single-well response testing was originally formu-lated by Hvorslev (1951) and the calculation of hori-zontal hydraulic conductivity is based on the rate ofthe water level recovery in a piezometer following aninduced change in water level. The water levelchange can be induced by the addition of water to thepiezometer as in a falling-head test, or the removal ofwater as in a rising-head test. Single-well responsetests, and specifically rising-head tests, are readilyincorporated into a tailings porewater sampling pro-gram. The tests utilize existing piezometer installa-tions which are also used to measure hydraulic headand collect porewater samples. Rising-head testscan be conducted during the course of piezometerpurging and recovery prior to porewater samplingoperations The hydraulic conductivity of uraniumtailings normally ranges from 1CH cm/s to 10"6 cm/sso the water level recovery in piezometers occursover the period of minutes to hours and is readilymeasured.
Single-well response tests in a network of piezo-meters allow a large number of hydraulic conductivitymeasurements distributed areally and verticallythroughout a tailings impoundment. Due to the gen-erally heterogeneous nature of tailings within animpoundment, this type of spatial characterization ishighly desirable. The principal limitation of single-wellresponse tests is that the vertical hydraulic con-ductivity cannot be determined, and this parameter isimportant in evaluating vertical porewater flowratesthrough the tailings.
The calculation of hydraulic conductivity usingpumping tests is based on the rate of drawdown ofwater levels in a network of observation wells due toremoval of water from a test well. A pumping test is abasic technique in hydrogeologic studies and is usedto determine bulk or average hydraulic conditions.For typical pumping test analyses, plots of drawdownversus time are compared to published type-curves
41

(see Fig. 6.8). Values for analytical parameters 1 uand W(u) are determined for specific values of timeand drawdown and are used in various formulae todetermine the hydraulic conductivity. The design andanalysis of pumping tests are described in detail byKruseman and De Ridder (1970). Pumping tests arecostly because they normally require a special pump-ing well, a network of observation wells, and aregenerally conducted over a period of several days.The high cost of pumping tests would generally pre-clude a program of many tests at different locations ina tailings impoundment but without many such tests.
the heterogeneities in the tailings impoundment cannot be adequately assessed. Pumping tests can,however, be used to determine vertical hydraulic con-ductivity if a specialized network of observation wellsis used. Details of this method are described byWalton (1979).
Laboratory hydraulic conductivity testing includesdirect methods such as permeameter testing andtriaxial permeability testing, and indirect methodssuch as grain-size correlation. The application andlimitations of these methods are shown in Table 6.2.
Table 6.2 - Types of hydraulic conductivity testing techniques
Type Application Limitations Reference
In Situ
1) Single-wellresponsetest
— Allows rapid determination ot hydraulicconductivity in porewater samplingpiezometers.
— Allows numerous tests to assess spalialvariability.
2) Pumping lest — Allows determination of bulk hydraulicconductivity.
- Zone ol influence for each test is small. (1) (2)- Determines only horizontal hydraulic
conductivity.
- Generally requires a special pumping well (3)with observation piezometers.
- Tests are generally long-term and costly.- Can only determine vertical conductivity
with special monitoring configuration.
— Relates grain size of tailings sample tohydraulic conductivity of the sample.
4) Permeameter — Based on flow rates through undisturbedor remouloed samples to determinehydraulic conductivity.
— Primarily for relatively permeable sandytailings.
— Tests on disturbed core samples providevertical hydraulic conductivity.
5) Triaxial — Based on same principles as thetest permeameter tests but primarily for low
permeability silty tailings.
- Based on empirical relationships and are (4)only approximations.
- Generally only application to sandymaterials.
- Uncertainty whether laboratory (5)determined values represent in situconditions.
- Same as permeameter. (6)
References1) Hvorslev(1951)2) Cedergren (1967)3) Kruseman and De Ridder (1970)
4) Freeze and Cherry (1979)5) Black (1965)6) Tavenas et al. (1983)
42

STATIC WATER LEVEL t = <=>o
ttatRECOVERY
= 0 — INITIAL LEVEL
Ho
. r -?—l
.1 i /
! ! :i i
O.I
0.5
° 0.37•X
0.2
X •l\
I I i l l I
RISING-HEAD TEST
Fig. 6.7 - Single-well response test configuration and analysis to determine horizontal hydraulic conductivity (Kh)where r is the well casing radius (cm)
R is the well intake or sand pack radius (cm)L is the well intake length (cm)To is the basic time lag from the graph (s)m is (Kh/Kv)
1'2 usually assumed to equal 1
Laboratory hydraulic conductivity testing of undis-turbed tailings samples is likely the most effectivemethod for determining vertical hydraulic con-ductivity.
Grain-size correlation is based on the empirical cor-relation between the hydraulic conductivity of a soilsample and the grain size of the sample. Freeze andCherry (1979) describe various grain-size correla-tions of which the most commonly used is:
Hydraulic conductivity (cm/s) = (D10)2
where D10 is the grain size in mm of the 10th percen-tile of the grain-size distribution curve. Such empiricalrelations were originally determined to provide roughbut useful estimates for most fine to coarse sandymaterials. Empirical grain-size correlations are notlikely applicable to materials with significant silt orclay contents.
Both permeameter and triaxial hydraulic conductivitytesting methods are based on measurement of fluidflowrates through tailings samples of known sizeunder known hydraulic gradients. Procedures for thelaboratory determination of hydraulic conductivityusing a permeameter are described by Black (1965)and ASTM (1983) Volume 04.08: D2434-68. Anexample of a falling-head permeameter apparatus isshown in Fig. 6.9. The configuration of triaxial testingapparatus is basically the same as the permeameterwith the exception that the sample is enclosed in arubber sleeve and is confined under a known pres-sure to simulate in situ confining pressures, and thetest can be conducted under constant-head condi-tions. Constant-head tests are required for testinglow hydraulic conductivity samples. Procedures fortriaxial hydraulic conductivity testing are describedby Tavenas et al. (1983).
43

PUMP DISCHARGE
1DRAWDOWN
PUMPINGWELL
PUMPING WATERLEVEL • •
• OBSERVATIONWELLS
STATIC WATER LEVEL
FIELD DATAr- TYTYPE CURVE
10
W (u)
O.I
).0l0.1 t 10 100 1000 10000
I /u
Fig. 6.8 - Pumping test configuration and analysis to determine hydraulic conductivity
44

POROUSPLATES
HEAD
Fig. 6.9 - Permeameter apparatus for laboratory determination of nydraulic conductivity
6.6 POREWATER SAMPLING6.6.1 Parameters
The key chemical and radiological parameters for theanalysis of tailings porewater are the same as thoseshown in Table 5.1 for surface water sampling. Aswith the surface water sampling, the precise selectionof parameters will be highly site-specific dependingon factors such as the composition of the tailings, thechemical composition of the mill effluent and par-ticular requirements from regulatory agencies.
6.6.2 Sample Collection Methods
Saturated Zone
A wide variety of sample collection methods can beused to recover porewater samples from piezometersand wells. These sample collection methods arelisted in Table 6.3 along with their respective applica-tions and limitations. Examples of the various samplecollection devices are illustrated in Figures 6.10 to6.13. Details on the various sample collection meth-ods are found in the references noted in Table 6.3 andFigures 6.10 to 6.13.
45

Table 6.3 - Porewater sample collection methods
Type Application Limitations Reference
Saturated Zone
1) Bailers
2) Depth-specificbailer
3) Syringesampler
— Simple, inexpensive methodfor collection of samples.
— Simple, inexpensive methodless disruptive than bailer.
— Allows collection of sampleswithout exposure to theatmosphere and allowsfiltration down-the-hole.
- Can collect samples from anydepth.
— Samples are highly disturbed and must (1)be extensively handled during filtration.
— Can be time consuming in small diameterwells.
— Requires relatively large diameter wells. (1)
- Only small volumes of porewater are (2)collected in each syringe.
- Requires piezometers greater than 3 cmdiameter.
4) Suction-liftpumping
5) Submersiblepump
6) Air-liftpumping
Unsaturated Zone
7) Suctionlysimeters
8) Core squeezing
References1) Gillham et al. (1983)2) Gillham (1982)3) USEPA (1977)4) Everett (1981)5) Smyth (1981)
— For collection of relativelylarge volumes of water fromshallow depth.
— Permits use of in-line filters toreduce sample handling.
— For collection of large volumesamples from depths greaterthan 8 m.
— For collection of watersamples from conventionalwells or special air-liftsamplers.
— No limitation on depth ofwater.
— For collection of porewatersamples from unsaturatedzone above the water lable.
— Allows repeated monitoring.
— For collection of porewaterfrom tailings solids samplesby squeezing ordisplacement.
— Sampling limitrd to water depths lessthan 8 m.
— Requires relatively large diameter wells.— Costly.
— Samples can be highly disturbed.
— Reliable only in relatively coarse sandymaterials.
— Destructive sampling, monitoring atprecisely the same location is notpossible.
<3|
(4)
(5)

EYE FOR CABLE
BARREL
RETAINING PIN
BALL CHECK VALVE
Fig. 6.10 - Bailer for water sampling from wells and piezometers Fig. 6.11 - Syringe sampler for water sampling from wells andpiezometers
Fig. 6.12 - Example o! peristaltic sampling pump
47

WATER RETURNLINE
*
WAI t "LEVEL
MONITORING - ^ " " ^WELL
y,/// J
/ ,
/ /
/ /
' /
' /
' /
/ /
JS2.T
- _ .
/ .
/ ,
/ .
/ .
/
/ ,
y.y.y.y.y
y /
* >
MR LINE
• • • >
11
DETAIL OF SAMPLERTIP
Fig. 6.13 - Air-lift device for water sampling from wells and piezometers
Prior to the collection of porewater samples frompiezometers, the water standing in the piezometersmust first be purged to ensure that the water which iscollected represents 'fresh' porewater. Water whichhas remained in piezometers for extended periods oftime (days or more) can undergo considerablechanges in chemical composition due to degassing,oxidation and precipitation reactions within thepiezometer. In piezometers which yield a continuoussupply of water, it is recommended that a volume
equivalent to several times the volume of thepiezometer be removed prior to sample collection(Gillham et al., 1983). Piezometers which do not yielda continuous supply of water can simply be purgeduntil they are dry and allowed to refill with 'fresh'porewater.
Devices for the collection of samples should be con-structed of resistant materials such as plastic, PVC,teflon and stainless steel due to the corrosive natureof tailings porewater. The use of other less resistant
48

materials would result in undue damage to the sam-pling equipment and potential contamination of thesamples.
The selection of the most applicable samplingmethod will depend on factors such as the chemicalstability of (he porewater, the depth of the water tableand the type of piezometer. The rationale for theselection of appropriate sample collection methods isillustrated in Fig. 6.14 together with the selection ofthe type of piezometer required.
An important consideration in the selection ofpiezometer type and sample collection method isaccessibility on the tailings impoundment. If the siteaccessibility is poor then the piezometer installationsmay be restricted to those which can be installedmanually.
The chemical stability of the tailings porewater willaffect the size or diameter of the required piezometer.Tailings porewater which contains high concen-trations of ferrous iron (>100 mg/L) is highly unsta-ble, and the oxidation of this ferrous iron cannot bereliably prevented during conventional sample collec-tion, filtration and preservation at the ground surface.Consequently, tailings porewater which is highlyunstable should be sampled using the syringesampler method in which the sample is recovered in asyringe lowered down the piezometer. The syringesampling method normally requires a relatively largediameter (>3 cm) piezometer. However, special nar-row diameter syringe-type samplers could be devel-oped for use in small piezometers if required.
A typical syringe sampler consists of a modified50 mL plastic syringe as shown in Fig. 6.11. Thesyringe sampler is fitted with a plastic 25 mm filterholder and 0.45 \xm filter membrane and is lowereddown the piezometer to the level of the piezometerintake. A vacuum pump is used to actuate the syringeplunger and draw water through the filter and into thesyringe. The syringe sampler is then removed fromthe piezometer and immediately capped to preventexposure to the atmosphere. Preservatives, if re-quired, are added using a 1 mL plastic syringe.Syringe sampling methods have been used suc-cessfully for sampling high-iron porewater at theDenison, Stanrock and Nordic tailings impound-ments at Elliot Lake (Feenstra et al., 1981; Cherry etal., 1980).
The depth to water in the tailings impoundment willaffect the possible sample collection methods whichcan be used, which will in turn determine the type ofpiezometer. The depth to water is only a factor for thesampling of chemically stable porewater. The syringesampling method for unstable porewater can operateat any depth.
In situations where the water level in the piezometersis within 6 m of the ground surface, suction-lift pump-ing is probably the most efficient method of samplecollection, although several other methods can beused.
There is a wide variety of reliable, inexpensive, porta-ble (suction-lift) peristaltic pumps available commer-cially which are well suited for porewater sampling.An example of a portable peristaltic pump is shown inFig. 6.12. These pumps are capable of pumping ratesup to approximately 1 L/min and can accommodatein-line filtration equipment. Although air-lift pumpsand bailers can be used for sampling from shallowdepths, sample filtration and handling are more diffi-cult. Similarly, submersible pumps can also be usedfor sampling from shallow depths but are relativelycostly and more time consuming to set up and oper-ate.
In situations where the water level in the piezometersis greater than 6 m below ground surface, bailers, air-lift pumps, air-lift samplers or submersible pumpsmust be used because the water levels are belowsuction-lift range. However, in most situations at ura-nium tailings impoundments in Canada, it is unlikelythat water levels in the tailings will be as deep as 6 m.
Unsaturated ZoneTailings porewater samples can be collected from theunsaturated zone of the tailings using suctionlysimeters or coring-squeezing methods. The appli-cations and limitations of these methods are sum-marized in Table 6.3. Examples of these samplecollection devices are illustrated in Fig. 6.15 and 6.16.Details of these sampling methods are found in thereferences noted in Table 6.3 and in Fig. 6.15 and6.16.
Suction lysimeters allow the repeated collection ofporewater samples from specific locations in theunsaturated zone. A suction lysimeter consists of avacuum cylinder with a water saturated, slightly per-vious plastic or ceramic intake. Water in the lysimeterintake contacts the porewater in the unsaturatedzone so that when the lysimeter cylinder is placedunder a vacuum slightly in excess of the soil suction,water flows slowly into the lysimeter. Depending onthe soil, sample collection times may be as long asseveral days. For sample collection, the lysimeter ispressurized to force the collected porewater to thesurface. Suction lysimeters are not, however, alwaysreliable due to difficulties in maintaining an adequatevacuum in low hydraulic conductivity soils. In addi-tion, the vacuum conditions and the long collectionperiods can result in considerable changes in pore-water chemistry prior to sample recovery.
49

SITE ACCESSIBILITY
MANUAL IN?(MAY BE LIMITED TO 8m DEPTH) FOR DRILL RIG
DRILL RIGINSTALLATION
EMICAL STABILITY OFPOREWATER
STABI
EMI CAL STABILITY O F ]POREWATER
DEPTH TO WATER |
I 6m! ( 61
J I.LOW
( 6IT.I
NNESTED LARGE
DIAMETERDRIVE-POINTPIEZOMETERS
SYRINGESAMPLING
NESTED LARGEDIAMETER
DRIVE-POINTPIEZOMETERS
BAILERSUBMERSIBLEPUMPAIR-LIFTPUMP
NESTED SMALLDIAMETER
DRIVE-POINTPIEZOMETERS
SUCTION-LIFTPUMP
• A I R - L I F TPUMP
NESTED LARGEDIAMETER
CONVENTIONALWELLS
- SYRINGESAMPLER
NESTEO LARGEDIAMETER
CONVENTIONALWEU-S
BAILERSUBMERSIBLEPUMPA I R - L I F TPUMP
NESTEOGAS - DRIV ESAMPLERS
- GAS- DRIVEOPERATION
NESTED LARGEDIAMETER
CONVENTIONALWELLS
• BAILER-SUCTION-UFT
PUMP- SUBMERSIBLE
PUMP- AI R - LI FT
PUMP
Fig. 6.14 - Selection of piezometer type and porewater sampling method
50

VALVE
VALVE
VACUUM/PRESSURELINE
POROUS INTAKE
SAMPLE RETURNLINE
GROUND SURFACE
BENTONITE SEAL
SAND FILTER PACK
LYSIMETER BARREL
WATER TABLE
Fig. 6.15 - Suction lysimeter for porewater sampling above the water table
PLUNGER
' 0 ' RINGS
BASE
SEALING DISC
CORE TUBE
FILTER DISCPOROUS PLATE
— SAMPLING PORTFOR SYRINGE BASE
SQUEEZING APPARATUS
RIGID PLATE
-SQUEEZING APPARATUS
^MOVEABLE PLATE
- HYDRAULIC JACK
STAND
Fig. 6.16 - Tailings core squeezing apparatus for collection of porewater from tailings samples
51

Coring-squeezing methods allow the collection ofless disturbed tailings porewater samples from tail-ings cores from the unsaturated zone. This methoddoes not allow repeated monitoring of samples from aspecific location as would the use of a suctionlysimeter The coring-squeezing method involves thecollection of tailings core samples from the unsatu-rated zone using a Shelby-tube or similar thin-walltube sampler which will allow the collection of well-sealed samples (see Section 4.3.3). The tailings coresamples are then placed in a hydraulic jack squeez-ing apparatus to remove the porewater. Fine-grainedsilty tailings samples are simply squeezed and theporewater is released due to consolidation of thesample. The porewater passes through a filter mem-brane at the bottom of the sample and is collected in aplastic syringe. Porewater from coarse-grainedsandy tailings is removed by immiscible displace-ment because squeezing and consolidation is inef-fective. Paraplex, an immiscible organic fluid, isinjected and squeezed into the top of the core sampleand the sample porewater is released by displace-ment. The porewater sample is collected in the samemanner. This innovative technique has been usedsuccessfully in investigations of pyrite oxidation in theunsaturated zone of the Nordic tailings impoundmentat Elliot Lake (Smyth, 1981).
6.6.3 Sample Handling and PreservationMethods
The considerations for the handling and preservationof tailings porewater samples are comparable tothose for the handling and collection of surface watersamples. The guidelines for sample containers, pre-servation and storage time shown in Table 5.2 arealso applicable to tailings porewater samples. Tail-ings porewater samples are, however, generally morechemically unstable than surface water samples andthe need for proper sample preservation in the fieldimmediately upon collection is important.
In addition, unlike surface water samples, all tailingsporewater samples must be filtered prior to preserva-tion. Tailings porewater samples collected frompiezometers or squeezed from tailings cores oftencontain small amounts of suspended tailings solids.This suspended material does not represent materialthat is dissolved in the tailings porewater and con-sequently must be removed by filtration. Ground-water samples are normally filtered through 0.45 nmmembranes prior to preservation and analysis(Gillham et al., 1983).
Tailings porewater samples can be filtered down-the-hole using the syringe sampler (see Fig. 6.11) with a25 mm diameter filter holder. Tailings porewater sam-ples collected using suction-lift or submersiblepumps can be filtered in-line using standard-size47 mm diameter filter holders or 142 mm filter holdersfor large volume samples. An example of a 142 mm
filter holder is shown in Fig. 6.17. All of the noted filterholders consist of a filter membrane in a lucite orpolycarbonate holder. The filter membrane is re-placed after each sample to avoid cross-con-tamination of the samples. The operation of cleaningthe filter holder and replacing the filter membrane inthe field can often be difficult and time-consuming. Toavoid replacing and cleaning filters in the field, and toeliminate potential cross-contamination, self-con-tained disposable filter cartridges are available butthey are considerably more costly.
6.6.4 Analytical Methods
As with surface water samples, parameters such aspH, electrical conductance, temperature and dis-solved oxygen should be analysed in the field imme-diately following collection. Field measurement ofthese parameters is particularly important for tailingsporewater because samples with high concentrationsof ferrous iron may oxidize rapidly with the con-sequent decrease in sample pH and precipitation offerric hydroxide. Detailed procedures for these mea-surements are referenced in Section 5.3.2.4.
The analysis of tailings porewater samples can beconducted using the same methods used for theanalysis of other waters and wastewaters. Standardmethods for the analysis of chemical and radiologicalparameters are described by Environment Canada
Fig. 6.17 -142 mm filter holder for filtration ot porewater samples
52

(1979), Environment Ontario (1981), the AmericanPublic Health Association (1980), the U.S. Depart-ment of the Interior (1977), and ASTM (1983) Volume11.01.
6.7 QUALITY ASSURANCE FOR POREWATERSAMPLING
The general quality assurance considerations for tail-ings porewater sampling are comparable to thosedescribed in Section 5.5 for surface water sampling.The accurate and comprehensive recording of fielddata is a vital component of a porewater samplingprogram. Field data from a sampling program willinclude sample identification numbers, samplinglocations, information on sampling methods, fieldmeasurements and the numbers and types of sam-ples collected for laboratory analyses. Field datasuch as these are best recorded on prepared sam-pling forms to ensure that all pertinent observationsare made and the information is recorded in a stan-dard manner. An example of a porewater (ground-water) sampling form is shown in Fig. 6.18.
Quality control procedures such as the use of fieldblanks and field standards (see Section 5.5.2) areapplicable to tailings porewater sampling programsto evaluate possible errors resulting from field sam-pling procedures. Field duplicate samples can beused to check the precision or reproducibility of thelaboratory chemical analyses.
Methods such as ionic balance calculations and theexamination of EC-TDS, EC-ionic sum and summedTDS-measured TDS relationships can be used toassess the general reliability/completeness of majorion chemical analyses. These methods are outlinedin Section 5.5.3.
6.8 PROGRAM COSTSThe cost of a tailings porewater sampling program willdepend on the type and number of piezometerinstallations and the number of individual samples.
The following are generalized unit cost estimates forkey aspects of a tailings porewater sampling pro-gram, which can be used to develop overall programcosts.
The cost of materials for piezometer installationsincreases as the diameter of the piezometerincreases. For example, the materials for poly-ethylene bundle piezometers or PVC piezometersless than 5 cm in diameter would range from $5 to$10 per metre, while PVC piezometers 5 to 15 cm indiameter would range from $10 to $35 per metre in1984. Piezometers can be installed either manuallyfor shallow depths of less than 8 m, or with a drill rig.Manual installation methods for piezometers typ-ically allow completion of 4 to 8 metres of piezometerinstallation per hour for a two person field crew.Piezometers installed using a drill rig are generallyassociated with drilling for a tailings solids samplingprogram. Typical drilling advance rates range from1 to 4 metres per hour depending on the failingssolids sampling methods used (see Section 4.7).
The sampling of porewater from piezometer installa-tions is considerably more involved and time con-suming than surface water sampling. Porewater sam-pling procedures will include purging of the pie-zometers, sample collection, field measurements,sample filtration, sample preservation and a rising-head permeability test. From 3 to 6 porewater sam-ples can typically be collected per day by a singlefield person.
Piezometer installation and porewater sampling gen-erally require experienced specialized field person-nel to supervise drilling operations and constructionof the piezometers, accurately record field observa-tions and measurements, and collect the porewatersamples. Typical consultants rates for such spe-cialized personnel range from $35 to $50 per hour forengineers/hydrogeologists in 1984.
53

Project: TAILIH&S STUQf
SAMPLE COLLECTION RECORD
Sample No.: 3t4-t<>-(
Sample Location:Sampling Date: MAY 2*1 S3Sampled by: •JQHrJ P e g
Time:?••«*> AM
Weather Conditions
Air Temp.: IS "c Cloud Cover: CLCAA Precipitat ion: —
Sampling Installation Type: < % " ' " / c
Well Purging Equipment: Wi5WT'C<Sample Collection Equipment: &0 ">_<~ *Ya/lv<>e
PglnrAL nc poa
Water Level Before Sampling: / . 2 V »i Date: MAY"2-j /8 3 Time: f:<x> AMVolume Water Purged Before Sampling: 3<? t-Water Level After Sampling: -Z- 5t> m Date:
Sample Appearance
Colour:
Degassing:
Field Determinations
Water Temp.: Co . P H :3-
Odour:
Precipitates:
Conductance:
&eK8.\C
(*>"*•)
Samples Collected
Sub-sample
123456
Analysis Required
Mmjas C « t o l ; tftlmlsM^jor Ami On 9Ptftaus Iron
SampleContainer
"
aofffc
SampleVolume
5*0 im U
*
1 L
Filter Size Preservation
,* MC HMO,
Remarks: - SAt1f>LG- O-nOt-a<rl> AFT6.R S"
UJiTu PGeciPIT^tTTOnJ Ot-
sm/ze~o OAI CCG
Sample Transmittal
LAB.
Golder Associates
Fig. 6.18 - Example of porewater (groundwater) sampling form
54

6.9 REFERENCESAmerican Public Health Association (1980). Stan-
dard Methods for the Examination of Water andWastewater.
American Society for Standards and Testing (ASTM)(1983). 1983 Annual Book of ASTM Standards,Part 04.08: Soil and Rock; Building Stones; Peat.D2434-68 Test method for permeability of granular
soils (Constant Head).Black, C.A. (1965). "Methods of soil analysis". Mono-
graph No. 9. American Society of Agronomy.Cedergren, H.R. (1967). Seepage, Drainage and
Flow Nets. Toronto; John Wiley & Sons.Cherry, J.A.; Blackport, R.J.; Dubrovsky, N.; Gillham,
R.W.; Lim, T.P.; Murray, D.; Reardon, E.J. andSmyth, D.J.A. (1980). "Subsurface hydrology andgeochemical evolution of inactive pyritic tailings inthe Elliot Lake Uranium District, Canada". In Sym-posium on Uranium Mill Tailings Management,pp. 353-385, 1980.
Desaulniers, D.E. (1983). "Hydraulically drivenpiezometers for monitoring in soft sedimenis".Ground Water Monitoring Review, 3:2:16-20.
Everett, L.G. (1981). "Monitoring in the Vadose zone".Ground Water Monitoring Review, 1:2:44-51.
Environment Canada (1979). Analytical MethodsManual. Inland Waters Directorate, Ottawa, Onta-rio.
Environment Ontario (1981). Outlines of AnalyticalMethods. Laboratory Services Branch, Rexdale,Ontario.
Feenstra, S.; Blair, R.D.; Cherry, J.A.; Chakravatti,J.L. and La Rocque, E. "Hydrogeochemical inves-tigations of two inactive tailings areas in the ElliotLake uranium district, Ontario, Canada". In Pro-ceedings of the Fourth Symposium on UraniumMill Tailings Management, pp. 367-389, 1981.
Freeze, R.A. and Cherry, J.A. (1979). Groundwater.Toronto: Prentice-Hall Inc.
Gillham, R.W. (1982). "Syringe devices for ground-water sampling". Ground Water Monitoring Review2:2:36-39.
Gillham, R.W.; Robin, M.J.L.; Barker, J.F. and Cherry,J.A. (1983). "Groundwater monitoring and samplebias". Report No. 4367. American Petroleum Insti-tute.
Hvorslev, M.J. (1951). "Time lag and soil permeabilityin ground-water observations". U.S. Army Corps ofEngineers, Waterways Experiment Station,Vicksburg, Mississippi.
Kruseman, G.P. and De Ridder, N.A. (1970). "Analy-sis and evaluation of pumping test data". Interna-tional Institute for Land Reclamation and Improve-ment, Bulletin 11, Wageningen, The Netherlands.
Morrison, R.D. and Brewer, P.E. (1981). "Air-liftsamplers for zone-of-saturation monitoring".Ground Water Monitoring Review 1:1:52-55.
Smyth, D.J.A. (1981). Hydrogeological and geo-chemical studies above the water table in an inac-tive uranium tailings impoundment near ElliotLake, Ontario. An unpublished M.Sc. Project,Department of Earth Sciences, University ofWaterloo, Waterloo, Ontario.
Tavenas, F.; Leblond, P.; Jean, P. and Leroueil, S.(1983). "The permeability of natural soft clays -Part I: Methods of laboratory measurement".Canadian Geotechnical Journal 20:4:629-644.
U.S. Department of the Interior (USEPA), (1977).National Handbook of Recommended Methods forWater-Data Acquistion. Office of Water Data Coor-dination, Reston, Virginia.
U.S Environmental Protection Agency (1977). Pro-cedures Manual for Ground Water Monitoring atSolid Waste Disposal Facilities. EPA/530/SW-611.
Wi-lton, W.C. (1979). Review of leaky artesian aquifertest evaluation methods. Ground Water 17:3:270-283.
55

7. WIND-BLOWN DUST AND RADON
7.1 OBJECTIVESAirborne emissions from tailings impoundments aregenerally in the form of wind-blown dust and/or radongas. The concern with the wind-blown dust lies withthe particulate radionuclides which constitute theprime sources of inhaled radioactivity. Most particu-late radionuclides are members of the uranium-238decay series. However, where natural thorium is pres-ent, members of the thorium-232 decay series mayalso be present. The radioactive decay schemes forthese two natural elements are summarized inAppendix A.
Two commonly used measurements in the assess-ment of air quality are dustfall and suspended par-ticulate matter concentrations. Both measurementsprovide the data necessary to characterize the wind-blown tailings dust in terms of quantity and chemical,radiological composition. Sampling techniques fordustfall and suspended particulate matter are dis-cussed in Section 7.3.
Radon, the gaseous member of the uranium-238decay chain, and thoron, the gaseous member of thethorium-232 decay chain (where thorium-232 is pres-ent) are two additional radioactive emissions of inter-est. In most situations radon is of much greater con-cern than thoron, hence the following discussionsfocus on radon. Measurements of radon con-centrations in the air surrounding a tailings impound-ment are important in the assessment of existingconditions and dose estimates associated with suchtailings impoundments. To complement the assess-ment of ambient conditions, measurements of therate of radon emanating from the surface of the tail-ings may be carried out to assess the ambient radonpotential of the site and provide information on howalternative decommissioning strategies may affectradon release rates. Sampling techniques for am-bient radon and radon flux measurements are dis-cussed in Section 7.4.
7.2 SELECTION OF SAMPLING LOCATIONSThe quantities of radon and wind-blown dust originat-ing from a tailings impoundment are affected bymany factors, including wind speed, atmospheric sta-bility, rainfall, wind direction, barometric pressures,topography, vegetative cover, freezing conditions andsnow coverage. It is important, therefore, in the selec-tion of the monitoring locations, to take account of asmany of these factors as possible. The selection ofsampling locations for air quality monitoring isdescribed in ASTM (1983) Volume 11.03: D1357-82.
The amount of particulate radionuclides (dust)picked up from the surface of a tailings impoundmentand transported by winds is dependent largely uponthe condition of the tailings surface and the speedand direction of the dominant winds. Consequently,
the most important sampling sites are generallylocated downwind and upwind of the tailingsimpoundment as illustrated in Fig. 7.1.
The presence or absence of vegetative covering onthe tailings also affects dust generation rates. Forexample, the presence of a stable vegetative coverwill substantially reduce dust generation rates(C.D.O.H., 1981). Local wind fields will also beaffected by the nature and type of vegetation on thetailings or adjoining lands (e.g., forest cover versusgrasslands).
Two other factors which must be considered in theselection of sampling sites are surface topographyand land use. Gently rolling or flat terrain generallypresents relatively few problems in terms of windfunnelling and wind field alteration. However, in othersettings the presence of large hills or valleys or largewater bodies may affect site-specific wind patterns.Such local geomorphic features must be assessedon a site-specific basis in order to develop the mostappropriate sampling location configuration.
Land use in the area surrounding the tailings isanother feature which must be taken into accountduring the selection of the sampling locations. Thetype of land use (industrial, residential, etc.) andextent of the development in an area surroundingtailings can influence the air quality and make theassessment of the tailings contribution difficult. Mate-rials-handling operations and roadways in the vicinityof the tailings are two such examples of land usewhich may influence the air quality.
To quantify the effect of land useage on air quality,additional off-site sampling stations may be required.Figure 7.2 depicts an example of how local land usecoiild affect interpretation of the air quality data.
Such considerations suggest that to the extent prac-ticable, a sampling grid pattern spatially orientedaround the tailings be used to assess both the magni-tude and extent of the contaminant plume. Such agrid would be oriented with the major emphasisdownwind (based on the predominant wind direction)of the tailings area; however, sample points shouldalso be located (where possible) upwind of the tail-ings site and along the axes as implied by the generalshape of the area. Figures 7.1 and 7.2 depict hypo-thetical sampling configurations for flat terrain tailingsareas.
Another important consideration, often overlooked inthe initial selection of sampling locations, is the avail-ability of electrical power to operate high volumesamplers. The motors in these sampling units mustbe able to operate continuously for 24-hour periodswith input voltages ranging from 110 to 120 volts.50-60 Hz and must have a third wire safety ground.Battery-operated low volume air sampling systems
56

BACKGROUND (UPWIND)LOCATIONS
DOWNWINDLOCATIONS
LEGEND
SAMPLING LOCATIONS
Fig. 7.1 - Selection of sampling locations for wind-blown dust
are available for use in circumstances where 110 voltpower is not available. In addition, electrical powercan be provided from gasoline or diesei generatorsets. However, it should be noted that experiencesuggests such generator sets are particularly vul-nerable to vandalism.
The amount of radon gas diffusing from tailingsdepends on several factors. The release rate hasbeen shown to vary by more than a factor of 10 due tothe effects of weather, e.g., changes in barometricpressure, atmospheric stability, rainfall, changes inwind speed and snow cover (e.g., Swift et al., 1976).On this basis, therefore, the selec'ion of the radonsampling locations would follow an evaluation pro-cess similar to that for the airborne dust samples.
7.3 WIND-BLOWN DUST7.3.1. Parameters
The two parameters measured are suspended par-ticulate matter and dustfall. Suspended paniculate
matter refers to the wind-blown dust particles havingdiameters of less than 100 ^.m, (Stokes equivalent),which are drawn into a covered housing and collectedon a filter surface. More commonly the phrase refersto dust particles less than about 44 ixm in size (Envi-ronment Ontario, 1981). Dustfall is a measure of thesettleable particulates from the atmosphere andincludes all materials which will pass through a 20-mesh-size screen.
As noted in Section 7.2 many factors can affect thelevels of dustfall and suspended particulate matter.These factors can be divided into two basic types,namely physical and chemical/mineralogical. Mete-orological conditions such as wind speed and direc-tion, precipitation, soil temperature, duration of snowcover, etc., are important factors influencing theextent and seasonal variation of air quality for thetailings impoundment environs.
Although high winds are typically associated withhigh dust levels the situation may arise when theground is frozen, saturated (following a rain storm) or
57

UPWIND LOCATION:
DOWNWIND LOCATIONS
LEGEND
SAMPLING LOCATIONS
) OFF-SITE LOCATION TOEXAMINE EFFECT OF ROADWAY
Fig. 7.2 - Selection of sampling locations for wind-blown dust with land-use effect
covered with snow, thereby greatly inhibiting the dustgeneration rate. Conversely a saturated soil con-dition could be 'dried up' by continued high windsthereby increasing the dust generation rate.
Physical characteristics of the tailings solids such asparticle size, moisture content and density are impor-tant factors in determining the aerodynamic proper-ties of the wind-blown dust. The tailings solids sizedistribution also plays an important role in determin-ing the downwind concentrations. The mechanismsby which tailings are moved by wind are similar to themovement of sand and soil. Bagnold (1959) consi-dered three types of particle transport: saltation(bouncing), creep (rolling), and suspension. The windcauses large particles, which have a relatively largeaerodynamic drag, to bounce or roll across the tail-ings surface. The impact of large particles on thesmaller tailings particles is the actual source of sus-pended material. The larger airborne particles (in theorder of 40-80 u.m in diameter) are quickly brought to
the ground by gravity. The smaller suspended dustparticles (less than about 40 ixm in diameter) can becarried by the air currents for substantial distances.
The chemical/mineralogical characteristics of thetailings solids are important not so much in terms ofgeneration rates but in terms of the assessment ofthe potential environmental or health concerns asso-ciated with the wind-blown dust levels.
7.3.2 Sample Collection Methods
High volume air samplers have been used exten-sively for about three decades to determine con-centrations of total suspended paniculate material.The high volume sampler is a device that draws aknown volume of ambient air through a filter with ahigh flowrate blower within a measured time interval.A typical high volume sampler is shown in Fig. 7.3. Todetermine the concentrations (e.g., gravimetric),chemical, or other characteristics of the particulate
58

on the filter, three independent determinations mustbe made, namely: mass of particles; volume flowrateof ambient air through the filter; and the samplingtime. All three must be measured with sufficientaccuracy to give the required accuracy in the calcu-lated result. Typical examples of suitable accuraciesare mass to the nearest milligram; flowrate to thenearest 0.03 cubic metre per minute; and time to thenearest two minutes (Alberta Environment, 1977).
Fig. 7.3 - High volume air sampler for determination of suspendedpaniculate
Suspended paniculate sampling is commonly car-ried out for a 24-hour period, from midnight to mid-night, with samples taken every 6th day to corre-spond with the National Air Pollution Surveillancenetwork (NAPS) sampling schedule. However, varia-tions in sampling duration and frequency may beincorporated into the specific program as requiredi.e., heavy dust loadings may require reduction in thesampling duration to 6 or 8 hours. Alternatively,samplers may be run continuously to obtain a suffi-ciently large sample for chemical/radiological analy-sis.
The detailed sampling method is outlined by Environ-ment Canada in "Standard Reference Method for theMeasurement of Suspended Particulate in theAtmosphere (High Volume Method)" and in ASTM(1983) Volume 11.03: D4096-83.
The standard high volume air sampler can collectparticles up to 100 ^m in size but is not capable ofseparating them into particulate size ranges. Theamount of dust present in the respirable size rangecan also be important. As a result of this interest in therespirable fraction of suspended particulate matter,several types of high volume samplers have beendesigned specifically to measure smaller particlesize fractions. The dichotomous sampler or virtualimpactor, and the size selective inlet are two exam-ples of such devices. Specific reference must bemade to suppliers' data sheets for information onparticle size ranges and collection efficiencies forsuch detectors. The greater costs for such units com-pared to high volume samplers have limited theirwidespread use in the air monitoring field. Despitethis problem and the need to consider newer sus-pended-particulate measurement techniques, theuse of the traditional high volume sampler is a widelyrecognized and long-used method (N cholas and Vi-salli, 1981) and will probably continue to provide thebasic data in this field.
For dustfall sampling, an open topped cylinder with aflat bottom, of a specified size and shape (typically152 mm diameter and 457 mm deep) is supportedabove the ground and left open to collect settleableparticulate matter over a 30-day period. A typicalconfiguration is shown in Fig. 7.4. Since these dust-fall jars are passive collectors and do not require anyelectrical power, the selection of a suitable samplinglocation is less restrictive than that for the high vol-ume sampler. However, the dustfall jar should belocated with a clear field of exposure, free of inter-ference from buildings or other high objects. The topof the jar should be a minimum of 2.5 m and a maxi-mum of 15 m above any other surface in the immedi-ate vicinity. Procedures for the collection of dustfallsamples are described in ASTM Volume 11.03:D1739-82.
The dustfall jar should be left for a 30-day exposureafter which it should be removed and replaced with aclean jar. (In certain situations a longer exposure maybe desirable). Following removal, the jar should becapped and sealed to prevent any loss or leakage ofthe contents during shipping to the laboratory.
For areas where the sample volume may be too smallto carry out the required analyses, the number of jarsat each location may be doubled. If this double jarprocedure results in insufficient sample volume, thenmultiple monthly composite samples may be re-quired. Review of initial data will aid in the selection ofthe appropriate sampling scenario.
59

Fig. 7.4 - Dustfall sampler
7.3.3 Analytical Methods
At the end of the sampling period, the exposed filterfrom the high volume air sampler should be carefullyremoved, folded in such a manner that sampletouches sample, and placed in the appropriatelylabelled envelope for shipment to the laboratory. Atthe laboratory, the samples should be dried andweighed to determine the total suspended particulatematter concentration (SPM). Once the total SPM hasbeen determined the filter may be cut into portions(typically 1/4) to form a monthly (or longer time) com-posite for analysis of various components such asradionuclides and metals. For more detailed informa-tion on the analysis techniques, the laboratory(ies)carrying out the sample analysis should be con-sulted. Particular attention should be given to thelower limit of detection and the coefficient of variation(or equivalent) quoted by the selected laboratory forthe required analyses. Samples should also beselected for inter-laboratory comparisons.
Following a 30-day exposure period the dustfall jarsare sent to the lab for analysis of total and total fixed
dustfall. The terms 'total dustfall' and 'total fixed dust-fall' are defined as the amount of material left afterevaporation of a sample of dustfall in water and itssubsequent drying in an oven at 103°-105°C for onehour, and igniting at 550°C for 30 minutes. The totaldustfall includes both suspended and dissolved mat-ter. The total fixed dustfall is the portion of the totaldustfall remaining after ignition. The loss in weight ismainly due to combustion of organic matter.Once the total dustfall analysis has been completed,additional testing may be carried out on the dustfallfor various components including heavy metals andradionuclides as discussed for SPM.
7.4 RADON7.4.1 Parameters
Radon-222 will be released from tailings surfaces foras long as the radium-226 parent (half-life 1620y) ispresent. Radium concentrations in uranium tailingsare typically in the order of 10 to 20 Bq/g of tailings.However, only a fraction of the radon producedthrough the natural decay of radium in the tailingsmass is released from the surface of the tailings. Oneof the most important factors in determining this massmaterial release is the fraction of radon that escapesfrom the solid tailings particles and is free to diffuse(emanation fraction). Experiments have shown that a15-25% radon emanation fraction applies to manytailings areas (USNRC, 1980; Chambers et al.,1980). When all factors are considered, in effect onlythe radon produced in the top 1 -2 m of tailings canpoientially escape to the atmosphere (Swift et al.,1976).
As discussed earlier, the rate at which radon diffusesfrom the surface of tailings depends on many factors.The release rate has been shown to vary by 10 timesor more due to the effects of weather e.g., changes inbarometric pressure, atmosphere stability, rainfall,changes in wind speed and the presence of freezingconditions or snow cover. As an example, exhalationrates measured during the summer of 1977 at ElliotLake tailings areas ranged from 0.33 to 70.6 Bq/m2/s(James F. MacLaren Ltd., 1978).
In addition, the water content of the tailings alsoaffects the radon diffusion rate. Theoretical calcula-tions indicate that water saturated tailings will reduceradon diffusion by a factor of ten or more as com-pared with dry tailings. Awareness of these manyfactors and their influence on radon diffusion isessential in the design and operation of successfulradon and radon daughter monitoring programs.
While radon daughter concentration is the importantfactor in health assessment, measurement of radonconcentration provides the most convenient measureof release rate from tailings and its effect on local airquality.
60

7.4.2 Radon Exhalation Measurements
Radon gas exhalation rates from tailings surfaces areeasily measured by an in situ accumulation method.For this procedure a container of suitable size (typ-ically 25 litres) is placed with the open end on thesurface of the tailings and the increase in con-centration of radon in the container is measured withtime. A typical radon flux sampler is shown in Fig. 7.5.
By measuring the concentration of radon releasedinto the drum with time, the rate of exhalation can becalculated. A detailed description of this method isfound in Bernhard et al. (1975).
Other techniques such as the charcoal cannistertechnique described by Countess (1977) have alsobeen used to determine radon flux. Recently, applica-tion of this technique to uranium tailings has beendescribed by Silker and Heasler (1979).
SCINTILLATIONCELL
DIRECTION OFSAMPLE FLOW
PORTABLE DC.AIR PUMP
RUBBER SURGICALTUBING
25 LITRES CAP. FLUX CAN
Fig. 7,5 - Apparatus for measurement of radon flux from tailings surface
61

7.4.3 In Situ Radon Measurements
Where tailings are sufficiently dry, radon gas con-centrations can be measured at various tailingsdepths to determine the average radon driving forcefor the specific tailings. The typical approach is toplace detectors (or take measurements) at specifieddepths in a tailings impoundment in order to measureradon concentration versus depth. These data pro-vide a direct measurement of the diffusion propertiesof the tailings material. Application of track etch tech-niques to radon flux measurement has beendescribed by Fleischer (1980). The installation ofsolid-state radon gas probes in tailings and radonmeasurement has been described in detail by Bigu etal. (1982).
7.4.4 Ambient Air Monitoring
Both ambient radon and radon daughter con-centrations are important in assessing potentialdoses to man. Ambient radon can be measured inseveral ways including time averaged measurementthrough the use of passive monitors or by takinginstantaneous or grab samples. The passive methodinvolves the use of nuclear track etch detectors tomeasure the average (time integrated) ambientradon concentration (typically over exposure periodsof several weeks or even months). The grab samplemethod involves the use of high and low volumepumps, filters, scintillation cells and photomultiplier-sealer assemblies to determine the actual radon andradon daughter concentrations at the time of sam-pling. Instantaneous radon and radon daughter mea-suring devices are also commercially available.
Typically the track etch detector film is mounted in thebottom of a light plastic cup. A filter material is affixedto the mouth of the cup to prevent entry of radondaughters and dust, and the cup is installed in aprotective all-weather shelter at the sampling loca-tion.
Once the specified sampling duration has beenattained, the cup/detector assembly is removed fromthe shelter and sent for analysis. Such a passivesystem is only capable of measuring the averageradon or thoron concentration over the specified timeperiod.
For the radon grab sample techniques, a filtered airsample is drawn through a scintillation cell for a spec-ified period of time at a sufficient flowrate to allow atleast 10 air changes in the cell. After a suitable delayperiod to permit the ingrowth of radon daughters, thescintillations produced by the decaying radon/radondaughters are counted and converted to a radonconcentration using the calibration factors suppliedby the manufacturer.
For the radon daughter sampling technique a cali-brated high volume pump (30 L min) is used to drawair through a filter of 0.45 urn porosity for a specifiedperiod of time (5-10 minutes). Radon daughter con-centrations are typically determined following themodified Kusnetz method (IAEA, 1976) which con-sists of counting the alpha-emitting radon daughtersthat are deposited on a filter by removal from a knownvolume of air. In recent years, several manufacturershave offered continuous radon and working levelmonitors to the commercial market. The reader isreferred to the suppliers' literature for specific details.
7.5 QUALITY ASSURANCEThe accurate and comprehensive recording of fielddata and sampling procedures is a vital component ofan air quality monitoring program. Field data andsampling information wiil include: sample identifica-tion numbers; sample locations; period of sampleroperation; general weather conditions and specificweather incidents (high winds, heavy rain, etc.); andinstrument calibration data. This type of informationis best recorded on prepared field data collectionforms to ensure that all pertinent observations aremade and the data recorded in a standardized man-ner. An example of a sample collection form for a highvolume air sampler is shown in Fig. 7.6.
Recalibration of a high volume sampler is required atleast twice a year and after every motor and brushchange to maintain air volume accuracy. The brushesof the sampler should be checked on a regular basis,and generally require replacement every 400-500hours of operating time. It is recommended that theowner's manual be consulted for specific calibrationand servicing instructions.
7.6 PROGRAM COSTSThe major cost of air quality sampling programs aturanium tailings impoundments involves the acquisi-tion and initial set-up of the monitoring instrumenta-tion. The following are generalized unit cost esti-mates which can be used to develop overall programcosts.
The cost for the acquisition and initial set-up of atypical high volume suspended particulates airsampler by qualified field personnel would beapproximately $2,500 to $3,500 per sampler in 1984.The cost for the acquisition and set-up of typicaldustfall collectors would be approximately $200 persampler in 1984. The cost of materials for ambientradon measurements using track-etch cups would beapproximately $150 to $200 per measurement in1984. The cost of acquisition of equipment for radonflux measurements is approximately $5,000 to$6,000 with an operating cost of approximately $200per measurement in 1984.
62

Project:
HI-VOL. FILTER DATA RECORD
STiAOY
Sampler Data:
Identification No.Date of Last Calibration
Field Data:
LocationFilter No.Collected By
Date
Time
RotameterReading
Temperature
START
MAY I 2, I 963
2.3 5To
5" cc
STOP
MAY I 3, I1&3
2.32-S-
8 °c
Weather Data:
WindDirectionVisibilityCloudsHumidity
Other Data:
Calm,NorthClear,Clear,Dry ,
X
><
Liqht,East,HazyScattered,Moderate,
Strong,South, y
X Overcas'..X Humid
Gusty: West
Filter No.Data Recorded byFinal Weight
Initial Weighttlet I'articulate WeightTotal Sampling Time
Doe
<?.
23 3SHrs.Min.
Average FlowrateParticulate Concentration
Comments:
scfmug/m3
Fig, 7.6 - Example of high volume air sampling form (completed for a typical sampling period).
63

7.7 REFERENCESAlberta Environment (1977). Air Monitoring Directive.
AMD-77-1, Power Generating Industry, December,1977.
American Society For Testing and Materials (ASTM)(1983) 1982, Volume 11,03: Atmospheric Analy-sis, Occupational Health & Safety.D1357-82 Method for planning the sampling of the
atmosphere.D1739-82 Method tor collection and analysis of dust
fall (settleable parliculates).D4096-83 Practice for the application of Hi-Vol (high-
volume) Sampler method for collection andmoss determination of airborne paniculatematter.
Bagnold, R.A. (1959). The Physics of Blown Sandand Desert Dunes. Metheun and Co. Ltd.
Bernhard, E.E.; Johns, F.B. and Kaufman, R.F.(1975). "Radon exhalation and uranium mill tailingspiles. Description and verification of the measure-ment method". US Environmental ProtectionAgency, EPA Report ORP/LV-75-7CA
Bigu, J.; Grenier, M.; Dave, N.K. and Urn, T.P. (1982)."Study of radon gas emanation from uranium minetailings areas. A progress report". CANMET- ElliotLake Laboratory, December, 1982.
Chambers, D.B.; Lowe, L.M.; Cassaday, V.C.;Nantel, J.H. and Archibald, J.F. (1980) "Develop-ment and use of radon source terms in environ-mental impact assessments". Paper presented atHealth Physics Society 25th Silver AnniversaryMeeting, Seattle, Washington, July 20-25, 1980.
Colorado Department of Health (C.D.O.H.) (1981)."Fugitive dust emissions". Prepared by the Air Pol-lution Control Commission, September 30, 1981.
Countess, R.J. (1977). "Measurements of theradon-222 flux with charcoal cannisters". Article inWorkshop on Methods for Measuring Radiation inand around Uranium Mills, Editor: E. Harward,Atomic Industrial Forum Report 3:9.
Environment Ontario (1981). Air Quality Measure-ment. Studies Carried Out in the Elliot Lake Area,1976-1980 - A compilation of data.
Fleischer, R.L. (1980). "Radon flux from the earth:Methods of measurement by the nuclear trackmethod". Physical Chemistry Laboratory, GeneralElectric Company, May 1980.
International Atomic Energy Agency (IAEA) (1976).Manual on Radiological Safety in Uranium andThorium Mines and Mills, IAEA Safety Series, No.43.
James F. MacLaren Limited (1978). EnvironmentalAssessment of the Proposed Elliot Lake UraniumMines Expansion, Volume 4 - Environmental As-sessment.
Nicholas, P.K. and Visalli, J.R. (1981). "Comparisonof three methods for measuring suspended par-ticulate concentrations". Environmental Scienceand Technology, 15:2:219-223.
Silker, W.B. and Heasler, P.G. (1979). "Diffusion andexhalation of radon from uranium tailings". Pre-pared for U.S. Nuclear Regulatory Commission byPacific Northwest Laboratory.
Swift, J.J.; Hardin, J.M. and Calley, H.W. (1976)."Potential radiological impact of airborne releasesand direct gamma radiation to individuals livingnear inactive uranium mill tailings piles". U.S. Envi-ronmental Protection Agency, EPA-520/1-76-001.
USNRC, (1980). "Final generic environmental impactstatement on uranium Milling". Nuewf-0706, Vol-ume 3, Appendix 6.
64

8. CASE HISTORY - SAMPLING PROGRAMS ATDENISON MINES, ELLIOT LAKE, ONTARIO
8.1 INTRODUCTIONThe following case history describes the samplingprograms which have been conducted at the DenisonMines Limited Tailings Management Areas at ElliotLake, Ontario. Information on various aspects of thesampling programs presented in this case history isprincipally derived from Denison Mines data andreports by La Rocque and Webber (1978), James F.MacLaren Ltd., (1978) and Feenstra et al. (1981).
Denison Mines is located 16 km north of the town ofElliot Lake in Ontario (see Fig. 8.1). Elliot Lake is in awet temperate climatic region which receives approx-imately 97 cm of precipitation annually. The precipita-tion is relatively evenly distributed throughout theyear with monthly average precipitation ranging from5-10 cm. The Elliot Lake area is snow covered fromNovember to April and experiences mean July tem-peratures of 18°C.
The Denison orebody is a uraniferous quartz-pebbleconglomerate, grading approximately 0.1 per centU308. The mine and mill operations commenced in1957 at a design capacity of 5400 tonne/day. Themine-mill capacity was increased to 6400 tonne/dayin 1974 and to 13 400 tonne/day in 1982. The uraniumis leached from the ore using a strong sulfuric acidsolution. Uranium is extracted by strong base ionexchange and precipitated as ammonium diuranate.The barren tailings solids and barren ion exchangesolution are neutralized with lime and discharged tothe tailings impoundment as a slurry consisting of 30to 40 per cent solids. The tailings discharge is cur-rently neutralized to a pH of 9 to 10, but during the1950's and early 1960s was only neutralized to a pHof 6 to 7. From 1957 to 1959, tailings were dischargedto the Smith Lake -Williams Lake area to the south ofthe mill (see Fig. 8.2). Since 1959, tailings have beendischarged to Long Lake.
The following case history describes the samplingprograms conducted at the inactive Williams Laketailings impoundment and the currently active LongLake tailings impoundment.
The tailings discharged to the tailings impoundmentscontain from 3 to 7 weight per cent pyrite. When thedischarge of neutralized tailings ceases and the tail-ings in the inactive tailings impoundments, such asWilliams Lake, are exposed to the atmosphere, pyriteoxidation commences close to the surface of thetailings. Pyrite oxidation produces low pH conditionsand high concentrations of iron and sulfate in thetailings porewater. These conditions result in therelease of high concentrations of heavy metals andvarious radionuclides from the tailings sc':ds into thetailings porewater. This poor quality porewater canmove out of the tailings impoundments via surface
water runoff, seepage or exfiltration and could haveunacceptable effects on the surrounding environ-ment. At the present time, these effects are controlledby collection and treatment of contaminated runoffand seepage. Pyrite oxidation is not a significantproblem in active tailings impoundments such asLong Lake due to the continual input of neutralizedtailings.
8.2 WILLIAMS LAKE TAILINGS IMPOUNDMENT8.2.1 Introduction
The Williams Lake tailings impoundment covers10.6 ha and contains approximately 1 million tonnesof tailings. The tailings impoundment is enclosed bybedrock ridges to the north and south, and by DamsNo. 1 and No. 2 to the west and east respectively. Thebedrock ridges consist of relatively low permeabilitymetamorphosed conglomerates, siltstones andarkoses of the lower Proterozoic Gowganda Forma-tion. The tailings in the central portion of the im-poundment are up to 12 m in thickness, and areunderlain by thin (<3 m) deposits of glacial till anddiscontinuous layers of silt and peat. Dam No. 1 isapproximately 8 m in height and consists of earthfill.Dam No. 2 is approximately 10 m in height and con-sists of spigotted tailings. Because tailings were dis-charged into Williams Lake from Smith Lake, thesurface of the tailings slopes from east to west at agrade of approximately 0.5 per cent, and sand tail-ings predominate in the east end of the impoundmentwhile silty tailings predominate in the west end. Dur-ing the late 1950's, a failure of the decant systemresulted in a spill of tailings down the valley to thewest of Williams Lake. This spill area was cappedwith glacial till and vegetated (Murray et al., 1979).Until 1970, the surface of the tailings impoundmentremained relatively dry. The decant structure wasraised in 1970 and thus created a headpond which, attimes, covers up to half the surface of the tailingsimpoundment. Remedial works were implementedin 1979 to improve the stability of Dam No. 1 (seeReadeset al., 1981).
Since the Williams Lake tailings impoundment wasdeactivated in 1959, a variety of sampling programshave been implemented for a variety of purposes.These programs have included sampling of tailingssolids, surface water runoff, seepage, tailings pore-water and wind-blown dust. The sampling of runoffand seepage was conducted as part of DenisonMines routine monitoring program. Wind-blown dustsampling was conducted as part of the 1976-1978environmental assessment of uranium mining in theElliot Lake area. The sampling of tailings solids andtailings porewater was conducted as part of a con-tinuing program at Denison Mines directed toward
65

U.S.A. TO*
-DENISON MINES[TAILINGS IMPOUNDMENTS
| INACTIVE I[TAILINGS IMPOUNDMENT
1 ACTIVE J
Fig. 8.1 - Location of Denison Mines tailings impoundments
66

the design of appropriate procedures for the futurelong-term decommissioning or 'close-out' of uraniumtailings impoundments.
8.2.2 Tailings Solids Sampling
For the purpose of tailings solids sampling, three (3)boreholes were put down in March of 1980 along theaxis of the tailings impoundment at the locationsshown in Fig. 8.2. Winter access was necessary dueto the extremely soft nature of the surface of thetailings. The boreholes were advanced to depths ofbetween 7.0 m and 12.6 m below tailings surfaceusing a skid-mounted diamond drill rig operating fromthe frozen surface of the tailings. The boreholes wereadvanced through the tailings by wash boring tech-niques utilizing H-size casing to a depth whererefusal was encountered.
Semi-continuous core samples of the tailings wererecovered by piston sampling techniques as theboreholes were advanced. A total of thirty-one indi-vidual tailings samples were recovered using thistechnique. The samples were sealed inside thepiston sampler tubes with paraffin wax and trans-ported to a laboratory for analysis. The samples werethen extruded in the laboratory and logged to deter-mine the tailings stratigraphy. A total of nineteen sam-ples were selected for sieve, hydrometer and watercontent analyses and chemical analyses.
The tailings core samples were chemically analysedfor water leachable sulfate to determine the gypsumcontent; acid soluble iron and manganese to deter-mine the oxyhydroxide mineral content; pyrite con-tent; total carbonate mineral content; and cationexchange capacity.
The results of the chemical analyses of the tailingssamples are summarized in Table 8.1. These resultsindicate that soluble sulfate minerals compriseapproximately 3 weight per cent of the tailings solids.
The soluble sulfate minerai is predominantly gypsumformed from the lime neutralization of the sulfuric acidleach solution in the mill, with minor amounts of jar-osite (Kaiman, 1977).
The pyrite content of the tailings, as indicated by thesulfide analyses, is of the order of 7 weight per cent.The pyrite in the tailings was derived from the pyrite inthe original ore. The leachable iron analyses repre-sent the concentration of the iron oxide and oxy-hydroxide minerals in the tailings. The relatively smallamounts of these minerals in the tailings result fromthe precipitation of the oxides and oxyhydroxidesduring the lime neutralization of the mill discharge.
The results of the carbonate analyses indicate smallamounts of carbonate minerals in the tailings. Thecarbonate in the tailings is thought to occur as cal-cium carbonate from the limestone impurities in thelime used for neutralization of the mill discharge. Theremainder of the tailings solids are comprised ofquartz, feldspar and alumino-silicate minerals whichwere present in the original ore. The cation exchangecapacity of the tailings is relatively low due to thesmall amounts of clay minerals in the tailings.
Figure 8.3 shows an example of the variation in car-bonate content and cation exchange capacity withdepth in the tailings and with the tailings stratigraphy.The concentrations of soluble sulfate, leachable iron,carbonate and the cation exchange capacity in-crease with decreasing grain size of the tailings (Fig.8.4). This indicates that gypsum, iron oxyhydroxideand carbonate minerals are more abundant in thefine grain fraction of the tailings and are segregatedinto the finer grained silty tailings. The cationexchange capacity increases with decreasing grainsize due to the larger proportion of clay minerals andlarger grain surface area in the finer grained siltytailings. The concentrations of pyrite in the tailings donot, however, increase with decreasing grain size ofthe tailings.
Constituent
Table 8.1 - Summary
Williams
of chemical analyses of
Lake Tailings Impoundment 1981(19 Samples)
Concentration
Range
tailings solids
(wt. per cent)
Mean
Soluble sulfate(as SO4)
Sulfide(as FeS2)
Leachable Iron(as Fe)
Carbonate(as CaC03)Cation ExchangeCapacity (meq/100g)
0.18 - 9.9
2.2 , - 10.5
0.08 - 1.33
<0.003 - 0.4
0.75 -15.7
2.8
7.2
0.5
0.06
2.9
From Feenstra et al. (1981).
67

LE6EN0
0 SURFACE WATER SAMPLINO LOCATION• 80BEH0LEA PIEZOMETER NEST
Fig. 8.2 - Williams Lake and Long Lake tailings impoundments
68

BOREHOLE 2STRATIGRAPHY
SILTTAILINGS
FINE SAND-TAILINGS
CARBONATEAS CACO3 (WT «
0.001 0.01 O.I
~ 4V)UJocUJ
S 6
IHQ.
10
1.0
CATION EXCHANGE CAPACITY(meq/IOOg)
0 2 4 60
wLL)
a.UJo
10
Fig. 8.3 - Example of tailings stratigraphy and tailings solids chemistry - Williams Lake

~ 1.0
roOoS 0.1
(U
§ 0.01
0.001
oo
1000>
E
i
<Io2
10
1.0
0.1 I
1.0 0.1 0.01 1,0 0.1
MEAN TAIUNGS GRAIN SIZE (mm)Fig. 8.4 - Chemical composition of tailings solids versus tailings grain size - Williams Lake
0,01
8.2.3 Surface Water SamplingThe quantity and quality of surface water runoff fromthe Williams Lake tailings impoundment is monitoreddownstream of Dam No. 1 and the treatment plant(see Fig. 8.2). Samples are collected according to thefollowing schedule:
Frequency TypeDailyDaily GrabWeekly GrabWeekly Composite
ParameterFlowpHTSSTDS, iron alkalinity, acid-ity, nitrate, ammonia, dis-solved radium-226
Composite Total radium-226MonthlyEvery 4Months Grab Sulfate, chloride, potas-
sium, calcium, magne-sium, sodium, barium,copper, nickel, lead, co-balt, zinc, and manga-nese.
The results of this monitoring are reported annuallyby Environment Ontario in their compilation of Ser-pent River Basin Water Quality Data. The results ofthe 1981 monitoring are shown in Table 8.2.
The surface water runoff downstream of the WilliamsLake tailings impoundment represents surface waterrunoff from the tailings and surrounding catchmentarea, direct precipitation, and seepage from the tail-ings impoundment through Dam No. 1. Before treat-ment, this runoff is characterized by low pH and highconcentrations of iron, acidity and radium-226. Treat-ment of the runoff involves the addition of lime andbarium chloride to increase the pH and decrease iron,acidity, and radium concentrations. The results ofmonitoring the treated runoff indicate that treatment isgenerally effective at controlling pH, iron, acidity andradium. There is a wide variation in the concentrationof many parameters due to the varying effects ofdilution by precipitation and uncontaminated runofffrom the surrounding catchment area.
8.2.4 Piezometer Installation
During the spring of 1980, five nests of piezometerswere installed in the Williams Lake tailings impound-ment for the purpose of hydraulic head measure-ment, hydraulic conductivity testing and tailings pore-water sampling. The locations of the piezometernests are shown in Fig. 8.2. Each piezometer nestconsists of ten piezometers with the exception ofPN-3 which consists of nine piezometers (see Fig.
70

Table 8.2 - Example of results of surface water sampling - WilliamsLake tailings impoundment Stn D-3 downstream ofimpoundment and treatment plant - 1981
Parameter
Flow (L s)pHTSSTDSIronAlkalinityAcidityNitrateAmmoniaTotal Radium (Bq L)Diss. Radium (Bq'L)
SulfateChloridePotassiumCalciumMagnesiumSodiumBariumCopperNickelLeadCobaltZincManganese
Mean
6.79.13
7000.50
852320.740.48
370150
1490
0.97191
0.40.02
• 0.040.0050.020.030.06
Range
07.0 -
• 1
74• 0.02 -25
0• 1• 1
0.23 -0.12 -
290140
1.3 -30
0.95 -191
0.2 -0.01 -0.040.0050.02 -
• 0.01 -0.02 -
14011.028
15701 5
37056
881.491.60
5iO16727
1981.0
0.80.03
0.020.050.12
Number of Samples
130234
495050515150521351
3
233t3322233
All concentrations in mg LAlkalinity and acidity expressed as mg L CaCo3
Nitrate and Ammonia expressed as mg L as N.
From Environment Ontario (1981 a).
8.5). Individual piezometers were installed to depthsof 0.3 to 8.5 m beiow the tailings surface. Pie-zometers consisted of 3.2 cm diameter PVC drive-point piezometers with porous polyethylene intakes(see Fig. 6.2). This type of piezometer was used toallow the use of syringe sampling techniques for thecollection of porewater samples with high ferrous ironconcentrations, and to allow the installation of thepiezometers manually without the use of a drill rigdue to the poor accessibility of the tailings to heavyequipment in the non-winter months.
The piezometers were installed manually using avibration technique with a hand-operated, gasolinepowered rock drill (Atlas-Copco 'Cobra'). The pie-zometer points were advanced to the desired depthby driving coupled 1.5 m long sections of Schedule40 PVC pipe. A steel driving mandrel formed anadaptor for the rock drill and provided the rigidity fordriving the PVC pipe. The tailings below the watertable liquified around the piezometer tip during driv-ing, allowing the piezometer to be advanced readily.
Following installation of the piezometers, hydraulichead was measured periodically using an electricsounding tape to determine the directions of pore-water flow. Rising-head response tests were con-
ducted in 12 of the piezometers to determine thehydraulic conductivity of the tailings (see Fig. 6.7).
The western portion of the Williams Lake tailingsimpoundment is covered by a shallow headpondadjacent to Dam No. 1. The water table in the easternportion of the tailings impoundment occurs within0.3 m of the surface of the tailings. The water tableapproximately follows the surface of the tailings slop-ing from east to west, representing a horizontalhydraulic gradient of 0.5 per cent. Vertical hydraulicgradients within the tailings are approximately 1.5 to2.5 per cent and are generally downward throughoutthe tailings impoundment. An example of the verticalhydraulic head profiles is shown in Fig. 8.6. Upwardhydraulic gradients can occur in the vicinity of DamNo. 1 when the headpond levels are low. Thesehydraulic gradients indicate that porewater within thetailings flows predominantly from east to west andvertically downward into the tailings. During periodswhen the headpond levels are low, tailings porewaterdischarges to the surface and contributes to surfacewater runoff from the tailings impoundment.
The horizontal hydraulic conductivity of the tailingsmeasured by the rising-head tests ranged from 104
cm/s in sandy tailings to 10-6 cms in silty tailings.
71

Fig. 8.5 - Example of piezometer nest at Williams Lake
Because the hydraulic gradients within the tailingsimpoundments are generally small, and the hydraulicconductivity of the tailings is relatively low, the move-ment of porewater through the tailings is correspon-dingly slow. Tailings porewater velocities are approxi-mately 0.5 cm year to 20 cm year.
8.2.5 Tailings Porewater Sampling
Tailings porewater samples were collected from 36 ofthe 49 piezometers installed in the Williams Laketailings impoundment. Each piezometer was purgedcompletely using a suction-lift pump and allowed torefill overnight prior to collection of the samples.Porewater samples were recovered from thepiezometers using a down-the-hole syringe samplingdevice (see Fig. 6.11). The syringe sampler was fittedwith a 25 mm diameter filter holder with a 0.45 ^mfilter membrane so that the porewater samples werefiltered in the piezometer as the syringe filled. Theporewater samples were retained in the 50 mLsyringes and were tightly capped to prevent exposureto the atmosphere. The porewater samples were keptin an ice chest following collection and were delivereddirectly to the Denison Mines Analytical Laboratoryfor analysis.
The pH and electrical conductance of the porewatersamples were measured in the field at the time of
sampling. The samples collected for the analysis ofalkalinity, acidity, total dissolved solids, nitrate, nitrite,ammonia, chloride and fluoride were delivered to thelaboratory for immediate analysis without the addi-tion of preservatives. The water samples collectedfrom each piezometer for the analysis of majorcations (calcium, magnesium, sodium, potassium,aluminum, silicon), heavy metals (manganese,cobalt, nickel, copper, lead, zinc, total iron and fer-rous iron) and sulfate were preserved with 0.5 mL ofconcentrated hydrochloric acid. Samples of tailingsporewater were also collected from selected pie-zometers for the analysis of radium-226. This sam-pling involved the collection of 1 L porewater sampleswhich were filtered immediately through 142 mmdiameter 0.45 pim filter membranes and were pre-served with 10 mL of concentrated hydrochloric acid.
Two types of porewater occur in the tailings and canbe identified according to theirchemical composition.The tailings porewater which occurs near the bottomof the tailings in the Williams Lake tailings impound-ment is characterized by neutral pH (6-7). low con-centrations of ferrous iron (•- 100 mg L) and moderateconcentrations of sulfate (1500 - 2500 mg L). Thechemical composition of this porewater closelyresembles that of the original mill process water dis-charge. The chemical composition of this original
72

PIEZOMETER NEST 2 ; SEPT. ,1981
HYDRAULIC HEAD (+ 2804m. )
0 16 17 18 19 20
CL
Q
8 -
GROUND SURFACEELEVATION 2 8 0 9 . 6 m .
Fig. 8.6 - Hydraulic head vertical profile - Williams Lake
process water' has not been substantially altered bygeochemical processes in the tailings.
The tailings porewater which occurs close to thewater table in the tailings is characterized by low pH(2-6), and high concentrations of ferrous iron(200-2500 mg/L) and sulfate (2500-6500 mg-'L). Thisporewater represents water which has recharged intothe tailings impoundment since the deposition of tail-ings ended. The chemical composition of this pore-water has been substantially altered by the oxidationof pyrite in the tailings.
The extent of movement of 'recharge water' into thetailings is dependent on the nature of the tailingsmaterials and the hydraulic gradients. Where thereare small downward hydraulic gradients, the re-charge water' has penetrated into the tailings todepths of 1.5 m to 4.6 m below the surface of thetailings. These depths of penetration correspond TOvertical porewater velocities of 7 cm/year to 23 cm/year. Such velocities are comparable to those calcu-lated from the hydraulic gradient-hydraulic con-ductivity relationships. The depth of penetration ofthe 'recharge water' into the tailings at a selectedpiezometer nest is shown in Fig. 8.7.
The pattern of 'recharge water' penetration into thetailings identified at the Williams Lake tailingsimpoundment is also identified at the other inactivetailings impoundments at Elliot Lake by Cherry et al.(1980) and Feenstra et al. (1981) in areas wheredownward hydraulic gradients occur. At other inactivetailings impoundments in areas where the hydraulic
gradients are upward, the 'recharge water' does notpenetrate into the tailings (Cherry et al., 1980).
The low pH and high concentrations of iron and sul-fate in the 'recharge water' in the tailings result in therelease of heavy metals such as cobalt, nickel, leadand zinc from the tailings solids into the tailingsporewater. The concentrations of these heavy metalsare therefore higher in the 'recharge water' in thetailings than in the 'process water'. The results ofMoffett and Tellier (1978) and Morin et al. (1982)indicate that the activities of radionuclides such asuranium and thorium are also higher in the low pH'recharge water' than in the 'process water'.The activity of radium-226 in the tailings porewaterranges from 1.3 to 6.33 Bq/L at the Williams Laketailings impoundment. The radium-226 activity in thetailings porewater is not higher in the 'recharge water'than in the 'process water'. The ranges in radium-226activities determined in the tailings porewater atWilliams Lake are comparable to those determined inthe other inactive tailings impoundments at ElliotLake by Cherry etal. (1980).
8.2.6 Wind-blown Dust and RadonA limited amount of specific information on wind-blown dust and radon for the Williams Lake tailingsimpoundment was collected during the environmen-tal assessment of uranium mining at Elliot Lake in1976-1978. Suspended particulate concentrations inair were measured at one location to the east ofWilliams Lake using a high volume air sampler.
73

PIEZOMETER NEST 2t SEPT. 1981pH
2 -
V)w
jjj 4 U
X
4
6 "
6 101
-
-
-
1
6
? 1J11
; 1
j
1
0 2000 4000 6000 8000 10000
ELECTRICAL CONDUCTANCE <MS/cm)
FERROUS «0N (mq/L)0 2000 4000 6000 8000
0 i 1 1 1 r ,
2 -
JK4-,X
a.
I/7 t
/
• o1
iii
it
i i
RECHARGE WATER'
'PROCESS WATER'
8
0 2000 4000 6000 8000SULFATE (mg/L)
Fig. 6.7 - Porewater chemistry vertical protile - Williams Lake

Ambient radon measurements in air and radonexhalation measurements were conducted on onlyone occasion at the Williams Lake tailings impound-ment. No dustfall measurements were collected spe-cifically for the Williams Lake tailings impoundment.Because of the limited number of air quality andradon measurements for Williams Lake, these dataare presented together with those for two other inac-tive tailings impoundments in the Elliot Lake area(Stanrock and Nordic).
Table 8.3 shows the results of suspended particulatemeasurements at the Williams Lake, Stanrock andNordic tailings impoundments together with the fed-eral air quality objectives for suspended particulate.
The geometric mean suspended particulate con-centrations at the inactive tailings impoundments areless than federal air quality objectives. Twenty-four-hour concentrations measured at the inactive tailingsimpoundments occasionally exceed federal guide-lines. Suspended particulate concentrations atWilliams Lake are considerably lower than Stanrockor Nordic. This difference is likely due to the wetnature of the surface of the Williams Lake tailingscompared to the other areas.
A limited radionuclide analysis was conducted onone suspended particulate sample from each of theStanrock and Nordic tailings impoundments. Similarresults would be expected for suspended particulate
at Williams Lake. The results of these analyses areshown in Table 8.4 together with the Derived AirConcentration (DAC). All observations are well belowthe appropriate DAC levels.
Dustfall measurements are not available for theWilliams Lake tailings impoundment but are availablefor the Stanrock and Nordic impoundments. Becausesuspended particulate concentrations in the air at theWilliams Lake tailings impoundment are somewhatless than at Stanrock and Nordic, dustfall at WilliamsLake would also be expected to be less. The resultsof the dustfall measurements are shown in Table 8.5.Only limited data are available on radionuclide levelsin dustfall collected near these tailings impound-ments. These data are shown in Table 8.6.
Normal background radon levels measured in manyareas of the world typically range from 0.0037 to0.037 Bq/L (UNSCEAR, 1977). One ambient radonmeasurement (grab sample) was made at theWilliams Lake tailings impoundment, however thelevels were not detectable. For reference purposesTable 8.7 has been prepared to summarize the avail-able data on ambient radon, ambient radon daughterand radon exhalation measurements for two otherinactive tailings impoundments (Stanrock and Nor-dic). Additional data are expected to become avail-able through on-going research by CANMET (Bigu etal., 1982).
Table 8.3 - Suspended particulate results for Williams Lakeand other inactive tailings impoundments
Tailings Area
Williams Lake1
Stanrock2
Nordic3
No. of Samples
13
90
139
24-hourS P M
Geometric Mean
26
40
26
(M-g m3)
Range
4-240
6 - 1050
0 - 1965
Suspended Particulate Level3
Annual Geometric Mean
24-hour Concentration
Federal Air Quality Objectives
Maximum MaximumDesirable Acceptable
MaximumTolerable
60 70
120 400
From James F. MacLaren Ltd. (1978).
Sampling Stations:
1) Long Lake No. 1 - 50 m from tailings
2) Stanrock No. 1, No. 2. and No. 3 - 1 0 0 . 100 and 250 m from tailings respectively
3) Nordic No. 1 and No. 2 - 1 0 0 and 200 m from tailings respectively.
75

Table 8.4 - Radiological analyses of suspended particulate samples
collected near inactive tailings impoundments
Sample station and date
Particulate concentration
Radionuclide
Lead-210
Polonium-210
Radium-226
ThoriuTi-230
Thorium-232
DAC
Bq'm3
1.23 *
2.12 *
2.17 »
5.81 x
<1.45 x
103
103
103
10'
10'
Bqg
11
8.2
N.D.
0.022
4 > i n - 3
Inactive
StanrockNo. 1 - June 21
1050 n g m 3
Radionuclide analyses
Bq m3
1.1 - 10-2
8.6 * 1 0 3
N.D
3.7 • 1 0 s
4 - 105
Tailings Areas
No.Nordic1 - July 25
1970 ug m3
Bqg
5.1
1.2
0.66
2.6 - 102
1.1 • 10-2
Bq m3
1.0 -
2.4 -
1.3 -
3.7 -
3.7 *
1 0 2
10-3
1 0 3
10-5
1 0 5
DAC - Derived Air Concentration calculated from dose conversion data for most restrictive form of radionuclide for 1diameter particles. From J.R. Johnson (1983).
Table 8.5 - Summary of total dustfall data collected in the Elliot Lake areaduring 1976-1980
Location
Nordic tailings (South)
Nordic tailings (SE)
Stanrock tailings (East)
Stanrock tailings (NW)
Stanrock tailings (SE)
No.
1976
1
—
1
5
—
of Samples
1977 1978
11
5
9
11
5
12
12
11
12
12
Collected
1979 1980
11
12
12
12
12
11
11
11
11
11
Mean DusHall Levels(grr>230
1976 1977
— 2.4
— 6.3
— 2.4
2.2 2.1
— 4.0
1978
2.1
5.1
1.7
1.5
4.6
days
197<
2.4
4.3
2.1
1.2
6.1
)
3 1980
1.8
2.3
2.0
1.5
5.4
1976
1.1
—
0.7
4.2
—
Maximum(g m 2 30
1977
5.3
14.0
6.2
4.9
8.6
1978
5.6
14.5
4.2
3.1
11.5
Valuedays)
1979
4.7
8.8
5.1
2.1
14.0
1980
3.6
11.9
4.2
9.8
22.3
From Environment Ontario (1981b).
Table 8.6 - Uranium and radium-226 in dustfall during the 1976-1978 period
Location
Nordic S
Stanrock E
Stanrock NW
Nordic SE
Stanrock SE
No. ofsamples
10
9
10
7
Uranium-238
No. ofsamples
above DL
9
3
6
4
3
Mean ofsamples
above DL(MBq km2 30 days)
0.92
0.81
0.4B
0.44
0.33
No. ofsamples
14
13
17
6
7
Radium-226
No. ofsamples
above DL
8
7
11
4
5
Mean ofsamples
above DL(mBq mg)
7.0
1.8
9.3
6.3
6.7
(DL) Detection limits reported as Uranium - 0.185 MBq km2 30 daysRadium - 0.37 mBq mg
From Environment Ontario (1981b).
76

Table 8.7 - Ambient radon measurements for inactive tailings areas
Area
Williams Lakespill area
Nordic
Stanrock
Nordic
Williams Lakespill area
Nordic
Stanrock
Location
Vegetated tailings
Over tailings
Over tailings
Near tailings
Vegetated tailings
Over tailings
Vegetated & soilcovered
On tailings
On tailings
No. ofsamples
1
4
4
3
1
3
1
4
1
I
81
11
3.7
0.003
4.4
Radon (mBq L)
Range
-
- 3 4 0
- 44
- 19
Average
Not detectable
170
22
11
Radon daughter (WL)
-
.0008
Radon ex! Nation
-
- 14.5
-
.0004
.0005
(Bq m2-s)
0.7
8.70
0.22
From James F. MacLaren Ltd. (1978).
8.3 LONG LAKE TAILINGS IMPOUNDMENT8.3.1 Introduction
The Long Lake tailings impoundment covers 125 haand presently contain, approximately 40 milliontonnes of tailings. The tailings impoundment isenclosed by bedrock ridges to the north and south,and by Dam No. 10 to the west and Dams No. 9 and17 to the east (see Fig. 8.2). The bedrock ridgesconsist predominantly of low permeability meta-morphosed conglomerates, siltstones and arkosesof the Gowganda Formation. The tailings in the cen-tral portion of the impoundment are currently approxi-mately 25 m in thickness. Dam No. 10 consists ofearthfill with a low permeability synthetic membranean<J is presently 27 m in height. Dams No. 9 and 17consist of earthfill with low permeability glacial tillcores and are approximately 12 m in height.
Because the tailings are discharged to the Long Laketailings impoundment from the east end, the surfaceof the tailings slopes from east to west at a grade ofapproximately 0.5 per cent, and sandy tailings pre-dominate in the east end of the impoundment whilesilty tailings predominate in the west end.
The continual discharge of tailings to the impound-ment (260 L/s liquid effluent-1983) ensures that thetailings remain wet. The surface of the tailings isextremely soft and is inaccessible even on foot excepton the coarse sandy tailings immediately adjacent tothe tailings discharge.
various sampling programs have been implementedat the Long Lake tailings impoundment for a variety ofpurposes. These programs have included tailingsdischarge and decant sampling as part of DenisonMines routine monitoring; determination of in situ
physical properties of the tailings; tailings porewatersampling as part of a continuing program directedtoward the design of appropriate procedures for thefuture 'close-out' of uranium tailings impoundments;and wind-blown dust and radon sampling as part ofthe 1977-1978 environmental assessment of ura-nium mining at Elliot Lake.
8.3.2 Physical Properties of Tailings
During the late fall of 1978 and winter of 1979 a total of8 boreholes were put down in the Long Lake tailingsimpoundment to determine the density of the tailingsdeposited in the impoundment. The density of tail-ings 'as deposited' is an important consideration inassessing the remaining capacity of an active tailingsimpoundment. Four boreholes were put down in thesilty tailings adjacent to Dam No. 10, and 4 boreholeswere put down in the mixed sandy and silty tailingsadjacent to Dam No. 17. Samples of tailings wererecovered using a thin-walled fixed piston sampler.The tailings samples were weighed in the field imme-diately upon recovery from the boreholes, the lengthsof the recovered samples measured and the samplescarefully sealed with paraffin wax. Water content,bulk density and dry density were determined in thelaboratory. In situ vane tests were conducted in oneborehole at both Dam No. 10 and Dam No. 17 todetermine the undrained shear strength of the tail-ings.
The results of the sampling program are shown inFig. 8.8. The silty tailings at both Dams No. 10 andNo. 17 show distinct decreases in water content andincreases in tailings density with depth. These trendslikely result from the compaction of the deeper tail-
77
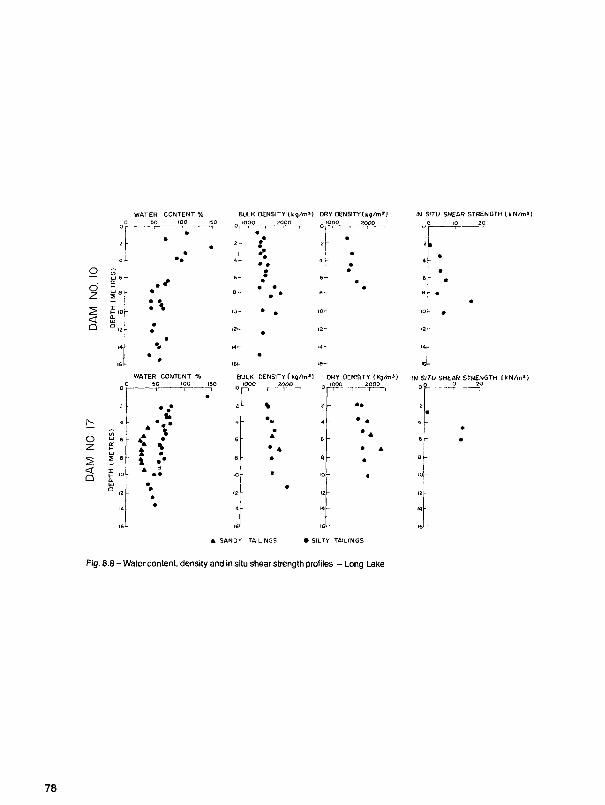
WATER CONTENT % BULK DENSITY (kg/m*) DRY DENSlTY(kg/m*J IN SITU SHEAR STRENGTH { kN/m»)_ IQOO ZOQO O \O 20
o AIll 6 -
QUJ
O " 6 -
«=r 5 8 -
WATER CONTENT % BULK DENSITY ( k g / m ' l DRY OENSITY ( k j / m * ) rN SITU SHEAR STRENGTH I kN/m». _ 50 100 150 nJO0O ^ -Mf—, 0. '°°° , 2 ° ° ° ° ? °
(
. SANDY TAILINGS • SILTY TAILINGS
Fig. 8.8 - Water content, density and in situ shear strength profiles - Long Lake
78

ings by the weight of the overlying tailings. As thetailings density increases, the in situ shear strengthalso increases with depth.
8.3.3. Tailings Discharge, Decant and SeepageSampling
The quantity and quality of tailings discharge to,decant and seepage from the Long Lake tailingsimpoundment are monitored routinely. Samples arecollected according to the following schedule:
Tailings Discharge (Liquid effluent)
FrequencyMonthly
Yearly
TypeGrab
Grab
Tailings Discharge (Solids)Monthly Grab
Tailings DecantDailyDailyWeeklyMonthly
GrabGrabComposite
Seepage Ditch at Dam No. 17MonthlyMonthly Grab
ParameterpH, TDS,ammonia, nitratenitrite,magnesium,dissolvedradium-226.
Sulfate, copper,lead, zinc, nickel,cobalt,manganese,calcium,potassium,chloride, iron,sodium.
Uranium,thorium, radiumtotal sulphur
FlowPHTSSTotal radium-226
FlowpH, TDS,alkalinity, acidity,dissolvedradium-226.
The results of this monitoring are reported annuallyby Environment Ontario in their compilation of Ser-pent River Basin Water Quality Data and by DenisonMines in their Annual Safety Reports. Examples oftypical results are shown in Tables 8.8 and 8.9.
The tailings discharge (Table 8.8) represents thegeneral water quality of the porewater containedwithin the tailings. The tailings porewater is thereforecharacterized by high pH, high radium activities andmoderately high concentrations of total dissolved sol-ids. The tailings decant quality (Table 8.9) representsthe general water quality of surface water runoff fromthe tailings impoundment. The decant water quality is
comparable to that of the tailings discharge but hassubstantially lower activities of radium-226. Thelower radium-226 activities in tailings porewater ininactive tailings impoundments and similarly thelower activities in the tailings decant have beenattributed to adsorption and co-precipitation reac-tions within the tailings (Feenstra et al., 1981). Thetailings decant is treated with barium chloride to fur-ther reduce radium-226 activities prior to discharge.
The water quality of the seepage ditch at Dam No. 17(Table 8.9) is considerably different than that of thetailings porewater. The pH is generally neutral andthe total dissolved solids concentrations are a factorof 10 or more lower than the tailings porewater. Con-sequently, it was evident that there was no significantseepage of tailings porewater through the retainingdam in this area during 1981.
8.3.4 Tailings Porewater Sampling
During the late fall of 1981, tailings porewater sam-ples were collected at five locations in the east end ofthe Long Lake tailings impoundment. These tailingsporewater samples were collected in order to deter-mine any effects of pyrite oxidation in the active tail-ings impoundment.
The sampling was conducted when the upper10-15 cm of the tailings were frozen to allow safeaccess on foot. Normally the surface of the tailings istoo soft to allow any access. Porewater samples werecollected from the water table from shallow hand-dugpits. Piezometers or other permanent monitoringdevices were not installed in this case because theywould be generally inaccessible. pH and electricalconductance measurements were made in the fieldimmediately following sample collection.
In general, the pH and electrical conductance of thetailings porewater closely res&mbled that of the tail-ings discharge. The only exception to this was in anarea of sandy tailings behind the current location ofthe tailings discharge pipe across which neutralizedtailings discharge no longer flows. In this area, the pHof the tailings porewater was 3.9 and the electricalconductance was higher than the tailings discharge,indicating the effects of some degree of pyrite oxida-tion.
These results indicate that although pyrite oxidationdoes not occur extensively in active tailings impound-ments, it can occur in localized zones which areisolated from a continual input of neutralized tailingsdischarge.
8.3.S Wind-blown Dust and Radon
A limited amount of information on wind-blown dustand radon for the Long Lake tailings impoundmentwas collected during the environmental assessmentof uranium mining at Elliot Lake during 1976-1978.Suspended particulate, dustfall, ambient radon andradon exhalation measurements were conducted at
79

Table 8.8 - Example of tailings discharge to Long Laketailings impoundment -1982
Parameter
Flow (Us)
pH
TDS
Dissolved Radium (Bq/L)
IronSulfateAmmoniaNitrate
Liquid effluentMean concentration
260
9.2
3876
73.9
0A21400
83139
Concentrations in ring LAmmonia and nitrate expressed as mg L as K.
SolidsParameter
Uraniw (vThoriix. ;.as "iR.-sdii'Mi (Bq g)Total sulphur
J? ,O6
Mean concentration
0.0093%0.046°o8.34.24°o
Denison Mines Limited Annual Salety Report - 1982.
Table 8.9 - Example of results of surface water sampling -Long Lake tailings impoundment - tailings decant
Parameter
Flow (L s)
pH
TSS
Total radium (Bq;L)
STN D-1 1982Mean concentration
289
8.9
13.2
25.6
From Denison Mines Limited Annual Safety Report - 1982
Seepage ditch at Dam No. 17STN O-9 1981
Parameter
Flow (Us)pH
TDSAlkalinityAcidity
Total radium (Bq/L)
Mean concentration
2.37.4
290120
5
0.015
Ml concentrations in mg/L.A'ltalinity and acidity expressed as mg/L CaCO3.From Environment Ontario (1981a).
80

the Long Lake tailings impoundment. Because of the of suspended particulate samples are shown in Tablelimited number of measurements available, these 8.11. All suspended particulate radionuclide levelsdata are presented together with those from the are below calculated DAC levels,active Quirke tailings impoundment for comparison T o t a | d u s ( f a | | d a l a a r e a v a i | a b | e f o r 3 |ocat jOns at thepurposes. Long Lake tailings impoundment. Dustfall levels wereThe results of the suspended particulate measure- measured by Denison Mines Limited duringments are shown in Table 8.10. The gee netric mean 1979-1980. These data are shown in Table 8.12. All ofsuspended particulate concentrations at both tailings the results are well below the provincial standard ofimpoundments are below federal air quality guide- 7 g/m2/30 days.lines. All 24-hour suspended particulate concen- A f t l b i e n t r a d o r l f a m b i e n t r a d o n d a u g n t e r a n d radon(rations at the Long Lake impoundment are below e x h a | a t i o n measurements at the active tailingsfederal air quality guidelines. Radionuclide analyses i m p O u n d m e n ts are shown in Table 8.13.
Table 6.10 - Suspended particulate results for activetailings impoundments
Tailings Area No
Long Lake'
Quirke2
From James F. MacLaren Ltd. (1978).
Sampling Stations :
o' Samples
28
74
&
Geometric mean
ID
33
24-hourP M ixg m2
Range
1 - 2 6 2
1 -441
1) Long Lake No. 2 and No. 3 - 5 0 and 1000 m from tailings respectively
2) Quirke No. 1. No. 2 and No. 3 - 120, 20 and 1000 m from tailings respectively
For Air Quality Objectives see Table 8.3.
table ' .11 - Radionuclide analyses of suspended particulate samplescollected near active tailings impoundments
Sample Station and Date
Mean particulate concentration
Radionuclide
Lead-210
Polonium-210
Radium-226
Thorium-230
Thorium-232
DAC
Bq'm2
1.23 x
2.12 x
2.17 x
5.8 x
t.45 x
103
103
103
10'
10'
QuirkeNo. 1 - July20, 23, 24.
87 (j.g/m:
Active
17,27
3
Radionuclide analyses
mBq/g
210
120
815
2.9
0.81
nBq/m3
18
11
70
0.27
1.4
Tailings Areas
LongNo. 1 -No. 2 -No. 3 -
206
mBq g
270
220
0
5.2
11
LakeSept. 9Sept. 16Sept. 17
ixg/m3
nBq/m3
56
44
2.7
11
2.7
DAC - Derived Air Concentration calculated from dose conversion data for (he most restrictive form of radionuclide for 1 jdiameter particles.
From James F. MacLaren Ltd. (1978).
81

Table 8.1" - Total dustfall data collected at the Long Laketailings impoundment by Denison Mines Limited
Site
A
B
C
June
1.8
0.2
0.3
July
—
0.2
0.1
Total Dustfall(g m230 days)
1979
August
.07
.17
.10
September
.14
.13
.12
1980
October
.17
.15
.16
May
—
.32
1.02
Note— Data MissingFrom Environment Ontario (1981b)
Table 8.13 - Ambient radon measurements for active tailings areas
Area
Long Lake
Quirke
Long Lake
Quirke
Long Lake
Quirke
Location
Over tailingsNear tailings
Over tailingsNear tailing::
Over tailingsNear tailings
Over tailingsNear tailings
Tailings area
Tailings area
No ofSamples
74
124
67
44
6
6
Radon (mBq L|
Range
11-1403.7 - 26
85 - 230N.D. - 19
Average
6015
407.5
Radon daughters (WL)
0.0003 - 0.00090.0002-0.0014
0.0003 - 0.00080.0002 - 0.0006
Radon Exhalation (Bq m :
0.33 - 15.9
8.9 -70.6
0.00060.0007
0.00050.0004
•sec)
4.7
29.8
From James F. MacLaren Ltd. (1978)
8.4 SUMMARYThe preceding sections describe various samplingprograms conducted at the Denison tailings im-poundments. These programs have been implemen-ted for a variety of purposes which include: routinemonitoring for compliance with regulatory agencies;environmental impact assessment; and the design ofappropriate procedures for future long-term decom-missioning or 'close-out' of uranium tailings im-poundments.
Routine monitoring of surface water quantity andquality is conducted at both the inactive Williams
Lake tailings impoundment and the currently activeLong Lake tailings impoundment. Sampling of airquality in the vicinity of the tailings impoundmentswas conducted during 1976-1978 for the overall envi-ronmental impact assessment of proposed uraniummining expansion in the Elliot Lake area. Detailedinvestigations of the tailings solids and tailingsporewater at the Williams Lake tailings impoundmentare on-going to provide information for the design oflong-term decommissioning procedures for inactiveuranium tailings impoundments.
82

8.5 REFERENCESBigu, J.; Grenier, M.; Dave, N.K. and Lim, T.P. (1982).
"Study of radon gas emanation from uranium minetailings areas - a progress report". CANMET,Energy, Mines and Resources Canada - ElliotLake Laboratory, December, 1982.
Cherry, J.A.; Blackport, R.J.; Dubrovsky, N.; Gillham,R.W.; Lim, T.P.; Murray, D.; Reardon, E.J. andSmyth, D.J.A. (1980). "Subsurface hydrology andgeochemical evolution of inactive pyritic tailings inthe Elliot Lake Uranium District, Canada". Sym-posium on Uranium Mill Tailings Managementpp. 535-385, 1980.
Environment Ontario (1981a). "Serpent River Basinwater quality data 1981: an annual compilation".
Environment Ontario (1981b). "Air quality assess-ment studies carried out in the Elliot Lake area,1976-1980: a compilation of data. 1981".
Feenstra, S.; Blair, R.C.; Cherry, J.A.; Chakravatti,J.L. andLaRocque, E.(1981). "Hydrogeochemicalinvestigations of two inactive tailings areas in theElliot Lake Uranium District, Ontario, Canada". InProceedings of the Fourth Symposium on UraniumMill Tailings Management, pp. 367-389, 1981.
Johnson, J.R. Atomic Energy of Canada Limited(1983). Dose conversion factors for 1 ̂ .m particles,personal communication, January 1983.
Kaiman, S., (1977). "Mineralogical examination of oldtailings from the Nordic Lake Mine, Elliot Lake,Ontario". Report 77-190, CANMET, Energy, Minesand Resources Canada.
La Rocque, E. and Webber R. (1978). "Waste man-agement at Denison Mines". In Proceedings of theNEA Seminar on Management, Stabilization andEnvironmental Impact of Uranium Mill Tailings, pp.215-225, 1978.
James F. MacLaren Limited (1978). EnvironmentalAssessment of the Proposed Elliot Lake UraniumMines Expansion, Volume 4 - EnvironmentalAssessment.
Moffett, D. and Tellier, M. (1978). "Radiological inves-tigations of an abandoned uranium tailings area".Journal of Environmental Quality, 7:2:310-314.
Morin, K.A.; Cherry, J.A.; Lim, T.P. and Vivyurka. A.J.(1982). "Contaminant migration in a sand aquifernear an inactive uranium tailings impoundment,Elliot Lake, Ontario". Canadian Geotechnical Jour-nal, 19:1:49-62.
Murray, D.R.; Webber, R. and Larocque. E. (1979)."Reclamation of the lower Williams Lake tailingsarea of Denison Mines Limited". Can Min MetallBull, March 1979, pp. 135-137.
Reades, D.W.: Davis, J.B.: Goldby. H.M. andStanlick, R.R. (1981). "Remedial works at DamNo. 1, Elliot Lake, Ontario". In Proceedings ofthe Fourth Symposium on Uranium Tailings Man-agement, pp. 507-518. 1981.
UN3CEAR (1977). United Nations Scientific Com-mittee on the Effects of Atomic Radiation. Report tothe General Assembly.
83A'/

APPENDIX A
URANIUM-238 AND THORIUM-232 DECAY SERIES

A-1URANIUM RADIOACTIVE DECAY SERIES
DECAY SEQUENCE NUCLIDE HALF-LIFE
Pb-214
Po-214
Po-210
U-238
ITh-234
Pa-234
U-234
Th-230
Ra-226
Rn-222
Po-218
Bi-214
Pb-210
Bi-210
Pa-234
At-218
TI-210
TI-206
Pb-206
Uranium-238
Thorium-234
Protoactinium-234
Protoactinium-234
Uranium-234
Thoriurn-230
Radium-226
Radon-222
Polonium-218
Lead-214
Astatine-218
Bismuth-214
Polonium-214
Thallium-210
Lead-210
Bismuth-210
Polonium-210
Thallium-206
Lead-206
4.51 ' 109 y
24.1 d
1.17 d
6.75 h
2.47 x 10⁵y
8.0 > i o 4 y
1602 y
3.8 d
3.05 min
26.8 min
2 s
19.7 min
164 ^s
1.3 min
21 y
5.01 d
138.4 d
4.19 min
Stable
86
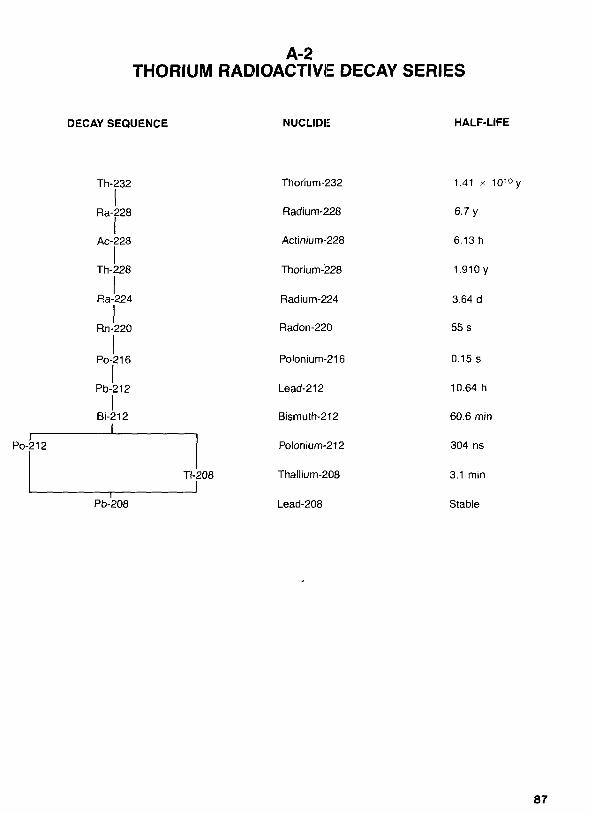
A-2THORIUM RADIOACTIVE DECAY SERIES
DECAY SEQUENCE NUCLIDE HALF-LIFE
Po-212
Th-232
Ra-228
Ac-228
Th-228
Ra-224
Rn-220
Po-216
Pb-212
Bi-212
TI-208
Pb-208
Thorium-232
Radium-228
Actinium-228
Thorium-228
Radium-224
Radon-220
Polonium-216
Lead-212
Bismuth-212
Polonium-212
Thallium-208
Lead-208
1.41 x 10¹⁰y
6.7 y
6.13 h
1.910 y
3.64 d
55 s
0.15 s
10.64 h
60.6 min
304 ns
3.1 min
Stable
87