Life cycle assessment of mine tailings management in Canada
10
This article appeared in a journal published by Elsevier. The attached copy is furnished to the author for internal non-commercial research and education use, including for instruction at the authors institution and sharing with colleagues. Other uses, including reproduction and distribution, or selling or licensing copies, or posting to personal, institutional or third party websites are prohibited. In most cases authors are permitted to post their version of the article (e.g. in Word or Tex form) to their personal website or institutional repository. Authors requiring further information regarding Elsevier’s archiving and manuscript policies are encouraged to visit: http://www.elsevier.com/copyright
Transcript of Life cycle assessment of mine tailings management in Canada
This article appeared in a journal published by Elsevier. The attachedcopy is furnished to the author for internal non-commercial researchand education use, including for instruction at the authors institution
and sharing with colleagues.
Other uses, including reproduction and distribution, or selling orlicensing copies, or posting to personal, institutional or third party
websites are prohibited.
In most cases authors are permitted to post their version of thearticle (e.g. in Word or Tex form) to their personal website orinstitutional repository. Authors requiring further information
regarding Elsevier’s archiving and manuscript policies areencouraged to visit:
http://www.elsevier.com/copyright

Author's personal copy
Life cycle assessment of mine tailings management in Canada
Catherine Reid a,*, Valerie Becaert a, Michel Aubertin b, Ralph K. Rosenbaum a, Louise Deschenes a
a CIRAIG-Interuniversity Research Centre for the Life Cycle of Products, Processes and Services, Ecole Polytechnique de Montreal, P.O. Box 6079, Station Centre-Ville, Montreal,Quebec, H3C 3A7, Canadab Industrial NSERC Polytechnique-UQAT Chair, Environment and Mine Wastes Management, Ecole Polytechnique de Montreal, P.O. Box 6079, Station Centre-Ville, Montreal,Quebec, H3C 3A7, Canada
a r t i c l e i n f o
Article history:Received 31 July 2008Accepted 14 August 2008Available online 11 October 2008
Keywords:Mine tailings managementLife cycle impact assessmentAcid mine drainage controlIMPACT 2002þLand-use category
a b s t r a c t
The effective management of mine tailings involves the control of several environmental impacts andlegal requirements. Six tailings site management and closure scenarios were developed for a copper zincunderground mine located in Quebec (Canada) and compared using life cycle assessment (LCA). Twooptions are considered for the mine operation: tailings can be sent to the tailings disposal area wherethey are submerged or they can be partly used for backfilling. For each of these two operation options,three alternatives are presented for mine closure: (a) submerged tailings, (b) partial desulphurizationwith a cover of desulphurized material and (c) a cover with capillary barrier effects (CCBE) made ofnatural soils followed by revegetation. The goals of the study were to draw the inventory of thesemanagement scenarios from the development to the post-closure phase, to assess and compare theirenvironmental impacts and to determine the importance of the land-use impact category. The potentialimpacts for each scenario were evaluated using the IMPACT 2002þ LCIA method. The results of theperformed LCA indicate that for mine development and operation, scenarios where tailings are partlyused as backfill for underground stopes appear to lead to larger impacts in 11 of the 14 midpointcategories since the backfill plant operation consumes a greater amount of material and energy. For a siteclosure period of 2 years, the CCBE option creates the greatest impacts, since it requires much more effortthan the other techniques. The results for the post-closure phase have been analysed separately sincethey have a larger uncertainty. They appear to modify the comparative assessment results. The variousresults presented in the paper show the importance of taking land-use impacts into account.
� 2008 Elsevier Ltd. All rights reserved.
1. Introduction
The province of Quebec is one of the country’s principal miningproducers, primarily for the production of precious (gold and silver)and base metals like copper, nickel and zinc [1]. Because of the largeamount of waste produced, the mining industry can generate manyenvironmental problems [2,3]. Large areas are required for thestorage of liquid and solid wastes. There is also the potentialproduction of acid mine drainage (AMD) which is a phenomenonthat can occur when reactive sulphurous minerals are exposed towater and oxygen and that leads to the solubilisation of varioustoxic elements in the environment (e.g. [2]). Not all mines produceAMD even when sulphides are present. To avoid the production ofAMD, the availability of water or oxygen must be limited, or theamount of sulphides reduced [2].
In order to select one or more AMD control methods for mineoperation and closure, different management options should be
assessed and compared with respect to their potential environ-mental impacts. Comparisons are most often based on cost, as wellas social impacts and environmental effects. The life cycle assess-ment (LCA) approach could prove to be a valuable tool to study theenvironmental aspects and potential impacts throughout a pro-duct’s (process’ or service’s) life cycle, from raw material extractionthrough production, use and disposal.
Application of LCA in the mining and minerals processingindustry started in the mid to late 1990s, initially aiming at carryingout life cycle inventories (LCI) for metal production processes to beused in support of LCA for consumer product selection and design.Since then, the use of LCA has been extended to project and processselection within companies [4,5]. Several studies were publishedpertaining to several aspects of the mining industry [6–13], and aninteresting point was raised by Van Zyl: environmental impacts ofmines have to be evaluated using specific data considering all lifecycle stages and not only the operation step [14]. A number ofinternational initiatives were launched in the recent years toevaluate the use of LCA in the context of minerals and metalsproduction. Among them, the Mining, Minerals and SustainableDevelopment (MMSD) project concluded that ‘‘LCA is a useful tool to
* Corresponding author. Tel.: þ1 514 340 4711x4273; fax: þ1 514 340 5913.E-mail address: [email protected] (C. Reid).
Contents lists available at ScienceDirect
Journal of Cleaner Production
journal homepage: www.elsevier .com/locate/ jc lepro
0959-6526/$ – see front matter � 2008 Elsevier Ltd. All rights reserved.doi:10.1016/j.jclepro.2008.08.014
Journal of Cleaner Production 17 (2009) 471–479
Author's personal copy
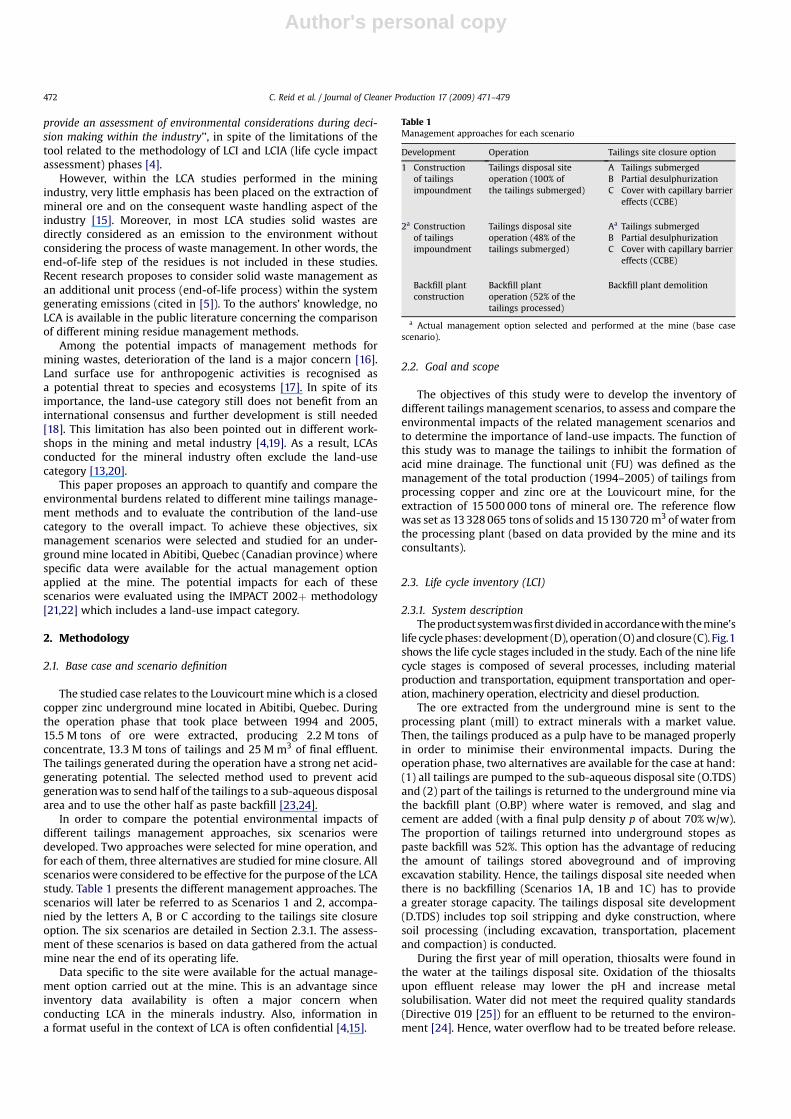
provide an assessment of environmental considerations during deci-sion making within the industry’’, in spite of the limitations of thetool related to the methodology of LCI and LCIA (life cycle impactassessment) phases [4].
However, within the LCA studies performed in the miningindustry, very little emphasis has been placed on the extraction ofmineral ore and on the consequent waste handling aspect of theindustry [15]. Moreover, in most LCA studies solid wastes aredirectly considered as an emission to the environment withoutconsidering the process of waste management. In other words, theend-of-life step of the residues is not included in these studies.Recent research proposes to consider solid waste management asan additional unit process (end-of-life process) within the systemgenerating emissions (cited in [5]). To the authors’ knowledge, noLCA is available in the public literature concerning the comparisonof different mining residue management methods.
Among the potential impacts of management methods formining wastes, deterioration of the land is a major concern [16].Land surface use for anthropogenic activities is recognised asa potential threat to species and ecosystems [17]. In spite of itsimportance, the land-use category still does not benefit from aninternational consensus and further development is still needed[18]. This limitation has also been pointed out in different work-shops in the mining and metal industry [4,19]. As a result, LCAsconducted for the mineral industry often exclude the land-usecategory [13,20].
This paper proposes an approach to quantify and compare theenvironmental burdens related to different mine tailings manage-ment methods and to evaluate the contribution of the land-usecategory to the overall impact. To achieve these objectives, sixmanagement scenarios were selected and studied for an under-ground mine located in Abitibi, Quebec (Canadian province) wherespecific data were available for the actual management optionapplied at the mine. The potential impacts for each of thesescenarios were evaluated using the IMPACT 2002þ methodology[21,22] which includes a land-use impact category.
2. Methodology
2.1. Base case and scenario definition
The studied case relates to the Louvicourt mine which is a closedcopper zinc underground mine located in Abitibi, Quebec. Duringthe operation phase that took place between 1994 and 2005,15.5 M tons of ore were extracted, producing 2.2 M tons ofconcentrate, 13.3 M tons of tailings and 25 M m3 of final effluent.The tailings generated during the operation have a strong net acid-generating potential. The selected method used to prevent acidgeneration was to send half of the tailings to a sub-aqueous disposalarea and to use the other half as paste backfill [23,24].
In order to compare the potential environmental impacts ofdifferent tailings management approaches, six scenarios weredeveloped. Two approaches were selected for mine operation, andfor each of them, three alternatives are studied for mine closure. Allscenarios were considered to be effective for the purpose of the LCAstudy. Table 1 presents the different management approaches. Thescenarios will later be referred to as Scenarios 1 and 2, accompa-nied by the letters A, B or C according to the tailings site closureoption. The six scenarios are detailed in Section 2.3.1. The assess-ment of these scenarios is based on data gathered from the actualmine near the end of its operating life.
Data specific to the site were available for the actual manage-ment option carried out at the mine. This is an advantage sinceinventory data availability is often a major concern whenconducting LCA in the minerals industry. Also, information ina format useful in the context of LCA is often confidential [4,15].
2.2. Goal and scope
The objectives of this study were to develop the inventory ofdifferent tailings management scenarios, to assess and compare theenvironmental impacts of the related management scenarios andto determine the importance of land-use impacts. The function ofthis study was to manage the tailings to inhibit the formation ofacid mine drainage. The functional unit (FU) was defined as themanagement of the total production (1994–2005) of tailings fromprocessing copper and zinc ore at the Louvicourt mine, for theextraction of 15 500 000 tons of mineral ore. The reference flowwas set as 13 328 065 tons of solids and 15130 720 m3 of water fromthe processing plant (based on data provided by the mine and itsconsultants).
2.3. Life cycle inventory (LCI)
2.3.1. System descriptionThe productsystemwas first divided in accordancewith the mine’s
life cycle phases: development (D), operation (O) and closure (C). Fig.1shows the life cycle stages included in the study. Each of the nine lifecycle stages is composed of several processes, including materialproduction and transportation, equipment transportation and oper-ation, machinery operation, electricity and diesel production.
The ore extracted from the underground mine is sent to theprocessing plant (mill) to extract minerals with a market value.Then, the tailings produced as a pulp have to be managed properlyin order to minimise their environmental impacts. During theoperation phase, two alternatives are available for the case at hand:(1) all tailings are pumped to the sub-aqueous disposal site (O.TDS)and (2) part of the tailings is returned to the underground mine viathe backfill plant (O.BP) where water is removed, and slag andcement are added (with a final pulp density p of about 70% w/w).The proportion of tailings returned into underground stopes aspaste backfill was 52%. This option has the advantage of reducingthe amount of tailings stored aboveground and of improvingexcavation stability. Hence, the tailings disposal site needed whenthere is no backfilling (Scenarios 1A, 1B and 1C) has to providea greater storage capacity. The tailings disposal site development(D.TDS) includes top soil stripping and dyke construction, wheresoil processing (including excavation, transportation, placementand compaction) is conducted.
During the first year of mill operation, thiosalts were found inthe water at the tailings disposal site. Oxidation of the thiosaltsupon effluent release may lower the pH and increase metalsolubilisation. Water did not meet the required quality standards(Directive 019 [25]) for an effluent to be returned to the environ-ment [24]. Hence, water overflow had to be treated before release.
Table 1Management approaches for each scenario
Development Operation Tailings site closure option
1 Constructionof tailingsimpoundment
Tailings disposal siteoperation (100% ofthe tailings submerged)
A Tailings submergedB Partial desulphurizationC Cover with capillary barrier
effects (CCBE)
2a Constructionof tailingsimpoundment
Tailings disposal siteoperation (48% of thetailings submerged)
Aa Tailings submergedB Partial desulphurizationC Cover with capillary barrier
effects (CCBE)
Backfill plantconstruction
Backfill plantoperation (52% of thetailings processed)
Backfill plant demolition
a Actual management option selected and performed at the mine (base casescenario).
C. Reid et al. / Journal of Cleaner Production 17 (2009) 471–479472

Author's personal copy
This was done using chemical neutralisation with a lime treatmentwhich is frequently used by the mining industry to treat the finaleffluent (raise the pH) because of its efficiency, reliability andrelatively low cost [2]. Lime is hydrated before being added to thewater (O.LP). The neutralised water overflow was then sent bygravity to the polishing pond (O.PP) which was also used asa retention pond for thiosalt degradation, and where suspendedsolids precipitate due to the addition of lime.
Once the end of the mine’s life was reached, the closure phasebegan (C.TDS). Here, three options are studied for that purpose.Option ‘‘A’’ keeps tailings submerged in order to limit the amount ofoxygen in contact with the sulphidic minerals. Option ‘‘B’’ consistsof desulphurizing (during the last few years of operation (O.D)) anamount of tailings required to make a 1 m deep cover on the tailingsite [26]. This technique minimises the quantity of sulphides likelyto oxidize. The desulphurization technique would produce 50% ofboth fractions; the sulphide concentrate is sent to the tailingsdisposal site and is covered with desulphurized tailings in Scenario1B, or it is sent to the backfill plant in Scenario 2B. The elevatedwater table technique is also applied to Scenarios 1B and 2B; thetechnique involves lowering the water level to the air entry value(AEV) of the material (about 1 m) to maintain tailings saturation[27]. The surface of the site is then stabilized with a 0.3 m cover ofgranular soils. In option ‘‘C’’, following the water level lowering (asin B), the tailings disposal site is reclaimed using a CCBE made ofthree layers of geological materials: (1) a supporting layer made ofwaste rock from the mine, (2) a low permeability layer made of siltand (3) a protection layer of sand and gravel. The quantity of oxygenreaching the tailings is limited by keeping the second layer satu-rated with water [2]. Final rehabilitation takes place by addinga layer of organic soil and seeding, in order to limit erosion and therising of dust.
Life cycle stages in the dark grey area in Fig. 1 are included in thesix scenarios (D.TDS, O.TDS, C.TDS, O.LP, O.PP); those in the mediumgrey area are only included in 2A, 2B and 2C (D.BP, O.BP, C.BP); andthose in the light grey area are included in Scenarios 1B and 2B. Foreach of the six scenarios, Table 2 shows the main tailings flow sentto the different unit processes and the final effluent of water intothe environment.
Desulphurization is applied in the final years of mine operation.Most of the tailings have to be sent to this unit during the last 6years for Scenario 1B and the last 4 years for Scenario 2B.
2.3.2. Data collection and main assumptionsLCI modelling was performed with the Simapro 6.0 software [28].
For each of the six scenarios, the materials, energy and equipmenthave been defined. Site-specific data were collected for the year2002, which is defined as representing the average operatingconditions of the mine. The data, gathered with questionnaires, sitevisits, articles and interviews, mainly include the amount of energyand materials used and their transportation. Data for the develop-ment and closure phases were obtained from consultants’ reports(who have also been interviewed) and from mine experts. Tocomplete the LCI, the ecoinvent database [29] was used as a source ofsecondary data. The main assumptions made during the elaborationof this inventory analysis can be summarized as follows:
� Year 2002 is a typical year for the mine’s life cycle operation (12years of operation); the operating time (7 days a week) and thesolid percentage (pulp density) in the tailings are consideredconstant over the years.� In situ tailings density¼ 1.7 tons/m3, tailings porosity (n)¼ 0.485
and rock density¼ 3.3 tons/m3. These data are site-specific.� Based on the initial reserves of mineable ore, two cells (east
and west) were originally designed and their construction wasplanned in two distinct steps. Since the ore reserves were lessthan anticipated, the construction of the second cell (west)never occurred. The capacity of this second cell would havebeen adequate for Scenarios 1A, 1B and 1C, so the data from thedesign reports could be used for the development step D.TDS(see Fig. 1). The east cell area (including dykes)¼ 105.4 ha; thewest cell area (including dykes)¼ 71.4 ha.� The duration of the site closure phase was set at 2 years, which
is the time required for option C. After this time, the tailingsdisposal site will still generate environmental impacts. Theseimpacts were analysed separately.� The management techniques used to prevent AMD formation
during the operation phase were designed to meet the
Development (D) Operation (O) Closure (C)
Underground mine
Processing plant $System boundaries
Polishing pondconstruction
Waste rock deposit
(D.BP) Backfill plant construction
(O.BP) Backfillplant operation
(C.BP.) Backfilllant dismantling
(O.TDS) Tailingsdisposal site operation
(O.PP) Polishing pond
(O.LP) Liming plant
(C.TDS) Tailingsdisposal siteclosure
(D.TDS) Tailings disposal site construction
(O.D) De-S
Energy
Water
Final effluent
Emissions
to air
Emissions
to water
Emissions
to soil
Raw
materials
Fig. 1. Life cycle stages (life cycle stages in the grey areas are included in the six scenarios). Residues, lime, water, ore, ¼ life cycle stagesfor the six scenarios, ¼ life cycle stages in Scenarios 2A, 2B and 2C, ¼ life cycle stages in Scenarios 1B and 2B.
C. Reid et al. / Journal of Cleaner Production 17 (2009) 471–479 473
Author's personal copy
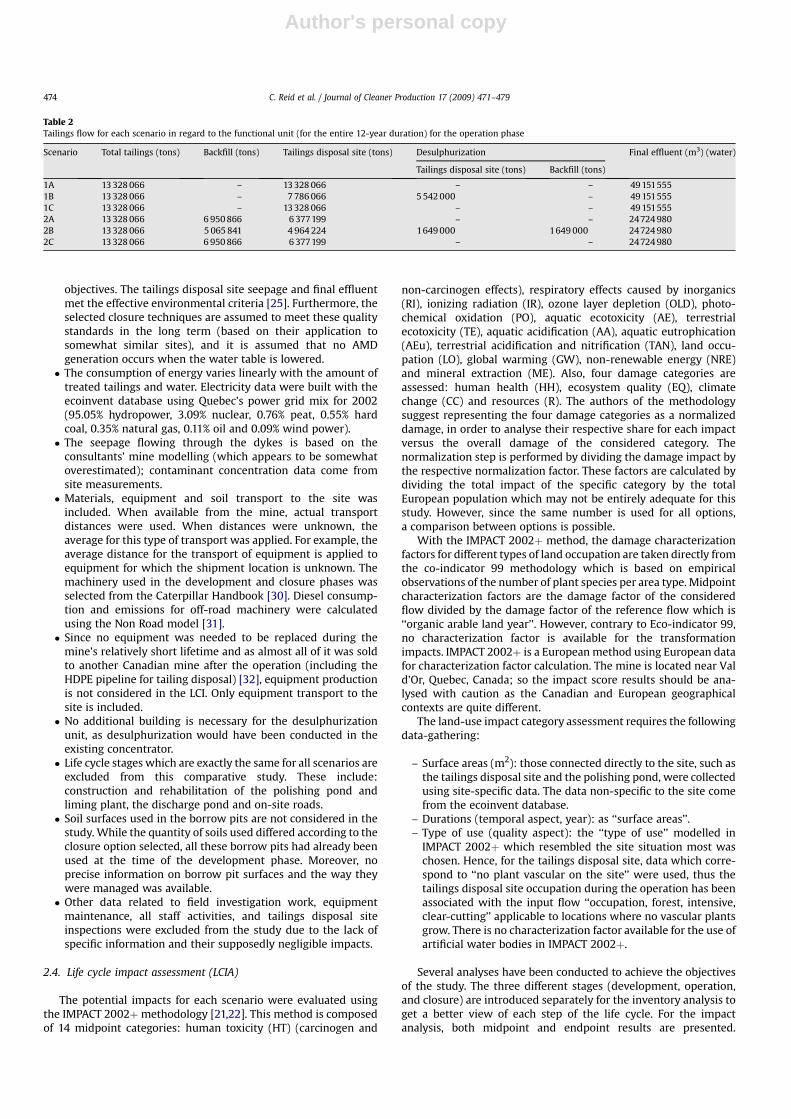
objectives. The tailings disposal site seepage and final effluentmet the effective environmental criteria [25]. Furthermore, theselected closure techniques are assumed to meet these qualitystandards in the long term (based on their application tosomewhat similar sites), and it is assumed that no AMDgeneration occurs when the water table is lowered.� The consumption of energy varies linearly with the amount of
treated tailings and water. Electricity data were built with theecoinvent database using Quebec’s power grid mix for 2002(95.05% hydropower, 3.09% nuclear, 0.76% peat, 0.55% hardcoal, 0.35% natural gas, 0.11% oil and 0.09% wind power).� The seepage flowing through the dykes is based on the
consultants’ mine modelling (which appears to be somewhatoverestimated); contaminant concentration data come fromsite measurements.� Materials, equipment and soil transport to the site was
included. When available from the mine, actual transportdistances were used. When distances were unknown, theaverage for this type of transport was applied. For example, theaverage distance for the transport of equipment is applied toequipment for which the shipment location is unknown. Themachinery used in the development and closure phases wasselected from the Caterpillar Handbook [30]. Diesel consump-tion and emissions for off-road machinery were calculatedusing the Non Road model [31].� Since no equipment was needed to be replaced during the
mine’s relatively short lifetime and as almost all of it was soldto another Canadian mine after the operation (including theHDPE pipeline for tailing disposal) [32], equipment productionis not considered in the LCI. Only equipment transport to thesite is included.� No additional building is necessary for the desulphurization
unit, as desulphurization would have been conducted in theexisting concentrator.� Life cycle stages which are exactly the same for all scenarios are
excluded from this comparative study. These include:construction and rehabilitation of the polishing pond andliming plant, the discharge pond and on-site roads.� Soil surfaces used in the borrow pits are not considered in the
study. While the quantity of soils used differed according to theclosure option selected, all these borrow pits had already beenused at the time of the development phase. Moreover, noprecise information on borrow pit surfaces and the way theywere managed was available.� Other data related to field investigation work, equipment
maintenance, all staff activities, and tailings disposal siteinspections were excluded from the study due to the lack ofspecific information and their supposedly negligible impacts.
2.4. Life cycle impact assessment (LCIA)
The potential impacts for each scenario were evaluated usingthe IMPACT 2002þmethodology [21,22]. This method is composedof 14 midpoint categories: human toxicity (HT) (carcinogen and
non-carcinogen effects), respiratory effects caused by inorganics(RI), ionizing radiation (IR), ozone layer depletion (OLD), photo-chemical oxidation (PO), aquatic ecotoxicity (AE), terrestrialecotoxicity (TE), aquatic acidification (AA), aquatic eutrophication(AEu), terrestrial acidification and nitrification (TAN), land occu-pation (LO), global warming (GW), non-renewable energy (NRE)and mineral extraction (ME). Also, four damage categories areassessed: human health (HH), ecosystem quality (EQ), climatechange (CC) and resources (R). The authors of the methodologysuggest representing the four damage categories as a normalizeddamage, in order to analyse their respective share for each impactversus the overall damage of the considered category. Thenormalization step is performed by dividing the damage impact bythe respective normalization factor. These factors are calculated bydividing the total impact of the specific category by the totalEuropean population which may not be entirely adequate for thisstudy. However, since the same number is used for all options,a comparison between options is possible.
With the IMPACT 2002þ method, the damage characterizationfactors for different types of land occupation are taken directly fromthe co-indicator 99 methodology which is based on empiricalobservations of the number of plant species per area type. Midpointcharacterization factors are the damage factor of the consideredflow divided by the damage factor of the reference flow which is‘‘organic arable land year’’. However, contrary to Eco-indicator 99,no characterization factor is available for the transformationimpacts. IMPACT 2002þ is a European method using European datafor characterization factor calculation. The mine is located near Vald’Or, Quebec, Canada; so the impact score results should be ana-lysed with caution as the Canadian and European geographicalcontexts are quite different.
The land-use impact category assessment requires the followingdata-gathering:
– Surface areas (m2): those connected directly to the site, such asthe tailings disposal site and the polishing pond, were collectedusing site-specific data. The data non-specific to the site comefrom the ecoinvent database.
– Durations (temporal aspect, year): as ‘‘surface areas’’.– Type of use (quality aspect): the ‘‘type of use’’ modelled in
IMPACT 2002þ which resembled the site situation most waschosen. Hence, for the tailings disposal site, data which corre-spond to ‘‘no plant vascular on the site’’ were used, thus thetailings disposal site occupation during the operation has beenassociated with the input flow ‘‘occupation, forest, intensive,clear-cutting’’ applicable to locations where no vascular plantsgrow. There is no characterization factor available for the use ofartificial water bodies in IMPACT 2002þ.
Several analyses have been conducted to achieve the objectivesof the study. The three different stages (development, operation,and closure) are introduced separately for the inventory analysis toget a better view of each step of the life cycle. For the impactanalysis, both midpoint and endpoint results are presented.
Table 2Tailings flow for each scenario in regard to the functional unit (for the entire 12-year duration) for the operation phase
Scenario Total tailings (tons) Backfill (tons) Tailings disposal site (tons) Desulphurization Final effluent (m3) (water)
Tailings disposal site (tons) Backfill (tons)
1A 13 328 066 – 13 328 066 – – 49 1515551B 13 328 066 – 7 786 066 5 542 000 – 49 1515551C 13 328 066 – 13 328 066 – – 49 1515552A 13 328 066 6 950 866 6 377 199 – – 24724 9802B 13 328 066 5 065 841 4 964 224 1649 000 1649 000 24724 9802C 13 328 066 6 950 866 6 377 199 – – 24724 980
C. Reid et al. / Journal of Cleaner Production 17 (2009) 471–479474
Author's personal copy
Midpoint result analyses are displayed in order to illustrate thedifference between scenarios for each impact category. Develop-ment and operation are grouped since these two life cycle stagesare closely linked together. To get a better view of the overallimpacts of each scenario, and to determine the importance of theland-use category, normalized damage results are also analysed.
3. Results and discussion
3.1. Inventory analysis
During the development phase, Scenario 2 involves the largestmaterial and energy inputs except for cement, geotextiles, soils,diesel for the off-road equipment and land surfaces. These mate-rials are used for the construction of the additional dyke in Scenario1 which requires a second tailings disposal cell. Note that thequantity of materials needed for the dyke construction is based ontechnical reports; the soils were found near the site (borrow pit)within a radius of 10 km. The most abundant substances found inwater and soil (�1%), with the exception of COD, were non-toxic orhad no characterization factor in the IMPACT 2002þ method. Notethat the data taken from the ecoinvent database for the backfillplant construction include the material’s final disposal.
For the operation phase, the results indicate that Scenario 2requires more materials and energy than Scenario 1, except forinputs related to the site area: occupied surface, water manage-ment (water treatment: quicklime, diesel for the liming plant andtailings site filling) and consumption of KAX-51 which is thexanthate collector used in the non-selective flotation process at thedesulphurization unit. The backfill plant required a large amount ofmaterials, predominantly slag and cement and their related trans-port. Again, the most important substances (�1%) found in waterand soil were either non-toxic or did not have a characterizationfactor for any of the toxicity impact categories, except for ammonia,COD and sulphuric acid. The TOC-to-DOC and the COD-to-BODratios are not in the approximate order of 2:1 as one would expect.In fact, no specific data were available for these emissions related toon-site processes. Therefore, these emissions come from thedifferent secondary data used.
For the different closure options, most of the material inputshave been calculated (i.e. they are not based on actual data). Themain materials are related to diesel consumption for the off-roadmachinery used to construct the different layers (closure options Band C), seed production and land occupation represented by forestclear-cutting (as no vascular plants are present on the site for alloptions during this period).
Emissions for Scenario 1 are larger than for Scenario 2 for eachclosure option. This result is not surprising considering that emis-sions in this life cycle stage are a function of the tailings disposalarea. Comparison of closure options B and C shows that emissionsare always higher for option C except for sulphates (transformedinto equivalent acid) emitted in water when the water level islowered. The differences for air and soil emissions between optionsB and C come from the off-road equipment since three layers arenecessary for the CCBE versus one layer for the desulphurizedcover. Furthermore, increased emissions in water for the CCBE areattributed to the off-road equipment for BOD5 and COD. The off-road equipment and seed production are responsible for theincrease in chloride and sodium emissions. In comparison tooptions B and C, emissions for option A are much lower except forammonia, hydrocarbons, sulphuric acid and suspended solids inwater, which are substances found in the final effluent. For water,the differences for BOD5, chloride, COD and sodium are explainedby the machinery which is not used within option A. The sameexplanation applies to air and soil emissions. For calcium, magne-sium and sodium in water, the differences are caused by thedifferent sources of data used for water quality of the tailingsdisposal site (seepage and final effluent). For option A, data areextrapolated from the mine operation phase (in situ analysis) andfor options B and C, data come from laboratory research wherea greater number of substances were analysed [27].
The detailed inventory data (input materials, energy and outputemissions) for the development, operation and closure stages arepresented in Supplementary information.
3.2. Impact evaluation analysis
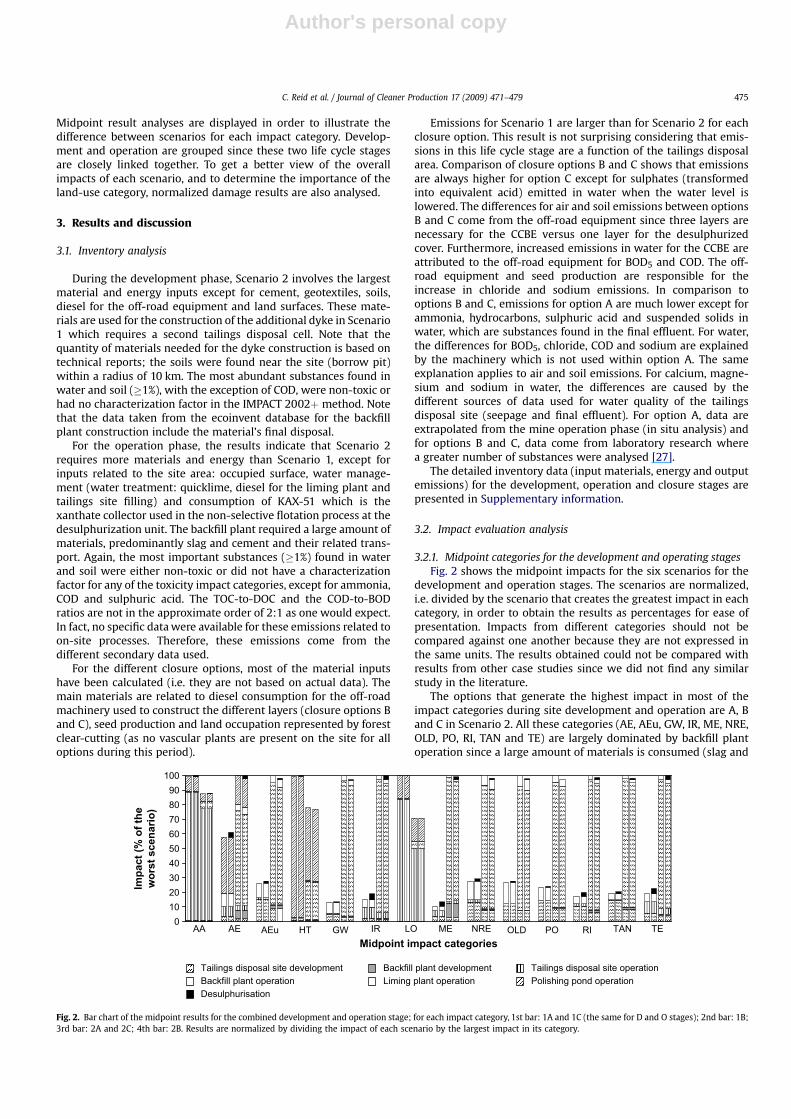
3.2.1. Midpoint categories for the development and operating stagesFig. 2 shows the midpoint impacts for the six scenarios for the
development and operation stages. The scenarios are normalized,i.e. divided by the scenario that creates the greatest impact in eachcategory, in order to obtain the results as percentages for ease ofpresentation. Impacts from different categories should not becompared against one another because they are not expressed inthe same units. The results obtained could not be compared withresults from other case studies since we did not find any similarstudy in the literature.
The options that generate the highest impact in most of theimpact categories during site development and operation are A, Band C in Scenario 2. All these categories (AE, AEu, GW, IR, ME, NRE,OLD, PO, RI, TAN and TE) are largely dominated by backfill plantoperation since a large amount of materials is consumed (slag and
Midpoint impact categories
Tailings disposal site development Backfill plant development Tailings disposal site operationBackfill plant operation Liming plant operation Polishing pond operationDesulphurisation
0102030405060708090
100
Im
pa
ct (%
o
f th
e
wo
rs
t s
ce
na
rio
)
AA IR OLD PO RI TAN TEAE AEu HT GW LO ME NRE
Fig. 2. Bar chart of the midpoint results for the combined development and operation stage; for each impact category, 1st bar: 1A and 1C (the same for D and O stages); 2nd bar: 1B;3rd bar: 2A and 2C; 4th bar: 2B. Results are normalized by dividing the impact of each scenario by the largest impact in its category.
C. Reid et al. / Journal of Cleaner Production 17 (2009) 471–479 475

Author's personal copy
cement). For the AE category, the polishing pond operation is alsoan important stage due to the emission of metals in the finaleffluent. Since the final effluent is larger in Scenario 1, the impactdifference between Scenario 1 and Scenario 2 is reduced. Categoriesrelated to site area and water emissions caused by the tailings site(i.e. AA, HT and LO) show greater impacts for Scenario 1. The impactdifference between Scenarios 1 and 2 for the AA category is mainlycaused by the tailings disposal site operation, but it is lower thanthe difference between Scenarios 1 and 2 for the two other cate-gories (HT and LO). This is because acidity emissions from theseepage are proportional to the dyke length around the tailingsdisposal site (not to the covered area).
The tailings site development never contributes to more than15% to an impact category and its impact is always greater forScenario 1. When adding backfill plant construction (and demoli-tion), Scenario 2 generates more impacts for AE, IR and ME. It is alsointeresting to note that the liming plant and desulphurization unitscause minor impacts (below 15% and 5% contribution respectivelyin all of the impact categories), since these units occupy a smallsurface in comparison to the tailings site and consume few mate-rials and lesser energy compared to the backfill plant operation.
Scenarios 2A and 2C have a greater impact than Scenario 2B inall of the categories mainly because the amount of tailings sent tothe backfill plant is slightly less (3.5%) in option 2B due to technicalconstraints (see Table 2). Tailings with a low solids percentagecoming from the cyclone (thickening stage) are sent directly to thetailings disposal site. The detailed results of these analyses arepresented in Supplementary information.
3.2.2. Midpoint categories for closure stageFig. 3 presents the midpoint results for the 2-year closure stage.
Again, the results are presented in relation to the scenario thatgenerates the highest impact in each category. For the impactcategories where only four bars are represented, Scenarios 1A and2A are not included since their impact is too low(contribution� 0.05%).
The tailings disposal site refers to impacts directly linked to thesite in terms of water effluent and area occupied. For each category,the impact ranking is option C> option B> option A, except forland occupation where the impacts are equal between the optionsfor the tailings disposal site, although somewhat larger for option Cdue to seed production. The impact categories AA, AE, HT and LOare dominated by the tailings disposal site while the other cate-gories are mainly influenced by machinery operation. Again, sincethere is no similar study available in the public literature, it isdifficult to compare the results presented here. The detailed resultsof these analyses are presented in Supplementary information.
3.2.3. DiscussionResults have been presented above for each step of the life cycle.
It is also relevant to put them in relation with one another. Theresults indicate that the closure step does not contribute substan-tially to the global impact of the different scenarios except forScenario 1C. The relative importance of the closure stage versus theoverall life cycle is above 20% for Scenario 1C in the followingimpact categories: TE¼ 20%, GW¼ 35%, AA¼ 37%, OLD¼ 37%,NRE¼ 39%, PO¼ 45%, AEu¼ 46%, RI¼ 46%, TAN¼ 51% (results notshown in figures). These relatively large contributions are mainlydue to the machinery, except for AA which is caused by loweringthe water level. The closure step does not have the same relativeimpact for Scenario 2C since the operation impacts are higher whilethe closure impacts are lower. This is because the area to berestored is smaller. The closure step also has a considerable influ-ence due to water level lowering in category AA for Scenarios 1B(36% of the overall impact), 2B (28%) and 2C (28%).
3.2.4. Damage categories for the life cycleIn order to obtain a global overview of the impacts related to the
life cycle for each scenario (including the 2-year closure period),impacts at the damage level are presented in Fig. 4.
As mentioned in the IMPACT 2002þ methodology [21,22], thefour damage scores presented in Fig. 4 (HH, EQ, CC and R) shouldnot be summed and have to be interpreted separately. For eachcategory, Scenario 2C shows the highest score and 1A the lowest.One could expect that the closure option where the site is coveredwith vegetation would be the most environmentally friendly optionbecause of the inclusion of the land-use category. However, thisoption requires more restoration effort, and thus causes moreimpacts on the environment (at least in the short term). Once again,Scenario 2 generates more potential impacts than Scenario 1. Themidpoint impact categories which contribute the most to a damagescore are respiratory effects caused by inorganics for human health,land-use for ecosystem quality and non-renewable energy for thedamage to resources. However, differences between the scenariosare smaller for the damage to ecosystem quality.
As shown in Fig. 2, for the development and operation stages,Scenario 1B shows higher impact scores than Scenario 1C for allmidpoint impact categories. When adding the closure period,Scenario 1C generates larger potential impacts than Scenario 1B asshown in Fig. 4 for each (normalized) damage impact category.Furthermore, after the operation stage, Scenarios 1A and 1C weresimilar with regard to all impact category scores; after the additionof the closure step, this was no longer the case. For Scenario 2, theanalysis of results from the development and operation stepsshowed that Scenarios 2A and 2C generate higher potential impacts
Midpoint impact categories
Tailings disposal site Seeds production and transport Machinery work and transport
0102030405060708090
100
Im
pact (%
o
f th
e
wo
rst scen
ario
)
AA IR OLD PO RI TAN TEAE AEu HT GW LO ME NRE
Fig. 3. Bar chart of the midpoint results for the closure stage; for each impact category, 1st bar: 1A; 2nd bar: 1B; 3rd bar: 1C; 4th bar: 2A; 5th bar: 2B; 6th bar: 2C. Results arenormalized by dividing the impact results in each category by the impact of the scenario having the highest impact score.
C. Reid et al. / Journal of Cleaner Production 17 (2009) 471–479476

Author's personal copy
than Scenario 2B. This conclusion changed when the impacts of theclosure period were added and the following ranking of the impactscores was obtained: Scenario 2C> Scenario 2A> Scenario 2B. Thisapplied to all damage categories except for the damage toecosystem quality where Scenario 2B has a higher score thanScenario 2A. In fact, between closure scenarios, option C appears tobe the most harmful at this point.
3.3. Temporal boundaries expansion
After the 2-year closure period, the tailings disposal site will stillgenerate potential impacts. The tailings disposal site will remain ina state that prevents any return to the initial state (hence producinglong-term land-use impacts). Moreover, the tailings disposal sitestill produces seepage and final effluent containing contaminants.For these reasons, it was decided to study the influence of the limitsof the temporal boundaries, avoiding implicit discounting of long-term impacts. The pros and cons of discounting long-term impactsare discussed by Frischknecht et al. [33] demonstrating that theconsideration of long-term impacts is the subject of an ongoingcontroversy in the LCA community. The IMPACT 2002þ method-ology also proposes a practical approach to this issue [21].
The post-closure stage generates impacts in the followingmidpoint impact categories: human toxicity (HT in damage to HH),aquatic ecotoxicity (AE in damage to EQ), land occupation (LO indamage to EQ) and aquatic acidification (AA, not modelled todamage). Only the results on the damage to ecosystem quality (EQ)are presented here because damage to human health (HH) variesslightly after the closure step (the maximum increase is 4% forScenario 1A for temporal boundaries expansion from 2 to 100years). Since Scenarios 2 generate much more impacts thanScenarios 1 after closure, the temporal boundaries expansion doesnot bring additional information in the damage category HH (seeFig. 4). The evolution of the EQ damage in the post-closure period isshown in Fig. 5.
As indicated in Figs. 4 and 5, the potential impacts on EQ arevery similar for all the scenarios after the 2-year closure period. Inlight of these results, combined with results for the other damagecategories, the three options in Scenario 2 (A, B, C) are clearlydisadvantaged compared to Scenarios 1. However, the tendency isreversed for damages to the ecosystem when the temporalboundaries are expanded beyond the 2-year closure period. Theshifting point where the scenarios’ hierarchy tends to change isaround 10 years after mine closure.
In the post-closure period, only aquatic ecotoxicity and landoccupation impact categories vary in time. The influence of landoccupation on the damage to ecosystems increases more rapidly for
Scenarios 2 than for Scenarios 1 (the detailed contribution of landoccupation to EQ damage is presented in Supplementary infor-mation). This can be explained by the fact that the land-use cate-gory already dominates before the closure step in Scenarios 1. Thus,the importance of the land-use category changes to such an extentthat it affects the result interpretation in favour of backfilling andthe CCBE options.
Let’s recall here that the damage results do not include theaquatic acidification (AA) impact category since IMPACT 2002þdoes not provide damage modelling. Before the closure step, AAimpacts from Scenarios 1 are superior to Scenarios 2. Because thewater volume seeping from the tailings impoundment during theclosure and post-closure steps is higher for Scenarios 1, this resultwould only be amplified. However, the tendency over time is notthe same for the different closure options. According to the dataused, which have a high uncertainty, acidity production in the post-closure step is inferior for closure option A than for options B and C.For option A, data are mainly taken from the literature and foroptions B and C from experiments in laboratory on tailings sampledfrom this mine but on a shorter time scale [27] complemented bynumerical modelling for long-term extrapolation. Efforts should bedevoted in the future to increase the quality of these data.
In this regard, a word of caution must be raised for long-termassessment. The data used for the quality of the final effluent andseepage flows are operation data extrapolated for the post-closurestage in option A and post-closure laboratory data on a smallerscale (439 days) for options B and C. In order to be more rigorous,more detailed technical studies should be carried out for each of thethree closure options selected, to provide higher quality data for thepost-closure stage. Moreover, the linear extrapolation used is notexpected in reality since the final effluent quality may vary in time.This assumption has been used since this variation is unknown. Inthe absence of more precise information, the available data arenevertheless used as a first approximation, mainly to illustrate howthe time scale may affect the final outcome of the LCA of a tailingsfacility closure plan.
It should be noted that additional toxicity impacts are likely tobe caused by long-term emissions that might vary in their extentbetween the options. Therefore, in order to include these in theimpact assessment, an estimation of emission factors correspond-ing to each option would be necessary, and a further extension ofthe time horizon towards several hundreds or even thousands ofyears would be required. Further research is clearly needed on howto include such impacts and considerations in LCA.
It is interesting to recall that the MMSD workshop held in 2001[4], raised concerns related to aggregation over time for the post-closure effects associated with solid waste management practices.
0
2000
4000
6000
8000
10000
12000
14000
16000
18000
Damage impact categories
pers * yr
MENREGWLOTANTEAEROOLDIRRIHT
CC REQHH
Fig. 4. Bar chart of the normalized damage results for the entire life cycle; for eachdamage impact category, 1st bar: 1A; 2nd bar: 1B; 3rd bar: 1C; 4th bar: 2A; 5th bar: 2B;6th bar: 2C; HH¼ human health, EQ¼ ecosystem quality, CC¼ climate change,R¼ resources.
0
2000
4000
6000
8000
10000
12000
14000
16000
18000
20000
0 20 40 60 80 100Time (years)
pe
rs
* y
r
scenario 1a scenario 1b scenario 1c
scenario 2bscenario 2a
scenario 2c
Fig. 5. Evolution of normalized ecosystem quality impacts in time. Year 0 correspondsto the closing of the mine. The arrow indicates the shifting point where the scenarios’hierarchy could change.
C. Reid et al. / Journal of Cleaner Production 17 (2009) 471–479 477

Author's personal copy
These have the potential to last for time periods significantly largerthan the operation phase of the mining/refining process. Careshould be taken to make sure that this aspect is adequatelyreflected in studies to ensure transparency and comparability ofresults.
Results shown here indicate that temporal boundaries expan-sion can indeed modify comparison results, hence post-closureeffects have been analysed but are presented separately because oftheir large uncertainty. Despite the above mentioned uncertainties,the results indicate that the impacts of land-use in the damage toecosystems are important and should be taken into account whenassessing tailings management options.
3.4. Limitations of the study
The application of IMPACT 2002þ, a European method, ina Canadian mining context, has some limitations. Nevertheless, thisapproach was deemed the best available at this time as othermethods induce even more limitations. For instance, with theCanadian midpoint method LUCAS [34], the land-use impact cate-gory was not operational with regional characterization factors. Forthis reason and because this impact category is of high importancein this study, it has been decided to select a method which inte-grates a valid model to characterize land-use impacts. Authors andreaders should nevertheless keep in mind the limitations of thisapproach as the context is quite different between Quebec andEurope.
A point of concern must be raised regarding the results shownhere on human toxicity (HT) and aquatic ecotoxicity (AE). Thepotential impacts on HT are mainly caused by the final effluent (seethe polishing pond operation in Fig. 2). The final effluent also causessignificant impacts on AE (approximately 20% of the impacts forScenario 2 and 65% for Scenario 1). As mentioned before, the Lou-vicourt mine met the environmental criteria [25] imposed by thefederal and provincial governments. Furthermore, the data used tocalculate the amount of the different substances present in the finaleffluent do not consider the background concentration. Also, basedon the concentrations of metals provided by the mine water anal-ysis, all metals identified in the inventory were considered to beemitted in the dissolved form (ions). However, current LCIAmethods, including IMPACT 2002þ, are not yet adapted for metalspeciation, bioavailability and bioconcentration modelling [21].
Reservations should be expressed concerning land quality forthe post-closure stage (after the 2-year closure period). The tailingsdisposal site occupation during post-closure is associated to theinput ‘‘occupation, forest, intensive, clear-cutting’’ for options A andB. Since the site is restored by revegetation which is cut every 2years, the occupation for option C is associated with the input‘‘occupation, pasture and meadow, extensive’’. The most importantassumption has been made here for option A, since a recent case inQuebec [35] showed that fauna and flora are now present in the‘‘lake’’ after a period of about 30 years. However, because nocharacterization factor is available in IMPACT 2002þ and as thissituation is very uncertain, this state has not been considered.
Another source of uncertainty here is related to the CCBEtechnique (option C). This reclamation technique is penalized afterthe 2-year closure period since it requires much more effort thanthe other techniques (but is expected to have a better long-termperformance). It is important to stress that LCA does not take intoaccount all the technical aspects. For example, the performance ofa technique is not assessed. In this case, the CCBE would have beenused only if the perched water table technique would not havegiven the expected results. In other words, option C offers doubleprotection against AMD production. In this specific case, this choicedoes not have much influence on the results since the only stepinvolved with the perched water table technique is the lowering of
the water level. This step generates potential impacts in only threecategories: AA, AE and HT (see Fig. 3). In the AA and HT categories,100% of the impacts are related to contaminants in water from thetailings disposal site and 65% for AE (35% comes from themachinery utilization). The volume of water related to the waterlevel lowering is equal to 4 years of seepage from the tailingsdisposal site. Thus, this technique does not generate a lot ofpotential impacts compared to the CCBE option. The inclusion ofthe perched water table technique in option C was not necessary,but it does not significantly affect the results. Another advantagerelated to the CCBE technique is that it does not require maintaininga specific water level at all times which may be important in thecontext of climate change. In addition, this technique is much lesssensitive to catastrophes.
The revegetation stage, included in option C, is used to avoiddusting. However, the avoided impacts were not considered. Inoption B, it would also have been possible to proceed with reveg-etation with a preliminary levelling of the surface and the additionof an organic cover; however, maintenance of the site is required sothat the roots do not damage the cover. It is also important tospecify that some beneficial aspects, like ground control, were notconsidered in Scenario 2.
Another key assumption has been made concerning theperformance of the different closure options. In this study, all of theselected management options are assumed to achieve their objec-tive, which is to avoid the production of AMD. In reality, it ispossible that a particular technique will not fully achieve theobjective and that corrective action would need to be taken.Moreover, the effects of a dam rupture are completely different foroption A compared to options B and C.
Finally, it should be recalled that this study is specific to anunderground mine in hard rock. Because of the very specific char-acter of each mine, application to another mine could lead todifferent results. The same applies to the fact that the electricitygrid mix in Quebec has an exceptionally high percentage ofhydropower (z95%) which might significantly decrease impactsrelated to electricity production which is not applicable to mostother mining sites in the world.
4. Conclusion
The main results of this study can be summarized as follows.
� Scenario 2 options (tailings disposal site and backfill plant) leadto higher impacts in 11 of the 14 midpoint categories since thebackfill plant operation consumes a great amount of materialand energy. The exceptions are: aquatic acidification, humantoxicity and land occupation which are more dependant uponwater management and occupied surfaces.� Closure option C (CCBE) is the most harmful over the 2-year
closure period since it requires seed production and greatermachinery work.� Damage scores over the life cycle (development, operation and
2-year closure) show that Scenario 1A generates the leastimpacts, mainly because it is the scenario which requires theleast effort.� Temporal boundaries extension tends to modify the results
interpretation in favour of Scenario 2C because of land qualityimprovement.
Special attention was given to the selection of the life cycleimpact assessment method and impact categories. In this study, theprecautionary principle was applied. Even if there is no consensuson the land-use method and the consideration of long-termimpacts, it was decided to include them since these are crucialaspects related to tailings management. Damage results showed
C. Reid et al. / Journal of Cleaner Production 17 (2009) 471–479478
Author's personal copy
the importance of the land-use category within the damage toecosystem quality.
The originality of this study partly lies in considering the tailingsas a process (tailings management) and not directly as an emissionof solid waste, and on focussing on site-specific data collection. Inthe ecoinvent database for example, for life cycle inventories ofmetals, only land-use is considered for mining waste disposalbecause there is a lack of reliable data for modelling of tailingsdisposal since tailings composition can be extremely variable [36].
For an LCA aimed at selecting the best management option,there should also be at the same time a technical assessment of thevarious closure options that would provide specific information foreach type of data.
Considering the specific character of a mine, the results of thisstudy must be applied with caution to other mining sites. Mineralore grade, topography of the site and soil characteristics, forexample are among the specific aspects that could significantlyinfluence the environmental impact.
Acknowledgements
The authors would like to thank CIRAIG’s partners: Alcan, BellCanada, Cambior, Chemin de fer Canadien Pacifique, CEAEQ, Total,Gaz de France/Electricite de France, Hydro-Quebec, Ministere desAffaires municipales et de la Metropole, Petro-Canada, Solvay andVille de Montreal and the Industrial NSERC Polytechnique-UQATChair, Environment and Mine Wastes Management. We would alsolike to thank Louvicourt Mine for their involvement in this project,Dr. Bruno Bussiere for helping in the project, Sandra Estrela and Dr.John Molson for their help in improving the manuscript. We wish togratefully acknowledge all CIRAIG members. We would also like tothank Martin Caspar for his helpful support.
Appendix A. Supplementary data
Supplementary data associated with this article can be found, inthe online version, at doi: 10.1016/j.jclepro.2008.08.014.
References
[1] Ministere des ressources naturelles Quebec. Le Quebec minier, <http://www.mrn.gouv.qc.ca/mines/quebec-minier/index.jsp>; 2003 [accessed 20.09.2003].
[2] Aubertin M, Bussiere B, Bernier L. Environnement et gestion des rejets miniers.manual on CD ROM. Presses Internationales Polytechnique; 2002.
[3] Bussiere B. Personal communication,<http://web2.uqat.ca/crc%2Dbussiere/>; 2006.[4] Stewart M. The application of life cycle assessment to mining, minerals and
metals. Report of the MMSD workshop on life cycle assessment, New York; 2001.[5] StewartM,HansenY,Petrie J.Critical issues for life cycle impactassessment inminerals
processing and metals refining. In: Green processing 2004: 2nd internationalconference on the sustainable processing of minerals. Fremantle, Australia; 2004.
[6] Ecobalance. Life cycle assessment of nickel products. Bethesda, USA; 2000.[7] Hay A, Orlandi M-C, Koundakjian P. EUROFER stainless steel LCI study. In:
Ressources naturelles Canada, editor. Analyse du cycle de vie des metaux –Atelier international portant sur l’analyse du cycle de vie et les metaux.Montreal, 2002.
[8] International Aluminium Institute. Life cycle inventory of the worldwidealuminium industry with regard to energy consumption and emissions ofgreenhouse gases, paper 1–automotive; May 2000.
[9] International Aluminium Institute. Life cycle assessment of aluminium:inventory data for the worldwide primary aluminium industry; 2003. 52 p.
[10] Ugaya CML, Walter ACS. Life cycle inventory analysis – a case study of steelused in Brazilian automobiles. International Journal of Life Cycle Assessment2004;9(6):365–70.
[11] Giurco DP, Stewart M, Petrie JG. The role of LCA in performance assessment inminerals processing – a copper case study. In: Singhal R, Mehrotra A, editors.Environmental issues and management of waste in energy and mineralproduction. Rotterdam; 2000. . 267–73.
[12] Norgate TE, Rankin WJ. Life cycle assessment of copper and nickel production.In: Proceedings of the international conference on minerals processing andextractive metallurgy, Minprex; 2000.
[13] Tan RBH, Khoo HH. An LCA study of a primary aluminium supply chain. Journalof Cleaner Production 2005;13:607–18.
[14] Van Zyl D. Towards improved environmental indicators during the mining lifecycle. In: Ressources naturelles Canada, editor. Analyse du cycle de vie des
metaux – Atelier international portant sur l’analyse du cycle de vie et lesmetaux. Montreal, 2002.
[15] Durucan S, Korre A, Munoz-Melendez G. Mining life cycle modelling: a cradle-to-gate approach to environmental management in the minerals industry.Journal of Cleaner Production 2006;14:1057–70.
[16] Ripley EA, Redmann RE, Crowder AA. Environmental effects of mining. 2nd ed.Florida: St. Lucie Press; 1996.
[17] Jolliet O, Ruedi M-W, Bare J, Brent A, Goedkoop M, Heijungs R, et al. The LCIAmidpoint-damage framework of the UNEP/SETAC life cycle initiative. Inter-national Journal of Life Cycle Assessment 2004;9(6):394–404.
[18] Lindeijer E, Muller-Wenk R, Steen B. Impact assessment of resources and landuse. Life-cycle impact assessment: striving towards best practice; 2002.
[19] Ressources naturelles Canada. Analyse du cycle de vie et metaux – Atelierinternational portant sur l’analyse du cycle de vie et les metaux. Montreal:Groupe de l’environnement aux LMSM-CANMET; 2002.
[20] Seppala J, Koskela S, Melanen M, Palperi M. The Finnish metals industry andthe environment. Resources, Conservation and Recycling 2002;35:61–76.
[21] Humbert S, Margni M, Jolliet O. IMPACT 2002þ: user guide. Lausanne, Swit-zerland: Industrial Ecology and Life Cycle Systems Group, GECOS, SwissFederal Institute of Technology (EPFL); October 2005.
[22] Jolliet O, Margni M, Charles R, Humbert S, Payet J, Rebitzer G, et al. IMPACT2002þ: a new life cycle impact assessment methodology. International Jour-nal of Life Cycle Assessment 2003;8(6):324–30.
[23] Julien MR, Lemieux M, Cayouette J, Talbot D. Performance and monitoring of theLouvicourt mine tailings and disposal area. In: Proceedings of the 36th annualmeeting of the Canadian mineral processors. Ottawa, Ontario, Canada; 2004.
[24] Golder Associes. Rapport de conception, Parc a residus, projet Louvicourt.Pointe-Claire: Les Ressources Aur, Inc; January 1993.
[25] Ministere du developpement durable de l’Environnementet des Parcs du Quebec.Directive 019 sur l’industrie miniere. Report no.: ENV/2005/0120; 2005.
[26] Bois D, Benzaazoua M, Bussiere B, Kongolo M, Poirier P. A feasibility study onthe use of desulphurized tailings to control acid mine drainage. CIM Bulletin2005;98(1087):1.
[27] Ouangrawa M, Molson J, Aubertin M, Zagury G, Bussiere B. The effect of watertable elevation on acid mine drainage from reactive tailings: a laboratory andnumerical modeling study. In: Barnhisel RI, editor. 7th International confer-ence on acid rock drainage (ICARD). St. Louis, MO: American Society of Miningand Reclamation (ASMR); 2006.
[28] PRe Consultants. Simapro Faculty version 6.0.4 software; 2004.[29] Frischknecht R, Jungbluth N, Althaus H-J, Doka G, Dones R, Heck T, et al. The
ecoinvent database: overview and methodological framework. InternationalJournal of Life Cycle Assessment 2005;10(1):3–9.
[30] Caterpillar. Guide Caterpillar: Materiels et Methodes. 35th ed. Peoria, Illinois,USA: 2004.
[31] Beardsley M, Lindhjem CE. Exhaust emission factors for non road enginemodeling – compression ignition. Report no.: NR-009. US EPA, Office of MobileSources, Assessment and Modelling Division; 1998 February 24.
[32] Aur Resources Inc. North and central America, future development,<http://www.aurresources.com/operations_north_future.htm>; 2006 [accessed 10.04.2006].
[33] Frischknecht R, Jungbluth N, Althaus H-J, Bauer C, Doka G, Dones R, et al.Implementation of life cycle impact assessment methods. Final report ecoin-vent v2.0 no. 3. Dubendorf, CH: Swiss Centre for Life Cycle Inventories;December 2007.
[34] Toffoletto L, Bulle C, Godin J, Reid C, Deschenes L. LUCAS – a new LCIA methodused for a Canadian-specific context. International Journal of Life CycleAssessment 2007;12(2):93–102.
[35] Vezina S, Amyot G. Le suivi de la restauration par inondation au parc a residusminiers Solbec, <http://sefa.asp.visard.ca/GEIDEFile/flooding-99-.htm?Archive¼191938091911&File¼flooding-99-F_ht> [accessed 27.09.2006].
[36] Althaus H-J, Classen M. Life cycle inventories of metals and methodologicalaspects of inventorying material resources in ecoinvent. International Journalof Life Cycle Assessment 2005;10(1):43–9.
Valerie Becaert, Ph.D., Eng, Research Officer at the Interuniversity Research Centre forthe Life Cycle of Products, Processes and Services (CIRAIG), Ecole Polytechnique deMontreal, Department of Chemical Engineering.
Prof. Michel Aubertin, Ph.D., Eng, Industrial NSERC Polytechnique-UQAT Chair, Envi-ronment and Mine Wastes Management, Ecole Polytechnique de Montreal, Depart-ment of Civil, Geological, and Mining Engineering.
Ralph K. Rosenbaum, Ph.D., Eng, Research Officer and Lecturer at the InteruniversityResearch Centre for the Life Cycle of Products, Processes and Services (CIRAIG), EcolePolytechnique de Montreal, Department of Chemical Engineering.
Prof. Louise Deschenes, Ph.D., Adjunct Director of the Interuniversity Research Centrefor the Life Cycle of Products, Processes and Services (CIRAIG), Ecole Polytechnique deMontreal, Department of Chemical Engineering.
Catherine Reid, MScA, Analyst at the Interuniversity Research Centre for the Life Cycleof Products, Processes and Services (CIRAIG), Ecole Polytechnique de Montreal,Department of Chemical Engineering.
C. Reid et al. / Journal of Cleaner Production 17 (2009) 471–479 479