Reactive Transport Modeling of Natural Carbon Sequestration in Ultramafic Mine Tailings
17
www.VadoseZoneJournal.org ReacƟve Transport Modeling of Natural Carbon SequestraƟon in Ultramafic Mine Tailings Atmospheric CO 2 is naturally sequestered in ultramafic mine tailings as a result of the weathering of serpenƟne minerals [Mg 3 Si 2 O 5 (OH) 4 ] and brucite [Mg(OH) 2 ], and subsequent mineralizaƟon of CO 2 in hydrated magnesium carbonate minerals, such as hydromagnesite [Mg 5 (CO 3 ) 4 (OH) 2 ·4H 2 O]. Understanding the CO 2 trapping mechanisms is key to evaluaƟng the capacity of such tailings for carbon sequestraƟon. Natural CO 2 sequestraƟon in subaeri- ally exposed ultramafic tailings at a mine site near Mount Keith, Australia is assessed with a process-based reacƟve transport model. The model formulaƟon includes unsaturated flow, equaƟons accounƟng for energy balance and vapor diffusion, fully coupled with sol- ute transport, gas diffusion, and geochemical reacƟons. Atmospheric boundary condiƟons accounƟng for the effect of climate variaƟons are also included. KineƟc dissoluƟon of serpen- Ɵne, dissoluƟon-precipitaƟon of brucite and primary carbonates—calcite (CaCO 3 ), dolomite [MgCa(CO 3 ) 2 ], magnesite (MgCO 3 ), as well as the formaƟon of hydromagnesite, halite (NaCl), gypsum (CaSO 4 ·2H 2 O), blödite [Na 2 Mg(SO 4 ) 2 ·4H 2 O], and epsomite [MgSO 4 ·7H 2 O]—are con- sidered. SimulaƟon results are consistent with field observaƟons and mineralogical data from tailings that weathered for 10 yr. PrecipitaƟon of hydromagnesite is both predicted and observed, and is mainly controlled by the dissoluƟon of serpenƟne (the source of Mg) and equilibrium with CO 2 ingressing from the atmosphere. The predicted rate for CO 2 entrapment in these tailings ranges between 0.6 and 1 kg m − 2 yr −1 . However, modeling results suggest that this rate is sensiƟve to CO 2 ingress through the mineral waste and may be enhanced by several mechanisms, including atmospheric pumping. AbbreviaƟons: BET, Brunauer–EmmeƩ–Teller; SWCC, soil water characterisƟc curve; TIC, total inorganic carbon; TSF, tailings storage facility; XRPD, X-ray powder diffracƟon. It is now widely accepted that anthropogenic greenhouse gases, in particular CO 2 , have caused most of the increases in global average temperatures since the mid 20th century (IPCC, 2007). Concerns over global climate change provide the motivation for investigating methods to sequester CO 2 . Underground CO 2 storage as a supercritical fluid is a widely advocated sequestration strategy (IPCC, 2005); however, fixing carbon within the crystal structures of minerals has also been recognized as a safe and more permanent method for sequestering anthropogenic carbon (e.g., Lackner, 2003; Seifritz, 1990; Wilson, 2009; Wilson et al., 2009). Recent work has shown that CO 2 is naturally sequestered into minerals in deep aquifers, but also at the Earth’s surface. Hydrated magnesium carbonate minerals, such as hydromagnesite [Mg 5 (CO 3 ) 4 (OH) 2 ·4H 2 O], are common low-tempera- ture alteration products of serpentine-rich mine wastes (Wilson et al., 2006, 2009; Wilson, 2009). Hydromagnesite, which occurs at Mount Keith, is metastable under Earth surface conditions (Königsberger et al., 1999). However, Power et al. (2009) demonstrated stability of hydromagnesite within alkaline playa deposits in British Columbia, Canada for more than 10 ka. erefore, if hydromagnesite is stored under neutral to alkaline conditions, dissolution of hydromagnesite and release of CO 2 to the atmosphere is unlikely on the time scale of millennia (Palandri and Kharaka, 2004). us, mineralization of CO 2 in ultra- mafic mine tailings has been proposed as a method by which the mining industry might reduce its greenhouse gas emissions. Understanding the CO 2 trapping mechanisms and quantification of CO 2 capture is key to evaluating how effective ultramafic tailings are for passive carbon sequestration. Process-based reactive transport modeling provides a suitable method to help identify the processes that are responsible for carbon trapping and storage. Although several reactive transport models have been developed to investigate trans- port and geochemical processes in the vadose zone of mine tailings (e.g., Xu et al., 2000; Lefebvre et al., 2001a,b; Mayer et al., 2002; Molins and Mayer, 2007; Acero et al., 2009; Bea et al., 2010a), none of these codes account for the full complexity of interactions Natural carbon dioxide sequestraƟon is assessed with a process-based reacƟve transport model for a mine site near Mount Keith, Australia. The simulations demonstrate that atmospheric carbon dioxide is trapped in the ultramafic mine tailings due to carbonaƟon reacƟons involving the weathering of serpenƟne and brucite, resulƟng in the formaƟon of hydromagnesite. S.A. Bea and K.U. Mayer, Dep. of Earth and Ocean Sciences, Univ. of BriƟsh Columbia, 6339 Stores Rd., V6T 1Z4, Vancouver, BC, Canada; S.A. Wilson, G.M. Dipple, and I.M. Power, Mineral Deposit Research Unit, Dep. of Earth and Ocean Sciences, Univ. of BriƟsh Columbia, 6339 Stores Rd., V6T 1Z4, Van- couver, BC, Canada; S.A. Wilson, currently at School of Geosciences, Monash Univ., Clay- ton, VIC 3800, Australia; P. Gamazo, Water Dep., North Headquarters, Univ. of the Repu- blic, Salto, Uruguay. S.A. Bea, currently at Lawrence Berkeley NaƟonal Lab., 1 Cyclotron Rd., Berkeley, CA 94720. *Corresponding author ([email protected]). Vadose Zone J. doi:10.2136/vzj2011.0053 Received 3 June 2011. Special Section: Reactive Transport Modeling S.A. Bea* S.A. Wilson K.U. Mayer G.M. Dipple I.M. Power P. Gamazo © Soil Science Society of America 5585 Guilford Rd., Madison, WI 53711 USA. All rights reserved. No part of this periodical may be reproduced or transmiƩed in any form or by any means, electronic or mechanical, including pho- tocopying, recording, or any informaƟon storage and retrieval system, without permission in wriƟng from the publisher.
-
Upload
independent -
Category
Documents
-
view
0 -
download
0
Transcript of Reactive Transport Modeling of Natural Carbon Sequestration in Ultramafic Mine Tailings

www.VadoseZoneJournal.org
Reac ve Transport Modeling of Natural Carbon Sequestra on in Ultramafi c Mine TailingsAtmospheric CO2 is naturally sequestered in ultramafi c mine tailings as a result of the weathering of serpen ne minerals [Mg3Si2O5(OH)4] and brucite [Mg(OH)2], and subsequent mineraliza on of CO2 in hydrated magnesium carbonate minerals, such as hydromagnesite [Mg5(CO3)4(OH)2·4H2O]. Understanding the CO2 trapping mechanisms is key to evalua ng the capacity of such tailings for carbon sequestra on. Natural CO2 sequestra on in subaeri-ally exposed ultramafi c tailings at a mine site near Mount Keith, Australia is assessed with a process-based reac ve transport model. The model formula on includes unsaturated fl ow, equa ons accoun ng for energy balance and vapor diff usion, fully coupled with sol-ute transport, gas diff usion, and geochemical reac ons. Atmospheric boundary condi ons accoun ng for the eff ect of climate varia ons are also included. Kine c dissolu on of serpen- ne, dissolu on-precipita on of brucite and primary carbonates—calcite (CaCO3), dolomite
[MgCa(CO3)2], magnesite (MgCO3), as well as the forma on of hydromagnesite, halite (NaCl), gypsum (CaSO4·2H2O), blödite [Na2Mg(SO4)2·4H2O], and epsomite [MgSO4·7H2O]—are con-sidered. Simula on results are consistent with fi eld observa ons and mineralogical data from tailings that weathered for 10 yr. Precipita on of hydromagnesite is both predicted and observed, and is mainly controlled by the dissolu on of serpen ne (the source of Mg) and equilibrium with CO2 ingressing from the atmosphere. The predicted rate for CO2 entrapment in these tailings ranges between 0.6 and 1 kg m−2 yr−1. However, modeling results suggest that this rate is sensi ve to CO2 ingress through the mineral waste and may be enhanced by several mechanisms, including atmospheric pumping.
Abbrevia ons: BET, Brunauer–Emme –Teller; SWCC, soil water characteris c curve; TIC, total inorganic carbon; TSF, tailings storage facility; XRPD, X-ray powder diff rac on.
It is now widely accepted that anthropogenic greenhouse gases, in particular CO2, have caused most of the increases in global average temperatures since the mid 20th century (IPCC, 2007). Concerns over global climate change provide the motivation for investigating methods to sequester CO2. Underground CO2 storage as a supercritical fl uid is a widely advocated sequestration strategy (IPCC, 2005); however, fi xing carbon within the crystal structures of minerals has also been recognized as a safe and more permanent method for sequestering anthropogenic carbon (e.g., Lackner, 2003; Seifritz, 1990; Wilson, 2009; Wilson et al., 2009). Recent work has shown that CO2 is naturally sequestered into minerals in deep aquifers, but also at the Earth’s surface. Hydrated magnesium carbonate minerals, such as hydromagnesite [Mg5(CO3)4(OH)2·4H2O], are common low-tempera-ture alteration products of serpentine-rich mine wastes (Wilson et al., 2006, 2009; Wilson, 2009). Hydromagnesite, which occurs at Mount Keith, is metastable under Earth surface conditions (Königsberger et al., 1999). However, Power et al. (2009) demonstrated stability of hydromagnesite within alkaline playa deposits in British Columbia, Canada for more than 10 ka. Th erefore, if hydromagnesite is stored under neutral to alkaline conditions, dissolution of hydromagnesite and release of CO2 to the atmosphere is unlikely on the time scale of millennia (Palandri and Kharaka, 2004). Th us, mineralization of CO2 in ultra-mafi c mine tailings has been proposed as a method by which the mining industry might reduce its greenhouse gas emissions. Understanding the CO2 trapping mechanisms and quantifi cation of CO2 capture is key to evaluating how eff ective ultramafi c tailings are for passive carbon sequestration. Process-based reactive transport modeling provides a suitable method to help identify the processes that are responsible for carbon trapping and storage.
Although several reactive transport models have been developed to investigate trans-port and geochemical processes in the vadose zone of mine tailings (e.g., Xu et al., 2000; Lefebvre et al., 2001a,b; Mayer et al., 2002; Molins and Mayer, 2007; Acero et al., 2009; Bea et al., 2010a), none of these codes account for the full complexity of interactions
Natural carbon dioxide sequestra on is assessed with a process-based reac ve transport model for a mine site near Mount Keith, Australia. The simulations demonstrate that atmospheric carbon dioxide is trapped in the ultramafic mine tailings due to carbona on reac ons involv ing the weather ing of serpen ne and brucite, resul ng in the forma on of hydromagnesite.
S.A. Bea and K.U. Mayer, Dep. of Earth and Ocean Sciences, Univ. of Bri sh Columbia, 6339 Stores Rd., V6T 1Z4, Vancouver, BC, Canada; S.A. Wilson, G.M. Dipple, and I.M. Power, Mineral Deposit Research Unit, Dep. of Earth and Ocean Sciences, Univ. of Bri sh Columbia, 6339 Stores Rd., V6T 1Z4, Van-couver, BC, Canada; S.A. Wilson, currently at School of Geosciences, Monash Univ., Clay-ton, VIC 3800, Australia; P. Gamazo, Water Dep., North Headquarters, Univ. of the Repu-blic, Salto, Uruguay. S.A. Bea, currently at Lawrence Berkeley Na onal Lab., 1 Cyclotron Rd., Berkeley, CA 94720. *Corresponding author ([email protected]).
Vadose Zone J. doi:10.2136/vzj2011.0053Received 3 June 2011.
Special Section: Reactive Transport Modeling
S.A. Bea*S.A. WilsonK.U. MayerG.M. DippleI.M. PowerP. Gamazo
© Soil Science Society of America5585 Guilford Rd., Madison, WI 53711 USA.All rights reserved. No part of this periodical may be reproduced or transmi ed in any form or by any means, electronic or mechanical, including pho-tocopying, recording, or any informa on storage and retrieval system, without permission in wri ng from the publisher.

www.VadoseZoneJournal.org
between fl ow and transport processes, energy balance, and geo-chemical reactions. Most of the existing models focus on the simulation of acid rock drainage (ARD) generation, and only some of the codes recognize dynamic boundary conditions as an impor-tant control for assessing the geochemical evolution in tailings (e.g., Xu et al., 2000; Lefebvre et al., 2001a,b; Acero et al., 2009; Bea et al., 2010a). To date, reactive transport modeling has not been applied to investigate CO2 capture in ultramafi c mine waste.
The objective of this contribution is to use reactive transport modeling for a process-based and integrated assessment of CO2sequestration in the Mount Keith tailings impoundment, Western Australia (Wilson, 2009). To meet this objective, the multicompo-nent reactive transport code MIN3P-D (Henderson et al., 2009) is enhanced by including an energy balance equation and vapor transport. An overview on the model development and its verifi ca-tion is also provided in this contribution.
Conceptual Model of Carbon Dioxide Sequestra on in Ultramafi c Mine WasteAtmospheric exposure of mine waste containing ultramafi c miner-als [e.g., serpentine, Mg3Si2O5(OH)4] naturally induces carbon sequestration when Mg released from primary minerals reacts with CO2 present in the tailings (e.g., Wilson, 2009). Although straightforward in principle, Mg-silicate dissolution and the formation of Mg-hydroxy-carbonates are aff ected by a variety of interacting processes (Fig. 1).
Under arid conditions, as present at the Mount Keith facility, vadose zone fl ow in tailings is mainly controlled by low relative humidity in the atmosphere that drives evaporation and causes upward fl ow of process water. As a result of evaporation, solute con-centrations in near surface pore water are dramatically increased, leading to super-saturated conditions with respect to salts and causing the formation of an effl orescent crust (e.g., Stolberg, 2005; Acero et al., 2009; Bea et al., 2010a; Gran et al., 2011). As evapora-tion progresses, water content and relative permeability near the surface are reduced, inhibiting the fl ow of water toward the surface. Th erefore, the evaporation front is progressively displaced down-ward, and the region containing effl orescent salts grows with time. As a consequence of evaporation, pH decreases near the tailings surface. Th is increases the dissolution rate of primary phases [i.e., serpentine and brucite, Mg(OH)2], which become the main source of alkalinity and Mg2+ in these tailings (Wilson, 2009; Wilson et al., 2009).
Downward diff usion of CO2 driven by carbonate precipitation and enhanced by the decrease of water saturation maintains the precipitation of hydrated Mg-carbonates [e.g., hydromagnesite, Mg5(CO3)4(OH)2·4H2O]. As a result, hydrated magnesium carbonate and calcium carbonate minerals mainly occur as
near-surface crusts or as disseminated precipitates that cement the tailings pile (Wilson, 2009). Th e key CO2 trapping mechanism is based on the following reaction:
3 2 5 4 2 2serpentine
5 3 4 2 2 2hydromagnesite
Mg Si O (OH) 2.4CO H O
0.6Mg (CO ) (OH) 4H O 2SiO
+ + ⇒
⋅ + [1]
In addition, the geochemical evolution of tailings is also aff ected by the precipitation of other secondary phases. Ca, Mg and Si released from dissolution of primary minerals are reprecipitated in the form of gypsum [CaSO4·2H2O], blödite [Na2Mg(SO4)2·4H2O], epso-mite [MgSO4·7H2O], and chalcedony [SiO2]. Th e dissolution and reprecipitation of primary carbonate minerals [i.e., calcite, CaCO3; dolomite, MgCa(CO3)2; magnesite, MgCO3] may pro-vide another important source or sink of total inorganic carbon (TIC) in the system.
Model DevelopmentTh e reactive transport code MIN3P (Mayer et al., 2002) was previ-ously enhanced by Henderson et al. (2009) to include the coupling between density driven fl ow and reactive transport. More recently, an energy balance equation and formulations for reactive trans-port in high ionic strength solutions were implemented (Bea et al., 2011). As part of this work, the capabilities of the code were further enhanced to include the diff usion of water vapor and atmospheric boundary conditions. A summary of the formulation for vadose zone fl ow, vapor diff usion, energy balance, and reactive solute and
Fig. 1. Conceptual model of carbon dioxide fi xation in ultramafi c tail-ings for arid environments.

www.VadoseZoneJournal.org
gas transport is provided below. Additional details of the formula-tion and constitutive relationships are provided in the Appendix. A verifi cation example for the energy balance equations and water vapor diff usion is also provided in the Appendix.
Vadose Zone Flow and Vapor Diff usionTh e implementation of vadose zone fl ow and vapor diff usion is based on the formulation presented by Philip and De Vries (1957) (see also Saito et al., 2006):
v vl ll v w=
SS q q ft t
δφ ρδφ ρ+ ∇⋅ +∇⋅ + ζ
δ δ [2]
where φ is the porosity; Sl and Sv are the pore water and vapor saturations, respectively; ρ l and ρv are the pore water and vapor densities [M L−3], t is time [T], ql and qv are the water and vapor mass fl uxes [M L−2 T−1], Fw is a fl uid source–sink term [M L−2 T−1], and ζ is a constant that relates the surface area on the bound-ary with the volume of the porous medium [L2 L−3].
Water fl uxes (ql) in Eq. [2] are calculated based on a modifi ed form of Darcy’s Law that includes a thermal hydraulic conductivity term (Noborio et al., 1996; Saito et al., 2006; Sakai et al., 2009):
( )r ll l l l l l wt
l 0= =
Kk Pq v P g G TT
⎡ ⎤∂γ⎢ ⎥ρ −ρ ∇ +ρ + ∇⎢ ⎥μ γ ∂⎣ ⎦ [3]
where vl is the modifi ed Darcy fl ux [L T−1], K is the permeability tensor [L2], kr is the relative permeability as a function of pore water saturation (Sl), Pl is the pore water pressure [M L−1 T−2], g is the gravity constant [L T−2], μl is the dynamic fl uid viscosity [M L−1 T−1], Gwt is a gain factor that quantifi es the temperature dependence of the soil water retention curve, γ and γ0 are the water surface tension [M T−2] and its reference value at 25°C (71.89 g s−2), respectively, and T is temperature [°C]. Water fl uxes (ql) in Eq. [3] can be induced by both pressure and temperature gradients.
Vapor f luxes in Eq. [2] take into account the vapor diffusion induced by vapor density (ρv) gradients through Fick’s equation as:
v vv v v w v v v w l
l= =q S D S D T P
T P⎛ ⎞∂ρ ∂ρ ⎟⎜ ⎟∇⋅ ∇⋅φ τ ∇ρ ∇⋅φ τ η ∇ + ∇⎜ ⎟⎜ ⎟⎜ ∂ ∂⎝ ⎠
[4]
where τv is the tortuosity factor (Millington, 1959), Dw is the vapor diff usion coeffi cient [L2 T−1], and η is an enhancement factor to describe the increase in thermal vapor fl ux as a result of liquid islands and increased temperature gradients in the air phase (Cass et al., 1984; Saito et al., 2006; Sakai et al., 2009).
Relationships by Wösten and van Genuchten (1988) are commonly used to describe the pore water saturation and relative permeability as a function of matric suction. In some cases, particularly under very dry conditions, these functions may not represent soil water
retention adequately. As an alternative, the enhanced MIN3P code also considers functions proposed by Fayer and Simmons (1995) that extend the functions by Wösten and van Genuchten (1988) to very dry conditions.
Energy Balance Equa onsTh e formulation for energy transport implemented in MIN3P is based on Philip and De Vries (1957) and Voss and Provost (2008):
v v v s s w v vl l lh h
(1 )=
c S c L Sc S j ft t t t
δφ ρ δ −φ ρ δ φ ρδφ ρ+ + + ∇⋅ + ζ
δ δ δ δ [5]
where cl, cv, and cs are the heat capacities for liquid, vapor, and solid phases, respectively [E M−1 °C−1], ∇⋅jh is the energy fl ux [E L−3 T−1], Lw is the latent heat of vaporization for liquid water [E M−1], and fh is the energy source–sink term [E L−2 T−1]. Th e energy fl uxes term (∇⋅jh) in Eq. [5] is evaluated as:
h l l l h
v v w v
j c q T T c D Tc q T L q
∇⋅ =∇⋅ −∇⋅λ∇ +∇⋅φ ρ ∇ +∇⋅ +∇⋅
[6]
where λ is the thermal conductivity tensor [E L−1 T−1 °C−1], and Dh is the thermal dispersion tensor [L2 T−1].
Reac ve Transport Equa onsTh e direct substitution approach is used for solving the coupled multicomponent reactive transport equations for Nc components (Mayer et al., 2002):
( ) ( )ga a al g l l a a
g ga ag g g c
=
1,
j j j j
j j j j
S T S T v T S D Tt t
S D T Q f f j N
∂ ∂φ + φ ∇⋅ −∇⋅φ τ ∇
∂ ∂−∇⋅φ τ ∇ + + + =
[7]
where vl is the Darcy fl ux (Eq. [3]); Tja and Tj
g are the total con-centrations for jth component in the aqueous and gas phases, respectively [M L−3]; Sg is the gas phase saturation, τa and τg are the tortuosities for aqueous and gas phases, respectively, computed here based on the relationships provided by Millington (1959); Da is the aqueous diff usion–dispersion tensor [L2 T−1]; Dg is the gas diff usion coeffi cient in air [L2 T−1], Q j
a is the source–sink term for the jth component due to the geochemical reactions [M L−3 T−1]; fja and fjg are the source–sink terms associated with boundary fl uxes for the jth component in the aqueous and gas phases, respectively [M L−3 T−1]. Th is formulation is based on the assumption that gas phase diff usion dominates gas transport, as was suggested by previous stud-ies for similar applications (e.g., Xu et al., 2000; Molins et al., 2008).
Boundary Condi onsTo facilitate an adequate description of evaporation under varying climate conditions, atmospheric boundary conditions for fl ow and energy transport equations have been implemented. Evaporation

www.VadoseZoneJournal.org
E [M L−2 T−1], rainfall P [M L−2 T−1], and surface run-off Jsr [M L−2 T−1] are considered through the term fw (Eq. [2]), which is defi ned by:
fw = P + E + Jsr [8]
Evaporation of water from the soil surface is controlled by the exchange of heat between the soil surface and the atmosphere, the fl ow of water to the soil surface from below, and the transfer of water vapor from the soil surface to the atmosphere. If any of these processes is altered, evaporation will change accordingly. An integrated form of Fick’s Law of vapor diff usion accounts for the eff ects of these three processes. Th is form of Fick’s Law implies that the evaporation rate is equal to the defi cit in vapor density between the soil surface and the atmosphere divided by the sum of the atmospheric boundary layer (rh) and soil surface (rs) resistances to vapor fl ow [T L−1]:
( )atmv v
s h=E
r rρ −ρ
+ [9]
where ρvatm is the atmospheric vapor density [M L−3]. If these resis-
tances to vapor fl ow are not considered, the evaporation rate will be overestimated (Saito et al., 2006).
Th e present formulation does not account for storage of ponded water; it is assumed that runoff occurs when the precipitation rate exceeds the infi ltration capacity of the surface. Note that the evap-oration term (E) and the run-off term (Jsr) depend on pore water pressure Pl. Runoff is activated if Pl exceeds atmospheric pressure at the ground surface.
Th e source–sink term for energy transport ( fh in Eq. [5]) is calcu-lated from the surface energy balance (Saaltink et al., 2005; Saito et al., 2006) as:
fh = Hs + LwE + clPTatm + Rn [10]
where Rn is the net solar radiation [E L−2 T−1] that can be provided as external input based on measured data or calculated internally based on latitude and climate data. Sensible heat fl ux Hs [E L−2 T−1] in Eq. [10], like evaporation, is also described by a diff usion relation accounting for an atmospheric boundary layer:
( )atmatm
s g gh
=T T
H cr−
ρ [11]
where ρgatm is the air density [M L−3], and cg is the heat capacity of
air [E M−1 °C−1]. Th e terms clPTatm and LwE in Eq. [10] account for the internal energy of water and vapor fl uxes.
Boundary solute and gas fl uxes ( fja and fjg) in Eq. [7] are defi ned as:
( )a ab ab=j j jf J T [12]
( )g gb gb=j j jf J T∇ [13]
where Jjab and Jjgb are the mass fl uxes for the jth component in the aqueous and gas phases across the boundary [M L−2 T−1]. Boundary fl uxes in the aqueous phase are expressed as a function of the total component concentrations (Tj
ab), whereas diff usive gas fl uxes at the boundary are a function of the gradient of the total concentrations of the jth component in the gas phase (∇Tj
gb).
Solu on Strategy for Thermohydraulic and Chemical CouplingTh e fl uid fl ow conservation and energy transport equations are solved using Newton’s method. Th e coupling between fl uid density (i.e., as a function of the temperature) and solute concentrations is solved using the Picard iterative approach. Th is approach is con-ceptually straightforward and is used in a number of computer programs that simulate variable density fl ow and transport prob-lems (Voss, 1984; Ackerer et al., 1999; Diersch and Kolditz, 2002).
Model Parameters for Mount Keith TailingsTh e new model capabilities are used for a process-oriented assess-ment of CO2 trapping in ultramafic mine tailings located in Western Australia (Mount Keith). Residual material from the processing plant was piped to the tailings storage facilities (TSF1 and TSF2) suspended in hypersaline process water used in the fl otation circuit.
Modeling was performed for the TSF1, an experimental tail-ings impoundment that was in operation from 1994 to 1996 and was sampled in 2006. Th e tailings are relatively homogeneous in grain size and hydraulic conductivity (Stolberg, 2005), and the impoundment has a large spatial extent in comparison with its thickness. Under these conditions fl ow and transport processes in the vadose zone are predominantly vertical, and for that reason, the domain is conceptualized as a one-dimensional column com-posed of 3.5 m sand to clay tailings on the basis of the description reported by Stolberg (2005) (see Fig. 1). Th is approach has also been used in previous reactive transport modeling studies for tailings by Mayer et al. (2002), Acero et al. (2009), and Bea et al. (2010a). Physical and transport parameters and constitutive laws used in the simulation are shown in Table 1. Estimated soil water characteristic curve (SWCC) parameters describing volumetric water content and hydraulic conductivity were contrasted with site-specifi c laboratory measurements by Stolberg (2005) and are presented in Fig. 2.
Atmospheric boundary conditions were imposed at the top of the solu-tion domain and impervious boundaries are imposed at the bottom for fl ow, energy and solute transport. Th is approach can be justifi ed by the low hydraulic conductivity of the clay foundation (?10−8 m s−1, Stolberg, 2005) and near constant temperatures at depth.

www.VadoseZoneJournal.org
As for the atmospheric parameters, maximum and minimum mean values for temperature (Tatm) and relative humidity (Hr) were cal-culated for a period of 30 yr of data recorded in the region. Th e relative humidity varies between 0.28 and 0.53 and the tempera-ture between 30 and 13°C from summer to winter, respectively. MIN3P allows use of hourly or daily data from a weather station (including precipitation, radiation, temperature, relative humidity, wind speed, cloud cover), but the full weather data records were not available for this site. A simplifi ed approach that captures seasonal fl uctuations of temperature and humidity based on sinusoidal functions was used for a time period of 1 yr, as depicted in Fig. 3.
Annual average rainfall for the region is approximately 220 mm and mainly occurs in intense events of short duration (Stolberg,
2005). Daily precipitation recorded in 2010 (1 January–31 December) at the Leinster Airport (station 012314), located 60 km south of the Mount Keith site, were used in the simulations and repeated for a period of 30 yr (Fig. 3). Th e average duration for
Table 1. Physical and transport parameters used in the simulation.
Parameter or constitutive law Tailings Reference†
Porosity, φ 0.46 1
Hydraulic conductivity K [m s−1] 10−8 1
Retention curve
α [m−1] 0.8 2
n 1.4 2
Srl 0.001 2
Liquid relative permeability, krl
l 1 1
Th ermal conductivity, λ [W m−1 °C−1]
b1 [W m−1 °C−1] 0.228 3
b2 [W m−1 °C −1] −2.406 3
b3 [W m−1 °C−1] 4.909 3
Solid density, ρs [kg m−3] 1400 4
Specifi c heat capacity of solid, cs (J kg−1 °C−1) 1100 9
Specifi c heat of liquid, cl [J kg−1 °C−1] 4182 5
Specifi c heat capacity of vapor, cv [J kg−1 °C −1] 1996 9
Diff usive transport in the gas phase
Diff usion coeffi cient, Dg [m2 s−1] 1.65 × 10⁻⁵ 6
Tortuosity in the gas phase, τg [-] τg = Sg7/3φ1/3 8
Transport diff usion in the aqueous phase
Diff usion coeffi cient, Da [m2 s−1] 8 × 10⁻¹⁰ 7
Tortuosity in the aqueous phase, τa [-] τa = Sg7/3φ1/3 8
Evaporation by aerodynamic diff usion (E)
Wind speed, va [m s−1] 3.3 9
Screen height, za [m] 1 9
Roughness length, z0 [m] 0.01 9
† 1, Stolberg (2005); 2, fi tted from Stolberg (2005); 3, Chung and Horton (1987) and Sakai et al. (2009); 4, computed from the weight percentage and density of the initial mineral content; 5, Voss and Provost (2008); 6, Molins and Mayer (2007); 7, Mayer et al. (2002); 8, computed as Mil-lington (1959); 9, estimated.
Fig. 2. Model parameters: soil water characteristic curve (SWCC). (A) Measured drying SWCC Mount Keith (TSF1) nickel tailings (Stolberg, 2005) and estimated SWCC used in the present model. (B) Unsaturated hydraulic conductivity function.
Fig. 3. Atmospheric boundary conditions: temperature and rela-tive humidity of the atmosphere and rainfall imposed in the model. Rainfall events were based on daily data recorded at Leinster Airport (012314 Station, located 60 km south of Mount Keith tailings) for the period 1 Jan. 2010 through 31 Dec. 2010.

www.VadoseZoneJournal.org
each rainfall event was estimated at 2 h. Wind speed and the pres-ence of cloud cover aff ect evaporation. In the absence of measured data, a constant wind speed of 3.3 m s−1 and a partially cloudy sky were considered in the simulation.
Mineralogy of Mount Keith TailingsDetailed mineralogical analyses have been conducted for the Mount Keith tailings, providing the data necessary to constrain the reactive transport simulations. Th e tailings are composed pri-marily of antigorite and lizardite with hydrotalcite-group minerals (i.e., mostly iowaite and woodallite with occasional pryroaurite, stichtite, and mountkeithite). Minor amounts of brucite, chryso-tile, talc, magnetite, chromite, quartz, magnesite, dolomite, and calcite are common (Wilson, 2009). Trace vermiculite is also observed in the tailings. Sulfi de minerals have not been detected with X-ray powder diff raction (XRPD) with a detection limit of approximately 0.5% (w/w). Sampling details and analytical meth-ods are described in the Appendix.
Secondary precipitates are abundant in surficial tailings and include carbonate, halide, and sulfate minerals. Effl orescent halide and sulfate minerals are common within the upper 0.25 m of the tailings, although less so in TSF1 than in TSF2. At Mount Keith, halite, hexahydrite, and blödite dominate these effl orescences and are commonly associated with lesser amounts of epsomite, konyaite, löweite, and gypsum. Sanderite, starkeyite, pentahydrite, and carnallite are less common and have only been observed at low abundance. Kainite and anhydrite may or may not be present near detection in very few of the samples analyzed.
Refined abundances and median abundances for hydromagnesite, magnesite, serpentine minerals, dolo-mite, halite, hydrotalcite-group minerals, brucite, and calcite in 30 samples of 10-yr-old tailings from TSF1 are plotted in Fig. 4. Th ese results were obtained by Rietveld refinement of XRPD data (Appendix 6). Shaded envelopes denote the median plus or minus the median absolute deviation of mineral abundance for depth intervals of 0 to 25, 25 to 50, 50 to 75, 75 to 100, and 100 to 125 cm. Median and median absolute deviation were used as measures of central tendency because Rietveld refi nement results produce a sparse set of log-normally distributed data.
Sulfate minerals are restricted to the effl orescences that cover the upper few centimeters of the tail-ings deposit. Abundances of both hydromagnesite and halite are highest near the surface of TSF1. Abundances of these minerals decrease asymptotically with increasing distance from the surface until they reach relatively constant values at a depth of approxi-mately 0.5 m (Fig. 4).
Th e abundance data for serpentine, hydrotalcite-group minerals, magnesite, and brucite display a consistent trend toward decreasing abundance with proximity to tailings surfaces. Part of this trend is the result of a first-order change in the composition of tail-ings during the fi rst few years of mine operation (Wilson, 2009). Another contributing factor is that secondary minerals (i.e., hydro-magnesite, halite, and sulfate minerals) in surface effl orescences have precipitated to a large extent from dissolved atmospheric gasses, dissolved aqueous species within process water, and from process water itself. This significant input of crystalline mass that was not contained initially within the processed ore results in a dilution eff ect in mineral abundances. Th is occurs because Rietveld refi nement results provide a relative measure of crystalline mass, normalized to 100% (w/w).
A second reason for the decrease in the abundance of serpentine (and the virtual disappearance of brucite from surfi cial tailings) is that these Mg-rich gangue minerals are dissolving and acting as the source of Mg in secondary carbonate and sulfate minerals. Brucite is known to produce hydromagnesite upon weathering under conditions of temperature and pressure that prevail at the Earth’s surface (e.g., Hostetler et al., 1966; Xiong and Lord, 2008). Carbonation of 2% (w/w) brucite would produce approximately 3.2% (w/w) hydromagnesite, which would account for >60% of the observed abundance.
Magnesite could also act as a source of Mg for precipitation of hydromagnesite. However, considering that the abundances of two far more soluble carbonate minerals, calcite and dolomite, remain relatively constant with depth it is more likely that the decline in
Fig. 4. Variation of select mineral abundances with depth (by Rietveld refi nement of X-ray powder diff raction data for 10-yr old tailings from TSF1).
www.VadoseZoneJournal.org
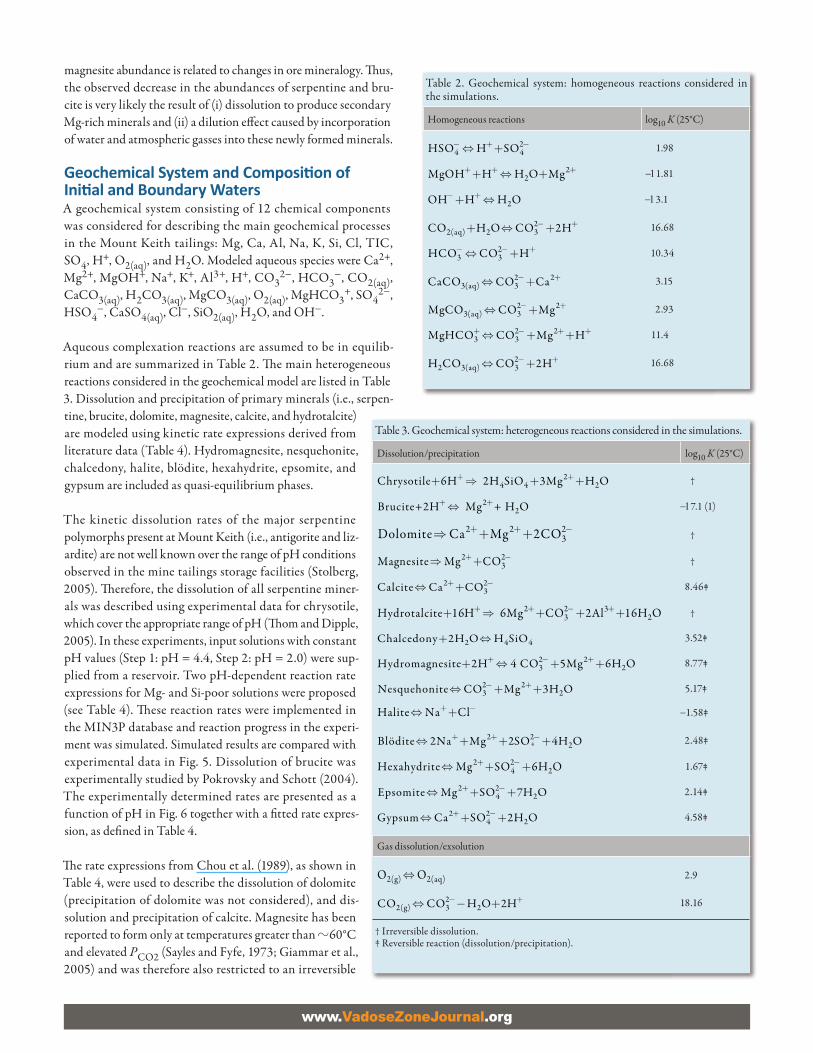
magnesite abundance is related to changes in ore mineralogy. Th us, the observed decrease in the abundances of serpentine and bru-cite is very likely the result of (i) dissolution to produce secondary Mg-rich minerals and (ii) a dilution eff ect caused by incorporation of water and atmospheric gasses into these newly formed minerals.
Geochemical System and Composi on of Ini al and Boundary WatersA geochemical system consisting of 12 chemical components was considered for describing the main geochemical processes in the Mount Keith tailings: Mg, Ca, Al, Na, K, Si, Cl, TIC, SO4, H+, O2(aq), and H2O. Modeled aqueous species were Ca2+, Mg2+, MgOH+, Na+, K+, Al3+, H+, CO3
2−, HCO3−, CO2(aq),
CaCO3(aq), H2CO3(aq), MgCO3(aq), O2(aq), MgHCO3+, SO4
2−, HSO4
−, CaSO4(aq), Cl−, SiO2(aq), H2O, and OH−.
Aqueous complexation reactions are assumed to be in equilib-rium and are summarized in Table 2. Th e main heterogeneous reactions considered in the geochemical model are listed in Table 3. Dissolution and precipitation of primary minerals (i.e., serpen-tine, brucite, dolomite, magnesite, calcite, and hydrotalcite) are modeled using kinetic rate expressions derived from literature data (Table 4). Hydromagnesite, nesquehonite, chalcedony, halite, blödite, hexahydrite, epsomite, and gypsum are included as quasi-equilibrium phases.
The kinetic dissolution rates of the major serpentine polymorphs present at Mount Keith (i.e., antigorite and liz-ardite) are not well known over the range of pH conditions observed in the mine tailings storage facilities (Stolberg, 2005). Th erefore, the dissolution of all serpentine miner-als was described using experimental data for chrysotile, which cover the appropriate range of pH (Th om and Dipple, 2005). In these experiments, input solutions with constant pH values (Step 1: pH = 4.4, Step 2: pH = 2.0) were sup-plied from a reservoir. Two pH-dependent reaction rate expressions for Mg- and Si-poor solutions were proposed (see Table 4). Th ese reaction rates were implemented in the MIN3P database and reaction progress in the experi-ment was simulated. Simulated results are compared with experimental data in Fig. 5. Dissolution of brucite was experimentally studied by Pokrovsky and Schott (2004). The experimentally determined rates are presented as a function of pH in Fig. 6 together with a fi tted rate expres-sion, as defi ned in Table 4.
Th e rate expressions from Chou et al. (1989), as shown in Table 4, were used to describe the dissolution of dolomite (precipitation of dolomite was not considered), and dis-solution and precipitation of calcite. Magnesite has been reported to form only at temperatures greater than ?60°C and elevated PCO2 (Sayles and Fyfe, 1973; Giammar et al., 2005) and was therefore also restricted to an irreversible
Table 2. Geochemical system: homogeneous reactions considered in the simulations.
Homogeneous reactions log10 K (25°C)
24 4HSO H SO− + −⇔ + 1.98
22MgOH H H O Mg+ + ++ ⇔ + −11.81
2OH H H O − ++ ⇔ −13.1
22(aq) 2 3CO H O CO 2H− ++ ⇔ + 16.68
23 3HCO CO H− − +⇔ + 10.34
2 23(aq) 3CaCO CO Ca− +⇔ + 3.15
2 23(aq) 3MgCO CO Mg− +⇔ + 2.93
2 23 3MgHCO CO Mg H+ − + +⇔ + + 11.4
22 3(aq) 3H CO CO 2H− +⇔ + 16.68
Table 3. Geochemical system: heterogeneous reactions considered in the simulations.
Dissolution/precipitation log10 K (25°C)
24 4 2Chrysotile 6H 2H SiO 3Mg H O+ ++ ⇒ + + †
22Brucite+2H Mg + H O+ +⇔ −17.1 (1)
2 2 23Dolomite Ca Mg 2CO+ + −⇒ + + †
2 23Magnesite Mg CO+ −⇒ + †
2 23Calcite Ca CO+ −⇔ + 8.46‡
2 2 33 2Hydrotalcite 16H 6Mg CO 2Al 16H O+ + − ++ ⇒ + + + †
2 4 4Chalcedony 2H O H SiO+ ⇔ 3.52‡
2 23 2Hydromagnesite 2H 4 CO 5Mg 6H O+ − ++ ⇔ + + 8.77‡
2 23 2Nesquehonite CO Mg 3H O− +⇔ + + 5.17‡
Halite Na Cl+ −⇔ + −1.58‡
42 2
2Blödite 2Na Mg 2SO 4H O+ + −⇔ + + + 2.48‡
2 24 2Hexahydrite Mg SO 6H O+ −⇔ + + 1.67‡
2 24 2Epsomite Mg SO 7H O+ −⇔ + + 2.14‡
2 24 2Gypsum Ca SO 2H O+ −⇔ + + 4.58‡
Gas dissolution/exsolution
2(g) 2(aq)O O⇔ 2.9
22(g) 3 2CO CO H O 2H− +⇔ − + 18.16
† Irreversible dissolution.‡ Reversible reaction (dissolution/precipitation).

www.VadoseZoneJournal.org
dissolution reaction. Th e rate expression for magnesite dissolution was taken from Palandri and Kharaka (2004), based on experi-mental data reported by Pokrovsky and Schott (1999) (Table 4).
In the model, the initial mineralogy is composed of a mixture of serpentine, brucite, and carbonates (magnesite, calcite, dolomite, and hydrotalcite; Table 5). Th e volumetric fraction occupied by each mineral is calculated from its weight fraction by considering its density. Weight fractions are estimated using Rietveld refi ne-ment results for XRPD data on samples from the Mount Keith tailings (Fig. 4 and Wilson, 2009). Total surface area for each min-eral Si [m2 L−1] in Table 4 is computed based on its weight fraction percentage wt%i, bulk solid density ρs [g L−1], and reactive surface area σi [m
2 g−1] shown in Table 5 as:
swt%100
i iiS
ρ σ= [14]
being the reactive surface (σi) calculated as the product of the measured surface area (Table 5) times a fi tted calibration factor fc(Table 4). Th is fi tted calibration factor represents the ratio between the mineral specific surface areas derived from the Brunauer–Emmett–Teller (BET) measurements and the reactive surface areas used in the present model. Eff ective reactive surface areas are typically one to three orders of magnitude lower than surface areas derived from BET measurements, which is in line with previous observations (White and Peterson, 1990). Th e chemical composi-tions for the initial and boundary solutions are shown in Table 6. Th e initial pore water composition is derived from the hypersaline process water emplaced with the tailings; the total concentrations for Ca, TIC, and Mg were modifi ed by equilibrium with calcite,
Table 4. Kinetic rate expressions used in the simulations. Hydromagnesite, nesquehonite, halite, chalcedony, blödite, epsomite, gypsum and hexahy-drite were considered as quasi-equilibrium reactions.
Reaction process Rate expression Fitted calibration factor ( fc) Reference†
mol L−1 s−1
Chrysotile dissolution (Mg path) 10.02 0.22H10i iR S a−+= × 0.035 1
Chrysotile dissolution (Si path)10.37 0.19
H10i iR S a−+= ×
Brucite 6.38 0.2 210 (1 )i i H iR S a−+= × −Ω 0.05 2
Magnesite dissolution ( )6.38 0.589 9.34H10 10i iR S a− −+= + 0.01 3
Dolomite dissolution ( )2.58 0.75 4 0.75 7.66H CO2(aq)10 10 10i iR S a a− − −+= + + 0.001 4
Calcite ( )0.051 6.19 3.301H w H2CO3(aq)10 10 10 (1 )i i iR S a a a− − −+= + + −Ω 1 4
Hydrotalcite 9 0.5H10i iR S a−+= × 1 5
† 1, Th om and Dipple (2005); 2, estimated based on data presented by Pokrovsky and Schott (2004); 3, Palandri and Kharaka (2004); 4, Chou et al. (1989); 5, esti-mated from fi eld observations presented by Wilson (2009).
Fig. 5. Chrysotile dissolution rate: temporal evolution of Mg and Si effl uent concentrations during chrysotile dissolution experiment (measured data from Th om and Dipple, 2005). Continuous lines show the results obtained by MIN3P.
Fig. 6. Estimated brucite [Mg(OH)2] dissolution rate (Rbrucite) as a function of pH (Table 4), measured data from Pokrovsky and Schott (2004).

www.VadoseZoneJournal.org
hydromagnesite and brucite, respectively (note that the resulting PCO2 was lower than atmospheric). Th e boundary condition for solute transport was based on the chemical composition of mete-oric water taken from Bea et al. (2004) in equilibrium with the partial pressure of CO2(g) in the atmosphere (≈3.4 × 10⁻⁴ atm). For both solutions, equilibrium with atmospheric oxygen (PO2 = 0.21 atm; Mayer et al., 2002) is assumed. Speciation calculations were performed with the help of the CHEPROO code (Bea et al., 2009). Considering the hypersaline nature of the pore water in these tailings (>50,000 mg L−1 total dissolved solids, Stolberg, 2005), the Pitzer ion interaction approach was used for the calcu-lation of the aqueous activities (the HMW model, Harvie et al., 1984; Bea et al., 2010b). Virial coeffi cients for most of the ions were taken from Harvie et al. (1984) at 25°C and 1 atm.
Modeling ResultsSimulations were conducted for a time period of 30 yr and the predicted thermohydraulic, and geochemical evolution and an estimation of CO2 uptake are described in the following sections. Despite the fact that results for a simulation time of 10 yr were consistent with the data set of observations in Mount Keith tail-ings, the simulation time was extended to 30 yr, which is consistent with the predicted lifetime of the Mount Keith mine (from com-mencement of operations to closure). Th us, the extrapolation of
the model to 30 yr provides an estimate of carbon mineralization over the operational lifetime of the mine.
Thermohydraulic Evolu onVertical distributions for water content, temperature, vapor density, and matric suction at diff erent times are shown in Fig. 7; the tem-poral evolution for temperature, matric suction, and vapor density at 0.05 m below the tailings surface are shown in Fig. 8 for a time period of 10 yr.
Due to arid conditions with very limited precipitation, the water content of the initially saturated tailings decreases as evaporation progresses (Fig. 7). Th e normalized bulk water content contained in the 3.5-m-thick tailings column decreases by 30% during 10 yr (Fig. 8C). Temperatures at depth quickly approach yearly average temperatures of approximately 22°C and refl ect seasonal fl uctu-ations near the ground surface (Fig. 7 and Fig. 8A). Pore water pressures decline substantially near the ground surface (Fig. 7) due to the development of very dry conditions.
As expected, the temperature on the tailings surface declines during the winter months, closely following decreases in solar radiation and air temperature (compare Fig. 3 and Fig. 8). Near sur-face temperatures in the tailings are higher than the atmospheric temperature (Fig. 8) with larger discrepancies during the summer months, and a slight increase over time. Th ese observations can be
Table 5. Initial mineralogy considered in the simulations.
Mineral phase Weight VolumeMeasured surface area
Reactive surface area(5) σ
———— % ———— ——————— m2 g−1 ———————
Chrysotile 85.75 46.17 17.6(1)† 0.616
Brucite 2.5 1.44 0.12(2) 0.006
Dolomite 1.5 0.72 0.069(3) 6.9 × 10⁻⁵
Magnesite 5 2.21 0.066(3) 6.6 × 10⁻⁴
Calcite 0.25 0.13 0.037(3) 0.037
Hydrotalcite 5 3.33 10(4) 10
Chalcedony 0 0
Hydromagnesite 0 0
Nesquehonite 0 0
Halite 0 0
Blödite 0 0
Hexahydrite 0 0
Epsomite 0 0
Gypsum 0 0
Total 100 54
† Methods: (1) BET (Th om and Dipple, 2005), (2) BET (Pokrovsky and Schott, 2004), (3) BET (Pokrovsky et al., 2005), (4) Calculated from the specifi c surface and the weight content of the primary solid phases of the concrete and the argillite (De Windt et al., 2008), and (5) Calculated as the prod-uct between the measured surface area times the fi tted calibration factor ( fc) shown in Table 4.
Table 6. Chemical compositions for initial and boundary solutions.
Initial solution Boundary solution
pH 9.75 6
Ca, mol L−1 9.7 × 10⁻⁴ 1.1 × 10⁻³
Mg, mol L−1 6.8 × 10⁻² 7.4 × 10⁻⁴
Na, mol L−1 1 7.5 × 10⁻³
K, mol L−1 3.3 × 10⁻² 1.5 × 10⁻⁴
Cl, mol L−1 1 7.5 × 10⁻³
SO4, mol L−1 8.5 × 10⁻² 1.9 × 10⁻³
O2, mol L−1 1.8 × 10⁻⁴ 2.6 × 10⁻⁴
Si, mol L−1 10−4 –
TIC, mol L−1 6.9 × 10⁻⁴ 2.7 × 10⁻⁵
Al, mol L−1 10−10 10−10
Ionic strength, mol L−1 1.32 0.014
PCO2, atm 7.2 × 10⁻⁷ 3.4 × 10⁻⁴
PO2, atm 0.21 0.21
Mineral saturation indices
SIBru 0 −9.06
SIHymg 0 −34.57
SIHal −1.97 −5.94
SICal 0 −4.33

www.VadoseZoneJournal.org
explained by considering the energy balance at the upper bound-ary. Most of the incoming radiation is consumed by evaporation of water. However, the mean evaporation rate decreases over time as very dry conditions develop near the tailings surface (Fig. 7), implying decreases in water activity and in liquid pressure near the surface (see Fig. 8B, E and F). As a result, the latent heat fl ux (related to evaporation) declines over the years. To maintain the heat balance, the sensible heat fl ux has to increase over time, which requires an increase in the diff erence between the surface and air temperature, which can only be achieved by a temperature increase of the surfi cial tailings.
Although vertical vapor density distribution is generally correlated with the temperature distribution, vapor density decreases dramat-ically near the surface because of dry conditions and high suction (Fig. 7). Simulation results show that rainfall events temporarily impact bulk water content in these tailings (Fig. 8C); however, the net water loss dominates long-term evolution. Evaporation rates increase during the summer when the relative humidity decreases, but also increase following rainfall events as the liquid saturation, vapor density, and water activity increase near the tailings surface (see Fig. 8F).
An alternative simulation, for which the vapor density (ρv) was not corrected by the osmotic suction [i.e., through water activity (aw), the impact of which on the evaporation rate can be found in Krumgalz et al. (2000) and Gamazo et al. (2011)] was also con-ducted (see Fig. 8C). Results suggest that neglecting osmotic eff ects
would tend to overestimate long-term water loss (35% instead of 30% when including the osmotic correction term).
Evolu on of Pore Water Composi on and PCO2(g)Th e vertical distributions of total concentrations for Cl, Na, Mg, SO4, and TIC at diff erent times are shown in Fig. 9. Ion concentrations progres-sively increase due to solute transport toward the ground surface, and subsequent water content decreases as a result of evaporation. The same trend is also observed for K and Ca (results not shown). However, TIC quickly reaches a steady state at the beginning of the simulation.
Th e distribution of pH is maintained in an alka-line range (between 8 and 10, see Fig. 10) as was observed in these tailings (Stolberg, 2005). However, despite the fact that the initial pH was 9.75 (see Table 6), simulations suggest that pH progressively decreases toward 8 to 9 near the sur-face. Th is decrease is due to an up-concentration of protons, as evaporation proceeds; however, the
Fig. 7. Modeling results: water content, liquid pressure, vapor density, and temperature distributions at 0, 1, 4, 6, 8, and 10 yr, respectively.
Fig. 8. Modeling results for fl ow, vapor transport, and energy balance: (A) temporal evolu-tion of temperature, (B) liquid pressure, (D) vapor density, and (E) water activity at 0.05 m below the tailings surface. Temporal evolution of (C) the normalized bulk water content for the entire tailings thickness and (F) evaporation rate at the tailings surface are also shown.

www.VadoseZoneJournal.org
pH decrease is buff ered by the dissolution of serpentine, brucite, and hydrotalcite.
The vertical distribution of CO2 partial pressure at different times is also shown in Fig. 10. Th e PCO2 profi le quickly reaches a quasi-steady state, and carbon dioxide pressure declines from atmo-spheric concentrations at the surface (3.4 × 10⁻⁴ atm) to values of approximately 5 × 10⁻⁵ atm at a depth of 0.5 m. Th ese conditions develop due to the precipitation of hydrated magnesium carbonate mineral phases and the downward concentration gradient leads to a sustained ingress of atmospheric CO2.
Forma on of Magnesium-Hydrated Carbonates and Other Secondary PhasesTh e modeled vertical distributions of serpentine, brucite, hydro-magnesite, and halite at diff erent times (0, 1, 4, 6, 8, and 10 yr, respectively) are shown in Fig. 11. Th e dissolution of serpentine is predicted to occur throughout the entire tailings, releasing Mg. However, the rate of dissolution increases as pH decreases in the evaporation zone (Fig. 10 and Fig. 11).
For brucite, the simulations suggest that dissolution occurs in the evaporation zone of the tailings as pH progressively decreases, whereas brucite precipitation is predicted in the deeper sections of the tailings zones, where the pH is greater
Fig. 9. Modeling results of geochemical evolution: vertical distribu-tion of concentrations for Cl, Na, Mg, SO4, and total inorganic carbon (TIC) at diff erent times (0, 1, 4, 6, 8, and 10 yr, respectively).
Fig. 10. Modeling results of geochemical evolution: vertical distribu-tion of PCO2(g) (atm) and pH at diff erent times. pH measurements corresponding to November 2001 were taken from Stolberg (2005).
Fig. 11. Modeling results of mineralogical evolution: vertical distribu-tion of mineral contents for serpentine, brucite, hydromagnesite and halite at diff erent times. Porosity distributions are also shown.

www.VadoseZoneJournal.org
than 9. Brucite precipitation in this region is partly driven by serpentine dissolution.
Precipitation of hydromagnesite and halite are also predicted in the evaporation zone of these tailings, and the precipitation fronts migrate to deeper regions as evaporation progresses (Fig. 11). Th e concentration of hydromagnesite increases over time, suggesting continued sequestration of CO2 from the atmosphere and from brucite dissolution, whereas halite practically remains constant (Fig. 11). Halite is partially redistributed in the surfi cial tailings due to reoccurring rainfall events. Precipitation of small amounts of nesquehonite is also predicted in this zone (results not shown). In addition, blödite is precipitating in the evaporation zone (Fig. 12E), whereas chalcedony precipitates throughout the tailings (results not shown).
Simulation results suggest limited reactivity of primary carbonates (i.e., calcite, dolomite, and magnesite), despite the fact that calcite is allowed to dissolve and precipitate. Porosity is practically unaf-fected over time, despite the formation of an effl orescent crust and the dissolution of serpentine (Fig. 11).
Es ma on of Carbon Dioxide Trapping in Mount Keith TailingsAn estimate of cumulative CO2 trapping in the Mount Keith tail-ings over a period of 30 yr is shown in Fig. 13 (for 1994–2024). Th e calculation is based on simulated gas fl uxes across the tailings surface with an arithmetic average of about 0.4 μmol m−2 s−1 from the atmosphere toward the tailings, decreasing from 0.51 to 0.31 μmol m−2 s−1 during the 30-yr simulation period (calculated based on 5-yr averages).
Th e simulations indicate that 17 kg m−2 of CO2 are trapped in the tailings mostly by hydromagnesite precipitation aft er 30 yr (Fig. 13). However, comparison of the simulated hydromagnesite accu-mulation with observed data (Fig. 12B) suggests that simulations have underpredicted hydromagnesite formation considerably. Th e simulations were conducted with a CO2 diff usion coeffi cient in air of 1.65 × 10⁻⁵ m2 s−1, which is representative for the average yearly temperature at Mount Keith, and high pore gas saturations. It is conceivable that additional processes that were not considered in the simulations may lead to enhanced ingress of CO2. Processes not considered include the temperature dependence of diff usion coeffi cients, gas advection due to barometric pressure fl uctuations (Massmann and Farrier, 1992), advective CO2 displacement in the gas phase due to displacement by ingressing precipitation water, and wind eff ects. In an attempt to better match observed hydro-magnesite formation, an additional simulation was conducted with Dg = 6 × 10⁻⁵ m2 s−1 (Fig. 12B), using CO2 diff usion as a surrogate for all processes aff ecting CO2 transport. In this case, the simulations predict that 31 kg m−2 of CO2 are trapped in the tailings over a 30-yr time period (Fig. 13). An enhanced CO2 diff u-sion coeffi cient also impacts brucite distribution (see Fig. 12C). Its
dissolution front reaches deeper portions in these tailings, whereas the remaining mineral distributions (i.e., serpentine, halite, blödite, and hydrotalcite) keep invariant (Fig. 12A, D, E, and F).
Th e results indicate that 3.4% (w/w) of serpentine was dissolved in 10 yr near the surface of the tailings with lower consumption rates in deeper sections, suggesting that the material possesses long-term sequestration potential. Th e dissolution of serpentine at depth is
Fig. 12. Modeling results of mineralogical evolution: Vertical distribu-tion for (A) serpentine, (B) hydromagnesite, (C) brucite, (D) halite, (E) blödite, and (F) hydrotalcite aft er 10 yr (Dg = 1.65 × 10 −5 [m2
s−1], solid line; Dg = 6 × 10⁻⁵ [m2 s−1], dashed line). Results are com-pared with observations corresponding in the TSF1 storage facility (Wilson, 2009).
Fig. 13. Modeling results: Cumulative CO2 trapping in Mount Keith tailings, computed based on total CO2 fl ux across tailings surface (solid line). Dashed line corresponds to results for CO2 gas diff usion coeffi cient of 6 × 10⁻⁵ [m2 s−1].

www.VadoseZoneJournal.org
likely an artifact of how the dissolution rate law was implemented, that is, as an irreversible reaction. However, this simplifi cation does not aff ect the carbonation rates in the surfi cial region of the tailings where far-from-equilibrium conditions prevail. Th e pri-mary conclusions of this study regarding CO2 uptake therefore remain unaff ected.
Discussion and Concluding RemarksTh e laboratory-determined serpentine dissolution rate had to be reduced using a factor of 0.035 (see Table 4) to obtain a consistent result with the observations (see Fig. 12A). Th is reduction may be justifi ed due to hydromagnesite precipitation on the surface of serpentine (Wilson et al., 2009; Wilson, 2009), which reduces its reactivity (i.e., passivation by “coating” is not simulated here). However, this adjustment is in line with previous studies that investigated the relationship between theoretical and eff ective reactive surfaces (e.g., White and Peterson, 1990). Under fi eld conditions, the reduction of reactive surface areas may also be due to preferential fl ow eff ects and reduced contact between pore water and mineral surfaces (e.g., Lichtner and Kang, 2007).
As was suggested by Wilson (2009), the dissolution of brucite [Mg(OH)2] serves as a secondary source of Mg, as pH drops in the evaporation zone. Th is process was confi rmed by the model for the surfi cial region of the tailings; however, the simulations also suggest precipitation of brucite in the deeper regions that remain at elevated pH values between 9 and 10.
Th e precipitation of effl orescent salts such as halite and blödite are also predicted in the upper part of the tailings, consistent with observations for TSF1 (Fig. 4 and Fig. 12D and E; Wilson, 2009). Despite that Cl and Na are present at comparable concentrations at the beginning of the simulation, Na concentrations decrease close to the tailings surface as blödite starts to precipitate (i.e., it consumes Na, and a chemical divide is produced; see, e.g., Bea et al., 2010a).
Th e simulated pH profi les are largely unaff ected over time and remain in the alkaline range (between 8 and 10), as was observed in previous investigations (e.g., see Fig. 10 corresponding to 10 yr; Stolberg, 2005). Th e progressive pH decrease toward neutral values near the tailings surface is attenuated by the dissolution of serpentine and brucite, which provide a key source of alkalinity in these tailings. However, observations and simulation results also suggest that the kinetic dissolution of hydrotalcite (not very well documented in the literature) may be another potential source of alkalinity in these tailings.
Th e assumption to reduce the reactivity of bedrock-carbonates in the present model is consistent with observations at Mount Keith,
where there is strong evidence that bedrock carbonate minerals are not being dissolved and remineralized (Wilson, 2009).
Simulations and fi eld observations indicate that 17 to 31 kg m−2 of CO2(g) become trapped in the tailings over a time period of 30 yr (Fig. 13). Model-predicted sequestration displays only a lim-ited decrease over time because the mineral content and reactive surface area of serpentine are only slightly altered over the 30-yr simulation period. Th e modeling results suggest that the trap-ping capacity for carbon dioxide may be maintained for decades in these tailings. Th e results also indicate that diff usive ingress of atmospheric carbon dioxide from the tailings surface plays an important role for carbon fi xation (Fig. 13). In addition, the fact that model results predict a lower CO2 uptake than indicated by mineralogical data suggests that additional transport processes enhance carbon capture.
Th e mechanistic reactive transport modeling approach has dem-onstrated that complex physical and chemical processes play a role for CO2 capture in ultramafi c tailings in arid environments. Overall, good agreement was obtained between fi eld observations and model simulations; however, the measurement of CO2 fl uxes, concentrations gradients, and moisture contents within the tail-ings would greatly help to confi rm fi ndings derived from previous studies focusing on mineralogical alteration, including hydromag-nesite precipitation.
Th e implementation of carbon mineralization at industrial point sources requires high pressures and temperatures due to short resi-dence times and timescales (e.g., hours) (Sipilä et al., 2008). Th is strategy remains both energy-intensive and expensive and is, there-fore, not broadly implemented. Our results suggest that passive sequestration technologies, such as mineral carbonation in mine tailings, off er a low-temperature, low-pressure alternative—exploit-ing the natural process of silicate weathering to enhance capture and storage of CO2 in the form of carbonate minerals.
AppendixCons tu ve Rela onships for Vadose Zone FlowSolution density, viscosity, and surface tension in Eq. [3] are aff ected by changes in temperature and solution composition. Fluid density (ρl) is evaluated as:
ρl = ρf + ΔρC + ΔρT [A1]
where ρf is the reference density (e.g., freshwater at 25°C) [M L−3], and ΔρC and ΔρT are the density changes due to solution com-position and temperature, respectively [M L−3]. Th e dependence of density on solution composition (ΔρC) can be approximated by a linear relationship between density and total dissolved solid or is

www.VadoseZoneJournal.org
calculated using Pitzer’s ion interaction model following Monnin (1994). Density changes due to temperature (ΔρT) are defi ned as:
T TT∂ρ
Δρ = Δ∂
[A2]
where ∂ρ/∂T is a constant that describes the density dependence on temperature [M L−3 °C−1], and ΔT is the temperature change [°C]. Dynamic fl uid viscosity (μ l) is expressed as a function of solution composition and temperature (Lever and Jackson, 1985; Kolditz et al., 1998):
l f C T= f fμ μμ μ [A3]
with
2 3
C 2 3f f f
1 1.85 4.1 44.51 1.85 4.1 44.5
f μ + ω+ ω + ω=+ ω + ω + ω
[A4]
and
3f f
T 31 0.7063 0.04832
=1 0.7063 0.04832
f μ + σ − σ+ σ− σ
[A5]
where σ = (T − 150)/100 (T, °C) and ω is the solute mass fraction in the fl uid and ωf is the solute mass fraction of the fl uid at the ref-erence viscosity μf). Surface tension (γ) is computed as a function of temperature (Saito et al., 2006; Sakai et al., 2009):
γ = 75.6 − 0.1425T − 2.38 × 10⁻⁴ [A6]
Cons tu ve Rela onships for Vapor TransportTh e vapor diff usion coeffi cient Dw [L2 T−1] is computed as a func-tion of temperature (T, °C) according to Saito et al. (2006):
25
w 2.12 10273.15
TD − ⎛ ⎞⎟⎜= × ⎟⎜ ⎟⎜⎝ ⎠ [A7]
Th e enhancement factor η in Eq. [4] is defi ned as (Cass et al., 1984; Saito et al., 2006; Sakai et al., 2009):
42.61 l
cl3 ( 1)
Sf
a S a e
⎡ ⎤⎛ ⎞⎟⎜⎢ ⎥⎟⎜ ⎟− +⎜⎢ ⎥⎟⎜ ⎟⎢ ⎥⎟⎜⎝ ⎠⎣ ⎦η= + − − [A8]
where fc is the mass fraction of clay in the soil, and a is an empirical constant (Sakai et al., 2009).
Vapor density (ρv) calculations in Eq. [2] and Eq. [4] account for the eff ect of capillary pressure (through relative humidity Hr) and salin-ity as a function of water activity aw (e.g., see Saaltink et al., 2005):
ρv = ρsvHraw [A9]
where ρsv is the temperature-dependent saturated vapor density [M L−3]. Relative humidity (Hr) is derived the from pore water pressure and temperature following Philip and De Vries (1957):
( )atm l w
lr
P P MRT
H e
⎡ ⎤−⎢ ⎥−⎢ ⎥ρ⎢ ⎥⎣ ⎦=
[A10]
where Patm is the atmospheric pressure [Pa], and R the universal gas constant (8.314 [m3 Pa mol−1 K−1]). Th e saturated vapor density (ρsv) in Eq. [A9] can be computed in two ways: the fi rst option is based on the psychrometric law as a function of vapor pressure (ρv, Pa) (e.g., see Edlefson and Anderson, 1943; Olivella et al., 1994; Saaltink et al., 2005):
w vsv
M PRT
ρ = [A11]
where Pv is defi ned as a function of temperature:
5239.711
v 1.36075 10 TP e−
= × [A12]
Alternatively, ρsv can be calculated as proposed by Saito et al. (2006):
6014.79 331.3716 7.92495 103
sv =10TeT
−− − ×−ρ [A13]
Due to the presence of concentrated brines in the pore water, water activity (aw) in Eq. [A9] is evaluated based on the HMW model (Harvie et al., 1984; Bea et al., 2010b).
Cons tu ve Rela onships for Energy TransportLatent heat of vaporization (Lw) in Eq. [5] is defi ned as a function of temperature:
Lw = 2.501 × 10⁶ − 2369.2T [A14]
Various expressions are available in the literature to compute the thermal conductivity λ in Eq. [6]. Here, λ is calculated as a func-tion of pore water saturation (Sl) following Chung and Horton (1987); Sakai et al. (2009):
λ(Sl) = b1 + b2φSl + b3(φSl)0.5 [A15]
where b1, b2, and b3 are constants [E L−1 T−1 °C−1]. Other expres-sions are also available in MIN3P (Voss and Provost, 2008):
λ(Sl) = φSlλl + (1 − φ)λs [A16]
where λl and λs are the liquid and solid thermal conductivities, respectively [E L−1 T−1 °C−1].

www.VadoseZoneJournal.org
Cons tu ve Rela onships for Atmospheric Boundary Condi onsTwo options, both depending on soil water content, are imple-mented to account for the eff ect of soil surface resistance (rs) on vapor diff usion (Eq. [9]). Th e formulation of Bittelli et al. (2008) is defi ned by:
2.3
sl
13.5 33.5r
S⎛ ⎞⎟⎜ ⎟= +⎜ ⎟⎜ ⎟⎜⎝ ⎠
[A17]
Alternatively, the formulation proposed by Simunek et al. (2009) can be used:
36.5 ( )l l0s s0= S Sr r e φ − [A18]
where rs0 is the soil resistance on the soil surface [T L−1] and Sl0is the minimal residual saturation.
Aerodynamic resistance (rh) in Eq. [9] is computed as (Saito et al., 2006; Bittelli et al., 2008):
2a 0
0h 2
a
ln z zz
rk v
⎡ ⎤⎛ ⎞+ ⎟⎜⎢ ⎥⎟+θ⎜ ⎟⎢ ⎥⎜ ⎟⎜⎝ ⎠⎣ ⎦= [A19]
where k is the Von Karman’s constant (?0.4), θ is a stability factor, z0 is the roughness length [L], va is the wind velocity [L T−1], and za [L] is the elevation above ground surface at which va and ρv
atm
are measured.
Solar radiation (Rn) in Eq. [10] is calculated as (Saaltink et al., 2005):
Rn = (1 − Al)Rg + εRg − εσT4 [A20]
where Rg is the direct solar short wave radiation [E L−2 T−1], Ra is the long wave atmospheric radiation [E L−2 T−1], Al is the albedo, ε is the emissivity, and σ is the Stefan–Boltzman constant. Details of the formulation can be found in Saaltink et al. (2005).
Verifi ca on and Valida on of Energy and Vapor TransportEnergy and vapor transport were verifi ed and validated by simu-lating a vapor transport and condensation experiment in a sandy column (Mizayaki, 1976, Fig. 14A). Th e columns were placed vertically in a heated chamber with constant air temperature and a relative humidity between 85 and 90%. Th e column tops were exposed to moist air, while the closed bottoms of the columns were maintained at room temperature in a water bath. Because of dif-ferences in vapor density, water vapor diff used from the hot and humid end of the column toward the cold and dry end, where it condensed. Subsequently, the condensed water moved upward due to the pressure head gradients.
Th is column experiment was previously modeled by Sakai et al. (2009) with HYDRUS-1D (Simunek et al., 2008); the same model parameters and boundary conditions were used here. Th e 0.1-m-long column was discretized uniformly into 100 fi nite volume cells. Th e initial volumetric water content and temperature were assumed to be uniformly distributed (i.e., θ0 = 0.0045, Fig. 14B, and room temperature of 23.5°C, Fig. 14C). Th e upper bound-ary condition for water fl ow was imposed as in Sakai et al. (2009), given by the total incoming water fl ux assumed to be equal to the change in weight of the entire column, thus refl ecting the con-densation of water vapor. An impervious boundary for fl ow was considered at the lower boundary (see Fig. 14A), and temperatures of 36.3 and 23.5°C were imposed at the top and bottom of the column, respectively (see Fig. 14A). As in Sakai et al. (2009), the water content profi les were calculated using the soil hydraulic func-tion parameter model by Fayer and Simmons (1995).
Experimental data (Mizayaki, 1976; Sakai et al., 2009) and simu-lated vertical distribution of water contents at diff erent times (i.e., 0, 5, 10, 16, and 30 d, respectively) are shown in Fig. 14B. Temperature distribution at diff erent times (i.e., 0.1, 0.2, 6, and 16 d, respectively) are shown in Fig. 14C. A very good agreement
Fig. A1. Verifi cation of energy and vapor transport: vapor condensa-tion in a sandy column, experimental data from Mizayaki (1976). (A) Domain and boundary conditions. (B) Vertical distribution of water contents at diff erent times. (C) Temperature distributions at diff erent times. Results are compared with the model HYDRUS-1D (Simunek et al., 2008; Sakai et al., 2009).

www.VadoseZoneJournal.org
with experimental data and simulated results from HYDRUS-1D was obtained by MIN3P.
Field Sampling and Quan ta ve Mineralogical MethodsSamples were collected at random intervals within tailings situated along the access road of Cell 2 of TSF1. Tailings were primarily sampled by coring, either as isolated core samples or on 5- by 5-m grids (aft er Roselle et al., 1999). Cores were taken at regular inter-vals of distance (0.25 and 2.50 m) and depth (10-cm-long samples centered at depths of 5, 25, 50, 75, 100, and 125 cm). Sampling did not extend to the base of the tailings deposits in most regions of TSF1 because depths greater than 1 to 4 m were inaccessible using the collection techniques available. A random number generator was used to select subsets of samples collected from cores and grids for quantitative phase analysis.
Quantitative phase analysis with the Rietveld method (Rietveld, 1969; Hill and Howard, 1987; Bish and Howard, 1988) was done on 30 samples of mine tailings from TSF1. Samples were dried in a hood under ambient laboratory conditions for at least 1 wk and were prepared for quantitative phase analysis according the method of Wilson et al. (2006). X-ray diff raction data for refi ne-ment were collected with a step size of 0.04° 2θ and counting time of 1 s step−1 over a range of 3 to 80° 2θ on a Siemens (Bruker AXS, Karlsruhe, Germany) D5000 θ-2θ diff ractometer equipped with a VÅNTEC-1 detector in the Department of Earth and Ocean Sciences at the University of British Columbia. Th e long, fi ne-focus Co X-ray tube was operated at 35 kV and 40 mA. Mineral phases were identifi ed with reference to the ICDD PDF-4+ data-base using DIFFRACplus EVA Version 10.0 (Bruker AXS, 2004a). Rietveld refi nements were done using the Topas Version 3 soft ware package (Bruker AXS, 2004b) using the fundamental parameters approach (Cheary and Coelho, 1992). Th e method of Wilson et al. (2006) was used to compensate for structural disorder in serpen-tine-group minerals during refi nement.
AcknowledgmentsTh is work was funded by the Carbon Management Canada National Centre of Excel-lence, the Natural Sciences and Engineering Research Council of Canada (NSERC) through the Discovery, Collaborative Research and Development, and Discovery Accelerator Supplement programs. Field sampling was supported fi nancially in in-kind by BHP Billiton and Diavik Diamond Mines. S.A. Wilson was supported by an Alexander Graham Bell Canada Graduate Scholarship from NSERC. I.M. Power was supported by a Post-Graduate Scholarship from NSERC. Mineralogical analyses and fi eldwork were supported in part by a grant from the Edward H. Kraus Crystal-lographic Research Fund to S.A.W. from the Mineralogical Society of America.
ReferencesAcero, P., C. Ayora, J. Carrera, M. Saal nk, and S. Olivella. 2009. Mul phase fl ow
and reac ve transport model in vadose tailings. Appl. Geochem. 24:1238–1250. doi:10.1016/j.apgeochem.2009.03.008
Ackerer, P., A. Younes, and R. Mose. 1999. Modeling variable density fl ow and solute transport in porous medium: 1. Numerical model and verifi ca on. Transp. Porous Media 35:345–373. doi:10.1023/A:1006564309167
Bea, S., C. Ayora, J. Carrera, M. Saal nk, and B. Dold. 2010a. Geochemical and environmental controls on the genesis of soluble effl orescent salts in coast-
al mine tailings deposits: A discussion based on reac ve transport model-ing. J. Contam. Hydrol. 111:65–82. doi:10.1016/j.jconhyd.2009.12.005
Bea, S., J. Carrera, C. Ayora, and F. Batlle. 2010b. Pitzer algor thm: Effi cient implementa on of Pitzer equa ons in geochemical and reac ve transport models. Comput. Geosci. 36:526–538. doi:10.1016/j.cageo.2009.09.004
Bea, S., J. Carrera, F. Batlle, C. Ayora, and M. Saal nk. 2009. CHEPROO: A Fortran 90 object-oriented module to solve chemical processes in Earth Science models. Comput. Geosci. 35:1098–1112. doi:10.1016/j.cageo.2008.08.010
Bea, S.A., J. Carrera, J.M. Soler, C. Ayora, and M. Saal nk. 2004. Simula on of remedia on alterna ves for a 137Cs contaminated soil. Radiochim. Acta 92:827–833. doi:10.1524/ract.92.9.827.54981
Bea, S.A., K.U. Mayer, and K.T.B. MacQuarrie. 2011. Modelling reac ve trans-port in sedimentary rock environments—Phase II. Reac ve transport modeling in a sedimentary basin aff ected by a glacia on/deglacia on event. Technical Rep. Nuclear Waste Management Organiza on, Toronto, ON, Canada.
Bish, D.L., and S.A. Howard. 1988. Quan ta ve phase analysis using the Riet-veld method. J. Appl. Cryst. 21:86–91. doi:10.1107/S0021889887009415
Bi elli, M., F. Ventura, G. Campbell, R. Snyder, F. Gallega , and P. Rossi Pisa. 2008. Coupling of heat, water vapor, and liquid water fl uxes to compute evapora on in bare soils. J. Hydrol. 362:191–205. doi:10.1016/j.jhy-drol.2008.08.014
Bruker AXS. 2004a. EVA V. 10.0: Release 2004—User’s manual. Bruker AXS, Karlsruhe, Germany.
Bruker AXS. 2004b. Topas V. 3.0: General profi le and structure analysis so ware for powder diff rac on data. Bruker AXS, Karlsruhe, Germany.
Cass, A., G. Campbell, and T. Jones. 1984. Enhancement of thermal wa-ter vapor diff usion in soil. Soil Sci. Soc. Am. J. 48:25–32. doi:10.2136/sssaj1984.03615995004800010005x
Cheary, R.W., and A.A. Coelho. 1992. A fundamental parameters approach to X-ray line-profi le fi ng. J. Appl. Cryst. 25:109–121. doi:10.1107/S0021889891010804
Chou, L., R.M. Garrels, and R. Wollast. 1989. Compara ve study of the kinet-ics and mechanisms of dissolu on of carbonate minerals. Chem. Geol. 78:269–282. doi:10.1016/0009-2541(89)90063-6
Chung, S., and R. Horton. 1987. Soil heat and water fl ow with a par al surface mulch. Water Resour. Res. 23:2175–2186. doi:10.1029/WR023i012p02175
De Windt, L., F. Marsal, E. Tinseau, and D. Pellegrini. 2008. Reac ve trans-port modeling of geochemical interac ons at a concrete/argillite inter-face, Tournemire site (France). Phys. Chem. Earth 33(Suppl. 1):S295–S305. doi:10.1016/j.pce.2008.10.035
Diersch, H., and O. Kolditz. 2002. Variable-density fl ow and transport in po-rous media: Approaches and challenges. Adv. Water Resour. 25:899–944. doi:10.1016/S0309-1708(02)00063-5
Edlefson, N., and A. Anderson. 1943. Thermodynamics of soil mix water-we ed porous media. Water Resour. Res. 35:635–649.
Fayer, M., and C. Simmons. 1995. Modifi ed soil water reten on func- ons for all matric suc ons. Water Resour. Res. 31:1233–1238.
doi:10.1029/95WR00173Gamazo, P., S.A. Bea, M. Saal nk, J. Carrera, and C. Ayora. 2011. Modeling the
interac on between evapora on and chemical composi on in a natural saline system. J. Hydrol. 401:154–164. doi:10.1016/j.jhydrol.2011.02.018
Giammar, D.E., R.G. Bruant, and C.A. Peters. 2005. Forsterite dissolu on and magnesite precipita on at condi ons relevant for deep saline aquifer storage and sequestra on of carbon dioxide. Chem. Geol. 217:257–276. doi:10.1016/j.chemgeo.2004.12.013
Gran, M., J. Carrera, S. Olivella, and M. Saal nk. 2011. Modeling evapora on processes in a saline soil from satura on to oven dry condi ons. Hydrol. Earth Syst. Sci. Discuss. 8:529–554. doi:10.5194/hessd-8-529-2011
Harvie, C.E., N. Moller, and J.H. Weare. 1984. The predic on of mineral solubili- es in natural waters: The Na–K–Mg–Ca–H–Cl–SO4–OH–HCO3–CO3–CO2–
H2O system to high ionic strengths at 25°C. Geochim. Cosmochim. Acta 48:723–751. doi:10.1016/0016-7037(84)90098-X
Henderson, T., K. Mayer, B. Parker, and T. Al. 2009. Three-dimensional density-dependent fl ow and mul component reac ve transport modeling of chlo-rinated solvent oxida on by potassium permanganate. J. Contam. Hydrol. 106:195–211. doi:10.1016/j.jconhyd.2009.02.009
Hill, R.J., and C.J. Howard. 1987. Quan ta ve phase analysis from neutron pow-der diff rac on data using the Rietveld method. J. Appl. Cryst. 20:467–474. doi:10.1107/S0021889887086199
Hostetler, P.B., R.G. Coleman, F.A. Mumpton, and B.W. Evans. 1966. Brucite in alpine serpen nites. Am. Mineral. 51:75–98.
IPCC. 2005. IPCC Special Report on Carbon Dioxide Capture and Storage. B. Metzet al. (ed.) Cambridge Univ. Press, Cambridge, UK.
IPCC. 2007. Climate Change 2007: The physical basis. Contribu on of Working Group I to the Fourth Assessment Report of the Intergovernmental Panel on Climate Change. S. Solomon et al. (ed.) Cambridge Univ. Press, Cam-bridge, UK.
Kolditz, O., R. Ratke, H.J.G. Diersch, and W. Zielke. 1998. Coupled groundwater fl ow and transport: 1. Verifi ca on of variable density fl ow and transport models. Adv. Water Resour. 21:27–46. doi:10.1016/S0309-1708(96)00034-6

www.VadoseZoneJournal.org
Königsberger, E., L.C. Königsberger, and H. Gamsjäger. 1999. Low-temper-ature thermodynamic model for the system Na2CO3–MgCO3–CaCO3–H2O. Geochim. Cosmochim. Acta 63:3105–3119. doi:10.1016/S0016-7037(99)00238-0
Krumgalz, B.S., A. Hecht, A. Starinsky, and A. Katz. 2000. Thermodynamic con-straints on Dead Sea evapora on: Can the Dead Sea dry up? Chem. Geol. 165:1–11. doi:10.1016/S0009-2541(99)00156-4
Lackner, K.S. 2003. A guide to CO2 sequestra on. Science 300:1677–1678. doi:10.1126/science.1079033
Lefebvre, R., D. Hockley, J. Smolensky, and P. Gelinas. 2001a. Mul phase trans-fer processes in waste rock piles producing acid mine drainage I: Concep-tual model and system characteriza on. J. Contam. Hydrol. 52:137–164. doi:10.1016/S0169-7722(01)00156-5
Lefebvre, R., D. Hockley, J. Smolensky, and P. Gelinas. 2001b. Mul phase trans-fer processes in waste rock piles producing acid mine drainage II: Applica- ons of numerical simula on. J. Contam. Hydrol. 52:165–186. doi:10.1016/
S0169-7722(01)00157-7Lever, D.A., and C. Jackson. 1985. On the equa ons for the fl ow of concen-
trated salt solu on through a porous medium. Technical report, U.K. DOE Rep. DOE/RW/85.100.
Lichtner, P., and Q. Kang. 2007. Upscaling pore-scale reac ve transport equa- ons using a mul -scale con nuum formula on. Water Resour. Res.
43:W12S15. doi:10.1029/2006WR005664 Massmann, J., and D. Farrier. 1992. Eff ects of atmospheric pressures on
gas transport in the vadose zone. Water Resour. Res. 28:777–791. doi:10.1029/91WR02766
Mayer, K.U., E.O. Frind, and D.W. Blowes. 2002. Mul component reac ve trans-port modeling in variably saturated porous media using a generalized for-mula on for kine cally controlled reac ons. Water Resour. Res. 38:1174. doi:10.1029/2001WR000862.
Millington, R.J. 1959. Gas diff usion in porous media. Science 130:100–102. doi:10.1126/science.130.3367.100-a
Mizayaki, T. 1976. Condensa on and movement of water vapor in sand under temperature gradient. (In Japanese.) Trans. Jpn. Soc. Irrig. Drain. Reclam. Eng. 61:1–8.
Molins, S., and K. Mayer. 2007. Coupling between geochemical reac ons and mul component gas and solute transport in unsaturated media: A reac ve transport modeling study. Water Resour. Res. 43:W05435. doi:10.1029/2006WR005206
Molins, S., K. Mayer, C. Scheutz, and P. Kjeldsen. 2008. Transport and reac on processes aff ec ng the a enua on of landfi ll gas in cover soils. J. Environ. Qual. 37:459–468. doi:10.2134/jeq2007.0250
Monnin, C. 1994. Density calcula on and concentra on scale conversions for natural waters. Comput. Geosci. 20:1435–1445. doi:10.1016/0098-3004(94)90103-1
Noborio, K., K. McInnes, and J. Heilman. 1996. Two-dimensional model for wa-ter, heat, and solute transport in furrow-irrigated soil. I. Theory. Soil Sci. Soc. Am. J. 60:1001–1009. doi:10.2136/sssaj1996.03615995006000040007x
Olivella, S., J. Carrera, A. Gens, and E.E. Alonso. 1994. Nonisothermal mul -phase fl ow of brine and gas through saline media. Transp. Porous Media 15:271–293. doi:10.1007/BF00613282
Palandri, J., and Y. Kharaka. 2004. A compila on of rate parameters of water-mineral interac on kine cs for applica on to geochemical modeling. Tech-nical report. USGS Open-fi le Rep. 2004-1068.
Philip, J., and D. De Vries. 1957. Moisture movement in porous materials under temperature gradient. Trans. Am. Geophys. Union 38:222–232.
Pokrovsky, O., and J. Scho . 1999. Processes at the magnesium-bearing carbonates/solu on interface. II. Kine cs and mechanism of magnesite dissolu on. Geochim. Cosmochim. Acta 63:881–897. doi:10.1016/S0016-7037(99)00013-7
Pokrovsky, O., and J. Scho . 2004. Experimental study of brucite dissolu on and precipita on in aqueous solu ons: Surface specia on and chemical affi nity control. Geochim. Cosmochim. Acta 68:31–45. doi:10.1016/S0016-7037(03)00238-2
Pokrovsky, O., S.V. Golubev, and J. Scho . 2005. Dissolu on kine cs of cal-cite, dolomite and magnesite at 25°C and 0 to 50 atm pCO2. Chem. Geol. 217:239–255. doi:10.1016/j.chemgeo.2004.12.012
Power, I.M., S.A. Wilson, J.M. Thom, G.M. Dipple, J.E. Gabites, and G. Southam. 2009. The hydromagnesite playas of Atlin, Bri sh Columbia, Canada: A biogeochemical model for CO2 sequestra on. Chem. Geol. 260:286–300. doi:10.1016/j.chemgeo.2009.01.012
Rietveld, H. 1969. A profi le refi nement method for nuclear and magne c struc-tures. J. Appl. Cryst. 2:65–71. doi:10.1107/S0021889869006558
Roselle, G.T., L.P. Baumgartner, and J.W. Valley. 1999. Stable isotope evidence of heterogeneous fl uid infi ltra on at the Ubehebe Peak contact aureole, Death Valley Na onal Park, California. Am. J. Sci. 299:93–138.
Saal nk, M.W., C. Ayora, and S. Olivella. 2005. User’s guide for RetrasoCode-Bright (RCB). Department of Geotechnical Engineering and Geo-Sciences, Technical Univ. of Catalonia (UPC), Barcelona, Spain.
Saito, H., J. Simunek, and B. Mohanty. 2006. Numerical analyses of coupled wa-ter, vapor and heat transport in the vadose zone. Vadose Zone J. 5:784–800. doi:10.2136/vzj2006.0007
Sakai, M., N. Toride, and J. Simunek. 2009. Water and vapor movement with condensa on and evapora on in a sandy column. Soil Sci. Soc. Am. J. 73:707–717. doi:10.2136/sssaj2008.0094
Sayles, F.L., and W.S. Fyfe. 1973. Crystalliza on of magnesite from aqueous-solu on. Geochim. Cosmochim. Acta 37:87–99. doi:10.1016/0016-7037(73)90246-9
Seifritz, W. 1990. CO2 disposal by means of silicates. Nature 345:486. doi:10.1038/345486b0
Simunek, J., M. Sejna, H. Saito, M. Sakai, and M. van Genuchten. 2008. The HYDRUS-1D so ware package for simula ng the movement of water, heat, and mul ple solutes in variably saturated media. version 4.0. Hy-drus So w. Ser. 3. Tech. rep. Dep. of Environmental Science, Univ. of Cali-fornia, Riverside.
Simunek, J., M. Sejna, H. Saito, M. Sakai, and M. van Genuchten. 2009. The HYDRUS-1D so ware package for simula ng the one dimensional move-ment of water, heat, and mul ple solutes in variably-saturated media. ver-sion 4.08. Hydrus So w. Ser. 3. Tech. rep. Dep. of Environmental Science, Univ. of California, Riverside.
Sipilä, J., S. Teir, and R. Zevenhoven. 2008. Carbon dioxide sequestra on by mineral carbona on: Literature review update 2005–2007. Åbo Akademi Rep. VT 2008-1.
Stolberg, D.J. 2005. Rehabilita on studies on tailings storage facili es in an arid hypersaline region. Ph.D. diss. Div. of Civil Engineering, School of Engineer-ing, Univ. of Queensland, Brisbane, Australia.
Thom, J., and G.M. Dipple. 2005. Accelerated ca on release during non-steady state dissolu on of Mg-silicates: Implica ons for mine tailings and seques-tra on of CO2. Paper 29. In Fourth Annual Conference on Carbon Capture and Sequestra on, 2–5 May 2005, Alexandria, VA.
Voss, C. 1984. A Finite-element simula on model for saturated-unsaturated fl uid-density-dependent ground-water fl ow with energy transport or chemically-reac ve single-species solute transport. USGS Water Resour. Invest. Rep. 84-4369.
Voss, C., and A. Provost. 2008. SUTRA—A model for saturated-unsaturated variable-density ground-water fl ow with solute or energy transport (Ver-sion 2.1). USGS Water Resour. Invest. Rep. 02-4231.
White, A.F., and M.L. Peterson. 1990. Role of reac ve-surface-area charac-teriza on in geochemical kine c models. Chapter 35, p. 461–475. In D.C. Melchior and R.L. Basse (ed.) Chemical modeling of aqueous systems II. American Chemical Society, Washington, DC.
Wilson, S. 2009. Mineral traps for greenhouse gases in mine tailings: A protocol for verifying and quan fying CO2 sequestra on in ultramafi c mines. Ph.D. diss. The Faculty of Graduate Studies (Geological Sciences). The University of Bri sh Columbia.
Wilson, S., G. Dipple, I. Power, J. Thom, R. Anderson, M. Raudsepp, J. Gabites, and G. Southam. 2009. Carbon dioxide fi xa on within mine wastes of ultramafi c-hosted ore deposits: Examples from the Clinton Creek and Cassiar chryso le deposits, Canada. Econ. Geol. 104:95–112. doi:10.2113/gsecongeo.104.1.95
Wilson, S., M. Raudsepp, and G. Dipple. 2006. Verifying and quan fying carbon fi xa on in minerals from serpen ne-rich mine tailings using the Rietveld method with X-ray powder diff rac on data. Am. Mineral. 91:1331–1341. doi:10.2138/am.2006.2058
Wösten, J., and M. van Genuchten. 1988. Using texture and other soil proper- es to predict the unsaturated soil hydraulic func ons. Soil Sci. Soc. Am. J.
52:1762–1770. doi:10.2136/sssaj1988.03615995005200060045xXiong, Y., and A.S. Lord. 2008. Experimental inves ga ons of the reac on path
in the MgO-CO2–H2O system in solu ons with various ionic strengths, and their applica ons to nuclear waste isola on. Appl. Geochem. 23:1634–1659. doi:10.1016/j.apgeochem.2007.12.035
Xu, T., S. White, K. Pruess, and G. Brimhall. 2000. Modeling of pyrite oxida on in saturated and unsaturated subsurface fl ow systems. Transp. Porous Me-dia 39:25–56. doi:10.1023/A:1006518725360