Analysis of Water Seepage Through Earthen Structures Using ...
Upload
khangminh22Category
view
2download
0
The environmental impact of seepage from gold mine tailings dams
near Johannesburg, South Africa
Submitted in partial fulfilment of the requirements
for the degree
Faculty of Natural and Agricultural Sciences
University of Pretoria
Pretoria
Republic of South Africa
©© UUnniivveerrssiittyy ooff PPrreettoorriiaa

The environmental impact of seepage from gold mine tailings dams
near Johannesburg, South Africa
Supervisor:Department:Degree:
Professor A. van SchalkwykEarth SciencesPhilosophiae Doctor
Gold mining in South Africa resulted in vast volumes of waste material, mainly in the
form of tailings material. Poor management of most of the tailings dams resulted in
the release of acid mine drainage that in some cases caused soil degradation and water
contamination underneath and around these sites.
Although many tailings dams have been partially or completely reclaimed, their
contaminated footprints pose a serious threat to the water quality of the underlying
aquifers (e.g. dolomitic aquifers). This study investigated the geotechnical,
mineralogical and geochemical parameters of eleven selected partially or completely
reclaimed sites situated near Johannesburg. The main objective of the field and
laboratory experiments was to assess the pathway of contaminant migration resulting
from acid mine drainage from tailings materials through the unsaturated zone into the
groundwater system.
Comparing extractable contaminant concentrations with a soil standard from literature
represents the environmental short-term impact. In contrast, total element
concentrations in the soil compared with background values were used to describe the
long-term impact or worst-case scenario. Extraction tests have shown that only a
minor portion of contaminants (i.e. Co, Ni and Zn) is mobile in acidic soils. This
implies that plant growth could be limited because of phytotoxic elements occurring
in the topsoils, complicating rehabilitation measures. In addition, the soils often
contain anomalous trace element concentrations, providing a pool for future
contamination. Buffer minerals will eventually be depleted and the subsequent
acidification of the subsoil, could result in the remobilization of contaminants from
the subsoil into the groundwater system in the long term.
It is important to understand the parameters, which control the balance between
retention and mobility of contaminants in soils. Therefore a risk assessment approach
would be required for all tailings dams and reclaimed sites to identify those sites,
which need rehabilitation and to define the type and extent of remedial measures.
Minimum rehabilitation requirements at reclaimed sites could consist of soil
management measures such as liming and the addition of organic material and
fertilisers to minimise the contaminant migration from the topsoil into the subsoil and
groundwater as well as to provide suitable conditions for vegetation growth and future
land use. Removal of remaining tailings and excavation of those portions of the soil,
which are excessively contaminated, are necessary. Tailings dams which pose a high
risk to the environment would require a well-engineered soil and vegetation cover to
limit rainfall infiltration into the impoundment, and thus to reduce the oxidation of
sulphide-bearing minerals such as pyrite. Long-term monitoring is an absolute
prerequisite to ensure the success of rehabilitation, and therefore the safe use of land
and water.

1 INTRODUCTION 1
1.1 STATEMENT OF THE PROBLEM 11.2 RESEARCH OBJECTIVES 31.3 PREVIOUS WORK 31.4 STUDY AREA 81.4.1 Regional setting within the Vaal River barrage catchment 81.4.2 Climate 91.4.3 Location of the study sites 11
1.5 ACKNOWLEDGEMENTS 13
2 GEOLOGY, MINERALOGY AND CHEMISTRY OF THE GOLD ORE ANDRELATED TAILINGS 14
2.1 HISTORICAL AND GEOLOGICAL ASPECTS 142.2 MINERALOGy 162.2.1 Macroscopic description ofthe gold-bearing conglomerate 162.2.2 Mineralogical composition of the gold-bearing conglomerate 162.2.3 Mineralogical composition of gold mine tailings 17
2.3 CHEMISTRy 192.3.1 Chemical composition of the gold-bearing conglomerate 192.3.2 Chemical composition of gold mine tailings 21
2.4 GOLD RECOVERy 242.4.1 Metallurgical process 24
2.5 MANAGEMENT AND RECLAMATION OF TAILINGS DAMS IN SOUTHAFRICA 27
2.5.1 Introduction 272.5.2 Construction 292.5.3 Operation and decommissioning 30
2.5.3.1 Seepage and the development of a groundwater mound 332.5.3.2 Seepage control measures 37
2.5.4 Reclamation 372.5.5 Land use after reclamation 38
2.6 HYDROGEOCHEMICAL PROCESSES DURING THE WEATHERING PROCESSOF TAILINGS 38
2.6.1 Sulphide oxidation and acid generation processes 402.6.1.1 Primaryfactors 402.6.1.2 Secondaryfactors 432.6.1.3 Tertiaryfactors 452.6.1.4 Subsurface and downstreamfactors 46
2.7 OCCURRENCE OF TRACE ELEMENTS IN SOIL AND ITS TOXICITy 492.7.1 Occurrence of trace elements in soil 492.7.2 Toxicity 522.7.3 Environmental quality standards 53

3 METHODSOF INVESTIGATION 56
3.1 SCOPE OF WORK 563.2 FIELD SURVEY AND SITE INFORMATION 573.3 SAMPLING AND LABORATORY TESTING 583.3.1 X-ray fluorescence spectrometry (XRF) 603.3.2 Soil extraction tests and inductively coupled plasma mass spectrometry 62
3.3.2.1 Method/or the soil extraction test 633.3.2.2 Inductively coupled plasma mass spectrometry (ICP-MS) 63
3.3.3 X-ray diffraction (XRD) 643.4 GEOTECHNICAL PROPERTIES 653.4.1 Estimation of hydrogeological conditions from geotechnical data 653.4.2 Soil types and properties 68
3.5 DATA EVALUATION 713.5.1 Correlation coefficients 713.5.2 Geochemical background values 723.5.3 Estimation of hydraulic conductivities in soils 733.5.4 Short-term impact 753.5.5 Long-term impact 77
4 CASESTUDIES 79
4.1 CASE STUDY A 794.1.1 Site location and drainage 794.1.2 Reclamation and rehabilitation status 794.1.3 Geological conditions 794.1.4 Soils 794.1.5 Assessment of contamination 80
4.1.5.1 Trace element concentration in soiL 804.1.5.2 Short-term impact 814.1.5.3 Long-term impact 81
4.1.6 Discussions and conclusions 824.2 CASE STUDY B 834.2.1 Site location and drainage 834.2.2 Reclamation and rehabilitation status 834.2.3 Geological conditions 834.2.4 Soils 834.2.5 Assessment of contamination 84
4.2.5.1 Trace element concentration in soil 844.2.5.2 Short-term impact 854.2.5.3 Long-term impact 85
4.2.6 Discussions and conclusions 854.3 CASE STUDY C 864.3.1 Site location and drainage 864.3.2 Reclamation and rehabilitation status 864.3.3 Geological conditions 864.3.4 Soils 864.3.5 Assessment of contamination 87
4.3.5.1 Trace element concentration in soiL 874.3.5.2 Short-term impact 884.3.5.3 Long-term impact 89
4.3.6 Discussions and conclusions 89
4.4 CASE STUDY D 894.4.1 Site location and drainage 894.4.2 Reclamation and rehabilitation status 904.4.3 Geological conditions 904.4.4 Soils 904.4.5 Assessment of contamination 91
4.4.5.1 Trace element concentration in soil 914.4.5.2 Short-term impact 914.4.5.3 Long-term impact 91
4.4.6 Discussions and conclusions 914.5 CASE STUDY E 924.5.1 Site location and drainage 924.5.2 Reclamation and rehabilitation status 924.5.3 Geological conditions 924.5.4 Soils 934.5.5 Assessment of contamination 93
4.5.5.1 Trace element concentration in soil.. 934.5.5.2 Short-term impact 944.5.5.3 Long-term impact 94
4.5.6 Discussions and conclusions 944.6 CASE STUDY F 954.6.1 Site location and drainage 954.6.2 Reclamation and rehabilitation status 954.6.3 Geological conditions 954.6.4 Soils and groundwater. 954.6.5 Assessment of contamination 97
4.6.5.1 Trace element concentration in soil and groundwater 974.6.5.2 Short-term impact 984.6.5.3 Long-term impact 99
4.6.6 Discussions and conclusions 994.7 CASE STUDY G 1004.7.1 Site location and drainage 1004.7.2 Reclamation and rehabilitation status 1004.7.3 Geology 1004.7.4 Soils 1004.7.5 Assessment of contamination lO1
4.7.5.1 Trace element concentration in soil.. 1014.7.5.2 Short-term impact 1014. 7.5.3 Long-term impact 102
4.7.6 Discussions and conclusions 1024.8 CASE STUDY H 1034.8.1 Site location and drainage 1034.8.2 Reclamation and rehabilitation status 1034.8.3 Geology 1044.8.4 Soil 1044.8.5 Assessment of contamination 104
4.8.5.1 Radioactive contamination in tailings, soils and sediments 1044.8.5.2 Groundwater 1064.8.5.3 Short-term impact 106
4.8.6 Discussions and conclusions 107
4.9 CASE STUDY I 1074.9.1 Site location and drainage 1074.9.2 Reclamation and rehabilitation status 1084.9.3 Geology 1084.9.4 Field work 1084.9.5 Soils 1094.9.6 Aquifer properties 1104.9.7 Assessment of contamination 111
4.9.7.1 Chemical properties in soils and groundwater 1114.9.7.2 Radioactive contamination in surface and groundwater 1134.9.7.3 Short-term impact 1134.9.7.4 Long-term impact 114
4.9.8 Discussions and conclusions 1144.10 CASES STUDY J 1154.10.1 Site location and drainage 1154.10.2 Reclamation and rehabilitation status 1154.10.3 Geology 1154.10.4 Field work 1164.10.5 Soils 1164.10.6 Aquifer conditions 1174.10.7 Assessment of contamination 117
4.10.7.1 Chemistry of surface water 1174.10. 7.2 Radioactive contamination 1194.10.7.3 Short-term impact 119
4.1 0.8 Discussions and conclusions 1204.11 CASE STUDY K 1204.11.1 Site location and drainage 1204.11.2 Reclamation and rehabilitation status 1214.11.3 Geology 1214.11.4 Field work 1214.11.5 Soils 1214.11.6 Aquifer conditions 1224.11. 7 Assessment of contamination 123
4.11.7.1 Short-term impact 1234.11.7.2 Long-term impact 123
4.11.8 Discussions and conclusions 124
5 ENVIRONMENTAL IMPACT ASSESSMENT 125
5.1 INTRODUCTION 1255.2 CHARACTERISATION OF THE PRIMARY CONTAMINATION SOURCE 1265.3 SHORT-TERM IMPACT ON THE SUBSURFACE 1275.3.1 Unsaturated zone 1275.3.2 Saturated zone 137
5.3.2.1 Regional groundwater quality 1375.3.2.2 Groundwater quality in the study area 1385.3.2.3 Estimation of seepage and sulphate loads 140
5.4 LONG-TERM IMPACT ON THE SUBSURFACE 1425.4.1 Unsaturated zone 1425.4.2 Saturated zone 144

6 RISK ASSESSMENT AND REHABILITATION MANAGEMENT 146
6.1 INTRODUCTION 1466.2 RISK ASSESSMENT 1476.2.1 Principles and definition 1476.2.2 Methodology 148
6.2.2.1 Hazard assessment 1486.2.2.2 Exposure assessment 1496.2.2.3 Dose-response assessment 1496.2.2.4 Site risk characterisation 150
6.3 REMEDIATION APPROACHES FOR CONTAMINATED SOILS 1516.3.1 Treatment technologies 1526.3.2 On-site management 154
6.3.2.1 Vegetation coverfor reclaimed sites 1566.4 REMEDIATION OF GROUNDWATER CONTAMINATED BY ACID MINE
DRAINAGE 1576.5 LONG-TERM ENVIRONMENTAL MANAGEMENT FOR LARGE
CONTAMINATED AREAS 1596.6 ENVIRONMENTAL MONITORING AND AFTER-CARE MANAGEMENT. .. 1616.7 FINANCIAL IMPLICATIONS OF REMEDIAL MEASURES 1626.8 ENVIRONMENTAL MANAGEMENT MEASURES REQUIRED FOR THE
INVESTIGATED SITES 163
7 DISCUSSION AND CONCLUSIONS 166
7.1 DISCUSSION 1667.2 CONCLUSIONS 167
8 LIST OF REFERENCES 170

TABLE 1.1a - Rainfall and evaporation data for the Johannesburg area 10TABLE 1.1b - Temperature data for the Johannesburg area 10TABLE 2.1 - Generalised lithostratigraphic columnar section for the study area 15TABLE 2.2 - Mean contents for significant elements and minerals present in the
Ventersdorp Contact Reef and Vaal Reef. 17TABLE 2.3 - Mineral distribution in gold mine tailings at three different sites 18TABLE 2.4 - Major element composition of conglomerates from the Central Rand 19TABLE 2.5 - Average of maximum trace elements contents in pyrite of the Black Reef
Formation 20TABLE 2.6a - Average major element concentrations of five different gold mine tailings
dams 21TABLE 2.6b - Average trace element concentrations of five different gold mine tailings
dams 23TABLE 2.7 - Transfer coefficients of metals in the soil-plant system 51TABLE 2.8 - Soil quality standards according to the Dutch List. 54TABLE 3.1 - Summary of site information for the investigated sites 58TABLE 3.2 - Summary of analytical tests applied in this study 60TABLE 3.3a - Detection limits and standard deviations for major elements using XRF
technique 61TABLE 3.3b - Detection limits and standard deviations for trace elements using XRF
technique 61TABLE 3.4 - Detection limits for ICP-MS 64TABLE 3.5 - Typical values of some properties of common clay minerals 66TABLE 3.6 - Clay contents in soil samples of the study sites 67TABLE 3.7 - Classification of clays contents in soil samples of the study sites 67TABLE 3.8 - Estimated hydraulic conductivties of soils from the case study sites 68TABLE 3.9 - Soil types occurring at the investigated sites 69TABLE 3.10 - Average background values and their standard deviations in topsoils 73TABLE 3.11 - Estimated hydraulic conductivity value from soil type 75TABLE 3.12 - Recommended maximum N~N03 extractable threshold values in soils 76TABLE 3.13 - Classification of contamination by using the geochemical load index 77TABLE 4.2 - Summary of soil parameters for study site B. 84TABLE 4.3 - Summary of soil parameters for study site C 87TABLE 4.4a - Chemical analyses of seepage water from test pit C/2 depicting macro-
chemistry and other main parameters 88TABLE 4.4b - Chemical analyses of seepage water from test pit C/2 showing metal and
CN concentrations 88TABLE 4.5 - Summary of soil parameters for study site D 90TABLE 4.6 - Summary of soil parameters for study site E 93TABLE 4.7 - Summary of soil parameters for study site F 96TABLE 4.8 - Groundwater quality at site F, measured in January, April and August 1996
............................................................................................................................ 98TABLE 4.9 - Summary of soil parameters for study site G 100
VI

TABLE 4.1Oa - Chemical analyses showing macro-chemistry and other parameters ofseepage water in test pit G/2 101
TABLE 4.1Ob - Chemical analyses showing various metal and CN concentrations ofseepage water from test pit G/2 102
Table 4.11 - Solid samples collected in November 1995 around study site H 105Table 4.12 - Groundwater chemistry of the site H. 106TABLE 4.13 - Summary of soil parameters for study site 1.. 109TABLE 4.14 - Metal and pH ranges in soils of the reclaimed portion of site 1.. 111TABLE 4.15a - Range of groundwater quality in shallow boreholes of site I. IIITABLE 4.15b - Range of groundwater quality in deeper boreholes of site I. 112Table 4.16 - Average values for selected water quality parameters measured by Rand
Water approximately one kIn downstream site J 117Table 4.17 - Average metal concentrations at a Rand Water sampling point
approximately one kIn downstream of site J 118TABLE 4.18 - Surface water quality with increasing distances downstream of tailings
dam site J 118TABLE 4.19 - Trace element concentrations in a peat sample near site J 119TABLE 4.20 - Trace element concentrations of soil and sediment samples near site J. 119TABLE 5.1 - Extractable elements in gold mine tailings 126TABLE 5.2 - Trace element concentrations in soils underneath the study sites 128TABLE 5.3 - Threshold excess ratio of trace elements in soil samples of study site F . 128TABLE 5.4 - Mobility of elements in soil samples from study site F 129TABLE 5.5 - Seepage water quality of case study sites C and G, an open mine shaft and
for comparative reasons of gold tailings operations in Arizona, USA 139TABLE 5.6 - Hazard rating of the study sites by using the geochemical load index 143TABLE 6.1 - Summary of selected rehabilitation measures and associated costs 162TABLE 6.2 - Environmental management measures recommended for the sites A-K .. 164

FIG. 1.1 - Study area depicting the location of the investigated sites, lithostratigraphicalunits and major drainage systems 12
FIG. 2.2 - Position of the phreatic surface in a tailings dam 31FIG. 2.3 - Saturation zones during ponded water infiltration 34FIG. 2.4 - Development of groundwater mound underneath an impoundment 36FIG. 2.5a - Eh-pH fields for some common aquatic environments 58FIG. 2.5b - Eh-pH stability relationships between iron oxides, sulphides and carbonates in the
aqueous phase 58FIG. 2.6 - Speciation of trace elements in a podzolic loamy sand soil. 50FIG. 3.1 - Estimation of saturated hydraulic conductivity in a fine-grained soil. 74FIG. 5.1 - Conceptual model of a cross-section of a tailings impoundment depicting various
contaminant pathways 125FIG. 5.2 - Relation between soil depth and soil pH on a site-specific base 130FIG. 5.3a - Ni mobility in soils 132FIG. 5.3b - Cr mobility in soils 131FIG. 5.3c - Cu mobility in soils 133FIG. 5.3d -Fe mobility in soils 132FIG. 5.3e - Co mobility in soils 133FIG. 5.3f - Pb mobility in soils 132FIG. 5.3g - U mobility in soils 134FIG. 5.3h - Zn mobility in soils 133FIG. 5.4a - Total As contents in soils 135FIG. 5.4b - Total Co contents in soils 134FIG. 5.4c - Total Cr contents in soils 135FIG. 5.4d - Total Fe contents in soils 134FIG. 5.4e - Total Ni contents in soils 135FIG. 5.4f - Total Pb contents in soils 134FIG. 5.4g - Total U contents in soils 135FIG. 5.4h - Total Zn contents in soils 134FIG. 5.5a - As content versus clay amount.. 135FIG. 5.5b - Fe content versus clay amount 135FIG. 5.5c - Ni content versus clay amount 137FIG. 5.5d - Zn content versus clay amount.. 136FIG. 6.1- Scheme for a risk-based site assessment.. 150

Summary of all geotechnical resultsTest pit profiles from case study sites A-G
Table B.1 -Table B.2-Table B.3 -Table B.4-Table B.5-
Table B.6-Table B.7-
Table B.8-Table B.9-
Summary of geochemical soil analyses (XRF)Main statistical parameters from Table B.lBackground values for the Vryheid FormationExtraction test results of the gold mine tailingsThreshold excess ratios for the extractable trace element concentrations insoil of the study site FTrace element mobility in soilCorrelation matrix for selected major and trace elements in tailings samplesfrom five different tailings dams situated in the East Rand areaCorrelation matrix for selected trace elements in soils of the study sites A-GCorrelation matrix between element concentrations and clay content
FIG. E.l -FIG. E.2-FIG. E.3 -FIG. E.4-FIG. E.5-FIG. E-6-FIG. E.7-FIG. E.8-FIG. E.9-FIG. E.IO-FIG. E.ll -FIG.E.12-FIG. E.13 -
Study site AStudy site BStudy site B. One of the test pits, maximum depth 2.50 m.Study site D. Grass cover is poorly developed.Study site E. Paddocks were established to prevent storm water run-off.Study site F. Grass cover poorly developed.Study site I. Rehabilitation of the slope wall to prevent wind erosion.Schaeffbackactor in action at one of the investigated study sites.Seepage sampling next to an operating tailings dam site.Perched groundwater table in test pit D/2.Ferricrete block.Study site G. Precipitation of secondary minerals such as gypsum.Satellite image of the Johannesburg area, depicting the location of tailingsdams, drainage systems and the study area

nn. a.n. d.P & T approachPISTDEVTCTDSTERTotCU.S.C.S.WHOXRDXRF
Acid mine drainageAverage valueCation exchange capacityCarbon-in-pulpDepartment of Water Affairs and Forestry, South AfricaElectrical conductivity (usually expressed in mS/m)Environmental Protection Agency, USAExtractable concentrationIductively coupled plasma mass spectrometryGeochemical load indexmolMaximum valueMinimum valueMobilityTotal amount of samples (or population)Information not availableNot detectablePump and treat approach to decontaminate groundwaterPlasticity indexStandard deviationThreshold concentrationTotal dissolved solids (expressed in mg/l)Threshold excess ratioTotal element concentrationUnited States Classification of SoilsWorld Health OrganisationX-ray diffractionX-ray fluorescence spectrometry
AMDAVGCECCIPDWAFECEPAExCICP-MSIgeoMMAXMINMOB
AluminiumArsenicBariumCadmiumCalciumCarbonChlorineChromiumCobaltCopperIronHydrogenLeadMagnesium
AlAsBaCdCaCCICrCoCuFeHPbMg
ManganeseMolybdenumNickelNitrogenOxygenPotassiumRadiumSodiumSulphurTinUraniumVanadiumZincCyanide
MnMoNiNoKRaNaSSnUVZnCN (radical)

Acid mme drainage (AMD) is recognised as a global pollution problem. The
uncontrolled release of acid mine drainage as a result of poor management of tailings
dams (or slimes dams), sand and waste rock dumps, is the single most important
impact mining has on the environment (Ferguson & Erickson, 1988). In general, mine
residues consist of high volume, low toxicity wastes according to the United States
Environmental Protection Agency (EPA, 1985). In 1996 alone, 377 million tons of
mine waste was produced, accounting for 81 per cent of the total waste stream in
South Africa (Engineering News, 1997).
Gold mining in rocks of the Witwatersrand Supergroup in the Gauteng Province of
South Africa has resulted in the construction of hundreds of tailings dams, which
cover a total area of about 180 km2. Owing to urban expansion and/or agricultural
land development, these tailings dams are often situated in close proximity to valuable
residential, agricultural or industrial property. It is known that the ore of the
Witwatersrand Supergroup contains significant quantities of sulphide minerals (e.g.
pyrite), and the tailings are therefore prone to the formation of acid mine drainage.
The seepage from these tailings is generally characterised by low pH values, high
sulphate loads, as well as elevated concentrations of toxic substances including
radionuclides.
Some of the tailings dams south of Johannesburg (Gauteng Province) are being
reclaimed and reprocessed in order to extract economically viable concentrations of
remaining gold. Once the tailings material has been removed, the polluted soil
beneath the footprint of the former tailings dam may seriously affect the development
potential of the land. In addition, land affected by reclaimed mine tailings is often
situated within highly developed urban areas. Initiatives such as The Reconstruction
and Development Programme of the South African government initiated in 1994, aim
to improve the general living conditions of people from previously disadvantaged
communities. Therefore, the availability of land is one of the central themes of this

program and the use of reclaimed land for development could provide an alternative
source of land closer to centres of employment.
This study is a continuation of a Water Research Commission project, completed in
1988 by the consulting firm Steffen, Robertson & Kirsten, entitled Research on the
Contribution of Mine Dumps to the Mineral Pollution Load in the Vaal Barrage. This
project came to a number of conclusions, of which the following are vital to the
present study:
Mine residue deposits (tailings dams and sand dumps) situated within the
catchment area of the Vaal Barrage discharged approximately 50 000 tonnes of
salts into the near surface environment in 1985 alone; the proportion of pollutants
eventually transported by surface streams and groundwater into the Vaal Barrage
is unknown.
Seepage from the mine residue deposits into the streams is the likely source of the
high salt loads.
The extent and type of pollution in the unsaturated zone determine the type and extent
of rehabilitation approach that would be required for safe future land use and the
prevention of groundwater contamination. Large-scale pollution of land from tailings
dams poses a serious threat to human health and the environment, including the
surface and groundwater resources particularly in highly populated areas.
Consequently, the protection of water resources and the mitigation of water pollution
are becoming an increasingly important issue. Experience in the USA (e.g. under
Superfuni) and Europe has shown that highly polluted areas (e.g. land affected by
mine tailings) are often too large to be cleaned up at a reasonable cost with the
technology available.
I Responding to public concerns about abandoned hazardous waste sites across the USA, the USCongress passed the Comprehensive Environmental Response, Compensation and Liability Act(CERCLA), also known as Superfund. Enacted in 1980, Superfund directs the EP A to locate, study,and clean-up the most hazardous sites; to respond to chemical accidents and spills and to pay for clean-up when parties who own or control a site cannot be identified or cannot afford to pay. In 1990 the totalamount of the trust fund amounted to $ 15.2 billion. Presently there are more than 37000 identifiedcontaminated sites in the USA with total clean-up costs possibly reaching more than $ 1 trillion overthe next 50 years (EPA, 1997b).

In summary, the primary focus of tailings disposal has been on designing a well-
engineered impoundment into which the mine slurry could be deposited. Little
attention was given to closure requirements and long-term management of the
disposal facility, particularly with respect to environmental concerns. Since the
reclaimed areas are expected to remain contaminated for an extended period of time,
it is essential to understand the potential for contaminant mobilisation in the long-term
under changing environmental conditions. While this study focuses on the short and
long-term impact of contaminated seepage released from tailings dams of the gold
mining industry, other factors such as dam stability, tailings pipeline routes, dust
generation and surface run-off are further significant environmental factors that need
to be considered.
1. To identify the nature and extent of contamination in unsaturated and saturated
zones underneath reclaimed gold mine tailings dams.
2. To evaluate and define the existing state of knowledge with regard to the long-
term environmental impacts of tailings dams on the subsurface.
3. To assess the potentially adverse environmental effects of residual contaminants
in the soils underlying tailings dams with respect to future land use of reclaimed
sites.
Many authors and working groups have dealt with the impact of mining activities on
water quality. A comprehensive summary of the previous work and related studies
conducted in South Africa is presented below:
Donaldson conducted studies in 1960 on the geotechnical stability of slimes dams
of the gold mining industry (Adamson, 1973). The findings resulted in the
3

publication of a first guideline for slimes dams in 1968, namely the Code of
Practice for the construction of slimes dams and the condition in which they
should be left at the time of closure by the Chamber of Mines.
• Clausen (1969) predicted an annual salt load of 16800 tonnes from mine residue
deposits in the Klip River and Suikerbosrand catchments in 1970, decreasing to
6000 tonnes in 1980 and 3000 tonnes in 1990. The author ascribed the predicted
reduction in the salt load from mine residues to the proposed construction of toe
dams, the securing of slimes dam tops against surface run-off, and the reduction
with time of the amount of residual pyrite (much of which had already been
oxidised when the study was completed). It is important to note that this study did
not consider the reclamation of mine residue deposits.
• Forstner & Wittmann (1976) analysed heavy metal concentrations in stream
sediments and rivers affected by gold mines in the Witwatersrand region and the
Free State Province. Acid mine drainage and the leaching of toxic metals such as
Co, Cu, Fe, Mn, Ni and Zn resulted in an increase in metal concentrations of three
to four orders of magnitude, compared to pristine river systems in South Africa.
• Hahne, Hutson & Du Plessis (1976) conducted a pilot study on the mineralogical,
chemical and textural properties of minerals occurring in gold mine dumps.
Detailed information about the study was not available.
• Geotechnical investigations regarding the abatement of air and water pollution
from abandoned gold mine dumps in the Witwatersrand area were conducted in
the early 1980s by Blight & Caldwell (1984). The main findings were that
stabilisation and terracing of the tailings dam embankment may result in the
minimisation of wind erosion of tailings material and hence, air pollution.
• Funke (1985) investigated the impact of mining wastes on water quality of the
Vaal catchment area and of the Vaal Barrage. The author found that the
contribution of acid mine drainage from sand dumps and slimes dams causes high
salt concentrations in the Vaal Barrage water. However, compared to the pollution
load originating from underground mine effluents, which are pumped to the
surface and discharged into the rivers, pollution from tailings accounts only to 2
per cent of the total load.
• Marsden (1986) analysed the sulphur content in borehole samples from different
mine residue deposits at various depths. Rainwater run-off from these deposits can
enter the Vaal Barrage system and contribute to the deterioration of water quality.

Seepage from young mine residue deposits contains high levels of pollution.
However, the author concluded that mine residue deposits older than 20 years
show no significant contribution to the current pollution load.
De Jesus, Malan, Ellerbeck, Van der Bank & Moolman (1987) conducted an
assessment of the 226Raconcentration levels in tailings dams and in environmental
waters in the gold/uranium mining areas of the Witwatersrand. The authors
concluded that 226Raconcentrations were low in environmental waters as a result
ofa very low mobility of 226Ra.
Wagner & Van Niekerk (1987) investigated the quality of effluents originating
from gold and uranium tailings dams. The authors found high total dissolved solid
values (> 2500 mg/l) associated by elevated concentrations of Ni, Co, Cu and Zn.
Steffen, Robertson & Kirsten (1988) monitored selected mine residue deposits in
the City Deep area (central Johannesburg) which contribute to the pollution load
(e.g. salt) of the Vaal Barrage Catchment.
Funke (1990) investigated the pollution potential of South African gold and
uranium mines and found that the potential for the sulphur in mine residue
deposits (which is still undergoing oxidation) to cause water pollution is low,
particularly when compared with the pollution load derived from mine pumpage
and metallurgical plants. The author found that most of the slimes dams in the
Witwatersrand area are inactive (i.e. depletion of pyrite oxidation) since more than
20 years.
Evans (1990) conducted a study on the geochemistry of a reed-bed adjacent to a
gold slimes dam and the associated environmental aspects such as the generation
of acid mine drainage and heavy metal pollution. The author found that the quality
of the water can be related to the oxidation of sulphide minerals (e.g. pyrite)
contained in the tailings, resulting in a sulphur-rich seepage and thus, in poor
water quality downstream of the mine residue deposits.
Cogho, Van Niekerk, Pretorius & Hodgson (1992) developed techniques for the
evaluation and effective management of surface and groundwater contamination
in the gold mining area of the Free State Province. The authors concluded that
pollution at the mine residue deposits has reached a quasi steady-state situation for
distances in excess of six kilometres downstream from the pollution source, owing
to the fact that the mine residue deposits are situated mainly on Ecca sediments
(low permeabilities). In contrast, deposits on Beaufort sediments (higher

permeability than Ecca sediments) may show higher quantities of acid mIlle
drainage and associated metal loads in surface and groundwater systems
downstream from the pollution source. However, the authors also concluded that
there is only limited environmental impact on the aquatic pathway, due to the
young age ofthe disposal facilities and a large dilution factor.
Walton & Levin (1993) investigated the type and extent of groundwater pollution
in the Gauteng Province and identified pollution sources and their characteristics
within the dolomitic aquifers. Two representative areas were selected for detailed
field studies, the Elspark/Rondebult, and Rietspruit area south of Brakpan. The
authors concluded that both study areas were subject to diffuse agricultural
contamination, resulting in high nitrate concentrations in groundwater samples.
Point source pollution was identified within the Rietspruit area in the vicinity of a
large tailings dam, reflected by elevated sulphate and metal (e.g. Ni, Cu, Fe)
concentrations in both, surface and groundwater systems.
Radioactive and heavy metal pollution associated with a gold tailings dam on the
East Rand was investigated by Znatowicz (1993). Water quality determinations
and an airborne radiometric method were used to identify anomalous amounts of
heavy metals and radionuclides in the vicinity of a tailings dam. The author found
that a high concentration of toxic metals (e.g. As, Cd, Ti and V) in the water and
high radioactivity (due to a high U content) downstream from the site exceeded
permissible limits. High concentrations of toxic metals were also encountered in
the stream sediments and soils. However, the mobility of the contaminants in the
latter samples is uncertain, because no suitable tests (e.g. extraction or leaching
tests) were conducted.
An assessment of radioactivity and the leakage of radioactive waste associated
with Witwatersrand gold and uranium mining was launched by Coetzee (1995),
who also provided data from an earlier airborne radiometric survey (Coetzee &
Szczesniak, 1993). The author concluded that very low concentrations of U were
found in samples from pollution plumes of tailings dams, but that significant
radiometric anomalies were detected in transported sediments. In his view, this
indicates the migration of U into river systems other than those investigated and
the deposition of 226Ra in the environment.
Pulles, Howie, Otto & Easton (1995) conducted a preliminary situation analysis in
order to characterise the impact of Witwatersrand gold mines on catchment water

quality. The authors concluded that mining activities contributed between 30-45
per cent of the total salt load (estimated at 677 000 ton/year in 1995) to the Vaal
Barrage catchment, thus having a significant negative impact on agricultural and
industrial users.
• Pulles, Heath & Howard (1996) compiled a manual for the assessment and
management of gold mining operations on the impact on water quality at three
different mines in the Witwatersrand, Carletonville and Klerksdorp areas. They
concluded that seepage from various waste deposits such as mine residue deposits
was the most significant pollution source of the water. Seepage contributed only
about 11 per cent of the overall salt load, but between 75 and 85 per cent of the
heavy metal load in waters.
• Rosner (1996) investigated trace and major element contents in samples taken at
various depths « 1 m) from five different gold mine tailings dams in the East
Rand area. All samples were taken within the oxidised zone of the tailings dam
and significant trace element concentrations of As, Cr, Ni, Pb and Zn were found.
However, no correlation between concentration and depth could be established.
• Lloyd (1997) conducted a study on sand dumps and concluded that these have
contributed to the salt discharge from gold mine residue deposits in the past, but
that their impact has progressively decreased due to rapid pyrite oxidation (which
in his view is now complete).
• Blight & Du Preez (1997) investigated sand dumps and found that pollution arises
from acid leachate formed by percolation through the more permeable sand dumps
and, to some extent, from erosion gullies on the less permeable tailings dams.
• Wates, Strayton & Brown (1997) investigated the environmental aspects related to
the design and construction of tailings dams with regard to the recent
environmental legislation in South Africa. The authors concluded that failures
such as the Merriespruit disaster in 1994 have led to an intensified public
awareness of the safety and environmental hazards associated with mine dumps.
These potential hazards are reflected in the promulgation of legislation such as the
new National Water Act (1998). A new set of guidelines, The Code of Practice for
Mine Residue Deposits was also developed under the guidance of the South
African Bureau of Standards (South African Bureau of Standards, 1997).

The study area is located within the Blesbokspruit quaternary sub-catchment system
in the East Rand, approximately 50 km south-east of the centre of Johannesburg. This
sub-catchment forms part of the Vaal River Barrage catchment and covers a total area
of approximately 3600 km2 (Funke, 1985). The West, Central and East Rand area
together (also known as the Witwatersrand), exhibits the highest concentration of
domestic and industrial water users in South Africa. In addition, this area plays an
important role for agricultural, recreational and natural environment use. It is
therefore essential that the water resources within this catchment need to be managed
in a sustainable way.
The Vaal River Barrage catchment is not only unique in terms of user requirements,
but also with regard to impacts on water quality. It is estimated that approximately
five million people (574 people/km2) live within the catchment and future projections
indicate a high growth rate. Whilst the Vaal River Barrage Reservoir relies heavily on
return flows from domestic, industrial and agricultural users, its catchment is also
characterised by a large number of gold mines (more than 60 of which six are active
mines), two active coal mines, 4800 industrial facilities, and 21 waste water
reclamation plants. The Department of Water Affairs and Forestry (DWAF, 1996)
identified the upper reaches of the Blesbokspruit amongst others, as the stream with
the poorest water quality. Furthermore, the Department stated that the gold mines
which are situated in a band running south of Johannesburg from Randfontein Estates
Gold Mine in the West through Nigel in the east, are probably the largest contributors
to diffuse water pollution within the Vaal Barrage catchment. Since a significant
number of gold mine tailings dams are located on dolomitic aquifers, groundwater
quality has deteriorated to such a degree that the viability of aquifers is currently
threatened (Asmal, 1999).
Although the high water demand in this catchment is to some extent alleviated by
water transfer schemes from other catchments (e.g. in Lesotho), it is reasonable to
assume that future management plans for regional water supply will also include

strategies for the increased re-use of water. As the feasibility and cost of water re-use
are inherently dependent on water quality, the success of future management plans for
water supply from the Vaal River Barrage catchment may be influenced by the
success in reducing the pollution load entering this catchment.
Groundwater under pre-mining conditions within the East Rand area had a distinct
dolomitic character (Ca-Mg-HC03 type) with a conductivity of generally less than 70
mS/m, and rarely between 70-300 mS/m (Walton & Levin, 1993). Currently, the
groundwater beneath and close to the tailings dams is dominantly of the Ca-Mg-S04-
type and is characterised by high loads in total dissolved solids2, indicating acid mine
drainage-related contamination emanating from mining operations (Scott, 1995). It
must be stressed that the dolomitic aquifers south of Johannesburg, which underlie
large areas of residential, mining and industrial development, will playa major role in
future water supply.
The greater part of South Africa is semi-arid and subject to variable rainfall, droughts,
floods, and high evaporation. The mean annual rainfall is only 500 mm, which is 60
per cent of the world average. In addition, this rainfall is poorly distributed relative to
areas experiencing economic growth. Only a comparatively narrow region along the
eastern and southern coastline is moderately well watered, whereas the greater part of
the interior is arid or semi-arid. Given that 65 per cent of the country receives less
than 500 mm of rainfall annually (the level regarded as the minimum for successful
dryland farming) and 21 per cent receives less than 200 mm, it is anticipated that
South Africa will face major shortages in future water supply (Eales, Forster & Du
Mhango, 1997).
2 The total dissolved solids limit (TDS) for drinking water recommended by the South African Bureauof Standards (1984), expressed in terms of electrical conductivity (EC), is 70 mS/m. Depending on thetype of TDS, this is equivalent to a TDS concentration in the range of 350-550 mg/I. The maximumallowable limit in this specification is 300 mS/m, which is equivalent to a TDS concentration of about2000 mg/I. According to the World Health Organisation (WHO), TDS concentrations of less than 1000mg/l are generally acceptable (Department of Water Affairs, 1996a). However, it is not so much theTDS value as the concentrations of specific ions that are detrimental to human health, and thusdetermine the suitability of groundwater for domestic and other uses.

No site-specific climatic data were available but the statistics for the nearest weather
station, at the Johannesburg International Airport, were used to describe the climate of
the study area. The investigated area falls in the summer rainfall region (mainly
between September and April), with the long-term average annual rainfall of 713 mm
as shown in Table 1.1a:
TABLE Lia - Rainfall (period 1961-1990) and evaporation (A-pan) data for the JohannesburgI t f 1A' d d' (W h B 1999)n erna lOna I.rrportan surroun mgs eat er ureau,Month Jan Feb Mar Apr May Jun Ju1 Aug Sep Oct Nov Dee Total
Rainfall average 125 90 91 54 13 9 4 6 27 72 117 105 713
(nun)
Max. 24h rainfall 108 56 92 50 70 31 17 21 62 110 102 102 -(nun)
Evaporation 222 182 172 135 129 109 123 107 217 246 223 231 2096
(nun)
The high evaporation rates of the area imply a moisture deficit during the entire year.
Table 1.1b represents the average maximum and minimum temperature data for the
study area.
TABLE Lib - Temperature data (period 1961-1990) for the Johannesburg International Airport andd' (W h )surroun mgs eat er Bureau, 1999 .
Month Jan Feb Mar Apr May Jun Jul Aug Sep Oct Nov Dee
MAX average 25.6 25.1 24.0 21.1 18.9 16.0 16.7 19.4 22.8 23.8 24.2 25.2
(0C)
MIN average 14.7 14.1 13.1 10.3 7.2 4.1 4.1 6.2 9.3 11.2 12.7 13.9(0C)
The prevailing winds for the area are in a northerly to north-westerly direction, with
wind speeds rarely exceeding 10.8 m/s. No rainfall occurred during the fieldwork
period from April to May 1998.

1.4.3 Location of the study sites
A number of 11 sites were selected for a detailed study. Sites A-K (except H) are
situated in the East Rand area, south-east of Johannesburg (Gauteng Province) and are
either partially or completely reclaimed. Site H is located near Potchefstroom in the
North-West Province and is completely reclaimed. The altitude of the study area is
about 1600 m above sea level and falls within the Highveld Region. The seven study
sites (A-G), where fieldwork was undertaken cover a total area of approximately 400
ha.
The underlying bedrock geology of the sites comprises rocks of the Monte Christo
(dolomite) Formation, Transvaal Supergroup (age ± 2600 Ma), sediments of the
Dwyka (diamictite and shale) and Vryheid (sandstone and shale) Formations, Karoo
Supergroup (age 200-300 Ma) and doleritic intrusions ofpost-Karoo age. Soils of the
study sites are highly weathered and generally characterized by a low organic matter
content « 1 per cent), but a relatively high clay contents averaging 31 per cent and
ferricrete horizons of considerable thickness.
The Blesbokspruit flows from the north to the south through the study area and joins
the Suikerbosrand River approximately 14 km south of Heidelberg. This river
subsequently feeds into the Vaal River. A large wetland system, intersected by a
number of road causeways, occurs over a distance of 22 km along the Blesbokspruit
east of Springs all the way to Nigel. This wetland has been proclaimed as an
international nature conservation site. The wetland modifies the hydrology by
attenuating floods and by evapotranspiration loss. It has also been deduced that bed
seepage loss occurs (Herold, 1981). A number of gold mine tailings dams are located
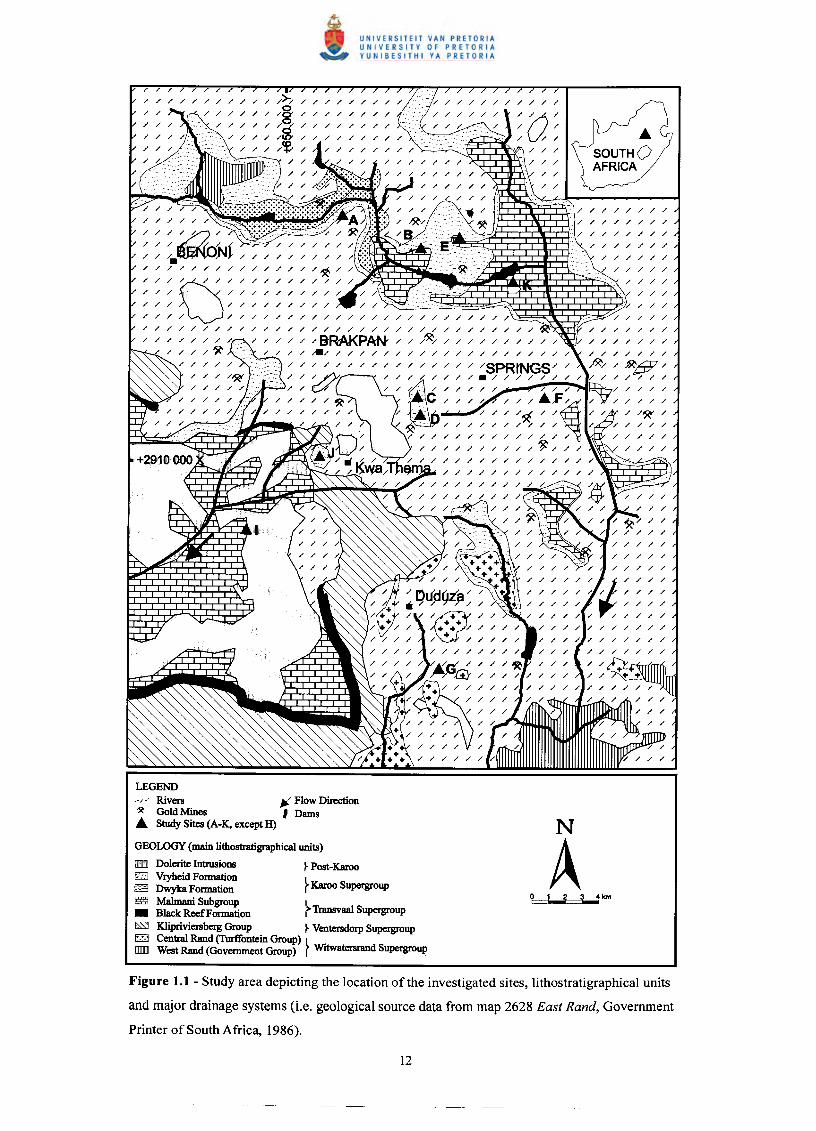
adjacent to the wetland. Figure 1.1 shows the location of the investigated sites and
their underlying geology as well as major drainage systems.
/ / / /
/ /
/ /
/ / / / / /
//// //
///// //
/
/
/ /
/ / / / / /
/ / / G' / / /
/ / / / / / / /
/ / / / / / /
/ / / / / / / /
/ / / / / / / / /
/ / / / / / /
~
/ /
/ /
/ /
/ / / /
/ / / / / / / / /
/' / / /
/ / / / /
/ / / / / / /
//////
/ / / / /
/ ~.tIP// / / /
/ / / /
/ / /
/ / / / / / / / / / / / / / / / / / / /
/ / / ,BRAKPAN- / / /~ / / / / / /
AI/ / / / / / / / / / / / /
/ / / / / /
"~'/ /
/ hj.6 ; /
/' -Ap// /
/ / / / / /
/ / / / / / /
/ / / / / / / / / /
/ / / / / /
/ / / / / /
/~ /
/ / /
/ / /
/ /
/ /
/
/
/ / /
/ / /
/ / / / / /
/ / / /
/ / / / /
/ / / / /
/ / / / /
/ / / / / /
LEGEND~ Rivers~ GoldMines.&. Study Sites (A-Ie, except H)
GEOLOGY (main lithostratigraphical units)
EJ Dolerite Intrusions ~Post-KarooEJ Vryheid Formation }~ Dwyka Formation Karoo Supergroupg;:;;j Ma\mani Subgroup l• Black Reef Formation (Transvaal Supergroup~ Klipriviersberg Group ~VentersdorpSupergroupo Central Rand (Turffontein Group) lDJIlI West Rand (Government Group) (Witwatersrand Supergroup
Ii Flow DirectionI Dams
N
AFigure 1.1 - Study area depicting the location of the investigated sites, lithostratigraphical units
and major drainage systems (i.e. geological source data from map 2628 East Rand, Government
Printer of South Africa, 1986).

The author would like to thank the Director of the Post-Graduate Bursary Program of
the Free State of Bavaria in Germany (Post-Graduiertenf6rderung des Freistaates
Bayem) and the German Academic Exchange Service (Deutscher Akademischer
Austauschdienst, DAAD) in co-operation with the University of Erlangen-Nlirnberg
as well as the Water Research Commission of South Africa for financial support
during this study. It must be also emphasised that this research project would not have
been possible without the co-operation of South African mining companies such as
the East Rand Gold and Uranium Mining Company (in particular Mr. H.
Geldenhuys), which is one of the largest tailings dam operators in South Africa.
I am indebted to Prof. A. van Schalkwyk and Prof. C.P. Snyman of the Department of
Earth Sciences at the University of Pretoria for their supervision. Prof. A. van
Schalkwyk in particular, for initiating this project and creating the opportunity to
undertake this study. Furthermore, I would like to thank Mr. W. Pulles and Dr. R.H.
Boer of the consulting firm Pulles, Howard & De Lange in Johannesburg for their
support, and staff members and colleagues of the Department of Earth Sciences for
their continuous interest and their practical help and provision of information; among
these are: Dr. J.L. van Rooy, Dr. T. Wallmach, Mrs. M. Loubser (XRF), Mrs. S.
Verryn (XRD) and Mr. J.J.G. Vermaak (now with Yates Consulting). I am grateful to
Mr. P. Aucamp of the Council of Geoscience (now with Geo-Hydro-Technologies)
for the provision of laboratory facilities, practical analytical help and many
stimulating discussions. I would like to thank Dr. Kim Wallmach for editing this
thesis.
At last I thank my parents and in particular my grandparents for their encouragement,
and my South African and German friends for their support during the years of this
research in South Africa.
2 GEOLOGY, MINERALOGY AND CHEMISTRY OF THEGOLD ORE AND RELATED TAILINGS
Gold was discovered in 1886 in the Witwatersrand and this region represents the
largest known low-grade gold mineral deposit in the world (Adamson, 1973). The
thickness of the Witwatersrand Supergroup reaches 7500 m and occupies an area of
thousands of square kilometres in the Gauteng (former Transvaal) and the Free State
Provinces. The production from the Witwatersrand Basin, since the first discovery,
amounts to about 45 000 tons of gold (Au) and about 150 000 tons of uranium (Robb
& Meyer, 1995).
The precious metal occurs in well-defined conglomerate bands (also known as beds,
banket or reefs) that are separated by barren sediments consisting mainly of
quartzites. Extensive research led to the assumption that the gold together with other
heavy minerals including uraninite, was originally deposited in the conglomerates as
detrital particles. Subsequently, metamorphic processes resulted in the remobilization
of gold particles. Apart from the occurrence in the conglomerates, gold is also
contained in banded pyritic quartzites, which fill erosion channels cut in shales,
quartzites, and conglomerates underlying the main reef in the Central and East Rand
(Liebenberg, 1973). Of special importance for the study area in the East Rand is the
Black Reef at the base of the Transvaal Supergroup, where from 1886 until 1962
about 195 000 ounces of Au were recovered, with an average gold content of 15.77
g/ton (Liebenberg, 1973). Table 2.1 presents the generalized lithostratigraphic
columnar section for the study area in the East Rand. Dykes and sills consisting
mainly of dolerite (post-Karoo), diabase and syenite (both post-Transvaal) intersect
the sediments of the Witwatersrand Supergroup. It should be emphasised that the
Witwatersrand has been the subject of extensive geological research for more than a
century. For detailed geological and mineralogical information reference should be
made to the literature available on this topic.

TABLE 2.1 - Generalised lithostratigraphic columnar section for the study area (modified after Kafri,Foster, Detremmerie, Simonis & Wiegrnans, 1986 and supplemented with data from the GeologicalM 2628 E R d G . f S h fr' 6)ap ast an , overnment Prmter 0 out A lca, 198
Supergroup Group ...- -r Formation Thicknesis Main Lithology(m)
I CDolerite intrusions..•.. !lifJ
C~=--
< Vryheid Sandstone and shaleUc U! I:I.l
=~Dwyka Diamictite and shale
Ravton 120 Quartzite and shaleMa~aliesber~ 300 Quartzite
< Silverton 600 Quartzite and limestone2 Daspoort 80-95 Quartzite0 Strubenkop 105-120 Quartzite and shaleE-<
~ Hekpoort 340-550 Lava and tuff
--'ll:l. Timeball Hill 270-660 Quartzite and shale
< Rooihoogte 10-150 Quartzite, shale and<;> conglomerate00
Eccles 380 Chert rich dolomiteZ< E-<
= ~E-< 0 Lyttleton 150 Chert poor dolomite0
l:l. Malmani00I:I.l Monte Christo 700 Chert rich dolomite.....•
~ Oaktree 200 Chert poor dolomiteU
Black Reef 25-30 Quartzite
~0Q00 Not relevant in this study=~E-<ZIi;Ii;l;>
QZ<=00=~ Not relevant in this study<~t:~

According to Feather and Koen (1975) the Witwatersrand conglomerate is a greyish,
metamorphosed sedimentary rock consisting mainly of quartz (about 80 per cent),
cemented by a fine-grained matrix of recrystallized quartz and associated with various
phyllosillicates (i.e. a mixture of sericite and chlorite, and sometimes also pyrophyllite
and chloritoid). The pebbles vary in composition, size, and colour but consist mainly
of vein quartz. Round grains of pyrite, also known as buckshot pyrite, are often visible
in the matrix, and sometimes are used as indicators for high gold concentrations. The
gold is confined to the matrix of the conglomerates and is concentrated predominantly
along the bedding planes of the conglomerate beds and on the footwall contact
(Liebenberg, 1973).
The gold-bearing conglomerate mined in the Witwatersrand area contains more than
70 ore minerals (Feather & Koen, 1975), but a typical mineralogical composition is as
follows (Liebenberg, 1973):
Primary and secondary quartz (70-90 per cent);
Sericite accompanied by variable amounts of pyrophyllite and other minerals such
as muscovite, chlorite and chloritoid (10-30 per cent);
Pyrite, occurring mainly as rounded grains (buckshot pyrite), and also crystals and
irregular patches (3-4 per cent);
Other sulphides such as pyrrothite, chalcopyrite, pentlandite, galena, cobaltite,
sphalerite, gersdorffite, linnaeite, and arsenopyrite (1-2 per cent);
Oval and round grains of primary minerals such as uraninite, monazite, chromite,
rutile, gamet, diamond, zircon, xenotime, ilmenite, magnetite, and tourmaline (1-2
per cent). These minerals are associated with alteration products such as hydrated
iron oxide (mainly goethite) and leucoxene, and sometimes with secondary
minerals such as anatase, and more rarely with calcite.

Lloyd (1981) reported pyrite contents in gold ores in Witwatersrand ranging from 3.2
per cent at Durban-Roodepoort Deep to 1.7 per cent at the East Rand Proprietary
Mines (ERPM) in Boksburg. Table 2.2 presents the mineralogical and element
composition of conglomerates from the Vaal Reef and the Ventersdorp Contact Reef.
TABLE 2.2 - Mean contents for significant elements and minerals present in the Ventersdorp ContactReef and Vaal Reef (after von Rahden, 1970).
Element / Ventersdorp Vaal Reef
Mineral Unit Contact Reef
Venterspost Hartebeestfontein Zandpan
Mine Mine Mine
Gold mg/kg 43.8 50.1 39.1
Silver mg/kg 4.9 7.6 3.3
Uranium Oxide (as U3Og) mglkg 290 870 930
Quartz % 88.9 88.3 75.8
Pyrite % 3.2 6.6 n. a.
Chlorite % 4.9 0.8 0.9
Muscovite (sericite) % 3.0 4.4 7.0
Pyrophyllite % 0.2 0.1 2.5
Zircon % 0.18 0.08 0.09
Chromite % 0.15 0.20 0.17
Titanium-bearing minerals
(Le. leucoxene, rutile, % 0.11 0.09 0.19
altered ilmenite,
titaniferous magnetite,
titanite)
The conglomerates from the different mines are mineralogically very similar, but vary
in the relative proportions of minerals comprising them. A detailed discussion on the
mineralogy of the Witwatersrand Reefs is provided in Feather & Koen (1975).
It can be expected that the mineralogical composition of tailings from the recovery of
gold can be derived from the gold ore. In this study, 16 tailings samples have been

selected for the determination of mineral content by means of the semi-quantitative X-
ray diffraction method (XRD). Table 2.3 presents the result of these analyses.
- mera Istn utlOnm go mme tal mgs at t ee I erent sItes n=Sample Sampling Jarosite Gypsum Quartz Muscovite Clinochlor Pyrophyllite TOTALNo. depth
em % % % % % % %1 30 1 0 70 17 11 1 1002 60 2 0 71 13 13 1 1003 80 1 0 78 11 10 0 1004 30 3 0 74 12 11 0 1005 30 2 0 71 15 11 0 1006 40 3 0 74 15 8 0 1007 50 6 0 72 16 7 0 1008 60 6 0 74 13 6 0 1009 70 7 0 73 14 6 0 10010 40 2 0 79 9 2 8 10011 60 3 0 85 8 0 4 10012 70 1 0 93 4 0 2 10013 80 2 2 87 5 0 3 10014 30 3 0 88 5 0 5 10015 30 2 0 83 6 9 0 10016 50 6 0 73 14 0 7 100MIN 1 0 70 4 0 0MAX 7 2 93 17 13 8AVG 3 0 78 11 6 2
Quartz (Si02) is the dominant mineral phase in tailings material ranging from 70-93
per cent, averaging 78 per cent. These results correspond to the geochemical ore and
tailings composition. The latter is listed in Table 2.6a. The high weathering resistance
of quartz results in its relative enrichment compared to readily weathered minerals.
The sulphide mineral oxidation results in the formation of secondary minerals such as
gypsum (CaS04 . 2 H20, Figure E.12) and jarosite (KFe3(S04)(OH)6). Gypsum and
other secondary minerals predominate on the outer toe wall of tailings impoundments
and in surface areas close to the impoundment where seepage discharge takes place.
Gypsum is formed due to evaporation of solutions supersaturated with respect to Ca2+
and sol-, resulting in the precipitation of gypsum. The fact that no pyrite was found
can be explained by the shallow sampling depth within the oxidised zone, resulting in
the depletion of pyrite after years of oxygen exposure. In addition, primary mineral
phases occurring within the tailings are muscovite [KAh(AISh)OlO(OH)2], clinochlor
[MgsAhShOlO(OH)g] and pyrophyllite [AI4[Sig02o](OH)4]. De Jesus et al. (1987)

reported high contents of phyrophyllite (max. 16 per cent) and sericite (max. 2 per
cent) as well as quartz contents of 80-90 per cent in tailings material. Pyrophyllite and
muscovite show similar physical properties to kaolinite: low expanding capabilities
when hydrated (swelling and shrinking, with changes in moisture content), and a low
cation exchange capacity.
It is important to note that these mineral phases in tailings impoundments control the
pore water chemistry, thus affecting the chemical composition of acid mine drainage.
Table 2.4 provides the major element composition of conglomerates from two
different gold mines of the Central Rand, where more than 40 per cent of the gold
from the Witwatersrand Basin were recovered.
TABLE 2.4 - Major element composition of conglomerates from the Central Rand (after Liebenberg,1973).Major Witwatersrand Durban Roodepoort
Element (%) Deep Mine Deep Mine
Si02 88.76 85.60
Ah03 6.91 3.50
FeZ03 2.65 8.60
FeO n. d. n. d.
CaO traces traces
MgO 0.70 n. d.
KzO n. d. n. d.
MnO n. d. n. d.
FeSz 2.75 2.15
Ti02 n. d. n. d.
PzOs n. d. 0.10
CO2 n.d. n. d.
H2O n. d. n. d.
TOTAL 99.77 99.95
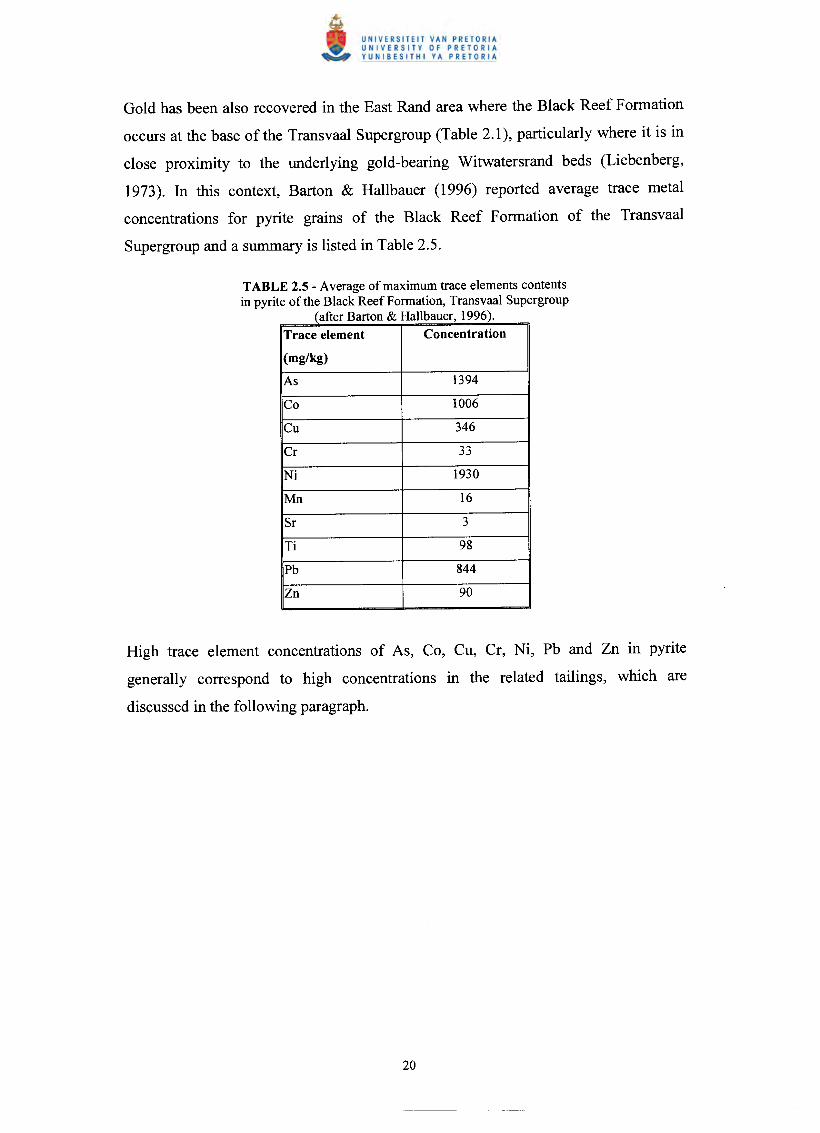
Gold has been also recovered in the East Rand area where the Black Reef Formation
occurs at the base of the Transvaal Supergroup (Table 2.1), particularly where it is in
close proximity to the underlying gold-bearing Witwatersrand beds (Liebenberg,
1973). In this context, Barton & Hallbauer (1996) reported average trace metal
concentrations for pyrite grains of the Black Reef Formation of the Transvaal
Supergroup and a summary is listed in Table 2.5.
TABLE 2.5 - Average of maximum trace elements contentsin pyrite of the Black Reef Formation, Transvaal Supergroup
(after Barton & Hallbauer, 1996).Trace element Concentration
(mg/kg)
As 1394
Co 1006
Cu 346
Cr 33
Ni 1930
Mn 16
Sr 3
Ti 98
Pb 844
Zn 90
High trace element concentrations of As, Co, Cu, Cr, Ni, Pb and Zn in pyrite
generally correspond to high concentrations in the related tailings, which are
discussed in the following paragraph.

Table 2.6a presents the concentrations of major elements in tailings samples, collected
from five different deposits in the East Rand area.
TABLE 2.6a - Average major element concentrations of five different gold mine tailings dams in theEast Rand area (Rosner, 1996, n=36).Major Site 1 Site 2 Site 3 Site 4 Site 5element (%)Si02 80.44 84.14 82.33 83.44 77.63
Ti02 0.49 0.48 0.47 0.27 0.60
Ah03 8.24 6.33 8.05 5.68 9.77
Fe203 3.66 3.23 3.65 3.66 3.60
MnO 0.02 0.02 0.01 0.01 0.01
MgO 0.94 0.77 0.6 0.29 0.60
CaO 0.28 0.55 0.12 0.43 0.20
Na20 0.15 0.21 0.19 0.17 0.22
K20 1.91 1.34 1.95 1.1 2.70
P20S 0.03 0.04 0.04 0.03 0.03
(S03) 0.1 0.12 0.02 0.08 0.06
(Cl) 0.02 0.04 0.03 0.03 0.03
(F) 0.02 0.01 0.01 0.01 0.01
LOI 3.46 2.36 2.32 4.31 4.24
TOTAL 99.76 99.64 99.79 99.51 99.70
• Changing ore body geochemistry;
• Weathering process in the mine tailings.
According to the chemical composition of the tailings material, the high Sio2 values
correspond to the high quartz content in the gold ore (Table 2.4). Carbonate occurs as
traces in the Witwatersrand gold ore, but lime is added during the gold recovery
process, resulting in an alkaline slurry and, thus in elevated carbonates contents in the
tailings. However, these contents in the tailings are too low to provide sufficient acid
neutralisation capacity to prevent the generation of the acid mine drainage.
The loss of ignition (LoI) as shown in Table 2.6a usually reflects the total content of
organic matter and volatile elements such as CO2, H20, C, CI, F, Sand CN (cyanide).
It is most unlikely that tailings contain any significant concentrations of organic
i IWbl?'11 04b \4?JI"J1170
material as the content of kerogen is generally low in the gold ore. Cyanide is used
amongst others during the gold recovery process to dissolve the gold and this process
is described in more detail in the next paragraph. However, CN is unstable and
decomposes rapidly if exposed to sunlight and the atmosphere (Adamson, 1973).
It can be argued that the pyrite (FeS2) content of the analysed tailings samples is
lower than in the ore (parent rock) or unweathered tailings, because all samples were
taken within the oxidised zone (2-3 m depth) of the deposit. In this zone pyrite reacts
in the presence of oxygen and moisture resulting in high sulphate loads and a low pH
in the tailings pore water, known as acid mine drainage. For example, Blight & Du
Preez (1997) investigated the total sulphur content, paste conductivity (measured in
the field) and the paste pH beneath the surfaces of slopes and the top surface of a
decommissioned tailings dam in the Gauteng Province. Samples were taken at
intervals of 0.5 m to a maximum depth of 5 m. A total sulphur content of
approximately 0.1 per cent within the first metre below the surface indicates that the
tailings have almost fully oxidised whereas sulphur contents at depths greater than 1
m increase to approximately 1.5 per cent. The pH profile indicates values from 3-7
within the first 0.5 m below surface and constantly low pH values (below 4) at depths
from 0.5-5 m. The paste conductivity profile corresponds to the pH and sulphur
content profile with low conductivities (below 100 mS/m) within the first metre of the
deposit and maximum values of 1000 mS/m at depths greater than I m. Blight & Du
Preez (1997) concluded that the salt and sulphur-rich tailings in the impoundment are
separated from the atmosphere by a 1-1.5 m thick outer layer of oxidised, leached,
relatively innocuous material.
Table 2.6b presents the concentrations of some of the trace elements, contained in
samples from five different gold mine tailings dams in the East Rand area.

TABLE 2.6b - Average trace element concentrations of five different gold mine tailings dams in theEast Rand area (Rosner, 1996; n=36).Trace element Site 1 Site 2 Site 3 Site 4 Site 5mg/k2)
As 109.0 82.7 103.5 112.5 123.4
Co 13.1 4.8 4.0 18.6 20.5
Cu 27.0 14.0 17.5 22.7 25.1
Cr 462.4 395.8 347.3 445.5 553.1
Ni 71.6 54.5 33.6 73.1 88.4
Ph 46.4 20.8 36.3 125.0 23.1
Zn 45.4 27.8 17.6 94.4 21.4
Th <3.0 < 3.0 <3.0 3.5 4.0
U 17.9 9.7 9.5 46.4 13.7
The following parameters may influence the trace element concentration in the mine
tailings:
Fluctuations in the pyrite content of the mined ore;
Dilution effect by the matrix;
Metallurgical separation during the gold recovery process;
Oxidation within the surface layer and migration into deeper zones of the
impoundment.
The correlation coefficients of all measured elements (major and trace elements) were
calculated and are presented in Table B-7 (Appendix B).
These correlation coefficients could be explained on a mineralogical basis. The
phyllosilicate muscovite (K2AI4[Si6Ah02o](OH,F)4) accounts for the correlation
coefficients between the K20-Si02-Ah03 components, as indicated by the structural
formula. Secondary sulphides (including galena, PbS), consisting predominantly of
pyrrothite, chalcopyrite, pentlandite and sphalerite (ZnS) often accompany the gold in
the uraninite (Liebenberg, 1973). Niccolite (NiAs) and cobaltite (CoFeAsS) are rare
minerals in Witwatersrand-type ores, but are closely related when they are present
(Feather & Koen, 1975). However, both Co and Ni can be camouflaged by Fe in
pyrite.

Subsequently, the mobility of various trace elements in 13 tailings samples was
investigated. The extractable concentrations and the relevant threshold value for soils
are presented in Table 5.1. In summary, high concentrations of sulphur (S) in the
leachate are caused by the oxidation of sulphide minerals such as pyrite. Furthermore,
Co, Cr, Cu, Ni, Pb and Zn exceed in the bulk of the leachate samples the soil standard
used in this study.
The recovery of gold in South Africa is achieved by a number of mechanical and
metallurgical processes (Adamson, 1973). The first step in the recovery is sorting to
reduce the mass of ore milled by eliminating dilution with waste rock from run-of-
mine feed. The waste rock is either deposited, or sold as construction material. The
second step is crushing and milling to reduce the grain size of the ore to a size less
than 0.1 mm. The fine-milled material is suspended in water and passed through a
hydrocyclone in order to separate over-size material for recycling to the mill. In the
next metallurgical step gold is recovered partly by gravity concentration (for coarse
gold) and partly by cyanidation (for fine gold), where mine water from tailings ponds
is used to augment the water in the milling circuit.
Various processes (not necessarily listed in the proper sequence) achieve the
metallurgical recovery of gold:
Gravity concentration;
Thickening;
Cyanidation;
Filtration;
Precipitation and smelting;
Carbon-in-pulp (CIP) process.

During the first process, the coarse and dense particles recovered at the bottom outlet
of the hydrocyclone are gravity concentrated to separate coarse gold and pyrite from
the remaining ore material. Thereafter, the concentrates gold and pyrite are refined by
amalgamation with mercury (Hg) or by treatment with a strong cyanide solution.
These days coarse gold is recovered by means of corduroy tables - the amalgam
method has not been used for the last 20-30 years.
The fine material from the top outlet of the hydrocyclone, or overflow, has to be
thickened by adding lime and organic compounds as flocculants (Funke, 1990). The
amount of lime added to the slime (or slurry) ranges from 0.75 to 1.5 kg/t to maintain
an alkalinity between 0.010 and 0.25 per cent CaO (Adamson, 1973). Subsequently,
the thickened slime is pumped to the cyanidation tanks, where approximately 0.15 kg
NaCN/t (or KCN) is added to dissolve the gold (Funke, 1990). In addition,
compressed air is passed through the slurry to provide oxygen, which is required for
the dissolution reaction:
Cyanide is consumed during agitation by the decomposition products of pyrite and the
presence of CO2 contained in the compressed air. The total air-agitation for the
maximum dissolution of gold varies from 15 to 45 hours, depending on (after Funke,
1990):
Grain size of the free gold particles;
Degree of pyrite encasement;
Consistency of slime grading.
Filters currently achieve separation of the gold-cyanide solution from slime. As a
result of lime added to the cyanide solution, CaC03 precipitates due to the reaction
with CO2 in the interstices of the filter cloth, leading to a gradual reduction of the
filtration rate (Adamson, 1973). The precipitation of gold from the filtered cyanide
solution is achieved by the reaction with zinc dust and the addition of small quantities

of lead nitrate, which is not shown in the reaction below. The chemical reaction of the
precipitation of gold from the cyanide solution can be expressed by the reaction:
The zinc-lead gold precipitate is subsequently removed from the solution by filter
presses. The precipitation product or cake in the filters is passed to an acid vat where
sulphuric acid is added to dissolve excess zinc and other soluble constituents. After
dewatering, the slime is roasted by calcining at approximately 6000 C and is then
smelted in electrode arc furnaces between 1200 and 13000 C for a period of about two
hours. Finally, the recovered gold is transported in bars to the refinery plant.
The carbon-in-pulp process is applied to recover gold directly from the cyanide
leached slime by adsorption onto granular activated carbon. The gold-loaded carbon is
separated from the slimes by screening and is then eluted with hot NaCN under
pressure to achieve a gold-containing solution. The gold can be recovered by either
direct electro-winning cells or by zinc precipitation and subsequent smelting. Due to
the smaller volumes used by this approach, financial savings are considerable (Funke,
1990).
Large quantities of sulphuric acid are required for the extraction of uranium from gold
plant residues. Pyrite is recovered from some ore as a by-product to produce sulphuric
acid. For this process, copper sulphate (CUS04) is essential for the successful froth
flotation of pyrite by means of a collector (xanthate) and a phosphate containing
frother (Aerofloat 25) according to Adamson (1973). In such cases the pyrite content
in the tailings will be reduced, whereas the Cu and phosphates contents will be
increased. In contrast to the recovery of gold by cyanide, complete dissolution of
uranium is achieved by oxidizing agents such as MnOz (until about 1970) or ferric
sulphate (since about 1970), the latter being produced by bacterial oxidation of
ferrous sulphate. The MnOz would cause an increase of MnS04 in the tailings.

In summary, a variety of substances such as Hg, Ca, Cu, Zn, Pb, Mn, phosphate and
NaCN are introduced during the gold and uranium recovery process, so that the
tailings contain higher values of these substances than the original ore.
2.5 MANAGEMENT AND RECLAMATION OF TAILINGS DAMS IN
SOUTH AFRICA
In most cases the basic requirements of a tailings facility are to store the tailings in
such a way that the impoundment structure remains stable, has little impact on local
residents and the environment, and the tailings dam can be rehabilitated once the mine
is closed. The main short and long-term impacts associated with tailings storage are:
1. Soil and water pollution (including groundwater);
2. Dam safety and stability;
3. Air pollution by dust;
4. Visual or aesthetic impact;
5. Reclamation and rehabilitation.
It should be noted that already in the in the early days of gold recovery in the
Witwatersrand, a variety of methods existed for the construction of slimes dams or
tailings dams, particularly with respect to slope angles, width of dam walls, rate of
deposition and final height. Since the 1960s practically all new dams have been
constructed in accordance with recommendations of G.W. Donaldson (outlined in
Adamson, 1973), who conducted studies on the geotechnical stability of slimes dams.
In 1968, the Chamber of Mines published The Code of Practice for the construction
of slimes dams and the condition in which they should be left at the time of closure,
mainly based on the findings of Donaldson.
As a result of the Merriespruit disaster in February 1994, where a tailings dam
collapsed, killing and injuring residents nearby a suburb of Virginia (Free State
Province), the Department of Minerals and Energy took an initiative to improve
existing guidelines for the construction, operation and rehabilitation and thus,
appropriate environmental management, of mine residue deposits. Thus, a new Code
of Practice for Mine Residue Deposits has been developed in collaboration with the
South African Bureau of Standards (1997) and various specialists of the mining
industry and consulting firms. The Code is not restricted to the safety and stability of
mine residue deposits but also includes environmental aspects such as:
Water and dust pollution;
Factors affecting soil requirements;
Aspects of land use.
This Code provides mining companies with guidance to ensure good practice in the
various stages of the life cycle of tailings dams. In addition, current legislation
requires from all mining companies to publish regular Environmental Management
Programme Reports on all mining operations potentially affecting the environment
during the life time of a mine, including tailings dams. The construction, operation,
decommissioning and reclamation of tailings dams in the view of legal aspects is
extensively discussed in Cogho et ai. (1992), Fuggle & Rabie (1992), Richter (1993),
and Wates et ai. (1997).
Various classification systems for mine residue deposits are available in South Africa
(Funke, 1990 and Cogho et. aI., 1992). A general classification system, based on the
grain size of mine residues, results in three categories:
• Waste rock dumps consisting of coarse-grained low-grade or barren country rock,
the processing of which for the recovery of gold is not economically viable
(Daniel, 1993). Rock dump material is usable as construction material for
infrastructure such as roads.
• Sand dumps were mechanically deposited in a wet state, reaching heights of up to
100 m above ground surface. Because of the permeability of the loosely packed
sand (fine to medium sand particle size), oxidation of sulphide minerals occurs up
to depths of more than 10m, resulting in the rapid generation of acid mine
drainage. The mechanical deposition of tailings material as sand dumps has been
phased out, with the last sand dumps deposited probably in the early 1960s
(Funke, 1990).
• Tailings dams (also termed slimes dams) are characterised as hydraulically
constructed ring dyke impoundments. The particle size of tailings material is
mainly < 75 /lm. Hence, the oxidation of sulphide minerals (e.g. pyrite) IS
confined to a depth of a few metres below the surface of the impoundment. The
solid to water ratio in the wet tailings varies from 1:1 for gold tailings up to 1:4.5
in tailings dams generated from the combined recovery of gold, uranium and
pyrite. Some of the operating tailings dams store large volumes of surplus water
from the plant in pond systems for evaporation purposes on top of the dam.
Tailings dams represent the most common deposition type in South Africa. Funke
(1990) subdivides tailings dams into two subclasses: those that have been
established only from the extraction of gold, and slimes dams from the combined
extraction of gold, uranium and pyrite.
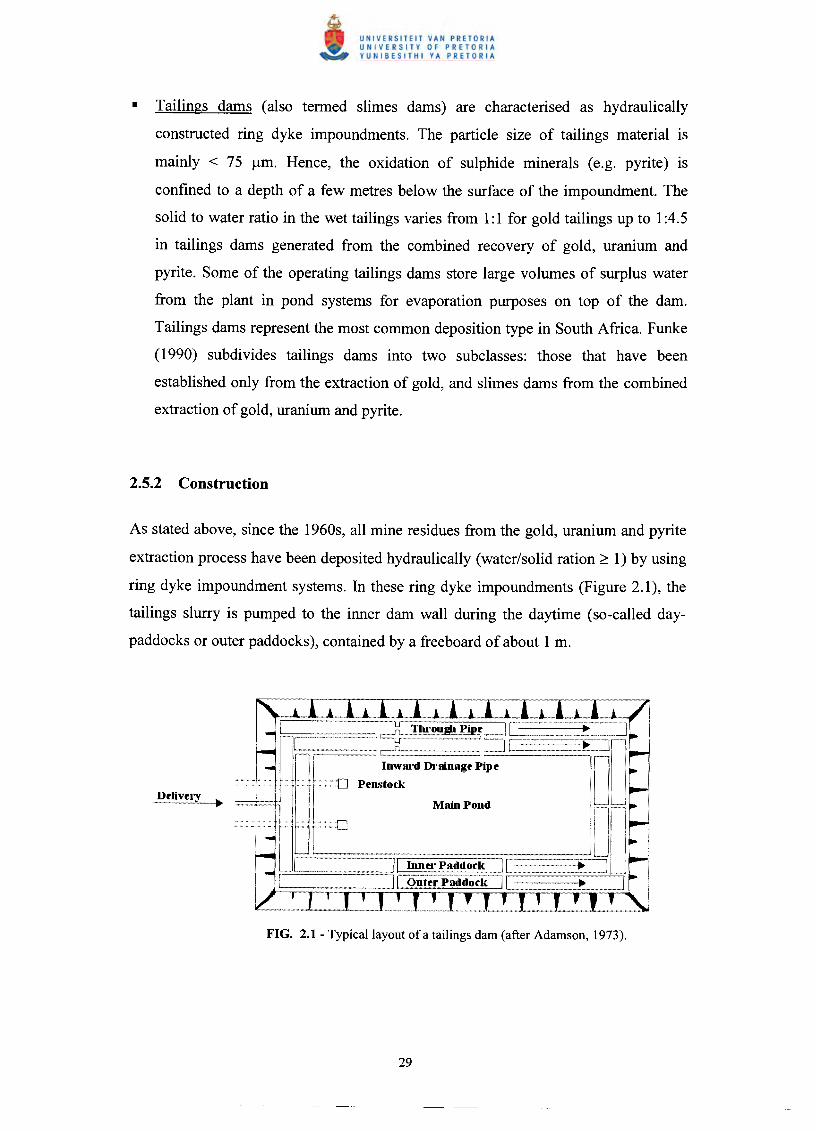
As stated above, since the 1960s, all mine residues from the gold, uranium and pyrite
extraction process have been deposited hydraulically (water/solid ration ~ 1) by using
ring dyke impoundment systems. In these ring dyke impoundments (Figure 2.1), the
tailings slurry is pumped to the inner dam wall during the daytime (so-called day-
paddocks or outer paddocks), contained by a freeboard of about I m.
In the late afternoon, after settlement of the coarse material in the day-paddocks, the
slurry decants via breeches into the large area of the night-paddocks (or inner
paddocks), where sedimentation of the fine tailings material takes place. Finally, the
decanted water is collected in the lower-lying area around the penstock system, from
where it is returned to the processing plant. The cycle time in the day-paddocks is
determined by the rate of deposition required for the tailings to achieve desiccation,
which is usually one to two weeks. The maximum rate of deposition in South Africa
is 2.5 m/year, which according to Funke (1990), is a result of:
• Effective desiccation;
• Stable surface conditions;
• Access requirements;
• Experience with gold tailings with a relative density of 1450 kg/m3 and a cycle
time in the day-paddocks of approximately two weeks (allowing for the
desiccation, compaction and cracking of the slime to reduce the ratio between
horizontal and vertical permeability).
A further approach is the cycloned deposition method (e.g. applied at study site I),
which involves the separation of the coarser tailings material prior to the deposition,
whereby the tailings are sprayed with a canon at high pressure into the pond of the
impoundment. This type of deposition results in a zone of coarse solids relatively free
of excess solution and a pool of solution including fine solids, which may not drain
readily and, therefore, consolidate. Daniel (1993) reports that such cycloned
operations require detailed planning and management if the system is to work
properly and is extensively discussed in his textbook.
This study has shown that there is a total number of 272 gold mine tailings dams
covering an area of about 181 km2 in South Africa, of which most were
decommissioned about 30 to 50 years ago (Funke, 1990). For comparison, according
to the international study Tailings Dam Incidents: 1980-1996, it is assumed that there

are a total of approximately 300 tailings dams in Canada, 400 in Australia and 500 in
Zimbabwe (Mining Journal Research Services, 1996).
The tailings dam or pond remains almost saturated during the operational phase, as
well as for some time after closure. This is mainly due to the particle size distribution
(fine sand and coarse to medium silt) of gold mine tailings, which allows water
retention by capillary forces. After the slurry deposition has been completed, the
phreatic (line of zero pore water pressure) surface slowly subsides at a rate which
depends on the conditions of the seepage collection system and the size of the
impoundment. Reported subsidence of the phreatic surface is generally about 0.3
m/year (Blight & Du Preez, 1997).
Figure 2.2 shows the position of the phreatic surface within the dam wall during
operation and after decommissioning (closure). It is important to note that the
majority of tailings dams in South Africa were constructed without seepage collection
systems.
operation (pond) /' " Phreatic surface••• /' ".....< ~~ I"--..,< ~ ..,; ~--..~~ / "~ '}; \: ~" "::all I"" ...., ...• ~~ ~~ "--< ~""l ~ ~" '4 --:. •.,.... "'JI - •.. ....; ~~ I"~/C 'a, ::M \ ~ '4 --:. ~I~., "'lI .-1 ....•~-~ ....• ~~ """
A la" ::M ~ ~ '4 ~ ~ ~ ~ ...., -~-i ...., ~""'li ~ " """
/1 Iii ~ ~ -- ~ ~ ~ 1':1I hi 'lIIl ..• ~, 1""-/'1~1~ , ~ la ~ ~ ~ ~ " I .•••••••• ..., •••• '.:Ii " , '''''''...
':lit.
Seepage collectionsystem
Tailings dam afterdecommissioning
In hydraulically constructed tailings dams, the anisotropy coefficient or the ratio
between horizontal and vertical permeability, is higher than in mechanically deposited
and compacted dams, because the layered structure of hydraulically constructed
tailings dams is enhanced due to compaction. The anisotropy coefficient is usually
between 5 to 10, but can reach values of more than 200 in case of poor construction
(Williams & Abadjiev, 1997). Various factors influence the anisotropy coefficient
(after Fell et aI., 1992):
• Height of pond water table;
• Beach grain size segregation;
• Foundation permeability;
• Decreasing tailings permeability with depth as a result of compaction;
• Underdrainage systems.
A high anisotropy coefficient of most of the tailings dams results in a high phreatic
surface, which frequently leads to failure of the horizontal drain systems and seepage
at the slope surface. In turn, the seepage at the slope surface causes erosion and results
in a considerable risk increase regarding dam failure and contamination by acid mine
drainage and associated contaminants.
Some tailings dams contain built-in horizontal drainage systems, which are
ineffective, because the elevated phreatic surface cannot be effectively lowered.
Common practices when seepage on the dam slope occurs is to institute remedial
measures such as elevated horizontal drains, buttresses, horizontally drilled boreholes
from the slope toe, and cover and surcharge by cycloned tailings.
A new approach in South Africa could be the installation of vertical drains, which are
simple to construct in a ring-dyke impoundment. A comprehensive description of the
installation and function of vertical drains is given in Williams & Abadjiev (1997).

Van den Berg (1995) concluded that the seepage regime of tailings dams is controlled
by the anisotropy factor, which results from a system of close layering and shrinkage
cracks. Further factors include the tailings deposition cycle during the construction
phase of the tailings dam. Authors such as Van den Berg (1995); Rust, Van den Berg
& Jacobsz (1995) and Wagener, Van den Berg & Jacobsz (1997) have described
various approaches dealing with monitoring of the phreatic surface of tailings dams.
Once the anisotropy coefficient is known, a flow net can be calculated by applying the
relevant boundary conditions (Wagener et. aI, 1997). The interpretation of such a flow
net would provide useful information regarding the seepage regime in a tailings dam.
In general, seepage escapes from tailings impoundments through two typical
pathways:
Through the dam wall;
Through the foundation materials.
The quantity and rate of seepage is controlled by several factors, the most important
ones being the following (Wagener et aI., 1997):
Hydrogeological conditions of the impoundment foundation;
Hydraulic conductivity of the tailings material;
Hydraulic conductivity of the foundation;
Geometry of the impoundment and dam wall;
The design, construction and operation of the impoundment.
Owing to the complexity of the impoundment and the number of variables involved, a
comprehensive analysis of seepage losses from an impoundment is a complicated
exercise (Wagener et aI., 1997). Mathematical models, which apply the finite element
method, such as SEEP/Wand SAFE, are helpful tools for calculating the phreatic
surface and the seepage regime.
The concept of different zones of saturation has been utili sed at tailings ponds to
prevent seepage from reaching the water table. Seepage initially moves as an
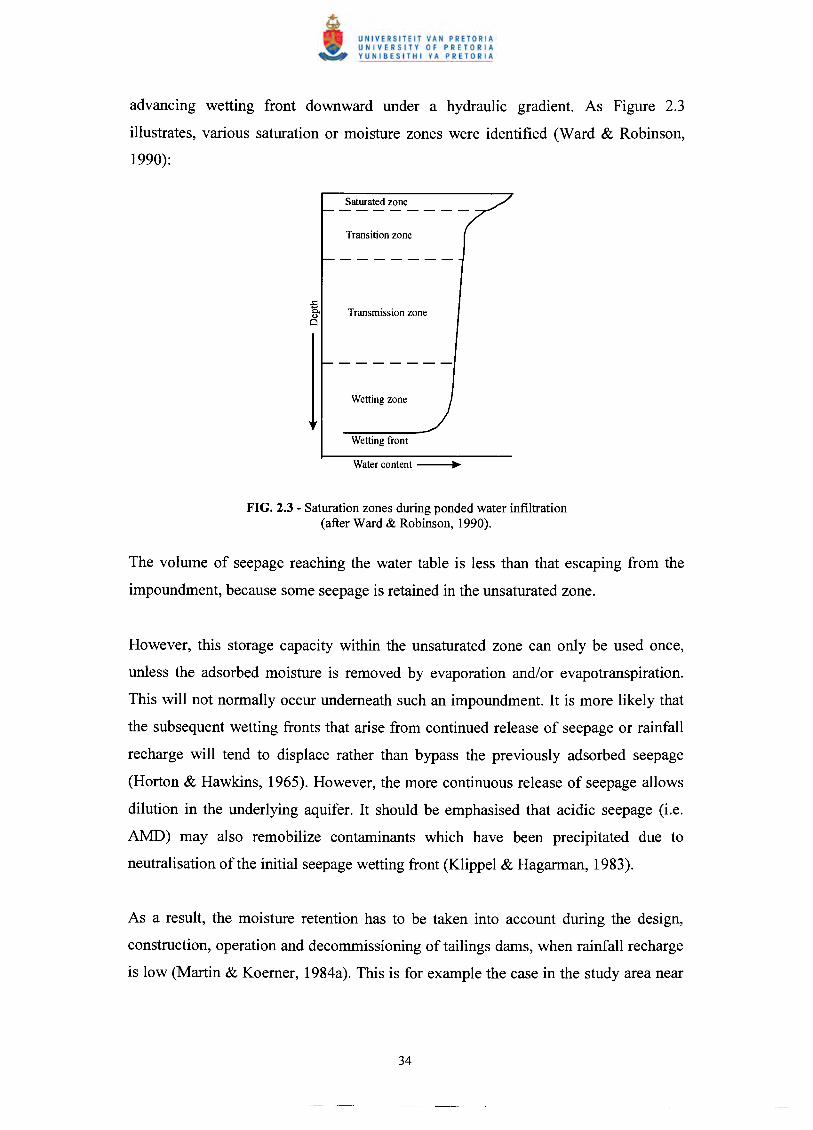
advancing wetting front downward under a hydraulic gradient. As Figure 2.3
illustrates, various saturation or moisture zones were identified (Ward & Robinson,
1990):
! Transmission zone
FIG. 2.3 - Saturation zones during ponded water infiltration(after Ward & Robinson, 1990).
The volume of seepage reaching the water table is less than that escaping from the
impoundment, because some seepage is retained in the unsaturated zone.
However, this storage capacity within the unsaturated zone can only be used once,
unless the adsorbed moisture is removed by evaporation and/or evapotranspiration.
This will not normally occur underneath such an impoundment. It is more likely that
the subsequent wetting fronts that arise from continued release of seepage or rainfall
recharge will tend to displace rather than bypass the previously adsorbed seepage
(Horton & Hawkins, 1965). However, the more continuous release of seepage allows
dilution in the underlying aquifer. It should be emphasised that acidic seepage (i.e.
AMD) may also remobilize contaminants which have been precipitated due to
neutralisation of the initial seepage wetting front (Klippel & Hagarman, 1983).
As a result, the moisture retention has to be taken into account during the design,
construction, operation and decommissioning of tailings dams, when rainfall recharge
is low (Martin & Koerner, 1984a). This is for example the case in the study area near

Johannesburg. A further problem is the development of a contaminated groundwater
mound underneath an impoundment.
The development of a groundwater mound as a result of such wetting zones is a
typical phenomenon in connection with the disposal of tailings slurry (solid-water
ratio 1:1 to 1:4.5). When seepage rates change, unsteady or transient phases exist as
the distribution of moisture and pressure within the unsaturated zone adjust to the new
hydraulicalloading (Martin & Koerner, 1984b). Increasing seepage rates will cause a
wetting front to move from the pond towards the saturated zone (i.e. water table),
leading to the formation of a groundwater mound (Figure 2.4).
The groundwater mound may eventually come into contact with the base (Phase III)
of the pond or impoundment if the groundwater table is shallow or the permeability of
the underlying aquifer is low. However, this might only occur after an extended
period of time, because a considerable quantity of seepage is required to saturate the
soil when the soil has a low initial moisture content or when the water table is deep. If
the rate of seepage is limited, or the lifetime of the impoundment is short, then Phase
III might never fully develop.
Therefore, it is necessary to investigate the first two transitional phases that precede
development of continued saturation by seepage. In Phase I, a wetting front advances
from the impoundment towards the water table. This front may be saturated or
unsaturated, depending on whether the impoundment is lined or unprotected (no
seepage control measures), and also whether air is freely displaced by the seepage. In
Phase II, the positive pressure mound forms and rises. If the initial wetting front was
saturated, this occurs rapidly, as a pressure wave moves up from the water table and
changes the pressure conditions from positive to negative (suction). In contrast, if the
initial wetting front was unsaturated, a further delay of Phase III occurs as continued
seepage is diverted to form the rising groundwater mound. A post-closure scenario
with decrease in seepage escape from the impoundment will result in desaturation and
the recession of the groundwater mound as shown in Phase IV (Martin & Koerner,
1984b).
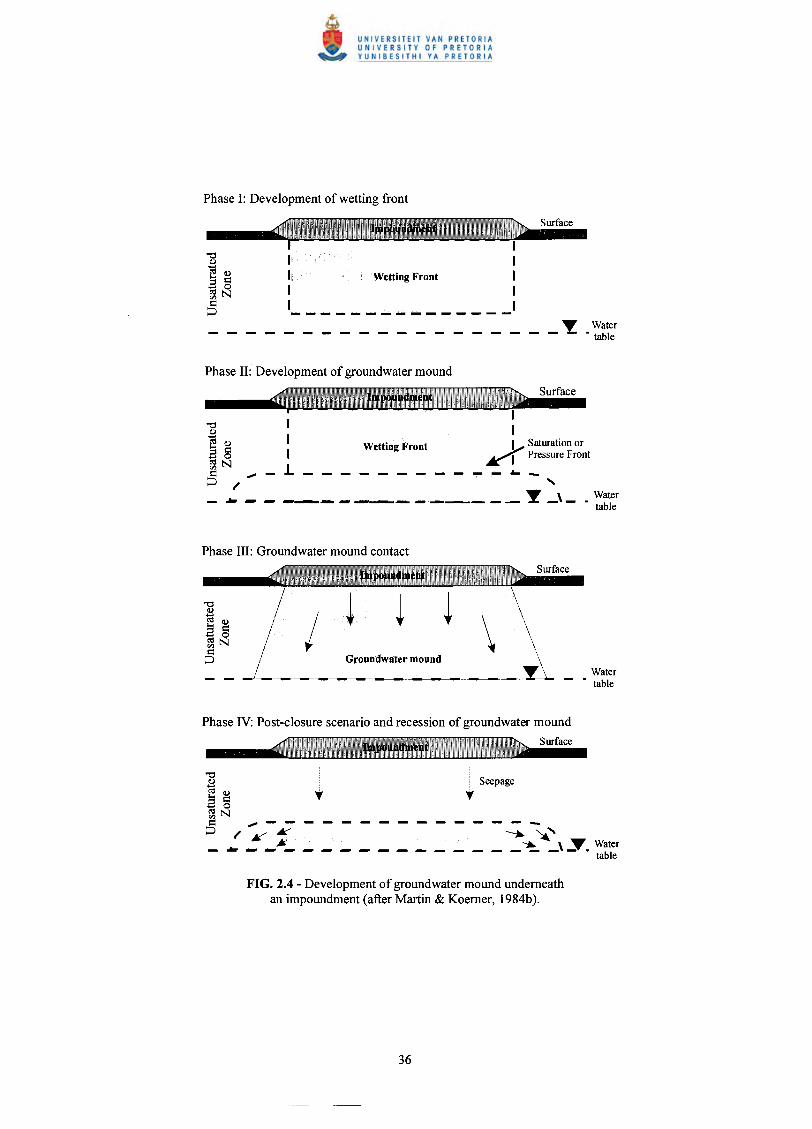
,I
Wetting Front ,,------------- - -'
Water• table
I,,L _
,,, Saturation or
~ Pressure Front
Water• table
/ / ~ \ \/ Groundwater mound \I ••• \_!_---~-~---_.------~--~~ Water
• table
Phase IV: Post-closure scenario and recession of groundwater moundSurface
i Seepage,.- ------.. ~ ..•..•.. \ Y Water- - - - - • table
FIG. 2.4 - Development of groundwater mound underneathan impoundment (after Martin & Koerner, 1984b).

2.5.3.2 Seepage control measures
Typical pollution control measures at tailings dams are:
• Toe dams;
• Penstock systems;
• Drain or seepage collection systems.
Toe dams considerably reduce the immediate pollution potential of a tailings dam or
sand dump by collecting run-off and seepage water and retaining it for evaporation.
The design and construction of older mine residue deposits did not include toe dams.
On modem tailings dams, excess water is controlled by penstock systems, where
water is drawn off from the pond and returned to the plant for re-use. Trenches are
also provided in order to drain seepage to the penstock pumps (Steffen, Robertson &
Kirsten, 1988).
In the past, so-called paddocks were used at reclaimed sites in South Africa to prevent
surface run-off from entering streams, dams and other reservoirs. Paddocks consist of
low slurry dam walls (approximately 1-2 m height), which are build in squares of a
few metres diameter in order to capture rainwater on site to prevent surface-run-off.
However, the use of paddocks increases the infiltration rate into the subsurface and,
therefore enhances the dispersion of contamination in soils and groundwater
underneath the site.
In the 1970s, various mining companies started to reclaim tailings. The recovered
tailings material is reprocessed to extract gold, which may be present in economically
viable quantities (currently 0.4 g Au/ton according to Creamer, 1998). A common
reclamation approach is jetting the tailings dam with high pressure water, thereby
liquefying the slime. The slime then drains to the pump station, from where it is
pumped to the processing plant.

Approximately 70 tailings dams have been reclaimed in the Gauteng Province,
resulting in nearly 13 km2 of land becoming available for potential development
(Rosner, Boer, Reyneke, Aucamp & Vermaak, 1998). Most of the reprocessed tailings
material has been disposed onto large dams close to Brakpan in the East Rand.
The author found that for the majority of the investigated sites the tailings material
was incompletely reclaimed and significant quantities of residual tailings remained on
the sites. Such sites or areas are often devoid of any vegetation or show only a poor
vegetation cover and are also known as abandoned mined lands (Sutton & Dick,
Owing to the inadequate vegetation cover on these abandoned mme lands, the
combined effects of acid mine drainage and excessive erosion often occur, causing
major environmental problems. The EPA (1976) reported that the erosion rate is
approximately 100 times higher for such abandoned mined lands compared to
similarly located forest lands.
The need for development of low-cost housing in highly urbanised areas such as near
Johannesburg is becoming increasingly important. Often the required land is situated
close to operating mines or on sites of previous mining and mineral processing
activities such as tailings dams. Hence, some degree of rehabilitation for
contaminated land would be required after complete reclamation has taken place, in
order to enable a safe future land use.
HYDROGEOCHEMICAL PROCESSES
WEATHERING PROCESS OF TAILINGS
Acid mine drainage is the main environmental effect of mining operations where a
sulphide-bearing ore is processed. Acid mine drainage is characterised by low pH and

often contains high concentrations of dissolved heavy metals and salts which exceed
drinking water standards up to a toxic level. In addition, the gold-bearing
conglomerates of the Witwatersrand Basin contain radioactive minerals such as
uraninite (Adamson, 1973), resulting in elevated concentrations of uranium and its
daughter products in the tailings (De Jesus et aI., 1987).
The first studies dealing with acid mine drainage processes were conducted in the
early 1980s at Elliot Lake in Canada (Cherry, Blackport, Dubrosvsky, Gilham, Lim,
Morin, Murray, Reardon & Smith, 1980; Blair, Cherry, Lim & Vivyurka, 1980;
Morin, 1983; Blowes, 1983; Dubrosvsky, Cherry, Reardon & Vivyurka, 1984a;
Dubrosvsky, Morin, Cherry & Smyth, 1984b; Dubrosvsky, 1986; Morin, Cherry,
Dave, Lim & Vivyurka, 1988a and Morin, Cherry, Nand, Lim & Vivyurka 1988b).
Since then many researchers world-wide have focussed on the processes and
environmental impacts related to acid mine drainage and associated contaminants.
The processes that generate acid mine drainage are natural, but they are enhanced by
mining operations and can produce large quantities of contaminated seepage. Acid
mine drainage originates from the rapid oxidation of sulphide minerals such as pyrite
and occurs where sulphide minerals are exposed to oxygen.
Additionally, the oxidation of sulphide minerals is greatly enhanced by the catalytic
activity of micro-organisms typically associated with sulphide-bearing ore and the
residues of mining operations, known as tailings. Although the knowledge about the
acid generating process is limited, several influencing parameters are known to
control the production of acid mine drainage and are discussed in the following
paragraphs.
It is apparent that tailings dams represent extremely complex and variable systems,
because the deposits differ in design, mineralogical and geochemical composition and
in geotechnical and hydraulical properties. Additionally, variations in the nature of
tailings material occur between different zones within each tailings dam as a result of
changes in the ore grade during mining operations and fluctuations in the
metallurgical extraction efficiency, and the metallurgical processing.

The release and migration of potentially toxic heavy metals and radionuclides
strongly depend on the acidification process of tailings and soils. The low pH results
from the oxidation of sulphide minerals in the unsaturated zone of the tailings dams.
Ferguson & Erickson (1988) classify and describe the factors controlling acid mine
drainage formation into primary, secondary and tertiary factors. The primary factors
are those directly involved in the generation of acidity. Secondary factors control the
consumption or alteration of the products from the acid generation reactions, while
tertiary factors reflect the physical characteristics of the tailings material that
influence acid production, migration and consumption. The authors also describe a
downstream factor, which concerns the affected area underneath and downstream of
the tailings dam.
The primary factors comprise the availability of sulphide minerals such as pyrite,
oxygen, water, and catalysing bacteria, which act as accelerators in the acid
production process.
The oxidation of pyrite, the most common sulphide mineral in tailings dams in South
Africa, can be expressed in the following reaction:
This reaction releases Fe2+, soi- and H+ to the tailings pore water. Subsequently,
Fe2+ released from the sulphide oxidation can be further oxidised to Fe3+by:
The Fe3+ resulting from Reaction 2.4 may react to further oxidise pyrite:

Alternatively, depending on the pH in the aqueous solution, the Fe3+ may be
hydrolysed and precipitated as Fe(OH)3 or a similar ferric hydroxide or hydroxy-
sulphate (Blowes, 1995):
The sequence of reactions above may consume most of the primary sulphide minerals
in the upper unsaturated surface layer (up to 2-3 m depth) of the tailings dam. These
reactions also result in the accumulation of secondary minerals of the ferric oxy-
hydroxide group. These secondary minerals, most commonly amorphous ferric
hydroxyde [Fe(OH)3], goethite [a-FeOOH] and ferrihydrite [FelO015 . 9 H20], usually
replace the primary sulphide minerals, resulting in thick alteration rims which
surround an inner core of unweathered sulphide minerals (Blowes, 1995). It is
important to note that colloidal Fe and Mn co-precipitates can adsorb significant
amounts of heavy metals such as Co, Cr, Cu, Mn, Ni, Mo, V and Zn (Alloway, 1995).
Furthermore, these relatively slow reactions comprise the initial stage in the three-
stage acid mine drainage production process described by Kleinmann, Crerar &
Pacelli (1981):
pH around the tailings particles is moderately acidic (pH> 4.5).
pH declines and the rate of Fe hydrolysis decreases providing
ferric iron as an oxidant.
Rapid acid production by the ferric iron oxidant, which
dominates at low pH, where ferric iron is more soluble.
Stage 1:
Stage 2:
The replenishment of oxygen within the tailings material from the atmosphere is
probably required to sustain the rapid oxidation rates catalysed by bacteria of Stage 3
as described above.
The rate of ferrous iron oxidation at low pH would be too slow to provide a sufficient
concentration of oxidant, without catalysis of autotrophic micro-organisms such as
Thiobacillus ferrooxidans and Thiobacillus thiooxidans (Singer & Stumm, 1970).

Consequently, the final stage of the acid mine drainage process only occurs when the
micro-organisms become established, which requires a certain biogeochemical milieu.
Abiotic and biotic oxidation of sulphide minerals is a function of the prevailing pH
within the tailings dam. At pH > 5, biotic sulphide oxidation occurs at a slower rate
than abiotic oxidation. At pH:::::3, the biotic oxidation dominates by being four times
faster than the abiotic reaction. At pH ~ 2.5, the reaction is considered to be fully
biotic due to a maximum oxidation rate of Thiobacilli (Kolling, 1990).
The bacteria mentioned above can attack most sulphide minerals under suitable
conditions (Duncan & Bruynesteyn, 1971 and Lundgren, Vestal & Tabita, 1972) and
increase the oxidation rate up to several orders of magnitude (Singer & Stumm, 1970;
Silver, 1987 and Brock & Madigan, 1991). Some reactions for bacteria and ferric ion
with various sulphide minerals are summarised in Ferguson & Erickson (1988).
Favourable conditions for the growth and efficiency of such bacteria have been
described as follows (after Mitchell, 1978 and Kolling, 1990):
• Optimal pH range: 2.4-3.5;
• Large specific surface area requiring a small particle size;
• Temperature between 30°-35°C;
• Sufficient nutrients, e.g. for Thiobacillus ferrooxidans: organIC carbon, Iron
sulphate, pyrite, calcium nitrate and ammonium sulphate;
• Sufficient oxygen flux;
• Drainage system to transport the reaction products.
Water is a key parameter in the generation of acid mine drainage, acting as a reactant,
as a reaction medium, and as the transporting medium. The first two processes can be
considered as primary factors, as discussed by Smith & Shumate (1970) and Morth,
Smith & Shumate (1972). Thus, a controlling parameter for bacteriological activity is
the moisture content within the tailings dam (Belly & Brock, 1974 and Kleinmann et
aI., 1981). Consequently, pore water or moisture provides the medium to transport

large quantities of salts, heavy metals, radionuclides and other toxic substances into
the subsurface underneath the tailings deposit.
Another aspect is the crystal structure of relevant sulphide mineral phase, because
various structures (such as in pyrite, marcasite) result in different oxidation rates
(Hawley, 1977). As a result, heavy metals and radionuclides can be released from the
sulphide mineral by three different processes, according to Silver (1987):
• Direct oxygen oxidation;
• Bacterial oxidation;
• Acidified ferric sulphate dissolution.
Sulphide minerals often contain significant concentrations of various toxic heavy
metals (Table 2.5), which have initially been used to establish genetic relationships
among different ore types (Vaughan & Craig, 1978) and as an indicator to trace
pollution caused by acid mine drainage.
The most important secondary factors comprise the presence of buffer minerals such
as calcite (CaC03) and dolomite (CaMg(C03h), which neutralise formed acids (also
known as liming if added to acid soils to increase the soil pH). The reaction, where
acid produced by the oxidation of pyrite is neutralised by calcite can be expressed as
(after Williams, Rose, Parizek & Waters, 1982):
Fe82(S) + 2 CaC03(s) + 15/4 02(g) + 3/2 H20 =>
Fe(OHh(s) + 280/- + 2 Ca2+ + 2 C02(g)
As a result of Reactions 2.3 to 2.6 the dissolved concentrations of sulphate and Fe
correspond to the stoichiometry of the pyrite oxidation reaction, although most Fe is
commonly precipitated as FeOOH (Appelo & Postma, 1994).

According to Reaction 2.7 two mols of CaC03 equivalent to 200 g are required to
neutralise one mole of pyrite or 64 g of S. However, this reaction assumes that
gaseous carbon dioxide (C02) will entirely exsolve, and may underestimate the fact
that some C02 will dissolve and contribute to the acid potential of the solution. As a
result, Cravotta, Brady, Smith & Beam (1990) modified the reaction to demonstrate
the maximum acid potential:
FeS2(S) + 4 CaC03(s) + 15/4 02(g) + 7/2 H20 =>
Fe(OHh(s) + 2 sol + 4 Ca2+ + 4 HC03-
In this reaction, four moles of CaC03 are required to neutralise the acids produced by
the oxidation of one mole of pyrite. On average, the Witwatersrand gold-bearing
quartz conglomerates contain 30-50 kg pyrite per ton (Hallbauer, 1986).
Consequently, about 134 kg oflime (CaC03) is required to neutralise 40 kg of pyrite,
containing about 21 kg of S in one ton of the mined ore.
The rapid equilibrium controlled dissolution of carbonate minerals (Reactions 2.7 and
2.8) results in a decrease of the acid potential, which is controlled by four key
parameters:
1. Partial pressure of C02;
2. Temperature;
3. Mineral type;
4. Concentration of dissolved constituents.
The reaction rate of the interaction between sulphide and carbonate minerals
determines the seepage water quality and consequently the soil quality, which can
range from high pH and low sulphate concentrations in carbonate dominated materials
to low pH (pH ~ 2-3) and high sulphate concentrations (> 1000 mg/l) in a carbonate-
deficient environment (Caruccio, 1968).
Other secondary factors comprise the weathering of oxidation products by further
reactions. This includes ion exchange onto clay minerals, the precipitation of gypsum
(CaS04 . 2 H20, Figure E.12), and the acid-induced dissolution of other minerals.
Ferguson & Erickson (1988) found that these reactions change the quality of seepage,
often by adding various other elements (e.g. AI, Mn, Cu, Pb, Zn) and replacing Fe
with Ca and Mg contained in carbonates.
Tertiary factors are characterised by the properties of the tailings material and the
hydraulic conditions within the deposit. Important physical parameters are particle
size, weathering tendency and the hydraulic characteristics of the tailings material.
The rate of pyrite oxidation and thus, acid generation is a function of the specific
surface of the particles, since this parameter reflects the amount of sulphide exposed
for reaction (Ferguson & Erickson, 1988).
Coarse-grained material is typically found in sand dumps and, as a result of greater
oxidation depth, enables a greater oxygen flux and hence more material is exposed for
active acid generation than in the fine-grained material contained in tailings dams. In
very coarse material, typically found as waste rock dumps, oxygen transport is
supported by wind speed, changes in barometric pressure and internal dump heating
originating from the exo-thermal oxidation reaction.
Another aspect is the physical weathering tendency of the tailings material. This
factor may also support the control of hydraulic properties such as permeability and
influences the oxygen and pore water migration. A decrease in permeability will
result in a decrease in acid generation. However, experience in North America (e.g.
Dubrovsky et aI., 1984a/b; Blowes, Cherry & Reardon, 1988 and Mills, 1993), Europe
(e.g. Ferguson & Erickson, 1988; Mende & Mocker, 1995) and South Africa (e.g.
Forstner & Wittmann, 1976 and 1981; Steffen, Robertson & Kirsten, 1988; Funke,
1990 and Cogho et aI., 1992) has clearly shown that, even decades after
decommissioning of mining operations, significant loads of salts, heavy metals and in
some cases radionuclides are released from such deposits, unless appropriate pollution
control and rehabilitation measures (e.g. cover and/or drainage systems) have been
taken place.

A further tertiary factor is the pore water flow throughout the tailings dam. Significant
acid generation within the saturated zone may not occur because of a limited oxygen
flux (Ferguson & Erickson, 1988). However, a fluctuating phreatic surface level
within the tailings dam, which is particularly common in operating tailings dams and
may occur even after decommissioning in connection with rainfall events, may result
in periodically wet and dry zones which allow further oxidation and acid generation
during fluctuations in the water table.
Consequently, active acid generation in waste rock dumps may occur throughout the
dump rather than being limited to the surface layer; whereas in tailings dams the
active acid generation area is usually limited up to a depth of 2-3 m in South Africa
(Marsden, 1986).
The acid generating process not only affects the mechanisms within the tailings dam,
but also influences natural processes underneath and downstream of the tailings dam.
Ferguson & Erickson (1988) reported that the dissolved oxygen content and pH of the
water may decrease downstream from tailings dams as a result of dilution effects and
the presence of acid neutralising minerals in the riverbed. Further reactions with
carbonates rise the pH in the water to 7-8. While most of the metals will precipitate
under these pH conditions, salts such as calcium sulphate (PbS04, RaS04 and BaS04
are virtually insoluble) remain dissolved in the aqueous phase.
The phase diagram in Figure 2.5a illustrates the Eh and pH stability fields for some
common aquatic environments. Figure 2.5b shows the stability relationships between
iron oxides, sulphides and carbonates in the aqueous phase under variable Eh and pH
conditions (after Garrels & Christ, 1965).

+1.0 ,
i +1.0, """ ~O
+0.8 • • ••• ~I +0.8~~ ",',;",.'>"q bJ)~. ~ '<0" ~<q' .51~ ,~~ ~<C' .>::3+0.6· ~ or, "~~iY :s! +0.6
C1+0.4 • ~S00 k,~, +0.4
+0.2 •~, <%.. ••.
+0.2;;; '4;-
~kQ O,-S.-..;,
g 00' ,,~~,~~ =e- 0.0-= ", {j>0~ -=f;Iil-0.2 ' 't!/) ~ f;Iil
-0.2", Ii.PkO~ '-'te;.
, '<t/ -1~<.0 "~% ~-0.4 ""r' , -0.4<lft-q~. ",
)( tof... ~
<.- '" .•.•" .. bJ)
-0.6"';,t..I.I; Stci6 ..••••.•• :fQe c"I)-cQ C
-0.6'l-o.?~74~....• Tl::l
"0
-0.8 & -0.8
-1.0 ~ -1.00 i 4 6 8 10 12 14 0 2
pH6 8
pH
Eh-pH fields for some common aquaticenvironments (after Garrels & Christ, 1965).
Eh-pH stability relationships between ironoxides, sulphides and carbonates in theaqueous phase at 25°C and 1 atmosphere totalpressure. Total dissolved sulphur = 10-6
molll; total dissolved carbonate = 10 molli.Solid lines show the boundaries plotted forconcentrations (strictly activities) ofdissolved species at 10-6 mol/I, fainter linesshow boundaries at 10'4 molll (after Garrels& Christ, 1965).
1. Reactions as a function of pH, e.g. the precipitation of aqueous ferric ions as
ferric oxide or haematite:
2. Reactions as a function of Eh, e.g. the oxidation of aqueous ferrous ions to
ferric ions:
3. Reactions as a function of both Eh and pH, e.g. the oxidation of ferrous ions
and their precipitation as ferric oxide (haematite):
4. Reactions as a function of the concentration of ionic species, and ofEh and/or
pH, e.g. the precipitation of ferrous ions as siderite (FeC03)' Note that
diagrams have to be plotted for specific anion concentrations or activities:
Iron is stable as Fe2+ and Fe3+under acidic conditions, whereas Fe3+ dominates under
oxidising conditions. Mineral precipitation is primarily induced by increasing pH,
although the Fe3+/Fe203 boundary can also be crossed by changes in Eh at constant
pH conditions. The ferrous minerals pyrite, siderite and magnetite are stable under
conditions of negative Eh values (reducing conditions). This stability is mainly a
function of the concentrations of total dissolved carbonate and sulphur. Pyrite is
precipitated even if the dissolved concentration of S is low, but siderite shows only a
small stability field, although the concentration of total dissolved carbonate is six
orders of magnitude greater, reflecting the much lower solubility product of FeS2
(pyrite) compared with FeC03 (siderite).
It is also evident from Figure 2.5b that relatively small shifts in Eh or pH can have a
major effect on the solubility of Fe. Thus, when pyrite is exposed to oxygenated
water, Fe will be readily dissolved. This fact is of major importance to the formation
of acid mine drainage from tailings.
It can be concluded that solubility and mobility of trace elements are controlled by
four main influence parameters, according to Forstner & Kersten (1988):
Decrease in pH - acidity poses problems in all aspects of metal mobilisation in the
environment, e.g. toxicity of drinking water, growth and reproduction of aquatic
organisms, increased leaching of nutrients from the soil resulting in reduction of
soil fertility, increased availability and toxicity of metals in sediments (Fagerstrom
& JemelOv, 1972). In South Africas mining areas, acid mine drainage is most
probably the main parameter affecting the mobility of toxic metals in surface
waters.
Increased salt concentrations - such as sulphate and chloride due to the effect of
competition on sorption sites on solid surfaces and by the formation of soluble
chi oro- complexes with some heavy metals.
Changing redox conditions - e.g. after surface deposition of anoxic mine tailings.
It can expected that changes from reducing to oxidising conditions, which involve
oxidation of sulphides and subsequently a shift to more acid conditions, will
increase the mobility of typical chalcophilic3 elements such as Cu, Pb and Zn.
Increased occurrence of natural and synthetic complexing agents - can form
soluble metal complexes with trace elements that would usually be adsorbed to
solid matter.
The predominance of simple mineral solution equilibria explains the concentrations of
major elements in the surface environment, but the hydrogeochemical properties of
many trace elements are more complex and are also determined by other factors such
as co-precipitation, sorption effects and interaction with organic matter.
2.7 OCCURRENCE OF TRACE ELEMENTS IN SOIL AND ITS
TOXICITY
Climatic and soil factors influence the speciation and mobility gradient of trace
elements such as heavy metals in soils, and therefore control their bio-availability
(Kabata-Pendias, 1984). However, total trace element concentrations in a soil are a
poor reflection of trace element bio-availability (Pierzynski, Sims & Vance, 1994)
where the bio-available fraction refers only to a certain portion of the total trace
element concentration. Trace elements occur in different adsorbing phases in soils and
these phases can be investigated by performing special leaching tests such as
sequential extraction tests. The following adsorbing phases are distinguished for trace
elements, i.e. Cd, Cu, Cr, Ni, Pb, and Zn (after Kabata-Pendias, 1994) and an example
is illustrated in Figure 2.6:
3 Chalcophilic elements are elements with a strong affinity for sulphur, characterised by sulphide oreminerals such as pyrite. Examples are: As, Fe, Cd, Cu, S, Se, Pb, Zn (Whitten & Brooks, 1972).
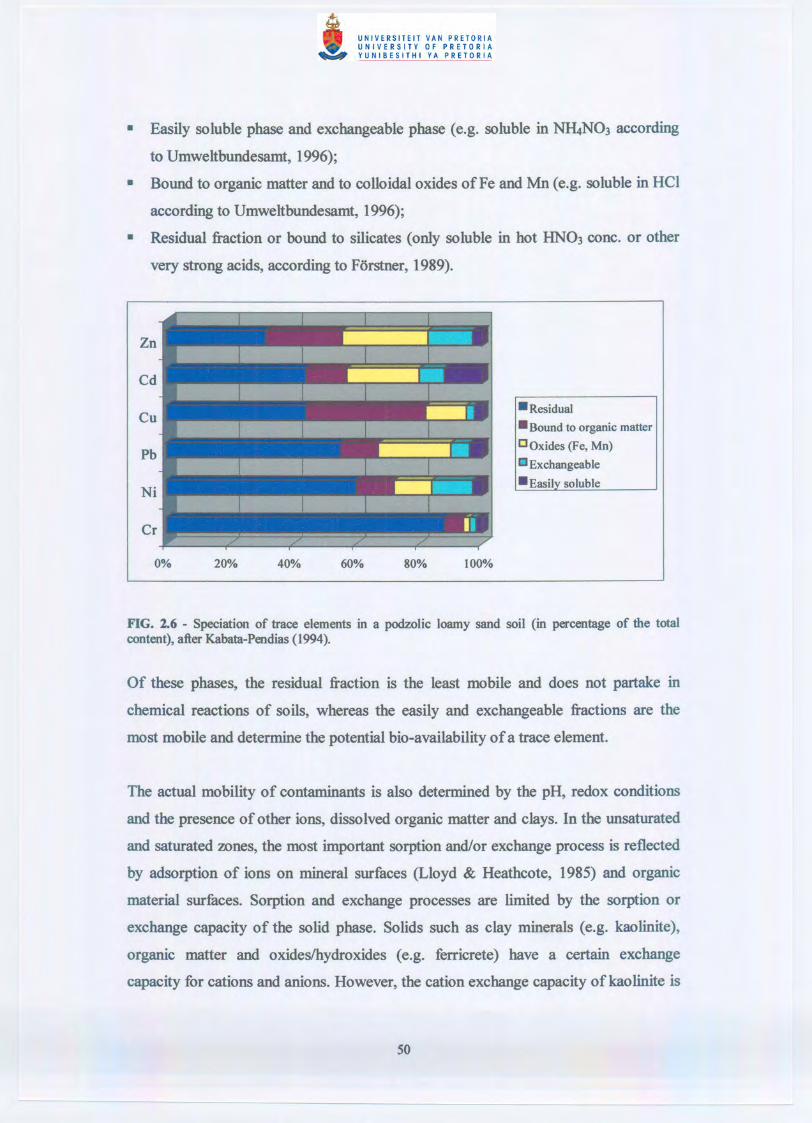
• Easily soluble phase and exchangeable phase (e.g. soluble in Nl4N03 according
to Umweltbundesamt, 1996);
• Bound to organic matter and to colloidal oxides of Fe and Mn (e.g. soluble in Hel
according to Umweltbundesamt, 1996);
• Residual fraction or bound to silicates (only soluble in hot HN03 cone. or other
very strong acids, according to Forstner, 1989).
-Residual- Bound to organic matterCOxides (Fe, Mn)• Exchangeable-Easilv soluble
FIG. 2.6 - Speciation of trace elements in a podzolic loamy sand soil (in percentage of the totalcontent), after Kabata-Pendias (1994).
Of these phases, the residual fraction is the least mobile and does not partake in
chemical reactions of soils, whereas the easily and exchangeable fractions are the
most mobile and determine the potential hio-availability of a trace element.
The actual mobility of contaminants is also determined by the pH, redox conditions
and the presence of other ions, dissolved organic matter and clays. In the unsaturated
and saturated zones, the most important sorption and/or exchange process is reflected
by adsorption of ions on mineral surfaces (Lloyd & Heathcote, 1985) and organic
material surfaces. Sorption and exchange processes are limited by the sorption or
exchange capacity of the solid phase. Solids such as clay minerals (e.g. kaolinite),
organic matter and oxideslhydroxides (e.g. ferricrete) have a certain exchange
capacity for cations and anions. However, the cation exchange capacity of kaolinite is

very low if compared to other clay minerals such as montmorillonite or vermiculite
(Table 3.5).
For example, the soil organic matter content can account for 20-70 per cent of the
cation exchange capacity of soils (Pierzynski et aI., 1994). However, it must be
stressed that the highly weathered soils of the study area generally contain negligible
contents of organic matter compared to soils of humid regions, and, thus, have
generally a low contaminant retention capacity4. The organic matter content depends
on various factors such as soil type and structure, water holding capacity, nutrient
availability and soil pH.
Alternatively for the estimation of bio-availability, a transfer coefficient is available,
referring to the contaminant (mostly metals) concentration in the plant relative to the
total concentration in the soil. It should be noted that chemical plant analysis was not
conducted in this study as a result of a very poor vegetation cover for most of the
sites. Alloway & Ayres (1996) presented generalised transfer coefficients for the soil-
plant system, which are listed in Table 2.7.
TABLE 2.7 - Transfer coefficients of metals in the'1 1 (ft All & A 1996)SOl -plant system a er oway. lYres,
Element Transfer
Coefficient
As 0.01-0.1
Cd 1-10
Co 0.01-0.1
Cr 0.01-0.1
Cu 0.01-0.1
Hg 0.1-1
Ni 0.1-1
Pb 0.01-0.1
Se 0.1-10
Zn 1-10
4 The typical range of organic matter in agricultural soils varies generally between 1.5-4 per cent (dryweight), where about 58 per cent of the organic matter is accounted for organic carbon (Scheffer-Schachtschabel, 1984).

The transfer coefficients are based on root uptake of metals, but it should be realised
that plants can accumulate relatively large amounts of metals by foliar adsorption of
atmospheric deposition on plant leaves. In addition, soil pH, organic matter content
and plant genotype can have significant effects on metal uptake. From Table 2.7 it is
evident that Cd, Se and Zn have the highest transfer coefficients (maximum
accumulation by a factor of 10), which is a reflection of their relatively poor sorption
in the soil. In contrast, metals such as Cu, Co, Cr and Pb have low coefficients
because they are usually strongly bound to soil colloids (Alloway & Ayres, 1996).
Substances are defined as toxicants if they show harmful effects to living organisms
(Moore & Ramamoorthy, 1984 and Morel & Hering, 1993). Environmental data in
relation to hazards for man, animals and plants should be interpreted in terms of bio-
availability, i.e. an indication of how easily contaminants could become incorporated
into living organisms via various pathways such as air, water and solids.
There are two primary reasons for concern about elevated concentrations of trace
elements in soils and the aquatic system. Firstly, increased human and animal
exposure to the contaminants can occur through food chain transfer, ingestion of
wind-blown dust, or direct ingestion of affected soil or water. A study in the USA has
shown that persons living downwind of an old smelter site could consume at least 50
per cent more Pb and Cd by eating some of their home-produced food items than by
eating comparable items, purchased in a control area (Laegerwerff & Brower, 1974).
The second reason for concern relates to the phytotoxic potential of certain trace
elements, which can limit biomass production. This inhibition of plant growth can
have direct negative effects, such as the limitation of crop yields. A poor vegetation
cover due to phytotoxic effects of trace elements results in a higher erosion rate by
wind and water, which further disperses the contaminants and increases the
probability of human exposure via wind-blown dusts (Pierzynski et aI., 1994). In
addition, poorly vegetated soils in fairly flat areas are generally characterised by
increased rainfall recharge, resulting in groundwater pollution and leaching of
nutrients, thus a reduction of soil fertility. Acid soil conditions such as those within

the study area would allow only acid-tolerant plants to survive. A list with seeds and
plants usable for revegetation is provided in Adamson (1973).
The most phytotoxic metals for both plants and several micro-organisms are Hg, Cu,
Ni, Pb, Co, Cd, and possibly Ag, Be and Sn (Kabata-Pendias, 1994), but it depends on
soil parameters such as soil pH, the plant species and growing conditions.
Soil and groundwater protection is an international concern. Particularly in South
Africa where the predicted shortage of surface water resources to meet future
demands and the growing costs of developing these resources suggest that
groundwater resources could contribute to the national water supply more
significantly, either in association with surface water resources or as a sole source.
Due to the irreversible deterioration of soils by persistent contaminants and physical
erosion, policymakers and scientists in many countries are beginning to realise that
the soil environment in particular is a limited resource. Therefore a number of
countries and international institutions have developed policies to protect their soils
generically, or dependent on land use.
Until recently a classification system for contamination was used for soils which
comprised three indicative values: (A) the normal reference value; (B) the test value
to determine the need for further investigations; and (C) the intervention value above
which the soil definitely would require clean-up. This system has been superseded by
a health risk-based protocol, namely the Environmental Quality Standards for Soil
and Water or Dutch List (Netherlands Ministry of Housing, Physical Planning and
Environment, 1997). The Dutch List is accepted throughout the European Union.
These standards are based on ecological functions and comprise target and
intervention values for soils and are summarised in Table 2.8. All limits are valid for a
standard soil, consisting of 25 per cent clay and 10 per cent humus. The target value is
the maximum permissible content of selected metals (total concentration) in soils with
no risk for humans, plants, animals and ecological systems. Concentrations above the
target value would require further site investigations, whereas the intervention value
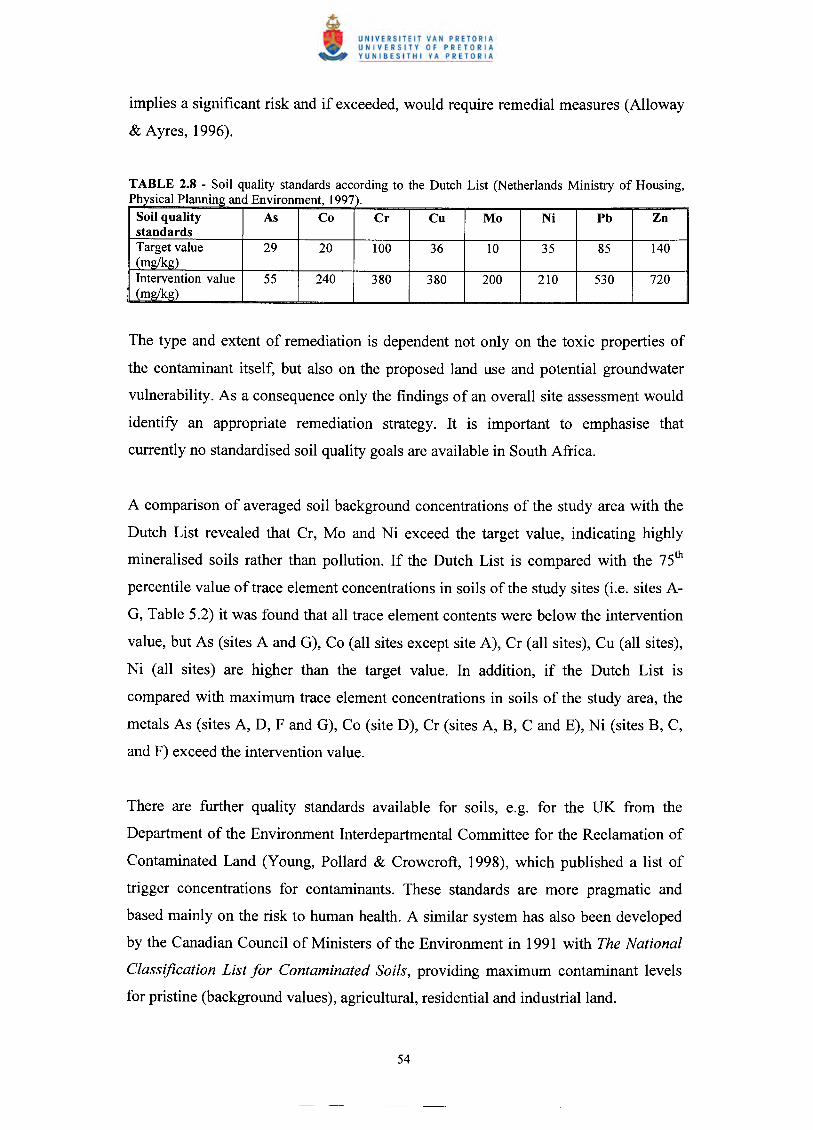
implies a significant risk and if exceeded, would require remedial measures (Alloway
& Ayres, 1996).
TABLE 2.8 - Soil quality standards according to the Dutch List (Netherlands Ministry of Housing,Ph sical Plannin and Environment, 1997).Soil quality As Co Cr Cu Mo Ni Pb ZnstandardsTarget value 29 20 100 36 10 35 85 140m
Intervention value 55 240 380 380 200 210 530 720m
The type and extent of remediation is dependent not only on the toxic properties of
the contaminant itself, but also on the proposed land use and potential groundwater
vulnerability. As a consequence only the findings of an overall site assessment would
identify an appropriate remediation strategy. It is important to emphasise that
currently no standardised soil quality goals are available in South Africa.
A comparison of averaged soil background concentrations of the study area with the
Dutch List revealed that Cr, Mo and Ni exceed the target value, indicating highly
mineralised soils rather than pollution. If the Dutch List is compared with the 75th
percentile value of trace element concentrations in soils of the study sites (i.e. sites A-
G, Table 5.2) it was found that all trace element contents were below the intervention
value, but As (sites A and G), Co (all sites except site A), Cr (all sites), Cu (all sites),
Ni (all sites) are higher than the target value. In addition, if the Dutch List is
compared with maximum trace element concentrations in soils of the study area, the
metals As (sites A, D, F and G), Co (site D), Cr (sites A, B, C and E), Ni (sites B, C,
and F) exceed the intervention value.
There are further quality standards available for soils, e.g. for the UK from the
Department of the Environment Interdepartmental Committee for the Reclamation of
Contaminated Land (Young, Pollard & Crowcroft, 1998), which published a list of
trigger concentrations for contaminants. These standards are more pragmatic and
based mainly on the risk to human health. A similar system has also been developed
by the Canadian Council of Ministers of the Environment in 1991 with The National
Classification List for Contaminated Soils, providing maximum contaminant levels
for pristine (background values), agricultural, residential and industrial land.

In this context, Table C.! (Appendix C) provides basic geochemical properties of
elements of concern and is also supplemented with target water quality standards for
drinking (domestic use) and irrigation (agricultural use) water, applied in South Africa
by the DWAF. In case a South African water quality standard deviates from
international standards, a further drinking water standard of the European Union
(guideline EU 98/83/EG) is also given.

A literature study, which included a request for data from various mining companies,
was undertaken in order to describe the contamination status at selected sites and
assess various attenuation and migration mechanisms of contaminants from gold
mining tailings and affected soils. All relevant information was entered into a
database-linked geographic information system, which allows the evaluation and
display of important features such as the spatial distribution of tailings dams,
reclaimed sites, surface water systems, and residential and industrial areas. The map
based on such a geographic information system, contains information gathered from
topographical and geological maps and technical drawings provided by mining
companies and a satellite image of the Johannesburg area (Figure E.13, Appendix E).
Based on this information, a selection of appropriate sites was carried out. A total of
eleven sites was identified as being suitable for the purposes of this study. Sampling
was conducted at seven of the eleven sites in order to close gaps in the database. All
the investigated sites were either partially or completely reclaimed for the recovery of
gold, and are situated above Karoo or dolomitic aquifer systems. Therefore, the
selected sites represent the most typical environmental conditions for tailings disposal
sites in South Africa.
Furthermore, all sites are within one km of either residential areas or areas of
agricultural land use. Most of the mine residue deposits have been present in the area
for decades. The study area is situated in the Gauteng Province and stretches from
Brakpan in the north to Springs in the south, with the exception of one site, being
situated close to Potchefstroom in the North-West Province. The case studies
comprised a visual site inspection of all sites with special reference to land use and
development of residential areas. Soil profiling to depths of 2.40 m was conducted
and samples were collected from the seven selected reclaimed sites and analysed with
respect to geotechnical, mineralogical and geochemical parameters. The main
objective of field and laboratory testing was to investigate the pathway of contaminant
migration in association with acid mine drainage from the tailings dams through the

unsaturated zone into the receiving groundwater system. A geochemical load index
was applied in order to indicate the worst-case scenario for the study sites. This index
comprises different contamination classes and thus, various risk levels for
groundwater resources and land development.
A total of 22 test pits (three per site, except at site F where four test pits were
investigated) were excavated by means of a Schaeff backactor on a Mercedes Unimog
truck (Figure E.8, Appendix E). The test pits were excavated to a maximum depth of
2.40 m in order to determine depth to bedrock, underlying pedological conditions and
the potential presence of a perched groundwater table. Samples for analyses were
taken at various depths: topsoil « 30 em depth) to water table or maximum test pit
depth. Pedological conditions were described using the protocol of the Soil
Classification Working Group (1991) and Jennings, Brink & Williams (1973). Soil
profiles are presented in Appendix A.
Each site has been described according to site characteristics (e.g. area, geology,
vegetation, reclamation status), geotechnical parameters, hydrogeological properties
and contaminant assessment of the unsaturated and saturated zones. Additional
information regarding land use in close proximity to the site was obtained from
topographical maps, ortho-photographs and a satellite image of the Johannesburg
area.
Table 3.1 presents a summary of the selected tailings dam sites with important
features such as geology, area and status of reclamation and rehabilitation.

TABLE 3.1 - Summary of site information for the investigated sites. Note that the period of deposition. nkn d . I 1977 1984ISU own except stu ly sIte : -
Site Type Lithological Area Reclamation Period of Environ. Rehab.units ha status reclamation monitoring Measures
%A Slime Vryheid F. 50 50 Until 1996 n. a. Paddocked
DwykaF.B Slime DwykaF. 47 90 Late 1980s None Paddocked
Oaktree F.
C Slime DwykaF. 28 100 1977 - mid None All slime1980s removed
D Slime DwykaF. 71 100 1977 - mid None All slime1980s removed
E Slime DwykaF. 70 90 Early 1990s Surface water OutstandingOaktree F.
F Slime Vryheid F. 120 95 Late 1980s - None SlimeDwykaF. early 1990s removal
ongoingG Slime Vryheid F. 13 95 1994 - 1995 None Partly
paddockedH Slime Oaktree F. 4 100 1940s Surface and n. a.
groundwaterI Slime Post-Karoo 1400 30 1996 Surface and Partly
dolerites, groundwater paddockedMonte Christo /
Oaktree F.J Slime DwykaF. 117 85 1985 - Surface water Partly
present paddockedK Slime Karoo S., 111 15 Started in Surface and n. a.
Malmani SG 1997 groundwaterNote: Lithostratigraphical units are shown in Table 2.1. Reclamation status refers to the percentagevolume of tailings removed. Abbreviations: F = Formation and SG = Subgroup and S = Supergroup.
Data are generally lacking for the period of deposition due to changing ownership of
the sites.
Soil samples were analysed for various chemical constituents in order to determine
the degree of contamination. The following elements were measured in the fine grain
size fraction: Fe203 (total), MnO, As, Ba, Co, Cr, Cu, Mo, Ni, Pb, Rb, Th, D, V, Zn
and Zr. The grain size fraction < 75 /lm was chosen for total element analyses, since
the majority of trace elements is concentrated in the clay-silt particle size range
(Forstner & Kersten, 1988; Forstner, 1989; Labuschagne, Holdsworth & Stone, 1993).
Geochemical element analyses of the solid phase were conducted using the
simultaneous X-ray fluorescence spectrometry (XRF) technique. Trace and major
element analyses on gold mine tailings were obtained from Rosner (1996), who

selected five different tailings dams in the East Rand for sampling at various depths.
Additionally, information on the geochemistry of tailings was supplemented with data
from Adamson (1973) and Blight & Du Preez (1997). Soil extraction tests were
conducted on a limited number of samples, generally characterised by high pollution
loads. Subsequently, leachate samples were measured by means of inductively
coupled plasma mass spectrometry (lCP-MS) with the exception of D, which was
measured spectrophotometric ally (as D30S) after solvent extraction. Mineralogical
analyses were carried out on a limited number of tailings samples by means of X-ray
diffraction (XRD) and additional data for soils affected by gold mine tailings were
provided by Joubert (1998).
Standard foundation tests were conducted on a large number of soil samples to
determine the general geotechnical properties such as hydraulic conductivity and size
of the clay fraction.
Standard quality control was applied during analytical testing (e.g. standards and
blank samples, double-measurements). The accuracy or correctness of data obtained
from other sources (e.g. mining companies) was estimated using the electro-neutrality
(EN) equation, which is based on the percentage difference defined as follows
(American Public Health Association, 1995):
EN(%) = Lcations - Lanions .100L cations +L anions
where cations and anions refer to equivalent concentrations. The sum (expressed as
milliequivalents per litre) of positive and negative charges in water must balance and
are calculated from the cations Na+, K+, Mg2+ and Ca2+, and the anions cr, HC03-,
SO/- and N03-. Results with deviations larger than 5 per cent would require an
examination of sampling and analytical procedures (which is not possible for data
obtained from other sources) and should be considered with caution.
Geochemical background values typical of pristine topsoils, overlying rocks of the
Vryheid Formation (i.e. sandstone and shale) and Malmani Subgroup (i.e. dolomites)
were obtained from Aucamp (1997) and Elsenbroek & Szczesniak (1997).
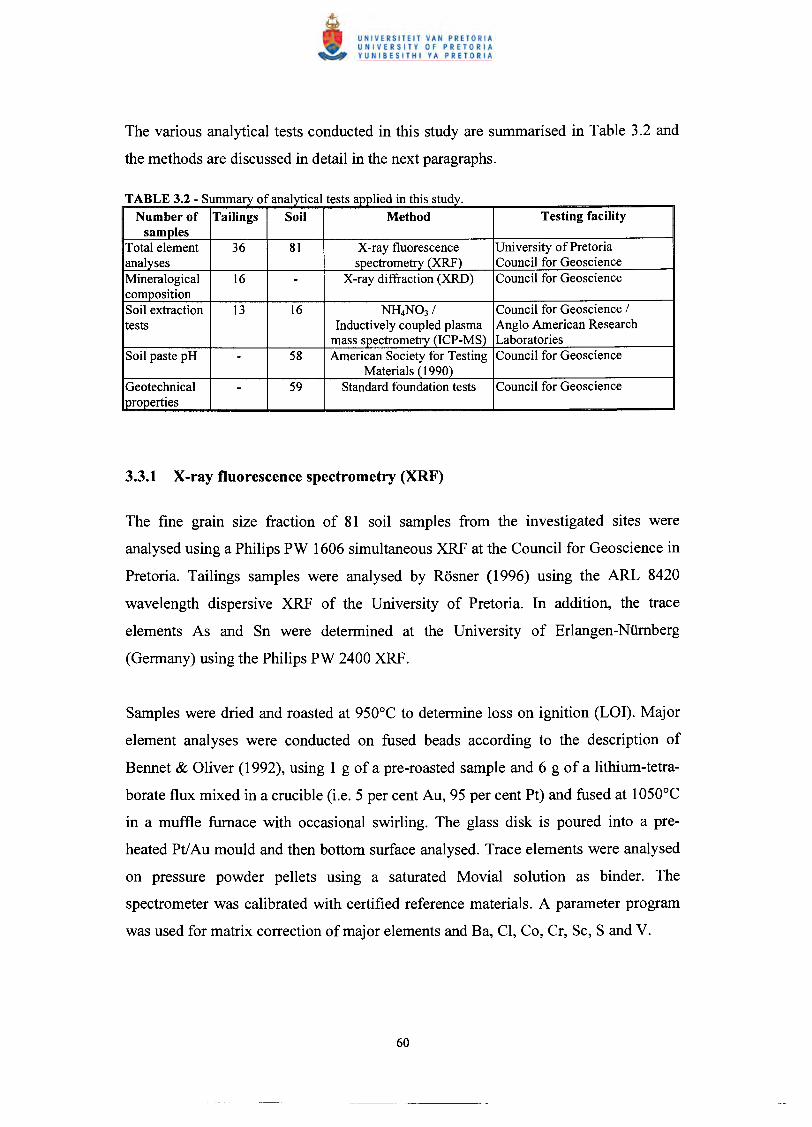
The various analytical tests conducted in this study are summarised in Table 3.2 and
the methods are discussed in detail in the next paragraphs.
lied in this stud .Soil Method Testing facility
36 81 University of PretoriaCouncil for Geoscience
16 Council for Geoscience
13 16 NH4N03/ Council for Geoscience /Inductively coupled plasma Anglo American Research
mass s ectrome (ICP-MS) LaboratoriesSoil paste pH 58 American Society for Testing Council for Geoscience
Materials (1990Geotechnical 59 Standard foundation tests Council for Geosciencero erties
The fine grain size fraction of 81 soil samples from the investigated sites were
analysed using a Philips PW 1606 simultaneous XRF at the Council for Geoscience in
Pretoria. Tailings samples were analysed by Rosner (1996) using the ARL 8420
wavelength dispersive XRF of the University of Pretoria. In addition, the trace
elements As and Sn were determined at the University of Erlangen-Niimberg
(Germany) using the Philips PW 2400 XRF.
Samples were dried and roasted at 950°C to determine loss on ignition (LOI). Major
element analyses were conducted on fused beads according to the description of
Bennet & Oliver (1992), using 1 g of a pre-roasted sample and 6 g of a lithium-tetra-
borate flux mixed in a crucible (i.e. 5 per cent Au, 95 per cent Pt) and fused at 1050°C
in a muffle furnace with occasional swirling. The glass disk is poured into a pre-
heated Pt/Au mould and then bottom surface analysed. Trace elements were analysed
on pressure powder pellets using a saturated Movial solution as binder. The
spectrometer was calibrated with certified reference materials. A parameter program
was used for matrix correction of major elements and Ba, CI, Co, Cr, Sc, S and V.

Standard deviation and detection limits for major and trace elements are listed in the
Tables 3.3a and 3.3b:
TABLE 3.3a - Detection limits and standard deviations for major elements. XRF hn' (ft B & or 1992)usmg tec lque a er ennett Iver,
Major Standard Detection limitsElement
deviation %
Si02 0.4 0.02Ti02 0.03 0.0032AI203 0.3 0.01Fe203 0.3 0.0097MnO 0.0065 0.0013MgO 0.1 0.0118CaO 0.07 0.01Na20 0.11 0.0265K20 0.06 0.005P20S 0.08 0.01
Cr203 0.0053 0.0006NiO 0.01 0.0013V20S 0.0018 0.0008Zr02 0.005 0.0009CuO 0.0037 0.0003
TABLE 3.3b - Detection limits and standard deviations for trace elementsXRF hn' (ft B & or 1992)usmg tec lque a er ennett Iver,
Trace Standard Detection limits
Elements deviation mg/kg
As n. a. 10Ba 50 50CI 100 11Cu 3 2Cr 40 15Ga 2 2Mo 1 1Nb 3 2Ni 6 3Pb 3 3Rb 5 3S (in %) 0.02 0.01Sc 5 1Sn n. a. 2Sr 4 3Th 6 5U 6 3V 10 1y 3 3Zn 5 4Zr 6 10

Various leaching methods have been discussed in Forstner (1995) to estimate the
concentration of an element in the easily soluble and exchangeable fraction. In this
study simple salt solutions (i.e. 1 M NH4N03) were used to estimate the mobility of
trace elements in the fine fractions (particle size < 75 f.lm) of soils.
The NH4N03 soil extraction method is an accepted method in the Federal
Environmental Agency of Germany for conducting hazard assessments
(Umweltbundesamt, 1996), and is likely to become an internationally recognised soil
leaching method for environmental studies. Schloemann (1994) and Utermann,
Gabler, Hindel, Kues, Mederer & Pluquet (1998) described the method in detail,
where the extracted solution stabilises in the acid range, thus ensuring that the leached
element remains in solution. This method is simple to handle and rapid. The results of
the soil extraction methods using salt solutions such as NH4N03 can be correlated
with the amount of ions held on charged soil surfaces (e.g. clays and organic material,
oxides) and with the concentration of these ions in the soil solution (Davies, 1983).
In this study, extracted concentrations were compared to the total concentration in the
solid phase and to threshold values for NH4N03 leachable trace elements, after PriieB,
Turian & Schweikle (1991). Concentrations higher than the set threshold
concentrations (TC) can result in a limitation of the soil function, according to PriieB
et al. (1991). The threshold concentrations for extractable elements in soils are listed
in Table 3.12.
Steffen, Robertson and Kirsten (1988) reported that extraction tests are not necessarily
representative of the quantities of trace elements that will be leached out of the
deposits in a single rain storm, but only of the quantities which are potentially
available.

3.3.2.1 Method for the soil extraction test
The NH4N03 (1 Molar) extraction method according to Schloemann (1994) was
applied and is described in the following:
1. Sieve the air-dried soil sample through a 75 /-lmnylon or stainless steel sieve and
discard the coarse fraction.
2. Weigh out 20 g air-dried sieved soil into an acid cleaned 250 ml Erlenmeyer
flasks.
3. Ad 50 ml N~N03 (1 molll NH4N03) solution to the soil sample.
4. Closed Erlenmeyer flasks containing the soil and salt solution were shaken for 2
hours at 20°C on a horizontal shaking table.
5. Filtrate supernatant solution through a 150 mm diameter Whatmann no. 40 ash-
less filter paper into acid-cleaned 100 ml polyethylene bottles.
6. Stabilise the extract by adding 0.5 ml cone. HN03 (i.e. 65 per cent).
7. Determine trace elements except U by means of the ICP-MS. Uranium IS
determined spectrophotometrically as U30g after solvent extraction.
Leachate samples from extraction tests and seepage samples collected from shallow
groundwater were analysed for trace elements using a FISON simultaneous ICP-MS
at Anglo American Research Laboratories in Johannesburg.
The samples were poured in pre-cleaned polyethylen bottles, instantly acidified (i.e.
diluted HN03) to prevent precipitation, and stored in a refrigerator. All samples were
submitted to the laboratory within 24 h for analysis. The detection limits for the ICP-
MS are listed in Table 3.4:

TABLE 3.4 - Detection limits for ICP-MS(after Heinrichs & Herrmann, 1990).
Element Detection limitug/l
Fe 0.8
Mn 0.05
Al 0.2
As 0.5
Ca 5.0
Co 0.02
Cr 0.03
Cu 0.03
Na 0.05
Ni 0.03
Pb 0.03
Sn 0.04
Th 0.03
U 0.03*
V 0.04
Zn 0.09
Note: *U was measured spectrophotometric ally(as U30g) after solvent extraction.
The mineralogical composition of sixteen tailings samples was analysed using a
Siemens D 5000 XRD at the Council for Geoscience in Pretoria. Results are semi-
quantitative to ± 20 per cent or better, depending on the crystallinity of the mineral
present and the sample preparation method. Detection limit for a mineral is 1-3 per
cent depending on background noise and peak resolution of the diffractogram pattern,
as well as sample preparation. The XRD is run with a secondary monochromator5 and
a copper X-ray tube (A = 1.54 A), which is appropriate for general sedimentological
studies. Data evaluation was supported by using the software package Diffrax Plus.
5 The use of a secondary monochromator would reduce the fluorescence of a high Fe content with Curadiation, decreasing the background noise, and thereby limiting the interference with mineralidentification and percentage estimation.
For the purpose of this study, about 1-3 g of representative sample material was
milled under alcohol to about 5-10 ~m (talcum powder size) using a mortar and
pestle. Subsequently, the sample was mounted in a sample holder in such a way to
minimise preferred orientation for XRD analysis.
Standard foundation tests were conducted to characterise basic geotechnical
parameters such as:
• Distribution of soil types across the investigated sites;
• Grain size distribution;
• Atterberg limits (i.e. soil plasticity);
• Hydraulic conductivity (i.e. derived from geotechnical parameters).
The amount of water that can be stored in a certain volume of soil and the rate of
water movement (flux) through that soil, depend on various parameters such as soil
texture (i.e. particle size distribution), soil structure (i.e. aggregation of soil particles),
density and shape of grains and the presence of preferential flow paths. Water may
occupy both interstructural and textural voids (between the particles). At high
moisture contents, water-flow through the voids may be the dominant transport
process, but becomes rapidly less important as the soil moisture decreases and matrix
flow dominates. Generally, the coarser and/or better sorted the solid particles, the
larger the intervening voids and the easier it will be for draining water to pass
through. As a result, sandy soils tend to be freely draining and permeable, while
clayey soils are both slower to absorb and to drain water.
Clay minerals (or grains < 0.002 mm) are the most important particle size fraction in
determining the physical and chemical properties of soil. The silt and sand fractions
mainly comprise quartz and other primary minerals that have undergone little
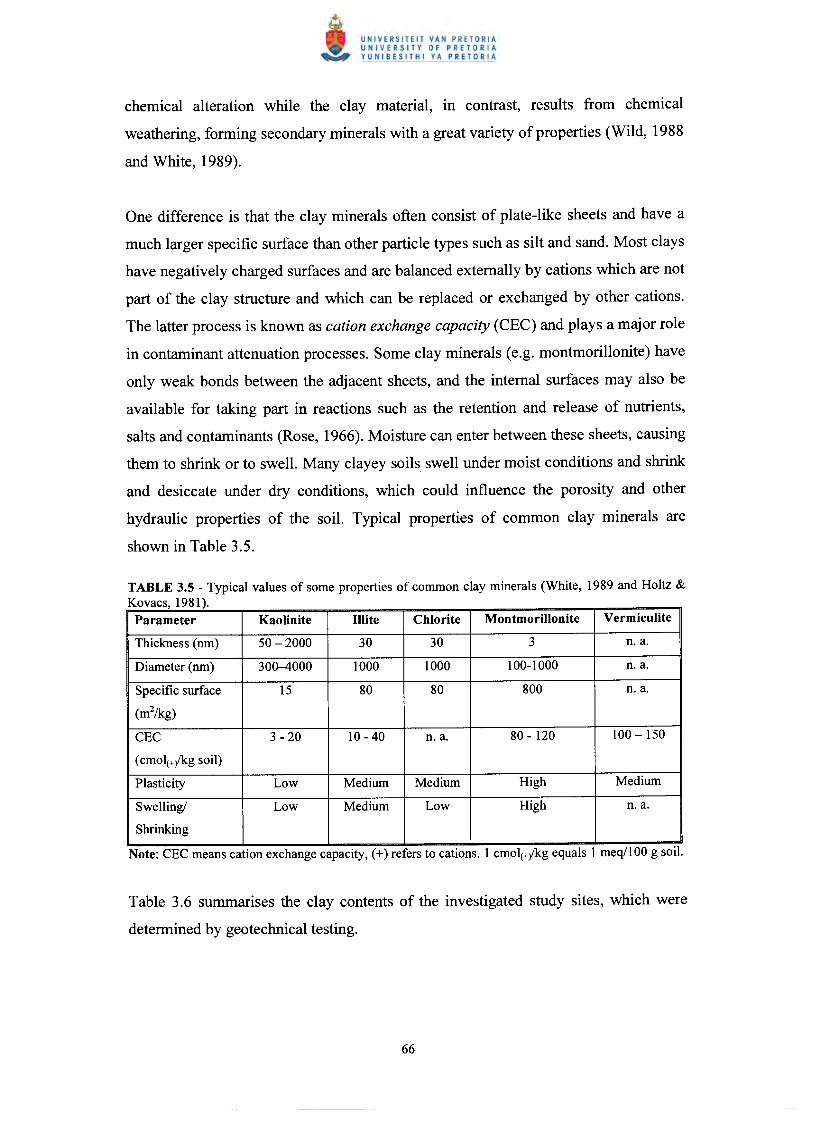
chemical alteration while the clay material, in contrast, results from chemical
weathering, forming secondary minerals with a great variety of properties (Wild, 1988
and White, 1989).
One difference is that the clay minerals often consist of plate-like sheets and have a
much larger specific surface than other particle types such as silt and sand. Most clays
have negatively charged surfaces and are balanced externally by cations which are not
part of the clay structure and which can be replaced or exchanged by other cations.
The latter process is known as cation exchange capacity (CEC) and plays a major role
in contaminant attenuation processes. Some clay minerals (e.g. montmorillonite) have
only weak bonds between the adjacent sheets, and the internal surfaces may also be
available for taking part in reactions such as the retention and release of nutrients,
salts and contaminants (Rose, 1966). Moisture can enter between these sheets, causing
them to shrink or to swell. Many clayey soils swell under moist conditions and shrink
and desiccate under dry conditions, which could influence the porosity and other
hydraulic properties of the soil. Typical properties of common clay minerals are
shown in Table 3.5.
TABLE 3.5 - Typical values of some properties of common clay minerals (White, 1989 and Holtz &Kovacs, 1981).
Parameter Kaolinite Illite Chlorite Montmorillonite Vermiculite
Thickness (nm) 50 -2000 30 30 3 n. a.
Diameter (nm) 300-4000 1000 1000 100-1000 n. a.
Specific surface 15 80 80 800 n. a.
(m2/kg)
CEC 3 - 20 10 - 40 n. a. 80 - 120 100 -150
(cmol(+/kg soil)
Plasticity Low Medium Medium High Medium
Swelling! Low Medium Low High n. a.
Shrinking
Table 3.6 summarises the clay contents of the investigated study sites, which were
determined by geotechnical testing.

- ay contents III SOl samples 0 t e stu ly SItes n=Site MIN MAX AVG Number of
% % % samples (0)
A 7.5 15.8 10.9 8
B 29.8 63.7 40.2 8
C 19.5 48.7 34.7 9
D 14.4 51.4 33.3 9
E 33.3 46.6 38.6 7
F 13.7 44.2 31.9 12
G 14.1 31.5 22.5 6
All sites 7.5 63.7 30.7 59
The clay contents of the investigated soils show a varying spatial distribution as a
result of different soil types, parent rock material and weathering conditions,
characterised by seasonal changes. In addition, Table 3.7 shows a list with the
percentage portion of the clay content in the soils of the study sites. Nearly 50 per
cent of all soil samples contain more than 30 per cent clay. No relationship was found
between clay content and sample depth, nor between clay content and element
concentrations.
TABLE 3.7 - Classification of clay contents according to the percentage portion in soil samples of thed .stu lY SItes.
Clay > 10 > 10-20 > 20-30 >30-40 > 40-50 > 50-60 >60
amount % % % % % % %
Number of 3 12 11 18 11 3 1
samples
Percentage 5.1 20.3 18.6 30.6 18.6 5.1 1.7
of samples
Geotechnical data allowed the estimation of hydraulic conductivities in 23 soil
samples, which are listed Table 3.8 (approach after Mathewson, 1981 and Tavenas,
Jean, Leblond & Leroueil, 1983). The methodology for these approaches is discussed
in paragraph 3.5.3.

TABLE 3.8 - Estimated hydraulic conductivties of soils from the study sites (n=23) according to themethods of Mathewson (1981) and Tavenas et al. (1983).Site MIN MAX Number of
m/s m/s samples (0)
A 1 X 10⁻⁹ 1 X 10⁻⁹ 3
B 1 X 10-10 IX 10-10 2
C 1 X 10-11 9.5 X 10⁻⁸ 4
D 7.5 X 10⁻¹⁰ 7 X 10⁻⁹ 4
E 8 X 10⁻¹⁰ 9 X 10⁻⁹ 4
F 6 X 10⁻¹⁰ 6 X 10⁻⁹ 4
G 1 X 10⁻⁹ 1 X 10⁻⁹ 2
All sites 1 x 10-11 9.5 X 10⁻⁸ 23
Estimated hydraulic conductivities range from impermeable (i.e. 1 x 10-11 m/s) to a
very low hydraulic conductivity (i.e. 9.5 x 10⁻⁸m/s), which is typical for soils having
a high clay content. Since more than half of all investigated soil samples showed a
clay content > 30 per cent, the unsaturated zone can be regarded as nearly
impermeable. However, high salinity in groundwater samples and the lack of
correlation between contaminant concentrations and clay contents in soils (Table B.9,
Appendix B) collected on and around the investigated sites indicate the presence of
alternative flow mechanisms that bypass the soil matrix, known as preferential flow.
Such conditions would result in high hydraulic conductivities and an insufficient
contact time between the aqueous and solid phase (soil matrix) to adsorb
contaminants.
The reclaimed sites are underlain by various soil types, which were described in the
field according to the protocol of the Soil Classification System for South Africa (Soil
Classification Working Group, 1991). The classification comprises the following
instructions amongst others:

• The horizon needs to be within the first 1.5 m ofthe soil profile. In this study soils
were described up to the bottom of the test pit (max. 2.40 m depth).
• Use the key in the soil classification protocol to identify the soil type.
Each soil type is distinguished by a name such as Shortlands and differs from other
soil types on the basis of certain pedological criteria. It is important to note that the
different horizons have not been formed separately, but as a result of a combination of
processes acting on the entire soil profile. Thus, horizons of the same soil type can
vary considerably in terms of different physical characteristics such as clay content
and hydraulic conductivity. Each soil is therefore described according to general
geotechnical properties by means of field testing methods, which are outlined below
(Jennings et aI., 1973):
• Moisture;
• Colour;
• Consistency;
• Structure;
• Soil type;
• Origin.
It is important to note that soils of the study area are generally characterised by low
organic matter contents as a result of poor vegetation and extensive weathering. The
following soil types were encountered at the investigated sites and are summarised in
Table 3.9:
TABLE 3.9 - Soil types occurring at the investigated sites.Soil type Description Occurrence at the study
sites
Arcadia Vertic A horizon Site I
Avalon Orthic A horizon, a yellow-brown apedal B horizon Test pits Al2, A/3, ell,
and a soft plinthic B horizon GIl, G/2, G3
Glencoe Orthic A horizon, a yellow brown apedal B horizon Test pit All
and a hard plinthic B horizon
Katspruit Orthic A horizon above a water table (G horizon) Test pit Ell
Rensburg Vertic A horizon above a water table (G horizon) Test pits E/2, E/3

Shortlands Orthic A horizon above a red structured B horizon. Test pits BIl, B/2, C/2,
DIl, FIl, F/2, F/3
Willowbrook Melanic A horizon above a water table (G horizon) Test pits B/3, C/3, D/2, D/3
According to the Soil Classification System of South Africa, an orthic A horizon is a
surface horizon without significant organic matter or clay content. A melanic A
horizon is a dark coloured soil unit with strongly developed structure without
slickensides, while a vertic A horizon is a soil unit with strongly developed structure
with slickensides (only in combination with smectites). A yellow brown apedal soil
horizon is a soil unit with a diagnostic yellow colour in the wet state, and has a
structure that is weaker than moderate blocky or prismatic when wet. A red structured
B horizon is diagnostically red when wet with strongly developed soil structure. A
soft plinthic B horizon has undergone localised accumulation of iron and manganese
oxides and has a loose to slightly firm consistency in the non-concretionary parts of
the horizon, while a hard plinthic B horizon consists of an indurated zone of
accumulated iron and manganese oxides. A G-horizon is saturated with water for long
periods, and is dominated by grey colours on micro-void and ped surfaces (Soil
Classification Working Group, 1991). The most common soil types encountered at the
study sites are Shortlands and Avalon.
The Shortlands soil type usually forms under warm temperate and subtropical climatic
conditions. The parent rock of this soil type is generally characterised by a high Fe
and basic mineral content, resulting in the accumulation of Fe, Si and Al (termed
jersialization) in the overlying soil. The high Fe content causes the typical red colour
of this soil type (Figure E.2, Appendix E). Kaolinite is the most likely clay mineral
occurring in this soil type.
The Avalon soil type form is characterised by the accumulation of sesquioxides (e.g.
haematite occurring in ferricretes, Figure E.11) as a result of the removal of silica and
bases by fersialization (Driessen & Dudal, 1991), i.e. relative accumulation of Fe and
Al in the soil. Thus, sufficient Fe must be present, originating from the parent material
or introduced by seepage (e.g. acid mine drainage). The soil typically has a pH
ranging from 5 to 8 and high hydraulic conductivity. A short dry period is an

important prerequisite for the formation of this soil type. The change from wet (i.e.
summer) to dry (i.e. winter) climatic conditions results in the segregation of Fe and
Mn concretions (e.g. ferricrete).
Furthermore, although soils in the study area show clay contents up to 60 per cent
(nearly 50 per cent of all soil samples contain more than 30 per cent clay)
contaminant retention is reasonably low as a result of potential preferential flow (also
known as macro-pore flow) conditions throughout the unsaturated zone. Preferential
flow is caused by large pores represented by structural cracks, fissures or paths of
plant-root systems (Ward & Robinson, 1990). Cracks or fissures can be a result of
alternate swelling and shrinking of expanding clays as well as cracking in the subsoil.
Cracking at varying depths (up to 2 m) was observed in test pits of study site E and
could be caused due to high salt loads in the soil and the alleviation of the former
load, i.e. the reverse process of consolidation. In addition, preferential flow paths
might be also associated with relatively impermeable ferricrete layers overlying less
impermeable soil and enforcing lateral instead of vertical flow. Notably is that the
dry density of the soils within the study area is higher if compared to natural soils,
indicating consolidation and compaction.
Joubert (1998) investigated clay types at study site F by means of X-ray diffraction
and confirmed the dominance of kaolinite Ah[(OH)4/SizOs] in all samples (n=lO).
Kaolinite is typically formed in highly weathered soils such as those occurring in the
study area and is often associated with sesquioxides (Brink, 1985). In addition, minor
amounts of the clay mineral palygorskite (Mg,AI)2Si40JO(OH) . 4 H20 were found.
Correlation coefficients were calculated for elements occurring in tailings and soils
using the Pearson approach, in order to identify trends between two variables
(bivariate). A trend is a change of the property x corresponding to a change of

property y. The goodness of the trend can be estimated from the product moment
correlation coefficient, r.
The coefficient ranges from + 1 to -1, where these extremes denote a perfect linear
relationship between x and y; which may be direct or indirect, respectively, i.e. on a
rectangular x, y coordinate system, where all points are located strictly on an
ascending (r = +1) or descending (r = -1) straight line. If r deviates from + 1, the
linear relationship becomes progressively blurred. A trend of increasing x associated
with increasing y, is termed positive. If r is negative, there the correlation is negative.
The value r = 0 indicates that there is no trend at all. In this case the plotted points are
distributed randomly in the coordinate system (Marsal, 1987).
n(LxY) - (Lx )(~y)r = -v'[-n-Lx-2 ---(-Lx-)-2-E-n-~="Jl="2-=-_-=-(-=--~-Jl-=-2-)-J
Many soils, surface and groundwaters contain natural concentrations of chemical
constituents that exceed soil quality or drinking water standards (Thornton, 1983;
Runnels, Sheperd & Angino, 1992). To determine the extent of contamination by
toxic elements in a soil or aquatic system, it is necessary to define this natural level
(or pre-civilisation value) in a comparable pristine area, and then to subtract it from
present values, thereby deriving the total accumulation by anthropogenic impacts
(Forstner, 1983). A common approach (Turekian & Wedepohl, 1961; Banks, Reiman,
Royset, Skarphagen & Saether, 1995 and Lahermo, Mannio & Taravainen, 1995) is to
sample river sediments upstream (similar geology) of the contamination source,
where the water quality is presumably unaffected, and to compare the sediment
concentrations with samples collected directly downstream of the contamination
source. However, especially in highly populated and industrialised areas, it is difficult
to identify a sampling point in a river or aquifer where the sediment quality seems to
be unaffected by human activities.

In this study, test pits from the reclaimed sites were excavated in soils or alluvial
sediments derived mostly from sandstone and shales of the Vryheid Formation,
diamictite and shales of the Dwyka Formation, or dolomites of the Malmani
Subgroup. The trace element concentrations of the soils retrieved from the
investigated sites were compared to average trace element concentrations from
topsoils overlying identical bedrock conditions, having the same grain size « 75 /-lm).
The method to calculate an accumulation factor (i.e. geochemical load index) is
discussed in the paragraph 3.5.5. Background concentrations for topsoils of the
Malmani Subgroup were obtained from Elsenbroek & Szczesniak (1997) and of the
Vryheid Formation from Aucamp (1997). Table 3.10 summarises the average
background values for the Vryheid Formation and Malmani Subgroup.
TABLE 3.10 - Average background values and their standard deviations in topsoils obtained from theVryheid Formation, Karoo Supergroup (n= 21) and Malmani Subgroup, Transvaal Supergroup (n=4248, particle size <75 Ilm). Vryheid Formation data from Aucamp (1997) and Malmani Subgroup datafrom Elsenbroek & Szczesniak (1997).
Vryheid Standard Malmani StandardParameter
Formation deviation Subgroup deviation
mg/kg mg/kg
As 22 4 18 17Co 14 3 15 40Cr 130 32 268 958Cu 35 7 31 81Fe203 (in %) 4.4 1.1 6.11 3.1MnO (in %) 0.08 0.03 0.7 0.7Mo 23 5 13 8Ni 45 10 57 107Pb 15 8 5 25Th 13 3 18 5U n.d. - n.d. -Zn 103 55 50 79
Saturated hydraulic conductivities in soil samples were estimated according to the
methods of Tavenas et al. (1983) or by means of comparison to the permeability, after
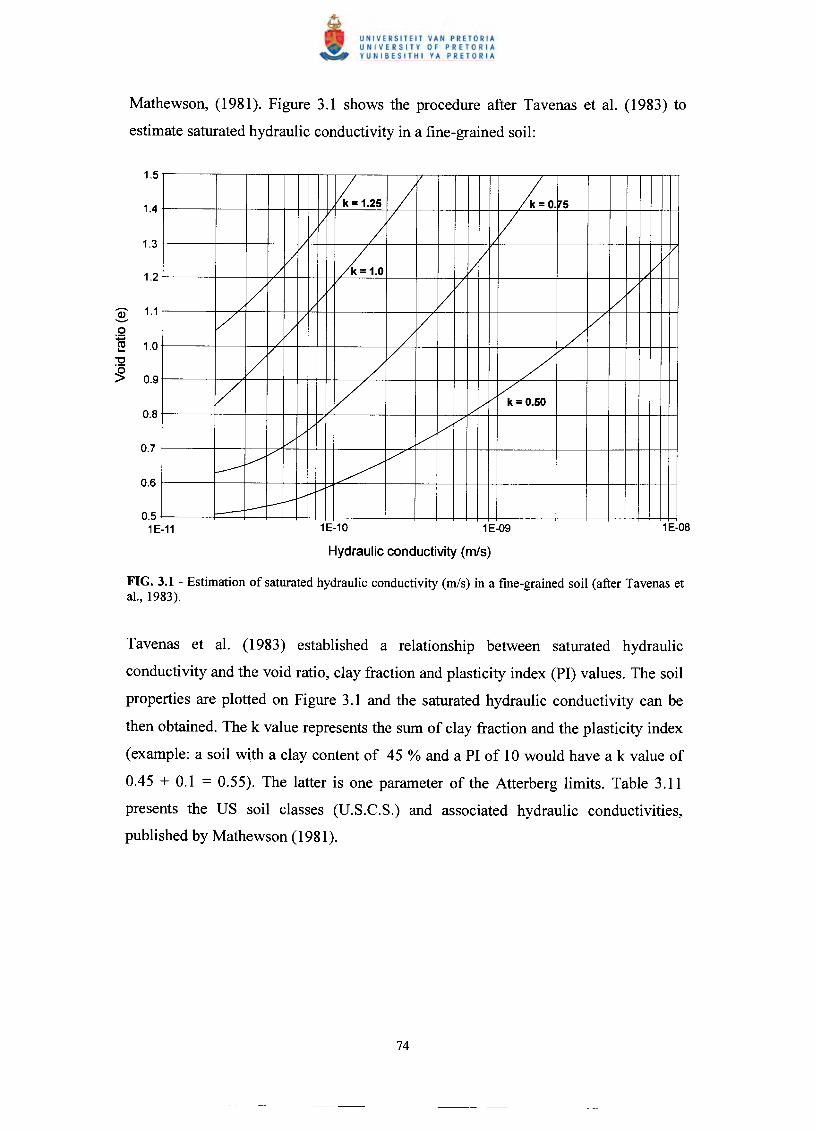
1.5
1.4
1.3
1.2
(j) 1.1----0
:0:;ro 1.0..."0
~ 0.9
0.8
0.7
0.6
Mathewson, (1981). Figure 3.1 shows the procedure after Tavenas et al. (1983) to
estimate saturated hydraulic conductivity in a fine-grained soil:
~=1.25 / ~o. 5/ / // /
/~1.0
V/ V V
/ / / // / V
/ / / // / /
/ V /// V /
/v k = 0.50
V V,/
,// /./
./ V-- ~
-I----0.51E-11
FIG. 3.1 - Estimation of saturated hydraulic conductivity (m/s) in a fine-grained soil (after Tavenas etaI., 1983).
Tavenas et al. (1983) established a relationship between saturated hydraulic
conductivity and the void ratio, clay fraction and plasticity index (PI) values. The soil
properties are plotted on Figure 3.1 and the saturated hydraulic conductivity can be
then obtained. The k value represents the sum of clay fraction and the plasticity index
(example: a soil with a clay content of 45 % and a PI of 10 would have a k value of
0.45 + 0.1 = 0.55). The latter is one parameter of the Atterberg limits. Table 3.11
presents the US soil classes (U.S.C.S.) and associated hydraulic conductivities,
published by Mathewson (1981).

- stlmate IY< aulic conductivity value from soil type (after Mathewson, 1981).
SoilHydraulic
Soil type U.S.C.S conductivity
symboldescription
m/s
,--, GP Poorly-graded gravel, little fines 10-' - 1O-~E
....l E Q) GW Well-graded gravel, little filles 10-4- 1O-~•....• V) ~0 l'-
GM Silty gravel, gravel-silt-sand mixture 10-0- 10-'CZl ~ •...
Q 0 Cl~ en
GC Clayey gravel, gravel- sand-clay mixture 10-~ - 10-0en
25 <I:S0.
;;2 -; SP Poorly-graded sand, little filles 10-0- lO-j
.;:Cl Q)
10-7 - 10-3- SW Well-graded sand, gravelly sand, littleI <I:S~ ECZl "0~ ••...fines0 c-< <I:S
0 '$. CZl
u 0 SM Silty sand, sand-silt mixture 10-- - 10-0
V)
v SC Clayey sand, sand-clay mixture 10-~ - 10-1'-'
ML Inorganic silt and very fine sand, silty or 1O-~_10-0,--,E
clayey fine sand, clayey silt with slightE....l V)
l'- .=:: plasticity•....• ~ Ci30 0CZl en MH Inorganic silt, micaceous or diatomaceous 10-9 _ 10-7Q en
<I:S~ 0.fine sandy or silty soil, elastic silt25 -;
;;2 .;:lO-w - 10--~ CL Inorganic clay with low-medium plasticity,
ClI E gravelly or sandy clay, lean clay~ ••...
25 0 ~•.... ~ 0 CH Inorganic clay with high plasticity, fat clay 10-11_ 1O-~0
0V)
/\'-'
The short-term or current contamination impact was investigated using the trace
element mobility coefficient (MOB) and threshold excess ratio (TER), which can be
expressed as:
TER= ExCTC'
where TER is the threshold excess ratio for an element, ExC is the NH4N03
extractable concentration and TC is a given set soil threshold value or soil quality
standard, after PriieB et al. (1991). A concentration that is exceeding the soil threshold
value can limit the functioning of the soil. Table 3.12 indicates which of the soil

functions are most threatened by a certain contaminant In order to assist In the
decision on appropriate counter measures.
TABLE 3.12 - Recommended maximum NHtN03 extractable threshold concentration in soils (afterPriieB et aI., 1991).
Soil functions and ranking of concernsElement Threshold Pollutant Pollutant Habitat for Habitat for Pollutant
concen. buffer with buffer with plants soil filter with
mg/l regard to regard for organisms regard to
plants for animal groundwater
human consumption
consumption
As 0.1 PC X C X C
Co 0.5 X C C X X
Cr 0.1 X X X PC C
Cu 2 X C C PC C
Mo 1 X PC C X X
Ni 1 X X C X X
Pb 2 PC C X C C
V 0.1 C C INV X X
Zn 10 X X C X X
U 0.04 X X X X !NV
Note: Abbreviations for the ranking of concern if the threshold concentrations are not greatly (e.g.several times) exceeded: PC = primary concern, C = concern, !NV = further investigations needed toassess risk. Limited soil functioning only if the threshold concentrations are greatly exceeded: X.
In addition, the mobility of trace elements was derived by comparing the extractable
ratio of an element to the total concentration:
MOB(in%) = ExC,TotC
where MOB represents the percentage mobility of an element, ExC is the NH4N03
extractable fraction and TotC is the total trace element concentration measured in soil
samples. The MOB coefficient gives an indication of the contaminant concentration,
which could be remobilised and is thus potentially bio-available.

In this study, TER and MOB were only applied experimentally to samples of the site
F, and were then extrapolated to the other samples from the remaining sites A-G. Site
F generally showed the highest pollution potential of all investigated sites with respect
to uranium.
The potential future impact of contamination (worst-case scenario) was assessed by
using the geochemical load index (Igeo),introduced by Muller (1979).
enIgeo = log2 ---,
Bn·1.5
where Cn is the measured concentration of the element n in the soil/sediment and Bn is
the average geochemical background value obtained from literature. The safety factor
1.5 is used to compensate for variation in the background data. The hazard rating
comprises six different contamination classes (i.e. I-VI), which are shown in Table
3.13:
TABLE 3.13 - Classification of contamination by using the geochemical load index (after Muller,1979).
Geochemical Load Contamination Level of contamination
Index (Igeo)class
> 0-1 I Non-polluted to moderately contaminated
> 1-2 II Moderately contaminated
> 2-3 III Moderately to highly contaminated
> 3-4 IV Highly contaminated
>4-5 V High to excessively contaminated
>5 VI Excessively contaminated
The application of this index reflects a worst-case scenario, assuming that the total
concentration of contaminants contained in the solid phase can be remobilized and
hence, is potentially bio-available. The geochemical load index is also intended to
represent the long-term capacity of the soil to retain contaminants. If the geochemical
load index is exceeded (i.e. greater than 1 or beginning with contamination class II), it

can be assumed that further damage to the environment is occurring and the general
quality of the environment is deteriorating. However, it is important to note that such
an excess does not necessarily mean that damage has to occur right now. It is a
calculation that damage, however defined, will occur at some time, possibly now,
possibly later, ifthe introduction of contamination into the soil system is not reduced.
The index was successfully applied in various environmental studies in Germany,
such as in the water quality monitoring program of the rivers Rhine and Elbe and in
sludge deposits of the Hamburg harbour area (Forstner & Muller, 1974 and Forstner,
1982), and also recently in the geochemical mapping program of topsoils in the city of
Berlin and in the Czech Republic, conducted by the German Federal Environmental
Agency (Birke, 1998).

Site A is situated approximately 1 km east of the suburbs of Benoni and covers an
area of approximately 50 ha (Figure 1.1). A residential area is located on the south-
western border of the site. The site is located at an altitude of ±1630 m above sea
level. Surface drainage direction is towards a non-perennial stream in the north. Test
pit locations are shown in Figure D.16.
Approximately 50 per cent of the tailings material has been removed. No vegetation
has been established on site except a poor grass cover and some trees on top of the toe
wall (Figure E.l). The oxidised zone in the remaining toe wall is clearly visible and
reaches up to a depth of approximately 5 m. Paddocks were constructed to prevent
storm water surface run-off from the site.
Site A is underlain by sedimentary rocks of the Vryheid Formation (sandstone and
shale), in the southern part of the site. The Dwyka Formation (diamictite and shale)
underlies the northern portion of the site.
The soils of the site A are mainly represented by the Avalon (test pits Al2 and Al3)
and Glencoe (test pit All) soil type. No perched water table was encountered during
the excavation of the test pits. Table 4.1 presents a summary of soil parameters of siteA.

- ummaryo SOl parameters or stu ly site A.Field test results
Geotechnical Derived from geotechnical Soil
Parameters parameters pH
Clay Plasticity Dry Specific Void Saturated U.S.C.S.
content index density gravity ratio permeability soil
Soil units % PI kg/m3 m/s group
Colluvium 8.5- 2.89- 1752.9- 2.72 0.50- 1 x 10⁻⁹ ML,SC, 3.1-
15.8 6.90 1816.1 0.55 OM 6.5
Nodular 11.31 5.11 - - - - SC 6.9
ferricrete
Hardpan 7.5- 5.94- 1551.43 2.81 0.81 1 x 10⁻⁹ ML,SC 4.4-
Ferricrete 12.10 8.90 6.9
Vertical preferential flow occurs in the clayey sand, colluvial topsoil unit (0.20-0.55
m thickness) which is characterised by cracks. The yellow-brown coloration along the
cracks indicates the movement of overlying tailings within these structures. Lateral
preferential flow may occur at depths between 0.45-0.60 m on the interface between
the pebble marker (very loose consistency) and the underlying nodular ferricrete
horizon (test pits Al2 and Al3) or the hardpan ferricrete unit present in All at 0.60 m
depth. The hardpan ferricrete unit shows zones of moist, brown, loose clayey sand
within the matrix of very densely cemented clayey sand, through which preferential
flow might occur. The ferricrete units in the profile might cause a perched water table
during the wet season.
Soil pH conditions are favourable for metal leaching, with the lowest pH of 3.1. All
test pits show a significant positive trend for Fe with depth, where the concentration
progressively increases from 3.5 per cent in the topsoil up to 18 per cent at 1.0 m
depth. The average concentration of Fe is significantly higher than the average
background value of 4.4 per cent. This indicates the release of Fe during the pyrite
oxidation process and its downward migration through the subsoil.
Chromium generally accumulates in subsoil and exceeds the average background
value of 130 mg/kg (i.e. Vryheid Formation) in all samples. However, the bulk of the
Cr seems to be associated with Fe203, reflected in a very good positive correlation (r
= 0.83). Arsenic in contrast accumulates in the topsoil to concentrations which exceed
considerably (5-fold) the average background value of 22 mg/kg (i.e. Vryheid
Formation). The high concentrations of As found in the topsoils and the negative
correlation with depth strongly suggest the leaching of As from reclaimed tailings into
the topsoil, whereupon As seems to be immediately immobilised on solid surfaces
such clay minerals or the formation of iron arsenates. The low remobilization and thus
mobility of As has been confirmed by extraction tests. In two samples, measured U
concentrations of 12 and 7 mg/kg are very low compared to site F, but still above the
average background value. A list of geochemical soil data is provided in Table B.1
(Appendix B).
The application of the extrapolated extractable fraction resulted in no excess of the
threshold value in case of As, whereas Co, Ni and Zn exceed the threshold in all
samples, resulting in a limited soil function. Chromium, Cu, Pb and Zn showed excess
in only one sample. It is important to note that the extractable fraction ofNi is 28-fold
higher than the recommended threshold value. The high excess ofNi can be explained
by a high mobility (MOB of 51 per cent). In contrast, Zn reaches only a maximum of
3-fold excess.
Soil samples of the test pits All, Al2 and Al3 show moderate contamination (class II)
for As, Fe, Cr, Cu and Pb using the geochemical load index. Only U occurs in
concentrations which are classified as moderately to highly contaminated (class III)
due to a average background value of 1 mg/kg.

The low clay content in connection with a generally low organic matter and the
presence of preferential flow paths might cause ongoing groundwater contamination.
In addition, the most common clay mineral is likely to be kaolinite, characterised by
its very low cation exchange capacity. Dry density values (i.e. colluvium) are very
high compared to natural soils and only very few plant would grow satisfactorily
under such conditions.
The fact that nearly half of the tailings material still remains on site, which provides a
source for continuing pyrite oxidation, gives rise to concern. Furthermore, paddocks,
which are situated on the reclaimed portion of the site are inappropriate as they
increase rainfall infiltration and, thus enhance contaminant migration. Nickel mobility
is very high in the soil and could complicate efforts to establish a self-sustaining
vegetation cover as the soil function is limited.
In this condition, the soil is not fit for revegetation. It is recommended to remove the
paddocks and to cover the remaining tailings material by an impermeable layer. Such
a soil cover would prevent the dispersion of fine tailings material by wind and would
minimise rainfall infiltration into the tailings and, thus the generation of acid mine
drainage. In addition, lime should be added to the topsoil to neutralise acids. The
introduction of fertilisers would improve growth conditions on the reclaimed portion
of the site. In addition, lime would also enhance the attenuation capacity of the soil.

Site B is situated to the south-east of Springs in close proximity to a residential area
on its eastern border (Figure 1.1). The site covers an area of approximately 47 ha and
is located at an altitude of ±1615 m above sea level. Surface drainage corresponds to
the topographical gradient towards a wetland system in a south-westerly direction. A
small squatter camp has been established in immediate vicinity to the reclaimed site.
The location of the test pits is shown in Figure D.2.
About 90 per cent of the tailings material has been removed (Figure E.2). The
remaining tailings will be reclaimed by the year 2003. The site shows vegetation,
consisting of a poor developed grass cover and some trees. Paddocks were
constructed to prevent storm water surface run-off.
The southern section of site B is located on dolomites of the Oaktree Formation,
Malmani Subgroup, whereas the northern part is situated on Dwyka Formation
(diamictite and shale).
The soils of site B are represented by the Shortlands (test pits B/l and B/2) and
Willowbrook (test pit B/3) soil type. The photographed soil profile is presented in
Figure E.3. The soil parameters of study site Bare summarised in Table 4.2:

- ummaryo SOl parameters or stu Iy SIteField test results
Geotechnical Derived from geotechnical Soil
Parameters Parameters pH
Clay Plasticity Dry Specific Void Saturated D.S.C.S.
content index density gravity ratio permeability soil group
Soil units % PI kglm3 rnls
Colluvium 29.80- 11.28- 1619.22- 2.45- 0.46- I x 10-10 CL,MH 3.53-
63.66 19.63 1695.54 2.48 0.51 6.63
Nodular 19.02- 8.21- - - - - SC,MH 5.7-
ferricrete 50.24 25.67 6.7
The open-structured nature of the topsoil unit may facilitate preferential vertical
infiltration, although the abundance of gypsum crystallisation could close up pores
and reduce vertical infiltration rates. Lateral preferential flow may occur at the contact
of the nodular ferricrete unit with the overlying soil (between 1.40-1.90 m) as
ferricrete formation entails precipitation of colloidal Fe-oxides that may close pores to
reduce vertical permeability. The nodular ferricrete units in the base of the profiles
suggest the presence of either a seasonal perched water table or very high moisture
saturation.
Iron shows in all test pits a positive correlation with depth of the profile (maximum
depth 2.10 m). Total concentrations of Fe exceed in nearly all samples the relevant
average background value of 6.1 mg/kg, suggesting the release of Fe during pyrite
oxidation. Chromium is likely to bound onto Fe-oxides reflected in a significant
positive correlation with Fe203 (r = 0.83).
Arsenic, Ni (except in test pit B/3) and Zn, in contrast, tend to accumulate in the
upper soil unit and exceed in a number of samples the average background value. It is
suggested that these elements have migrated from the tailings into the topsoil, where
they became readily immobilised. A further downward migration of Ni and Zn is
likely since low pH conditions enhance leaching. A list of geochemical soil data is
provided in Table 8.1.
The application of the extrapolated extractable fraction would result in a high
threshold excess ratio for Co (38-fold), Ni (88-fold) and Zn (53-fold). No significant
excess, in contrast, was found for Cr, Pb and Fe.
Site B is moderately contaminated (class II) by Ba, Cu and Ni, moderately to highly
contaminated by Co and highly contaminated by Pb using the geochemical load
index.
The high clay content can support contaminant attenuation mechanisms within the
soil matrix. However, kaolinite is most likely the dominating clay type, having a low
cation exchange capacity. In addition, paddocks are inappropriate as they increase
rainfall infiltration and thus, enhance contaminant migration. High mobility ofNi and
Zn in soils could complicate efforts to establish a self-sustaining vegetation cover, as
these trace elements are known to be phytotoxic.
In this condition, the soil is not fit for revegetation. It is recommended to remove the
paddocks and remaining (or residual) tailings material from the surface and to add
lime to those portions of the topsoil, delineated as acid soils. Further soil management
measures like the addition of fertilisers would improve growth conditions. In addition,
lime would also enhance the attenuation capacity of the soil.

The site covers an area of approximately 28 ha and is located to the south-east of
Springs (Figure 1.1) at an altitude of ± 1610 m above sea level. A golf course is
situated in immediate proximity to the north-eastern border of the reclaimed site. The
general surface drainage direction is in southerly direction towards a canal and dam.
The location of the test pits is shown in Figure D.3.
Site C has been completely reclaimed and is sparsely covered by grass vegetation. No
rehabilitation measures (including paddocks) were found.
Site C is mostly is covered by alluvial sediments deposited by a tributary of a
perennial stream. Sedimentary rocks of the Dwyka Formation (diamictite and shale)
underlie the alluvium.
Site C is covered by the following soil types: Colluvium of the Avalon (test pit CIl)
type and alluvium of the Shortlands (test pit C/2) and Willowbrook (test pit C/3)
types. Table 4.3 summarises the soil parameters for study site C.
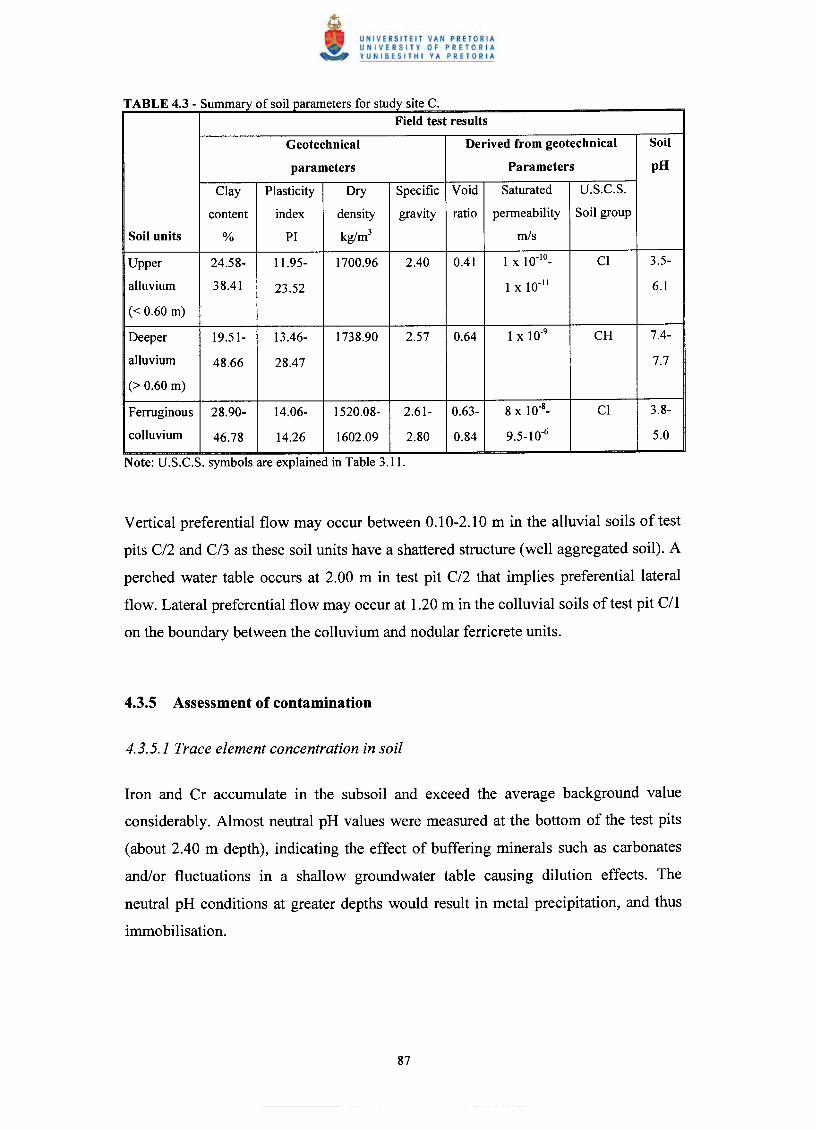
- ummaryo SOl parameters or stu ly siteField test results
Geotechnical Derived from geotechnical Soil
parameters Parameters pH
Clay Plasticity Dry Specific Void Saturated U.S.C.S.
content index density gravity ratio permeability Soil group
Soil units % PI kg/m3 m/s
Upper 24.58- 11.95- 1700.96 2.40 0.41 1 x 10,10_ Cl 3.5-
alluvium 38.41 23.52 1 x 10,11 6.1
« 0.60 m)
Deeper 19.51- 13.46- 1738.90 2.57 0.64 1 x 10.9 CH 7.4-
alluvium 48.66 28.47 7.7
(> 0.60 m)
Ferruginous 28.90- 14.06- 1520.08- 2.61- 0.63- 8 x 10'8_ Cl 3.8-
colluvium 46.78 14.26 1602.09 2.80 0.84 9.5-10.6 5.0
Vertical preferential flow may occur between 0.10-2.1 0 m in the alluvial soils of test
pits C/2 and C/3 as these soil units have a shattered structure (well aggregated soil). A
perched water table occurs at 2.00 m in test pit C/2 that implies preferential lateral
flow. Lateral preferential flow may occur at 1.20 m in the colluvial soils of test pit CIl
on the boundary between the colluvium and nodular ferricrete units.
Iron and Cr accumulate in the subsoil and exceed the average background value
considerably. Almost neutral pH values were measured at the bottom of the test pits
(about 2.40 m depth), indicating the effect of buffering minerals such as carbonates
and/or fluctuations in a shallow groundwater table causing dilution effects. The
neutral pH conditions at greater depths would result in metal precipitation, and thus
immobilisation.

A shallow water table was encountered in test pit C/2 (Figure E.lO) and a chemical
analysis was conducted to assess the impact of the seepage on groundwater quality.
The results are presented in Table 4.4a and 4.4b:
TABLE 4.4a - Chemical analyses of seepage water from test pit C/2 depicting macro-chemistry andth .o er mam parameters.
pH EC TD8 Ca Mg Na K CI N03 HC03 804
C/2 mS/m mg/I mg/I mg/I mg/I mg/I mg/I mg/I mg/I mg/I
6.3 309 2214 219 147 262 5.37 336 <0.1 348 1006
The pH conditions in the seepage sample correspond to the soil pH. Total dissolved
solids (TDS) are relatively high and mainly caused by high salt concentrations such as
S042- and cr. Table 4.4b represents metal and cyanide concentrations determined in
the seepage sample.
TABLE 4.4b - Chemical analyses of seepage water from test pit C/2 showing metal and CNconcentrations.
As Cu CN Fe Mn Ni Pb Zn
C/2mg/I mg/I mg/I mg/I mg/I mg/I mg/I mg/I
<0.1 <0.01 <0.2 3.2 0.76 0.13 <0.01 0.05
Arsenic, CN, Cu and Pb concentrations are below the detection limit, therefore, there
is tendency that these elements are retained from the soil. Additionally, the cyanide
ion (CN-) decomposes in aqueous solutions to cyanate (OCN-), which is not stable and
further disintegrates to CO2 and NH3 (Mortimer, 1987). The extraction test has shown
that As, Cu and Pb have very low mobilities even under acidic conditions. The
concentrations of Fe, Mn, Ni and Zn are low compared to seepage samples of the sites
G and F. High alkalinity values in seepage reflect the acid neutralisation capacity of
the subsoil by carbonate containing minerals. A list of geochemical soil data is
provided in Table B.l.
Extrapolated extractable Ni concentrations result in threshold excess, varying from 19
to 40-fold. In addition Co and Cr reach a threshold excess of up to 44 and 18-fold,

respectively, indicating limited soil functioning. Zn, in contrast does not significantly
exceed the threshold concentration.
Site C is moderately contaminated (class II) by Cu, Fe, Ni, Mn, V and Zn while the
site is highly (class IV) contaminated by Co using the geochemical load index.
The relatively high clay content may support contaminant attenuation mechanisms
within the soil matrix. However, kaolinite is most likely the dominating clay type,
having a low cation exchange capacity. The mobility of the phytotoxic elements Co,
Cr and Ni is considerable and could endanger the present vegetation cover in the long-
term.
Soil management measures like the addition of lime and fertilisers are currently not
required since a vegetation cover has developed on site, but might be necessary in the
future. Vadose zone monitoring (pH, redox conditions and trace element
concentrations in seepage by using lysimeters) is advised, as the future contamination
potential (worst-case scenario) of the soil is high.
Site D is situated adjacent to a highway and in close proximity to a large township
(Figure 1.1). It covers an area of approximately 71 ha and is located at an altitude of ±
1610 m above sea level. Surface run-off may occur towards a canal in northern
direction. The location of the test pits is shown in Figure D.4.
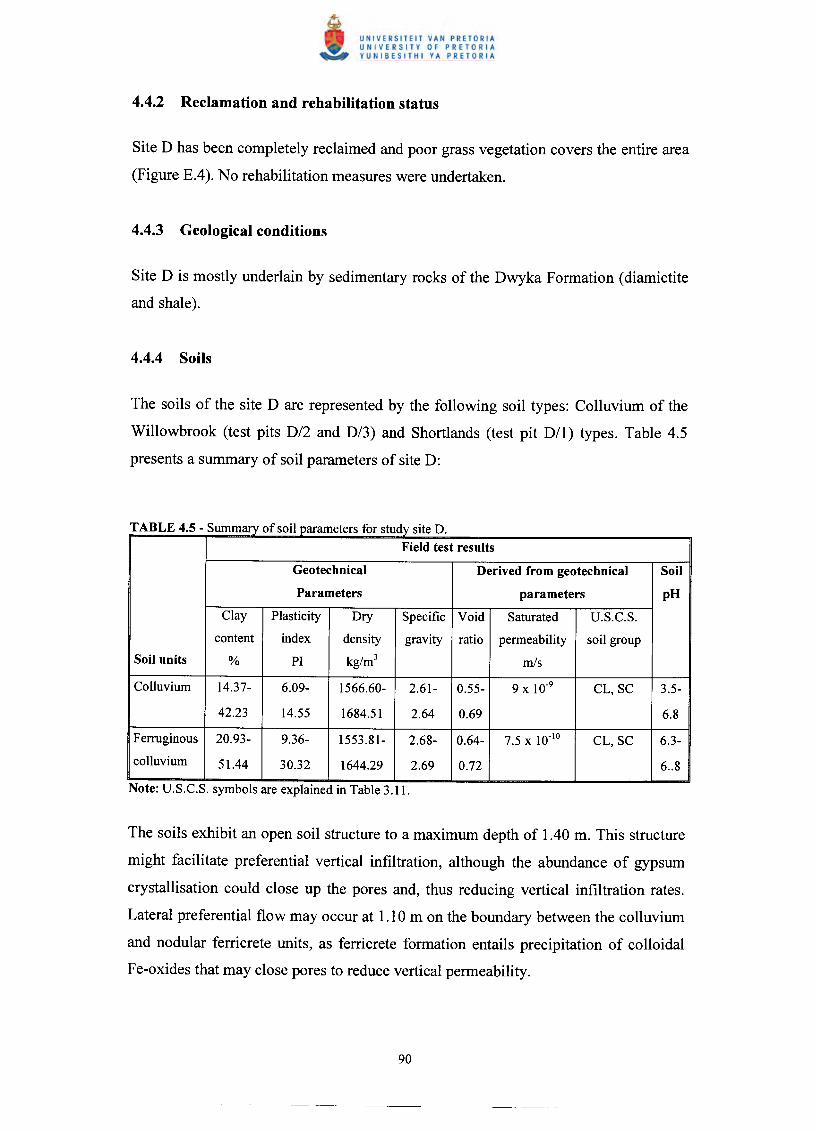
Site D has been completely reclaimed and poor grass vegetation covers the entire area
(Figure E.4). No rehabilitation measures were undertaken.
Site D is mostly underlain by sedimentary rocks of the Dwyka Formation (diamictite
and shale).
The soils of the site D are represented by the following soil types: Colluvium of the
Willowbrook (test pits D/2 and D/3) and Shortlands (test pit D/1) types. Table 4.5
presents a summary of soil parameters of site D:
TAB . - ummaryo SOl. parameters or stu1y sIte D.Field test results
Geotechnical Derived from geotechnical Soil
Parameters parameters pH
Clay Plasticity Dry Specific Void Saturated D.S.C.S.
content index density gravity ratio permeability soil group
Soil units % PI kglm3 m/s
Colluvium 14.37- 6.09- 1566.60- 2.61- 0.55- 9 x 10⁻⁹ CL, SC 3.5-
42.23 14.55 1684.51 2.64 0.69 6.8
Ferruginous 20.93- 9.36- 1553.81- 2.68- 0.64- 7.5 x 10⁻¹⁰ CL, SC 6.3-
colluvium 51.44 30.32 1644.29 2.69 0.72 6,,8
The soils exhibit an open soil structure to a maximum depth of 1.40 m. This structure
might facilitate preferential vertical infiltration, although the abundance of gypsum
crystallisation could close up the pores and, thus reducing vertical infiltration rates.
Lateral preferential flow may occur at 1.10 m on the boundary between the colluvium
and nodular ferricrete units, as ferricrete formation entails precipitation of colloidal
Fe-oxides that may close pores to reduce vertical permeability.
Lateral preferential flow may also occur at 1.40 m at test pit D/3 on the boundary
between the ferruginous colluvium and the residual shale. Cracking occurs from 0.80-
2.30 m and might allow vertical preferential flow. A hard pan ferricrete unit occurs at
1.60 m in test pit D/1 and lateral preferential flow may be induced on this layer.
Iron shows low concentrations in the topsoils (3.4-8.9 per cent), but an accumulation
in the subsoil (6.8-12.0 per cent). Test pit C/3 shows generally much lower Fe and As
concentrations than in the two other test pits. The pH value in all topsoil samples
varies from 3.5-3.8, thus indicating favourable leaching conditions for metals. A list
of geochemical soil data is provided in Table B,1.
Extrapolated extractable concentrations for Co would result in threshold excess of 28
to 53-fold and 24 to 72-fold for Ni, respectively. In contrast, Cr and Cu exceed the
threshold concentration only by a factor of 6 to 10 and 2 to 4, respectively.
Extractable concentrations of Zn and Pb are negligible.
Site D is moderately contaminated (class II) by As, Cr, Fe while the site is moderately
to highly contaminated (class III) by Ni and Pb. The site is highly contaminated (class
IV) by Co, U and V using the geochemical load index.
The relatively high clay content may support contaminant attenuation mechanisms
within the soil matrix. However, kaolinite is most likely the dominating clay type,
having low expanding capabilities and thus, a low cation exchange capacity. A high

mobility of the phytotoxic elements Co and Ni could endanger the present vegetation
cover in the long-term.
Liming is not recommended as the primary pollution source was removed and a grass
cover has developed on site, but might be necessary in the future. However, vadose
zone monitoring is advised as the future contamination potential (worst-case scenario)
of the soil is high.
Site E is situated approximately I kIn to the north of the outskirts of Springs (Figure
1.1) and is bordered by a dam on its western side. An industrial area is located on the
eastern border of the reclaimed site. The reclaimed site E covers an area of
approximately 70 ha and occurs at an altitude of ±1585 m above sea level. Surface
drainage occurs towards a drainage canal in a southerly direction. This canal feeds a
dam further downstream. The location of the test pits is shown in Figure D.5.
The site has been almost completely reclaimed, with about 90 per cent of the tailings
being removed. The site shows a poor grass cover and paddocks systems were
established to prevent storm water surface run-off from the site (Figure E.5).
Site E is mostly underlain by alluvial sediments deposited by a tributary of a perennial
stream. The alluvium is underlain in the northern section of the site by sedimentary
rocks of the Dwyka Formation (diamictite and shale) and by dolomitic rock (low chert
content) of the Oaktree Formation in the southern portion of the site. A dolerite sill
occurs in the central portion of the site.

The soils of site E are represented by the following soil types: Alluvium of the
Rensburg (test pit E/2 and E/3) type and colluvium of the Katspruit (test pit Ell) type.
A summary of the soil parameters is presented in Table 4.6.
- ummarvo SOliparameters or stu ly SIte E.Field test results
Geotechnical Derived from geotechnical Soil
Parameters Parameters pH
Clay Plasticity Dry Specific Void Saturated D.S.C.S.
content index density gravity ratio permeability soil
Soil units % PI kg/m3 m/s group
Alluvium 35.02- 22.27- 1484.87- 2.68 0.75- 9 x 10-'1- CH,CL 5.1-
46.55 38.38 1535.06 0.80 8 x 10⁻¹⁰ 8.3
Colluvium 33.29- 21.28- 1535.78- 2.55- 0.44- 1 x lO-lU_ CL 6.7-
40.06 23.05 1775.29 2.70 0.76 9.5 x 10⁻⁹ 7.0
In the clayey alluvial soils of test pits E/2 and E/3, cracking occurs between 0.60 m
and a maximum of 1.50 m and these features may be preferential vertical flow paths.
Both test pits refused on an alluvial boulder layer (at 1.50 m in test pit E/2 and 1.30 m
in E/3). A perched water table occurs at 2.00 m in the colluvial soils of test pit Ell
that implies preferential lateral flow. Vertical preferential flow may occur between
0.50 m and 2.00 m in test pit Ell as these soils are slickensided.
Iron, Cr and V show increasing concentrations with depth, thus indicating the
downward migration through the subsoil, whereas Pb and Zn tend to accumulate in
the topsoil. A list of geochemical soil data is provided in Table B.l.

No information on extractable metal concentrations of the soil is available. Leaching
tests, conducted by the mining company, indicated high sol- concentrations even
after the fourth extraction, exceeding the recommended maximum concentration of
600 mg/l (South African Bureau of Standards, 1984). The high sol- concentrations
in the topsoil are a result of pyrite oxidation and the subsequent leaching from the
reclaimed tailings. However, pH conditions in the top and subsoil are fairly neutral
and would not allow significant contaminant mobilisation.
Site E is moderately contaminated (class II) by Fe, Co, Pb and V, while the site is
moderately to highly contaminated (class III) by Pb and V using the geochemical load
index. Seepage is characterised by high sol- concentrations as a result of pyrite
oxidation. A dolomitic aquifer system, which is in particular vulnerable to pollution
(high flow velocities along fissures, fractures and cracks), underlies the southern
portion of this site.
The relatively high clay content may support contaminant attenuation mechanisms
within the soil matrix. However, kaolinite is most likely the dominating clay type,
having low expanding capabilities and thus, a low cation exchange capacity. In
addition, the site is partially situated on dolomite.
However, the remaining tailings should be removed and vadose zone monitoring is
advised as the future contamination potential (worst-case scenario) of the soil is
moderately to high. In addition, extraction tests for metals should be conducted.
Liming is not required since the soil pH conditions are in a normal range.

Site F is situated approximately 1 Ian south of the outskirts of Springs (Figure 1.1)
adjacent to a highway and bordered to the east by a small township. Site F consists of
two reclaimed tailings dams, which were located next to each other. The reclaimed
sites cover a total area of approximately 120 ha. The site is located at an altitude of
±1585 m above sea level. Surface drainage is towards a perennial stream in the east.
The location of the test pits is shown in Figure D.6.
Both sites have been reclaimed, but small volumes of tailings material still remain on
site and indicate the footprint of the former deposit. Some poor vegetation has been
developed on site. The mining company is currently in the process of removing these
residual tailings (Figure E.6).
The larger portion of the site is underlain by rocks of the Vryheid Formation
(sandstone and shale); whereas the remainder in the south-eastern section is underlain
by sedimentary rocks of the Dwyka Formation (diamictite and shale).
4.6.4 Soils and groundwater
The soils of site F are represented by the Shortlands soil type. Table 4.7 presents a
summary of soil parameters:

- ummaryo SOl parameters or stu ly siteField test results
Geotechnical Derived from geotechnical Soil
Parameters Parameters pH
Clay Plasticity Dry Specific Void Saturated U.S.C.S.
content index density gravity ratio permeability soil
Soil units % PI kg/m3 m/s group
Colluvium 13.70- 6.64- 1661.44- 2.51- 0.47- 6 x 10,9 to CL 3.7-
44.22 14.33 1711.02 2.78 0.67 1 x 10,10 6.7
Nodular 19.72- 6.21- 1739.57 2.72 0.56 6 x 10,10 CL 4.7
ferricrete 39.56 15.89
This study site is characterised by an average clay content of about 32 per cent, thus
providing potential contaminant attenuation within the soil matrix. However, Joubert
(1998) conducted mineralogical analyses using X-ray diffraction on soil samples
(n=28) and found that kaolinite is the dominating clay type, which has a low cation
exchange capacity. Furthermore, Fe oxide was detected in all samples, mostly as
ferricrete. Such ferricrete layers can adsorb significant amounts of metals.
The soils are open structured between a minimum depth of 0.05 m (test pit F/3) and a
maximum of 2.40 m (test pit F/4). The open structured nature of this soil unit should
facilitate preferential vertical infiltration, although the presence of gypsum (observed
at various depths) could close up the pores to reduce vertical infiltration rates. Lateral
preferential flow may occur at the contact of the nodular ferricrete unit with the
overlying soil (at a minimum of 1.00 m in test pit F/3 and a maximum of 2.20 m in
test pit F/2) as ferricrete formation entails precipitation of colloidal Fe oxides that
may close pores to reduce vertical permeability. No perched water tables were
encountered but the basal nodular ferricrete unit present in most of the test pits is
indicative of seasonal high moisture contents or a perched aquifer at the base of the
profiles.
The site is underlain by a dolomitic aquifer. Repeated collapse during drilling, the
recirculation of air during borehole development and the high transmissivity
calculated from pumping tests indicate the presence of karstified features at shallow
depth in this area. In addition, the high transmissivity of the dolomitic aquifer results
in the immediate down gradient migration of contaminants away from the site,
towards a perennial stream in the east. A hydrocensus revealed the presence of 18
boreholes in close proximity to the site, which are used for irrigation of gardens and
swimming pools. One monitoring borehole has been drilled on site and shows a
groundwater yield of approximately 5 lis. The water table was determined at
approximately 11 m below surface. No groundwater quality data were available.
The site shows relatively low concentrations of Mn, Co, Pb, Zn compared to the
average background value for the Vryheid Formation. However Fe shows higher
concentrations than the averaged background, indicating the potential release of Fe
during the pyrite oxidation process. Test pit Fll shows the highest concentrations of
As, Cu, Ni, U and Zn at a depth of about 70 cm, which is characterised as a sandy
clay with abundant gypsum crystals.
Arsenic and Ni show 8-fold higher concentrations than the averaged background,
however their mobility is very low. Very high concentrations of U were found in six
of sixteen samples. Of those, three samples showed concentrations greater than 700
mg/kg, two of them collected from the topsoil. It is likely that the high U
concentrations (which are in the range of gold/uranium ore, Table 2.2) in the soil
emanate from the deposition of radioactive material generated prior to the tailings
disposal by a uranium processing plant (according to staff information of the former
site operator).

TABLE 4.8 - Groundwater quality at site F, measured in January, April and August 1996. Dataobtained from mining company. Recommended maximum limit (RML) according to Aucamp & Vivier(1987).
Sampling pH TDS Alk Ca Mg Na K CI S04 N03 CNdate (mg/I)
Jan. 1996 6.7 2274 158 314 123 132 15 165 869 64 <1Apr. 1996 7.0 1328 162 184 69 102 0.1 216 729 3.5 <0.5Aug. 1996 7.3 1502 n. a. 112 11 100 7.7 176 712 n. a. n. a.
RML 6-9 - 300 150 70 100 200 250 200 6 0.2Note: n. a. means information not available. Accuracy of the analysis, which is outlined in paragraph3.3:January 1996: /).= 14.6 per cent; April 1996: /).= -5.0per cent and August: /).= -28.4 per cent.
These results indicate that groundwater underneath the reclaimed site shows a poor
quality and does not conform with specified drinking water limits of South African
Bureau of Standards (1984) with regard to Ca2+, Mg2+, sol- and N03-. The
groundwater shows a predominant Mg-Ca-S04 character, which becomes more
pronounced with increasing values for total dissolved solids (TDS). The pH is fairly
neutral, although high concentrations of total dissolved solids occurred in January
1996 indicating the acid neutralisation capacity of the groundwater (most likely of
dolomitic nature) in this particular area. Lower concentrations of total dissolved solids
and earth alkali metals in April 1996, in contrast, can be explained with dilution
effects as a result of rainfall recharge to the aquifer. No information regarding heavy
metals in the groundwater was available. A list of geochemical soil data is provided in
Table B.1.
The extractable concentrations of trace elements of all soil samples were determined
and extrapolated to the other sites A-G. The calculation of threshold excess revealed
that Co, Ni and U exceed significantly the threshold concentration. Co reaches an
excess of up to 40, Ni of 72.5 and U of 118.75. The latter due to a very high mobility
of 6.4 per cent at pH values between 3-4. Low threshold excess was found for Cu, Pb
and Zn due to relatively low total concentrations. However, the mobility as shown in
the extraction tests is fairly high for these elements.

The soil pH indicates an pH increase with depths from 4.4 to 6.3 and 4.5 to 5.2,
respectively in two test pits, whereas the two other test pits showed lower pH values
even at greater depths (maximum depth 2.4 m). The fluctuating soil pH conditions
might be a result of the spatial variation of buffer minerals within the soil or a
localised perched water table.
Site F is moderately contaminated (class II) by Mn, Co and Th while the site is
moderately to highly contaminated (class III) by As and Ni, although As seems to
have a very low mobility. In addition, U excessively contaminates (class VI) the site.
Important to note is that U showed a high mobility, thus becoming easily bio-
available to organisms and plants. Groundwater in general is of poor quality, mainly
reflected by high total dissolved solid values.
The mining company is currently in the process of removing residual tailings.
However, high mobility of Co and Ni could complicate efforts to establish a self-
sustaining vegetation cover, as these metals are known to be phytotoxic. The topsoil
shows favourable leaching conditions and soil management measures such as liming
would be required to neutralise acids and to improve growth conditions. Lime would
also enhance the attenuation capacity of the soil.
Uranium concentrations are unacceptably high and a detailed risk-based site
investigation would be necessary to assess the radiological impact on groundwater
and plants, and subsequently, the degree of site rehabilitation required. In addition,
vadose zone and groundwater monitoring is advised as the future contamination
potential (worst-case scenario) of the soil is very high and groundwater underneath
the reclaimed site is of poor quality.

The site situated approximately 4 km north-east of the outskirts of Nigel (Figure 1.1).
The site covers an area of approximately 13 ha and is located at an altitude of ±161O
m above sea level. Surface drainage direction is towards a canal in western direction.
Agricultural activities take place in immediate vicinity of the site. The location of the
test pits is shown in Figure D.?
The reclamation of tailings dam site G has been completed, except some waste rock
material at the south-eastern border. However small volumes of residual tailings
material indicate the presence of the former deposit. Vegetation is poorly developed
and consists of isolated trees and grass.
The reclaimed site G is underlain by sedimentary rocks of the Vryheid Formation
(sandstone and shale).
The soils of the site G are represented by the Avalon soil type. Table 4.9 summarises
the soil parameters for site G:
- ummaryo SOl parameters or stu lY SIteField test results
Geotechnical Derived from geotechnical Soil
parameters Parameters pH
Clay Plasticity Dry Specific Void Saturated U.S.C.S.
content index density gravity ratio permeability soil group
Soil units % PI kg/m3 mls
Colluvium 14.10- 5.78-8.27 1786.21 2.64 0.48 1 x 10⁻⁹ SC 4.0-
24.69 4.8

Nodular 22.63- 7.60-9.48 1782.53 2.68 0.50 I x 10-9 SC,CL 6.3-
ferricrete 31.45 6.9
Lateral preferential flow may occur on the hardpan ferricrete unit that caused refusal
in all the test pits between 1.10 m and 1.50 m. A perched water table occurs between
0.95-1.30 m in all test pits, which could indicate the presence of preferential flow
paths.
Most of the elements show no geochemical pattern except As, having the highest
concentrations in the topsoil. Cobalt, Cu and Th exceed the average background
value. Chromium, Pb, V and Zn, in contrast show lower concentrations than the
average background. A list of geochemical soil data is provided in Table B.l.
Low soil pH values (4.0-4.8) indicate favourable leaching conditions for metals,
which is also reflected in one chemical analysis on seepage water from test pit G/2.
The results ofthe chemical analysis are shown in Tables 4.1Oaand 4.1Ob.
TABLE 4.10a - Chemical analyses showing macro-chemistry and other parameters of seepage water in. G/2test PIt
pH EC TDS Ca Mg Na K CI NOJ HCOJ S04
G/2 mS/m mgll mg/I mgll mg/I mg/I mgll mg/I mg/I mg/I
4.9 670 6802 525 257 227 154 207 <0.1 8 4760
Note: Accuracy of the analysis, which is outlined in paragraph 3.3: ~ = -26.4 per cent (highinaccuracy).

TABLE 4.10b - Chemical analyses showing various metal and CN concentrations of seepage waterfr t t 't G/2om es. Pi
As Cu CN Fe Mn Ni Pb ZnG/2 mg/l mg/l mg/l mg/l mg/l mg/l mg/l mg/l
0.12 0.1 <0.2 431 359 4.4 0.03 0.3
It is apparent that high total dissolved solid values and elevated metal concentrations
are caused by leaching from tailings.
Soil management measures are not required as the tailings were removed and a grass
cover has developed.

Thefollowing site information (study sites H-K) was obtainedfrom a literature survey
and supplemented with data from mining companies. Only limited extraction test or
geochemical soil data were available, thus final conclusions are premature. However,
for some of these sites radiological and groundwater data became available and
supplemented the following site assessments. The structure of the following
paragraphs varies depending on the availability of site-specific data. Those data,
which are not referenced, were provided by mining companies and are confidential.
The site is located in the North-West Province, west of Potchefstroom and is isolated
from industrial or residential development. The reclaimed investigated site covers an
area of approximately 4 ha. The altitude varies between 1373-1560 m above sea level.
Predominant drainage mechanism of the site is sheet-wash in southerly direction. The
drainage has resulted in portions of a floodplain being covered by fine slimes material
originating from the tailings dams. In addition, the residual tailings are heavily eroded
and fine material has spread onto farmland in the direction of prevailing wind. The
quantity of residual tailings material is estimated at 2 million tons for the entire site
(Aucamp, 1997). The position of the auger holes is shown in Figure D.8.
The site is not completely reclaimed and significant quantities of residual tailings
material remain on site. Three other tailings dams and a waste rock dump are situated
within a radius of one km of the investigated site. Vegetation on site comprises poorly
developed grassveld and small shrubs. Exotic trees (including Eucalyptus) occur
around the old mine operations and on top of the disposed material (Aucamp, 1997).
The Department of Minerals and Energy currently is developing a rehabilitation plan
for the site.

The entire area is underlain by dolomite (low chert content) of the Oaktree Formation
(Aucamp, 1997).
Three different dolomite residuum soil and rock units were identified. A chert-rich
residual dolomite occurring in auger holes Hll and Hl2, a shale horizon occurring in
auger hole Hll and a ferricrete-rich and chert-poor soil horizon in auger holes Hl2 and
Hl3. A geotechnical description of the soil is not possible since these data are not
available. However, soil profiling in three auger holes revealed three general soil and
rock units, consisting of a chert-rich topsoil, underlain by a sandy clay with a shale
horizon and a ferricrete and chert-poor horizon (Aucamp, 1997).
The sandy topsoil, which is mixed with varying amounts of tailings would allow a
rapid recharge. This would be enhanced by chert gravel, found in auger hole Hll up to
a depth of approximately 1.50 m. The clayey sand (in auger holes Hl2 and H/3) at the
interface to the overlying soil is, in contrast, relatively impermeable, enhancing lateral
preferential flow. Additionally, lateral preferential flow may occur at the boundary
between the sandy clay and nodular ferricrete units (Aucamp, 1997).
A survey was conducted in the mid 1990s by the Council for Nuclear Safety on the
entire site, which covers approximately 43 ha, to assess risks associated with
dispersing radioactive material contained in the fine tailings. The results clearly
indicate elevated levels of contamination on the mine site, adjoining farmland and in
stream sediments significantly above background values. Background values for
pristine or uncontaminated soils in the Highveld region vary from 15-75 Bq/kg (or
1.2-5.9 mg/kg) of 238U. Each of its radioactive decay products including 226Ra and

232Th, show a similar range. 40K is a widely distributed naturally occurnng
radionuclide usually found at levels of a few hundred Bg/kg in soils (Council for
Nuclear Safety, 1996). Table 4.11 lists the results for different radionuclides:
Table 4.11 - Solid samples collected in November 1995 around study site H. Samples 1,3, 5 and 6k fr 'lth h b ddfr h T dwere ta en ommatena at as een ero e om t e tal mgs ams.
Sample 40K 226Ra 232Th 238U Sampling medium
No.Bq/kg Bq/kg Bq/kg Bq/kg
I 770 285 60 200 Fines accumulated in erosion
channels
3 590 740 45 1300 Fines in water collected in
sump
5 935 1360 100 <400 Sediment on nearby farm land
6 830 200 45 <400 Fines accumulated in erosion
channels
7 200 220 100 7100 Sample taken within the
vicinity of the site
10 440 145 30 <400 Average tailings sample
II 260 20 20 <100 Background sample taken
some distance away on a
ploughed field
The contamination depth in soils varies within the topsoil and the deposits (eroded
tailings dam material) were particularly thick in the streambed. The Council for
Nuclear Safety (1996) concluded that although soils on the nearby farmland and
stream sediments are contaminated with radionuclides, the level of activity is
relatively low and does not cause an immediate radiation hazard. However, in the
long-term the material may disperse and accumulate in certain areas (such as areas
situated in the prevailing wind direction) and could cause an unacceptable long-term
risk. Further investigations including water analyses are ongoing until a final
rehabilitation plan is in place.

Two sets of groundwater measurements from one borehole on site are available and
are presented in Table 4.12.
Table 4.12 - Groundwater chemistry of the site H (Aucamp, 1997).Sampling pH EC N03 S04 HC03 Na K Ca Mg
date mS/m mg/1 mg/1 mg/1 Mg/1 mg/1 mg/I mg/I
June 1998 7.7 338 145.5 2247 329.4 63.2 26.2 521 307
July 1998 7.7 328 - 2552 62.3 66.8 30.3 527 310
Note: Accuracy ofthe analysis, which is outlined in paragraph 3.3: June 1998: ~ = 0.1 per cent (veryhigh accuracy) and July 1998: ~ = -4.1 per cent (high accuracy).
High concentrations of S042- indicate the impact of acid mine drainage on
groundwater quality. High concentrations of Ca2+ and Mg+ are a result of the
dissolution of dolomitic rock causing neutral pH conditions.
Extraction tests, using the 2 mm particle size fraction, were conducted to assess the
current contamination impact. Extractable concentrations of Ni, Zn and Cd in the soil
increase where nodular ferricrete is more distinctly developed in the soil. The
extractable concentrations of Cr and Cu do not reflect a clear geochemical pattern. It
can be concluded that Cd poses a hazard in the ferricrete, reflected by a threshold
excess of almost 10. Copper, Ni and Zn pose a hazard in both the ferricrete-poor soil
and the ferricrete. Mercury does not pose a hazard, because the mobile portion in soils
is very low (Aucamp, 1997).
No hazard rating could be established for this site. However, high concentrations of
sol- in groundwater indicate the migration of acid mine drainage into the aquifer.
Residual tailings material on the surface would provide a long-term source for further
pyrite oxidation and contaminant remobilization.
The dispersion of tailings material and subsequent accumulation on farmland and in
stream sediments as a result of wind erosion, is a concern in terms of agricultural land
use. In addition, a variety of trace elements such as Co, Cu, Ni and Zn are extractable
and could complicate efforts to establish a self-sustaining vegetation cover on site.
The high levels of trace elements and radionuclides would require a detailed risk-
based site investigation (site is here considered as the entire area of approximately 43
ha) as the long-term risks for the groundwater and surface exposure routes (plants,
animals, humans and environment) are currently unknown. In addition, vadose zone
(pH, redox conditions and trace element concentrations in seepage by using
lysimeters) and groundwater monitoring is advised as the future contamination
potential (worst-case scenario) of the site seems to be very high and groundwater
underneath the reclaimed site shows a poor quality.
The residual tailings material should be covered using an impermeable cover to
prevent further wind dispersion of fine tailings and to reduce seepage and, thus
minimising acid mine drainage. Soil management measures would be required to
neutralise acids and improve growth conditions.
The site is located adjacent to the R23 (Old Heidelberg Road) between Brakpan and
Heidelberg (Figure 1.1). A township is situated less than 2 km east of the tailings dam
and farming is taking place in the immediate surroundings of the deposit. A perennial
stream flows through a wetland system in a north-westerly direction at a distance of
less than one km from the western boundary of the site. The area slopes gently in a
westerly direction towards the wetland system. Surface run-off is controlled and
limited by a drainage collection system surrounding the tailings dam.

The tailings dam comprises a southern compartment, which is currently reclaimed and
retreated, and a northern compartment (active dam) where gold mine tailings are
currently disposed at a rate of approximately 950000 tons/day, using the cycloned
deposition approach. Disposal activities commenced in 1985 and will be completed in
2005. The maximum dam wall height of the current active dam is over 60 m and the
target height is anticipated to be approximately 85 m above lowest ground level. The
current active dam covers an area of 870 ha, whereas the entire affected area, which
includes the reclaimed portion, is approximately 1400 ha. No vegetation occurs on the
reclaimed site (southern portion) due to the ongoing reclamation operation. A portion
of the active slope wall was grassed in order to prevent wind erosion (Figure E.7).
The tailings dam is mainly underlain by andesitic lava of the Ventersdorp Supergroup,
quartzite of the Black Reef Formation, dolomitic rocks of the Oaktree and Monte
Christo Formations, sandstone and mudstone of the Dwyka and Vryheid Formations
and post-Karoo dolerite intrusions. However, doleritic and dolomitic rocks cover the
largest portion of the area.
The tailings dam is surrounded by monitoring boreholes, which are sampled on a
quarterly basis in order to determine the groundwater quality (total dissolved solids,
pH, EC, alkalinity, total hardness, major cations and anions, CN, As, Fe and Mn) at
various depths and distances away from the tailings dam. An extensive geotechnical
study was launched as part of the feasibility study for the northern tailings dam in the
mid 1980s. This comprised core drilling, the excavation of a large number of test pits
and a soil survey in the area now covered by the tailings dam. Pump tests have been
conducted to assess the hydrogeological properties of the aquifer underneath the site.
As a result, detailed geological and hydrogeological information was available and
incorporated into a numerical groundwater model.
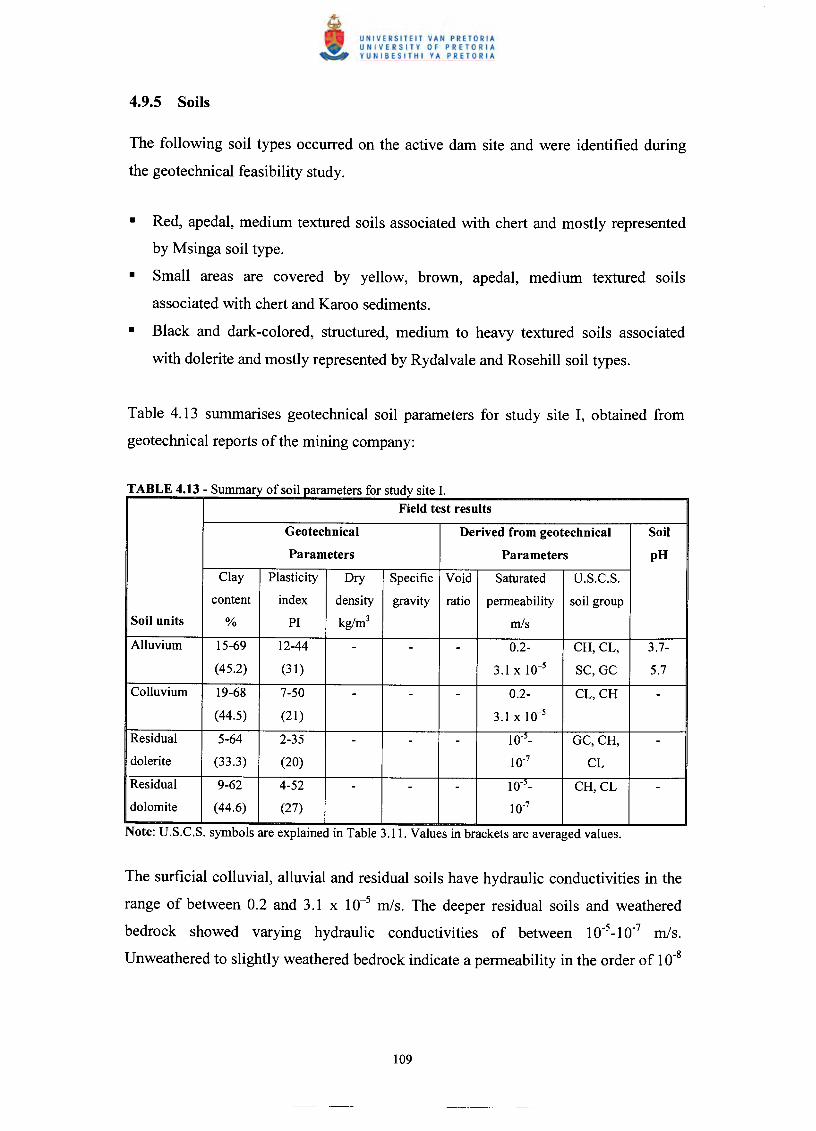
The following soil types occurred on the active dam site and were identified during
the geotechnical feasibility study.
Red, apedal, medium textured soils associated with chert and mostly represented
by Msinga soil type.
Small areas are covered by yellow, brown, apedal, medium textured soils
associated with chert and Karoo sediments.
• Black and dark-colored, structured, medium to heavy textured soils associated
with dolerite and mostly represented by Rydalvale and Rosehill soil types.
Table 4.13 summarises geotechnical soil parameters for study site I, obtained from
geotechnical reports of the mining company:
- ummary 0 SOl. parameters or stu lY site .Field test results
Geotechnical Derived from geotechnical Soil
Parameters Parameters pH
Clay Plasticity Dry Specific Void Saturated U.S.C.S.
content index density gravity ratio permeability soil group
Soil units % PI kglm3 m/s
Alluvium 15-69 12-44 - - - 0.2- CH,CL, 3.7-
(45.2) (31) 3.1 x 10⁻⁵ SC,GC 5.7
Colluvium 19-68 7-50 - - - 0.2- CL,CH -(44.5) (21) 3.1 x 10⁻⁵
Residual 5-64 2-35 - - - 10-5_ GC,CH, -dolerite (33.3) (20) 10-7 CL
Residual 9-62 4-52 - - - 10-'- CH,CL -dolomite (44.6) (27) 10-7
The surficial colluvial, alluvial and residual soils have hydraulic conductivities in the
range of between 0.2 and 3.1 x 10⁻⁵ mls. The deeper residual soils and weathered
bedrock showed varying hydraulic conductivities of between 10-5_10-7 mls.
Unweathered to slightly weathered bedrock indicate a permeability in the order of 10-8
mls. A soil survey conducted at the reclaimed dam indicates the presence of soils of
the Arcadia soil type.
Groundwater flow occurs under unconfined to semi-confined conditions.
Groundwater levels are shallow (mean between 1-2 m) and a significant groundwater
mound has developed underneath and in close proximity to the tailings dam. The
groundwater mound seems to be better developed where dolerite rocks, showing a
lower permeability than dolomite, and clayey and silty weathered formations, is
present. These areas are generally wet due to seepage.
Farther away from the tailings dam, groundwater levels seem to reflect the
topographical gradient towards the west. However, groundwater drainage takes place
radially, in a westerly, north-westerly and northerly direction towards two rivers and
with an average hydraulic gradient < 2 per cent.
Many boreholes close to the tailings dam are artesian, indicating that the tailings dam
is hydraulically connected with deeper rock fracture systems underlying superficial
soils and highly weathered bedrock. Monitoring boreholes drilled into the shallow and
deeper aquifer system revealed slightly higher groundwater levels in the shallow
boreholes (compared to shallow boreholes farther way) and thus indicating that
seepage originated from the tailings dam.
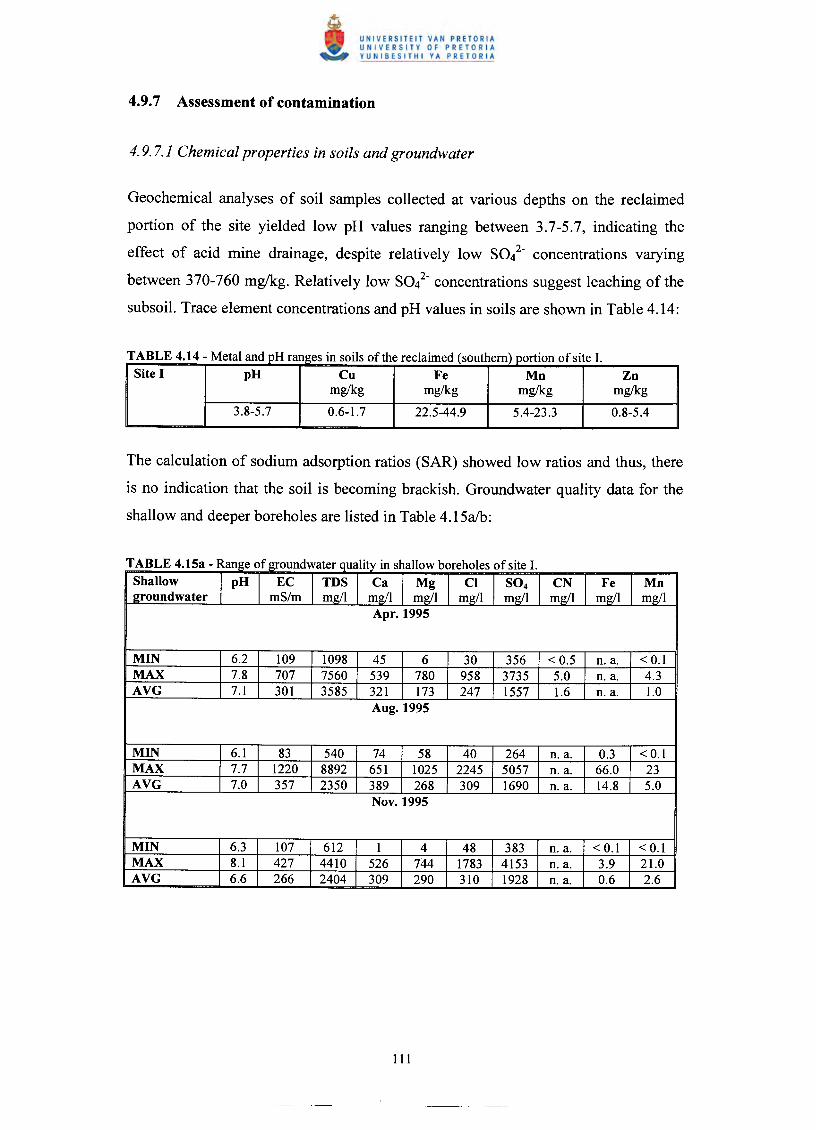
Geochemical analyses of soil samples collected at various depths on the reclaimed
portion of the site yielded low pH values ranging between 3.7-5.7, indicating the
effect of acid mine drainage, despite relatively low sol- concentrations varying
between 370-760 mg/kg. Relatively low sol- concentrations suggest leaching of the
subsoil. Trace element concentrations and pH values in soils are shown in Table 4.14:
- eta an .pJ ranges III SOlsot e ree aIme sout em portIOn 0 SIte .Site I pH Cu Fe Mn Zn
mg/kg mg/kg mg/kg mg/kg
3.8-5.7 0.6-1.7 22.5-44.9 5.4-23.3 0.8-5.4
The calculation of sodium adsorption ratios (SAR) showed low ratios and thus, there
is no indication that the soil is becoming brackish. Groundwater quality data for the
shallow and deeper boreholes are listed in Table 4.15a1b:
TABLE 4.15a - Range of groundwater quality in shallow boreholes of site I.Shallow pH EC TDS Ca Mg CI S04 CN Fe Mne:roundwater mS/m mg/I mg/I mg/I mg/I mg/I mg/I mg/I mg/I
Apr. 1995
MIN 6.2 109 1098 45 6 30 356 <0.5 n. a. < 0.1MAX 7.8 707 7560 539 780 958 3735 5.0 n. a. 4.3AVG 7.1 301 3585 321 173 247 1557 1.6 n. a. 1.0
Aug. 1995
MIN 6.1 83 540 74 58 40 264 n. a. 0.3 < 0.1MAX 7.7 1220 8892 651 1025 2245 5057 n. a. 66.0 23AVG 7.0 357 2350 389 268 309 1690 n. a. 14.8 5.0
Nov. 1995
MIN 6.3 107 612 1 4 48 383 n. a. < 0.1 < 0.1MAX 8.1 427 4410 526 744 1783 4153 n. a. 3.9 21.0AVG 6.6 266 2404 309 290 310 1928 n. a. 0.6 2.6

Apr. 1996
MIN 6.3 107 612 20 121 57 302 n. a. < 0.1 < 0.1MAX 8.1 1038 8932 436 776 1801 4295 n. a. 2.6 24.7AVG 6.6 306 2822 222 283 288 1783 n. a. 0.3 4.0
- ange 0 groun water quality in deeper boreholes 0 site I.Deeper pH EC TD8 Ca Mg CI 804 CN Fe Mn2roundwater mS/m mg/l mg/l mg/l mg/l mg/l mg/l mg/l mg/l
Apr. 1995
MIN 6.8 31 270 22 4 8 31 <0.5 n. a. < 0.1MAX 8.4 785 6510 601 863 1108 3751 4.2 n. a. 29.3AVG 7.3 269 2402 291 119 217 1418 0.7 n. a. 4.4
Aug. 1995
MIN 6.2 35 256 73 19 8 35 n. a. n. d. < 0.1MAX 7.9 951 7008 757 796 1516 4015 n. a. 73.0 28.0AVG 7.0 310 2278 381 216 244 1456 n. a. 14.0 5.0
Nov. 1995
MIN 6.6 27 188 27 26 12 43 n. a. < 0.1 < 0.1MAX 8.5 749 7414 1448 750 1166 3254 n. a. 10.7 21.0AVG 6.0 262 2555 329 219 180 1123 n. a. 1.1 2.6
Apr. 1996
MIN 6.6 27 188 27 26 12 43 n. a. < 0.1 < 0.1MAX 7.9 622 4874 426 444 1026 2919 n. a. 65.0 4.5AVG 6.8 236 2058 193 220 190 1230 n. a. 5.8 1.2
The high concentrations of total dissolved solids (TDS) in shallow and deeper
groundwater are a result of seepage from the pond, containing high loads of sol- and
Cr. Considerable concentrations of Ca2+ and Mg2+ are caused by the dissolution of
dolomitic aquifer material, leading to fairly neutral pH conditions. There is no
distinctive trend indicating a polluted shallow aquifer and a less polluted groundwater
deeper system.

A limited number of groundwater and surface water samples were analysed for
radionuclides, indicating that surface water systems show far higher radioactivity than
groundwater samples. However, concentrations and activities are low and within
recommended concentrations of DW AF for domestic use (l996a) and agricultural use
(l996d).
Generally, samples from the shallow boreholes show higher total dissolved solid,
sol-, Na+ and cr concentrations than those obtained from the deeper monitoring
boreholes. As a result, most of the groundwater samples obtained during the
monitoring survey show a predominant Ca-Mg-S04 signature, which is typical of
water affected by acid mine drainage.
However, deeper monitoring boreholes further away from the tailings dam show a
better groundwater quality than samples from the shallow boreholes in the area
between the tailings dam and the main drainage features, due to natural dilution
effects and attenuation processes.
The shallow and deep boreholes in close proximity to the tailings dam exceed the
crisis limits for sol- of 1200 mg/l, whilst those further away show concentrations
which fall between maximum permissible of 600 mg/l and the crisis limit of 1200
mg/kg (South African Bureau of Standards, 1984). Heavy metal analyses were
conducted on a random basis. Elevated concentrations of As, Cd, Co, Fe, Mn and Ni
were found at almost neutral pH values (pH varies between 5.4-7.4) and indicate
seepage draining from the tailings dam into the aquifer. It is important to note that
similar contaminants were also found in elevated concentrations in soil samples at
reclaimed sites (study sites A-G). Surface water samples taken along the adjacent
river showed high concentrations of sol- at fairly neutral pH conditions (6.0-7.6),
indicating acid mine drainage.

A numerical groundwater model was applied to estimate the degree of future
contamination. The model supported the assumption of groundwater drainage radially
away from the tailings dam and towards the surface drainage features. The model was
run for 50 years, which represents 40 years after final rehabilitation and closure
(scheduled for the year 2005). A groundwater risk assessment using Monte-Carlo
simulations indicates a low impact on surface water resources downstream of the
tailings dam. Salts contained in seepage from the tailings dam represent less than 0.5
per cent of the total salt load of the nearby river. It is estimated that salts in seepage
would contribute less than 2.5 per cent to the total salt load after 50 years.
In conclusion, groundwater in close proximity to the tailings dam has been polluted
by seepage from the tailings dam, but groundwater quality further away suggests that
drainage features such as the river have a much larger impact than the tailings dam.
The development of a groundwater mound underneath the active dam is of major
concern as contaminants can migrate from the pond directly into the dolomitic aquifer
without or insufficient attenuation. The Ca-Mg-S04 signature of groundwater
underneath and in close proximity to the active tailings dam clearly indicates such
migration. High hydraulic conductivities along rock fractures and fissures would
allow rapid dispersing of contaminants, and thus causing risks in the long-term.
However, a detailed site investigation was conducted and a water quality monitoring
program is ongoing. New monitoring data should be implemented into the present
groundwater model (as part of the risk management), which allows verifying and
refining predicted scenarios. It is anticipated that after decommissioning of the slurry
disposal (in the year 2005) on the active dam site, the surface will be covered with an
impermeable soil layer to prevent wind erosion (which is currently significant) and to
minimise rainfall infiltration.
It must be noted that portions of the slope wall are already covered with soil (Fig. E.7,
Appendix E) and the mining company is currently assessing various cover options. It
is recommended to investigate the reclaimed portion of the site in more detail, as the
presence of phytotoxic elements is most likely, complicating efforts to establish a
self-sustaining vegetation cover on this portion of the site. Soil management measures
are required to improve growth conditions and to enhance the attenuation capacity of
the soil.
Site J is located south of Brakpan (Figure 1.1), in the immediate vicinity of a wetland
system on its western border and covers an area of approximately 117 ha. A large
township is located approximately 2 km from the eastern border of the site. The
wetland extends from the western border of site J along a non-perennial stream, and
terminates at the confluence with another perennial stream, which eventually drains
into the Vaal dam. Drainage direction is south-westerly towards the wetland system.
The site is currently in the process of reclamation and a small quantity of tailings
remains on surface. Vegetation, comprising some trees is poorly developed.
The tailings dam area is underlain by sedimentary rocks of the Dwyka Formation
(diamictite and shale).

A geochemical pollution study was conducted in the wetland system next to the
tailings dam, indicating acid mine drainage escape from this study site. Soil samples
were taken at five different sampling points down-gradient of the site. Twenty one
vibracore holes were drilled up to a maximum depth of 2 m along a traverse
approximately 300 m long and adjacent to site J. From these boreholes, sediment and
water samples were obtained and analysed for their contamination levels.
Furthermore, a surface water sampling point of Rand Water is located downstream of
the tailings dam and monitored for its water quality.
In addition, the operating mining company of the tailings dam drilled one borehole on
the north-eastern border of the site to monitor groundwater quality and to conduct
aquifer testing. The borehole remained dry even at a depth of 40 m. As a result, no
groundwater data are available for this site. However, a hydro census conducted by the
operator resulted in groundwater quality data for one borehole up-gradient of the site.
Information of the soils underlying the tailings dam area were obtained from a
borehole log of the proposed monitoring borehole, drilled on the north-eastern border
of site J. The borehole log indicates a clayey, sandy material, which is considered to
be the weathering product of the Karoo sediments underneath. The thickness of the
clay layer in that particular borehole profile is approximately 7 m.
Soils down-gradient of the site consist of a mixture of soil and yellow oxidised
tailings underlain by a red to dark brown clayey soil (due to ferric oxides) with
abundant ferruginous concretions. The clay consists predominantly of kaolinite at
shallow depths and montmorillonite at greater depths.
Owing to a lack of geotechnical data, no hydrogeological characterisation of the
unsaturated zone was possible.
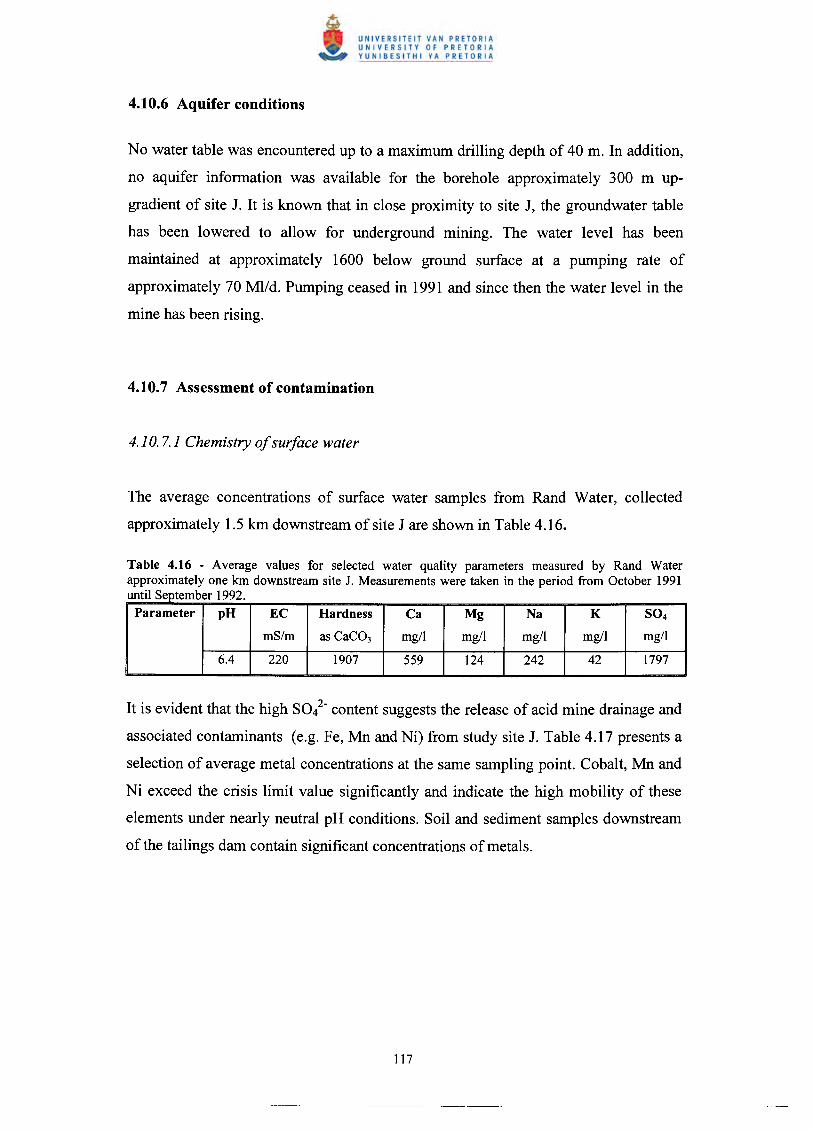
No water table was encountered up to a maximum drilling depth of 40 m. In addition,
no aquifer information was available for the borehole approximately 300 m up-
gradient of site J. It is known that in close proximity to site J, the groundwater table
has been lowered to allow for underground mining. The water level has been
maintained at approximately 1600 below ground surface at a pumping rate of
approximately 70 MIld. Pumping ceased in 1991 and since then the water level in the
mine has been rising.
The average concentrations of surface water samples from Rand Water, collected
approximately 1.5 km downstream of site J are shown in Table 4.16.
Table 4.16 - Average values for selected water quality parameters measured by Rand Waterapproximately one kIn downstream site J. Measurements were taken in the period from October 1991
'IS b 1992untI eptem erParameter pH EC Hardness Ca Mg Na K 804
mS/m as CaC03 mg/I mgll mgll mgll mgll
6.4 220 1907 559 124 242 42 1797
It is evident that the high SO/- content suggests the release of acid mine drainage and
associated contaminants (e.g. Fe, Mn and Ni) from study site J. Table 4.17 presents a
selection of average metal concentrations at the same sampling point. Cobalt, Mn and
Ni exceed the crisis limit value significantly and indicate the high mobility of these
elements under nearly neutral pH conditions. Soil and sediment samples downstream
of the tailings dam contain significant concentrations of metals.

Table 4.17 - Average metal concentrations at a Rand Water sampling point approximately one kIndownstream of site J. Measurements were taken in the period of October 1991 until September 1992.C .. r't d' t A & V" (1987)fISIS Iml accor mg 0 ucamp IVler
Parameter As Co Cr Cu Fe Mn Ni
mg/l mg/l mg/l mg/l mg/l mg/l mg/l
Sampling 0.0008 2.8 0.003 0.13 0.01 14 13.4
Crisis limit 0.6 1 0.4 2 2 2 1
Table 4.18 represents data from four different water quality sampling points, which
are approximately 2, 2.5,5 and 7 km downstream of tailings dam site J.
concentrations in mg 1.Distance pH Eh EC 804 HC03 Ca Co Fe Mn Zn
Downstream mV mS/m
2 kIn (a) 5.8 94.4 320 1517 18.9 564 4 < 1 21 16
2.5 kIn (b) 5.4 118.7 310 1428 15.7 561 4 < 1 22 13
5.0 kIn (c) 6.6 48.7 210 759 91.1 289 < 1 < 1 6 <5
before confluence
7.0 kIn (d) 7.4 5.8 200 893 116.3 273 < 1 < 1 < 1 <5
after confluence
The table above indicates the improvement in water quality as the distance to the
tailings dam from the study site increases. Although the pH becomes fairly neutral at
sampling point (d), SO/- concentrations still exceed the maximum allowable
concentration of 600 mg/l (South African Bureau of Standards, 1984). Thus, water
treatment needs to be considered before using the water for domestic or agricultural
purposes. High Ca2+ concentrations might be caused by lime treatment of slime,
which causes a rise of pH. Metal concentrations of Mn and Zn decrease significantly
farther downstream as a result of dilution effects. Redox conditions (Eh values)
indicate a slight oxidising milieu. Rivers and streams show generally Eh values in the
order of 400 mY.

A radiometric survey has shown that significant amounts of U and Th are leaving the
tailings dam site J and entering the wetland system, where both seem to be partially
adsorbed by peat. Total a-activity was about 2 Bq/l downstream oftailings dam site J,
(corresponding to sample (a) in Table 4-18) and 0.4 Bq/l approximately 5 kIn
downstream (similar to sampling point (c) in Table 4-18), thus indicating a significant
decrease of concentration caused by dilution and adsorption on organic material such
as peat.
Peat samples downstream of the tailings dam at site J contain very high
concentrations of trace elements as a result of adsorption. Results for some trace
elements are shown in Table 4.19:
- race e ement concentratIOns ill a peat sample near sIte .Element Cd Co Cu Pb Zn Th U
mglkg mglkg mglkg mglkg mglkg mg/kg mglkg
25 946 438 261 931 110 195
It is apparent from Table 4.20 that all considered trace elements occur in anomalous
concentrations in soil samples affected by seepage from tailings dam site J.
TABLE 4.20 - Trace element concentrations of soil and sediment samples in close proximity to site J(n = 53).Element As Co Cu Cr Ni Pb Zn
mglkg mglkg mglkg mglkg mg/kg mglkg mglkg
MIN 1 15 4 35 42 17 23MAX 2040 6117 1071 713 17844 247 10516AVG 455 582 274 340 1882 69 1095Standard 523 1096 290 194 2948 55 1744deviation
Factor above
average 21 42 7.9 2.6 41.8 4.6 10.6background

Affected soils, sediments, peat and the wetland systems act as a metal pool
downstream of the tailings dam, accumulating considerable amounts of metals,
because heavy metals seem to be immobilised under prevailing pH (fairly neutral)
conditions and the presence of organic material. Sulphate-reducing bacteria in the peat
may also lead to precipitation of cha1cophile elements from solution as sulphides.
The extremely high metal concentrations in soils and sediments down-gradient of the
study site J pose a long-term environmental risk. Phytotoxic elements such as Co and
Ni in soils and sediments would complicate efforts to establish a self-sustaining
vegetation cover, even if only a minor portion of the total element concentration is
mobile.
A detailed risk-based site investigation is recommended, which should extend to the
affected soils and sediments down-gradient of the site. In addition, vadose zone
monitoring is advised, as the future contamination potential (worst-case scenario) of
affected soils and sediments is considerably high.
Site K is situated north of Springs in immediate vicinity of a large tailings dam
(Figure 1.1). The tailings dam covers an area of approximately 111 ha and is situated
at an altitude of ± 1600 m above sea level. Surface drainage follows the topographical
gradient, which is reflected by a gentle slope towards the north.

The tailings dam was used for the disposal of slurry during the period 1969 to 1994.
Since 1994 the tailings dam has been in the process of reclamation. The current
reclamation status is estimated with 15 per cent of the total volume having been
reclaimed. No vegetation occurs on site K.
The northern part of the tailings dam is underlain by dolomite, whilst the southern
part is underlain by Karoo sedimentary rocks (the formation is not known). The
thickness of Karoo rocks to the south of the tailings dam varies from 6-15 m. Two
NW -SE trending dolerite dykes occur below the tailings dam. A third narrower dyke
occurs towards the west of the site. A dolerite sill with a thickness between 10-20 m,
occurs at depths of about 20-40 m below the site, and outcrops to the north of the
dam.
A number of boreholes have been drilled in order to monitor the groundwater quality
(on a quarterly basis) affected by acid mine drainage released from the tailings dam as
well as to abstract contaminated groundwater down-gradient of the site.
The tailings dam is directly underlain by a zone of transported and residual clayey
soils with a thickness of up to 5 m. In order to assess the role of the perched aquifer
system, a soil field survey was launched and a number of auger holes were drilled to
depths between 2-5 m. Clayey sands dominate the unsaturated zone to a depth of a
few metres.
A perched aquifer was encountered at a general depth of 3 m. A permeability test on a
sample taken from a depth of 1.8 m above the perched aquifer indicated a very low
hydraulic conductivity in the order of 10-10 mls.
Furthermore, three different aquifers have been identified in the course of a detailed
groundwater study:
• Perched water tables, occurring above shallow ferricrete or clay horizons at depths
between 3-5 m below surface.
• Semi-confined weathered and fractured aquifer, occurring at depths of about 20-
30 m. The base of the aquifer comprises less fractured dolomitic rocks. The semi-
confined aquifer is hydraulically connected to the underlying fractured aquifers
within the dolomite. Preferential flow paths are associated with zones of highly
weathered/residual dolomite (wad) and highly fractured zones along dyke contacts
and faults. Preferential flow paths, which are characterised by higher
permeabilities, are likely to be the main zones of contaminant transport.
• Confined fractured aquifers, occurring at depths below 30 m in fractured zones
within the unweathered hard rock dolomite, as well as along dyke and sill contact
zones. Due to recharge from the semi-confined aquifers above the deeper aquifer,
groundwater contamination is likely.
The presence of north-striking dykes and fractures (zones of higher permeability)
results in preferred contaminant migration towards a stream channel to the north.
Different groundwater tables around the north-west comer of the tailings dam suggest
a compartmentalisation of the semi-confined aquifer by dyke systems.

The impact and extent of soil contamination underneath the study site is unknown
since only a minor portion has been reclaimed. However, only limited groundwater
quality data were available.
High sol- concentrations (range of 1000-2800 mg/l) in abstraction and monitoring
boreholes around and on the site indicate the impact of acid mine drainage released
from the tailings dam. The pH values are neutral to slightly alkaline with an average
value of7.9 in groundwater samples collected beneath the tailings dam, indicating the
presence of buffer minerals and the effect of recharge. Cobalt, Cu, Fe, Ni, Mn, Zn
concentrations measured from groundwater samples and sampled from piezometers in
the dolomitic aquifer are below the recommended maximum limit (South African
Bureau of Standards, 1984) for domestic use. Sulphate concentrations range between
200-600 mg/l with a maximum concentration of > 2000 mg/l in one groundwater
sample.
However, analyses conducted on effluent samples collected around the study site
show significantly higher concentrations with respect to Co, Cu, Fe, Ni and Mn than
those sampled in the dolomitic aquifer. The pH is extremely low (around 2) resulting
in the dissolution of metals. Total dissolved solids concentrations are extremely high
in these samples and reach a mean of 14600 mg/l reflecting high salt loads. Hence, the
fairly neutral pH in the groundwater is caused by the high buffer capacity of the
dolomitic groundwater in the area. Metal mobility is relatively low under these pH
conditions, despite high salt concentrations.
A numerical groundwater model was used to assess the future contamination impact.
The modelling exercise has indicated very small changes in groundwater quality after
complete reclamation of the tailings dam. However, potential effects of removal,
including remobilization of contaminants or the seepage from residual paddocks, have

not been included in the model. The impact of remobilization of contaminants is
considered to be likely to be short-term only, based on the results of the model.
Additionally, the effect of paddocks on groundwater quality is not likely to result in a
considerable redistribution of contaminants.
Vadose zone monitoring on the reclaimed portion and groundwater monitoring up-
and down-gradient of the study site is advised as the future contamination is likely to
be high. This is already indicated by contaminated groundwater underneath the site.
The removal of the remaining tailings might improve water quality in the long-term,
but a risk-based site investigation is recommended once the reclamation is completed.
New monitoring data should be integrated into the present groundwater model to
verify and to refine predicted scenarios.

The unsaturated zone is considered to be both a barrier (geochemical and physical)
and a pathway between the primary contamination source (i.e. tailings dam) and the
receiving aquifer. Consequently, the properties of the unsaturated zone defme the
degree of aquifer vulnerability. Water movement and contaminant attenuation
conditions have the potential to mitigate the contamination of the groundwater
system. However, once this barrier has become contaminated, it can also act as a
source for ongoing groundwater contamination. Figure 5.1 illustrates the various
contaminant pathways of tailings impoundments.
EvaporationitiWind erosion •
1----= :groiil 0 -;-NE- o..~ J ~~
0N
< ca o..m .~ .~z 'a;;l - III
~ ••-----
=~~<m
FIG. 5.1 - Conceptual model of a cross-section of a tailings impoundment depicting variouscontaminant pathways (modified after Parsons & Jolly, 1994).

In most mining operations it is common practice to discharge all contaminated
effluents from the ore processing facility to the tailings impoundment. Therefore,
minimising the quantity of ponded water escaping from the impoundment will be
necessary to avoid pollution, and forms an integral part of best practice environmental
management.
5.2 CHARACTERISATION OF THE PRIMARY CONTAMINATION
SOURCE
The major and trace element chemistry of five different tailings dams, situated in the
East Rand area south-east of Johannesburg is shown in Tables 2.6a and 2.6b. Samples
were collected at different gold mine tailings dams from the oxidised zone up to a
maximum depth of approximately one metre. It was found that gold mine tailings
contain significant concentrations of trace elements. In addition, the mobility of
various trace elements in 13 tailings samples was investigated. The extractable
concentrations and the relevant threshold value for soils are presented in Table 5.1.
TABLE 5.1 - Extractable elements in gold mine tailings (1 M NH4N03 soil extraction method).Samples were obtained from five different tailings dams in the East Rand area (n=13). Extraction testd fi T . d' T bl B 4 Thr h Id I fi '1 ft P B I (1991)ata or tal ill s are summarlse ill a e - es 0 va ues or SOls a er rile et a.Element 25th percentile 75th percentile Threshold
mg/I value value for soils
As n. d. n. d. 0.1Ca 860 1770 n.a.Co 1 17.5 0.5Cr n. d. 2.25 0.1Cu 2.5 12.52 2Fe 2.5 55 n.a.Mg 72.5 802.5 n.a.Mn 2.5 27.5 n.a.Ni 2.5 57.5 IPb n. d. 0.5 2S 1257.5 4837.5 n.a.U n. d. n. d. 0.04Zn 1.5 27.5 10

The extractable portions of Co, Cr, Cu, Ni, Pb and Zn in the bulk of the tailings
samples exceed the threshold value for soils. High concentrations of S (maximum >
10000 mg/l) in the leachate indicate the oxidation of sulphide minerals such as pyrite
resulting in acid mine drainage. It can be summarised that all investigated reclaimed
sites have shown soils with elevated concentrations of contaminants, which are
typically contained in tailings material. This clearly indicates the escape of acid mine
drainage and associated contaminants from the impoundment into the unsaturated and
saturated zones.
In addition, Hahne et al. (1976) reported that Al is the predominant extractable cation
in mine residue samples and is a prime hazard for the soils underneath mine deposits
due to its phytotoxic effects.
It is interesting to note that no correlation was found between total element
concentrations and sampling depth within the oxidised zone of the investigated
tailings dams in the East Rand area (Rosner et aI., 1998). Steffen, Robertson &
Kirsten (1988) reported similar findings.
The soil underneath reclaimed tailings dams has been contaminated with various trace
elements and salts. Table 5.2 summarises the trace element and Fe concentrations in
soils underneath the reclaimed study sites. Average background values for the
relevant geological units (Vryheid Formation and Malmani Subgroup) are listed in
Table 3.10.

TABLE 5.2 - Trace element concentrations in soils underneath the study sites (n=81). UnderlinedI . d' th fi Id f h I b k d Iva ues In Icate more an a two- 0 excess 0 t e re evant average ac ,groun va ue.
Study sites
Element (75th percentile values)
A B C D E F GAs mglkg 53.5 19.8 26.3 24.5 22.8 28.8 40.0
Co mglkg 15.0 33.0 40.5 52.5 33.3 26.3 21.3
Cr mg/kg 346.0 351.0 252.8 192.8 303.0 208.3 129.8
Cu mglkg 81.5 131.3 51.0 93.8 53.5 64.3 42.25
Fe % 10.6 13.0 10.5 9.6 7.6 8.53 4.5
Ni mglkg 72.5 158.0 76.3 111.8 85.5 144.0 73.0
Pb mglkg 23.25 13.5 18.0 21.0 21.0 10.8 4.8
Zn mglkg 75.0 93.8 38.8 53.3 57.8 84.5 44.0
Th mglkg 14.8 18.3 18.8 18.0 17.0 20.0 19.3
U mglkg 10.8 n. d. 8.0 n. d. n. d. 818.0 n. d.
The 75th percentile values (Table 5.2) for some elements significantly exceed the
average background value for the relevant lithological unit (Table 3.10). However, the
total element concentration is a poor reflection of trace element bio-availability.
Therefore, Table 5.3 summarises the results of the soil extraction compared with a
given threshold concentration after PriieB et al. (1991):
TABLE 5.3 - Threshold excess ratio of trace elements in soil samples of study site F (n = 16).E . d fi'l . d' T bl B (A d' B)xtractlOn test ata or SOls are summanse In a e .5 \'PI en IX
As Co Cr Cu Ni Pb U Zn
MAX 0 40.0 12.5 3.8 77.5 0.5 1500.0 6.3
AVG 0 8.1 0 0.35 14.8 0 105.1 1.3
Number of samples 0 10 1 5 11 2 3 10
with ratio> 1
Extractable concentrations of Co, Ni and Zn exceed their threshold values for soils in
more than 50 per cent of the investigated samples. For each element, threshold
concentrations are exceeded to the greatest extent in the topsoil samples. There is also
a decrease in threshold excess with depth as a result of a reduced vertical migration
(attenuation).

Furthermore, Cr, Pb and U exceed the threshold in at least one soil sample. Uranium
exceeds the threshold to the greatest extent, being 1500 times above the threshold
concentration in one sample at study site F. The high U concentrations emanate from
radioactive waste material from an former uranium extraction plant. The radioactive
material has been deposited on the site prior to the establishment of the tailings dam.
Extractable As concentrations were in all instances below the detection limit of the
analytical technique and as such did not exceed the threshold value of 0.1 mg/I.
Detection limits for XRF and ICP-MS techniques are presented in Table 3.3a, 3.3b
and 3.4, respectively.
The mobility of various elements in soil samples of study site F is shown in Table 5.4.
Extractable trace element concentrations are expressed as a percentage of the total
element concentration.
TABLE 5.4 - Mobility (in percentage of the total concentration) of elements in soil samples from studysite F (n=16). Average values were only calculated if more than two samples showed a value largerthan 0 per cent. The MIN values were in all instances below 0.1 per cent mobility. All data aresummarised in Table B.6.
As Co Cr Cu Fe Ni Pb U Zn
% % % % % % % % %
IMAX - 66.7 0.5 8.3 19.3 50.7 12.5 6.4 39.1
~VG - 14.9 - 0.9 1.8 8.6 - - 11.4
Cobalt, Ni and Zn are the most mobile trace elements and the mobility decreases for
each element with increasing soil depth due to attenuation. The elements are most
mobile in the topsoil units of the test pits. This suggests that a significant portion of
the Co, Ni and Zn amount in each soil sample is present in the mobile, easily soluble
and exchangeable portions.
Figure 5.2 below shows the relation between soil depth and pH on a site-specific base,
where the soil pH increases with increasing depth (best-fit curve). This can be a result
of buffering reactions by minerals such as carbonates or alternatively, by a fluctuating
shallow groundwater table, which causes mixing and dilution effects with dolomitic
groundwater. It is evident that some sites show a more distinct trend (e.g. sites B, E
and G) than others.
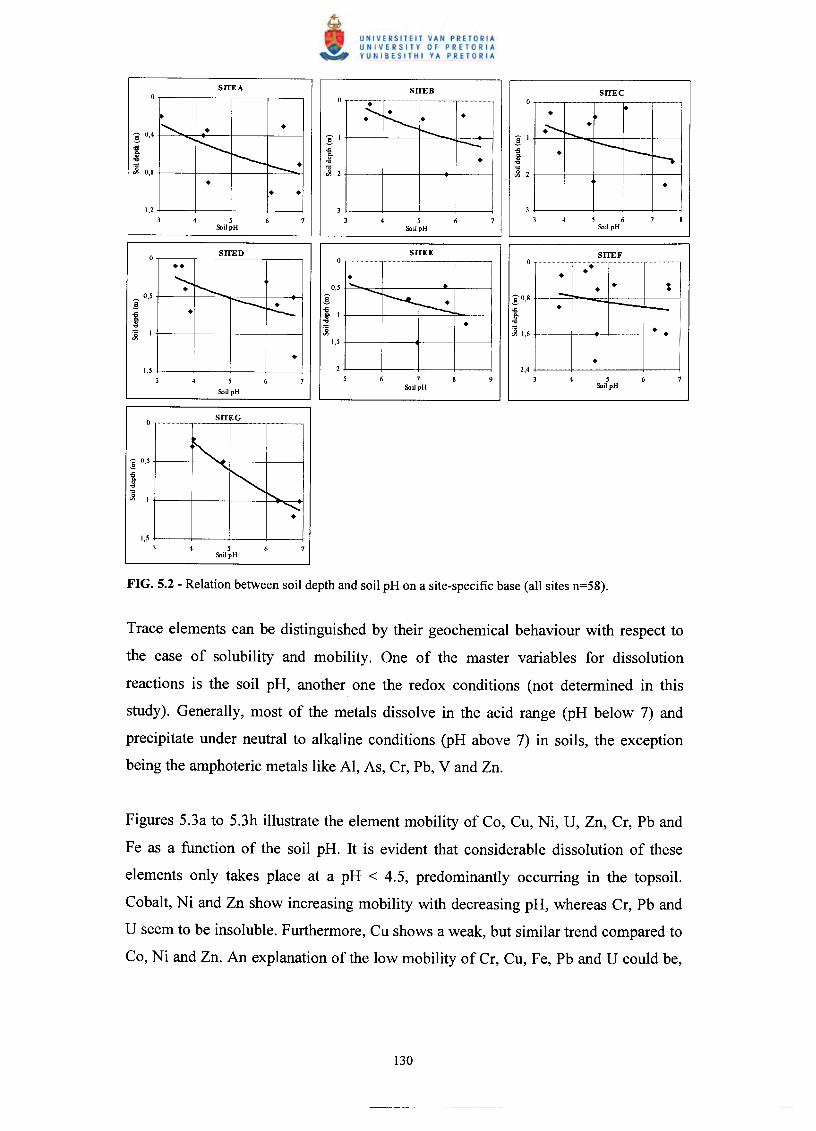
SITEA SITED SITEC._----.- ..... ....................••••.•.. " .......................
~ 0,4 ~ 1 ~ 1oS ! !~ • •] 0,8 ] 2 ~ 2
• •• •1,2 3 3
3 5 3 5 3 5 6Soil pH Soil pH Soil pH
SITED SITEE SITEF
°•• • •0,5 • •
~ 0,5 ~ ~0,8!,t oS •oS 1 ~~ .:J •~ ] 1,6 •~ 1
1,5
• •1,5 2 2,4
3 5 5 7 3 5&lilpH Soil pH
Soil pH
SITEG
~ 0,5
1] 1
•1,5
3 5Soil pH
Trace elements can be distinguished by their geochemical behaviour with respect to
the ease of solubility and mobility. One of the master variables for dissolution
reactions is the soil pH, another one the redox conditions (not determined in this
study). Generally, most of the metals dissolve in the acid range (pH below 7) and
precipitate under neutral to alkaline conditions (pH above 7) in soils, the exception
being the amphoteric metals like AI, As, Cr, Pb, V and Zn.
Figures 5.3a to 5.3h illustrate the element mobility of Co, Cu, Ni, U, Zn, Cr, Pb and
Fe as a function of the soil pH. It is evident that considerable dissolution of these
elements only takes place at a pH < 4.5, predominantly occurring in the topsoil.
Cobalt, Ni and Zn show increasing mobility with decreasing pH, whereas Cr, Pb and
U seem to be insoluble. Furthermore, Cu shows a weak, but similar trend compared to
Co, Ni and Zn. An explanation of the low mobility ofCr, Cu, Fe, Pb and U could be,

that a significant portion of these trace elements appears to be contained in the
residual fraction and thus, is not bio-available.
o2 3 456
pH
FIG. 5.3a - Ni mobility in soils
0.5
U 0.4
~ OJ.0
~ 0.2~ 0.1
o2 3 456
pH
FIG. 5.3b - Cr mobility in soils
•
-
Z 40<l.l:=.0~~ 20
Alloway (1995) reported similar findings for Cr (Figure 5.3b), which is contained in
the majority of soils and where the relatively insoluble and less mobile Cr3+ form
predominates and generally occurs as insoluble hydroxides and oxides or even
chromite (FeCrz04). In addition, the acid character of acid mine drainage-affected
soils suggests a rapid reduction from Cr6+ to Cr3+, which can substitute Ae+ in clay
minerals. However, soils of the study area tend to be dominated by kaolinite, which is
characterised by a low cation exchange capacity. In addition, Alloway (1995) reports
that above a soil pH of 5.5 complete precipitation of Cr3+ is likely. Brooks (1987)
compared the solubility of Cr and Ni and found that Ni is clearly more mobile than
Cr, corresponding to the findings of this study.
The mobility of Ni increases as the pH (Figure 5.3a) and cation exchange capacity
decrease (Alloway 1995). Kabata-Pendias (1994) reported that over 60 per cent ofNi
in soils may be associated with the residual fraction, approximately 20 per cent with
the Fe-Mn oxide fraction and organic matter while the remainder is bound up with the
carbonate fraction (Alloway 1995). However, the presence of ferruginous soils caused
due to intense weathering and free drainage (Brink, 1985) in the study area suggests
that a large portion of Ni is likely to be bound on Fe-hydoxides, whereas organic
material is probably absent. In addition, it is well established that the Ni uptake by
plants increases as the exchangeable fraction in soils increases due to the acidification
caused by acid mine drainage. Hence, the concentration of Ni in plants can reflect the
concentration of the element in the soil, although the relationship is more directly

related to the concentration of soluble ions of Ni and the rate of replenishment of the
mobile fraction (Hutchinson 1981).
Cu mobility
10
::l 8uQ) 6::l.0
~ 4'<f-
2
02 3 4 pH 5 6 7
FIG. 5.3c - eu mobility in soils
25
20&~ 15.0
~ 10'<f-
5
o2
•
•
4 5pH
FIG. 5.3d - Fe mobility in soils
Although Cu (Figure 5.3c) is less mobile than Co, Ni and Zn it is important to note
that Cu concentration levels of 1.5 to 4.5 mg/kg damage or kill roots of growing
plants (Alloway, 1995).
Iron mobility (Figure 5.3d) is very low and significant mobility was only found in two
soil samples at a pH < 5. The results correspond to the general immobile character of
Fe, where a carrier such as colloids is required to allow migration in soil
water/groundwater. It is important to note that Fe-precipitates such as Fe-oxides
provide additional adsorption surfaces for other metals within the soil system. Total
Fe (measured as Fe203) concentrations found in soil samples of the study area range
from 3-24 weight-per cent and are often associated with the occurrence of ferricretes .
(3 60~:0 40~
'<f- 20
4 5pH
••
4 5pH
Cobalt (Figure 5.3e) shows a very high mobility (pH < 5) up to 67 per cent compared
to the solid phase. This would result in a higher plant uptake and is as also reported by

Alloway (1995). Furthermore, Co is often found adsorbed onto Mn minerals such as
Mn02. A positive correlation coefficient of r = 0.63 (n = 81) was calculated for MnO
versus Co, which corresponds with the above observation.
Lead (Figure 5.3f) has a very low mobility in soils, and thus accumulates within the
topsoil. Similar observations were made in Finland, Canada and in the United
Kingdom by Alloway (1995) who found that soils affected by mining operations show
higher accumulations of Pb in topsoils than in unaffected soils, suggesting a low
mobility even under acid soil conditions.
The mobility of U (Figure 5.3g) is very low, but three samples showed an elevated
mobility occurring only in the topsoil. Uranium mobility is very low and occurs only
under strongly acid soil conditions (pH < 5). In case of elevated mobility, the
threshold excess value of U ranged from 62 to 1500. However, the correlation
coefficient between U/As gave a positive coefficient of r = 0.74 (n = 81), which is
also reflected by the immobility of As. The formation of the uranyl cation uol+ is
the most likely reason for the solubility (e.g. (U02)S04 is soluble) of U over a wide
pH range. However, the low mobility of U found in the soil underneath reclaimed
tailings deposits could be caused due to a co-precipitation (secondary mineral) with
arsenate in the soil (Bowie and Plant, 1983) after U was released from the primary
mineral during the operation of the tailings dam.
Zn mobility
60
c::N 40~.D~ 20~
02 3 4 5 6 7
pH
•
• •
FIG. 5.3g - U mobility in soils FIG. 5.3h - Zn mobility in soils
Zinc (Figure 5.3h) has a high mobility, where the solubility increases with decreasing
soil pH, corresponding with the findings of Kabata-Pendias (1994) for acid soils.
Figures 5.4a to 5.4h show element concentrations versus soil depth at the study sites
A-G (the dotted reference line indicates the highest average background value).

o0.00
0.50
:§:LOO..cfrl.50CI
2.00
2.50
As concentration (mg/kg)50 100 150 200 250
:§:..c 1.00i5..o 1.50
o0.00
Cr concentration (mg/kg)200 400 600
---. 0.50g<9 1.000..II)
CI 1.50
o0.00
Ni concentration (mg/kg)100 200 300
•••
0.50E:;-1.00i5..o 1.50
o0.00
U concentration (mg/kg)300 600 900 1200 1500
• ••
~•
---. 0.508'-'<9 1.000..II)
CI 1.50
o0.00
---. 0.50g..c 1.00i5..II)
CI 1.50
o0.00
Fe-oxide concentration (% )5 10 15 20 25
E'-' 1.00..c
fr 1.50CI
o0.00
Pb concentration (mg/kg)30 60 90 120
o0.00
Zn concentration (mg/kg)100 200 300
0.50:§:..c 1.00i5..o 1.50

Chromium and Fe show a weak linear trend (using best-fit curves) by increasing
concentrations with increasing soil depth. However, the trend of As and Zn suggests
an exponential decrease in concentration with depth. Furthermore, Co, Ni and Pb
show no trend with soil depth, although Co and Ni showed a high mobility using
extraction tests. Uranium concentrations are the highest only in the upper soil units. It
can be summarised that there is no clear geochemical pattern regarding a correlation
between soil depth and total element concentrations as a result of heterogeneous site
and soil conditions.
However, highest concentrations seem to occur generally in the upper soil units and
depth related element accumulations were found, if single test pits were considered.
Although, generally clay minerals have a much higher adsorption capacity for trace
elements compared to coarser grain size fractions, no correlation was found between
the clay content in soils and total element concentrations indicating the presence of
preferential flow paths that bypass matrix flow. It is anticipated that the flow rate
under such conditions is high, resulting in a contact time between seepage and solid
phase, which is insufficient to allow significant sorption effects for contaminants.
Trace element concentrations versus the relevant clay content in soils is shown in the
following Figures 5.5a to 5.5d.
~ 0~';;' 40.00o.~ 30.00
g 20.008.g 10.00.~9 0.000)
"'"
••: •• .' ••• 'Il ....•••• ••• • •
These observations correspond to the findings of Merrington & Alloway (1993)
which investigated the properties of heavy metals in soils affected by old iron mines
in England.

bl) 0~ 400.00g~ 300.00.9~ 200.00t::8§ 100.00u
Z 0.00
o~ 320.00
g 240.00t::o·1 160.00
g 80.00ou
~ 0.00
• ••
• • •• •.~.~•.•...........••r. _
•
In conclusion, trace element values exceeding threshold concentrations (i.e. Co, Cr,
Cu, Ni, Zn and U) may limit soil functioning. The mobility of the trace elements is a
function of soil pH. The majority of the topsoil samples were highly acidic (pH 3-4),
whereas deeper samples showed generally higher pH-values (pH 5-7). The low pH
value in soils underlying tailing dams is a direct result of the pyrite oxidation and the
associated generation of acid mine drainage. All of the investigated trace elements are
most mobile when pH < 4.5 and least mobile when a soil pH > 6 prevails. Cobalt, Ni
and Zn are the most mobile trace elements and phytotoxic, corresponding to literature.
In contrast, the mobility of Cr, Cu, Fe, Pb and U is lower, indicating that a significant
portion of these trace elements are contained in the residual fraction (i.e. bound to
silicates). Arsenic concentrations were below the lower detection limit in all soil
extraction tests. The potential hazard for land development and groundwater
contamination posed by the trace elements can be summarised as
U»Co=Ni=Zn>Cr=Pb»As. This potential hazard series is only a function of the
degree and frequency with which a trace element exceeds the relevant threshold
value. It is also important to note that such extraction tests were only conducted at one
site and further tests would be necessary to confirm and support these findings.
Furthermore, hydraulic conductivities derived from geotechnical properties (estimated
from techniques of Mathewson, 1981 and Tavenas et aI., 1983) and in situ test data
indicate a low to very low vertical hydraulic conductivity (range between 10-7-10-10
m/s) of the investigated soil profiles. Contaminants measured at greater depths would,
however, require alternative migration mechanisms than percolation through the
porous media, because of their retardation. Soil conditions indicating preferential flow

(bypass of the soil matrix) were observed in nearly all test pits, but attempts to
identify dominating contaminant migration pathways and mechanisms would be
premature and further investigations are necessary.
Extraction tests on gold mining tailings (Table 5.1) have shown high S concentrations
contained in the leachate. Hence, incomplete reclamation of tailings would result in an
additional reservoir for acid generating processes and contaminant release.
The mitigation of acid mine drainage at greater soil depths may have various reasons
such as the presence of acid neutralising minerals (e.g. carbonates) or a seasonal
fluctuating groundwater table, which causes dilution (mixing with dolomitic
groundwater) effects.
Finally, many countries such as the Netherlands (Ministry of Housing, Physical
Planning and Environment, 1997) provide guidelines for soil quality to assess the
degree of soil contamination. However, these guidelines were established in Europe
and North America, where humid climate conditions, which determine different soil
conditions, predominate. No soil protection guidelines are available for climatic
conditions such as those experienced in the study area.
Groundwater collected across the study area (East Rand area) can be characterised as
two distinctive groundwater types (Kafri et al. 1986 and Scott, 1995):
• Ca-Mg-HC03;
• Ca-Mg-S04•
Piper diagrams representing these groundwater types are shown in Scott (1995).
Groundwater quality showing a predominant Ca-Mg-HC03 character frequently
indicates recharged waters associated with dolomitic aquifers. Such groundwater

often shows low total dissolved solid values and a high total hardness. High Na+
levels in some samples are probably reflected by ion exchange processes (Lloyd &
Heathcote, 1985) preferably from the overlying Karoo strata (Scott, 1995). Scott
(1995) reported that high Ca2+ concentrations resulting from the dissolution of
dolomite (and in some cases from lime treatment) and alkalinity may exceed drinking
water standards in some areas.
In contrast, groundwater quality which is predominantly characterised by a Ca-Mg-
S04 signature and high total dissolved solid concentrations indicates discharge areas
(Palmer, 1992), but in the case of the study area, it is more likely to indicate acid mine
drainage-related pollution. Although the relative proportions of cations in this
groundwater remain similar to those of unaffected groundwater, the anion signature
reflects the progressive dominance of sol- over HC03- as the reaction products of
the sulphide mineral (e.g. pyrite) oxidation are introduced into the groundwater
system. In contrast, Scott (1995) reported that in some areas, the ratios of main
elements in surface and groundwater are very similar, particularly along less polluted
portions of the Blesbokspruit, indicating that surface and groundwater are closely
related across parts of the study area.
It is important to note that dolomites of the Oaktree (chert-poor dolomite) and Eccles
(chert-rich dolomite) Formations occur within the study area. Kafri et al. (1986)
reported that these dolomites occasionally contain considerable amounts of pyrite,
which could contribute to metal and sol- pollution in groundwater. However, it is
highly unlikely that the natural pyrite content would cause a S04-dominated water
type in dolomitic aquifers.
Groundwater quality beneath and in close vicinity of the investigated tailings dams is
dominated by the Ca-Mg-S04 type, although all sites with relevant groundwater data
(sites H, I and K) are underlain by dolomitic rocks. In general, groundwater quality
seems to improve further down-gradient of the tailings dams and reclaimed sites as a
result of dilution effects and the high acid neutralisation capacity of the dolomitic
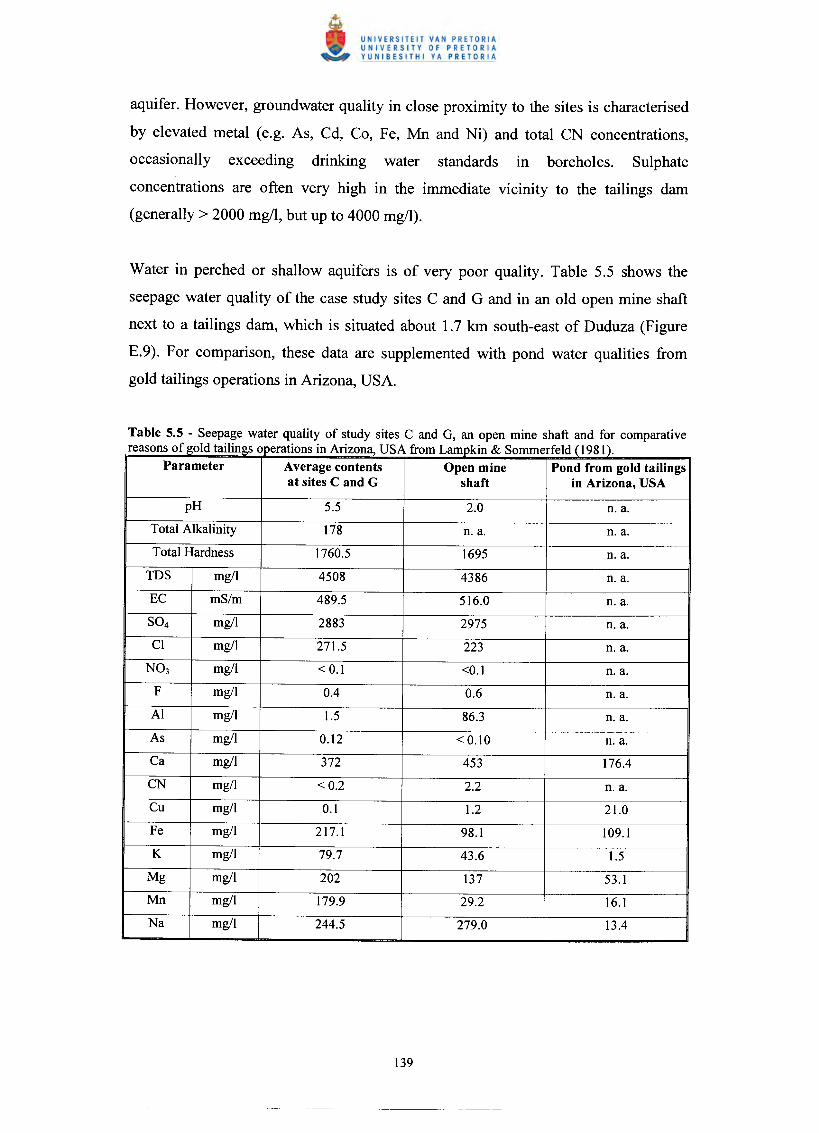
aquifer. However, groundwater quality in close proximity to the sites is characterised
by elevated metal (e.g. As, Cd, Co, Fe, Mn and Ni) and total CN concentrations,
occasionally exceeding drinking water standards in boreholes. Sulphate
concentrations are often very high in the immediate vicinity to the tailings dam
(generally> 2000 mg/l, but up to 4000 mg/l).
Water in perched or shallow aquifers is of very poor quality. Table 5.5 shows the
seepage water quality of the case study sites C and G and in an old open mine shaft
next to a tailings dam, which is situated about 1.7 kIn south-east of Duduza (Figure
E.9). For comparison, these data are supplemented with pond water qualities from
gold tailings operations in Arizona, USA.
Table 5.5 - Seepage water quality of study sites C and G, an open mine shaft and for comparativef IdtT f' Ar' USAfr L k' &S fild(1981)reasons 0 go al mgs opera Ions m lzona, om amplm ommer e
Parameter Average contents Open mine Pond from gold tailingsat sites C and G shaft in Arizona, USA
pH 5.5 2.0 n. a.
Total Alkalinity 178 n. a. n. a.
Total Hardness 1760.5 1695 n. a.
TDS mg/I 4508 4386 n. a.
EC mS/m 489.5 516.0 n. a.
S04 mg/I 2883 2975 n. a.
CI mg/I 271.5 223 n. a.
N03 mg/I < 0.1 <0.1 n. a.
F mg/I 0.4 0.6 n. a.
Al mg/I 1.5 86.3 n. a.
As mg/I 0.12 < 0.10 n. a.
Ca mg/I 372 453 176.4
CN mg/I <0.2 2.2 n. a.
Cu mg/I 0.1 1.2 21.0
Fe mg/I 217.1 98.1 109.1
K mg/I 79.7 43.6 1.5
Mg mg/I 202 137 53.1
Mn mg/I 179.9 29.2 16.1
Na mg/I 244.5 279.0 13.4

Ni mg/l 2.3 16.9 n. a.
Pb mg/l 0.03 0.02 n. a.
Zn mg/l 0.2 3.3 115.6
Note: n. a. means information not available. Accuracy of the analysis, which is outlined in paragraph3.3, for open mine shaft: ~ -18.3 per cent (high inaccuracy).
It is apparent that SO/- as well as some metals (e.g. As, Fe, Mn, Ni, Pb and Zn) and
eN exceed the recommended target water quality standards. The pH in the seepage of
the old open mine shaft is extremely low and enhances metal leaching. As a result
some metal concentrations such as Fe and Mn are substantially lower due to
precipitation as hydroxides. Even if the topsoil would be treated with lime and
fertilisers (e.g. superphosphate) in order to achieve suitable soil conditions for plant
growth, it may take a long time until groundwater quality will gradually improve.
Finally, it must be stressed that agricultural activities often occur in immediate
vicinity to tailings dams, and the use of such affected water for agricultural (e.g.
irrigation) or domestic purposes should be avoided.
A load estimation was undertaken in order to assess the annual discharge of seepage
and SO/- from the reclaimed sites in South Africa into the groundwater system.
Rosner et al. (1998) have shown that the total area of land affected by reclaimed gold
mine tailings amounts to approximately 13 km2. All these sites are situated within the
Vaal Barrage catchment system, which plays a major role for water supply of the
Johannesburg region. Vegter (1984) estimated a net recharge value of 12.5 per cent of
the annual rainfall for the Gauteng Province, which equals 80-100 mm recharge per
year (Vegter, 1984).

1. Conversion of recharge/year (i.e. 80 mm1year) into an area size. Method after
Halting (1996).
80 mm recharge/year equals 2.5361/(s· km2)
2. Conversion of recharge value from seconds per km2 to year per km2
I 6 I2.536 2 = 79.97 ·10 2
s . km year· km
3. Multiplication of recharge value with the relevant area size (i.e. 13 km2)
79.97.106 I .13km2 = 1.0397 .103 Mls ·km2 year
The estimation above has shown that the accumulated volumes of seepage amount
annually to approximately 1000 Ml. For the S042- load estimation two scenarios with
concentrations of 1006 mg/l and 4760 mg/l, respectively were considered. These
values were obtained from seepage analyses conducted at study sites C and G (Table
4.4a and 4.10a), respectively and also correspond to measurements at other sites
(study sites H and I). The results for the two scenarios are as follows:
1. Scenario: 1046 t sol-/yr for all reclaimed sites (13 km2) equals 804 kglha· yr
2. Scenario: 4949 t SOl-/yr for all reclaimed sites (13 km2) equals 3.81 tonslha· yr
It should be noted that the process of pyrite oxidation is kinetically controlled and
long-term predictions can be only made by using relevant geochemical models.
Furthermore, without any site rehabilitation, a load decrease of sol- and associated
contaminants will only occur once the source of oxidation (i.e. pyrite) has depleted. In

addition, changes in land use might enhance pyrite oxidation, thus resulting in even
higher contaminant loads.
It is of great concern that sites, which were reclaimed a long time ago (e.g. study site
C, more than 10 years ago) still show very high sol concentrations in the seepage.
However, it is premature to quantify accurately the amount of seepage and
subsequently the load of contaminants for all gold mine tailings dam sites in the
country. Various attempts have been made in the past (Steffen, Robertson & Kirsten,
1988), but the lack of appropriate long-term water quality data around such tailings
dam sites as well as lacking technical information about the sites themselves (e.g. the
presence of pollution control measures) result in many unknown parameters.
The application of the geochemical load index system is a conservative approach,
assuming that the total contaminant load in the solid phase could be dissolved.
However, studies by Kabata-Pendias (1994) have shown that only a minor portion of
heavy metals are bio-available, as they are only contained in the easily soluble and
exchangeable phase. A risk assessment would be required if land development such as
housing is envisaged.
The concentrations of Fe203 (total), MnO and various trace elements (i.e. As, Ba, Co,
Cr, Cu, Mo, Ni, Pb, Sn, Th, U, V and Zn) were compared to background soil
concentrations of similar geology by using the geochemical load index system
according to Muller (1979). Based on the results of this comparison, a table listing
contaminants of concern for each site was produced (Table 5.6). This methodology
allows the assessment of potential future trace element loads in the investigated soil
profiles. Significant contamination is reflected by contamination classes III-VI, where
the average background value is considerably exceeded.

TABLE 5.6 - Hazard rating of the study sites by using the geochemical load index system (after Muller(1979).
Hazard rating of the study sites
Study Class I Class II Class III Class IV Class V Class VIsite None- Moderately Moderately- Highly High- Excessively
moderately contaminated highly contaminated excessively contaminatedcontaminated contaminated contaminated
A Ni, Zn As, Cr, Cu, Sn, U - - -Fe, Pb, V
B As, Cr, Fe, Cu, Ni Co Pb - -Mo, Th, V,Zn
C As,Cr Cu, Fe, Ni, - Co - -Mn,Pb, V
D Cu,Mn, Th As, Cr, Fe Ni, Pb Co,U, V - -E As, Cr, Cu, Co, Fe Pb,V - - -
Ni, Th, ZnF Fe, Cr, Cu, Co,Mn, Th As, Ni - - U
Mo, V,ZnG As, Ni, Sn Co - - - -
Moderately to highly contaminated sites (class III): five sites with respect to the
following trace elements: As, Co, Ni, Pb, Sn, V and U. Cobalt and Ni are
phytotoxic and, therefore have negative effects on plant growth (Alloway, 1995).
High As concentration was only found in one case. However, As is less mobile
than other metals and thus, effects are negligible.
Highly contaminated sites (class IV): three sites with respect to Co, Pb, U and V.
Vanadium is not a typical mine tailings contaminant, and enrichment caused by
natural processes in association with ferricrete in soils (Figure E.ll) is most likely
(Nemeth, Molnar, Csillag, Butjas, Lukacs, Pmay, Feher & Van Genuchten, 1993
and Alloway, 1995). High U concentrations were found only at one site.
One site has been classified as an excessively contaminated site (class VI) as a
result of U (measured as U30S) concentrations more than lOO-fold above the
natural background. It is unlikely that the high U concentrations in the soil
emanate from the gold mine tailings, the U concentrations are rather caused by the
deposition of radioactive material deposited prior to the construction of the
tailings dam.

It can be concluded that the long-term impact of typical mine tailings on soils and
groundwater will mainly depend on the availability of minerals with a sufficient acid
neutralisation capacity in soils. The ongoing production of sol- and acids are a result
of sulphide mineral oxidation by residual tailings material on the surface. When the
topsoil becomes highly acidic (pH around 4.5), the acidity starts to migrate into the
subsoil. Once the subsoil becomes acidic, only the most acid-tolerant plants can be
grown (Fenton, 1997). Acidification of the subsoil is a form of permanent soil
degradation and therefore, the primary contamination source should be completely
removed from the reclaimed sites in order to minimise further acid and salt
generation.
Only a limited number of tailings dams in South Africa have been investigated in
detail with respect to the hydrogeological conditions, including contaminant analysis.
One South African mining company applied numerical groundwater models for two
tailings dam sites, situated within the study area. The model applications have shown
that tailings dams continue to release seepage with high salinity for an extended time
period (predictions were given for about 50 years) after decommissioning (closure) of
tailings operations.
Acid and salt generation in tailings dams and the subsequent impact on the
groundwater system can only be mitigated by preventing the moisture and oxygen
flux into the impoundment or soil, which can be only achieved by cover systems.
Such a cover would also prevent wind erosion and the subsequent dispersion of
contaminants in the near surrounding of the deposit or footprint. The models have also
shown that deterioration of groundwater quality occurs only in the immediate vicinity
of the impoundment. Groundwater quality improves with increasing distance down-
gradient of the tailings dam mainly due to dilution and sorption effects. Seepage
emanating from tailings dams is, however, likely to affect water quality negatively in
nearby surface water systems due to discharge from affected groundwater or surface
run-off, which would have an adverse impact on water users in that particular area.

It is important to note that as a result of dewatering of underground mines,
groundwater tables dropped across the study area, causing the Blesbokspruit to
discharge water along permeable sections of the water course into the groundwater
system. Mine closures and the reduction of mining operations resulted in a rapid
groundwater table recovery in the dolomitic aquifers in the East Rand area. This
might affect water courses such as the Blesbokspruit to effluent rather than influent
streams in future, characterised by recharge from the aquifers (Scott, 1995). The
effect of groundwater recovery cannot be regarded in isolation from the release of
acid mine drainage from tailings dams.

Rehabilitation is defined as the restoration of a disturbed land area to a landform and
productivity which conforms with the landform and productivity of the locality before
disturbance took place.
Section 38 of the Minerals Act (50/1991) in South Africa determines the approach towards
rehabilitation of the surface in a mining or prospecting environment. Within the context of the
mining authorisation, rehabilitation measures must be carried out as follows:
In accordance with the approved environmental management plan;
As an integral part of the operations or prospecting progress;
At the same time as the mining operations, unless otherwise determined by the Regional
Director;
To the satisfaction of the Regional Director ofthe Department of Minerals and Energy.
Mining plays an essential role in the South African economy. However, there are growing
cost implications involved in the disposal of mining wastes due to adverse effects on soils,
surface and groundwater quality. The extent of these effects depends on the physical
characteristics of the disposal site, mineralogy of the ore, the metallurgical process, the
method of disposal, the climate and microbiological conditions within the disposal site and in
the underlying subsurface.
In the case of reclaimed gold mine tailings dams, the remediation of the subsurface (soil and
groundwater) is of major importance for the mitigation of adverse effects on the aquifer and in
order to enable land development. As a result, waste remediation efforts are heavily
influenced by statutory and regulatory compliance and in some countries, such as the USA,
waste remediation is often dictated by these regulations. Regulatory standards and guidelines
are becoming increasingly prescriptive as regards procedural and technical requirements.
It is clearly preferable to prevent contamination problems at the outset by investigating
contamination potentials at the mine planning stage, and deciding on the most appropriate

metallurgical process and waste disposal. However, in case of contaminated sites or
footprints, the success of rehabilitation measures depends on how effectively contamination
has been eliminated and how sustainable the rehabilitation effort is in the long-term (Vander
Nest & Van Deventer, 1996).
With introduction of the second edition of the Minimum Requirements for Water Monitoring
at Waste Management Facilities, DW AF (1998) has endorsed a risk-based framework within
which contamination at waste facilities can be identified, assessed and environmentally
soundly managed.
In this context, the term risk has a multitude of uses and is not to be confused with hazard. In
the context of contaminated land or soils, the term risk is generally defined with the likelihood
of human health problems occurring if no clean-up measures were taken at the site (EPA,
1997a). In terms of contaminated sites or land, risks to human health and the environment can
be regarded as being comprised of three components (Young, Pollard & Crowcroft, 1998):
Source, reflecting a toxic substance or group of toxic substances with the potential to
cause harm;
Pathway, reflecting a route by which a receptor could be exposed to, or affected by, the
toxic substance(s);
Receptor, reflecting a particular entity which is being harmed or adversely affected by the
toxic substance(s).
The probability of a hazard being realised (i.e. the risk), depends on the conditions of a
linkage between these components, including site-specific factors such as the contaminant
concentration in the exposure medium, the bio-availability, the ease of access to the exposure
pathway and the duration of exposure.
The term of risk assessment can be basically defined as an evaluation of the probability of
harm and, in context with contaminated sites, is concerned with gathering and interpreting

information on the characteristics of sources, pathways and receptors at a specific site and to
understand the uncertainties inherent to the ensuing assessment of risk.
The requirements of the risk assessment define the scope of a site investigation and, thus
potential remediation measures. In practice, this involves the geochemical characterisation of
the contaminant(s), relevant soil properties and groundwater conditions encountered and the
site factors that influence contaminant fate and migration.
Because the unsaturated zone is often a physical and geochemical barrier zone between the
source of contamination and the receptor (i.e. groundwater), the understanding of the
contaminant transfer between these components is an essential prerequisite to the site
investigation, risk assessment and the subsequent development of rehabilitation strategy.
Four key phases have to be generally assessed as part of a risk assessment according to EPA
(l997b). These phases including their practical implementation are described below:
The hazard assessment is the qualitative evaluation of the adverse health effects of a toxic
substance(s) in animals or humans.
Practical implementation: Collection and analysis of samples from different media (i.e. soil,
air and/or water, sediments, fish, plants, animals) from and around the site of concern.
Development of a Conceptual Site Model (method according to the EPA, 1997b) that reflects
the site conditions including contaminant sources (current and future land use), release
mechanisms (i.e. bio-availability), exposure pathways, migration routes, and potential human
and ecological (e.g. groundwater) receptors.
The exposure assessment is the evaluation of the components, magnitude, time, and duration
of actual and anticipated exposures and of doses, when known; and when appropriate, the
amount of people who are likely to be exposed.
Practical implementation: Assessment of exposure pathways for contaminants from the source
to the receptor via the pathway, whereas contaminants of concern have to be identified in
Phase 1. As a result, a Reasonable Maximum Exposure (EPA, 1997a) scenario is calculated
which reflects the highest level of human exposure that could reasonably be expected to occur
from the contaminant identified in Phase 1. This scenario also assesses the duration of
exposure time that could occur if no clean-up measures at the site take place. Such an
exposure assessment ensures that the selected clean-up or remediation measure protects all
people potentially affected by the contaminated site, with a focus on the most vulnerable or
sensitive populations (e.g. children). These populations are also termed critical group.
The dose-response assessment is the process of estimating the relation between the dose of a
substance(s) and the incidence of an adverse health effect situation.
Practical implementation: Determination of the toxicity, or harmfulness, of each contaminant
identified in Phase 1. It is obvious that the type and intensity of potential health problems
depend on the contaminant itself and the duration of exposure. For example, a likely dose
could be derived from the consumption of contaminants as a result of drinking polluted water
every day for 30 years. The EPA uses two methods to evaluate effects on human health
arising from exposure of toxic substances from contaminated sites. One approach calculates
the probability of cancer incidents occurring as a result of exposure (e.g. 1 in 10 000
probability). The second method evaluates non-cancer health effects of contaminants from the
site (EPA, 1997a).

The site risk characterisation is the process of estimating the probable incidence of an adverse
health effect to humans under various conditions of exposure, including an assessment of the
uncertainties involved (usually a sensitivity analysis).
Practical implementation: Determination of the most critical risks and whether these risks are
significant enough to cause negative or adverse effects on health for people living near the
site. The results of the three previous Phases 1, 2 and 3 are combined, evaluated and
summarised. Figure 6.1 illustrates an example for a risk-based investigation for contaminated
sites.
Identify actual orpotential problem
reliminary Hazard Identification &Assessment Preliminary Site Investigation
Identify potential: .....i::....
- hazards (contamination source)- pathways Initial Exploratory Investigation- receptor (or target)
Hazard AssessmentFor critical hazards, pathways, targets- compare with guideline/standards .- judge significance
Risk Estimation
- conduct exposure assessment- conduct effects assessment
Risk Evaluation- compare with guidelines/standards- analyse uncertainties- judge significance
Risk Control
- decide on remedial measures- implement measures
"' .
t______
FIG. 6.1- Scheme for a risk-based site assessment(after Griffiths & Smiths, 1998)

Subsequently, a total site risk is calculated, whereby uncertainties have to be taken into
account in order to prioritise decisions on the most efficient clean-up or rehabilitation
measures aiming at risk reduction to acceptable levels. The latter is achieved by the
application of Hazard Ranking Systems and a Site Ranking Methodology, which were
introduced by the EPA (1997a). A detailed discussion of the application of risk assessment for
contaminated sites is given in EPA (1997b) and Skivington (1997).
According to Pierzynski et al. (1994), two general strategies are used to deal with soils, which
are mainly contaminated by trace elements:
Treatment technologies;
On-site management.
Treatment technologies refer to soil that has been physically removed (ex situ) and processed
in a certain way in an attempt to reduce the concentrations of trace elements or to reduce the
extractable (bio-available) trace element concentration to an acceptable level. The TCLP
(toxic characteristic leaching procedure) is a protocol used by the EPA, which dictates that
materials should be leached under standard conditions. If the concentration of various
substances exceeds some critical levels in the leachate, the material is classified as hazardous.
The second strategy is called on-site management (in situ). There are two subcategories
within the on-site management option:
• Isolation;
• Reduction ofbio-availability.
Isolation is one of a number of processes by which a volume of soil is solidified, resulting in
prevention of any further interaction with the environment. The second subcategory consists
of methods for reducing the bio-availability of trace elements in the soil. The following
paragraphs will provide a brief introduction of both rehabilitation strategies and their
application potential for this type of contamination.

Soil clean-up methods make use of the specific differences between the properties of
contaminants and soil particles. Soil contamination characteristics at which clean-up may be
directed are volatility of the contaminants, solubility in aqueous solution, adsorption and
remobilization characteristics, size, density, shape of contaminated particles, bio-degradability
and geochemical instability. The following aspects are of importance for the application of a
clean-up technique:
Soil type (properties of the inorganic and organic soil phases);
Type and concentration levels of contaminants;
Physical state of the contaminants (e.g. particulate pollutant, adsorbed, absorbed, liquid
films around soil particles, contaminant as a liquid or solid phase in soil pores);
Migration mechanisms of contaminants and the time interval between contamination and
clean-up. Particularly in the case of in-situ treatment, it is important to know if the
contaminated site is disturbed by mechanical processes or not.
Clean-up possibilities depend on the type and concentration of contaminants, which can vary
significantly in the soil. Contamination caused by seepage leaving gold mine tailings dams
and entering the subsurface mainly consists of:
Acidity;
Salts (e.g. sol- and Cn;
Trace elements (e.g. heavy metals and heavy metal compounds and radionuclides);
Cyanides (free and complex cyanides).
Soils contaminated with heavy metals or heavy metal compounds are in general most resistant
to clean-up, because metals and metal compounds cannot be destroyed, with the exception of
volatile elements such as As and Hg (Rulkens, Grotenhuis & Tichy, 1995). However, the
volatilisation of As and Hg contaminants will only succeed at extremely high temperatures. In
addition, heavy metals are usually found in soils accompanied by other types of
contamination (e.g. organic compounds). The occurrence of organic substances can make the
removal of metals from the soil substantially more complicated.

Five main principles are applied for the clean-up or decontamination of affected soils. These
principles are discussed in detail by Rulkens et ai. (1995) and listed below:
Removal of contaminants by molecular separation (e.g. treatment by extraction and
treatment by desorption or remobilization);
Removal of particulate contaminants by phase separation (e.g. classification with
hydro cyclones, froth flotation and jig techniques);
Removal of contaminants by chemical/thermal destruction;
Removal of contaminants by biodegradation (e.g. land farming and biological slurry
reactors, not applicable to heavy metals);
Removal of contaminants by biological adsorption or biological mobilisation.
A large number of clean-up techniques have been developed on the basis of these principles.
However, only a few approaches are presently successfully applied in practice (Rulkens et aI.,
1995).
In general, mining sites in South Africa are far too large to be cleaned up using the available
technology at reasonable cost. Approximately 13 km2 of land has been affected by gold mine
tailings material, which have been reclaimed. If only the top 30 cm (i.e. topsoil) of these areas
were to be treated, this would imply that 3.9 million m3 and hence, at least 5.5 million tons of
material would have to be treated. This is a very conservative estimate, since treating the
topsoil would not be sufficient - some contaminants have already reached the groundwater
system, indicating that contamination of the subsoil or deeper parts of the unsaturated zone
has been occurred.
Areas affected by wind-blown tailings or contaminated sediments in waterways downstream
of these deposits have not been considered in this example. Even with an effective treatment
technology available, it would be cost prohibitive to treat such large quantities of material
necessary to address the problem. Therefore, present-day treatment technologies are confined
to rehabilitation scenarios where only small volumes of soil are involved.
The isolation approach of the on-site management includes in situ approaches described under
the treatment technologies option. All isolation approaches aim to isolate the contaminants
from the surrounding environment by encapsulating them into a nonporous matrix.
Of major interest in the context of rehabilitation of land affected by mine tailings are the
methods to lower the mobility and hence, to reduce the bio-availability of trace elements.
These methods include the following aspects relevant for soils affected by acid mine drainage:
Altering soil pH;
Increase sorption capacity;
Precipitation of trace elements as some insoluble phase.
The influence of soil pH, cation exchange capacity, and adsorption mechanisms on trace
element bio-availability are well studied and reported in soil literature (e.g. in Alloway, 1995),
although generally not in association with a remediation technique.
Of all the methods for reducing trace element bio-availability, increasing the soil pH by
adding lime (generally to a pH of ~ 6.5) is probably the most common approach applied. This
is a result of the general tendency for most trace elements to precipitate as hydroxides at a pH
> 6.5 and of the fact that soil pH management is a routine measure of a fertility program.
However, where more than one trace element is involved in the remediation (common
situation), changing the soil pH may reduce the mobility of some elements whilst mobilising
others such as Mo (Pierzynski et aI., 1994). Fenton (1997) reported that the following
quantities oflime are required in order to achieve a pH increase of 0.5:
2.5 tonslha for a clay;
1.7 tonslha for a silty clay loam;
1.5 tonslha for a sandy clay loam;
1.0 tonslha for a sandy loam.
In the study area, the majority of samples from the upper soil units had a strongly acid
character (pH 3-4), whereas samples from deeper depths showed generally higher pH-values

(pH 5-7). Thus, approximately 10 tons/ha lime would be required to neutralise a silty clay
loam from pH 4 to pH 7. Additionally, more lime is required to maintain a certain level of soil
quality. Quantities depend on climatic conditions and range from 75-1000 kg/ha/year (Fenton,
1997). However, these lime quantities are only estimations since the quantities for a specific
site have to be determined on the base of the dominating clay mineralogy in the soil, and more
importantly the reactivity of the liming material itself. An extensive discussion on this topic is
also found in Logan (1992) and Whitney & Lamond (1999).
Bio-availability of some trace elements to plants is mainly influenced by the soil pH and
cation exchange capacity, with availability decreasing at neutral to alkaline pH values and as
the exchange capacity increases. It should be noted that the soil pH does not predict the
amount of lime necessary to neutralise acid soil. That requires the determination of the soil
reserve acidity, which is a function of the soil pH as well as the cation exchange capacity. To
measure reserve acidity, the soils cations such as Ca must be extracted using a buffer solution,
where the adsorbed cations exchange with cations in the buffer solution. Subsequently, the
cations are filtered and the quantity of cations, which can neutralise acids (mainly Ca and to
some extent Mg) determines the amount of lime required to neutralise acidity. Thus, a soil
with a high cation exchange capacity will require more lime than one with a low exchange
capacity.
An increase in soil cation exchange capacity in order to improve the soil retention capacity for
contaminants, can be achieved for instance by:
• Adding clays with a high cation exchange capacity (e.g. montmorillonite);
• Adding organic material (e.g. manures, sludges).
• Adding large amounts of Fe and Al salts (increasing adsorption capacity for oxy-anions
with a subsequent reduction in their bio-availability).
• Adding hydroxides, carbonate or phosphate-containing salts can cause precipitation of the
corresponding trace element-containing solid phase. If the solid phase then controls the
activity of the trace element in the soil solution and this activity is lower than the initial
level, the bio-availability will be reduced.

• Mixing the contaminated soil with uncontaminated material or materials such as coal fly
ash, paper mill wastes, sewage sludge in order to dilute existing pollution levels
(attenuation) in the contaminated soil.
Sutton & Dick (1984) discuss many of these methods in detail with respect to soil treatment.
Another aspect is phytotoxicity, which can protect the human food chain. This phenomenon is
called the soil-plant barrier and refers to the situation where a plant reacts phytotoxically to a
trace element concentration below that which would be harmful if humans were to consume
the plant as food.
Certain elements might exert a lower risk to humans because of phytotoxic reactions to plants
and were discussed in paragraph 2.7. However, some elements, such as Cd, Mn, Mo and Zn,
are not affected by this phenomenon, as a result of insolubility or strong retention of the
element in the soil that prevent plant uptake (Pierzynski et aI., 1994).
Another mechanism is the low mobility in non-edible portions of plants that prevent
movement into edible portions (e.g. roots versus above ground portions), or phytotoxicity that
occurs in concentrations in the edible portions of plants below a level at which they would be
harmful to animals or humans. Detailed information about the effects of heavy metal pollution
on plants is given in Hutchinson (1981). It is important to note that direct ingestion of
contaminated soil or dust (e.g. mine tailings) bypasses the soil-plant barrier and thus poses a
direct risk to human health.
A primary objective for the satisfactory rehabilitation of land affected by mine tailings is to
establish a permanent self-sustaining vegetation cover (Sutton & Dick, 1984). This may have
a beneficial effect, since it may reduce the amount of leachates entering the subsurface.
However, the establishment of vegetation (recultivation) on land affected by mine tailings is
often hindered due to the low availability of plant nutrients and soil moisture. Another
primary factor is the low pH in soils (caused by acid mine drainage and a lack of buffer
minerals) which prevents the establishment of vegetation as a result of leached nutrients. In

addition, incomplete reclamation often results in tailings material remaining on the surface.
This residual tailings material provides an additional reservoir for acid mine drainage
generation and associated contaminants and complicates rehabilitation efforts even more.
Although the acid and soluble salt amounts will decrease with time due to weathering and
leaching processes, the underlying soil might remain too acid for plant growth. As a result,
most of the areas covered by tailings dams which were reclaimed will remain without an
appropriate vegetation cover for an extended period of time (also as a result of highly soil
compaction), if exposed to weathering.
Treatment options were discussed in the previous paragraphs and amelioration could be
achieved by addition of soil amendments such as lime or coal fly ash. Once the abandoned
mined land shows vegetation growing on the surface, the initial regeneration of these areas
towards future land development has begun. In addition, a vegetation cover on abandoned
mined lands improves the aesthetics of the area. The land use capability, location, and
objectives of the owner will determine the ultimate use of these areas. This would also include
ecological aspects in respect of agriculture, forestry, wildlife, and recreation (Sutton & Dick,
1984).
A further option is to cover remaining tailings with soil. Such a cover or cap would prevent
leachate migration and reduce the need for other cost intensive techniques such as soil clean-
up or groundwater treatment. A detailed discussion is given in Daniel (1983), Hutchison &
Ellison (1992) and Johnson, Cooke & Stevenson (1998).
6.4 REMEDIATION OF GROUNDWATER CONTAMINATED BY ACID MINE
DRAINAGE
Most of the remediation techniques used in practice are related to organic pollution such as
petroleum from leaking underground tanks. However, limitations to remediation of
contaminated groundwater became apparent in the mid 1980s as data from groundwater
remediation projects in the USA became available (EPA, 1989 and 1996a; Mackay & Cherry,
1989; Travis & Doty, 1990 and Kavanaugh, 1996). The most common groundwater
remediation strategy in the USA has been the pump-and-treat approach (P&T technology),

where contaminated groundwater is pumped to the surface, treated and returned to the aquifer.
Because of growing concerns in the USA that this approach was not likely to achieve target
levels in many cases, and that predictions of clean-up times had been seriously
underestimated, an independent assessment of the issues was conducted by the U.S. National
Research Council in 1994. A number of77 remediated sites were investigated in the U.S. with
regard to their clean-up success. The survey revealed that only 8 of the 77 sites reached the
remediation clean-up level and in most cases the concentration of the target compounds in the
extracted water had reached a constant level.
The low success ofP&T technologies is not surprising, because even in the case of an optimal
design of the P&T approach, restoration of groundwater is limited by four factors which are
inherent to the problem of removing contaminants from the subsurface (Kavanaugh, 1996).
These factors are:
Compounds strongly adsorbed to aquifer solids (Mackay & Cherry, 1989);
Highly heterogeneous subsurface environments contain zones of low permeability (e.g.
clay);
Slow mass transfer of contaminants from aquifer solids to the bulk interstitial fluid
(Brusseau & Rao, 1989);
Wide spread presence of non-aqueous phase liquids (NAPL's), particularly those that are
more dense than water (Mecer & Cohen, 1990). This factor does not account for inorganic
trace element pollution.
Alternative remediation techniques such as semi-reactive walls and bio-remediation
approaches are not applicable to groundwater, if heavily affected by salt and heavy metal
contamination. Thus, remediation efforts should focus on control of the pollution source (e.g.
vegetation cover, drainage systems) and, if contamination in the subsurface occurs, on
limiting the bio-availability of contaminants within the unsaturated zone. Various clean-up
technologies have been reviewed by the EPA (1987a). The long-term management of the
contaminated subsurface will be discussed in the following paragraphs.

LONG-TERM ENVIRONMENTAL
CONTAMINATED AREAS
Areas such as those covered by gold mine tailings dams, are too large to be cleaned up
economically. However, since the unsaturated zone (vadose zone) underneath the mine
tailings is expected to be contaminated for a long time, it is necessary to understand the
mobility of contaminants and the capacity of the unsaturated zone to retain contaminants in
the long term. In a number of cases, contaminants have already migrated into the groundwater
system, thus causing a deterioration in groundwater quality.
The parameters, which control the balance between retention and mobility of contaminants in
soils and sediments are also termed master variables (i.e. pH, but also redox conditions and
the presence of complexing agents such as dissolved organic matter and inorganic anions)
according to Salomons & Stigliani (1995).
For a short-term risk assessment (time period of 5-10 years) it is sufficient to understand how
these master variables are associated with mobility and hence, bio-availability of
contaminants. A great deal of information is available in the literature on this subject
(Salomons & Stigliani, 1995).
However, there is less information available which deals with the mechanisms which
determine the master variables. This is not important for short-term processes, which
determine the current contamination status of soils and sediments and their immediate impact
on the environment. Salomons & Stigliani (1995) found that in a number of cases the present
impact may be slight; however, this may increase if the retention capacity of soils for
contaminants changes or when the master variables controlling the interaction between the
soil and the soil solution change. This could be a result of the consumption of minerals which
provide acid neutralisation capacity. These changes are of a long-term nature and are caused
by the dynamic geochemical behaviour of the master variables and the major element cycles
in the soil-sediment system. Figure 6.2 illustrates the relationship between the master
variables, the major element cycles and contaminants.

Soil/sedimentsystem
FIG. 6.2 - Association between the master variables, the major element cycles and contaminants (modified afterSalomons & Stigliani, 1995).
It is important to understand that these changes in contaminant concentrations in the soil
solution show a non-linear relationship, in particular for inorganic pollutants (such as heavy
metals). Changes in the pH or Eh conditions can cause sharp increases in concentrations over
a short time period (Salomons & Stigliani, 1995). This could be a result of changing land use
(e.g. deposition and reclamation of tailings dams), continued acid deposition and changes in
hydrology.
Although the previous discussion has focused on the chemical properties and behaviour of
contaminants in the soil, it is important to realise that other disciplines must be taken into
account for a complete understanding of this complex system and in order to be able to
perform predictive long-term modelling. Hence, it is important to assess the significance of
increased mobility on transport, plant uptake and impact on the soil ecosystem as part of a risk
assessment. Integration of these aspects would allow one to establish eco-toxicological
guidelines, sustainable agriculture, changing land-use and long-term protection of
groundwater resources for certain target areas such as those affected by mining operations.

How effectively contamination can be mitigated and how sustainable the rehabilitation effort
is under long-term conditions determine the success of rehabilitation (Van der Nest & Van
Deventer, 1996). Consequently, the only available tool to measure the success of
rehabilitation at a specific site is the monitoring approach. Only monitoring reveals if
improvement occurs as a direct result of the rehabilitation measure. Monitoring would also
justify the use of a specific remediation method for further applications under similar
conditions. Therefore, monitoring serves as a quality control tool for rehabilitation
management and thus, forms an integral part of a risk assessment and after-care measures for
previously contaminated and subsequently rehabilitated sites.
The type and extent of monitoring, however, would depend on the site-specific conditions and
could comprise the monitoring of the vadose zone, surface and/or groundwater systems. The
latter monitoring technique could for example consist of the establishment of boreholes
suitable for groundwater sampling up and down-gradient of the site. Groundwater monitoring
approaches are discussed in detail in textbooks such as Palmer (1992), Daniel (1993), and by
Mulvey (1998), whereas vadose zone monitoring techniques are described in Everett, Wilson
& Hoylman (1984).
In addition, The Minimum Requirements for Water Monitoring at Waste Management
Facilities (DWAF, 1998) give guidance on this issue. In this context, it should be emphasised
that this guideline states:
"It is a minimum requirement that a risk assessment, to determine the risk of water becoming
polluted, be performed at all waste sites before the installation of a monitoring system. The
risk assessment ensures that the design of the monitoring system is adequate ... "
Finally, the use of remote sensing techniques (e.g. using satellite images) could provide an
important tool for the monitoring of reclamation activities of mining companies as well as of
the nearby environment (rapid developing residential areas such as townships and illegal land
use) of tailings dams.
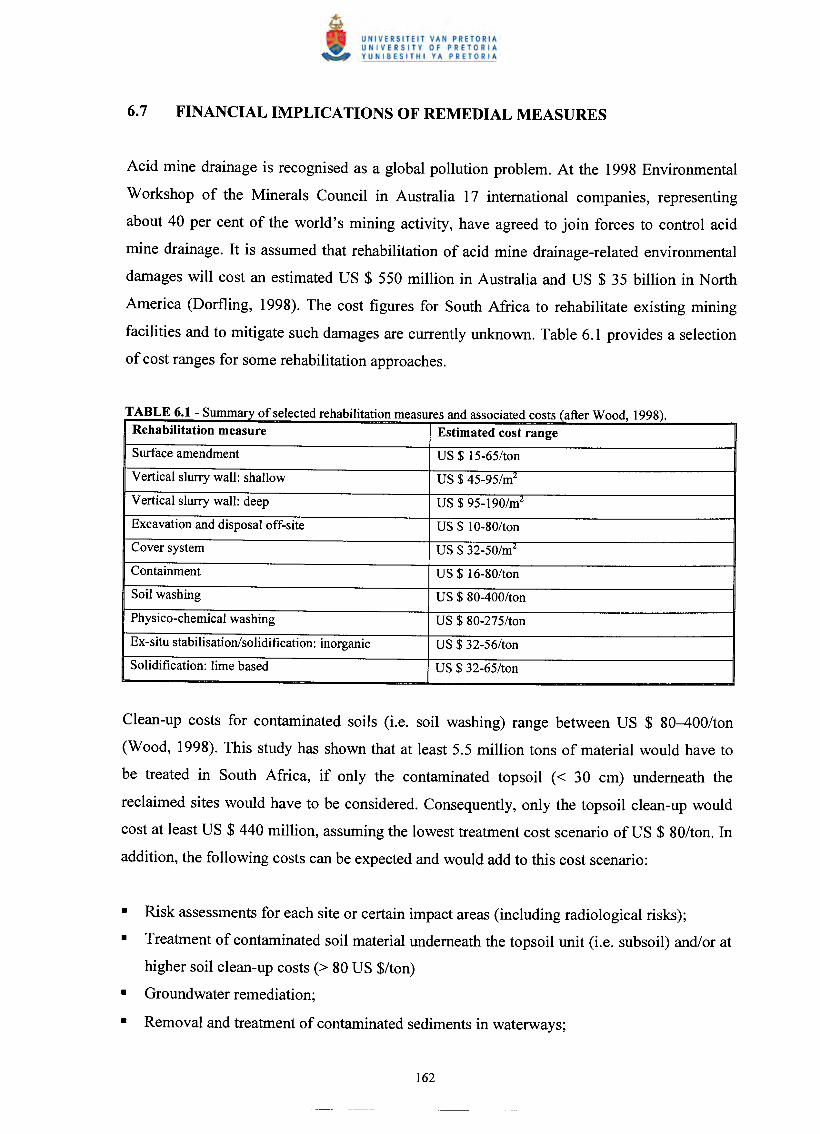
Acid mine drainage is recognised as a global pollution problem. At the 1998 Environmental
Workshop of the Minerals Council in Australia 17 international companies, representing
about 40 per cent of the world's mining activity, have agreed to join forces to control acid
mine drainage. It is assumed that rehabilitation of acid mine drainage-related environmental
damages will cost an estimated US $ 550 million in Australia and US $ 35 billion in North
America (Dortling, 1998). The cost figures for South Africa to rehabilitate existing mining
facilities and to mitigate such damages are currently unknown. Table 6.1 provides a selection
of cost ranges for some rehabilitation approaches.
- ummary 0 se ecte re a I ItatIon measures an assocIate costs a er 00 ,
Rehabilitation measure Estimated cost range
Surface amendment US $ 15-65/ton
Vertical slurry wall: shallow US $ 45-95/mL
Vertical slurry wall: deep US $ 95-190/mL
Excavation and disposal off-site US $ 10-80/ton
Cover system US $ 32-50/mL
Containment US $ 16-80/ton
Soil washing US $ 80-400/ton
Physico-chemical washing US $ 80-275/ton
Ex-situ stabilisationlsolidification: inorganic US $ 32-56/ton
Solidification: lime based US $ 32-65/ton
Clean-up costs for contaminated soils (i.e. soil washing) range between US $ 80--400/ton
(Wood, 1998). This study has shown that at least 5.5 million tons of material would have to
be treated in South Africa, if only the contaminated topsoil « 30 cm) underneath the
reclaimed sites would have to be considered. Consequently, only the topsoil clean-up would
cost at least US $ 440 million, assuming the lowest treatment cost scenario of US $ 80/ton. In
addition, the following costs can be expected and would add to this cost scenario:
• Risk assessments for each site or certain impact areas (including radiological risks);
• Treatment of contaminated soil material underneath the topsoil unit (i.e. subsoil) and/or at
higher soil clean-up costs (> 80 US $/ton)
• Groundwater remediation;
• Removal and treatment of contaminated sediments in waterways;

Remediation of existing gold mine tailings dams (e.g. cover systems) to prevent wind
erosion and, thus mitigate the generation of acid mine drainage;
Revegetation of reclaimed sites.
It is obvious that these rehabilitation costs cannot be afforded either by the South African
government or by the mining industry. It is also questionable if the predicted costs for
Australia and North America will ever be spent. Thus, rehabilitation (including treatment of
contaminated soils and groundwater) of large-scale polluted sites is uneconomical and this
should only be applied at highly contaminated sites or areas determined by a risk assessment
as high risk areas.
6.8 ENVIRONMENTAL MANAGEMENT MEASURES REQUIRED FOR THE
INVESTIGATED SITES
One of the findings of this research study is the recommendation of site-specific
environmental measures for the study sites A-K (field testing only at sites A-G). It must be
noted that this study serves as a hazard assessment or Phase 1 of a risk assessment and, thus
recommendations are of preliminary nature. Table 6.2 summarises the environmental
management measures, which are suggested for the investigated sites.
It was found that paddock systems are inappropriate in pollution prevention and should be
removed from the reclaimed sites. In addition, residual tailings, which remain in excessive
volumes on site, should be covered with an impermeable layer (assuming that the cover
option is associated with lower costs compared to the removal), in order to reduce wind-
erosion and infiltration of rainwater into the tailings dam.

- ummaryo envlfonmenta management measures recommended for the stu 1y SItes A-K.Site Monitoring Soil Site Summary
Vadose Groundwater management
Zone
A 0 No R Topsoil pH 3-4, metal contents above background,
site is not entirely reclaimed.
B R R R Topsoil pH about 3-4, metal contents such as Co
and Ni above background, site is partially situated
on dolomite.
C R 0 0 Topsoil pH about 3-4, acidity tends to migrate into
the subsoil, metal contents of above background.
The site has a vegetation cover.
D R 0 0 Topsoil pH 3-4, metal contents such as Co above
background. The site has a vegetation cover.
E 0 0 No Topsoil pH is fairly neutral, metal contents of Ni
and Co above background, but with low mobility,
remove residual tailings material; site is partially
situated on dolomite.
F R R R Topsoil pH 3-5, metal contents such as Co and Ni
above background, very high U content, removal of
residual tailings is ongoing.
G No No No Topsoil pH varies from 4 to neutral, metal contents
such as Co above background, remove paddocks.
H 0 R 0 Rehabilitation plan is currently developed; cover
residual tailings; site is partially situated on
dolomite
I R R R Groundwater risk assessment including monitoring
is .ongoing; site is partially situated on dolomite;
this site is the largest gold mining tailings dam in
South Africa
J R No 0 Remove residual.tailings material
K R R 0 Groundwater investigations are ongoing; site is
partially situated on dolomite; geochemical soil
data lacking
Note: Soil management comprises liming of those portions of the topsoil identified as acid soils and the additionof fertilisers and organic material. In cases of excessively polluted soils excavation should be considered. Rmeans "required", 0 means "optional" or future requirement, No means "no measures necessary". Grey shadedare those sites, where no field and laboratory tests during this study were conducted.
It is apparent that most of the sites require monitoring of the vadose or unsaturated zone, as
this zone represents the physical and geochemical barrier zone between the source (i.e.

contaminated site) and the receptor (i.e. groundwater system) and, thus is of major
significance for the assessment of contamination. Additionally, sites with a perched water
table or dolomitic aquifer should be monitored with respect to groundwater quality. A risk
assessment is only recommended if significant contamination of soil and/or groundwater is
indicated. It should be mentioned that for some of the investigated sites, environmental
management measures such as removal of residual tailings, soil analyses, liming of acid soils,
groundwater monitoring and numerical groundwater modelling were already undertaken by
the operating mining company, although such measures were previously not mandatory.
The EPA (1997b), other EPA sources and Skivington (1997) provide additional information
on risk assessment and their practical implementation.
Acid mine drainage is recognised as a global pollution problem and is related to the
generation of large volumes of mine waste such as the tailings produced as a result of
intensive mining activities for gold, coal and other mineral resources in South Africa. To date,
more than 270 tailings dams have been constructed to store these fine-grained tailings. Most
of the tailings dams are situated south of Johannesburg within the highly populated Gauteng
Province (currently 7.7 million people increasing to estimated 8.5 million in the year 2000).
Up to 1998 a total of 70 tailings dams were reclaimed throughout the Johannesburg region in
order to extract the gold, still present in economically viable concentrations (currently
approximately 0.40 g Au/ton). Once the tailings material has been completely reclaimed, the
land has a certain potential for development. However, it is important to realise that the
reclaimed tailings material leaves a contaminated subsurface below an area, also known as the
footprint.
It is known that gold mine tailings, originating from sulphide-bearing ore, are prone to the
generation of acid mine drainage. It is estimated that the remediation of environmental
damages related to acid mine drainage will cost about US $ 500 million in Australia and US $
35 billion in the United States (regulated under the Superfund program, see footnote 1) and
Canada. The cost figure for South Africa to rehabilitate existing tailings dams and to mitigate
damages in the unsaturated and saturated zone is currently unknown. Clean-up costs for
contaminated soil material (e.g. soil washing) range from US $ 80-400/ton. This study has
shown that at least 5.5 million tons of material would have to be treated in South Africa, if
only the polluted topsoil « 30 cm) underneath the reclaimed sites would have to be
considered. Hence, only the topsoil treatment would cost at least US $ 440 million, assuming
the lowest treatment cost scenario of US $ 80/ton. Additional rehabilitation measures such as
cover systems for present mine-residue deposits, recultivation of reclaimed land or
groundwater remediation were not taken into account for this cost scenario. It is obvious that
these rehabilitation costs cannot be afforded either by the South African government or by the
mining industry. It is also questionable if the predicted cost figures for Australia and North
America will ever be spent, in order to rehabilitate such sites. Thus, rehabilitation (including
treatment of soils and groundwater) of large-scale polluted sites is uneconomical and this

should only be applied at highly contaminated sites or areas characterised by a risk
assessment as high risk areas. It is important to realise that the understanding of the short- and
long term behaviour of contaminants in the subsurface zone affected by such mining
operations, forms an integral part of a risk assessment.
Ten selected reclaimed gold mine tailings dam sites, situated in the Gauteng Province and one
in the North-West Province of South Africa, were investigated in this study. All reclaimed
sites were analysed in terms of their short-term impact and conservative predictions were also
attempted to assess the long-term impact (worst-case scenario). In addition, the contamination
source (i.e. tailings dam) was geochemically and mineralogically characterised. Field and
laboratory tests were conducted on samples taken from seven reclaimed selected sites within
the unsaturated zone and from a shallow groundwater table. The database was supplemented
by further soil and groundwater data of the investigated sites, obtained from mining
companies, various government departments and associated institutions. Rating and index
systems were applied to assess the level of contamination contained in the unsaturated zone
underneath reclaimed gold mine tailings dams.
In conclusion, this study has shown that contamination occurs in the subsurface below the
footprints of former gold-mine tailings deposits. However, based on the findings of this study,
it is premature to quantify this impact as the results have to be incorporated into a risk
assessment approach for some of the sites. This investigation therefore provides a first step
towards a risk assessment and serves as a hazard assessment/identification.
It is important to recognise that slight changes in the pH or Eh conditions (e.g. by changes in
land use, climate, hydrology) of soils, affected by acid mine drainage can cause mobilisation
of large amounts of contaminants, which are characterised by a geochemical behaviour that is
time-delayed and non-linear. Additional field and laboratory testing would be obligatory for
an in-depth understanding of the long-term dynamic aspects of these contaminant processes,
which pose a serious threat to the vulnerable dolomitic groundwater resources and land
development. Salomons & Stigliani (1995) described these processes as " ... precisely the kind
ojresponse that catches policymakers, the public, and even scientists by surprise".
1. Groundwater quality beneath and in close vicinity to the investigated tailings dams is
dominated by the Ca-Mg-S04 type, indicating acidic seepage, although all sites with
relevant groundwater data (sites H, I and K) are underlain by dolomitic rocks. In addition,
high TDS (up to 8000 mg/I) values occur mainly as a result of high salt loads (SOl- and
Cn and are often associated with elevated trace element (e.g. As, Fe, Mn, Ni, Pb and Zn)
concentrations, exceeding target water quality standards in some boreholes.
2. The low pH (range between 3-4) in the topsoil enhances leaching of soil nutrients,
essential for plant growth and only acid tolerant plant species can survive under such
conditions. The acid conditions are a result of acid mine drainage released from the
tailings and a CaC03 deficiency in the soil. When the pH drops around 4.5 in the topsoil,
the acidity starts to migrate into the subsoil and indicates a permanent soil degra;dation.
3. An estimation of seepage quantities and sol- loads for all reclaimed sites (total area of 13
km2) has shown that an accumulated amount of approximately 1000 MI seepage is
annually discharged into the groundwater system, containing a sol- load between 1000-
5000 tons based on conservative recharge and concentration figures.
4. Elevated trace element concentrations in the soils affected by acid mine drainage and the
high mobility of phytotoxic elements such as Co and Ni could hinder the establishment of
a vegetation cover.
5. Generally, the trace elements are most mobile when the soil pH < 4.5 (prevailing in the
upper soil units), and least mobile when a soil pH > 6 (prevailing in the deeper soil units).
Cobalt, Ni and Zn are the most mobile trace elements for the selected reclaimed site and
exceed soil threshold values. Chromium, Cu, Fe, Pb and U are less mobile compared to
the above elements, indicating that a significant portion of those is likely to be contained
in the residual fraction (i. e. bound to silicates) of the solid phase.
6. The application of the geochemical load index for the assessment of the long-term impact
at seven sites classified three sites as moderately to highly contaminated, three sites as
highly contaminated and one site as excessively contaminated.
7. Soil conditions indicating preferential flow (bypass of the soil matrix) were observed in
nearly all soil profiles and even sites with relatively impermeable soils showed
contamination in the underlying groundwater system.
8. The extractable concentrations of Co, Cu, Ni and Zn found in gold-mine tailings samples
exceed threshold concentrations. This confirms that gold mine tailings are a source of
trace element contamination for soils and groundwater.
9. Leaching tests and a load calculation have shown that even reclaimed sites (i.e. footprint)
continue to release significant salt contents contained in seepage for an extended time
period (> 10 years). Incomplete reclamation of tailings would result in tailings material
remaining on the surface. Such material provides an additional reservoir for acid
generating processes and ongoing contaminant release.
10. The clean-up costs of environmental damages, caused by acid mine drainage from mine
waste disposal sites are expected to be excessively high. The most common rehabilitation
measure applied in South Africa is liming of acid soils and additional lime is also needed
to maintain a certain level of soil quality after the initial treatment. Fertilisers are required
to improve growth conditions for plants. However, it can be expected that even after site
rehabilitation has occurred, the subsoil and groundwater might remain polluted for an
extended period of time.

ADAMSON, R.J. 1973. Gold metallurgy in South Africa. Johannesburg: Chamber of Mines
of South Africa.
ALLOWAY, B.J. 1995. Heavy metals in soils. London: Blackie Academic Professional
Publisher.
ALLOWAY, B.J. & AYRES, D.C. 1996. Chemical principles of environmental pollution.
London: Blackie Academic Professional Publisher.
AMERICAN PUBLIC HEALTH ASSOCIATION. 1995. Standard methods for the
examination of water and waste water; nineteenth edition, Washington DC.
AMERICAN SOCIETY FOR TESTING AND MATERIALS. 1990. Standard test method for
pH of soils. Annual Book of ASTM Standards, 4, section 04.08: 1017-1019.
ANTROBUS, E.S.A. & WHITESIDE, H.C.M. 1964. The geology of certain mines in the East
Rand. (In: Haughton, S. H. ed. The geology of some ore deposits in Southern Africa.
Vol. 1. Johannesburg: Geology Society of South Africa, pp. 126-160.)
APPELO, C.A.J. & POSTMA, D. 1994. Geochemistry, groundwater and pollution.
Rotterdam: Balkema.
ASMAL, K. 1999. Groundwater map launch, Bisho, Eastern Cape on 1 February 1999.
Speech by Prof. K. Asmal, Minister of Department of Water Affairs and Forestry.
AUCAMP, P. 1997. Preliminary trace element soil pollution of soils affected by a tailings
dam at Machavie Gold Mine, west of Potchefstroorn. Council for Geoscience, (Rep.
No. 1997-0159). Pretoria: Council for Geoscience.
AUCAMP, P.J. & VIVIER, F.S. 1987. A novel approach to water quality criteria in South
Africa. (In: Conference proceedings: Symposium Water 2000. Nice: IWSA.)
BANKS, D., REIMANN, C., ROYSET, 0., SKARPHAGEN, H. & SAETHER, O.M. 1995.
Natural concentrations of major and trace elements in some Norwegian bedrock
groundwaters. Appl. Geochem., 10: 1-16.
BARTON, E.S. & HALLBAUER, D.K. 1996. Trace-element and U-Pb isotope compositions
of pyrite types in the Protozoic Black Reef, Transvaal Sequence, South Africa:
Implications on genesis and age. Chern. Geol., 133: 173-199.
BELL Y, R.T. & BROCK, T.D. 1974. Ecology of iron-oxidizing bacteria in pyritic materials
associated with coal. J. Bacteriol., 117: 726-732.

BENNETT, H. & OLIVER, G. 1992. XRF analysis of ceramics, minerals and applied
materials. New York: John Wiley & Sons.
BIRKE, M. 1998. Geochemical investigations in urban areas - Megacities, mining districts,
waste disposal and industrial zones. (In: Conference proceedings: Geocongress 19988,
hosted by the Council for Geoscience, Pretoria, pp. 3-5.)
BLAIR, R.D., CHERRY, J.A., LIM, T.P. & VIVYURKA, A. J. 1980. Groundwater
monitoring and contaminant occurrence at an abandoned tailings area, Elliot Lake,
Ontario. (In: Brawner, C. ed. Conference proceedings: First International Conference
on Uranium Mine Waste Disposal, May 1980, pp. 19-21.)
BLIGHT, G. & DU PREEZ, J. 1997. The escape of salt pollution from decommissioned
gold residue deposits in South Africa. J. S. Afr. Inst. Min. Meta1l., Jul./Aug. 1997:
201-204.
BLIGHT, G.E. & CALDWELL, J.A. 1984. The abatement of pollution from abandoned
gold-residue dams. J. S. Afr. Inst. Min. Metall.. 84(1): 1-9.
BLOWES, D.W. 1995. Acid generation and contaminant transport in decommissioned
sulfide-bearing mine-tailings impoundments. (In: Conference proceedings: Uranium
Mining and Hydrogeology. Freiberg, Sachsen, pp. 43-53.)
BLOWES, D.W. 1983. The influence of the capillary fringe on the quantity and quality of
runoff in an inactive uranium mill tailings impoundment Ontario: University of
Waterloo (Ph.D. thesis).
BLOWES, D.W., CHERRY, J.A. & REARDON, E.J. 1988. Geochemical evolution for four
inactive sulphide-rich tailings impoundments in Canada. (In: Conference proceedings:
International Conference on Control of Environmental Problems From Metal Mines,
held on 20 - 24 June 1983, Roros, Norway.)
BOWIE, S.H.U. & PLANT, J. 1983. Radioactivity in the environment. (In: Thornton, I. ed.
Applied environmental geochemistry. New York: Academic Press, pp. 481-495.)
BRINK, A.B.A. 1985. Engineering geology of South Africa, Vol. 4: Post-Gondwana
Deposits. Pretoria: Building Publications.
BROCK, T.D. & MADIGAN, M.T. 1991. Biology of microorganisms; sixth
edition. Washington, New Jersey: Prentice Hall.
BROOKS, R.R. 1987. Serpentine and its vegetation. London: Crom Helm.
BRUSSEAU, M. & RAO, P. 1989. Sorption non-ideality during organic contaminant
transport in porous media. Critical Review Environmental Control (CRC), 19: 22-99.

BUNDESGESUNDHEITSAMT (BGA). 1993. Die neuen Trinkwasserleitwerte der WHO fUr
chemische Stoffe und ihre praktische Bedeutung. Bundesgesundheitsblatt, 36. Jahrg.,
Mai 1993, 5 (Sonderdruck).
CARUCCIO, F.T. 1968. An evaluation of factors affecting acid mine drainage production and
the groundwater interactions in selected areas of Western Pennsylvannia. (Second
Symposium on Coal Mine Drainage Research, Bitumious Coal Research in
Monroeville, Pennsylvania: 107-152.)
CHERRY, J.A., BLACKPORT, R.J., DUBROSVSKY, N.M., GILHAM, R.W., LIM, T.P.,
MORIN, K.A., MURRAY, D., REARDON, E.J. & SMITH, D.J.A. 1980. Subsurface
hydrology and geochemical evolution of inactive pyritic tailings in the Elliot Lake
Uranium District. Canada. (In: Conference proceedings: Symposium on Uranium Mill
Tailings Management. 24-25 Nov. 1980, Fort Collins, Colorado.)
CLAUSEN, H.T. 1969. Dissolved solids load in the Vaal Barrage Water System with
reference to mine effluents. (In: Paper presented at the Institute of Water Pollution
Control Symposium.)
COETZEE, H. & SZCZESNIAK, H. 1993. Detection and monitoring of pollution from mine
tailings dams along rivers in the Witwatersrand gold fields, using airborne radiometric
method. (In: Proceedings: Sixteenth International Colloguim on African Geology, pp.
94-96.)
COETZEE, H. 1995. Radioactivity and the leakage of radioactive waste associated with
Witwatersrand gold and uranium mining. (In: Conference proceedings: Uranium
Mining and Hydrogeology, held in Freiberg, Sachsen, pp. 90-99.)
COGHO, V.E., VAN NIEKERK, L.J., PRETORIUS, H.P.J. & HODGSON, F.D.L 1992. The
development of techniques for the evaluation and effective management of surface and
groundwater-contamination in the Orange Free State Gold Fields (Rep. No. K5/224).
Pretoria: Water Research Commission.
COUNCIL FOR NUCLEAR SAFETY (CNS). 1996. Confidential report.
COUNCIL FOR NUCLEAR SAFETY (CNS). 1997. Guideline to the assessment of radiation
hazards to members of the public from mining and mineral processing facilities. Draft
LG-I032, Pretoria, 50 p.
CRAVOTTA, C.A., BRADY, K.B.C., SMITH, M.W. & BEAM, R.L. 1990. Effectiveness of
the addition of alkaline materials at surface coal mines in preventing or abating acid
mine drainage: Part 1. Geochemical considerations. (In: Conference proceedings:

Conference on Mining, Reclamation and Exhibition in Charleston. West Virginia,
23-26 April 1990, pp. 226-225.)
CREAMER, M. 1998. 12.3 t from poorest material. Mining Weekly, December1998: 4-10.
CROUNSE, R.G., PORIES, W.J., BRAY, IT. & MAUGER, R.L. 1983. Geochemistry and
man: health and disease. 1. Elements possibly essentials, those toxic and others. (In:
Thornton, 1. ed. Applied environmental geochemistry. New York: Academic Press,
pp. 309-330.)
DANIEL, D.E. ed. 1993. Geotechnical practice for waste disposal. London: Chapman & Hall.
DAVIES, B.E. 1983. Heavy metal contamination from base metal mining and smelting:
Implications for man and his environment. (In: Thornton, 1. ed. Applied environment
geochemistry. New York: Academic Press, pp. 452-462.)
DE JESUS, A.S.M., MALAN, J J., ELLERBECK, V.T., VAN DER BANK, DJ. &
MOOLMAN, E.W. 1987. An assessment of the Radium-226 concentration levels in
tailings dams and environmental waters in the gold/uranium mining areas of the
Witwatersrand. Pelindaba: Atomic Energy Corporation (Rep. PER-159).
DEPARTMENT OF WATER AFFAIRS AND FORESTRY (DWAF). 1995. Dolomitic
groundwater resources ofthe Republic of South Africa (Rep. No. GH 3857), Pretoria.
DEPARTMENT OF WATER AFFAIRS AND FORESTRY (DWAF). 1996. Vaal River
Barrage catchment: Impact of the mining industry on water quality. Report, Pretoria.
DEPARTMENT OF WATER AFFAIRS AND FORESTRy'1996a (DWAF). Volume 1:
South African water quality guidelines - domestic water use. Report, Pretoria.
DEPARTMENT OF WATER AFFAIRS AND FORESTRY (DWAF). 1996d. Volume 4:
South African water quality guidelines - Agricultural water use: Irrigation. Report,
Pretoria.
DEPARTMENT OF WATER AFFAIRS AND FORESTRY (DWAF). 1998. Minimum
requirements for water monitoring at waste management facilities. Documents 1-3,
second edition. Pretoria.
DORFLING, C. 1998. Mines agree on acid drainage. Mining Weekly, Nov. 1998: 13-19.
DRIESSEN, P.M eds. 1991. The major soils of the world. Zutphen: Wohrmann.
DUBROSKY, N.M., MORIN, K.A., CHERRY, J.A. & SMYTH, D.J.A. 1984b. Uranium
tailings acidification and subsurface contaminant migration in a sand aquifer. Canad. J.
Water Poll. Res., 19(1): 55-89.
DUBROSVSKY, N.M. 1986. Geochemical evolution of inactive pyritic tailings in the Elliot
Lake Uranium District. University of Waterloo, Ontario: University of Waterloo
(Ph. D. thesis).
DUBROVSKY, N.M., CHERRY, J.A., REARDON, E.J. & VIVYURKA, A.J. 1984a.
Geochemical evolution of inactive pyritic tailings in the Elliot Lake uranium district:
1. The groundwater zone. Canad. Geotech. J., 22(1): 110-128.
DUNCAN, D.W. & BRUYNESTEYN, A. 1971. Enhancing bacterial activity in a uranium
mine. Transactions of the Canadian Institute of Mining and Metallurgy and of the
Society of Nova Scotia, 74: pp. 116.120.
EALES, K., FORSTER, S. & DU MANGO, L. 1997. Strain, water demand, and supply
direction in the most stressed water systems of Lesotho, Namibia, South Africa, and
Swaziland. (In: Rached, E., Rathgeber, E. & Brooks, D.B. eds. Water management in
Africa and the Middle East. Ottawa: IDRC Publisher.)
ELSENBROEK, J.H. & SZCZESNIAK, H.L. 1997. Regional geochemistry and statistics of
the soils of the dolomites on a portion of the Ghaap Plateau Formation and a portion of
the Malmani Subgroup, South Africa (Rep. No. 1997-0114). Pretoria: Council for
Geoscience.
ENGINEERING NEWS. 1997. An update of the South African waste scenario. Publication:
24-30 October 1997.
EVANS, G.H. 1990. The geochemistry and environmental study of a reed-bed adjacent to a
gold slimes dump, with aspects on acid mine water and heavy metal pollution.
Johannesburg: University of Witwatersrand (B.Sc. thesis).
EVERETT, L.G., WILSON, L.G. & HOYLMAN, E.W. 1984. Vadose zone monitoring for
hazardous waste. Washington, New Jersey: Noyes Data Corporation.
FAGERSTROM, T. & JERNELOV, A. 1972. Aspects of the quantitative ecology of
mercury. Water Resources. 6: 1193-1202.
FEATHER, C.E. & KOEN, G.M. 1975. The mineralogy of the Witwatersrand reefs.
Minerals Sci. Engng., 7(3): 189-224.
FELL, R., MACGREGOR, P. & STAPLEDON, D. 1992. Geotechnical engineering of
embankment dams. Rotterdam: Balkema.
FENTON, G. 1997. Looking at liming? How much do you need? Agricultural Notes 5/115,
electronic edition (www.agric.nsw.gov.au/ann/soil--pub/5115.htm).

FERGUSON, K.D. & ERICKSON, P.M. 1988. Pre-mine prediction of acid mine drainage.
(In: Salomons, W. & Forstner, U. eds. Environmental management of solid waste.
Dredged material and mine tailings. Berlin: Springer, pp. 24-44.)
FORSTNER, U. & KERSTEN, M. 1988. Assessment of metal mobility in dredged material
and mine waste by pore water chemistry and solid speciation. (In: Salomons, W. &
Forstner, U. eds. Chemistry and biology of solid waste. Berlin: Springer: pp. 214-238.)
FORSTNER, U. & MULLER, G. 1974. Schwermetalle in Fliissen und Seen als Ausdruck der
Umwe1tverschmutzung. Berlin: Springer.
FORSTNER, U. & WITTMANN, G.T.W. 1976. Metal accumulations in acidic waters from
gold mines in South Africa. Geoforum, 7: 44-49.
FORSTNER, U. & WITTMANN, G.T.W. 1981. Metal pollution in the aquatic environment.
Berlin: Springer.
FORSTNER, U. 1982. Schadstoffe im Wasser, Metalle - Phenole und algenbiirtige Stoffe.
Bonn: Deutsche Forschungsgemeinschaft.
FORSTNER, U. 1983. Metal pollution in rivers and estuaries. (In: Thornton, I. ed: Applied
environmental geochemistry. New York: Academic Press, pp. 395-419.)
FORSTNER, U. 1989. Contaminated sediments. (In: Lecture notes in earth sciences. Berlin:
Springer.)
FORSTNER, U. 1995. Non-linear release of metals from aquatic sediments. (In: Salomons,
W. & Stigliani, W.M. eds. Biogeodynamics of pollutants in soils and sediments - Risk
assessment of delayed and non-linear responses. Berlin: Springer, pp. 247-298.)
FUGGLE, RF. & RABIE, M.A. 1992. Environmental management in South Africa.
Johannesburg: Juta.
FUNKE, J.W. 1985. Contribution of mining wastes to the mineral pollution of the Vaal
catchment area and of the Vaal Barrage. Pretoria: Water Research Commission.
FUNKE, J.W. 1990. The water requirements and pollution potential of South African gold
and uranium mines. Pretoria: Water Research Commission (Rep. No. KV9/90).
GARRELS, RM. & CHRIST, C.L. 1965. Solutions, minerals and equilibria. New York:
Harper & Row.
GOVERNMENT PRIINTER OF SOUTH AFRICA. 1986. Geological Map 2628 East Rand.
Pretoria.
GRIFFITHS, G. & SMITH, S. 1998. Risk assessment and management strategies. (In: Hester,
RE. & Harrison, RM. eds. Contaminated land and its reclamation. London: Royal
Society of Chemistry, pp. 103-123.)

HAHNE, H.C.H.; HUTSON, J.L. & DU PLESSIS, M. 1976. Pilot investigation on mine
dump materials: Mineralogical, chemical and textural properties. Pretoria: Department
of Agricultural Technical Services (Rep. No. 841/55/76).
HALLBAUER, D.K. 1986. The mineralogy and geochemistry of Witwatersrand pyrite, gold,
uranium, and carbonaceous matter. (In: Anhaeusser, C.R & Maske, S. eds. Mineral
Deposits of Southern Africa, I. Johannesburg: Geological Society of South Africa, pp.
731-752.)
HAWLEY, J.R 1977. The problem of acid mine drainage in the province of Ontario. Ontario:
Ministry of the Environment.
HEINRICHS, H. & HERRMANN, AG. 1990. Praktikum der analytischen Geochemie.
Berlin: Springer.
HEROLD, C. 1981. A model to simulate daily river flows and associated diffuse-source
conservative pollutants (Rep. No.3/81). University of the Witwatersrand, Johannesburg:
Hydrological Research Unit.
HOLTING, B.H. 1996. Hydrogeologie. Stuttgart: Enke.
HOLTZ, RD. & KOVACS, W.D. 1981. An introduction to geotechnical
engineering. Washington, New Jersey: Prentice Hall.
HORTON, J.H. & HAWKINS, R.H. 1965. Flow path from the soil surface to the water table.
Soil Science, 100(6): 377-383.
HUTCHINSON, T.C. 1981. Effects of heavy metal pollution on plants. London: Applied
Science Publishers.
HUTCHINSON, I.P.G. & ELLISON, RD. 1992. Mine waste management. Boca Raton:
Lewis Publishers.
JENNINGS, lE.B., BRINK, A B.A & WILLIAMS, AAB. 1973. Revised guide to soil
profiling for civil engineering purposes in South Africa. Transactions of the South
African Institute of Civil Engineers (SAlCE), 15.
JOHNSON, M. S., COOKE, J. A & STEVENSON, J. K. W. 1998. Revegetation of
metalliferous wastes and land after metal mining. (In: Hester, R E. & Harrison, R. M.
eds. Mining and its environmental impact, pp. 31-47. Cambridge: Royal Society of
Chemistry. )
JOUBERT, R 1998. The agricultural viability of two reclaimed tailings dams near Springs,
East Rand. Pretoria: University of Pretoria (B.Sc. thesis).
KABATA-PENDIAS, A & PENDIAS, H. 1992. Trace elements in soils and plants. Boca
Raton, Florida: CRC Press.

KABATA-PENDlAS, A 1992. Behavioural properties of trace metals III soils. AImLGeochem., 2: 3-9.
KABATA-PENDlAS, A 1994. Agricultural problems related to excessive trace element
contents of soils. (In: Salomons, W., Mader, P. & Forstner, U. eds: Pathways, impact
and engineering aspects of metal polluted sites. Berlin: Springer.)
KAFRI, U., FOSTER, M., DETREMMERIE, F. SIMONIS, J. & WIEGMANS, F.E. 1986.
The hydrogeology of the dolomite aquifer in the Kliprivier-Natalspruit basin (Report
GH 3408). Pretoria: Department of Water Affairs and Forestry.
KAVANAUGH, M. 1996. Resolving the conflict between policy and practicality. Water
Quality International (WQI), Dec.l996: 13-14.
KLEINMANN, R.L.P., CRERAR, D.A & PACELLI, RR 1981. Biogeochemistry of acid
mine drainage and a method to control acid formation. Mining Engineering, 33.
KLIPPEL, RW. & HAGARMAN, J.A 1983. Landfilling air pollution dust from specialty
steel production on a Solvay Process waterbed. (In: Conference proceedings:
Fifteeentht Mid-Atlantic Industrial Waste Conference, held in Lewisburg, PA)
KOLLING, M. 1990. Modellierung geochemischer Prozesse in Sickerwasser und
Grundwasser. -Beispiel. Die Pyritverwitterung und das Problem saurer Grubenwasser.
Bremen: Geowissenschaften Universitat Bremen (Rep. 8).
LABUSCHAGNE, L.S., HOLDSWORTH, R. & STONE, T.P. 1993. Regional stream
sediment geochemical survey of South Africa. J. Geo. Explor., 47(1-3): 283-296.
LAEGERWERFF, J.V. & BROWER, D.L. 1974. Trace substances in environmental health.
Missouri, Columbia: University of Missouri.
LAHERMO, P., MANNIO, J. & TARAVAINEN, T. 1995. The hydrogeochemical
comparison of streams and lakes in Finland. Appl. Geochem., 10: 205-210.
LAMPKIN, AJ. & SOMMERFELD, M.R. 1981. Impact of reclamation on drainage from the
Sheldon mine complex, Yavapai County, Arizona. Journal of Arizona-Nevada
Academic Science, 16: 65-68.
LIDE, D. R ed. 1999. Handbook of Chemistry and Physics; 78th edition. Boca Raton, Florida:
CRC Publisher.
LIEBENBERG, W.R 1973. Mineralogical features of gold ores in South Africa. (In:
Adamson, R.J.: Gold metallurgy in South Africa. Johannesburg: Chamber of Mines of
South Africa, pp. 352-426.)
LLOYD, J.W. & HEATHCOTE, J.A 1985. Natural inorganic hydrogeochemistry in relation
to groundwater. Oxford: Clarendon Press.

LLOYD, P.J.D. 1981. The flotation of gold, uranium and pyrite from Witwatersrand areas. LS. Afr. Inst. Min. Metall.. 81(2): 41-47.
LLOYD, P.J.D. 1997. Comment on paper: The escape of salt pollution from decommissioned
gold residue deposits. J. S. Afr. Inst. Min. Metall., Nov.lDec. 1997: 325-327.
LOGAN, T.J. 1992. Reclamation of chemically degraded soils. (In: Lal, R. & Stewart, B.A.
eds: Advances in soil science - soil restoration. New York: Springer, pp. 13-31.)
LUNDGREN, D.G., VESTAL, J.R & TABITA, F.R 1972. The microbiology of mine
drainage pollution. (In: Mitchell, R ed. Water pollution microbiology. New York:
Wiley, pp. 69-88.)
MACKAY, D. & CHERRY, J. 1989. Groundwater contamination: pump-and-treat
remediation. Environ. Sci. Techn., 23(6): 630-636.
MARSAL, D. 1987. Statistics for geoscientists. New York: Pergamon Press.
MARSDEN, D.D. 1986. The current limited impact of Witwatersrand gold-mine residues on
water pollution in the Vaal River system. J. S. Afr. Inst. Min. Metall., 86(12): 481-
504.
MARTIN, J.P. & KOERNER, RM. 1984a: The influence of vadose zone conditions on
groundwater pollution - Part 1: Basic principles and static conditions. J. Hazard. Mat.,
8: 349-366.
MARTIN, J.P. & KOERNER, R.M. 1984b. The influence of vadose zone conditions on
groundwater pollution - Part 2: Fluid movement. J. Hazard. Mat., 9: 181-207.
MATHEWSON, C.C. 1981. Engineering geology. Ohio: Merril.
MECER,1. & COHEN, R 1990. A review of immiscible fluids in the subsurface; properties,
models, characterization and remediation. Journal of Contaminant Hydrology, 6: 107-
163.
MENDE, A. & MOCKER, D. 1995. Mobilisierung von konventionellen und radioaktiven
Schadstoffen des Altbergbaus durch sauren Regen. (In: Conference proceedings:
Uranium Mining and Hydrogeology, held in Freiberg, Sachsen, pp. 345-354.)
MERRINGTON, G. & ALLOWAY, B.1. 1993. Das Verhalten von Schwermetallen 10
Abraum und Boden im Bereich alter eisenmetallischer Minen. (In: Arendt, F.,
Annokkee, G.J., Bosman, R. & Van den Brink, W.J. eds. Altlastensanierung 1993 -
Fourth international KfKJTNO congress for remediation. Berlin (Mai 1993),
Deutschland, pp. 225-233.)
MEYER, M., SAAGER, R. & VOLKEL, V. 1986. Uranium distribution and redistribution in
a suite of fresh and weathered pre-Witwatersrand and Witwatersrand conglomerates

from South Africa. Johannesburg: Economic Research Unit of the University of
Witwatersrand (Information Circular No. 174).
MILLS, P.C. 1993. Water movement and water chemistry in the unsaturated zone beneath a
low level waste disposal site in Sheffield/Illinois. Series of the USGS Water Supply
Paper. Washington DC (Rep. No. 2398).
MINING JOURNAL RESEARCH SERVICES. 1996. Tailings dams incidents: 1980-1996 - a
study for the United Nations Environmental Programme (UNEP). Mining
Environmentl Management, 9: 15-19.
MITCHELL, R. 1978. Water pollution microbiology. New York: Wiley.
MOORE, J.W. & RAMAMOORTHY, S. 1984. Heavy metals in natural waters - Applied
monitoring and impact assessment. Berlin: Springer.
MOREL, F.M.M. & HERING, J.G. 1993. Principles and applications of aquatic chemistry.
New York: Wiley.
MORIN, KA 1983. Prediction of subsurface contaminant transport in acidic seepage from
uranium tailings impoundments. Ontario: University of Waterloo (Ph.D. thesis).
MORIN, KA, CHERRY, J.A, DAVE, N.D., LIM, T.P. & VIVYURKA, AJ. 1988a.
Migration of acidic groundwater seepage from uranium-tailings impoundments, 1.
Field study and conceptual hydrogeochemical model. Journal of Contaminant
Hydrology, 2(4): 271-303.
MORIN, KA., CHERRY, J.A, NAND, KD., LIM, T.P. & VIVYURKA, AJ. 1988b).
Migration of acidic groundwater seepage from uranium-tailings impoundments, 2.
Geochemical behaviour of radionuclides in groundwater. Journal of Contaminant
Hydrology, 2(4): 304-322.
MORTH, AH., SMITH, E.E. & SHUMATE, K.S. 1972. Pyritic systems: a mathematical
model. United States Environmental Protection Agency (Rep. R-2-72-002).
MORTIMER, C. E. 1987. Chemistry. Belmont, California: Wadsworth.
MULLER, G. 1979. Schwermetalle in den Sedimenten des Rheins - Veranderungen seit
1971. Umschau, 79: 778-783.
MULVEY, P. 1998. Groundwater monitoring. Mining Environment Management, Jul. 1998:
13-20.
NATIONAL RESEARCH COUNCIL. 1994. Alternatives for groundwater cleanup.
Washington DC: National Academy Press.
NATIONAL WATER ACT. 1998. National Water Act. Government Gazette of the Republic
of South Africa, 398(19182) from 26 August 1998, Cape Town.
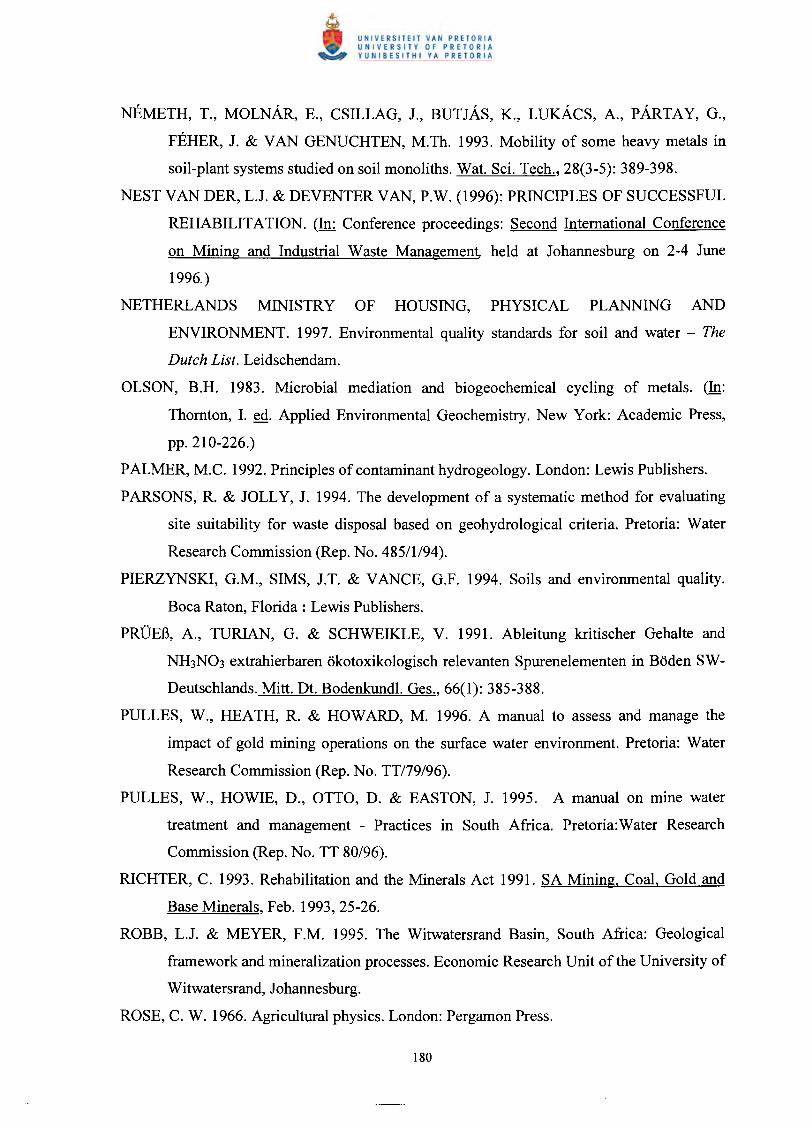
NEMETH, T., MOLNAR, E., CSILLAG, J., BUTJAS, K., LUKACS, A., pARTAY, G.,
FEHER, J. & VAN GENUCHTEN, M.Th. 1993. Mobility of some heavy metals in
soil-plant systems studied on soil monoliths. Wat. Sci. Tech., 28(3-5): 389-398.
NEST VAN DER, L.J. & DEVENTER VAN, P.W. (1996): PRINCIPLES OF SUCCESSFUL
REHABILITATION. (In: Conference proceedings: Second International Conference
on Mining and Industrial Waste Management. held at Johannesburg on 2-4 June
1996.)
NETHERLANDS MINISTRY OF HOUSING, PHYSICAL PLANNING AND
ENVIRONMENT. 1997. Environmental quality standards for soil and water - The
Dutch List. Leidschendam.
OLSON, B.H. 1983. Microbial mediation and biogeochemical cycling of metals. (In:
Thornton, I. ed. Applied Environmental Geochemistry. New York: Academic Press,
pp.210-226.)
PALMER, M.C. 1992. Principles of contaminant hydrogeology. London: Lewis Publishers.
PARSONS, R. & JOLLY, J. 1994. The development of a systematic method for evaluating
site suitability for waste disposal based on geohydrological criteria. Pretoria: Water
Research Commission (Rep. No. 485/1/94).
PIERZYNSKI, G.M., SIMS, J.T. & VANCE, G.F. 1994. Soils and environmental quality.
Boca Raton, Florida: Lewis Publishers.
PROEB, A., TURIAN, G. & SCHWEIKLE, V. 1991. Ableitung kritischer Gehalte and
NH3N03 extrahierbaren okotoxikologisch relevanten Spurenelementen in Boden SW-
Deutschlands. Mitt. Dt. Bodenkundl. Ges., 66(1): 385-388.
PULLES, W., HEATH, R. & HOWARD, M. 1996. A manual to assess and manage the
impact of gold mining operations on the surface water environment. Pretoria: Water
Research Commission (Rep. No. TT/79/96).
PULLES, W., HOWIE, D., OTTO, D. & EASTON, J. 1995. A manual on mine water
treatment and management - Practices in South Africa. Pretoria:Water Research
Commission (Rep. No. TT 80/96).
RICHTER, C. 1993. Rehabilitation and the Minerals Act 1991. SA Mining, Coal, Gold and
Base Minerals, Feb. 1993,25-26.
ROBB, L.J. & MEYER, F.M. 1995. The Witwatersrand Basin, South Africa: Geological
framework and mineralization processes. Economic Research Unit of the University of
Witwatersrand, Johannesburg.
ROSE, C. W. 1966. Agricultural physics. London: Pergamon Press.

ROSNER, T. 1996. EinfluB von Goldhalden auf die Grundwasserqualitat in der East Rand
Region/Witwatersrand - Zwischenbericht. Bonn: DAAD (unpubl.)
ROSNER, T., BOER, R.H., REYNEKE, R., AUCAMP, P. & VERMAAK, J.J.G. 1998. A
preliminary assessment of pollution contained in the unsaturated and saturated zone
beneath reclaimed gold-mine residue deposits. Pretoria: Water Research Commission
(Rep. No. K5/797/0/1).
RULKENS, W.H., GROTENHUIS, J.T.C. & TICHY, R. 1995. Methods for cleaning
contaminated soils and sediments. (In: Forstner, U. ed. Heavy metals. Berlin: Springer,
pp. 164-186.)
RUNNELS, D.D., SHEPHERD, T.A. & ANGINO, E.E. 1992. Metals in water. Envir. Sci.
and Technol., 26(12): 2316-2322.
RUST, E., VAN DEN BERG, J.P. & JACOBSZ, S.W. 1995. Seepage analysis from
piezocone dissipation tests. (In: Conference proceedings: International Symposium on
Cone Penetration Testing, held at the Swedish Geotechnical Institute, Linkoping,
Sweden.)
SALOMONS, W. & STIGLIANI, W.M. 1995. Biogeodynamics of pollutants in soils and
sediments - Risk assessment of delayed and non-linear responses. Berlin: Springer.
SCHEFFER-SCHACHTSCHABEL, P. 1984. Lehrbuch der Bodenkunde. Stuttgart: Enke.
SCHLOEMANN, H. 1994. The geochemistry of some Western Cape soils (South Africa)
with emphasis on toxic and essential elements. Cape Town: University of Cape Town
(Ph.D. thesis).
SCOTT, R. 1995. Flooding of Central and East Rand gold mines - An investigation into
controls over the inflow rate, water quality and the predicted impacts of flooded
mines. Pretoria: Water Research Commission (Rep. No. 486/1/95), Pretoria.
SILVER, M. 1987. Distribution of iron-oxidizing bacteria in the Nordic uranium tailings
deposit, Elliot Lake, Ontario, Canada. Applied and Environmental Microbiology, 53
(4): 846-852.
SINGER, P.C. & STUMM, W. 1970. Acid mine drainage: The determining step. Science, 20.
Feb.1970: 1121-1123.
SKIVINGTON, P. 1997. Risk assessment for water quality management. Pretoria: Water
Research Commission (Rep. No. TT90/97).
SMITH, E.E. & SHUMATE, K.S. 1970. The sulfide to sulfate reaction mechanism. United
States Environmental Protection Agency (Rep. No. 14016).

SOIL CLASSIFICATION WORKING GROUP. 1991. Soil classification: A taxonomic
system for South Africa. Memoirs on the Agricultural Natural Resource of South
Africa, 15.
SOUTH AFRICAN BUREAU OF STANDARDS. 1984. Specification for water for domestic
supplies (Rep. 24101984), Pretoria.
SOUTH AFRICAN BUREAU OF STANDARDS. 1997. Proposed code of practice for mine
residue deposits, Pretoria.
STEFFEN, O. ROBERTSON, A. & KIRSTEN, H. 1988. Research on the contribution of
mine dumps to the mineral pollution load in the Vaal barrage. Pretoria: Water
Research Commission (Rep. No. PT. 3632/10).
SUTTON, P. & DICK, W.A. 1984. Reclamation of acid mined lands in humid areas.
Advances in Agronomy, 41: 377-405.
TAVENAS, F., JEAN, P., LEBLOND, P. & LEROUEIL, S. 1983. The permeability of
natural soft clays. Part II: Permeability characteristics. Canadian Geotechnical Journal,
20: 645-660.
THORNTON, 1. ed. 1983. Applied Environmental Geochemistry. New York: Academic
Press.
TRAVIS, C. & DOTY, C. 1990. Can contaminated aquifers at Superfund sites be
remediated? Environ. Sci. Techn., 24(10): 1464-1466.
TUREKIAN, K.K. & WEDEPOHL, K.H. 1961. Distribution of the elements in some units of
the earth crust. Bull. Soc. Am.. 72: 175-192.
UMWELTBUNDESAMT. 1996. Methods in soil protection used in Poland, Slovakia, the
Czech Republic and Hungary (Rep. Texte 77/96, ISSN 0722-186X), Berlin.
UNITED STATES ENVIRONMENTAL PROTECTION AGENCY (EPA). 1976. Erosion
and sediment control, surface mining in the eastern U.S. Washington D.C.: U.S.
Government Printing Office (Rep. EPA-625/33-76-006).
UNITED STATES ENVIRONMENTAL PROTECTION AGENCY (EPA). 1985. Wastes
from the extraction and beneficiation of metallic ores, phosphate rock, asbestos,
overburden from uranium mining and oil shale. Washington D.C. Report to Congress
(EPA-530/SW-85-033).
UNITED STATES ENVIRONMENTAL PROTECTION AGENCY (EPA). 1987a.
Underground storage tank corrective technologies. Hazardous Waste Engineering
Research Laboratory. U.S. Government Printing Office (Rep. EPA-600/2-89-035),
Washington D.C.

UNITED STATES ENVIRONMENTAL PROTECTION AGENCY (EPA). 1989. Evaluation
of ground water extraction remedies. U.S. Government Printing Office (Vols. 1 and 2),
Washington DC: U.S. Government Printing Office.
UNITED STATES ENVIRONMENTAL PROTECTION AGENCY (EPA). 1996a.
Groundwater clean-up at Superfund sites (brochure of Superfund & EPCRA).
UNITED STATES ENVIRONMENTAL PROTECTION AGENCY. 1997a (EPA). EPA
Superfund today - focus on risk assessment (rep. EPA 540-K-96-003), Washington
DC.
UNITED STATES ENVIRONMENTAL PROTECTION AGENCY. 1997b (EPA). Rules of
thumb for Superfund remedy selection (rep. EPA 540-R-97-013), Washington DC.
UTERMANN, J., GABLER, H.E., HINDEL, R., KUES, J., MEDERER, J. & PLUQUET, E.
1998. Schwermetallgehalte im Bodenwasser - ein Vergleich von drei
Extraktionsverfahren. Z. angew. Geo!' 44: 204-209.
VAN DEN BERG, J.P. 1995. Monitoring of phreatic surface of a tailings dam and the
subsequent stability implications. Pretoria: University of Pretoria (M.Sc. dissertation).
VAN DER NEST, L.J. & DEVENTER VAN, P.W. 1996. Principles of successful
rehabilitation. (In: Conference proceedings: Second International Conference on
Mining and Industrial Waste Management. held at Johannesburg on 2-4 June 1996.)
VAUGHAN, D.J. & CRAIG, J.R. 1978. Mineral chemistry of metal sulfides. (In: Harland,
W. Agrell, B.S.O., Cook, A.H. & Hughes, N.F. eds. Cambridge Earth Science Series.
Cambridge: Cambridge University Press.)
VEGTER, J.R. 1984. The role of groundwater III South Africa's water supply. (In:
Conference proceedings: Groundwater Technology, Johannesburg, pp. 3-14.)
VON RAHDEN, H.V.R. 1970. Mineralogical and geochemical studies of some
Witwatersrand gold ores with special reference to the nature of phyllosilicates.
Johannesburg: University of Witwatersrand (Ph. D. thesis).
WAGENER, F.M., VAN DEN BERG, J. P. & JACOBSZ, S.W. 1997. Monitoring seepage
regime in tailings dams in practice. (In: Conference proceedings: Second International
Conference on Mining and Industrial Waste Management, held on 2-4 June1997 at the
South African Institute of Civil Engineers (SAlCE), Johannesburg.)
WAGNER, J.C. & VAN NIEKERK, A.M. 1987. Quality and treatment of effluents
originating from mine and municipality solid waste sites. (In: Conference proceedings:
Mining and Industrial Waste Management, held in Johannesburg, pp. 283-288.)

WALTON, D.G. & LEVIN, M. 1993. The identification and verification of polluted areas in
the dolomitic aquifers of the PWV area. Atomic Energy Corporation, Pretoria, GEA-
1045.
WARD, RC. & ROBINSON, M. 1990. Principles of hydrology. London: McGraw-Hill.
WATES, J.A, STRAYTON, G. & BROWN, S.AP. 1997. Environmental aspects relating to
the design and construction of tailings dams in South Africa. (In: Conference
proceedings: Second International Conference on Mining and Industrial Waste
Management, held on 2-4 June at the South African Institute of Civil Engineers
(SAlCE), Johannesburg.)
WEATHER BUREAU. 1999. Weather data from 1961-1990. Pretoria: Directorate of
Climatology, electronic edition (www.sawb.gov.za/www/climate).
WHITE, RE. 1989. Introduction to the principles and practices of soil science. London:
Blackwell Scientific Publications.
WHITNEY, D.A & LAMOND, R.E. 1999. Liming acid soils. Kansas State University Notes
on Soil Fertility, electronic edition (www.oznet.ksu.edu/library/crpsI2/MF1065.pdf).
WHITTEN, D.G.A & BROOKS, lRV. 1972. Dictionary of geology. New York: Penguin
Books.
WILD, A. ed. 1988. Soil conditions and plant growth. London: Longman.
WILLIAMS, D.A. & ABADJIEV, c.B. 1997. Horizontal and vertical drains in tailings
dams? (In: Conference proceedings: Second International Conference on Mining and
Industrial Waste Management, held on 2-4 June 1997 at the SAlCE, Johannesburg.)
WILLIAMS, E.G., ROSE, AW., PARIZEK, RR & WATERS, S.A 1982. Factors
controlling the generation of acid mine drainage. U.S. Bureau of Mines (rep. res. Grant
G105086).
WOOD, P.A 1998. Remediation methods for contaminated sites. (In: Hester, RE. &
Harrison, R M. eds. Contaminated land and its reclamation. London: Royal Society of
Chemistry, pp. 47-72.)
YOUNG, P.J., POLLARD, S. & CROWCROFT, P. 1998. Overview: Context, calculating
risk and using consultants. (In: Hester, R.E. & Harrison, RM. eds. Contaminated land
and its reclamation. London: Royal Society of Chemistry, pp. 1-24.)
ZNATOWICZ, K.P.S. 1993. Radioactive and heavy metal pollution associated with a gold
tailings dam on the East Rand. Johannesburg: University of Witwatersrand (M.Sc.
dissertation).

APPENDIX A

Ta e - ummary 0 SOl parameters 0 stu ly sites -SAMPLE DESCRIPTION PARTICLE SIZE ATTERBERG LIMITS j~SITU PROPERTIES PERMEABILITY
TEST PIT and DEPTH UNIFIED SOIL % % % 0/0 LL LS PI PI Exp pH Bulk SG e K
Sample No. (m) CLASSIFICATION SYSTEM Clay Silt Sand Gravel ws density %
(U.S.C.S.) (kgImJ) (cm/s)
Study Site A
NlIl 0.20 SC-SM 13.15 23.50 62.50 0.50 18.75 2.06 5.98 4.80 low 3.06 1752.88 2.72 0.55 I x 10"
N1I2 0.40 SC 15.82 20.38 54.60 9.20 20.98 3.77 9.81 6.90 low 4.22 1816.08 2.72 0.50 I x 10"'
N1/3 1.00 SC-SM 7.51 25.49 53.00 14.00 21.01 2.79 5.94 3.85 low 6.11 - - - -N2/2 0.35 SC 10.62 15.48 51.20 22.70 23.05 5.27 9.30 4.03 low 4.33 - - - -N2/4 0.90 SC 8.54 21.96 57.30 12.20 26.23 5.21 8.26 3.55 low 4.36 1551.43 2.81 0.81 I x 10-
N312 0.30 SC 8.45 8.45 52.20 30.90 28.70 7.22 12.25 2.89 low 6.45 - - - -N3/3 0.70 SC 11.31 28.39 56.00 4.30 25.69 5.58 9.34 5.11 low 6.90 - - - -N3/4 1.00 SC 12.10 31.40 45.80 10.70 25.24 5.49 8.99 5.65 low 6.87 - - - -
Study Site B
B/l/1 0.10 CL 29.80 24.60 45.60 0.00 28.00 7.28 13.07 11.79 low 3.64 1695.54 2.48 0.46 I x 10-'
BI1/2 0.50 CL 34.68 21.82 43.50 0.00 29.32 8.18 13.01 11.73 low 3.53 1619.22 2.45 0.51 I x 10-'
B/2/1 0.30 ML 50.92 26.18 22.90 0.00 48.40 10.91 19.17 16.54 low 4.19 - - - -
B/2/2 0.50 MH 63.66 23.54 12.40 0.40 50.31 11.13 20.64 19.63 low 5.09 - - - -B1214 2.00 MH 50.24 43.46 6.30 0.00 57.83 11.82 26.00 25.67 med 5.74 - - - -B/3/1 0.40 CL 31.71 29.59 38.50 0.20 28.78 7.42 12.74 11.28 low 6.19 - - - -B/3/3 1.00 CL 41.80 28.00 30.10 0.10 33.41 8.97 14.82 13.65 low 6.63 1665.46 - - -B/3/4 1.60 SC 19.02 21.68 50.30 9.00 34.84 8.36 15.61 8.21 low 6.66 - - - -
Study Site C
C/II2 0.80 CL 46.78 28.42 24.80 0.00 32.72 8.93 15.10 14.26 low 3.95 1602.09 2.61 0.63 8 x 10⁻⁸
CI1I3 1.40 CL 28.90 32.40 38.60 0.10 38.33 8.89 18.61 14.06 low 3.82 1520.08 2.80 0.84 9.5 x 10⁻⁶
CI1I4 2.20 CL 34.33 32.77 30.70 2.20 35.52 9.03 17.43 14.09 low 5.01 - - - -C/2/1 0.15 CL 35.37 30.53 43.70 0.40 45.01 7.73 25.13 21.10 med 6.09 - - - -C/2/2 0.40 CL 35.75 21.15 42.60 0.50 48.06 10.38 28.01 23.52 med 5.05 - - - -C/2/4 2.30 SC 19.51 13.09 50.80 16.60 44.86 10.93 26.68 13.46 med 7.44 - - - -C/3/1 0.30 CL 24.58 36.62 38.80 0.00 29.89 6.97 13.03 11.95 low 3.52 - - - -C/3/2 0.60 CL 38.41 27.79 33.60 0.20 34.53 9.14 16.50 15.20 low 4.85 1700.96 2.40 0.41 I x 10"
C/3/3 1.65 CH 48.66 26.64 23.70 1.00 52.85 8.93 31.38 28.47 med 7.69 1738.90 2.57 0.48 I x 10-'
Study Site D
0/1/1 0.10 CL 27.77 27.33 44.90 0.00 28.18 7.84 13.39 11.75 low 3.65 1684.51 2.61 0.55 9 x 10-
011/2 0.30 CL 41.64 25.46 32.90 0.00 31.92 8.69 14.70 13.49 low 6.00 1566.60 2.64 0.69 9xlO"
0/114 1.30 SC 20.93 23.57 48.30 7.20 32.38 8.04 15.72 9.36 low 6.78 1644.29 2.69 0.64 7 x 10-
0/2/1 0.40 CL 31.33 24.67 44.00 0.00 34.09 9.88 16.48 14.55 low 3.76 - - - -

SAMPLE DESCRIPTION GRADING ANALYSES I ATTERBERG LIMITS IN-SITU PROPERTIES .'TV II
TEST PIT and DEPTH UNIFIED SOIL % % % % LL LS PI PI Exp pH Bulk SG e K
Sample No. (m) CLASSIFICATION SYSTEM Clay Silt Sand Gravel ws density %
D.S.C.S. (kg/mJ) (cm/s)
Study Site D
D/212 0.70 CL 42.23 25.67 32.10 0.00 37.13 10.73 15.73 14.38 low 3.89 - - - -D/2/4 0.60 CL 35.00 35.70 29.30 1.00 40.93 9.97 19.20 16.90 low 6.29 - - - -D/3/1 0.10 SC 14.37 28.83 55.80 0.00 20.48 3.52 7.20 6.09 low 3.47 - - - -D/312 0.50 CL 34.73 22.67 39.50 3.10 32.68 9.14 15.53 13.07 low 6.75 - - - .D/3/4 1.90 CH 51.44 25.96 22.50 0.10 55.87 11.09 32.28 30.32 med - 1553.81 2.68 0.72 7.5 x 10⁻⁸
Study SiteE
E/II2 0.70 CL 33.29 23.21 42.70 0.80 45.57 7.83 27.43 23.05 med 6.72 1775.29 2.55 0.44 1 x 10"
E/1I3 1.50 CL 40.06 22.34 37.50 0.10 46.19 7.28 26.31 21.28 med 6.97 1535.78 2.70 0.76 9.5 x 10⁻⁷
E/2I1 0.45 CH 37.39 23.61 37.40 1.60 56.54 11.67 32.58 28.91 high 7.74 1484.87 2.68 0.80 9x 10'
E/2I2 0.75 CH 35.02 20.38 36.20 8.40 52.32 11.32 27.65 22.27 med 7.79 - - -E/2I3 1.15 CH 46.55 24.65 28.30 0.50 64.10 11.15 37.23 34.27 v high 8.31 1535.06 2.68 0.75 8 x 10"
E/3/1 0.30 CH 38.38 30.02 31.00 0.60 56.02 9.84 32.59 38.38 high 5.12 - - - -E/3/2 0.70 CL 39.19 29.61 31.00 0.00 48.69 7.30 28.31 26.88 high 6.75 - - - -
Study Site F
FIlii 0.60 CL 40.16 28.54 31.30 0.00 30.12 8.81 13.60 12.73 low 6.69 1709.29 2.51 0.47 1 x 10"
FI1I2 1.00 CL 28.23 28.07 43.70 0.00 24.79 7.04 11.11 9.90 low 3.66 1711.02 2.71 0.58 6 x 10'
FI1I3 1.60 CL 40.82 28.28 30.60 0.30 29.52 8.30 13.01 12.09 low 6.62 - - - -F/2/1 0.20 CL 30.05 24.80 44.70 0.00 26.10 6.92 11.32 10.09 low 4.37 - - - -F/2/2 0.50 CL 40.34 21.46 38.20 0.00 30.69 7.98 12.94 11.82 low 6.67 - . - -F/2/3 1.50 CL 44.22 26.78 29.00 0.00 33.32 8.55 15.22 14.33 low 6.29 - - - -F/3/1 0.10 CL 25.56 28.74 45.70 0.00 23.72 6.12 10.66 9.41 low 4.53 - - - -F/3/2 0.50 CL 30.96 24.94 44.10 0.00 25.99 7.67 10.98 9.78 low 5.17 1661.44 2.78 0.67 6x 10'
F/3/4 1.60 CL 19.72 16.48 43.30 20.50 29.67 7.81 12.91 6.21 low 4.70 - - - -F/4/1 0.30 CL 13.70 37.00 49.30 0.00 21.32 4.32 7.45 6.64 low 3.70 - - - -F/4/2 0.60 CL 29.24 23.56 47.20 0.00 25.48 7.85 11.23 10.04 low 4.71 - - - -F/4/4 2.20 CL 39.56 26.84 33.20 0.40 31.55 8.83 17.23 15.89 low 4.65 1739.57 2.72 0.56 6 x 10'
Study Site G
G/III 0.30 SC 14.10 26.80 58.10 0.30 19.39 4.36 7.54 5.78 low 3.99 1786.21 2.64 0.48 1 x 10'
G/l/3 1.00 SC 23.61 23.99 35.60 16.80 29.26 7.79 14.76 9.48 low 6.89 - - - -G/2/2 1.00 SC 22.63 25.37 43.50 8.50 24.21 6.23 10.75 7.60 low 6.31 1782.53 2.68 0.50 1 x 10'
G/3/1 0.20 SC 18.74 28.06 53.20 0.00 22.90 6.42 10.37 8.27 low 4.03 - - - -G/3/2 0.50 SC 24.69 32.61 41.30 1.40 23.18 6.98 10.03 7.90 low 4.83 - . - -G/3/3 1.20 CL 31.45 21.15 34.60 12.80 30.85 8.60 11.54 8.23 low 6.74 - - - -
Note: LL: Liquid limit. LS: Linear shrinkage. PI: Plasticity Index. PI ws: Plasticity index of whole sample. Exp: Expansiveness SG: Specific gravity e: void ratio. K: Estimated saturated hydraulic conductivity. U.S. soil symbols areexplained in Tabid. I 1.

Test Pit LogTest pit number: AJ1
Sample Geotechnical parameters Geochemical parameters (elements in mg/kg)
Profile description number % Clay PI Dry SG e K pH Fe Mn As Sa Co Cr Cu Mo Ni Pb Sn Th U V Zn
a ws density cm/s % %0,05 Slightly moist, light grey banded pale yellow
H)) brown, very soft, layered sandy silt, Tailings. A/1/1 13,15 4,8 1752,88 2,72 0,55 1 x 10' 3,06 3,6 0,02 102 188 10 197 43 3 55 0 0 0 0 62 410,30
Slightly moist, dark brown, loose, slightly A/1/2 15,82 6,9 1816,08 2,72 0,50 1 x 10' 4,22 4,3 0,02 77 194 11 202 43 9 62 0 6 1 0 70 660,55 open textured clayey sand stained pale yellow0,60 I\ brown on joints and cracks; Colluvium.
Slightly moist, yellow brown mottled darkbrown, loose, slightly open textured clayey
1 sand stained pale yellow brown on joints A/1/3 7,51 3,85 1892,52 2,81 0,81 1 x 10' 6,11 7,9 0,02 14 408 17 341 48 9 37 7 0 12 0 143 282\ and cracks; Colluvium.
1,30 Slightly moist, yellow brown mottled darkbrown, loose, slightly open textured clayey
1,50 sand with occasional coarse-, medium-and fine-grained, subrounded quartzgravel; Pebble marker horizon.
Slightly moist, orange brown mottled bright2 yellow brown and stained brown, medium-
dense, relic structured clayey sand withzones of moist, brown, loose, openstructured clayey sand; Hardpan ferruge =nised residual sandstone of the VryheidFormation.
As above but very dense
-3 Notes-
-1. Gradual refusal at 1,50 m on hardpan
ferricrete.2. No water table encountered.
meter
Date: 04.06.98 Locality: Case Study Site A Elevation: 1630 m Profiled by: P Aucamp & T Rosner

Test Pit LogTest pit number: A/2
Sample Geotechnical description Geochemical description (elements in mg/kg)
Profile description number % Clay PI Dry SG e K pH Fe Mn As Sa Co Cr Cu Mo Ni Pb Sn Th U V Zn
0 ws density cm/s % %0,10 •Slightly moist, light grey banded pale yellow0,20 brown, very soft, layered sandy silt, Tailings. A/2/1 - - - - - - - 4,1 0,02 70 175 12 246 54 10 60 0 0 2 0 76 58
Slightly moist, yellow brown mottled darkbrown, loose, slightly open textured clayey A/2/2 10,62 4 - - - - ~,33 7,6 0,03 30 263 14 310 94 19 85 0 9 14 12 117 108
0,45 sand stained pale yellow brown on jointsand cracks' Colluvium. A/2/3 - - - - - - - 9,1 0,02 17 314 5 360 93 18 62 2 0 15 7 180 40
0,70 Abundant coarse-, medium- and fine-grained subrounded sandstone and quartzgravel and occasional sandstone boulders A/2/4 8,54 3,55 1551,43 2,81 0,81 1 x 10' 14,36 18 0,05 8 362 4 494 106 4 78 60 0 2 0 327 84
1 (up to 0,25 m in diameter) in slightly moistyellow brown mottled dark brown, opentextured clayey sand. Pebble marker horizon
1,30 \ The overall consistencv is verY loose.Abundant coarse-, medium- and fine-grained angular to subrounded ferricretegravel in slightly moist, yellow brownmottled red brown and orange brown clayeysand. Nodular ferrugenised residualsandstone of the Vryheid Formation.
2 The overall consistency is medium dense.-
Slightly moist, orange brown mottled brightyellow brown and stained brown, verydense, relic structured clayey sand;Hardpan ferrugenised residual sandstone.
Pale red brown stained and motte led paleyellow brown, highly weathered, coarse-grained, closely jointed and fractured,very soft rock sandstone of the Vryheid
Formation.-
3
Notes1. Gradual refusal at 1,50 m on hard rock
sandstone of the Vryheid Formation.2. No water table encountered.
meter
Date: 04.06.98 Locality: Case Study Site A Elevation: 1630 m Profiled by: P Aucamp & T Rosner

Test Pit LogTest pit number: A/3
Sample Geotechnical description Geochemical description (elements in mg/kg)
Profile description number % Clay PI Dry SG e K pH Fe Mn As Sa Co Cr Cu Mo Ni Pb Sn Th U V Zna ws density cm/s % %
0,03 111111111 Slightly moist, light grey banded pale yellow0,20 brown, very soft, layered sandy silt, Tailings. N3/1 - - - - - - - 3,9 0,02 37 144 11 152 39 26 58 0 0 14 0 59 45
Slightly moist, yellow brown mottled dark N3/2 8,45 12 - - - - 6,19 7,5 0,02 24 200 16 266 55 20 94 2 0 19 0 132 58brown, loose, slightly open textured clayeysand stained pale yellow brown on joints
0,60 and cracks; Colluvium.Abundant coarse-, medium- and fine- N3/3 11,31 5 - - - - 6,63 12,2 0,04 20 204 7 351 57 17 67 9 0 17 0 279 31
o,so grained subrounded sandstone and quartzgravel and occasional sandstone boulders
1 (up to 0,35 m in diameter) in slightly moist N3/4 12,1 6 - - - - 6,66 15,1 0,07 16 302 22 341 70 12 65 28 0 12 0 332 31yellow brown mottled dark brown, opentextured clayey sand. Pebble marker horizonThe overall consistencv is verv loose.
1,40 Abundant coarse-, medium- and fine-
-grained angular to subrounded ferricrete
-gravel in slightly moist, yellow brownmottled red brown and orange brown clayey
- sand. Nodular ferrugenised residual
- sandstone of the Vryheid Formation.2 The overall consistency is medium dense.-
-Slightly moist, orange brown mottled yellow
-brown and stained brown, very dense, relicstructured clayey sand with scatteredcoarse-, medium and fine-grained wellrounded quartz gravel; Hardpanferrugenised residual sandstone of theVryheid Formation.
Notes-
3 1. Gradual refusal at 1,50 m on hard rocksandstone of the Vryheid Formation.
2. No water table encountered.
meter
Date: 04.06.98 Locality: Case Study Site A Elevation: 1630 m Profiled by: P Aucamp & T Rosner
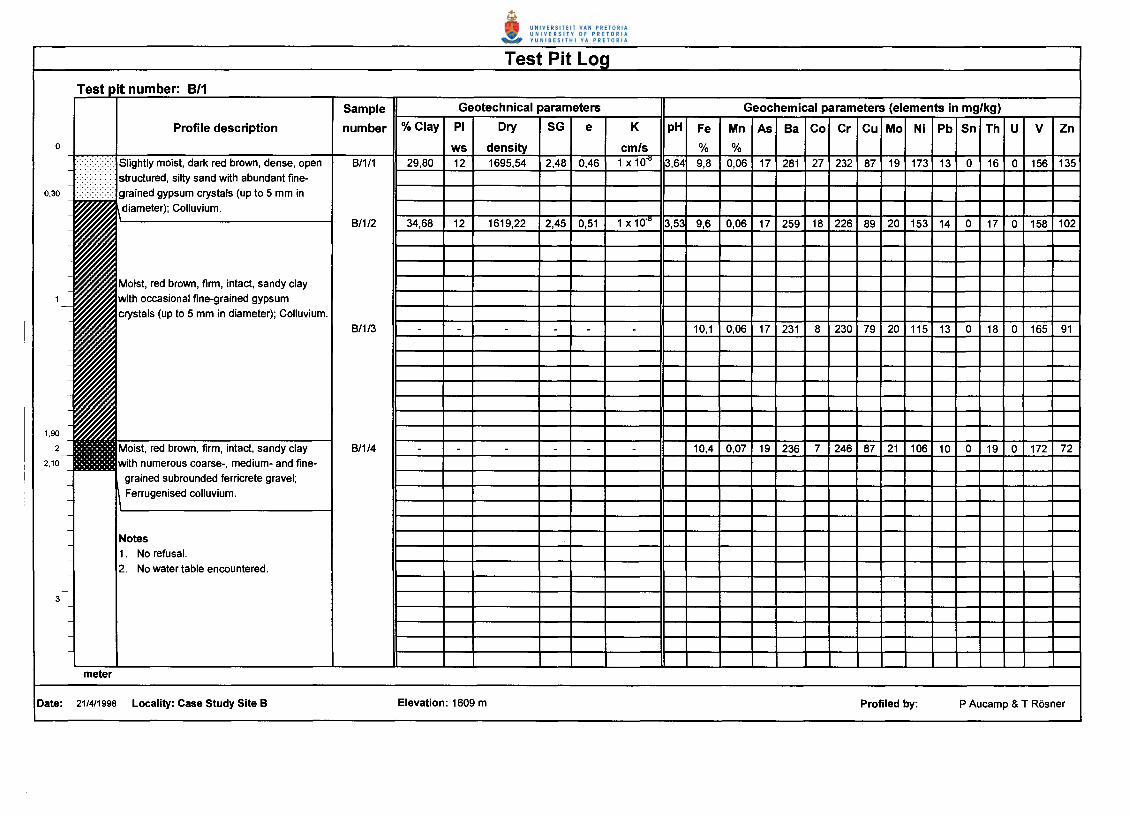
Test Pit LogTest pit number: 8/1
Sample Geotechnical parameters Geochemical parameters (elements in mg/kg)
Profile description number % Clay PI Dry SG e K pH Fe Mn As Sa Co Cr Cu Mo Ni Pb Sn Th U V Zn0 ws density cm/s % %
Slightly moist, dark red brown, dense, open B/1/1 29,80 12 1695,54 2,48 0,46 1 x 10-0 3,64 9,8 0,06 17 281 27 232 87 19 173 13 0 16 0 156 135structured, silty sand with abundant fine-
0.30 grained gypsum crystals (up to 5 mm indiameter); Colluvium.
B/1/2 34,68 12 1619,22 2,45 0,51 1 x 10-0 3,53 9,6 0,06 17 259 18 226 89 20 153 14 0 17 0 158 102
Moist, red brown, firm, intact, sandy clay1 with occasional fine-grained gypsum
crystals (up to 5 mm in diameter); Colluvium.B/1/3 - - - - - - 10,1 0,06 17 231 8 230 79 20 115 13 0 18 0 165 91
1,90
2 Moist, red brown, firm, intact, sandy clay B/1/4 - - - - - - 10,4 0,07 19 236 7 246 87 21 106 10 0 19 0 172 722,10 with numerous coarse-, medium- and fine-
-grained subrounded ferricrete gravel;
- 1\ Ferrugenised colluvium.
-Notes-1. No refusal.
2. No water table encountered.
-3
meter
Date: 21/4/1998 Locality: Case Study Site B Elevation: 1609 m Profiled by: P Aucamp & T Rosner

Test Pit LogTest pit number: 8/2
Sample Geotechnical parameters Geochemical parameters (elements in mg/kg)
Profile description number % Clay PI Dry SG e K pH Fe Mn As Sa Co Cr Cu Mo Ni Pb Sn Th U V Zn
0 ws density cm/s % %0,15 00 Slightly moist, pale yellow brown, very soft,
layered sandy silt, Tailings.8/2/1 50,92 17 - - - - ,19 13,2 0,10 18 286 76 372 135 9 241 15 0 15 0 207 126
0,40 Slightly moist, dark red brown, dense, openstructured, sandy silt with abundant fine- 8/2/2 63,66 20 - - - - 5,09 12,9 0,10 23 247 51 344 143 10 190 6 0 14 0 202 78grained gypsum crystals (up to 5 mm indiameter) and subrounded quartziteboulders (up to 0,20 m in diameter);
0,90 Colluvium.1 8/2/3 - - - - - - - 13,6 0,06 17 293 10 374 130 14 139 4 0 16 0 197 57-
Moist, red brown, firm, intact, sandy siltwith occasional fine-grained gypsumcrystals (up to 5 mm in diameter);Colluvium.
Moist, dark red brown, firm, intact, siltwith occasional fine-grained gypsum
1,80 crystals (up to 5 mm in diameter);Colluvium.
2 8/2/4 50,24 26 - - - - 5,74 15,1 0,06 3 400 16 485 170 12 140 6 0 15 0 203 51-Moist, dark red brown, firm, intact, silt
2,20 with occasional coarse-, medium- and.fine-grained subrounded ferricrete gravel;Ferrugenised colluvium
Notes1. No refusal.
2. No water table encountered.-
3
meter
Date: 21/4/1998 Locality:Case Study Site B Elevation: 1612 m Profiled by: P Aucamp & T Rosner

Test Pit LogTest pit number: 8/3
Sample Geotechnical parameters Geochemical parameters (elements in mg/kg)
Profile description number % Clay PI Dry SG e K pH Fe Mn As Sa Co Cr Cu Mo Ni Pb Sn Th U V Zn0 ws density cm/s % %
Slightly moist, light grey banded yellowbrown, very soft, layered sandy silt, Tailings.
0,30
Moist, dark grey, dense, open structured 8/3/1 31,71 11 - - - - 6,19 6,0 0,04 43 230 19 211 48 12 85 0 0 12 0 89 53o,so sandy clay with abundant fine-grained
gypsum crystals (up to 5 mm in diameter);Colluvium. 8/3/2 - - - - - - 6,2 0,03 22 204 13 163 46 20 78 9 0 21 0 96 40
0,90 Moist, dark olive mottled dark grey, firm,1 intact sandy clay with scattered fine-grained 8/3/3 41,8 14 - - - - 6,63 7,2 0,04 19 197 9 230 51 19 85 13 0 23 0 113 44
gypsum crystals (up to 5 mm in diameter);Colluvium.
1,40 Very moist, dark yellow brown occasionallymottled dark red brown, firm, intact sandyclay with scattered fine-grained gypsum 8/3/4 19,02 8,21 - - - - 6,66 8,7 0,47 6 1018 124 204 67 4 126 83 0 8 0 163 39crystals (up to 5 mm in diameter);Colluvium.
2 Abundant medium- and fine-grained2,10 subrounded to sUbangular ferricrete gravel
in very moist, light olive mottled black,dark red brown and dark yellow brown
\ sandy clay; Ferrugenised colluvium.The overall consistency is stiff.
Notes-1. No refusal.
-3 2. No water table encountered.
meter
Date: 21/4/1998 Locality: Case Study Site B Elevation: 1613 m Profiled by: P Aucamp & T ROsner

Test Pit LogTest pit number: C/1
Sample Geotechnical parameters Geochemical parameters (elements in mg/kg)
Profile description number % Clay PI Dry SG e K pH Fe Mn As Sa Co Cr Cu Mo Ni Pb Sn Th U V Zn
0 ws density cm/s % %Slightly moist, pale yellow, firm, intact
-sandy silt with occasional fine-grainedgypsum crystals (up to 5 mm in diameter); C/1/1 - - - - - - - 7,1 0,03 68 205 13 170 44 8 77 0 0 7 0 112 49
Tailings.-
0,60
Slightly moist, dark brown stained darkgrey, firm, intact sandy clay with scattered C/1/2 46,78 14 1602,09 2,61 0,63 8 x 10'0 3,92 8,5 0,04 25 212 14 191 50 18 79 8 0 21 0 126 47fine-grained gypsum crystals (up to 5 mm
1 in diameter) and zones of moist, dark greysoft, intact, sandy clay; Colluvium.
1,20
Slightly moist, red brown mottled andspeckled dark red brown and black, firm C/1/3 28,90 14 1520,08 2,80 0,84 9,5 x 10~ 3,82 14,2 0,06 7 526 33 369 67 0 76 118 0 0 0 254 36intact sandy clay with abundant coarse-,medium- and fine-grained, subroundedferricrete gravel and with scattered fine-grained gypsum crystals (up to 5 mm in
1,90 diameter); Ferrugenised colluvium.2 Slightly moist, red brown mottled and
stained light grey, yellow brown and brownstiff, intact sandy clay with occasional C/1/4 34,33 14 - - - - 5,01 10,6 0,11 22 511 25 220 54 16 65 10 0 17 0 167 38
2,30 coarse-, medium- and fine-grained,subrounded ferricrete gravel; Ferrugenised
\ colluvium.
Notes1. No refusal.
-3 2. No water table encountered.
-
-
meter
Date: 04.06.98 Locality: Case Study Site C Elevation: 1605 m Profiled by: P Aucamp & T ROsner

Test Pit LogTest lJit number: C/2
Sample Geotechnical parameters Geochemical parameters (elements in mg/kg)
Profile description number % Clay PI Dry SG e K pH Fe Mn As Sa Co Cr Cu Mo Ni Pb Sn Th U V Zn0 ws density cm/s % %
0,10 Slightly moist, pale yellow brown, very softintact sandy silt with occasional fine-grained C/2/1 35,37 21 - - - - ~,09 6,91 0,05 13 370 20 223 32 16 51 14 0 17 0 99 34
0,25 gypsum crystals (up to 5 mm in diameter);Tailings. C/2/2 35,75 24 - - - - 5,05 7,1 0,07 15 383 28 230 32 15 72 15 0 17 0 107 41
Slightly moist, dark grey occasionallymottled and striped dark yellow brown, stiffshattered sandy clay with scattered fine-grained gypsum crystals (up to 5 mm in
1 \ diameter); Alluvium.1,10
Moist, dark grey occasionally mottled darkyellow brown, soft, intact sandy clay withscattered fine-grained gypsum crystals C/2/3 - - - - - - - 7,1 0,03 21 406 16 270 27 14 56 17 0 19 0 166 33(up to 5 mm in diameter); Alluvium.
Moist, grey mottled and speckled darkyellow brown, soft, intact sandy clay withsporadic coarse-grained, subangular quartz
2 gravel; Alluvium.Abundant coarse-, medium- and fine-grainedsubanguler ferricrete and quartz gravel in wetorange brown speckled and mottled black C/2/4 19,51 27 - - - - 7,44 23,9 0,17 38 428 188 622 89 0 282 8 0 0 0 937 28
2,40 and dark yellow brown, clayey sand.Ferrugenised alluvium.
\ The overall consistency is soft.
-Notes
-3 1. No refusal.-
2. Perched water table at 2,00 m.-
meter
Date: 04.06.98 Locality: Case Study Site C Elevation: 1612 m Profiled by: P Aucamp & T Rosner

Test Pit LogTest pit number: C/3
Sample Geotechnical parameters Geochemical parameters (elements in mg/kg)
Profile description number % Clay PI Dry SG e K pH Fe Mn As Sa Co Cr Cu Mo Ni Pb Sn Th U V Zn0 ws density cm/s % %
-Slightly moist, light greyish olive, very soft
0,25 intact sandy silt with occasional fine-grainedgypsum crystals (up to 5 mm in diameter); C/3/1 24,58 12 - - - - 3,52 4,09 0,03 30 193 22 166 46 23 53 5 0 20 8 98 29
0,40 Tailings.
Slightly moist, dark grey occasionally C/3/2 38,41 15 1700,96 2,40 0,69 1 x 10-0 4,85 6,9 0,10 23 237 40 201 39 18 76 19 0 18 0 146 34mottled and striped dark yellow brown, stiffshattered sandy clay with scattered fine-grained gypsum crystals (up to 5 mm in
1 diameter); Alluvium.
Slightly moist, yellow brown mottled and1,30 speckled dark yellow brown and dark grey
firm slightly shattered, sandy clay withscattered fine-grained gypsum crystals (up C/3/3 48,66 28 1738,90 2,57 0,64 1 x 10-' 7,69 10,4 0,15 16 539 44 247 47 8 75 29 0 16 0 220 36to 5 mm in diameter); Alluvium.
Slightly moist, yellow brown mottled andspeckled dark yellow brown, dark grey and
2 light grey, stiff, slightly shattered, sandy2,10 clay with scattered fine-grained gypsum
crystals (up to 5 mm in diameter); Alluvium.C/3/4 - - - - - - - 7,3 0,10 24 292 42 213 42 14 65 7 0 18 0 178 36
2,40 Abundant coarse-, medium- and fine-grainedsubrounded quartzite and sandstone graveland occasional subrounded quartziteboulders (up to 0,10 m in diameter) in moistlight olive brown speckled and mottled dark
-yellow brown to pale yellow brown, sandy
3 clay; Alluvium.\ The overall consistency is soft.
Notes1. No refusal.
2. No water table encountered.meter
Date: 04.06.98 Locality: Case Study Site C Elevation: 1608 m Profiled by: P Aucamp & T Rosner

Test Pit LogTest pit number: 0/1
Sample Geotechnical parameters Geochemical parameters (elements in mg/kg)
Profile description number % Clay PI Dry SG e K pH Fe Mn As Sa Co Cr Cu Mo Ni Pb Sn Th U V Zna ws density cm/s % %
0,03 Slightly moist, pale yellow, very soft, layered0,20 sandy silt, Tailings. 0/1/1 27,77 12 1684,51 2,61 0,55 9 x 10' 3,65 6,15 0,04 50 207 21 155 51 14 82 0 0 8 0 100 54
0/1/2 41,64 13 1566,60 2,64 0,69 9xW 6,00 7,1 0,02 21 188 15 159 62 19 77 6 0 18 0 112 49Moist, dark brown mottled dark greystiff, open structured sandy clay with
0,60 abundant fine-grained gypsum crystals (upIto 5 mm in diameter); Colluvium. 0/1/3 - - - - - - - 7,4 0,03 18 196 23 161 51 21 79 4 0 19 0 120 40
Moist, yellow brown, firm, open1 structured sandy clay with abundant fine-
1,10 grained gypsum crystals (up to 5 mm in
Idiameter); Colluvium.0/1/4 20,93 9 1644,29 2,69 0,64 7 x 10' 5,78 10,2 0,37 9 1252 90 195 78 10 99 46 0 8 0 199 38
Moist, yellow brown occasionally mottledred brown, firm, open structured sandy
1,60 clay with occasional fine-grainedgypsum crystals (up to 5mm in diameter);Colluvium.,
2 Abundant coarse-, medium- and fine--
grained, subrounded ferricrete gravel inmoist, light grey mottled yellow brown andblack, clayey sand; Ferrugenised colluvium.The overall consistency is medium dense.
Notes
- 1. Gradual refusal at 1,50 m on hardpan3 ferricrete.-
2. No water table encountered.~
meter
Date: 21/4/1998 Locality: Case Study Site D Elevation: 1505 m Profiled by: P Aucamp & T Rosner
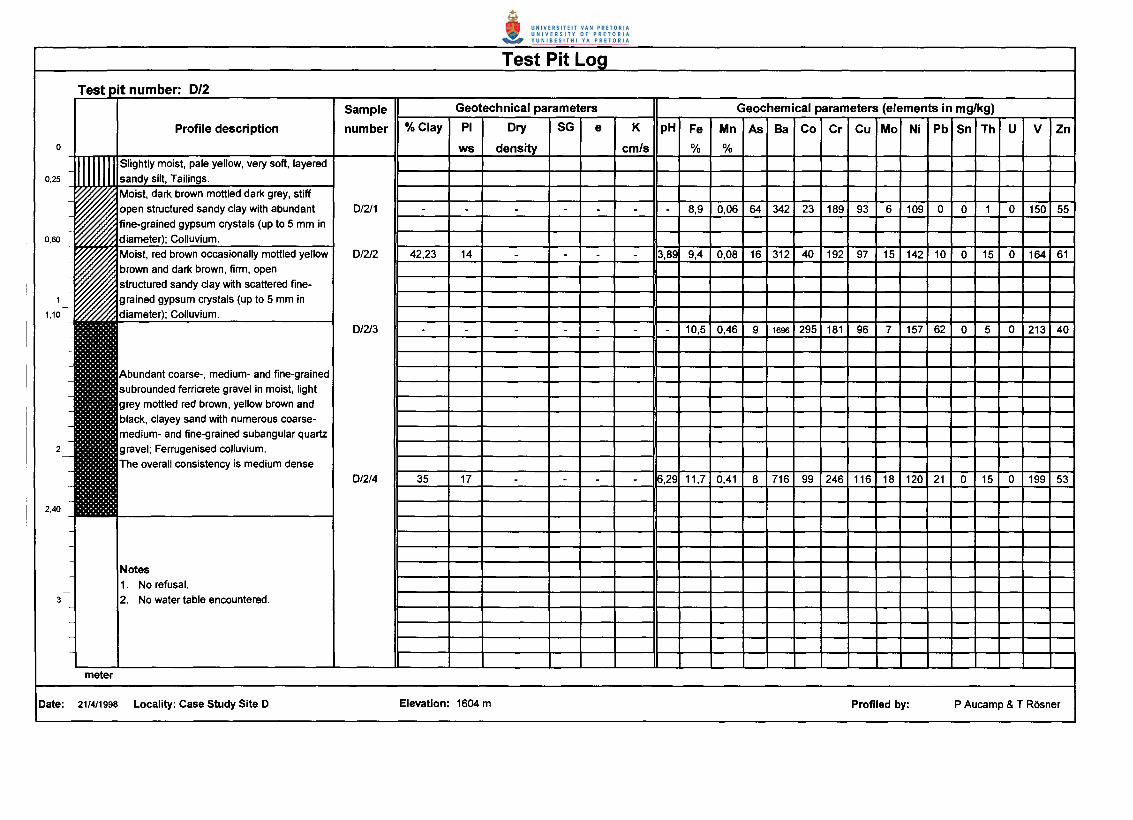
Test Pit LogTest pit number: 0/2
Sample Geotechnical parameters Geochemical parameters (elements in mg/kg)
Profile description number % Clay PI Dry SG e K pH Fe Mn As Sa Co Cr Cu Mo Ni Pb Sn Th U V Zn0 ws density cm/s % %
-Slightly moist, pale yellow, very soft, layered
-0,25 sandy silt, Tailings.
Moist, dark brown mottled dark grey, stiffopen structured sandy clay with abundant 0/2/1 - - - - - - - 8,9 0,06 64 342 23 189 93 6 109 0 0 1 0 150 55fine-grained gypsum crystals (up to 5 mm in
0,60 diameter); Colluvium.Moist, red brown occasionally mottled yellow 0/2/2 42,23 14 - - - - 3,89 9,4 0,08 16 312 40 192 97 15 142 10 0 15 0 164 61brown and dark brown, firm, openstructured sandy day with scattered fine-
1 grained gypsum crystals (up to 5 mm in1,10 diameter); Colluvium.
0/2/3 - - - - - - - 10,5 0,46 9 1696 295 181 96 7 157 62 0 5 0 213 40
Abundant coarse-, medium- and fine-grainedsubrounded ferricrete gravel in moist, lightgrey mottled red brown, yellow brown andblack, clayey sand with numerous coarse-medium- and fine-grained subangular quartz
2 gravel; Ferrugenised colluvium.The overall consistency is medium dense
0/2/4 35 17 - - - - 6,29 11,7 0,41 8 716 99 246 116 18 120 21 0 15 0 199 53
2,40
--
Notes1. No refusal.~
3 2. No water table encountered.
meter
Date: 21/4/1998 Locality: Case Study Site D Elevation: 1604 m Profiled by: P Aucamp & T Rosner

Test Pit LogTest pit number: 0/3
Sample Geotechnical parameters Geochemical parameters (elements in mglkg)
Profile description number % Clay PI Dry SG e K pH Fe Mn As Sa Co Cr Cu Mo Ni Pb Sn Th U V Zn0 ws density cm/s % %
0,05 Slightly moist, pale yellow, very soft, layeredsandy silt, Tailings. 0/3/1 14,37 6 - - - - 3,47 3,4 0,04 35 195 25 113 33 22 48 0 0 14 0 61 37
0,40 Slightly moist, dark grey occasionallymottled yellow brown, firm, open 0/3/2 34,73 14 - - - - 6,75 6,7 0,05 17 305 23 175 42 17 70 6 0 18 0 90 48structured sandy clay with numerous fine-grained gypsum crystals (up to 5 mm in
0,80 diameter); Colluvium.
1 Slightly moist, dark grey mottled yellowbrown, firm, open structured sandy 0/3/3 - - - - - - - 9,0 0,10 8 707 30 146 35 20 59 9 0 16 0 108 28clay with sporadic fine-grained
1,40 gypsum crystals (up to 5 mm in diameter);Colluvium.
Moist, dark grey mottled yellow brown andlight grey, firm, occasionally slickensidedsandy clay with abundant coarse-, medium-and fine-grained, subrounded ferricrete 0/3/4 51,44 30 1553,81 2,68 0,72 7,5 x 10'0 - 6,8 0,03 20 228 10 196 50 17 75 1 0 19 0 85 49
2 gravel; Ferrugenised colluvium.
Moist, light grey mottled and stained yellow2,30 brown and black, stiff, slickensided clay;
Residual mud rock of the Vryheid Formation.
-3 ~
Notes-
1. No refusal.
2. No water table encountered.-
meter
Date: 21/4/1998 Locality: Case Study Site D Elevation: 1606 m Profiled by: P Aucamp & T Rosner

Test Pit LogTest pit number: E/1
Sample Geotechnical parameters Geochemical parameters (elements in mg/kg)
Profile description number 0/0 Clay PI Dry SG e K pH Fe Mn As Sa Co Cr Cu Mo Ni Pb Sn Th U V Zn
0 ws density em/s % %Slightly moist, pale yellow brown mottledblack and orange brown, very soft,
0,30 layered sandy silt, Tailings-
Moist, brown mottled dark grey and dark E1/1 - - - - - - - 5,9 0,14 21 248 36 279 26 16 106 14 0 15 0 111 58o,so brown, stiff, intact sandy clay with
abundant fine-grained gypsum crystals(up to 5mm in diameter); Colluvium, El1/2 33,29 23 1775,29 2,55 0,44 1 x WO ~,72 6,1 0,27 17 533 47 294 31 15 70 21 0 16 0 134 37
Moist, light grey mottled yellow brown and1 dark grey, stiff, slickensided sandy clay with
occasional fine-grained gypsum crystals(up to 5 mm in diameter); Colluvium.
1,30
Moist, yellow brown mottled light grey and El1/3 40,06 21 1535,78 2,70 0,76 9,5 x 10' ~,97 12,2 0,07 7 194 20 403 38 10 88 25 0 15 0 261 24dark grey, stiff, slickensided sandy clay withabundant fine-grained subrounded quartzgravel and sporadic rounded quartziteboulders (up to 0,40 m in diameter);
2 Colluvium.
Abundant coarse-, medium and fine-grained El1I4 - - - - - - - 18,8 0,07 24 271 47 498 57 0 135 41 0 0 0 581 222,30 subrounded quartz gravel and occasional
-ferricrete nodules in wet yellow brown
\landY clay; Colluvium.-The overall consistency is firm.
Notes-
3 1. No refusal
2. Perched water table at 2,00 m3. Stable sidewalls
meter
Date: 04.08.98 Locality: Case Study Site E Elevation: 1585 m Profiled by: P Aucamp & T Rosner
Test Pit LogTest pit number: E/2
Sample Geotechnical parameters Geochemical parameters (elements in mg/kg)
Profile description number % Clay PI Dry SG e K pH Fe Mn As Sa Co Cr Cu Mo Ni Pb Sn Th U V Zn
0 ws density cm/s % %.'. Moist, red brown, very loose, layered silty
sand with abundant organic residue; Fill.0,30
Moist, black, soft, intact clay with E/211 37,39 29 1484,87 2,68 0,80 9 x 10-t 7,74 6,6 0,08 36 191 24 258 52 9 69 0 0 8 0 99 43
abundant fine-grained gypsum crystals0,60 (up to 5 mm in diameter); Alluvium.
Moist, black, firm, slickensided claywith numerous coarse-, medium- and fine- E/212 35,02 22,27 - - - - 7,79 6,9 0,07 22 274 17 285 54 14 66 2 0 12 0 113 47
grained subrounded quartz gravel and1,00 occasional fine-grained gypsum crystals
(up to 5 mm in diameter); Alluvium.E/213 46,55 34 1535,06 2,68 0,75 8 x 10-0 8,31 7,8 0,10 10 266 25 305 58 14 78 11 0 15 0 161 41
Moist, blueish grey mottled dark yellowbrown and dark grey, firm, slickensided clay
1,50 with occasional coarse-, medium- and fine-grained calcrete and quartz gravel andscattered fine-grained gypsum crystals
\ (up to 5 mm in diameter); Alluvium.
2~Notes1. Refusal at 1,50 m on alluvial boulders
(quartzite and chert)
2. No water table encountered3. Stable sidewalls
-
~3
meter
Date: 04.08.98 Locality: Case Study Site E Elevation: 1580 m Profiled by: P Aucamp & T Rosner

Test Pit LogTest pit number: E/3
Sample Geotechnical parameters Geochemical parameters (elements in mg/kg)
Profile description number % Clay PI Dry SG e K pH Fe Mn As Sa Co Cr Cu Mo Ni Pb Sn Th U V Zn
0 ws density cm/s % %Moist, red brown, very loose, layered silty
0,20 sand with abundant organic residue; Fill.E/3/1 38,38 38 - - - - 5,12 4,5 0,02 19 138 23 235 31 15 65 15 0 18 0 102 57
Moist, black, soft, intact clay withabundant fine-grained gypsum crystals
0,60 (up to 5 mm in diameter); AlluviumE/3/2 36,19 26,88 - - - - 16,75 4,7 0,02 19 118 18 297 33 16 68 12 0 19 0 147 68
Moist, black, firm, slickensided sandyclay with numerous coarse-, medium- and
1 fine-grained subrounded quartz gravel and1,10 occasional fine-grained gypsum crystals
(up to 5 mm in diameter ); Alluvium E/3/3 - - - - - - - 3,6 0,02 23 109 14 287 27 19 61 10 0 17 0 118 831,30
Moist, blueish grey mottled dark yellowbrown and dark grey, firm, intact claywith occasional coarse-, medium- andfine-grained calcrete and quartz gravel andscattered fine-grained gypsum crystals(up to 5 mm in diameter); Alluvium.
2-
Notes1. Refusal at 1,30 m on alluvial boulders
(quartzite and chert)
2. No water table encountered3. Stable sidewalls
-
-3
-
meter
Date: 04.08.98 Locality: Case Study Site E Elevation: 1606 m Profiled by: P Aucamp & T Rosner

Test Pit LogTest pit number: F/1
Sample Geotechnical parameters Geochemical parameters (elements in mg/kg)
Profile description number % Clay PI Dry SG e K pH Fe Mn As Sa Co Cr Cu Mo Ni Pb Sn Th U V Zn
0 ws density cm/sSlightly moist, pale yellow brown, very soft,layered sandy silt, Tailings
o,soSlightly moist, dark red brown, soft, open F/1/1 40,16 13 1709,29 2,51 0,47 1 x 10-0 6,69 8,6 0,16 20 188 5 178 53 22 76 11 0 21 0 139 43
0,70 textured sandy clay with abundant fine-grainedgypsum crystals (up to 5 mm in diameter);Colluvium
1 F/1/2 28,23 10 1711,02 2,71 0,58 6x 10-' 3,66 7,3 0,19 31 222 30 170 90 22 143 10 0 18 57 127 801,10 Slightly moist, red brown, soft, open tex-
tured sandy clay with abundant fine-grainedgypsum crystals (up to 5 mm in diameter)
1,40 Colluvium.Moist, dark red brown, stiff, intact sandyclay with abundant fine·grained gypsum F/1/3 40,82 12,01 - - - - 6,62 8,3 0,12 21 182 4 169 49 23 68 11 0 20 0 134 40crystals (up to 5 mm in diameter);Colluvium.
2 Very moist, dark red brown, stiff, intact sandyclay with abundant fine-grained gypsumcrystals (up to 5 mm in diameter); F/1/4 - - - - - - - 8,2 0,09 21 178 3 200 43 24 62 9 0 21 0 133 36Colluvium
2,40
Very moist, dark red brown, stiff, intactsandy clay with abundant coarse-, medium-and fine-grained subangular ferricrete gravelFerrugenised colluvium.
-3 Notes
-1. No refusal2. No water table encountered
meter
Date: 21/4/1998 Locality: Case Study Site F Elevation: 1583 m Profiled by: P Aucamp & T Rosner

Test Pit LogTest pit number: F/2
Sample Geotechnical parameters Geochemical parameters (elements in mg/kg)
Profile description number % Clay PI Dry SG e K pH Fe Mn As Sa Co Cr Cu Mo Ni Pb Sn Th U V Zn0 ws density cm/s % %
0,10 Slightly moist, pale yellow brown, very soft,layered sandy silt, Tailings F/2/1 30,05 10,09 - - - - 4,37 8,5 0,44 20 235 9 202 68 22 83 11 0 18 0 135 46
0,30
Slightly moist, dark red brown mottled darkbrown, very stiff, open textured sandy clay F/2/2 40,34 12 - - - - 6,67 9,3 0,18 17 214 5 208 68 20 88 12 0 18 0 152 46
with abundant fine-grained gypsum crystals(up to 5 mm in diameter); Colluvium.
Moist, red brown, stiff, open textured sandy1,00 clay with abundant fine-grained gypsum
crystals (up to 5 mm in diameter);Colluvium
Moist, red brown, stiff, intact sandy clay with F/2/3 44,22 14 - - - - 0,29 9,6 0,11 20 196 4 199 63 21 78 10 0 20 0 154 39
abundant fine-grained gypsum crystals(up to 5 mm in diameter); Colluvium.
2
2,20
F/2/4 - - - - - - - 9,0 0,11 18 186 4 209 54 23 66 7 0 20 0 144 372,40 Very moist, dark red brown, stiff, intact sandy
clay with abundant.coarse-, medium- andfine-grained subangular ferricrete gravel;Ferrugenised colluvium.
-3 Notes-
1. No refusal-
2. No water table encountered
meter
Date: 21/4/1998 Locality: Case Study Site F Elevation: 1587 m Profiled by: P Aucamp T Rosner

Test Pit LogTest pit number: F/3
Sample Geotechnical parameters Geochemical parameters (elements in mg/kg)
Profile description number % Clay PI Dry SG e K pH Fe Mn As Sa Co Cr Cu Mo Ni Pb Sn Th U V Zn0 density % %
0,05 Slightly moist, pale grey, very soft, layeredsandy silt, Tailings F/3/1 25,56 9 - - - - 4,53 5,4 0,04 200 194 60 179 55 24 312 0 0 0 1175 125 205
0,30
Slightly moist, dark red brown occasionallymottled red brown, stiff, open textured F/3/2 30,96 10 1661,44 2,78 0,67 6 x 10' 5,17 6,6 0,04 72 183 51 178 56 36 301 3 0 13 704 131 281sandy clay sand with abundant fine-grainedgypsum crystals (up to 5 mm in diameter);Colluvium.
1,00
Moist, red brown, firm, open testured F/3/3 - - - - - - - 7,2 0,06 24 179 14 291 47 15 83 10 0 16 9 129 40sandy clay with abundant fine-grainedgypsum crystals (up to 5 mm in
1,40 diameter); Colluvium.
Abundant medium- to fine-grained F/3/4 19,72 6 - - - - 4,70 7,6 0,06 28 170 15 292 52 14 96 4 0 15 50 142 511,70 l~b","'de<Jfe,","," ,,,"'os."" "'.rt
gravel in moist, red brown clayey sand;Ferrugenised colluvium.
2 The overall consistency is dense.--- Abundant medium- to fine-grained
subrounded chert gravel and occasionalferricrete nodules and occasionalsubangular chert boulders (up to 0,07 min diameter) in moist, red brown clayeysand; Ferrugenised colluvium.The overall consistency is dense.
-3 Notes
1. Gradual refusal on hard rock chert.2. No water table encountered
meter
Date: 21/4/1998 Locality: Case Study Site F Elevation: 1585 m Profiled by: P Aucamp & T Rosner

Test Pit LogTest pit number: F/4
Sample Geotechnical parameters Geochemical parameters (elements in mg/kg)
Profile description number % Clay PI Dry SG e K pH Fe Mn As Sa Co Cr Cu Mo Ni Pb Sn Th U V Zn0 ws density cm/s % %
-
-Slightly moist, pale grey, very soft, layered
0,20 sandy silt, Tailings.Slightly moist, dark red brown occasionally F/4/1 13,7 7 - - - - 3,70 5,2 0,03 92 188 32 267 74 43 187 0 0 50 932 118 147
mottled red brown, stiff, open texturedo,so sandy clay with abundant fine-grained gypsum
crystals (up to 5 mm in diameter); F/4/2 29,24 10 - - - - 4,71 8,1 0,05 21 179 12 174 53 21 92 9 0 19 0 132 41Colluvium.
Moist, red brown, stiff, open textured sandy1,00 clay with abundant fine-grained gypsum
crystals (up to 5 mm in diameter);Colluvium. F/4/3 - - - - - - - 7,2 0,04 27 201 25 181 58 23 147 8 0 17 100 135 98
Moist, red brown, firm, open texturedsandy clay with abundant fine-grainedgypsum crystals (up to 5 mm in diameter);Colluvium.
2
2,10
F/4/4 39,56 16 1739,57 2,72 0,56 6 x 10' 4,65 8,5 0,06 19 191 5 199 53 21 78 7 0 19 0 138 49Moist, red brown, firm, open textured
2,40 sandy clay with abundant fine-grainedgypsum crystals (up to 5 mm in diameter)and numerous medium- to fine-grainedferricrete gravel; Ferrugenised colluvium.
Notes-3 1. No refusal.
2. No water table encountered.
meter
Date: 21/4/1998 Locality: Case Study Site F Elevation: 1580 m Profiled by: P Aucamp & T Rosner
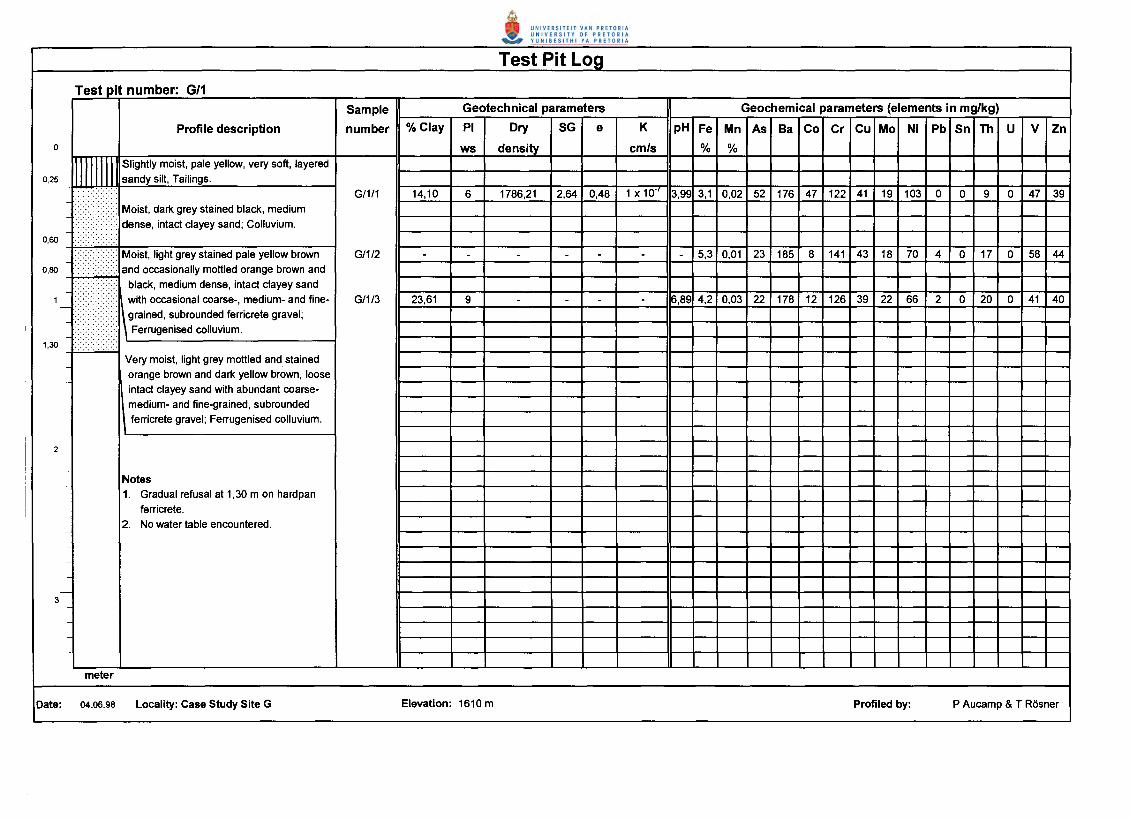
Test Pit LogTest pit number: G/1
Sample Geotechnical parameters Geochemical parameters (elements in mg/kg)
Profile description number % Clay PI Dry SG e K pH Fe Mn As Sa Co Cr Cu Mo Ni Pb Sn Th U V Zn0 ws density cm/s % %
-
I[[ Slightly moist, pale yellow, very soft, layered0,25 sandy silt, Tailings.-
G/1/1 14,10 6 1786,21 2,64 0,48 1 x 10" 3,99 3,1 0,02 52 176 47 122 41 19 103 0 0 9 0 47 39-
Moist, dark grey stained black, medium
-dense, intact clayey sand; Colluvium.
0,60
Moist, light grey stained pale yellow brown G/1/2 - - - - - - - 5,3 0,01 23 185 8 141 43 18 70 4 0 17 0 58 44-
and occasionally mottled orange brown and0,80
-black, medium dense, intact clayey sand
1 :.:. with occasional coarse-, medium- and fine- G/1/3 23,61 9 - - - - 6,89 4,2 0,03 22 178 12 126 39 22 66 2 0 20 0 41 40-
grained, subrounded ferricrete gravel;
-\ Ferrugenised colluvium.
1,30
-Very moist, light grey mottled and stainedorange brown and dark yellow brown, loose
-intact clayey sand with abundant coarse-
-
-medium- and fine-grained, subrounded
-ferricrete gravel; Ferrugenised colluvium.
-2-
-Notes
-1. Gradual refusal at 1,30 m on hardpan
ferricrete.2. No water table encountered.
-3
meter
Date: 04.06.98 Locality: Case Study Site G Elevation: 1610 m Profiled by: P Aucamp & T Rosner
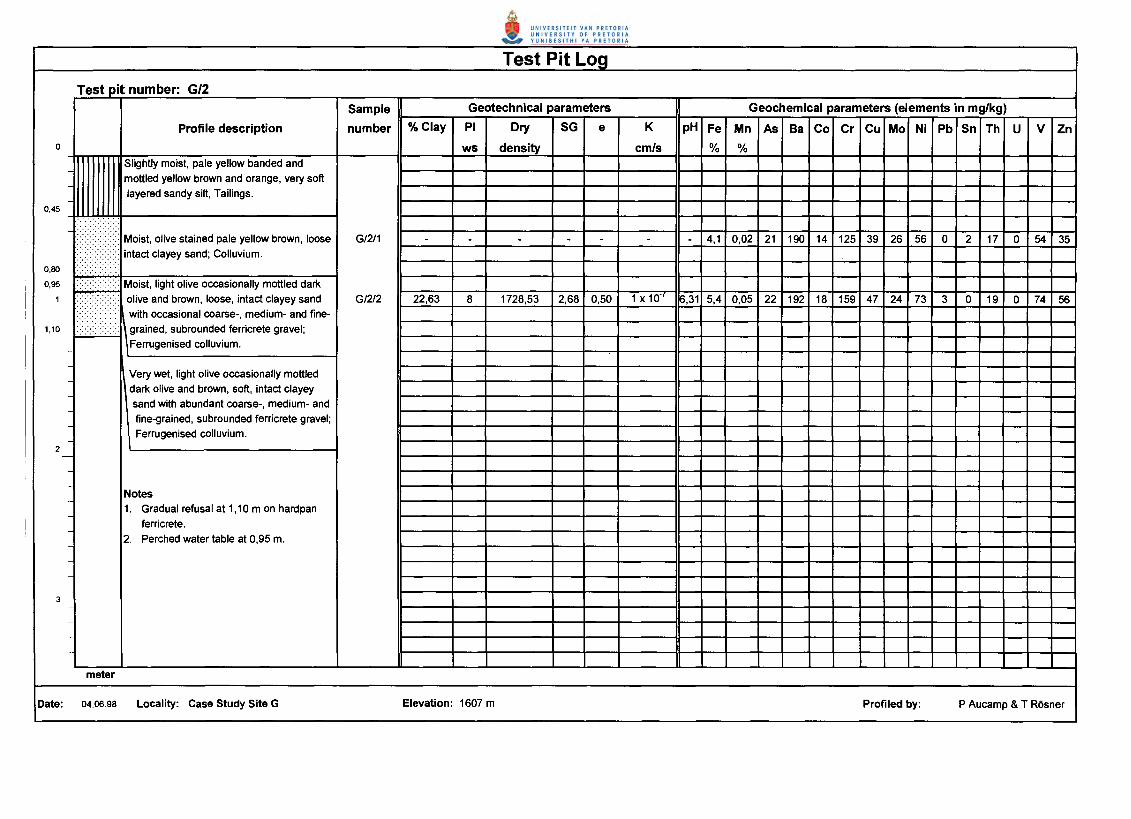
Test Pit LogTest pit number: G/2
Sample Geotechnical parameters Geochemical parameters (elements in mg/kg)
Profile description number % Clay PI Dry SG e K pH Fe Mn As Sa Co Cr Cu Mo Ni Pb Sn Th U V Zn0 ws density cm/s % %
Slightly moist, pale yellow banded andmottled yellow brown and orange, very softlayered sandy silt, Tailings.
0,45
•••••••••••••••••Mo','. o'~ ,m;,~p,~ ~11~ brow,. ~G/2/1 - - - - - - - 4,1 0,02 21 190 14 125 39 26 56 0 2 17 0 54 35
intact clayey sand; Colluvium.0,80
0,95 ... :-:-: :.: Moist, light olive occasionally mottled dark1 :::»:>1 olive and brown, loose, intact clayey sand G/2/2 22,63 8 1728,53 2,68 0,50 1 x 10' 16,31 5,4 0,05 22 192 18 159 47 24 73 3 0 19 0 74 56-
with occasional coarse-, medium- and fine-1,10 grained, subrounded ferricrete gravel;
,Ferrugenised colluvium.
Very wet, light olive occasionally mottleddark olive and brown, soft, intact clayeysand with abundant coarse-, medium- andfine-grained, subrounded ferricrete gravel;Ferrugenised colluvium.
2-
Notes1. Gradual refusal at 1,10 m on hardpan
ferricrete.
2. Perched water table at 0,95 m.
~3
-
meter
Date: 04.06.98 Locality: Case Study Site G Elevation: 1607 m Profiled by: P Aucamp & T Rosner

Test Pit LogTest pit number: G/3
Sample Geotechnical parameters Geochemical parameters (elements in mg/kg)
Profile description number 0/0 Clay PI Dry SG e K pH Fe Mn As Sa Co Cr Cu Mo Ni Pb Sn Th U V Zn0 ws density cm/s % %
0,10 IIIIII11 Slightly moist, pale yellow banded and
://> mottled yellow brown and orange, very soft G/3/1 18,74 8 - - - - 4,03 2,9 0,03 56 209 21 97 33 14 67 0 0 8 0 31 40-
\Iayered sandy silt, Tailings.0,35 c.:.
-
1::::]/.: Slightly moist, dark brown mottled and 4,83G/3/2 24,69 8 - - - - 3,3 0,02 36 224 12 104 34 19 55 0 0 15 0 34 38
stained orange brown (root stains), medium0,70 dense, intact clayey sand; Colluvium.0,85 ..... .
Slightly moist, brown mottled and stained1 orange brown (root stains), medium dense
intact clayey sand; Colluvium.G/3/3 31,45 8 - - - - 6,74 3,9 0,03 22 206 22 121 42 19 73 7 0 20 0 41 44
1,30 Moist, light grey mottled dark grey, looseintact clayey sand; Colluvium.
1,50
Moist, light grey mottled orange brownsoft, intact sandy clay with occasionalcoarse-, medium- and fine-grained,
-subrounded ferricrete gravel; Ferrugenised
2 colluvium.-
-Abundant coarse-, medium- and fine-
-grained, subrounded ferricrete gravel in wetlight grey silty clay; Ferrugenised colluvium.
-The overall consistency is soft.
Notes1. Gradual refusal at 1,50 m on hardpan
-3 ferricrete.
2. No water table encountered.
meter
Date: 04.06.98 Locality: Case Study Site G Elevation: 1612 m Profiled by: P Aucamp & T Rosner

APPENDIXB

Table B.l - Summary of geochemical soil analyses (technique: XRF, all trace elements in m~ kg).Site Sample- Ti02 MoO Fe203 Sc V Cr Co Ni Cu Zo As Rb Sr y Zr Nb Mo So Sb Ba W Pb Th U
No. % % %A 1/1 0.94 0.02 3.64 11 62 197 10 55 43 41 102 68 16 14 519 13 3 0 0 188 7 0 0 0A 1/2 0.98 0.02 4.26 14 70 202 11 62 43 66 77 78 19 21 509 16 9 6 0 194 10 0 1 0A 1/3 0.57 0.02 7.95 16 143 341 17 37 48 282 14 95 41 18 273 16 9 0 0 408 6 7 12 0A 2/1 0.89 0.02 4.08 11 76 246 12 60 54 58 70 62 21 9 522 15 10 0 0 175 5 0 2 0A 2/2 1.02 0.03 7.61 20 117 310 14 85 94 108 30 78 23 17 485 21 19 9 0 263 6 0 14 12A 2/3 0.81 0.02 9.08 21 180 360 5 62 93 40 17 78 23 15 414 19 18 0 0 314 7 2 15 7A 2/4 0.86 0.05 18.05 31 327 494 4 78 106 84 8 49 15 6 346 15 4 0 19 362 4 60 2 0A 3/1 0.99 0.02 3.9 13 59 152 11 58 39 45 37 70 22 24 612 22 26 0 0 144 8 0 14 0A 3/2 1.04 0.02 7.52 19 132 266 16 94 55 58 24 90 26 27 432 23 20 0 0 200 7 2 19 0A 3/3 1.06 0.04 12.15 25 279 351 7 67 57 31 20 58 25 18 439 22 17 0 0 204 6 9 17 0A 3/4 1.11 0.07 15.09 28 332 341 22 65 70 31 16 47 24 15 432 21 12 0 0 302 4 28 12 0B 1/1 1.21 0.06 9.75 25 156 232 27 173 87 135 17 85 23 35 429 22 19 0 0 281 7 13 16 0B 1/2 1.2 0.06 9.61 24 158 226 18 153 89 102 17 85 22 33 428 23 20 0 0 259 7 14 17 0B 1/3 1.22 0.06 10.11 24 165 230 8 115 79 91 17 82 22 28 431 23 20 0 0 231 6 13 18 0B 1/4 1.3 0.07 10.44 26 172 246 7 106 87 72 19 77 21 23 444 25 21 0 0 236 8 10 19 0B 2/1 0.92 0.1 13.18 32 207 372 76 241 135 126 18 79 22 29 200 17 9 0 0 286 4 15 15 0B 2/2 0.92 0.1 12.87 30 202 344 51 190 143 78 23 76 23 22 200 18 10 0 0 247 5 6 14 0B 2/3 1.05 0.06 13.61 35 197 374 10 139 130 57 17 64 26 26 251 19 14 0 0 293 6 4 16 0B 2/4 0.95 0.06 15.14 41 203 485 16 140 170 51 3 72 35 35 186 17 12 0 0 400 5 6 15 0B 3/1 1.05 0.04 5.97 16 89 211 19 85 48 53 43 90 35 31 421 21 12 0 0 230 8 0 12 0B 3/2 1.12 0.03 6.22 18 96 163 13 78 46 40 22 96 35 33 437 25 20 0 0 204 7 9 21 0B 3/3 1.18 0.04 7.2 19 113 230 9 85 51 44 19 101 31 29 418 26 19 0 0 197 6 13 23 0B 3/4 1.22 0.47 8.65 21 163 204 124 126 67 39 6 89 42 26 409 19 4 0 0 1018 5 83 8 0C 1/1 1.03 0.03 7.14 18 112 170 13 77 44 49 68 96 16 17 405 18 8 0 0 205 6 0 7 0C 1/2 1.1 0.04 8.54 21 126 191 14 79 50 47 25 107 20 30 388 24 18 0 0 212 7 8 21 0C 1/3 1.06 0.06 14.23 27 254 369 33 76 67 36 7 74 19 9 361 12 0 0 0 526 3 118 0 0C 1/4 1.05 0.11 10.55 21 167 220 25 65 54 38 22 93 30 21 397 22 16 0 0 511 5 10 17 0C 2/1 0.99 0.05 6.91 15 99 223 20 51 32 34 13 70 57 31 405 22 16 0 0 370 5 14 17 0C 2/2 0.96 0.07 7.07 16 107 230 28 72 32 41 15 71 53 33 378 22 15 0 0 383 6 15 17 0C 2/3 1.03 0.03 7.05 17 166 270 16 56 27 33 21 57 57 24 359 23 14 0 0 406 6 17 19 0C 2/4 0.84 0.17 23.86 36 937 622 188 282 89 28 38 43 30 115 246 10 0 0 64 428 10 8 0 0C 3/1 1.31 0.03 4.09 14 98 166 22 53 46 29 30 67 26 28 537 27 23 0 0 193 8 5 20 8C 3/2 1.18 0.1 6.85 17 146 201 40 76 39 34 23 78 28 32 444 24 18 0 0 237 6 19 18 0

Site Sample- Ti02 MoO Fe20J Sc V Cr Co Ni Cu Zo As Rb Sr Y Zr Nb Mo So Sb Ba W Pb Th UNo. % % %
C 3/3 1.02 0.15 10.44 23 220 247 44 75 47 36 16 72 35 24 303 21 8 0 0 539 5 29 16 0C 3/4 1.01 0.1 7.32 19 178 213 42 65 42 36 24 64 35 30 378 23 14 0 0 292 7 7 18 0D 1/1 1.11 0.04 6.15 17 100 155 21 82 51 54 50 97 20 26 465 20 14 0 0 207 7 0 8 0D 1/2 1.03 0.02 7.1 19 112 159 15 77 62 49 21 105 26 30 396 22 19 0 0 188 6 6 18 0D 1/3 1.11 0.03 7.44 19 120 161 23 79 51 40 18 96 24 27 443 23 21 0 0 196 6 4 19 0D 1/4 1.13 0.37 10.21 21 199 195 90 99 78 38 9 89 47 25 433 18 10 0 0 1252 4 46 8 0D 2/1 1.24 0.06 8.86 22 150 189 23 109 93 55 64 95 22 27 434 16 6 0 0 342 5 0 1 0D 2/2 1.1 0.08 9.44 23 164 192 40 142 97 61 16 104 25 34 356 21 15 0 0 312 5 10 15 0D 2/3 1.21 0.46 10.53 23 213 181 295 157 96 40 9 85 89 23 377 16 7 0 0 1696 5 62 5 0D 2/4 1.43 0.41 11.73 28 199 246 99 120 116 53 8 92 42 33 419 22 18 0 0 716 5 21 15 0D 3/1 1.14 0.04 3.43 10 61 113 25 48 33 37 35 75 33 21 571 22 22 0 0 195 7 0 14 0D 3/2 1.05 0.05 6.67 19 90 175 23 70 42 48 17 129 43 29 403 22 17 0 0 305 6 6 18 0D 3/3 1.14 0.1 9.04 19 108 146 30 59 35 28 8 87 55 24 482 23 20 0 0 707 7 9 16 0D 3/4 1.02 0.03 6.79 19 85 196 10 75 50 49 20 101 46 26 380 23 17 0 0 228 6 1 19 0E 1/1 1.06 0.14 5.89 16 111 279 36 106 26 58 21 68 32 36 448 22 16 0 0 248 6 14 15 0E 1/2 1.09 0.27 6.11 17 134 294 47 70 31 37 17 61 33 32 438 23 15 0 0 533 7 21 16 0E 1/3 1.11 0.07 12.15 24 261 403 20 88 38 24 7 62 22 31 359 22 10 0 0 194 4 25 15 0E 1/4 0.93 0.07 18.76 31 581 498 47 135 57 22 24 50 18 29 255 11 0 0 85 271 5 41 0 0E 2/1 0.9 0.08 6.62 17 99 258 24 69 52 43 36 60 52 18 351 17 9 0 0 191 5 0 8 0E 2/2 0.95 0.07 6.89 20 113 285 17 66 54 47 22 60 54 16 349 19 14 0 0 274 3 2 12 0E 2/3 0.99 0.1 7.84 20 161 305 25 78 58 41 10 49 39 32 332 20 14 0 0 266 5 11 15 0E 3/1 0.96 0.02 4.49 13 102 235 23 65 31 57 19 66 39 44 393 23 15 0 0 138 6 15 18 0E 3/2 1.08 0.02 4.71 15 147 297 18 68 33 68 19 58 31 39 420 24 16 0 0 118 8 12 19 0E 3/3 1.07 0.02 3.62 13 118 287 14 61 27 83 23 58 29 30 480 24 19 0 0 109 8 10 17 0

SiteSample- Ti02 MoO Fe203 Sc V Cr Co Ni Cu Zo As Rb Sr y Zr Nb Mo So Sb Ba W Pb Th UNo. % % 0/0
F 1/1 1.16 0.16 8.59 22 139 178 5 76 53 43 20 89 25 24 462 25 22 0 0 188 6 11 21 0F 1/2 1.12 0.19 7.33 20 127 170 30 143 90 80 31 88 21 37 484 24 22 0 0 222 8 10 18 57F 1/3 1.18 0.12 8.28 21 134 169 4 68 49 40 21 81 23 18 498 25 23 0 0 182 6 11 20 0F 1/4 1.18 0.09 8.16 20 133 200 3 62 43 36 21 77 24 17 506 25 24 0 0 178 8 9 21 0F 2/1 1.07 0.44 8.46 21 135 202 9 83 68 46 20 82 27 28 462 22 22 0 0 235 6 11 18 0F 2/2 1.04 0.18 9.34 24 152 208 5 88 68 46 17 87 24 24 422 22 20 0 0 214 7 12 18 0F 2/3 1.13 0.11 9.6 24 154 199 4 78 63 39 20 77 22 21 439 23 21 0 0 196 6 10 20 0F 2/4 1.11 0.11 9.04 22 144 209 4 66 54 37 18 70 23 19 469 23 23 0 0 186 5 7 20 0F 3/1 1.06 0.04 5.44 18 125 179 60 312 55 205 200 79 13 35 479 35 24 0 0 194 12 0 0 1175F 3/2 1.07 0.04 6.61 20 131 178 51 301 56 281 72 91 21 46 474 36 36 0 0 183 9 3 13 704F 3/3 0.87 0.06 7.22 18 129 291 14 83 47 40 24 68 28 16 379 20 15 0 0 179 7 10 16 9F 3/4 0.87 0.06 7.58 18 142 292 15 96 52 51 28 68 28 17 355 21 14 0 0 170 6 4 15 50F 4/1 1.05 0.03 5.17 18 118 267 32 187 74 147 92 77 24 23 518 41 43 0 0 188 9 0 50 932F 4/2 1.06 0.05 8.07 21 132 174 12 92 53 41 21 83 22 23 462 23 21 0 0 179 7 9 19 0F 4/3 1.05 0.04 7.23 19 135 181 25 147 58 98 27 84 24 35 462 24 23 0 0 201 8 8 17 100F 4/4 1.16 0.06 8.51 22 138 199 5 78 53 49 19 77 22 21 482 24 21 0 0 191 7 7 19 0G 1/1 1.06 0.02 3.08 13 47 122 47 103 41 39 52 84 19 28 545 19 19 0 0 176 8 0 9 0G 1/2 0.98 0.01 5.2·7 16 58 141 8 70 43 44 23 113 21 25 405 21 18 0 0 185 7 4 17 0G 1/3 1.12 0.03 4.18 16 41 126 12 66 39 40 22 104 20 26 479 24 22 0 0 178 7 2 20 0G 2/1 1.03 0.02 4.06 14 54 125 14 56 39 35 21 86 22 21 549 22 26 2 0 190 7 0 17 0G 2/2 1.13 0.05 5.44 16 74 159 18 73 47 56 22 93 20 34 516 23 24 0 0 192 8 3 19 0G 3/1 1.16 0.03 2.93 14 31 97 21 67 33 40 56 91 21 31 497 20 14 0 0 209 9 0 8 0G 3/2 1.15 0.02 3.31 14 34 104 12 55 34 38 36 106 23 32 488 22 19 0 0 224 6 0 15 0G 3/3 1.12 0.03 3.89 14 41 121 22 73 42 44 22 119 23 27 414 24 19 0 0 206 6 7 20 0
a e - am statlstIca .parameters om a e ..Ti02 MoO Fe203 Sc V Cr Co Ni Cu Zo As Rb Sr Y Zr Nb Mo So Sb Ba W Pb Th U
0/0 % 0/0
MIN 0.57 0.01 2.93 10 31 97 3 37 26 22 3 43 13 6 186 10 0 0 0 109 3 0 0 0MAX 1.43 0.47 23.86 41 937 622 295 312 170 282 200 129 89 115 612 41 43 9 85 1696 12 118 50 1175STDEV 0.12 0.10 3.74 5.8 117.5 96.6 41.0 54.1 28.1 46.1 27.1 17.0 12.4 12.4 82.9 4.6 7.2 1.2 11.9 239.5 1.6 18.7 7.2 181.9AVG 1.06 0.09 8.17 20.2 151.7 237.5 29.5 96.6 60.1 59.5 28.6 80.0 29.1 27.0 420.6 21.6 16.4 0.2 2.1 299.6 6.4 12.3 14.7 37.7

1ame D." - tlaCK!!louna vames lOr me vrynelQ l'ormanon tau rrace elemems III mg;K ,n=.Ll).
Sample- 1 2 3 4 5 6 7 8 9 10 11 12 13 14 15 16 17 18 19 20 21 AVG STDEVNo.
Ti02% 1.06 1.08 1.01 0.96 0.95 0.92 0.99 0.95 0.96 1.01 0.91 0.89 0.95 0.97 1 0.91 1 0.84 0.91 0.89 0.99 0.96 0.06MnO% 0.14 0.05 0.1 0.04 0.11 0.08 0.06 0.08 0.1 0.12 0.13 0.08 0.07 0.07 0.06 0.05 0.08 0.06 0.08 0.06 0.09 0.08 0.03Fe203 % 6.44 3.3 4.99 4.48 4.6 2.58 2.63 4.31 5.05 4.59 5.85 4.8 4.37 4.44 4.87 3.77 4.96 3.13 5.62 2.51 5.1 4.40 1.07
As 26 18 25 24 17 18 14 19 22 15 20 22 27 25 20 28 24 23 31 21 26 22.14 4.41Ba 246 266 270 257 267 183 177 196 277 279 341 192 161 169 171 153 174 145 251 85 214 213.05 60.72Co 18 12 18 10 18 12 10 15 15 18 21 13 13 14 13 12 15 10 15 11 15 14.19 3.08Cr 157 93 123 130 117 83 107 115 139 145 175 132 134 132 149 136 130 96 223 80 131 129.86 31.89Cu 43 28 46 24 33 26 24 33 46 34 37 41 36 37 37 35 39 29 39 21 38 34.57 7.09Mo 20 30 18 19 19 25 28 25 21 22 22 17 28 24 23 20 23 27 21 39 22 23.48 4.99Nb 21 24 20 21 18 20 21 20 18 20 18 17 21 21 21 19 21 20 19 20 20 20.00 1.52Ni 61 33 51 38 42 29 26 44 53 41 46 50 50 51 55 48 56 38 59 32 54 45.57 9.99Pb 12 5 15 5 33 17 14 20 25 15 16 30 10 8 10 20 14 3 11 4 17 14.48 8.04Rb 89 84 89 97 78 72 73 76 72 80 70 83 79 81 83 68 79 69 82 50 80 77.81 9.63Sb 0 0 0 0 0 0 0 0 0 0 0 0 0 0 0 0 0 16 0 0 0 0.76 3.49Sc 18 12 13 13 12 8 10 12 15 12 15 14 13 14 13 12 15 10 16 9 14 12.86 2.37Sn 0 2 0 0 0 0 2 0 7 1 0 0 0 1 2 1 0 6 0 0 0 1.05 1.96Sr 36 33 37 45 25 36 32 29 102 29 27 29 27 26 25 26 23 24 35 22 34 33.43 16.72Th 15 18 12 18 8 12 14 12 12 12 10 8 15 16 15 12 14 15 14 15 13 13.33 2.69U 0 0 0 0 0 0 0 0 0 0 0 0 0 0 0 0 0 0 0 0 0 0.00 0.00V 99 41 69 55 68 36 34 61 75 67 97 67 66 67 73 59 79 44 106 37 74 65.43 20.11W 8 8 8 6 6 10 9 6 7 8 8 7 8 9 7 7 7 8 7 8 14 7.90 1.73y 31 29 29 31 22 23 23 26 28 27 26 25 28 28 27 24 25 24 22 21 30 26.14 3.02Zn 68 48 125 41 136 205 230 142 199 80 74 145 93 87 79 60 67 49 78 56 108 103.33 54.74Zr 492 623 494 443 553 609 656 616 591 579 579 502 603 555 542 520 528 560 532 793 549 567.57 72.56

Table B.4 - Extraction test results of the old mine tailings (all element concedntrations in mg/l).Sample- 1 2 3 4 5 6 7 8 9 10 11 12 13
No.As 0.00 0.00 0.00 0.00 0.00 0.00 0.25 0.00 0.00 0.00 0.00 0.00 0.00Ca 1574.50 660.00 202.50 860.00 1082.50 500.00 1362.50 1770.00 1342.50 2185.00 2182.50 1750.00 3020.00Co 0.50 1.00 0.00 0.00 10.00 17.50 25.00 30.00 2.50 15.00 15.00 10.00 25.00Cr 0.00 0.00 0.00 0.00 1.75 1.25 1.75 2.25 1.00 0.50 5.00 2.50 5.00Cu 2.50 2.50 0.00 0.25 12.52 17.50 22.50 22.50 1.50 2.50 7.50 5.00 10.00Fe 0.75 2.50 0.50 0.00 50.00 87.50 105.00 60.00 25.00 7.50 55.00 37.50 5.00Mg 7.50 72.50 17.50 10.00 460.00 687.50 802.50 927.50 290.00 312.50 955.00 650.00 1487.50Mn 1.25 2.50 0.50 0.50 15.00 22.50 25.00 27.50 10.00 42.50 35.00 25.00 45.00Ni 1.25 2.50 0.00 0.00 32.50 57.50 77.50 105.00 10.00 45.00 47.50 35.00 80.00Pb 0.00 0.00 0.00 0.00 0.00 0.50 0.50 0.75 0.25 0.50 0.50 0.50 0.75S 1257.50 697.50 60.00 650.00 3090.00 3712.50 5097.00 6132.50 2510.00 4837.50 4820.00 4827.50 11262.50U 0.00 0.00 0.00 0.00 0.00 0.00 0.00 0.00 0.00 0.00 0.00 0.00 0.00Zn 0.25 1.50 0.25 0.00 7.50 10.00 12.50 15.00 10.00 80.00 40.00 27.50 60.00
a e - es 0 excess ratIos or t e extracta e trace e ement concentratIOns In SOl S 0 stu ly sIteSample- FIliI FIlI2 FIlI3 FIlI4 F/2/I F/2/2 F/2/3 F/2/4 F/3/I F/3/2 F/3/3 F/3/4 F/4/I F/4/2 F/4/3 F/4/4
No.As - - - - - - - - - - - - - - - -Co - 40 - - - - - 1.5 30 10 4 5 30 5 2 1.5
Cr - - - - - - - - - - - - 12.5 - - -Cu - 3.75 - - - - - - 0.13 - - 0.25 1.25 0.13 - 0.38
Ni - 72.5 - - 2.5 - - 0.25 77.5 15 2.5 10 40 10 2 5Pb - 0.38 - - - - - - - - - 0.25 0.5 - - -U - - - - - - - - 118.75 62.5 - - 1500 - - -Zn - 2.75 - - 0.2 0.05 - 0.15 6.25 2.75 0.2 1 5.75 1 - 0.5
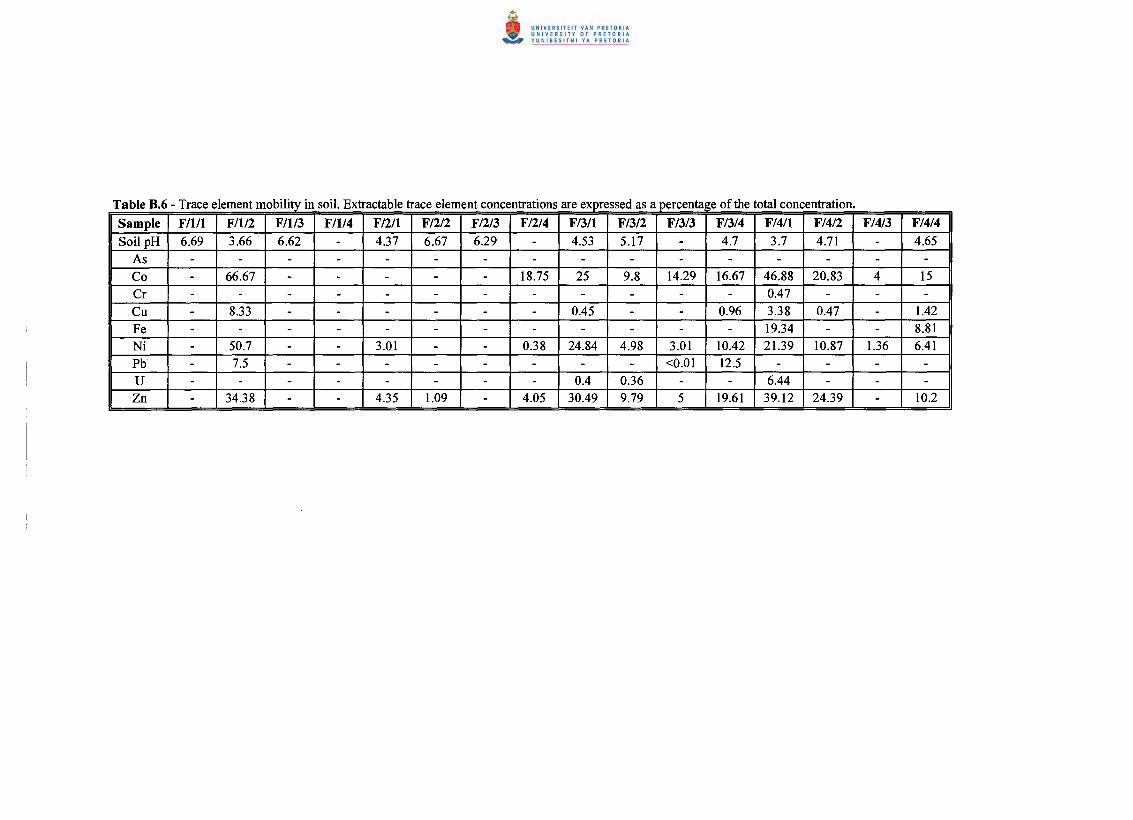
Table H.b - Trace element mObIlIty m SOILextractable trace element concentratIons are expressed as a percenta e 01 me total concentratIOn.Sample FIliI F/lI2 F/lI3 F/lI4 F/2/I F/2/2 F/2/3 F/2/4 F/3/I F/3/2 F/3/3 F/3/4 F/4/I F/4/2 F/4/3 F/4/4
Soil pH 6.69 3.66 6.62 - 4.37 6.67 6.29 - 4.53 5.17 - 4.7 3.7 4.71 - 4.65As - - - - - - - - - - - - - - - -Co - 66.67 - - - - - 18.75 25 9.8 14.29 16.67 46.88 20.83 4 15Cr - - - - - - - - - - - - 0.47 - - -Cu - 8.33 - - - - - - 0.45 - - 0.96 3.38 0.47 - 1.42
Fe - - - - - - - - - - - - 19.34 - - 8.81Ni - 50.7 - - 3.01 - - 0.38 24.84 4.98 3.01 10.42 21.39 10.87 1.36 6.41
Pb - 7.5 - - - - - - - - <0.01 12.5 - - - -U - - - - - - - - 0.4 0.36 - - 6.44 - - -Zn - 34.38 - - 4.35 1.09 - 4.05 30.49 9.79 5 19.61 39.12 24.39 - 10.2

Table B-7: Correlation matrix (Pearson coefficient) for selected major and trace elements in solid tailings samples from five different tailings dams situated in the EastRand area (source data from Rosner, 1996; n=36).
SiOz TiOz Ah03 FeZ03 MnO MgO CaO NazO KzO PzOs As Co Cu Cr Ni Pb Zn Th USiOz 1 055 0.86 om 026 0.40 0.11 om 0.81 0.30 0.14 03 026 0.44 0.36 0.12 0.10 om 0.00T~ 1 0.74 om 033 0.58 028 0.10 0.82 026 0.16 0.45 0.30 0.66 057 0.01 0.14 0.15 0.16AlA 1 0.41 022 0.47 0.40 0.D2 0.% 031 0.10 0.42 0.30 o.ffi 0.45 0.00 0.15 0.11 0.14FeA 1 033 02> 0.00 026 OIl 052 O.<~ 0 0.02 om om 0.00 0.01 0.05 0.01Ml£) 1 022 051 0.18 0.12 0.49 0.16 0.01 om 0.02 0.00 0.10 0.17 om O.<X>Mg() 1 0.15 0.17 0.39 0.30 0.02 022 024 032 038 0.01 0.19 0.17 omQ() 1 0.14 0.46 0.02 0.19 0.49 035 0.48 0.36 0.46 0.48 0.17 0.54NaP 1 om 0.00 0.10 om 0.02 om 0.12 OIl 0.00 026 0.05KP 1 OIl 0.18 0.47 032 o.~ 051 om 0.13 0.15 0.16PA 1 0.12 0.10 0.19 0.11 0.00 026 055 om 038As 1 0.30 0.45 032 024 032 0.<X> 0.17 024Co 1 0.72 0.48 O.su 0.36 056 038 O.ffiG1 1 0.45 0.76 0.12 024 0.19 0.30a- 1 0.62 0.12 o.ffi OIl 0.19Ni 1 0.15 0.43 033 O.:'Qlb 1 0.72 0.15 0.81Zn 1 0.18 092Th 1 028U 1
r = 1 maximum positive correlation between two variables;r = 0 no correlation between two variables;r = -1 maximum negative correlation between two variables.

Table B-8: Correlation matrix (Pearson coefficient) for selected trace elements in soils of the sites A-G (n = 81).Element As Ba Co Cr Cu Fe Mn Mo Ni
As 1 0.23 0 0.13 0.08 0.24 0.25 0.08 0.41Ba 1 0.78 0.14 0.30 0.34 0.73 0.40 0.17Co 1 0.23 0.31 0.37 0.63 0.35 0.51Cr 1 0.56 0.83 0.04 0.59 0.41Cu 1 0.68 0.25 0.33 0.59Fe I 0.26 0.56 0.49Mn I 0.19 0.16Mo I 0.11Ni IPbThUZn
Pb0.340.580.400.240.130.380.480.420.02
1
Th0.250.250.290.170.070.200.120.630.090.33I
U0.740.080.100.010.050.080.090.370.600.130.15I
Zn0.260.130.050.13
o0.200.120.320.250.030.060.46I
r = Ir= 0r =-1

APPENDIXC

Sulphate(S04)
Occurrence in the gold-bearingconglomerates
Geochemical propertiesIn soil and waters
Predominantly from the oxidation of Readily soluble in water, excess CaL+
sulphide-bearing minerals such as e.g. in dolomitic aquifers results inpyrite [FeSz]. the precipitation ofCaS04'
Arsenopyrite [FeSAs]. Furthersources are realgar [AszSz] andorpiment [AsZS3].
Cobaltite [CoAsS] and othersulphide minerals such as pyrite. Inpyrite, Co can be camouflaged by Fe.
Arsenic is rarely encountered innatural waters (Lide, 1999).However, As dissolves under acidconditions such as in the presence ofAMD.
Properties are similar to Fe and Ni,where the pH is the main parameterfor the solubility. During theweathering process, Co may dissolvemore readily than Ni. Co is usuallyfound in soils in Co (II) species. Atlow pH it is oxidised to Co (III) andoften found associated with Fe (Lide,1999).
Environmental andhealth effects
Contents of 200-400 mg/l cause asalt and bitter taste in drinking water.Higher contents (> 600 mg/l) cancause diarrhoea (DWAF, 1996a).A toxic, non-essential element thatcauses chronic (cancer) and acutepoisoning (nerve damage). As (III)shows phytotoxic effects at contentsbetween 1-4 mgfkg in plant leaves(Alloway, 1995). Long-termexposure of 200-300 ~g/l can causeskin cancer, contents above lOOO~g/l are considered to be lethal toman (DWAF, I996a).
Only a few plant species accumulateCo under acidic soil conditionsabove lOO mgfkg which causessevere phytotoxicity. Contents of0.1-5 mg/l when added to nutrientshave been found to be toxic in avariety of food crops. However, theoccurrence of Co is not commonunder field conditions (DWAF,1996d).
Permissible contentsin water and soil
Target water quality ranges from 0-200 mg/l in waters for domestic use(DWAF,1996a).
Target water quality for domestic useis :::;lo ~g/l and < 200 ~g/l (only forshort-term exposure) for potablewater (DWAF, 1996a). Forcomparison, the limit of theEuropean Union for drinking water isgiven as 50 ~g/l (EU 98/83/EG). Thetarget soil quality is given as < 29mgfkg and intervention value with >55 mgfkg dry weight (Dutch List,1997).No target water quality for domesticuse is available, but a concentrationof :::;50 ~gfkg is recommended insoils (DWAF, 1996d). The target soilquality is given as < 20 mgfkg andthe intervention value with > 240mgfkg dry weight (Dutch List, 1997).
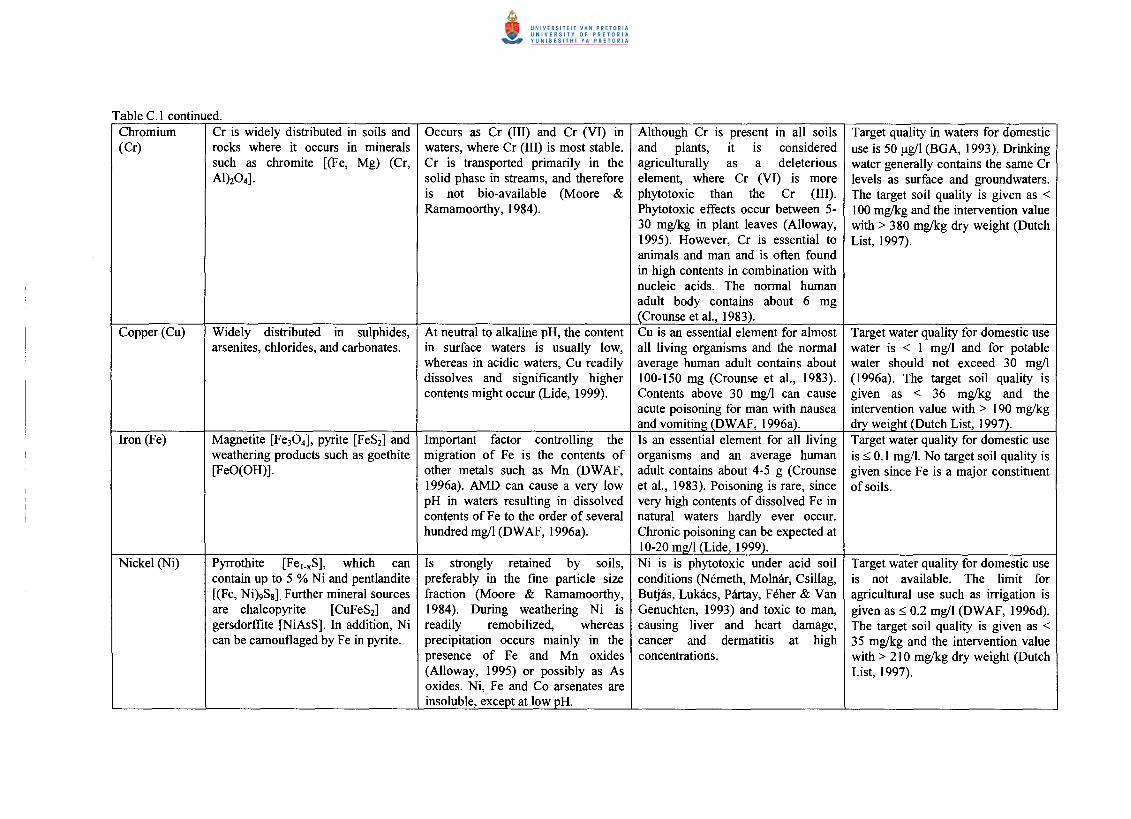
Chromium(Cr)
Cr is widely distributed in soils androcks where it occurs in mineralssuch as chromite [(Fe, Mg) (Cr,Al)Z04].
Widely distributed in sulphides,arsenites, chlorides, and carbonates.
Magnetite [Fe304], pyrite [FeSz] andweathering products such as goethite[FeO(OH)].
Pyrrothite [Fel_xS], which cancontain up to 5 % Ni and pentlandite[(Fe, NihSgl Further mineral sourcesare chalcopyrite [CuFeSz] andgersdorffite (NiAsS]. In addition, Nican be camouflaged by Fe in pyrite.
Occurs as Cr (III) and Cr (VI) inwaters, where Cr (III) is most stable.Cr is transported primarily in thesolid phase in streams, and thereforeis not bio-available (Moore &Ramamoorthy, 1984).
At neutral to alkaline pH, the contentin surface waters is usually low,whereas in acidic waters, Cu readilydissolves and significantly highercontents might occur (Lide, 1999).
Important factor controlling themigration of Fe is the contents ofother metals such as Mn (DWAF,1996a). AMD can cause a very lowpH in waters resulting in dissolvedcontents of Fe to the order of severalhundred mg/l (DW AF, 1996a).
Is strongly retained by soils,preferably in the fine particle sizefraction (Moore & Ramamoorthy,1984). During weathering Ni isreadily remobilized, whereasprecipitation occurs mainly in thepresence of Fe and Mn oxides(Alloway, 1995) or possibly as Asoxides. Ni, Fe and Co arsenates areinsoluble, except at low pH.
Although Cr is present in all soilsand plants, it is consideredagriculturally as a deleteriouselement, where Cr (VI) is morephytotoxic than the Cr (III).Phytotoxic effects occur between 5-30 mglkg in plant leaves (Alloway,1995). However, Cr is essential toanimals and man and is often foundin high contents in combination withnucleic acids. The normal humanadult body contains about 6 mg(Crounse et al., 1983).Cu is an essential element for almostall living organisms and the normalaverage human adult contains about100-150 mg (Crounse et al., 1983).Contents above 30 mg/l can causeacute poisoning for man with nauseaand vomiting (DWAF, 1996a).Is an essential element for all livingorganisms and an average humanadult contains about 4-5 g (Crounseet al., 1983). Poisoning is rare, sincevery high contents of dissolved Fe innatural waters hardly ever occur.Chronic poisoning can be expected at10-20 mg/l (Lide, 1999).Ni is is phytotoxic under acid soilconditions (Nemeth, Molnar, Csillag,Butjas, Lukacs, Plirtay, Feher & VanGenuchten, 1993) and toxic to man,causing liver and heart damage,cancer and dermatitis at highconcentrations.
Target quality in waters for domesticuse is 50 1lg/1(BGA, 1993). Drinkingwater generally contains the same Crlevels as surface and groundwaters.The target soil quality is given as <100 mglkg and the intervention valuewith> 380 mglkg dry weight (DutchList, 1997).
Target water quality for domestic usewater is < 1 mg/l and for potablewater should not exceed 30 mg/l(l996a). The target soil quality isgiven as < 36 mglkg and theintervention value with > 190 mglkgdry weight (Dutch List, 1997).Target water quality for domestic useis ~ 0.1 mg/l. No target soil quality isgiven since Fe is a major constituentof soils.
Target water quality for domestic useis not available. The limit foragricultural use such as irrigation isgiven as ~ 0.2 mg/l (DWAF, 1996d).The target soil quality is given as <35 mglkg and the intervention valuewith> 210 mglkg dry weight (DutchList, 1997).

Manganese(Mn)
Spahlerite [(Zn, Fe)S], which oftencontains some Mn.
Sphalerite [ZnS], which is oftenassociated with galena.
Similar to Fe, where both elementstend to dissolve under aerobicconditions and co-precipitate underanaerobic conditions. Once Mn isdissolved, it is difficult to removefrom solution except at high pH,where it precipitates as the hydroxide(DWAF,1996a).Contents of Pb in soil solution reacha minimum below a pH of 5-6 andincrease below pH 4 - 5 and above 6-7, because metal-organic complexesare formed in this pH range (Lide,1999). Chemical properties aresimilar to those of Cd, Co, Ni and Zn(DWAF, 1996d). In connection withAMD, Pb forms insoluble PbC03
(cerussite), PbS04 (anglesite)compounds or Fe-hydroxides. Muchof the Pb transported in streams is inthe form of suspended matter, andthus not bio-available (Lide, 1999).
Zn is dissolved under acidicconditions, whereas at pH > 8 itprecipitates as the relatively stablehydroxide Zn(OH)2 (Moore &Ramamoorthy, 1984). Zn stronglyinteracts with Cd, which showssimilar geochemical properties (Lide,1999).
Mn is essential to a wide variety ofanimals (Crounse et aI., 1983).Although it is less toxic than othermetals, chronic effects occur atcontents above 20 mg/l (DWAF,1996a).
Pb is non-essential and above normalblood and tissue levels toxic tohumans and animals. Pb is neither astoxic as many other heavy metals noras bio-available, however, it isgenerally more ubiquitous in theenvironment and IS a cumulativetoxin in the mammalian body, thustoxic concentrations can accumulatein the bone narrow (Alloway &Ayres, 1996). Significant healtheffects such as limitation ofneurological functions can beexpected from contents above 50I!g/I. Very high levels of Pb arelethal to man (Lide, 1999).Zn is an essential element is a varietyof animals (Olson, 1983). Zn isphytotoxic and less toxic to man thanother heavy metals (Alloway &Ayres, 1996); acute toxic effects canbe expected at contents above 700mg/l (DWAF, 1996a). Zn is mainly acause of
Target water quality for domestic useis given as ::; 0.05 mg/l (DWAF,1996a). No target soil quality isgiven since Mn is a major constituentof soils.
Target water quality for domestic useIS given as ::; 10 I!g/l (DWAF,1996a). The target soil quality isgiven as < 85 mg/kg and theintervention value with> 230 mg/kg(Dutch List, 1997).
Target water quality for domestic useis given as ::;3 mg/I. The target soilquality is given as < 140 mg/kg andthe intervention value with > 720mg/kg dry weight (Dutch List, 1997).

Uraninite [U02], which alters tolimonite and hematite. Furthersources are zircon and monazite(Meyer, Saager & Kolpel, 1986).Note, that the Wits ore is low in Th(CNS, 1997).
CN is typically not contained in theWits ore, but added [NaCN] duringthe gold recovery process.
U has a complex decay chainresulting in emissions of differentradiations and the generation ofdifferent radioactive daughterproducts. U can accumulate in watersand migrate over long distances evenat pH > 7.5, because of its ability toform complexes such as withcarbonates in dolomitic waters(Bowie & Plant, 1983).
Most of the aqueous cyanide is in thehydrocyanic form and IS largelyundissociated at pH values < 8(DWAF, 1996t). In addition, thecyanide ion (CN") decomposes inaqueous solutions to cyanate (OCN-),which is not stabile and furtherdecomposes to CO2 and NH3
(Mortimer, 1987).
U and its compounds are highlytoxic, both under chemical andradiological aspects. However, Ucontents in human bodies vary due togeographic differences of U in theenvironment averaging 0.02 mg per70 kg (Lide, 1999).
Toxicity depends on various factorssuch as pH, temperature, dissolvedoxygen content, salinity and thepresence of other ions in solution.Chronic effects are expected atconcentrations of about 4 Ilg/l andacute effects at concentrations > 11Ilg/l free cyanide (DWAF, 1996 t).The lethal dose for humans is 1-3mglkg body weight (Lide, 1999).
A U content of 0.07 mg/l should notbe exceeded in water for domesticuse. Contents above 0.284 mg/lindicate a cancer risk < 1 : 200 000and above 1.42 mg/l an increasedcancer risk for humans in the long-term or renal damage in the short-time (DWAF, 1996a). Target waterquality for irrigation waters is givenas > 0.1 mg/l only over the short-term and on a site-specific base(DWAF,1996).The target water quality for freecyanide In aquatic ecosystems isgiven as ~ 1 Ilg/l (DWAF, 1996 t).For comparison, the limit of theEuropean Union for drinking water isgiven as 50 Ilg/l for total CN (EU98/83/EG). The target soil quality isgiven as < 5 mglkg (pH < 5) and theintervention value with > 50 mglkgdry weight (pH < 5) would requireremedial actions (Dutch List, 1997).
Note: Abbreviations DWAF = Department of Water Affairs and Forestry. BGA = Bundesgesundheitsamt, Germany. Dutch List, 1997 refers to the Netherlands Ministry ofHousing, Physical Planning and Environment, 1997
APPENDIXD

>-§~
++Z898000X
N
A
ZOO 400 600 800 1000 m
LEGEND
• Test pit (TP)~ Prevailing wind directionI~;Site boundary
N
A
N
A
o zoo 400 600 800 1000 m•••
>-§coon+
++Z907000X

N
A
N
A
,,,,,,,I,,,
I
I
I
I
>-§,..,on++
"\
\
\ ,,,,,,,
>-ooocoIt)
+
++2907000X
I
I
1 :• I,,,
I
IIIII
I,,
I
I
I
I
I,,,
,
4 "• II
I
I
I
I
II
I
I"" ,'-
• Test pit (TP)
•••. Prevailing wind direction
I~:Site boundary
N
A
,," - - - - - - - - - -,I
I
I
II,I
I
I,I,I
3 I• I
III
_________ J
>-§00on++
I
II
I
I
I
I
I
II\
\
\\
\
\
3 '.. \
\
\
\
\
\
\
\\\\
\\
\
\\
\\
\

APPENDIXE

Fig. E.l - Study site A. Partially reclaimed.Dam height approximately 15-20metres.
FIG. E.3 - Study site B. One of the test pits,maximum depth 2.40 m.
FIG. E.S - Study site E. Some portions oftailings remaining on the surface. Paddockswere established to prevent storm water run-off.
FIG. E.Z - Study site B. Some portions oftailings remaining on the surface. Paddockswere established to prevent storm water run-off.
FIG. E.4 - Study site D. Some portions oftailings remaining on the surface. Grass coveris poorly developed.
FIG. E.6 - Study site F. Some portions oftailings remaining on the surface. Grass coveris poorly developed

FIG. E.7 - Study site I. Rehabilitation of the slopewall to prevent wind erosion and dust generation.
FIG. E.9 - Seepage sampling next to an operatingtailings dam site near Duduza. The water is highlyacidic.
FIG. E.ll - Ferricrete block consisting of ironconcretions.
FIG. E.8 - Track-mounted backactor on a Merce-des Unimog in action at one of the investigated sites.
FIG. E.I0 - Seepage in test pit e/2. A sample wastaken for chemical analysis.
FIG. E.n - Precipitation of secondary mineralssuch as gypsum. Photograph taken at study site G.

Fig. E.13 - Satellite image of the Johannesburg area, depicting the location of tailings dams, drainage systems and thestudy area

I declare that this thesis which I am submitting to the University of Pretoria for the Ph.D.
degree, represents my own work and has never been submitted by me to any other tertiary
institution for any degree.
%OY.>feAA ~.............................. (~ .Thorsten Rosner
Copyright © 2022 FDOKUMEN