Arsenic in iron cements developed within tailings of a former metalliferous mine—Enguialès,...
14
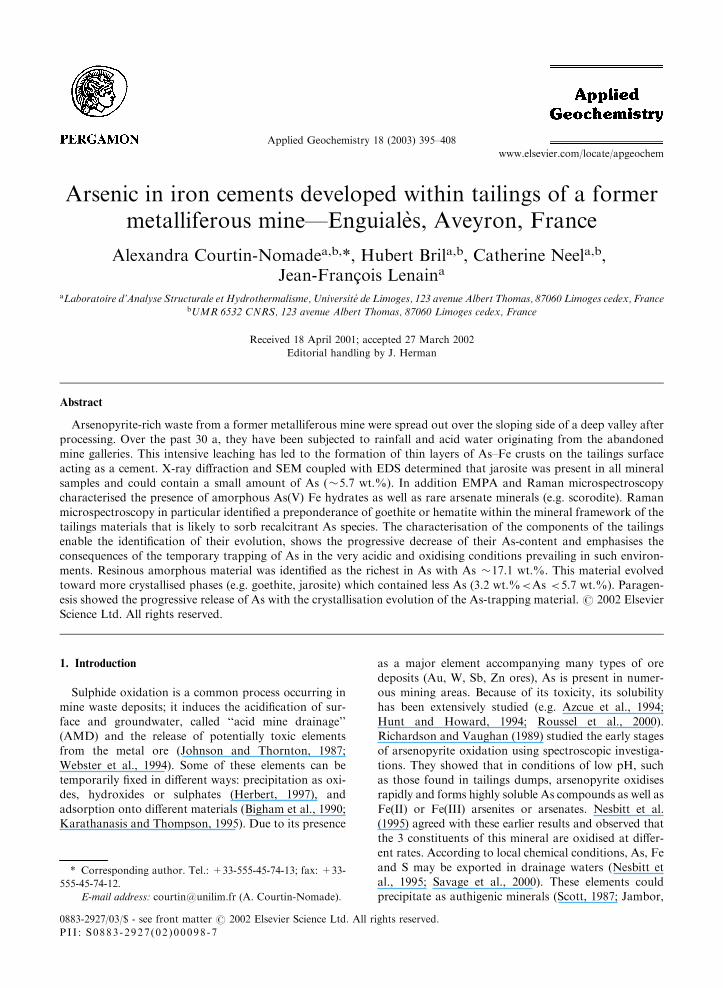
Arsenic in iron cements developed within tailings of a former metalliferous mine—Enguiale`s, Aveyron, France Alexandra Courtin-Nomade a,b, *, Hubert Bril a,b , Catherine Neel a,b , Jean-Franc¸ ois Lenain a a Laboratoire d’Analyse Structurale et Hydrothermalisme, Universite ´ de Limoges, 123 avenue Albert Thomas, 87060 Limoges cedex, France b UMR 6532 CNRS, 123 avenue Albert Thomas, 87060 Limoges cedex, France Received 18 April 2001; accepted 27 March 2002 Editorial handling by J. Herman Abstract Arsenopyrite-rich waste from a former metalliferous mine were spread out over the sloping side of a deep valley after processing. Over the past 30 a, they have been subjected to rainfall and acid water originating from the abandoned mine galleries. This intensive leaching has led to the formation of thin layers of As–Fe crusts on the tailings surface acting as a cement. X-ray diffraction and SEM coupled with EDS determined that jarosite was present in all mineral samples and could contain a small amount of As ( 5.7 wt.%). In addition EMPA and Raman microspectroscopy characterised the presence of amorphous As(V) Fe hydrates as well as rare arsenate minerals (e.g. scorodite). Raman microspectroscopy in particular identified a preponderance of goethite or hematite within the mineral framework of the tailings materials that is likely to sorb recalcitrant As species. The characterisation of the components of the tailings enable the identification of their evolution, shows the progressive decrease of their As-content and emphasises the consequences of the temporary trapping of As in the very acidic and oxidising conditions prevailing in such environ- ments. Resinous amorphous material was identified as the richest in As with As 17.1 wt.%. This material evolved toward more crystallised phases (e.g. goethite, jarosite) which contained less As (3.2 wt.%< As < 5.7 wt.%). Paragen- esis showed the progressive release of As with the crystallisation evolution of the As-trapping material. # 2002 Elsevier Science Ltd. All rights reserved. 1. Introduction Sulphide oxidation is a common process occurring in mine waste deposits; it induces the acidification of sur- face and groundwater, called ‘‘acid mine drainage’’ (AMD) and the release of potentially toxic elements from the metal ore (Johnson and Thornton, 1987; Webster et al., 1994). Some of these elements can be temporarily fixed in different ways: precipitation as oxi- des, hydroxides or sulphates (Herbert, 1997), and adsorption onto different materials (Bigham et al., 1990; Karathanasis and Thompson, 1995). Due to its presence as a major element accompanying many types of ore deposits (Au, W, Sb, Zn ores), As is present in numer- ous mining areas. Because of its toxicity, its solubility has been extensively studied (e.g. Azcue et al., 1994; Hunt and Howard, 1994; Roussel et al., 2000). Richardson and Vaughan (1989) studied the early stages of arsenopyrite oxidation using spectroscopic investiga- tions. They showed that in conditions of low pH, such as those found in tailings dumps, arsenopyrite oxidises rapidly and forms highly soluble As compounds as well as Fe(II) or Fe(III) arsenites or arsenates. Nesbitt et al. (1995) agreed with these earlier results and observed that the 3 constituents of this mineral are oxidised at differ- ent rates. According to local chemical conditions, As, Fe and S may be exported in drainage waters (Nesbitt et al., 1995; Savage et al., 2000). These elements could precipitate as authigenic minerals (Scott, 1987; Jambor, 0883-2927/03/$ - see front matter # 2002 Elsevier Science Ltd. All rights reserved. PII: S0883-2927(02)00098-7 Applied Geochemistry 18 (2003) 395–408 www.elsevier.com/locate/apgeochem * Corresponding author. Tel.: +33-555-45-74-13; fax: +33- 555-45-74-12. E-mail address: [email protected] (A. Courtin-Nomade).
-
Upload
independent -
Category
Documents
-
view
0 -
download
0
Transcript of Arsenic in iron cements developed within tailings of a former metalliferous mine—Enguialès,...
Arsenic in iron cements developed within tailings of a formermetalliferous mine—Enguiales, Aveyron, France
Alexandra Courtin-Nomadea,b,*, Hubert Brila,b, Catherine Neela,b,Jean-Francois Lenaina
aLaboratoire d’Analyse Structurale et Hydrothermalisme, Universite de Limoges, 123 avenue Albert Thomas, 87060 Limoges cedex, FrancebUMR 6532 CNRS, 123 avenue Albert Thomas, 87060 Limoges cedex, France
Received 18 April 2001; accepted 27 March 2002
Editorial handling by J. Herman
Abstract
Arsenopyrite-rich waste from a former metalliferous mine were spread out over the sloping side of a deep valley afterprocessing. Over the past 30 a, they have been subjected to rainfall and acid water originating from the abandonedmine galleries. This intensive leaching has led to the formation of thin layers of As–Fe crusts on the tailings surface
acting as a cement. X-ray diffraction and SEM coupled with EDS determined that jarosite was present in all mineralsamples and could contain a small amount of As (�5.7 wt.%). In addition EMPA and Raman microspectroscopycharacterised the presence of amorphous As(V) Fe hydrates as well as rare arsenate minerals (e.g. scorodite). Raman
microspectroscopy in particular identified a preponderance of goethite or hematite within the mineral framework of thetailings materials that is likely to sorb recalcitrant As species. The characterisation of the components of the tailingsenable the identification of their evolution, shows the progressive decrease of their As-content and emphasises theconsequences of the temporary trapping of As in the very acidic and oxidising conditions prevailing in such environ-
ments. Resinous amorphous material was identified as the richest in As with As �17.1 wt.%. This material evolvedtoward more crystallised phases (e.g. goethite, jarosite) which contained less As (3.2 wt.%<As <5.7 wt.%). Paragen-esis showed the progressive release of As with the crystallisation evolution of the As-trapping material. # 2002 Elsevier
Science Ltd. All rights reserved.
1. Introduction
Sulphide oxidation is a common process occurring inmine waste deposits; it induces the acidification of sur-
face and groundwater, called ‘‘acid mine drainage’’(AMD) and the release of potentially toxic elementsfrom the metal ore (Johnson and Thornton, 1987;
Webster et al., 1994). Some of these elements can betemporarily fixed in different ways: precipitation as oxi-des, hydroxides or sulphates (Herbert, 1997), and
adsorption onto different materials (Bigham et al., 1990;Karathanasis and Thompson, 1995). Due to its presence
as a major element accompanying many types of ore
deposits (Au, W, Sb, Zn ores), As is present in numer-ous mining areas. Because of its toxicity, its solubilityhas been extensively studied (e.g. Azcue et al., 1994;
Hunt and Howard, 1994; Roussel et al., 2000).Richardson and Vaughan (1989) studied the early stagesof arsenopyrite oxidation using spectroscopic investiga-
tions. They showed that in conditions of low pH, suchas those found in tailings dumps, arsenopyrite oxidisesrapidly and forms highly soluble As compounds as well as
Fe(II) or Fe(III) arsenites or arsenates. Nesbitt et al.(1995) agreed with these earlier results and observed thatthe 3 constituents of this mineral are oxidised at differ-ent rates. According to local chemical conditions, As, Fe
and S may be exported in drainage waters (Nesbitt etal., 1995; Savage et al., 2000). These elements couldprecipitate as authigenic minerals (Scott, 1987; Jambor,
0883-2927/03/$ - see front matter # 2002 Elsevier Science Ltd. All rights reserved.
PI I : S0883-2927(02 )00098-7
Applied Geochemistry 18 (2003) 395–408
www.elsevier.com/locate/apgeochem
* Corresponding author. Tel.: +33-555-45-74-13; fax: +33-
555-45-74-12.
E-mail address: [email protected] (A. Courtin-Nomade).
1999) or amorphous material or can be adsorbed ontoFe oxides, hydroxides, or suspended material (Pierceand Moore, 1982; Tsung-Hui et al., 1994; Manning etal., 1998). Knowledge of As speciation and successive
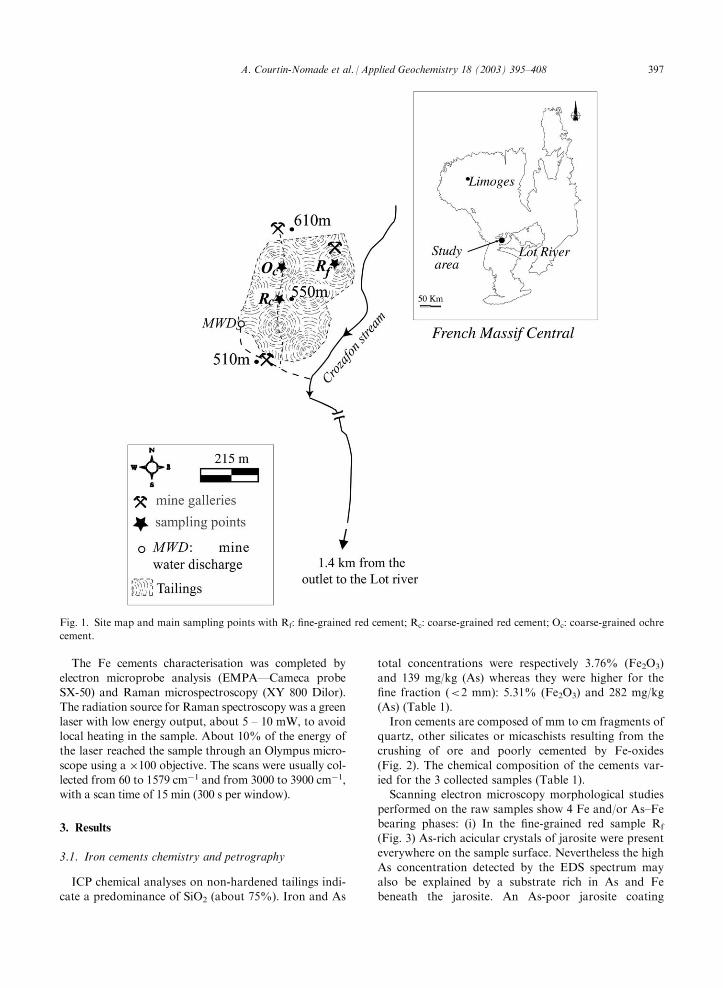
oxidation stages is thus required for predicting theremobilization of this element.Enguiales mine tailings were chosen for this study
because of their high initial As content (As �100–300mg/kg), the acidity of the local stream (pH<3.5) thesloping tailings and the large quantities of exported Fe
oxyhydroxides (Femax �219 mg/l measured in the localstream). Moreover, As-rich Fe cements are well devel-oped as weathering crusts within the dumps.
The objectives of this paper are (i) to study the As–Feconcentrations in these crusts by characterising theirmineralogical form, (ii) to understand the differentstages of their formation, and (iii) to test their stability in
order to forecast As release induced by leaching of thetailings. In the study SEM w/EDS, XRD, micro-Raman,EMPA were used to analyse the solid materials and to
establish a paragenetic succession of As in the tailings.
2. Materials and methods
2.1. Field study
The Enguiales W deposits, located near the Lot river,belong to ‘‘La Chataigneraie’’ district in the southernpart of the French Massif Central. Derre (1983) showed
evidence of a multi-stage vein deposit composed of bis-muthinite, arsenopyrite, chalcopyrite, pyrite and mus-covite in a quartz gangue; the economic mineralization
consisted of wolframite, scheelite, pyrite and arsenopyrite.Mining activity ended in 1979 and 180 000 m3 of
arsenopyrite-bearing waste (100–300 mg/kg As) were
abandoned on the bedrock made of micaschists. The tail-ings were spread out along a steep slope (�35�) covering22 500 m2 (Fig. 1). For 20 a, they have been eroded intoravines by rainfall and drained by very acidic surface
waters (pH 2.6) coming from the mine galleries. In1997, some remediation work was undertaken, whichconsisted only of collecting underground waters origi-
nating from the former galleries and gathering theminto one channel. The entrance to these galleries wasthen sealed.
2.2. Sampling
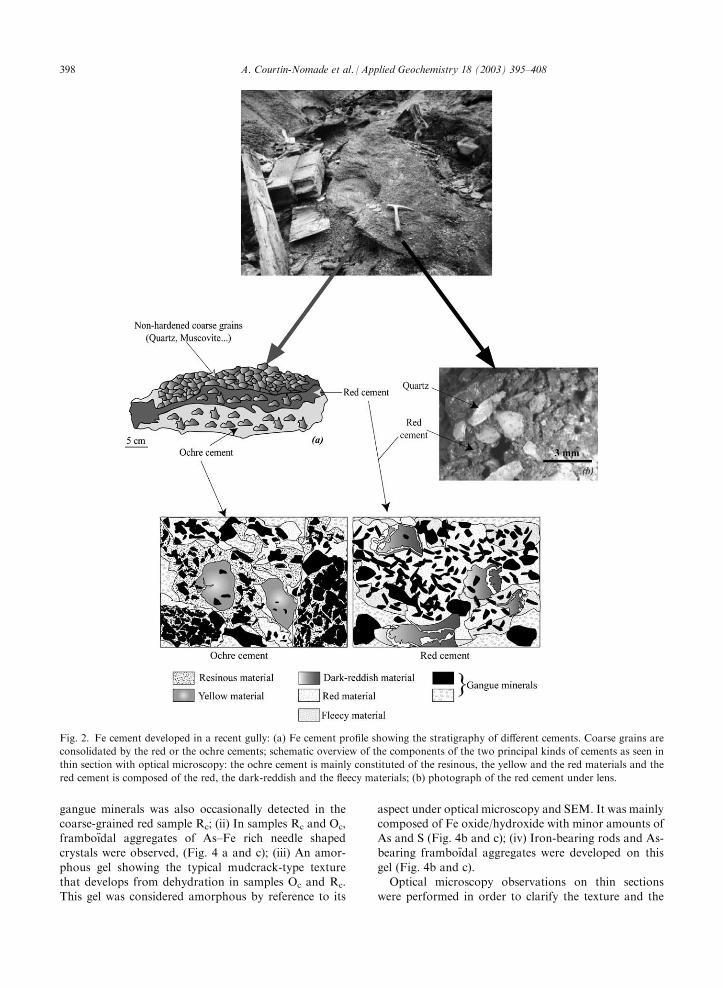
Decimetric-thick indurated layers were found in themost recent gullies within the waste or within the pile oftailings (Fig. 2). Thus these oxidised layers referred to aspaleosurfaces (Jambor, 1994) would seem to indicate
that tailings oxidation began long before the mine wasdecommissioned. These crusts, rich in Fe, have a yellow-brown (10 Yr 7/8) to red colour (5 Yr 5/8 to 2.5 Yr 3/6)
(Table 1), with the red cement always found above theochre cement (Fig. 2). These two different colours aredue to the presence in various proportions of 5 mainmaterials. Indeed, the red cement is mainly composed of
red, dark-reddish and fleecy materials whereas the ochrecement is rich in resinous, yellow and red materials(Fig. 2). In the gullies, the red cement is directly in con-
tact with the atmosphere whereas in the tailings pile, it islocated in zones where permeability is high due to acoarse granulometry (0.63–2 mm).
Three representative samples of various textures andcolours were collected from different places within thetailings (Fig. 1): Rf is a fine-grained red cement, Rc is a
coarse-grained red cement and Oc is a coarse-grainedochre cement. A sample of the non-hardened tailingswas also analysed in order to find out the initial wastecomposition.
2.3. Analytical methods
The Eh and pH of the system were determined in themeteoric and seepage water running across the tailings.Eh and pH were measured in situ using, respectively, a
Metrohm (6.400.230) pt electrode and a HI 1230Bcombined electrode (3M KCl) connected to a HI 9025CpH/mV meter.
After collection, the samples were air-dried at roomtemperature when necessary. A fraction of each samplewas gently ground in a mortar to less than 2 mm. Che-mical and mineralogical analyses were performed by
ICP-MS/AES, AAS flame or furnace mode (VarianspectrAA-800 Zeeman) and X-ray diffraction. For ICP-MS/AES analyses, a total digestion of the material was
performed by melting the sample with LiBO2 followed bydissolution in HNO3. Major elements were determinedby ICP-AES whereas trace elements were determined by
ICP-MS (CRPG-CNRS automatic analysis, France).The detection limits for these analyses are given inTable 1. Loss on ignition (LOI) was determined byheating the sample for 3 h to reach 980 �C; this tem-
perature was maintained for 3 h then cooled. The pow-der XRD analyses used CuKa radiation and a SiemensD5000 diffractometer equipped with a diffracted-beam
graphite monochromator to remove the fluorescenceeffect. X-ray diffraction patterns were collected from 4 to80�2y with a 0.04�2y step and 20-s count time per step.
A portion of the collected Fe cements was prepared asthin sections. The material was then hardened with aGeofix1 resin (i.e an epoxy resin) in order to strengthen
its cohesion. The morphological analyses were carriedout by optical microscopy and scanning electronmicroscopy (SEM) equipped with an energy dispersivespectroscopy (EDS) system. Micro-morphological
analyses were performed on (i) cemented material, (ii)magnetically separated and hand-picked Fe-oxides and(iii) thin sections.
396 A. Courtin-Nomade et al. / Applied Geochemistry 18 (2003) 395–408
The Fe cements characterisation was completed by
electron microprobe analysis (EMPA—Cameca probeSX-50) and Raman microspectroscopy (XY 800 Dilor).The radiation source for Raman spectroscopy was a green
laser with low energy output, about 5 – 10 mW, to avoidlocal heating in the sample. About 10% of the energy ofthe laser reached the sample through an Olympus micro-
scope using a �100 objective. The scans were usually col-lected from 60 to 1579 cm�1 and from 3000 to 3900 cm�1,with a scan time of 15 min (300 s per window).
3. Results
3.1. Iron cements chemistry and petrography
ICP chemical analyses on non-hardened tailings indi-cate a predominance of SiO2 (about 75%). Iron and As
total concentrations were respectively 3.76% (Fe2O3)
and 139 mg/kg (As) whereas they were higher for thefine fraction (<2 mm): 5.31% (Fe2O3) and 282 mg/kg(As) (Table 1).
Iron cements are composed of mm to cm fragments ofquartz, other silicates or micaschists resulting from thecrushing of ore and poorly cemented by Fe-oxides
(Fig. 2). The chemical composition of the cements var-ied for the 3 collected samples (Table 1).Scanning electron microscopy morphological studies
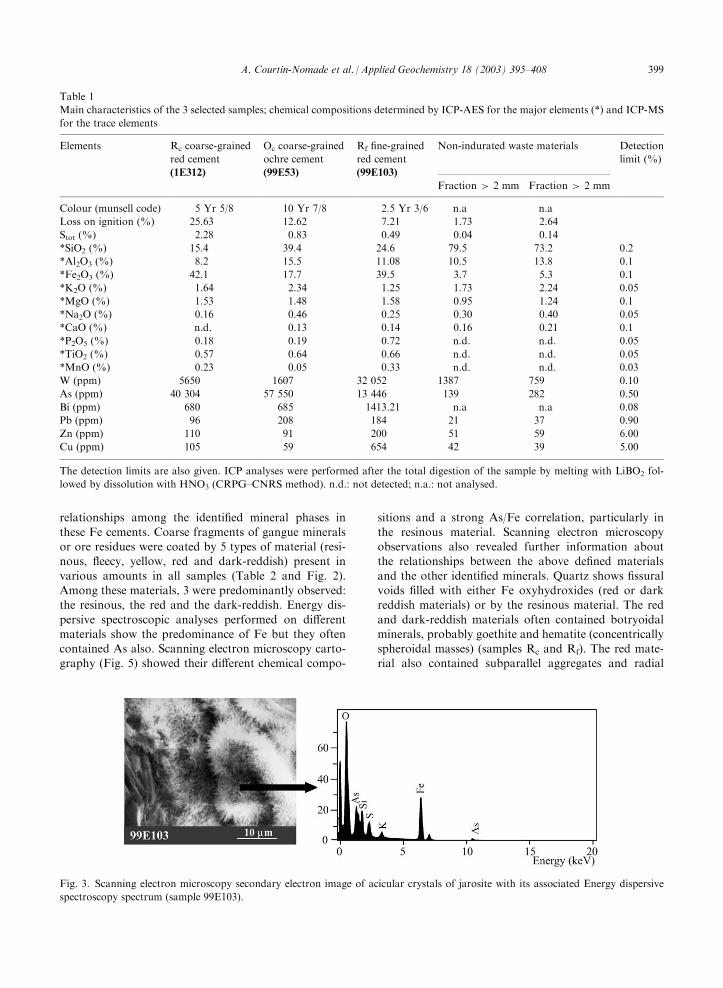
performed on the raw samples show 4 Fe and/or As–Febearing phases: (i) In the fine-grained red sample Rf
(Fig. 3) As-rich acicular crystals of jarosite were presenteverywhere on the sample surface. Nevertheless the high
As concentration detected by the EDS spectrum mayalso be explained by a substrate rich in As and Febeneath the jarosite. An As-poor jarosite coating
Fig. 1. Site map and main sampling points with Rf: fine-grained red cement; Rc: coarse-grained red cement; Oc: coarse-grained ochre
cement.
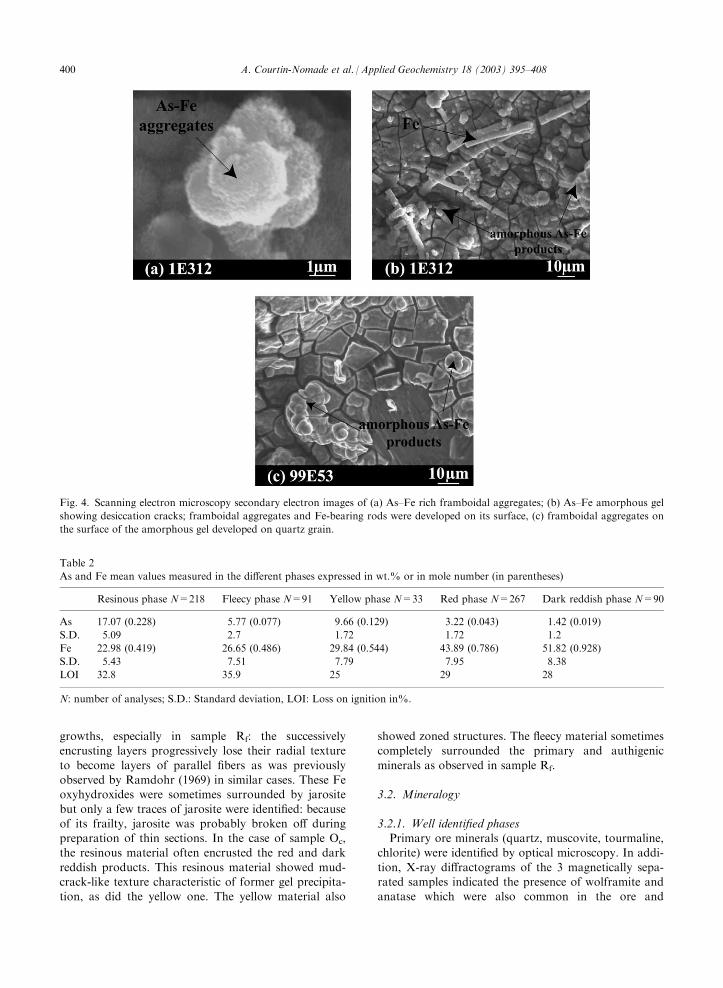
A. Courtin-Nomade et al. / Applied Geochemistry 18 (2003) 395–408 397
gangue minerals was also occasionally detected in thecoarse-grained red sample Rc; (ii) In samples Rc and Oc,framboıdal aggregates of As–Fe rich needle shapedcrystals were observed, (Fig. 4 a and c); (iii) An amor-
phous gel showing the typical mudcrack-type texturethat develops from dehydration in samples Oc and Rc.This gel was considered amorphous by reference to its
aspect under optical microscopy and SEM. It was mainlycomposed of Fe oxide/hydroxide with minor amounts ofAs and S (Fig. 4b and c); (iv) Iron-bearing rods and As-bearing framboıdal aggregates were developed on this
gel (Fig. 4b and c).Optical microscopy observations on thin sections
were performed in order to clarify the texture and the
Fig. 2. Fe cement developed in a recent gully: (a) Fe cement profile showing the stratigraphy of different cements. Coarse grains are
consolidated by the red or the ochre cements; schematic overview of the components of the two principal kinds of cements as seen in
thin section with optical microscopy: the ochre cement is mainly constituted of the resinous, the yellow and the red materials and the
red cement is composed of the red, the dark-reddish and the fleecy materials; (b) photograph of the red cement under lens.
398 A. Courtin-Nomade et al. / Applied Geochemistry 18 (2003) 395–408
relationships among the identified mineral phases in
these Fe cements. Coarse fragments of gangue mineralsor ore residues were coated by 5 types of material (resi-nous, fleecy, yellow, red and dark-reddish) present in
various amounts in all samples (Table 2 and Fig. 2).Among these materials, 3 were predominantly observed:the resinous, the red and the dark-reddish. Energy dis-
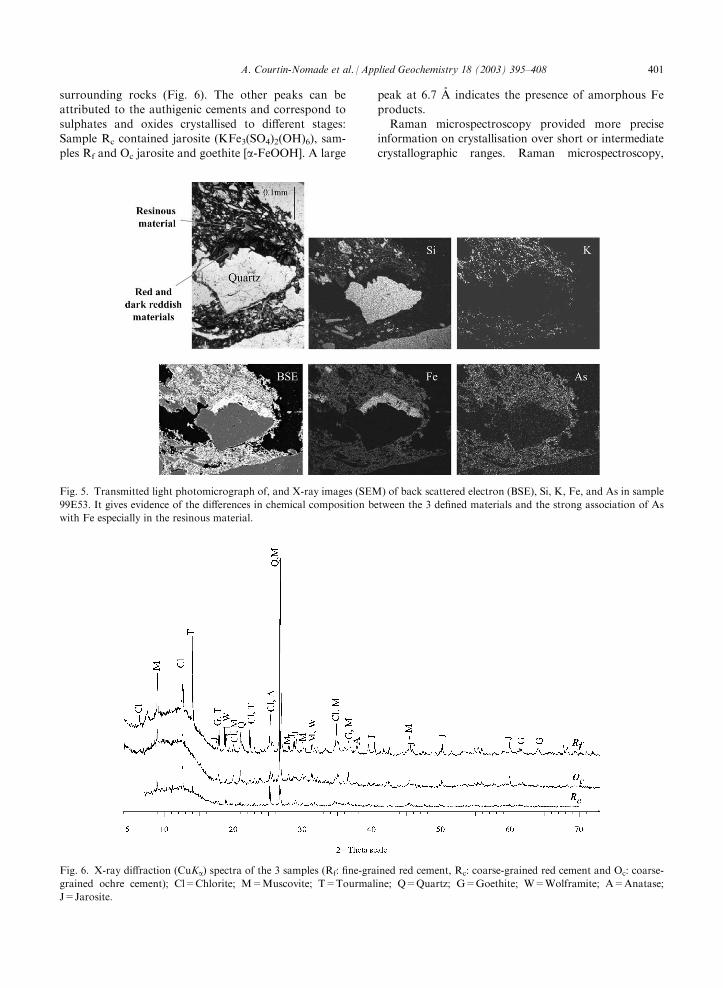
persive spectroscopic analyses performed on differentmaterials show the predominance of Fe but they oftencontained As also. Scanning electron microscopy carto-graphy (Fig. 5) showed their different chemical compo-
sitions and a strong As/Fe correlation, particularly in
the resinous material. Scanning electron microscopyobservations also revealed further information aboutthe relationships between the above defined materials
and the other identified minerals. Quartz shows fissuralvoids filled with either Fe oxyhydroxides (red or darkreddish materials) or by the resinous material. The red
and dark-reddish materials often contained botryoidalminerals, probably goethite and hematite (concentricallyspheroidal masses) (samples Rc and Rf). The red mate-rial also contained subparallel aggregates and radial
Table 1
Main characteristics of the 3 selected samples; chemical compositions determined by ICP-AES for the major elements (*) and ICP-MS
for the trace elements
Elements Rc coarse-grained
red cement
(1E312)
Oc coarse-grained
ochre cement
(99E53)
Rf fine-grained
red cement
(99E103)
Non-indurated waste materials Detection
limit (%)
Fraction > 2 mm Fraction > 2 mm
Colour (munsell code) 5 Yr 5/8 10 Yr 7/8 2.5 Yr 3/6 n.a n.a
Loss on ignition (%) 25.63 12.62 7.21 1.73 2.64
Stot (%) 2.28 0.83 0.49 0.04 0.14
*SiO2 (%) 15.4 39.4 24.6 79.5 73.2 0.2
*Al2O3 (%) 8.2 15.5 11.08 10.5 13.8 0.1
*Fe2O3 (%) 42.1 17.7 39.5 3.7 5.3 0.1
*K2O (%) 1.64 2.34 1.25 1.73 2.24 0.05
*MgO (%) 1.53 1.48 1.58 0.95 1.24 0.1
*Na2O (%) 0.16 0.46 0.25 0.30 0.40 0.05
*CaO (%) n.d. 0.13 0.14 0.16 0.21 0.1
*P2O5 (%) 0.18 0.19 0.72 n.d. n.d. 0.05
*TiO2 (%) 0.57 0.64 0.66 n.d. n.d. 0.05
*MnO (%) 0.23 0.05 0.33 n.d. n.d. 0.03
W (ppm) 5650 1607 32 052 1387 759 0.10
As (ppm) 40 304 57 550 13 446 139 282 0.50
Bi (ppm) 680 685 1413.21 n.a n.a 0.08
Pb (ppm) 96 208 184 21 37 0.90
Zn (ppm) 110 91 200 51 59 6.00
Cu (ppm) 105 59 654 42 39 5.00
The detection limits are also given. ICP analyses were performed after the total digestion of the sample by melting with LiBO2 fol-
lowed by dissolution with HNO3 (CRPG–CNRS method). n.d.: not detected; n.a.: not analysed.
Fig. 3. Scanning electron microscopy secondary electron image of acicular crystals of jarosite with its associated Energy dispersive
spectroscopy spectrum (sample 99E103).
A. Courtin-Nomade et al. / Applied Geochemistry 18 (2003) 395–408 399
growths, especially in sample Rf: the successivelyencrusting layers progressively lose their radial texture
to become layers of parallel fibers as was previouslyobserved by Ramdohr (1969) in similar cases. These Feoxyhydroxides were sometimes surrounded by jarosite
but only a few traces of jarosite were identified: becauseof its frailty, jarosite was probably broken off duringpreparation of thin sections. In the case of sample Oc,the resinous material often encrusted the red and dark
reddish products. This resinous material showed mud-crack-like texture characteristic of former gel precipita-tion, as did the yellow one. The yellow material also
showed zoned structures. The fleecy material sometimescompletely surrounded the primary and authigenic
minerals as observed in sample Rf.
3.2. Mineralogy
3.2.1. Well identified phasesPrimary ore minerals (quartz, muscovite, tourmaline,
chlorite) were identified by optical microscopy. In addi-
tion, X-ray diffractograms of the 3 magnetically sepa-rated samples indicated the presence of wolframite andanatase which were also common in the ore and
Fig. 4. Scanning electron microscopy secondary electron images of (a) As–Fe rich framboidal aggregates; (b) As–Fe amorphous gel
showing desiccation cracks; framboidal aggregates and Fe-bearing rods were developed on its surface, (c) framboidal aggregates on
the surface of the amorphous gel developed on quartz grain.
Table 2
As and Fe mean values measured in the different phases expressed in wt.% or in mole number (in parentheses)
Resinous phase N=218 Fleecy phase N=91 Yellow phase N=33 Red phase N=267 Dark reddish phase N=90
As 17.07 (0.228) 5.77 (0.077) 9.66 (0.129) 3.22 (0.043) 1.42 (0.019)
S.D. 5.09 2.7 1.72 1.72 1.2
Fe 22.98 (0.419) 26.65 (0.486) 29.84 (0.544) 43.89 (0.786) 51.82 (0.928)
S.D. 5.43 7.51 7.79 7.95 8.38
LOI 32.8 35.9 25 29 28
N: number of analyses; S.D.: Standard deviation, LOI: Loss on ignition in%.
400 A. Courtin-Nomade et al. / Applied Geochemistry 18 (2003) 395–408
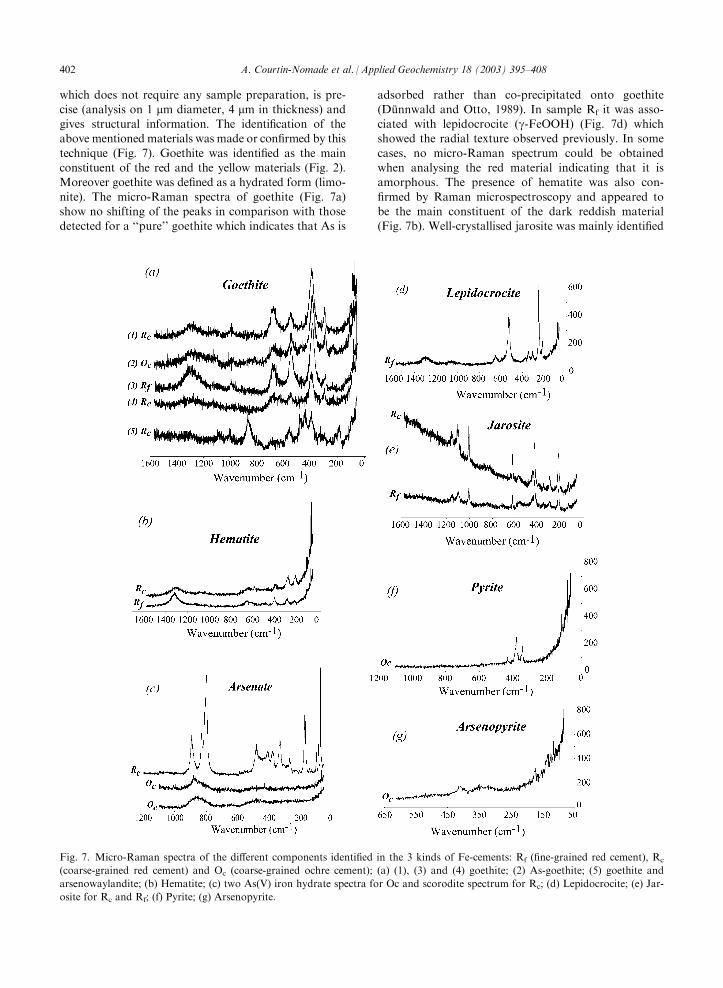
surrounding rocks (Fig. 6). The other peaks can beattributed to the authigenic cements and correspond tosulphates and oxides crystallised to different stages:Sample Rc contained jarosite (KFe3(SO4)2(OH)6), sam-
ples Rf and Oc jarosite and goethite [a-FeOOH]. A large
peak at 6.7 A indicates the presence of amorphous Feproducts.Raman microspectroscopy provided more precise
information on crystallisation over short or intermediate
crystallographic ranges. Raman microspectroscopy,
Fig. 5. Transmitted light photomicrograph of, and X-ray images (SEM) of back scattered electron (BSE), Si, K, Fe, and As in sample
99E53. It gives evidence of the differences in chemical composition between the 3 defined materials and the strong association of As
with Fe especially in the resinous material.
Fig. 6. X-ray diffraction (CuKa) spectra of the 3 samples (Rf: fine-grained red cement, Rc: coarse-grained red cement and Oc: coarse-
grained ochre cement); Cl=Chlorite; M=Muscovite; T=Tourmaline; Q=Quartz; G=Goethite; W=Wolframite; A=Anatase;
J=Jarosite.
A. Courtin-Nomade et al. / Applied Geochemistry 18 (2003) 395–408 401
which does not require any sample preparation, is pre-cise (analysis on 1 mm diameter, 4 mm in thickness) andgives structural information. The identification of theabove mentioned materials was made or confirmed by this
technique (Fig. 7). Goethite was identified as the mainconstituent of the red and the yellow materials (Fig. 2).Moreover goethite was defined as a hydrated form (limo-
nite). The micro-Raman spectra of goethite (Fig. 7a)show no shifting of the peaks in comparison with thosedetected for a ‘‘pure’’ goethite which indicates that As is
adsorbed rather than co-precipitated onto goethite(Dunnwald and Otto, 1989). In sample Rf it was asso-ciated with lepidocrocite (g-FeOOH) (Fig. 7d) whichshowed the radial texture observed previously. In some
cases, no micro-Raman spectrum could be obtainedwhen analysing the red material indicating that it isamorphous. The presence of hematite was also con-
firmed by Raman microspectroscopy and appeared tobe the main constituent of the dark reddish material(Fig. 7b). Well-crystallised jarosite was mainly identified
Fig. 7. Micro-Raman spectra of the different components identified in the 3 kinds of Fe-cements: Rf (fine-grained red cement), Rc
(coarse-grained red cement) and Oc (coarse-grained ochre cement); (a) (1), (3) and (4) goethite; (2) As-goethite; (5) goethite and
arsenowaylandite; (b) Hematite; (c) two As(V) iron hydrate spectra for Oc and scorodite spectrum for Rc; (d) Lepidocrocite; (e) Jar-
osite for Rc and Rf; (f) Pyrite; (g) Arsenopyrite.
402 A. Courtin-Nomade et al. / Applied Geochemistry 18 (2003) 395–408
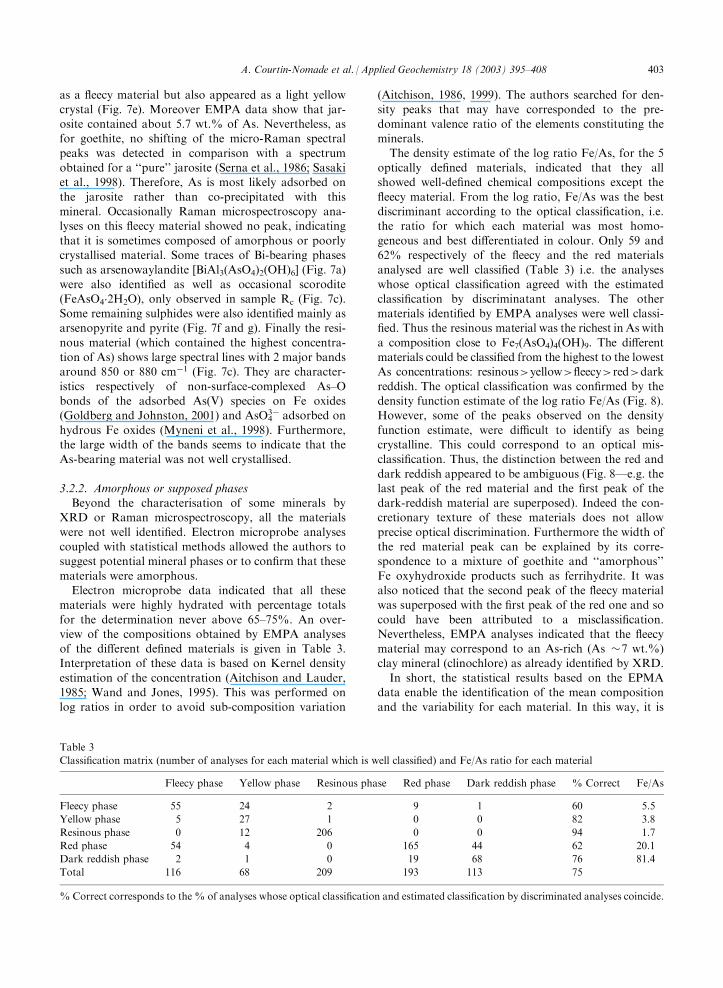
as a fleecy material but also appeared as a light yellowcrystal (Fig. 7e). Moreover EMPA data show that jar-osite contained about 5.7 wt.% of As. Nevertheless, asfor goethite, no shifting of the micro-Raman spectral
peaks was detected in comparison with a spectrumobtained for a ‘‘pure’’ jarosite (Serna et al., 1986; Sasakiet al., 1998). Therefore, As is most likely adsorbed on
the jarosite rather than co-precipitated with thismineral. Occasionally Raman microspectroscopy ana-lyses on this fleecy material showed no peak, indicating
that it is sometimes composed of amorphous or poorlycrystallised material. Some traces of Bi-bearing phasessuch as arsenowaylandite [BiAl3(AsO4)2(OH)6] (Fig. 7a)
were also identified as well as occasional scorodite(FeAsO4
.2H2O), only observed in sample Rc (Fig. 7c).Some remaining sulphides were also identified mainly asarsenopyrite and pyrite (Fig. 7f and g). Finally the resi-
nous material (which contained the highest concentra-tion of As) shows large spectral lines with 2 major bandsaround 850 or 880 cm�1 (Fig. 7c). They are character-
istics respectively of non-surface-complexed As–Obonds of the adsorbed As(V) species on Fe oxides(Goldberg and Johnston, 2001) and AsO4
3� adsorbed on
hydrous Fe oxides (Myneni et al., 1998). Furthermore,the large width of the bands seems to indicate that theAs-bearing material was not well crystallised.
3.2.2. Amorphous or supposed phasesBeyond the characterisation of some minerals by
XRD or Raman microspectroscopy, all the materials
were not well identified. Electron microprobe analysescoupled with statistical methods allowed the authors tosuggest potential mineral phases or to confirm that these
materials were amorphous.Electron microprobe data indicated that all these
materials were highly hydrated with percentage totals
for the determination never above 65–75%. An over-view of the compositions obtained by EMPA analysesof the different defined materials is given in Table 3.Interpretation of these data is based on Kernel density
estimation of the concentration (Aitchison and Lauder,1985; Wand and Jones, 1995). This was performed onlog ratios in order to avoid sub-composition variation
(Aitchison, 1986, 1999). The authors searched for den-sity peaks that may have corresponded to the pre-dominant valence ratio of the elements constituting theminerals.
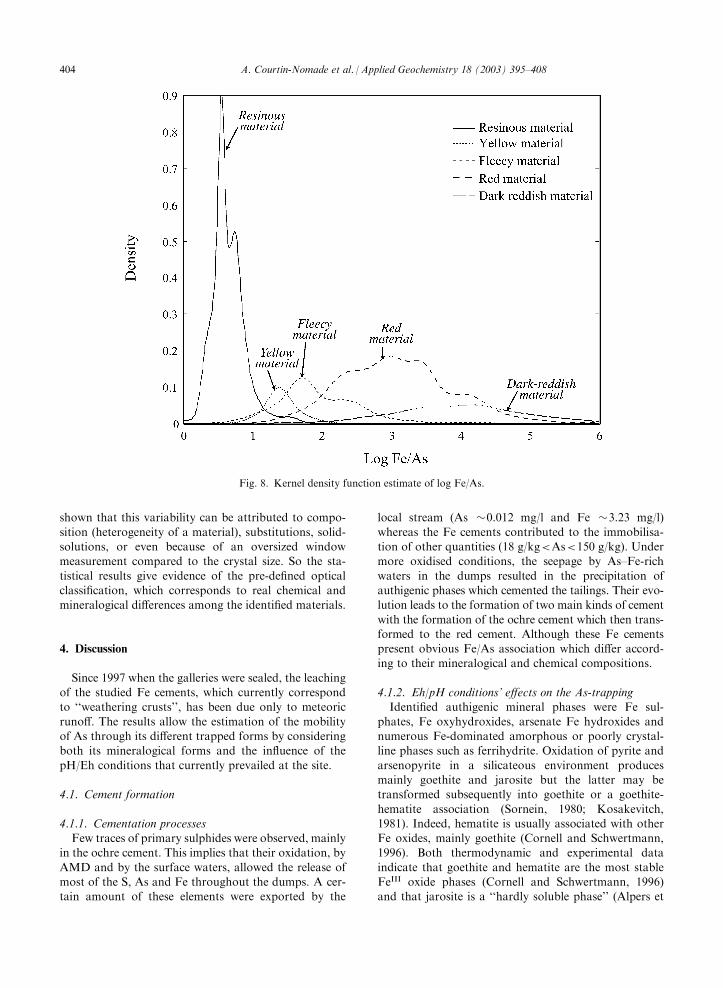
The density estimate of the log ratio Fe/As, for the 5optically defined materials, indicated that they allshowed well-defined chemical compositions except the
fleecy material. From the log ratio, Fe/As was the bestdiscriminant according to the optical classification, i.e.the ratio for which each material was most homo-
geneous and best differentiated in colour. Only 59 and62% respectively of the fleecy and the red materialsanalysed are well classified (Table 3) i.e. the analyses
whose optical classification agreed with the estimatedclassification by discriminatant analyses. The othermaterials identified by EMPA analyses were well classi-fied. Thus the resinous material was the richest in As with
a composition close to Fe7(AsO4)4(OH)9. The differentmaterials could be classified from the highest to the lowestAs concentrations: resinous>yellow>fleecy>red>dark
reddish. The optical classification was confirmed by thedensity function estimate of the log ratio Fe/As (Fig. 8).However, some of the peaks observed on the density
function estimate, were difficult to identify as beingcrystalline. This could correspond to an optical mis-classification. Thus, the distinction between the red and
dark reddish appeared to be ambiguous (Fig. 8—e.g. thelast peak of the red material and the first peak of thedark-reddish material are superposed). Indeed the con-cretionary texture of these materials does not allow
precise optical discrimination. Furthermore the width ofthe red material peak can be explained by its corre-spondence to a mixture of goethite and ‘‘amorphous’’
Fe oxyhydroxide products such as ferrihydrite. It wasalso noticed that the second peak of the fleecy materialwas superposed with the first peak of the red one and so
could have been attributed to a misclassification.Nevertheless, EMPA analyses indicated that the fleecymaterial may correspond to an As-rich (As �7 wt.%)clay mineral (clinochlore) as already identified by XRD.
In short, the statistical results based on the EPMAdata enable the identification of the mean compositionand the variability for each material. In this way, it is
Table 3
Classification matrix (number of analyses for each material which is well classified) and Fe/As ratio for each material
Fleecy phase Yellow phase Resinous phase Red phase Dark reddish phase % Correct Fe/As
Fleecy phase 55 24 2 9 1 60 5.5
Yellow phase 5 27 1 0 0 82 3.8
Resinous phase 0 12 206 0 0 94 1.7
Red phase 54 4 0 165 44 62 20.1
Dark reddish phase 2 1 0 19 68 76 81.4
Total 116 68 209 193 113 75
% Correct corresponds to the % of analyses whose optical classification and estimated classification by discriminated analyses coincide.
A. Courtin-Nomade et al. / Applied Geochemistry 18 (2003) 395–408 403
shown that this variability can be attributed to compo-
sition (heterogeneity of a material), substitutions, solid-solutions, or even because of an oversized windowmeasurement compared to the crystal size. So the sta-
tistical results give evidence of the pre-defined opticalclassification, which corresponds to real chemical andmineralogical differences among the identified materials.
4. Discussion
Since 1997 when the galleries were sealed, the leachingof the studied Fe cements, which currently correspondto ‘‘weathering crusts’’, has been due only to meteoric
runoff. The results allow the estimation of the mobilityof As through its different trapped forms by consideringboth its mineralogical forms and the influence of the
pH/Eh conditions that currently prevailed at the site.
4.1. Cement formation
4.1.1. Cementation processesFew traces of primary sulphides were observed, mainly
in the ochre cement. This implies that their oxidation, by
AMD and by the surface waters, allowed the release ofmost of the S, As and Fe throughout the dumps. A cer-tain amount of these elements were exported by the
local stream (As �0.012 mg/l and Fe �3.23 mg/l)
whereas the Fe cements contributed to the immobilisa-tion of other quantities (18 g/kg<As<150 g/kg). Undermore oxidised conditions, the seepage by As–Fe-rich
waters in the dumps resulted in the precipitation ofauthigenic phases which cemented the tailings. Their evo-lution leads to the formation of two main kinds of cement
with the formation of the ochre cement which then trans-formed to the red cement. Although these Fe cementspresent obvious Fe/As association which differ accord-ing to their mineralogical and chemical compositions.
4.1.2. Eh/pH conditions’ effects on the As-trappingIdentified authigenic mineral phases were Fe sul-
phates, Fe oxyhydroxides, arsenate Fe hydroxides andnumerous Fe-dominated amorphous or poorly crystal-line phases such as ferrihydrite. Oxidation of pyrite and
arsenopyrite in a silicateous environment producesmainly goethite and jarosite but the latter may betransformed subsequently into goethite or a goethite-
hematite association (Sornein, 1980; Kosakevitch,1981). Indeed, hematite is usually associated with otherFe oxides, mainly goethite (Cornell and Schwertmann,1996). Both thermodynamic and experimental data
indicate that goethite and hematite are the most stableFeIII oxide phases (Cornell and Schwertmann, 1996)and that jarosite is a ‘‘hardly soluble phase’’ (Alpers et
Fig. 8. Kernel density function estimate of log Fe/As.
404 A. Courtin-Nomade et al. / Applied Geochemistry 18 (2003) 395–408
al., 1989). These 3 minerals can persist together undersurface conditions after long exposure even if the pHconditions required for jarosite precipitation disappear(Nordstrom and Munoz, 1986; Stahl et al., 1993). Con-
versely, Krause and Ettel (1988) showed a relativelyhigh solubility of apparently amorphous Fe–As pre-cipitates (which could be close to the composition of the
present resinous material) with �log CAs(V) rangingfrom 3.5 to 4 mol l�1 at pH 3. The resinous material, theamorphous or poorly crystallised Fe products (e.g. fer-
rihydrite) are unstable and with time will convert tomore stable Fe oxides (a-FeOOH or a-Fe2O3) (Cornelland Schwertmann, 1996).
At Enguiales, the Fe cements were composed of theochre and the red cement containing different materialproperties. Jarosite, goethite and hematite were themain constituents of the red cement, which undergoes
leaching, but they are considered to be thermo-dynamically stable under current conditions. Thus jar-osite which forms at pH<3, observed in all samples,
agrees with field acidic conditions. The presence of goe-thite, which can precipitate and persist over a largerange of pH/Eh, was also consistent with the actual
acidic and oxidising pH/Eh conditions (characteristicsof the runoff waters in the tailings: pH �3; Eh �482mV). In this way, the properties of these Fe oxyhydr-
oxides allow efficient As trapping but only in smallamounts. Conversely, the progressive transformationwhich can occur for the As-bearing amorphous Fe oxy-hydroxides into more crystallised Fe oxides leads to the
release of some of the As. In like manner the ochrecement, mainly composed of the As-rich resinous mate-rial, appeared to be unstable under the acidic conditions
measured at Enguiales and led to release of As intosurface waters.
4.1.3. As-bearing phasesArsenic is co-precipitated or adsorbed on to several
phases. It can be adsorbed on jarosite or, as suggestedby Scott (1987) for the alunite-jarosite family, can sub-
stitute for SO4 in the mineral lattice. Arsenic is alsoassociated with all other Fe oxyhydroxides. This affinityis well documented; indeed As can form mono- or
bidentate complexes with a-FeOOH as shown by FTIR,XANES or EXAFS investigations (Foster et al., 1998;Manceau, 1995; Savage et al., 2000; Sun and Doner,
1998; Waychunas et al., 1995). These kinds of studiesalso show the high sorption capacities of ‘‘amorphous’’Fe(III) hydroxide as ferrihydrite for As (Waychunas et
al., 1993, 1995; Jambor and Dutrizac, 1998). AtEnguiales, jarosite commonly contained As (As �5.7�2.7 wt.%) which is adsorbed onto this sulphate asproved by micro-Raman analyses. Furthermore, in the
fleecy material, As was also found more rarely asso-ciated with clay minerals (As �7 wt.%) which couldalso be a good sink for As (Foster et al., 1998; Manning
and Goldberg, 1997). Raman spectral peaks for goethitewere wider than for ‘‘pure’’ goethite (Dunnwald andOtto, 1989) which can indicate that goethite was poorlyor micro-crystallised (White, 1975). EMPA data show
that compositions of As-enriched goethite and hematitewere variable. Kosakevitch (1981) also observed thisfact for co-precipitated minerals in a subsurface envir-
onment (e.g. the gossan deposits in Um ad Damar, Ara-bia). Indeed, As concentration in hematite (As=1.42�1.2 wt.%) was lower and less homogeneous than in goe-
thite (As=3.22�1.72 wt.%). From its crystallinity, statis-tical results suggest that goethite can be a reasonably goodsink for As and Raman microspectrometry established
that As is adsorbed rather than co-precipitated.In the two main types of Fe cements (ochre or red),
As was mainly present as poorly crystallised phases(As=17.07�5.09 wt.%) and as an adsorbed species on
ferrihydrite-type oxyhydroxide but well crystallisedarsenate species such as scorodite which is a raremineral at Enguiales, were also noted.
4.2. Cement stability
The previous observations lead the authors to pointout the importance of the amorphous phases in Astrapping. In order to understand the behaviour of As in
the different materials identified, a paragenetic succes-sion was established based on their geometrical rela-tionship. The knowledge of the capacity of the differentmaterials to trap As and their stability in current con-
ditions coupled with the paragenetic succession gaveinformation on As behaviour from the oxidation of thesulphide through to its final mineralogical form.
As observed by SEM and microscopic observations, 3main types of materials in the Fe cements can be found:the resinous, the red, and the dark reddish. The resinous
material appears to have been the first stage of the sul-phide oxidation: arsenopyrite is the first of the sulphidesto be altered. As indicated by EMPA data, its mud-crack-type texture as well as its relative homogeneity in
composition also suggested its rapid re-precipitationfrom As–Fe rich waters. Thus it confirms that it repre-sented the first step of As–Fe immobilisation as recor-
ded by Roussel et al. (1999) in tailings from a former Aumine. The resinous phase was also present as rim andfilled the cracks of the slightly altered sulphides
(arsenopyrite or early-altered pyrite). This phase fills thecracks in the quartz and surrounds other gangueminerals. It was predominantly found in the ochre
cement (i.e. at the Fe cements’ base).The red and the dark reddish materials correspond to
the most evolved stages. These were found only as tracesin the ochre cement, where they were encrusted by the
resinous material and also filled the cracks in primaryminerals (quartz, muscovite etc.). However, they werethe main constituents of the red cements (i.e. in the
A. Courtin-Nomade et al. / Applied Geochemistry 18 (2003) 395–408 405
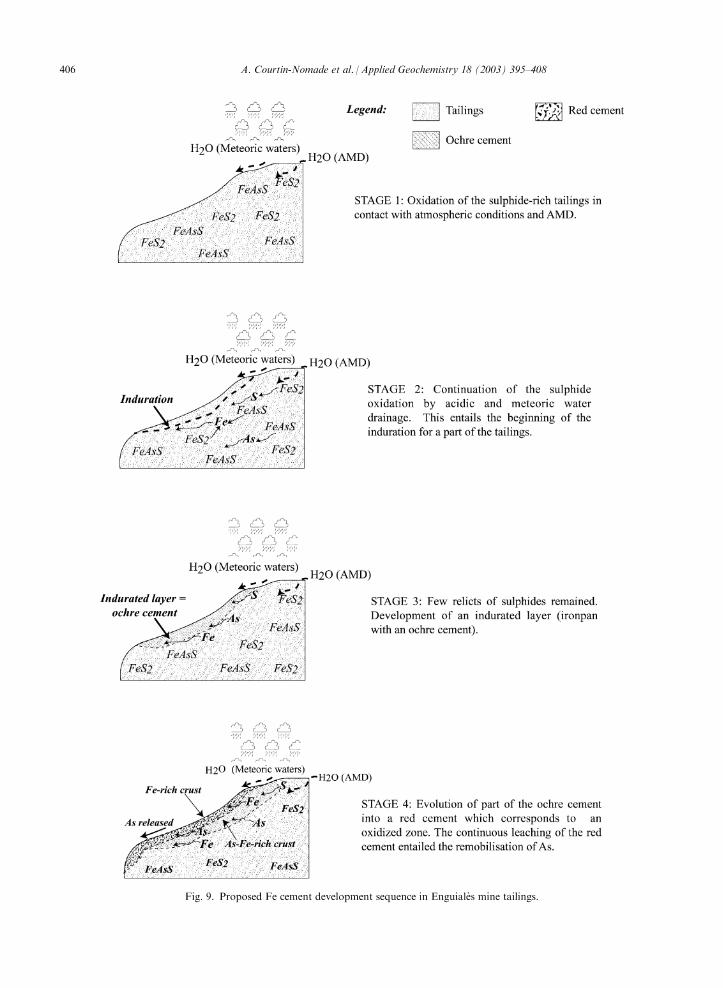
Fig. 9. Proposed Fe cement development sequence in Enguiales mine tailings.
406 A. Courtin-Nomade et al. / Applied Geochemistry 18 (2003) 395–408
upper layers of the Fe cements) which are more subjectto leaching. Only the most stable minerals persisted inthese upper layers. Indeed, the red and the dark reddishmaterials mainly correspond to goethite and hematite,
respectively.With no distinction in their chronological formation,
two substances, the yellow and the fleecy, appeared as
an intermediate stage between the resinous and the red-dark reddish materials. They were mainly observed inthe red cements. Textural (observations of colloform
structure) and mineralogical information indicated thatthe yellow material corresponds to an As-rich gel or to apoorly crystallised goethite and then to an intermediate
stage with the red material. The fleecy material appearedto be a mixture of As-rich jarosite and clays but it can-not be accurately placed in the chronology.The general sequence proposed for the formation of
these Fe cements is as follows (Fig. 9): AMD trans-ported elements such as Fe and As issued from sulphideoxidation (Fig. 9—stages 1 and 2). These elements pre-
cipitated successively during dry periods as an ochrecement (Fig. 9—stage 3). With the partial release of Asby dissolution, some of this cement evolved into a red
cement (Fig. 9—stage 4). This evolution is due togreater leaching of the upper layer because of its coarsergranulometry. Mineralogical data indicates that As is
most probably adsorbed on to Fe oxyhydroxides orsulphates in part but a fraction of the As seems to bereleased and transported by runoff water. Indeed about0.023 mg/l of As was measured in a rill running across
the tailings and which flows into the drainage patterndownward in the tailings.
5. Conclusions
The ability of Fe oxyhydroxides to strongly trap As iswell-known. At Enguiales, As (the most readily oxidisedspecies) and Fe are released from the primary ore and re-precipitated together with different mineralogical forms.
This Fe–As re-precipitation leads to the formation of Fecements at stages 2 and 3 in the tailings evolution. Theneo-formed materials have various Fe/As ratios and
different stabilities (ferrihydrite-type oxyhydroxide asamorphous Fe oxyhydroxide gel, poorly crystallisedarsenate or secondary minerals such as goethite, lepido-
crocite, hematite, jarosite). Both As and Fe concentra-tions in the amorphous products are high (�17.07 and22.98 wt.% respectively). However, this first stage in As
trapping leads to its progressive release followed by a re-precipitation with other Fe oxyhydroxides or Fe-SO4
minerals. These latter materials act as a quantitativelyweak mineralogical sink for As e.g. in goethite, As
�3.22 wt.% or in jarosite, As �5.7 wt.%.Under the acidic and oxidising on-site conditions, the
evolution from amorphous As-rich materials towards
As-poor and ordered structures implies a progressive Asrelease. In order to better understand why As is releasedas well as finding out its release kinetics, the way As istrapped by the different minerals or materials must be
confirmed by structural data (e.g. EXAFS), especiallyon the As-rich amorphous products. Ultimately Fecements appear to be only a poor sink for As because of
their progressive recrystallisation towards the more stablematerials which composed the red cements. Therefore, acomplete study of the hydrological system located
downhill from the Enguiales tailings will allow one toquantify the actual impact of As release in this system.
Acknowledgements
We wish to thank the PDZR program for financial
support. A special thank to Dr. J.M. Beny from theCRSCM-CNRS, ISTO/Orleans, for the Raman micro-spectroscopy analyses, Pr A. Meunier for the improve-
ment of an earlier version of the manuscript, MichelPeymirat for the sample preparation, Angela and Lisafor their improvements of English. Constructive reviews
and comments by K. Savage, M. La Force, J. Hermanand R. Fuge were gratefully appreciated.
References
Aitchison, J., 1986. The Statistical Analysis of Compositional
Data. Chapman & Hall.
Aitchison, J., 1999. Logratios and natural laws in composi-
tional data analysis. Math. Geol 31, 563–589.
Aitchison, J., Lauder, I.J., 1985. Kernel density estimation for
compositional data. Appl. Statist 34, 129–137.
Alpers, C.N, Nordstrom, D.K., Ball, W.B., 1989. Solubility of
jarosite solid solutions precipitated from acid mine waters,
Iron Mountain, California, U.S.A. Sci. Geol. Bull. 42, 281–
298.
Azcue, J., Muroch, A., Rosa, F., Hall, G., 1994. Effects of
abandoned gold mine tailings on the arsenic concentrations
in water and sediments of Jack of Clubs Lake, B.C. Environ.
Technol. 15, 669–678.
Bigham, J.M., Schwertmann, U., Carlson, L., Murad, E., 1990.
A poorly crystallized oxyhydroxysulfate of iron formed by
bacterial oxidation of Fe(II) in acid mine waters. Geochim.
Cosmochim. Acta 54, 2743–2758.
Cornell, R., Schwertmann, U., 1996. The Iron Oxides, Struc-
ture, Properties, Reactions, Occurence and Uses. VCH.
Derre, C., 1983. La Province a Sn-W ouest europeenne. His-
toire des divers Types de Gisements du Massif central, des
Pyrenees et du Portugal. Distribution des Gisements. These
de Doctorat, Univ. Paris VI.
Dunnwald, J., Otto, A., 1989. An investigation of phase tran-
sitions in rust layers using raman spectroscopy. Corrosion
Sci. 29, 1167–1176.
Foster, A.L., Brown Jr., G.E., Tingle, T.N., Parks, G.A., 1998.
Quantitative arsenic speciation in mine tailings using X-ray
absorption spectroscopy. Am. Mineral. 83, 553–568.
A. Courtin-Nomade et al. / Applied Geochemistry 18 (2003) 395–408 407
Goldberg, S., Johnston, C.T., 2001. Mechanisms of arsenic
adsorption on amorphous oxides evaluated using macroscopic
measurements, vibrationnal spectroscopy and surface com-
plexation modeling. J. Colloid Interface Sci. 234, 204–216.
Herbert, R.B., 1997. Properties of goethite and jarosite pre-
cipitated from acidic groundwater, Dalarna, Sweden. Clays
Clay Minerals 45, 261–273.
Hunt, L.E., Howard, A.G., 1994. Arsenic speciation and dis-
tribution in the Carnon Estuary following the acute dis-
charge of contaminated water from a disused mine. Marine
Poll. Bull 28, 33–38.
Jambor, J.L., 1994. Mineralogy of sulfide-rich tailings and their
oxidation products in the environmental geochemistry of
sulfide mine-wastes. In: Jambor, J.L., Blowes, D.W., (Eds.),
Short Course Handbook, Vol. 22, Waterloo, Ontario, May
1994, pp. 59–102.
Jambor, J.L., 1999. Nomenclature of the alunite supergroup.
Can. Mineral 37, 1323–1341.
Jambor, J.L., Dutrizac, J.E., 1998. Occurrence and constitution
of natural and synthetic ferrihydrite, a widespread iron oxy-
hydroxide. Chem. Rev. 7, 2549–2585.
Johnson, C.A., Thornton, I., 1987. Hydrological and chemical
factors controlling the concentrations of, Fe, Cu, Zn and As
in a river system contaminated by acid mine drainage. Water
Res. 21, 359–365.
Karathanasis, A.D., Thompson, Y.L., 1995. Mineralogy of
iron precipitates in a constructed acid mine drainage wet-
land. Soil Sci. Soc. Am. J. 59, 1773–1781.
Kosakevitch, A., 1981. Etude morphogenetique des Textures de
Remplacement et de Remplissage dans les Chapeaux de Fer.
Rapport BRGM.
Krause, E., Ettel, V.A., 1988. Solubility and stability of scor-
odite, FeAsO4.2H2O: new data and further discussion. Am.
Mineral 73, 850–854.
Manceau, A., 1995. The mechanism of anion adsorption on
iron oxides: evidence for the bonding of arsenate tetrahedra
on free Fe(O,OH)6 edges. Geochim. Cosmochim. Acta 95,
3647–3653.
Manning, B.A., Goldberg, S., 1997. Arsenic(III) and arsenic(V)
adsorption on three california soils. Soil Sci. 162, 886–895.
Manning, B.A., Fendorf, S.E., Goldberg, S., 1998. Surface
structures and stability of arsenic(III) on goethite: spectro-
scopic evidence for inner-sphere complexes. Environ. Sci.
Technol. 32, 2383–2388.
Myneni, S.C.B., Traina, S.J., Waychunas, G.A., Logan, T.J.,
1998. Experimental and theoretical vibrational spectroscopic
evaluation of arsenate coordination in aqueous solutions,
solids, and at mineral-water interfaces. Geochim. Cosmo-
chim. Acta 62, 3285–3300.
Nesbitt, H.W., Muir, I.J., Pratt, A.R., 1995. Oxidation of
arsenopyrite by air and air-saturated, distilled water, and
implications for mechanism of oxidation. Geochim. Cosmo-
chim. Acta 59, 1773–1786.
Nordstrom, D.K., Munoz, J.L., 1986. Geochemical Thermo-
dynamics: Blackwell Scientific, Palo Alto, CA.
Pierce, M., Moore, C., 1982. Adsorption of arsenite and arsenate
on amorphous iron hydroxide. Water Res. 16, 1247–1253.
Ramdhor, P., 1969. The Ore Minerals and Their Intergrowths.
Pergamon Press.
Richardson, S., Vaughan, D.J., 1989. Arsenopyrite: a spectro-
scopic investigation of altered surfaces. Mineral. Mag 53,
223–229.
Roussel, C., Bril, H., Fernandez, A., 1999. Evolution of sul-
phide-rich mine tailings and immobilization of As and Fe.
C.R. Acad. Sci. Paris Earth Planet. Sci. 329, 787–794.
Roussel, C., Bril, H., Fernandez, A., 2000. Involvement in
evaluation of environmental impact caused by mine wastes.
J. Environ. Qual 29, 182–188.
Sasaki, K., Tanaike, O., Konno, H., 1998. Distinction of jar-
osite-group compounds by raman spectroscopy. Can.
Mineral 36, 1225–1235.
Savage, K.S., Tingle, T.N., O’Day, P., Waychunas, G.A., Bird,
D.K., 2000. Arsenic speciation in pyrite and secondary
weathering phases, Mother Lode Gold District, Tuolumne
County, California. Appl. Geochem. 15, 1219–1244.
Scott, K.M., 1987. Solid solution in, and classification of, gos-
san-derived members of the alunite-jarosite family, northwest
Queensland, Australia. Am. Mineral 72, 178–187.
Serna, C.J., Parada Cortina, C., Garcia Ramos, J.V., 1986.
Infrared and Raman study of alunite-jarosite compounds.
Spectrochim. Acta 42A, 729–734.
Sornein, J.F., 1980. Alteration supergene de Mineralisations
ferriferes: Les Chapeaux de Fer du Gisement de Siderite de
Batere et du Gisement de Pyrite de Sain Bel. These Doct.
Ing. E.N.S.M., Paris.
Stahl, R.S., Fanning, D.S., James, B.R., 1993. Goethite and
jarosite precipitation from ferrous sulfate solutions. Soil Sci.
Soc. Am. 57, 280–282.
Sun, X., Doner, H.E., 1998. Adsorption and oxidation of
arsenite on goethite. Soil Sci. 163, 278–287.
Tsung-Hui, H., Shang-Lien, L., Cheng-Fang, L., Dar-Yuan,
L., 1994. Characterization of arsenate adsorption on hydrous
iron oxide using chemical and physical methods. Colloids
and Surfaces A: Physiochem. Eng. Aspects 85, 1–7.
Wand, M.P., Jones, M.C., 1995. Kernel Smoothing. Chapman
and Hall.
Waychunas, G.A., Davis, J.A., Fuller, C.C., 1995. Geometry of
sorbed arsenate on ferrihydrite and crystalline FeOOH: re-
evaluation of EXAFS results and topological factors in pre-
dicting sorbate geometry, and evidence for monodentate
complexes. Geochim. Cosmochim. Acta 59, 3655–3661.
Waychunas, G.A., Rea, B.A, Fuller, C.C., Davis, J.A., 1993.
Surface chemistry of ferrihydrite: part 1. EXAFS studies of
the geometry of coprecipitated and adsorbed arsenate. Geo-
chim. Cosmochim. Acta 57, 2251–2269.
Webster, J.G., Nordstrom, D.K., Smith, K.S., 1994. Transport
and natural attenuation of Cu, Zn, As, and Fe in the acid
mine drainage of Leviathan and Bryant Creeks. In: Alpers,
C.N., Blowes, D.W. (Eds), Environmental Geochemistry of
Sulfide Oxidation. Am. Chem. Soc. Symp. Series 550, pp.
244–260.
White, W.B., 1975. In: Karr, C. (Ed.), Infrared and Raman
Spectroscopy of Lunar and Terrestrial Minerals. Academic
Press, New York (Chapter 13).
408 A. Courtin-Nomade et al. / Applied Geochemistry 18 (2003) 395–408