Geology and mineral technologyk of the Grants uranium ...
400
,**-<* • £V Geology and mineral technology k of the Grants uranium region* 1979 ' S:>"v"i> I A N H . P s K H ~ v .\ Kfit*K\t ' Kf-:i:\< ».••' • IIK.INM' THf\ss;r '.ii.i • Ti-tui. 1 •."". LJLJ LJJ) Hi C.KOI.OlilC MAI 1 OK NOHTIUVKSTKHN NKW MK\H'<» ' A»Hli.\JKKI!tll s MKMOIR38 Ne\< Mexico Buredu of Mines & Mineral Resources 1980
-
Upload
khangminh22 -
Category
Documents
-
view
1 -
download
0
Transcript of Geology and mineral technologyk of the Grants uranium ...

,**-<* • £V
Geology and mineral technologyk
of the Grants uranium region* 1979
' S : > " v " i > I A N H . P s K H ~ v .\
Kfit*K\t ' Kf-:i:\< ».••' • IIK.INM' THf\ss;r'.ii.i • Ti-tui.
1 •."". LJLJ L J J ) Hi
C.KOI.OlilC MAI1 OK NOHTIUVKSTKHN NKW MK\H'<»
' A»Hli.\JKKI!tll s
MKMOIR38 Ne\< Mexico Buredu of Mines & Mineral Resources 1980

Memoir 38
New Mexico Bureau of Mines & Mineral Resources
A DIVISION OlNEW MEXICO INSTITUTE OH MINING & TICHNO1 OCA
Geology and mineral technologyof the Grants uranium region 1979
compiled by Christopher A. Rautmanin cooperation with 83 other coauthors
vS
inCO Q
UJ
A symposium on the Grants uranium region,held May 13-16, 1979,
in Albuquerque, New Mexico
,,-.:.•,,'3
SOCORRO 1980

NEW MEXICO INSTITUTE OF MINING & TECHNOLOGYKENNETH W. FORD, President
NEW MEXICO BU.1EAU OF MINES & MINERAL RESOURCESFRANK E. KOTTLOWSKI, Director
GEORGE S. AUSTIN, Deputy Director
BOARD OF REGENTSEx Officic
Bruce King, Governor of New MexicoLeonard DeLayo, Superintendent of Public Instruction
AppointedWilliam G. Abbott, Secretary-Treasurer, 1961-1985, Hobbs
Judy Floyd, President, 1977-1981, Las CrucesOwen Lopez, 1977-1983, Santa FeDave Rice, 1972-1983, Carlsbad
Steve Torres, 1967-1985, Socorro
BUREAU STAFF
Full Time
MARLA D. ADKINS, Assisfnnf EditorORIN J. ANDERSON, GeologistRUBEN AnniULETA, Technician IWILLIAM E. ARNOLD, Scientific IllustratorKOBERT A. BIEDERMAN, Senior Petrol. GeologistLYNN A. BUANDVOLD, ChemistCORALE BRIERLEY, Chemical MicrobiologistBRENDA R. BROADWELL, /Issue. Lab GeoscientistFRANK CAMPBELL, Coal GeologistRICHARD CHAMBERLIN, Economic GeologistCHARLES E. CIIAPIN, Senior GeologistJEANETTE CHAVEZ, Admin. Secretary IRICHARD R. CHAVEZ, Assistant Head, PetroleumRUBEN A. CRESPIN, Laboratory Technician IILois M. DEVLIN, Director, Bus.-Pub. OfficeKATHV C". 1IDI:N, Editorial TechnicianROBERT \V, EVELHTH, Alining EngineerROUSSEAU M. FLOWER, Sr. Emeritus PaleontologistSTEPHEN J. FROST, Coal GeologistJOHN W. HAWUIV, Environmental GeologistSTEPHEN C. HOOK, PaleontologistBRADLEV B. HOUSE, Scientific IllustratorMtLViN JENNINGS, MetallurgistROBEIIT W. KELLEV, Editor A GeologistSHI'RII " A. KRUKOWSKI, Record Manager\Vi-:ss ,\!AULDIN, Driller's HelperVinciiNiA MCLEMORE, Geologist
LVNNE MCNEIL, Staff Secretary\ORMA J. MEEKS, Department SecretaryARLEEN MONTOYA, Librarian/TypistSUE NESS, ReceptionistROBERT M. NORTH, MineralogistJOANNE C. OSBURN, GeologistGLENN R. OSBURS, VolcanologistLINDA PADILLA, Staff SecretaryJOAN C. PENDLETON, Associate EditorJUDY PERALTA, Executive SecretaryBARBARA R. POPP, Lab. Biotech itofogistROBERT QUICK, Driller's Helper/DrillerMARSHALL A. REITER, Senior Geop/iysicisiJACQUES R. RENAULT, Senior GeologistJAMES M. ROBERTSON, Alining GeologistGRETCHEN H. ROYBAL, Coal GeologistAMY SIIACKLETT, Asst. Lab BiotechnologistJACKIE H, SMITH, Laboratory Technician IVWILLIAM J. STONE, HydrogeoiogistSAMUEL THOMPSON III, Petroleum GeologistDEBRA VETTERMAN, DraftspcrsonCittADALUPE M. VIGIL, Department SecretaryJCIE A. WALTON, DrillerROBERT H. WEBER, Senior GeologistDONALD WOLREHG, Vertebrate PnfeonlologistMICHAEL W. WOOLDRIDCE, Scientific Illustrator
Part TimeCHRISTINA L. BALK, GeologistHOWARD B. NICKELSON, Coal Geologist
BEVERLY OHLINE, Neirsirrrter, Information Seri'tccsALLAN R. SANFORD, GeophysicistTHOMAS E. ZIMMERMAN, Chief Security Officer
BRUCE W. BAKERINDIRA BALKISSOONC'ERRY W . CLARKSON
Graduate StudentsROBERTA ECCLESTONTED ECGLESTONTHOMAS GIBSON
ADRIAN HUNTLAWRENCE NELSONWILLIAM WYMAN
Plus about 50 undergraduate assistants
First Printing, 1980
Example of suggested reference style
Lyford, F. P., Frenzel, P. F.» and Stone, W. J., 1980. Preliminary estimates of ef-fects of uranium-mine dewatering on water levels, San Juan Basin, in Geologyand technology of the Grants uranium region 1979, Christopher A. Rautman,compiler: New Mexico Bureau of Mines and Mineral Resources Mem. 38, p.320-333, 2 tables, 10 figs.
Memoir 38 abstract
The Grants Uranium Symposium was held May I?-I6, 1979, in Albuquerque,New Mexico. This volume contains 45 papers and expanded papers from the sym-posium, aJong with 4 abstracts of papers that were given at the symposium but notpresented for publication.
Published by Authority of State of New Mexico, NMSA 1953 Sec. 63-1-4Printed by University of New Mexico Printing Plant, December, 1980
Available from New Mexico Bureau of Mines & Mineral Resources, Socorro, NM 87801 Price$J8.00

PrefaceThe first "Symposium on the Geology of the Grants Uranium
Region" was held as a field conference sponsored by the Societyof Economic Geologists in 1961. One of the lasting results of thisconference was the 1963 publication of New Mexico Bureau ofMines and Mineral Resources Memoir 15, Geology and technol-ogy of the Grants uranium region, compiled by Vincent C.Kelley. Through the years since 1963, this volume has remainedan authoritative reference to the geology of this prolific mineralbelt in northwestern New Mexico.
Despite the continuing usefulness of Memoir 15, the tremen-dous development of the Grants mineral belt since 1963 hasresulted in an expansion both of ore reserves and of our knowl-edge of the deposits. By the mid-1970's, many people working inthe area felt that a revision of Memoir 15 was needed. Late in1977, a decision was made to convene a new conference and tosolicit papers from geologists working in the area. Three organi-zations agreed to act as cosponsors for the symposium: the NewMexico Bureau of Mines and Mineral Resources, the EnergyMinerals Division of the American Association of PetroleumGeologists (AAPG), and the Central New Mexico Section of theAmerican Institute of Mining, Metallurgical, and PetroleumEngineers (AIME).
The symposium was held in Albuquerque, New Mexico, onMay 13-16, 1979. Frank E. Kottlowski served as general chair-man of the conference, and A. E. (Gene) Saucier was field-tripchairman. 1 served as technical program chairman and memoircompiler. The response to the call for papers was extremely gra-tifying. Geologists from across the country rose to the occasion,and, despite full-time duties elsewhere, submitted literally dozensof papers. Contributing authors represented all facets of geologicendeavor: industry, government, academic institutions, and pri-vate individuals. The symposium attracted over 800 geologistsand other scientists, including representatives from six foreigncountries. Field trips run by Gene Saucier, William L. Cheno-weth, and Morris W. Green conducted an overflow crowd of 260geologists to parts of the mineral belt itself. Sondra Biggs and theconvention department of AAPG handled all logistical details ofthe symposium. Their expertise in these matters was 100 percentresponsible for the smooth progress of the symposium.
Forty-six papers were presented at the 1979 symposium. Thepresent volume comprises these papers plus an additional three.The papers cover the broad spectrum of Grants region geology,including discussions of exploration history and methods, indi-vidual deposits and regional phenomena, and petrographic inves-tigations and field studies. More peripheral but vitally relatedtopics such as severence taxes, ground-water hydrology, and ex-perimental studies also are included. Although no attempt hasbeen made to compile a total synthesis of knowledge in theGrants uranium region, we hope that this memoir may serve as areference work to the region for many years to come. The paperscontained herein are the results of investigations (some over
many years) by the individual authors or coauthors, who aresolely responsible for the conclusions and interpretationspresented. Consequently, controversial and even cor'licting con-clusions may be found within this memoir. Compiling and edit-ing such a diverse collection of manuscripts by authors withvastly differing experiences and opporiuuiiies for writing has notbeen an easy task. My intention throughout has been to assure adegree of uniformity in style and to ensure that the descriptiveportion of each paper is sufficiently well documented to supportthe interpretations offered. Readers of this memoir are urged toevaluate these papers in the light of their own experiences and touse the volume as a way station in the evolutionary process ofunderstanding the geology of this important contributor to theenergy future of the United States: the Grants mineral belt.
I wish to extend particular thanks to some of the many peoplewho made completion of this memoir possible. The authors, ofcourse, are the principal contributors to the success of thisvolume. Supported and encouraged by their managers and ad-ministrators, the authors collectively have prepared an outstand-ing group of papers in a relatively short time. Most authors alsoprovided camera-ready illustrations, and a few provided camera-ready tables. The many geologists who reviewed manuscript ver-sions of these papers prior to publication have been indispensiblein the timely completion of this volume. A few individualsdeserve special mention for their efforts. Gene Saucier providedthe final impetus that started the symposium and memoir processin motion. Frank Kottlowski placed the support of the New Mex-ico Bureau of Mines behind the symposium concept and assuredpublication of the resulting papers. Lloyd A. Carlson of theEnergy Minerals Division of AAPG and N. M. Naiknimbalkarof the Central New Mexico Section of AIME similarly committedtheir organizations in cosponsorship. Douglas G. Brookins,William L. Chenoweth, David C. Fitch, Joel S. Leventhal,William R. Moran, and John B. Squyres, in addition to FrankKottlowski and Gene Saucier, provided support throughout theprocess leading to publication. Candace L. Holts, formerAssociate Editor, and Kathy Eden, Editorial Technician, both ofthe New Mexico Bureau of Mines and Mineral Resources,handled the many editorial details involved in seeing the com-pleted manuscripts into print. Last, but certainly not least, I wish!o thank my wife, Jenny Rautman, for her continued supportand encouragement throughout the long and frequently difficulthours and days involved in compiling this volume.
Christopher A. RautmanProgram Chairman and Compilerformerly of Shell Development Co.,
Houston, TexasDenver presently with Amoco Minerals CompanyMay 31,1980 Denver, Colorado
Note added in proof—As Memoir 38 goes to press (late 1980), the domestic uranium industry appears to haveentered a temporary period of decline. The economic recession that began in 1979, the aftereffects of the ThreeMile Island reactor accident, governmental regulation, high tax rates, changing government policy, and inexpen-sive foreign supplies all have contributed to a declining demand for uranium and a slumping price foryellowcake. As a result, many operations have had to curtail activity—marginal mines have been closed,development projects have been stretched out, shelved, orcanceled. Exploration isat a low ebb. Several depositsdiscussed in this volume have been adversely affected by the depressed market conditions, and optimisticdescriptions of planned development may no longer be valid.
The need for secure supplies of energy will continue, however, if our industrialized society is to remain viable.Nuclear power has been and remains an environmentally benign source of cost-effective energy. Given a stableand reasonable political/economic climate, the nuclear industry will probably emerge from its current problemsand continue supplying secure energy to Americans. New Mexico and the Grants mineral belt undoubtedly willcontinue to play a leading role in this effort.
—C.A.R.
[New Mexico Bureau of Mines & Mineral Resources, Memoir 38,1980]

Contents
EXPLORATION IN GRANTS URANIUM REGION SINCE1963 by William L. Chenoweth and Harlen K. HolenAbstract 17Introduction 17Exploration from 1963 to 1979 17
Status in 1963 17The 1964-69 period 17The 1970-74 period 18The 1975-78 period 20Status in 1979 20
Summary 20References 21
GRANTS AND WORLD URANIUM by Robert J. WrightAbstract 22Introduction 22Grants and other uranium districts 22Other sandstone deposits 22
Argentina: Sierra Pintada 22Australia: Beverley 23France: Lodeve 23Gabon: Five deposits 23Niger: Arlette 29South Africa: The Karroo Supergroup 29
Basal type of sandstone deposits 30Japan 30Canada: Lassie Lake 30United States: Sherwood 31
Metamorphosed sandstone deposits 31Austria: Forstau 32Italy: Alps 32Zambia: Domes deposits 32
General observations on sandstone deposits 34Conclusions 35References 35
STRATIGRAPHIC IMPLICATIONS OF URANIUMDEPOSITS by Fred F. LangfordAbstract 36Introduction 36Stratigraphic features 36Unconformity deposits in Saskatchewan 36Genetic models 37Unconformity deposits in New Mexico 38References 39
EXPLORATION FOR URANIUM DEPOSITS, GRANTSMINERAL BELT by David C. FitchAbstract 40Introduction 40Regional geology 40Description of orebodies 42Mineral composition and alteration 42Age of ore formation 43Ore guides 43Origin of deposits 45Exploration 46
Methods 46Johnny M mine 47
Conclusions 50References 50
GEOCHRONOLOGIC STUDIES IN THE GRANTSMINERAL BELT by Douglas G. BrookinsAbstract 52Introduction 52
Radiometric age dating 52Uranium-lead studies 52Potassium-argon studies 53Rubidium-strontium studies 53Mineralization in Cretaceous rocks 55Laramide mineralization 56Posi-Laramide mineralization 56Summary 57References 57
DEPOSITION AND EARLY HYDROLOG1C EVOLUTIONOF WESTWATER CANYON WET ALLUVIAL-FANSYSTEM by William E. GallowayAbstract 59Introduction 59Westwater Canyon alluvial-fan system 59
Permeable framework facies 62Nonframework facies 65Facies distribution 65
Uranium mineralization 65Ground-water flow history 65Mineralization history 67Implications for exploration 68
References 68
DISCONFORMIT1ES IN GRANTS MINERAL BELT ANDTHEIR RELATIONSHIP TO URANIUM DEPOSITSby Morris W. GreenAbstract 70Introduction 70Lower Morrison disconformity 71Pre-Dakoiadisconformity 73References 74
ORGANIC GEOCHEMISTRY AND URANIUM IN GRANTSMINERAL BELT by Joel S. LevenihalAbstract 75Introduction 75Role of organic material in uranium deposits 75Characlerization of the organic material 77Experimental methods 79Results of pyrolysis-gas chromatography 79Results of carbon-isotope analyses 81Discussion 81Organic carbon and uranium data from Ambrosia Lake 82Summary and conclusions 83References 84
ORIGIN AND SIGNIFICANCE OF ORGANIC MATTER INURANIUM DEPOSITS OF MORRISON FORMATION,SAN JUAN BASIN, NEW MEXICO by John B. SquyresAbstract 86Introduction 86Location and geologic setting 86Ore deposits 87
Main morphologic features 87Subordinate morphologic features 88Mineralogy and zoning 89Age of the ore 90
Alteration 91Nature of the organic matter 92Evidence for humic origin of the organic matter 93
Analytical evidence 93Geologic evidence 93
Synthesis 93Conclusions and inferences 95References 96
[New Mexico Bureau of Mines & Mineral Resources, Memoir 38,1980]

EFFECTS OF GROUND-WATER FLOW ON THE ORIGINOF COLORADO PLATEAU-TYPE URANIUM DEPOSITSby Frank G. Ethridge, Nestor V. Ortiz, Harry C. Granger,James A. Ferentchak, and Daniel K. SunadaAbstract 98Introduction and objectives 98Previous work 99Analytical procedure 99
Description of physical model 99Fluid, media, and control systems 100Description of experiment 100Simulation of homoeeneous and heterogeneous
conditions 101Experiment results 103Summary and conclusions 105References 106
DISSOLUTION AND AUTHIGENESIS OF FELDSPARSby S. Ralph A ustinAbstract 107Introduction 107Feldspar dissolution 107Mechanism of shell formation 111Authigenesis 113Replacement versus supersedure 113Summary and conclusions 115References 115
TERTIARY OXIDATION IN WESTWATER CANYONMEMBER OF MORRISON FORMATION by A. E. SaucierAbstract 116Introduction 116Geology 116
Stratigraphy 116Distribution of oxidation in the Westwater
Canyon Member 116Structure 119Economic geolcgy 119R..d-bed problem 120Ternary ground-water flow patterns 120
Conclusions 121References 121
DEPOSITIONAL ENVIRONMENTS AS ORE CONTROLS INSALT WASH MEMBER, MORRISON FORMATION(UPPER JURASSIC), CARRIZO MOUNTAINS AREA,ARIZONA AND NEW MEXICO by A. Curtis Huffman, Jr.,Allan R. Kirk, andR. James CorkenAbstract 122Introduction 122Methods 122Lithologies 122Depositional environments 124Stratigraphic units 125Uranium 127Conclusions 128References 129
GEOLOGY OF PRE-DAKOTA URANIUM GEOCHEMICALCELL, SEC. 13, T. 16 N., R. 17 W., CHURCH ROCKAREA, McKlNLEY COUNTY by R. J. PetersonAbstract 131Introduction 131Regional geologic setting 131Geology and uranium mineralization, sec. 13 131Structure 132Westwater Canyon isopach 133Westwater Canyon sandstone/mudstone ratio 133Iron-redox maps 133
A-l iron-redox pattern, mineralization, and orecontrols 134
A-2, A-3, and B iron-redox patterns, mineralization, andore controls 134
C iron-redox pattern, mineralization, and ore controls 136History of mineralization 137Conclusions 138References 138
GEOLOGY OF CROWNPOINT SEC. 29 URANIUMDEPOSIT, Me KINLEY COUNTY by D. W. Wentworth,D. A. Porter, and H. N. JensenAbstract 139Introduction 139Exploration history 139Geologic setting 140
Stratigraphy 140Structure 141
Paleoslructural-depositional relationships 141Ore deposits 142Ore genesis 142Summary 143References 144
GEOLOGY OF EASTERN SMITH LAKE ORE TREND,GRANTS MINERAL BELT by Steven J. RistorcelliAbstract 145Introduction 145Stratigraphy 146Structure 148Mineralization 148
Lower sandstone unit 148Middle sandstone unit 150Upper sandstone unit 151
Petrography and alteration 151Discussion 152References 152
DEPOSITIONAL ENVIRONMENT OF BRUSHY BASINMEMBER, MORRISON FORMATION, IN GULFMARIANO LAKE MINE, Me KINLEY COUNTYby John T. Jenkins, Jr., and S. Blaze CunninghamAbstract 153Introduction 153Stratigraphy and structure 153Petrology 153Sedimentary facies 155Paleocurrenls 160Depositional environment 160Conclusions 160References 161
MINERALOGICAL VARIATIONS ACROSS MARIANOLAKE ROLL-TYPE URANIUM DEPOSIT, McKlNLEYCOUNTY by Suresh C. SachdevAbstract 162Introduction 162Samples 162Characteristics of the orebody 163Clay minerals 164
Montmorillonhe 164Chlorite 164Kaolinite 165Distribution of authigenic clays 165
Heavy minerals 166Iron-titanium oxides 166Pyrite 167Barite 167Uranium minerals 168Heavy minerals as guides to exploration 168
[New Mexico Bureau of Mines & Mineral Resources, Memoir38,1980]

VI
Interpretation and discussion 168Stage I 169Stage II 169Stage 111 170Stage IV 170
References 171
MINERALOGY AND GEOCHEMISTRY OF MARIANOLAKE URANIUM DEPOSIT, SMITH LAKE DISTRICTby Jeannie Place, Richard S. Delia Valle, andDougla* G. Brook inAbstract 172Local geology 172
Regional selling 172Morrison formation stratigraphy 173Structure 174
(.•oology oI ore deposits 174Primary oie 174Stacker; 174
Samples 17ftChemistry 176Mineralogy 17XInterpretation 182Ketereiia> 184
C.EOPHYSICA1 EXPERIMENTS AT MARIANO LAKEURANIUM OKI-BODY by D. T. ThompsonAbstract 185Introduction 185Surface SP measurements 185Surface-to-hole IP measurements 186Reflection-seismic techniques 188Summary and conclusions 193References 1<>4
URANIUM ORE ROLLS IN WESTWATER CANYONSANDSTONE, SAN JUAN BASIN, NEW MEXICOby Dean S. ClarkAbstract 195Introduction 195Location of area 195General background 195Exploration problems 197Nose Rock area 197
Stratigraphy 197Structure 197Orebodies 197
Conclusions 198References 201
HI- \vy-MINERAL CRITERIA FOR SUBSURFACEi K \S1UM EXPLORATION, SAN JUAN BASIN,NEW MEXICO by Douglas W. RhettAhMr;.cl 202inir vUietion 202Significance of heavy minerals 202Applicai 'on of roll-front concept to Nose Rock deposit 202The teduaum event 204Diagnostic heavy minerals 204Geochemieal /ones in roll-front system 205
Exterior /one 205Seepage zone 205Ore zone 205Interior zone 205
Field trial 205Summary and conclusions 207References 207
PETROLOGY OF WESTWATER CANYON MEMBER,MORRISON FORMATION, EAST CHACO CANYONDRILLING PROJECT, NEW MEXICO—COMPARISONWITH GRANTS MINERAL BELT by Randall T. Hicks,Robert M. Lowry, Richard S. Delia Valle, andDouglas G. BrookinsAbstract 208Introduction 208Geologic setting 208Radiometric character 209Original sediment 209Alteration of detrital grains 209Authigenic minerals 210Discussion 212Summary 213References 214
GEOLOGY AND RECOGNITION OF A RELICT URANIUMDEPOSIT IN SEC. 28, T. 14 N., R. 10 W., SOUTHWESTAMBROSIA LAKE AREA, McKINLEY COUNTYby D. A. Smith andR. J. PetersonAbstract 215Introduction 215Geologic setting 2i5Geology of sec. 28 uranium mineralization 216
Poison Canyon 10 iron-redox pattern 217Westwater Canyon D-C zone iron-redox pattern 218Westwater Canyon B zone iron-redox pattern 218Westwater Canyon A zone iron-redox pattern 218Westwater Canyon isopach 219Westwater Canyon sandstone/mudstone ratio 219
Ore controls 219Genesis of Sec. 28 relict uranium deposit 222Conclusions 223References 225
REDISTRIBUTED OREBODIES OF POISON CANYON,SEC. 18 AND 19, T. 13 N., R. 9 W., McKINLEY COUNTYby Timothy Neal TessendorfAbstract 226Introduction 226Stratigraphy 226Structure 226Environment of deposition 227Redistributed orebodies 227
Mineralization 227Radiometric disequilibrium 228
References 229
GEOLOGY AND ORE DEPOSITS OF JOHNNY M MINE,AMBROSIA LAKE DISTRICT by Stephen K. FalkowskiAbstract 230Introduction 230General geology 231
Stratigraphy 231Westwater Canyon Sandstone 231Poison Canyon sandstone 232Structure 233Sedimentary structures and features 233Paleochannel directions 234Environments of deposition of the Morrison
Formation 234Ore deposits 235
Westwater Canyon ore 235Poison Canyon ore 236Relation to stratigraphy, sedimentary features,
and structure 237Associated jordisite 237Ore controls 237Age of the ore 238
[New Mexico Bureau of Mines & Mineral Resources, Memoir38,1980]

Source of the uranium and associated ore elements 238Scenario of ore formation 238Conclusions 239References 239
AN ANOMALOUS OREBODY WITHIN THE AMBROSIALAKE TREND AT SANDSTONE MINE by John F. Fosterand Robert J. QuintanarAbstract 240Introduction 240Geology of altered sandstone 241Discussion 243
JACKPILE-PAGUATE DEPOSIT—A REVIEW by R. G. Beck,C. H. Cherrywell, D. F. Earnest, and W. C. FeirnAbstract 269Introduction 269Mining and milling 269Stratigraphy 270Igneous rocks 270Structure 270Jackpile sandstone 270Mineralization 271Discussion 272Conclusions 272References 275
SCANNING-ELECTRONMICROSCOPE INVESTIGATIONOF PARAGENESIS OF URANIUM DEPOSITS, MOUNTTAYLOR AND ELSEWHERE, GRANTS MINERAL BELTby Walter C. Riese, Douglas G. Brookins, andRichard S. Delia ValleAbstract 244Introduction 244
Regional geology 244Clay mineralogy 244Type samples 245
Clay-mineral distributions 246Discussion 251
Updip and outcrop samples 251Ore-zone samples 251Downdip samples 251
Conclusions 251References 251
GEOLOGY AND DEVELOPMENT OF MARQUEZ,NEW MEXICO, URANIUM DEPOSITby Bowman A. Livingston, Jr.Abstract 252Introduction 253General geology 253
Structure 253Jurassic stratigraphy 253
Westwater Canyon Sandstone petrography 254Uranium mineralization 255Physical and chem ical ore cont rols 255
Migration of uranium 255Precipitation of uranium 259
Alteration 259Accessory extrinsic elements 259Development of Marquez, New Mexico, project 260Summary and conclusions 260References 260
THE BERNABE MONTANO URANIUM DEPOSIT,SANDOVAL COUNTY by R. G. Kozusko andA. E. SaucierAbstract 262Introduction 262Geoloyic setting 263Stratigraphy 263
Morrison Formation 263Structure 264Economic geology 264
Exploration history 264Mineralization 265Ore geometry 267Host-rock characteristics 267Host-rock alteration 267Age and origin of mineralization 268
Summary and conclusions 268References 268
MAGNITUDE AND VARIABILITY OF DISEQUILIBRIUMIN SAN ANTONIO VALLEY URANIUM DEPOSIT,VALENCIA COUNTY by Stephen C. Moore andNorman G. LaveryAbstract 276Introduction 276Available data 276Method of disequilibrium analysis 278Average disequilibrium 278Chemical geology 278Horizontal variation in disequilibrium values—implications
for mine planning 282Conclusions and geological model 283References 283
SEDIMENTARY CONTROLS ON URANIUM ORE ATL-BAR DEPOSITS, LACUNA DISTRICT, NEW MEXICOby L. C. JacobsenAbstract 284Introduction 284General geology 284Jackpile sandstone 284Distribution of mineralization 286Carbonaceous material 289Discussion 291References 291
COMPARISON OF BRA1DED-STREAMDEPOSITIONAL ENVIRONMENT AND URANIUMDEPOSITS AT SAINT ANTHONY UNDERGROUNDMINE by Charles W. Baird, Kalvin W. Martin,and Robert M. LowryAbstract 292Introduction 292Stratigraphy 292Petrology of sandstone 294Nature of mineralized organic carbonaceous material 295Ceochemical observations 295Ore trends in underground mine 296Relationship between economic concentrations of ore and
braided-stream bedding configurations 296Conclusions 298References 298
GEOLOGY AND CHARACTERISTICS OF URANIUMMINERALIZATION IN THE MORRISON FORMATIONAT DENNISON-BUNN CLAIM, SANDOVALCOUNTY by Jennie L. RidgleyAbstract 299Introduction 299Stratigraphy and depositional environments 299
Westwater Canyon Member 299Structure 300
[New Mexico Bureau of Mines & Mineral Resources, Memoir 38,1980]

VIII
Uranium deposit 300Geometry and distribution of uranium 300
Mineralogy 302Origin of deposit 302Economic speculations 303References 303
URANIUM IN TOD1LTO LIMESTONE (JURASSIC) OFNEW MEXICO—EXAMPLE OF A SABKHA-LIKEDEPOSIT by Richard R. RawsonAbstract 304Introduction 304Sabkha model of mineralization 304Uranium emplacement in sabkha model 304Stratigraphy of Todilto Limestone 305
Limestone member 305Gypsum-anhydrite member 307
Uranium in the Todilto 308Genesis of Todilto uranium deposits 309Future prospects 311
San Juan Basin 311Other areas 311
References 311
EFFECTS OF URANIUM MINING ON GROUND WATER INAMBROSIA LAKE AREA, NEW MEXICO by T. E. Kelly,Regina L. Link, and Mark R. SchipperAbstraci 313Introduction 313Geology and aquifer characteristics of study area 313
San Rafael Group 314Morrison Formation 314Dakota Sandstone 315Mancos Shale 315Mesaverde Group 315Alluvium 315
Effects of mining on West water Canyon Member 315Water levels 315Mine discharge 316Water quality 318
Conclusions 318References 319
PRELIMINARY ESTIMATES OF EFFECTS OF URANIUM-MINE DEWATERING ON WATER LEVELS,SAN JUAN BASIN by Forest P. Lyford, Peter F. Frenzel,and William J. StoneAbstract 320Introduction 320
Purpose and scope 320Study area 320
Ground water in the Morrison Formation 320The model 322
Grid size and hydrologic properties 322Initial and boundary conditions 322Mode! confidence 328
Results and discussion 329References 332
URANIUM ROYALTIES AND SEVERANCE TAXES INTHE GRANTS REGION, WITH EXAMPLES OF THEIREFFECTS ON MINIMUM PRODUCIBLE GRADEby James W. MelvinAbstract 334Introduction 334Royalty agreements 334
State of New Mexico 335
Navajo Indian Tribe, 1968 335Laguna Indian Pueblo, 1970 335Navajo Indian Tribe, 1971 -72 335Navajo Indian Tribe, 1975 335Land company 1 335Land company II 335Land company III 336Private surface owner 336Solution mining 336Summary of royalty amounts 336
Severance taxes 336Effects on minimum producible grade 337Examples of effects on producible reserves 337Regional economic effects 339Conclusion 339References 339
URANIUM SOLUTION MINING—COMPARISON OF NEWMEXICO WITH SOUTH TEXAS by W. D. ConineAbstract 340Iniroduction 340Pilot-test objectives 340South Texas solution-mining operations 340In-situ leach process at O'Hern plant 341Observations and conclusions from south Texas
operations 342New Mexico solution-mining operations 342Permits and licenses 343
APPLICATION OF SOLUTION-MINERAL EQUILIBRIUMCHEMISTRY TO SOLUTION MINING OFURANIUM ORES by A. C. RieseandC. J. PoppAbstract 344Introduction 344Theoretical evaluation 344Geology 345Experimental procedures 345
General procedure 345Whole-rock and chemical analyses 345Mineralogy 345Leach columns 345Sample collection 345
Results and discussion 345Ore mineralogy 345Ground water 346Control-column leaching test 346Sulfuric-acid column leach 348Sodium-bicarbonate leach 349Potassium-chloride leach column 352
Summary 352References 353
APPLICATIONS OF COMPUTER MODELING TO THEGENESIS, EXPLORATION, AND IN-SITU MINING OFURANIUM AND VANADIUM DEPOSITS by DonaldD.Runnells, Ralph Lindberg, Steven L. Lueck, andGergely MarkosAbstract 355Introduction 355Principles involved in model 355Output of model 356Genesis of uranium deposits—South Plane River 358Hydrogeochemical exploration—known deposits 359In-situ leaching—Nine Mile Lake 362Conclusion 366References 366
[New Mexico Bureau of Mines & Mineral Resources, Memoir38,1980]

USE OF HELIUM IN URANIUM EXPLORATION, GRANTSDISTRICT by Richard H. DeVoto, Richard H. Mead,Joseph P. Martin, and Lyle E. BergquistAbstract 368Introduction 368Almospheric helium 360Soil-gas helium 369
Survey techniques 3(>9Survey data 370
Helium in ground water 371Conclusions 374Selected references 378
RADON EMANATION OVER AN OREBODY—SEARCHFOR LONG-DISTANCE TRANSPORT OF RADONby Robert L. Fleischer, Howard R. Hart, Jr., andAntonio Mogro-CamperoAbstract 380Introduction 380Radon transport 380Vertical-flow test 380Test site 381Techniques 381
Data consistency 382Near-surface experiments 382
Stable pattern 382Superimposed variations in radon 384Origin of increases 385Driving force 385
Effective in-situ permeability measurements 385Conclusions 388References 388
DIRECT MEASUREMENT OF URANIUM BY PROMPT-FISSION NEUTRON METHOD OF PULSED-NEL'TRONBOREHOLE LOGGING by Hugh M. Bivens, D. H. Jensen,Ralston W. Barnard, and William A. StephensonAbstract 390Introduction 390Theory of operation 390Logging-probe description 391Uphole instrumentation 393Logging procedure 393Log interpretation 393Results 394Commercialization 395References 395
GEOCHEM1CAL AND CLAY M1NERALOG1CAL STUDIES,GRANTS MINERAL BELT by Douglas G. BrookinsAbstract 396
MOUNT TAYLOR URANIUM DEPOSIT, SAN MATEO,NEW MEXICO by Walter C. Riese and Douglas C. BrookinsAbstract 397
THERMOLUMINESCENCE OF URANIUM HOST ROCKSIN AMBROSIA LAKE AREA by D. L. Hayslip, G. E, Fuller,P. W. Levy, andJ. R. RenaultAbstract 398
GEOCHEMICAL STUDIES OF GRANTS MINERAL BELTby Richard S. Delia Valle and Douglas G. BrookinsAbstract 399
TABLES
Chenoweth & HolenJ—Uranium production summary, 1950-1978 172—Uranium resources, January 1979 21
Fitch1—New Mexico uranium-ore production, reserves 40
BrookinsI—Rb-Sr data, Grants mineral belt 542—Rb-Sr data, Dakota Formation 553—Rb-Sr data, Maucos Formation 554—Rb-Sr data, oxidized ore deposit 56
Galloway1—Geologic history, Grants mineral belt 66
Leventhal1 —Elemental analyses, organic materials in sediments 782—Pyrolysis type, uranium content, carbon content, H/C ratio
for organic matter 793—Uranium, organic carbon, carbonate carbon, and isotopic
carbon data, Sec. 30 mine 804—Mine and sample suites 83
Ethridge, Ortiz, Granger, Ferentchak, & Sunada1—Properties of porous media 1012—Summary of experimental runs 102
Huffman, Kirk, & Corken1—Average values, stratigraphic units 1-111, Carrizo
Mountains 125
Jenkins & CunninghamI—Principal facies, Plane and Bijou Creek braided-stream
models 161
Place, Delia Valle, A Brookins1—Major chemical-components analysis, Poison Canyon
sandstone 1762—Trace chemical-components analysis, Poison Canyon
sandstone 1803—Distribution of clay minerals 182
Hicks, Lowy, Delia Valle, & Brookins1—Summary of petrography 210
Foster & Quintanar1—Uranium assays, track level near red sandstone 2412—Uranium assays, next to relict orebody within A-9
stope 2413—Uranium assays, A-10 track level 2414—Uranium assays, A-10 stope 2425—Petrographic and x-ray-diffraction analysis, A-10
stope 242
LivingstonI—Petrographic thin-section study, composite sample 2542—Modal analysis, sandstone host rock 2553—Analyses of composite samples, Marquez Canyon
orebody 260
Beck, Cherry-well, Earnest, & Feirn1 —Whole-rock analyses, core samples 2732—Whole-rock analyses, roll feature 274
[New Mexico Bureau of Mines & Mineral Resources, Memoir 38,1980]

Moore & Lavery1 —San Antonio Valley, core data 2772—Explanation of geochemical factors 278
Ridgley1—Uranium, equivalent uranium, and carbon values,
anomalous zone 301
Kelly, Link, & Schipper1 —Selected well measurements, Ambrosia Lake area 3162—Mine water discharge, Ambrosia Lake area 317
Lyford, Frenzel, & Stone1—Pumping periods and rates, 1952-2000 3262—Modeled water inflow and discharge changes,
1 *8O-2O00 327
Melvin1 —Numerical assumptions for exemplary-royalty
calculations 3352—Royalties per pound, recovered U,O,, 3363—New Mexico primary severance-tax schedule 3364—New Mexico uranium severance taxes 3375—Operating cutoff grades 3376—ORSACestimate of l^Q, content, deposit in Grants
uranium region 338
ConineI —Comparison of Crownpoint and south Texas ore zones 3422—Required permits and issuing agencies 343
Riese & Popp1—Mineral and clay analyses, Mariano Lake ore 3462—Whole-rock analysis, Mariano Lake 3473—Mine-water chemistry 3474—Effluent analyses, distilled-water column 3485—Solution composition, sulfuric-acid leach test 3506—Effluent analyses, bicarbonate column 3507—Changes, major ion concentrations, sodium-bicarbonate
leach test 3518—Effluent analyses, 1.0 m KC1 solution 353
Runnells, Lindberg, Lueck, & Markos1 —Uranium species added to WATEQF 3562—Vanadium species added to WATEQF 3573—Analysis of major surface-water components, South Platte
River 3574—Computed calcium-species distribution, South Platte
River 3585—Water saturation state, South Platte River 3586—Chemical composition, surface and alluvium waters, South
Platte River 3597—Speciation of dissolved uranium 3598—Uranium- and vanadium-mineral saturation state, South
Platte River 3609—Chemical analyses, leach-solution modeling 362
10—Computed distribution, vanadium and uranium aqueousspecies in leach fluids 364
11 —Computed saturation indices, selected minerals andcompounds, Nine Mile Lake 365
Fleischer, Hart, & Mogro-Campero1—Specific admittance of drill holes 3872—Effective permeability of drill holes 387
FIGURES
Chenoweth & Holen1—Uranium production 182—Index map of mines and deposits 193—Surface-drilling summary, 1964-1978 20
Wright1—Geologic map of Argentina showing uranium areas 232—Geologic map of Frome Embayment, South Australia,
showing uranium areas 243—Radiometric-cell area, Beverley uranium deposit, South
Australia 254—Vertical section, Beverley uranium deposit 255—Location map, Lodeve Basin, southern France 266—Index map, uranium deposits nearOklo, Gabon 267—Plan and vertical section, Mounana uranium deposit,
Gabon 278—Plan and vertical section, Boyindzi uranium deposit,
Gabon 279—Isopachs of the Cl bed, Oklo uranium deposit, Gabon 28
10—Grade x thickness of the Cl bed, Oklo uranium deposit 2811 —Oklo and Okelobondo uranium deposits 2812—Schematic vertical section, Mikouloungou uranium deposit,
Gabon 2813— Paleovalleys in the Arlit area, Gabon 2914—Schematic geologic section, Arlette uranium deposit,
Gabon 2915—Cross section, Asabatake Channel, Ningyotoge mine 3016—Cross section, Tsukiyoshi ore deposits, Tono mine 3117—Index geologic map. Lassie Lake area, southern British
Columbia 31
18—Plan of Forstau uranium deposit, Austria 3219—Uranium occurrences, Roan Supergroup, Zambia and
Zaire 3320—Isotopic ages, uranium mineraiiiation in lower Roan
rocks 34
Langford1 —Saskatchewan uranium mines and deposits 372—Uranium deposition model, based on Key Lake
deposit 373—Modified uranium deposition model 384—Section showing relationship of Permian formations to
Precambrian basement, northwest New Mexico 385—Bullard Peak area, Burro Mountains 39
Fitch401 —Map of New Mexico, Grants mineral belt
2—Grants mineral belt map 413—Geologic section, Morrison Formation 414—Ore deposits, Ambrosia Lake district, Morrison
Formation 425—Block diagram, prefault orebodies, Ambrosia Lake
district 436—Correlation of organic carbon with uranium content in
black ores 447—Mineral composition, black ores, Jackpile and Paguate
deposits 458—Correlation, ferric-iron content witii color of
mudstone 45
[New Mexico Bureau of Mines & Mineral Resources, Memoir 38,1980]

9—Truncation of uranium-bearing humate pod by sandstonescour. Ambrosia Lake district 45
10—Age of uranium mineralization, black ores 4611 —Typical geophysical log 4612—Drill map of sec. 7, T. 13N..R.8W. 4713—Drill map at time of discovery of uranium ore 4714—Drill map at time of completion of eighth drill hole 4815—Drill map at time of discovery of southeast orebody 4816—Drill map at time of discovery of south-central
orebody 4817—Final drill map, outline of orebodies 4818—Representative drill logs, sec. 7 4919—lsopach map, ore-bearing sandstone unit 4920—Drill map of fig. 19 area 50
BrookinsI—Rb-Sr isochron, Dakota Formation 552—Rb-Sr isochron, Mancos Shale 553—Rb-Sr data, oxidized uranium deposit 56
Galloway1 —Sandstone isolith map, Westwater Canyon fan system 602—Kosi River fan, India and Nepal, a) map view of fan and
braided-stream pattern; b) downfall decrease in streamgradient and grain size 61
3—Sedimentary and hydrologic features, Kern River wet fan,Great Valley, California, a) map view of present and formerchannel courses; b) fan cross section 62
4—Sedimentary features of proximal braided channel-fillsequences 63
5—Sedimentary features of straight bed-load channel fills 636—Representative transverse cross sections, Westwater Canyon
fan system 647—Sedimentary features of sinuous mixed-load channel
fills 648—Sedimentary features of distributary mixed-load channel
fills 659—Interpreted facies track from proximal to distal fan,
Westwater Canyon outcrop belt, San Juan Basin 6610—Transmissivity, Westwater Canyon aquifer 6711—Early evolution, Westwater Canyon aquifer, a) syndeposi-
tional flow under water-table conditions; b) burial by less-transmissive Brushy Basin fan deposit; c) pre-Dakotaerosion followed by swampy conditions above theunconformity 68
Green1—Index map, San Juan Basin, Grants mineral belt 702—Schematic cross section showing sedimentary rocks and
disconformities. Grants mineral belt 713—Schematic fence diagram, Triassic and Jurassic rocks, San
Juan Basin 714—Schematic cross section, offlap and erosional truncation,
Jurassic and older rocks, Zuni highland 715—Morrison Formation and overlying Dakota Sandstone,
Grants mineral belt 716—Erosional disconformity, Cow Springs Sandstone and
Westwater Canyon Member 717—Schematic cross section, depositional environments of
Jurassic rocks, Grants mineral belt 728—Basal conglomeratic sandstone, lower Morrison
disconformity, Thoreau 729—Fossilized bone fragments, lower Morrison disconformity,
Laguna 7210—Sandstone clasts, Westwater Canyon-Brushy Basin
sequence, Gallup 7311 —Zone of regolith, below lower Morrison disconformity,
Gallup 7312—Lower Morrison disconformity, Dos Lomas 73
13—Lower Morrison disconformity, Cafioncito 7314—Dakota Sandstone-Westwater Canyon erosional contact,
Gallup 7315—Schematic cross section, pre-Dakota truncation, ground-
water flow patterns, Grants mineral bell 7416—Black Diamond uranium mine 7417—Pre-Dakota erosion channel, Delter prospect, Gallup 74
Levenihal1—Cycle of organic matter, sandstone-type uranium
deposits 762—Schematic representation, organic matter in uranium-ore
formation 763—Chemical-structural model, humic acid 774—H/C vs. O/C (atomic ratios) 785—Pyrolysis-gas ehromaiography, organic matter 806—Vertical traverses, Sec. 30 mine 817—Scatter diagrams. Ambrosia Lake ores 828—Scatter diagrams, Ambrosia Lake ores 829—Covariant organic carbon-uranium suites, 1:1
relationships 8310—Covariant organic carbon-uranium suites, 1:1
relationships 84
Squires1—Index map of southern San Juan Basin 862—Plan and section views of Ann Lee orebody. Ambrosia Lake
district 873—Longitudinal view of main Ann Lee orebody 884—Cross-sectional view of main Ann Lee orebody 885—Small roll feature in ore, Ann Lee mine 886—Halo of ore on daysione cobble, San Mateo mine 887—Feathery jordisite above ore, Ann Lee mine 898—Jordisite lenses in ore, San Mateo mine 899—Haloof jordisite around silicified log, Ann Lee mine 89
10—Small jordisite roll, Ann Lee mine 9011 —Calcite shell at ore boundary, Ann Lee mine 9012—Actual and restored sections of collapse structure, Cliffside
mine 9013—Remnant of original red claystone, Sandstone mine 9114—Ion-exchange capacity of humic acids 9215—Diagrams illustrating leaching of humic acids and evolution
of ore pods 9416—Diagrams illustrating development of roll morphology 94
Ethridge, Ortiz, Granger, l-'erentchak. & SunudaI —Uranium mineral belts, Colorado Plateau and
Wyoming 982—Diagrammatic view of large porous-media flume 993—Diagrammatic view of small porous-media flume 1004—Diagrammatic view of small porous-media flume illustrating
simulation of permeability zones 1015—Diagrammatic view of small porous-media flume illustrating
location of baffles 1016—Diagrammatic view of smal1 porous-media flume illustrating
layered model 1017—Large porous-media flume, precipitation bands in
homogeneous Ottawa sand 1038—Close-up view, multiple precipitate bands resulting from
flow-rate variation 1039—Close-up view of area in large porous flume showing humic-
acid solution breakthrough 10310—Small porous-media flume showing humic-acid
deflection 10411 —Depositional pattern, lens c f less permeable material 10412—Depositional pattern, len< of more permeable material 10413—Cross section, precipitate in small porous-media
model 10414—Small porous-media model, effects of layers with different
permeabilities 105
[New Mexico Bureau of Mines & Mineral Resources, Memoir 38,1980]

15—Effect of baffle on shape and distribution of precipitateband 105
16—Small porous-media model, effects of densitydifferences 105
17—Small porous-media flume, effects of mudstone layers andlenses on shape and distribution of precipiate bands;2 parts 106
18—Diagrammatic cross section, rolls in sandstone layers, SaltWash Member, Cougar mine, San Miguel County,Colorado 106
Aust inI —Fractured surface of sandstone, sanidine shell 1072—Map of Grants uranium region, sample sites 1083—Thin section of sandstone, Rio de Oro drill core 1094—Thin section of sandstone, Sabre-Pinon hole 1095—Thin section of sandstone, Sabre-Pinon hole 1096—Fractured surface of sandstone, two sanidine shells 1107—Thin section of sandstone ! 108—Thin section, Rio de Oro core 1109—Exterior of sanidine shell 111
10—Interior of sanidine shell 11111—Columnar sanidine remnants, shell interior 11212—Thin section, Rio de Oro core 11213—Ore thin section, Black Jack core 11314—Ore thin section. Black Jack core 11315— Authigenic feldspar crystal, shell interior 11316—Skeich of thin section 11417—Ore thin seel ion, Rio de Oro core 11418—Ore thin section, Bukey mine 115
Saucier1—Index map. Grants uranium region, Morrison
Formation 1172—Westwater Canyon subaerial fan 1183—Distribution of Late Tertiary oxidation 119
Huffman, Kirk. & Cor ken1—Index maps, Carrizo Mountains area 1232—Isopach map, Sail Wash Member, Morrison
Formation 1243—Petrographie classification, Salt Wash Member 1244—Lithologies, Salt Wash Member 1255—T • mine measured section 1256—C JI relation diagram. Red Rock Valley 1267—Detailed measured sections, King Tut 1/Begay I mine,
Rattlesnake 5 Plot 7 mine 1278—Ternary diagrams, a) Carrizo Mountains; b) Carrizo
Mountains and Henry Mountains mineral belt 1289—Parameters defined by ternary diagrams 128
10—Sandstone/mudstone ratio vs. average sandstonethickness 129
11—Sandstone/mudstone ratio vs. number of alterations fromsandstone to mudstone 129
Peterson1—Location map, sec. 13, T. 16N..R. 17 W. 1322—Westwater Canyon alluvial fan, ground-water flow
directions 1333—Stratigraphic column, sec. 13, T. 16 N., R. 17 W. 1344—Structure map, sec. 13, T. I6N..R. 17 W. 1355—Isopach map, Westwater Canyon fluvial system 1356—Westwater Canyon sandstone/mudstone ratio map 1357—A-l zone iron-redox map 1358—A-2 zone iron-redox map 1369—A-3 zone iron-redox map 136
10—B zone iron-redox map 13611 —C zone iron-redox map 13612—North-south stratigraphic cross section 13713—Dakota Formation, Westwater Canyon Member 138
Wentworth, Porter, & Jensen1 —Index map, Grants mineral belt 1392—Electric log, ore zones, Westwater Canyon Member 1403—Structure map, Twowells sandstone 1414—Structure map, CP mudstone 1415—Isopach map, Westwater Canyon Member, sec. 29, T. 17 N.,
R. 12 W. 1426—Ore-zone map, sec. 29 1437—Diagrammatic cross section, ore zones, sec. 29 143
Ristorcelli1—Location map 1452—Stratigraphic section and electric log. Smith Lake 1463—East-west cross section, Smith Lake 1474—Structure and property map 1485—Norih-south cross section, east end Smith Lake 1496—North-south cross section, central part Smith Lake 1497—North-south cross section, west end Smith Lake 1508—Reduced rock morphology 1519—Assemblage from unoxidized sandstone 151
10—Assemblage from updip of roll front, oxidizedsandstone 152
Jenkins & CunninghamI —Location of Mariano Lake mineral district, sandstone
isopach, paleocurrent data 1542—Stratigraphy, log response, Brushy Basin structure
summary 1553—Structure at top of Brushy Basin and Mariano Lake orebody
outline; location of two cross sections 1564—Cross sections, perpendicular and parallel to dip of Brushy
Basin sandstones 157S—Grouped tabular crossbeds and scour surface 1586—Foresets, tabular crossbed 1587—Parallel-laminated facies 1598—Tabular-crossbedded facies 1599—Sand texture vs. uranium occurrence 160
SachdevI—Core-hole locations, Mariano orebody 1622—Cross section along line of drill holes in fig. 1 1633—Schematic diagram of lithology, gamma-ray log
response 1634—Photomicrograph, sandstone from far-reduced zone 1645—Photomicrogiaph, bentonitic material 1646—Photomicrograph, authigenic cellular montmorillonite 1647—Photomicrograph, cellular montmorillonite 1658—Photomicrograph, paragenetic relationships 1659—Pseudohexagonal books, kaolinite 165
10—Histogram, (Mg + Ca)/Na ratios 16611—Distribution of authigenic clays 16612—Photomicrograph, Fe-Ti oxide mineral grain 16713—Photomicrograph, authigenic TiO: crystals 16714—Distribution of Fe-Ti oxides and pyrite 16815—a) Photomicrographs, Fe-Ti oxides layer; b) baritecement;
c) clay gall; d) authigenic pyrite crystals 16916—(a) Thin section, abundant clay galls; b) autoradiograph,
thin section 17017—Diagram, sequence of events in formation of Mariano
orebody 171
Place, Delia Valle, & Brookins1 —Location map, Mariano Lake, Smith Lake district 1722—Stratigraphic section 1733—Cross section A-A ', Mariano Lake 1754—Wyoming-type roll deposit 1765—Sample locations, Mariano Lake mine 1776—Distribution, silica vs. uranium 1787—Distribution, calcium vs. uranium 1788—Distribution, total iron vs. uranium 178
[New Mexico Bureau of Mines & Mineral Resources, Memoir 38,1980]

9—Distribution, H,O + (CO:) vs. uranium 17810—Distribution, total iron and sulfur vs. uranium 17811—Distribution, vanadium vs. uranium 17912—Distribution, molybdenum vs. uranium 17913—Distribution, arsenic vs. uranium 17914—Distribution, zinc vs. uranium 17915—Partially altered pyrite cube 18116—Large needle of selenite 18117—Selenite needles 18118—Kaolinite books and stackings 18119—Rosette and edge-to-face chlorite 18120—Chlorite-rich sample, kaolinite books 18221—Mixed-layer chlorite-montmorillonite with quartz 18322—Edge-to-face chlorite 18323—Cellular montmorillonite 18324—Void-filling montmorillonite 18325—Kaolinite books and stackings being replaced by illite-
montmorillonite 18326—Authigenic K-feldspar 183
Thompson1—Idealized geochemical cell, roll-type uranium
deposits 1852—Observed SP data 1863—Second-degree regional SP data 1864—Second-degree residual SP data 1865—Surface conditions at survey location 1876—Geometry, surface-to-hole IP measurements 1877—Surface plotting points, dipole-dipole surface arruy 1888—Surface-to-hole normalized rhargeability data,
Hole No. 1086 1889—Surface-to-hole normalized chargeability data.
Hole No. 1110 18810—Surface-to-hole normalized chargeability data,
Hole No. 1133 18811—Locations of seismic lines relative to orebody 18912—Seismic reflection line C 19013—Seismic reflection line B 19114—Seismic structure map base of the Dakota 19215—Seismic Todilto-West water isopach map 193
Clark1—Index map, northwest New Mexico 1962—Geophysical log. Nose Rock area 1983—Drill-hole map, northwest sec. 31, T. 19N. .R. 11 W. 1994—Cross sections, sec. 31, T. 19N. .R. II W. 200
Rhett1 —Schematic cross section, major geochemical zones 2032—Authigenic heavy-mineral assemblages 2033—Drill-hole locations 2064—Cross section, Westwater Canyon Sandstone, traverse
no. I 206
Hicks, Lowy, Delia Valle, & Brookins1—Index map, East Chaco Canyon drill holes, undeveloped
uranium deposits 2082—Distribution of uranium mineralization 2093—Hollow feldspar grain 2104—Magnetite grain 2105—Photomicrographs: a) grain coatings, authigenic chlorite;
b) sample in fig. 5a; c) "close-spaced" rosette habit;d) chlorite rosettes, unidentified clay mineral 211
6—Photomicrographs: a) honeycomb habit, illite-montmorillonite and chlorite; b) higher magnification offig. 6a 212
7—Photomicrograph, authigenic feldspar 2128—Magnetite alteration 213
Smith & Peterson1—Location map. Sec. 28 uranium deposit 2162—General stratigraphic column, Jurassic-Cretaceous
stratigraphy within sec. 28 2173—Structure contour map 2184—lron-redox map, Westwater Canyon Sandstone, T. 14 N.,
R. 10W. 2195—North-south stratigraphic cross section 2206—Poison Canyon 10 zone iron-redox map 2207—Westwater Canyon D-C zone iron-redox map 2208—Westwater Canyon B zone iron-redox map 2219—Westwater Canyon A zone iron-redox map 221
10—Westwater Canyon isopach map, sec. 28 22111 —Westwater Canyon sandstone/mudstone ratio, sec. 28 22212—Isopach map, Westwater Canyon D-C zone 22313—Sandstone/mudstone ratio map, Westwater Canyon D-C
zone 22414—Idealized genetic model for relict uranium deposits 225
Tessendorf1—Poison Canyon orebodies 227
Falkowski1 —a) North-side orebodies; b) south-side orebodies 2302—Log from Johnny M mine 2313—East-west cross section, south-side orebody 2334—Rose diagrams, paleocurrent directions: a) Westwater
Canyon Sandstone; b) Poison Canyon sandstone 2355—East-west cross section, Westwater Canyon Sandstone
ore 236
Foster & QuintanarI —Plan view of A-level sandstone 2402—Red sandstone. No. 2-W track 2413—Schematic cross section, hematitic sandstone 2424—Sample location map, A-10 slope 243
Riese, Brookins, & Delia Valle1 —Index map, Grants mineral bell 2442—Cross section, Morrison stratigraphy, Mount Taylor
area 2453—Photomicrograph, kaolinite 2454—Photomicrograph, vermicular kaolinite 2455—Photomicrograph, chlorite in edge-to-face
arrangement 2456—Photomicrograph, chlorite rosettes 2467—Photomicrograph, montmorillonite 2468—Photomicrograph, illite-montmorillonite 2469—Photomicrograph, montmorillonite honeycomb 247
10—Photomicrograph, detrital grain mantled by authigenicchlorite 247
11—Closer view of fig. 10 24712—Photomicrograph, intergranular organic material 24713—Photomicrograph, illite-montmorillonite, chlorite-coated
detrital grain 24714—Photomicrograph, chlorite development 24715—Photomicrograph, kaolinite development 24816—Photomicrograph, montmorillonite development 24817—Photomicrograph, illite needles 24818—Photomicrograph, chlorite-illite 24819—Photomicrograph, chamosite(?) development 24820—Photomicrograph, authigenic high-Na feldspars 24821— Photomicrograph, authigenic high-K feldspars 24922—Photomicrograph, carbonate development 24923—Photomicrograph, framboida! pyrite development 24924—Photomicrograph, titanium oxides 24925—Photomicrograph, plant spores(?) 24926—Closer view of fig. 25 24927—Photomicrograph, coffinite 250
INew Mexico Bureau of Mines & Mineral Resources, Memoir 38,1980]

XIV
28—Photomicrograph, kaolinite development 25029—Photomicrograph, authigenic feldspars 25030—Photomicrograph, hematite nodules 25031—Photomicrograph, high-iron smectites 25032—Photomicrograph, montmorillonite altering to chlorite
rosettes 25033—Paragenetic sequence, mineral formation, sandstone-type
uranium ore deposits 251
Livingsion1—Tectonic map, Colorado Plateau 2522—Stratigraphic column, Morrison Formation, Marquez
Canyon 2533—Phoiomicrograph, micros!ructure of medial ore-zone host
rock 2544—Fence diagram, Marquez Canyon orebody 2565—Ore deposits, Juan Tafoya Grant 2576—Photomicrograph, coalings on quart? grains 2577—Photomicrograph, radioactive particle 2578—Isopach, southeast orebody, K, shale 258
Kozusko <& Saucier
1—Location map, Bernnbc Montano Gram and Laguna IndianReservation 262
2—Columnar sec!ion, Morrison Formation, Bernabe MontanoGram 263
.1—North-south stratigraphic cross section, Bernabe MontanoGram 264
4—Northwest-southeast structural section, Bernabe MontanoGrant 265
5—Drilling pattern at Bernabe, main mineral trends 2656—Illustration, ore-development block 2667—Comparison, uranium and carbon content 2668—Type log, Morrison members 267
Beck. Cheirywell, Earnest. & Feirn1—Location map, .lackpile-Paguateorebodies, core
samples 2692—Cross section A-A ', Jackpile-Paguale deposit 2713—Cross section B-B'', underground area 2714—Organic carbon vs. uranium, Jackpile-Paguatemine
area 2725—Graphs of whole-rock analytical data taken across roll
feature 2726—Phoiomicrograph, mineralized channel breccia zone 2141—Photomicrograph of sample from high-grade ore zone 2748—Photomicrograph of sample from ore zone of a core
hole 2749—Photomicrograph, altered feldspar grain, calcite 274
Moore & Lavery1—Location map, San Antonio Valley 2762—Location map, core holes 2773—Histogram of DF values, 33 intervals 2784—Mobility of uranium 2795—Radium migration 279fi—Depth-concentration plot, core hole H 2807—Depth-concentration plot, core hole M ?808—Depth-concentrat ion plot, core hole L 2819—Depth-concentration plot, core hole L 281
10—Disequilibrium-factor zones 28211—Histogram of DF values, zones I and III 28212—Histogram of DF values, zone II 283
Jacobsen1—Major uranium deposits, Jackpile sandstone, Laguna
district 2852—Tabular crossbedding in medium-grade ore 2863—Trough crossbedding marked by carbonaceous debris 286
4—Northwest-southeast cross section showing ore grade 2875—Cross section parallel to section shown in fig. 4 2876—Southwest-northeast cross section showing ore grade 2887—Areal extent of ore zones 2888—Individual orebodies 2899—Photographs of carbonaceous material; 4 parts 290
Baird, Martin, & Lowy1 —Location map, mine and surface excavations 2932—Location map, uranium production properties 2933—Willie P. orebody, section view 2944—Cross-straiificalion, underground vertical exposures 296
Ridgley1 —Location and Morrison Formation outcrop map 2992—Schematic diagram of uranium-bearing sandstone 3003—Schematic diagram and scintillometer readings, oxidized-
rock tongues 3014—Cross section relating orange sandstone, redox zone, and
uraniferous sandstone 302
RawsottI —Sabk ha model of m ineralizat ion 3042—Areal extent of Todilto Limestone 3053—Stratigraphic column of Todilto Limestone 3054—Bleached Entrada Sandstone near Grants 3055—Polished slab, platy zone 3066—Polished slabs, crinkly zone 3067—Algal mounds exposed during low lake level, Great Sail
Lake 3068—Mud-cracked layer from crinkly zone near Grants 3069—Polished slabs, massive zone 307
10—Formation of massive zone by solution collapse 30711 —Laminaied limestone and interbedded nodular gypsum 30812—Suggested model for formation of massive zone 30813—Uraninite-bearing sample and radiograph 30814—Uraninite-bearing sample from crinkly zone 30915—Uranium depositional model, Todilto Limestone 310
Kelly, Link, & SchipperI—Pre-Quaternary geology, Ambrosia Lake area 3132—Photograph of sandstone outcrops 3143—Geologic column. Ambrosia Lake area 3144—Predevelopment potentiometric contours, Westwater
Canyon Member 3155—Locations, water-producing mines, Westwater Canyon
Member 3166—Potentiometric contours, Westwater Canyon Member 3177—Stiff water-quality diagrams, Westwater Canyon Member
and Dakota Sandstone 3188—Stiff water-quality diagrams, Westwater Canyon Member
and Dakota Sandstone 3189—Trilinear diagram showing water-quality change with
time 319
Lyford. Frenzel, & Stone1—Location map 3212—Polentiomeiric surface, Morrison Formation 3233—Transmissivity and outcrop map, Morrison Formation 3244—Difference between Morrison potenliometric surface and
top of Morrison Formation 3255—Modeled discharge-theoretical discharge comparison 3266—Modeled 1980 drawdown, Weslwater Canyon Member 3287—Modeled 2000 drawdown, Weslwater Canyon Member 3298—Modeled 2000 drawdown, Westwater Canyon Member,
medium-level mining 3309—Modeled 2000 drawdown, Westwater Canyon Member,
high-level mining 33110—Cumulative discharge 332
[New Mexico Bureau of Mines & Mineral Resources, Memoir 38,1980]

Melvin1—Relationship of New Mexico uranium severance taxes to
U,O8 sale price 3372—Relationship of estimated U,0s content in deposit tocutofi"
grade 338
ConineI—Index map, south Texas uranium belt 3402—Flow diagram, in-situ leaching process 3413—Aerial view, solution-mining facility 3414—Ion-exchange and elution columns 3415—Precipitaton tanks 3426—Well field grid III 3427—Index map, Grants mineral belt 3428—Trailer-mounted pilot plant 3439—Well field (five-spot pattern) at Crownpoint site 343
Riese & Popp1—LogaK . /aM . vs. logaMjSl,>4 diagram 3472—Log aMl,: • /(a,H • ) : vs. log \ • /aH . diagram 3473—Log aN j . /aH . vs. log aHjSlO4 diagram 3484—Log a, a : . /a,H . , : vs. log all4S,(,4 diagram 3495—Log aK. /aH . vs. log aH4S,<>4 diagram 3496— Loga^,,. /a , , , vs. log aH4S,,)4 diagram 3497—Log aK • /a,, • vs. log H^M)i diagram 3518—Log aNll • /a , , . vs. log ?.M4Sl() diagram 3519—Area-solubility diagram, UO :-CO2-H :O system 352
10—Log a,^,. /aM • vs. log at,4?>l,,4 diagram 353
Runnells, Lindberg, Lueck, & MarkosI—Or; distribution, Location 1 3602—Uraninite saturation indices, Location 1 3613—Calcite saturation indices, Location 1 3614—Ore distribution. Location 2 3615—Uraninite saturation indices. Location 2 3616—Calcite saturation indices. Location 2 3617—Well locations. Nine Mile Lake 3628—Solution pH, Eh, and dissolved SQ, vs. time,
well OBI 3639—Solution concentrations, uranium and vanadium,
well OB-1 36310—Solution concentrations, iron and silica, well OB-1 363II—Solution pH, Eh, and dissolved SO4 vs. lime,
well OB-3 36312—Solution concentrations, uranium and vanadium,
well OB-3 36413—Solution concentrations, iron and silica, well OB-3 364
DeVoto, Mead, Martin, & Berquist1—Uranium-238 radioactive-decay series 3682—Diurnal helium-content variations, soil gas and
atmosphere 3693—Soil-gas helium-anomaly map, southern Powder River
Basin 3704—Soil-gas helium-anomaly map, southern Powder River
Basin 3705—Soil-helium grid survey 3716—Soil-gas helium, regional profiles 3727—Ground-water helium 3738—Ground-water How paths related to helium and uranium
content 3749—Uranium content, shallow ground water 375
10—Schematic stratigraphy. Cretaceous and Jurassic rocks.Grants district 376
11—Ground-water uranium and helium 37712—Cross section of uranium and helium content of ground
water. Grants district 378
Fleischer, Hart, & Xtogro-Campero1—Radon concentration rale vs. calculated depth 3802—Radon measurement sites 3813—Radon values, winter 1972-73 3814—Radon-monitoring cup 3825—Median readings on grid, fig. 2 3826—Time-variation readings on grid, fig. 2 3837—Median values of readings in fig. 6 3848—Time variation of high and low readings 3849—Track-production rates relative to median values 384
10—Precipitation variation, average temperature, and pressureper period 385
11 —Pressure vs. time calculations, model experiment 38612—Excess pressure and throughput vs. time, experiment using
hole GE-2 38613—Logarithmic display of effective permeabilities 38814—Logarithmic display of anomalously high permeability 388
Bivens, Jensen, Barnard, & Ste/inenson1—Time and energy histories, neutron irradiation of uranium-
barren formation 3912—Time and energy histories, neutron irradiation of uranium-
bearing formation 3913—PFN interrogation radius vs. porosity 3914—Block diagram of PFN probe 3925—TTA cross section 3926—Photograph of two TTA designs 3927—Photograph, PFN logging-demonstration truck and
van 3938—Comparison of PFN log and core assay 3949—Calculated effect on PFN signal by thin zones of uranium
mineralization 39510—Comparison of PFN log and core assay 395
[New Mexico Bureau of Mines & Mineral Resources, Memoir 38,1980]

17
EXPLORATION IN GRANTS URANIUM REGIONSINCE 1963
by William L. Chenoweth, U.S. Department of Energy, Grand Junction, Colorado SI502, andHarlen K. Holen, U.S. Department of Energy, Albuquerque, New Mexico 87110
AbstractThe Grants uranium region is the largest uranium area in the
United States. As of January 1, 1979, the region accounted for 40percent of the domestic uranium-ore production and contained53 percent of the domestic reserves in the $30 per pound forward-cost category. Since 1963, the region has expanded to the northand east, primarily through the efforts of exploration programsof major oil companies. Exploration has been influenced by theavailability of land rather than by the use of geologic models.During this period, nearly 65 million ft of surface drilling foruranium has been completed in the region. The average drillingdepths have increased from approximately 200 ft to over 1,600ft. The discovered reserves and the favorable geology for un-discovered potential resources are expected to maintain the posi-tion of the Grants uranium region as the nation's principalsource of uranium for years to come.
IntroductionThe Grants uranium region has been the source of more
uranium production than any other area in Ihe United Slates.During the period 1950-1978, underground and open-pit minesproduced 135,891 tons of uranium oxide (UiO«). This amountsto 40 percent of ihe total United Slates uranium-ore production.The majority of this production has come from bedded depositsin sandstones of the Morrison Formation with minor productionfrom the Todillo Limestone and Dakota Sandstone. A signit-icant amount of uranium also has been recovered from minewaters (table 1).
The early exploration history of the region is well documentedin the New Mexico Bureau of Mines and Mineral Resources1
Memoir 15 and elsewhere (Melancon, 1963; Hilpert, 1969), and itwill not be repeated here However, one erroneous statementcontinues to appear in the literature and should be corrected. Ac-cording lo a letter ihe Atomic Energy Commission (AEC) re-ceived from I.ouis Lothman in 1958, he did not find radioactivityin ihe cuttings of an oil well on Ambiosia dome; rather, he usedihe cuttings and logs to ascertain drilling depths to the MorrisonFormation. This wildcat project penetrated ore-bearing sand-stone in the Wesiwaier Canyon Member of the Morrison Forma-tion on the second hole drilled, and the initial Ambrosia Lakedeposii was discovered in April 1955.
u KNOW i.iixiMtNis— Publication of this report is authorizedby the U.S. Department of Energy, Grand Junction, Colorado,Office. This report is an outgrowth of the continuing liaison ofthe Department of Energy (DOE) and its predecessors, theEnergy Research and Development Administration (ERDA) andihc Atomic Energy Commission (AEC), with the uranium in-
TAB1.E 1—SUMMARY OK URANIUM PRODUCTION. 1950-1978, GRANTS
I R-XNIUM REGION.
Number ofFormation Properties
Morrison
Type o«Mines
Years ofProduction
ProductionTons U,O,
Todilto
DakotaMine waterBreccia pipe
Total
133
43
9
Underground, twolarge open pits
Underground andopen pit
Underground
Underground
1951 to present
1950 to present
1951 thru 19701963 to present1953 thru 1956
131.231
2.993
2461.3S4
67135.891
dustry in the Grants region. We owe special thanks to BetteLearned for compiling and assembling the statistical datapresented in this report.
Exploration from 1963 to 1979
Status in 1963When Memoir 15 was published in 1963, production was re-
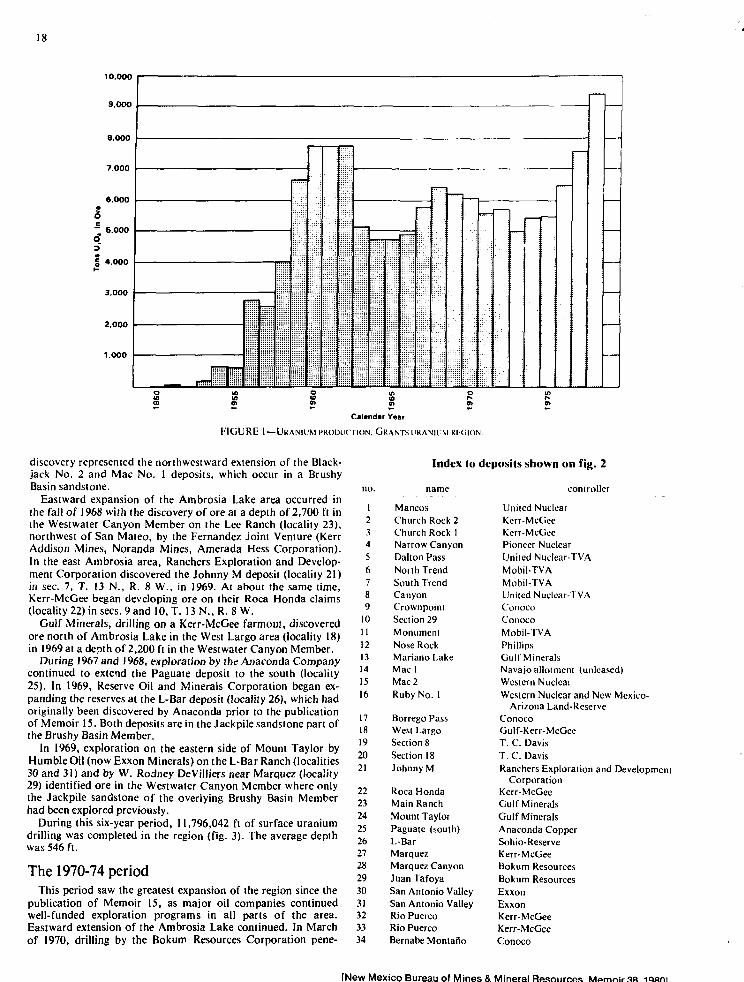
corded from 47 properties in the Grants uranium region. Theseproperties included 21 at Ambrosia Lake, 6 in the Poison Can-yon trend, 14 in the Todilto Limestone, and 2 each in the Black-jack, West Ranch, and Laguna areas. Production in 1963 was5,140 tons UjO», a sharp decline from an all-time high of 7,892tons in 1962 (fig. 1). Total production through 1963 was 46,451tons U,O», which represents 34 percent of the total domestic oreproduction to that date.
As calculated by the AEC in 1963, reserves were 80,000 tonsU,O,, amounting to 50 percent of the nation's reserves in the $8per pou.id U,O, forward-cost category. The AEC geologists esti-mated that potential resources of the region in 1963 were 110,000tons U.OB in the $8 per pound category.
Data compiled by the AEC indicates that approximately12,500,000 ft of surface drilling for uranium was done in theregion from 1951 through 1963. Surface drilling in 1963 was ap-proximately 300,000 ft with an average depth of about 200 ft.This drilling was done principally in the vicinity of the knownmines. Very little drilling was done above the rim of the GallupSandstone. An exception was the northeast Church Rock areawhere Sabre-Pinon Corporation (now United Nuclear Corpora-t on) was developing an orebody in the Westwater Canyon Mem-bet at an average depth of 1,600 ft.
The 1964-69 periodThis time period witnessed a slight expansion of the region to
the west, north, and east. In the summer of 1965, Kerr-McGeeobtained exploration permits for a block of Navajo tribal landadjacent to Sabre-Pinon Corporation's northeast Church Rockorebody. Drilling by Kerr-McGee discovered the Church Rock Iorebody (fig. 2, locality 3) in late 1965 and i he Church Rock IIorebody (locality 2) in 1968. West of the old Church Rock mine,United Nuclear Corporation discovered orebodies in sec. 7, T. 16N., R. 16 W., and in sec. 12, T. 16 N., R. 17 W. (locality 1) in1967. These discoveries were in an area where previous drillingby Phillips Petroleum had encountered mineralized material inwidely spaced drill holes.
Extensions of the Blackjack No. 2 ore trend occurred in 1967when Homestake-Sapin Partners discovered the Mac No. 1 de-posit (locality 14) to the northwest of that mine and the Mac No.2 deposit (locality 15) to the southeast. These deposits all occur ina sandstone bed in the lower part of the Brushy Basin Member ofthe Morrison Formation.
A slight westward expansion of the Ambrosia Lake area oc-curred in 1968 when W. Rodney DeVilliers discovered orebodiesin the Poison Canyon Sandstone in the Brushy Basin Member insees. 8 and 18, T. 14 N., R. 10 W. (localities 19 and 20). In thisarea, previous drilling had shown the Westwater Canyon to beoxidized and unfavorable; however, sandstones in the lower partof the Brushy Basin Member were unoxidized and found to con-tain ore.
In March of 1969, Gulf Mineral Resources announced the dis-covery of an orebody in the Mariano Lake area (locality 13). This
[New Mexico Bureau of Mines & Mineral Resources, Memoir 38,1980]
18
10.000
9,000
8.000
7.000
6.000
S.0006
q
g 4.000
3.000
2.000
1.000
Calendar Year
FIGURE I—URANIUM PRODUCTION. GRANTS URANIUM RKHON.
discovery represented the northwestward extension of the Black-jack No. 2 and Mac No. I deposits, which occur in a BrushyBasin sandstone.
Eastward expansion of the Ambrosia Lake area occurred inthe fall of 1968 with the discovery of ore at a depth of 2,700 ft inthe Westwater Canyon Member on the Lee Ranch (locality 23),northwest of San Mateo, by the Fernandez Joint Venture (KerrAddison Mines, Noranda Mines, Amerada Hess Corporation).In the east Ambrosia area, Ranchers Exploration and Develop-ment Corporation discovered the Johnny M deposit (locality 21)in sec. 7, T. 13 N., R. 8 W., in J969. At about the same time,Kerr-McGee began developing ore on their Roca Honda claims(locality 22) in sees. 9 and 10, T. 13 N., R. 8 W.
Gulf Minerals, drilling on a Kerr-McGee farmout, discoveredore north of Ambrosia Lake in the West Largo area (locality 18)in 1969 at a depth of 2,200 ft in the Westwater Canyon Member.
During 1967 and 1968, exploration by the Anaconda Companycontinued to extend the Paguate deposit to the south (locality25). In 1969, Reserve Oil and Minerals Corporation began ex-panding the reserves at the L-Bar deposit (locality 26), which hadoriginally been discovered by Anaconda prior to the publicationof Memoir 15. Both deposits are in the Jackpile sandstone part ofthe Brushy Basin Member.
In 1969, exploration on the eastern side of Mount Taylor byHumble Oil (now Exxon Minerals) on the L-Bar Ranch (localities30 and 31) and by W. Rodney DeVilliers near Marquez (locality29) identified ore in the Westwater Canyon Member where onlythe Jackpile sandstone of the overlying Brushy Basin Memberhad been explored previously.
During this six-year period, 11,796,042 ft of surface uraniumdrilling was completed in the region (fig. 3). The average depthwas 546 ft.
The 1970-74 periodThis period saw the greatest expansion of the region since the
publication of Memoir 15, as major oil companies continuedwell-funded exploration programs in all parts of the area.Eastward extension of the Ambrosia Lake continued. In Marchof 1970, drilling by the Bokum Resources Corporation pene-
Index (o deposits shown on fig. 2
no.
1
2
3
4
56
7
8
9
10
11
12
1314
1516
17
18
19
2021
22
23
24
25
2627
28
2930
3132
33
34
name
MancosChurch Rock 2Church Rock 1Narrow CanyonDalton PassNorth TrendSouth TrendCanyonCrownpoiniSection 29MonumentNose RockMariano LakeMaclMac 2Ruby No. 1
Borrego PassWest LargoSection 8Section 18JohnnyM
Roca HondaMain RanchMount TaylorPaguate (south)L-BarMarquezMarquez CanyonJuanTafoyaSan Antonio ValleySan Antonio ValleyRio PuercoRio PuercoBernabe Montafio
comroller
United NuclearKerr-McGeeKerr-McGeePioneer NuclearUnited Nuclear-TVAMobil-TVAMobil-TVAUnited Nuclear-TVAConocoConocoMobil-TVAPhillipsGulf MineralsNavajo allotment (unleased)Western NucleaiWestern Nuclear and New Mexico-
Arizona Land-ReserveConocoGulf-Kerr-McGeeT. C. DavisT. C. DavisRanchers Exploration and Development
CorporationKerr-McGeeGulf MineralsGulf MineralsAnaconda CopperSohio-ReserveKerr-McGeeBokum ResourcesBokum ResourcesExxonExxonKerr-McGeeKerr-McGeeConoco
[New Mexico Bureau of Mines & Mineral ResournpR

20
— 2 OOO
— - 1 600
— — 1 400
2 6
» 4
p
A.erage -+iD.pih /
1
m m 1
—
- --
. n
- —- ; - -=r- - - - - - - — - 6 0 0
FIGURE 3—Si.MMAm <>i sum A H I>RU I INC. [OK URANIUM. G R A N I S
I KANUMKK.ios. 1964-I978.
trated ore-grade intercepts at a depth of 4,000 ft on the flanks ofMount Taylor, southeast of San Mateo (locality 24). By early1971, Gulf Minerals had purchased (he Lee Ranch and MountTaylor orebodies to consolidate its holdings in the east Ambrosiaarea.
In the north Laguna area, Kerr-McGee made discoveries (lo-calities 32 and 33) in the Westwater Canyon in 1970. Owing to in-terest in the eastern portion of the region, the Pueblo of Lagunaheld a uranium-lease sale for unleased Laguna lands in 1970. Bydrilling on the Bernabe Moniafio Grant, which had been acquiredat the Laguna lease sale, Continental Oil encountered ore-gradematerial in the Westwater Canyon Member at a depth of 1,700 ftin late 1971 (locality 34). This deposit, with an average depth of1,500 ft, occurs in a highly faulted area and represents the easterneconomic limit of the Grants mineral belt.
Near the village of Marquez, where a discovery in the West-water had been made in 1969, both Bokum and Kerr-McGeemade discoveries in Marquez Canyon in 1974 (localities 27 and28).
In 1972, Western Nuclear announced the discovery of theRuby Wells deposit at a depth of about 300 ft in sec. 21, T. 15 N.,R. 13 W. (locality 16), southeast of the Blackjack No. 2 mine, inan area that had been overlooked by past exploration. Continuedexploration in this area by Western Nuclear, in partnership withthe New Mexico-Arizona Land Company and Reserve Oil andMinerals, delineated additional ore deposits in sees. 25, 26, and27, T. 15 N.,R. 13 W.
A Navajo uranium-lease sale held in April and May of 1971was significant; this sale initiated deeper exploration in the north-east Church Rock area and eastward into the Dalton Pass andCrownpoint areas. Between 1972 and 1974 discoveries were madeby United Nuclear (localities 5 and 8), Mobil Oil (localities 6, 7,and 11), Pioneer Nuclear (locality 4), and Continental Oil(localities 9 and 10), at depths of 2,000-2,500 ft.
In 1973, Phillips Petroleum began leasing Santa Fe Railroadlands in the Seven Lakes area where drilling depths to theWestwater Canyon Member were in excess of 3,000 ft. In August1974, drilling penetrated ore-grade material in sec. 31, T. 19 N.,R. II W., which then led to the discovery of the Nose Rockorebody (locality 12) announced in December 1975.
During the five-year period 1970-1974, surface drilling foruranium in the Grants uranium region totaled 18,980,954 ft, andthe average depth was 1,024 ft (fig. 3).
The 1975-78 periodThe 1975-78 period recorded some of the deepest drilling ever
done for uranium in the United States, mainly due to Phillips'discovery at Nose Rock. This discovery was significant because itchanged many of the existing ideas about the width of themineral belt. Also, the apparent northeast trend of the deposit isunlike any known in the Westwater Canyon Member in theregion.
East of Crownpoint, Continental Oil discovered an orebody insec. 18, T. 16 N., R. 10 W. (locality 17), in the Borrego Pass areain 1977.
During 1978, a 15-hole drilling program in the east ChacoCanyon area was carried out by the Grand Junction Office of theDepartment of Energy (DOE) in an effort to learn more aboutthe uranium favorability of the Westwater Canyon in the deeper,untested portions of the San Juan Basin. Two of the holes in theChaco Canyon area encountered significant mineralization in theWestwater at depths exceeding 4,000 ft (fig. 2). The limits of theregion now seem to be more economic than geologic.
During this four-year period, surface drilling for uranium bythe industry totaled 33,854,796 ft, with an average depth of 1,424ft (fig. 3).
Status in 1979Production in 1978 was 8,354 tons UjO,, an all-time yearly
high for the region (fig. 1). The 1978 production was recordedfrom 42 properties. These included 23 at Ambrosia Lake, 3 in thePoison Canyon trend, 5 in the Todilto Limestone, 3 in theChurch Rock area, 3 in the Blackjack area, 1 in the West Rancharea, and 4 in the Laguna area.
Discoveries in the Nose Rock area have encouraged deeper ex-ploration drilling throughout the entire southern San Juan Basin.In the Nose Rock and Crownpoint areas, development drilling ofthe known deposits continues. Near Crownpoint, explorationdrilling has shifted updip to the south of the delineated deposits.Although no discoveries have been formally announced, severalclosely spaced drill-hole patterns can be observed in this area.
The area between Crownpoint and Borrego Pass continues tobe actively explored. East of Borrego Pass and downdip fromAmbrosia Lake, exploration also is taking place as extensions aresought for the trends delineated at Crownpoint and BorregoPass. The availability of land that can be acquired for explora-tion is a factor in future exploration in the region.
New mines are being developed at Nose Rock (locality 12), eastAmbrosia Lake (locality 24), and in the north Laguna area (local-ities 28 and 32); and a solution-mining project is being con-structed near Crownpoint (between localities 6 and 7).
SummaryDuring the years since the publication of Memoir 15, the im-
pact of well-funded exploration programs has increased know-ledge of the region's resources. Records of the Grand JunctionDOE office indicate that 63,898 holes totaling 64,631,792 ft havebeen drilled in the area. Average drilling depths increased from212ftin 1964 to a record high of 1,651 ft in 1975 (fig. 3).
Exploration in the region has been influenced by the availabil-ity of land, rather than by the use of geologic models. The ap-plication of straightedge geology, or "trendology," has beenmore successful than has a roll-front model in locating ore-bodies, because most deposits occur farther downdip than theTertiary redox front, which is much younger than the primaryore deposits.
In the 1964-1978 period, the region produced 89,440 tonsUjO,, which was 45 percent of the national uranium-ore produc-tion during this period.
As of January 1, 1979, DOE has estimated the reserves of theregion as 374,000 tons V,OS, or 53 percent of the domesticreserves in the $30 forward-cost category. This figure is approx-imately 450 percent of the 1963 reserves.
[New Mexico Bureau of Mines & Mineral Resources, Memoir 38,1980]

21
How much more uranium remains to be found in the region isa matter of conjecture among geologists. Geologists of the GrandJunction Office of DOE have estimated a probable potential re-source of 400,000 tons U,O, and a possible potential resource of205,000 tons in the $30 forward-cost category (table 2). Thepotential resources estimated in 1963 would compare with theprobable potential class of current DOE nomenclature. Hence,there has been nearly a fourfold increase in the potentialresources of the southern San Juan Basin in the past 15 years.Additional information regarding resource estimates are given byDOE (1979a, b) in the Statistical Data of the Uranium Industryreport and in the National Uranium Resource Evaluation, In-terim Report.
These estimates are made without regard for land status or thetime frame for discovery. Political and environmental restraintswill make exploration more time-consuming and expensive; how-ever, the outlook for additional discoveries continues to be veryoptimistic, and the Grants region is expected to maintain its posi-tion as the nation's principal source of uranium for years tocome.
TABLE 2—URANIUM RESOURCES, JANUARY 1, 1979, GRANTS URANIUM
REGION.
ForwardCost
Category$30$50'
'Includes $30
Tons U,O,Potential
Reserves Probable374.000 400.000472.000 538.000
References
Possible205.000
275,000
Hilperi, L. S., 1969, Uranium resources of northwestern New Mexico:U.S. Geological Survey, Prof. Paper 603, 166 p.
Melancon, P. E., 1963, History of exploration, in Geology and technol-ogy of theGrants uranium region, V. C. Kelley, compiler: New MexicoBureau of Mines and Mineral Resources, Mem. 15, p. 3-5
U.S. Department of Energy, 1979a, Statistical data of the uranium indus-try, January 1, 1979: U.S. Department of Energy, GJO-100(79), 123 p.
, 1979b, National uranium resource evaluation, interim report:U.S. Department of Energy, GJO-111(79). 149 p., 5 pis.
[New Mexico Bissau of Mines & Mineral Resources, Memoir 38,1980]

22
GRANTS AND WORLD URANIUMby Robert J. Wright, U.S. Department of Energy, Division of Uranium Resources, Washington, D.C. 20545
AbstractThe Grants uranium region is the premier uranium mining dis-
trict of the world: the region has yielded the most uranium(113,400 metric tons UjO,), has the highest current rate of pro-duction (7,800 metric tons U,O, in 1978), and has the largestpublished reserves (430,000 tons UjOg at a forward cost up to $50per lb). Most of the ore in Grants is in sandstone, as it is in theother main uranium districts of the United States. The UnitedStates deposits of this type have provided a model for explora-tion around the world. Most of the foreign sandstone depositsillustrate the familiar relationship of uranium ore with plant mat-ter and fluvial channels. Some foreign deposits show the stronginfluence of structure. Others contain ore in black shaly faciesand in aeolian sandstone. Both acid volcanics and granites ap-pear to be likely sources of the uranium.
IntroductionJudged by the usual tests, Grants is the premier uranium min-
ing district of the world. This region has yielded the mosturanium, has the highest current rate of production, and has thelargest announced reserves. In the rest of the worid, only theAlligator Rivers area of Australia seems to have the possibility ofexceeding the Grams district in size.
To place ihe Grants district into a world perspective, this paperis divided into two sections: the first section includes relevantstatistics, and the second is largely geological. Ore in Grants, aswell as in the United States as a whole, comes mainly from de-posits in sandstone. The U.S. experience with this ore type hasbeen applied in every continent and has led to discoveries inmany countries. The second section describes some of the sand-stone deposits in other nations.
Grants and other uranium districtsIn traditional ten.is, (he measure of a mining district is the
value of its output. Through the first half of this century, a giantdistrict in the United States—like Butte or Bingham Canyon—was one that had produced more than a billion dollars of metals,as valued when the metals were sold. The giant districts of theUnited States could then be numbered on the fingers of twohands.
With expansion of uranium mining in the second half of thiscentury, a number of new names have been added io the list ofbillion-dollar districts, and Grants is number one among them.Through 1978, the production has been about 113,400 metrictons of UjO, in concentrate, representing about 44 percent ofUnited States and 20 percent of free-world totals. If given a valueof SlOperlb U,O,, the gross value is almost $3 billion.
The runners-up to the Grants district are Elliot Lake, Canada,with 100,000 metric tons U,O«, and Witwatersrand, SouthAfrica, with 98,000 metric tons UiO» total production. Only oneforeign nation—Canada—exceeds the State of New Mexico inuranium output to date.
In terms of current production, Grants is also number one with7,800 metric tons UjOg output during 1978. This amount was 46percent of United States and 19 percent of world output. TheWirwatersrand was second, with 4,500 metric tons in 1978, andTlliot Lake was third, with an estimated4,100 metric tons.
But what of the future? How does Grants stand in terms of yetunmined reserves? Caution is needed here because the definitionot reserves, the completeness of exploration, and the availabilityof public information vary among countries. In terms of what isavailable from published data, Grants is first with 430,000 metric
tons of reserves at a forward cost up to $50 per lb. The runner-upis the Alligator Rivers district of the Northern Territory, Aus-tralia, which is credited with 240,000 metric tons. However, mostgeologists who are familiar with this district believe that muchmore ore remains to be found through future exploration andpresent reserves may be understated. The reserves in the Wit-watersrand are said to be about 180,000 metric tons and in ElliotLake, about 120,000 metric tons.
The figures on other aspects of the industry are equally im-pressive. These are tallied on a state-by-state basis; data below isfor all of New Mexico, to which the Grants district is the chiefcontributor. The latest figures show that in New Mexico about5,260 persons are engaged in uranium mining, 1,020 in milling,and 1,070 in exploration. Collectively, they represent 43 percentof the uranium industry's work force in the United States.
About 21 percent of 1978 exploration effort in the UnitedStates was in New Mexico—9.9 million ft were drilled, comparedwith 47 million ft in the United States as a whole. The lower pro-portion of exploration activity, compared with mining and mill-ing, reflects the relative maturity of Grants as compared withsome of the districts in the rest of the nation.
Other sandstone depositsThe sandstone deposits in other parts of the world are similar
in many ways to those in the United States, but some deposits ex-hibit features that are different. In the following pages, whichcover deposits in eleven countries, the intent is not to present acomplete description of the occurrences but rather to highlightcertain unusual aspects. Deposits in six countries are first treatedin alphabetical order; then basal type deposits in two countries(and the United States) are discussed; and finally, sandstonedeposits in metamorphic rocks of three countries are considered.
Argentina: Sierra PintadaAmong the South American countries, Argentina is the most
advanced in the production of uranium, now at the level of about225 metric tons U,O, per year. The deposits are scattered widelythroughout western Argentina (fig. 1) and are of various geologictypes, but most of the reserves are in sandstone ores. The largestsandstone district is Sierra Pintada, state of Mendoza, which iscredited with 16,200 metric tons UjO8 in about a dozen deposits.Production started here in 1977, and it is expected to increase to540 metric tons UjO, per year in the early 1980's.
Western Argentina has many earmarks of a uranium province.Uranium is found in a variety of geologic settings. The graniticshield areas contain 6-10 ppm uranium, about double the normalerustal abundance. The sandstone deposits occur in basins con-taining sedimentary rocks of Carboniferous and Permian ageswithin the shield areas. Within such a basin, in the Sierra Pintadadistrict, is th,. ore-bearing Cochico Group of Permian age. It isoverlain unconformably by lower Tertiary tuffs and latites.
The Cochico Group is an unusual unit in which to find ura-nium ore. Above a basal, red, unmineralized conglomerate unitis the ore-bearing layer—a 90-m-thick, crossbedded, gray eoliansandstone containing polished quartz grains, feldspar, anddevitrified volcanic glass. No organic matter is present. The rockis believed to have been deposited by wind as an infilling of inter-montane bolsons.
The deposits are in the form of lenses averaging 9 m in thick-ness and 0.10-0.15 percent UjO,. Uraninite and autunite areassociated with minor pyrite.
Apart from the usual question—where did the uranium comefrom?—Sierra Pintada also poses a more difficult one: in theabsence of organic matter, what precipitated the uranium? The
[New Mexico Bureau of Mines & Mineral Resources, Memoir 38,1980]

23
PISANOGASTA
CHOS MALAL
C Cenozoic
Ms Mesozoic sediments
Ps Paleozoic sediments
I Igneous - UndHferentiated
Paleozoic through Cenozoic
Pc Precambrian
0 Major uranium areas
• Cities
F I G U R E J — Cl'OI.OIilC MAP ()!• AjUil-NHNA SHOWING MAJOR URANIUMARIAS (Anonymous, 1978, p. 130).
uranium is thought to have been introduced into the Permianrockyduring a period of extensive erosion at the beginning of theTertiary. At that time the exposed rocks included various radio-active units, especially Carboniferous volcanics. Uranium ions,released from these rocks by deep weathering, could have enteredinto surface waters and the ground-water system, penetrating theoutcropping sedimentary layers. The nature of the precipitant,however, remains a mystery. Argentinian geologists do notspeculate. One U.S. geologist suggests that H2S may have beenreleased into the rocks during Tertiary volcanic activity.
Australia: BeverleyThe Beverley discovery in the state of south Australia is a good
example of two-stage exploration guided by identifying uranium-bearing rocks that might provide a source and by drilling nearbyfavorable rocks that could contain ore. At Beverley the approachhas been successful: about 15,300 metric tons UjO,, at a grade of0.26 percent, have been delineated 100 m below surface.
In the north-trending Flinders Ranges (fig. 2) small uraninitebreccia bodies were drilled out between 1968 and 1971 in Precam-brian crystalline rocks near Mount Painter. The average grade is0.1 percent U>OB. East of the Flinders Ranges is the Frome Em-bayment, a lobe of a large, shallow, sedimentary basin. LakeFrome is indicated on some maps as a large body of water, but
many maps also carry the notation "generally dry saltpan."Lake Frome is a dry area of interior drainage. At Beverley, thesedimentary section is about 400 m thick, consisting of marineCretaceous rocks overlain by flat-lying Miocene terrestrialsediments.
Following the hypothesis that erosion of mineralized brecciasin the Flinders Ranges may have contributed uranium to theFrome sediments, drilling was started in 1969 on the west bide ofthe basin at the foot of the mountains. The drilling was unsuc-cessful until exploration extended 16 km east of the base of themountains and detected a subsurface zone of 20 sq km with ab-normal radioactivity—a radiometric cell (fig. 3). A system ofsand lenses containing uranium was traced over a north-southdistance of 3 km, with a width of 900 m at the north end and 90m at the south end. The orebody consists of a set of contiguoussands enclosed above and below by fine-grained, unconsolidated,argillaceous sediments (fig. 4). The sands range from about 1 to18 m in thickness. The uranium occurs as fine-grained uraninite.The Beverley deposit is unusual, because it has sandstone ura-nium ore in a geologic section without acidic volcanic rocks.
France: LodeveIn southern France, an underground mine (now under develop-
ment) has a close historical link with the western United States.About 20 years ago, the director of raw materials of the FrenchCommissariat a L'Energie Alomique (CEA), having just re-turned from a visit to our uranium districts, was driving throughsouthern France with the chief geologist. En route to a project inthe Alps he commented, "This looks like Colorado; let's explorehere."
The analogy to the western United States was good, for theywere passing through rhc Lodeve Basin, a small structure withPermian continental rocks (fig. 5). The subsequent geochemicaland radiometric surveys identified a stratiform regional anomalyof uranium and molybdenum. Drilling then disclosed a reserve of31,500 metric tons U,O,. Extraction, however, has presentedsome problems: pitchblende is located in several beds of blackshale less than 1.5 m thick; faulting is a problem; and the highcarbon content of the shale (1-10 percent) inhibits mill recovery.Nevertheless, an underground mine is now being prepared forproduction.
The Permian sequence rests on Precambrian basement rocksand dips 20°S. Upon the Lower Permian arkosic rocks is a se-quence of beds representing cyclic lacustrine and fluvial deposi-tion (Herbosch, 1974). The lowest bed in <••• ii series carries theuranium; it comprises 1-1.5 m of finely la. i nated dolomite andbituminous shale deposited under lacustrine conditions. Upward,this unit gives way to as much as 30 m of claystone and siltstone,representing floodplain deposition, with some channel sands.The uppermost layer of the cyclothem is a thin channel sand-stone.
Included within the sequence are some silicified beds that giveevidence of volcanic origin and that may have been the source ofthe uranium. A shale bed typically carries ore where it is ter-minated updip by faulting, and as many as five beds may bemineralized at a single locality. Thus, uranium distribution iscontrolled by both lithology and structure. Pitchblende is asso-ciated with sulfides, chiefly pyrite, in stratiform accumulationsin the clay layers and in bituminous veins in fractures. Chemicalstudies and microscopic examination show that the unmineral-ized organic material is at a diagenetic stage comparable to oildiagenesis. The uraniferous organic matter, on the other hand, isat a more mature (gas diagenesis) stage and is very similar to thatin the Oklo (Gabon) uranium deposit of Proterozoic age.
In a sense, Lodeve might be considered outside the boundaryof sandstone deposits because the host rock is black shale.
Gabon: Five depositsThe uranium production of Gabon is from sedimentary rocks
containing deposits that have been variously described as sand-
[New Mexico Bureau of Mines & Mineral Resources, Memoir 38,1980]

Mt. Painter
L.
<£|everley /prospect
. i* FROME
}T e r t i a r y J High (ewet plains
Boresisee crosssecllon)*
Faults
Thrust tautt
j PrecambrionProferozo ic
FJGURIi 2—GEOLOGIC MAP OF FROME EMBAYMENT. SOUTH AUSTRALIA, SHOWING URANIUM OCCURRENCES(Callen, 1975, fig. 1).

25
DRILL HOLESBEVERLEV DEPOSITRADIOMETRIC CELL
FIGURE 3—RADioMbrRic-fELi AREA, BEVERLEYIRANIUM DEPOSIT. SOUTH AUSTRALIA (Haynes, 1975, fig. 2).
Stllon *9000N
SEA LEVEL
VERTICAL SCALE
HORIZONTAL SCALE
LEGEND
E 3 SANDS & GRAVELS
SANDS, SILTS & CLAYS
CARBONACEOUS MUDSTONE
MINERALISED ZONE
FIGURE 4—VERTICAL SECTION OF 3EVERLEY URANIUM DEPOSIT. SOUTH AUSTRALIA (Haynes, 1975, fig. 4).
[New Mexico Bureau of Mines & Mineral Resources, Memoir 38,1980]

26
AUDE
I ] POST-MERCYNIAN ROCKS ! ' • ' . * • ! GRANITOIDS
PRE-HEHCVNIAN ROCKS ^ H H PERMIAN ROCKS0 10 20 X 40 SO Km
FIGURK 5 — LOCAIION MAI' SHOWINI,(Herbosdi, 1974, fig. I).
Louf-.vi-. BASIN, sou.THt.kN FRANCE
stone deposits, veins, and unconformity-related deposits. Theconfusion arises naturally, because features of all three ore typesare represented to varying degrees in the five major depositsdiscovered to date.
The deposits are unique in two ways: they are in the oldestsedimentary roiks (1,740 m.y.) known to contain sandstone-typedeposits; and one deposit, Oklo, has achieved world renown ascontaining at least two, and perhaps as many as six, naturalnuclear reactors that operated about 1,700 m.y. ago (fig. 6).
All the work in Gabon has been undertaken by the FrenchCEA. Over the years, the drilling tactics have undergone a seriesof changes—a good example of the need for flexibility in ex-ploration thinking as new facts are disclosed by successive ef-forts.
Mounana was discovered in 1956 as a result of radiometric re-connaissance. The ore is contained in a particular sandstone bedbut is concentrated along faults, and the best ore is in breccia(fig. 7). The importance of structural control is illustrated by thefact that the favorable sandstone bed away from the faults car-ries low-grade mineralization but no ore. Structural control isalso suggested by the geometry of the deposit: 60 m long, 40 mwide, and 120 m in vertical dimension. The deposit was minedfrom 1971 to 1975 and produced 6,600 metric tons U,O. at anaverage grade of 0.5 percent.
Following the discovery of Mounana, drilling was done to thenorth following the ore-bearing fault system. A blind orebody,Boyindzi, was discovered in 1966 at a depth of 120 m (fig. 8).Here, too, structure is the main ore control. The orebody is 200m long, 60 m wide, and has a vertical dimension of 30 m. It isestimated to contain about 3,600 metric tons U>O, at an averageore grade o{ 0.4 percent. A shaft was expected to intersect the orein 1979.
Oklo was discovered in 1968. It is clearly a stratabound de-posit, concentrated in a beach sand facies between coarser con-tinental sandstones on the west and finer sandstones and shales ina sedimentary basin toward the east. The dips are 15°-40°E.
The isopachs of the ore-bearing Cl bed (fig. 9) indicate twochannelways that trend north, diverging to form a sort of V
SANDSTONE & CONGLOMERATE
FIGURE 6—INDKX MAP OI- URANIUM DEPOSITS NLAR OKIO. GABON(Diouly-OssoandChauvet, 1977, fig. 4).
shape. The orebody (fig. 10) is related to the channelways andalso has a V shape, nested within the larger V of the thicker Clbed. Although sedimentation features are the main control ofmineralization, structure is still important because the ore isricher where the formation is structurally disturbed. The orebodymeasures 9C0 m north-south, 600 m east-west, and has an aver-age thickness of 6 to ii m. Oklo, the only present producer inGabon, is estimate^ to contain about 19,000 metric tons U,O«.
Noting that at Oklo the uranium tended to be found in abeach-sand facies and picturing a sedimentary source to thesouth (on the basis of crossbedding analysis that showed currentdirections), the geologists placed east-west fences of holes southof Oklo to trace the favorable sand. The first drilling, on widecenters, found continental-type coarse facies to the west and fine-grained basinal facies to the east. After reducing the spacing be-tween holes, the favorable shore facies was discovered. The blindOkelobondo deposit was found in 1973 (fig. 11; note the dif-ference in orientation between this figure and figs. 9 and 10). Ata depth of 450 m, this strataboind deposit (like Oklo) consists ofa group of lenses in a belt 1.5 km long and 500-600 m wide. Thedeposit is estimated to contain at least 5,000 metric tons U,O8,and it will be exploited in the future. Meanwhile, explorationcontinues on to the south at drill depths up to 1,000 m.
About 40 km to the southeast, in a similar geologic setting, theMikouloungou deposit shows another interesting combination ofstratigraphic and structural control (fig. 12). Along an east-trending fault, flat-lying sandstones are in contact with steeplydipping shale. The mineralization is of two types: 1) a zone ofvariable thickness, up to 4 m thick, with mineralization along thefault independent of the lithology, and 2) stratiform mineraliza-tion that extends 5-20 m away from the fault along beds of coarseto medium sandstones.
Perhaps more clearly than any other group of deposits, theGabon orebodies demonstrate a complete range from mainly
[New Mexico Bureau of Mines & Mineral Resources, Memoir 38,1980]

27
(A) , PELITEs/ FBI (B)
ESIMINERAI
VERTICAL SECTION A-B SCALE 1/750PLAN SCALE: 1/3 000
FIGURE 7—PLAN ANO VERTICAL SECTION A—Boi MOUNANA I'KANIUM DH'OSII. GABON; amas—deposit, faille—fault, gres—sandstone,pelites—shales, socle—basement (Pfiffelmann, 1975, fig. 3).
HE
400
—300
_ 2 0 0
VERTICAL SECTION SCALE: 1/1/875 PLAN SCALE: 1/1/875
FIGURE 8—PLAN AND VERTICAL SECTION OH BOYINDZI URANIUM DEPOSIT. GABON; amas—deposit, faille—fault,gres—sandstone, pelites—shales, socle—basement (Pfiffelmann, 1975, fig. 4).
[New Mexico Bureau of Mines & Mineral Resources, Memoir 38,1980]

28
FIGURE 9—Isoi'AfHs 01 IMI- Cl BID. O K I O I.RANIUM DEPOSIT, GABON(bed thickness in meters); arrows indicate direction of sedimentation(Chauvet, 1975, fig. II) .
I
FIGURE 11—OKLO AND OKI-IOBONUOLRANIUM ubi'osrrs. GABON, show-ing post-mineral dolerite dike cutting the Oklo deposit; orientation dif-fers from figs. 9 and 10(Diouly-Ossoand Chauvet, 1977, fig. 13).
ZOflEOOWIIE U S t E SIK LE P M t WTCrtELTfi x PUISSJnCE t>E ( 1
FA
I Mtrwrohiancn
Coup* schtnuliqu* au 1/1 875
FIGURE 10—GRADE X THICKNESS OF THE Cl BED, OKLO URANIUM FIGURE 12—SCHEMATIC VERTICAL SECTION ot MIKOULOUNGOU URANIUMDEPOSIT, GABON; a southeast-trending, post-mineral dolerite dike is DEPOSIT. GABON; faille—fault, pelites grises a verts—gray to greenshown (Chauvet, 1975, fig. 10). shales, sondage—drill hole (Pfiffelmann, 1975, fig. 6).
[New Mexico Bureau of Mines & Mineral Resources, Memoir 38,1960]

29
sedimentary control (Oklo) to sedimentary/structural control(Mikouloungou) and to dominantly structural control(Mounana).
Niger: ArletteOne of the great uranium provinces of the world is in northern
Niger. Here the deposits are entirely of the sandstone type andrank second only to those of the United Slates in reserves of thisore type. The United Stales sandstone model played an importantrole in the identification of this favorable area and in its explora-tion.
In 1955 the French CEA selected a geologically favorable area(based on the United States model) and began preliminary workUranium was discovered in 1957 and large-scale systematic ex-ploration began two years later. During succeeding 'ears theexploration successes attracted a wide range of international in-terests. A recent tabulation of permits and leases showed hold-ings by groups from seven nations, in addition to the governmentof Niger.
Three large deposits have been discovered and delineated formining: Arlette, Akouta, and Imouraren. These deposits arelocated at different stratigraphic levels in Carboniferous, Per-mian, and Triassic rocks. Arlette is credited with 27,000 men •tons U,O, at an average grade of 0.25 percent, 30-40 m belowsurface. It came into production as an open-pit operation in 1971and has contributed most of Niger's production, which totaledabout 2,800 metric tons UjOi in 1978. The Akotita deposit con-tains about 40,000 metric tons of UjO. at 0.45 percent at a depthof 240 m; production began in 1978. Imouraren, the largestknown deposit, has 59,000 metric tons of UjO. and is understudy as an open-pit mine to depths of 150 m.
By 1972 the exploration had demonstrated thai the geologicalsetting is similar to the western United States, " . . .particularlywith respect to the following characteristics: 1) structuralfeatures: northeast and northwest tectonic folds, more or lessmineralized basins; 2) sedimemological features: porous, fekl-spathic, fluviatile sandstones with a high permeability, frequentclayey levels; 3) biochemical features: organic matters ofvegetable origin, in relation to the sandstones lying in channeldepressions within clays, bone or silicified wood remains"(Bigotteand Molinas, 1973, p. 36).
This model provided a plan for mapping and drilling: first,identify the regional paleostructure picture, because the paleo-structure influenced the direction of sedimentation and thedistribution of organic matter; second, identify the channeldepressions; and finally, test the depress'ons for mineral lenses.
Drilling in the vicinity of Arlit town revealed a paleodomefrom which sediments flowed to the southwest. Several channelsgullied into the older rocks (fig. 13). The Arlette deposit was
found where a southwest-trending channel swings in a U shape tothe south, west, and northwest. The host rock is gray Carbonif-erous sandstone containing carbonaceous matter, calcite, pyrite,pitchblende, coffinite, and molybdenum sulfide. Ore is concen-trated at intraformational discontinuities and in places of highlyvariable permeability, as with alternating sandy and shaly beds(fig. 14). The widespread presence of analcime is interpreted torepresent the former presence of acid volcanics, which may havecontributed the uranium to the sedimentary rocks.
The descriptions of the uranium occurrences in Niger wouldlead one to believe that a Grants district explorationist would feelquite at home there and would know instinctively how to goabout his business.
South Africa: The Karroo SupergroupUranium mineralization was discovered in Beaufort Gioup
sandstones (middle Permian) of the Karroo Supergroup (UpperCarboniferous-Jurassic) in the southern Cape Province in 1969.Since then exploration has been active, and hundreds of small oc-currences have been found. Although the Karroo sediments makeup about 55 percent of South Africa's land surface, no uraniumdiscoveries of significance have been announced. The experiencein South Africa has been similar in other parts of southernAfrica, where the Karroo is represented in Angola, Botswana,Kenya, Madagascar, Mozambique, Tanzania, Zaire, and Zam-bia, as well as on the continent of Antarctica.
In South Africa, the uranium-bearing sediments consist ofalternating beds of sandstone and mudstone at a ratio of about30:70. Fossil plant material and sulfides are common, and thesedimentary environment suggests deposition on a fluvial flood-plain.
Two types of sandstones are mineralized: 1) well-cemented,dark-gray, calcareous, sulfide-bearing sandstone and 2) limonite-stained, poorly cemented sandstone. The dark-gray mineraliza-tion is generally confined to the base of sandstones and siltstonesand appears to be associated with major channel depressions.Mineralization of this type has been found to depths of at least1.5 km in oil exploration. Unlike the United States deposits,pyrite is commonly accompanied by arsenopyrite, bornite, orchalcopyrite; molybdenum sulfides are relatively scarce. Largeremnants of carbonaceous material, such as tree trunks, areusually silicified and barren of uranium.
The limonite-stained mineralization occurs in white to light-brown sandstones characterized by irregular limonite banding.Like the darker mineralization, it is confined to the base of sand-stones in channels along with fossil plant matter and pyrite. Thistype of mineralization is generally enriched in arsenic, molyb-denum, and sometimes copper, and it includes chiefly autuniteand torbernite (uncommon in United States deposits).
Studies of the color of organic tissues in the Karroo (Treasure,1977) indicate that nearly three-fourths of the Beaufort Groupfalls within the greenschist facies of organic metamorphism(about 300°C) with most of the remainder in the metamorphicfacies (about 200 °C). This is interpreted as indicating that pest-depositional geothermal gradients must have been much higherthan normal at one time. Significantly, 80 percent of the known
COARSE GREYISHSANDSTONES
FIGURE 13—PALEOVALLEYS IN THE ARLIT AREA. GABON, SHOWINULOCATION OF THE ARLETTE URANIUM DEPOSIT (modified from Bigotteand Molinas, 1973, fig. 4).
FIGURE 14—SCHEMATIC GEOLOGIC SECTION OK THE ARLETTE URANIUMDEPOSIT. GABON: U—uranium mineralization (modified from Bigotieand Molinas, 1973, fig. 5).
[New Mexico Bureau of Mines & Mineral Resources, Memoir 38,1980]

30
uranium occurrences are within the metamorphic fades, sug-gesting a connection between uranium and the degree of organicmetamorphism.
Basal type of sandstone depositsA subclass of sandstone deposits—the basal type—has been
identified in Japan and, more recently, in British Columbia.These bodies are situated in sandstone that occupies paleostreamchannels on an unconformity; the sandstone is overlain by rockscontaining acid volcanics.
JapanThe uranium deposits of Japan are small but widespread; only
a few are workable. They are found in Tertiary sandstone thatrests unconformably upon a basement of older rocks. Where theunconformity is flat or gently undulating, little uranium isfound, because the orebodies are limited to channels. Channelsbounded by steep slopes are more favorable than the broad,open, main channelways that are barren or weakly mineralized.The nature of the basement rock plays an important role infavorability. Where granite is present below the unconformity,ore can be found; but where the basement consists of Paleozoicsediments or metamorphics, only showings are found.
Within the channels a ground-water trap is important, as rapidwater movement works against the chemical reactions that pre-cipitate uranium from solution. Thus, ore is localized at theedges of channels, at the bottoms, and in thin permeable beds(fig. 15). At the Tsukiyoshi mine, faulting appears to play a rolein ore control (fig. 16).
Carbonaceous matter, as carbonized and silicified wood frag-ments and as fine particles, is an important precipitant. Highconcentrations of uranium surround or replace fossil plants. Inthe Ningyo-toge mine the uranium content of samples, rangingfrom 0.20 percent UiCX to 14 percent UiO», bears a direct rela-tionship to the content of humic acid, ranging from 0.07 percentto0.75 percent (Katayama and Kamiyama, 1977, p. 5).
Most of the above relationships are reminiscent of channel-controlled deposits of the western United States, especially thosein the Shinarump Member of the Chinle Formation (Triassic) insouthern Utah and northern Arizona. Howoer, there is a con-spicuous mineralogical difference: in Japan, niffaceous materialis interspersed with the host sandstones and has been altered dia-
genetically to montmorillonite and zeolites. Some zeolites con-tain up to 0.9 percent UiO«, and the typical ore mineral in theTono mine is a zeolite of the heulandite-clinoptilite type,uranium being adsorbed on it. Katayama and others (1974) sug-gest that enrichment of the uranium into ore deposits occurred bystripping of the uranium from the zeolites by low pH solutionsresulting from pyrite oxidation. As the pH of the solutions in-creased during migration, the uranium was again adsorbed byzeolites and precipitated under reducing conditions by car-bonaceous matter.
Canada: Lassie LakeThe model of the basal-type sandstone deposits in Japan con-
tributed to the discoveries in the Lassie Lake area of southernBritish Columbia. The mineralization is in poorly consolidatedTertiary sediments under an impervious capping of Miocene orPliocene basalt (or, less commonly, sedimentary rocks). Thisflat-lying capping has been dissected by erosion into a number ofoutliers of various shapes and sizes (fig. 17). The uranium occursin organic-rich sediments deposited in paleostream channels.Ground-water traps are favored sites. As in Japan, granite in thebasement rocks is favorable.
The first discovery was the Fuki showing, identified during acarborne-scintillometer survey. Subsequently, the Cup Lakebasalt was drilled, and anomalous uranium was discovered in a3-m sandstone bed at the base of a channel. The largest depositknown to date is the Blizzard orebody, with reported reserves of3,400 metric tons UiO, at a grade of 0.22 percent. The drill-holeinformation indicates that autunite and other uraniferous min-erals occur with carbonaceous matter in a basal channel occupiedby unconsolidated sandstone and mudstone.
In contrast to most uranium discoveries of the world, whichhave been made by radiometric means, Blizzard is the result ofgeochemical reconnaissance. Obviously, it is impracticable todrill all basalt cappings in order to locate the limited areas ofconcealed paleostrearn channels. Geochemistry has proved usefulhere. The basalt cappings store up rainfall, which then movesdown and laterally out to surface at the base of the slope. Emerg-ing ground water can carry an imprint of the geochemical en-vironment through which it has passed. Seepage water, collectedat Blizzard on the slope below the basalt capping, was found tobe abnormally radioactive. This led to a staking bee on the basaltcap, during which 1,200 hectares were acquired. Drilling was
LEGEND
URANIUM AREAS
IMPERMEABLE LAYERS
PERMEABLE LAYERS
+ | GRANITE
/ FAULT
FIGURE 15- GEOLOGICAL CROSS SECTION OF THE ASABATAKE CHANNEL. NINGYOTOGI: MINE (Katayama and Kamiyama, 1977, fig. 6).
[New Mexico Bureau of Mines & Mineral Resources, Memoir 38,1980]

31
SL 300
IMPERMEABLE LAYERS
| | PERMEABLE LAYERS
GRANITE / F A U L T
URANIUM ORE BODIES
FIGURE 16—GKHOCIICAI CROSS SK'iION oi rm- TSUKIYOSHI ORI mi'osns, TUNOMINI- (Kaiayania andKamiyama. 1977, fig. 7).
then undertaken through 60 m of basalt into the basal sediments.At least a 1.5-km length of channel has been outlined by the drillholes.
Unites States: SherwoodOne of the first basal-type deposits to be discovered was the
Sherwood mine in Washington State, located during an airborneradiometric survey in 1955 (Becraft and Weis, 1963, p. 62).Anomalous radiation was found to originate from outcrops ofthin, slightly radioactive, carbonaceous shale beds. Subsequentdrilling disclosed a low-grade orebody, at depths up to 25 m, con-sisting of uranium-bearing, highly carbonaceous shale lenseswithin a conglomerate up to 30 m thick. The deposit has about4,900 metric tons UiO, at an average grade of 0.09 percent. Theuranium occurs as autunite, rutherfordine, torbernite, and minorcoffinite. Mining is by open pit at a stripping ratio of 7:1.
The ore-bearing conglomerate is poorly cementec1 and poorlysorted, and it is believed to be of mid-Eocene age (Jonn Bulich,personal communication, 1979). The conglomerate occupies ashallow, northwest-trending trough representing a paleostreamchannel cut into quartz monzonite (Becraft and Weis, 1963, p.63). The channel is limited by erosion to a length of 900 m.
The conglomerate, perhaps more accurately called a fan-glonicrate, contains clasts up to 3 m in diameter and represents ahigh-energy sedimentary environment that was interrupted epi-sodically by periods of quiescence. The carbonaceous shale lensesdeposited during the low-energy intervals contain uranium inassociation with coalified woody material and pyrite. Overlyingrocks are Oligocene tuffaceous sandstone and arkose of theGerome Volcanics.
Metamorphosed sandstone depositsThe sandstone deposits of Mesozoic and Tertiary age in the
western United States are generally similar to deposits in Lower
-BLIZZARD DEPOSIT
CUP LAKE BASALT
FUKI SHOWING
1 mile
COLUMNAR & VESICULAR
BASALTS BASAL SEDIMENTS
MINERALIZED BASAL
SEDIMENTS
FIGURE 17—INDEX CII-OIoc.ic MAP OK LASSIE LAKE AREA, SOUTHERNBRITISH COLUMBIA, SHOWING URANIUM OCCURRENCES (modified fromBoyle, 1979, fig. 52.2).
[New Mexico Bureau of Mines & Mineral Resources, Memoir 38,1980]
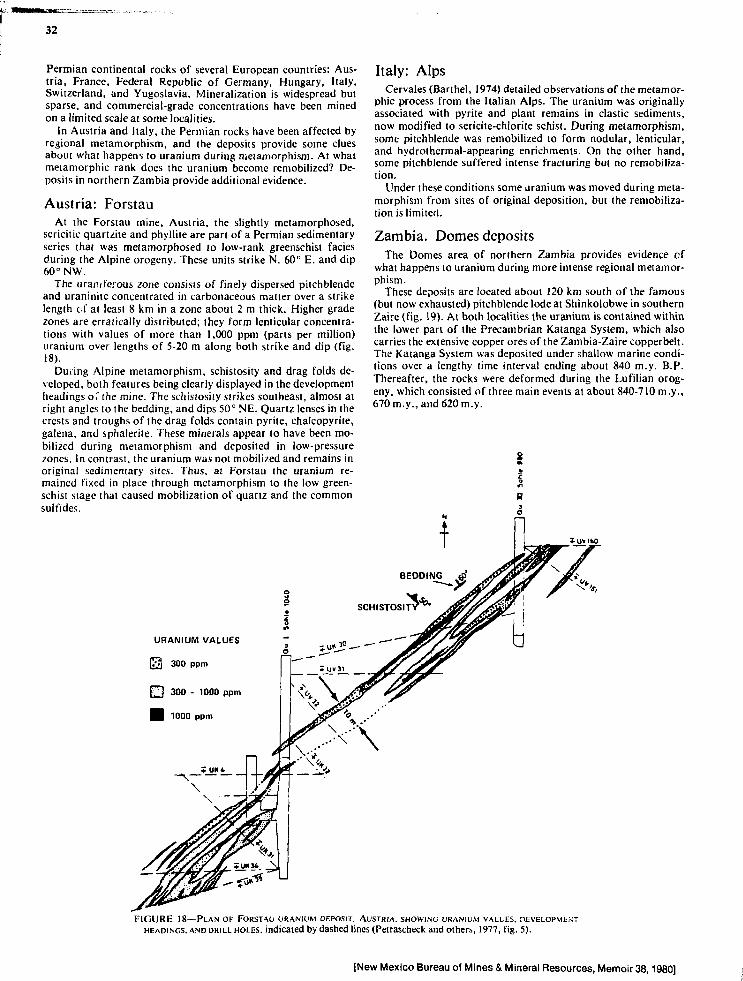
32
Permian continental rocks of several European countries: Aus-tria, France, Federal Republic of Germany, Hungary, Italy,Switzerland, and Yugoslavia. Mineralization is widespread butsparse, and commercial-grade concentrations have been minedon a limited scale at some localities.
In Austria and Italy, the Permian rocks have been affected byregional metamorphism, and the deposits provide some cluesabout what happens to uranium during metamorphism. At whatmetamorphic rank does the uranium become remobilized? De-posits in northern Zambia provide additional evidence.
Austria: ForstauAt the Forstau mine, Austria, the slightly metamorphosed,
sericitic quartzite and phyllite are part of a Permian sedimentaryseries that was metamorphosed to low-rank greenschist faciesduring the Alpine orogeny. These units strike N. 60° E. and dip60° NW.
The urarul'erous zone consists of finely dispersed pitchblendeand uraninite concentrated in carbonaceous matter over a strikelength of at least 8 km in a zone about 2 m thick. Higher gradezones are erratically distributed; they form lenticular concentra-tions with values of more than 1,000 ppm (parts per million)uranium over lengths of 5-20 m along both strike and dip (fig.18).
During Alpine metamorphism, schistosity and drag folds de-veloped, both features being clearly displayed in the developmentheadings o." the mine. The schistosity strikes southeast, almost atright angles to the bedding, and dips 50° NE. Quartz lenses in thecrests and troughs of the drag folds contain pyrite, chalcopyrite,galena, and sphalerite. These minerals appear to have been mo-bilized during metamorphism and deposited in low-pressurezones. In contrast, the uranium was not mobilized and remains inoriginal sedimentary sites. Thus, at Forstau the uranium re-mained fixed in place through metamorphism to the low green-schist stage that caused mobilization of quartz and the commonsulfides.
Italy: AlpsCervales (Barthel, 1974) detailed observations of the metamor-
phic process from the Italian Alps. The uranium was originallyassociated with pyrite and plant remains in clastic sediments,now modified to serictte-chlorite schist. During metamorphism,some pitchblende was remobilized to form nodular, lenticular,and hydrothermal-appearing enrichments. On the other hand,some pitchblende suffered intense fracturing but no remobiliza-tion.
Under these conditions some uranium was moved during meta-morphism from sites of original deposition, but the remobiliza-tion is limited.
Zambia. Domes depositsThe Domes area of northern Zambia provides evidence cf
what happens to uranium during more intense regional metamor-phism.
These deposits are located about 120 km south of the famous(but now exhausted) pitchblende lode at Shinkolobwe in southernZaire (fig. 19). At both localities the uranium is contained withinthe lower part of the Precambrian Katanga System, which alsocarries the extensive copper ores of the Zambia-Zaire copperbelt.The Katanga System was deposited under shallow marine condi-tions over a lengthy time interval ending about 840 m.y. B.P.Thereafter, the rocks were deformed during the Lufilian orog-eny, which consisted of three main events at about 840-710 m.y.,670 m.y., and 620 m.y.
N
H9O
URANIUM VALUES
13 300 ppm
£ ] 300 - 1000 ppm
JB 1000 ppm
FIGURE 18—PLAN OF FORSTAU URANIUM DEPOSIT. AUSTRIA, SHOWING URANIUM VALUES, DEVELOPMENTHEADINGS, AND DRILL HOLES, indicated by dashed lines (Pelrascheck and others, 1977, fig. 5).
[New Mexico Bureau of Mines & Mineral Resources, Memoir 38,1980]

FIGURE 19—OtcuRRENc tsOF URANIUM (U) IN THb ROAN SLPtRCiRoi p OF ZAMBIA AND ZAiRfc. "1 he Roan Supergroup lies unconformably upon basement rocks, shown by horizonial shading (Meneghel.1977, fig. 2).

34
The uranium, as well as the closely related copper, cobalt, andnickel, dates from the time of original sedimentary deposi'ionwhen the metals were incorporated into the rocks as strataboundaccumulations. The original distribution was then modified bylater geologic events, such as diagenesis and orogeny, to form thepresent orebodies. Age dates on pitchblende attest to remobiliza-tion and repeated resetting of the time clocks (fig. 20). Most ofthe age dates center around the three episodes of Lufilian orog-eny, all of which are represented at Shinkolobwe. Each suc-ceeding pulse of metamorphism caused increased differentiationof the original mix of metals, as each responded, in accordancewith its nature, to changes in environment (Meneghel, 1977). Inthe 670-m.y. deposits, uranium may be accompanied by copper,cobalt, nickel, and iron. The uranium deposits of 620 m.y. con-tain no nickel, and the uranium deposits of 235 m.y. and youngerare monometallic.
In the Domes area, uranium is found mostly in quartz-muscovite-kyanite schist of amphibolite grade. Small grains ofpitchblende are disseminated in the schist, and pitchblende also isfound in narrow veins and fracture zones. The mineralized areasare separated by unmineralized zones along the strike of therocks, on the scale of several meters; the uranium apparentlymoved about 3 m or more during metamorphism to the amphib-olite fades (L. Meneghel, personal communication, 1977).
Although the mineralization in the Domes of Zambia is ofrelatively low grade, the deposits appear to be the result of migra-tion of sedimentary uranium, duiing regional metamorphism, toform epigenelic concentrations.
General observations on sandstone depositsSOURCE OF URANIUM—At many of the localities mentioned,
acid volcanics exist in the strata above the uraniferous zone. Infact, the Frome Embayment, Australia, is the only locality dis-cussed where the uranium is in a succession of rocks apparentlydevoid of volcanics, and here the source rocks are believed to begranites in the nearby Flinders Ranges. Granite, along with acidvolcan^s, is favorable for the basal-type deposits. In both BritishColumbia and Japan, favorable conditions call for acid volcanicsabove the mineral-bearing channel sandstones, combined withgranites in the basement below the channels.
Clearly, either granites or acid volcanics, upon weathering, canprovide a source of uranium for sandstone ore. Both togethermay be best.
URANIUM PRECIPITANTS—The widely noted relationship be-tween sites of uranium deposition and sites with carbonized plantmatter holds almost universally. At Sierra Pintada, Argentina,however, the cause of uranium precipitation remains uncertain.
TYPE OF HOST ROCK—Whereas fluvial sandstone is the mostcommon host rock, other types of sandstone are also ore bearingin places: eolian sandstone (Sierra Pintada, Argentina) andmarine-beach sandstone (Oklo, Gabon). Pelitic rocks also carryore: black, lacustrine shale (LodSve, France) and fluvialmudstone (Arlette, Niger; Sherwood, United States). The pelitesare mineralized mostly where transmissivity has been induced byfaulting (Loddve) or where adjoining clastic rocks are permeable(Arlette, Sherwood).
Z A I R E
S20582
KAMETO .KALONGWE 520
x«.% 5 2 0 .
• M W I N I L U N G A .KAWANGA
535520
KOLWEZI
620 LUISHYA
x.._ A:
55S. KAMBOVE
SWAMBO . • SHINKOLOBWE670 620
670706
n • LUBUMBASHI
S20 %'MUSOSHI
'"235.468 \
*f SAKANIA
• \ N D O L ALUANSHYA' \
365 t
520- KANSANSHtV523 ' KIMALE \543 .
DUMBWA555 5 2 0
NKANA.
Z A M B I A
200 km
FIGURE 20—ISOTOPIC ACES or URANIUM MINERALIZATION IN LOWER ROAN ROCKS.ZAIRE AND ZAMBIA (Cohen and others in Meneghel, 1977, fig. 3).
[New Mexico Bureau of Mines & Mineral Resources, Memoir 38,1980]

35
The essential features of a host rock appear to be adequatetransmissivity, to permit entry of uranium-bearing solutions, anda precipitant—normally, carbonized plant remains.
CHANNELS AND UNCONFORMITIES—The basal-type deposits, aswell as certain other deposits, testify to the preference of ore forstructural lows in the sedimentary section. The deeper parts ofpaieostream channels are particularly favored sites. Where anerosional unconformity is present, the ore is in lows above theunconformity and in areas of greater lelief (on the unconformitysurface), rather than in areas of lesser relief.
In part, the explanation may lie in the higher concentrationand better preservation of plant material along structural lows.In some deposits, however, carbonized plant matter is min-eralized just above the unconformity but not higher up in thestratigraphic section. The structural lows present barriers andimpediments to the vertical and lateral migration of uranium-bearing ground waters. Movement is slowed, presenting in-creased opportunity for the chemical interactions necessary toprecipitate the uranium from solution.
KAUI.TS—Several deposits (Mounana and Boyindzi, Gabon,and Lodeve, France) owe substantial portions of their reserves tomineralization along faults; faults provide enhanced transmissiv-ity for ore-bearing solutions, particularly in directions across thebedding planes.
MhTAMORPHiSM—With increasing metamorphic grade,uranium in sedimentary rocks shows increasing tendency to be-come remobilized. In the low-grade greenschist facies at Forstau,Austria, the uranium is largely unmoved. In the higher rankgreenschist facies of the Italian Alps, some movement has takenplace. Under amphibolite grade conditions, as in the Domes areaof Zambia, uranium has moved over distances of at least 3 m.Under some conditions, therefore, regional metarnorpiiism to theamphibolite facies may operate as a mineralizing force.
ConclusionsThe information from foreign deposits tends, for the most
part, to underscore conventional United States wisdom aboutsandstone deposits. Plant matter is an important precipitant, andfluvial channels commonly localize ore. Some of the foreigndeposits illustrate structural control on a larger scale than domost United States deposits. The suitability, under proper condi-tions, of black shale and eolian sandstone as host rocks is alsonoteworthy. Finally, one issue that was the subject of livelydiscussion at the time of the 1963 symposium on the Grants ura-nium region may be approaching resolution: both acid volcanicsand granites can, upon weathering, provide a source of uranium.
ReferencesAnonymous, 1978, World uranium potential—An international evalua-
tion: Paris, Organization for Economic Co-operation and Develop-ment, 176 p.
Barthel, F. hi., 1974, Review of uranium occurrence1' in Permian sedi-ments in Europe, in Formation of uranium deposits, a symposium,Athens: Vienna, International Atomic Energy Agency. Proc, ST1/PUB/374, p. 2'77-289
Becrafl, G. E., and Weis, P. 1... 1963, Geology and mineral deposits ofthe Turtle lake quadrangle, Washington: U.S. Geological Survey,Bull. 1131, 73 p.
Bigotte, G., and Molinas, H., 1973, How French geologists discoveredNiger uranium deposits: World Mining, April, p. 34-39
Boyle, D. R., 1979, The dispersion of uranium in Miocene basal-typeuranium occurrences in Lassie Lake area, south-central British Colum-bia: Geological Surey of Canada, Paper 79-1 A, p. 349-356
Callen, R. A., 1975, Lake Frome area— Regional geology. Tertiary stra-tigraphy and uranium mineralization, in Economic geology ofAustralia and Papua, New Guinea: Australasian Insiiiuie of Miningand Metalluigy, Mon. Series 5, v. I, p. 803-808
Chauvet, R. J., 1975, Description du gisement d'uranium d'Oklo, in TheOklo phenomenon, a symposium, Libreville: Vienna, InternationalAtomic Energy Agency, Proc, ST1/PUB H)5, p. 53-65
Diouly-Osso, P., and Chauvet, R. J., 19" \ l.es gisements d'uranium dela Region de Franceville (Gabon): I r.aka, Zambia, InternationalAtomic Energy conference, 13 p., 1 • li^s.
Haynes, R. W., 1975, Beverley sedimentary uranium orebody, FromeEmbayment, South Australia, in Economic geology of Papua, NewGuinea: Australasian Instiiute of Mining and Metallurgy, Mon. Series5,v. I, p. 808-813
Herbosch, A., 1974, Facteurs conlrolant la distribution des elements dansles shales uraniferes du Bassin Permien de l.odive (Herault, France), inFormation of uranium deposits, a symposium, Athens: Vienna, Inter-national Atomic Energy Agency, Proc., ST1/PUB/374, p. 359-380
Katayama, Nobu, and Kamiyama, Teiji, 1977, Favourable conditions forthe formation of basal-type uranium deposits: Mining Geology(Japan), v. 27, p. 1-8
Kataynma, Nobu, Kubo, K., and Hirono, S., 1974, Genesis of uraniumdeposits in the Tono mine, Japan, in Formation of uranium deposits, asymposium, Athens: Vienna, International Atomic Energy Agency,Proc., STI/PUB/374, p. 437-452
Meneghel, L., 1977, The occurrence of uranium in the Katanga System ofnorth-western Zambia: Geological Survey of Zambia, OccasionalPaper 89, 26 p.
Petrascheck, W, E., and others, 1977, Type of uranium deposits in theAustrian Alps, in Geology, mining, and extractive processing ofuranium, a symposium, M. H. Jones, ed.: London, Institute of Miningand Metallurgy and the Commission of the European Communities,Proc., p. 71-75
Pfiffelmanr, J. P., 1975, L'uranium dans le Bassin de Franceville, mTheOklo phenomenon, a symposium, Libreville: Vienna, InternationalAtomic Energy Agency, Proc., ST1/PUB/4O5, p. 37-51
Treasure, P. A., 1977, Uranium from the Dry Country: South AfricaAtomic Energy Board, Nuclear Active, no. 7
[New Mexico Bureau of Mines & Mineral Resources, Memoir 38,1980]
36
STRATIGRAPHIC IMPLICATIONS OFURANIUM DEPOSITS
by Fred F Langford, Department of Geology, University of Saskatchewan, Saskatoon, Saskatchewan, Canada F7NOWO
AbstractOne of the most consistent characteristics of economic
uranium deposits is their restricted stratigraphic distribution.Uraniniie deposited with direct igneous affiliation contains:horium, whereas chemical precipitates in sedimentary rocks arejharacterized by thorium-free primary uranium minerals withvanadium and selenium. In marine sediments, these mineralsform low-grade disseminations; but in terrestrial sediments,chiefly fluvial sandstones, the concentration of uranium varieswidely, with the high-grade portions constituting ore. Pitch-blende vein deposits not only exhibit the same chemical charac-teristics as the Colorado-type sandstone deposits, but they have astiatigraphically consistent position at unconformities coveredby fluvial sandstones. If deposits in such diverse situations havecritical features in common, they are likely to have had manyfeatures of their origin in common. Thus, vein deposits in Sas-katchewan and Australia may have analogues in areas that con-tain Colorado-type sandstone deposits. In New Mexico, thepresence of continental sandstones with peneconformable ura-nium deposits should also indicate good prospecting ground forunconformity-type vein deposi's. All unconformities within Iheperiods of continental deposition ranging from Permian to Cre-taceous should have uranium potential. Some situations, such asthe onlap of the Abo Formation onto Precambrian basement inthe Zuni Mountains, may be directly comparable to Saskatch-ewan deposition. However, uranium occurrences in the upperpart of the Entrada Sandstone suggest that unconformitiesunderlain by sedimentary rocks may also be exploration targets.
IntroductionIn New Mexico, Chenoweth (1976) shows a wide scattering of
uranium occurrences. The main uranium deposits of the north-west part of the state are restricted to Jurassic strata, but smalleroccurrences are found in Permian, Cretaceous, and Eocenerocks. Although information is scanty, most of the vein-type oc-currences that occur in other rocks seem to be related to theseperiods. This stratigraphic control can be used as a primary ex-ploration guide for vein-type deposits.
Some of the literature refers to the uranium vein deposits as"Proterozoic uranium deposits," implying that they are some-how unique to that period of time. Some, like Robertson andTilsley (1977), go even further and specify that "Palaeosurface-related 'veins' appear to form preferentially in time at about 1.7b.y., and preserved sandstone-type deposits are generally con-fined to Mesozoic and younger rocks."
So many similarities exist between the vein types and sandstonetypes of uranium deposits that they cannot be considered entirelyseparate entities. Both are stratigraphically controlled, and theconditions that favor one should favor the other. The strati-graphic restriction indicates limited times of environment suit-able for deposition which should recur throughout geologic timesince 2.0 b.y. ago. In their survey of the United States for poten-tial sites of vein-type uranium deposits, Kalliokoski and others(1978) confined themselves to Proterozoic rocks to limit the proj-ect, but they recognized the possibility of several favorable situa-tions higher in the sequence.
Stratigraphic featuresThe most consistent feature of both types of uranium deposits
is their close relationship to fluvial sandstones or, rarely,lacustrine deposits. For both types, this relationship is widely
regarded as the primary guide to ore. In addition, Finch (1967)has shown that certain time intervals within the Phanerozoic ofwestern North America, namely Triassic, Jurassic, Cretaceous,and Eocene, were preferred times for the formation ofsandstone-type deposits. From what scanty evidence is available,these also seem to have been the preferred times for formation ofvein-type deposits in this area. Since vein-type deposits mostlyoccur in basement rocks, where they are unconformably overlainby the genetically significant fluvial sandstone (Langford, 1977),the problem of dating them is complicated by the fact that theage of the host rocks may be widely divergent from the age of theassociated fluvial sandstone. Commonly, uranium deposits haveundergone periods of remobilization, which makes radiometricdating of primary emplacement extremely difficult; however, formost deposits, recent work postulates times of primary introduc-tion of uranium that are close to the times of formation of theassociated fluvial sediments on both radiometric and geologicgrounds (Brookins and others, 1977; and Galloway, 1978).
The similarity of vein and sandstone types of deposits is rein-forced by the similarity in composition, both in the elements thatmake ore and in those elements present in lesser amounts. Thecharacteristic elements of sandstone deposits are uranium,vanadium, copper, lead, zinc, cobalt, nickel, arsenic, selenium,molybdenum, barium, and chromium (Shoemaker and others,1959; Brookins and others, 1977). Although the abundance ofthese elements varies considerably between deposits, the depositsare significantly enriched compared to the surrounding countryrock. Gold and silver are probably enriched, but their normalabundance is too low to be widely reported. This same suite ofelements is present in the vein-type deposits as indicated in the ex-ample by Robinson (1955). The degree to which various elementshave been concentrated differs between the two types. The sand-stone deposits tend to be richer in vanadium, but the uranium:vanadium ratio varies widely.
With increasing copper, these deposits grade into thesandstone-copper deposits. Among the lesser elements, the varia-tion is less conspicuous, but even here the presence of variousminerals in a few deposits highlights the abundance of someelements (Fischer, 1968, p. 741). Considerable variation existsbetween many vein-type deposits, and some show substantialdepartures from the sandstone types.
Unconformity deposits in SaskatchewanIn the Beaverlodge area of Saskatchewan (fig. 1) a few deposits
contain enough selenium to produce the mineral nolanite (ironvanadate), whereas in other deposits selenium content is low. Asmall cluster of deposits has abundant development of nickel-cobalt-arsenic minerals (Robinson, 1955), but most containuranium with small amounts of pyrite, galena, and chalcopyrite.A similar disparity is found among the deposits around theAthabasca Basin. The Key Lake ore in most places has as muchgersdorfite (NiAs) as it has uranium minerals. Similar nickel-arsenic enrichment orcurs at Midwest Lake, in some of thedeposits at Cluff Lake, and north and south of Rabbit Lake.
The minerals present in these deposits are mainly identical. Insandstone types the grade is lower and coffinite is much moreabundant. Where vanadium is abundant, montroseite and othervanadium minerals are found that so far have not been reportedfrom the vein-type deposits.
Associated gangue minerals are similar. Chlorite has long beenrecognized around uranium veins, but only since the discovery ofthe Australian and Saskatchewan deposits has it come to be
[New Mexico Bureau of Mines & Mineral Resources, Memoir38,1980]

37
1 .2 .34 .5 .6
789 .
10 .1 1 .
Beave r l odge A r e aMaur i ce BayFond du LacO c c i d e n t a l
M i d w e s t L a k eC o l l i n s Bay
R a b b i t L a k eH o r s e s h o e , R a v e nWest B e a rKey Lake
C l u f f L a k e
100 kmFIGURE 1—SASKAK HI-WA\ I RANIUM MINES ANI> nti'osns
regarded as an indicator of ore. Hoeve and Sibbald (1978)pointed out that Mg-chlorite is associated with ore at RabbitLake and that kaolinite characterizes the regolith and the sand-stone away from ore. A similar relationship was noted byGranger (1962) in the Grants mineral belt, and Brookins (1976)also made similar observations when he tried to relate mont-morillonite and chlorite formation to the ore-forming processes.Both Hoeve and Brookins describe the chlorite as magnesiumrich, but Dahlkamp and Tan (1977) report only Fe-chlorite atKey Lake.
Genetic modelsIn spite of having so many features in common, most genetic
models of both types of deposits first try to satisfy the structuraland stratigraphic features that differentiate between the deposittypes. Many geologists are highly influenced by radiomelriedates and temperature determinations that suggest depositiononly after deep burial, but their models do not really explain theuniversal connection of these types of uranium deposits with con-
tinental deposits. Rich and others (1978) have emphasized thepresence of hematite in fluvial sandstone, which indicates anoxidizing ground-water environment; however, many marinesandstones have limonite, and many uranium deposits occur msandstones that would have had a reducing environment.
Recent concepts developed by workers in Saskatchewan io ex-plain the origin of the vein-type deposits have stressed formationby deep-seated ground water (hydrothermal solutions of Richand others, 1978), which circulates through the sandstone anddives into fractures beneath the sandstone, depositing • -arv.amthere (Hoeve and Sibbald, 1978). Others feel that the uraniumfirst accumulated when the unconformity was being weatheredand eroded and later remobilized into its present portion(Davies, 1979). Generally the source of the uranium i* no! con-sidered an important question There aie no volcanic-, within theAthabasca. Galloway (1978) and Brookins (1976) have presentedstrong arguments that volcanic dusts provide the urarr lm. Ituranium deposits are source dependeni, then the Athabasca de-posits should contain a suite of elements that differ from tru>e .ifNew Mexico or Texas. The trap mechanism is believed to becritical, and although volcanics may be important contributor*.many ground and surface waters should contain enough of theoriginal elements.
The difficulty with these concepts is creating Mime reason forthe connection of the deposits with continental sandstone*.Davies (1979) shows the original accumulation of uranium ore ona surface undergoing teaching and erosion (fig. 2). I f this surfacewere covered by the sir, this deposit would occur at an uncon-formity which was covered by marine sediments—a situation tha:is not encountered. If the ore deposit occurs when the uncon-formity is being covered by fluvial sands (fig. 3), a number ofaspects are resolved, and a situation that should be encounteredin New Mexico results. The uranium can then be deposited in areducing environment fed by the ground water closely tied to thestreams depositing the sands. The mechanism to fix the uraniummay be one such as Tilsley's (1978) cells, but in any case themechanism is related to fractures and void space in the basement.
The presence of carbon and sulfides seems to promote deposi-tion. I have suggested (Langford, 1977) that these agents wouldproduce a reducing environment. If carbon is present as graphite,this would probably not be true; perhaps, as Tilsley (1978) sug-gests, carbon's action as a conductor is more important.
I f I x4wtL
STAGE I
SUPERGENE ENRICHMENT
PRE-ATHABASCA EROSION SURFACE
unnn§ •
GRAPHITIC SCHIST
METASEDIMENTS
GRANITE
URANIUM CONCENTRATION
WEATHERED ZONE
FAULT ZONE
FIGURE 2—DAVIES' (1979) MODEL OH URANIUM DEPOSITION BASED SOMEWHAT ON THE KtvLAKI DEPOSIT; this model does not show any relationship between uranium deposits andlerrestrial sediments.
[New Mexico Bureau of Mines & Mineral Resources, Memoir 38,1980]

38
Uranium model : s t a g e I
w e a t h e r e d e r o s i o n s u r l r i e
s h e a r e d g r a p h i t i c
s c h i s t
Uranium mode l : s t a g e I I
f i r s t f I I v i o l s a n d s
q r c n i 1 1 z e d
s e d i m e n t s
Uror, urn model s t a g e III
f i u v i o i a n d l a t e r s e d i m e n i s
FIGURE 3—MomiiH) W-RSION OI- DAMLS' (1979) vioubi oi URANIUMIMPOSITION, showing the relationship of deposition to the presence ofterrestrial sediments and ihe effects of post-depositional reaaivalion.
Unconformity deposits in New MexicoThe ability of the processes that formed the New Mexico
sandstone-type deposits to mineralize the underlying formationcan be seen in the Entrada Sandstone deposits. Although Kelleyand others (1968, p. 758) regard the uranium in the Entrada asbeing of fairly recent origin when the Todilto Limestone wasbreached by the present erosion surface, Moench and Schlee(1967) believe the bleaching of the Entrada occurred beforedeposition of the Todilto and that mineralization may have oc-curred about the same time the uranium was deposited in theTodilto. This uranium occurrence demonstrates that any poroussubstratum may provide a suitable trap for uranium.
The Abo Formation (Permian) consists of interbedded silt-stone, shale, and arkose of fluvial origin (Baars, 1974). In thisrespect it is similar to the Martin Formation in the Beaverlodgearea, where arkosic sandstones and conglomerate overlie thebasement in which the uranium deposits occur. Lovering (1956)described small, uranium-bearing veins in the Precambrian of the
Zuni highland where it is overlain by the Abo Formation. Thus,possibilities exist for a situation in that area similar to that of theBeaverlodge area. Peterson and others (1965) show the areawhere the Permian rocks directly overlie crystalline basement tobe restricted to basement highs (fig. 4). These probably would bethe b.st areas for vun deposits because where Permian rocksoverlie Pennsylvanian units, the probability for space-formingevents becomes small. Faulting, for example, would have had tooccur after the Pennsylvanian but before the Permian in order toprovide space for uranium deposition. Towards the southeast,the Abo Formation changes from terrestrial elastics to marinelimestones, where it interfingers with the Red Tanks Member,and the opportunity for uranium deposits diminishes according-ly.
During the Triassic and Jurassic, crystalline rocks were ex-posed in the Mogollon highland (Saucier, 1976). Erosion duringthe Cretaceous probably removed or modified anv deposits inthis area. Here also, erosion was largely on preexistingPhanerozoic sediments that generally do not make good traps.The development of kaolinite along this unconformity (Brook-ins, 1976) is very similar to that in the regolith beneath theAthabasca Formation. A guide to ore beneath the Athabascaseems to be chlorite alteration along faults in the basement or inthe overlying sandstone. Shear zones that contain enough graph-ite or sulfides to form conductors seem to be favored.
The Tertiary rocks of southwestern New Mexico and theunderlying unconformity offer a variety of favorable situationsfor uranium deposits, because they consist of continental vol-canic rocks deposited in a tectonically active area. In the Beaver-lodge area (fig. 1), uranium veins occur in lava flows in theMartin Lake Formation as well as in the underlying Precambrianbasement. The Martin Lake Formation consists mostly of ar-kosic sediments deposited in fault basins.
Gillerman's (1968) description of uranium deposits in theBurro Mountains, New Mexico, provides an example of the ex-ploration opportunities created if vein deposits are controlled bystratigraphic situations. In the Bullard Peak area (fig. 5), thebasement consists of Precambrian granites and gneiss invaded bya quartz monzonite that may be either Late Cretaceous or earlyTertiary. Cretaceous conglomerate and sandstone lie unconform-ably on the Precambrian rocks and possibly on the monzonite.Tertiary volcanics overlie the Cretaceous rocks, and uraniumveins occupy northeast-trending fractures in the g anite andgneiss. If the v >ins were deposited with the Cretacious rocks,then the basal unconformity is a target area. Gillerman (1968)mentions veins in fractures in the Cretaceous sandstone, and onegets the impression that the mineralization postdates the Creta-ceous. Consequently, attention should be given to the base of theTertiary sequence and possibly along breaks within it. Fracturezones could then be located in the exposed crystalline rocks andpossibly followed beneath Tertiary rocks, particularly where theyoverlie basement.
10 km
FIGURE 4—SECTION SHOWING THE RELATIONSHIP OH PERMIANFORMATIONS TO THE PRECAMBRIAN BASEMENT IN NORTHWEST N E W M E X -ICO (after Peterson and c'hers, 1965).
[New Mexico Bureau of Mines & Mineral Resources, Memoir 38,1980]

2 mi
uramu m veins
Quaternary grovel
Cre'-'ceous sand
Iote monzonite
I -|— I Ternary voIconics
PREC AMBRIAN
I | granite | ( <, ) | gneiss
FIGURE 5—THE BULLARD PEAK AREA ot THE BURRO MOUNTAINS (afterGillerman, 1968); the target areas show possible uranium-bearing frac-ture zones extending beneath the Tertiary volcanoes.
ReferencesBaars, D. L., 1974, Permian rocks of north-central New Mexico: New
Mexico Geological Society, Guidebook 25th field conference,p. 167
Brookins, D. G., 1976, The Grants mineral belt, New Mexico: Commentson the coffinite-uraninite relationship, probable clay mineral reactionsand pyrite formation, in Tectonics and mineral resources ofsouthwestern North America, L. A. Woodward and S. A. Northrop,eds.: New Mexico Geological Society, Spec. Paper 6, p. 158-166
Brookins, D. G., Lee, M. H., and Riese, W C , 1977, Trace elements aspossible prospecting tools for uranium in the southern San Juan Basin:New Mexico Geological Society, Guidebook 28th field conference, p.263-269
Chenoweth, W. L., 1976, Uranium resources of New Mexico, in Tec-tonics and mineral resources of southwestern North America, L. A.Woodward and S. A. Northrop, eds.: New Mexico Geological Society,Spec. Pub. 6, p. 138-143
Dahlkamp, F. J., and Tan, B., 1977, Geology and mineralorv of the KeyLake U-Ni deposits, northern Saskatchewan, in Geology, mining andextractive processing of uranium, M. J. Jones, ed.: London, Instituteof Mining and Metallurgy, p. 145-157
Davies, J., 1979, Uranium exploration in Saskatchewan as a function ofgenetic modelling: Montreal, Canadian Institute of Mining andMetallurgy, 81st ann. intg.. preprint
Finch, W. I., 1967, Geology of epigcnetic uranium deposits ,n sandstonein the United Slates: U.S. Geological Survey, Prof. Paper 538. 121 p
Fischer, K. P., 1968, The uranium u;id vanadium deposit's of the Colo-rado Plateau region, in Ore deposits of the tinned States i913-196". IP. Ridge, ed.: American Institute of Mining. Metallurgical, andPetroleum Engineers, p. 730-746
Galloway, W. E., 1978, Uranium m!r»eiali/ation in a i_oastal-plain fluvialaquifer system, Catahoula Formation, Texas, t.conomn. Geology, v.73, p. 1655-167*
Gillerman, E., 1968, Uranium mineralization n. the Burro MountainsEconomic Geology, v. 63, p. 239-246
Granger, H. C , 1962, Clays in the Morrison Formation and their spatialrelationship to the uranium deposits at Ambrosia Lake district. New-Mexico: U.S. Geological Survey, Prof. Paper 45OD, p. 15-20
Hoeve, J., and Sibbald, T. 1. ]., 1978, On (he genesis of Rabbu Lake andother unconformity-type uranium deposits in northern Saskatchewan,Canada: Economic Geology, v. 73, p. 1450-1473
Kelley, V. C , Kittel D. F., and Melancan, P. E., 1968. Uranium depositsof the Grants region, in Ore deposits of the United Stares !9ji-19o", ID. Ridge, ed.: Americai. Institute of Mining, Metallurgical, andPetroleum Engineers, p. 748-769
Kalliokoski, J., Langford, F. F., and Ojakangas, R. W., 1978. Cr 'erufor uranium occurrences in Saskatchewan and Australia as guides tofavorability for similar deposits in the United States: U.S. Dept. ofEnergy, GJ BX-114(78), 480 p.
Langford, F. F., 1977, Surficial origin of North American pitchblendeand related uranium deposits: American Association of PetroleumGeologists, Bull., v. 61, p. 28-42
Lovering, G. T., 1956, Radioactive deposits in New Mexico: U.S. Geo-logical Survey, Bull. I009L, p. 315-390
Moench, R. H., and Schlee, J. S., 1967, Geology and uranium deposits ofthe Laguna district, New Mexico: U.S. Geological Survey, Prof. Paper519,117 p.
Peterson, J. A., Loloit, A. J., Spencer, R. A., and Ullrich, R. A., 1965.Sedimentary history and economic geology of San Juan Uasin:American Association of Petroleum Geologists, Bull., v. 49, p.2076-2119
Rich. R. A., Holland, H. D., and Petersen, U., 1977, Hydrothermaluranium deposits: New York, Elsevier Scientific Publishing Co., 264 p.
Robertson, D. S., and Tils.cy. J. E., 1977, The time-bound character ofuranium deposits (abs.): Geological Society of America, Abstracts withPrograms, v. 9, no. 7, p. 1143
Robinson, S. C , 1955, Mineralogy of uranium deposits, Goldfields, Sas-katchewan: Geological Society of Canada, Bull. 31, 128 p.
Saucier, A. E., 1976, Tectonic influence on uraniferous trends in the LateJurassic Morrison Formation: New Mexico Geological Society, Spec.Pub. 6, p. 151-157
Shoemaker, E. M., Miesch, A. T., Newman, W. C , and Riiey, L. B.,1959, Elemental composition of the sandstone-type deposits, in Geo-chemistry and mineralogy of the Colorado Plateau uranium ores, R. J.Garrels and E. S. Larsen, eds.: U.S. Geological Survey, Prof. Paper320, p. 25-54
Tilsley, J. E., 1978, Role of electrochemical cells in formation of paleo-surface-related vein-type uranium deposits (abs.): American Associa-tion of Petroleum Geologists, Bull., v. 62, p. 567
[New Mexico Bureau of Mines & Mineral Resources, Memoir 38,1980]

I 40
EXPLORATION FOR URANIUM DEPOSITS,GRANTS MINERAL BELT
by David C. Fitch, Ranchers Exploration and Development Corporation,P.O. Box6217, Albuquerque, New Mexico 87197
AbstractUranium ore deposits in the Grants mineral belt, New Mexico,
occur in fluvial sandstones in the Morrison Formation (Jurassic).Uranium mineralization is concentraied by a dark-gray to blacksubstance that has been identified as humate, which is derivedfrom decaying vegeua'ion. Black ore is truncated by overlyingsandstone in at least three ore deposits, documenting an early agefor mineralization. Ore deposits in the Grants mineral belt varygreatly in size and shape, tend to occur in clusters, and oftenpresent difficult drill targets. Current exploration is largely amatter of drilling in stages to distinguish favorable from unfa-vorable ground on a wide spacing, to seek mineralization in fa-vorable ground, and to conduct close-spaced drilling in mineral-ized areas. Criteria for favorability differ among explorationgroups but generally include I) presence of a host sandstone, 2)anomalous mineralization, 3) color of the host rock, 4) presenceof carbonaceous matter, and 5) position of the area relative tomineralized trends. A description of the drilling sequence, fromore discovery to the development of a mine at the Johnny M de-posit (in the east part of the Ambrosia Lake district), exemplifiesthe problem of predicting where orebodies may occur. A study ofthe drill data at the Johnny M indicates tne uranium ore is notrelated to specific geologic features other than humate, which iscommonly associated with coalified plant fragments inmudstone-rich parts of the host sandstone.
IntroductionUranium-ore deposits in the Grants mineral belt, New Mexico,
occur principally in certain fluvial sandstones with mudstoneinterbeds in the Morrison Formation (Jurassic). Uranium in thedeposits is concentrated by a dark-gray substance that has beenidentified as humate (Schmidt-Collerus, 1969), which is derivedfrom decayed vegetation.
This paper presents an overview of the significant geologicfeatures of the deposits, exploration methods in common use,and a description of the sequence of drilling that led to thediscovery and development of a typical uranium deposit.
ACKNOWLEDGMENTS— I wish to acknowledge the favorable in-fluence of ideas created a number of years ago by John E.Motica, Ranchers Exploration and Development Corporation,who recognized the importance of humic acids in forming ura-nium deposits and applied the concept to successful explorationprograms. These ideas were not generally accepted by explora-tion geologists at the time but have continued to prove true asmore facts have accumulated.
Regional geologyThe Grants mineral belt, located in northwest New Mexico, ex-
tends from several miles east of Laguna to the Gallup area, alength of 100 mi (160 km), and is about 25 mi (40 km) wide (fig.1). The region includes the Laguna, Ambrosia Lake, and ChurchRock districts (fig. 2), together with a new district beingdeveloped in the Crownpoint area. A large new deposit namedthe Nose Rock orebody is being developed by Phillips UraniumCo. 12 mi northeast of Crownpoint (Chapman, Wood and Gris-wold, Inc., 1977).
A recent wide-spaced drilling program by the U.S. Departmentof Energy intersected ore-grade uranium mineralization at adepth of 4,000 ft (1,530 m) in an area 24 mi northeast of Crown-point.
TABLE 1—NEW MEXICO URANIUM ORE PRODUCTION AND ORE RESERVES.JANUARY 1, 1978 (U.S. Department of Energy, 1978).
productionreserves$30-lb cost
total
tons of ore
59,850,000
318,000,000
377,850,000
grade% U,O,
0.21
0.12
0.33
million poundscontained UjO,
254
735
989
(49% of totalUnited States)
The Grants mineral belt contains nearly all of New Mexico'sreported uranium production and ore reserves. Production andreserves total nearly one billion pounds of UiO» (table 1). Severalof the nation's largest uranium orebodies are in the Grantsmineral belt.
Principal host rocks for the uranium deposits are fluvial sand-stones containing mudstone interbeds in the Westwater CanyonMember and Jackpile sandstone of the Morrison Formation (fig.3). In addition to the Jackpile sandstone, other unnamed sand-stone beds in the Brushy Basin Member of the Morrison Forma-tion host significant deposits. Other less important producinghost rocks, which are not discussed in this paper, are the DakotaSandstone (Cretaceous) and the Todilto Limestone, SummervilleFormation, and Entrada Sandstone (all Jurassic). Morrisonsandstones are fine to coarse grained, consist predominantly ofquartz with feldspar, and range in color from light gray to pale
"RATON
SANTAFE
a/urt.'ouEtMjue
SILVERCITY
£ARLSBAD
FIGURE 1—MAP OV NEW MEXICO SHOWING LOCATION OF GRANTSMINERAL. BELT.
[New Mexico Bureau of Mines & Mineral Resources, Memoir 38,1980]

DRILL HOLE
41
Uranium Deposits
^wp- Close-spaced Drilling^ (New Discoveries)
FIGURE 2—MAI'OI GKAMSMINI RAI HI I l
AMBROSIA LAKE DISTRICT LAGUNA DISTRICT
___ ^ ^ \ _ ^ _ ^ ~ _ — ^ - « ~ — ^ _ ^ SOUTHEAST
400
300
200
too
is ^
Southv-- >. , " DAKOTA,- .'Sandstone. . . . . , * - '
JOHNNY M. NorthOMX^££?W&%:>~ x : f f ^ ^ : ; ' J
400 FT.
FIGURE 3—GEOLOGIC SECTION SHOWING STRATICRAPHIC RELATIONS OF THE MORRISON FORMATION. Above: from Ambrosia Lake toLaguna; below: from south to north in Ambrosia Lake district.
[New Mexico Bureau of Mines & Mineral Resources, Memoir 38,1980]

42
reddish brown. The Westwater Canymi Member forms ablanket-like deposit that extends over most of the San Juan Basinand ranges from 50 ft (15 m) to over 250 ft (76 m) in thickness.The Westwater Canyon Member hosts ore deposits in the Am-brosia Lake, Church Rock, and Crownpoint districts as well as inthe Rio Puerco, Marquez, and Smith Lake areas.
The Jackpile sandstone hosts large uranium deposits in theLaguna district. It occurs in a northeast-trending channel that isabout 13 mi (21 km) wide in the Laguna area. The Jackpile is ab-sent in the Ambrosia Lake and Church Rock districts.
The larger ore deposits in the Morrison Formation tend to oc-cur in, but are not restricted to, the areas containing the thickestsandstone.
Description of orebodiesOrebodies in the Grants mineral belt range in size from a few
tons to several million tons. They are irregular in shape, areroughly tabular and elongate, and range from thin pods a fewfeet in width and length to bodies several tens of feet thick,several hundred feet wide, and several thousand feet long (fig. 4).The deposits tend to occur in clusters, and many form distincttrends that are parallel to sedimentary trends. A typical orebodymay occur in several layers that are generally parallel to enclosingbeds but may form rolls that cut across bedding (fig. 5). Primaryore is not related to present structural features; however, post-fault ore, also termed redistributed or stack ore, is related both tofaults and to iron-oxide staining. Most workers state that post-fault or stack ore is almost always near primary ore (Kendall,1971). Many of the orebodies exhibit a low-grade uranium halo,but several have no halo.
Mineral composition and alterationTypical primary ore consists of uranium-enriched humic mat-
ter that coats sand grains and impregnates the sandstone, im-
R 10 W
parting a dark color to the rock (Schmidt-Collerus, 1969). Adirect correlation exists between uranium content and organic-carbon content by weight percent (fig. b) in the ores (Moench andSchlee, 1967; Squyres, 1969; Kendall, 1971; Granger, 1962).Very little barren humate is reported in the host sandstones.Although coffinite and uraninite have been identified in theblack ores (fig. 7), their abundance is not sufficient to accountfor the total uranium content in an ore sample (Kittel, 1963). Theterm "uranium ore" implies the presence of economicallyrecoverable amounts of uranium oxide contained in the rock.Admixed and associated with the uranium are enriched amountsof organic carbon, vanadium, selenium, molybdenum, arsenic,manganese, iron, chromium, lead, rare-earth elements, tan-talum, nickel, antimony, boron, cobalt, copper, germanium,gallium, beryllium, cadmium, and magnesium (Finch, 1967; Lee,1976; Kendall, 1971; Squyres, 1969; Moench and Schlee, 1967).The deposits might be more accurately termed humate depositsthat contain enriched amounts of the metals listed above. Theenriched metals, other than uranium, are not present in sufficientquantity to be recovered economically.
Speculation has suggested that the uranium minerals were pre-cipitated from ground-water solutions and formed by a processof reduction of the uranium from the hexavalent (oxidized) to thetetravalent (reduced) state. Although one might assume that theuranium in black ores is in the reduced state because it isassociated with carbonaceous matter and pyrite, no concreteevidence appears in the literature determining the proportion ofhexavalent to tetravalent uranium in a typical ore sample. Posingthe question to an experienced uranium metallurgist resulted inthe statement that a major part of the uranium in black ores fromthe Grants belt is in the oxidized state, and a minor part of theuranium is in the reduced state (fig. 7). Laboratory studies todetermine the oxidation state of uranium in the ores would con-tribute to an understanding of the genesis of uranium deposits, asubject of considerable importance to exploration geologists.
8 W
-i- -iJOHNNY M
FIGURE 4—ORE DEPOSITS IN THE MORRISON FORMATION, AMBROSIA LAKE DISTRICT; GRID TICKS ON 1-MI SPACING (modifiedfrom Thaden and Santos, 1963, and Hilpert, 1969).

43
F I G U R E 5 — B I O C K D I A G R A M S H O W I N G R l l A I I O N O I P R I - I A I ' I I O R I B O D I I S I N A M I I K O M A L A M I M S I K H ' I ( f r o m G r a n g e r a n d o t h e r s , 1 9 6 1 ) .
Moderate to intense rock alteration that imparts a bleachedcolor to the rock is present in the vicinity of orebodies. Solutionof detrital feldspars and formation of authigenic quartz andfeldspar overgrowths in the Grants ores were first described byAustin (1963; this volume). Excellent papers b> Adams andothers (1974, 1978) provide accurate factual documentation ofthe compositional and spatial relationship of rock alteration toore. Austin (1963) recognized that humic acids were among theagents that caused alteration, and Adams and others (1978)document the importance of humic-acid alteration in the ore-forming process. Mudstone galls in and near ore and mudstonebeds beneath the bleached host rock commonly are bleachedgreenish gray. Mudstone galls with a red core and altered greenrim are common near ore. In cases where a red mudstone bedunderlies a bleached-sandstone host, the mudstone has an alteredgreen border at its contact with the sandstone. The green alteredzones range from less than one inch to several feet in thicknessand typically show an irregular lower boundary that is grada-tional into the red material.
The green mudstone contains less ferric iron and less total ironthan the red mudstone and was formed by removal of ferric ironfrom red mudstone (fig. 8), rather than by a process whereby theiron was reduced from ferric to ferrous (Weeks, 1951; Kendall,1971). No significant mineralogical difference is apparent be-tween the green and red mudstone.
Age of ore formationBlack ore is truncated by overlying sandstone scours in at least
three uranium deposits, limiting the age of ore formation to syn-genetic or early diagenetic. At the Johnny M mine (AmbrosiaLake district) a uranium-bearing humate pod within an even-bedded sandstone is truncated by an overlying cut-and-fill chan-nel sandstone (fig. 9). At the Paguate mine (Laguna district), theDakota Sandstone, containing barren carbonaceous matter,forms a knife-edge truncation of blebs of uranium-bearinghumate and uranium-bearing carbonized plant fragments thatoccur along crossbeds in the underlying Jackpile sandstone (fig.10) (Melvin, 1976). Nash and Kerr (1966) were the first to de-
scribe this feature, and they recognized its significance in limitingthe age of ore to pre-Dakota lime.
An overlying barren sandstone channel, trending east, trun-cates ore-bearing sandstone in the uppermost part of the West-water Canyon Member in a north-trending sandstone channel atthe Dog mine (south part of the Ambrosia Lake district).
Ore guides
3)4)
The above geologic relationships have been developed into thefollowing ore guides in general use in the Grants mineral belt foruranium deposits in the Morrison sandstones:
1) The presence of a proven host sandstone in the area.2) Anomalous uranium mineralization (mineralization in the
range of 0.01-0.03 percent UiO, and greater) in sandstoneis generally felt to be encouraging.Position of area with respect to mineralized trends.Color of host rock: Gray or bleached sandstones areconsidered to be favorable, and drab reddish rocks thatcontain hematite and exhibit no alteration are consideredunfavorable. However, large areas of Westwater Canyonsandstone are pale reddish brown and contain redistributediron oxides that are superposed on a previous alteration asrecorded by bleached claystones. Orebodies are known tooccur in this environment.Presence of carbonaceous matter and pyrite: Carbonizedplant fragments are more abundant in ore-bearing areasthan in barren ground, Pyrite is abundant in and near orebut also is common in areas lacking known orebodies.Bleaching of mudstone clasts or mudstone at base ofsandstone.Relative thickness of host rock: Thicker parts of asandstone channel are considered favorable; however, ma-jor deposits are known in sandstone less than 60 ft (18 m)thick.
8) Stratigraphic environment of host rock: A mixture ofinterbedded mudstones and clay-rich zones in the sandstoneis considered more favorable than massive clean sandstone.
5)
6)
7)
fNew Mexico Bureau of Mines & Mineral Resources. Memoir 38.19801

44
pi
3 c«?•Si ••• O
I
==3i
.•'*» . Organic Carbon in Parcantft i i i i i i i i i i
O.2 O.6 I.O 1.4 1.8 2.2
Q
0.01
a. Or-ub
O.I Percent i.o IO.O
O Uthiii I I I I I.20 .40 .60 .80 l.OO
Organic C in Weight Percent
FIGURE 6—CORRELATION or OR<;ANK CARBON WITH URANIUM CONTENT IN BLACK ORts.
[New Mexico Bureau of Mines & Mineral Resources, Memoir 38,1980]

45
80%
15
3%
2 %
Unidentifiable oxidizeduranium complexes
Uraninite
FIGURE 9—TRUNCATION OI I RANIUM BLARING HI'MAII POD cm K I » I inSANDsiiiNi scoi'R iMiovii. upper Wesiwater Canyon Member in theJohnny M mine. Ambrosia Lake district.
Origin of deposits
Orgono-nronium complexes
Coffinite
FIGURE 7 —MlNfcRAl. COMPOSITION Ol BLACK URANIUM OR1-S IN I HIJACKPII.I'. AND PAGUATF in-POSITS (from Kittel, 1963).
GRE15BEEN
LIGHTGREEN
GREEN RIMOF
CLAY GALL
GREEN RIMOF
CLAY GALL
DARKGREEN
DARK REDWITH
C0LC1TE
DARK RED
FIGURE 8—CORRELATION OK FERRIC-IRON CONTENT WITH COLOR OFMUDSTONE. NOTE: LESS TOTAL FERRIC-IRON IN GREEN MUDSTONE (data
from Kendall, 1971).
Origin of the uranium deposits in Morrison sandstones,although regarded as a key factor for a successful explorationprogram, is still a matter of considerable controversy. A largenumber of theories dating back to 1900 (Finch, 1967) cover thespectrum of possible sources and modes of transportation anddeposition of uranium in sandstone-type deposits (Squyres, 1970;Finch, 1967; Hilpert, 1969; Kelley, 1963; and Gruner. 1956).
A correct theory of origin must obviously accommodate thefactual evidence. The large amount of geologic data accumulatedover the years includes several key facts that place definite limitson the possible manner of origin:
1) Uranium and other metals are enriched in ore by humate(Schmidt-Collerus, 1969). (The presence of a concentratingagent is necessary for the material to constitute ore.)
2) The humate is relatively insoluble in a natural environmentbut fills pore spaces of the sandstone as a solution would.(The humate must be introduced into the rock as a liquid orgel consisting of solubilized humic acids.)
3) Truncation of uranium-bearing humate pods byintraformational sandstone scours has been documented.(Truncation limits the age, of at least the humate pod, to aprescour time or to a syngenetic age. This age limitation inturn limits the humic-acid solutions to an origin contem-poraneous with the sedimentary system being deposited atthat time.)
4) Coalified or carbonized plant fragments are common inand near ore.
5) Rocks in the vicinity of ore are strongly altered: feldsparand quartz are corroded, silica has been redeposited, andferric iron has been removed from mudstones. (Humicacid, known to have been present, is the only likelycausative agent for the observed alteration.)
6) Laboratory and field studies have proved that humic acidsare capable of:a) solubilizing and mobilizing the metals found in ore at
significantly high concentrations in natural water(Bloomfield and Kelson, 1973; Ong and others, 1971;Manahan, 1975; Schnitzerand Khan, 1972);
b) significantly enriching metals in precipitated humicacid: humate (Szalay, 1958; Vine and others, 1958;Schnitzer and Khan, 1972; Manskaia and others, 1956;Baker, 1973); and
c) solubilizing rock-forming minerals in sediments (Huangand Keller, 1970, 1971, 1972a, b).
These facts support the following possible origin for theuranium deposits: 1) Surface waters leached soluble humic acids

46
imj ss
i. Jackpile Sandstone
PAGVATE MIM JACKPILE MINE
TRUNCATION OF ORE BY DAKOTASANDSTONE
AMBROSIA LAKE AREA
OFFSET OF OREBY PRE DAKOTA
FAULTSO 3
1 1 1 !O 100
I ISCALE:-FOOT SCALE:-INCHES SCALE:-FEET
F I G U R E 10—A(il- Oh URANIUM MINI'.KAI IZATION. GRANTS MINI-.KA1 Bl.l I lltl AfK ORLSI.
i , ,„
: / • . ; •
\ 1
\\ " fS h
DakotaSandstone
BrushyBasin
Wesfwater
V W^^-I S B r5.5'-0.54%
i f ' ^ W»
Gamma < ^ >
^44*4Potential \ L, L
RecaptureResistivity curve
X
MK
-tt
from decaying vegetation. 2) The humic acids weie carried down-stream, accumulating and concentrating metals. 3) Eventuallythese acids reached an environment where they coprecipitatedwith the enriched metals, forming an ore deposit. 4) Subsequentcoaliftcation of (he metal-bearing humic acids and diagenesisresulted in the ore-bearing humate that makes up the presentdeposits.
Exploration
FIGU RE 11 —TYPICAL GEOPHYSICAL LOG.
MethodsCurrent exploration practices involve using the previously
mentioned ore guides, after selecting an area of interest, toevaluate drill data and direct a drilling program toward discov-ery. Company objectives, the geologic setting of an area, and aconcept of the origin of sandstone uranium deposits influence theoverall exploration program both in selection of areas that meritdrilling and in balancing the exploration effort among severaltargets.
Early exploration in the Grants mineral belt was concentratednear the outcrop but soon moved into areas in which the ore-bodies have no surface expression and require drilling. Drillingdepths to Morrison sandstones in current exploration programsrange from 500 ft (150 m) to more than 5,000 ft (1,500 m), de-pending on topography and the distance from the outcrop.
Holes are drilled by a truck-mounted rotary rig to a depth suf-ficient to test the host sandstones. Upon completion, the hole isprobed by a geophysical logging truck, which records gamma-ray, resistivity, and self-potential curves (fig. 11). Drill cuttingsare caught over each 5-ft interval, examined for significant data,and logged by a geologist. The geophysical log and cuttings logprovide the basic drill-hole information used by most explorationgroups. Other down-hole techniques not in general use are beingevaluated by various companies and the U.S. Department ofEnergy. Among these techniques are geochemical analysis of for-mation water and drill cuttings, radon or helium determinationat depth, remnant magnetism, induced polarization, and analyticand petrographic studies of drill core.
Drilling is commonly conducted in three stages: 1) delineatingfavorable ground by wide-spaced drill holes (from one-half to
[New Mexico Bureau of Mines & Mineral Resources, Memoir 38,1980]

47
several miles apart), 2) seeking mineralization in favorableground by closer spacing of drill holes (perhaps as many as fiveor ten holes per square mile), and 3) closely spaced drilling inmineralized areas to intercept ore-grade uranium mineralization.
Once a discovery is made, four equidistant holes are drilled tooffset the discovery hole, and the resulting ore holes are againoffset. The purpose of offset drilling is to assemble a grouping ofadjacent ore holes that is as large as possible, bordered by a rimof non-ore holes. Barren or slightly mineralized holes are not off-set. This is regarded as the most efficient method of determiningan orebody outline that cannot be predicted before drilling.
Johnny M mineBased on geologic criteria, broad areas of favorable ground
may be outlined by interpreting drilling results; however, in-dividual orebodies often present difficult drilling targets. An ex-ploration program consisting of drill holes on 1-mi centersthroughout the Ambrosia Lake area could fail to intersect asingle orebody and miss the entire district containing 250 millionlbs of U,O, (fig. 4).
A description of the sequence of drilling, from ore discovery tothe development of a mine at the Johnny M uranium deposit inthe east part of the Ambrosia Lake district (fig. 4), provides anexample of the problems of predicting where orebodies may oc-cur within a given area. The Johnny M mine, owned jointly byRanchers Exploration and Development Corporation and HNGOil Company, comprises sec. 7 and E'/z sec. 18, T. 13 N., R. 8W. Prior to beginning mining operations, surface-drilled orereserves on sec. 7 were estimated at 350,000 tons of ore contain-ing 3,500,000 lbs of U,O,. A shaft 1,350 ft (410 m) deep islocated on the line between the two sections.
Ore is being produced from one orebody in sec. 18 and threeseparate orebodies in sec. 7, all located in sandstones within theupper part of the Westwater Canyon Member of the MorrisonFormation (figs. 3, 11; Falkowski, this volume).
The following discussion of drilling results will be restricted tosec. 7, a 1-sq-mi tract of land. An option for lease covering sec. 7was acquired from the Santa Fe Pacific Railroad Co. by a win-ning bid of $49,900 in September 1968. The decision to bid wasbased on projecting a belt of favorable trends into the section. Adrill map at the time of acquisition (fig. 12) shows a total of nine
randomly spaced holes drilled by a previous lessee during the1950's. Geophysical logs of the holes obtained after acquiring theproperty did not indicate that undiscovered orebodies might oc-cur nearby, yet one hole contained a thin zone of anomalousuranium mineralization in a basal Westwater Canyon sandstone,which later proved to be unrelated to the orebodies.
A program of randomly spaced drilling was started in October1968, shortly after acquiring the properly, and uranium ore wasdiscovered on November 20, 1968, in the fifth drill hole com-pleted (fig. 13). The ore zone averaged 0.54 percent eU.O, over athickness of 5.5 ft (1.7 m) at a depth of 1,375 ft (420 m). The ore-bearing sandstone appeared to correlate stratigraphically withthe producing sandstone at the Cliffside mine (Clark and Haven-strite, 1963) located 1.5 mi (2.4 km) northwest of sec. 7. Al-though sec. 7 is south of the producing trends of the AmbrosiaLake district, the potential appeared good for developing anorebody. Superimposed on the drill map (fig. 13) are the outlinesof orebodies, unknown at the time, that were developed by an ex-tensive drilling program. Had the discovery hole been located 150ft (45 m) east of its actual position, it would have missed uraniummineralization in the ore-bearing sandstone, a fact confirmed bya later drill hole. One of the previous lessee's drill holes waswithin 300 ft (90 m) of the later-delineated northwest orebody.
Drilling was continued using a program of widely spaced holeswhile four drill sites were being prepared 200 ft (60 m) northwest,northeast, southeast, and southwest of the discovery hole. Theeighth drill hole (fig. 14) intersected ore-grade uranium mineral-ization, which did not extend to nearby offset holes that weresubsequently drilled. The seventh drill hole penetrated the hostsandstone but gave no significant indication of a nearby orebodythat was later discovered within a distance of 20 ft (6 m).
Offset drilling, together with a program of randomly spaceddrilling, was resumed in the area of the northwest orebody in asearch for additional orebodies. The southeast orebody was dis-covered July 31, 1969, by the 109th hole drilled (fig. 15). The orewas intercepted just before abandoning close-spaced drilling inthe area. By then, two drill holes had been completed within 20 ft(6 m) of the south-central orebody, which <vas yet to bediscovered.
The 169th drill hole (completed February 20, 1970) discoveredthe south-central orebody (fig. 16), which was blocked out by
JOBNKY M...SHAFT
FIGURE 12—DRILL MAP OF SEC. 7, T. 13 N., R. 8 W., SHOWING HOLESDRII i ED BY PREVIOUS LESSEE; map area 1 mi square, north at top. Shaftlocated on south section line to mine ore subsequently discovered insec. 7 and an orebody later acquired to the south.
o
oJOHNNY M.
..SHAFTFIGURE 13—DRILL MAP AT TIME OF DISCOVERY OF URANIUM ORE IN FIFTH
HOI E DRILLED; map shows outline of orebodies subsequently developedby drilling.
[New Mexico Bureau of Mines & Mineral Resources, Memoir38,1980]
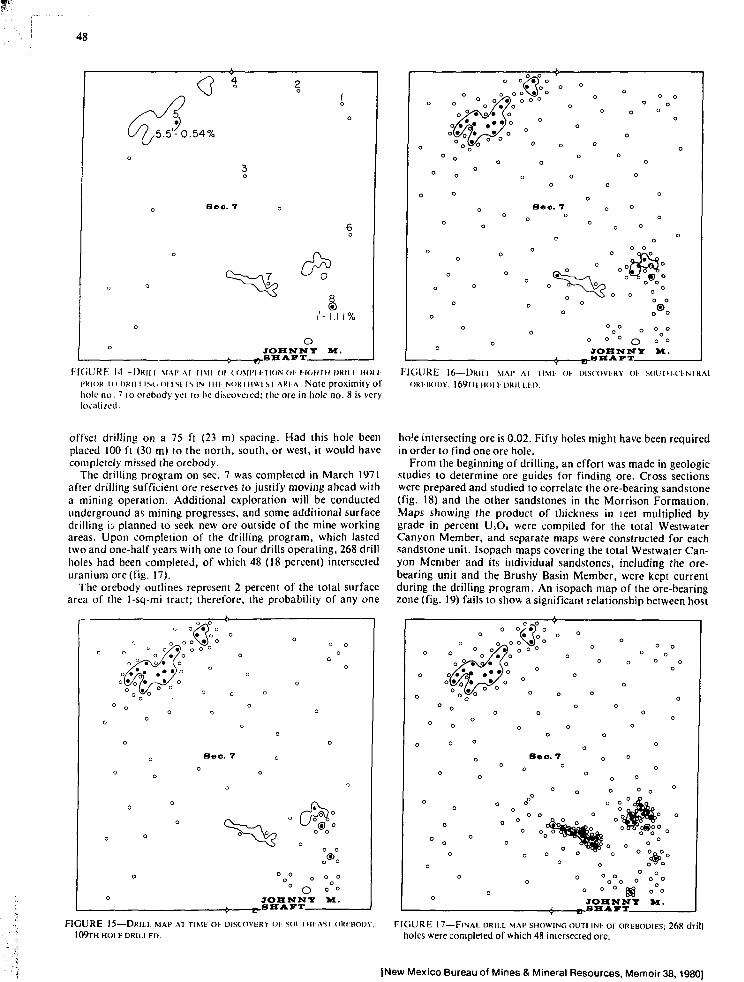
48
-0 .54%
I'- I.I 1%
JOHNNY M.
o o0 o
o o
o o0 0 o o °
o o o o o ° o
JOHNNY M.
FIGURE 14—DRIII MAP AI mi l oi (OMl'i H K I N OI I i d u m DKII I HOII FIGURE 16—DRIII MAP AI TIMI m DISCOVERY in- soimi-ciNTRAl
PRIOR in DKII I isd (Hisi ' is IN mi- NORiiiwisi ARIA Note proximity of ORI IIODV. 169m HOI i- DRII i l l ) ,
holt; no. 7 IO orebody yei to he discovered; the ore in hole no. 8 is verylocalized.
offset drilling on a 75 ft (23 m) spacing. Had this hole beenplaced 100 ft (30 m) to the north, south, or west, it would havecompletely missed the orebody.
The drilling program on sec. 7 was completed in March 1971after drilling sufficient ore reserves to justify moving ahead witha mining operation. Additional exploration will be conductedunderground as mining progresses, and some additional surfacedrilling is planned to seek new ore outside of the mine workingareas. Upon completion of the drilling program, which lastedtwo and one-half years with one to four drills operating, 268 drillholes had been completed, of which 48 (18 percent) intersecteduranium ore (fig. 17).
The orebody outlines represent 2 percent of the total surfacearea of the 1-sq-mi tract; therefore, the probability of any one
X vO ° °
JOHNNY M.
FIGURE 15—DRILL MAP AT TIME OF DISCOVERY OI- SOUTHI-AST ORCROUY.
109TH HOLK DRILLED
hole intersecting ore is 0.02. Fifty holes might have been requiredin order to find one ore hole.
From the beginning of drilling, an effort was made in geologicstudies to determine ore guides for finding ore. Cross sectionswere prepared and studied to correlate the ore-bearing sandstone(fig. 18) and the other sandstones in the Morrison Formation.Maps showing the product of thickness in leet multiplied bygrade in percent UjO, were compiled for the total WestwaterCanyon Member, and separate maps were constructed for eachsandstone unit. Isopach maps covering the total Westwater Can-yon Member and its individual sandstones, including the ore-bearing unit and the Brushy Basin Member, were kept currentduring the drilling program. An isopach map of the ore-bearingzone (fig. 19) fails to show a significant relationship between host
o o/rt o o io /•/o
o oo
O o
8«o. 7
JOHNNY M.u8HAII
FIGURE 17—FINAL DRILL MAP SHOWING OUTLINE OF OREBODIES; 268 drillholes were completed of which 48 intersected ore.
[New Mexico Bureau of Mines & Mineral Resources, Memoir 38,1980]

49
NORTHWEST OREBODY CENTER OF SECTION 7 SOUTHEAST OREBODY
MANCOSSHALE
DAKOTASANDSTONE
u.
s£0s
BRUSHYBASINMEMBER
9'-0.69%
WEST WATERCANYONMEMBER
RECAPTUREMEMBER y--<
f •' • • \
OREBEARING
MOO1
CLAY PRESENT
-4 - 1500'
-HI 100
1000'
- I2001/ . .a45%
Z0NE2'-2.89% ;
--I4001
* L D-I5J6 1 D-145T I 3 N - R 8 W - Sec. 7 ; Mc"RlNLEY COUNTY. NEW "MEXICO
F I G U R E 18—REPRESENTATIVE DRILL I.OCJS.SfcC. 7.
thickness and ore. Sandstone color maps were prepared fromdrill cuttings, and structure contour maps were constructed on adatum in the Dakota Sandstone. None of these maps showed asignificant relationship of geologic features to known uraniummineralization.
Drill cores were taken of ore from each of the three orebodies
F I G U RE 19—ISOPACH MAP OF ORE-BEARING SANDSTONE UNIT, which Showsno significant relationship to ore (thickness in feet).
to determine radiometric equilibrium and to perform mill-amenability studies. All of the ore consists of the black, humicmatter that contains the uranium values. Good correlation existsbetween radiometric and chemical assays of the cores.
Early in the program, the geologic studies clearly identified aspecific stratigraphic interval hosting all of the orebodies, and itbecame possible to correlate this unit throughout sec. 7. The ore-bearing zone, or host (fig. 18), consists of a basal sandstonesequence, a middle mudstone or clay-rich zone, and an uppersandstone sequence. The base of the ore-bearing unit is underlainby a continuous mudstone bed that extends over all of sec. 7, ex-cept for a northeast-trending belt in the south part. The top ofthe ore-bearing unit is overlain by mudstone beds that are persist-ent throughout sec. 7 except in the northwest part.
The clay-rich unit in ore-bearing areas either underlies ore oractually hosts the ore-grade mineralization; it is absent over largebarren areas. The map distribution of this favorable unit appearsto correlate well with the ore (fig. 20). No ore has been foundoutside areas containing the clay-rich unit; the orebodies foundto date occur at the margin of the unit. This particular featurehelped to discover the south-central orebody.
The spatial relationship of uranium ore to the margins of clay-rich zones suggests that the clayey environment was a factor inprecipitation and fixation of the mobile humic acids, containingenriched metals, at the time of origin of the orebodies. Labora-tory experiments and field observation document three ways inwhich humic acid is precipitated from slightly alkaline water: 1)by contact with a slightly acidic environment, 2) by mixing withbrackish waters containing abundant cations such as aluminum,iron, and magnesium, and 3) by complexing and adsorption onclay minerals (Swanson and Palacas, 1965).
The map distribution of anomalous uranium mineralization inthe ore-bearing unit (fig. 20) documents the lack of significantmineralized haloes to some of these orebodies.
[New Mexico Bureau of Mines & Mineral Resources, Memoir38,1980]

50
) V1...-.H rr.ii> showing distribution of ore H/';.'».<... ol uroniun) mineralization Gj.\r.•'. <-*tent ol area underlain by favorableri't. Jstnnr rnudbtune gall zone Q
I K i l ' K l : 20—-DRII t MAI'OI SAMI-. ARIA AS SHOWN IN HCi. 19.
ConclusionsThe search for uranium deposits is a risky undertaking that re-
quires a combination of geologic skill with a genetic model basedon fact, experience in interpreting the significance of drill results,persistence, and a measure of good fortune.
Future potential for the discovery of significant new uraniumdeposits in the Grants mineral belt remains excellent, as evi-denced by the discovery of several large deposits over the pastdecade. However, there are economic limitations created by drill-ing to depths greater than 3,000 ft, which requires large capitaloutlays and increased operating costs.
Uranium exploration in the Grants mineral belt is now wellinto its third decade of searching for and finding uraniumdeposits. One of the greatest challenges of uranium explorationwill be developing a method of enlarging the target area of an un-discovered orebody so that widely spaced drill holes can yielddata pointing to an ore deposit several hundred feet away. Re-search directed toward identifying the tracks left by solublehumic acids and their enriched metals enroute to a site of deposi-tion, together with determining a concentration gradient alongthis path, should prove rewarding.
ReferencesAd. ms, S. S., Curtis, H. S., and Hafen, P. L., 1974, Alteration of
6c riial magnetite, ilmenite in continental sandstones of the MorrisonrV nation, New Mexico, in Formation of uranium deposits: Vienna,Iir> -.ational Atomic Energy Agency, p. 219-253
Adam-., S. S., Curtis, H. S., Hafen, P. L., and Salek-Nejad, H., 1978, In-icrpu .niion of post-depositional processes related to the formation anddesnuii.on of the Jackpile-Paguate uranium deposit, northwest NewMexico i conomic Geology, v. 73, p. 1635-1654
Austin, S K., 1963, Alteration of Morrison sandstone, in Geology andtechnology of the Grants uranium region, V. C. Kelley, compiler: NewMexico Buiciiu of Mines and Mineral Resources, Mem. 15, p. 508-521
Baker, W. E., 1973, The role of humic acids from Tasmanian podzolicsoils in mineral degradation and metal mobilization: Geochimica etCosmochimica Acia, v. 37, p. 269-281
Bloomfield, C , and Kelson, W. I., 1973, The mobilization and fixationof molybdenum, vanadium, and uranium by decomposing plant mat-ter: Journal of Soil Science, v. 24, no. 3, p. 368-379
Chapman, Wood and Griswold, Inc., 1977, Geologic map of Grantsuranium region: New Mexico Bureau of Mines and Mineral Resources,Geol. Map 31 rev.
Clark, D. S., and Havenstrite, S. R., 1963, Geology and ore deposits ofthe Cliffside mine, Ambrosia Lake area, in Geology and technology ofthe Grants uranium region, V. C. Kelley, compiler: New MexicoBureau of Mines and Mineral Resources, Mem. 15, p. 108-116
Evans, W. D., 1964, The organic solubilization of minerals in sediments:Advances in Organic Geochemistry, no. 15, p. 263-270
Finch, W. I., 1967, Geology of epigenetic uranium deposits in sandstonein the United States: U.S. Geological Survey, Prof. Paper 538, 121 p.
Granger, H. C , 1962, Clays in the Morrison Formation and their spatialrelation to the uranium deposits at Ambrosia Lake, New Mexico: U.S.Geological Survey, Prof. Paper 450-D, p. D15-D20
Granger, H. C , Santos, E. S., Dean, B. G., and Moore, F. B., 1961,Sandstone-type uianium deposits at Ambrosia Lake, New Mexico—aninterim report' "-onomic Geology, v. 56, no. 7, p. 1179-1210
Gruner, J. W., 1916, Concentration of uranium in sediments by multiplemigration-accretion: Economic Geology, v. 51, no. 6, p. 495-520
Hilperl, L. S., 1969, Uranium resources of northwestern New Mexico,U.S. Geological Survey, Prof. Paper 603, 166 p.
Huang, W. H., and Keller, W. D., 1970, Dissolution of rock-formingsilicate minerals in organic acids: American Mineralogist, v. 55, p.2076-2094
, 1971, Dissolution of clay minerals in dilute organic acids at roomtemperature: American Mineralogist, v. 56, p. 1082-1095
-, 1972a, Kinetics and mechanisms of dissolution of Fithian illite intwo complexing organic acids: International Clay Conference, Pre-prints, v. 1, p. 385-396
, 1972b, Organic acids as agents of chemical weathering of silicateminerals: Nature Physical Science, v. 239, p. 149-151
Kelley, V. C , compiler, 1963, Geology and technology of the Grantsuranium region: New Mexico Bureau of Mines and Mineral Resources,Mem. 15, 277 p.
Kendall, E. W., 1972, Trend orebodies of the Section 27 mine, AmbrosiaLake uranium district, New Mexico: Ph.D. thesis, University ofCalifornia (Berkeley), 167 p.
Kitlel, D. F., 1963, Geology of the Jackpile mine area, in Geology andtechnology of the Grants uranium region, V. C. Kelley, compiler: NewMexico Bureau of Mines and Mineral Resources, Mem. 15, p. 167-176
Lee, M. J., 1976, Geochemistry of the sedimentary uranium deposits ofthe Grants mineral belt, southern San Juan Basin, New Mexico: Ph.D.thesis, University of New Mexico, 241 p.
Manahan, S. E., 1975, The environmental chemistry of humic materialsas related to trace substances—results of a computerized VVRSICbibliographic literature search: University of Missouri, 9lh annual con-ference on trace substances in environmental health
Manskaia, S. M., Drozdova, T. V., and Emelianova, M. P., 1956, Bind-ing of uranium by huminc acids and by melanoidines: Geochemistry,no. 4, p. 339-356
Melvin, J. W., 1976, Systematic distribution of large uranium deposits inthe Grants uranium region, New Mexico, in Tectonics and mineralresources of southwestern North America, L. A. Woodward and S. A.Northrop, eds.: New Mexico Geological Society, Spec. Pub. 6, p.144-150
Moench, R. H., and Schlee, J. S., 1967, Geology and uranium deposits ofthe Laguna district, New Mexico: U.S. Geological Survey, Prof. Paper519, 117p.
Nash, J. T., and Kerr, P. F., 1966, Geologic limitations of the age ofuranium deposits in the Jackpile sandstone, New Mexico: EconomicGeology, v. 61, p. 1283-1290
Ong, H. L., Swanson, V. E., and Bique, R. E., 1971, Natural organicacids as agents of chemical weathering, in U.S. Geological Survey,Prof. Paper 700-C, p. C13O-C137
Schmidt-Collerus, J. J., 1969, Investigations of the relationship betweenorganic matter and uranium deposits, Pt. II—Experimental investiga-tions, final report: Denver Research Institute, 192 p.
Schnitzer, M., and Khan, S. U., 1972, Humic substances in the environ-ment: New York, Marcel Dekker, Inc., 327 p.
Squyres, J. B., 1970, Origin and depositional environment of uraniumdeposits of the Grants region. New Mexico: Ph.D. thesis, StanfordUniversity, 228 p.
Swanson, V. E., and Palacas, J. G., 1965, Hum ate in coastal sands ofnorthwest Florida: U.S. Geological Survey, Bull. 1214-B, 29 p.
Szalay, A., 1958, The significance of humus in the geochemical enrich-
[New Mexico Bureau of Mines & Mineral Resources, Memoir 38,1980]

51
mem of uranium: 2nd United Nations international conference on (he dustry, January 1, ]978: Grand Junction. Bendix Field Engineeringpeaceful uses of atomic energy, Proc, v. 2, Survey of raw material Corp., GJO-IOO(78), 91 p.resources, p. 182-186 Vine, J. D., Swanson, V. E., and Bell, K. G., 1958, The role of humic
Thaden, R. E., and Santos, E. S., 1963, Map showing the general struc- acids in the geochemistry of uranium: 2nd United Nations internationaltural features of the Grants district and the areal distribution of the conference on the peaceful uses of atomic energy, Proc, v. 2, Survey ofknown uranium ore bodies in the Morrison Formation, in Geology and raw materials resources, p. 187-191technology of the Grants uranium region, V. C. Kelley, compiler: New Weeks, A. D., 1951, Red and gray clay underlying ore-bearing sandstoneMexico Bureau of Mines and Mineral Resources, Mem. 15, between p. of the Morrison Formation in western Colorado: U.S. Geological20and21 Survey, Trace Elements Memo. Rept. 251. 19 p.
U.S. Department cf Energy, 1978, Statistical data of the uranium in-
[New Mexico Bureau of Mines & Mineral Resources, Memoir 38,1980]

52
GEOCHRONOLOGIC STUDIES IN THEGRANTS MINERAL BELT
by Douglas G. Brookins, Department of Geology, University of New Mexico,Albuquerque, New Mexico 87131
AbstractGeologic observation coupled with radiometric age dating can
be used to assess ages of ore formation and, in some cases, agesof sedimentation in the Grants mineral belt. Rb-Sr studies in-dicate the earliest mineralization is trend ore at Ambrosia Lakeand Smith Lake, dated at 139±9.5 m.y. This date is similar tothat for barren-rock montmorillonite from the Jackpile sand-stone (Late Jurassic): 142±14 m.y.; it may be used, withcaution, to indicate the minimum age of sedimentation for theMorrison Formation. Geologic evidence indicates epigeneticrather than syngenetic ore formation. Barren-rock mont-morillonites from Ambrosia Lake yield a poorly defined iso-chron of 132 ±26 m.y.; these samples may have been affected bypost-fortnational processes. Early formed ore at the Jackpile-Paguate mine, Laguna district, was remobilized and reprecip-itated at 113 ± 7 m.y. This date is older than the range of datesfor the Dakota Formation (Cretaceous) (K-Ar dating: 90-94m.y.; Rb-Sr dating: 93 ± 8 m.y.) and Mancos Shale (K-Ar dating:82-89 m.y.; Rb-Sr dating: 93 ±11 m.y.). The 113 ±7 m.y. mid-Cretaceous date for the Jackpile-Paguate ore is consistent withgeologic evidence; geologic control suggests that other oredeposits are post-Late Jurassic but pre-Dakota Formation. Basedon geologic evidence (Gabelman, 1956), mineralization in theDakota Formation is thought to be very young. Laramide miner-alization (60-70 m.y.) is evidenced by the presence of some stackore. Other, roll-type ore may be post-Late Jurassic, pre-Laramide, or post-Laramide. At least one uranium deposit,located partly in oxidized ground at the main redox front of theGrants mineral belt, may represent Tertiary mineralization; theclay-mineral Rb-Sr systematics o ' this deposit have been severelyperturbed. Younger mineralization is indicated by U-Pb dates onuranophane (9-10 m.y.), and Pleistocene mineralization (50,000-150,000 y.) is noted for some ore. U-Pb dates on U4t -rich oreminerals cluster between 80 and 100 m.y., although some are asold as 140-150 m.y.; the significance of the clustering isunknown. K-Ar dales on clay minerals range from 49 to 138 m.y.The reasons for this scatter are not known, although loss ofradiogenic40Ar due to burial is probable.
IntroductionBased on crosscutting relationships and other geologic obser-
vations, evidence indicates that mineralization in the Grantsmineral belt has occurred at several times. Periods of mineraliza-tion often agree with hypotheses for ore deposition. Syngeneticor very early epigenetic ore must be Late Jurassic for deposits inthe Morrison, although some redistribution of ore occurred inpost-Late Jurassic but pre-Cretaceous Dakota Formation time(Adams and others, 1978). Granger (1968) proposed that the oredeposits of the Grants mineral belt were formed by leaching ofuranium from the Dakota Formation, making the age of min-eralization about 94 m.y. or younger. Stack ore associated withLaramide faulting is younger than the primary ore and may beused to infer mineralization of about 60-70 m.y. (Laramideorogeny). Hydrothermal solutions associated with the Laramidehave also been proposed (Gabelman, 1956). Post-Laramide min-eralization has been inferred for some deposits in oxidizedground near the main redox front of the Grants mineral belt. A10-m.y. date for uranophane (discussed herein) is one example.Supergene mineralization for many types of uranium deposits,including the Grants mineral belt, has been proposed (Langford,this memoir), as have polygenetic models (Gruner, 1956).
Radiometric age determinations, especially by the U-Pbmethod, for ore and gangue minerals have been attempted infre-quently, although the ages are difficult to interpret. More recent-ly, K-Ar and Rb-Sr ages have been attempted for clay mineralspenecontemporaneous with uranium minerals. The K-Ar ages ex-hibit wide scatter, whereas some of the Rb-Sr ages suggest agreater degree of reliability. These dates, coupled with geologiccontrol, are used below to discuss periods of mineralization inthe Grants mineral belt.
ACKNOWLEDGMENTS—Partial financial support for this workwas provided by the U.S. Energy and Research DevelopmentAgency (Contract USERDA AT05-1-I636); the U.S. Departmentof Energy—Bendix Field Engineering Corporation (ContractBFEC #76-029E); and the University of New Mexico, ResearchAllocations Committee. R. S. Delia Valle, J. K. Register, R, T.Hicks, R. M. Lowy, J. T. Place, W. C. Riese, and M. E. Reg-ister, all of the University of New Mexico, provided thoughtfuldiscussion and laboratory assistance.
Radiometric age datingRadiometric age determinations for rocks and minerals rely on
the following assumptions: 1) the mineral or rock must have re-mained a closed system since the time of formation (that is, theremust be no gain or loss of parent or daughter isotopes in thedecay scheme of interest), 2) the amount of the initial daughterisotope must be known, and 3) the rate of decay of the radio-active parent to the one or final stable daughter-isotope productmust be known. The time during which the mineral or rock wasforming is for purposes of age determinations assumed to beshort, relative to its absolute age. Additionally, both parent anddaughter elements must be present in measurable quantities.
Uranium-lead studiesUranium-lead age determinations from the Grants mineral belt
are often difficult to interpret; unavoidable difficulties existwhen dating cryptocrystalline to poorly crystallized minerals,which are often mixed in complex fashion with organic carbon-aceous matter, secondary uranium minerals, and sulfides ofpossibly several generations. An importanl exception to the fun-damental assumptions for radiotnetric dating is the knowledgethat if the mineral contains an abundance of parent isotope f ' Uor 218U) and little original daughter isotope (""Pb or 206Pb), theradiogenic lead/original lead ratio may be sufficiently high sothat only a small error is introduced by lack of precise knowledgeof the amount of original lead. Some uranium minerals containvirtually no original lead; therefore, in theory, they are ideal foruranium-lead dating, assuming the other criteria for radiometricage determinations are met. Finally, the decay constants for 235Uand 238U have been revised (Steiger and Jaeger, 1977) and areknown within acceptable limits of accuracy.
The criterion of system closure for uranium-lead dating ofsedimentary uranium deposits is difficult to assess. Complexitiesarise in both the 238U and 23SU decay chains owing to the numberof intermediate daughters formed before final formation of 2MPband 207Pb. Since the half lives of the intermediate daughters inthe 238U chain are longer than those of the235U decay chain, thereis a greater possibility of loss of one or more intermediatedaughter products from the former chain. In the238U chain, lossmay occur from: a)2MU, which is commonly hexavalent and thussoluble, b) 226Ra, which is known to be lost (some barite, BaSO ,
[New Mexico Bureau of Mines & Mineral Resources, Memoir 38,1980]

53
is rich in 226Ra and referred to as radiobarite; Granger, 1963),c) 222Rn, a noble gas which is present in relatively large quantitiesin some of the mines of the Grants mineral belt. (This radon maybe due to many sources, not just uranium minerals in ore zones.)
Because there is a greater possibility of loss of radioactivedaughter isotopes from the 238U decay chain, the 2"U-207Pb agesfrom the Grants mineral belt are considered more reliable thanthose by the 2J8U-2O6Pb method. Radiogenic (•) lead loss may alsooccur, since Pb2 ' does not substitute easily for U4+ sites in mostminerals. Even the 2"U-207Pb dates, however, are possibly mini-mum dates, owing either to loss of radioactive daughters of :'5Uor to loss of *207Pb. The reliability of uranium-lead dates issometimes determined by the age obtained from the M7Pb/2O6Pbdates. Lee and Brookins (1978, table I) have summarized someof the earlier uranium-lead dates. "8U-:"; b dates range from 78to 88 m.y., 2»U-2O7Pb dates from 90 • 07 m.y., and 2°7Pb/2l»Pbdates from 154 to 820 m.y. Th, " Pb/20<)Pb dates are clearlyunreliable and, because of uncertainties in the 23»U-2O6Pb method,the 235U-2O7Pb dates are interpreted as minimum dates.
Recently, Leventhr.! and Threlkeld (1978) referred to unpub-lished discordant M»U-2l*Pb and 2»U-2O7Pb apparent ages of81-150 m.y. on unspecified Morrison Formation ore. The 2"U-207Pb dates tend to cluster between 80 and 107 m.y., but the sig-nificance of this clustering, if any, is unknown at the presenttime.
I recently obtained uranium-lead dates from uranophane. Theanalytical work was carried out at Teledyne Isotopes (Westwood,New Jersey). The sample contained 22.135 percent total uraniumand 286.7 ppm lead. Using a Pb,, correction based on troilitelead, the dates are: 2'8U-206Pb: 9.2 m.y.; 235U-2ll7Pb: 10.3 m.y.;207Pb/206Pb: 296 m.y. (estimated). This uranophane is of interestbecause it cements oxidized sandstone near one of (he AmbrosiaLake mines (proprietary location), unlike most uranophane,which occurs as bloom or fissure fillings. The age of thisuranophane is possibly Miocene, but better interpretation mustawail a more precise determination of Pbo. The lack ofassociated organic matter and pyrite with this uranophane sug-gests its formation at sulfate-stable Eh conditions during the Ter-tiary. The source of uranium is probably from the destruction ofolder, Late Jurassic(?) uranium ore as the uranophane occursnear the main redox front of the Grants mineral belt; however,other sources for the uranium cannot be ruled out.
Potassium-argon studiesThe advantages of the potassium-argon method are that usual-
ly no 40Aro is present, and no intermediate daughter isotopes areformed between decay of'"K to M0Ar plus 40Ca. The decay con-stant for40K is given in Steiger and Jaeger (1977).
Potassium-argon analyses have been attempted for some clay-sized and silt-sized fractions of ore-zone samples from the Grantsmineral belt (Brookins and others, 1977). Apparent ages rangefrom 45 to 139 m.y. for the clay-sized (-2^) material, and twosilt-sized fractions yield apparent dates of 141 and 244 m.y.The samples were rich in chlorite and/or mixed-layer illite-montmorillonite, and some were rich in illite. These mineralshave been shown to form at the expense of pre-existing mont-morillonite (Brookins, abstract in this volume). The apparentlylow ages for the clay-sized fraction may be the result of loss ofradiogenic ^Ar owing to burial or to potassium fixation in post-formational time (Perry, 1974). Loss of <40Ar from illitic clayminerals owing to burial has been demonstrated by Perry (1974)for Gulf Coast clay minerals. Because the Morrison Formationwas uplifted, tilted, and eroded prior to burial and deposition ofMesozoic and Tertiary sediments, several periods of >40Ar lossand/or potassium fixation may have occurred well after clay-mineral formation accompanying mineralization. The two clay-sized samples yielding the oldest K-Ar dates, 104 and 138 m.y.,both contain authigenic K-feldspar not noted in scanning-electron-microscope study of the other samples (Brookins, 1979).
This implies that K-feldspar-bearing samples may be more suitedfor potassium-argon dating in these rocks than the clay-mineral-rich samples (although more work in (his area is planned); atpresent, however, the potassium argon method must be con-sidered less reliable than the other methods.
Rubidium-strontium studiesThe rubidium-strontium method has the following favorable
aspects: a) rubidium is always camouflaged in potassium-bearingminerals and thus is widespread in occurrence; b) tht half life of*7Rb is extremely long (48.8 b.y.; Steiger and Jaeger, 1977);c) 87Rb decays to '87Sr, and the latter is usually compatible in theRb site; and d) the decay takes place without intermediatedaughters. In many sedimentary rocks, however, calcium is fre-quently more abundant than potassium. Because strontium sub-stitutes for calcium with ease and also for potassium with relativeease, the87Sr,, may be so abundant that measurement ot"K7Sr isvery difficult, and age dating may be impossible by this method(total "7Sr in such a case is virtually equal to87Sr,, in a rubidium-poor, strontium-rich rock such as limestone). Another source ofdifficulty is that rubidium fixation, like potassium fixation, mayoccur during the post-formational history of the mineral beingdated, which would result in an apparently young date. Alter-nately, if detrital material is finely mixed, an apparently old datemay be obtained. Further, during diagenesis and/or other post-formational processes, early formed '*7Sr may be released and in-corporated in minerals other than those in which it originallyformed, yielding different apparent 87Sr,, values for two spatiallyclose rocks. In a study of Gulf Coast sediments, Perry and Ture-kian (1974) found that the balance of Rb, total Sr, and "*7Srvaried as a function of depth. As illite-montmorillonite and illiteformed from pre-existing montmorillonite, fixation of rubidiumin the illite sites occurred, and homogenization of the detritalplus authigenic materials was not complete at 18,000 ft at 165 °C.Perry and Turekian concluded thai for whole-rock shales, ho-mogenization might be complete by 30-40 m.y. after originalsediment deposition.
For the Grants mineral belt the following factors must be con-sidered: a) the Morrison Formation is nonmarine, and rapidsedimentation is assumed; b) clay minerals penecontemporane-ous with uranium mineralization presumably formed over ashort interval of time, either close to the time of sedimentation orat a significantly younger time; c) chlorite formed in the orezones is more stable than illite or mixed-layer illite-montmorillonite (Lee and Brookins, 1978), and either of iheselast two may, if mixed with chlorite, be armored from surround-ing solutions by the chlorite. The chlorite noted in thin section iscommonly slightly birefringent, and eiectron-microprobe an-alysis indicates the presence of potassium. These data, plus somex-ray-diffraction evidence, suggests that the chlorite is indeedmixed with illite and mixed-layer illite-montmorillonite.
The approach used by Lee and Brookins (1978) was to worksolely with the clay-sized fraction of samples from barren rocksand from ore zones of the Grants mineral belt, thereby avoidingdetrital material. We recognized that the 87Sro, reported asC'Sr^SrX,, is likely to be variable and therefore used theisochron method to determine both age and (87Sr/86Sr)o (Faure,1977). The result is a linear array of data of slope (e^-l) with anintercept 87Sr/S6Sr = f7Sr/86Sr)o at 87Rb/86Sr = 0. For igneousrocks, the fit of data to a linear array is commonly very good.For sedimentary rocks, however, scattering of the data resultsfrom lack of homogeneous 87Sr/86Sr in the samples at the time offormation, loss or gain of total rubidium or strontium, or otherfactors (Chaudhuri, 1976; Chaudhuri and Brookins, 1979). Theisochron method was used by Lee and Brookins (1978), and theresults are presented in table 1.
In order for the isochron method to be used successfully, all ofthe prerequisites for age determination mentioned above must bemet by several samples (five or more data points are common).
[New Mexico Bureau of Mines & Mineral Resources, Memoir 38,1980]

54
TABLE 1—RUBIDIUM-STRONTIUM DATA. GRANTS MINERAL BELT (N = number ofsamples, *age recalculated; value reported in Lee and Brookins, 1978, was 149 ± 17m.y. with (87Sr/86Sr)o = 0.7086, "age recalculated; value reported in Lee andBrookins, 1978, was 146±5 m.y. with (87Sr/86Sr)o = 0.7100±0.0001, all datescalculated by York method [1969], using a decay constant forB7Rb= 1.42x 10" /y .Errors are one-sigma values.).
material dated N
1) Barren-rock montmorillonite; 10Ambmsia Lake (-2M fraction)
2) Barren-rock montmorillonite; 9Jackpile-Paguatemine (-2JJ)
3) Chlorite-rich ore-zone material; 9Ambrosia Lake district (-2^)
4) Chlorite-rich ore-zone material; 9Smith Lake district (-2H)
5) Jackpile-Paguate mine; ore- 14zone material (-2n)
6) Jackpilc-Paguate mine; ore 8
age (m.y.)
131 +26 m.y.* 0.7071 ±0.0029*
142 ± 14 m.y.** 0.7100±0.0007**
139±I0m.y. 0.7091 ±0.0020
I39±l3m.y. 0.7102±O.OOI3
II5± 9m.y. 0.7! I2±0.0016
110+10 m.y. 0.7088 + 0.0016
For the six suites of clay minerals analyzed in table 1, a minimumof eight samples was used for one isochron (Jackpile-Paguatemine ore zone, -0 .5^ , chlorite-rich material) and as many as 14samples for another (Jackpile-Paguate mine ore zone, -2p<,chlorite-rich material). When data are sufficient, they are sub-jected to least-squares treatment in order to obtain the slope andC'Sr^Sr) , , intercept (York, 1969). The errors given for theisochron ages are one-sigma errors. The largest scalier of dataabout the isochron constructed for any of the clay-mineral suitesis shown for the -2\x montmorillonites from the Westwater Can-yon Member from Ambrosia Lake (Lee and Brookins, 1978, fig.6). Sj;ch .scatter may reflect open-system conditions for severalsamples at the time of formation or post-formational effects.Because of the large error, the date of 131 ±26 m.y. does notallow one to place these samples in either the Jurassic or Creta-ceous Periods. Ore-zone clay minerals from Ambrosia Lake andSmith Lake (table I; nos. 3, 4) yield dates of 139± 10 and139+13 m.y. respectively; and barren-rock montmorillonitesfrom the Jackpile-Paguate mine yield 142 ± 14 m.y. respectively(table 1, no. 2). Since the accepted age for the boundary betweenthe Jurassic and Cretaceous is 136 m.y. (error uncertain; this dateprovided by USGS), the date for the Jackpile-Paguate mont-morillonite is compatible with its Late Jurassic age assigned ongeologic grounds (Melvin, 1976), although admittedly the errorsoverlap into the Early Cretaceous. Significantly, the AmbrosiaLake and Smith Lake ore-zone chlorites give indistinguishabledates of 139 m.y. Both .suites of clay minerals were taken fromtrend ore, and these dates are proposed here to be close to the ageof sedimentation, although geologic evidence supports epigeneticformation of the ore (Finch, 1967).
At the Jackpile-Paguate mine, the ore-zone chlorile-richmaterial was examined for -2/J and -0.5^ fractions. This ex-amination was made because the first date obtained—for the -2\ifraction—was 115 ± 9 m.y., much younger than the mont-morillonite date from barren rocks of 142±14 m.y. The -0.5(jfraction also yielded a young date, 110+10 m.y. X-ray-diffrac-tion study of both fractions revealed that the suites of sampleswere identical. Adams and others (1978) propose destruction oforiginal ore at the Jackpile-Paguate mine area with subsequentrernobilization and reprecipitation of uranium before uplift,lilting, erosion, and deposition of the Dakota Formation (Cre-taceous); these 110 and 115 m.y. dates are consistent with such aninterpretation. An average date for the ore formation at theJackpile-Paguate mine area may be taken as 113 ± 7 m.y. bycombining the -2(i and -0 .5^ data. This date is younger than the139-m.y. date for Ambrosia Lake and Smith Lake trend ore andolder than the range of ages proposed herein for the Dakota For-mation. Why the barren-rock montmorillonites at the Jackpile-
Paguate mine area give an older age and a smaller error than theWestwater Canyon Member montmorillonites at Ambrosia Lakeis unknown. Possibly, processes resulting from a deeper burial ofthe Westwater Canyon Member al Ambrosia Lake, plus pro-cesses of ion exchange due to long-term diagenetic effects as pro-posed by Perry and Turekian (1974), may have caused "agelowering" of those montmorillonites, relative to the near-surfacemontmorilloniies at ihe Jackpile-Paguate mine area. Such pro-cesses presumably would be less effective on chlorites (Perry,1974). For samples from an ore zone relative to host rocks, lessscatter of data about an isochron might be expected; the ore-forming processes are more local than are diagenetic processesaffecting large volumes of rock. This increases the probability ofhomogenous " 'Sr/^Sr at the time of clay-mineral formation inore zones and allows indirect dating of the ore-zone formation.The clays are penecontemporaneous with uranium mineraliza-tion as indicated by the following characteristics: their rosetteform, high vanadium and rare-earth contents, and habit asrevealed by scanning-electron microscopy. For barren rocks,however, loss of t|!7Sr due to formation of illite or illite-montmorillonite from montmorillonite (owing to burial, tem-perature, and waters of complex chemistry) might result indifferent (M1Sr/li''Sr)ii for many samples. This loss would explainthe largo scatter for the -2p montmorillonites from theWestwater Canyon Member at Ambrosia Lake (table 1, no. I).Alternately, if two or more suites of detrital minerals with dif-ferent, partially homogenized Rb-Sr systematics are present inthe samples (discussion in Chaudhuri, 1976), the large scatter forthese samples may be due to sampling two populations with dif-ferent ()"Sr/1(6Sr)c); however, this possibility remains to bedemonstrated. Perry and Turekian (1974) suggest that Rb-Sr iso-chrons for marine shales may be interpreted as minimum dates.For the samples studied by Lee and Brookins (1978), the isochronfor the Jackpile-Paguale mine area (142± 14 m.y.) shows lessscatter than that for the Ambrosia Lake montmorilloniteisochron (131 + 26 m.y.); the former date may be used, with cau-tion, for the minimum date of sedimentation for the MorrisonFormation.
Early epigenetic uranium mineralization for the trend ore atAmbrosia Lake and Smith Lake is suggested by (he dates of 139m.y. (table 1); this interpretation is consistent with that of others(discussion in Finch, 1967; Lee, 1976; Brookins, 1976a).
The uranium ore in the Jackpile-Paguate mine area has beeninterpreted as syngenetic or very ep ';/ epigenetic (Moench, 1963;Moench and Schlee, 1967; Jacobsei., this volume). The Rb-Srdata support the post-Late Jurassic and pre-Dakota Formationinterpretations of Melvin (1976) and Adams and others (1978);however, the average date for the Jackpile-Paguate clay min-
[New Mexico Bureau of Mines & Mineral Resources, Memoir 38,1980]

55
TABLE 2—RUBIDIUM-STRONTIUM DATA, DAKOTA FORMATION, -2JI(sample locations in Brookins, 1979; Rb-Sr isochron age = 93 ±8 m.y.;(87sr/»6Sr)o = 0.7097 + 0.0001. Errors are one-sigma values.).
TABLE 3—RUBIDIUM-STRONTIUM DAIA. MANCOS FORMATION. -2^ (samplelocations in Brookins, 1979; Rb-Sr isochron age = 83 + 11 m.y.; (s1Sr/
, = 0.7239 ± 0.0009. Errors are one-sigma values.).
sample
Kd-9J
Kd-8J
Kd-7J
Kd-2J
Kd-U
Kdbs-U
Kds-lPC
Kd-4J
Kd-3J
Kds-12J
Rb (ppm) Sr (ppm)
19.313.817.812.419.1
178.146.2
9.0
20.313.3
185.442.7
209.481.840.0
192.563.990.1
121.368.8
»7Rb/8"Sr
0.3040.9360.2460.4391.3832.6802.0940.2890.4850.789
87Sr/S(lSr sample
0.70980.71050.71020.41050.71140.71300.71300.71010.71030.7101
erals, 113 ± 7 m.y., is here referred to as mid-Cretaceous for con-venience. Other ore deposits in the Grants mineral belt (MarianoLake, Ruby) contain ore that, based on geologic grounds (Placeand others, this volume; Ristorcelli, this volume), is interpretedto have formed in post-Late Jurassic-pre-Laramide time, al-though these deposits have not been subjected to Rb-Sr dating.
The age of the Dakota Formation is important in addressingthe age(s) of mineralization in the Morrison Formation; Granger(1968) has proposed that uranium was leached from the Dakotaand transported downward into the Morrison Formation. TheDakota Formation in the southern San Juan Basin is Cenoma-nian (Cobban, 1977; Molenaar, 1977; Peterson and Kirk, 1977).Biotites and sanidine separated from bentonitic beds of theDakota, or of equivalent formations, have been dated by Obra-dovich and Cobban (1975), using the K-Ar method. The resultsof those investigations suggest that the Dakota Formation wasdeposited approximately 94-90 m.y. ago. Similarly, the overlyingMancos Shale was deposited between 89 and 80 m.y. ago (K-Ardating, Obradovich and Cobban, 1975).
Recently, R. S. Delia Valle and I havir attempted Rb-Sr datingof the Dakota Formation and the Mancos Shale. The data arepresented in tables 2 and 3, and the Rb-Sr isochrons arepresented in figs. I and 2. We again used the -2y> fraction fordating purposes in order to avoid detrital material. The Rb-Srisochron date for the Dakota Formation is 93 ± 8 m.y. with initial(a7Sr/1(('SrX, = 0.7097 ±0.0001 for 10 samples (Brookins, 1979).For the Mancos Shale, four samples yield 83 ±11 m.y. with in-itial C'Sr^Sr),, = .7239±0.0009. The York (1969) method was
Kms-3Kms-9Kms-1Kms-4
Rb (ppmj
137.5131.6139.1154.5
Sr (ppm)
225.9117.164.449.8
1.77
3.26
6.27
9.00
0.7256
0.7279
0.7322
0.7339
used to calculate the ages and initial ratios. The Rb-Sr dates arein excellent agreement with the K-Ar dates cited above. Thesedates, plus the geologic observations of Moench and Schlee(1967), Nash (1968), Brookins (1976), Lee (1976), Melvin (1976),and Adams and others (1978), convincingly argue against a Da-kota source for the major ore deposits of the Grants mineral belt.The agreement between the Rb-Sr dates (-2ji fractions) and K-Ardates (biotites. sanidines) lends support to the use of the Rb-Srmethod as a reliable dating tool when working with clay-sizedmaterial. This method may be especially useful when the rockshave been buried to insufficient depths, thereby involving theprocesses suggested by Perry and Turekian (1974) discussedherein.
If one assumes the age of trend ore to be 139 m.y. (table 1) andthe maximum Dakota Formation age as 100 m.y., the suggested113 ±7 m.y. date for the mid-Cretaceous formation of uraniumore at the Jackpilc-Paguate mine is clearly post-Late Jurassic andpre-Dakota. At least 10 and perhaps 25 m.y. elapsed between theclose of the Jurassic and rcprccipitalion of the Jackpile-Paguateore (Adams and others, 1978).
Mineralization in Cretaceous rocksMinor deposits of uranium are found in Cretaceous rocks of
the Grants mineral belt, principally in the basal swamp depositsof the Dakota Formation. Gabelman (1956) noted that the orecommonly is associaied with organic matter and, more impor-tantly, is controlled by post-Laramide folding and faulting.These factors are also true for the minor deposits of the MancosShale (Granger, 1963; Finch, 1967), indicating a Terliary age formineralization. Very recent mineralization may be indicated bythe data of Ludwig and others (1977) for Ihe Hogback No. 4mine (dates reported are 150,000 years or less). In addition,uranium found in basal Dakota rocks, just above the .lackpilesandstone at the Saint Anthony mine, Laguna district, is re-stricted to organic layers along fractures parallel to bedding
73 n
.70-
DAKOTA SANDSTONE-2)i Clay Fraction
t = 93 ± 8 m.y.Ro= 0.7096
FIGURE 1—FORMATION.
0 1 2 387Rb/86Sr
R B - S R I S O C H R O N . - 2 / J F R A C T I O N F R O M I H I D A K O T A
.75-1
.74-
co .73-
in00 . 7 2 -
.71-0
MANCOS SHALE-2JJ Fraction
t= 83 ± II m.y.R o~ 0.7235
i
287Rb/86Sr
10
FIGURE 2—RB-SR ISOCHRON, -2\I FRACTION FROM THK MANCOS SHALE.
[New Mexico Bureau of Mines & Mineral Resources, Memoir 38,1980]

planes and within fractures. Nowhere is the ore pervasivethrough the rock or in other ways indicative of movement ofuraniferous solutions prior to Laramide fracturing. Locally,some uranium is found in the Dakota near the base of the Man-cos Shale, but this too is restricted to fractures. Some uraniumappears to have been leached from the Mancos and redepositedin the upper Dakota. Sinre a crude correlation of uranium stain-ing with zones of fractures near the crest of anticlines is noted,these minor occurrences again support a Tertiary age of mineral-ization.
Laramide mineralizationThe stack ore described by Finch (1967), Roeber (1972), and
others is attributed by them to Laramide tectonism. They believethai the ore was immobilized by oxidizing conditions associatedwith uplift and subsequently fixed in structurally controlledtraps. Commonly, ore concentrated along Laramide fault orjoint systems is at or very near the major redox front of theGrants mineral belt, and this remobilized ore can be assumed tohave formed during and/or very shortly after the Laramideorogeny. However, a) not all such ore is present at the redox in-terface; b) some ore is not controlled by Laramide faults orjoints, although it may occur at a redox interface; and c) someremobilized mineralization is found entirely within reducedground, whereas some minor mineralization is found entirelywithin oxidized ground. Based on recent work on roll-typedeposits in Texas (Galloway, 1977; Goldhaber and others, 1978),faults and joints formed during the Laramide possibly acted asfavorable channelways for reducing agents such as dissolvedH,S. These reductants would easily remove any U6+ from solu-tions migrating downdip from oxidized rocks and precipitateU4 * as coffinite or pitchblende in the fault or joint systems. Suchore would not have to have formed during the Laramide, becausecontinued deposition of uranium in post-Laramide time wouldbe possible in these zones as long as a source of uranium-chargedground waters and a source of reductants were present. Some ofthe ore attributed to Laramide deposition may well be younger,even if the source for the uranium was pre-Laramide or reworkedLaramideore.
In summary, the only ore that unequivocally can be identifiedas Laramide is that which is located in obvious Laramide faultsand joints and is cut or folded by late Laramide features or, alter-nately, that ore which might yield concordant radiometric datesof60-70m.y.
Post-Laramide mineralizationPost-Laramide mineralization is suggested at several places in
the southern part of the Grants mineral belt. Where ore clearlycrosscuts Laramide fractures, it must be younger. If redox-frontore is located updip from obvious Laramide fractures, this oremust also be post Laramide in light of lack of evidence for re-reduction or updip migration of uraniferous solutions. Roeber(1972) described both types of ore.
A mineralized zone from the Smith Lake area is of interest.The data are presented in table 4 and are shown in fig. 3 with a140-m.y. reference isochron with a chosen f'Sr/^SrX, interceptof 0.7100. The clay minerals from this deposit (proprietary loca-tion) are more kaolinite-rich than nearby deposits, and the oreoccurs principally in oxidized rocks at the redox front. An iso-chron treatment is not warranted for these samples; they areclearly too scattered. The dotted line above the reference iso-chron in fig. 3 is for an age of 30±90 m.y. with a calculatedintercept of 0.7203 ±0.004. The uncertainty in age makes it im-possible to state whether this ore was formed in the Mesozoic orTertiary, but all of the data plot above the reference isochron.Table 1 data resulted in the choice of 0.7100 for the intercept ofthe reference isochron. These data may reflect an extreme lack ofhomogenization of both Rb and Sr abundance and 87Sr/86Sr. One
TABLK 4—RUBIDIUM-STRONTIUM DATA, OXIDIZED ORE DEPOSIT (propri-etary location), -2|i.
sample
1
2
3
4
5
67
8
9
10
Rb (ppm)
70.7
89.976.863.534.9
84.2
111.983.296.5
100.8
Sr (ppm)
113.2
130.9103.771.4
35.4
121.1
94.442.871.2
92.0
87Rb/86Sr
1.80
2.002.142.583.10
2.03
3.455.643.91
3.16
87Sr/««Sr
0.7240
0.7217
0.71730.72460.7231
0.7173
0.71700.75230.7231
0.7206
can only speculate on the time at which this deposit formed, sinceboth the age of formation of the main redox front and whetherthe front has remained essentially stationary since the Laramideare unknown. AH of the data plot above the reference isochron,which could have resulted from remobilization of *87Sr during thepost Laramide.
The source of the uranium in post-Laramide deposits may bea) fro..i older uranium deposits destroyed by an encroachingredox front (Saucier, this volume), b) from pre-Laramide sourcerocks submerged prior to the Laramide, or c) from suspectedsource areas rejuvenated after the Laramide orogeny. The Pre-cambrian core rocks of the Zuni Mountains to the southwest ofthe Grants mineral belt are a possible and convenient source foruranium. Brook ins and Rautman (1978) presented evidence thatlocal redistribution of uranium, rather than widespread loss, hasoccurred in surface rocks and near-surface (to 15 m) drill core.This does not preclude uranium loss from rocks not sampled (therocks removed by weathering or those occurring at greaterdepths). Lee (1976) found that granitic detritus in some Am-brosia Lake mines and microcline pebbles from Morrison For-mation outcrops were indeed Precambrian. Brookins and others(1978), however, have shown that the presently exposed corerocks of the Zuni Mountains have quite different Rb/Sr ratiosand more average 87Sr/86Sr ratios than either the granitic detritus
Rb-Sr dataminus-two micron samples
Possible TertiaryDeposit, GMB
.73n
t t > -
2 3 4 587 86
Rb/ SrFIGURE 3—RB-SR DATA FOR ~2\t FRACTION FROM AN OXIDIZED URANIUM
DEPOSIT. GRANTS MINERAL BELT. The dotted line is shown for com-parison with the 140-m.y. reference isochron to demonstrate that thenine data points do not fall on the reference isochron.
[New Mexico Bureau of Mines & Mineral Resources, Memoir 38,1980]
57
or microdine pebbles, indicating that this detritus was not de-rived from the presently exposed Zuni core rocks.
Other evidence for Tertiary mineralization is the 9-10-m.y.uranophane date mentioned earlier, obtained from oxidizedrocks in the Ambrosia Lake district. Since this uranophane oc-curs as cement in oxidized sandstone and is not associated withorganic matter or pyrite, it may have formed by direct precipita-tion from solution without any accompanying oxidation-reduc-tion reaction. An equal possibility is that it may have formed bydestruction of preexisting U4+ -bearing minerals.
Pleistocene mineralization is most commonly noted as thebright yellow and green U6+ -bearing mineral species found inoutcrop and in oxidized rocks (post-mining bloom is not con-sidered here). Ludwig and others (1977) have shown that some ofthe Hogback No. 4 mine samples from Cretaceous rocks are50,000-150,000 years old or less. The amounl of Pleistocenemineralization has never been quantitatively assessed. It seemsminor, but the economics of leaching uranium from low-gradeoxidized rocks should be examined in view of the volume of sur-face and near-surface rocks exhibiting such mineralization.
Summary1) Some trend ore at Smith Lake and Ambrosia Lake formed
inlheLate Jurassic, about 139± 10m.y. ago.2) Minus 2 micron montmorillonite from barren rock in the
Jackpile-Paguate mine area yields a minimum age of sedi-mentation for the Jackpile sandstone of 142± 14 m.y.,which is compatible with its Late Jurassic geologic age. TheRb-Sr method indicates a 132 ±26 m.y. age for minus 2micron montmorillonite from barren rock at AmbrosiaLake. These samples either were not homogeneous withrespect to (87Sr/86SrX> at the time of sedimentation or, alter-natively, their Rb-Sr systematics were altered after sedi-mentation by processes similar to those suggested by Perryand Turekian (1974).
3) The remobilized ore at the Jackpile-Paguate mine formedat about 113 + 7 m.y.: this mid-Cretaceous date is compat-ible with geologic evidence (Melvin, 1976). Based ongeologic evidence (Place and others, this volume," Ristor-celli, this volume), roll-type ore at the Mariano Lake andRuby mines is post-trend ore (post-Late Jurassic) but pre-Dakota. This ore might be mid-Cretaceous but documenta-tion is needed.
4) The Rb-Sr isochron minimum ages for the CretaceousDakota Formation and Mancos Shale are 93 ±8 m.y. and83 ±11 m.y. respectively. These dates are consistent with K-Ar dates for biotites and sanidines from bentonites (Obrad-ovich and Cobban, 1975).
5) Mineralization in Cretaceous rocks is clearly post-Cretaceous; some ore yields Pleistocene dates (Ludwig andothers, 1977).
6) Geologic evidence shows that ore in Jurassic rocks wasredistributed during and after the Larmide orogeny(Roeber, 1972).
7) Some ore at or near the main redox front for the Grantsmineral belt may be Tertiary. The Rb-Sr data (table 4) forat least one such deposit indicate extreme resetting of theRb-Sr systematics of constituent clay minerals. While nodate can be obtained, the data fall above a 140-m.y. refer-ence isochron, suggesting resetting of 87Sr/*6Sr, Rb, and Sr.
8) Uranophane cementing of oxidized sandstone at one mineindicates a 9 to 10 m.y. age of formation; this date indicatesremobilization during the late Tertiary.
9) U-Pb dates by the 2«U-207Pb method cluster between 80and 107 m.y., but the significance of this clustering isunknown. At least one "'LM^Pb date is 150 m.y. (Leven-thal and Threlkeld, 1978). 207Pb/20*Pb dates are veryi i ia i a i t u i i u c i A d u , 1 7 / o ^ . r u/ i vdiscordant and range from J54 to 820 m.y.
10) K-Ar dates for ore-zone -2ji clay minerals range from 45 to139 m.y. Since many of these dates are from samples usedsuccessfully for Rb-Sr dating, the young dates probably re-flect >40Ar loss due to burial and other processes as Perryproposed (1974).
ReferencesAdams, S. S., Curtis, H. S., Hafen, P. F., and Salek-Nejad, H., 1978, In-
terpretation of postpositional processes related to formation anddestruction of the Jackpile-Paguate uranium deposil, northwest NewMexico: Economic: Geology, v. 73, p. 1635 1654
Brookins, D. C, 1976, Uranium deposits of the Grams, New Mexico,mineral belt: U.S. Energy Research and Development Administration(ERDA), Rept. GJO-1636-1, 120 p.
. 1979, Uranium deposits of the Grants, New Mexico, mineral bell,Pt. 11: U.S. Department of Energy and Bendix Field Engineering, Rept-78-249, 411 p.
Brookins, D. G., Delia Valle, R. S., and Lee. M. J., 1978, Rb-Sr geo-chronologic investigation of Precambrian silicic rocks from the ZuniMountains, New Mexico: The Mountain Geologist, v. 15, p. 67-71
Brookins, D. G., Lee, M. J., and Shafiqullah, M., 1977, K-Ar ages forclay and silt-size fractions of uranium ore from Ihe Grants mineral bell.New Mexico: Isochron/West, no. 18, p. 17-19
Brookins, D. G., and Rautman, C. A., 1978, Uranium and thoriumabundances, whole rock chemistry and trace element chemistry, ZuniMountains, New Mexico, in A study of silicic plulonic rocks in the Zuniand Florida Mountains to evaluate the possible occurrence of dissem-inated uranium and thoriu;n deposits: New Mexico Energy Institute,Rept. no. 77-1104B, 46 p.
Chaudhuri, S., 1976, The signiticance of rubidium-strontium ages ofsedimentary rocks: Contributions to Mineralogy and Petrology, v. 59,p. 161-170
Chaudhuri, S., and Brookins, D. G., 1979, The Rb-Sr systematics in acid-leached clay minerals: Chemical Geology, v. 24, p. 231-242
Cobban, W. A., 1977, Fossil mollusks of the Dakota Sandstone andintertongucd Mancos Shale of west-central New Mexico: New MexicoGeological Society, Guidebook 28th field conference, p. 213-220
Faure, G., 1977, Principles of isotope geology; New York, John Wiley &Sons, 464 p.
Finch, W. I., 1967, Geology of epigenetic uranium deposits in sandstonein the United States: U.S. Geological Survey, Prof. Paper 538. 121 p.
Gabelman, J. VV., 1956, Uranium deposits in paludal black shales of theDakota Formation, San Juan Basin, New Mexico: U.S. Geological Sur-vey, Prof. Paper 300, p. 303-319
Galloway, W. E., 1977, Caiahoula Formation of theTexas Coastal Plain:depositional systems, composition, structural development, groundwater flow history and uranium distribution: University of Texas(Austin), Bureau of Economic Geology, Rept. Inv. 87, 59 p.
Goldhaber, M. B., Reynolds, R. L., and Rye, R. O., 1978, Origin of asouth Texas roll-type uranium deposit; Pt. 2., Petrology and sulfurisotopes: Economic Geology, v. 73, p. 1677-1689
Granger, H. C , 1963, Mineralogy, in Geology and technology of theGrants uranium region, V. C. Kelley, compiler: New Mexico Bureau ofMines and Mineral Resources, Mem. 15, p. 21-37
, 1968, Localization and control of uranium deposits in thesouthern San Juan Basin mineral belt, New Mexico—an hypothesis, inGeological Survey research: U.S. Geological Survey, Prof. Paper600-B, p. B60-B70
Gruner, J. W., 1956, Concentration of uranium in sediments by multiple-migration-accretion: Economic Geology, v. 51, no. 6, p, 495-520
Lee, M. J., 1976, Geochemistry of the sedimentary uranium deposits ofthe Grants mineral belt, southern San Juan Basin, New Mexico: Ph.D.thesis, University of New Mexico, 241 p.
Lee, M. J., and Brookins, D. G., 1978, Rubidium-strontium minimumages of sedimentation, uranium mineralization, and provenance, Mor-rison Formation (Upper Jurassic), Grants mineral belt, New Mexico:American Association of Petroleum Geologists, Bull., v. 62, no. 9, p.1673-1683
Leventhal, J. S., and Threlkeld, C. N., 1978, Carbon-13/Carbon-12 iso-tope fractionation of organic matter associated with uranium ores in-duced by alpha irradiation: Science, v. 202, p. 430-432
Ludwig, K. R., Szabo, B. J., and Granger, H. C , 1977, Pleistocene ap-parent ages by U-Pb isotope and U-series methods for uranium ore inDakota Sandstone near Gaiiup, New Mexico: U.S. Geological Survey,Journal of Research, v. 5. p. 669-672
i NleyAco Bureau of Mines 6. Mineral Resources, Memoir 36,19801

Melvin, J. W., 1976, Systematic distribution of large uranium deposits inthe Grants uranium region, New Mexico, in Tectonics and mineralresources of southwestern North America, L. A. Woodward and S. A.Northrop, eds.: New Mexico Geological Society, Spec. Pub. no. 6, p.144-150
Moench, R. H., 1963, Geologic limitations on the age of uraniumdeposits in the Lagtna district, in Geology and technology of theGrants uranium region, V. C. Kelley, compiler: New Mexico Bureau ofMines and Mineral Resources, Mem. 15, p. 157-166
Moench, R. H., andSchlee, J. S., 1967, Geology and uranijm deposits ofthe Laguna district, New Mexico: U.S. Geological Survey, Prof. Paper519, 117 p.
Molenaar, C. M., 1977, Stratigraphy and depositional history of UpperCretaceous rocks of the San Juan Basin area, New Mexico and Colo-rado, with a note on economic resources: New Mexico GeologicalSociety, Guidebook 28th field conference, p. 159-167
Nash, J. T., 1968, Uranium deposits in the Jackpile Sandstone, NewMexico: Economic Geology, v. 63, p. 737-750
Obradovich, J. A., and Cobban, W. A., 1975, A time-scale for the LateCretaceous of the Western Interior of North America: Geological As-sociation of Canada, Spec. Paper 13, p. 31-54
Perry, E. A., 1974, Diagenesis and the K-Ar dating of shales and clayminerals: Geological Society of America, Bull., v. 85, p. 827-830
Perry, E. A., and Turekian, K. K., 1974, The effects of diagenesis on theredistribution of strontium isotopes in shale: Geochimica et Cos-mochimica Acta, v. 38, p. 929-936
Peterson, F., and Kirk, A. R., 1977, Correlation of Cretaceous rocks inthe San Juan Black Mesa, Kaiparowits and Henry Basins, southernColorado Plateau: New Mexico Geological Society, Guidebook 28thfield conference, p. 167-179
Roeber, M. M., 1972, Possible mechanics of lateral enrichment andphysical partitioning of uranium deposits, Ambrosia Lake area, NewMexico: New Mexico Bureau of Mines and Mineral Resources, Circ.118, supplement, 16 p.
Steiger, R. H., and Jaeger, E., 1977, Subcommission of geochronology:convention on the use of decay constants in geo- and cosmochronol-ogy: Earth and Planetary Science Letters, v. 36, p. 359-362
York, D., 1969, Least squares fitting of a straight line with correlated er-rors: Earth and Planetary Science Letters, v. 5, p. 320-326
[New Mexico Bureau of Mines & Mineral Resources, Memoir 38,1980]

59
DEPOSITION AND EARLY HYDROLOGIC EVOLUTIONOF WESTWATER CANYON WET ALLUVIAL-FAN SYSTEM
by William E. Galloway, The University of Texas, Bureau of Economic Geology.Austin, Texas 78712
AbstractThe Westwater Canyon Member is one of several large, low-
gradient alluvial fans that compose the Morrison Formation inthe Four Corners area. Morrison fans were deposited by majorlaterally migrating streams entering a broad basin bounded byhighlands to the west and south. The Westwater Canyon sandframework consists of a downfan succession of 1) proximalbraided channel, 2) straight bed-load channel, 3) sinuous mixed-load channel, and 4) distributary mixed-load-channel sandbodies. Regional sand distribution and facies patterns are highlydigitate and radiate from a point source located northwest ofGallup, New Mexico. Early ground-water flow evolution withinthe Westwater Canyon fan aquifer system can be inferred byanalogy with Quaternary wel-fan deposits and by the interpretedparagenetic sequence of diagenetic features present. Syndeposi-tional flow was controlled by the downfan hydrodynamic gra-dient and the high horizontal and vertical transmissivity of thesand-rich fan aquifer. Dissolution and transport of solublehumate would be likely in earliest ground water, which was abun-dant, fresh, and slightly alkaline. With increasing confinement ofthe aquifer below less permeable tuffaceous Brushy Basin depos-its and release of soluble constituents from volcanic ash, flowpatterns stabilized, and relatively more saline, uranium-richground water permeated the aquifer. Uranium mineralization oc-curred during this early postdepositional, semiconfined flowphase. Later exposure, erosion, and probable further flushing ofproximal fan deposits resulted in some ore redistribution. Devel-opment of overlying Dakota swamps suggests a shallow watertable indicative of regional discharge or stagnation. In eitherevent, only limited downward flux of acidic water is recorded bylocal, bleached, kaolinized zones where the Westwater Canyondirectly underlies the Dakota swamps. Subsequent ground-waterflow phases have further obscured primary alteration patternsand caused local oxidation and redistribution of uranium.
IntroductionThe Morrison Formation (Jurassic) of the Colorado Plateau
(New Mexico, Arizona, Utah, and Colorado) consists of a co-alesced sequence of large, low-gradient, wet alluvial fans derivedfrom source areas to the south and southwest. The regionalgeometry and composition of the major fan systems were de-scribed in a classic paper by Craig and others (1955). In ascend-ing sequence, the Morrison Formation consists of the Salt Wash,Recapture, Westwater Canyon, and Brushy Basin Members. Allmembers contain commercial uranium deposits, but the principaldeposits occur in the sand-rich Salt Wash and in the WestwaterCanyon fans, each of which is estimated to contain total reservesgreater than 50,000 tons (100,000,000 pounds) of U,OS.
ACKNOWLEDGMENTS—This publication was authorized by theDirector, Bureau of Economic Geology, The University of Texasat Austin. I also thank Continental Oil Company, Ponca City,Oklahoma, for previous permission to publish portions of thisreport in an earlier set of research colloquium notes.
Westwater Canyon alluvial-fan systemThe Westwater Canyon alluvial fan was deposited in a broad
basin extending across northwestern New Mexico (fig. 1). Sedi-ment composing the fan was derived from the Mogollon upland,which lay to the southwest, and entered the basin along an axislying between Gallup, New Mexico, and Window Rock, Arizona.
The southern margin of the fan thins against the north rim of theZuni Arch, which was a positive topographic element during Jur-assic time (Saucier, 1976). Later, renewed activity of theMogollon uplift resulted in pre-Cretaceous truncation of iheproximal part of the Westwater Canyon fan (fig. 1).
The preserved portion of the Westwater Canyon fan systemcovers about 14,000 sq mi {36,000 sq km) and forms a relativelycoarse-grained unit sandwiched between interbedded mudstonesand sandstones of the underlying Recapture and overlyingBrushy Basin Members of the Morrison Formation. Distal limitsof the Westwater Canyon fan are defined to the north and east byinterfingering with Brushy Basin lithology mudstones and sand-stones. The maximum preserved thickness of the Westwater Can-yon is over 300 ft (100 m) and occurs in the subsurface northeastot" Gallup, New Mexico. Southwest of the truncation line (fig. 1),the Dakota Sandstone rests directly on the Westwater CanyonMember. Craig and others (1955) described ihc Westwater Can-yon as a large, low-gradieni, alluvir.l-fan deposii thai entered thedepositional basin from the southwest. The predominance ofbed-load fluvial channel facies confirms the categorization of theWestwater Canyon depositional environment as a wet alluvialfan.
A wet or humid-region alluvial fan forms where a seasonal orperennial river flows from a point source along the margin of anupland area into an open basin (McGowen, 1979). In contrast tobetter known dry or arid region fans, wet fans can be quite large,covering several hundred square miles. Both the large Kosi Riverfan of India (fig. 2) and the small Kern River fan of California(fig. 3) illustrate characteristics of wet alluvial fans that both aidtheir recognition in the straligraphic record and define their earlyhydrologic history.
Both fans consist of fluvial channel deposits lhat, through con-tinued lateral migration and/or bifurcation of the active channel,radiate into the depositional basin from the point of channelentry. The radial pattern may be symmetrical, as in the Kosi (fig.2a), or skewed by basin structure or topography, as in the Kern(fig. 3a).
In both, the average and maximum grain size of deposited allu-vium decreases markedly and systematically downfan (figs. 2band 3b). Concomitant with the changing mix of sediment trans-ported by the stream, channel geometry and gradient commonlyevolve downfan. The Kosi, for example, evolves from a single,deep channel at the proximal fan into a broad, multichanneled,braided complex across the midfan, and finally into a relativelynarrow single channel across the distal fan (McGowen, 1979).The changing channel pattern and cross-sectional geometry ex-pectably produce downfan changes in sand-body geometry andinternal structures.
Both rivers lose a significant volume of total flow by infiltra-tion into the coarse, permeable fan surface across which theyflow. The topographic gradient of the fans, which is mirrored bythe water table, produces a downfan flux of meteoric groundwater within the fan depostis. Consequently, large volumes offresh water recharge the unconfined shallow fan aquifer, pick upa charge of dissolved constituents as they flow basinward, andare discharged from unconfined and semiconfined distal fanaquifers. Expectably, proximal fan deposits are flushed and oxi-dized. In the more confined distal portions of the alluvial fan,aquifer sediments are typically reduced following shallow burialbelow the water table (fig. 3b).
The Westwater Canyon Member displays the defining charac-teristics of wet alluvial fans. An analogous early hydrologic
[New Mexico Bureau of Mines & Mineral Resources, Memoir 38,1980]

EXPLANATION
° Well log
A Measured section
^ * » Ore body
Contour Interval = 100ft (30m )
FIGURE 1—SANDSTONE ISOLITH MAP OF THE WESTWATER CANYON FAN SYSTEM BASED ON OUTCROP SECTIONS AND SUBSURFACE LOG DATA.Radiating sand trends outline geometry of the fan. Coarsest sediment occurs between Gallup and Window Rock, but most of the prox-imal fan facies has been removed by pre-Dakota erosion. Mineralization extends along the length of the southernmost fluvial belts, andnew deposits are being found along deeply buried sublobes of the fan system. The Westwater Canyon is partially truncated southwestof the hatchured line. Letters indicate key measured sections that are illustrated in fig. 9.
[New Mexico Bureau of Mines & Mineral Resources, Memoir 38,1980]

61
Kilometers 160 240 320
FIGURE 2—THE KOSI RIVER FAN OF INDIA AND NEPAL, WHICH IS A MODERN WET ALLUVIAL FAN; a) map view of thefan and detail of midfan braided-stream pattern; b) downfall decrease in stream gradient and grain size modifiedfrom McGowen, 1979 (after Gole and Chitale, 1966).
[New Mexico Bureau of Mines & Mineral Resources, Memoir 38,1980]

62
/CLOSED LACUSTRINE BASIN
• 50
Pebbly sand t 5 ' ° v e l
D 0 5 10 15 Kilometers
I-'IGURE 3 — Si DIM! NIAKt AND HYIMHAXM H:ATURI:S Ol IH1- Kj:RN RjVLK WfcT FAN. SOUTHERN GklATV,M 11 v. CAIIIOKNIA; a) map view showing present and former channel courses radiating from theSierra Nevada Mountain front and general areas of ground-water recharge and discharge; b) cross sec-tion through the fan illuslrating the dou nfan decrease in gravel and sand within the young fan sequenceand the generalized position of oxidized and reduced fan deposits (after Davis and others, 1959 and
evolution is consistent with observed ore paragenesis and also hasimplications for the origin and distribution of uranium ore.
Permeable framework fadesDownfan-diverging belts of bed-load and mixed-load channel-
fill sandstone (terminology of Schumm, 1977; discussion in Gal-loway, 1979) make up the coarse-grained framework facies of theWestwater Canyon fan system. Analysis of sand-body geometry,internal sir icture, composition, and vertical sequence allows dif-ferentiation of four major channel facies within the fan system.
A proximal, braided, bed-load channel facies (fig. 4) consistsof thick, coalesced, tabular bodies of medium to very coarse,pebbly sandstone containing lenses of sandy conglomerate. Littlemud is preserved in sections dominated by the braided facies.Composite sand-body thicknesses range from 30 to 90 ft (10 to 30m), but recognizable longitudinal bar structures suggest that
stream depths were less than 10 ft (3 m). Internal sedimentarystructures include elongate conglomeratic lenses with flat bot-toms and low-angle accretionary foreset bedding, abundantplanar stratification, and medium-scale, low-angle trough andtabular cross-stratification. The basal scour surfaces are wide-spread and of low relief. Deposition was by shallow, fast-flowingwater within broad, laterally migrating, braided-stream chan-nels.
The straight bed-load channel facies (fig. 5) also forms broad,coalesced, tabular sandstone units. The classic upward-fininggrain-size sequence is poorly developed. Many units are cappedby a few feet of coarse, pebbly sandstone grading up into verypoorly sorted sandy, pebbly mudstone. Fine to coarse, pebblysandstone occurs in heterogeneous beds and lenses. The basalscour surfaces are laterally extensive and nearly flat. Sand bodiesform broad, tabular belts bounded by thin, laterally extensivesandy mud beds (fig. 6, section A). Characteristic sedimentary
[New Mexico Bureau of Mines & Mineral Resources, Memoir 38,1980J
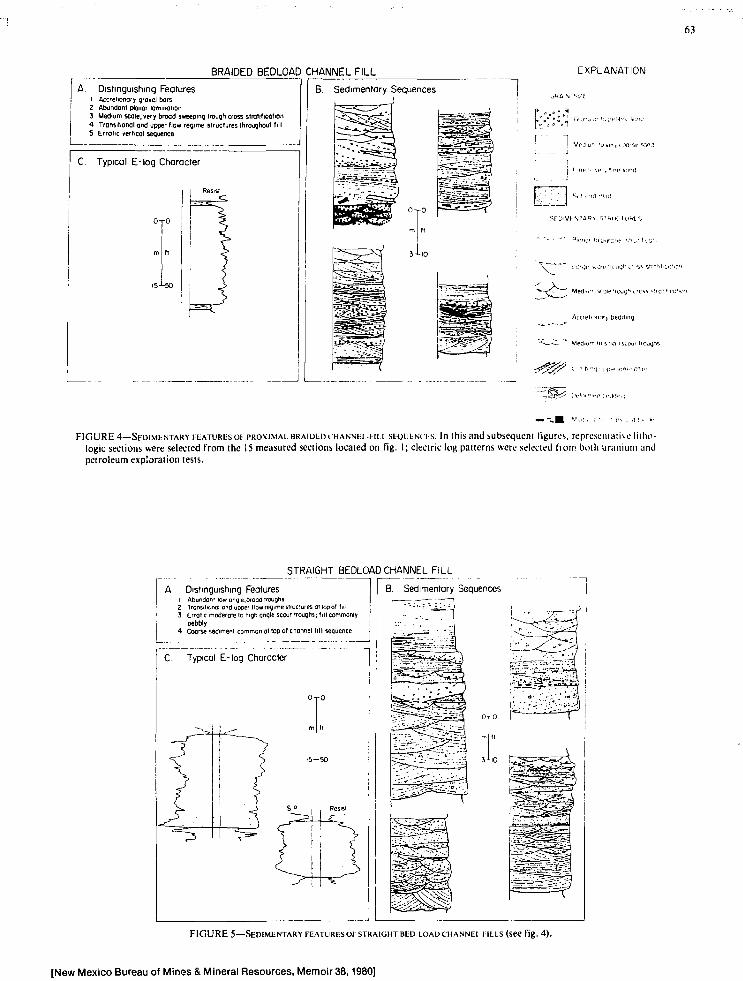
63
BRAIDED BEDLOAD CHANNEL FILL EXPLANATION
A. Distinguishing FeaturesI Accretionory gravel bars
2 Abundant planar lamination3 Medium scale, very brood sweeping trough cross stratification4 Transitional and upper flow regime structures throughout fill5 Erratic vertical sequence
C. Typical E-log Character
B. Sedimentary Sequences
Si 1 O-
f ^ i M f N I A R t '•;' Hi K I u«L S
" " " - x ^ * MeO'u'
FIGURE 4—SEDiMhNTARYiBATURtsoh PROXIMAL. BRAIDLDL'HANNEI-mi stQUtiNci s. In this and subsequcni figures, represeiuaiiveliUui-logic sections were selected from the 15 measured sections located on fig. 1; electric log patterns were selected from both uranium andpetroleum exploration tests.
STRAIGHT BEDLOAD CHANNEL FILL
A Distinguishing FeaturesAbundant low ongle,broad troughsTronsiticnai end upper How regime structures at top oi MiErratic moderate lo high angle scour troughs; fill commonlypebblyCoarse sadiment common ot top of channel l i l l sequence
FIGURE 5—SEDIMENTARY FEATURES OF STRAIGHT BKD LOAD CHANNEL FILLS (see fig. 4).
[New Mexico Bureau of Mines & Mineral Resources, Memoir 38,1980]
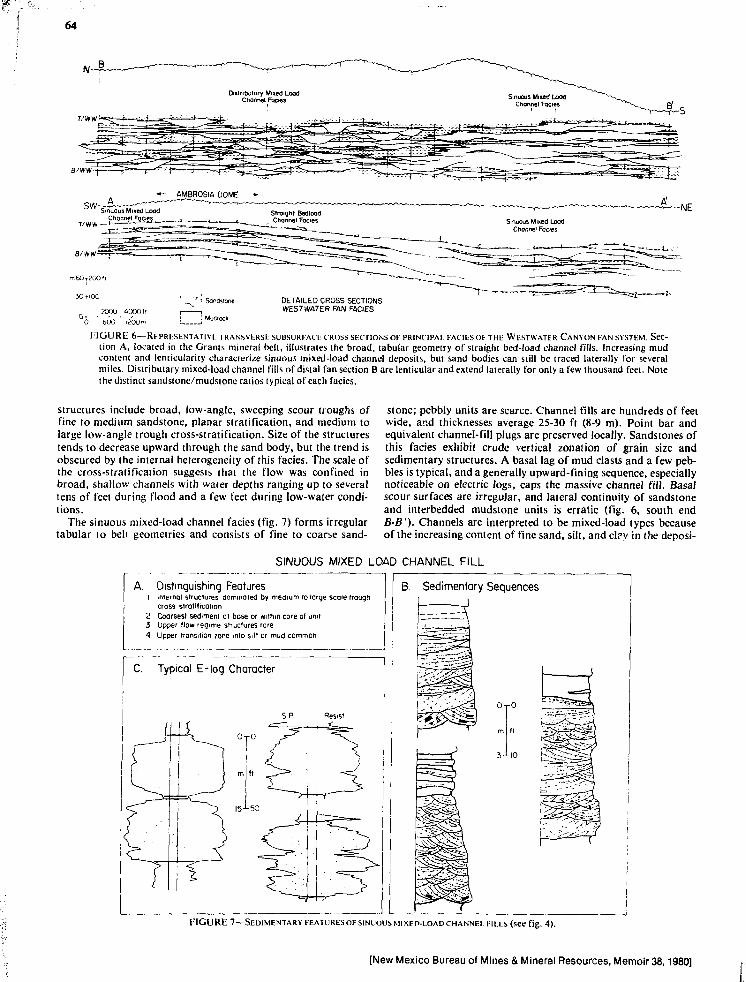
64
DETAILED CROSS SECTIONSWESTWATER FAN FADES
F I G U R E 6—RLPRLSbNTAUVL rRANSVLRSL SUBSURKAt'k CROSS SECTIONS OK PRINCIPAL FAC1ESOI- THE WESTWATLR CANYON KAN SYSTEM. SeC-tion A, located in the Grants mineral belt, illustrates the broad, tabular geometry of straight bed-load channel fills. Increasing mudcontent and Icmicularity characterize sinuous mixed-load channel deposits, but sand bodies can still be traced laterally for severalmiles. Distributary mixed-load channel fills of distal fan section B are lenticular and extend laterally for only a few thousand feet. Notethe distinct sandstone/mudslone ratios typical of each facies.
structures include broad, low-angle, sweeping scour troughs offine to medium sandstone, planar stratification, and medium tolarge low-angle trough cross-stratification. Size of the structurestends to decrease upward through the sand body, but the trend isobscured by the internal heterogeneity of this facies. The scale ofthe cross-stratification suggests that the flow was confined inbroad, shallow channels with water depths ranging up to severaltens of feet during flood and a few feet during low-water condi-tions.
The sinuous mixed-load channel facies (fig. 7) forms irregulartabular to belt geometries and consists of fine to coarse sand-
stone; pebbly units are scarce. Channel fills are hundreds of feetwide, ar.d thicknesses average 25-30 ft (8-9 m). Point bar andequivalent channel-fill plugs are preserved locally. Sandstones ofthis facies exhibit crude vertical zonation of grain size andsedimentary structures. A basal lag of mud clasts and a few peb-bles is typical, and a generally upward-fining sequence, especiallynoticeable on electric logs, caps the massive channel fill. Basalscour surfaces are irregular, and lateral continuity of sandstoneand interbedded mudstone units is erratic (fig. 6, south endB-B'). Channels are interpreted to be mixed-load types becauseof the increasing content of fine sand, silt, and clpy in the deposi-
SINUOUS MIXED LOAD CHANNEL FILL
A. Distinguishing Features1 Internal struciures dominated by medium to farge scale trough
cross siroiificotion2 Coarsest sediment at bose or within core of unit3 Upper flow regime structures rare4 Upper transition ?one into silt or mud common
B. Sedimentary Sequences
C. Typical E-log Character
FIGURE 7—SEDIMENTARY FEATURES OF SINUOUS MIXED-LOAD CHANNEL FILLS (see fig. 4).
[New Mexico Bureau of Mines & Mineral Resources, Memoir 38,1980]

65
tional sequence; the irregular depth of basal channel scour; andthe areal segregation of point-bar, channel-fill, and overbankfacies (indicating increasing sinuosity).
Distributary mixed-load channel facies (fig. 8) predominate atthe distal margin of the fan system. Sandstone units are lenticularand, except where locally stacked, interspersed with subequalthicknesses of mudstone (fig. 6, section B). Sands range fromfine to coarse but are dominated by the fine- and medium-sizedgrades. Widths of channel fills are typically less than 1,000 ft(300 m), and many are less than 100 ft (30 m); thicknesses rangefrom several feet to as much as 40 ft (12 m). The decreasingwidth-to-thickness ratio reflects the increasing content ofsuspended-load sediment in this facies. Distributary-channelsand bodies typically display a basal lag of mudstone clasts andgrade into fine, muddy sand at the top. Common sedimentarystructures include trough cross-stratification, broad intersectingscour fills, parallel lamination, and local zones of ripple or wavylamination. The inferred decrease in channel cross-sectional areain this facies is a combined result of 1) branching of fan channelsinto multiple distributaries and 2) net loss of discharge by in-filtration in the proximal and intermediate fan areas.
Non framework faciesFiner-grained nonframework deposits compose volumetrically
from less than 10 percent (proximal) to 50 percent or more (dis-tal) of the Westwater Canyon fan system. Fan-plain units consistof sandy to pebbly mud, forming laterally continuous thin sheetsthat can be correlated over considerable distances in the proximalbed-load channel association (fig. 6, southwest half of sectionA'). Continuity of mudstone beds and total percentage of mudpresent can aid recognition and mapping of the different channelfacies in the subsurface.
Facies distributionProximal bed-load channel facies generally grade downfan
into distal mixed-load fan facies, which in turn grade intomudstone-dominated sections undifferentiable from BrushyBasin deposits (fig. 9); however, there is considerable interfinger-
ing of straight channel and sinuous channel facies along andacross fluvial axes. The orientation of sandstone belts (fig. I)outlines the loci of recurrent channel development and definesthe radiating sediment-dispersal pattern across the fan. Measure-ment of directional features at outcrop (Saucier, 1967; Campbell,1976) confirms the dispersal pattern suggested by the sand-isolithmap.
Uranium mineralizationMineralization occurs in all Westwater Canyon fan facies;
however, major orebodies are restricted to sand bodies of thebraided, straight, and sinuous channel facies. The Grants min-eral belt lies north of Grants, New Mexico, along the south flankof the fan system within a major east-southeast-trending arm ofthe fan (fig. 1). Within this arm, mineralization extends over 70mi (110 km) from Church Rock to Bernabe. Recent drilling in thedeeper basin is only now delineating mineralization in the centraland northern areas of the arm and in other branches of the fansystem. Localization of ore by sedimentary facies, syn-depositional structural features, detrital organic material, andhumate masses have all been documented in some areas (Grangerand others, 1961; Kelley and others, 1968). In addition, primarytrend ore has been redistributed along faults and fractures to pro-duce generally lower grade stack orebodies. The great variety oforebody characteristics and ore/host relationships suggests acomplex history of mineralization and has given rise to a pleth-ora of theories about the origin of the uranium deposits.
Ground-water flow historyGeohydrologic history of the Grants mineral belt is complex
(table 1). Four distinctly different ground-water regimes have ex-isted since deposition of the Westwater Canyon fan; three havebeen argued by various authors as having controlled uraniummineralization.
1) Initial hydrodynamic gradient was defined by the deposi-tional system and was downfan toward discharge areas at the toeof the fan in the east and northeast San Juan Basin. Recharge
DISTRIBUTARY MIXED LOAD CHANNEL FILL
A. Distinguishing Features B. Sedimentary Sequences1 Small, medium and large scale moderate to high angle trough
cross stratification jmi2 Some ripple and fit.e scale lamination3 Fining up sequence and basal lag
One or more major reaclivation scour surfaces within fill common
Typical E-log Character
FIGURE 8—SEDIMENTARY FEATURES OF DISTRIBUTARY MIXED-LOAD CHANNEL FILLS (see fig. 4).
[New Mexico Bureau of Mines & Mineral Resources, Memoir 38,1980]

m66
IOO4 , 0
Brushy Basin Mbr
??•• STRAIGHT BEOLOADVi ' CHANNEL FACIES
SE
DISTRIBUTARYMIXED LOAD CHANNEL
FACIES
4
7/Recapture Mbr.
l : l t i U R t 9 - - N It RI'Rl II I) I AC It S IRAl K I ROM I'ROXIMAI I AN (Nl)Rl IIW1.SI) IODIS1AI EAN (SOUTHEAST) AS I -XI'OSED At ONli Tilt: WlSTttArLR
C'AMIIN <>I 11 ROIJ ill i i Ai nit soliiHI-RN MAR<iiN<)i iHt- SAN JUAN BASIN. Measured section localities: W, Window Rock; Z.N., Zuni
nose; I-.W., Fort Wingatf T.C , East C'oolidgc; T, Thoreau; N.P . , North Prewilt; P.M., Plate Mesa (for locations see fig. 1).
TABLE I—SUMMARYonii-oioi i i i HISIORV. GRANTSMINERAI Btt-T. NEW MEXICO.
Si
1
;
3
o
2
2,
UJ
>. °.2
s
Structural Event
Cir.idu.il uplift ofMn^nllun Highlands
•V,f louted uplift•nid \i 'k.in sm in
i \1.in<il|t.n Highlands,miiiui upl I ol £uni Arch
|[ iplitt i-Kti-nds nui theastto dranl-. Area; minorpre-D.ikuta olding
Re^ion.iJ downwarpijiy
Laramide deformationproduces majorstructural features
Uplift ofColorado Plateau
Mt. Taylor extrusivevolcantsm
Depositional Event
Deposiliun of Entradd,Todilto, Summerville,and Blulf Formations
Recapture (an systemdeposited 1
Westwater Canyonfan system deposited
Brushy Basin fansystem deposited
Truncation of Jurassicsection to southwest
Deposition of DakotaSandstone
Deposition of coastal plainand marine elastics
Erosion over uplifts
General exhumation
Chuska Sandstonedeposited in deeper basin
Hydrologic Event
Basic aquifer geometry andpermeability determined
East-northeast hydrodynamicgradient established
Recharge of proximal fanthrough ashy Brushy Basin
Age date for mineraii?athn(days) at 139 ±12 m.y.(Lee and Brookins, 1978)
Probable active recharge ofWestwater Canyon aquiferand ore redistribution
Decreasing recharge;stagnation of WestwaterCanyon aquifer
Pore water expulsion
Hydrodynamic gradientreestablished to northand northeast
Recharge along flank ofZunt Uplift; modernregional flow systemestablished; localore redistribution
[New Mexico Bureau of Mines & Mineral Resources, Memoir 38,1980]

67
was through ash-bearing Westwater Canyon and later throughBrusy Basin deposits in the proximal fan area. Additional groundwater was provided through infiltration in the midfan area.Downfan decrease in hydraulic conductivity is qualitatively re-flected by the modern pattern (fig. 10).
2) Uplift and erosion before deposition of the Dakota Sand-stone modified the flow direction and resulted in a period ofenhanced recharge of the proximal fan, followed by slow, local-ized influx of downward-percolating, acidic ground waters de-rived from subsequently developed peaty soils underlying theDakota. Bleaching of the Westwater Canyon is pronouncedwhere a protective blanket of Brushy Basin muds does notseparate the massive sands from the unconformity surface. Effi-ciency of ground-water recharge was apparently rather low, asindicated by the marshy soils and the attendant loss of per-meability that resulted from alteration of feldspars in thebleached areas. The area may have been one of regional dis-charge.
3) Burial of the Westwater Canyon beneath thick post-DakotaCretaceous marine elastics resulted in compaction of associatedmuds and expulsion of pore water. Expelled waters most likelywould have entered the massive sands and drained updip towardthe surface; flow direction and water chemistry were significantlymodified.
4) Structural deformation associated with the Laramide upliftlaid the framework for the modern ground-water flow system,which was initiated with regional uplift of the Colorado Plateauand exhumation of the Westwater Canyon along the flanks of theSan Juan Basin. Recharge now occurs along the area of outcropbelt, probably from underlying aquifers; ground water movesbasinward across the trend of the fan sand bodies and dischargesinto the San Juan River or inlo laterally equivalent or overlyingunits (Kelly, 1977).
Mineralization historyRecent dating of authigenic clay minerals believed to be
genetically associated with primary uranium mineralization givesa 139+12 m.y. (Jurassic) age, which overlaps or slightly
0
0 10 km GRANTS
F I G U R E 10—TRANSMISSIV1TY Oh THt WfcsTWATKR CANYON AQUIH-R;maximum transmissivity occurs in the coarse, proximal fan andsystematically decreases in the downfan direction (modified fromKelly, 1977).
postdates the Westwater Canyon deposition (148±9 m.y.;Brookins, 1977; Lee and Brookins, 1978). Vitric volcanic debrisin the overlying Brushy Basin was a probable source for theuranium that would have been available at the appropriate time.Thus, ground-water How patterns during or closely followingMorrison deposition controlled primary ore emplacement. Laterhydrologic events have tended to locally modify primary min-eralization patterns and obscure initial relationships, but theyhave not destroyed the first-order regional trends. Oxidation andpartial destruction of some orebodics can be directly related tothe most recent ground-water movement down the north Hank ofthe Zuni uplift, essentially perpendicular to flinial axes and tothe probable flow direction during the mineralization episode. Itis easy to see why controversy has arisen over attempted applica-tion to the Grants mineral belt of simple roll-front models thatarc based on the modern hydrologic system.
MINtRAl IZAT1ON t'HASl—-Considerable uncertainty is inherentin the detailed reconstruction of Jurassic paleohydrology, be-cause pre-Dakota erosion has removed much of the proximalWestwater Canyon fan and overlying Brushy Basin; however,patterns of Jurassic ground-water movement can be generalized:I) Flow tended to be dispersive because of the radiating geometryof the fan aquifer system and the water-table configuration,which reflected fan topography. 2) Dispersive flow was compen-sated for by the efficient recharge, high transmissivity, and con-sequent high ground-water flux inherent in a sand-rich wetalluvial fan. 3) The highly digitate sand distribution resulted insubstantial local reorientation of some flow streamlines, lor ex-ample, How was probably concentrated at the southern marginof the fan system along the northwest-southeast-irending sandaxes hosting the deposits of the Grants mineral belt.
Syndepositional flow was dominated by active recharge alongthe proximal fan, by intrastratal downfall flow, and by dischargein the distal fan area (fig. 11). The water table was probablyshallow, and the dissolved-solids content was probably low —conditions that were highly favorable for the solution, transport,and preservation of soluble humate (Swanson and Palacas,1965). The abundant plant debris present indicates a vegetatedfan plain, at least along the channel courses. Increasing salinityalong the flow patn, or mixing of fan waters with other watermasses found at the toe of the fan or locally intruded along faultzones, could have caused flocculation and accumulation of themobilized organic matter (Swanson and Palacas, 1965).
Early postdepositional flow began with burial of the West-water Canyon beneath tuffaceous Brushy Basin muds. At thispoint, the Westwater Canyon aquifer was semiconfined. andflow lines tended to mo\e downward across the overlying, lesspermeable layer (fig. 11), sweeping through the tuffaceous sedi-ments during a time of maximum glass alteration and release ofsoluble constituents (Taylor and Stoiber, 1973; Walton, 1975;Galloway and Kaiser, 1980). Flow was collected within thepermeable horizons and moved down regional hydrodynamicgradient, which remained east to northeast in the basinwarddirection. This phase presented optimum conditions ior uraniumemplacement: ground-water flux was still quite high and parallelto sand axes; uranium content in the waters was at a maximum;and reductants were already in place. Potassium-argon datesreported by Lee and Brookins (1978) support this interpretation.
MODIFICATION PHASE—Post-Brushy Basin hydrologic historyhas been obscured by the widespread pre-Dakota (Cretaceous)unconformity. Recharge of the exposed Westwater Canyon fanalong the southwest basin margin during Early Cretaceous ero-sion probably led to a period of renewed aquifer flushing andredistribution of some primary ore. During the development ofthe swampy Dakota environment above the unconformity, flowcells probably were shallow and local, and regional flux wasseverely reduced (fig. !l). Original mineralization patterns werelittle affected, and the acidic ground waters produced at theshallow water table were ineffective in further mobilizing humatematerial (Stevenson and Butler, 1969).
[New Mexico Bureau of Mines & Mineral Resources, Memoir 38,1980]

68
FIGURE 11—EAKIY IVOUHUN OI mi WISIWATIR CANYON AQUIFER,VII-wfcDAioNi, A WI-.M I: AS i Die six I ION. A) Syndcpositional flow underwaier-iable conditions. Water rapidly infiltrated the highly permeableproximal and intermediate fan surface, recharging the basinward flowsystem. Discharge probably occurred along the toe of the fan system.Waters were fresh. Organic debris accumulating at the fan surface wasleached, and soluble components were transported along the flow pathuntil increasing salinity or mixing with deeper discharging waterscaused flocculation and accumulation as primary humatc masses(black). B) Burial by the less transmissive, tuffaceous Brushy Basin fandeposits initiated the early postdepositional, semiconfined flow phaseof the Wesiwater Canyon aquifer system. Ground-water How was col-lected and transported down the regional gradient within the WestwaterCanyon sands. Primary mineralization of humate masses (hatchured)and other organic debris probably occurred during this flow phase. C)Pre-Dakota erosion stripped away mosi of the proximal fan depositsand was followed by a period of swampy conditions above the uncon-formity. A shallow water table and stagnant flow conditions prevailed;little meteoric flow entered the aquifer. Orebodies were little affected.
Throughout much of the Late Cretaceous, the Westwater Can->on was buried beneath several thousand feet of coastal plainar.d marine deposits* effectively insulating the aquifer systemfrom meteoric circulation. Furthermore, although the effect on:'-e mineral deposits of the waters expelled from associated muds> ;T-ecuiame, the entire Westwater Canyon quite possibly was
• -'r;sc:ec to reducing connate marine waters expulsed from over-.y.r.z ~ J - > : consequently, primary oxidation patterns producedz.-?.z -.realization were obscured.
•-•'• - -?:::"; and exposure of the Westwater Canyon around the-,t~ -,- i-, -.-• -ftg san Juan Basin during the Laramide tectonicr".i;.; :~e :'ir. system was again subject to active ground-water:"..:••£ rj~',i:zing waters began to recharge the aquifer along-it :.•.•.•--:—. :-:;rop belt; this regime continues today. Shallow
pr.-.i-•.. . : £.-..-:r; deposits of this part of the fan system were ox-.z.z.tz zr.z .-.i-.il.-; remobilized by the evolving Tertiary flow5>•:?".. •_•-.--.;• '_*:Muring primary ore trends and generating thei'.a.:t.tz s.-.-: ".^-•haped orebodies. Two generations of secon-dary ox:ti.::-r. z-,i remobilization are described in this volumeby SauciiT. Hyd-ochemistry and physical hydrology of themodern fio1* system are thus discordant to primary mineraliza-tion trends.
Implications for explorationThe hypothesis that mineralization occurred during the early
ground-water flow system within a subaerial wet fan yieldsseveral implications that are consistent with results of continuedexploration:
1) Because mineralizing ground-water flow paralleled paleo-channel axes, mineralization trends likewise will parallel paleo-channel axes and will extend through a bioad area of the fan.
2) Multiple ore-producing trends can be expected to occur indeep portions of the San Juan Basin. Exploration limits will bedictated by economic considerations rather than by geologic un-favorability.
3) Mineralization may occur along both margins of majorsand axes, particularly within sinuous mixed-load and bed-loadfluvial facies. Distal fan facies are least favorable for largedeposits,
4) Only structures that intluenced deposition or were presentduring the early postdepositional history of the Westwater Can-yon should have influenced primary mineralization trends;however, younger structural features may have profoundly in-fluenced redistribution of uranium during the modificationphase.
5) Finally, many proposed Westwater Canyon exploration cri-teria that relate mineralization to the location of the overlyingunconformity or present outcrop, to modern hydrochemicaltrends, or to localized sources of uranium-bearing waters areprobably too restrictive. Mineralization was a product of re-gional, inherent geochemical and hydrodynamic attributes of theearly flow system that developed in a major alluvial-fan deposi-tional system. The principal limitation was likely imposed byavailability of a source for large quantities of easily mobilizeduranium in recharge areas of the fan aquifer. Flow of mineraliza-ing ground waters was localized within certain portions of the fansystem by regional head configuration extant during and soonafter deposition of the host strata. Such localization of flow mayhave further restricted distribution of large-scale mineralizationwithin the fan system.
ReferencesBrookins, D. G., 1977, Uranium deposits of the Grants, New Mexico,
mineral belt: Grand Junction, U.S. Energy Research and DevelopmentAdministration (ERDA), contract no. AT(05-1)-1636-1, 143 p.
Campbell, C. V., 1976, Reservoir geometry of a fluvial sheet sandstone:American Association of Petroleum Geologists, Bull., v. 60, no. 7, p.1009-1020
Craig, S. P., Holmes, C. N., Cadlgan, R. A., Freeman, V. L., Mullens,T. E., and Weir, G. W., 1955, Stratigraphy of Morrison and relatedformations, Colorado Plateau region, a preliminary report: U.S. Geo-logical Survey, Bull. 10090-E, p. 125-168
Davis, G. H., Green, J. H., Olmstead, F. H., and Brown, D. W., l r j9,Ground-water conditions and storage capacity in the San JoaquinValley, California: U.S. Geological Survey, Waier-supply Paper 1469,125 p.
Davis, G. H., Lofgren, B. E., and Mask, S., 1964, Use of ground-waterreservoirs for storage of surface water in the San Joaquin Valley,California: U.S. Geological Survey, Water-supply Paper 1618, 125 p.
Galloway, W. E., 1979, Fluvial depositional systems, in Depositional andground-water flow systems in the exploration for uranium, W. E.Galloway, C. W. Kreitler, and J. H. McGowen, eds.: University ofTexas (Austin), Bureau of Economic Geology, p. 13-42
Galloway, W. E., and Kaiser, W. R., 1980, Catahoula Formation of theTexas Coastal Plain: Origin, geochemtcal evolution, and characteristicsof uranium deposits: University of Texas (Austin), Bureau of Eco-nomic Geology, Report of Investigations, no. 100, 81 p.
Gole, C. V., and Chilale, S. V., 1966, Inland delta building activity ofKosi River: American Society of Civil Engineers, Proc, Journal of Hy-draulics Division, v. 92, p. 111-126
Granger, H. C , Santos, E. S., Dean, B. G., and Moore, F. B., 1961,Sandstone-type uranium deposits at Ambrosia Lake, New Mexico—anad interim report: Economic Geology, v. 56, no. 7, p. 1180-1198
Kelley, V. C , Kittel, D. F., and Melancon, P. E., 1968, Uranium deposits
[New Mexico Bureau of Mines & Mineral Resources, Memoir 38,1980]

69
of the Grants region, in Ore deposits of the United States, 1933-1967:New York, American Institute of Mining, Metallurgical, and Petro-leum Engineers, v. 1, p. 747-769
Kelly, T. E., 1977, Geohydrology of the Westwater Canyon Member.Morrison Formation, of the southern San Juan Basin, New Mexico:New Mexico Geological Society, Guidebook 28th field conference, p.285-290
Lee, M. J., and Brookins, D. G., 1978, Rubidium-strontium minimumages of sedimentation, uranium mineralization, and provenance, Mor-rison Formation (Upper Jurassic), Grants mineral belt, New Mexico:American Association of Petroleum Geologists, Bull., v. 62, no. 9, p.1673-1683
McGowen, J. li. , 1979, Alluvial fan systems, in Depositional andground-water flow systems in the exploration for uranium, W. E.,Galloway, C. W. Kreitler, and J. H. McGowen, eds.: University ofTexas (Austin), Bureau of Economic Geology, p. 43-79
Saucier, A. E., 1967, The Morrison and related formations in the Gallupregion: M.S. thesis, University of New Mexico, 106 p.
, 1976, Tectonic influence on uraniferous trends in the LateJurassic Morrison Formation, in Tectonics and mineral resources ofsouthwestern North America, L. A. Woodward and S. A. Northrop,eds.: New Mexico Geological Society, Spec. Pub. no. 6. p. 151157
Schumm, S. A., 1977. The fluvial system: New York, John Wiley & Sons,338 p.
Stevenson, F. J., and Butler, J. H. A., 1969, Chemistry of humic acidsand related pigments, in Organic geochemistry, methods and results,G. Eglington and J. T. J. Murphy, eds.: New York, Springer-Verlag, p.535-557
Swanson, V. E., and Palacas, J. G., 1965, Humate in coastal sands ofnorthwest Florida: U.S. Geological Survey, Bull. 1214-B, p. BI-B29
Taylor, P. S., and Stoiber, R. E., 1973, Soluble material on ash from ac-tive Central American volcanoes: Geological Society of America, Bull.,v. 84, p. 1031-1042
Walton, A. W., 1975, Zeolitic diagenesis in Oligoceiie volcanic sediments.Trans-Pecos, Texas: Geological Society of America, Bull., v. 86, p.615-624
[New Mexico Bureau of Mines & Mineral Resources, Memoir 38,1980]

70
DISCONFORMITIES IN GRANTS MINERAL BELT ANDTHEIR RELATIONSHIP TO URANIUM DEPOSITS
by Morris W. Green, U.S. Geological Survey, Federal Center,Denver, Colorado 80225
AbstractAl least five major, regionally extensive disconformities are
present in sedimentary rocks of Triassic, Jurassic, and Cre-taceous age in the Grants mineral belt; numerous local intra-formational disconformities are also present in these rocks.These disconformities, some of which have been known formany years, have proven useful in stratigraphic correlation andin differentiation of lithologically and genetically similar rocks inthe mineral belt and elsewhere on the Colorado Plateau. Two ofthese disconformities, one in the lower part of the Morrison For-mation and the pre-Dakota Sandstone disconformity, are be-lieved to be related to the distribution o'' sandstone-type uraniumdeposits in ihe Morrison Formation (Jurassic) and in the im-mediately overiying Dakota Sandstone (Cretaceous). The West-water Canyon Member and laterally equivalent beds in theRecapture Member of the Morrison Formation arc separatedfrom underlying Jurassic rocks by an ii.informational discon-formiiy which marks a major change in depositional environ-ment, from predominantly sabkha with eolian dunes below thedisconformity to mixed fluvial and lacustrine above the discon-formity. This disconformity is economically significant becauseall of the large uranium deposits in the Grams mineral belt occurin first-cycle arkosic fluvial sandstone of (he Morrison above thedisconlbrmiiy. The pre-Dakoia disconformity is a well-known,predominantly southward-beveling regional disconformity thatmarks the lower boundary of the Dakota throughout the SanJuan Basin and adjacent regions. In the western part of themineral belt, relatively impermeable siltstone of the Brushy BasinMember of the Morrison Formation has been truncated by pre-Dakota erosion at this disconformity, and uranium-bearingground waters from the Morrison have migrated into basalorganic-rich sandstone of the Dakota to produce several small- tomedium-si/ed uranium deposits.
IntroductionApproximately 12,000 ft (3,600 m) of Paleozoic, Mesozoic,
and Cenozoic sedimentary rocks underlie the San Juan Basin ofnorthwest New Mexico (fig. 1). These rocks are well exposed inoutcrops near the basin margins, where Laramide tectonic activ-ity has uplifted, folded, and faulted the sequence into its presentstructural configuration (Kelley, 1455, 1957).
Uranium occurrences and small deposits are present within thesequence throughout the basin and adjacent regions. Within theGrants mineral belt in the southern San Juan Basin on the northflank of the Zuni uplift, the larger deposits are concentrated incontinental host rocks of the Morrison Formation and TodiltoLimestone (Jurassic) and in overlying marginal-marine rocks ofthe Dakota Sandstone (Upper Cretaceous).
Since the early 1950's, when uranium was first discovered inthe Todilto Limestone north of Grants, New Mexico, the geologyof the deposits has been studied intensively by researchers and ex-plorationists because of the likelihood of finding additional largeuranium deposits in the incompletely explored 1,500-sq-mi(4,000-sq-km) basin. The Grants mineral belt annually producesapproximately 50 percen1 of the nation's supply of uranium, orapproximately 17 percent of that produced in the world. Theprobability of finding additional major uranium deposits isperhaps greater in the San Juan Basin and adjacent regions thananywhere else in the United States at the present time.
Recent stratigraphic and sedimentologic studies of the Jurassicand Lower Cretaceous host rocks have shown an interesting and
SAN JUANMOUNTAINS
BLANDINGBASIN FOUR
CORNERSPLATFORM
ARCHULETAg-
SAN JUANBASIN
NACIMIENT
UPLIFTDEFIANCEUPLIFT
RANTSINERAL
ELTPUERCOFAULTBELT
ZUNI
.UPLIFT
GALLUP \ GRANT RIORANDEROUGH
LUCERO UPLIFTL
FIGURE 1—INDIA MAP OH I HI- SAN JI.AN BASIN. GRANTS MINI-RAI BFII,ANDADJAtlNI ARIAS.
perhaps economically significant relationship between uraniumoccurrence and two disconformities in the host-rock sequence.
When one considers the complex tectonic history of the Colo-rado Plateau—the sporadic sedimentation, erosion, and alterna-tion and mixing of depositional environments in response toclimatic and tectonic change—the numerous unconformitiespresent are not surprising. Several regional disconformities andnumerous local intraformational disconformities are present inthe mineral bell. These disconformities, some of which have beenwell-known for many years, have proven useful in stratigraphiccorrelation and in differentiating lithologically and geneticallysimilar rock sequences. At least five disconformities, not in-cluding the Precambrian unconformity, have been recognizedwithin the sedimentary sequence shown schematically in fig. 2.The disconformity shown at the base of the Westwater Canyonand Brushy Basin Members of the Morrison Formation and theone between the Morrison and the overlying Dakota Sandstoneare included in this discussion, because they are associated withuranium deposits in the mineral belt. Until now, their signif-icance in relationship to uranium occurrence has not been em-phasized other than to point out that Morrison uranium hostrocks have been truncated (fig. 3) south of the mineral belt bypre-Dakota erosion and depositional offlap onto the Zuni high-land (Silver, 1948). The pre-Dakota disconformity progressivelymarks a regional erosional truncation of Morrison and olderMesozoic and Paleozoic strata in a south-southwesterly direc-tion. The Dakota eventually laps onto Prc- .mbrian rocks ap-proximately 150 mi (250 km) south of the mineral belt. In aschematic cross section (fig. 4), roughly northeast-southwestthrough the eastern end of the mineral belt, depositional offlapas described by Silver occurs in coincidence with pre-Dakota ero-sion. All sedimentary units thin depositionally and are truncated
[New Mexico Bureau of Mines & Mineral Resources, Memoir38,1980]

71
DAKOTA SS JACKPILE SS "££&
CHINLE FM.- = - _- -«_ PETRIFIED FOREST
JHOREAUGRANTS
SAN ANDRES LS - GLORIETTA SS -YESO FM. - ABO FM
(PERMIAN) ! F I G U R E 4 — S c H i - M A i k t R o s s S K n o s S H O U I M , m i O I I I A I ' A M > I K H
' S I O N A I I R I N C A I I O N O f J l R X S S K A M ) o l l ) f '; K O ( K s I ) \ i K l l l l / . I M
FIGURE 2—SCHEMATIC CROSS SECTION SHOWING SEDIMENTARY ROCKS AND HIGHI ANDDISCONIORMITIESINTHh GRANTSMINtRAl BEIT.
by pre-Dakota erosion. Uranium host rocks of the Morrison For-mation thin depositionally and are truncated along an east-westline near the present Zuni uplift axis.
Lower Morrison disconformityThe Morrison Formation and the overlying cliff-forming
Dakota Sandstone (fig. 5) are well exposed in almost continuousoutcrop a few miles north of 1-40 throughout the mineral belt.Stratigraphic and depositional-environment studies of theserocks have shown the existence of a disconformity, referred to asthe lower Morrison disconformily, at the base of the WestwaterCanyon Member and equivalent beds in the Recapture Memberof the Morrison Formation throughout the outcrop belt. At thewestern end of the mineral belt in the vicinity of Gallup, thedisconformity is readily apparent (fig. 6) because of the abruptchange in environment above and below the disconformity. Flu-vial sandstone of the Westwater Canyon Member, deposited asthe midfan facies of a large coalescing alluvial-fan complex, is inerosional contact with underlying eolian crossbedded dune sand-stone of the Cow Springs Sandstone. Saucier (1967) first de-scribed this erosion surface in the Gallup area. In subsequentwork, I have extended this break in the depositional recordthroughout the outcrop belt. As work progressed eastward across
SELAGUNA AREA
SWZUNI HIGHLAND
the mineral belt, the discontinuity was found to be obscuredbecause similar lithologies occur in units above and below thebreak. Because of this similarity, rocks both above and below thedisconf'ormity are presently included in the Recapture Member ofthe Morrison in the central part of the mineral belt. Fluvial sand-stone, shown in fig. 6 above the break, changes laterally eastward
FIGURE 5—MORRISON FORMATION AND OVERI VINO DAKOTA SANDSIONI(CAPROCK) IN THE WESTERN ENDOI- THE GRANTS MINERAL Bt l 1
FIGURE 3—SCHEMATIC FENCE DIAGRAM SHOWING TRIASSIC AND JURASSIC FIGURE 6—EROSIONAL DISCONFORMITY BETWEEN THE COW SPRINGSROCKS AND DISCONFORMITIES IN THE SOUTHERN PART OF THE SAN JUAN SANDSTONE <LOWER CROSSBEDDED UNIT) AND THE WESTWATER CANYONBASIN. MEMBER OF THE MORRISON FORMATION.
[New Mexico Bureau of Mines & Mineral Resources, Memoir 38,1980]

72
into equivalent siltstone beds of fluvial-lacustrine origin (fig. 7),reflecting the change from bed-load dominated, midfan facies ofthe alluvial-fan complex to suspended-load distal facies. Withinthe fan complex, the Westwater Canyon (midfan facies), domi-nant in the western half of the mineral belt, gives way to theBrushy Basin Member (distal-fan facies) in the eastern half of thebelt, as shown in fig. 7. This facies relationship indicates thatsediment transport directions in the Westwater Canyon-BrushyBasin sequence are generally east-northeasterly, away from asediment source thai lay south-southwest of the Gallup area, asfirst demonstrated by Craig and others in 1955. In the easternhalf of the mineral bell near Laguna, Moench and Schlee (1967,p. 21) also have documented northeasterly transport directions influvial bed-load sandstone of the Jackpile sandstone of theBrushy Basin Member. This uniformity of transport directionsuggests thai the alluvial-fan complex was fed, in large part,from a relatively widespread source southwest of the Zunihighland. Some internal variation in transport direction may oc-cur wiihin the Westwater Canyon-Brushy Basin sequence. Fur-ther study of transport directions is necessary to determine theex lent of these variations.
Below the disconformity shown in figs. 6 and 7, crossbeddedeolian-dune sandstone changes laterally to siltstone of inland,interdune sabkha origin. This sabkha siltstone facies is similar inoutward appearance to that of the overlying fluvial-lacustrinesiltstone facies of the alluvial-fan complex. In the eastern half ofthe mineral belt, the disconformity is commonly marked by athin basal lag conglomerate (fig. 8) composed of variegated chertpebbles and reworked sandstone or conglomeratic sandstonelocally containing an abundance of fossilized bone fragments(fig. 9). The basal conglomerate bed ranges from a thin layer ofpebbles in outcrops north of Thoreau and the Continental Divideto a thickness of over 6 ft (2 m) in the eastern part of the mineralbelt in the vicinity of Acoma and Laguna pueblos. In the westernend of the belt, large clasts (fig. 10) of the underlying eolian-dunesandstone fill channels scoured into rocks below the disconform-ity.
Locally, the disconformily is marked by the presence of whatare interpreted to be zones of regolith in the upper part of theunderlying sequence (fig. )1). These zones are characterized bydistortion of primary bedding structures, intense surface wea-thering, mud cracks, and abundant secondary calcite cement.
Fig. 12 shows the disconformity at Dos Lomas, north ofGrants, New Mexico. Thin-bedded sandstone and siltstone bedsof the dune-sabkha environment below the disconformity arelocally truncated at a low angle by overlying fluvial sandstoneand overbank siltstone beds. Even though lithologies above andbelow the break are similar, there is a marked contrast in deposi-tional environments. Paleoclimatic depositional conditionsbelow the break were extremely arid, whereas beds above weredeposited during humid conditions. Fig. 13 shows a similar rela-
GALLUP
COALESCING ALLUVIAL FAN COMPLEX
tfiittvSai FiMVIAL I 1 FLUVIAL-k~.7~Y-.T--J HUVIftL I i LACUSTRINE
GRANTS SANDSTONE SILTSTONE _
SANDSTONE SILTSTONE
E5221~LACUSTRINELIMESTONE
ANONCITO
MORRISON FW
BLUFF SCOW SPRINGS SS
SAN RAFAEL GROUP
g . ^ \ - v * j " . : / - - •• . • • •
FIGURE 8—BASAI CONGLOMERATIC SANDSTONE AT THE LOWER MORRISON
DISC ONI ORMITY NORTH OF THOREAU, NbW MbXICO.
tionship above and below the disconformity in the easternmostend of the mineral bell north of Canoncito; however, beds abovethe disconformity are predominantly lacustrine in origin, in-dicated by thin limestone and chert beds between siltstone andclaystonc beds. Also present in this area are several relativelythin, laterally restricted sandstone beds of fluvial origin.
The significance of this disconformity with respect to uraniumdeposits is that all known, large uranium deposits in the Grantsmineral belt lie in first-cycle arkosic sandstones of the coalescingalluvial-fan complex above the disconformity; this knowledge isimportant for future exploration and resource assessment in thebasin, because a lower boundary can now be placed on the majorhost-rock sequence within the mineral belt and possibly through-out the basin. As exploration progresses to deeper parts of thebasin, drilling depths can be closely calculated for completeassessment of the more favorable interval.
j^Cifew-
FIGURE 7—SCHEMATIC CROSS SECTION THROUGH THE GRANTS MINERAL FIGURE 9—FOSSILIZED BONE FRAGMENTS IN THE BASAL CONGLOMERATIC
BELT SHOWING THE DISTRIBUTION OF DEPOSITIONAL ENVIRONMENTS OF SANDSTONE MARKING THE LOWER MORRISON DISCONFORMITY NORTHWEST
JURASSIC ROCKS. OF LAGUNA. NEW MEXICO.
[New Mexico Bureau of Mines & Mineral Resources, Memoir 38,1980]

73
FIGURE 10—SANDSTONI- OASTS COMPOSED OK UNDERLYING COW SPRINGSS A N D S T O N E IN BASAI WESTWATER C A N Y O N - B R U S H Y B A S I N SEQUENCE
NI AR GAI I up. NEW MEXICO.
FIGURE 12—LOWER MORRISON DISCONIORMIIY AI DOS LOMASNOKIHOIGRANTS, NEW MEXICO: underlying rocks arc locally truncated at a lowangle by rocks above the disconformity.
Recognition of the disconformity in the subsurface may be dif-ficult because lithologic differences across the disconformitymay not be recognizable; however, analysis of drill-hole data byMartinez (1976) indicates this break can be traced in the sub-surface using standard resistivity logs. In several drill holes northof Laguna, Martinez was able to distinguish "kicks" at the dis-conformity, which he attributed to calcite cement associated withthe basal lag conglomerate. This information, in conjunctionwith a knowledge of depositional environments and facies rela-tionships as determined from outcrop studies above and belowthe disconformity, should aid significantly in the continuingsearch for uranium.
Pre-Dakota disconformityPre-Dakota Sandstone erosion has progressively truncated
Jurassic host rocks south of the Grants mineral belt over the Zunihighland (fig. 3). In addition to this southward beveling, geologicmapping in the western end of the mineral belt has shown thatthe Brushy Basin Member of the Morrison Formation is progres-sively beveled to the west, leaving the Dakota Sandstone in con-tact with the Westwater Canyon Member. At the outcrop of theBrushy Basin line of truncation, a short distance east of Gallup(fig. 14), intense alteration of sandstone of the Westwater Can-yon Member occurs. The sandstone is kaolinized and bleached toform a continuous white cliff along most of the southern edge ofthe Gallup mining district. Locally, alteration extends downwardinto the Cow Springs Sandstone below the lower Morrison dis-
conformity. This alteration is believed lo have been caused byleakage of ground water which was bearing organic acids fromcarbonaceous sediment in the overlying Dakota Sandstone. Suchalteration of sandstone adjacent to organic-rich Cretaceous sedi-ment is not uncommon in other areas ol the San Juan Basin andColorado Plateau. The presence of silt stone and other fine-grained, impermeable lenses and partings within the Wesiwater
FIGURE 13—LOWER MORRISON DISCONKORMITY NORTH OF CANONCTTO.NEW MEXICO; disconformity is marked by the ledge at top of verticalcliff-forming sequence.
FIGURE 11—ZONE OF RECOLITH (upper part of vertical cliff in fore-ground) formed by surface weathering below the lower Morrisondisconformity in outcrops northeast of Gallup, New Mexico.
FIGURE 14—DAKOTA SANDSTONE IN EROSIONAL CONTACT WITHWESTWATER CANYON SANDSTONE NORTH OK GALLUP, NEW MEXICO;Brushy Basin Member has been eroded.
[New Mexico Bureau of Mines & Mineral Resources, Memoir 38,1980]

74
A'
DEFIANUPLIFT/
WESTERN GRANTSMINERAL BELT
URANIUMMINERAL-
GALLUPT"uPLIFT\ZAiN°N
DAKOTASS
Uranium Deposits
Movement ol Ground WaterBoundary of
Alteration Zone
F I G U R E 15 — S( HI-MA IK < KOSS SK I ION SHDW1NC, I ' R I - D A K O I AIRUNC AIION Ol BKl.Sin B A S I N AND 1'OSIUIAIID GROUNDWATER I 1 OWI ' A I T I R N S I N i in W I S H KN CAR i til m i G R A M S MINI RAI id I I
and underlying sandslone unils limits the downward distance ofalteration by acting as a barrier to altering ground-water solu-tions.
Several small- to medium-size uranium deposits and occur-rences are (bund in basal, organic-rich, distributary-channelsandstone beds of the Dakota (fig. 15) where it overlies theWestwater Canyon. These deposits are believed to be the resultof migration of uranium-bearing ground water from the West-water Canyon upward into the overlying organic-rich Dakota,where the relatively impermeable Brushy Basin is absent.Uranium occurs in relatively thin carbonaceous sandstone bedsfrom one to several feet thick; it is concentrated on beddingplanes by detrital organic matter. Mineralization also occurs injoinls within these sandstone beds. Some deposits occur in prox-imity to the erosional surface (fig. 16) and in scour channels atthe disconformity (fig. 17). All deposits and occurrences in theDakota are found in the lower half of the formation, suggestingthat uranium-bearing solutions were migrating stratigraphically
,t
FIGURE 16—SMALL URANIUM MINE (BLACK DIAMOND) IN THIN DAKOTA
SANDSTONE BEDS NEAR THE CONTACT WITH UNDERLYING MORRISON SAND-
STONE.
FIGURE 17—PRE-DAKOTA EROSION CHANNII NORTHEAST oh GAII IT inwhich uranium mineralization (Delter prospect) occurs in basal Dakotasandstone bed.
upward under considerable hydrostatic head, rather than down-ward through straiigraphically higher organic-rich Cretaceoussediments.
In the central part of the mineral belt north of Haystack Buttenear Grants, several small mines are clustered in tl c Dakotaabove the Brushy Basin Member. However, these deposits areassociated with several faults and joint sets in the area (Mirsky,1953, p. 17; Thaden and others, 1966), suggesting that mineral-ization has occurred as a result of leakage of mineralizing solu-tions along faults, from the Westwater Canyon upward throughthe Brushy Basin. The details of factors controlling Dakotauranium mineralization and the geology of individual mines aredescribed by Pierson and Green (1980).
ReferencesCraig, I.. C , and others, 1955, Stratigraphy of ihe Morrison and relaied
formations, Colorado Plateau region—a preliminary repori: U.S. Geo-logical Survey, Bull. 1009-E,p. 125-167
Kelley, V. C , 1955, Regional tectonics of the Colorado Plateau and rela-tionship to ihe origin and distribution of uranium.1 University of NewMexico, Pubs, in Geology no. 5, 120 p.
, 1957, Tectonics of the San Juan Basin and surrounding areas, inGeology of the Southwestern San Juan Basin: Four Corners GeologicalSociety, 2nd field conference, p. 44-52
Martinez, Ruben, 1976, Stratigraphy of the Morrison Formation andprovenance study of the Brushy Basin and Westwater Canyon Mem-bers between Gallup and Laguna, New Mexico: Ph.D. thesis proposal.University of New Mexico, 79 p.
Mirsky, Arthur, 1953, Preliminary report on uranium mineralization inthe Dakota Sandstone, Zuni uplift. New Mexico: U.S. Atomic EnergyCommission, Rept. RME-47, 21 p.
Moench, R. H., and Schlee, J. S., 1967, Geology and uranium deposits ofthe Laguna district. New Mexico: U.S. Geological Survey, Prof. Paper519,117 p.
Pierson, C. T., and Green, M. W., 1980, Factors controlling localizationof uranium deposits in the Dakota Sandstone, Gallup and AmbrosiaLake mining districts, McKinley County, New Mexico: U.S. GeologicalSurvey, Bull. 1485,31 p.
Saucier, A. E., 1967, The Morrison Formation in the Gallup region: NewMexico Geological Society, Guidebook 18th field conference, p.138-144
Silver, Caswell, 1948, Jurassic overlap in western New Mexico: AmericanAssociation of Petroleum Geologists, Bull., v. 32, no. 1, p. 68-81
Thaden, R. E., Santos, E. S. and Osiling, E. J., 1966, Geologic map ofthe Goat Mountain quadrangle, McKinley County, New Mexico: U.S.Geological Survey, Geologic Quadrangle Map GQ-518
[New Mexico Bureau of Mines & Mineral Resources, Memoir 38,1980]

75
ORGANIC GEOCHEMISTRY AND URANIUMIN GRANTS MINERAL BELT
by Joel S. Le\cnihal, VS. Geological Survey, Denver. Colorado S()22f
AbstractOrganic material is intimately associated with the primary
uranium deposits of the Grants mineral bell. This organic mate-rial is now insoluble and nonvolatile, and most of it lacks cellularstructure. The mixture of organic matter and uranium coats sandgrains and fills interstices, which seems to indicate that both theorganic matter and uranium were introduced as soluble materialsafter sedimentation. The relationship of organic matter anduranium can be shown physically, chemically, and statistically.Pyrolysis-gas chromatography, mass spectrometry, and ele-mental analysis have been used to examine the organic matterfrom several ore deposits. The results show carbon-rich materialsthat have been severely degraded by radiation from uranium anddaughter products. The organic material now resembles amor-phous carbon, having lost most of its hydrogen and oxygen.From the uranium content and approximate age, the radiationdose is calculated to be 10" rads. """he radiation damage has alsoproduced an interesting new carbon-isotope fractionation effect,by which the carbon associated with ore is enriched in carbon-13(C") relative to the non-ore carbon. From model experimentsand laboratory work on samples from the Grants district, thefollowing hypotheses are made: first, the soluble organic matter(of unknown origin) coated or precipitated on the mineral grains;subsequently, the uranium (probably as uranyl cation or car-bonate anion complex) was concentrated in and on this organicmatter by ion exchange and chelation with functional groups.This cycle of organic coating and uranium concentration couldhave been episodic or continuous but must have lasted at least 10*years, based on calculations using assumed porosity, permeabil-ity, hydraulic gradient, uranium content of water, and organicconcentration factors. Finally, after 10" years, the radiationdamage has created an amorphous carbon material that is defi-cient in hydrogen and oxygen; this material helps to protect theore from mobilization because it is chemically inert.
IntroductionOrganic matter is present in most sandstone-type uranium
deposits. This common association has led many uranium geol-ogists to comment on the importance of organic matter (Grangerand others, 1961; Fischer, 1942, 1956; Motica, 1968; Rackley,1972; Squyres, 1972; and Adams and others, 1978).
This report is a general outline of the possible roles of organicmatter in forming and preserving uranium deposits (Leventhal,1976a). I have classified the organic matter and then discussedthe following relationships of organic matter to uranium: 1)possible origins and chemical characterization of the organicmatter found associated with uranium ore, 2) the role of organicmatter in concentrating uranium from dilute solutions, and 3)data of earlier workers that show analyses concordant, altered,and discordant behavior in sample suites. This data may be usedto determine primary relationships.
ACKNOWLEDGMENTS—Joni Jennings Walker is responsible forsome of the laboratory work, particularly that related to humicmaterials. I am indebted to Harry Granger for getting me into theGrants uranium-organic study; he also guided me through themines and field, and he provided samples, suggestions, and con-structive criticism.
Role of organic materialin uranium deposits
Plants and animals from terrestrial and aquatic environmentsprovide many types of organic matter that can be added to
sediments. Most organic matter comes from plants and micro-organisms. More than 99 percent of the living material is oxi-dized by biological or inorganic processes; less than 1 percent hasbeen preserved by sedimentary burial (Tissot and Welle, 1978).Fig. 1 depicts the organic carbon cycle, showing pathways ofchanges in organic material and solubility or insolubility of itsvarious forms.
If the preserved organic material is buried less than 10,000 ftdeep and/or not heated o\er 100'X", it retains its cellular struc-ture; the material can be recognized as leaves, twigs, or otherforms, and it will contain some of its original chemicals. Soluble,nonstructured organic material is also present in recent sedimentsas humic material. Humic material may be carried in suspensionor dissolved in water; most of it is decomposed (and oxidized) orends up in the ocean, but some of it may coat mineral grains.
If the organic material is deeply buried and heated, it will betransformed into gas (CO... CM,), petroleum, amorphous car-bon, and graphite. Petroleum is high-temperature organic matterthat is insoluble in water but will dissolve in organic solvents,such as a mixture of benzene, methanol, chloroform, and hex-ane. The gas and petroleum may migrate back to the surface oraccumulate in a suitable trap.
Solid insoluble organic matter is termed kcrogi'/i, regardless oforigin (Tissot and Welte, 1978). Humic material is low-temperature organic matter that is soluble in weakly basicaqueous solutions. Humic acid may precipitate in response tolow pH (less than 3), cation loading, or normal aging. Fulvic acidis soluble at all pH values. Ancient sediments, especially low-rank coals, can be oxidized and will also yield base-solublereconstituted humic acids.
Lab or field tests can be made on organic material to classify itas kerogen, humic material, or petroleum by mixing a finelyground 1-gram sample of organic material or sediment in 10grams of water (slightly basic) or organic solvent. A colored solu-tion indicates solubility: water-soluble materials arc Inimic orfulvic; organic-soluble materials are petroleum. It there is nocolor, no soluble organic material is present.
The role of organic material in the uranium geochemical cycleis shown in fig. 2, which is a schematic of the five steps of the roleof organic matter in uranium ore formation: mobilization, trans-portation, concentration, reduction, and preservation. Step 1gives the possible role of organic matter in mobilization ofuranium from igneous rocks, where decomposition of biologicalmaterial raises the partial pressure of CO. and forms organicacids, both of which may leach and complex uranium. Step 2 isthe possible role of organic-decomposition products as transport-ing agents for oxidized uranium species. These organic materials,such as fulvic and humic acids as well as smaller organicmolecules, are capable of complexing and transporting oxidizeduranium species.
Step 3 is the most important, in which organic matter is essen-tial in forming high-grade uranium deposits. Organic matter canconcentrate uranium 10,000 times from water (Szalay, 1964;Manskaya and Drozdova, 1968). Based on this ratio, water con-taining 50 ppb (parts per billion) uranium passing over organicmaterial would result in a concentation of 500 ppm (parts permillion) uranium in the organic material. Approximately a 1.1ratio, by weight, of organic carbon to uranium is found in theGrants district (Granger and others, 1961). Pristine (trend) orescontaining 0.7 percent (by weight) organic material also containabout 0.7 percent uranium; likewise, ores containing 4 percentorganic material contain about 4 percent uranium. Uranium con-centration factors (conditional stability constants) as high as 10'have been shown for fulvic acid, a naturally occurring organic
[New Mexico Bureau of Mines & Mineral Resources, Memoir 38,1980]

76
H2O
CO2
OXIDIZED PETROLEUM
PETROLEUM RESIDUE
AMORPHOUS CARBON
GRAPHITE
CO2 PETROLEUM
CH4 OIL3
F I G U R E 1—Cvi II Ol ORGANIC MATHR.I'ARTKUI ARLY Wl TH RH-fcRFNC'fc TO SANDS! ONE-TYI'k URANIUM DEPOSITS.
1. MOBILIZATION
DECOMPOSITION OF ORGANIC MATERIAL RAISES « 2 PARTIAL PRESSURE
IN GROUND WATER AND SOIL ADDS ORGANIC COn AND ORGANIC ACIDS
WHICH LEACH AND MOBILIZE URANIUM.
2. TRANSPORTATIONURANIUM IS TRANSPORTED AS DICARBONATE ANION OR AS SOLUBLE
ORHANIC COMPLEX IN GROUND WATER AND SURFACE WATER.
3 CONCENTRA TIONORGANIC MATERIALS WITH FUNCTIONAL GROUPS (SUCH AS HUMIC ACIDS)
ION EXCHANGE OR CHELATE URANIUM. CONCENTRATION FACTORS OF
GREATER THAN 10.000 T4MES HAVE BEEN OBSERVED.
HUMIC ACID CAN PRECIPITATE AT INTERFACE OF RECHARGE AND
AQUIFER WATERS OR WHERE PH BECOMES MORE ACID OR WHERE
INCREASED SALT CONTENT IS ENCOUNTERED.
4. REDUCTION
SLOW REDUCTION OF URANIUM WHICH IS HELD BY ORGANIC MATTER
AS THE ORGANIC MATTER DECOMPOSES ABIOGENICALLY
5. PRESERVATIONREDUCED URANIUM INTIMATELY MIXED WITH REFRACTORY ORGANIC
MATTER IS PROTECTED FROM OXIDATION,
FIGURE 2—SCHEMATIC REPRESENTATION OF THE ROLE OF ORGANICMATTER IN CHRONOLOGY OF URANIUM-ORE FORMATION.
material similar to humic acid (Jennings, 1976; Jennings andLeventhal, 1976).
A structural model for humic acid, a type of organic materialthat is known to concentrate uranium, has been presented by Jen-nings and Levenlhal (1978) and is reproduced here (fig. 3).Humic material is made up of water and base-soluble (in car-bonate or hydroxide) fulvic acid and humic acid. It is a complexmacromolecule with molecular weight of 500 to 20,000. Its sol-ubility is due to the many oxygen-containing polar functionalgroups. Humic material has the approximate chemical formula(CiiH,6OiNS)n) where n is an integer (1-3 for fulvic acid and 4-50for humic acid). Fulvic and humic materials can be formed inwater or soil either by decomposition of organic materials suchas plants, animals, and microorganisms, or by reoxidation ofcoal, petroleum, or kerogen.
Not all organic material is capable of concentrating uraniumdirectly (Jennings and Leventhal, 1978). For example, the ura-nium content of petroleum is generally in the range of only a fewppm (Erickson and others, 1954), probably because petroleumhas few functional groups. Obviously, even tne right type oforganic material will be insufficient if little or no uranium is pres-ent. In the Green River formation (Eocene) of Wyoming andColorado, where 10-20 percent organic material is present, only2-4 ppm of uranium is found. Humic acid has often been used asthe model substance of organic material in certain uranium de-posits (Squyres, 1972). That this material has a humic-acid originhas not been proved, because the infrared spectrum of organicmaterial in these deposits is not distinct from those of the oxi-dized coal or oxidized-petroleum fractions. The organic materialis structureless, coats sand grains, and probably was water sol-uble, but its source and mode of precipitation are not yet known.
Step 4 shows the close association of uranium and organicmaterial in the interstices between sand grains. Presumably theorganic material creates an environment that reduces the ura-nium concentrated by the organic material. Thus, the organicmaterial plays the dual role of concentrating uranium from solu-
[New Mexico Bureau of Mines & Mineral Resources, Memoir 38,1980]

77
HH-CO-HH-C-OHH-C-O-H
O = CHICH
H CH
L(5° v QH H H N
O,. 0°
0 Ofc
Protrusion
HO OH
FIGURE 3—A SUGGESTED CHEMICAL-STRUCTURAL MODEL oi HUMIC ACID (Jennings and Levemhal, 1977).
tion and chemically reducing it to insoluble uraninite and cof-finite. The reduction probably is not as fast as the concentrationstep (Step 4), although the speed of this process, on a geologictime scale, is unknown.
Step 5 points out the importance of the bulk organic material(long after the ore-forming process), both in physically enclosingthe uranium and in preventing chemically oxidizing conditionsfrom being established. Undoubtedly, the organic material couldbe oxidized, but under natural ground-water chemistry and flowconditions the time for oxidation is long enough that deposits ap-proximately 100 m.y. old have been preserved.
Characterization of the organic materialPrevious workers have reported a few results of analyses of
organic material associated with uranium ores from the Grantsuranium district. Unfortunately, most of the work has been doneon fossil-wood materials (lignite, coal), and few results areavailable for the amorphous organic material that is associatedwith the Grants primary (prefault, tabular) ore. Breger (1974)summarized his work from the 1950's and 1960's, which mainlyrelated to lignite and coaly structured material from the Colo-rado and Utah portions of the Colorado Plateau. Schmidt- Col-lerus (1969) reported work on organic material, principally logsfrom Wyoming. He reported radioactivity (cpm) data for sink-float fractions for a few logs from the Grants district and gave
pyrograms of these samples. In general, he did not give elemental(C,H,O) analyses or uranium content. He reported benzoxyzole(C6HjNOCH) as a pyrolysis product for both structured andunstructured material.
Moench and Schlee (1967) gave analytical data on one sampleof organic material from the Laguna area. They showed an in-frared spectrum that has been tentatively interpreted to mean theorganic material was derived from fossil plants. This interpreta-tion was based on very weak evidence: infrared spectroscopic ad-sorption of aromatic, carbonyl, and ether groups. These resultscould have been obtained from many other oxidized, radiation-degraded kerogen materials. A good infrared identification ofpetroleum-asphalt-derived material at the La Bajada deposit,New Mexico, was presented by Haji-Vassiliou and Kerr (1972).They clearly showed a petroleum-like (rather than coal-like) spec-trum for their post-Cretaceous material.
Table 1 gives elemental-analysis results for humic materials(Schnitzer and Khan, 1972), asphaltene and resins from petro-leum (Tissot and Welte, 1978), coals of various ranks (Francis,1961), Florida humates (Swanson and others, 1966), Lagunadistrict ore (Moench and Schlee, 1967), and Ambrosia Lake ore(I. A. Breger, written communication to H. C. Granger, 1959).The ores fall in the field of kerogen but are not exactly like eitherhumic materials or asphaltenes and resins. The organic materialassociated with ore chemically most resembles a high-rank coal;physically it resembles amorphous humic material or asphaltic
[New Mexico Bureau of Mines & Mineral Resources, Memoir 38,1980]

78
T A B I . h 1 — E l l M I - M A I ANAI ^ SI SOI ORGANIC MAI I R I A i S I Ol M ) IS SI D I M 1 M S
F u l v i e AcidsHumic AcidF lo r i da llumateSoi l KeroyenCoal H.A.Wood
PeatL i yn i t eLow Bituminous CoalMed Bituminous CoalAn th rac i t e Coal
Oi l Resins/AsphaltenesRock Resins/As()hj ! tenes
K.eroyen ( less mature)f'.eroyen (more mature)
Anibrosi.i Lake Ore
Layund Ore
References
C
475755,55.6550
5765798696
84.76.
72.9 1 .
67.
8 1 .
SK Schni tzer and KahnTW Tissot and We i nF Francis (1961),
1
4.5.
.0 4 .,8 (5 .
4.6.
5.4.5.5.2.
• b 8.,2 8.
,7 6.6 3.
9 2.
.7 4 .
(1972)' (1978) ,Coa l . p.
B I . Breger, w r i t t e nOre from Jeep 04
i
.4147)1.3
.2
.0540
63
02
7
fa
> PP-439
N
(1.)2.81.4
(4.8)1.21.0
1.01.01.61.71.0
1.3
2.32.0
19.
0.3
. 30-31132, 362
communication t o(?) c l a im
M Moench and Sctilee (1967),SP Swanscm and others (1966)
P.. P
0
46.434.438.532.828.742.8
36.93014
61.9
(7.1)7.4
19.02.9
j
3
13.6
S
0.60.60.70.71.2- -
- -- -__- -
2.9
0.00.3
10.1
H. Granger, Ambrosia Lake76
. C175
AtomicH/C
1.121.070.96
(1.2)0.761.5
1.090.740.830.750.25
1.221.27
0.990.42
0.48
0.68
2/20/59
Ref
KSKSPSKSKF
FFFFF
TWTW
TWTW
B
MS
Fla ,
ATOMIC O/CFIGURE 4—H/C vs. O/C (ATOMIC RATIOS) TOR SELECTED ORGANIC
MATERIALS FROM TABLE 1. Types 1, II, and III from Tissol and Welte(1978). L is Laguna ore, A is Ambrosia Lake ore, Res/Asp is the resinand asphaltene fraction of petroleum, and Fla Humate is Floridahumaie.
and resin material. These organic materials associated with orehave experienced massive doses of radiation and have lost theiroriginal identity.
Fig. 4 is a H/C vs. O/C organic evolution diagram used byorganic geochemists and coal chemists (Tissot and Welte, 1978).Type 1 organic material is algal organic material (Green RiverFormation shale) with high H/C and low O/C initial ratios. TypeII! is a coaly or humic type of organic material with lower H/Cand higher O/C (relative to type I) initial ratios. Type II is in-termediate between these two. These organic types start at the up-per right side of the diagram and evolve to the left and down,eventually reaching amorphous carbon with very little oxygen orhydrogen. After the three paths coalesce at H/C < 0.6 and O/C<0.1, the origin of the organic material cannot be determined bymeasuring carbon, hydrogen, and oxygen. The placement of theLaguna (L) and Ambrosia Lake (A) ores on the plot shows thattheir origin cannot be defined. Additional H/C data are given intable 2. These data may be suspect, though, because there is aserious problem with carbon, hydrogen, and oxygen analyses:the analytical procedure requires a pure organic material so thatoxygen and hydrogen from minerals will not be included. It isnearly impossible to remove all the mineral material, because theuranium and clays are very fine grained and admixed; therefore,most of the analytical data report H/C and O/C ratios that aretoo large. The oxygen numbers are obtained indirectly by sub-tracting the carbon, hydrogen, nitrogen, and ash weight. The ar-rows (fig. 4) indicate the probable true H/C and O/C values forthe ores if the hydrogen and oxygen from mineral material werecompletely removed. Since these classic procedures (infrared andelemental analyses) do not define the origin of the organicmaterial, two new procedures were used.
[New Mexico Bureau of Mines & Mineral Resources, Memoir38,1980]

79
T A B L E 2—P> R o n sis i m . i K A M I M ( O M T N I . i AKHOIS I O M I - \ I . A M I H C I M O M H I R M I O I O K
OKtiAMi M M U R ASSO< IAil-D u i I H i K A N I I ' M ORI-S ( s ample d a t a inc lude s a m p l e , type , m i n e , a n dloca t i on ) .
Sample ppm U %C ory H/C
Type (A) Alkane-alkene
Coal New Mexico 0.9 51.4
Type (b) H-poor
8 Jackpile, amorphous, New Mexico15.5 Paguate, amorphous. New Mexico26G61 i. Ambrosia Lake, New MexicoSec. 30 mine, amorphous. New MexicoSec. 30 mine, amorphous. New Mexico
445011000150001080027700
Type (c) Naphthalene
35G62 Poison Canyon, Ambrosia Lake, New Mexico 314516G58 Wood? bone? asphalt?, New Mexico37G62, Coal N58, New Mexico1960 Kermac Sec. 30, fracture filling. New Mexico
Type (d) Complex and aromatic
44G58 Amorphous, New Mexico 20000Black Diamond mine, New Mexico 210Black Diamond mine, Dakota Formation, New Mexico 18044G58a, Ambrosia Lake, coaly, New Mexico 8044G58d, Ambrosia Lake, coaly, New Mexico 15545G58a, Ambrosia Lake, coaly, New Mexico
1.83.70.71.15.0
6239.855. b3"
302.62.6
40.831.14.4
O.bl
0.39(1.6/)0.4')0.4(>
(3.4)0.6 70.7/0.75
All H/C data may include inorganic H from water (in clays, etc.);numbers greater than 1 given in parentheses are not considered reliable forthis organic material.
Experimental methodsStepwise pyrolysis-gas chromatography has been described by
Levenihal (1976a, b), and the experimental procedure is brieflyreviewed here. One to 10 mg of finely powdered sample is placedin a 2.5-cm-long by 2-mm (ID) quartz tube, which is put in thespiral heating coil of the Pyroprobe (Chemical Data Systems;note: mention of brand names in this report is for identificationonly and does not imply endorsement by the U.S. Geological Sur-vey). The Pyroprobe is inserted in the injection port of a gaschromatograph in helium carrier gas (12 em'/min) and pyrolyzedfor 10 seconds at 25O°C. The pyrolysis products are frozen outby liquid N; on a trap made by the first 6 cm of a 15-m x 0.5-mm(ID) porous-layer-open-tubular (PLOT) capillary column coatedwith Apiezon L on Chromsorb R-6740. The pyrolysis productsare temperature programmed at 6°/min from 50° to 280°C afterthe trap has warmed to room temperature (from liquid N- tem-perature). The procedure is repeated al 450°, 600°, 750°, and900°C (and sometimes at 1,050° and 1,200°C). In some analyses,pyrolysis products from several steps are combined.
Elemental analysis was by use of a Perkin Elmer carbon, hy-drogen, and nitrogen analyzer after acid leach to remove car-bonates. Carbon was analyzed as follows: total was by Lecocombustion, carbonate by acid-leach gasometric, and organic bydifference (Leventhal and others, 1978). Uranium was analyzedby the delayed-neulron technique (Millard, 1976). Carbonisotopes (Leventhal and Threlkeld, 1978) were measured afteracid treatment (3/V HC1) for release of carbonate and combustionat l,200°C for organic materials, on a Nier 60°-sector, dual-collector, isotope-ratio mass spectrometer. The results (table 3)are given in the PDB notation (Leventhal and Threlkeld, 1978).
Results of pyrolysis-gas chromatographyPyrolysis-gas chromaiography is used to characterize insoluble
organic material. Pyrolysis can fragment the large, insolubleoiganic molecules into smaller pieces that can be identified. Thestcpwise-pyrolysis procedure enables the removal of volatile orsoluble molecules at low temperature without the usual chemical-solvent extraction. These volatiles or solubles may be of recentorigin and not related to the organic material that fixed theuranium.
The organic material associated with sandstone-type uraniumdeposits can be classified into four types of pyrolysis-gaschromaiography (Leventhal, 1976a, b). Fig. 5 shows typicalpyrograms obtained from study of over 100 samples from west-ern United States sandstone deposits.
The pyrograms represent molecules with 9 to 30 carbon atoms.The large peaks of pyrogram A represent the normal (or linearstraight-chain) alkanes and alkenes. Alkenes are molecules withan unsalurated carbon (carbon-carbon double bond). The num-bers show the number of carbon atoms in the molecule (for ex-ample, n-Cn is C,;HJS, an alkane, and CiH,, , an alkene). Thesamples that give pyrogram A are lignites (or low-grade coalymaterial) from beds that underlie or overlie uranium deposits inWyoming and Texas. These pyrograms and the lignites them-selves look the same as those of nonmineralized ligiiites fromother localities.
Pyrogram B shows no molecules with nine or more carbons.(The hump represents small amounts of unresolved molecules orcolumn bleed.) The samples that give this type of pyrogram mayhave as much as several percent carbon, but their only pyrolysisproducts are methane and other gases (not shown on fig. 5).
[New Mexico Bureau of Mines & Mineral Resources, Memoir 38,1980]

80
TABLE 3—URANIUM, ORGANIC C ARBON. CARBONATE CARBON, AND ISOTOPIC CARBON DATAfor samples from Kerr-McGee Corp., Sec. 30 mine. New Mexico.
Lab no.
359360361362363
824825826827828
U %
0.0080.390.691.080.016
0.0382.872.781.170.016
Organic
Organic
<0.2a
0.40.8
<0.2b
0.2c
5.04.3
<0.2d
carbon
C% 413C %,
-23.52-19.61-18.73-18.71-22.65
-24.06-17.76-17.661
-16.87-26.43
Carbonate
Carbonate
0.781.270.100.041.26
<.01<.01<.01<.01<.01
carbon
a .13
-12.-11.-13.-16.-15.
_.-.-...--
C 1,
,63,93,62.05,74
'Ac id- t reated rep l i ca te -17.45 %„dReanalyzed: 0.30, by d i f fe rence; 0.11 a f te r acid leachbReanalyzed: 0.23, by d i f fe rence; C.12 a f t e r acid leachcReanalyzed: 0.19, by di f ference 0.20 to ta l combustion
^Reanalyzed: 0.13, by d i f fe rence ; 0.12 to ta l combustion
• l 3C % - Rsaniple - R std x 1000 where R = l 3C/ 1 2C of theR std Pee Dee Belemnite standard
(B)750'C STEP OF 4- SAMPLES
250 280 HOLD100 150 200COLUMN TEMPERATURE °C
FIGURE 5—STEPWISE PYROLYSIS-GAS CHROMATOGRAPHY FINGERPRINTS OF FOUR TYPES OF ORGANIC MATTER ASSOCIATED WITH URANIUMDEPOSITS.
[New Mexico Bureau of Mines & Mineral Resources, Memoir 38,1980]

These gases were synthesized from the organic material by thehigh pyrolysis temperature and by reaction with hydrogen fromwater in the clays present in the samples. These samples are oresfrom the Grants mineral belt and are amorphous, structureless,authigenie organic material intimately mixed with uranium(Granger and others, 1961). Hydrogen and carbon analyses(table 1) show they are hydrogen deficient, in some cases ap-proaching amorphous carbon.
Pyrogram C shows only one large peak and several very smallpeaks. The large peak has been identified by mass spectrometryas having a mass/energy ratio of 128, which is characteristic ofnaphthalene (C.H,,,, two fused aromatic rings). Naphthalene is amolecule that should be stable to oxidation, temperature, andradiation. The small peaks present are below the sensitivity of themass spectrometer and cannot be identified. These samples arcsimilar to type B; they are structureless and hydrogen poor.
Pyrogram D is for a complex mixture, which has been partlycharacterized by mass spectrometry. The identified peaks repre-sent various molecules built around a benzene nucleus with func-tional groups such as hydroxyl (OH), methoxyl (OCH,), andmethyl (CH,). These are representative of the structures oflignin. The samples that produce pyrogram D are from ores withstructured material that looks like coalified logs and fossil-woodfragments.
Results of carbon-isotope analysesAnalyses of stable carbon isotopes (Leventhal and Threlkeld,
1978) from two sample suites (fig. 6) of sandstone-type uranium(tabular) ores in the Grants mineral belt show interesting varia-tion. The uranium ore occurs in medium- to fine-grained fluvialsandstones of the Wesiwater Canyon Member (Upper Jurassic)of the Morrison Formation. The ore is ihe trend or tabular type,in which the ore forms blankets that literally are suspended insandstone units. Individual orebodies range from a little lessthan 1-15 m thick, from 5 m to somewhat more than 100 m wide,and from a few tens of meters to at least a thousand meters long.The richer parts of the ore commonly contain more than 1 per-cent uranium. The ore is intimately associated with structurelessorganic material that is insoluble in organic solvents, weak acids,and bases. The ore and organic material surround sand grainsand fill interstices between grains. The five samples in each suiterepresent a vertical traverse of the orebody, with one low-gradesample from the top, three samples from the middle, and anotherlow-grade sample from the bottom. The low-grade samples fromthe borders of the ore show dC" values of -22.7 to -26.4 per mil(table 3), which are typical of sedimentary organic material. Thelightest values are similar to those reported lor terrestrialkerogens and humic material. The ore samples have carbon iso-topic values that range from -16.9 to -19.6 per mil (table 3)—that is, approximately 5-8 per mil heavier than the low-gradesamples. These values are not typical of sedimentary organicmaterial from a nonmarine environment, and the organic mate-rial in these samples all seems to be derived through the epi-genetic introduction of originally soluble organic material.Because the organic material and uranium were deposited in LateJurassic time, the uranium and its daughters have deposited adose of 10" rads, which was absorbed mainly by the intimatelyassociated organic material. The decay of each atom of U2>* tolead accounts for eight alpha particles, six beta particles, andassociated gamma rays. Bond breaking by alpha radiation andalpha recoil of the nucleus are most effective in the immediatevicinity of the uranium atom, whereas bond breaking by beta andgamma radiation will be diffused over a much larger volume.The high linear-energy transfer of the alpha radiation gives ahigh density of primary ionizations that are so close together thatthey may be considered as continuous. This energy transfer andionization leads to many broken bonds, radicals, ions, and ex-cited molecules in a small volume where preferential formationof C '-deficient volatile products can occur to produce the
X-Sec.30Mine
NEW MEXICO
' . ' •.• 1 3 6 3 : - . - ' : : • ' • . ' • ' • • ' • • ' • • • . ' : • •
3 5 9 .••..•
7 cmScale:
7 cm.Scale.
F I G U R E 6 — S t ' H l ' M A I l l <)!• V l - R I U A I IRAV1KSIS I OK S A M I ' l l s IN l » < l
SUITLSIROM rHt SM'TION 30MINI- (daiaon table 3).
observed isotope effect in the bulk organic material. The radia-tion probably catalyzes the fixation of the uranium ore in theorganic material by creating chemically reactive reductants thatreduce the soluble uranyl (VI) species to insoluble DO,. Theradiation also makes the residual organic material more refrac-tory (less soluble and reactive), and it protects the uranium orefrom remobilization or solution.
The carbon isotope values of the carbonate associated with theores are lighter (less C") than those of normal nonmarine car-bonates (Keith and Weber, 1964). These light-carbonate carbonvalues indicate a considerable proportion of the carbon was de-rived through the oxidation of organic material. This isotopicallylight carbonate may represent organic material oxidized earlyduring the uranium reduction by organic materials or oxidationof organic material by later radiation damage.
DiscussionStepwise pyrolysis-gas chromatography is a useful technique
that allows analysis of insoluble sedimentary organic material.Four types of organic material have been found in samples fromwestern United States sandstone-type uranium deposits. Thematerial represented by pyrogram B (fig. 5) is the most altered,and its origin cannot be determined by pyrolysis-gas chromatog-raphy. Possibly, type B has evolved from type C, and both ofthese could have come from either type A or D. The pyrogramsshow the chemical building blocks of mineralized and non-mineralized lignite (type A) and mineralized coaly material (typeD). Unfortunately, the amorphous, structureless material of theGrants mineral belt has not produced pyrolysis products that canbe related to an organic precursor. Benzoxyzole reported to be
[New Mexico Bureau of Mines & Mineral Resources, Memoir 38,19B0]

82
present in Grants ores by Schmidt-Collerus (1969) was not de-tected in the Grants ores examined in this work.
Isotopic-carbon analyses show an interesting fractionation ef-fect; however, the results do not give clear evidence for the originof the organic material. The initial isotope value of -26 per milcould result from either land- or even marine-derived organicmaterials (Nissenbaum and Kaplan, 1972). These materials couldbe of either early diagenetic (humic) or later catagenic (petro-leum) origin, based on their isotopic signature.
Organic carbon and uranium datafrom Ambrosia Lake
Granger and others (1961) report geologic and geochemicalresults from the Ambrosia Lake area of the Grants mineral belt.A complete listing of all of the analyses for more than 80 suitesof samples from prefault ore (taken vertically through the ore) isgiven by Granger (1966). Figs. 7 and 8 give the organic carbon vs.
0 02 0.05 O.I 0.2 0.5 1.0
PER CENT URANIUM
5.0
I-Kil'KI-l K \ S I I
7—Si A I I I K 1)1 AC,RAMS I OR SO\1I < >l I III 1) AI \ I ROM AMBROSIA l.AM OKI S; OKI,AMI I ARI1ON AM)
M I'l Hi i i ;>oNKK. M M . s i \11 s (Granger, 1966).
CA
RB
ON
o
OR
GA
N
T
LJO
orLJQ.
50
2 0
10
0 5
0.2
<
<
L-
-1
>—w—
•
L_
4
1
i
— •
<
_ljul
i
• *•
—»
•
•
••1
•MM
•
•
f
I•
•
•
•
1 1
!
1 II10.02 0.05 0.1 0.2 O5 L0 2.0 5.0
PER CENT URANIUMFIGURE 8—SCATTER DIAGRAMS K>K THE REST oh rm OAIA I KOM AMBROSIA LAKE ORES: « M . A M ( CARBON AND
URANIUM PLOTTED ON i oc"i-i.oci scAl HS (Granger, 1966).
[New Mexico Bureau of Mines & Mineral Resources, Memoir 38,1980]

uranium content in most of these samples. The post-fault orecontains less than 0.1 percent organic carbon, and the data wouldall plot along the bottom of the figures. There is a scatter ofresults in these figures, but there is a general trend of 1:1 (weightpercent). This relationship implies one uranium atom for approx-imately 20 carbon atoms (or 15 carbons, 10 hydrogens, and fouroxygens). The original organic material probably had more car-bon and, especially, more hydrogen and oxygen that were lostboth during reduction of the uranium (and oxidation of theorganic material) and later through radiation damage. Ex-trapolation back to the original organic elemental composition isnot possible.
The data (figs. 7 and 8) do not show a definite relationship bymine or sample suite. However, concordant (covariani) behaviorcan be seen in several of the sample suites. Fig. 9 shows fivesample suites from three mines; these suites show the 1:1 relationand are from pans of the orebodies that show little evidence ofoxidation, redistribution, or mobilization (Granger, 1966. andoral communication, 1979). These sample suites are proposed toTI present the most undisturbed ores. These samples—and others•.hat conform to the concordant, 1:1 relation—should be the bestto study geochemical associations related to ore-forming pro-cesses. These samples also may be suiied for mineralogy andpetrology studies.
A second group (fig. 10) shows concordant behavior, but theuranium to organic ratios are considerably greater than or lessthan 1:1. These ores are from suites or deposits that show evi-dence of some mobilization, redistribution, or oxidation (Gran-ger, 1966, and oral communication, 1979). These samples may beof use in studying the geochemical, mincralogie, and petro-graphic effects of remobilization. These suites of samples repre-sent only a few- (oul of seven or more) from each irine, and notall samples from the named mines show the covariant relations.Table 4 gives the listing of the suites.
Other data plotted on figs. 7 and 8 are from (he Section 17, 25,30, and 32 mines and the Ann Lee, Bucky No. I, Dog No. 1,Marquez, and San Mateo mines (both groups mostly primaryores); and Section 10, 15, 22, and 23 mines and the M-5, Cliff-side, Dysart, and Sandstone mines (both groups primary andpostfault ore).
TABl.fc 4—1 IMIM. 111 MINI \M" sWII'l I si 110 (from Granger.
1 -. I'l o l II 1) u s | | i , s 4 \ \ l >
f i g . 9
Fig. 10
Mir-
Section 30MarquezSection 23
Section 15Clif fsideAnn LeeDoris
Sdiiipl e
31-4bPIbdb9 ,4OGb2,
2'. ,592bGbl81LSb93 0Gb 2
s u i t e nt
14d b °1 lGbO
Summary and conclusionsOrganic material can play several roles in the formation of
sandslonc-iype uranium deposits of the primary, prefault.trend-ore type of the Grants mineral belt. I he role ol organicmaterial in mobilization and transportation or uranium may beof minor importance, since these processes can he accomplishedby inorganic processes as well (Hosteller and Garrels, 1962;Langmuir, 1978). Experiments show thai organic material willprecipitate with approximately 10 percent by weight of variousmetals (Swanson and others, 1966). These results imply thai theorganics and uranium did not form the deposits in one transpor-tation-concentration process.
The process of concentration by organic material is certainlyan important role, because no other mechanisms for uranium en-richment are known to be as effective. The concentration mech-anism is unknown: Is it a cation or anion species that is attachedto the organic material? How is it attached? Such a mechanismwould require the presence of organic material coating the sandgrains of the host rock both prior to and during the introductionof uranium by ground water. The crucial question still to beanswered concerns the localizing factor: Why is the organicmaterial concentrated at certain places, where it subsequentlyfixes uranium and becomes ore? One suggestion (Granger and
5 0
OCDCC
o 20
rro
0
0.5
o:
0.2
O.I
—
1
11
i1
1 1 MM
/
!i
M /
/
I 1
Q /
Vy,
fill
?/7
y/30
1 1 M MO.I 0.2 0.5 10 2.0
PER CENT URANIUM
5.0
FIGURE 9—COVARIANT ORGANIC CARBON URANIUM sun ts SHOW ING 1:1 RI i AI IONSHII'S (table 4).
[New Mexico Bureau of Mines & Mineral Resources, Memoir 3B, 1980]

84
0.1 0.2 0.5 1.0 2.0PER CENT URANIUM
J-'IGURE 1 0 — C O V A K I A M T O J U J A N K 1'ARUON-UKANILMSUITI'S Oh SAMPLKSSHOWINtiKtl AT KINSHIPS URkATl'.K THANOKI iss I MAN 1:1 (tablet).
others, 1961) is that a hydrologic boundary between two waterbodies formed the locus of organic material concentration.
Calculations show that—using reasonable assumptions of theuranium content of the water, porosity and permeability, dip ofthe strata, ground-water flow rates, and trapping efficiency—theore-formation process would take 0.5 to 5 m.y. (Leventhal andGranger, 1977). To be most efficient, this process would involveoxidized uranium species in ground water containing no free oxy-gen. In such a medium, the organic material and suHides wouldnot be severely altered or e'estroyed during the concentration pro-cess.
Reduction of the uranium probably took a longer time thanconcentration, which was instantaneous. The mechanism of re-duction requires additional study to discover which part of theorganic material supplies the electrons and is oxidized. Thereduction process also requires non-oxygen-containing groundwater. The original ion-exchanged and chelated uranium speciesare now reduced to uraninite or coffinite molecules that are sur-rounded by organic material. Strictly speaking, the uraniumitself forms no chemical bonds with the organic material; theoxygen atoms on the uranyl ion, interacting with oxygens orother functional groups on the organic material, form the bonds.No urano-organic complex (that is, no uranium) bonds with theorganic carbon. This association of uraninite and coffinitemolecules surrounded by organic material accounts for the amor-phous appearance and Jack of x-ray identifiable minerals inmany of the ores.
The organic material also plays a role in preserving the de-posit: Coatings of amorphous and refractory (due to oxidation,radiation, and time) organic material on uraninite and coffinitemolecules can protect the uranium from oxidation or mobiliza-tion. The organic material fills the interstices, thus decreasingpossible Her flow. Possibly, the carbonate cement that is pres-ent in . „• ores and shows partial origin from organically de-rived material (based on isotope analysis) has acted to seal theinterstices, so that subsequent water flow is minimized.
ReferencesAdams, S. S., Curtis, H. S., Hafen, P. L., and Salek-Nejad, H., 1978, In-
terpretation of posidepositional processes related to the formation anddestruction of the Jackpile-Paguate uranium deposit, northwest NewMexico: Economic Geology, v. 73, p. 1635-1654
Breger, I. A., 1974, The role of organic matter in the accumulation ofuranium—the organic geochemistry of coal-uranium associations, inInternational conference on formation of uranium ore deposits:Vienna, International Atomic Energy Agency, Proc, p. 99-123
Erickson, R. L., Meyers, A. T., and Horr, C. A., 1954, Association ofuranium and other metals with crude oil, asphalt and petroliferousrock: American Association of Petroleum Geologists, Bull., v. 38, p.2200-2218
Fischer, R. P., 1942, Vanadium deposits of Colorado and Utah: U.S.Geological Survey, Bull. 936-P, p. 363-394
, 1956, Uranium-vanadium-copper deposits on the Coloradoplateau, in Geological Survey research: U.S. Geological Survey, Prof.Paper 300, p. 143
Francis, W., 1961, Coal: London, Arnold, 2nd edition, 787 p.Granger, H. C , 1966, Analytical data on samples collected at Ambrosia
Lake, New Mexico, 1958 through 1962: U.S. Geological Survey, open-file rept., 485 p.
Granger, H. C , Santos, E. S., Dean, B. G., and Moore, F. B., 1961,Sandstone-type uranium deposits at Ambrosia Lake, New Mexico—an
1 interim report: Economic Geology, v. 56, no. 7, p. 1179-1210Haji-Vasiliou, A., and Kerr, P. F., 1972, Uranium-organic matter
association at La Bajada, New Mexico: Economic Geology, v. 67, p.41-54
Hostetler, P. B., and Garrels, R. M., 1962, Transportation and precipita-tion of U and V at low temperature: Economic Geology, v. 56, p.137-167
Jennings, J. K., 1976, Interaction of uranium with naturally occurringorganic substances: M .S. thesis, Colorado School of Mines, 72 p.
Jennings, J. K., and Leventhal, J. S., 1976, Interaction of oxidizeduranium with humic acids, ion-exchange resins, and chelating resins todetermine conditions of fixation (abs.): Geological Society of America,Abstracts with Programs, v. 8, p. 940
, 1977, A new structural model for humic material which showssites for attachment of oxidized uranium species, in Short papers of the
[New Mexico Bureau of Mines & Mineral Resources, Memoir 38,1980]

85
U.S. Geological Survey uranium-thorium symposium, J. A. Campbell,ed.: U.S. Geological Survey, Circ. 753, p. 10-11
1978, A literature review of interaction of oxidized uraniumspecies and uranium complexes with soluble organic matter: U.S. Geo-logical Survey, Open-file Rept. 78-179, 48 p.
Keith, M. L., and Weber, J. N., 1964, Carbon and oxygen isotopic com-position of selected limestone and fossils: Geochimica et Cosmochim-icaActa, v.28, p. 1787-1816
Langmuir, D., 1978, Uranium solution-mineral equilibria at low tempera-tures: Geochimica et Cosmochimica Acta, v. 42, p. 547-569
Leventhal, J. S., 1976a, Characterization of insoluble organic matterassociated with uranium ores (abs.): American Association of Petro-leum Geologists, Bull., v. 60, p. 692
, 1976b, Stepwise pyrolysis-gas chromatography of kerogen insedimentary rocks: Chemical Geology, v. 18, p. 5-20
Leventhal, J. S., Crock, J. G., Mountjoy, W., Thomas, J. A., Shaw, V.E., Briggs, P. H., Wahlberg, J. S., and Malcolm, M. J., 1978, Prelim-inary analytical results for a new U.S. Geological Survey DevonianOhio shale standard, SDO I: U.S. Geological Survey, Open-file Rept.78-447, 13 p.
Leventhal, J. S., and Granger, H. C , 1977, Conceptual-mathematicalmodels of uranium ore formation in sandstone-type deposits, in Shortpapers of the U.S. Geological Survey uranium-thorium symposium,J. A., Campbell, ed.: U.S. Geological Survey, Circ. 753, p. 34
Leventhal, J. S., and Threlkeld, C. N., 1978, Carbon-13/carbon-12 iso-tope fractionation of organic matter associated with uranium ores in-duced by alpha irradiation: Science, v. 202, p. 430-432
Manskaya, S. M., and Drozdcva, T. V., 1968, Geochemistry of organic-substances: New York, Pergamon Press, 347 p.
Millard, H. T., Jr., 1976, Determination of uranium and thorium in U.S.Geological Survey standard rocks by the delayed neutron technique, F.J. Flanagan, ed.: U.S. Geological Survey, Prof. Paper 840, p. 61-66
Moench, R. H., andSchlee, J. S., 1967, Geology and uranium deposits ofthe Laguna district, New Mexico: U.S. Geological Survey, Prof. Paper519, 117 p.
Motica, J. E., 1968, Geology and uranium-vanadium deposits in theUravan mineral belt, southwestern Colorado, in Ore deposits of theUnited States, 1933-1967, J. D. Ridge, ed.: New York, American In-stitute of Mining, Metallurgical, and Petroleum Engineers, Gralon-Sales volume, p. 805-813
Nissenbaum, A., and Kaplan, I., 1972, Chemical and isotopic evidencefor the origin of marine humic substances: Limnology and Oceanog-raphy, v. 17, p. 570-582
Rackley, R. I., 1972, Environment of Wyoming Tertiary uraniumdeposits: American Association of Petroleum Geologists, Bull., v. 56,p. 755-774
Schmidl-Collerus, J. J., 1969, Investigations of the relationship betweenorganic matter and uranium deposits: University of Denver, DenverResearch Institute, no. 2513, 192 p., Report to U.S. Atomic EnergyCommission
Schnitzer, M., and Khan, S. U., 1972, Humic substances and ihe environ-ment: New York, Mercel Dekker, 327 p.
Squyres, J. B., 1972, Uranium deposits of the Grants region, New Mex-ico: Wyoming Geological Association, Earth Science Bull., v. 5, no. 3,p.3-12
Swanson, V., Frost, I., Rader, L., and Huffman, C , 1966, Metal sorp-lion by northwest Florida humate: U.S. Geological Survey, Prof.Paper550-C, p. 174-177
Szalay, A., 1964, Cation exchange properties of humic acids and their im-portance in geochemical enrichment of UO : , : Gcochimica el Cosmo-chimica Acta, v. 28, p. 1605-1614
Tissot, B. P., and Welte, D. H., 1978, Petroleum formation and oc-currence: New York, Springer-Verlag, 538 p.
[New Mexico Buisau of Mines & Mineral Resources, Memoir 38,1980]

86
ORIGIN AND SIGNIFICANCE OF ORGANIC MATTERIN URANIUM DEPOSITS OF MORRISON FORMATION,
SAN JUAN BASIN, NEW MEXICOby John B. Squyres, Amoco Minerals Company, 333 West Hampden, Suite 508,
Englewood, Colorado 80110
AbstractPrimary uranium orebodies in the Morrison Formation of the
San Juan Basin, New Mexico, consist of submicroscopic cof-finite in a matrix of dark-colored, structureless carbonaceousmatter that impregnates and partially replaces the Morrisonsandstones. Recognizable carbonized plant fragments are alsoabundant both in and near ore. The orebodies are elongated, len-ticular or tabular masses; they are oriented parallel to paleo-channel systems in the host rocks. Accessory minerals in theorebodies are crudely zoned. The surrounding sediments are per-vasively altered, chiefly by destruction of iron oxides and repre-cipitation of pyrite. Stratigraphic, structural, and radiometricevidence indicates that the orebodies are approximately the sameage as their host rocks. The carbonaceous matrix of the ore hasbeen tentatively identified as degraded humate. Geologic evi-dence supports this conclusion and suggests a genetic model forthe origin and geology of the orebodies. According to this model,humic acids were leached from buried plar' debris by groundwater, during or shortly after Morrison sedimentation. The acidsmigrated with the ground water and eventually consolidated intostreamlined, interstitial humate masses. Uranium in the groundwater was chelated by the humates and subsequently reduced.Molybdenum and other metals were precipitated at the humateboundaries by hydrogen sulfide. Organic matter and reducedsulfur species were both involved in alteration of the host rocks.Posi-ore processes have modified the orebodies and host rocks.
IntroductionInterstitial organic matter, which is associated with uranium in
the primary or trend-type orebodies of the south San Juan Basin,
played a major part in the ore-forming process. The identity ofthe organic matter, its source, its role in the accumulation of ura-nium, and the mechanisms of emplacement are still unsettledquestions.
This paper presents evidence indicating that the organic matteris of humic origin and that the geology of the uranium depositscan be accounted for in terms of the properties of humic matter.The first part reviews aspects of the geology of the deposits, in-cluding features related to the origin of the organic matter orresulting from its presence. Morphology and distribution of ore,mineral zoning in the orebodies, and host-rock alteration are em-phasized. The second part reviews pertinent properties of humicmatter and summarizes evidence supporting the view that the or-ganic matter in the ore is a degraded humate. The third part is asynthesis, combining data from the preceding sections to form amodel describing the origin and evolution of the orebodies. Fi-nally, a urief list of practical inferences that may be drawn fromthe model is provided.
Location and geologic settingThe known uranium deposits of the southern San Juan Basin
are in a poorly defined belt about 95 mi (150 km) long, which ex-tends along the southern mar^n of the basin from the vicinity ofGallup, New Mexico, to the edge of the Rio Grande graben, westof Albuquerque (fig. 1). Exploration outside this belt has beenlimited, and the potential for discovery of additional depositselsewhere in the basin is excellent.
The chief host rocks for uranium in the San Juan Basin are theupper, fluvial and lacustrine members of the Jurassic Morrison
Son Juan Basin
Map Area
0 km 30
ExplanationMount Taylor Volcanics
Orebody
Morrison Outcrop BeltUranum District
Gallup
-Church Rock-Crown Point
-Smith Lake /-Ambrosia Lake
ca>.ao
T3co
(5
FIGURE I—INDEX MAP OF SOUTHERN SAN JUAN BASIN, SHOWING IOCATION. MAJOR STRIICTURAIIhATURES. AND MINING DISTRICTS.
[New Mexico Bureau of Mines & Mineral Resources, Memoir 38,1980]
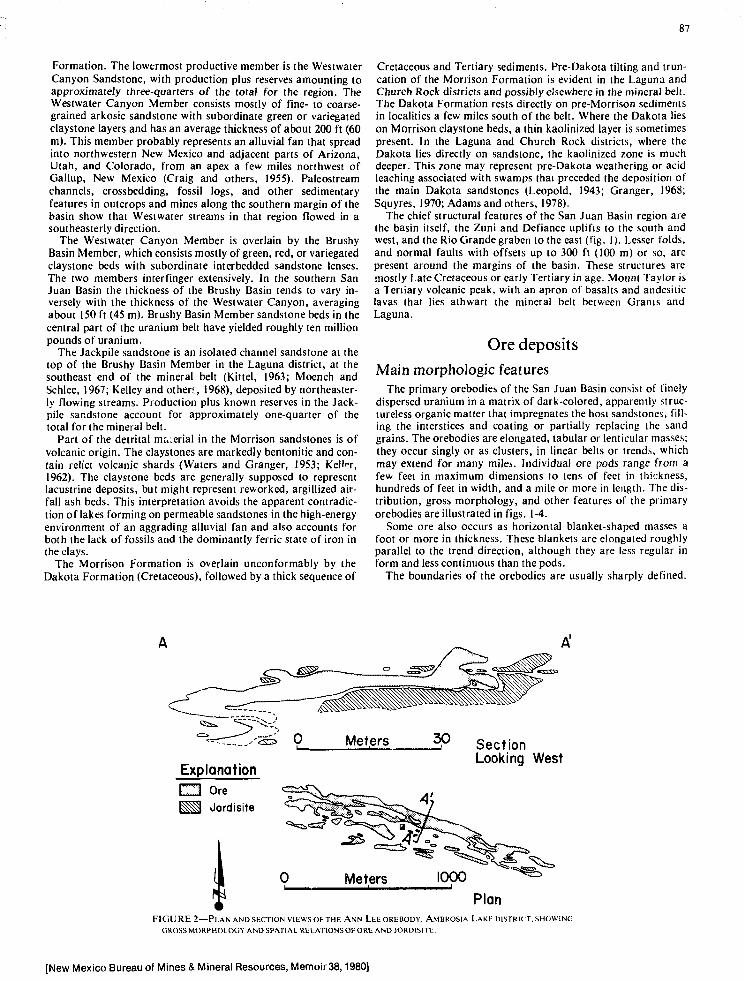
87
Formation. The lowermost productive member is the WestwaterCanyon Sandstone, with production plus reserves amounting toapproximately three-quarters of the total for the region. TheWestwater Canyon Member consists mostly of fine- to coarse-grained arkosic sandstone with subordinate green or variegatedclaystone layers and has an average thickness of about 200 ft (60m). This member probably represents an alluvial fan that spreadinto northwestern New Mexico and adjacent parts of Arizona,Utah, and Colorado, from an apex a few miles northwest ofGallup, New Mexico (Craig and others, 1955). Paleostreamchannels, crossbedding, fossil logs, and other sedimentaryfeatures in outcrops and mines along the southern margin of thebasin show that Westwater streams in that region flowed in asoutheasterly direction.
The Westwater Canyon Member is overlain by the BrushyBasin Member, which consists mostly of green, red, or variegatedclaystone beds with subordinate interbedded sandstone lenses.The two members interfinger extensively. In the southern SanJuan Basin the thickness of the Brushy Basin tends to vary in-versely with the thickness of the Westwater Canyon, averagingabout 150 ft (45 m). Brushy Basin Member sandstone beds in thecentral part of the uranium belt have yielded roughly ten millionpounds of uranium.
The Jackpile sandstone is an isolated channel sandstone at thetop of the Brushy Basin Member in the Laguna district, at thesoutheast end of the mineral belt (Kind, 1963; Moench andSchlee, 1967; Kelley and othen, 1968), deposited by northeaster-ly flowing streams. Production plus known reserves in the Jack-pile sandstone account for approximately one-quarter of thetotal for the mineral belt.
Part of the detrital material in the Morrison sandstones is ofvolcanic origin. The claystones are markedly bentonitic and con-tain relict volcanic shards (Waters and Granger, 1953; Keller,1962). The claystone beds are generally supposed to representlacustrine deposits, but might represent reworked, argillized air-fall ash beds. This interpretation avoids the apparent contradic-tion of lakes forming on permeable sandstones in the high-energyenvironment of an aggrading alluvial fan and also accounts forboth the lack of fossils and the dominantly ferric state of iron inthe clays.
The Morrison Formation is overlain unconformably by theDakota Formation (Cretaceous), followed by a thick sequence of
Cretaceous and Tertiary sediments. Pre-Dakota tilting and trun-cation of the Morrison Formation is evident in the Laguna andChurch Rock districts and possibly elsewhere in the mineral belt.The Dakota Formation rests directly on pre-Morrison sedimentsin localities a few miles south of the belt. Where the Dakota lieson Morrison claystone beds, a thin kaolinized layer is sometimespresent. In the Laguna and Church Rock districts, where theDakota lies directly on sandstone, the kaolinized zone is muchdeeper. This zone may represent pre-Dakota weathering or acidleaching associated with swamps that preceded the deposition ofthe main Dakota sandstones (Leopold, 1943; Granger, 1968;Squyres, 1970; Adams and others, 1978).
The chief structural features of the San Juan Basin region arethe basin itself, the Zuni and Defiance uplifts to the south andwest, and the Rio Grande graben to the east (fig. 1). Lesser folds,and normal faults with offsets up to 300 ft (100 m) or so, arepresent around the margins of the basin. These structures aremostly Late Cretaceous or early Tertiary in age. Mount Taylor isa Tertiary volcanic peak, with an apron of basalts and andesiticlavas that lies athwart the mineral belt between Grants andLaguna.
Ore deposits
Main morphologic featuresThe primary orebodies of the San Juan Basin consist of finely
dispersed uranium in a matrix of dark-colored, apparently struc-tureless organic matter that impregnates the host sandstones, fill-ing the interstices and coating or partially replacing the sandgrains. The orebodies are elongated, tabular or lenticular masses;they occur singly or as clusters, in linear belts or trends, whichmay extend for many miles. Individual ore pods range from afew feet in maximum dimensions to tens of feet in thickness,hundreds of feet in width, and a mile or more in length. The dis-tribution, gross morphology, and other features of the primaryorebodies are illustrated in figs. 1-4.
Some ore also occurs as horizontal blanket-shaped masses afoot or more in thickness. These blankets are elongated roughlyparallel to the trend direction, although they are less regular inform and less continuous than the pods.
The boundaries of the orebodies are usually sharply defined.
ExplanationI i OretS^I Jordisite
SectionLooking West
PlanFIGURE2—PLAN ANDSECTION VIEWS OF THE ANN LEEOREBODY. AMBROSIA LAKE DISTRICT, SHOWING
GROSS MORPHOLOGY AND SPATIAL RELATIONS OF ORE AND JORDISITE.
[New Mexico 8ureau of Mines & Mineral Resources, Memoir 38,1980]

88
FIGURE 3—-LONGITUDINAL vitw OH MAIN ANN LEE OREBODY. AMBROSIAI.-XK.I- DIM kin (view looking north); note lenticular jordisite massbelow ore.
FIGURE 5—SMALL ROLL FEATURE IN ORL-, ANN LEE MINE. AMBROSIA LAKEDISTRICT (view looking east). This roll widened along trend into aiypical pod with a lenticular cross section. Dark band a few centimetersto the right of the roll is pyrite.
They may be straight or curved and may follow the bedding orcut smoothly across it. One can generalize that the orebodies areconcordant in gross aspect, but discordant in detail.
The morphology and orientation of the orebodies consistentlyare related to depositional features in the host rocks. The orebells occur in discrete channel sands or in less well-defined chan-nel complexes. In the Ambrosia Lake district particularly, thegeneral S. 70° E. orientation of the ore trends and individualpods corresponds closely to the orientation of sedimentary fea-tures such as scour surfaces, crossbedding, claystone-pebbletrains, and the preferred orientation of fossil logs. Clary andothers (1963) showed that the orientations of fossil logs in thewestern part of the Ambrosia Lake district conform to localsinuousilies in the ore belts.
Layers of ore may rest on the surface of a claysione bed or aparticularly persistent diastem, or they may be suspended withinthe thicker sandstone beds, separated from beds above and belowby many feet of barren sandstone.
Carbonized or silicified logs, branches, and other coarse plantdetritus are common in and near ore, but are less common inmine workings or outcrops away from ore. Some plant fragmentsare highly uraniferous, but most are barren or only weaklyminenlized.
Subordinate morphologic featuresVarious subordinate morphologic features and regularities in
the distribution of primary ore have been noted in the mines ofthe southern San Juan Basin. None are volumetrically important,but examples are too widespread and consistent to be accidental.
FIGURE 4—CROSS-SECTIONAL VIEW OF MAIN ANN LEE OREBODY,AMBROSIA LAKE DISTRICT (view looking east). Fringe of grayish sand-stone adjacent to ore contains authigenic chlorite and probably marksformer extern of ore. Wisps of jordisite in slightly lighter sandstoneprobably formed at old ore boundary; note layer of strongly bleachedclaystone cobbles.
The most prominent examples of these features are describedbelow, and some examples are shown in figs. 5-10.
S-SHAPED PODS: EN ECHELON ARRANGEMENT OF PODS—Manyore pods throughout the Ambrosia Lake district have the shapeof a flattened S in cross section, with the upper limb pointing tothe north (Harmon and Taylor, 1963). A related form consists ofseveral overlapping, connected lobes, with successively higherlobes displaced further to the east.
SPACED PODS—Regularly spaced pods of ore embedded inblanket ore have been observed by several workers (Gould andothers, 1963; Roeber and Melancon, 1964; Whittacre, personalcommunication, 1967; Squyres, 1970). Many such pods areroughly S-shaped and connect a layer of blanket ore on the southwith a similar, slightly higher layer on the north.
ROLL IEATURHS—Narrow crescent-shaped bodies like theclassic rolls of the older districts of the Colorado Plateau are oc-casionally found. They occur near the edges of the larger orepods and are usually only a few feet high. The axes of the rollsare parallel to the main trend. The concave boundaries of therolls are generally sharp, and (he convex boundaries are diffuse.Fig. 5 shows a small roll that changed shape and widened along(he (rend direction into a typical lenticular pod. These rolls areprimary features with no lateral continuity and no spatial rela-tionship lo redistributed orebodies or secondary oxidized zones.
ASYMMETRIC HALos—Claystone cobbles, fossil woodfragments, and pyrite aggregates in barren sandstone adjacent toore may be surrounded by a halo of ore an inch or so thick. Gen-erally the halos have no obvious orientation, but in some casesthey have a pronounced teardrop shape (fig. 6). I have observedthese features in many mines in the Ambrosia Lake district andhave photographs of examples from three separate trends orbelts. In every instance the tails were oriented to the southeast,
FIGURE 6—ASYMMETRIC HALO OF ORE ON CLAYSTONE COBBLE. SANMATEO MINE, SOUTHEASTERN AMBROSIA LAKE DISTRICT (tail pointing tosoutheast).

89
parallel to the trend of the orebodies and to the flow direction ofthe Morrison paleostreams.
Mineralogy and zoningThe mineralogy of the orebodies is simple. The chief uranium
mineral has been identified by x-ray-diffraction methods as cof-finite, although it is too fine grained to be resolvable by ordinarymicroscopic methods (Granger and others, 1961; Moench andSchlee, 1967; Lee, 1976). Black, oxidized uranium complexes andunspecified urano-organic complexes are reportedly importantore constituents in the Jackpile sandstone (Kelley and others,1968), but these may reflect post-depositiona! events rather thanoriginal conditions. The organic material, which consists of car-bon with minor amounts of hydrogen, oxygen, and nitrogen, isamorphous or very finely crystalline. Organic matter and ura-nium are about equal, by weight, in the ore. This relationship isremarkably uniform in unaltered primary ore and is true over awide range of ore grades; however, the low-density organic mat-ter must be greatly predominant by volume. This material isbrown in very thin films, black in thicker layers, and is ratherbrittle, with a hackly or conchoidal fracture and a pitchy orvitreous luster (Granger and others, 1961).
No vanadium minerals have been identified ;n primary ore. Al-though vanadium is usually present, its concentration is notstrongly correlated with uranium or organic matter: vanadiummay be present chiefly as a constituent of authigenic clayminerals rather than dispersed in the organic matter.
Jordisite, or amorphous MoS;, commonly is associated withore but occurs in spatially distinct masses (fig. 2, 3, 7, 9, and 10).Like the organic matter, jordisite impregnates the sandstone,coating and cementing the grains, but does not seem to replacethe sandstone significantly. Jordisite can be distinguished visual-ly from ore by its lack of luster; its feathery or dense lenticularform; and, in some cases, by a sparkly appearance resulting frommyriads of small quartz overgrowths. In some localities, thismineral amounts to as much as one-third of the volume of adja-cent ore; elsewhere it is present in small amounts only.
Jordisite occurs only in or adjacent to ore, usually within a fewfeet of the ore boundaries. It seems to be most common beneathore, but it may occur above, below, or beside ore, as well as ir-regularly around the entire periphery of an orebody (fig. 2). Jor-disite and ore are almost never in contact, although the bordersof adjacent jordisite and ore masses may be separated by as littleas a quarter-inch (1 cm) of barren ground for a lateral distance ofmany feet.
Jordisite bodies a few feet distant from ore are patchy and ir-regularly shaped. The jordisite tends to selectively impregnate al-ternate laminae of crossbedded sandstones, resulting in a minute-ly detailed, feathery pattern (fig. 7). Some patches of jordisite arebounded partly by feathery edges and partly by smooth, discor-dant edges. Jordisite also forms elongated, lenticular bodies a
FIGURE 8—JORDISITE I.KNSIS IN ORI. SAN MAIKI MINI-, sornu ASH R\AMUROSIA LAKE DISIRIIT (view looking cast); nolc narrow /one of un-impregnated sandstone between ore and jordisiie.
few inches to tens of inches in width and up to 10 ft (3 m) inlength, adjacent to the ore boundaries and oriented parallel tothem (fig. 3). A few jordisit; lenses occur in the ore (fig. 8).These lenses are present in many orebodies, although they prob-ably account for less than 1 percent of the total amount of jor-disite. Although surrounded by ore, the lenses contain littleuranium or organic matter and are separated from the ore by athin zone of barren sandstone. Jordisiie also forms roll-likefeatures and asymmetric halos with the same form and orienta-tion as corresponding features in ore (figs. 9, 10).
Arsenic and selenium are present in amounts up to a few hun-dred parts per million in primary ore. No arsenic minerals havebeen identified, and recognizable selenium minerals are rare.However, samples taken in vertical traverses through ore-bodiesby Granger (1966) show that arsenic and selenium as well asmolybdenum tend to be concentrated at the ore boundaries.
Minute euhedral crystals of pyrite constitute about 1 percent ofore and barren sandstone alike. No clear-cut distribution patternis evident, but pyrite appears to be slightly more abundant in orethan in the host rocks, and it is possibly more abundant in sand-stone adjacent to ore than at greater distances. Pyrite may alsoform thin discontinuous shells at the ore boundaries (fig. 5);however, these shel.s are rare. Some pyrite appears older than orcontemporaneous with the ore, but a substantial amoum is clear-ly younger. Beds of green claystone usually contain pyriteai theiredges, but the interiors of clayslone beds more I'I-UI a few feelthick are generally pyrite free.
Calcite commonly occurs as clear, coarsely crystalline inter-stitial masses of ill-defined shape, which are more common in orethan in the adjacent, barren sandstones. Calcite also forms occa-sional discontinuous shells at the ore boundaries. The shells havea sharp outer boundary and grade from solidly caleite-
FIGURE 7—FEATHERY JORDISITE ABOVE ORE. ANN LEE MINE. AMBROSIALAKE DISTRICT (view looking south); the streaky pattern results fromselective impregnation of certain bedding laminae by jordisiie.
FIGURE 9—ASYMMETRIC HALO OF JORDISITE AROUND SII.ICIFIED I.OC;. ANNLEE MINE. AMBROSIA LAKE DISTRICT (tail of halo points to southeast);compare with fig. 6.
(New Mexico Bureau of Mines & Mineral Resources, Memoir 38,1980]

90
FIGURE 10—SMAI i JORDISITE R o n . ANN LEE MINE, AMBROSIA LAKEDISIKK r (view looking south); compare with fig. 5.
impregnated sandstone into isolated calcite-impregnated spher-ules on the ore side (fig. 11).
Authigenic quartz overgrowths are common in ore, where theyare usually coated by the organic substance, and in the host rockswithin a few feet of the ore boundaries. The overgrowths alsocharacteristically occur with the feathery variety of jordisite,where they grow over the jordisite and impart a sparkly ap-pearance to the masses. Visible quartz overgrowths do not occurwith the lenticular variety of jordisite.
Chlorite is fairly common in ore, where it appears to haveformed at the expense of preexisting clay minerals (Granger andothers, 1961; Lee, 1976). A few occurrences of chlorite are inbarren ground contiguous to ore; these may represent "ghost"outlines of ore formerly present but removed during an early,mobile stage (fig. 4).
Age of the oreThe following evidence indicates that the ore was deposited
during or shortly after the accumulation of the host rocks:si KAI KiRAi'Hic I-VIOL-NCE—Nash and Kerr (1966) described an
exposure of ore in the Paguate mine, in the Laguna district,where a lens of calciie-cemented, ore-bearing sandstone at thetop of the Jackpile sandstone was truncated by the pre-Dakotaerosion surface. Although the exposure was small, the geologicrelations indicate a pre-Dakoia age for the ore. More recently,Adams and others (1978) reported the results of detailed studies
FIGURE 11—CALCITE SHELL AT ORE BOUNDARY. ANN LEE MINE.AMBROSIA LAKE DISTRICT (view looking west); note sharp outer bound-ary, diffuse inner boundary of shell.
of the Jackpile and Paguate orebodies. In the Laguna districtthey observed that ore had been destroyed along with feldspars inthe host rocks, in an event related to the post-Jurassic uncon-formity or to the early Dakota sediments. The authors concludedthat the ore formed prior to deposition of the Cretaceous rocks.Rapaport (personal communication, 1967) noted and mappedsharply bounded gaps in a north-trending orebody in the PoisonCanyon trend, south-central Ambrosia Lake district, where east-west channels truncated slightly older host channels within thePoison Canyon sandstone. Rapaport concluded that the crosschannels postdated and truncated the ore. Fitch (personal com-munication, 1977) observed a similar relationship in the JohnnyM mine, in the southeastern Ambrosia Lake district, where anore pod was found to be sharply truncated by a local intraforma-tional erosion surface.
STRUCTURAL EVIDENCE;—Several workers have mapped anddescribed cylindrical collapse structures or ring faults in the Mor-rison Formation (Rapaport, 1963; Clark and Havenstrite, 1963;Moench and Schlee, 1967). At least four such structures con-tained some ore, and three were associated with typical trend-type orebodies. Displacements on the faults that bound thesestructures decrease upward. The faults flare and die out withinthe upper Morrison section and are overlain by undisturbed Mor-rison sediments; therefore, they are considered to be nearly con-temporaneous with their host rocks.
Fig. 12 is a section across a collapse structure in the Cliff side
NE SW NE
Actual Section Restored Section
ExplanationI I Sandstone • Ore 9 Meters 30r7~! Clay stone . / Fault Trace
FIGURE 12—ACTUAI AND KHSIOKI-D SKTIONS <X A OMNDRICAI (ONAI'SI- STIUX II m.Ci IIISIDI MINE. AMBROSIA LAKI- DISTRICT: note continuity of ore layers across fault tracein restored section (Clark and Havensirile, 1963).
[New Mexico Bureau of Mines & Mineral Resources, Memoir 38,1980]
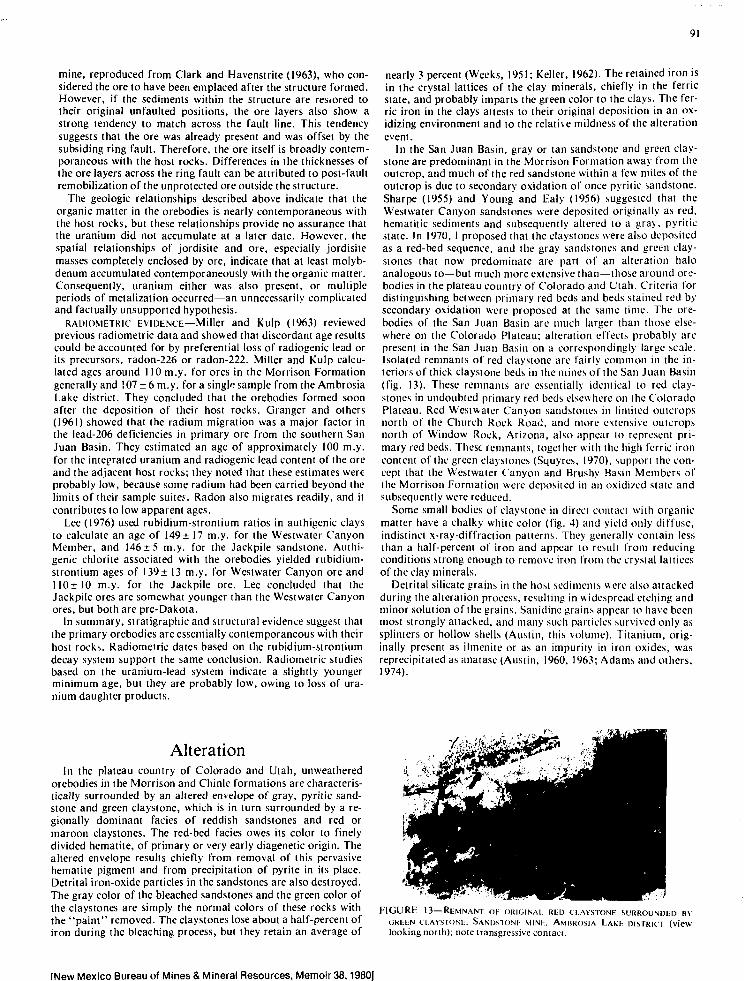
91
mine, reproduced from Clark and Havenstrite (1963), who con-sidered the ore to have been emplaced after the structure formed.However, if the sediments within the structure are restored totheir original unfaulted positions, the ore layers also show astrong tendency to match across the fault line. This tendencysuggests that the ore was already present and was offset by thesubsiding ring fault. Therefore, the ore itself is broadly contem-poraneous with the host rocks. Differences in the thicknesses ofthe ore layers across the ring fault can be attributed to post-faultremobilization of the unprotected ore outside the structure.
The geologic relationships described above indicate that theorganic matter in the orebodies is nearly contemporaneous withthe host rocks, but these relationships provide no assurance thatthe uranium did not accumulate at a later date. However, thespatial relationships of jordisite and ore, especially jordisitemasses completely enclosed by ore, indicate that at least molyb-denum accumulated contemporaneously with the organic matter.Consequently, uranium either was also present, or multipleperiods of metalization occurred—an unnecessarily complicatedand factually unsupported hypothesis.
RADIOMETRIC EVIDENCE—Miller and Kulp (1963) reviewedprevious radiometric data and showed that discordant age resultscould be accounted for by preferential loss of radiogenic lead orits precursors, radon-226 or radon-222. Miller and Kulp calcu-lated ages around 110 m.y. for ores in the Morrison Formationgenerally and !07 ± 6 m.y. for a single sample from the AmbrosiaLake district. They concluded that the orebodies formed soonafter the deposition of their host rocks. Granger and others(1961) showed that the radium migration was a major factor inthe lead-206 deficiencies in primary ore from the southern SanJuan Basin. They estimated an age of approximately 100 m.y.for the integrated uranium and radiogenic lead content of the oreand the adjacent host rocks; they noted that these estimates wereprobably low, because some radium had been carried beyond thelimits of their sample suites. Radon also migrates readily, and itcontributes to low apparent ages.
Lee (1976) used rubidium-strontium ratios in authigenic claysto calculate an age of 149 ± 17 m.y. for the Westwater CanyonMember, and 146±5 m.y. for the Jackpile sandstone. Authi-genic chlorite associated with the orebodies yielded rubidium-strontium ages of 139± 13 m.y. for Westwater Canyon ore and110 ± 10 m.y. for the Jackpile ore. Lee concluded that theJackpile ores are somewhat younger than the Westwater Canyonores, but both are pre-Dakota.
In summary, stratigraphic and structural evidence suggest thatthe primary orebodies are essentially contemporaneous with theirhost rocks. Radiometric dates based on the rubidium-strontiumdecay system support the same conclusion. Radiometric studiesbased on the uranium-lead system indicate a slightly youngerminimum age, but they are probably low, owing to loss of ura-nium daughter products.
nearly 3 percent (Weeks, 1951; Keller, 1962). The retained iron isin the crystal lattices of the clay minerals, chiefly in the ferricstate, and probably imparts the green color to the clays. The fer-ric iron in the clays attests to their original deposition in an ox-idizing environment and to the relative mildness of the alterationevent.
In the San Juan Basin, gray or tan sandstone and green clay-stone are predominant in the Morrison Formation away from theoutcrop, and much of the red sandstone within a few miles of theoutcrop is due to secondary oxidation of once pyritic sandstone.Sharpe (1955) and Young and Ealy (1956) suggested that theWestwater Canyon sandstones were deposited originally as red,hematitic sediments and subsequently altered lo a gray, pyriticstate. !n 1970, 1 proposed that the claystones were also depositedas a red-bed sequence, and the gray sandstones and green clay-stones that now predominate are part of an alteration haloanalogous to—but much more extensive than—those around ore-bodies in the plateau country of Colorado and Utah. Criteria fordistinguishing between primary red beds and beds stained red bysecondary oxidation were proposed at the same time. The ore-bodies of the San Juan Basin are much larger than those else-where on the Colorado Plateau; alteration effects probably arepresent in the San Juan Basin on a correspondingly large scale.Isolated remnants of red claystone are fairly common in the in-teriors of thick claystonc beds in the mines of the San Juan Basin(fig. 13). These remnants are essentially identical to red clay-stones in undoubted primary reel beds elsewhere on the ColoradoPlateau. Red Westwater Canyon sandstones in limited outcropsnorth of the Church Rock Road, and more extensive outcropsnorth of Window Rock, Arizona, also appear lo represent pri-mary red beds. Thest remnants, together with the high ferric ironcontent of the green claystones (Squyrcs, 1970), support the con-cept that the Westwater Canyon and Brushy Basin Members ofthe Morrison Formation were deposited in an oxidi/cd state andsubsequently were reduced.
Some small bodies of claystone in direct contact with organicmatter have a chalky white color (fig. 4) and yield only diffuse,indistinct x-ray-diffraction patterns. They generally contain lessthan a half-percent of iron and appear to result from reducingconditions strong enough to remove iron from the crystal latticesof the clay minerals.
Detrital silicate grains in the host sediments were also attackedduring the alteration process, resulting in widespread etching andminor solution of the grains. Sanidine grains appear to have beenmost strongly attacked, and many such particles survived only assplinters or hollow shells (Austin, this volume). Titanium, orig-inally present as ilmenite or as an impurity in iron oxides, wasreprecipitated as anatase (Austin, 1960, 1963; Adams and others,1974).
AlterationIn the plateau country of Colorado and Utah, unweathered
orebodies in the Morrison and Chinle formations are characteris-tically surrounded by an altered envelope of gray, pyritic sand-stone and green claystone, which is in turn surrounded by a re-gionally dominant fades of reddish sandstones and red ormaroon clayslones. The red-bed facies owes its color to finelydivided hematite, of primary or very early diagenetic origin. Thealtered envelope results chiefly from removal of this pervasivehematite pigment and from precipitation of pyrite in its place.Detrital iron-oxide particles in the sandstones are also destroyed.The gray color of the bleached sandstones and the green color ofthe claystones are simply the normal colors of these rocks withthe "paint" removed. The claystones lose about a half-percent ofiron during the bleaching process, but they retain an average of
FIGURE 13—REMNANT OF ORIGINAL RED CI.AYSTONE SURROUNDED BVGREEN CLAVSTONh. S A N D S T O N I : MINK, AMBROSIA L A K E DISTRICT (viewlooking north); note iransgressivc contact.
(New Mexico Bureau of Mines & Mineral Resources, Memoir 38,19801

92
Other alteration products such as kaolin, second-stage pyrite,and secondary iron oxides are also present in the vicinity of someprimary orebodies, but they appear to result from post-ore pro-cesses and have no bearing on the genesis of the primary ore.
Nature of the organic matterBoth the smoothly discordant surfaces of the orebodies and the
uniform, intimate way in which the organic matter impregnatesthe host sands suggest that the organic matter was introducedeither as fluid or precipitated at a fluid interface. Early workersconsidered the possibility that the organic material is an asphaltor hydrocarbon residue (Granger and others, 1961; Moench andSchlee, 1967), and the concept still receives some attention(Leventhal, this volume). However, most subsequent work indi-cates that it originated as humic matter rather than as a hydro-carbon. The following pages review the properties of humicsubstances and present evidence identifying the organic matter inthe orebodies of ;he San Juan Basin as humate derivative.
Humic a;:ds are defined operationally as "the yellow or brownorganic rr.a::er extracted b> alkaline solutions from decayingplan: rr.a:er:ai." and humates are "salts of humic acids" (Vineand other*. 195M. A> used here, the term humate will apply tothe solid or >emisolid equi\ alents of humic acids. The term humicsubstances wili be used for any member of the humate family,regardless of its state ot consolidation.
Humic acids may be composed of literally hundreds of relatedcarbon compounds, only a few of which have been isolated andclearly identified. They can be generally described as aggregatesof six-membered carbon rings, in various configurations, withhydroxyl (-OH), carboxyl (-COOH) and other functional groupsattached to the edges of the rings (fig. 14a; Leventhal, thisvolume). Humic acids have molecular weights ranging from afew hundred to a hundred thousand or more, and are mostly col-loidal suspensions rather than true solutions (Swain, 1963);nevertheless, they are capable of remaining in suspension andtraveling considerable distances as constituents of ground water.
Most humic acids can be flocculated by a decrease in pH, al-though one group, the fuKates, are stable in acid solutions. Floc-culation can also be induced by an increase in concentration (asthrough evaporation), or by addition of various cations. Poly-valent cations such as Ca" ' are particularly effective flocculants.Moreover, humic acids may polymerize and flocculate spontane-ously simply through aging (Pommcr and Breger, 1960a, b).
When humic acids are flocculated experimentally, the floe par-ticles settle and combine to form an amber-colored gel with ahigh water content. This gel is initially coherent bui weak, with aviscosity only slightly greater than water. An analogous, butgenerally more viscous, natural humic gel is common in modernbogs and swamps in the form of dopplerite (Vine and others,1958; Swain, 1963), and certain amorphous constituents of coalsand black shales are probably of similar origin (Swanson andLandis, 1962; Van Krevelen, 1963).
Because of its low initial viscosity, a natural humate gel isprobably capable of limited migration in ground-water environ-ments. However, the continuing processes of dehydration andpolymerization must render it increasingly viscous and eventu-ally immobile. Incidental processes such as coalification andradioactive bombardment may play a part; but extensive young,nonradioactive humate deposits in Florida, for example, dem-onstrate that consolidation can take place without the influenceof heat, pressure, or radiation (Swanson and Palacas, 1965).
Humic acids and humate gels are remarkably effective cationexchangers, capable of concentrating uranium and other cationsfrom extremely dilute solutions. This property arises from the ex-changeability of hydrogen in the -OH, -COOH, and other func-tional groups in the humic matter, and it is analogous to thebehavior of commercial ion-exchange resins. When divalent cat-ions like uranium bond to two adjacent exchange sites, the pro-cess is termed cheiation (Schmidt-Collerus, 1967). Szalay (1958,
1964) and Rozhkova and others (1958) showed that adsorption ofuranium is sensitive to pH. Under optimum conditions, as withpH values near 5, the amount of adsorbed uranium may exceeduranium in an equal weight of water by a factor of 10,000 (Szalayreferred to this number as the "geochemical enrichment" fac-tor). At both lower and higher pH values, the concentration fac-tor drops off rapidly (fig. 14b). At lower pH values, hydrogenions probably displace uranium from the exchange sites; and athigher values, uranium is increasingly tied up in carbonate com-plexes. Szalay also plotted adsorption as a function of uraniumconcentration, at constant pH values (fig. 14c). He showed thatthe curve consisted of two parts: an initial straight, steep segmentwith a slope corresponding to the geochemical enrichment factor,followed by a flat segment where the concentration of uranium inthe organic matter remains constant as the concentration in solu-tion is increased. The flat segment corresponds to saturation ofthe humate, or occupation of all available exchange sites. Szalay
A.
Adsorbed Uranium(As % of DryWeight of Humate)
B.
10 r
I 2Ph
8 10
Adsorbed Uranium(As % of DryWeight of Humate)
0 2000 4000Uranium in Solution, ppm
FIGURE 14—loN-txt"HANCit CAPACITY OK HUMIC ACIDS: a) Idealized seg-ment of humie-acid molecule showing attached groups with exchange-able hydrogen; b) Idealized plot of uranium adsorption on humate, as afunction of pH (after Rozhkova and others, 1958); c) Idealized plot ofuranium adsorption on humate, as a function of uranium concentra-tion in solution, at pH 5.0 and 8.0 (modified from Szalay, 1958, 1964).
[New Mexico Bureau of Mines & Mineral Resources, Memoir 38,1980]

93
showed that the maximum adsorption of uranium was approx-imately 10 percent by weight, at pH CO. Rozhkova and others(1958) reported similar results with uranium and lignite. How-ever, these results were attained in acid solutions, using uraniumconcentrations in the hundred parts-per-million range. In a solu-tion of pH 8 with a uranium concentration of only 100 ppb (partsper billion), the concentration factor would be closer to 100, andthe maximum concentration of uranium in the humate as a resultof adsorption alone would be a fraction of one percent. This isfar below the one-to-one ratio of uranium and organic mattertypical of orebodies in the San Juan Basin.
Field measurements show that organic-rich aqueous environ-ments with restricted circulation commonly attain reducing po-tentials of -200 to -300 mv (millivolts) in the pH range 7-9, andpotentials as low as -400 mv have been recorded (Baas Beckingand others, 1960). Humates are products of a partial decay pro-cess and presumably are relatively stable; they are not likely tosupport extreme reducing potentials, but they probably are ableto reduce uranium (VI) to uranium (IV).
Evidence for humic originof the organic matter
Analytical evidenceThe organic matter in the orebodies of the southern San Juan
Basin has been degraded by long-continued exposure to radia-tion, until it is now largely composed of amorphous carbon(Granger and others, 1961; Leventhal, this volume). Neverthe-less, it retains distinctive properties providing evidence of itsorigin.
Breger and Deul (1956) showed that organic substances in ura-nium deposits in the Colorado Plateau outside the San JuanBasin yield infrared spectographs and differential thermal-analysis curves like those of plant remains. In particular, the in-frared spectra contain peaks corresponding to -OH, -COOH,and C=C bonds, which are characteristic of plant-derivedmaterial rather than hydrocarbons. Other workers reported sim-ilar results for nonparticulate, interstitial, or epigenetic organicmatter from the Westwater Canyon Member and the Jackpilesandstone (Granger and others, 1961; Moench and Schlee, 1967).Jacobs (1970) extracted and purified various fractions of theepigenetic organic material under carefully controlled condi-tions, and he studied the extracted compounds by mass spec-troscopy and nuclear magnetic resonance, as well as by infraredmethods. Jacobs also concluded that the carbonaceous materialis a plant derivative.
Humates are soluble in dilute alkaline solutions; hydrocarbonsare soluble in organic reagents like benzene. Organic matter inthe orebodies of the southern San Juan Basin is insoluble ineither type of reagent. However, Granger and others (1961) dem-onstrated that reoxidation of the substance in nitric acid rendersit partly soluble in alkaline solutions and that the soluble portionhas the general properties of a humic acid. A similar result can beachieved using sodium hydroxide with a little hydrogen peroxideadded. Samples of natural hydrocarbon residues are not affectedby the same treatment (Squyres, 1970).
These analytical results are not unequivocal, because they in-volve partial reoxidation of the carbonaceous matter; the re-sulting humate-like properties may arise from newly createdsubstances rather than remnants of the original organic matter.However, no reported studies exist demonstrating that hydrocar-bons can be degraded by radiation and subsequently reoxidizedto yield humate-like substances.
Geologic evidenceOn a worldwide scale, the association of uranium with plant
detritus is far more marked than uranium's association withhydrocarbons. In fact, direct association of uranium with hydro-
carbons is remarkably rare, considering the number of regions inwhich both occur. Coalified logs and other fossil plant detritusare present in or near most of the primary orebodies of the south-ern San Juan Basin. In several mints, barren plant detritus ispresent in quantities sufficient to account for the organic matterin the orebodies (Weege, 1963; Rapaport, 1963). Other concen-trations of plant debris, plus much scattered material, probablyremain undiscovered or unreported. Most of the known oc-currences are tree trunks, limbs, and other coarse material. Finerdetrital material was probably also abundant originally but wasdestroyed during humification. Finally, the Westwater Canyonfan may have supported simple indigenous plants that also con-tributed to humate in the subsurface but left no fossils in thehigh-energy, oxidizing alluvial environment.
Swanson and Palacas (1965) described extensive occurrencesof humate-cementing sands in he Gulf coast of Florida. Thedeposits are of recent origin and probably are still forming. Theyare remarkably similar to the primary orebodies of the San JuanBasin in features such as color, form, mode of occurrence, andvertical displacement from associated plant material. An espe-cially suggestive feature of these deposits is their relative freedomfrom paniculate fossil material, even though the land surface afew feet above is heavily vegetated. Their development and sur-vival adjacent to a moist, strongly oxidizing surface environmentis also noteworthy.
Other lines of reasoning that suggest the organic matter wasoriginally a humate rather than a hydrocarbon include the fol-lowing:
STRATIGRAI'HIC KELATIONS—Neither the Morrison Formationnor any of the beds for several thousand feet or more below it areadequate hydrocarbon source rocks. Downward migration ofhydrocarbons is uncommon, and if the age relations previouslydiscussed are correct, the organic matter was emplaced beforeany of the overlying source rocks were deposited. Moreover, theorebodies show no tendency to occur in structural or strati-graphic highs as would be expected in the case of a light, fluidhydrocarbon.
ALTERATION—Hydrocarbons are relatively unreactive withsilicate minerals. They probably would not be able to cause th-corrosion of silicate grains in the altered sandstones or the moreextensive replacement that has taken place in the orebodies.
MisciniLiTY—For the orebodies to form, uranium and otherdissolved substances must have diffused freely across the water-organic interface and through the organic matter. Hydrocarbonsare generally immiscible in water, and no mechanism seems to beavailable to account for either the transfer of dissolved sub-stances across the interface or their uniform distributionthroughout the organic masses.
SynthesisDuring accumulation of the Westwaler Canyon alluvial fan,
sand and other elastics were distributed by a network of channelsradiating from an apex north of the present town of Gallup, NewMexico. In addition to igneous and metamorphic detritus, theWestvater Carbon streams carried abundant volcanic material.Volcanic ash occasionally inundated the surface, loading thechannels and disrupting the drainage before being reworked andincorporated into the sedimentary pile. Logs, branches, andquantities of finer plant material were also carried onto the fanand buried. Simple indigenous plants may have grown on thefan, providing an additional source of delicate organic matter.
Scattered dinosaur bones in the Morrison Formation suggestthat the climate was warm. The fluvial nature of the sandstonesand the common presence of slump structures and other evidenceof plastic deformation in the claystone beds suggest that theclimate was at least seasonally wet, with substantial surface runoff and a shallow, active ground-water system. In this environ-ment, volcanic ash quickly devitrified, forming bentonite andreleasing silica and other substances to the ground water. Most of
[New Mexico Bureau of Mines & Mineral Resources, Memoir 3B, 1980]

94
the iron in the ash was oxidized and incorporated in the crystallattices of the clay minerals, or it was precipitated as finelydispersed ferric oxides on the surface of the clays and othermineral grains.
The pH of the ground water was maintained around 8 by hy-drolysis reactions with volcanic ash, clays, and detrital silicateminerals, and later by approximate equilibrium between calciteand atmospheric CO,.
Significant amounts of organic matter probably decayed at thesurface, contributing some humic acids to the ground water inthe process. Oxidizing conditions probably al'.o prevailed forseveral feet into the moist, permeable surface sediments, main-taining iron in the ferric state and destroying some of the finer,dispersed organic matter. With progressive burial, however, theavailability of oxygen was restricted. Mild reducing conditionsdeveloped, and humic acids were leached in increasing quantitiesfrom the buried plant matter (fig. 15a).
The liberated humic acids migrated freely with the groundwater, adsorbing calcium and other cations from the water,forming soluble complexes with iron, and attacking the silicateminerals to a lesser extent. As the humic acids migrated, theybegan to polymeri/e and condense into an attenuated gel with aviscosity slightly greater than the ground water (fig. 15b).Polymerization may have been spontaneous, or it may have beenfacilitated by the adsorbed material on the humic acids. If therainfall in the vicinity of the Morrison Ian was seasonal, de-hydration during periods when the water table was low may haveplayed a part.
As the humate gel began to adhere to the sand grains and ob-struct the flow of the ground water, it ceased to be a passive com-ponent of the ground water and became a separate, distinct phasewith its own properties and modes of interacting with its sur-roundings. Where the gel was sufficiently viscous, the ground
\\
A Leaching of Humic Acids
B Flocculation C. Compaction andStreamlining
E. Slight RemobilizutionD Precipitation ofMolybdenum
l I C i U K l - 1 5 — D l A d K A M S I I I U S l R A I I N C i I I A C M I N I . O l H U M I l A l I D S A N D
i von IION <>i OKI I'ODS: arrows indicate direction of ground-waternow.
water was forced to flow around it rather than simply flushing italong through the aquifer, and discrete masses of gel wereformed. These masses continued to migrate slowly down gradientand gradually evolved into streamlined shapes that maintainedan approximate balance between the flushing action of theground water and the drag of the humate masses (fig. 15c). Thestreamlined forms were characterized by: 1) smooth surfaces,which minimized flow friction or drag at the humate-ground-water interface; 2) rounded or lenticular cross sections, whichminimized the amount of humate surface for a given cross-sectional area (periodic or spaced pods may have resulted fromevolution of blanket ore into pods); and 3) elongation in thedirection of ground-water flow, which minimized the flow resist-ance of a given mass of material.
Minor roll features resulted when the ground-water movementwas Mifficiently energetic to displace the humate gel laterally (fig.16), and the teardrop-shaped halos formed when the gel adheredto an obstacle in its path and was dragged or stretched in the flowdirection. The S-shaped pods may have resulted from a subtlerotational force in the ground water, akin to the Coriolis effect,which causes rotation in free-flowing air and water currents;however, this is speculation. Although there seems to be nosatisfactory explanation of these features, their association withother directional features suggests a similar genesis. Verticallystacked pods formed when a humate mass encountered a clay-stone bed in its path of migration and split into separate massesabove and below the claystone.
As the humate masses took form, lack of circulation and theconcentration of organic matter caused their interior environ-ment to become more reducing. Low concentrations of uranium,sullate, and other dissolved species diffused across the humate-ground-watcr boundary and were replenished at the boundary byground-water How. Sulfate was reduced by bacteria in thehumate masses, generating modest concentrations of sulfide ionswhich tended to diffuse out into the host rocks. Uranium ions,strongly complexed with carbonate, were not reduced by theweak sulCide solutions. The humate was able to decompose thecarbonate complexes and capture the dipositive uranyl cations byion exchange or dictation. This mechanism was effective ingathering and distributing uranium uniformly throughout thehuniatc masses, in low concentrations. Organically bound ura-nium was readily reduced, oxidizing a small amount of organicmatter in the process and freeing the rest to adsorb moreuranium. Adsorption therefore functioned as a gathering mech-anism, and reduction as a storage mechanism. The dispersedslate of the reduced uranium probably facilitated the formationof fine-grained eoffinite.
Molybdenum, arsenic, and selenium were probably present inthe alkaline ground water as anions such as MoO< , HAsOj ,and ScO, or SeO, . These anions were repelled rather than at-tracted by the negatively charged humic matter; therefore, they
Development of Humate Mass
Partial Deflection of Humate
Deflection complete:C-Shaped Roll formed
F I G U R E 1 6 — D l A O K A M S II 1 U S I K A I I N d D I M I O I ' M I N l l>l KOI I M I I H I ' H O l
<K;> ; arrows indicate direction of ground-waier flow.
[New Mexico Bureau of Mines & Mineral Resources, Memoir 38,1980]

were not concentrated in the humate. All three elements were ef-fectively precipitated at the margins of the humate bodies bysulfide ions (fig. I5d). Molybdenum, present in relative abun-dance, precipitated as colloidal molybdenum sulfide, forming adiscontinuous layer around the developing orebodies and pos-sibly coprccipitating some arsenic and selenium. Since the molyb-denum and humate colloids were both negatively charged, theyrepelled one another, and—despite their close proximity—neverintermingled or came into actual contact. Vanadium, present asH.VO. or a similar species, was neither fully precipitated bysulfide ions nor strongly complexed by ihe organic matter, and itwas therefore distributed in an ill-defined, intermediate pattern.Positively charged ferrous ions were strongly complexed byhumic acids and subsequently precipitated as pyrite throughoutthe system, instead of being concentrated with other sulfidespecies at Ihe borders of the orebodies.
Continuing movement of the ground water disrupted the layerof colloidal molybdenum sulfide and molded it into lenticularforms similar to the humate bodies. At a slightly greater distancefrom the humate boundaries, as the molybdenum masses agedand became more viscous, they moved only along the most per-meable laminae of the sandstones, forming the feathery patterncharacteristic of many jordisite masses (fig. 15c). A few MoS;
masses formed asymmetric halos or roll-like forms. The similargel-like properties of the molybdenum sulfide and humate col-loids caused them to interact in a similar manner with the movingground water and to assume similar forms.
Differences of pH and concentration of dissolved species be-tween ground water in the host rocks and in the humate massescaused minor precipitation of calcium-carbonate shells at the oreboundaries and other differences in concentration of gangtieminerals between the orebodies and the host rocks. The car-bonate shells developed sharp boundaries at the shear surfacebetween humate and moving ground water and diffuse grada-tional boundaries on their interior, stagnant sides.
Slight continued movement of the luimate occasionally re-sulted in the engulfing of jordisite lenses and calcite shells and thestabilization of the humate surface a few feet beyond its originalposition. In other places the luimate surface receded, exposingchlorite and other minerals that formed originally within thehumaie masses (fig. 4).
During their accumulation, the moist, aerated Morrison sedi-ments were maintained in an oxidized condition to a depth ofseveral meters, even in the vicinity of buried plant detritus. Asburial proceeded and the supply of oxygen diminished, an enve-lope of reduced or altered ground formed around each accumula-tion of plant matter and began 1.0 expand into the surroundingsediments. Humic acids in the ground water and newly formedmasses of interstitial humate also contributed to the developmentof a reducing environment. Much humic matter and fine, dis-persed particulate plant matter must have been destroyed in (heprocess.
The chief result of the alteration process was the reduction andremoval of iron-oxide coatings on the sand an<l clay particles,destroying the red color of the sediments and exposing the in-herent colors of the particles. Iron was reprecipnatcd as pyrite,and some iron may have been removed from the ? ysiem entirely.Detrital iron-oxide particles were destroyed also, and silicate par-ticles were attacked to a lesser extent. Alteration in the claystonebeds was highly selective, resulting in the complete removal ofhematite without significantly affecting ferric iron in the crystallattices of the clays.
At least two types of chemical reactions probably took placeduring reduction of the host rocks. Humic acids probably weredirectly responsible for the etching of silicates; for complexingand removing iron, aluminum, calcium, and other cations fromthe silicate surfaces; and for freeing the excess silica to solution.The acids probably also attacked iron oxides in the sandstones(Hem, 1960; Adams and others, 1974); however, hurni.- acidsalone cannot precipitate pyrite, and it is difficult to explain how a
colloidal species could penetrate tens of fed into nearly imper-meable claystone beds. Biogenic sulfide ions and other reducedsulfur species must have played a major role in the alteration ofthe claystones and in the reduction of iron and precipitation olpyrite in the sandstones as well. The absence of pyrite in the in-teriors of altered claystone beds and the lower iron content ofaltered vs. unaltered claystones indicate that iron was trans-ported out of Ihe claystones. Sulfide ions may have reacted withiron oxides 10 form other reduced sulfur species capable of com-plexing iron and removing it in solution, in a process partl>analogous to that suggested by Granger and Warren ( l%9, 1974)for roll-type uranium deposits.
The altering solutions were probably dilute and rather mildand attenuated by reactions with dissolved oxygen as well aswith iron oxides. The alteration process must have continuedduring the formation of the orebodies and at reduced rates tot along time thereafter. In fact, cessation of ground-water move-ment in post-Morrison time ma> have further lestrieted the avail-ability of oxygen without interfering with Ihe diffusion of reduc-tanls. Sulfur probably acted as ;t transfer agent of reducingenergy, being reduced in the vieinitv, of the organic matter, dif-fusing out and reducing the wall rocks. ;uul then repeating thecycle. The alteration envelopes expanded and coalesced mostrapidly in the sandstones and moved more slowlv into the clav-stone beds. 1-ventually. after some millions of vcais, the sandstones were completely altered, and the original red clav stoneswere preserved only as isolated remnants in the interiors of thickclaystone beds.
By the end of Morrison time the orebodies weie lullv devel-oped, although alteration of the host rocks piohabl) continuedfor a long time afterwards. Some ore was desttoyed bv pic-Dakota erosion and weathering or by acid ground waiei fiomearly Dakota swamps, which also locally kaolini/cd the hostrocks, hollowing deposition of the Dakota lormation. the oredeposits were buried and preserved throughout Cretaceous andmost of Tertiary lime, unchanged exeepi for minor structuraldeformation, coalification, and radiogenic degradation.
In the last few million years, ground water has again invadedthe Morrison formation, oxidizing the sandstones, blurring thefeatures of the primary orebodies and forming secondaiy ore de-posits over a wide area in the central and northwestern pails ofthe bell. In the southeastern pail f the Ambrosia I ake districtand in the deeper parts of the other districts, however, the ore-bodies retain most of their original features. Once these arerecognized, the effects of secondary alteration and redistributionare relatively easy to identify.
Conclusions and inferencesThe morphology, zoning, host rock alteration, and other
geologic features of primary uranium orebodies in the MorrisonFormation of the southern San Juan Basin can be accounted forin terms of the properties of humic matter derived from plantdetritus within the host rocks. Geologic evidence indicates thatthe deposits are remnants of a system dominated by humic mai-ler and its reactions, with uranium as an incidental constituent.
The following inferences are suggested by this model:1) Evidence indicates that ore occurrences will nol be confined
to the margins of the San Juan Basin. Additional trends orbells of ore deposits deeper in the Basin are likely to be ar-ranged in a radial patiern with a hub in the general area ofthe Westwater Canyon fan apex.
2) Since organic matter controls the distribution of uranium,a study of sedimentologic factors governing the distribu-tion of plant detritus, and hydrologic factors governing themovement of humates in the ground water, might be morerewarding than studies of uranium alone.
3) Faults and folds formed during Morrison time mayinfluence the distribution of orebodies, either through thelocalization of channels or directly as hydrologic barriers.
IMsm Movir-n Ruroan rtf Minac ft Mineral Rpsnnrr.ee Mpmnir 3R 1QH["I1

96
Post-Morrison structures probably have no effect; how-ever, many apparently younger structures in the southernSan Juan Basin may have formed along pre-existing struc-tural luci.
4) Outside the established mineral belt and particularly nearthe distal edge of the VVestwater fan, ore trends may be en-veloped by discrete alteration halos, which would be usefulas guides to ore. Moreover, areas of nonprospective pri-mary red sandstone may be encountered. The distinctionbetween primary red beds and secondary oxidised beds isimportant. Alteration lacies should be mapped and consi-dered as a possible regional guide to ore.
s| Aicunuilaiions ol barren carboni/ed wood are a potentialmdicatoi ol oie and probably justify exploratory drillingloi several miles in the down-channel direction. C'hlorite-inijuciMuiied /ones in bur ten sandstone may represent sites>il Unmet accumulations of organic matter and also suggestdim n-chaiincl exploration.
(i\ lordisite impregnated sandstone is a strong indicator of orein (lie immediate \icinilv.
ReferencesAdams. S s . ( uitis, H s , .mil Hatcn, I'. 1 . 1974, Alteration ol
dciiit.il magnetite iliiiemle in conlineulal sandstones ol the Mornson1 oitn.ition. Neu M e \ k o . in Iorm.iiHin ot uiaiiHiiu oic deposits;x iciiii.i. lmetti.UHin.ii Atomic t ncrffv Agency. Pro i . . p. 219-25?. 7l . l M c s . (> t l ( ! \
•Vl.iins, s S (. urns. It S . Haten, P. I . and Salek Nejad, H., 1978. ln-teipiei.tium lit posuk'posiiuMuil processes related lt> the formation anililcsiiuiiion ot the Jackpilc-Paguaic uranium deposit, northwest NewMexuo: I lonoiniL deoloev, v 71, no. 8, p. 1635-1654, 1.1 figs.
Austin. S. K . I960. Alteration at Ambrosia Lake, New Mexico: U.S.AIOIIIK I nerpv t oniiiiisMiin, RM1 1.14. I9p . . IX rigs.
. Ivdi, Aliciaiiouol Momsori Sanitsmne. in Geology and lechnol-•\e\ ot tile Giants uranium tcgion, V. C . Kclley, curnpilcr: New MexicoBureau ot Mines ami Mincial Rcsuuiees. Mem. 15, p. 38-44, IS Tigs.
Haas l inking. 1 G. M . Kaplan. I. K.. anil Moore. I) . , I960, l imits ofi la- ii.inn.il eiiviumincm in lei ins ol pH ami oxulalion potential: Jotir-n.ilol tieolnjiv. v hN.im \, p 24V2Kl,2iables, 34 figs.
lircger, I A . 1961, Origin .mil dassilicanon ol nanirally occurring car-bonaceous vnhsiaikcs. in Or panic geochemistry, I. A. Brcger. ed.: NewYork, MacMillan Co . p M-86, I table. ll> figs.
Ureger. I A., and Pcul, M . 1956. I he oiganic geochemistry ol uranium:U.S. Geological Suivev. Piol . Paper 100. p. 505-510. 1 table, I fig.
Clark. 1> S., anil llavciisiiuc. S. K , 1961, Geology anil ore deposits olthe Clillsule mine, \inhiosia I akc area, in Cieology and technology ofthe Cnains uranium icgum. V I Kellev. compiler: New Mexico Bur-eau ot Mines ami Mutual Kesouices, Mem. 15. p. 108-116, 5 figs.
Clary, I. A.. Moliley. ( \ | . . ami Moiilion. (.1. I .. 1963, Geological set-ling of an anomalous <ne Jeposn in the Section 30 mine. AmbrosiaLake area, in Geology and technology ol the Grants uranium region,V. C. Kelley, compiler Ne« Mexico Bureau ol Mines and MineralResources, Mem. 15, p. 7." 79, 5 tigs.
Craig, L. (.'., Holmes, C . N . Cidigun. K. A.. Freeman, V. L., andMullens. I I-.. 1955. Straiigraphv til [he Mormon and related I'ortna-Mons. Colorado Plateau region, a preliminary reporl: L'.S. GeologicalSurvey, Bull. 1009-L. p. I25-I6X, I table, i ; tigs.
Ciould, W., Smity, R. I! , Met/ger, S. I'., and Melancon, 1'. h . , 1963,Cieology of the Homtsiake-Sapin uranium deposits, Ambrosia Lakearea. r>i Cieology and technology of the Grants uranium region, V. C.Kelley. compiler: New Mexico Bureau of Mines and Mineral Re-sources, Mem. 15, p. 66-71, 3 figs.
Granger, H. (."., 1966, Analytical data on samples collected al AmbrosiaLake, New Mexico, 1958 through 1962: U.S. Geological Survey, open-file repl.. 485 p.
, 1968, Localization and control of uranium deposits in Ihesouthern San Juan Basin mineral bell. New Mexico—an hypothesis:U.S. Geological Survey, Prof. Paper 600-B, p. B60-B7O, 5 figs.
Granger, H. C , Santos, E. S., Dean, B. G., and Moore, F, B., 1961,Sandstone-type uranium deposits at Ambrosia Lake, New Mexico—aninterim report: Economic Geology, v. 56, no. 7, p. 1179-1210, 2 tables,8 figs.
Granger, H. C , ind Warren, C , G., 1969, Unstable sullur compoundsand the origin of roll-type uranium deposits: Lconomic Cieology, v. 64,no. 2, p. 160-. 71, 6 figs.
, 1974, Zoning in the altered tongue associated with roll-i>peuranium deposits, in Formation of uranium ore deposits: Vienna, In-ternational Atomic Energy Agency, 1 ' roc p. 185198 } tigs.
Harmon, G. 1-., and Taylor, IJ. S., 1963, Gcolug) and ore deposits ol theSandstone mine, southeastern Ambrosia l a k e area, m Geology andtechnology of the Grants uranium region, V. C. Kelley, compiler: Ne«Mexico Bureau ot Mines and Mineral Resources, Mem. 15. p. 102-107,3 figs.
Hem, J. I) . , 1960, Complexes of ferrous iron vvuh tannic acid: U.S. Geo-logical Survey, Water-supply Paper 1459-D, p. 75-94, 3 tables, 2 figs.
Jacobs, M. 1 .. 1970, Elucidation of the organic matrix from a uraniumore: I'h.U. thesis, Colorado State University, 169 p. , 6 tables, 41 tigs
Keller, W. IX, 1962, Clay minerals in the Morrison Formation of theColorado l'laieau: U.S. Geological Survey, Bull. 1150. 90 p. . 4 tables.12 figs , 1 pi.
Kelley, V. C'.. Kiltel, I). 1 .. and Melancon. P. F... 1968, Uranium depositsof the Grams region, in Ore deposits of the United States 19331967,J, 1). Ridge, ed.: New York, American Institute of Mining. Metal-lurgical, and Petroleum Engineers, p. 747-769, 1 table, 10 tigs.
Kind. I) 1 , 1963. Cieology of the Jackpile mine area, in Cieology andtechnology ol thcGiauls uranium region. V. C. Kelley, compiler: NewMexico Bui can of Mines and Mineral Resouices. Mem. 15, p. 167-176,6 lips
I ee. M. J., 1976, Geochemistry of the sedimentary uranium deposits ofthe Grams nnneial bell, southern San Juan Basin, New Mexico: Ph.D.thesis, University of New Mexico, 241 p.. 22 tables, 32 figs.
I eopold, 1 . B.. 1943, Climatic character of the interval between the Jurassu and Cretaceous m New Mexico and An/ona: Journal of Geology,v. 51. p. 56-62
Miller. I). S., and Kulp, J. I ., 1963. Isotopic evidence on ihe origin of theColorado Plateau uranium ores: Geological Society of America, Bull.,v 74, p. 604-630
Moench. R. M., and Schlee, J. S.. 1967, Cieology and uranium deposits ofthe l.aguna district. New Mexico: U.S. Geological Survey, Prof. Paper519, 117 p., 16 tables, 39 figs., 9 pis.
Nash, J. r., and Kerr, P. F., 1966, Geologic limitations on the age of theuranium deposits in the Jackpile sandstone. New Mexico: EconomicCieology, v. 61, no. 7, p. 12831290, 1 lablt, 2 figs.
Pommer, A. M., and Breger, I. A., 1960a, Potenliometric titration andequivalent weight of humic acid: Geochimica et Cosmochimica Ada, v.20, p. 30-44
— , 1960b, Equivalent weight of humic acid from peat: Gcuchimicael Cosmochimica Acta, v. 20, p. 45-50
Rapaport. I. R.. 1963, Uranium deposits of the Poison Canyon ore trend,Grams district. New Mexico, in Geology and technology of the Grantsuranium region, V. C. Kclley, compiler: New Mexico Bureau of Minesand Mineral Resources, Mem. 15, p. 122-135, 6 figs.
Roeber, M. M., and Melancon, P. E., 1964, Periodicity and aid tolocating uranium ore in the Section 32 mine, Ambrosia Lake, NewMexico: unpublished manuscript
Ro/hkova, E. V., Ra/umnaya, E. G., Scrcbryakova, M. IJ., and Shcher-bak, C). V., 1958, The role of sorption in the process of uranium con-centration in sedimentary rocks: Geneva, 2nd International Conferenceon Peaceful Uses of Atomic Energy, Proc. v. 2, p. 420-431, 10 tables.6 figs.
Schmidl-Collerus, J. J., 1967, Investigation of the relationship betweenorganic matter and uranium deposits: Denver Research Institute, Uni-versity of Denver, 192 p., 14 tables. 85 figs. '
Sharpe, J. V. A., 1955, Uranium deposits in Ihe Morrison Formation,Church Rock area, McKinley County, New Mexico: U.S. AtomicEnergy Commission, RME-79, 15 p., 1 table, 5 figs.
Squyres, J. B., 1970, Origin and dcpositional environment of uraniumdeposits, Grams region, New Mexico: Ph.D. thesis, Stanford Univer-sity, 228 p., 20 tables, 42 figs.
Swain. F. M., 1963, Geochemistry of humus', in Organic geochemistry, I.A. Breger, ed.: New York. MacMillan Co., p. 87-147. II tables, 6 figs.
Swanson, V. E., and Landis, E. R., 1962, Geology of a uranium-bearingblack shale of late Devonian age in north-central Kansas: ArkansasGeological and Conservation Commission, Inf. Circ. no. 22, 16 p., 2tables, 6 figs.
Swanson, V. E., and Palaeas, J. G., 1965, Humate in coastal sands ofnorthwest Florida: U.S. Geological Survey, Bull. 1214-B, p. 1-27, 22figs.
Szalay, A., 1958, The significance of humus in the geoehemical enrich-
[New Mexico Bureau of Mines & Mineral Resources, Memoir 38,1980)

91
inent nt uranium: Geneva. 2nd International Conference on Peaceful sandstone- anil Ms possible beating on ihe ongin and piccipiuinon olI scsot Atomic Inergv. I'mc . v 2. p. 1S1 IKft.fttigs uiaimim. L S. Geological Sune\. Cue 224. 2h p.. 2 tables. \2\\p,
. IVM. Cation exchange properties ol IUIIIIIC acids and fheir mi Weege. K I . 19ft.'. (KI>IO(>« O! i l if Maic;uiv iiiinc. Ambiosi.i 1 .ikcui-.).ponaiKc :n the {saiclu-iiiical cnnclimcni ol I'()..• • and oilier cations: m l"iroU)j!> and iivhnolog> ol I lie luanls ui.imum ic^ion, V. c . kc lk t .CicoJiiniKa el C osmochiniKa Ai'la. » 2S. p. Iftll5-lhl4. 4 ligs aunpili'i New MI'VK'O Hi:u'.iu ol Mines and Mincial Kesouues. Mem
\an Kieielen. 1) \ \ . . 1S)6 . Cleoi.lieniisu\ ol eoal. m Organic j:eo 15.p I P I2l. . ' l i j ;s
clieinisti>. I A. Hrrgcr. ed New ^ork. Ma^Millan Co.. p. IK2-2OI. 2 Weeks, A I).. 1Y5 I. Red and j ! i . i \ clav inuleiKin.i; oie hciii mp sandsionedi.tu'i.tins, y iijis o! the Monison I oimalion in uestein < oloiado I S \ IO I I IK I neij:^
\nie. I I ) . Suanson. \ I , and Bell. K d . , I'»5N. 1 he role ol luiniu' C ommisMon. 11 M 251.uids in the jicocliL-miMrv i>l iiianiuin Civnoa. 2nd lnien.ational C on ^ ouni;. K o . and I-al>. (.• K . I1<<>. I laniiim mvum-iuo in ihe \ mleieiKe on I'eacelul I ses ot I i.H.ILIin. 1'nn. . p 18"-ISM, 1 table. 2 tijjv hiosia 1 ake aiea. Mckinle\ i oiniiv. New Mexico I s \ IO I I IK 1 neipx
\\.ueis \ () . and Cnanj;ei. II C . 1^5'. \oleanic delnis in lanileious I oniniission. KM1 • Sd. h p . ? maps
[New Mexico Bureau of Mines & Mineral Resources. Memoir 33.1960]

98
EFFECTS OF GROUND-WATER FLOW ON THE ORIGINOF COLORADO PLATEAU-TYPE URANIUM DEPOSITS
by Frank G. Ethridge, Department of Earth Resources, Colorado State University. Ft. Collins. Colorado 80521,Nestor V. Ortiz, Department of Civil Engineering, Colorado State University, Ft. Collins, Colorado 80521,
Harry C. Granger, U.S. Geological Survey, Federal Center, Golden. Colorado 80401,James A. Ferenichak, Department of Civil Engineering, Colorado Slate University, Ft. Collins, Colorado 80521. and
Daniel K. Sunada, Department of Civil Engineering, Colorado State University, Ft. Collins, Colorado 80521
AbstractThe precipitation of humic acid at the interface between a
humic-acid solution and an aluminum-potassium-sulfate solu-tion was studied under controlled laboratory conditions to gaininsight into the deposition of Colorado Plateau-type uraniumdeposits. In particular, the effects of variable flow rates, porous-media layering, baffles (mudstone lenses), fluid-density differ-ences, and geochemical reactions on both the flow phenomenonand the resulting precipitate were evaluated in a series of ex-perimental runs. During these runs, distinct bands of precipitateformed both parallel and perpendicular to the flow path at the in-terface between *ulutions. The precipitate filled pore space,reducing hydraulic conductivity, while the thickness of thedeposits increased with time. When the flow rate of humic acidwas increased, the precipitate was dissolved back into solutionand reprecipitated at a new interface. However, when the flowrate was decreased, the original deposit remained, and a newzone of precipitate formed. Under experimental conditions char-acterized by multiple-porous-media layers, the precipitate wasmore concentrated in layers having greater permeability. Bafflesused to simulate mudstone layers caused significant changes inthe tlow configuration and thus in the orientation and location ofthe precipitate bands. Density differences between the two solu-tions appear to have had little effect on the concentration of thedeposits, and significant effects due to diffusion were not ob-served. Precipitate patterns in models simulating river depositsclosely resemble actual patterns of some tabular orebodies of theColorado Plateau. These experiments provided a visual record ofthe shape and distribution of deposits resulting from fluid-flowpatterns and reactions between two solutions. This informationshould prove useful in predicting the shape and distribution ofsandstone uranium deposits and the relations between these de-posits and ground-water flow patterns.
Introduction and objectivesThe Colorado Plateau includes parts of Colorado, Utah, Ari-
zona, and New Mexico and contains one of the largest uraniummining districts in the United States (fig. I). Rocks of the twomain host units, the Morrison and Chinle formations, comprisearkosic and quartzose, lenticular, cross bedded, fluvial sand-stones, conglomerates, and mudstones. These deposits representbraided and meander-belt paleochannels that formed as portionsof alluvial fans and fluvial systems.
Despite numerous studies during the last quarter century, thereis still considerable dispute about the exact origin and localiza-tion of these sandstone-type uranium deposits. One hypothesisemphasizes the differences between the tabular deposits of theColorado Plateau and the roll-front deposits of the Wyomingbasins. These differences include both the lack of an alterationand oxidation zone on the updip side of the ore and the presenceof many orebodies within crossbedded sandstone units. Theseand other facts concerning the nature of Colorado Plateau de-posits led Shawe (1956), Granger and others (1961), Miesch(1963), Shawe and Granger (1965), Fischer (1970), and Granger(1968, 1976) to propose that the mechanism of deposition musthave been a transient feature that no longer exists in the rocks.This hypothesis suggests that physical and chemical reactions at
the interface between two solutions have been instrumental indepositing much of the uranium in the Colorado Plateau area.
A second hypothesis is the classic roll-front or geochemical-cellhypothesis originally proposed for Tertiary deposits in Wyomingand recently used to explain all western United States deposits,including those of the Colorado Plateau (Rackley, 1976; Gabel-man, 1977; Galloway, 1978; and De Voto, 1978). This secondhypothesis emphasizes that precipitation of ore minerals isbrought about through reactions between ground-water solutionsand host rocks. Differences between the Colorado Plateau andWyoming deposits are considered of secondary importance andare explained in terms of post-mineralization modifications(Galloway, 1978; De Voto, 1978) or growth of a modified geo-chemical cell (Rackley, 1976).
This study evaluates the first hypothesis by investigating theformation of a precipitate at the interface between two solutionsin porous-media flumes located at the Engineering ResearchCenter at Colorado State University. The experiments may pro-
Monument ' \Volley ,' J
FIGURE 1—URANIUM MINERAL BELTS OI THE COLORADO PLATEAU ANDWYOMING (after Rackley, 1976, p. 90); black bar in lower left corner ofmap is 62.1 mi (100 km) long.
[New Mexico Bureau of Mines & Mineral Resources, Memoir 38,1980]

99
vide some new insight into the following: the mechanisms of pre-cipitation at the interface between two solutions; the geometry ofthe resulting deposits; and the effects of variable-flow rates,porous-media layering, mudstone lenses, and fluid-density dif-ferences on the shape and distribution of the precipitates.Qualitative assessments can also be made on the importance ofdiffusion and dispersion processes by visual examination andphotography.
The experiment was devised to study deposits in the Uravanmineral belt where ore layers appear to have been deposited atthe margins of anastomosing hydraulic conduits within the hostsandstones. Presumably, the reactions that resulted in precipita-tion of associated vanadium clays and replacement of quartzgrains would be too slow to study effectively in laboratorymodels. On the other hand, in the Grants mineral belt, thetabular ore layers are composed of an intimate mixture of ahumate-like substance and uranium minerals. The humate mayhave been deposited at an interface between two solutions andmay have become the control which localized uranium deposi-tion.
Solving the problem of the origin of Colorado-type uraniumdeposits is not possible in this type of study. This problem canonly be solved by an exhaustive series of field studies and lab-oratory experiments designed to answer the four fundamentalproblems concerning the origin of epigcnetic sandstone deposits(summarized by Rackley, 1976): I) What are the processes thatmobilize uranium, transport it for miles, and redeposit it withminimal change in the rock through which it passes? 2) What isthe source of the uranium? 3) When was it deposited? 4) Why dothe orebodies commonly have both discordant and concordantrelationships with the enclosing sediments?
Our primary objective in this study was to examine the charac-teristics of solution interface by precipitating humic acids—asaluminum or potassium humates—at the interface between twosolutions, one that would dissolve humic acids and another thatwould precipitate them. This procedure should provide insightinto the first problem (above). A second objective involved in-vestigation of the relationships between the orebodies and enclos-ing sediments.
ACKNOWLEDGMENTS—We wish to express our appreciation toDr. C. G. Warren, Associate Professor of Chemistry at Colo-
rado State University, for his valuable suggestions and to JohnA. Campbell for his critical review of the manuscript. This studywas conducted under USGS Grant No. G-429 with partial sup-port from Colorado State University Experiment Station Project1110.
Previous workPrevious experimental studies on fluid penetration into a
porous medium or Hele-Shaw cell containing another fluid haveconcentrated on the stability of the interface between two fluidsof different density or viscosity under homogeneous conditions.These studies have contributed to a better understanding of theflow phenomenon.
Studies by Lewis (1950) and Saffman and Taylor (1958)showed that when a viscous fluid is driven forward by thepressure of another driving fluid, the interface between th^ two isunstable if the driving fluid is less viscous or dense than the otherfluid. Instability develops into round-ended fingers of lessviscous or dense fluid penetrating into more viscous or densefluid, assuming that the fluids remain completely separatedalong a definite interface.
Wooding (1964) studied the penetration at a point of a denserfluid into a saturated porous medium. A finger-like intrusion ofthe denser fluid into the stationary fluid developed as a result ofgravity flow, and precipitate formed at the interface between thetwo fluids.
Analytical procedureDescription of physical model
Laboratory experiments for this study were conducted in twosimilar flumes containing a porous medium (figs. 2 and 3). Thelarger flume (fig. 2) is approximately 12.0 ft (3.7 m) long, 16.0inches (40.6 cm) high, and 2.0 inches (5.1 cm) wide. The smallerflume (fig. 3) is 3.0 ft (0.9 m) long, 12.0 inches (30.5 cm) high,and 1.5 inches (3.8 cm) wide and was used for most of the ex-perimental work because it is easier to handle, reducing the timenecessary for removal and replacement of the porous medium.Both flumes are composed of acrylic plastic walls in which
Fluid maybe withdrownat piezometer points
Pie m g loss pane Is
12'
Elevat i on View
7f 12
G l o s s b e a d s or a n y s o i l .
5.5"T Screen
Top ViewFIGURE 2—DIAGRAMMATIC VIEWS OF LARGE POROUS-MEDIA FLUME USED IN EXPERIMENTAL RUNS 1 AND 2
(described in table 2).
[New Mexico Bureau of Mines & Mineral Resources, Memoir 38,1980]

100
Outflow Impermeable Boundary- Inflow
12"
/A
Plexiglass wa l l s .
1 o
2 O
A O
Piezometer points
OraEndbox7/V 36" 1"
Drain
FIGURE 3—DIAGRAMMATIC VILW OK SMALL POROUS-MEDIA H UME USED IN EXPERIMENTAL RUNS 3-24 (described in table 2).
piezometer taps are installed. Plexiglass plates were sealed on thetop and bottom of the flumes to simulate confined aquifer condi-tions. At the upstream and downstream ends, a screened outletand plastic end box was attached. A constant-head tank was con-nected to the end box at the downstream end to simulate aconstant-head boundary condition. The fluid was recharged atthe upstream end of the flume as a distributed source, to simulatea constant-flow boundary condition, and was discharged at thedownstream end. The fluid can also be injected or withdrawnthrough piezometer openings located at different levels on oneside wall of the model. A positive-displacement pump was usedto inject the fluids, thereby maintaining the desired flow ratethroughout the test period. In both models, a confined aquiferwas studied.
Fluid, media, and control systemsHumic acid and aluminum-potassium-sulfate solutions were
used as the fluids in these experiments. The concentration of thealuminum-potassium-sulfate solution was 900 ppm. Sulfuric acidwas then added to the solution to adjust the pH to a value of 3.5both in order to prevent the aluminum from precipitating out ofthe solution if it was allowed to stand for several days and to pro-vide a more stable precipitate front upon its reacting with thehumic-acid solution.
The humic-acid solution was made from a technical-gradehumic acid and sodium salt. A standard solution of 750 ppm con-centration, pH of 8, and a density of 0.9994 gm/cc at 20 CC, wasprepared for these experiments. The viscosities of both solutionswere essentially that of water. The aluminum-potassium-sulfatesolution was the denser of the two fluids. For those runs in whichthe fluid densities were the same, the density of the aluminum-potassium-sulfate solution was altered slightly by the addition ofmethyl alcohol. When these solutions come into contact witheach other for a sufficient period of t j m e i precipitation of ahumate results from a reaction between the aluminum ion andthe humic-acid ion.
Our procedure involved studying characteristics of solution in-terfaces by precipitating liumic acids (as aluminum or potassiumhumates) between two solutions—one which would dissolvehumic acids and another which would precipitate them. Humicacids and their corresponding humate precipitates were ideal forthis purpose because 1) they seem to be very similar to the humicmaterial that forms the ore control in the Grants mineral belt,2) they precipitate very quickly and do not react with the quartzsands, and 3) the reactions are quickly reversible so that the pre-
cipitate can be redissolved in the solvent solution, and anothertest can be conducted without disturbing the model.
In the initial experimental runs, the porous-media model was:uturated with aluminum solution and the humic acid was in-jected from a point source. The following conditions werestudied: I) homogeneous medium, point recharge and uniformdischarge, no density difference; 2) homogeneous medium, pointrecharge and point discharge, no density difference; 3) hetero-geneous medium (introduction of areas of different perme-abilities), point recharge and uniform discharge, no densitydifference; 4) heterogeneous medium, point recharge and pointdischarge, density difference; 5) heterogeneous medium, pointrecharge and uniform discharge, density difference.
Five different porous media, ranging from fine sands to glassbeads, were used to simulate different hydraulic properties. Forany given run the flume was filled with one type of material,when simulating a homogeneous medium, or with a combinationof two or more porous media, when testing the heterogeneouscases. The hydraulic properties of the porous media used in theseexperiments are presented in table 1.
In later runs involving simulated stream deposits, the respec-tive roles of the fluids were reversed to bring the simulation morein line with natural conditions.
Description of experimentThe initial conditions for each test were those of a horizontal
piezometric surface at a previously selected elevation. These con-ditions were met by observing the piezometric head levels from arow of piezometers, located on one side wall of the model, to en-sure that no detectable hydraulic gradients existed.
When the correct hydraulic head had been established, aconstant-flow rate of aluminum-potassium-sulfate solution wasinitiated at the upstream end of the model from the end box,simulating a constant-flow boundary. A constant flow of humicacid solution was then injected as a point source through one ofthe piezometer openings located at the upstream end of themodel. The positive displacement pump was used to introduceboth fluids into the flume. During a test, changes in the flow pat-tern were recorded photographically at selected time intervals.The photographic record includes closeup shots of the precipitateas well as shots of the entire flow configuration. Data collectedduring each test included the piezometric head, inflow rate ofeach fluid, combined fluid outflow, and flow configuration, re-corded photographically. The test was continued until no detect-able changes were observed in the flow configuration orprecipitation zone.
[New Mexico Bureau of Mines & Mineral Resources, Memoir 38,1980]

101
TABLE I—PROPERTIES OF POROUS MEDIA.
type
Glass beadsSmall beadsOttawa sandFine Ottawa sandCoarseSandBSand A
hydraulicconductivity
(cm/sec)
5.11.30.650.110.950.060.01
porosity
0.380.390.330.360.390.31
0.36
grain size(mm)
2.351.60
0.5-0.840.42-0.590.71-2.50.15-0.6
0.15-0.3
description
sphericalglass beads
Ottawa sand
coarse sandfine sand
very fine sand
Simulation of homogeneous andheterogeneous conditions
Two different porous media were used alternately to simulatehomogeneous aquifer conditions. One of the materials used wasspherical glass beads about 2.5 mm in diameter. The otherporous material was Ottawa sand. The material was placed inlayers 2-3 cm thick so that packing would be as uniform as pos-sible.
The heterogeneous cases considered included simulation ofzones of different permeabilities, layered deposits, and mudstonelenses. A rectangular body of porous material, of a permeabilitydifferent from the surrounding medium, was placed at the centerof the flume to simulate zones of different permeabilities (fig. 4).Two cases were considered: one in which the permeability of theporous medium composing the rectangular area was greater thanthe permeability of the surrounding medium and one in which itwas less. In both cases, the surrounding medium consisted of Ot-tawa sand. The rectangular area was filled with glass beads inone test and type A sand in the other.
To simulate a heterogeneous medium with impermeable mud-stone lenses, baffles made of plexiglass were interspacedthroughout the flume at angles ranging between 15 and 45 de-grees (fig. 5). Ottawa sand was used as the porous medium forthis series of tests.
A combination of four different porous media were used tosimulate a layered deposit. Each medium was packed in horizon-tal layers about 3 inches (7.6 cm) thick, grading from coarse
.75"
Run
59
101112
14.2512.315.215.215.215.1
10.58.89.39.39.39.3
11.2514.911.511.511 .511.6
beadsbeadsf ine sandf ine sandf ine sandbeads
AAA
FIGURE 4—DIAGRAMMATIC VIEW OF SMALL POROUS-MEDIA FLUME ILLUS-
TRATING SIMULATION OF ZONES OF DIFFERENT PERMEABILITIES BETWEENRECTANGULAR LENS OF POROUS MEDIA NEAR CENTER OF FLUME AND SUR-ROUNDING MEDIA; surrounding media in all runs was Ottawa sand; sizeof media material in rectangular lens and dimensions of L,, L;, and L>are shown below diagram for runs 4, 5, 9, 10, 12, and 6, respectively(top to bottom).
sands at the bottom to very fine sands at the top (fig. 6). Thematerials used were type A, type B, coarse sand, and Ottawasand.
In examining relationships between orebodies (precipitateband of the model studies) and the enclosing sediments, informa-tion on the permeability, porosity, and textural patterns found inmodern river deposits (Pryor, 1973) was used to construct simpleand complex fluvial-deposit models in the small, porous-mediaflume. For the simple fluvial model, five types of porous mediawere used to simulate textural changes commonly found in an-cient river deposits. These materials included small glass beads,Ottawa sand, fine Ottawa sand, type B sand, and type A sand(table I). In the case of the complex model, the same five porousmedia were used, along with mudstone lenses simulated withmodeling clay. Greater lateral and vertical variability, in terms of
RUN
3
2
7"
9"
2
b
9'
\
10 4"
30°
I I
15°
5"
1?"
5. l "
4 l"
2 5"
b
4 3"
45°\
4
4
3
4
5
1
5
o"
RUN * I 6
B
FIGURE 5—DIAGRAMMATIC VIEW OI SMALL POROUSMEDIA FLUME n ius-TRATING LOCATION OF BAFFLES FOR RUNS 15 AND 16, RESPEC1IVL1.Y (seetable 2).
Fine sand A
Fine sand B
Ot towa sand
Coarse sand ^^-^___^
3.5"
2 7"
3 l"
2 l"
- H 4 " V 8 " 4 / 5 " h 7 " H
Mudstone lens
FIGURE 6—DIAGRAMMATIC VIEW OF SMALL POROUS-MEDIA FLUME ILLUS-
TRATING LAYERED MODEL USED FOR RUN 18.
[New Mexico Bureau of Mines & Mineral Resources, Memoir 38,1980]
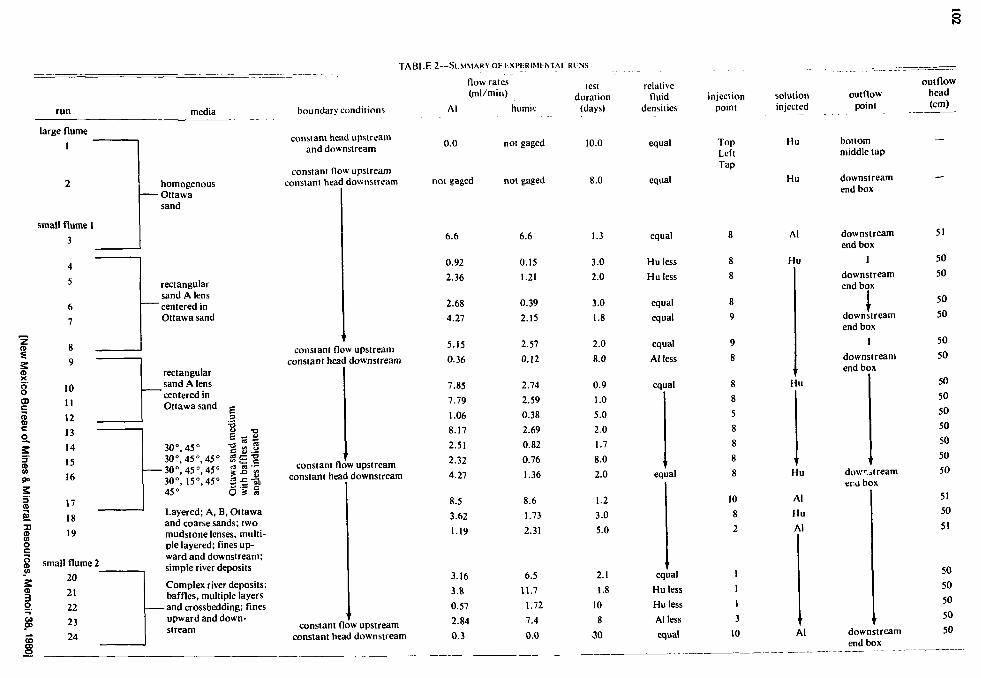
large flume1
ax
8CD
3CDCO
Oc
small flume 1
3
45
67
8 _
9 ~
1011
12 _13 ~14
15
16
17
18
19
small flume 22021222324
media
homogenous- Ottawasand
rectangularsand A lens
" centered inOttawa sand
rectangularsand A lenscentered inOttawa sand
30°, 45° • g g S30°, 45", 45° S £ " g30°, 45°, 45° %M"%30°, 15°, 45° 2-5-SoAC O X " ^ C45 O 5
Layered; A, B, Ottawaand coarse sands; twomudslone lenses, multi-ple layered; fines up-ward and downstream;simple river deposits
Complex river deposits:baffles, multiple layers
-and crossbedding; finesupward and down-stream
boundary conditions
constant head upstreamand downstream
constant flow upstreamconstant head downstream
TABLE 2—Sl.MMARYOhLXPtRIMlWAl RINS
flow rates(ml/min)
Al humic
constant flow upstreamconstant head downstream
constant flow upstreamconstant head downstream
constant flow upstreamconstant head downstream
0.0
not gaged
6.6
0.92
2.36
2.684.27
5.15
0.36
7.857.791.068.172.512.324.27
8.5
3.62
1.19
3.16
3.8
0.57
2.84
0.3
not gaged
not gaged
6.6
0.15
1.21
0.392.15
2.57
0.12
2.74
2.59
0.38
2.69
0.82
0.76
1.36
8.61.73
2.31
6.5
11.7
1.72
7.4
0.0
lestduration
(days)
10.0
8.0
1.3
3.0
2.0
3.0
1.8
2.08.0
0.91.05.02.01.78.02.0
1.23.05.0
2.1
1.8
10
8
-30
relativefluid
densities
equal
equal
equal
injectionpoint
TopLeftTap
Hu lessHu less
equal
equal
equal
Al less
equal
equal
eq lal
Hu less
Hu less
Al less
equal
88
8
9
9
8
8
85
88
8
8
108
2
1
1
1
3
10
solutioninjected
Hu
Hu
Al
Hu
Hu
Hu
AlHuAl
outflowpoint
bottommiddle tap
downstreamend box
downstreamend box
1
downstreamend box
downstreamend box
1
downstreamend box
outflowhead(cm)
downitreamer,U box
Al downstreamend box
51
50
50
50
50
50
50
50505050505050
515051
5050505050

103
porosity and permeability differences, was added; and crossbedswere simulated by small-scale layering of combinations ofporous-media materials.
Experiment resultsRuns 1 through 3 (table 2) were conducted to acquire informa-
tion about how the humic acid and the aluminum-potassium-sulfate solutions reacted when they came in contact with eachother and to observe where precipitation occurred. These testswere conducted in the large flume with Ottawa sand as the por-ous media. Two cases were considered—one in which both fluidswere flowing and one in which the aluminum-potassium-sulfatesolution was stagnant. The results of these tests indicate thatprecipitation of the humic material can occur both parallel andperpendicular to the general flow path, at the interface betweenthe two solutions (fig. 7). The dark band formed by precipitationof humic material is both parallel and perpendicular to the flow.Results indicate that the deposits are larger when the contact timeperiod between the two fluids is long.
Any variation in flow rates can significantly influence the loca-tion of the deposits. When the flow of the humic acid relative tothe aluminum-potassium-sulfate solution was increased, the pre-cipitate was dissolved back into solution and redeposited at a newinterface. However, if the flow of the humic acid was decreased,the original deposit remained at its previous location, and a newband of precipitate formed, providing multiple-precipitate zones(fig. 8). When both solutions came in contact with each other fora sufficient period of time, the aluminum and humate ions re-acted, causing the humic material to precipitate. The solutionsurrounding the deposited material then had a pH of 5. In orderfor this precipitate to have been dissolved and brought back intosolution, it had to come in contact with a solution with a pHgreater than 5. Decreasing the flow of humic-acid solutioncaused encroachment of the aluminum-potassium-sulfate solu-tion on the precipitate. Since the pH of the aluminum solutionwas only 3.5, the deposited material would not dissolve, so thattwo distinct precipitate zones occurred. However, increasing theflow of the humic acid would cause the precipitate to come incontact with the humic solution with a pH greater than 5; conse-quently, the precipitate would dissolve and be redeposited at anew interface. These results lend support to the hypothesis pro-posed by Granger and others (1961) for the Ambrosia Lakeuranium deposits, which suggested that fluctuation of the inter-face would tend to either preserve or dissolve and redistributecarbonaceous matter.
FIGURE 8—CLOSE-UP VIEW SHOWING MULTIPLE PRECIPITATE BANDSRESULTING KROM VARIATIONS IN i LOW RATES; general flow direction indi-cated by large arrow.
In run 1 the porous medium was saturated with the aluminum-potassium-sulfate solution and allowed to remain stagnant. Aconstant injection of humic acid through one of the upstreampiezometer openings was continued for a period of 10 days untilthe precipitate layer was fully established. A hydraulic gradientwas then imposed across the precipitate band by allowing a verysmall discharge of aluminum solution through the bottom, up-stream corner of the flume. As a result, part of the deposit wasdissolved, causing a breakthrough of the humic-acid solution(fig. 9). Allowing the aluminum solution to drain through the
FIGURE 7—LARGE POROUS-MEDIA FLUME SHOWING PRECIPITATION BANDSIN HOMOGENEOUS OTTAWA SAND; general flow direction indicated byheavy arrow. Aluminum solution was stagnant in this run and is clearin picture; humic-acid solution remains wiihin the area outlined byprecipitate bands and colors that area of flume; darker precipitatebands show up at the edge and within this dark-colored zone.
FIGURE 9—CLOSE-UP VIEW OF AREA IN LARGE POROUS FLUME (RUN 1),SHOWING THE BREAKTHROUGH OF HUMIC-ACID SOLUTION AND ITS REPRE-CIPITATION OUTSIDE THE ORIGINAL PRECIPITATE BAND; dark curved linerunning diagonally to upper right-hand corner is reflection of plastictube that is attached to a piezometer point; genera! flow direction in-dicated by large arrow.
[New Mexico Bureau of Mines & Mineral Resources, Memoir 38,1980]

104
upstream end of the model caused the humic acid solution to en-croach upon the precipitate. Since the pH of the humic solutionwas greater than 5, it caused the precipitate to dissolve, produc-ing a breakthrough situation. With the fluids reversed in a sim-ilar situation, the precipitate band was not dissolved byaluminum solution encroachment, and no solution channel wasformed.
The precipitate has a tendency to fill the pores of the porousmedium, reducing the hydraulic conductivity. Fig. 10 shows theresults for the condition in which both fluids were flowing andthe humic solution was the denser of the two fluids. For this testa rectangular body, less permeable than the surrounding me-dium, was located at the center of the flume. The path followedby the humic acid was deflected at point A once the precipitatehad formed here, reducing the permeability. Observations werealso made of the path followed by a stream of dye, introduced atone of the piezometer openings at the upstream end of the model.This stream of dye was deflected as it came in contact with theprecipitate (fig. 10, location A).
Runs 4 through 12 (table 2) were conducted to simulate zonesof different permeabilities, as previously described. When theporous medium composing the rectangular body was less perme-able than the surrounding medium, the stream lines diverged,shifting the interface toward the more permeable surroundingmedium in which precipitation occurred (fig. 11). When the per-meability of the surrounding medium was less, however, the flowlines converged toward the more permeable rectangular area inwhich precipitation occurred (fig. 12).
A photograph of the precipitate in cross section, in which theporous media composing the rectangular body was more perme-able, was obtained by removing the end of the model and someof the media material. The cross section of the precipitate band iscircular in shape and approximately 6 mm thick (fig. 13). Thesource is approximately 18 cm upstream from the cross section.The diffuse nature of the band is due to a decrease in flow ratefrom the point source, a result of poor flow regulation.
Runs 18 and 19 (table 2) show the effects of layering on theflow configuration, using the four porous media (fig. 14). Mate-rials placed in the flume were graded from coarse sand at the bot-tom to very fine sand at the top. Results indicate the precipitatelayer was richest in the more permeable material and became pro-gressively leaner toward the less permeable material, and theprecipitate band was more diffuse in the finer material (fig. 14).The deposits occurred much sooner in more permeable materialsthan in less permeable ones, partly because of the higher flowrates in the more permeable material. A greater flow rate allowslarger volumes of solutions to interact over a set time interval.Very little fluid flows through the fine material in a given time in-terval, so that little precipitate forms owing to the small amountof solution interaction.
Although in the laboratory the precipitate is most pronouncedin the more permeable layers, this may not always be the case innature. Different orders of magnitude of laboratory and naturalflow rates and of elapsed times may permit natural precipitatesto occur away from the more permeable beds. Subsequent dis-solution of precipitates might proceed more readily in permeable
FIGURE 10—SMALL POROUS MEDIA ILUM£ SHOWING THfc DERKCT1ON OFHUMK ACID (POINT A) AROUND PREVIOUSLY DEPOSITED PRECIPITATEBAND; general flow direction indicated by lar£c arrow.
FIGURE 12—DEPOSITIONAL PATTERN RESULTING FROM THE LOCATION OI-ARECTANGULAR LENS OH MORE PERMEABLE MATERIAL NEAR CENTER OlSMALL POROUS-MEDIA FI.UMH: general flow direction indicated by largearrow.
FIGURE 11—DEPOSITIONAL PATTERN RESULTING FROM THE LOCATION OF ARECTANGULAR LENS OF LESS PERMEABLE MATERIAL NEAR CENTER OF SMALLPOROUS-MEDIA FLUME; general flow direction indicated by large arrow.
FIGURE 13—CROSS-SECTION VIEW OF PRECIPITATE IN SMALL POROUS-MEDIA MODEL.
[New Mexico Bureau of Mines & Mineral Resources, Memoir 38,1980]

105
layers, leaving remnants and pods in the less permeable layers.Runs 13 through 17 (table 2) show the effect of permeability
barriers (mudstone lenses) on the distribution of precipitate. Thebaffles used (described previously) changed both the flow con-figuration and the shape and location of the precipitate (fig. 15).In general, no precipitate occurred in the porous medium adja-cent to the baffles unless a gap was allowed between the baffleand the side walls of the model.
The effect of density differences on the flow regime was to in-crease the penetration of the denser fluid into the lighter solutionas the fluids flowed across the flume. In this study, no changewas indicated in the precipitate concentration as a result of den-sity differences, although the location of the solution interfacechanged (fig. 16). Width and sharpness of the precipitationbands were similar for fluids of both the same and differing den-sities.
For cases considered in this study, no contribution of precipi-tate from the diffusion process was observed; any precipitate in-crease noticed could be attributable to flow-rate changes. Thisfact may be the result of the velocities used in our experiments,which were relatively high, ranging from 3 to 4.6 m/day, com-pared with the velocity of about 0.008 m/day (Todd, 1959) typ-ical of sandstone aquifers found in nature. In addition, undernatural conditions one fluid (probably the fluid carrying the oremineral) is assumed to have moved relative to a more nearlystatic fluid. However, sufficient time presumably was availablefor reagents from the static fluid to diffuse to the solution inter-face where they would react. The precipitate band is not a knife
FIGURE 14—SMALL POROUS-MEDIA MODEL SHOWING EFFECTS OF LAYERSOF MATERIAL WITH DIFFERENT PERMEABILITIES ON PRECIPITATE BAND;general flow direction indicated by large arrow.
edge at the solution interface, suggesting some intermixing ofcomponents which may be attributed to the diffusion process.Under field conditions these effects may prove to be significant,in contrast with the results obtained in this experimental study.
For later runs involving both the simple and complex fluvialdeposits, the porous-media model was saturated with humic acid,and the aluminum solution was injected from a point source. In-terchanging the respective role of the fluids should bring thesimulation more in line with natural conditions. Experimentalresults for runs involving the simple fluvial-deposit model aresimilar to those found in the layered model. Patterns of precip-itate bands obtained using the complex model (figs. 17, 18), how-ever, more closely resemble actual cross sections of tabularorebodies in the Colorado Plateau (fig. 18).
Small-scale details of the ore distribution in the ColoradoPlateau area are closely associated with sedimentary featuressuch as disconformities, bedding planes, and mudstones and con-glomeratic beds (fig. 18; Santos, 1963; Shawe and others, 1959).Similar relationships between the precipitate bands and themodeled sedimentary features were reproduced under the labora-tory conditions described here (fig. 17). These physical similar-ities between the model and actual deposits suggest that reactionsat (he interface between two solutions may produce layer-like oredeposits similar to those found in the Colorado Plateau region.
Although the general qualitative depositional patterns abovehave been modeled, quantitative results have not been obtained.In the second phase of this study, emphasis will be placed onquantitative results for numerical modeling.
Summary and conclusionsThis study investigated processes that might have been impor-
tant in the formation of layer-like sandstone-type uraniumdeposits, such as those found in the Colorado Plateau. An evalu-ation of the results from the physical model used leads to thefollowing conclusions:
The precipitate of the humic material can occur both paralleland perpendicular to the general flow path, at the interface be-tween two solutions. The deposits are larger when the contacttime between the two fluids is long.
Any variation in flow rate can significantly influence the loca-tion of these deposits. When the flow of humic acid is increased,relative to the aluminum-potassium-sulfate solution, the precip-itate is dissolved back into solution and redeposited at a new in-terface. However, if the flow of humic acid is decreased, theoriginal precipitate remains and a new precipitate forms, pro-viding distinct precipitate zones.
FIGURE 15—CLOSE-LIB VIEW OF EFFECT OF BAFFLE ON THE SHAPE AND DIS-
TRIBUTION OF PRECIPITATE BAND (run 3, table 2); general flow direction
indicated by large arrow.
FIGURE 16—SMALL POROUS-MEDIA MODEL ILLUSTRATING THE EFFECTS OFDENSITY DIFFERENCES ON PRECIPITATE BANDS; diffuse vertical lines withindark-colored areas of humate solution are concentrated zones of humicacid that result when the fluids are allowed to stagnate for extendedperiods of time; general flow direction indicated by large arrow.
[New Mexico Bureau of Mines & Mineral Resources, Memoir 38,1960]
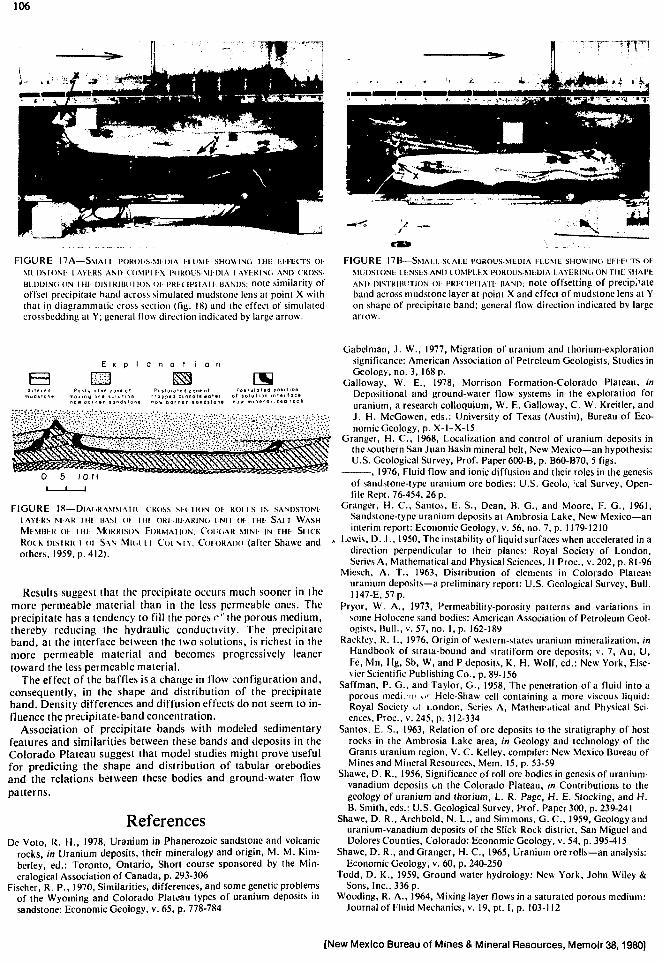
106
FIGURE 17A—SMAI i. I 'OKOUS MI DIA H i u u t SHOWING n i l : l i i i tcTS OH
Ml DSIOM. 1AYI-.RS AND COMPI I-X POROUS MIDIA I AYl-.RINCi AND CROSS-
isi DDLNCI ON iHI- msiKiiuiiioN 01 I'RICIPIIAII BANDS; note similarity ofoffset precipiiate hand across simulated mudstone lens ai point X withthat in diagrammatic cross section (fig. 18) and the effect of simulatedcrossbedding al Y; general flow direction indicated by large arrow.
FIGURE 17B—SMAI.i.-SCALE POROUS-MEDIA HI.UME SHOWING E H b a s OK
MUDSTONI: l.fcNSKS AND COMPLEX POROUS-Mr.DIA LAYERING ON THE SHAPE
AND DISTRIBUTION oi- PRECIPITATE BAND; note offsetting of precipi'ateband across mudstone layer at point X and effect of mudstone lens at Yon shape of precipiiate band; general flow direction indicated by largearrow.
p I o
F I G U R E 18 — D l A I i K A M M A I K ( R O S S S K I ION OI- R O I I S IN SANDSTONE
lAYt -RS NI-AR I HI- BASE OI I I I ! ORI BEARING UNI I OI THl- SA1 I W A S H
MLMBEK oi iHI- MORRISON FOKMAIION. C O K . A R MINI- IN IHE SI ICK
ROCK DISIKK i oi SAN MIGUEL Coi M Y , COIORADO (after Shawe and
others, 1959, p. 412).
Results suggest that the precipitate occurs much sooner in themore permeable material than in the less permeable ones. Theprecipitate has a tendency to fill the pores r ' the porous medium,thereby reducing the hydraulic conductivity. The precipitateband, at the interface between the two solutions, is richest in themore permeable material and becomes progressively leanertoward the less permeable material.
The effect of the baffles is a change in flow configuration and,consequently, in the shape and distribution of the precipitateband. Density differences and diffusion effects do not seem to in-fluence the precipitate-band concentration.
Association of precipitate bands with modeled sedimentaryfeatures and similarities between these bands and deposits in theColorado Plateau suggest that model studies might prove usefulfor predicting the shape and distribution of tabular orebodiesand the relations between these bodies and ground-water flowpatterns.
ReferencesDe Voto, K. H., 1978, Uranium in Phanerozoic sandstone and volcanic
rocks, in Uranium deposits, their mineralogy and origin, M. M. Kim-berley, ed.: Toronto, Ontario, Short course sponsored by the Min-eralogical Association of Canada, p. 293-306
Fischer, R. P., 1970, Similarities, differences, and some genetic problemsof the Wyoming and Colorado Plateau types of uranium deposits insandstone: Economic Geology, v. 65, p. 778-784
Gabelman, J. W., 1977, Migration of uranium and thorium-explorationsignificance: American Association of Petroleum Geologists, Studies inGeology, no. 3, 168 p.
Galloway, W. E., 1978, Morrison Formation-Colorado Plateau, inDeposilional and ground-water flow systems in the exploration foruranium, a research colloquium, W. E. Galloway, C. W. Kreitler, andJ. H. McGowen, eds.: University of Texas (Austin), Bureau of Eco-nomic Geology, p. X-l-X-15
Granger, H. C , 1968, Localization and control of uranium deposits inthe southern San Juan Basin mineral belt, New Mexico—an hypothesis:U.S. Geological Survey, Prof. Paper 600-B, p. B60-B70, 5 figs.
, 1976, Fluid flow and ionic diffusion and their roles in the genesisof sandstone-type uranium ore bodies: U.S. Geolo, ;cal Survey, Open-file Rept. 76-454, 26 p.
Granger, H. C , Santos, E. S., Dean, B. G., and Moore, F. G., 1961,Sandstone-type uranium deposits at Ambrosia Lake, New Mexico—aninterim report: Economic Geology, v. 56, no. 7, p. 1179-1210
, Lewis, D. J., 1950, The instability of liquid surfaces when accelerated in adirection perpendicular to their planes: Royal Socieiy of London,Series A, Mathematical and Physical Sciences, II Proc, v. 202, p. 81-96
Miesch, A. T., 1963, Distribuiion of elements in Colorado Plateauuranium deposits—a preliminary report: U.S. Geological Survey, Bull.1147-E, 57 p.
Pryor, W. A., 1973, Permeability-porosity patterns and variations insome Holocene sand bodies: American Association of Petroleum Geol-ogists, Bull., v. 57, no. 1, p. 162-189
Rackley, R. I., 1976, Origin of western-slates uranium mineralization, inHandbook of strata-bound and stratiform ore deposits; v. 7, Au, U,Fe, Mn, Hg, Sb, W, and P deposits, K. H. Wolf, ed.: New York, Else-vier Scientific Publishing Co., p. 89-156
Saffman, P. G., and Taylor, G., 1958, The penetration of a fluid into aporous medi.'ni w Hele-Shaw cell containing a more viscous liquid:Royal Society ul London, Series A, Mathematical and Physical Sci-ences, Proc, v. 245, p. 312-334
Santos, E. S., 1963, Relation of ore deposits to the stratigraphy of hostrocks in the Ambrosia Lake area, in Geology and technology of theGrants uranium region, V. C. Kelley, compiler: New Mexico Bureau ofMines and Mineral Resources, Mem. 15, p. 53-59
Shawe, D. R., 1956, Significance of roll ore bodies in genesis of uranium-vanadium deposits on the Colorado Plateau, in Contributions to thegeology of uranium and thorium, L. R. Page, H. E. Stocking, and H.B. Smith, eds.: U.S. Geological Survey, Prof. Paper 300, p. 239-241
Shawe, D. R., Archbold, N. L., and Simmons, G. C , 1959, Geology anduranium-vanadium deposits of the Slick Rock district, San Miguel andDolores Counties, Colorado: Economic Geology, v. 54, p. 395-415
Shawe, D. R., and Granger, H. C , 1965, Uranium ore rolls—an analysis:Economic Geology, v. 60, p. 240-250
Todd, D. K., 1959, Ground water hydrology: New York, John Wiley &Sons, Inc., 336 p.
Wooding, R. A., 1964, Mixing layer flows in a saturated porous medium:Journal of Fluid Mechanics, v. 19, pt. I, p. 103-112
[New Mexico Bureau of Mines & Mineral Resources, Memoir 38,1980]

107
DISSOLUTION AND AUTHIGENESIS OF FELDSPARSby S. Ralph Austin, Bendix Field Engineering Corporation, P.O. Box 1569,
Grand Junction, Colorado 81501
AbstractFeldspars constitute about 25 percent of the host sandstones of
the Morrison Formation, Grants uranium region. Most rangefrom fresh to slightly altered, but partial dissolution of sanidineis common, leaving a thin shell conforming to the detrital grainsurface. During weathering, transport, or—more probably-early diagenesis, potassium probably replaces sodium in an outerlayer of the sanidine grain, converting it to low microcline, theleast soluble potassium feldspar at low temperatures. Duringlater diagenesis, pressure solution penetrates the microcline layerat grain contacts, and the interior sanidine is dissolved, leaving athin shell that conforms closely to the grain surface. The shellmay be empty, or it may contain either sliver-like or castellatedremnants or nearly complete grains. Solution of plagioclase con-forms more nearly to crystallographic directions, sometimesleaving riddled grains. Authigenic feldspar overgrowths occurmostly later than organic material containing uranium. Thisfeldspar also occurs in barren zones, sometimes as minute crys-tals within sanidine shells. Calcite and other minerals fill cavitiesleft by the dissolution of feldspars but do not commonly replacethe feldspars in the classic sense.
IntroductionThe New Mexico Bureau of Mines and Mineral Resources'
Memoir 15 includes my 1963 study of alteration of the Morrisonsandstones in the Grants uranium region. Since then, this in-vestigation has continued sporadically. Some of the later workprovided information pertinent to dissolution and authigenesisof minerals in the Morrison uranium host rocks. In addition, newinstrumentation and techniques have become available, andseveral excellent theses and other papers pertinent to the subjecthave appeared. The present paper is a continuation, for BendixField Engineering Corporation, of my previous work; it includesadditional observations and correlates them with earlier studies.
Feldspars constitute about 25-30 percent of the host sand-stones of the Grants uranium region. Squyres (1970, 1972) esti-mates that about half of this feldspar is of volcanic origin andalso supports my view that many of these are or were sanidine.Knox and Gruner (1957) report that most of the feldspars are un-altered, as was also observed by various later investigators.Sericitization of plagioclase is the most commonly observed typeof alteration and is attributed by Knox and Gruner (1957) andGranger (1963) to predepositional processes.
Feldspar dissolutionHollow shells sometimes containing feldspar remnants were
first reported in the Morrison host rocks by Knox and Gruner(1957), who misidentified sliver-like remnants within the shells as"authigenic adularia." I examined several remnants under thepolarizing microscope and tentatively identified them as sanidineon the bases of their small optic angle, clarity and freedom fromalteration products, and absence of multiple twinning (Rogersand Kerr, 1942, p. 234-235; Winchell, 1951, p. 305-307). A sam-ple of several dozen ultrasonically cleaned, typical remnants wassubmitted to the U.S. Geological Survey, Denver, Colorado.Harry Granger of the USGS (personal communication, 1959)identified these using x-ray diffraction and spectrographicanalyses (Riley and others, personal communication, 1959) assanidine, having a composition of about 30 percent sodic and 70percent potassic feldspar. Not all feldspar remnants from theGrants uranium region are sanidine, but no multiply twinned,
altered, or cloudy remnants have been observed in examininghundreds of remnants within typical shells.
Fig. 1 shows a typical shell. Shells and remnants are also wellillustrated in Mem. 15 (Austin, 1963, figs. 8-14). Such shells,with or without remnants, have been observed in varying abund-ance in all relatively permeable sandstone units of the MorrisonFormation in the Grants uranium region. They occur both adja-cent to and far from known ore, and in barren ground. Theabundance of shells is limited by the former abundance ofsanidine, which in turn depends in part on the grain size of thesediment. Dissolution of sanidine and other feldspars appears tobe most common in zones of greatest permeability, which is alsoconsidered favorable for the passage of ore-bearing solutions; noother consistent spatial relationship between dissolution of feld-spar and ore zones has been discerned.
Fig. 2 is a map of the Grants uranium region showing represen-tative sites from which samples containing sanidine shells, withor without remnants, have been collected. Similar shells arc pres-ent in the uranium host sandstones of the Salt Wash Member, inuranium mines in the Lukachukai Mountains of Arizona-NewMexico, and in the Recapture Member in the vicinity of minesnear Sanostee, New Mexico.
Brookins (1975), Lee (1976), and others have underestimatedthe number and importance of partly dissolved feldspar grains.The shells are apparently so delicate that they usually do notsurvive sectioning, even after careful impregnaiion, unless sup-ported by calcite or other interstitial minerals. Shells near thesurface of a specimen are readily destroyed in collecting andhandling. They are best observed by examining freshly brokensurfaces under the stereoscopic microscope. Kendall (1971, p. 54)observes, "In thin section they are difficult to find and neverseem equal to the number seen in the same hand specimen!"
Fig. 3 shows a thin section of a sanidine shell unsupported bycementing materials. I have seen only two such unsupportedshells in examining a few hundred sections of the host sandstonefrom the Grants uranium region; the other, reinforced by an
FIGURE 1 —FRACTURED SURFACE OF SANDSTONE SHOWING SANIDINE SHELL(lower center); Rio de Oro hole T-7, 340-350 ft, 64 x; width of fieldabout 1.4 mm.
[New Mexico Bureau of Mines & Mineral Resources, Memoir 38,1980]

<t
X5'oCD
36
35°
20
O
11118NJ—
Explanationy* Mine or group of mines, pre 19640 Site from which sample containing
partly dissolved sanidine wascollected.
- D O E
5 DOE drill hole with significant mineralizationMt. Taylor volcanic rocks
10 20 Miles
i*
FIGURE 2—MAP OF GRANTS URANIUM REGION SHOWING RtPRFstNTAnvi sn ts IROM WHICH SAMIMIS CONTAINING PARTLY
DISSOI VL:I>SANIDINE WERE coi i ECTfcD (modified from Chenoweih and Holen, this volume).

109
FIGURE 3—THIN SECTION OF SANDSTONE. RIO DE ORO DRILL CORE;sanidine shell and attached minute remnants are in crystallography-continuity; quartz and feldspar (?) grains penetrate shell (crossedpolarizers, 160 x ; width of field aboul 0.6 mm).
authigenic feldspar overgrowth, is shown in Mem. 15 (Austin,1963, fig. 14, p. 42).
The former abundance of sanidine may be estimated (evenoverestimated) from fig. 4, which shows a thin section of the hostsandstone in which detrital grains are poikilitically enclosed incalcite. Among the 60-100 detrital grains in this field are at leastfive shells that are believed to have been sanidine. Shells num-bered one and five contain sanidine remnants.
Fig. 5 shows an unusually thick shell containing typical rem-nants in optical continuity with the shell. The dark, mottled areaat right within the shell is kaolinite. Where grains are coated withore or with some other materials, the shells may be obscured orpossibly destroyed; the coating material reveals their formerpresence.
Fig. 4 happens to show an unusually high concentration ofshells and remnants. Here, sanidine shells and/or remnants areabout as abundant as microcline grains and more abundant thanplagioclase. Although the grains in fig. 4 are in the approximatesize range in which sanidine is likely to be most abundant, this isoffset by the fact that quartz is considerably more dominant inthis range than in either much coarser or much finer sizes.
In a further attempt to estimate the former abundance of sani-dine, a freshly broken transverse surface of NX (2 1/8 inches;5.45 cm) core of moderately friable barren sandstone from Riode Oro (Dysart) hole T-7, in the 240-250 ft interval, wasexamined under the stereoscopic microscope. More than 25 san-idine shells and/or remnants were identified. In several in-stances, two or more shells are visible in the same microscope
FIGURE 4—THIN SECTION OF SANDSTONE. SABRE-PINON HOLE D1A3,677-678 FT; calcite encloses sand grains and fills five sanidine shells;shells 1 and 5 contain remnants; central grain is partly dissolvedplagioclase not filled with calcite (crossed polarizers, about 40 x ; widthof field about 2.3 mm).
field at a magnification of 25 diameters (fig. 6). A freshly brokenlongitudinal surface was also examined in case the transverse sur-face represented a concentration of sanidine along a singlelamina; it revealed similar results. Sanidine shells are much lessabundant in very coarse or very fine sandstone; in thin section,they are better observed in calcitic zones, and they tend to beobscured or possibly destroyed in rich ore.
In the Grants uranium region, plagioclase dissolution does notcommonly form shells similar to those formed from sanidine.
FIGURE S—THIN SECTION OF SANDSTONE. SABRE-PINON HOLE DIA3,692-693 FT; uncommonly !hick shell with sanidine remnants in crystal-lographic continuity, calcite matrix; dark, mottled area at right in shellis kaolinite; surrounding grains mostly quartz (crossed polarizers,203 x ; width of field about 0.45 mm).
[New Mexico Bureau of Mines & Mineral Resources, Memoir 38,1980]

110
FIGURE 6—FRACTURED SURI-ACE 01 SANDSTONI- SHOWING TWO SANIDINESHI 11 s (lefl center and lower right); grains visible within each shell havepenetrated far side of former sanidine. Rio de Oro hole T-7, 340-350 ft(32 x ; widlli of field about 2.8 mm).
Plagioclase may instead resemble the hollow sanidine grains de-scribed by Miller (1955). The interior of the hollow plagioclasegrain roughly conforms to crystallographic directions, common-ly forming a shell of greatly varying thickness (fig. 7). Fig. 8shows a riddled grain, another common type of plagioclase dis-solution. A similar grain ir the center of fig. 4 is also plagio-clase.
In the Smith Lake (Black Jack) area, occasional colored feld-spar grains appear dull and chalky, suggesting kaolinization.When they are carefully broken open with a needle, however, athree-dimensional latticework of clear, reticulated, columnarremnants is revealed, with no evidence of kaolinization. Thesegrains may be plagioclase and may resemble fig. 8 in thin section.
No orthoclase, microcline, or perthite has been recognized
FIGURE 7—THIN SECTION OF SANDSTONE; plagioclase grain (center) incalcite matrix is partly dissolved and superseded by calcite; plagioclasesliver is slightly tilted (crossed polarizers, about 100x; width of fieldabout 0.9 mm).
FIGURE 8—THIN SECTION, RIO DE ORO CORE; plagioclase grain (center)contains irregular voids; note overgrown quartz grains (lefl and upperright) (crossed polarizers, 203 x ; width of field about 0.45 mm).
among the feldspar remnants in shells. Dissolution of microclineor perthite was observed only rarely, and then only where adja-cent quartz grains were embedded in these feldspars by pressuresolution, producing pits or shallow depressions.
Sanidine and high-temperature plagioclase represent both ar-kosic and volcanic components, perhaps largely tuffaceous, ofthe host rock. About half the feldspars are of volcanic origin andthus must be considered in a tuff-leach hypothesis for the originof the deposits.
The uranium content of the vanished feldspars is unknown.The reported uranium content of feldspars from other areasvaries by about two orders of magnitude. Rogers and Adams(1974), citing several investigators but obtaining most of theirdata from Larsen and Gottfried (1961), find the uranium contentof the feldspars ranging fro*"- 0.1 to 10 ppm (parts per million)and averaging 2.7 pprn.(T;ie ranges of Rogers and Adams ". . .are those within which uranium values commonly lie, rather thanthe extreme values. . . .") Dostal and Capedri (1975), on theother hand, find the uranium contents of a few potassic feldsparsto occupy a narrow range close to 0.06 or 0.07 ppm.
Feldspars partly or almost completely dissolved compose 6-10percent of the detrital grains in fig. 4. While this is an unusuallyhigh concentration of dissolved grains, dissolution of feldsparsoriginally constituting at least one percent of the rock does notseem unreasonable.
Calculations from these estimates show that dissolution of thevanished feldspars alone releases uranium constituting from lessthan 1 ppb (parts per billion) to 100 ppb of the host rock. All ofthe uranium from the vanished feldspars is released for possibleincorporation into the deposits, along with that from former
[New Mexico Bureau of Mines & Mineral Resources, Memoir 38,1980]

I l l
magnetite, ilmenite, pyroxenes, amphiboles, and other heavydetrital minerals, now vanished.
Rosholt and others (1971), however, find that almost no ura-nium is released from glassy volcanic rocks—including vitrictuffs—during hydration, and that from 30 to 80 percent is re-leased during devitrification. Although the vanished feldsparswere a very minor source of uranium in the deposits, despite thelarge volume of barren sandstone from which at least some of thehigh-temperature feldspars were dissolved (Adams and others,1978), all uranium in these feldspars must have become availablewith their dissolution.
The effect of feldspar dissolution on porosity and permeabilityis probably more important in the genesis of the deposits. Healdand Larese (1973) point out that feldspar dissolution increasesporosity under certain conditions. In the Morrison host rocks,pressure solution, occasional fracturing of grains, and rare devel-opment of stylolitic grain contacts indicate considerable compac-tion. Dissolution of feldspars and other detrital minerals hashelped maintain porosity and permeability during and after com-paction. The fact that calcite cement is commonly late in theparagenetic sequence and merely supersedes rather than replacesfeldspars indicates that porosity and permeability were main-tained for some time after feldspar dissolution.
In the Salt Wash Member of the Morrison Formation, in 1957I observed features similar to the sanidine shells describedabove—but much smaller—in the uranium deposits of the Lu-kachukai Mountains of Arizona-New Mexico. The mineralrepresented by the shells could not be identified at that time, butsimilarity to the larger shells in the Grants uranium region im-plies that it was sanidine. Since no similar shells have beenreported in the numerous studies of the Salt Wash in the Uravanmineral belt, their presence in the Lukachukai Mountains impliesa provenance for the Salt Wash partly similar to the provenanceof the Westwater Canyon Member in the Grants uranium region.This provenance therefore differs somewhat from the Salt Washof the Uravan mineral belt, supporting Chenoweth's (1967) con-clusion that the Salt Wash in the Lukachukai Mountains is partof a lobe distinct from the main Salt Wash.
Mechanism of shell formationMiller (1955) described somewhat similar hollow sanidine
grains from the Pierce Canyon Formation (Permian). Heald andLaresc (1973) and others have described and illustrated solutioncavities in various feldspars. However, the sanidine shells fromthe Grants uranium region appear to be unique in that they areonly a few micrometers thick (figs. I, 3, 5) and conform todetrital grain surfaces rather than to crystallographic directions.
In order for a thin outer shell to be preserved while some or allof the interior of a grain is dissolved, the shell and the interiormust differ in composition. Until the Gandolfi x-ray camera andthe scanning-electron microscope became available, the chemicaland mineralogical nature of the shells was unknown. Since thattime, several Gandolfi x-ray-diffraction patterns were obtainedfrom small fragments of two or three different shells. Althoughthe patterns are not diagnostic among the several potash feld-spars, they most closely resemble patterns for microcline. More-over, energy-dispersive x-ray spectrography of one or two shellsand corresponding remnants (M. L. Dixon of Bendix Field Engi-neering Corporation, analyst) indicates the presence of con-siderable sodium in the sliver-like remnants but little, if any, inthe shells.
Such analyses are only qualitative, and the number of speci-mens analyzed was limited by factors beyond my control. Theseare the first analyses of discrete fragments of shells and con-tained remnants from the region. Considering the small size ofthe specimens (a few micrometers thick and less than a millimeterin other dimensions), they are considered the best obtainable inthe absence of microprobe services. These specimens demon-strate, although they do not fully define, chemical differencesbetween shells and contained remnants.
During either weathering and transport or, more likely, earlydiagenesis, sodium was probably replaced by potassium in theouter few micrometers of the grain. Recrystallization or re-arrangement in the crystal structure of this layer converted it tolow microcline.
Fig. 9 is an electron micrograph of the exterior of a shell at2,300 x , showing planar cleavage surfaces and sharp cornerscharacteristic of an abraded surface. Fig. 10 shows the interior ofa shell at 2,700 x ; the rounded surfaces between cleavage tracesare attributed to solution. The crystal near the center of themicrograph is authigenic feldspar; other projecting masses, lessclearly discernible, are probably sanidine remnants.
Adams (1968) investigated differential solutions of plagioclase
FIGURE 9—EXTERIOR OF SANIDINE SHELI ; note planar surfaces and sharpcorners characteristic of abrasion (electron micrograph by M. L.Dixon, 2,300 x ; width of field about 39 Mm).
FIGURE 10—INTERIOR OF SANIDINE SHELL SHOWING SUBDUED RELIEF ANDSLIGHTLY ROUNDED SURFACES CHARACTERISTIC OF SOLUTION; Crystal incenter is authigenic feldspar; sanidine remnants in lower right (electronmicrograph byM. L. Dixon, 2,700 x ; width of field about 37f«n).
[New Mexico Bureau of Mines & Mineral Resources, Memoir 38,1980]

112
at various temperatures. In his experiments at 25-100°C, theanorthite component is preferentially removed from labradorite,leaving a pseudomorph richer in the albite component. Adamsstates, ". . . differential solution works from the crystal sur-faces inward, forming a shell of new material which is a pseudo-morph after the original feldspar." Fig. 11 shows detailed rela-tionships between remnants and the shell. Gross relationships arealso shown in fig. 5 herein and in figs. 9-11 of Austin (1963).
A similar process of preferential leaching of sodium and sub-stitution of potassium is believed to have formed an outer, morepotassic layer on detrital sanidine grains. The outer layer is con-verted from sanidine to low microcline, the most stable potassicfeldspar at low temperatures. This might be termed micrometa-somatism.
Petrovic and others (1976), in their experimental dissolution ofalkali feldspar, find a " . . . hint of enrichment of the surfacelayers in potassium during dissolution at pH 6 not only . . .chemically implausible, but . . . not statistically significant."However, in view of the apparent depletion in sodium and theconcomitant enrichment in potassium of the sanidine shells innature, the hint of enrichment of a surface layer in potassium ap-pears not only plausible but also statistically significant. Theobservations of Petrovic and others tend therefore to cor-roborate the chemical changes postulated for sanidine shell for-mation, even though their conclusions do not. In addition,Helgeson and others (1978) found that potassium may exchangefor sodium in the feldspar crystal lattice with little or no ac-companying change in order among aluminum ami silicon sites.In others words, the exchange of potassium for sodium requireslittle or no change in crystal structure.
Following deposition, the solutions permeating the host sand-stones became different from those with which the sanidine wasin contact during weathering, transport, and/or early burial.Although sanidine is soluble in these later solutions, the detritalgrains are protected by a layer of relatively more stable lowmicrocline.
Microcline is soluble under sufficient pressure, as evidenced bythe occasional indentions in detrital microcline grains wherequartz has been pressed into them. During compaction of theMorrison, adjacent grains may exert enough pressure on theouter, low microclinc layer to cause dissolution at such points.
Such solution-penetration of microcline-armored sanidine is wellillustrated in Mem. 15 (Austin, 1963, fig. 11). An extreme case ofpenetration of a former detrital grain is shown in fig. 12, whichalso shows the incursion of a partially dissolved plagioclase grain(right) and a volcanic rock fragment (left) into the space formerlyoccupied by the sanidine grain.
Once the microcline layer has been penetrated, the interiorsanidine, a high-temperature phase unstable at low temperatures,is readily soluble. Solution is largely guided by crystallographicdirections or perhaps by slight differences in composition asreported by Miller (1955). The resulting shells may be empty ormay contain sliver-like or castellated remnants, or the sanidinemay be only slightly dissolved near pressure points.
Some sanidine shows no signs of dissolution, but such grainsare entirely unremarkable and difficult to recognize in handspecimen, even with the aid of the stereoscopic microscope.Slightly dissolved grains, such as those in figs. 10 and 11 ofAustin (1963), may even be mistaken for unaffected grains inthin section if the plane of the section does not pass through adissolved portion. The proportions of partly dissolved and un-affected grains, then, are difficult to estimate.
The reason for the survival of an occasional unaffected grainamidst those partly dissolved is not known. However, protectionby surrounding grains from the transmission of the lithostatic orslight diastrophic pressure (necessary to press other grains intoan unaltered grain and thereby initiate solution of its more resist-ant shell) is an obvious mechanism for preserving sanidinegrains. There is no obvious explanation for the variations indegree of solution of grain interiors. Variation in chemical com-position within and among individual grains, crystallographicsite of initial pressure solution or relative time of initiation ofpressure solution may be involved.
Some volcanic rock fragments in the Poison Canyon Sand-stone contain partly dissolved sanidine crystals. Unlike thediscrete sanidine grains, however, no shell is present. Instead, thepink or gray aphanitic groundmass surrounding the formersanidine crystal is visible through the array of sliver-like sanidineremnants.
FIGURE 11—COLUMNAR SANIDINE REMNANTS ATTACHED TO INTERIOR OFSHELL, which is the surface of low relief at right (electron micrographby M. L. Dixon; length of bar abou' 6 pm).
FIGURE 12—THIN SECTION OF RIO DE ORO CORE,- calcite fills intersticesand supersedes sanidine; polycrystalline quariz above, volcanic rockfragment at left, and partly dissolved plagioclase at right penetrate shellin lower center (crossed polarizers, 64 x ; width of field about 1.4 mm).
[New Mexico Bureau of Mines & Mineral Resources, Memoir 38.1980]

113
AuthigenesisUntil the scanning-electron microscope became available,
authigenic feldspar had been identified from the Grants uraniumregion only as overgrowths on detrital feldspars (or sanidineshells, Austin, 1963, fig. 14, p. 42) from the Smith Lake (BlackJack) area, although Cadigan (1967) describes and illustratessimilar overgrowths from the Westwater Canyon Member out-side the region. Figs. 13 and 14 show an overgrowth on a detritalfeldspar grain from the ore zone of the Black Jack No. 1 deposit.Such overgrowths may or may not be in exact crystallographiccontinuity with the principal-component crystal of the detritalgrain as indicated by observed extinction positions. The cloudyappearance of the detrital grain, probably the result of pre-depositional alteration, contrasts strongly with the clearovergrowth (fig. 14).
The overgrowth on the sanidine shell from a barren zone (Aus-tin, 1963, fig. 14, p. 42) extends only outward from the formergrain surface, appearing to predate solution of the detrital grain.In figs. 13 and 14, organic material and ore minerals occur be-tween the grain and the overgrowth, indicating that the over-growths postdate ore. Rarely, on other grains, an overgrowth ispartly covered by ore, indicating deposition of organic materialeither prior to or penecontemporaneous with overgrowths onfeldspars.
Authigenic feldspars from outside the Smith Lake area werediscovered when an electron micrograph of a sanidine shell inbarren sandstone from Rio de Oro core was prepared. Within theshell is a minute euhedral feldspar crystal (figs. 10, 15). Riese andothers (1978, figs. 20, 21; this volume) present electron micro-graphs of authigenic feldspar from ore in an unspecified part ofthe Grants uranium region.
At temperatures postulated for the Morrison host rocks in theGrants uranium region, only the essentially pure sodic and potas-sic end-member alkali feldspars can crystallize. Because most ofthe overgrowths in the Smith Lake area are on, and nearly incrystallographic continuity with, potassic feldspar, they arepresumed to be low microcline, although albite overgrowths mayalso be present. Because of their minute size (=5 m), the com-position of the euhedral feldspar crystals within the shells has notbeen investigated, and Riese and others (1978) do not report thecomposition of authigenic feldspars.
Replacement versus supersedureLindgren (1933, p. 91) defines the term replacement as "the
process of practically simultaneous capillary solution and deposi-
FIGURE 14—THIN SUCTION OF ORU. BLACK JACK CORE (same field as fig.13); note clear authigenic overgrowth on cloudy, deirital feldspar grain(plane-polarized light; 100 x ; width of field about 0.9 mm).
tion by which a new mineral of partly or wholly differing com-position may grow in the body of an old mineral or mineralaggregate." Many investigators (Austin, 1963, fig. 5, p. 40;Cadigan, 1967) have used replacement to denote the occurrenceof one mineral in the space formerly occupied by another withoutevidence of contemporaneity of solution and deposition, when atime lapse between solution and deposition might be demon-strated. I now prefer the term supersedure in such instances.Criteria, some of which are demonstrated herein, are listed inAustin (1960) for distinguishing between the two processes; how-ever, because such distinction is often extremely difficult, morecriteria are needed.
Fig. 7 shows a partly dissolved plagioclase grain with calciteoccupying part of the space formerly occupied by feldspar as wellas the interstices between grains. A rodlike remnant of feldsparextends into the zone occupied by calcite. This remnant, with athicker attached portion within the main feldspar mass, is in-clined and has its twin lamellae inclined, to the main mass. Con-sidering the weak force of crystallization of calcite (Jackson,
FIGURE 13—THIN SECTION OF ORF. BLACK JACK CORE; perlhilic feldspar,
coated with ore (black), is overgrown by authigenic feldspar in calcilematrix (crossed polarizers, about 100 x ; width of field about 0.9 mm).
FIGURE 15—AUTHIGENIC FELDSPAR CRYSTAL RESTING ON INTERIORSURFACE OF SANIDINE SHELL (electron micrograph by M. L. Dixon-17,000 x ; width of field about 5.3 Mm).
[New Mexico Bureau of Mines & Mineral Resources, Memoir 38,1980]

114
1970), crystallizing calcite probably did not force the remnantinto its present position; either gravity or compaction must havetilted this remnant with respect to the rest of the grain when thecavity was empty, before calcite came in. Thus, calcite supersedesrather than replaces feldspar.
Fig. 16, a sketch made from a thin section not available forphotography, shows even more clear-cut evidence of supersedurerather than replacement of feldspar. A sanidine grain (S) in thecenter has been partly dissolved, leaving a remnant and partialshell. The shell is unbroken in the plane of the section but isbelieved to have been penetrated by pressure solution outside thisplane. Authigenic chlorite (Ch) has coated all surfaces availableafter partial solution of the sanidine, and it has coated both thedetrital and solution surfaces of the sanidine remnant, forming adouble coating that has covered both the inside and outside sur-faces of the sLell. Calcite (Cc) in crystallographic continuity hasfilled all available space, including the cavity in the sanidine, andhas poikilitically enclosed the detrital grains. The cavity musthave existed in the sanidine at the time chlorite was deposited, sothat both chlorite and later calcite must have superseded ratherthan replaced the sanidine.
Knox and Gruner (1957), on the other hand, report "corro-sion" and "replacement" of feldspars by calcite in the Grantsuranium region. In my experience, however, this is primarilysupersedure rather than true replacement. I believe that superse-dure is also the true relationship between calcite and feldsparin sandstone host rocks of uranium in other areas, although truemetasomatic replacement does occur sometimes. This conclusioncould apply as well to many Fluvial sandstones not known to con-tain uranium deposits.
Other minerals, especially pyrite, kaolinite, and anatase, some-times supersede detrital feldspars, especially sanidine. However,the presence of euhedral pyrite grains within relatively unalteredfeldspars as seen in thin and polished section indicates that pyritesometimes truly replaces feldspar.
Fig. 17 shows a partly dissolved feldspar grain containing cal-cite, kaolinite, and relict feldspar within its borders. The kaolin-ite is not believed to be a result of direct kaolinization of thefeldspar; it merely supersedes the feldspar, as does the calcite.Two generations of calcite may be present; the lower calcite por-tion of the grain appears to be polycrystalline, whereas the upper
FIGURE 16—SKETCH OF THIN SECTION containing quartz (Q), microcline(M), plagioclase (P), volcanic rock fragment (V), and sanidine shell andremnant (S) in calcite (Cc) matrix; chlorite (Ch) coats detrital grains,remnant, and both sides of shell.
; • * \
FIGURE 17—THIN SECTION OF ORE FROM RIO DE OKOCORE: partly dis-solved feldspar grain in calcite matrix is coated with ore and supersededby calcite, with light, high relief, and kaolinitc, mottled (crossedpolarizers; about 200 x ; width of field about 0.45 mm).
right-hand portion is part of one of two large crystals filling in-terstices between grains. All detrital grains, including the originalsurface of the partly dissolved grain, are coated with uraniferousorganic material probably containing coffinite. Since the organicmaterial does not coat remnants in the grain's interior and passesthrough the crystallographically continuous calcite, it must pre-date solution of the feldspar.
Riese and others (1978, p. 6) state " . . . potassium feldspargrains within (kaolinite) nests are fresh and show no signs of kao-linization." The true situation is, perhaps, more precisely statedby Kendall (1971, p. 96): "Feldspar and quartz clasts within thenests show no change in size, amount of etching, or alteration."Altered or partly dissolved feldspar grains are therefore presentin kaolinite nests but appear to be no more abundant than else-where, further evidence of supersedure rather than replacementby kaolinite.
Fig. 18 shows an incompletely dissolved plagioclase grain part-ly within a kaolinite nest and largely superseded by kaolinite.Evidence of supersedure rather than replacement includes the oc-currence of kaolinite outside grain boundaries and transection ofkaolinite by ore at the former grain boundary in the right-handportion of the figure. Kaolinite fills interstices to the upper rightand far outside the area shown; calcite fills most interstices to thelower left in the figure. The sequence is: 1) coating and localpenetration of plagioclase grain by organic material; 2) dissolu-tion of most of the remainder of the grain; and 3) supersedure bykaolinite. The relationship between calcite and kaolinite is notclear, and the time of mineralization of the organic material withuranium cannot be determined.
Adams and others (1978) report albitized rims on plagioclasefrom the Jackpile area. No plagioclases from that area are in-cluded in the present investigation, and no albitization is evidentin those examined from other areas. According to Adams andothers (1978), albitized feldspars appear to be associated withpervasive, finely crystalline kaolinite found in sediments im-mediately below the pre-Dakota weathering surface, whereaskaolinite in figs. 5,17,and 18 is of the coarsely crystalline varietytypical of nests some distance below this surface. No genetic rela-tionship between albitization and kaolinization is implied—onlyproximity. The upper part of the host rock in the Jackpile minehas evidently undergone more severe alteration than most Mor-rison host rocks in the region.
[New Mexico Bureau of Mines & Mineral Resources, Memoir38,1980]
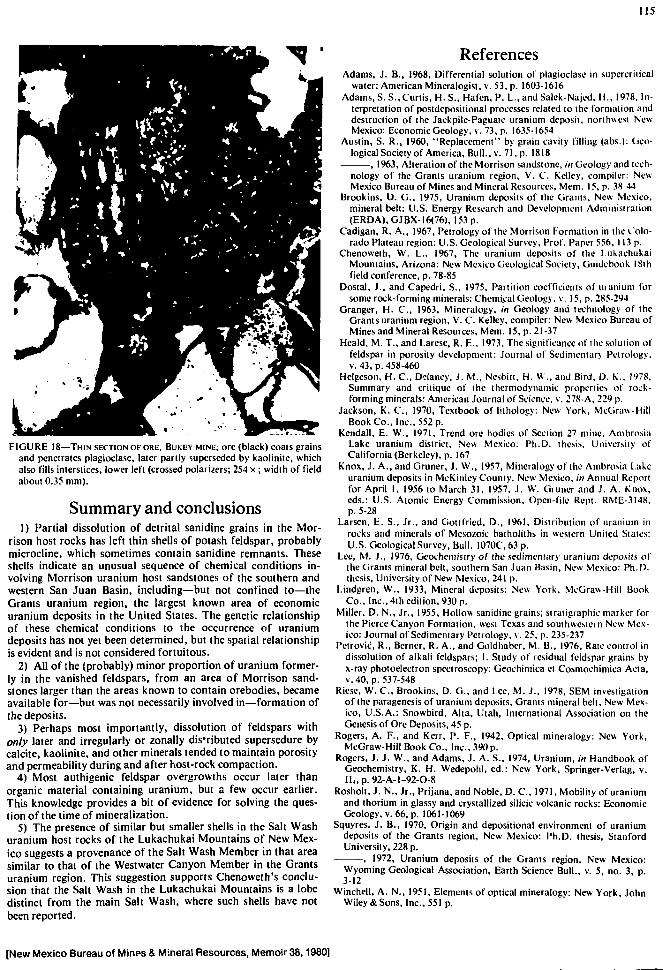
115
FIGURE 18—THIN SECTION OF ORE, BUKEY MINE; ore (black) coais grainsand penetrates plagioclase, later partly superseded by kaolinite, whichalso fills interstices, lower left (crossed polarizers; 254 x ; width of fieldabout 0.35 mm).
Summary and conclusions1) Partial dissolution of detrital sanidine grains in the Mor-
rison host rocks has left thin shells of potash feldspar, probablymicrocline, which sometimes contain sanidine remnants. Theseshells indicate an unusual sequence of chemical conditions in-volving Morrison uranium host sandstones of the southern andwestern San Juan Basin, including—but not confined to—theGrants uranium region, the largest known area of economicuranium deposits in the United States. The genetic relationshipof these chemical conditions to the occurrence of uraniumdeposits has not yet been determined, but the spatial relationshipis evident and is not considered fortuitous.
2) All of the (probably) minor proportion of uranium former-ly in the vanished feldspars, from an area of Morrison sand-stones larger than the areas known to contain orebodies, becameavailable for—but was not necessarily involved in—formation ofthe deposits.
3) Perhaps most importantly, dissolution of feldspars withonly later and irregularly or zonally distributed supersedure bycalcite, kaolinite, and other minerals tended to maintain porosityand permeability during and after host-rock compaction.
4) Most authigenic feldspar overgrowths occur later thanorganic material containing uranium, but a few occur earlier.This knowledge provides a bit of evidence for solving the ques-tion of the time of mineralization.
5) The presence of similar but smaller shells in the Salt Washuranium host rocks of the Lukachukai Mountains of New Mex-ico suggests a provenance of the Salt Wash Member in that areasimilar to that of the Westwater Canyon Member in the Grantsuranium region. This suggestion supports Chenoweth's conclu-sion that the Salt Wash in the Lukachukai Mountains is a lobedistinct from the main Salt Wash, where such shells have notbeen reported.
ReferencesAdams, J. B., 1968, Differential solution of plagioclase in supercritical
water: American Mineralogist, v. 53, p. 1603-1616Adams, S. S., Curtis, H. S., Hafen, P. L.,andSalek-Najcd, H., 1978, In-
terpretation of postdepositional processes related to the formation anddestruction of the Jackpile-Paguatc uranium deposit, northwest NewMexico: Economic Geology, v. 73, p. 1635-1654
Austin, S. R., I960, "Replacement" by grain cavity filling (abs.): Geo-logical Society of America, Bull., v. 71, p. 1818
, 1963, Alteration of the Morrison sandstone, in Geology and tech-nology of the Grants uranium region, V. C. Kelley, compiler: NewMexico Bureau of Mines and Mineral Resources, Mem. 15, p. 38-44
Brookins, O. G., 1975, Uranium deposits of the Grants, New Mexico,mineral belt: U.S. Energy Research and Development Administration(ERDA), GJBX-16(76), 153 p.
Cadigan, R. A., 1967, Petrology of the Morrison Formation in the Colo-rado Plateau region: U.S. Geological Survey, Prof. Paper 556, 113 p.
Chenoweth, W. L., 1967, The uranium deposits of the LukachukaiMountains, Arizona: New Mexico Geological Society, Guidebook 18thfield conference, p. 78-85
Dostal, J., and Capedri, S., 1975, Partition coefficients of uranium forsome rock-forming minerals: Chemical Geology, v. 15, p. 285-294
Granger, H. C , 1963, Mineralogy, in Geology and technology of theGrants uranium region, V. C. Kelley, compiler: New Mexico Bureau ofMines and Mineral Resources, Mem. 15, p. 21-37
Heald, M. T., and Larese, R. E., 1973, The significance of the solution offeldspar in porosity development: Journal of Sedimentary Petrology,v. 43,p. 458-460
Helgeson, H. C , Delaney, J. M., Nesbitt. H. VV., and Bird. D. K., 1978,Summary and critique of the thermodynamic properties of rock-forming minerals: American Journal of Science, v. 278-A, 229 p.
Jackson, K. C , 1970, Textbook of lithology: New York, McGraw-HillBook Co.. Inc., 552 p.
Kendall, E. W., 1971, Trend ore bodies of Section 27 mine. AmbrosiaLake uranium district, New Mexico: Ph.D. thesis. University ofCalifornia (Berkeley), p. 167
Knox, J. A., and Gruner, J. W., 1957, Mineralogy of the Ambrosia Lakeuranium deposits in McKinley County, New Mexico, in Annual Reportfor April I, 1956 to March 31, 1957, J. W. Gruner and J. A. Knox,eds.: U.S. Atomic Energy Commission, Open-file Rept. RME-3148,p. 5-28
Larsen, E. S., Jr., and Gottfried, D., 1961, Distribution of uranium inrocks and minerals of Mcsozoic balholiths in western United States:U.S. Geological Survey, Bull. 1070C, 63 p.
Lee, M. J., 1976, Geochemistry of the sedimentary uranium deposits ofthe Grants mineral bell, southern San Juan Basin, New Mexico: Ph.D.thesis, University of New Mexico, 241 p.
Lindgren, W., 1933, Mineral deposits: New York, McGraw-Hill BookCo., Inc., 4th edition, 930 p.
Miller, D. N., Jr., 1955, Hollow sanidine grains; slratigraphic marker lorthe Pierce Canyon Formation, west Texas and southwestern New Mex-ico: Journal of Sedimentary Petrology, v. 25, p. 235-237
Petrovk', R., Berner, R. A., and Goldhaber, M. B., 1976, Rate conirol indissolution of alkali feldspars; 1. Study of residual feldspar grains byx-ray photoelectron spectroscopy: Geochimica et Cosmochimica Ada,v. 40, p. 537-548
Riese, W. C , Brookins, D. G., and Lee, M. J., 1978, SEM investigationof the paragenesis of uranium deposits, Grants mineral bell. New Mex-ico, U.S.A.: Snowbird, Alta, Utah, International Association on theGenesis of Ore Deposits, 45 p.
Rogers, A. F., and Kerr, P. F., 1942, Optical mineralogy: New York,McGraw-Hill Book Co., Inc., 390p.
Rogers, J. J. W., and Adams, J. A. S., 1974, Uranium, in Handbook ofGeochemistry, K. H. Wedepohl, ed.: New York, Springer-Verlag, v.II,,p.92-A-l-92-O-8
Rosholt, J. N., Jr., Prijana, and Noble, D. C , 1971, Mobility of uraniumand thorium in glassy and crystallized silicic volcanic rocks: EconomicGeology, v. 66, p. 1061-1069
Squyres, J. B., 1970, Origin and depositional environment of uraniumdeposits of the Grants region. New Mexico: Ph.D. thesis, StanfordUniversity, 228 p.
, 1972, Uranium deposits of the Grants region. New Mexico:Wyoming Geological Association, Earth Science Bull., v. 5, no. 3, p.3-12
Winchell, A. N., 1951, Elements of optical mineralogy: New York, JohnWiley*Sons, Inc., 551 p.
[New Mexico Bureau of Mines & Mineral Resources, Memoir38,1980]

116
TERTIARY OXIDATION IN WESTWATER CANYONMEMBER OF MORRISON FORMATION
by A. E. Saucier, Consultant. P.O. Box827, CedarCrest, New Mexico 87008
AbstractHematitic oxidation in the Westwater Canyon Sandstone
Member of the Morrison Formation extends along the outcropfrom the Pipeline fault northeast of Gallup, New Mexico, to theSan Mateo fault north of Grants, New Mexico. The hematiticsandstone forms a broad lobe in the subsurface to a depth of2,400 ft (730 m). The downdip edge of this sandstone arcs east-ward from northeast Church Rock through Crownpoint, andsoutheastward to the west edge of the Ambrosia Lake district.The red sandstone is bordered on the downdip side by a band oflimonitic oxidation, which interfingers with reduced sandstonesbasinward. The limonitic oxidation forms a relatively narrowband along the north and west sides of the hematitic lobe but ex-pands progressively in an east and southeast direction. Weaklimonitic oxidation, as indicated by the absence of pyrite and bya bleached to faint yellowish-gray color, appears to extend fromthe San Mateo fault eastward under Mount Taylor to the RioPuerco of the east. The hematitic oxidation is epigenetic and isbelieved to be of early Miocene to late Pliocene age. The limon-itic oxidation follows the present ground-water flow pattern andprobably dates from late Pliocene to the Holocene. The oxida-tion patterns are important in uranium exploration because thehematitic area is essentially barren, whereas the limonitic areascontain ore deposits that are in the process of being destroyed byoxidation.
IntroductionExploration geologists working in the Grants uranium region
have identified and attempted to map a broad lobe of hematiticsandstone within the Westwater Canyon Member of the Mor-rison Formation on the gently dipping south flank of the SanJuan Basin. The oxidized sandstone covers a large area of theChaco slope extending from Gallup to Grants, New Mexico, andfrom the outcrop north of 1-40 to Crownpoint, New Mexico, 15mi (24 km) downdip. The general location and geography of thisarea is shown in fig. I. Only a few uranium orebodies have beendiscovered in the main body of the Westwater Canyon Sandstonewithin this oxidized area. Numerous discoveries, however, havebeen made on the periphery of the hematitic sandstone, and thishas encouraged many workers to compare the mineralization inthis area to the Wyoming roll-type deposits. This paper describesthis economically important feature and speculates on its age andorigin. Evidence included will support the conclusions that theoxidation is epigenetic and of middle Tertiary age. With regardto uranium accumulation, evidence provided will also show thatthe oxidation front has been destructive in character—in contrastto the Wyoming oxidation fronts, which were constructive.
ACKNOWLEDGMENTS—I have benefited from discussions withmany of the geologists working in this area, particularly HarlenHolen of the U.S. Department of Energy, Dave Wentworth ofConoco, George Hazlett of United Nuclear Corporation, RustyRiese of Gulf Oil, Jacques Bauer of Aquitaine, Stan Harrison ofExxon, Andy Livingston of Bokum, Forrest Lyford of the U.S.Geological Survey, and many others. However, 1 must accept fullresponsibility for the conclusion presented.
GeologyStratigraphy
The Westwater Canyon Member of the Morrison Formationcan be recognized throughout the San Juan Basin (Craig andothers, 1955). This member is interpreted to be a large subaerialfan of clastic material that spread northeastward across a broad
synclinal area between the Mogollon and Uncompahgre uplifts inthe Late Jurassic. The area of provenance, as determined fromfacies distribution and paleocurrent data, was the Mogollonuplift in south-central Arizona. The Westwater Canyon Sand-stone intertongues to the east and northeast with mudstones ofthe overlying Brushy Basin Member. The thickness of recogniz-able Westwater Canyon Member ranges from about 50 ft (15 m)along the distal edges of the fan to over 300 ft (90 m) in the moreproximal areas, north of Gallup, New Mexico (fig. 2). Southwestof Gallup, the Westwater Canyon Member thins rapidly to apinchout resulting from pre-Dakota erosional truncation(Saucier, 1967). The line of truncation can be projected toGrants, where the Westwater Canyon is overlapped by theBrushy Basin Member. Southeast of Grants, the Westwater Can-yon thins depositionally to zero beneath the Brushy BasinMember (fig. 2). Neither the Westwater Canyon nor the BrushyBasin Member is preserved on the south side of the Zuni uplift.
This paper is concerned with the color of the Westwater Can-yon sandstones; this color is principally determined by the oxida-tion state of iron minerals. In most exposures around the SanJuan Basin the Westwater Canyon is generally limonitic yellowor yellowish gray with only minor areas of hematitic-red colora-tion. Between Gallup and Grants, however, the Westwater Can-yon is almost entirely red. The term red refers here to a variety ofcolors, ranging from light pink through reddish brown to reddishorange. These colors are due to hematite, as opposed to thebrown, yellow, and orange colors of limonite. The most complexcolor patterns are found at Gallup where the sandstones graderapidly from red, to pink, to yellowish gray, and to bleachedwhite in the outcrops. The white color appears to be the result ofiron leaching and the alteration of feldspars to kaolin, which wascaused by organic acids during the Early Cretaceous; at that timethe overlying Brushy Basin Member was removed, and the West-water Canyon Member was exposed to weathering in the vicinityof Gallup.
The original color of the Westwater Canyon Member is a mat-ter of question. Sharpe (1955) concluded that the Westwater Can-yon was originally red. Squyres (1970) and others also supportedthis idea and argued that the red sandstones were diageneticallyreduced. Austin (1963) concluded that two periods of alterationare evident in the Westwater Canyon: an early one under reduc-ing conditions that destroyed magnetite and ilmenite and a laterone that oxidized the sandstones. Certainly the original sandysediment was oxidized during transport and initial deposition.The sediment probably was light brown, but it was reduced veryshortly after deposition by HiS derived from decaying vegetalmatter, which appears to have been moderately abundant in thechannel deposits. Therefore, except in the more distal portions ofthe fan where conditions may have been drier and organic matterless abundant, the Westwater Canyon Member was probably re-duced to a pyritic, gray sandstone contemporaneous with deposi-tion. According to Sears and others (1974), magnetite and ilmen-ite are preserved farther out in the basin where postdepositionalconditions were less reducing (fig. 2). The Westwater Canyon inthe southern San Juan Basin was almost certainly reduced andgray in color after burial. The yellow and red of the oxidizedsandstones observed on the outcrop today are not the originalcolors.
Distribution of oxidationin the Westwater Canyon Member
The general distribution of hematite-stained sandstones in theWestwater Canyon Member on the Chaco slope is shown in fig.
[New Mexico Bureau of Mines & Mineral Resources, Memoir 38,1980]

25'
a
oCO
<D
o*
0900
MORRISON OUTCROP
MOUNT TAYLOR VOLCANICS
FIGURE I—INDKX MAP OF THE GRANTS LRANILM REOION SHOWING THI OI K'ROP OP THE MORRISON FORMATION. MOIST TAYIORVOLCANICS. AND Ml SING DISTRICTS.

118
SAN JUANUPLIFT
^ ^ = 3 . I X COIOIIAOO
VJ^\
••;•:;;: GREATER THAN BOO FEET OF'•£$'}• NET SANDSTONE (after Gallowoy. 1971)
\»6S.78 f >
L-,
FIGURE 2—MAPOI- i m Wis r\\ ATI.R CANYON SUBAERIAI. FAN SHOWING THE DEPOSITIONAI. AND EROSIONAI. EDGES IN NEW MEXICO AND THEMAJOR M.UVIAI. TKi-.Nixs IN n i t MEMBER. The solid arrows indicate the main passageways for ground-water movement in Late Jurassicand Early Cretaceous time (modified from Craig and others, 1955; Saucier, 1967; and Galloway, 1972).
3. Surface mapping and drill cuttings confirm that the irregularboundary of red sandstone arcs eastward from the Church Rockmines to the village of Crownpoint and continues easterly andsoutheasterly to Ambrosia dome. The red-colored WestwaterCanyon borders the south side of the Ambrosia Lake miningdistrict and ends along the San Mateo fault. The hematitic oxida-tion extends up to 15 mi (24 km) downdip from the outcrop to amaximum depth of 2,000-2,400 ft (600-730 m) below the surface.In the vicinity of Crownpoint, the lower distal edge of the red-colored sandstones may be up to 1,700 ft (520 m) below the staticwater level. The oxidation has penetrated farther downdip in thelower half of the Westwater Canyon than in the upper half be-cause the lower sandstones are more transrnissive.
The red sandstones are bordered on the downdip side by aband of limonitic sandstone that separates the hematitic unitsfrom the reduced gray sandstones. This interfingering transitionzone occurs over a width of one to several miles (fig. 3). A hole
drilled in this zone may penetrate red, yellow, and gray intervalsin the Westwater Canyon. The limonitic oxidation products arealmost always intermediate between red and gray rock in thesame horizon. North of Ambrosia dome, the yellow transitionzone is expanded in width to the northeast. Also, east of the SanMateo fault, the Westwater Canyon is believed to be faintlylimonitic as far as the village of San Mateo, and probably evenfarther to the east. Southeast of the village of Marquez, theWestwater Canyon Sandstone is reported to be weakly oxidized(Lynn Jacobsen, personal communication, 1978), and this weakoxidation is suspected to extend as far north as Marquez. Mildlyoxidized sandstones can be traced across the San lgnacio faultedmonocline and into the north half of the Bernabe MontanoGrant. Weakly oxidizing ground waters appear to be movingdowndip to the southeast across the northern Bernabe MontanoGrant at the present time. This oxidation is difficult to detect onthe basis of color alone. The sandstones are a light yellowish gray
[New Mexico Bureau of Mines & Mineral Resources, Memoir38,1980]

119
l _EXPLANATION
| C^> Groundwoter Flow Directions I| Illlllllll GfOundwater Discharge-Morrison Fm.I "^ Stylized Uranium DepositsI **"•* Border of hemoliiic SandstonesI *"*""" Border of Limonit'C Sandstones
J 0 P.pelme FauM Zone' H Ambrosia DomeI E San Moteo FaultI [3 UcCartys SynclineI B San Ignacio ArchI B Bernabc Montano GrantI 0 Blackjack No I
I
FIGURE 3—MAP SHOWINC; THL DISTRIBUTION OK LATU TLRTIARY OXIDATION IN IHL WLSTWATI-R CANVON MI-MBI KOI I HI MORRISON FOR-MATION. GRANTS URANIUM RKHON.
10 20mi
and either are devoid of pyrite or contain only coarse grains oftarnished and corroded pyrite. The San Mateo and Marquezareas of weak oxidation are assumed to be connected under theMount Taylor volcanics. Unlike the hematitic oxidation bound-ary, which is fairly well defined, the boundaries of this weaklimonitic oxidation are indefinite.
StructureThe pattern of hematitic oxidation (fig. 3) suggests that struc-
ture is an important control on the distribution of oxidation inthe Westwater Canyon Sandstone. The Pipeline fracture zonenortheast of Gallup appears to have retarded the northwesterlymigration of oxidizing ground waters. North of the NavajoReservation boundary, the Pipeline fracture zone is intersectedby a northwest-trending fracture zone; in this area the oxidationhas progressed farther downdip to the northwest.
To the east, the hematitic oxidation abuts north-trendingfaults on the west side of Ambrosia dome. The oxidation patternextends around the faults to the south and then eastward, whereit stops against the San Mateo fault. The main San Mateo frac-ture was apparently permeable; oxidation has penetrated fartherdowndip along this fault. The relationship among color, uraniumdeposits, and fractured areas was noted by Konigsmark in 1955.
Small folds do not appear to have influenced the movement ofoxidizing ground waters in the southern San Juan Basin. Theweak limonitic oxidation, as projected eastward from the villageof San Mateo to Marquez, crosses the McCartys syncline andcontinues east across the San Ignacio arch. Large-scale structuraldomes and arches, such as the Zuni uplift, were important increating recharge areas with a high potential ground-water head.The pattern of hematitic oxidation appears to be clearly relatedto the Zuni uplift. The pattern is symmetrical with respect to theContinental Divide on the north flank of the uplift, which in-
dicates that recharge of the Westwater Canyon has been evenlydistributed along the outcrop belt. The present Zuni iplift is aLaramide structure and, therefore, the oxygenated groundwaters must have entered the exposed Westwatcr Canyon sand-stones since the uplift, making the oxidation post-Laramide inage. Areas of red Westwater Canyon elsewhere around the basinalso appear to be associated closely witli early Tertjjry uplifts.
Economic geologyAn important control on the distribution of oxidation in the
Westwater Canyon Member is the organic-rich uranium ore-bodies themselves. Southwest of Crownpoint, hematitic oxida-tion has almost surrounded the remnants of an older primary-oretrend (fig. 3). Northwest-trending, primary, blanket ore in thistrend is being oxidized and redistributed by encroaching oxida-tion from the south. The redistributed mineralization formsstack ore, which often closely resembles the geometry of Wyo-ming roll-type mineralization. The essential difference is that inWyoming the oxidation front is considered responsible for theoriginal accumulation of uranium, whereas in the Grants ura-nium region, the oxidation front is dissolving and dispersingpreexisting orebodies. No significant amount of new uranium isbeing added from an external source, and large segments of theoxidation front are totally barren. The redistribution is believedto be inefficient and to result in the gradual loss of uranium, sothat, given enough time, the preexisting primary ores will becompletely destroyed. Some of the remobilized uranium has pos-sibly enriched primary orebodies farther downdip in the West-water Canyon. In dissolving the preexisting ore, the oxidationfront is held back or slowed in its advance; therefore, ore isgenerally found on the reentrant or updip portions of the oxida-tion front, rather than along the salient tongues of oxidation as isthe case in Wyoming.
[New Mexico Bureau of Mines & Mineral Resources, Memoir 38,1980]

120
Primary-ore trends are believed to have once extended acrossthe oxidized area from Ambrosia Lake to Church Rock. TheBlackjack No. 1 mine may be considered a remnant of one ofthese original primary trends. Its preservation has been due to afavorable sandstone-to-mudstone ratio, abundant calcite ce-ment, and possibly because of faulting, which may have retardedground-water circulation in this area. Some of the vast amountof uranium that may have been removed from this area couldhave been transported along the transmissive zones in the West-water Canyon to the east and west, where it would have enrichedthe Ambrosia Lake deposits and perhaps formed the ChurchRock orebody. If so, the high-grade deposits at Ambrosia Lakemay be a poor analog for unenriched primary deposits farther inthe basin.
The southern Ambrosia Lake orebodies are now in the processof being oxidized. According to Squyres (1970), minor amountsof redistributed ore are present around almost every primaryorebody in Ambrosia Lake, even at distances of several milesfrom visibly oxidized sandstones. Granger (1963) has foundabout 20 percent deficiency in uranium relative to protactinium(Pa"') in ores of Ambrosia Lake, which indicates that thepresently measurable loss of uranium could not have occurredmore than about 300,000 years ago (Granger and others, 1961);therefore, the oxidation fronts are still moving, and the redis-tribution of uranium is an ongoing process.
Red-bed problemThe oxidation of the Westwater Canyon Member has a bearing
on the red-bed problem, which is still a controversy. The originalbelief was that red sediments were produced in wet, tropicalsource areas or in desert basins, and that they retained their redcolor after burial. The red color was thus thought to be indicativeof a hot climate. The red color is now recognized as eitherprimary or diagenetic. Hematite forms from the dehydration oforiginal limonite (goethite) in the sediment (Van Houten, 1968)or from the oxidation of iron silicates, which form the yellowamorphous goethite; upon aging or exposure to elevaied tem-peratures, the goethite crystallizes to the more stable hematite(Walker, 1967). Berner (1969) has shown that finely dividedlimonitic goethite is thermodynamically unstable, relative tohematite plus water, undei almost all geological conditions.Early hydrous iron oxide has been named ferrihydrite byChukhrov (1973). He suggests that ferrihydrite forms by the ac-celerated oxidation caused by bacteria. The ferrihydrite isunstable, and in time it spontaneously alters to hematite.Whatever the explanation, limonitic yellow is generally believedto be younger than the hematiiic red in the same sandstone. Thisempirical color relationship has been long recognized amonguranium geologists (Vickers, 1957) and has been used widely as acolor guide to ore in Wyoming (Adler, 1970). The importantpoint is that in the Grants uranium region, the hematitic-redareas can be considered the earliest areas that were oxidized,whereas the limonitic-yellow sandstones are the latest that wereoxidized.
Permeability and organic content of the sediment are two ofthe most important factors determining the rates of oxidation. Inhighly organic sandstones (that is, sandstones containing morethan 0.30 percent organic matter), the rate of oxidation is so slowthat deep penetration of the sandstone beds is rare. Consequent-ly, the Cretaceous beds are usually brown or yellowish on theoutcrop. The rate of erosion is about equal to the rate of oxygenpenetration, with the result that nothing but the young limoniticstage is ever observed on the outcrop. In a highly permeablesandstone with a low organic content, such as the Entrada Sand-stone (Jurassic), oxidation can move rapidly downdip. This oxi-dation has produced the dark-red color that can be observed inthe Entrada between Gallup and Grants. A yellowish-white coloris present locally in the top of the Entrada Sandstone. This coloris probably caused by a higher original organic content in theupper Entrada, where it is overlain by the carbonaceous Todilto
Limestone. The sandstone most enriched in organic matter is thelast to be oxidized. The Westwater Canyon Sandstone is inter-mediate between the highly organic Cretaceous beds and the low-organic, easily oxidized Entrada Sandstone.
Walker (1967) estimated that the crystallization of hematitefrom amorphous hydrated ferric oxides may take hundreds ofthousands to several million years. The hematite staining in theWestwater Canyon between Gallup and Grants appears to beyounger than the Pipeline and San Mateo faults, which are ofearly Tertiary age. This staining places a lower age limit on theoxidation, and it also means that the oxidation is epigenetic inorigin. An upper age limit may be set by considering the probablelate Tertiary ground-water flow patterns in the San Juan Basin.
Tertiary ground-water flow patternsThe Westwater Canyon Member on the north flank of the Zuni
uplift was exposed to ground-water recharge at least as far backas the early Eocene. During this time the ancestral San JuanRiver and other surface drainages in the basin are believed tohave flowed south (Hunt, 1956). Granite from the core of theZuni Mountains has been found in the coarse stream gravels ofthe Baca Formation (middle Eocene) about 55 mi (88 km) southof Grants (Snyder, 1971). The Jurassic rocks around the risingZuni uplift may have been discharging ground water at this time,because the San Juan and Brazos uplifts north of the basin wereprobably topographically higher areas of recharge in the earlyTertiary. In the early Oligocene, voluminous acid to intermediatevolcanic rocks were erupted east and south of the San JuanBasin. These volcanic piles may have blocked the earlier Eocenedrainages and forced the San Juan River to seek another outlet.Whatever the cause, the San Juan River is postulated to have in-cised its present course across the Four Corners area in the earlyMiocene. According to Berry (1959), this process initiated thenortherly gravitational hydrodynamic flow in the WestwaterCanyon sandstones. The pattern of red, oxidized WestwaterCanyon sandstones on the Chaco slope appears to be related tothis early northward ground-water movement toward the SanJuan River.
The San Juan River was probably the only ground-water outletfor Jurassic sandstones until late Pliocene or Pleistocene time,when two new outlets were formed by the Rio Puerco Rivers ofthe east and west. These two streams dissect an old erosion sur-face, which was named the Zuni surface by McCann (1938). TheMount Taylor volcanics were deposited on this very old surfaceof low relief. The Mount Taylor volcanics have been dated atabout 3 m.y. by Bassett and others (1963), which makes them oflate Pliocene age. Since these volcanics were erupted, erosion hasdissected this ancient surface and has developed a topographicrelief of 1,500 ft (460 m) or more. This deep, post-Pliocene ero-sion along the east and west Rio Puerco Rivers has exposed theJurassic sandstones at sufficiently low elevations to create newdischarge ar^as.
At present, vater enters the Westwater Canyon Sandstone onthe Continental Divide at an elevation of about 7,600 ft (2,300m). From the Continental Divide the waters flow north to theSan Juan River, where outlets exist below 5,000 ft (1,500 m). Thewater can also now move west and southwest to discharge atManuelito at an elevation of about 6,500 ft (1,970 m), or it canmove eastward toward the Rio Puerco of the east, with exposedWestwater Canyon deposits at 5,580 ft (1,690 m). East of theContinental Divide, most of the ground water probably followsthe highly transmissive paleochannel system in the WestwaterCanyon southeast toward the Rio Puerco. The pattern of weaklimonitic oxidation east of San Mateo and the 1,200-2,000 ft(370-600 m) of head make this route very plausible. These weaklyoxidizing ground waters cross the mineral trend southeast ofMarquez (fig. 3), and the water is diverted around the north endof the San Ignacio arch. The waters eventually find their way tothe Rio Grande, either by way of the Rio Puerco, or by movingdowndip to the southeast across the Bernabe Montano Grant.
[New Mexico Bureau of Mines & Mineral Resources, Memoir 38,1980]

121
The present ground-water flow to the east under Mount Taylor isprobably no older than late Pliocene and is possibly muchyounger.
ConclusionsOxidation of the Westwater Canyon Sandstone Member in the
southern San Juan Basin is epigenetic and is believed to havebegun when the San Juan River created a basin outlet to thenorthwest in the late Oligocene or early Miocene. This late Ter-tiary oxidation has formed two distinct color patterns on theChaco slope. The reddish, hematitic oxidation is the older anddates from at least early Miocene to late Pliocene. The yellowish,limonitic oxidation is younger and appears to be late Pliocene toHolocene. The early oxidizing ground waters moved northwardtoward the San Juan River outlet. Since late Pliocene time,ground-water outlets have developed on both the southeast andsouthwest corners of the basin. East of the present ContinentalDivide, much of the ground water in the Westwater CanyonMember appears to be migrating eastward toward the RioGrande.
The late Tertiary oxidation in the Westwater Canyon has hadnothing to do with the original accumulation of uranium in theGrants uranium region. The oxidation has, however, been anagent in the destruction of a large part ol the projected mineraltrend. The young limonitic oxidation is presently dissolving someof the existing ore deposits. The late Tertiary oxidation hasredistributed some preexisting ore deposits to form secondary ac-cumulations that resemble, in some respects, the roll-frontmineralization in Wyoming. Fractured areas appear to haveretarded ground-water movement and may have aided in thepreservation of the primary ores.
Red-colored sandstones are neither reliable paleoclimatie in-dicators nor diagnostic of uranium mineralization. Anomalousepigenetic hematite staining in otherwise limonitic, porous sand-stones marks locations along basin margins where ground waterfirst entered the basins. The hematitic sandstones can be used asa guide to the earlier, and generally more extensive, subsurfaceoxidation.
ReferencesAdler, H. H., 1970, Interpretation of color relations in sandstone as a
guide to uranium exploration and ore genesis, in Uranium explorationgeology: Vienna, International Atomic Energy Agency, Proc , p.331-344
Austin, S. R., 1963, Alteration of Morrison sandstone, in Geology andtechnology of the Grants uranium region, V. C. Kelley, compiler: NewMexico Bureau of Mines and Mineral Resources, Mem. 15, p. 38-44
Bassett, W. A., Kerr, P. F., Schaeffer, O. A., and Stoenner, R. W., 1963,Potassium-argon ages of volcanic rocks north of Grants, in Geologyand technology of the Grants uranium region, V. C. Kelley, compiler:New Mexico Bureau of Mines and Mineral Resources, Mem. 15, p.214-216
Berner, R. A., 1969, Goethite stability and the origin of red beds: Gco-chimica et Cosmochimica Acta, v. 33, p. 267-273
Berry, F. A., 1959, Hydrodynamics and geochemistry of the Jurassic andCretaceous systems in the San Juan Basin, northwestern New Mexicoand southwestern Colorado: Ph.D. thesis, Stanford Univeristy, 192 p.
Chukhrov, F. V., 1973, On mineralogical and geochcmical criteria in thegenesis of red beds: Chemical Geology, v. 12, no. 1, p. 67-75
Craig, L. C , and others, 1955, Stratigraphy of the Morrison and relatedformations, Colorado Plateau region, a preliminary report: U.S. Geo-logical Survey, Bull. 1009-E, p. 125-168
Galloway, W. E., 1972, Stratigraphy of the Westwater Canyon alluvialfan system (Morrison Formation)—relationships to uranium mineral-ization: unpublished Conoco Tech. Repl., 10 p.
Granger, H. C , 1963, Radium migration and its effect on the apparentage of uranium deposits at Ambrosia Lake, New Mexico: U.S. Geolog-ical Survey, Prof. Paper 475-B, p. B60-B53
Granger, H. C , Santos, E. S., Dean, B. G., and Moore, F. B., 1961,Sandstone-type uranium deposits at Ambrosia Lake, New Mexico—aninterim report: Economic Geology, v. 56, no. 7, p. 1179-1210
Hunt, C. B., 1956, Cenozoic geology of the Colorado Plateau: U.S. Geo-logical Survey, Prof. Paper 279, 99 p.
Konigsmark T. A., 1955, Color changes and uranium deposit!, of the up-per Morrison Formation, northeast flank of theZuni uplift, New Mex-ico: U.S. Atomic Energy Commission, RME-76, pi. I,114 p.
McCann, F. T., 1938, Ancient erosion surface in the Gallup-Zuni area.New Mexico: American Journal of Science, v. 36, no. 214, p. 260-278
Saucier, A. E., 1967, The Morrison Formation in the Gallup Region: NewMexico Geological Society, Guidebook 18ih field conference, p.138-144
Sears, R. S., Marjaniemi, D. K., and Blomquist, J. T., 1974, A study ofthe Morrison Formation in the San Juan Basin, New Mexico and Colo-rado: Grand Junction, Colorado, Lucius Pitkin, Inc. and U.S. AtomicEnergy Commission, Geology Division, GJO-912-20, 102 p.
Sharpe, J. W. A., 1955, Uranium deposits in the Morrison Formation,Church Rock area, McKinley County, New Mexico: U.S. Atomic En-ergy Commission, RME-79, 19 p.
Snyder, D. O., 1971, Stratigraphic analysis of the Baca Formalion, wesl-central New Mexico: Ph. D. thesis, University of New Mexico, 160 p.
Squyres, J. B., 1970, Origin and depositional environment of uraniumdeposits of the Grants region, New Mexico: Ph.D. thesis, StanfordUniversity, 228 p.
Van Houten, F. B., 1968, Iron oxides in red beds: Geological Society ofAmerica, Bull., v. 79, no. 4, p. 399-416
Vickcrs, R. C , 1957, Alteration of sandstone as a guide to uraniumdeposits and their origin, northern Black Hills, South Dakota: Eco-nomic Geology, v. 52, no. 6, p. 599-611
Walker, T. R., 1967, Formation of red beds in modern and ancientdeserts: Geological Society of America, Bull., v. 78, no. 3, p. 353-368
[New Mexico Bureau of Mines & Mineral Resources, Memoir38,1980]

122
DEPOSITIONAL ENVIRONMENTS AS ORE CONTROLSIN SALT WASH MEMBER, MORRISON FORMATION(UPPER JURASSIC), CARRIZO MOUNTAINS AREA,
ARIZONA AND NEW MEXICOby A. Curtis Huffman, Jr., U.S. Geological Survey, Federal Center, Denver, Colorado 80225,
Allan R. Kirk, U.S. Geological Survey, Federal Center, Denver, Colorado 80225, andR. James Corken, Department of Geology, Northern Arizona University, Flagstaff, Arizona 86001
AbstractUranium deposits in the Salt Wash Member of the Morrison
Formation in the Carrizo Mountains area are closely related todepositional facies. In the vicinity of the Eastside mines, south-eastern Carrizo Mountains, the Salt Wash Member consists of alower part, 30-50 ft (9-15 m) thick, and an upper part, 180-200 ft(55-60 m) thick, which is further divisible into two stratigraphicunits. The lower part or distal-fan facies is predominantlymudstone and silty sandstone interpreted as overbank and par-tially abandoned channel-fill deposits. This part also contains afew large, lenticular, channel sandstones deposited by braidedand possibly meandering streams. Uranium deposits are uncom-mon in the lower part. The upper part or mid fan facies of theSalt Wash contains a much greater percentage of braided-stream-deposited channel sandstones, many of which coalesce to formprominent continuous ledges. Fine-grained low-energy depositsare limited in extent; they are commonly less than 600 ft (200 m)long, 60 ft (20 m) wide, and 6 ft (2 m) thick, with a lenticularcross section and a scoured base. These deposits consist of in-terbedded mudstones, claystones, and sandstones and are inter-preted as abandoned and partially abandoned channel fills.Scouring of these beds resulted in clay-clast conglomerates thatwere incorporated as lag deposits in the bases of overlying chan-nel sandstones. Detrital organic debris is present in somechannel-lag deposits and in some of the bedded mudstones andparallel-bedded sandstones. Uranium deposits in the CarrizoMountains area are associated with channel-sandstone systemsthat have scoured into abandoned and partially abandonedchannel-fill deposits in the lower midfan facies of the Sale Wash.
IntroductionMore than 0.5 million pounds of U(O» and 4.5 million pounds
of V2O, have been produced from the Morrison Formation (Up-per Jurassic) in the Carrizo Mountains area along the north-western rim of the San Juan Basin (fig. I). All production hasbeen from the Salt Wash Member, which is the lowermost offour members that compose the 820-ft (250-m) thick MorrisonFormation in this area.
The Salt Wash Member was described by Craig and others(1955) as an alluvial fan, with an apex in west-central Arizonaand southeastern California (fig. 2). Mullens and Freeman(1957), although agreeing with most of the conclusions of Craigand others (1955), relocated the apex in south-centra! Utah andrelated the uranium-vanadium deposits to transmissivity within asandstone-mudstone lithofacies. Galloway (1978) interpreted theSalt Wash as a wet alluvial-fan system, with the primary mineral-ization occurring in the midfan facies.
In the area studied, the Salt Wash is approximately 230 ft (70m) of interbedded sandstone and mudstone. Sandstones, whichmake up about 70 percent of the section, are fine grained, mod-erately sorted to moderately well sorted shale litharenite andchert arenite (fig. 3). The sandstones are generally light greenishgray but may vary from yellowish gray to pinkish orange. Mud-stones are silty and are commonly mottled with shades of reddishbrown and pale green. The base of the SJt Wash is generally
scoured into the top of the Bluff Sandstone and is marked by athin granule to pebble conglomerate, whereas the top is grada-tional with the Recapture Member of the Morrison.
Northward from the Carrizo Mountains area, the Salt Washthins over the thickening Bluff Sandstone. Eastward, in thedirection of sediment transport, it decreases in sandstone contentand thins into the San Juan Basin. To the south it intertongueswith the Recapture Member and disappears entirely within a dis-tance of about 30 mi (45 km).
The importance of sedimentology in evaluating the uraniumand vanadium potential of the Salt Wash has long been recog-nized. Favor ability criteria such as sandstone/mudstone ratio,total thickness, percent stream deposits, color, accumulations ofcarbonized organic material, and paleotransport directions havebeen used since the earliest days of uranium exploration. Usingcombinations of these criteria, large areas of generally favorablerock have been delimited (Fischer and Hilpert, 1952; Stokes andothers, 1953; Stokes, 1954; Craig and others, 1955; Masters,1955; Mullens and Freeman, 1957; Motica, 1968). The objectivesof this study were to define the depositional environments withinone of these large, generally favorable areas to determine to whatextent mineralization is controlled by environments, and toascertain which, if any, of the proposed ore guides are successfulin this area.
MethodsFor this study nine sections were measured in the Red Rock
Valley between Oak Springs and the Red Rock Trading Post, adistance of about 9 mi (15 km) (fig. 1). Corken has extended theline of sections 15 mi (24 km) to the south of Red Rock. The Ca-rrizo Mountains area was chosen for study because of good expo-sure, local mineralization in the Salt Wash, and the existence ofdetailed geologic maps covering the entire area (Strobell, 1956;O'Sullivan and Beikman, 1963; Huffman, 1977; Huffman andJones, 1978).
Outcrop sections were described on standardized forms at ascale of 1 inch = 10 ft (1.0 cm = 1.2 m). Units as thin as 6 inches(15 cm) were measured and described, with particular attentionpaid to sedimentary structures, transport directions, grain size,color, and lateral variation. The Tent mine section (fig. 1) wassampled for petrography and chemistry at an average interval of10 ft (3 m). Representative mines from five areas (fig. 1) weredescribed in greater detail and sampled at an average interval of 1ft (35 cm).
Standard petrographic thin sections of all sandstone sampleswere impregnated with blue-dyed epoxy and stained for calciteand potassium feldspar. Mean grain size, sorting, skewness, andkurtosis were calculated based on long-axis measurements of 50grains per thin section. Point counts of at least 300 points perslide were made, and the results were plotted on ternar>diagrams.
LithologiesIn the Carrizo Mountains area, the bedding within the Salt
Wash Member of the Morrison Formation is extremely variableboth vertically and laterally. Few sand bodies are thicker than 10ft (3 m) and traceable laterally more than several hundred meters.
[New Mexico Bureau of Mines & Mineral Resources, Memoir 38,1980]

123
RATTLESNAKEMINE GROUP UTAH i/COLORAD
ARIZONA J ' NEW"MEXICO
r\ /TEEC NOS PAS
LUKACHUKAIMINE AREA
(from Chenoweth & Malan, 1973)
EXPLANATION
C D Mine area studied• Measured section
Outcrop of the SaltWash Member (Jms)of MorrisonFormation
FIGURE 1 —INDEX MAPS SHOWING THE LOCATION OF MINE GROUPS AND MEASURED SECTIONS IN THE CARRIZO MOUNTAINS AREA.
Four primary lithologic types have been recognized: sandstone,conglomerate, mudstone, and claystone. The sandstones werefurther subdivided into crossbedded and parallel-bedded units.
The crossbedded sandstones have a mean grain size of 2.54 $and a standard deviation of 0.51 $ (moderately well sorted). Theynormally have a scoured base and may grade upward intoparallel-bedded or ripple-laminated sequences. The crossbeddingvaries from low- to high-angle trough with rare planar types.
Parallel-bedded sandstone includes horizontally laminated,ripple-laminated, and very gently inclined laminated sand bodies.These sandstones are slightly finer grained (mean = 2.72 +) andless well sorted (standard deviation = 0.53 <|>) than the cross-bedded sandstones. They are generally less than 3 ft (1 m) inthickness, seldom extend more than 160 ft (50 m) laterally, andcommonly include very fine grained carbonized organic materialand clay clasts on the lamination surfaces. These units normallyhave a flat or very gently scoured base and a ripple-laminatedfiner grained upper surface.
The conglomerates in the Salt Wash of this area are almost allclay and mud-ciast conglomerates. Clasts range in size from lessthan 1 mm to 30 cm. Conglomerates occur in the basal portionsof trough-crossbed sets, in the parallel-bedded sandstones, andas both structureless and trough-crossbedded units underlyingcrossbedded sandstones.
The mudstone units are characterized by contorted bedding,horizontal laminations, ripple laminations, and small-scaletrough crossbedding. They are commonly reddish brown withpaie-green silty to sandy interbeds and internal mottling. Muchof the mudstone is burrowed and bioturbated and contains car-bonized plant material. Mudcracks are also common in the mud-stone layers.
Gray and greenish-gray claystone occurs as 4-12-inch (10-30-cm) thick horizontally laminated and ripple-laminated beds oflimited extent. Although few claystone beds were found in thearea of study, most of the clay clasts in the conglomerates are ofsimilar material.
[New Mexico Bureau of Mines & Mineral Resources, Memoir 38,1980]

124
WYOMING
UTAH &&
QUARTZ
HENRY MOUNTAINSMINERAL BELT
STUDY AREA
FLAGSTAFF GALLUP
SANTA FE
0 80 I'M.
— 9 0 — Isopacn thickness in meters (from Craig iothere, 1955)FIGURE 2—ISOI'ACH MAP OI THE SALT WASH MEMBER. MORRISON
FORM M ION (modified from Craig and others, 1955), showing the loca-tion of the Carrizo Mountains area and the Henry Mountains mineralbelt.
Depositional environmentsInterpretation of depositional environments is based on
observed features of each lithologic unit and examination of thesequence in which these units occur. Although the sequences oflithologies are varied, they can be grouped into several recurringfluvial subenvironments (fig. 4): active channel fill, both braidedand meandering; partially abandoned channel fill; abandonedchannel fill; and overbank.
Active channel-fill deposits are composed of trough-cross-bedded sandstone with minor parallel-bedded and ripple-lami-nated sandstone. The base is normally a scour surface overlain bya l-3-ft (15-100-cm) thick lag deposit containing clay clasts, mudrip-ups, and large fragments of carbonized plant material. Por-tions of tree trunks and limbs as large as 16-20 ft (5-6 m) long arepresent but rare. Crossbedding in the active channel-fill depositsvaries from low to high angle, commonly decreasing in bothanele and scale upward. Grain size also decreases slightly up-waro.
Braided-stream deposits form multilateral and multistoriedsandstone bodies with lags at the base and thin mudstone layersat the top of each crossbedded sequence. Although the sheet ofsandstone may be as much as 80 ft (25 m) thick and extend formany kilometers, the individual channel deposits are rarely over16 ft (5 m) thick and several hundred feet wide (width/thickness= 50-60). Parallel-bedded units are present locally as thin,horizontally laminated or ripple-laminated horizons at the top ofa crossbedded sequence and may represent topset beds of bars.
Meandering-stream deposits have much lower width-to-thickness ratios (20-25) than the braided streams, are lenticular incross section, and normally are completely enclosed in mudstone.Although very few surfaces or units of lateral accretion wererecognized, the common vertical sequence of massive or cross-bedded conglomerate at the base, moderate- to high-angle troughcrossbedding in the middle, and finer grained parallel beddingand ripple laminations at the top strongly suggests meanderingstreams.
SUBFELDS-ARENITE
QUARTZ-ARENITE
SUBLITH-ARENITE
FELDSPAR FRAGMENTS
SHALE CLASTS
UNMINERALIZEDSAMPLE
O
MINERALIZEDSAMPLE
CARBONATELITHARENITE
CALCITE CLASTS CHERT
FIGURE 3—PETROGRAPHIC CLASSIFICATION OF SANDSTONE SAMPLES FROMTHE SALT WASH MEMBER OF THE MORRISON FORMATION (from Folk,1968); note concentration of mineralized samples in the shale lith-arenite field.
Partially abandoned channel-fill deposits form when a pre-viously active channel is cut off from the main stream but stillreceives some mixed-load material during floods. These depositsnormally have a scoured base, a lenticular cross section and asinuous or curved form in plan view. The scours are fillet! vithmud, silt, and thin sandstone beds of limited lateral extent. Tnesandstone units are commonly flat-bedded or low-angle troughcrossbedded at the base and contain mud rip-ups and carbonizedplant material. They may also have contorted bedding at thebase. The upper portions of the sandstone bodies are usually rip-ple laminated, with climbing ripples being fairly common. Themudstones contain mud cracks and are commonly bioturbatedby both burrowing animals and plant roots. Where exposure per-mits, the partially abandoned fill can be traced laterally intoeither bar deposits or active channel-sandstone deposits.
Channel abandonment occurs when the partially abandonedchannel is completely cut off from any new influx of coarse sedi-ment or when the stream avulses to a new location, leaving aswamp or lake in the old channel. In the Salt Wash Member ofthe Carrizo Mountains area, the abandoned channel-fill depositsare generally thin (1 ft; 30 cm or less), finely laminated, dark-gray to greenish-gray claystone of limited lateral extent (100 ft;30 m or less).
Overbank deposits are predominantly suspended-load materialdeposited on the floodplain during a flood or when a levee has
[New Mexico Bureau of Mines & Mineral Resources, Memoir38,1980]

125
IDEALIZEDSECTION
LITHOLOGY
GRAY CLAYSTONERED & GREENMOTTLED MUDSTONEWITH ROOT TRACESRIPPLE LAMINATED SsWITH CONTORTEDBEDDINGBURROWED MUDSTONE
CLIMBING RIPPLESPARALLEL-BEDDED Si
CONTORTED BEDDING
MUDSTONE
RIPPLE BEDDINGTROUGH-CROSSBEDDEDSs
CHANNEL LAG. CLAYCLAST CONGLOMERATEWITH ORGANIC DEBRISRED & GREEN MOTTLEDMs WITH MUD CRACKS
INFERREDENVIRONMENT
OF DEPOSITION
ABANDONEDCHANNEL FILL
g TENT MINE SECTION
PARTIALLYABANDONED
CHANNFL FILL
ACTIVECH\NNEL
FILL
OVERBANK
FIGURE 4—SECTION SHOWING LITHOLOOIES AND INFERRED DEPOSITIONAL
ENVIRONMENTS IN AN IDEALIZED CYCLE OF CHANNEL ABANDONMENT, SALT
WASH MEMBER, MORRISON FORMATION.
been breached. In the Salt Wash they are laterally extensive,reddish-brown and green-mottled mudstones and siltstones withminor interbedded silty sandstones. Common features are con-torted bedding, ripples, horizontal or gently inclined lamina-tions, and mudcracks. The upper part of sandstone beds mayalso contain climbing ripples.
Stratigraphic unitsIn the Carrizo Mountains area, the Salt Wash Member of the
Morrison Formation is a coarsening-upward sequence of increas-ing energy levels and sand content, which can be subdivided intoat least three stratigraphic units based on depositional en-vironments (fig. 5). Although these units were defined fromdetailed measured sections, several distinguishing characteristicssuch as sandstone/mudstone ratio, average sandstone-unit thick-ness, and number? of alternations between sandstone andmudstone are easily derived from electric logs, particularly large-scale (1 inch = 10 ft) uranium-exploration logs.
The lowermost stratigraphic unit (I) is an average of 30 ft (9 m)thick (table 1) and is predominantly overbank deposits of alter-nating thin mudstone and sandstone. It contains few channelsandstones, most of which have features characteristic of bothmeandering- and braided-stream deposits with width-to-thickness ratios of about 20. Approximately 60 percent of thetotal sandstone is parallel bedded and silty. Rare lacustrinedeposits containing ostracodes and casts of pelecypods werefound in the lower part of this unit.
o UJ CT_ J U JQ_ CD22< 3co z O Q
CO Q
O tu UJO Q. CO
0 2 0 0 4 0 0
^ M. 1 I-
OCO
occrO
(fLLJCD
UJ
CO<
CO
UNITMM I
- 8 0
-40
0+0BLUFF
SANDSTONE•
SUMMERVILLEFORMATION
IFIGURE 5—TENT MINE MEASURED SECTION WITH STRATIGRAPHIC UNITS
AND POSITIONS OF URANIUM ANOMALIES INDICATED.
The middle stratigraphic unit (II) is an average of 70 ft (21 m)thick and is composed of channel-sandstone deposits, partiallyand completely abandoned channel-fill deposits, and overbankdeposits. The active channel-fill sandstones are primarilybraided-stream deposits but locally exhibit some meanderingcharacteristics. Width-to-thickness ratios are between 30 and 40.Approximately 80 percent of the sandstone is active channel fill.Several cycles of channel cutting and abandonment are apparent,although complete cycles are rarely preserved.
The upper unit (III) is 120 ft (36 m) thick at Oak Springs,
TABLE 1—AVERAGE VALUES FOR STRATIGRAPHIC UNITS I, I I , AND I I I INTHE CARRIZO MOUNTAINS AREA.
unit
III
III
thicknessft (m)
120 (35)70 (21)30 (9)
channel ss %total ss
907942
sandstonemudstone
6.832.900.76
average ssthickness in ft (m)
8.9 (2.7)6.0 (1.8)2.2 (0.7)
number of alternationsper 10 ft (3.05 m)
0.781.372.12
[New Mexico Bureau of Mines & Mineral Resources, Memoir 38,1980]
8CD
s5'
CD
CD
g
IME
t
CO
aztrD.W
<o
Oc
oo
0 5 Km ^ 0 5 Km 0 5 Km 0 1 Kmz
0 1 Km 0 1 K m , 6 5 Km
z z
a—
crsw
RECAPTUREMBR.
MORRISONFM.
3 0 0
240 -~7 S
180-
-so
1 2 0 -
6 0 -
1 I CROSSBEDDED SANDSTONE
PARALLEL BEDDED SANDSTONE
MUDSTONE
EZ3 CLAYSTONE
EOLIAN SANDSTONE
FLUVIAL
ANOMALOUS URANIUMOCCURRENCE
-25
0-1-0SUMMER-
VILLE FM.
FIGURE 6—CORRELATION DIAGRAM OF MEASURED SECTIONS IN RED ROCK ''ALLEY, SHOWING STRATIORAPHIC UNITS AND URANIUM ANOMALIES.

127
which is the only section where the entire unit was measured.Most of the unit is composed of braided-stream deposits withhigh width-to-thickness ratios (50-70) and thin overbank depos-its. The active channel-fill sandstones and conglomerates arealmost entirely trough crossbedded with only minor parallel bed-ding (10 percent of total sandstone).
The observed sequence of stratigraphic units probably repre-sents a prograding wet alluvial fan as suggested by Shumm(1977), Galloway (1978), and Young (1978). Placing the strati-graphic units into this model, unit I is the distal-fan facies whichincludes small distributary streams, a high proportion of fine-grained deposits, and rare lacustrine deposits. Units II and IIIboth belong to the midfan facies and show an increase of energyupwards. Unit II represents a transition from the low-energydistal-fan environments to the relatively high-energy upper mid-fan environments and, as such, combines some characteristics ofboth.
UraniumIn the Carrizo Mountains area, economic uranium deposits are
confined to our stratigraphic unit II (fig. 6). Deposits in all fivemine areas (Eastside, Rattlesnake, Cove Mesa, Lukachukai, andKinusta Mesa) are associated with partially abandoned channelfill. The orebodies are located either near the bases of channelsandstones where they scoured into partially abandoned channel-fill deposits or in parallel-bedded sandstones that are in contactwith the channel sandstones within or adjacent to partially aban-doned channel fill. Although uranium mineralization occurs inother environments and other units, it has not been concentratedin sufficient quantities to form ore deposits except in unit II.
Uranium-bearing solutions were probably introduced intomost—if not all—of the permeable channel-sandstone depositswithin the Salt Wash and were subsequently carried down thesesandstone conduits in the direction of regional dip. Deposition ofuranium occurred where these fluids encountered a reducing
environment. In the Salt Wash this reducing environment wasproduced by the presence of organic material. The greatest con-centration of organics in the wet alluvial-fan system occurs in thebars, swamps, and lakes of the partially abandoned and com-pletely abandoned channels. This concentration would be espe-cially likely if the fan were prograding in an arid or semi-aridregion, which is indicated in the case of the Salt Wash by thepresence of eolian sandstone bodies (fig. 6). A third importantfactor is the decrease of transmissivity owing to the largevolumes of fine-grained sediments deposited in these environ-ments and subsequently incorporated into the active channel-filldeposits. Without this reduction in transmissivity and the pres-ence of reductants, the mineralizing fluids continue downdip.
In the study area, the ideal combination of conditions is pres-ent in stratigraphic unit II, which corresponds to the lower mid-fan facies. Unit I is a low-transmissiviiy unit that is choked withmud and does not contain enough thick, continuous sandstonebodies to act as conduits. Unit III is almosl entirely channel-sandstone deposits and contains little mud or organic material.Rare uranium occurrences found associated with small partiallyabandoned channel-fill deposits in unit 111 indicate that, al-though the mineralizing solutions passed through this unit, con-ditions necessary to concentrate the ore were present only locaLy.
Detailed measured sections from the King Tut I mine in theEastside Group and from the Rattlesnake 5 Plot 7 mine in theRattlesnake Group (fig. 7) illustrate typical occurrences ofuranium in unit 11. Mineralization in both mines is stronglyrelated to visible carbonized plant material and organic carbon.No evidence of mobile-kerogen deposits was observed in eithermegascopic or microscopic examination. An obvious associationof uranium with mudstone and claystone, both as beds and asclasts in channel-lag deposits, is also evident.
At the risk of oversimplification, the observed relationshipswere reduced to a minimum number of easily recognizable andmeasurable parameters to make the results of this study ap-plicable to measured-section, core, and electric-log interpreta-
s-i£*
King Tut I/Beqay I
FasUide Mines Area
rtei'k
|»-_^ (Uvstone f ^ H contorted Deddmq
|7==^ mudstont {— '"] parallel heddini)
f^^i conglomerate
feet Meters I I I I • I
[ EldestoneELChannel Lag
Rait lesnake ^/Plot 7fidtt le-^ndle (irnup
FIGURE 7—DETAILED MEASURED SECTIONS WITH URANIUM IPPM> AND ORGANIC CARBON (WEIGHT PERCENT) FROM THE KING T U T 1/BEGAY I
MINE AND THE RATTLFSNAKE 5 PLOT 7 MINE.
[New Mexico Bureau of Mines & Mineral Resources, Memoir 38,1980]

128
CROSSBEDDEDSANDSTONE
UNMINERALIZEDSTRA riGRAPHIC,
UNIT
MINERALIZEDSTRATIGRAPHIC
UNIT
CROSSBEDDEDSANDSTONE
UNMINERALIZED A MINERALIZEDSTRATIGRAPHIC / \ STRATIGRAPHIC
UNIT / „ \ UN|T
a.)FIGURE 8—TERNARY DIAGRAMS of ( ITHOI o<;ic COMPOSITION OF STRATIURAPHIC UNITS I ROM MEASURED SECTIONS IN a) Carrizo Mountains
area and b) Carrizo Mountains area plus Henry Mountains mineral belt; outlined area encloses all units containing economic mineraldeposits.
tion. Environmental, stratigraphic, and petrographic parameterswere tested both against the degree to which they separated thethree stratigraphic units and identified favorable (mineralized)ground and against the ease and degree of confidence with whichthey could be measured. Three parameters satisfy these criteriausing measured-section and core data, and three other criteriacan be applied to measured sections, cores, and electric logs.
The Ihree parameters applicable to measured sections andcores only are percent crossbedded sandstone, percent parallel-bedded sandstone, and percent fine-grained (mudstone and clay-stone) deposits. This analysis was applied solely to fluvial andlacustrine deposits. Total thickness of each end member wascalculated for each stratigraphic unit, the results were recalcu-lated lo 100 percent, and the points were plotted on a ternarydiagram. The mineralized units were used to define the diamond-shaped area in the center of fig. 8. This empirically derived areawas used to determine limiting sandstone/mudstone ratios,parallel-bedded sandstone percentages, and crossbedded sand-stone percentages (fig. 9).
The technique was tested by adding measured-section datafrom the Salt Wash of the Henry Mountains (fig. 2; Peterson,1978, and unpublished data, 1979). Stratigraphic units were iden-tified on the basis of Peterson's descriptions and draftedmeasured sections. All units containing uranium deposits fellwithin the proposed favorable area of fig. 8. The technique wasalso tested for sensitivity to stratigraphic-unit identification bycalculating and plotting points for each of the complete sections.Most of the measured sections fell within the favorable area. Byidentifying stratigraphic units, however, 57 percent of the totalSalt Wash Member in the Red Rock Valley can be identified asunfavorable, using this technique.
The three parameters applicable to electric-log interpretationand to section and core data are sandstone/mudstone ratio,average thickness of sandstone units, and numbers of alterna-tions from sandstone to mudstone. For these diagrams a sand-stone unit is defined as the total sandstone between twomudstone breaks regardless of lithology. The favorable areasoutlined on each diagram (figs. JO, II) were derived empiricallyby combining data from the Carrizo Mountains area with thatfrom the Henry Mountains (Peterson, 1978, and unpublisheddata, 1979). The favorable area on the diagram of sand-stone/mudstone ratio vs. average sandstone-unit thickness (fig.10) includes the same stratigraphic units as the favorable area forsandstone/mudstone ratio vs. numbers of alternations per 10 ft(3.05 m; fig. 11). Both are included here to demonstrate the util-ity of each approach. On both plots 30 percent of the total SaltWash in the Red Rock Valley and 47 percent in the Henry Basincan be cony dered unfavorable. By using all three diagrams (figs.
9-11), 57 percent of the Salt Wash in Red Rock Valley and 47 per-cent in the Henry Mountains can be identified as unfavorable foreconomic uranium deposits.
ConclusionsUranium deposits in the Carrizo Mounains area, northwestern
San Juan Basin, are located in the lower midfan facies of the ialtWash Member of the Morrison Formation. Small amounts ofmineralization also occur in the distal facies and upper midfanfacies, indicating that although the ore-carrying fluids are in-ferred to have passed through them, the proper conditionsnecessary to concentrate the ore into economic deposits were notpresent in these environments.
The parameters favorable for deposition of uranium in the SaltWash areas follows:
1) 24-73 percent crossbedded sandstone in active channel-filldeposits that form conduits through which the mineralizingfluids are carried through the system11-39 percent parallel-bedded sandstone, both ashigh-energy active channel-fill deposits and lower energypartially abandoned fill and overbank deposits, but ineither case of limited lateral extent
3) 12-38 percent mudstone and claystone in partially andcompletely abandoned channel-fill deposits of limitedlateral extent
CROSSBEDDEDSANDSTONE
2)
Ss/Ms=6
Ss/Ms- 1
1 1 % OF S s ,PARALLELBEDDED
73% OF Ss.CROSSBEDDED* 39% OF Ss.' PARALLEL
BEDDED
24% OF SsCROSSBEDDED.
FIGURE 9—PARAMETERS DEFINED BY FAVORABLE AREA OUTLINED IN FIG. 8.
[New Mexico Bureau of Mines & Mineral Resources, Memoir 38,1980]

129
1 1-
1 01112OI—CO
a
SAVERAGE Ss THICKNESS-
0.6M(2.6 FT.)
I AVERAGE Ssx
T HIC K N E S S=6.7M(21 .8FT. )
UNMINERALIZEDSTRATIGRAPHIC
UNIT oMINERALIZED
STRATIGRAPHICUNIT •
M
8 1 0 1 2 1 4 1 6 1 8 2 0 2 2 2 4 2 6 2 8 3 0 3 2 3 4 3 6 F T
AVERAGE SANDSTONE THICKNESSFIGURE 10—PLOT OH SANDSTONE/MUDSTONE RATIO VS. AVERAGE SANDSTONE THKKNLSS K>K SIKAIII.RAI'IIIC
UNITS IDENTIFIED IN THE C A R R I Z O MOUNTAINS AREA AND HENRY MOUNTAINS MINERAL BUT: Outlinedfavorable area encloses all units containing economic mineral deposits.
4) sandstone/mudstone ratio of 1.6-6.15) average sandstone-unit thickness of 3-22 ft (79 cm-6.65 m)6) 0.3-3.0 alternations from sandstone to mudstone per 10 ft
(3.05 m)By dividing the Salt Wash into stratigraphic units and plottingthese units with respect to these six parameters, 57 percent of thetotal Salt Wash volume in the Red Rock Valley area and 47 per-cent in the Henry Mountains mineral belt are identified as un-favorable for economic ore deposits.
CO 8Q
iUj 6
O
<CO
4 -
3
2
1
CO
O
crUJ
Z UNMINERALIZED2 STRATIGRAPHIC
i UN.IT£ MINERALIZED
I K STRATIGRAPHICVi UNIT
Ss/Ms6.1
- Ss/Ms
© 1.6
0 1 2 3 4
NUMBER OF ALTERNATIONS/3.05m (10ft)
FIGURE I I — P L O T OF SANDSTONE/MUDSTONE RATIO VS. NUMBER OF
ALTERNATIONS FROM SANDSTONE TO MUDSTONE PER 10 FT (3.05 M) FORSTRATIGRAPHIC UNITS IDENTIFIED IN THE CARRIZO MOUNTAINS AREAAND HENRY MOUNTAINS MINERAL BELT: outlined area encloses allunits containing economic miner:! deposits.
More important than the numbers themselves is the recogni-tion of the key role played by partially and completely aban-doned channel-fill deposits in the localization and concentrationof uraniuTi mineralization. By providing organic material for areductant, clay and mud to reduce the transmissivity, and poroussand bodies of very limited lateral extent, these environmentsform an ideal sink for uranium mineralization. Subsequentscouring of the partially and completely abandoned fills byfluvial channels incorporates the mud and clay, as well as theplant debris, into basal-lag deposits and provides a conduit fromwhich the mineralizing fluids can reach the organic-rich sands ofthe partially abandoned fill. These factors explain both commonmodes of uranium occurrence in the Salt Wash Member of theCarrizo Mountains area.
ReferencesChenoweth, W. L., and Malan, R. C , 1973, The uranium deposits of
northeastern Arizona: New Mexico Geological Society, Guidebook24th field conference, p. 139-149
Craig, L. C , and others, 1955, Stratigraphy of the Morrison and relatedformations, Colorado Plateau region, a preliminary report: U.S. Geo-logical Survey, Bull. 1009-E, p. 125-168
Fischer, R. P., and HiJperl, L. S., 1952, Geology of the Uravan mineralbelt: U.S. Geological Survey, Bull. 988-A, p. 1-13
Folk, R. L., 1968, The petrology of sedimentary rocks: Austin, Texas,Hemphill Publishing Co., 170 p.
Galloway, W. E., 1978, Morrison Formation, Colorado Plateau, inDepositional and ground-water flow systems in the exploration foruranium, a research colloquium, W. E. Galloway, C. W. Kreitler, andJ. H. McGowen, eds.: University of Texas (Austin), Bureau of Eco-nomic Geology, p. x-l-x-15
Huffman, A. C , Jr., 1977, Preliminary geologic map of the Red RockNE quadrangle, Apache County, Arizona, and San Juan County, NewMexico: U.S. Geological Survey, Open-file Rept. 77-227
Huffman, A. C , Jr., and Jones, T. W., 1978, Preliminary geologic mapof the Red Rock SE quadrangle, Apache County, Arizona, and SanJuan County, New Mexico: U.S. Geological Survey, Open-file Rept78-404
Masters, J. A., 1955, Geology of the uranium deposits of the LukachukaiMountains area, northeastern Arizona: Economic Geology v 50 no2, p. 111-126
[New Mexico Bureau of Mines & Mineral Resources, Memoir 38,1980]

130
Motica, J. E., 1968, Geology and uranium-vanadium deposits in the Shumm, S. A., 1977, The fluvial system: New York, John Wiley andUravan mineral belt, southwestern Colorado, in Ore deposits of the Sons, 338 p.United States, 1933-1967, J. D. Ridge, ed.: New York, American In- Stokes, W. L., 1954, Some stratigraphic, sedimentary, and structuralstitute of Mining, Metallurgical, and Petroleum Engineers, Graton- relations of uranium deposits in the Salt Wash sandstone: U.S. AtomicSales volume, p. 806-813 Energy Commission, RME-3102, 50 p.
Mullens, T. E., and Freeman, V. L., 1957, Lithofacies of the Salt Wash Stokes, W. L., Jones, D. J., and Sadlick, W., 1953, Primary sedimentaryMember of the Morrison Formation, Colorado Plateau: Geological features in relation to uranium deposits in the Salt Wash sandstone:Society of America, Bui! , v. 68, p. 50S-526 U.S. Atomic Energy Commission, RME-3043, 74p.
O'Sullivan, R. B., and Beikman, H. M., 1963, Geology, structure, and Strobe!!, J. D., Jr., 1956, Geology of the Carrizo Mountains area inuranium deposits of the Shiprock quadrangle, New Mexico and Ari- northeastern Arizona and northwestern New Mexico: U.S. Geologicalzona: U.S. Geological Survey, Misc. Geol. lnv. Map 1-345 Survey, Oil and Gas Inv. Map OM-160
Peterson, Fred, 1978, Measured sections of the Lower Member and Salt Young, R. G., 1978, Depositional systems and dispersal patterns inWash Member of the Morrison Formation (Upper Jurassic) in the uraniferous sandstones of the Colorado Plateau: Utah Geology, v. 5,Henry Mountains mineral belt of southern Utah: U.S. Geological no. 2, p. 85-102Survey, Open-file Rept. 78-1094
[New Mexico Bureau of Mines & Mineral Resources, Memoir 38,1960]

131
GEOLOGY OF PRE-DAKOTA URANIUM GEOCHEMICALCELL, SEC. 13, T. 16 N., R. 17 W., CHURCH ROCK AREA,
McKINLEY COUNTYby R. J. Pelerson, Telon Exploration Drilling Co.. Inc.,
4125 Montgomery Blvd. N.E., Albuquerque, New Mexico 87109
AbstractExploration drilling on sec. 13, T. 16 N., R. 17 W., McKinley
County, New Mexico, has defined uranium deposits within theWestwater Canyon Member of the Morrison Formation (Juras-sic). Elongate, tabular, redistributed deposits were formedperipherally along the zones of highest transmissivity of thenortheast-trending Westwater Canyon flmial system by aJurassic-Cretaceous geochemical cell. Strongly reducing condi-tions, which existed locally in the channel-margin areas owing tothe presence of organic materials, were the primary ore control.Evidence that this major redistribution process took place in pre-Dakola time is that bleaching of the Westwater Canyon Sand-stone by Dakota swamps is superimposed on older oxidation,and the primary mineralization above the Jurassic-Cretaceouswater table was not affected by the geochemical-cell redistribu-tion process.
IntroductionThis study concerns the history of mineralization and ore con-
trols within a uranium deposit at the western end of the ChurchRock district, sec. 13, T. 16 N., R. 17 W., McKinley County,New Mexico. Relationships of mineralization to host-rocksedimentary fades, iron-redox interfaces, and ground-water flowpatterns explain the observed mineralization in sec. 13 and, byextrapolation, support a regional model of ore controls andmineralization history for the Grants mineral belt.
Stratigraphy, structure, geologic history, geometric descrip-tions, and genetic models of uranium emplacement for theGrants mineral belt have been discussed by many authors overthe past thirty years. I have drawn freely from the many pub-lished reports. For the sake of brevity, these topics will only bediscussed where necessary in the following sections. The reader isreferred to Kelley (1963a) for excellent articles on the above sub-jects, to Granger (1968) for a popular model of ore genesis, andto Hilpert (1969) for an excellent overview of the geologic historyand uranium mineralization of the Grants mineral belt.
ACKNOWLEDGMENTS—I wish to thank Teton Exploration Drill-ing Co., Inc. for allowing the publication of this data. Specialthanks are extended to R. L. Johnson and D. A. Smith of TetonExploration Drilling Co., Inc. and D. G. Brookins of the Univer-sity of New Mexico for their invaluable discussions concerningthe uranium geology of the Grants mineral belt. Recognition isextended to O. Roybal for his expertise in drafting the diagramsin this paper and to F. Cory for his assistance in describing thedrilling samples from sec. 13. D. A. Smith made many helpfulsuggestions concerning content and clarity of this report.
Regional geologic settingThe Church Rock district lies at the western edge of the Grants
mineral belt, and sec. 13 lies at the western edge of the ChurchRock district (fig. I). The host for uranium mineralization is theWestwater Canyon Member of thr Morrison Formation (Jur-assic).
The Dakota Sandstone (Cretaceous) lies with gentle angularunconformity on the Morrison rocks in the Church Rock area,and southward it rests on successively older strata. This relation-ship represents simple erosional planation of Mesozoic strata
tilted to the north prior to deposition of the Dakota. Immediatelysouth of the Church Rock district, th? Dakota rests directly onthe Westwater Canyon Member of the Morrison Formation. TheBrushy Basin Member in this area has been entirely removed bypre-Dakota erosion. This exposure of Westwater Canyon sedi-ments in Late Jurassic and Early Cretaceous time was instrumen-tal in the genesis of redistributed uranium deposits in the Grantsmineral belt.
Cretaceous strata, both marine and terrestrial sequent , andlocally, a Tertiary volcanic sequence, form the overburien of theMorrison Formation in the San Juan Basin. The thic1. iu ,s of thisoverburden varies from a few hundred feet to thousands of feet,depending upon topog-aphy and location within the basin, andhas a profound influence on the economics of uranium explora-tion and mining.
The Westwater Canyon was deposited as a broad alluvial plainor fan by an aggrading system of braided streams (Craig andothers, 1955; Galloway, this volume). This alluvial plain wasbounded to the north by the Uncompahgre highland in south-west Colorado, and to the south it onlapped the north flank ofthe ancestral Zuni highland, which was a low but positivetopographic element during Jurassic time (Rapaport and others,1952; Saucier, 1976). The source area for these alluvial sedimentswas the Mogollon Highland in central Arizona and west-centralNew Mexico (Cooley and others, 1963). Fig. 2 shows the locationand general shape of portions of the Westwater Canyon alluvialfan still preserved in the San Juan Basin.
The Westwater Canyon is a fine to very coarse grained, sub-arkosic to arkosic sandstone with interbedded green and redmudstones. It attains a maximum thickness of over 300 ft (100m) near the New Mexico-Arizona border north of Gallup, NewMexico.
The Brushy Basin Member of the Morrison Formation con-formably overlies the Westwater Canyon with a gradational andintertonguing contact. It consists principally of greenish, siltyand sandy mudstones, many of which are derived from volcanicash falls. The thickness of the Brushy Basin was modifiedeverywhere by pre-Dakota erosion. In the Church Rock area, theBrushy Basin is preserved as a feather edge of a much thicker unitto the north; in some parts of the area, the Brushy Basin has beencompletely eroded away, and the Dakota res^s unconformably onthe Westwater Canyon. Although ar, important uranium host inother portions of the Grants mineral belt, the Brushy Basin is sothin in this area that any ore deposits once present have beeneroded.
In the Church Rock area, the Westwater Canyon is underlainby the Cow Springs Sandstone, a well-sorted, rounded, fine- tomedium-grained, quartzose sandstone believed to be of eolianorigin. The Cow Springs ir.tertongues with several Upper Jur-assic units, including the Morrison and the underlying Summer-ville Formation (Harshbarger and others, 1957). The CowSprings-Westwater Canyon contact is easily recognized in bothdrill cuttings and on electric logs because of the change to clean,well-sorted sandstone. Although not a prospective uranium host,the Cow Springs locally contains low-grade radiometric anom-alies just below the Westwater Canyon contact.
Geology and uranium mineralization, sec. 13The geology of sec. 13 provides a unique example of a West-
water Canyon mineral deposit that has not been greatly modified
[New Mexico Bureau of Mines & Mineral Resources, Memoir 38,1980]

132
i 1CHURCHROCK DISTRICT
UNCSIwfl
i ii Ii i
! i
<o
L._rFIGURE 1—GENERALIZED LOCATION MAP OF SEC. 13, T. 16 N., R. 17 W. relative to the Grants mineral belt and the
Church Rock mining district.
by oxidation associated with Laramide and post-Laramide fault-ing. Electric logs and drilling samples from more than 400 holeswere examined for this study. These data have been used todevelop a series of geologic displays that include a stratigraphiccross section, isopach map, and a sandstone/mudstone ratio mapof the Westwater Canyon. Correlation of intraformational mud-stones indicates at least five identifiable mineralized stratigraphiclevels are present. Microscopic lithologic descriptions of drill cut-tings have allowed development of a series of iron-redox mapsfor each of the stratigraphic levels. A sec. 13 type log and litho-logic description (fig. 3) shows the Cretaceous and Jurassic for-mations penetrated by drilling and depicts the various strati-graphic zones in the Westwater Canyon.
StructureA structure-contour map drawn on the top of the Dakota (fig.
4) displays a uniform dip of 3GN. This is consistent with theregional dip of the Chaco slope, which forms the southern flankof the San Juan Basin (Kelley, 1963b). No faults appear in thesection, and surface topography does not suggest the presence ofany major fracture systems. Consequently, the deposit can bestudied without removing the effects of uranium redistributioncaused by meteoric waters migrating along zones of secondarypermeability generated by faults and fracture systems. The Pipe-line fault lies one mile southeast of sec. 13 and trends approx-imately N. 55° E.
[New Mexico Bureau of Mines & Mineral Resources, Memoir 38,1980]

133
EXPLANATION° Well log* Measured section
T»» Ore body
Contour Interval -100 ti {3Om )
WSSTWATER- BRUSHYBASIN TIME GROUNDWATER FLOW DfRECflON
POST BRUSHt- BASI N PRE-DAKOTA .Gr°"15
WESTWATER ICANYON OUTCROP FORMING ANEW RECHARGE AREA
FIGURE 2—WESTWATER CANYON ALLUVIAL FAN SHOVING GROI IND-WATFR FLOW DIRECTIONS IN WESTWATER CANYON-BRUSHY BASIN TIME(down the fan along radiating sand trends). In post-Brushy Basin time (Late Jurassic-Early Cretaceous), regional tilting to the northgenerated broad flat Westwater Canyon outcrops and a new recharge area. At this time, a trend of redistribution deposits was formedproximal to a geochemical-cell-iron redox interface that extends from Church Rock to Ambrosia Lake. Oxidation associated withLaramide and Recent structure has only locally modified this pre-Dakota oxidation pattern (figure modified from Galloway, thisvolume).
Westwater Canyon isopachIn sec. 13, the upper and lower contacts of the Westwater Can-
yon are easily identified on electric logs. The overlying BrushyBasin is present throughout and averages 30 ft (9 m) in thickness.It thins from north to south across the section, owing to pre-Dakota erosion. The Westwater Canyon varies in thickness from220 to 270 ft (67 to 82 m) as shown in fig. 5. A general northerlythinning is present across the section. The map indicates anortheast-trending thalweg of the Westwater Canyon fluvialsystem. This northeast trend for the channel systems is supportedby a N. 13° E. paleocurrent direction reported by Saucier (1967)from outcrop studies immediately south of sec. 13. The directionof maximum ground-water transmissivity would coincide withthis trend.
Westwater Canyonsandstone/mudstone ratio
Sandstone/mudstone ratios vary from 3:1 to 22:1 in sec. 13(fig. 6). A sand-rich area is present in the southeast quarter, anda sand-poor area is present in the northwest quarter. The low-sand area is interpreted as channel-margin facies of the West-water Canyon fluvial system and represents a zone of lowerground-water transmissivity.
Both sandstone/mudstone ratios and isopach data suggest anortheast paleo-ground-water flow direction.
Iron-redox mapsIron-redox interface maps were constructed for each of the
five zones of the Westwater Canyon. The iron-redox patterns are
[New Mexico Bureau of Mines & Mineral Resources, Memoir 38,1980]

134
COZ>oLJO
LJ
o
oCOCO<DC.
GALLUP FORMATION
MA NCOS FORMATION
TWO WELLSMEMBER
DAKOTA FORMATION
MORRISON
FORMATION
BRUSHY BASIN MEMBER
WESTWATERCANYON
MEMBER
C ZONE
B ZONE
A, ZONE
A, ZONE
A, ZONE
COW SPRINGS S.S.
184
INTERBEDDEO MARINE AND
NON- MARINE TRANSGRESSIVE1
AND REGRESSIVE SEQUENCE
LIGHT GRAY TO TANMARINE SANDSTONE
MARINE BLACK SHALEWITH LIGHT GRAYFINE GRAINEDSAND LENSES
LIGHT GRAY MARINEQUARTZOSE SANDSTONE
LIGHT GRAY QUARTZOSFSANDSTONE WITH INTERBEDDEDBLACK SHALE ANB LIGNITE
aGREEN MUDSTONE
LIGHT GRAY TO REDARKOSIC SANDSTONE WITHGREEN MUDSTONE BEDS
PYRITE OR HEMATITECOMMON DEPENDING ONREDOX CHARACTER
LIGHT GRAY, QUARTZOSEEOLIAN SANDSTONE
FIGURE 3—GENERAL STRATIGRAPHIC COLUMN DEPICTING JURASSIC-CRETACEOUS STRATIGRAPHY WITHIN SEC. 13, T. 16 N., R. 17 W.
defined by the presence or absence of hematite (oxidized iron) inthe individual zones. The presence of hematite was determinedby binocular microscopic examination of drill cuttings collectedat 10-ft intervals. The degree of oxidation increases away fromthe iron-redox interface, indicating the redox change with respectto iron is gradual over several hundred feet, from strongly oxi-di 7ing to reducing.
As shown on the type log (fig. 3), the zonation of the West-\v?ier Canyon is (in ascending order): A-l, A-2, A-3, B, and C.The iron-redox patterns and the relationship to mineralizationand c. >.- controls have been determined for each of the five zones.
A-l iron-redox pattern, mineralization,and ore controls
The A-l zone is the lowermost of the five stratigraphic zonesof the Westwater Canyon. In sec. 13 this zone averages 40 ft (12m) in thickness and consists of fine- to medium-grained, poorlycemented, subarkosic sandstone. Fig. 7 shows that mineraliza-tion (greater than 1 ft—0.02 percent eU3O.) apparently is present
in oxidized ground. However, as shown in cross section (fig. 12),the mineralization is located close to the base of the A-l sandbeneath a horizontal iron-redox interface. Cores of this intervalshow hematite in contact with the upper boundary of mineraliza-tion, but no hematite underneath.
The mineralization is tabular in shape and varies in thicknessfrom 1 to 25 ft (0.3 to 8 m), averaging about 6 ft (2 m). Thegeneral trend of mineralization is parallel to the northeast-trending thalweg of the Westwater Canyon fluvial system. Ura-nium was precipitated in reducing humate masses proximal to ahorizontal redox interface within the A-l zone.
A-2, A-3, and B iron-redox patterns,mineralization, and ore controls
The A-2, A-3, and B zones of the Westwater Canyon aresimilar in character and can be discussed together. They form themiddle three zones of the five stratigraphic intervals identified inthe Westwater Canyon and consist of medium- to coarse-grained, arkosic sandstones. Mineralization in each zone forms
[New Mexico Bureau of Mines & Mineral Resources, Memoir 38,1980]

135
• 6300
txHO
638 0 •
_ ^ - " 6120
^ _ ^ _ —• btbO
^ ~~65OO ^ * "
_ — — '
0 800 ft
FIGURE 4—STRUCTURE MAP OF SEC. 13, T. 16N..R. 17 W. drawn on thetop of the Dakota Formation (Cretaceous) and displaying a uniformnortherly dip of 3 ° (contour interval 40 ft).
elongate tabular deposits located in close proximity to iron-redoxinterfaces. These relationships are shown in figs. 8, 9,10, and 12.The three zones average 40 ft (12 m) in thickness and generallythin toward the high mudstone area northwest of the deposits.Mineralization varies greatly in thickness but averages 9 ft (3 m)in each zone. Low-grade mineralized limbs, described by Rubin(1970), are present along the southeast side of the mineral trends.Only one limb is usually identifiable, but in some drill holes twoor more limbs may be identified in the same zone. These limbslocally extend above and below the oxidized ground and graduateinto ore-grade mineralization to the northwest. The usual trendof mineralization is N. 35° E., parallel to the depositional
FIGURE 6—WESTWATER CANYON SANDSTONE.-MUDSTONL- RATIO MAP SUG-GESTING A NORTHEASTERLY HOW DIRECTION OI rill: Wl.STWAII-RCANYON FLUVIAL SYSTEM.
features and marginal to zones of highest ground-water trans-missivity in the Westwater Canyon fluvial system. The positionand shape of the uranium deposits are controlled by humateaccumulations in the channel-margin areas of the WestwaterCanyon fluvial system. Although the transportation and precip-itation of humates is not fully understood, these observationsconfirm the conclusion that organic accumulations tend to occuradjacent to zones of highest transmissivity in fluvial systems.Assays of ore-grade samples from sec. 13 indicate an average of0.61 percent organic carbon.
The varying rates of ground-water flow controlled by sedimen-tary facies in each of the Westwater Canyon zones producedstacking of the deposits near one another but not necessarily ver-tically above and below one another (fig. 12).
1400 ft
•REDUCED(Pyritic Iron)
F I G U R E 5—ISOPACH MAP DISPLAYING A NORTHEASTERLY TREND TO THEWESTWATER CANYON FLUVIAL SYSTEM (contour interval 10 ft).
FIGURE 7—WESTWATER CANYON A-l ZONE IRON-REDOX MAP showingthat mineralization has been overriden by hematitic oxidation.
[New Mexico Bureau of Mines & Mineral Resources, Memoir 38,1980]

136
WOO ft
MINERALIZATION^.I.O'-.O2 eu3o8
OXIDIZEOI I (Hematite Iron)
•REDUCED(Pyritic Iron)
FIGURE 8—WhsrwATEK CANYON A-2 zoNt IRON-REDOX MAP showingthai uranium mineralization is localized parallel to an iron-redox inter-face.
FIGURE 10—WESTWATER CANYON B ZONE IRONREDOX MAP showing thaiuranium mineralization is localized parallel to an iron-redox interface(see fig. 11 for symbols and scale).
These deposits, clearly geochemical-cell derived, precipitatedperipheral to channel margins of the Westwater Canyon fluvialsystem. Oxidizing processes of the geochernical cell transporteduranium to stationary sites of reduction adjacent to zones ofmaximum permeability. I f a suitable reductant was not present inthe zone adjacent to the iron-redox interface, precipitation ofuranium did not occur. In this sense, geochemical-cell processeswere mobilizing and transporting agents of uranium, but notnecessarily the agent of precipitation. The geochemical cell sup-plied uranium to stationary sites of reduction over extendedperiods of time, which enabled large deposits of uranium toform. Commonly, a zone of reduced ground exists between theiron-redox interface and the uranium mineralization (fig. 12).This relationship is usual in redistributed deposits of the Grantsmineral belt.
C iron-redox pattern, mineralization,and ore controls
The C zone is the uppermost zone of the Westwater Canyon. Itconsists of medium to very coarse arkosic sandstone and aver-ages 50 ft (15 m) in thickness. The C zone mineral trend (fig. 11)is east-west across the section, in contrast to the northeast trendof the underlying zones. Oxidation is sporadic and has no trendor great lateral extent. Unlike the tabular deposits of the underly-ing zones, mineralization is spotty, discontinuous, and very lowgrade—generally less than 0.05 percent eU3O8 (fig. 12). The veryeffective geochemical-cell mineralizing processes in the underly-ing zones were not operative in the C zone; mineralization withinthe C zone represents primary uranium not redistributed bygeochemical-cell processes. In sec. 13, the C zone was apparently
FIGURE 9—WESTWATER CANYON A-3 ZONE IRON-REDOX MAP showingthat uranium mineralization is localized parallel to an iron-redox inter-face (see fig. 8 for symbols and scale).
1400 f t
] MINERALIZATION^i 1.0'-.02 eUjOg
•OXIDIZED(Hemotitc ron)
I I REDUCEDI I (Pyritic Iron)
FIGURE 11—WESTWATER CANYON C ZONE IRON-REDOX MAP indicatingthat uranium mineralization is localized in reduced ground.
[New Mexico Bureau of Mines & Mineral Resources, Memoir 38,1980]

137
JmcsSEC. 13, T I 6 N . R I 7 W
L E G E N D
MINERALIZATIONS 1.0-.02 e U, 0Q
OXIDIZED (Hematitic Iron)
I I REDUCED S.S.(Pyritic Iron)
M P'HALE
LOCATION MAPFIGURE 12—NORTH-SOUTH STRATIGRAPHIC CROSS SECTION showing the straiigraphic zonation of the Morrison Formation (Jurassic) and
localization of uranium mineralization.
above the Late Jurassic-Early Cretaceous water table establishedafter truncation of the Westwater Canyon Sandstone by pre-Dakota erosion. This truncation advanced 1 mi south of sec 13.Primary mineralization in the C zone lying above the pre-Dakotaground-water table was effectively isolated from geochemical-cell redistribution processes.
History of mineralizationThe history of mineralization in sec. 13 and in the Grants
mineral belt is essentially a history of ground-water flow withinthe Morrison fluvial sandstones.
During Westwater Canyon sedimentation and for a substantialperiod after Brushy Basin deposition, the ground-water flow pat-terns were essentially downfan as described by Galloway (thisvolume). The recharge area was in the proximal facies of th* fanin "he Mogollon Highlands, and discharge was in the distai fanareas. Permeability and transmissivity were controlled by sedi-mentary facies. The channel sands transmitted the largest volumeof water. Certainly the primary flow direction in the Grantsregion at this time was east-southeast down the southernmostlobe of the Westwater Canyon alluvial fan (fig. 2). During thisperiod, substantial primary ore deposits were formed at sites ofhumate accumulations.
Recent geochronologic studies by Brookins (1975, 1977) datedauthigenic clay minerals genetically associated with primary ura-nium mineralization at 135 ± 10 m.y. (Jurassic). The upper Mor-
rison sedimentation is dated at 145 ± 10 m.y., and the Dakotasandstone is dated at post-100 m.y. The age difference betweenupper Morrison sedimentation and Dakota sedimentation indi-cates that the Westwater Canyon could have been an aquifer for45 ± 10 m.y. During this period, there was a substantial change inthe ground-water flow of the Westwater Canyon aquifer.
Between Brushy Basin deposition and the beginning of Dakotadeposition, regional tilting to the north caused truncation of pro-gressively older sedimenu to the south, which formed a broad,flat Westwater Canyon outcrop and a new recharge area for theWestwater Canyon aquifer. At this time, a Late Jurassic-EarlyCretaceous geochemical cell advanced along the newly estab-lished hydrologic gradient; it remobilized primary mineralizationthroughout the Westwater Canyon into a major sequence of re-distributed deposits that have persisted to the present. Evidencefor widespread activity of this geochemical cell is the zone ofhematitic oxidation that extends from Church Rock to AmbrosiaLake. The modern hydrologic gradient is similar to the LateJurassic-Early Cretaceous hydrologic gradient because presentregional dip and outcrop positions are similar to the olderfeatures. Minor redistribution of Jurassic-Cretaceousgeochemical-cell deposits near Laramide—and younger—faultsin the Ambrosia Lake area have caused misinterpretation of thetiming of events, as most geologists of the Grants mineral beltconsider this hematitic zone of oxidation to be of Tertiary orQuaternary age.
[New Mexico Bureau of Mines & Mineral Resources, Memoir 38,1980]

138
Evidence for Jurassic-Cretaceous-age oxidation and redistri-bution of uranium mineralization is as follows:
1) Westwater Canyon bleaching, common in the Church Rockarea where the Dakota rests directly on Westwater Canyonsediments, has been interpreted as having been caused bypermeation into Morrison sands by acid waters fromDakota swamps (Squyres, 1972; Granger, 1968). Thisbleaching is superimposed on preexisting oxidized West-water Canyon sediments and displays a gradational contact(fig. 13). Bleaching is thus interpreted to be younger thanthe hematitic oxidation; if this oxida'ion were of Tertiaryor Quaternary age, the bleached zone should also be oxi-dized. Bleaching is very spotty and varies in thickness fromless than a few feet to greater than 30 ft and is not presenteverywhere the Dakota and Westwater Canyon are in directcontact.
2) The elongate tabular pods in the lowest four zones of theWestwater Canyon in sec. 13 obviously were formed bygeochemical-cell redistribution processes. The uppermost Czone of the Westwater Canyon was not influenced by thissame geochemical-cell process, implying that the C zonewas above the Late Jurassic-Early Cretaceous water tableduring the redistribution of the lower units. The BrushyBasin is only 30 ft (10 m) thick in sec. 13 and thins to zerowithin 1 mi south of sec. 13. Therefore, the WestwaterCanyon outcrop in pre-Dakota time was eroded to withinI mi of sec. 13, and the top of the Westwater Canyon wasonly 30 ft (10 m) below the surface. In post-Brushy Basinand pre-Dakota time, the Westwater Canyon Member insec. 13 was not completely saturated, and the C zone wasabove the water table. Since Dakota time, the WestwaterCanyon has been completely saturated. Therefore, if re-distribution were younger than Dakota time, the C zonewould also have been affected by redistribution processeson sec. 13.
3) Organic material loses its mobility and reducing capacitywith age (Leventhal, this volume). Granger (1968, p. B66)reported that organic material in Ambrosia Lake ". . . isnot soluble in common acids, bases, or organic solventsand can be likened to coal which went through a gelatinouspeat stage but has since solidified to a relatively insolublemass largely through a process of aging." However, or-ganic carbon is reported present in redistributed oredeposits in Ambrosia Lake (Harmon and others, 1963;Granger, 1968). If organic material in the Grants mineralbelt is insoluble, why is it associated with redistributed orethat is supposed to have been redistributed in Tertiary or
FIGURE 13—DAKOTA FORMATION RESTS DIRECTLY ON THE WESTWATERCANYON MEMBER OF THE MORRISON FORMATION OWING TO EROSIONALREMOVAL OF THE BRUSHY BASIN MEMBEK (in the Church Rock area);locally, bleaching is superimposed on preexisting hematitically oxidizedWestwater Canyon.
Quaternary times? This inconsistency supports the inter-pretation that the major redistribution process took placemore than 100 m.y. ago when the organic material wasmore mobile and still retained its reducing capacity.
ConclusionsUranium deposits in the Grants mineral belt were formed in-
itially in Westwater Canyon and Brushy Basin time as primarydeposits associated with humate materials in the host rock. Pre-Dakota erosion, resulting from regional tilting to the north,stripped the Brushy Basin Member and generated WestwaterCanyon Member outcrops in an area extending from Gallup toGrants, New Mexico. This erosion formed a new recharge area,and a trend of redistributed deposits formed proximal to ageochemical-cell iron-redox interface extending from ChurchRock to Ambrosia Lake. The position and shape of these re-distributed deposits were controlled by the position and shape ofessentially stationary humate masses in the channel-margin faciesof the Morrison fluvial system. The tabular uranium deposits insec. 13 parallel to iron-redox interfaces were formed by these pre-Dakota geochemical-cell processes. The sporadic primary min-eralization in the uppermost C zone of the Westwater Canyonwas above the post-Brushy Basin and pre-Dakota water table,and the mineralization was not affected by redistribution pro-cesses.
ReferencesBrookins, D. G., 1975, Uranium deposits of the Grants, New Mexico,
mineral belt: Grand Junction, U.S. Energy Research and DevelopmentAdministration (ERDA), Contract No. AT(05-l)-1636-1, 143 p.
, 1977, Uranium deposits of the Grants mineral belt: geochemicalconstraints on origin: Rocky Mountain Association of Geologists,Symposium, p. 337-352
Cooley, M. E., and Davidson, E. S., 1963, The Mogollon highlands—their influence on Mesozoic and Cenozoic erosion and sedimentation:Arizona Geological Society, Digest, v. 6, p. 7-36
Craig, L. C , Holmes, C. N., Cadigan, R. A., Freeman, V. L., Mullens,T. E., and Weir, G. W., 1955, Stratigraphy of (he Morrison and relatedformations: Colorado Plateau region, a preliminary report: U.S. Geo-logical Survey, Bull., v. 1009-E, 168 p.
Granger, H. C , 1968, Localization and control of uranium deposits inthe southern San Juan Basin mineral belt, New Mexico—an hypothesis:U.S. Geological Survey, Prof. Paper 600-B, p. B60-B70
Harmon, G. F., and Taylor, P. S., 1963, Geology and ore deposits of theSandstone mine, southeastern Ambrosia Lake area, in Geology andtechnology of the Grants uranium region, V. C. Kelley, compiler: NewMexico Bureau of Mines and Mineral Resources, Mem. 15, p. 102-107
Harshbarger, J. W., Repenning, C. A., and Irwin, J. M., 1957, Stra-tigraphy of the uppermost Triassicand the Jurassic rocks of the Navajocountry: U.S. Geological Survey, Prof. Paper 291, 74 p.
Hilpert, L. S., 1969, Uranium resources of northwestern New Mexico:U.S. Geological Survey, Prof. Paper 603, 166 p.
Kelley, V. C , I9t>3a, Tectonic setting, in Geology and technology of theGrants uranium region: New Mexico Bureau of Mines and MineralResources, Mem. 15, p. 19-20
, compiler, 1963b, Geology and technology of the Grants uraniumregion: New Mexico Bureau of Mines and Mineral Resources, Mem15, 227 p.
Rapaport, Irving, Hadfield, J. P., Jr., and Olson, R. H., 1952, Jurassicrocks of the Zuni uplift, New Mexico: Oak Ridge, Tennessee, U.S.Atomic Energy Commission RMO-642, Tech. Inf. Service, 47 p.
Rubin, B., 1970, Uranium roll front zonation in the southern PowderRiver basin, Wyoming: Wyoming Geological Association, EarthScience Bull., v. 5, p. 5-12
Saucier, A. E., 1967, TheMorrison Formation in theGallup region: NewMexico Geological Society, Guidebook 18th field conference, p138-144
, 1976, Tectonic influence of uraniferous trends in the LateJurassic Morrison Formation, in Tectonics and mineral resources ofsouthwestern North America, L. A. Woodward and S. A. Northrop,eds.: New Mexico Geological Society, Spec. Pub. 6, p. 151-157
Squyres, J. B., 1972, Uranium deposits of the Grants region, New Mex-ico: Wyoming Geological Association, Earth Science Bull., v. 5, p. 3-8
[New Mexico Bureau of Mines & Mineral Resources, Memoir 38, i960]

139
GEOLOGY OF CROWNPOINT SEC. 29 URANIUM DEPOSIT,McKINLEY COUNTY
by D. W. Went worth, Conoco Inc., 9301 Indian School Rd. N.i-., Albuquerque, New Mexico 87112.D. A. Porter, Conoco Inc., 555 17th Street, Denver, Colorado 80202, and
H. N. Jensen, Conoco Inc., 9301 Indian School Rd. N.E., Albuquerque. New Mexico 87112
AbstractThe Crownpoint Sec. 29 deposit, located in the west-central
part of the Grants mineral belt, represents a relatively recenturanium discovery in the Westwater Canyon Member (Jurassic)of the Morrison Formation. This deposit, estimated as contain-ing up to 10 million pounds of uranium oxide, occurs in four ver-tically separate sandstone units. The average depth of the oremineralization is approximately 2,000 ft (610 m) below theground surface. Present-day structure of the Crownpoint Sec. 29area is relatively simple and consists of gentle north-northeast-dipping strata with no known faulting. This deposit is located inan east-southeast-trending Westwater Canyon depocenter, whosecourse is believed to have been influenced by subtle Jurassicstructure, which was penecontemporaneous with sedimentation.The deposit has been delineated by drilling on 200-ft (60-m)centers, involving approximately 348 holes and is awaiting shaftsinking and mine development.
IntroductionThe Crownpoint Sec. 29 uranium deposit is located in sec. 29,
T. 17 N., R. 12 W., McKinley County, New Mexico, immediately
east of the village of Crownpoint. The deposit is in the Grantsmineral belt, approximately 100 air mi (160 km) northwest ofAlbuquerque and 35 air mi (56 km) northeast of Gallup. The areahas excellent road access from NM-57, which crosses the section(fig. 1).
This paper discusses geological observations about the Crownpoint Sec. 29 deposit—a major uranium discovery. The depositoccurs as a series of tabular ore pods at a depth of approximately2,000 ft (610 m). This exploration-oriented report is based ondata interpreted from the electric and gamma logs of rotary drillholes and a limited number of cores. More detailed informationwill be obtained during the mine development and productionphases of the project.
ACKNOWLEDGMENTS—We appreciate permission given byConoco to publish this paper, and we thank the many people inthe Minerals Department who assisted in its preparation. Specialthanks are extended to L. W. Heiny, who provided encourage-ment and support over the years for the Crownpoint project, andto Rob Lease for his special assistance with this paper.
Exploration historyConoco became interested in the Crownpoint area in the early
1970's as a result of a regional study of the Grants mineral belt.
onding'ock '
Crownpoint
^SECTION 29
BERNALILL0 COUNTY
ALBUQUERQUE
• KNOWN MAJOR DEPOSIT* MINING DISTRICT
10 20 30km
FIGURE 1—INDEX MAPOF GRANTS MINERAL BELT.
[New Mexico Bureau of Mines & Mineral Resources, Memoir 38,1980]

140
These studies indicated a good possibility of finding economicuranium deposits to the north and downdip of the known ura-nium orebodies of the region. Another company had drilleduranium test holes immediately to the east and west of the villageof Crownpoint. Six of these holes were drilled in sec. 29, and twopenetrated strongly mineralized zones at a depth of about 2,000ft (610 m). Electric logs of these holes showed that the host rocksare stratigraphically similar to those in the Ambrosia Lake min-ing district.
Mineral leases in sec. 29 were acquired in August 1972 as aresult of a successful bid for a group of properties offered by theNew Mexico and Arizona Land Company. These properties con-sisted of both fee and Indian-allotted leases. Shortly after ac-quisition, Conoco initiated a first-phase drilling program on thesec. 29 properties. Three north-south fences with 800-ft (245-m)spaced holes were drilled across the northern part of the sectionto determine the extent of the previously discovered mineraliza-tion. This program was unusually successful; seven of the nineholes drilled penetrated ore-grade mineralization. At this time, amajor multi-horizon deposit seemed to have been discoveredtrending east-west across the northern part of the section. Apotential ore-reserve estimation was made, based on 15 wide-spaced holes, which did not vary appreciably from reserves calcu-lated after the deposit had been completely delineated on 200 ft(60 m) centers. The additional drilling of 333 holes confirmed thepresence of a major uranium deposit and provided necessary in-formation concerning the configuration of the individual orepods, distribution of grade, and other data needed for mine plan-ning. Ore delineation was carried out in two phases conducted on400-ft (120-m) and 200-ft (60-m) centers. This deposit is nowawaiting shaft sinking and mine development.
Current ore-reserve estimates indicate that the deposit maycontain up to 10 million pounds (4,500 metric tons) of in-placeuranium oxide. The actual number of pounds that may be real-ized is dependent on several factors, some of which are: royaltyburdens, severance taxes, environmental restraints, capital andproduction costs, and the future price of uranium.
Geologic settingStratigraphy
Sandstone units of the Westwater Canyon Member of the Mor-rison Formation (Upper Jurassic) a. c the hosts for the Crown-point Sec. 29 uranium deposit (fig. 2). Overlying the MorrisonFormation are approximately 1,750 ft (530 m) of Cretaceousrocks that include the Dakota Sandstone, Mancos Shale, andMesaverde Group. Rock units below the Morrison Formation areinterpreted to consist of approximately 3,900 ft (1,180 m) of Up-per Jurassic, Triassic, and Paleozoic sediments resting on aPrecambrian crystalline basement.
In the subsurface of the Crownpoint area, three members ofthe Morrison Formation are recognized (in ascending order):Recapture Member, Westwater Canyon Member, and BrushyBasin Member. The regional depositional patterns and sourceareas for these members have been described by Craig and others(1955), Saucier (1976), and Galloway (1978).
The Recapture Member has a thickness of 255-270 ft (78-82m). This unit is composed of red-brown and grayish mudstonesand siltstones with interbeds of fine- to medium-grained whitesandstone. The contact between the Recapture and overlyingWestwater Canyon Member appears to be contormable in theCrownpoint area.
The Westwater Canyon Member is the host unit for theuranium deposits of sec. 29 and is 250-350 ft (76-107 m) thick. Itconsists of a series of gray- to light-red, fine- to medium-grained,feldspathic sandstones with a number of well-defined mudstonebeds of variable thickness. The sandstones are generallycrossbedded, poorly sorted, and only moderately well cemented.Subsurface studies made with electric logs show that the member
o<s TWOWELLS SS TONGUE
<f> W H I T E W A T E RO^ ARROYO SHALE
5 TONGUE
1500 -
DAKOTA SANDSTONE 1600 ,
I - l'-4
Z
o BRUSHY BASIN
MEMBER
1750 » f r f - I—
<
5a:
ou.
a.
A
B
CP
SAND
SAND
MUDSTONE
zoCO
<rtro
zo>-z<to
II-<nS
RECAPTURE MEMBER
FIGURE 2—ELECTRIC LOO SHOWING THE RELATIONSHIP OF THE MAJOR OREZONES TO THE WESTWATER CANYON MEMBER OF MORRISON FORMATION,SEC. 29, T. 17N. .R . 12 W.
is separated by mudstone beds into five distinct sandstone unitsthat are informally termed, in descending order, the A, B, C, D,and E sands (fig. 2). The sandstones are 30-100 ft (9-30 m) thickand are correlated across sec. 29, with only an occasional inter-ruption resulting from the erosion of the intervening mudstoneunit. The mudstone units are colored pale green with sparse redmottling and range from a few inches to more than 30 ft (9 m)thick. The most persistent mudstone bed separates the B sand
[New Mexico Bureau of Mines & Mineral Resources, Memoir 38,1980]

141
FIGURE 3—STRUC TLiRt: MAP CONTOURED ON THE TOP OK THE Twowti i sSANDSTONE.
from the C sand in the upper part of the Wesiwater Canyon andis designated the CP mudstone.
The Brushy Basin Member consists of 80-125 ft (24-38 m) ofpale-green, bentonitic mudstone with lenses of siltstone and gray,fine- to medium-grained sandstone. It conformably overlies theWestwater Canyon Member, and its basal mudstone units inter-tongue with the upper sandstones of the Westwater Canyon. TheBrushy Basin Member is separated from the overlying DakotaSandstone (Cretaceous) by a regional unconformity that showsconsiderable relief in the Crownpoint area.
StructureThe area containing the Crownpoint Sec. 29 deposit is located
on the Chaco slope, a gently dipping structural terrace betweenthe Zuni uplift to me south and the inner San Juan Basin to thenorth. The strata in sec. 29 have north-northeast dips of 1-2°.Northeast-trending normal faults with limited displacementshave been mapped in the Crownpoint area, but no faults areknown to cut the ore-bearing beds in sec. 29.
A structure map contoured on the top of the Twowells sand-stone (Upper Cretaceous) shows a gentle northward dip of 1-2°(fig. 3). A similar structure map contoured on the base of the CVmudstone of the Westwater Canyon Member also shows a gentlenorthward dip that is interrupted by local anticlinal nosing in thenorth-central part of sec. 29 (fig. 4). This nosing does not appearto have affected the main Westwater Canyon depositional pat-terns, and no significant evidence of this structure has beenfound above the base of the Dakota Sandstone. This structuralfeature probably was formed during the period of deformationthat occurred on the Colorado Plateau near the end of the Juras-sic Period (Kelley, 1955).
Paleostructural-depositional relationshipsThe Morrison Formation in northwest New Mexico is a se-
quence of fluvial and lacustrine sedimentary rocks that weredeposited in a series of coalescing alluvial fans on the northernslope of the ancient Mogollon Highland (Craig and others,1955). The Mogollon Highland is believed to have been located insoutheastern and southern Arizona. The general direction ofstream flow in the Crownpoint area was east-southeast, roughlyparallel to the axis of the ancient Zuni uplift on the south. Theconfiguration of the Westwater Canyon depositional fan in thearea of the Grants mineral belt probably was influenced by wide-spread but subtle tectonic processes that were active duringdeposition. The influence of tectonic movement penecontempo-raneous with Westwater Canyon deposition has been recognizedpreviously (Hilpert and Moench, 1960; Moench and Schlee,1967; Saucier, 1976).
A series of normal, east-southeast-striking basement stepfaults is believed to lie parallel to the Zuni uplift. These faultsalso are believed to be downthrown to the north and occur atrelatively regularly spaced intervals. Initiation of the faulting isthought to be pre-Morrison and may be as old as Precambrian.Recurrent movement along these basement faults may be re-flected in the depositonal patterns of several overlying sedimen-tary units, including the Westwater Canyon Member.
Movement along these basement faults is believed to have in-fluenced Morrison Formation paleotopography. Subtle down-
N/2of Section 29T.17N..R.12W. 1/4MI
FIGURE 4—STRUCTURE MAP CONTOUREDON THE BASE OF THE CP MUDSTONE.
[New Mexico Bureau of Mines & Mineral Resources, Memoir 38,1980]

142
warping, produced by subsiding fault blocks, was transmitted tothe surface and formed broad, shallow troughs that affected theoverall depositional patterns of the Westwater Canyon sandstoneunits. Regional subsurface mapping of the Westwater Canyonfluvial systems shows that sedimentation was influenced bysubtle positive and negative structural movements. Subsidencealong these fault trends appears to have accelerated moderatelyduring deposition of the uppermost Westwater Canyon Memberand to have resulted in .hick accumulations of channel sand-stones confined to the broad troughs. The result of this deposi-tion was development of an extensive system of southeast-trending structurally influenced depocenters, up to 2 mi wide,across the western part of the Grants mineral belt.
The Crownpoint Sec. 29 deposit is associated with such a depo-center. Isopach mapping (fig. 5) shows that the axis of thedepocenter follows a nearly east-west course across sec. 29,where the maximum sandstone thickness in the Westwater Can-yon is approximately 350 ft (106 m). In places near the southernlimit of the section, total Westwater Canyon thickness decreasesto approximately 250 ft (76 m); north of the section, the West-water Canyon Member also thins significantly. The increase insand thickness is mainly the result of an increase in number andthickness of sandstone units deposited in the upper part of theWestwater Canyon Member. These upper sandstone units inter-tongue with the basal Brushy Basin Member mudstone units.
Ore depositsThe Crownpoint Sec. 29 deposit is similar in host rock, ore
geometry, and uranium minerals to other large deposits in theGrants mineral belt. Uranium minerals were identified by x-raydiffraction and microprobe studies of core. Coffinite is themajoi uranium mineral, with sparse to minor amounts of amor-phous urano-organic clay complexes. Secondary uranium miner-als are sparse; they include carnotite, zippeite, and schroeking-erite. The zippeite and schroekingerite probably were derivedfrom the oxidation of core samples (Lee, 1976).
Uranium concentrations occur as a series of pods in well-developed channel sandstones composing the upper three-fourthsof the Westwater Canyon Member. The individual pods are ir-regular in configuration and are elongated and parallel to theregional sedimentary trends (N. 70-80° W.). Ore pods occur inthe A, B, C, and D sandstone units (fig. 2), and within each sand-stone unit the pods may overlap, coalesce, or occur en echelon.Individual pods range from a few feet to 200 ft (60 m) wide andfioni a few inches to 20 ft (6 m) thick. Collectively, the ore podscompose the Crownpoint Sec. 29 deposit, which is approximately2,000 ft (610 m) wide and extends across the length of the section(tig. 6).
In sec. 29, uranium occurs in successively lower sandstoneunits from south to north. Thus, deposits in the D sand are far-ther north and structurally deeper than those in the upper threesandstone units (fig. 7). The opposite occurs at Ambrosia Lake,where the ore deposits ascend in stratigraphic level downdip tothe north. The Crownpoint deposits seem to be the result ofdissolution and differential movement of uranium downdip byoxygenated ground waters. The main ore deposits in the C and Dsands appear to have been moved northward from their originallocation. Small remnants of C and D ore are preserved along thesouth side of the Crownpoint Sec. 29 deposit (fig. 6). Studies ofWestwater Canyon drill-cuttings samples suggest that the north-ward movement of the ore in the C and D sands was impeded bya decrease in grain size and permeability in the northern part ofthe Crownpoint depocenter. The ore deposits in the upper, morelenticular A and B sands seem to have been less affected by ox-idizing ground waters, and their ore deposits remain very close towhere they were emplaced originally.
The oxygenated ground waters that apparently moved the orein the C and D sands may have been associated with a regionaloxidation front. Westwater Canyon Member sandstone unitshave been altered by a northward encroaching front covering a15-mi (24-km) distance from the outcrop to the southern edge ofthe Crownpoint Sec. 29 deposit. In the southern part of sec. 29,the gray pyritic sandstones of the Westwater Canyon Memberhave been altered by oxidation to a reddish, hematitic color.Here the alteration pattern is complex, and vertically separatesandstone units in a single drill hole generally exhibit differentdegrees of oxidation. The oxidation represents a dissipating anddestructive force and is believed to have destroyed uraniumtrends previously existing south of the present front. Saucier (thisvolume) believes that this front was formed during the Miocene-Holocene cycle of erosion.
Ore genesisRubidium-strontium age dating of ore-stage clay minerals sup-
ports a Late Jurassic age (139 m.y.) of uranium mineralizationfor the Crownpoint Sec. 29 deposits (Lee and Brookins, !978).Squyres (1972) postulates a similar age for deposits at AmbrosiaLake. The deposits probably began to form during the time ofWestwater Canyon deposition. The uranium in the sec. 29 areawas introduced by ground water migrating down-gradient in aneast-southeast direction along the strike of porous sandstoneunits. These ground waters probably were slightly alkaline andcarried uranium in the form of carbonate complexes (Hostetlerand Garrels, 1962). The uranium could have been derived bothfrom the weathering of volcanic ash in the Mogollon Highlandsource area and from volcanic material deposited in the West-water Canyon Member.
N/2 Section 29T.17N..R.12W.
F I G U R E 5—ISOPACH MAP OF WESTWATER CANYON MEMBER ON SEC. 29 , T. 17 N . , R. 12 W .
[New Mexico Bureau of Mines & Mineral Resources, Memoir 38,1980]

143
T I 7 M F512W^EXPLANATION -
[~]"A"ORE ZONE £3 "CORE ZONE
(2^]"B"ORE ZONE \^\ "D" ORE ZONE
FIGU RE 6—ORE-ZONE MAP SHOWING DISTRIBUTION OI ORU ON NORTHERN H ALI OI si;t. 29.
The ground waters migrating through the Crownpoint regionhad a relatively uniform uranium content at the time the depositswere emplaced in sec. 29. The controlling factor for ore emplace-ment seems to have been the presence of large buried masses oforganic derivatives. Evidence for the association of organicmaterial with the ores of the Grants mineral belt is well known(Granger, 1963; Kelley, 1963; Moench and Schlee, 1967), and thepresence of organic material in these ores has caused minor mill-ing problems over the years (Matthews, 1963). This organicmaterial appears in the form of humates, which are humic-acidderivatives that contribute to the dark color of the ores.Examination of cores has shown that many of the high-grademineralized zones at sec. 29 are black, which is similar to the oreproduced in the Ambrosia Lake mining district.
The uranium deposits in sec. 29 are thought to have been em-
placed originally as a result of a chemical reaction betweenuranium-bearing ground waters and elongate humate masseslocated along the southern margins of several east-southeast-trending channels within the Crownpoint depocenter. An addi-tional factor appears to have been the proximity of well-developed mudstone beds associated with this part of thedepocenter; they may have controlled the localization of thehumate masses and also acted as adsorbants.
SummaryThe Crownpoint Sec. 29 deposit represents a significant
uranium discovery in the western part of the Grants mineral belt.Conoco acquired the sec. 29 leases in 1972 and subsequentlydelineated an east-west trending deposit, which involved the drill-
F1GURE 7—DIAGRAMMATIC CROSS SECTION SHOWING DISTRIBUTION OF ORE ZONES IN NORTH-CENTRAL PART OF
SEC. 29.
[New Mexico Bureau of Mines & Mineral Resources, Memoir38,1980]

144
ing of 348 holes on a 200-ft (60-m) grid. The widespread holesof the first phase of exploration were unusually successful and in-dicated that a major ore deposit might be present in the section.The results of additional drilling using closer spacing dem-onstrated that the deposit may contain up to 10 million pounds(4,500 metric tons) of in-place uranium-oxide reserves. The ac-tual amount recovered will be determined by a number ofeconomic factors, some of which are difficult to predict at thistime.
The uranium mineralization in sec. 29 occurs in multiple hori-zons in the Westwater Canyon Member of the Morrison Forma-tion (Upper Jurassic) at depths of approximately 2,000 ft (610m). Regional subsurface studies in the western part of the Grantsmineral belt have shown that the ore-bearing sandstone units ofthe Crownpoint Sec. 29 deposit were deposited in an east-southeast-trending fluvial depocemer. Original mineralization insec. 29 probably was emplaced parallel to the fluvial trends soonafter deposition. Mineralization is believed to have been localizedby the presence of masses of humic material in the WestwaterCanyon Member. The individual uranium deposits occur inelongate pods and usually are located in successively lower sand-stone units from south to north. The deposits in the lower sandsappear to have been shifted northward from their original site ofemplacement. These deposits have been encroached upon fromthe south by a destructive regional oxidation front.
ReferencesCraig, L. C , Holmes, C. N., Cadigan, R. A., Freeman, V. L., Mullens,
T. E.,and Weir, G. W., 1955, Siraligraphy of the Morrison and relatedformations, Colorado Plateau region, a preliminary report: U.S. Geo-logical Survey, Bull. 1009-E, p. 125-168
Galloway, W. E., 1978, Morrison Formation, Colorado Plateau, inDepositional and groundwater flow systems in the exploration foruranium: University of Texas (Austin), Bureau of Economic Geology,p. X-l-X-15
Granger, H. C , 1963, Mineralogy, in Geology and technology of theGrants uranium region, V. C. Kelley, compiler: New Mexico Bureau ofMines and Mineral Resources, Mem. 15, p. 21-37
Hilpert, L. S., and Moench, R. H., 1960, Uranium deposits of thesouthern part of the San Juan Basin, New Mexico: Economic Geology,v. 55, p. 429-464
Hosteller, P. B., and Garrels, R. M., 1962, Transportation and precipita-tion of uranium and vanadium at low temperatures with special refer-ence to sandstone-type uranium deposits: Economic Geology, v. 57,no. 2, p. 137-167
Kelley, V. C , 1955, Regional tectonics of the Colorado Plateau and rela-tionships to the origin and distribution of uranium: University of NewMexico, Pubs, in Geology, no. 5,120 p.
, compiler, 1963, Geology and technology of the Grants uraniumregion: New Mexico Bureau of Mines and Mineral Resources, Mem.15, 277 p.
Lee, M. J., 1976, Geochemistry of the sedimentary uranium deposits ofthe Grants mineral belt, southern San Juan Basin, New Mexico: Ph.D.thesis, University of New Mexico, 241 p.
Lee, M. J., and Brookins, D. G., 1978, Rubidium-strontium minimumages of sedimentation, uranium mineralization and provenance, Mor-rison Formation (Upper Jurassic), Grants mineral belt. New Mexico:American Association of Petroleum Geologists, Bull., v. 62, no. 9, p.1673-1683
Matthews, D. C , 1963, 'Rudiments of uranium ore metallurgy, in Geol-ogy and technology of the Grants uranium region, V. C. Kelley, com-piler: New Mexico Bureau of Mines and Mineral Resources, Mem. IS,p. 268-270
Moench, R. H.,andSchlee, J. S., 1967, Geology and uranium deposits ofthe Laguna District, New Mexico: U.S. Geological Survey, Prof. Paper519, 117 p.
Saucier, A. E., 1976, Tectonic influence on uraniferous trends in the lateJurassic Morrison Formation, in Tectonics and mineral resources ofsouthwestern North America, L. A. Woodward and S. A. Northrop,eds.: New Mexico Geological Society, Spec. Pub. 6, p. 151-157
Squyres, J. B., 1972, Uranium deposits of the Grants region, New Mex-ico: Wyoming Geological Association, Eaith Science Bull., v. 5, p. 3-12
[New Mexico Bureau of Mines & Mineral Resources, Memoir 38,1980]

14S
GEOLOGY OF EASTERN SMITH LAKE ORE TREND,GRANTS MINERAL BELT
by Steven J. Ristorcelli, Western Nuclear, Inc., 6001 Osuna Road N.E.,Albuquerque, New Mexico 87109
AbstractThe sandstones in the Brushy Basin Member of the Morrison
Formation (Jurassic) are the ore-bearing horizons of the easternSmith Lake area. The Brushy Basin Member in this district con-sists of three sandstones with interbedded mudstones. Only thelower two sandstones contain ore. The sandstones are fine tocoarse grained, well rounded, and arkosic, representing con-tinental stream sediments. The lower sandstone contains roll-front ore. The redox interface is laterally extensive and welldefined, extending at least 7 mi (11 km) west of the Bluewaterfault zone. The ore generally occurs at the redox boundary butoccasionally will be up to 1,500 ft (450 m) updip. Limoniticalteration, where present, is downdip from the hematitic zoneand is 100-1,500 ft (30-450 m) wide. The middle sandstone con-tains both trend ore and roll-front ore. The trend ore occursdowndip from the redox front in unoxidized ground. The redoxfront in the middle sand is also laterally extensive but displays awedge shape, rather than a C shape. The clay assemblages of thetwo types of ore are different: the trend ore occurs in sands withthe pore spaces filled with kaolinite; the roll-front ore is
associated with altered illite-montmorillonite as grain coatings.Hematitic alteration is associated with the latter. A second stageof kaolinite coats the illite-montmorillonite. Two periods of min-eralization are suggested, but no absolute dates are known. Thetrend ore is the oldest (Jurassic?) and is similar to the ore foundin unoxidized ground elsewhere in the Grants region. The roll-front ore could be Laramide or post-Laramide because of itsassociation with local Laramide structures.
IntroductionThis paper reviews the stratigraphy, structure, and uranium
deposits discovered at Smith Lake by Western Nuclear, Inc. Theage and mode of ore genesis in the area is discussed in terms ofpetrography, cross sections (showing alteration), lithologies, andstructures.
Western Nuclear's exploration program was conducted on5.75 sq mi southwest of Smith Lake, McKinley County, NewMexico. The company's property is located about 8 mi (13 km)north of 1-40 (fig. 1) on the escarpment formed by the Entrada
VALENCIA CO.. MT.
TAYLOR
MC KINLEY COVALENCIA SCALE
FIGURE I—LOCATION MAP.
[New Mexico Bureau of Mines & Mineral Resources, Memoir 3S, 1980]

146
Sandstone and Morrison Formation (both Jurassic) and iscapped by the Dakota Sandstone (Cretaceous). The sections dis-cussed herein include SE'/< sec. 18, NW/4 sec. 20, SE'/i sec. 17,sees. 21, 25, 26, and 27, T. 15 N., R. 13 W., and parts of sees. 29and 30, T. 15 N., R. 12 W. This study is based on informationfrom the company's property only.
Western Nuclear discovered uranium mineralization in thearea of the Ruby well in 1968. Earlier exploration had been con-ducted by other companies in 1955 and 1960. Sections drilled bythe company in 1968 are held in a joint venture with the NewMexico-Arizona Land Company and Reserve Oil and MineralsCorporation with Western Nuclear acting as operator. Addi-tional properties along the trend were acquired by the companyin 1972 and 1976. Presently 3,680 acres are held, mostly in T. 15N.,R. 13 W.
ACKNOWLEDGMENTS—I thank Western Nuclear, Inc. and NewMexico-Arizona Land Company for the opportunity to publishthis paper. The critical reviews by M. E. Vazzana and the staff at
the Albuquerque exploration office of Western Nuclear were ex-tremely helpful. I am indebted to D. G. Brookins of the Univer-sity of New Mexico and to the Department of Energy for theircontributions in the ongoing age-dating research, which indirect-ly helped in the understanding of these deposits. The GeologyDepartment at the University of New Mexico furnished theequipment used in the preparation of this paper. Finally, muchof the data would have been inconclusive without the discussionsand contributions by M. A. Merrick and R. H. Hicks.
StratigraphyDrilling at the Smith Lake property concentrated on the
Brushy Basin Member of the Morrison Formation (Jurassic) withonly local penetration of the Westwater Canyon Member to theRecapture Member. Detaile 'ithologic descriptions are limitedto the Brushy Basin Member, although the other units are de-scribed briefly. Fig. 2 shows a generalized stratigraphic section of
LITHOLOGY
DESCRIPTIONS
(SEE TEXT FOR MORE DETAILED DESCRIPTIONS)
GENERALIZEDELECTRIC LOG
S.P. RESISTIVITY
SHALES AND SILTSTONES
SANDSTONES:MASSIVE AND CROSSBED0ED AND
PLANAR CROSSBEDDING
COAL LENSES UP TO 3'
MUDSTONES: GREEN-GRAY,
FINELY BEDDED
SANDSTONES: CROSSBEDDED
FINE TO VERY COARSE,
GRAY TORED.FELDSPATHIC
MAROON MUDSTONE
MUDSTONES: RED.GRAY, GREEN,GENERALLY LESS THAN 5' THICK
SANDSTONES: REDDISH-BROWN
TO ORANGE, CROSSBEDOED
FINE TO COARSE-GRAINED AND
FELDSPATHIC
RED.GRAY, GREEN,THIN-BEDDED
MUDSTONES AND SILTSTONES ' 480
FIGURE 2—GENERALIZED STRATIORAPHIC SECTION AND bLECTRic LOG OF THE MORRISON FORMATION AT SMITH LAKE.
[New Mexico Bureau of Mines & Mineral Resources, Memoir 38,1980]

147
the study area. The accompanying electric log shows an idealizedprofile of the self-potential and resistivity profiles.
The Morrison Formation in this area comprises three mem-bers: Recapture, Westwater Canyon, and Brushy Basin. Theyrepresent continental fluvial deposits with minor lacustrinesediments. Brushy Basin flow directions in the Smith Lake areaare generally to the east. The Morrison Formation is unconform-ably overlain by the Dakota Sandstone (Cretaceous).
The lowest member of the Morrison Formation is the Recap-ture Member, composed of a series of variegated mudstones,shales, and siltstones ranging in color from gray to green to red.The top of this unit is defined as the base of the lowermostWestwater Canyon sandstone.
The Westwater Canyon Member is composed of sandstone(about 90 percent) with minor interbedded mudstone. The sand-stones are arkosic (5-15 percent feldspar) and poorly sorted.The lithologies of the Westwater Canyon sandstones are identicalto the sandstones of the Brushy Basin Member except for theirubiquitous oxidation. The mudstones in the Westwater Canyonrarely reach 5 ft (2 m) in thickness and are green gray, maroon,or red. The total thickness of this member ranges from 180-220 ft(55-67 m). The contact with the overlying Brushy Basin Memberis often defined as above the uppermost maroon mudstone.
On Western Nuclear property, the Brushy Basin consists ofthree sandstone units separated by mudstones. This subdivisioninto the lower, middle, and upper sandstones is convenient.However, the stratigraphy becomes exceedingly complex under-ground, where the ore-bearing units are further subdivided intoseveral ore beds.
Because of the erosional contact with the Dakota Sandstone,the Brushy Basin Member is 80-180 ft (24-66 m) thick, averagingabout 120 ft (37 m). The individual sandstone units range up to80 ft (24 m) thick and make up approximately 50 percent of theBrushy Basin Member. The sandstones are generally arkosic(10-15 percent feldspar) and very poorly sorted, with moderatelyrounded to well-rounded grains. The high clay/sand ratio in partcauses these sandstones to be poorly consolidated and gives themtheir distinctive green-gray color. Pyrite content may be as highas 5 percent.
Both high-energy and low-energy environments are displayedin the lithologies of the Brushy Basin Member. Clasts reachingone inch (2.5 cm) in diameter indicate high-energy environments,
whereas thin limestone beds near the base of this member in-dicate low-energy systems with low influx of clastic sediments.The paleocurrent direction of these sediments is to the east-southeast.
Complexities in stratigraphy arise when units coalesce to formmajor beds or become extensively interbedded with mudstonesand eventually pinch out. Fig. 3 illustrates the interfingeringcharacter of the beds within the Brushy Basin Member. Thiscross section, oriented approximately east-west, cuts across bothstream channels and meander bends, accounting for the disap-pearance of the sandstones in several places. Fig. 3 is an idealizedcross section displaying stratigraphic and ore-stratigraphic rela-tionships. Neither alteration nor mineralization has been foundin the upper sandstone, and the vertical exaggeration accentuatesthe amount of ore present.
The Dakota Sandstone (Cretaceous) unconformably overliesthe Brushy Basin Member, which comprises two major sandstoneunits with interbedded carbonaceous shale. The sandstones arefine grained and very well sorted, with subangular grains—distinctly different from the Brushy Basin sands. The sandstonesare massive or crossbedded. In outcrop, the Dakota sandstonesare buff to orange, whereas the unweathered sandstones rang<*from white to gray to orange. At least one approximately 2-ft(0.6-m) coal lens is present near the base of the Dakota. This bed,and some of the lower sandstones, contain local gamma anom-alies, none of which are of economic significance.
In general, very high resistivity values and extremely lowspontaneous-potential values of the lower Dakota sands distin-guish them from those of the Brushy Basin Member. However,occasionally these sands are poorly sorted and their distinctionfrom the Brushy Basin sands is not clear. In such cases the elec-tric log profiles are similar, making the contact obscure.
The Mancos Shale (Cretaceous) overlies the Dakota Sandstoneand consists of shales, siltsiones, fine-grained sandstones, andsome limestone lenses. In outcrop, the sandstones are buff, andthe unweathered sandstones are white.
StructureUplifts and basins formed during the Laramide are believed to
be the cause of the structural features seen throughout the SanJuan Basin. A change of the ground-water flow during the Lara-
W
^ # ^ ^
too"
HORIZ.
U-UPPER SANDSTONE
M-MIDDLE SANDSTONE
L-LOWER SANDSTONE
2,000'
SCALES(APPR0X.)
Ex3SANDSTONE
•MUDSTONES AND SILTSTONES
^ O R E
[«]DAK0TA SANDSTONE
HBRUSHY BASINMEMBER " ^
QWESTWATER CANYON MEMBERJ
FIGURE 3—GENERALIZED EAST-WEST CROSS SECTION THROUGH THE SMITH LAKE AREA.
[New Mexico Bureau of Mines & Mineral Resources, Memoir38,1980]

148
mide from a south direction to a north direction resulted fromthe downdropping of the San Juan Basin, allowing oxygenatedwaters to enter the strata and form redox fronts (Galloway,1978). The subparallel trend of these redox interfaces to theMariano anticline implies an intimate relationship between struc-ture and location of roll-front ore.
The Smith Lake property lies along and is roughly parallel tothe southern margin of the Chaco slope. Regional dip is uniformat about 2° to the north-northeast. The lower sandstones of theMancos and occasional sandstones of the Dakota form the dipslope.
Three major structural elements in this area (fig. 4) isolate theSmith Lake ore trend from other bodies and districts in theGrants mineral belt. These elements are the Bluewater fault tothe east, the Mariano Lake anticline to the north, and the Pine-dale monocline several miles to the west.
The Bluewater fault zone is a series of high-angle, en echelon,normal faults, downthrown to the east. No strike-slip motion hasbeen noted on these or any of the faults in the area (J. F. Robert-son, personal communication, 1978). The stratigraphic separa-tion in sec. 29, T. 15 N., R. 12 W., is approximately 175 ft (53m). Folds adjacent to the fault indicate the presence of a rupturedmonocline.
The Mariano Lake anticline is the northern boundary of thearea; it extends from near the Bluewater fault zone on the east tothe Pinedale monocline on the west, where it loses definition. Theanticline has a maximum structural relief of about 200 ft (60 m)and plunges to the northwest.
The Pinedale monocline plays only a minor role in the geologyof the area. The monocline trends northwest at the western endof the Mariano Lake anticline, 7 mi west of the company's prop-erty, and dips to the northeast with a maximum dip of 27 °.
MineralizationThe three sandstones of the Brushy Basin Member of the Mor-
rison Formation are discussed in ascending order. The termalteration is used in the context of alteration associated with theredox interfaces and not the low Eh and pH alteration in theMorrison Formation as defined by Austin (1963). The term roll isused in the sense of Wyoming- and Texas-type roll fronts unlessotherwise indicated.
Figs. 5, 6, and 7 are schematic cross sections through theBrushy Basin Member showing stratigraphic relationships andgeometry of the orebodies. The detailed lateral and vertical litho-logic changes within the sandstones have not been shown, andmany mudstone lenses are assumed to exist. The following dis-cussion will describe relationships from east to west, beginning insec. 29, T. 15 N., R. 12 W. and ending in the SEW sec. 18, T. 15N.,R. 13 W.
Lower sandstone unitThe lower sandstone ore deposits have features similar to the
well-documented sandstone roll-front deposits found elsewhereiv the United States. Throughout much of the trend, a well-defined " C " geometry and pyritic-limonitic-hematitic alterationpattern is found. Ore generally occurs at the limonite-unoxidizedboundary.
The lower sandstone is generally less than 20 ft (6 m) thick atthe east end of the property and is laierally continuous through-out much of sec. 30. This sandstone contains more shale at thesouthern edge of the section. No well-defined channel has beennoted.
Farther west, the location of the lower sandstone orebody and
SCALE = IMILE(l.6Km)
ANTICLINE
FIGURE 4—STRUCTURE AND PROPERTY MAP OF THE SMITH LAKE AREA.
[New Mexico Bureau of Mines & Mineral Resources, Memoir 38,1980]

149
SOUTHUNCONFORMITY
CRETACEOUS DAKOTA SANDSTONES
_¥'
• ' • - ' % : H E M i T IT IA - ' - . . ' . : - ' :.'tS
^ M I N E R A L I Z E D AREAS
^ 3 GREEN-GRAY MUDSTONES
i j ^ l c O A R S E - G R A I N E D , POORLY SORTED SANDSTONES (Jmbb)° ' —3
I ;•'•••"•• IFINE-GRAINED.WELL-SORTED SANDSTONES (Kd)
FIGURE 5 — D I A G R A M M A T I C NORTH-SOUTH CROSS SECTION THROUGH THE EASTERN END OI- THE PROPERTY AT S M I T H LAKE.
SOUTH.UNCONFORMITY
FINE-GRAINED , -CARBON RICH
CRETACEOUS DAKOTA SANDSTONES NORTH
"v-v-TT:*/•••*••*.• - . ^ T i r Y ^ ^ E L , ~ ™ - ^ S f - ,-r.> i^jLja^'.'r.*.\.v'*,'-^»•."!•• \*•'.•**"S•>;:• ' >±?
_ AREAS fgS o
= 3 g GREEN-GRAY MUDSTONES jjjgjjj CO
I'^-^l COARSE-GRAINED , POORLY SORTED SANDSTONES (Jmbb) Qj
|ff:r|| FINE-GRAINED .WELL-SORTED SANDSTONES (Kd)
F I G U R E 6 — D I A G R A M M A T I C NORTH-SOUTH CROSS SECTION THROUGH T H E CENTRAL PART OF T H E PROPERTY AT S M I T H LAKE.
[New Mexico Bureau of Mines & Mineral Resources, Memoir 38,1980]

ISO
SOUTH.
UNCONFORMITY
CRETACEOUS DAKOTA SANDSTONES NORTH
»o'
I MINERALIZED AREAS
I GREEN-GRAY MUDSTONES
COARSE-GRAINED, POORLY SORTED SANDSTONES (Jmbb)
: - I FINE-GRAINED.WELL-SORTED SANDSTONES (Kd)
F I G U R E 7 — D I A G R A M M A T I C NORTH-SOUTH CROSS SECTION T H R O U G H T H K WKSTCRN K N U oh T H K PROPERTY AT S M I T H LAKK.
of the redox interface is controlled predominantly by changes inlithology. The interface conforms to the southern edges ofBrushy Basin mudbanks. The ground-water flow direction sug-gested by this alteration configuration indicates that the fluidswere derived from the south-southwest, an interpretation thatsuggests post-Laramide (?) fluid migration. Overall, the interfacetrends west-northwest.
Alteration along the front is consistent with that of other rollfronts: the hematitic rock updip becomes limonitic rock downdipand finally becomes unoxidized. This alteration sequence is lo-cated throughout much of the trend but is not everywhere com-plete or of similar width. For example, in the eastern part of theproperty, a redox interface exists, but it contains neither limonitenor ore. The ore here is about 1,000 ft (300 m) south of the redoxinterface, possibly existing as a remnant pod (fig. 5). Continuingwestward, the front wraps around the southern end of a mud-bank of considerable size. Typical alteration sequences appearwest of this mudbank, and the ore is located within the limoniticsandstone (fig. 6). In some locations, the ore extends into un-oxidized gray sandstone and updip into the hematitic alterationzone. Alteration is an excellent guide to exploration for thisorebody, which can be classified as a roll-front deposit. Thewestward extension of the orebody is presently being mined byWestern Nuclear in the Ruby No. 1 mine.
At the far west end of the property, the limonitic alteration/one widens to a maximum of 1,500 ft (450 m). The mineraliza-tion is still confined to the limonite zone but occurs at the updiplu undary with the hematite zone (fig. 7). The mineralization isu regular and only locally reaches ore grade. The uranium seemsin be associated with mudstone lenses within this sandstone,probably held by the adsorptive properties of the clays.
Middle sandstone unitOf the two ore-bearing sandstones, the middle sandstone
displays the greatest variation from a typical roll-front orebody.The middle sandstone displays great variation in ore occurrencestratigraphically, geometrically, and spatially with respect to theredox interface. Near the eastern edge of the property, no altera-
tion or mineralization has been found in the middle sandstone.Farther west, uranium occurs but shows no apparent relationshipto the alteration (fig. 5) and is here interpreted as trend ore.Mineralization occurs 1,000-2,000 ft (300-600 m) downdip of theredox interface. The sandstone is 45 ft (14 m) thick and is gener-ally unoxidized; however, local, discontinuous areas of hematiticand limonitic alteration have been found. Mineralization is ex-tremely discontinuous, existing in all horizons of the sandstoneas blanket-like ore pods with no apparent preferred direction ofelongation. The ore seems both to crosscut and to be controlledby primary sedimentary features such as crossbedding. It occursstratigraphically higher to the west in fine- to very coarse grainedsands with accessory pyrite. In hand specimens at least 50 percentof the feldspars are altered to kaolinite(?). Uranium is generallyassociated with calcite cement, which makes the mineralizedsandstone well indurated and competent.
Farther west, the redox interface is well defined but does nothave the geometry of a roll front. In fig. 6, the redox interface isillustrated as a diagonal line or wedge. The configuration is, ofcourse, more complex than is shown in the figure, but it sufficesas an exploration model. The ore associated with this front isalways within the top 10 ft (3 m) and is generally less than 5 ft(1.5 m) thick. Ore occurs both in front of and at the interface.The upper part of this unit is generally fine grained and containsminor carbonaceous material, which is probably significant.Lithology probably played a role in the geometry of this wedgeby restricting ground-water movement at the top of the interfacebecause of the lower permeability and greater adsorptive proper-ties of the fine-grained bed. Carbonaceous material, generallyconfined to this upper zone, probably played a role in the pre-cipitation of the uranium. Still farther west, the redox front losesdefinition and ore is absent. The redox front here is almosthorizontal, allowing pyritic sands to directly overlie hematiticsands for a lateral extent of more than 600 ft (180 m).
To the far west, mineralization occurs that is similar tomineralization found to the east. For example, the occurrence ofunoxidized, poddy ore is without an associated redox front. Themineralization is sporadic and in reduced ground and does notreach grades of economic significance. No preferred strati-
(New Mexico Bureau of Mines & Mineral Resources, Memoir 38,1980]

151
graphic position for the uranium seems to exist; however, it doesseem to be associated with mudstone lenses (fig. 7).
Upper sandstone unitThe upper part of the Brushy Basin Member has played only a
small role in the exploration program conducted by WesternNuclear because the sandstone never develops into a major unit.The upper sandstone rarely exceeds 15 ft (5 m) in thickness and isoften interbedded with the green-gray mudstones; it has beenbeveled in many places by pre-Dakota erosion and is commonlyabsent. No alteration or mineralization has been encountered.This lack is probably the result of its isolated character, whichrestricted ground-water flow and did not allow mineralizingfluids to pass through. This interpretation seems valid, becauseno other difference exists between this upper sandstone and thelower and middle sandstones.
Petrography and alterationTwo distinctly different periods of alteration can be seen in
Western Nuclear's property. Both periods are correlative withthose described by Austin (1963). The first is characterized byabundant kaolinite and ferrous iron occurring with and aroundthe poddy trend ore. The second period is characterized byaltered illite-montmorilloniteand ferric iron, associated with andupdip from the roll-front ore. X-ray-diffraction studies of theless than 2 micron fraction of the sediments substantiated thepetrographic work. The distinction between illite and mont-morillonite could not be made; therefore, this clay assemblage ispresumed to be a mixed-layer series.
Overall, the detrital mineralogy is the same in the two altera-tion zones. Approximately 85 percent of the detrital grains arequartz. Polycrystalline quartz is common. Frequently, but notconsistently, quartz grains have quartz overgrowths in bothalteration zones. About 14 percent of the detrital minerals arefeldspars. They are dominantly potassium feldspars (mostlymicrocline) with lesser amounts of plagioclase. Feldspar skele-tons as described by Austin (1963, this volume) are present. Avery small percentage of detrital biotite is also present along withsome opaque minerals (not positively identified). Quartz, calcite,and kaolinite occur as cements, varying in location with respectto the ores. The calcite occurs with the ore, and the kaolinite oc-curs predominantly downdip of the roll fronts.
In the kaolinite zone (pyritic or unoxidized zone), iron exists asFe'2 in pyrite. The pyrite occurs both as polycrystalline aggre-gates and as single crystals. Figs. 8 and 9 show the typicalpetrography of this zone. The rock in the photomicrograph dis-plays low permeability, resulting from the abundant kaolinitematrix. Calcite is much less common and is always associatedwith the ore. As shown in these specimens, ore is found occurringcontemporaneously with kaolinite and calcite.
In the illite-montmorillonite zone (the oxidized zone), pyrite israre and hematite and limonite predominate. Illite-montmorillonite does occur as grain coatings at the expense ofthe first kaolinite (I) (fig. 10). Also present in this photo-micrograph is the second stage of kaolinite (II), which is coarsergrained and is found filling pore spaces and covering the illite-montmorillonite. This specimen was collected updip from theredox front in the hematitic alteration zone. In this zone thehematite exists as grain coatings, crystals, or is associated withclays. The limonite is always found as an amorphous graincoating.
No differences were observed in the occurrence of cakite be-tween the two alteration zones. In both cases calcite formed as anintergranular matrix associated with ore or replacing detritalfeldspar grains. All stages of calcite replacement were observed.The ore (black, amorphous-looking material) in both types ofdeposits exists as intergranular fillings, grain coatings, andwithin the kaolinite and calcite matrix.
FIGURE 8—TYPICAL REDUCED ROCK MORPHOIOOY; NOTI I Aim DIA
Cil'NI'TIC PI4ASI- Ol II I I I I --MONrMORII I ONI 11 ( IM), KAOI INI II (K), C AlCIH (C), AND OR! (O); Al l Ol I HI- DM'KIIAI (DRAINS ARI Ol M i l / (Q)(crossed nicols, long dip'ension of photograph 1.07 mm).
Alteration began with the destruction of the feldspars. Detritalfeldspars were altered to illite-montmorillonitc, kaolinite, andmixtures of the two. Completely altered feldspars coexist withcompletely fresh feldspars. Presumably, the trend ore hadformed or was forming at this time. During continued alteration,kaolinite formed and reduced the permeability of the sandstoneby developing in and filling the intergranular spaces. This reduc-tion of permeability helped preserve the early trend ore.
The altered illite-montmorillonite clays formed contemporane-ously with the oxidation of iron and destruction of kaolinite.These clays formed rims on deirital grains only where the firstkaolinite stage had been destroyed. Since the kaolinite destruc-tion was not complete, illite-montmorillonite rims sometimescoat kaolinite. The hematite was principally found staining theillite-montmorilloniteand did not seem to penetrate kaolinite, in-dicating that the hematite formed contemporaneously with theillite-montmorillonite and after the first kaolinite (I).
Chlorite in trace amounts occurs in both alteration zones.Chlorite appears more abundant in the illite-montmorillonitczone, but hematite-limonite staining may prevent pelrographicdetection.
FIGURE 9—TYPICAL ASSEMBLAGE WITH QUARTZ (Q), SKELETAL FELDSPARS(SF), KAOLINITE (K), AND URANIUM ORE (O), FROM UNOXIDIZED SAND-STONE IN TREND ORE (plane-polarized light; long dimension ofphotograph 1.07 mm).
[New Mexico Bureau of Mines & Mineral Resources, Memoir 38,1980]

152
FIGURE 10—TYPICAL ASSEMBLAGE FROM UPDIP OF THE ROLL FRONT IN OX-ii)'/tn SANDSTONL; r.ote the finer grained first-stage kaolinite (Kl), thecoarser grained second-stage kaolinite (K2), altered illitc-monimorillonite (1M), quartz (Q), and feldspar (F) (crossed nicols;long dimension of photograph 1.07 mm).
DiscussionAll of the data presented indicate two different periods and
two different systems for uranium mineralization at Smith Lake.That more than one period of mineralization occurred in theGrants region is now generally accepted (Kelley and others, 1968;Granger and Warren, 1974; Lee and Brookins, 1978; Brookins,this volume). At Smith Lake, the first mineralization is the trendore—discontinuous, blanket-like ore pods associated with pre-dominantly kaolinite in reduced ground. The second mineraliza-tion is roll-front ore—associated with a redox interface and withaltered illite-montmorillonite clays.
The trend ore is tentatively assigned a Late Jurassic agebecause of its mode of occurrence and similarities to otherdeposits found in reduced ground that are thought to be of thisage. The geometry, lack of a related redox interface, and strati-graphic location are similar to those deposits described byGranger and others (196!) in the Ambrosia Lake district. In addi-tion, the alteration and mineralogy are almost identical to thatdescribed by Austin (1963) as being widespread in the MorrisonFormation and having developed prior to the oxidizing event. Inshort, the compiled data indicate that the ore in the kaolinitealteration zone is trend ore.
The clay paragenesis and other petrographic criteria suggest
that the roll fronts are definitely post-trend ore, but an absoluteage cannot be determined from the data collected. However, theconfiguration of the redox interfaces implies an origin fromground water moving to the northeast. This ore-forming process"which has apparently been in progress since the earliest Lara-inide tectonic activity" (Kelley, 1968, p. 760) resulted from sub-sidence of the San Juan Basin, which produced a northeastground-water flow regime. In addition, Galloway's (1978) inter-pretation of the paleo-ground-water systems substantiates aLaramide age of origin. The structure-alteration relationship inthis area substantiates a Laramide or post-Laramide period formineralization.
Although the clay assemblages of the two types of depositsdiffer—and the distinctions will aid in understanding thedeposits—exploration in this area need not be dependent uponclays. Iron oxidation is easier to identify in the field than clays,and this method remains the principal guide in local explorationfor roll-front ore. However, additional work must be done bothin and around the trend ore to see if clay assemblages or geo-chemistry changes with distance from the ore. Potentially, suchchanges could lead to an exploration model for these deposits inwhich redox relationships are not applicable.
ReferencesAustin, S. R., 1963, Alteration of Morrison Sandstone, in Geology and
technology of the Grants uranium region, V. C. Kelley, compiler: NewMexico Bureau of Mines and Mineral Resources, Mem. 15, p. 38-44
Galloway, W. E., 1978, Morrison Formation—Colorado Plateau, in Theexploration for uranium—a research colloquium, W. E. Galloway, C.W. Kreitlcr, and J. H. McGowen, eds.: University of Texas (Austin),Bureau of Economic Geology, p. x-l-x-14
Granger, H. C , Santos, E. S., Dean, B. G., and Moore, F. B., 1961,Sandstone-type uranium deposits at Ambrosia Lake, New Mexico—aninterim report: Economic Geology, v. 56, no. 7, p. 1179-1210
Granger, H. C , and Warren, C. G., 1974, Zoning in the altered tongueassociated with roll type uranium deposits, in Formation of uraniumore deposits: Vienna, 1. • "-"'nnal Atomic Energy Agency, p. 185-198
Kelley, V. C , Kittel, D. F., . . .jlancon, P. E., 1968, Uranium depositsof the Grants region, in Ore deposits of the United States 1933-1967, J.D. Ridge, ed.; American institute of Mining, Metallurgical andPetroleum Engineers, 1st edition, p. 752-770
Lee, M. J., and Brookins, D. G., 1978, Rubidium-strontium minimumages of sedimentation, uranium mineralization, and provenance, Mor-rison Formation (Upper Jurassic), Grants mineral belt, New Mexico:American Association of Petroleum Geologists, Bull., v. 62, no. 9, p.1673-1683
Robertson, J. F., 1973, Geologic map of the Thoreau quadrangle,McKinley County, New Mexico: U.S. Geological Survey, open-filerept.
[New Mexico Bureau of Mines & Mineral Resources, Memoir 38,1980]

153
DEPOSITIONAL ENVIRONMENT OF BRUSHY BASINMEMBER, MORRISON FORMATION, IN GULF MARIANO
LAKE MINE, McKINLEY COUNTYby John T. Jenkins, Jr., and S. Blaze Cunningham, Gulf Research and Development Co.,
P.O. Box36506. Houston, Texas 77036
AbstractThe Mariano Lake mine, McKinley County, New Mexico, is
developed in the lower portion of the Brushy Basin Member ofthe Morrison Formation (Upper Jurassic). The sandstones typ-ically are arkosic to subarkosic, moderately to poorly sorted,medium to coarse grained, subrounded, carbonaceous, and silicacemented. Early emplacement of uranium minerals occurredalong geochemical boundaries in a roll-front geometry. In thearea of the Mariano mine, the Brushy Basin Member was de-posited as a series of stacked, lenticular-shaped sand bodiesinterfingering with bentonitic mudstones. Petrologic and sedi-mentologic data allow the interval to be divided into four deposi-tional facies. These facies represent in-channel and flood-basindeposits of a braided-stream complex with characteristics of thepresent-day Platte River and Bijou Creek.
IntroductionThe Mariano Lake mine is located in sees. 11 and 12, T. 15 N.,
R. 14 W., McKinley County, New Mexico, within the southeastportion of the Gallup district (fig. 1) as defined by Hilpert (1969,plate 1). The host rock for the uranium is the lower sandy portionof the Brushy Basin Member of the Morrison Formation (UpperJurassic). The Mariano Lake orebody is now being developed byGulf Mineral Resources Company.
In conjunction with exploration-oriented geophysical-researchprograms conducted at the Mariano Lake mine, a detailed studyof the Brushy Basin sandstone was undertaken. The goals of thestudy were to determine the depositional environment and geom-etry of the host sandstone and to determine the relationship ofore emplacement to the depositional environment. Study meth-ods included examination of exposures of the Brushy Basin in themine and at three outcrops and analysis of electrical logs fromdrill holes in the area of the orebody.
Stratigraphy and structureThe stratigraphic nomenclature used in this report follows that
for the Morrison Formation presented by Hilpert (1963). Thesandstones in the Mariano Lake mine area are lithologically andstratigraphically similar to the Poison Canyon sandstone in theadjacent Ambrosia Lake district (fig. 2). We have interpreted theBrushy Basin sandstones at the Mariano Lake mine as being con-formable with the underlying sandstones of the Westwater Can-yon Member.
The main portion of the orebody lies along the axis of theMariano syncline (fig. 3). The orebody is transected in a fewplaces by northeast-trending joints and faults with less than 4inches (10 cm) of displacement. These joints and faults postdateore emplacement, and their orientation suggests they are relatedto Laramide tectonic activity.
PetrologySamples were selected from exposures within the mine that ex-
hibit typical textures, sedimentary structures, degrees of indura-tion, and ore development. Color photographs were taken atmost sample locations to help document the geological setting.Blue epoxy-impregnated thin sections were prepared from 36
samples, and grain-size distributions were calculated frommechanical analyses of 31 samples, using calibrated Vi phi sieves(Folk, 1974).
Thin sections were examined to determine mineral composi-tion, textural relations, and diagenetic effects. Major detritalcomponents of the Brushy Basin samples are monocrystallinequartz, microcline and plagioclase feldspar, and igneous andsedimentary rock fragments. Also present are minor amounts ofpolycrystalline quartz, detrital clay, metamorphic rock frag-ments, biotite, and heavy minerals.
The Brushy Basin sandstones are arkoses and lithic lubarkoses(McBride, 1963). Most samples are moderately to poorly sorted,medium- to coarse-grained, subrounded sandstones. Diageneticeffects include extensive leaching of feldspars and emplacementof organic matter, uranium minerals, and silica cement.
Quartz varieties observed are: monocrystalline straight-extinction grains containing inclusions and vacuoles, roundedchert grains, and polycrystalline-unstrained grains wi;h normalboundaries. Most grains are subrounded to roundeU Over-growths rarely are developed, probably because of hematite anddetrital-clay rims.
Feldspars are subangular lo angular and commonly are alteredto clays along grain boundaries and cleavage planes or have beendestroyed by leaching. Feldspar content is 10-30 percent byvisual estimate. Microcline is the dominant feldspar with albite,orthoclase, and perthite present in respectively decreasingamounts.
Rock fragments constitute 10-25 percent of the grains;rounded shale clasts are the most common variety. Acid igneous-rock fragments and quartzose siltstone fragments are present inminor amounts. Quartzite, mica-schist fragments, and biotite arerare. Volcanic fragments are present in trace amounts in a fewsamples. Glass shards were not observed in any samples. Raregrains with scattered feldspar laths probably are of volcanicorigin, but extensive alteration obscures evidence of the petro-genesis.
Cementation ranges between slight and extreme. Montmoril-lonite and hematite coalings contribute significantly to graincementation. In thin section, montmorillonite coatings appear asyellow birefringent rims. Commonly, these grain coatings alsocontain pyrite and intimately mixed organic material anduranium minerals of unknown composition. Silica cement, al-though not uniformly distributed within samples, is extensivelocally and accounts for extreme induration in some rocks. Silicacements, in thin section, exhibit random optical orientation.Well-defined quartz overgrowths are rare. Kaolinite commonly ispresent as scattered books; in many places it is mixed with, or ap-pears to grade into, silica cement. Both cements occur onlywithin primary pore spaces. Many leached framework grains arefilled with pyrite or hematite. These relationships help to es-tablish the sequence of diagenetic events and to explain when theuranium was emplaced and why it has not been extensivelyremobilized.
Interpretation of the timing of ore emplacement is based onthin-section analysis. First, detrital and early authigenic-clayrims coated framework grains. Soon after shallow burial, thesands were subjected to reducing conditions resulting from localconcentrations of highly organic pore waters or from bacterialactivity (Nash, 1968). Either mechanism could have producedauthigenic pyrite, which would have improved the reducing envi-
[New Mexico Bureau of Mines & Mineral Resources, Memoir 38,1980]

SAND ISOPACH ANDPALEOCURRENT DATA
OF THE BRUSHY BASINGALLUP DISTRICT
AMBROSIA LAKE DISTRICT
_ MC KINLEY CO.TTVALENCIA CO. "
FIGURE 1—LOCATION OF THE MARIANO LAKE MINE, mineral district boundaries (after Hilpert, 1969), sandstone isopach, and paleo-current data, for the Brushy Basin Member of the Morrison Formation; the sandstone thickness data are modified from Boone andHalterman (personal communication, 1973).

155
SEDIMENTARY STRUCTUREAND LOG RESPONSE
u.•9
nsoi
MO
RF
DAKOTA ^_BRUSHY BASIN _ 2
^rj3**^- «: - /
Jill?BRUSHY RASIN-=^=~=-l
WESTWATER f
<
340'
360'
1
380*
400'
420'
440'
RESISTIVITY
I• ^
?"r
• ^= T T — . — . . .
FIGURE 2—STRATIGRAPHY-, TYPICAL LOG RESPONSE, AND SUMMARY OI THI SHIJIMI NIARY STRI'I H KINOBSERVED IN THE BRUSHY BASIN MEMBER.
ronment. Subsequent influx of uranium-rich ground waterthrough the coarser sands resulted in precipitation of uraniumminerals along geochemical boundaries in characteristic roll-front geometry. Unstable hydrologic conditions caused remobil-ization of ore during this shallow-burial stage. Finally, silica andkaolinitecementation occurred, which protected the ore mineralsfrom subsequent remobilization. This sequence was completedearly in the burial history of the sediments. Feldspar leaching andpyrite replacement were late diagenetic events and indicate arenewed paragenetic sequence.
Sedimentary faciesIn the viciniiy of the Mariano Lake mine, the Brushy Basin
Member is approximately 120 ft (37 m) thick, with an averagesandstone thickness of 100 ft (31 m). The remaining 20 ft (6 m) ofthe member consists of massive, gray, bentonitic rnudstone in-terbedded with the sandstone. The Brushy Basin sandstones oc-cur as lenticular stacked sandstone bodies having a sharp contactwith the underlying mudstone and a sharp to gradational contactwith overlying mudstone.
Uranium ore occurs in the lowest sandstone sequence of theBrushy Basin (fig. 4). This sandstone averages 25 ft (7.6 m) inthickness and is sandwiched between two fairly continuous mud-stones. Both mudstones are usually less than 10 ft (3 m) thick.The following facies designations and environmental interpreta-tions are based on a detailed examination of this lower section ofthe Brushy Basin Member.
Four facies are distinguished on the basis of petrology andsedimentary structures seen in the lower sandstones and shale;, ofthe Brushy Basin. All are genetically related and represent depo-sition in different subenvironments within the same fluvialsystem. Three of the facies describe sandstone beds, and thefourth applies to interbedded mudstones.
The lower part of the Brushy Basin is arkosic to quartzose,coarse- to fine-grained sandstone with mudstone interbeds.These sandstones may be divided into two major and one minor
facies. The tabular-crossbedded facies (figs. 5, 6) is most com-mon and is dominated by large to medium tabular crossbeds withtrough crossbeds. The sandstone is feldspathic, angular to sub-angular, poorly sorted, and coarse to medium grained. Inter-spersed throughout this facies are scour surfaces with andwithout pebble- to boulder-sized shale rip-up clasts, isolatedclasts, and shale laminae. Dinosaur bones and woody debris arerare.
The tabular-crossbedded facies grades laterally and verticallyinto the parallel-laminated facies (fig. 7). In places the parallel-laminated facies locally truncates the tabular-crossbedded facies(fig. 8). The sediments consist of subrounded, moderately sorted,medium- to fine-grained quartzose sandstone.
Less than 2 percent of the sediment occurs as a small-scale rip-ple facies with fine-grained quartzose sandstone, small-scale rip-ples, ripple-drift laminations, and abundant mudstone partings.Evidence of minor bioturbation was observed. The small-scaleripple facies grades into a massive overlying mudstone or is trun-cated by the tabular-crossbedded facies.
Mudstone beds consist of gray, massive, silty, bentonitic claycommonly containing evenly distributed sand-sized grains ofquartz, feldspar, and subsidiary volcanic-rock fragments. Sach-dev (personal communication, 1978) has suggested that thesemudstones represent altered tuff. The stratigraphic relation ofthe mudstones with respect to the fluvial sandstones suggests thatthe mudstones represent floodplain deposits of the fluvialsystem. Any bedforms originally present probably have been de-stroyed by bioturbation or devitrification of the tuffaceoussediments.
Uranium occurs within a variety of sedimentary textures inboth the tabular-crossbedded and parallel-laminated facies (fig.9). The uranium commonly is found in the tabular-crossbeddedfacies where it is associated with the coarse-grained sandstonefound in scour fills and grouped crossbed sets. These facies arezones of greater porosity and permeability, which served as con-duits for uranium-rich ground waters and as primary sites ofprecipitation under favorable reducing conditions.
[New Mexico Bureau of Mines & Mineral Resources, Memoir 38,1980]

IIo'oCD
co
5 'g>
© O R E BODY OUTLINE
lOtf 0 KM* 200 VXf
CONTOUR INTERVAL: 1C(
A>
O
GENERALIZED STRUCTURETOP OF THE BRUSHY BASIN MEMBER
[MORRISON FORMATION, UPPER JURASSIC]
LOUTION B V
FIGURE 3—GENERALIZED STRUCTURE AT THE TOP OK THE BRUSHY BASIN MEMBER, OUTLINE OK THE MARIANO LAKE OREBODY. AND
LOCATION OF THE TWO GEOLOGIC CROSS SECTIONS (FIG. 4) .

157
A ' SOUTH843 226 227 228 229 230 225 250
NORTH A349 416 778
200'
B ' WEST551 1210 280 273 1281
4 0 '
VERTICALEXAGGERATION 5X
DATUM IS TOP OF THEBRUSHY BASIN MEMBER
SEE FIGURE 3 FOR THELOCATION OF THECROSS SECTIONS
MUDSTONE
SANDSTONE
ORE
EAST B
207 244 239 230 180 160
FIGURE 4—GEOLOGIC CROSS SECTION PERPENDICULAR (A-A ') AND PARALLEL {B-B') TO THE DEPOSITIONAL DIP OF THE
BRUSHY BASIN SANDSTONES.
[New Mexico Bureau of Mines & Mineral Resources, Memoir38,1980]

158
FIGURE 5—GROUPUD TABULAR CROSSBEDS AND SCOUR SURI-ACE WITH CLAY RIP-UP CLASTS AND LAMINAE: ore is
present in the basal part of the scour above the clay-rich zone. The sequence is part of the tabular-cross-stralificd fades (scale is in inches, left, and centimeters, right).
F I G U R E 6—FORESETS OF A SOLITARY TABULAR CROSSBED IN THE TABULAR-CROSS-STRATIFIED FACIES; ore is presentaround the isolated rip-up clast and below the solitary crossbed. Stream transport was to the left (east) (scale isin inches, left, and centimeters, right).
[New Mexico Bureau of Mines & Mineral Resources, Memoir 38,1980]

159
FIGURE 7—PARALLEL-LAMINATED FACIES: the uranium minerals (right side) have migrated into more permeablezones (scale is in inches, top, and centimeters, bottom).
FIGURE 8—TABULAR-CROSSBEDDED FACIES TRUNCATED BY SANDSTONE OF THE PARALLEL-LAMINATED FACIES: thissequence is interpreted as a bedload channel-sand deposit—tabular crossbedded facies with sedimenttransport to the left—cut by later crevasse splay deposits—parallel-laminated facies with sediment transportout of the photo toward the viewer (scale in the center of the picture is in inches, left, and centimeters, right).
[New Mexico Bureau of Mines & Mineral Resources, Memoir 38,1980]

160
• ORE SAMPLE• BARREN SAMPLEA SAMPLE OF ORE - BARREN CONTACT
•
-1.5
-10
3.0 2.0 10
MEAN GRAIN SIZE(^)
- 5- 5
FIGURE 9—PLOT OF SAND TEXTURK VERSUS URANIUM OCCURRENCE: scatter of data poinis indicates that ore em-placement is not strongly influenced by mean size or sorting of grains.
PaleocurrentsAzimuths of current-oriented bedforms were recorded in the
Mariano Lake mine and at three outcrops (fig. I). One hundredten measurements were made on trough crossbeds, tabular cross-beds, and channel scours. Exposures of trough crossbed stratifi-cation provided the most reliable current-direction measurements(Dott, 1973; Meckel, 1967). Vector means for each exposure werecalculated using the equations derived by Curry (1956). Struc-tural deformation, parallel to paleocurrent direction, was notgreat enough to require correction of the measurements (Potterand Pettijohn, 1977).
Current measurements taken at the four Brushy Basin expo-sures corroborate results of earlier studies of sediment transportin the Brushy Basin (Craig and others, 1955; Flesch, 1974;Rapaport, 1963; Young, 1978). Based upon the paleocurrentdata from the Mariano Lake mine and the results of a sandstoneisopach study (Boone and Halterman, personal communication,1973), the Brushy Basin sandstone in the mine area was depositedby eastward-flowing streams related to a Late Jurassic alluvialfan northwest of Gallup (Craig and others, 1955; Young, 1978).
Depositional environmentCraig and others (1955), Flesch (1974), and Keller (1962) sug-
gest that Brushy Basin sediments accumulated in low-energyfluvial (probably meandering streams) and lacustrine environ-ments. Data from the Mariano Lake mine, however, suggest thatthe Brushy Basin fluvial system was of sufficient energy to pro-duce features characteristic of a braided stream. The braided-stream deposits in this area are interpreted as representing distalalluval-fan deposits. Farther away from the fan, lower gradientsproduced the meandering streams and lakes described by otherresearchers.
Miall (1977, 1978) and Galloway, Kreitler, and McGowen(1979) have summarized characteristics of braided-streamdeposits and have provided criteria for recognizing differenttypes of braided streams. At the Mariano Lake mine the BrushyBasin section exhibits these diagnostic features (Galloway,Kreitler, and McGowen, 1979):
1) An alternation of grain sizes exists, with medium to coarsesand being the most abundant, and fining-upward se-quences are not well developed.
2) Basal contacts are sharp and irregular.
3) Upper contacts may be sharp or gradational.4) Small-scale sedimentary structures may be absent or
constitute only a minor part of the unit.5) Sandstone bodies are lenticular, with a high width-
to-thickness ratio.6) The sandstone appears as a broad dip-oriented belt.7) Coarse-grained chute bar deposits may occur at the top of
the sequence.Of the six models that Miall (1978) has proposed for braided-
stream deposits, the lower part of the Brushy Basin Member fitsthat of a noncyclic braided river like the Platte River, with occa-sional flash flooding like Bijou Creek (table 1). During normalflow conditions, sand accumulated in the channel where a seriesof sand waves and linguoid bars migrated downstream. Thedominance of tabular crossbeds in the section indicates that nor-mal flow conditions were in the lower flow regime and that mostof the deposition probably occurred under these conditions. Per-iodic flooding resulted in the development of scours, which weresubsequently filled with sand containing abundant clay rip-upclasts. During flood conditions suspended sediments accumu-lated near channel margins as parallel-laminated crevasse-splaydeposits. Fig. 8 illustrates a crossbedded unit truncated by acrevasse channel containing finer grained parallel-laminatedsand. A Tertiary example of this type of braided fluvial systemmay be the Oakville Formation (Miocene) of south Texas (Gallo-way, Finley, and Henry, 1979).
Fossil wood from the Brushy Basin was examined by W. B.Cornet, a palynologist with Gulf Research. The wood is of theAraucarian or Cheirolepsidacean type, a brachyphyllus orpagiophyllus conifer common to the Mesozoic. The lack of well-developed growth rings and variation of the cell-wall thicknesssuggests an equitably warm climate, with seasonal fluctuations inprecipitation. These fluctuations could be recorded as the normalflow-and-flood episodes previously discussed.
ConclusionsThe lower portion of the Brushy Basin Member at the Mariano
Lake mine is composed of arkosic to subarkosic sandstone andbentonitic mudstone, which was deposited in a sand-dominatedbraided-stream environment. Sediments were transported east-ward by perennially flowing streams subject to occasionalflooding. The sands accumulated laterally and vertically to pro-
[New Mexico Bureau of Mines & Mineral Resources, Memoir 38,1980]

161
TABLE 1—PRINCIPLE FACIES OF SAND-DOMINATED PLATTE AND BIJOU CREEK BRAIDED-STREAM MODELS (modified from Miall, 1978).
name
Platte type
3ijou Creek type
environment
sandy braided rivers (perennial)
ephemeral or perennial riverssubject to flash floods
main facies
trough crossbedded medium tocoarse sand
planar crossbedded medium tocoarse sand
horizontally bedded sand
low-angle crossbedded finesand
facies
horizontally bedded sand
sand with all varieties ofripple marks
sand with scours
massive gravel
finely laminated and rippledsand, silt, and mud
planar crossbedded sand
sand with all varieties ofripple marks
duce a beltiike deposit averaging 100 ft (31 m) thick, the axis ofwhich paralleled depositional dip.
Uranium ore is restricted to the lowest channel sequence in theBrushy Basin Member; most is found in the tabular-cross-stratified facies, but some occurs in the parallel-laminated facies.Ore emplacement was a diagenetic phenomenon in the poroussands of the Brushy Basin. The belt of porous sand controlledore concentration by serving as a conduit for uranium-richground waters; uranium precipitated where those ground watersencountered local reducing conditions. Analyses of porous-sandstone trends, hydrologic flow patterns, and possible sourceareas of the uranium will help to outline other prospective trends.
ReferencesCraig, L. C , Holmes, C. N., Cadigan, R. A., Freeman, V. L., Mullens,
T. E., and Weir, G. W., 1955, Stratigraphy of Morrison and relatedformations, Colorado Plateau region, a preliminary report: U.S. Geo-logical Survey, Bull. !009-E. p. 125-168
Curry, J. B., 1956, Analysis of two-dimensional data: Journal of Geol-ogy, v.64, p. 117-131
Doll, R. H., Jr., 1973, Paleocurrent analysis of troufh cross stratifica-tion: Journal of Sedimentary Petrology, v. 43, no. 3, p. 779-783
Flesch, G. A., 1974, Stratigraphy and sedimentology of the MorrisonFormation (Jurassic), Ojito Springs quadrangle, Sandoval County,New Mexico—a preliminary discussion: New Mexico Geological Soci-ety, Guidebook 25th field conference, p. 185-195
Folk, R. L., 1974, The petrology of sedimentary rocks: Austin, Texas,Hemphill Publishing Co., p. 1-182
Galloway, W. E., Finley, R. J., and Henry, C. D., 1979, South Texasuranium province, geologic perspective: University of Texas (Austin),Bureau of Economic Geology, Guidebook 18, p. 1-81
Galloway, W. E., Kreitler, C , and McGowen, J. H., 1979, Depositionaland ground-water flow systems in the exploration for uranium: Univer-sity of Texas (Austin), Bureau of Economic Geology, 1978 UraniumExploration Colloquium, p. 1-79
Hilpert, L. S., 1963, Regional and local stratigraphy of uranium-bearingrocks, in Geology and technology of the Grants uranium region, V. C.Kelley, compiler: New Mexico Bureau of Mines and MineralResources, Mem. 15, p. 6-18
, 1969, Uranium resources of northwestern New Mexico: U.S.Geological Survey, Prof. Paper 603, p. 1-166
Keller, W. D., 1962, Clay minerals in the Morrison Formation of theColorado plateau: U.S. Geological Survey, Bull. 1150, p. 1-90
McBride, E. F., 1963, A classification of common sandstones: Journal ofSedimentary Petrology, v. 33, no. 3, p. 664-669
Meckel, L. D., 1967, Tabular and trough crossbedding; comparison ofdip azimuth variability: Journal of Sedimentary Petrology, v. 37, no. 1,p. 80-86
Miall, A. D., 1977, A review of the braided-river depositional environ-ment: Earth Science Reviews, v. 13, p. 1-62
, 1978, L.ithofacies types and vertical profile models in braidedriver deposits, in Fluvial sedimentology: Canada Society of PetroleumGeologists, Mem. 15, p. 597-604
Nash, J. T., 1968, Uranium deposits in the Jackpile sandstone, New Mex-ico: Economic Geology, v. 63, p. 737-750
Potter, P. E., and Pettijohn, F. J., 1977, Paleocurrents and basinanalysis: New York, Springer-Verlag, p. 1-460
Rapaport, I., 1963, Uranium deposits of the Poison Canyon ore trend.Grants District, in Geology and technology of the Grants uraniumregion, V. C. Kelley, compiler: New Mexico Bureau of Mines andMineral Resources, Mem. 15, p. 122-135
Young, R. G., 1978, Deposilional systems and dispersal patterns inuraniferous sandstones of the Colorado plateau: Utah Geology, v. 5,no. 2, p. 85-102
[New Mexico Bureau of Mines & Mineral Resources, Memoir 38,1980]

162
MINERALOGICAL VARIATIONS ACROSS MARIANO LAKEROLL-TYPE URANIUM DEPOSIT, McKINLEY COUNTY
by Suresh C. Sachdev, Gulf Research and Development Co., P.O. Drawer 2038,Pittsburgh, Pennsylvania 15230
AbstractMineralogy of core samples from the Mariano orebody was
determined. The data obtained were used to develop explorationtools for roll-type uranium deposits. Preliminary interpretationsof the physical and chemical conditions of ore deposition weremade on the basis of paragenetic relationships. The host sand-stones occur between the bentonitic rock units and contain scat-tered intercalations of detrital montmorillonitic material in theform of clay galls, stringers, and lenses derived from these ben-tonites. Authigenic clay minerals identified in the host rocksinclude cellular montmorillonite, platy chlorite, and pseudo-hexagonal books of kaolinite. The cellular montmorillonite isconcentrated in the oxidized zone and appears to have formedprior to ore deposition. Authigenic chlorite is most abundant inthe ore zone and has formed at the expense of cellular mont-morillonite; its formation is interpreted as being related to theore-forming processes. Kaolinite in sandstones is the last claymineral to form and is enriched in the reduced zone. Calcile, con-sidered typical of such deposits, is not found in this orebody.Iron-titanium oxides and their alteration products are the mostabundant heavy-mineral species in the host rocks. In addition toanatase and rutile, the alteration products include hematite in theoxidized zone and pyrite in the ore and reduced zones. Car-bonaceous material introduced later into the potential ore zoneappears to have been responsible for the decomposition of Fe-Tioxides and the formation of pyrite. The paragenetic relationshipindicates oxidation of pyritc by mineralizing solutions, resultingin reduction and subsequent deposition of uranium. The positivecorrelation between organic carbon and uranium suggests thatcarbonaceous material also acted as a reductant for uranium.
IntroductionThe Mariano ore is hosted by the Prison Canyon sandstone,
which lies in the basal part of the Brusl y Basin Member of theMorrison Formation. The deposit occurs at a redox interfacewith its long dimension lying in an east-west-trending structuraldepression. Details of the location, stratigraphy, and structure ofthe Mariano Lakeareacan be found in Jenkins and Cunningham(this volume).
This exploration study investigated possible systematic varia-tions in the mineralogy of the host rocks across the orebody (hatmay aid in the search for similar uranium deposits. Preliminaryinterpretations regarding the physical and chemical conditions ofore deposition have been made on the basis of paragenetic rela-tions.
ACKNOWLEDGMENTS—This project was supported and en-couraged by Gulf Minerals Resources Company and Gulf Re-search and Development Company; their permission to releasethe information is gratefully acknowledged. I wish to thank R.M. Pawlowicz for our stimulating discussions throughout thestudy. I also thank R. Suda of Gulf's Albuquerque office for ac-quiring the cores and my colleague D. S. loth for criticallyreading the manuscript. Analytical work by R. E. Morton and R.L. Pivirotto of Gulf Research and Development Company isgreatly appreciated.
penetrated the orebody and will be referred to as the ore hole (orore zone). Holes 1210 and 1211 are at distances of 200 and 1,200ft (65 and 390 m) respectively from the ore hole on the oxidizedside of the deposit; these will be referred to as the near-oxidized(1210) and far-oxidized (1211) zones. Drill holes 1208 and 1212lie in the barren unaltered ground to the north of the deposit atdistances of 200 and 1,200 ft (65 and 390 m); these will be re-ferred to as the near-reduced (1208) and far-reduced (1212)zones.
A geologic cross section along the line of the drill holes isshown in fig. 2. The ore-bearing Poison Canyon sandstone isconfined between two impermeable mudstone units. These mud-stones have been interpreted to be the altered products of vol-canic tuffaceous material (Sachdev, 1978); in this paper theseunits are called bentonites. All of the drill holes penetrated thelower bentonite bed, which is a fairly continuous unit in the areaand marks the base of the Brushy Basin Member of the MorrisonFormation.
The cores recovered range from 16 to 38 ft (5 to 12 m) inlength. Forty-five represei>'ative samples from the five coreswere analyzed to determine their mineralogy. Only 30 sampleswere used to interpret the mineralogical variations across the oredeposit.
SamplesSamples for the mineralogical analyses were obtained from
five cores taken across the ore deposit (fig. 1). Drill hole 1209FIGURE I—CORE-HOLE LOCATIONS IN MARIANO OREBODV. MCKINLEY
COUNTY. NEW MEXICO.
[New Mexico Bureau of Mines & Mineral Resources, Memoir 38,1980]

163
SURFACEELEV.
ZONE
GEOLOGIC7447'
CROSS SECTION7419' 7420' 7445'
llRUSHY --BASIN, SHALt
7000'-
0 200 400 FEETFIGURE 2—GMMOC.K CROSS SKTIONAIONG nil I INIOI nil DKII I HOI I s snow M M K. I.
•7000'
Characteristics of the orebodyThe Poison Canyon sands are feldspathic and were deposited
by an eastward-flowing braided-stream system (Jenkins andCunningham, this volume). The location of the redox interfaceand the shape of the Mariano orebody, however, indicate thedeposit formed from the northward-flowing uranium-bearingground waters. The deposit appears to have developed a roll-front geometry with its tails pointing toward the south. The tailsare commonly present at the contact between the host rocks andthe bentonites. Typical gamma-ray log response, along with theresistivity logs for the near-oxidized, ore, and near-reduced drillholes, is shown in fig. 3; (he roll-front geometry of the orebody isapparent.
In addition to the gamma-ray logs, unpublished (proprietary)chemical analyses of these samples show elemental zonationacross the Mariano orebody that is similar to those commonlyobserved in the roll-front-type deposits. The ore one contains ahigh concentration of vanadium, cerium, arsenic, organic car-bon, and lead, as well as uranium. Selenium is concentrated inthe near-oxidized zone, whereas barium is present in and aroundthe ore zone. The deposit generally is high in vanadium and lowin molybdenum; however, local concentrations of molybdenumdo occur in the ore zone. Calcite, which is considered typical ofroll-type uranium deposits (Granger and Warren, 1974), isalmost completely absent in this orebody.
Uranium in the host rocks is associated and intimately mixedwith unstructured organic material that usually coals the sand
DRILLHOLES
1210 1 2 0 9 1 208DAKOTA
WESTWATER
RES.100 II/SINS.
GAMMA50 CPS/IN
RES.100H/SINS
GAMMASO CPS/IN.
RES.100U/5INS.
OXIDIZEDSANDSTONE
ORE-STAGEURANIUM
UNALTEREDSANDSTONE:
BENTONITICROCK UNITS
UNMINERALIZEDSANDSTONE BEDS
1 POISON CANYON SANDSTONE '
FIGURE 3—SCHEMATIC DIAGRAM OK LITHOLOGY AND GAMMA-RAY LOG RESPONSE, SHOWING THE ROLL-FRONT GEOMETRY OF THE MARIANO
OREBODY.
[New Mexico Bureau of Mines & Mineral Resources, Memoir 33,1980]

164
grains and fills the pore spaces. Coaly structured material fre-quently occurs in the bentonites and occasionally in the sand-stones. Although the source of the organic material associatedwith the uranium cannot be determined with certainty, it mr-yhave been derived from this coaly material as humic acids andthen epigenetically introduced into the host rocks.
Large amounts of secondary silica are observed in the sand-stones as cement, overgrowths, and euhedral quartz crystals;chert lenses are found within the bentonites. Authigenic potas-sium feldspars and sodium-rich plagioclases are also identifiedwithin the host rocks. No systematic variation of these, however,could be observed across the roll front. Partially dissolvedfeldspar and quartz grains are commonly observed in and nearthe ore zone.
Clay mineralsClay minerals in the sandstones were identified using
petrographic microscopy, scanning-electron microscopy, andx-ray diffraction. Montmorillonite, chlorite, and kaolinite arethe dominant clay mineral species in the host rocks; traces of amixed-layer illite-montmorillonite are present in a few samples.
MontmorilloniteTwo different generations of montmorillonites, detrital and
authigenic, were identified in the samples. The detrital mont-morillonite, apparently derived from bentonites, occurs as claygalls, lenses, and cementing material in the sandstones (fig. 4);SEM (scanning-electron microscope) examination shows them toexhibit a typical tobacco-leaf morphology (fig. 5). The round andelliptical shapes of the clay galls suggest that these clays were in-corporated during deposition into the sandstones after the under-lying tuffaceous material had transformed into bentonites. Thedetrital montmorillonites are chemically similar to the parentbentonites and are enriched in calcium and magnesium, but theycontain very little sodium.
The authigenic montmorillonite shows a cellular or honey-comb pattern and coats the detrital grains in the sandstones (fig.6). Although this type of morphology is also exhibited by chlorite(Wilson and Pittman, 1977) and illite, the presence of mont-morillonite was confirmed by x-ray diffraction. The mode of oc-currence and delicate structure of (he clay clearly indicate that itis authigenic. Web-like pillars or microcolumns of this type ofmontmorillonite originate and project from the grain surfaces;partial coalescing of these pillars probably results in the cellularstructure (fig. 7). Pillars of montmorillonite also appear tobridge the gap between sand grains, suggesting that the mineralcrystallized from solutions rather than formed by iri-situ altera-
FIGURE 5—SCANNING-ELECTRON MICROGRAPH OF BENTONITK. MATERIALSHOWN IN no. 4; note the lobacto-leaf structure exhibited by mont-morillonite.
tion or replacement of preexisting minerals. Montmorillonite isthe first mineral to have crystallized in the clay-mineral para-genetic sequence.
ChloriteIn the host sandstones, chlorite occurs as plate-like crystals
that appear to have an edge-to-face orientation lo each other.The chlorite is authigenic and probably formed at the expense ofcellular montmorillonite (fig. 8). The SEM examination showedthat chlorite is generally concentrated in the ore zone. Theconcentration of chlorite in ore zones in the Grants mineral beltalso has been reported by Granger (1962) and by Riese and others(1977).
FIGURE 4—PHOTOMICROGRAPH OF A SANDSTONE SAMPLE FROM FAR.REDUCED ZONE. SHOWING INTERCALATION OF DETRITAL MONT-MORILLONITE DERIVED FROM BENTONITES (crossed tlicols).
FIGURE 6—SEM IMAGE OF AUTHIGENIC CELLULAR MONTMORILLONITECOATING DETRITAL GRAINS IN A SANDSTONE SAMPLE FROM NEAR-OXIDIZEDZONE.
[New Mexico Bureau of Mines & Mineral Resources, Memoir 38,1980]

165
F I G U R E 7—SCANNING-ELECTRON MICROGRAPH SHOWING THE GROWTH OF
H I 111 AK MONTMOKII i ciNiTii ON A uETKiTAi GRAIN; note the growth andcoalescing of micrnpillars thai probably give rise to the honeycombstructure; sample from near-oxidized zone.
KaoliniteKaolinite occurs as a face-to-face stacking of pseudohexagonal
plates that fill the pore spaces and coat the grains in the sand-stones (fig. 9). Kaolinite lies over honeycomb montmorillonitewhich also coats the grains, suggesting that kaolinite formedlater in the paragenetic sequence. Kaolinite also exhibits adelicate, vermicular, accordion-like structure which may extendthe length of the pores. The coarse, monomineralic nests ofkaolinite probably crystallized from pore fluids, in a processsimilar to the formation of cellular montmorillonite. Althoughno quantitative determinations could be made from the SEMstudy, authigenic kaolinite appeared to be favored by coarse-grained sediments and to be more abundant in the ore andreduced zones.
FIGURE 8—SEM IMAGE SHOWING PARAGENETIC RELATIONSHIPS AMONGHONEYCOMB MONTMORILLONITE. CHLORITE. AND QUARTZ. Chlorite isforming at the expense of montmorillonite and laps onto quartzcrystals; therefore, chlorite is younger than both montmorillonite andquartz; sample from near-oxidized zone.
F I G U R E 9 — P s i i l l D O H E X A t i O N A I BOOKS Ol KAOLINITL 111 1 INC. THfc PORt
si'At i AND COATING DLIKITAI GRAIN:;, dark smooth areas are grain con-tacts developed during sample preparation; sample from near-oxidizedzone.
Distribution of authigenic claysQuantitative determination of clay minerals was made by x-ray
diffraction of the <2 /J fraction of the sandstones. Only thedistribution across the roll front of the authigenic mont-morillonite, kaolinite, and chlorite is presented here. Traceamounts of a mixed-layer illite-montmorillonite were identifiedin a few samples but are not considered in the quantitativeanalysis because of their limited occurrence.
Although both detrital and authigenic montmorillonites wereidentified in the samples, those containing significant amounts ofdetrital montmorilloi.ite were screened out in order to show thedistribution of only authigenic clay-mineral species across theroll front. Chen ' ~al data were used to identify these samples.
The bentonites are significantly enriched in calcium and mag-nesium and contain very low concentrations of sodium; in con-trast, the host sandstones are characterized by relatively highamounts of sodium and low amounts of calcium and magnesium.The (Ca + Mg)/Na ratios for sandstone samples not con-taminated by detrital bentonitic material are significantly smallerthan both the contaminated sandstones and pure bentonitesamples. A plot of the (Ca+ Mg)/Na ratios versus frequency forthe 45 samples analyzed is shown in fig. 10. Despite the largerange in the ratios, 30 of the samples are clustered near low(Ca + Mg)/Na values (<2.1), indicating relatively un-contaminated sandstone samples. Only these samples were usedin the interpretation of the mineralogical data.
Fig. 11 shows the distribution of authigenic clays across theMariano ore roll. The relative amount of montmonilonite ismuch greater in the oxidized zone. The SEM data indicate thatchlorite is enriched principally in the ore zone, whereas kaoliniteis abundant in both the ore and reduced zones. The abundance ofauthigenic kaolinite indicates acidic conditions in these zones(Grim, 1968). Formal ion of kaolinite may have been confined toa small area close to tne orebody as a result of the ore-formingprocesses. Cellular montmorillonite may be the dominant speciesaway from this zone of kaolinite enrichment, although this inter-pretation is not established yet.
Quantitative clay-mineral studies in the Grants region havebeen conducted by Riese and others (1977), who found thatmontmorilionite is most abundant in the reduced zone, and
[New Mexico Bureau of Mines & Mineral Resources, Memoir 38,1980]

166
10 15 20
NO. OF SAMPLES
25 30
FIGURE 10—HISTOGRAM SHOWING FREQUENCY OH (Mg + Ca)/Na RATIOSFOR ALL SAMPLES ANALYZED IN THIS STUDY.
kaolinite is most abundant in the oxidized zone. Their results arein contrast to this investigation, possibly because of their failureto recognize two genetically different types of montmorillonites.
Heavy mineralsThe heavy minerals were separated from the sandstone
samples using bromoform (specific gravity 2.87). The identifica-tion of the minerals was made by x-ray diffraction and by anSEM equipped with an energy-dispersive x-ray detector.
The heavy minerals identified in the sandstones include iron-titanium oxides (ilmeno-hematite and/or ilmeno-magnetite), ironoxides (hematite and limonite), anatase, rutile, pyrite, barite,apatite, and zircon. Trace amounts of garnet, tourmaline, sphal-erite, amphiboles, and pyroxenes were also observed. No discreteuranium mineral species were identified in the samples.
The iron-titanium oxides anatase, pyrite, and barite are themost dominant heavy minerals present in the host rocks of theMariano Lake area; however, the occurrence and distribution ofthese minerals across the roll front are quite variable. The Fe-Tioxides in the sandstones are detrital and have undergone varyingdegrees of alteration. Pyrite, barite, and anatase are authigenicand appear to be related to the ore-forming processes; therefore,the following discussion is limited only to Fe-Ti oxides, anatase,pyrite, and barite.
Iron-titanium oxidesThe presence of Fe-Ti oxide minerals in the uranium-bearing
sandstones has been reported (Adams and others, 1974; Rey-
DRILLHOLE NO. 1210 1209
ZONE FAROXIDIZED
1208
Z
o
(0>
oo
Io
100 -
2 5 -
NEAR NEAROXIDIZED ORE REDUCED
1 1 1
FARREDUCED
MONTMORILLONITE (A)
(8)
(7)
DISTANCE100' 150 METERS
FEET400
I
Ui
CiCO
100-
7 5 -
5 0 -
2 5 -
0 - i-8)
KAOLINITE & CHLORITE
1
1
/
(5)
^ 1
t(7
— • —
(B)
_
•
(5)
FIGURE 11—DISTRIBUTION OF AUTHIGENIC CLAYS ACROSS THE MARIANO ROLL FRONT: vertical bars representone standard deviation from the mean value indicated by dot; number of samples analyzed are in paren-theses.
[New Mexico Bureau of Mines & Mineral Resources, Memoir 38,1980]

167
nolds, 1977; Reynolds and Goldhaber, 1978). In the Jackpilesandstone unit of the Brushy Basin Member, these minerals oc-cur as detrital grains that appear to have been altered in situ byselective removal of iron (Adams and others, 1974). According tothese authors, almost all of the iron can be leached from theseminerals in strongly reducing environments, especially withinpermeable sands containing large conct-.;rations of organic mat-ter. This process results in a residuum that ultimately yieldsalmost pure TiO> (anatase, rutile, and brookite).
SEM examination of heavy-mineral fractions from the Mari-ano area showed the presence of detrital Fe-Ti oxide mineralgrains, which appeared to have undergone varying degrees ofalteration (fig. 12). The element-distribution maps recorded bythe microprobe showed that whereas all grains have high titan-ium content, iron concentration varies greatly, suggesting altera-tion of the Fe-Ti oxide minerals by selective leaching of iron.Authigenic titanium-oxide minerals (anatase and rutile), presum-ably the alteration products of the Fe-Ti oxides, were also iden-tified in the heavy-mineral fractions (fig. 13).
The common Fe-Ti oxide minerals form two solid-solutionseries: the rhombohedral ilmenite (FeTiOj)-hematite (Fe:Oj)series and the cubic ulvospinel (FeTiO4)-magnetite (FejQi) series.X-ray diffraction of the heavy minerals revealed no discretereflections for the individual species of these series; therefore, theFe-Ti oxide minerals were treated as a single group. Quantitativeanalysis of these minerals was made by grain count of the heavy-mineral fractions using an SEM equipped with an energy-dispersive x-ray detector. About 150 representative grains in eachsample were counted. Grains showing almost equal intensities ofiron and titanium were counted as representing Fe-Ti oxide min-erals. Since the presence of these minerals could not be con-firmed by x-ray diffraction, the numerical data for this group ofminerals should be considered semiquantitative.
The Fe-Ti oxide minerals were found to be most abundant inthe oxidized zones and somewhat less abundant in the far-reduced zone (fig. 14a). The presence of organic matter and theresultant reducing environment probably caused alteration anddepletion of Fe-Ti oxide minerals in the ore zone of the MarianoLake area. Although these minerals are dispersed throughout thehost rocks, they appear to be concentrated in a thin lamina in the
FIGURE 13—SEM IMAGE SHOWING AUTHK.I-NU TiO. C RVSTAISIANAI \SI .RUTH.DIN AHIiAVY-MINI-KAl GRAIN.
basal part of the sandstone unit; fig. 15a shows the presence ofthese heavy minerals in a thin section prepared from a sampletaken from this zone.
FIGURE 12—SEM IMAGE OF LEACHED Fe-Ti OXIDE MINERAL GRAIN FROM
HEAVY-MINERAL FRACTION OF SANDSTONE SAMPLE FROM THE FAR-REDUCED
ZONE.
PyriteThe quantitative analysis of pyrite was also made by grain
count using an SEM equipped with an energy-dispersive x-ray de-tector. X-ray diffraction of the heavy-mineral fractions did notshow the presence of any other iron-sulfide mineral species.
Pyrite varies substantially in form and abundance across theroll front. It is concentrated in the ore zone, present in smalleramounts in the reduced zones, and absent in ihe far-oxidizedzone (fig. 14b). Small, discrete octahedra and round framboidsare the common forms of pyrite in these sandstones. Pyrite fre-quently acts as a cement in the host rocks and is authigenic.
Bentonitic clay galls and clay stringers in the sandstones seemto have favored the formation of pyrite (figs. 15 c, d). The ben-tonites are enriched in pyrite especially near the contacts withsandstones; Squyres (1970) also observed the abundance of pyritealong the edges of claystone beds. Hematite pseudomorphs afterpyrite commonly are seen in the oxidized zone of the Marianoorebody.
Alteration halos occur in some samples around peripheral por-tions of the clay galls containing pyrite. The alteration rims ofthese clay galls are much lighter in color and are almost com-pletely devoid of pyrite (fig. 15c). An autoradiograph of a pol-ished thin section containing these partially altered clay gallsshows uranium to be concentrated in the alteration halos (fig.16). Almost complete absence of pyrite and concentration ofuranium in these reaction rims suggest that the deposition ofuranium took place at the expense of pyrite.
BariteBarite (BaSO4) is present as an authigenic mineral in many
samples, and its abundance is highly variable. Relatively largeamounts are present in the near-oxidized, ore, and near-reducedzones. One sample from the basal portion of the near-reducedzone contained an extremely high percentage (20 weight percent)of heavy minerals, of which over 90 percent was barite. Barite oc-curs chiefly as anhedral to subhedral crystal aggregates and ascementing material. The paragenetic relationship among theorganic matter, barite, and pyrite can be see in fig. 15b. The
[New Mexico Bureau of Mines & Mineral Resources, Memoir 38,1980]

168
DRILLHOLE NO. 1211
ZONE FAROXIDIZED
-T5 0 -z
Oto<a.u
UJ
z2
1210 1209 1208
NEAR NEAROXIDIZED ORE REDUCED
FARREDUCED
3 0 -
0 -
IRON-TITANIUM OXIDES (A)
(8)
(5)
zg
ui23O
60
5 0 -
4 0 -
3 0 -
2 0 -
10 -
0 -
-\PYRITE
8)
1
/
(5)
•
(5
1 1(B)
\
5 V—-•• •"•(7)
(S
100 150 METERSDISTANCE
200 FEET
FIGURE 14—DISTRIBUTION OH Fe-Ti OXIDES (A) AND PYRITE (B) ACROSS THE MARIANO ROLL FRONT; vertical barsrepresent one standard deviation from Ihe mean value indicated by dot; number of samples analyzed are in paren-theses.
organic material coats the detrital grains and lines the porespaces, indicating that the organics were introduced and de-posited first in the paragenetic sequence. Most of the pore spaceis filled with barite. which appears to have formed authigenicallyat a later stage; a pyrite crystal in the center of the pore was thelast to form in this sequence. The formation of barite and thisyounger-generation (ore-stage) pyrite seems related to the ore-forming processes.
Uranium mineralsCoffinite is frequently considered the most common uranium
mineral in the Grants mineral belt, although neither coffinite norany other uranium mineral was found in this study. Therefore,uranium may be present in a noncrystalline form in this orebody.Recent equilibrium studies of Mariano Lake samples by J. G.McKelvey of Gulf Research show a very rapid loss of radon dur-ing experimentation. This observation suggests that uraniumminerals, if present, may have very open structure or may be veryfine grained or amorphous, facilitating the escape of radon.
Heavy minerals as guides to explorationFe-Ti oxide minerals and pyrite are relatively abundant across
the Mariano orebody. Since the Fe-Ti oxides possess magneticproperties, detection of these minerals may be possible using sur-face and downhole magnetic methods. The magnetic susceptibil-ity measurements on the core samples can provide valuable in-formation regarding the presence and concentration of theseminerals. The use of these methods for detecting halos aroundsandstone-type uranium deposits has been proposed by Adamsand others (1974), Hafen and others (1976), and Scott andDaniels (1976).
Fe-Ti oxides and pyrite are most abundant in the oxidized zoneand ore zone respectively in the Mariano Lake area (fig. 14). Cur-rent research may determine whether magnetic methods can beused to detect these zones.
Interpretation and discussionFig. 17 is a schematic representation of the probable sequence
of events leading to uranium deposition in the Mariano orebody.
[New Mexico Bureau of Mines & Mineral Resources, Memoir 38,1980]

169
FIGURE IS—A) PHOTOMICROGRAPH SHOWING A LAYER CONTAINING Fe-Ti OXIDES IN A THIN SECTION or SANDSTONE SAMPLE FROM THE NEAR-
REDUCED ZONE. Bi PHOTOMICROGRAPH SHOWING BARITE CEMENT (bt) IN A SANDSTONE SAMPLE FROM NEARREDUCED ZONE; a pyrite crystal
(black) in the central part of the pore space suggests that pyrite formed later than barite; note the presence of organic material, whichcoats the detrital grains and lines the pore spaces (crossed nicols). o PHOTOMICROGRAPH SHOWING PART OF A CLAY GALL IN SANDSTONE;note alteration halo around the clay gall; unaltered core of the clay gal] shows abundant pyritc, whereas alteration halo is devoid ofpyrite; sample from ore zone (plane-polarized light). D) AUTHIGENIC PYRITE CRYSTALS IN CLAYEY MATERIAL IN A SANDSTONE SAMPLE FROM
om ZONE (reflected light).
This model is based principally on paragenetic relationships and,to a lesser extent, on the distribution of mineralogies! variables.My conception of the formation of this deposit is discussedbelow. These interpretations are preliminary since they are basedon a limited amount of information; modifications of the modelmay be necessary as more data become available.
Stage IThe Poison Canyon sands were deposited by a braided-stream
system developed on the basal bentonite bed of the Brushy BasinMember. Montmorillonitic clayey material, derived from thebentonites, was incorporated into the sandstones in the form ofdetrital clay galls, lenses, and stringers. Local accumulations ofplant material occurred during the deposition of the sediments.Plutonic rocks dominated the source area for these sands, whichwere deposited by eastward-flowing streams (Jenkins and Cun-ningham, this volume).
The deposition of potential host rocks was followed by largeinfluxes of tuffaceous volcanic material that also altered to ben-tonites. Climatic conditions of the region were semiarid; rain-water provided solutions that altered the volcanic material andpercolated downward into the underlying Poison Canyon. Theleach solutions probably were alkaline and contained large con-centrations of dissolved silica as evidenced by the presence of
chert layers within the bentonites. The irregular distribution andlow concentrations of sodium in the bentonites are probably theresult of the sodium mobility and its removal by these leach solu-tions.
Authigenic cellular montmorillonite probably precipitated onand within the sand grains at this time. The availability ofsodium may have caused some albitization in the sandstones.Authigenic quartz in the host rocks is ubiquitous and seems tohave formed at several stages, indicating that the ground waterwas saturated with respect to silica.
Stage IIThe mode of occurrence of organic material in the ore zone in-
dicates that it was introduced epigenetically. The timing andmechanism(s) of humate precipitation are not known; however,the alkaline leach solutions from the bentonites may havetransported fulvic and humic acids derived from the plant debris.
The presence of organic material created reducing conditionswithin the sandstones. The reducing environment initiated therelease of iron from Fe-Ti oxides, as well as from the other Fe-containing minerals; some of the released iron combined withsulfur to form pyrite. While the source of sulfur cannot be deter-mined with certainty, it could have been derived from gypsum,which is fairly common in the shallow mines of the Grants
[New Mexico Bureau of Mines & Mineral Resources, Memoir 38,1980]

170
FIGURt 16—AI THIN SK'IION 01 A SAMIM I i KOM ORI- /ONI- IONIAININC. ABUNDANI n A* UAI I s; note[he allcraiion halos around clay galls; the central dark portions of the clay galls contain abundantpyrite, whereas alteration halos are almost completely devoid of pyrite (see fig. 15c). HI AUIOKADIO-C.RAI'HOI mi IIIIN si ci ION SHOWN IN HO. 16a; note concent ration of uranium in alteration halos ofI he clay galls; uranium deposition at the expense of pyrite i.s apparent.
uranium region (Squyres, 1970). An insignificant amount ofsulfur could also have come from the organics. The pyriteformed during this stage is referred to as prc-ore pyrite.
The affinity of pyrite for the bentonitic material in theMariano area may result either from the retention of humates asbacterial food in the clays or from a relatively high concentrationof iron-bearing mineral species in the clays.
Authigenic chlorite in (he hos! sandstones is enriched in iron.Chlorite formation from cellular montmorillonite also may havetaken place after the introduction of organic material into thepotential ore zone.
Stage IIIUranium halos observed by Squyres (1970) and Lee (1976) are
similar to the concentration of uranium in the peripheral por-tions of clay galls (figs. 15c and 16). In a few cases, Squyres(1970) observed southeast-trending tails in the halos which he in-terpreted as indicating the direction of movement of ore-depositing solutions. Squyres (1970, fig. 25) also observed aswarm of minute, oriented ore halos around pyrite clots in sand-tones; however, he did not offer any explanation for such a
uranium occurrence. Lee (1976) believes that the halos wereto: r.ied by uranium adsorption on montmorillonitic clay gallsironi relatively stagnant solutions.
These observations suggest that uranium halos formed at thelApense of pre-ore pyrite. Although this relationship betweenpvriie and uranium occurs here in the clay galls, uranium in thehost rocks could have also been deposited as a result of oxidationof pyrite by the mineralizing solutions.
The acidic solutions resulting from the oxidation of pyritewould readily attack potassium feldspars to form authigenickaoliniie. This process would also release barium that is presentin the feldspars as a trace element (Fairbridge, 1972). The re-leased barium can combine with the sulfate—present in the solu-tion as a result of pyrite oxidation—to form barite, which is con-
centrated in and near the ore zone at Mariano Lake. Fig. 15bshows the formation of pyrite after barite, suggesting the forma-tion of pyrite during the ore-forming process. If the acidic solu-tions produced by the oxidation of pre-ore pyrile migrate towardareas of higher organic concentrations, the excess sulfate presentin the solutions may oxidize organic material and produce sulfidesulfur that could combine with Fe'2 , forming ore-stage pyrite.
The abundance of auihigenic kaoliniteand near absence of cal-cite in the ore and reduced zones can also be attributed to theacidic environments created during this stage.
Stage IVBecause the cores obtained in the oxidized zone of Mariano
Lake did not encounter any clay galls, the last stage of fig. 17 wasnot observed in the samples examined. This stage is proposed as avisual aid that might be used in the field for exploration pur-poses.
The depth of penetration of uranium into clay galls would de-pend on: a) availability of uranium in solution, b) presence ofreducing agents in clay galls (such as pyrite or organics), c) size ofthe galls, and d) length of time uranium-bearing solutions remainin contact with clay galls. These variables may affect both thesize and shape of the halos and the presence or absence of pyritein the core of the clay galls. Assuming that uranium penetrationof the galls occurred to the point shown in fig. 17 (Stage III), aninflux of oxidizing solutions at a later time would attack uraniumas well as pyrite. The oxidation of pyrite in the central parts ofthe galls would produce hematite and/or limonite. The concen-tration of iron oxides in the core of the galls would give them redcoloration. Uranium present in alteration halos also would be ox-idized and dissolved. Because the former uranium halo wouldhave very little or no iron, it would be gray green, pink, or tan,depending upon the amount of iron present. If these types of claygalls can be identified in the oxidized zone, one may infer thatmineralizing solutions passed through that region.
[New Mexico Bureau of Mines & Mineral Resources, Memoir38,1980]

171
SANDSTONE CONTAININGFe-Ti OXIDES
CLAY GALLS CONTAININGFe-T, OXIDES ANDORGANIC MATTER
INTRODUCTION OFHUMIC ACIDS INTOSANDSTONES.
REACTION OF ORGANICSWITH Fe-T, OXIDES.
SELECTIVE REMOVALOF Fe ANDFORMATION OF PYRITE.
URANIUM-BEARINGMINERALIZINGSOLUTIONS
DESTRUCTION OFPYRITE.URANIUM DEPOSITION
REACTION RIMSCONTAINING URANIUM(NO PYRITE)
INTRODUCTION OFOXIDIZINGSOLUTIONS
OXIDATION ANDREMOVAL OF URANIUM(FORMATION OF PINKRIM)
••OXIDATION OF PYRITETO FORM HEMATITE(FORMATION OF REDCORE)
I - ' I G U R E 1 7 — S c l l l M A I I C l > l \ l , K \ M S H U W I M , V I'OSMIIII- S K J l l - M I u l
I \ l M S IS l l l l M I K M A I l n S O l M \ K I A M ) O K H I o m .
Squyres (1970) has described the occurrence of clay galls in theMorrison Formation of the Grants uranium region and foundthem altered to varying degrees. He observed claystone clastshaving "a red core and a green mantle." The distribution ofhematite in theclasts he examined corresponds to the distributionpattern of pyrite in adjacent unoxidized clasts. I believe that thistype of occurrence of clay clasts in sandstones is similar to the
one proposed in Stage IV of this model of uranium deposition alMariano Lake.
A number of features observed by Squyres (1970) in othermines of the Grants region are similar to the ones observed in theMariano Lake area, suggesting a mechanism of uranium precip-itation similar to the one proposed here. However, more mineral-ogical and chemical information about other uranium deposits inthe Giants region will be needed for definitive conclusions.
ReferencesAdams, S. S., Curtis, H. S., and Hut'en, P. 1 .. IS»74. Altcianon ol
dciriial magnctilc-ilmcnitc in continental sandstones ol die MoirisonFormation, Now Mexico, in Formation of uianium oie deposits: Vi-enna, International Atomic Energy Agency. Symposium, p. 219-2?.'
Fairbridge, R. W\, ed., 1972, The encyclopedia of geochemistry and envi-ronmental sciences: New York, Van Nosirand Remhold Company. v.IV A. 1321 p.
Granger, H. (.'., 1962, Clays in the Morrison lotmaiion and I hoi: spatialrelationship to die uranium deposits al Ambrosia I ake. New Mexico:U.S. Geological Survey, Prof. Paper 450-1), p. 1)15-1)20
Granger, H. C , and Warren, C. G.. 1974, Zoning in altered tongueassociated with roll-type uranium deposiis, in Formation of uraniumore deposits: Vienna, International Alomic Energy Agency, Sym-posium, p. 185-200
Grim, R. E., 1968, Clay mineralogy: New Yotk, McGraw-Hill, 2nd edi-tion, 596 p.
Hal'en. P. 1.., Adams, S. S.. and Seeor. Ci. B.. 1476, Application otmagnetic susceptibility measurements 10 uianium exploianon in sand-stones, in Exploration lor uranium ore deposits: Vienna. Intel nationalAtomic Energy Agency, Symposium, p. 367-378
Lee, M. .1., 1976, Geochemistry of the sedimentary uranium deposit-, olthe Grants mineral bell, southern San Juan Basin, New Mexico: Ph.D.thesis. University of New Mexico, 241 p.
Reynolds, R. I... 1977, Magnetic litanoheniaiiie mincials in uianium-bearing sandstones: U.S. Geological Survey, Open-tile Kept. 77.355,I6p .
Reynolds, R. [.., and Goldliabe:, M. B., 197K, Origin of a south lexasroll-type uranium deposii. I. Alteration of iron-manium oxideminerals: Economic Geology, v. 73, no. S, p. 1677-1689
Riese, W. C , Lee, M. T., and Brookins, I). G., 1977, Scanning eleclronmicroscopy of uranium ores, Grains mineral belt. New Mexico-application to U: C: pyrite distribution (abs.): Geological Society olAmerica, Abstracts with Programs, v. 9, no. 7. p. 1142
Saehdev, S. C , 1978, Clay minerals as uranium tracers lor roll-front typedeposits: Geological Society of America, Abstracts with Programs, v.10, no. 7, p. 484
Scott, J. H., and Daniels, J. .1., 1976, Non-radiomeiric borehole geo-physical detection of geochemical halos surrounding sedimentaryuranium deposiis, in Exploration for uranium ore deposits: Vienna, In-lernalional Atomic Energy Agency. Symposium, p. 379-390
Squyres, J. B., 1970, Origin and depositional environment ol uianiumdeposits of the Grams region. New Mexico: Ph.D. thesis, StanfordUniversity, 228 p.
Wilson, M. I)., and Pittman, E. I)., 1977, Aulhigenic clays insandstones—recognition and influence on reservoir properties andpaleo-environmental analysis: Journal of Sedimentary Petrology, v.47, no. I, p. 3-31
[New Mexico Bureau of Mines & Mineral Resources, Memoir 38,1980]

172
MINERALOGY AND GEOCHEMISTRY OF MARIANO LAKEURANIUM DEPOSIT, SMITH LAKE DISTRICT
by Jeannie Place, Gulf Oil Corp., Casper, Wyoming 82602, andRichard S. Delia Valle and Douglas G. Brookins, University of New Mexico, Albuquerque, New Mexico 87131
AbstractThe Mariano Lake uranium deposit is located on the west side
of the Smith Lake district in the Grants mineral belt. Mineraliza-tion is restricted to a basal arkosic sandstone of the Brushy BasinMember of the Morrison Formation (Upper Jurassic). This sand-stone is equivalent to the Poison Canyon sandstone of the Am-brosia Lake district and contains a series of paleochannels thathave been mineralized. The ore displays a roll-type geometry andis located at an iron-sulfur redox interface. The deposit ischemically different from other deposits of the Grants mineralbelt. It is characterized by low total carbon dioxide, calcium,molybdenum, and selenium, whereas sulfur and vanadium areenriched. Arsenic and zinc exhibit regular zoning patterns acrossthe deposit. The deposit contains an ubiquitous assemblage ofpyrite, kaolinite, chlorite, illite, and illite-montmorilloniteassociated with vanadiferous ore mixed wiih organic carbon. Noprimary uranium minerals have been identified. Gypsum (varietyselenite) is present, but calcite is absent. The age of mineraliza-tion is unknown. The ore has been remobilized, perhaps morethan once, and mineralization may have occurred during mid-Cretaceous, Laramide, or post-Laramide time. Based on existingdata, polygenetic models are as reasonable as a single stage ofremobiiization.
Local geologyThe Mariano Lake uranium deposit has been intensively
studied by personnel of Gulf Mineral Resources Co., Denver,Colorado. The deposit is located at the west end of the SmithLake district of the Grants mineral belt, sees. 11 and 12, T. 15N., R. 14 W. (fig. 1). Mineralization is restricted to a basalarkosic sandstone of the Brushy Basin Member of the Morrison
Formation (Upper Jurassic), shown in the stratigraphic section(fig. 2). This sandstone, informally termed the Poison Canyonsandstone, consists of a sequence of paleochannels in whichuranium mineralization occurs in a roll-type deposit. Downdipmigration of a chemical front (an oxidation-reduction interface)was halted by formation of the north-northwest-striking Mari-ano (Smith) Lake anticline. As a result the deposit has ac-cumulated on the south flank of the anticline. Normal faults cutthe deposit, especially in the southeast area, with displacementsof no more than 50 ft.
Regional settingThe Smith Lake district is located on the southern edge of the
San Juan Basin, a structural depression that lies on the southernedge of the Colorado Plateau. According to the tectonic subdivi-sions of Kelley (1955), the Smith Lake district lies on the south-ernmost edge of the Chaco slope at its contact with the Zuniuplift. In the Smith Lake district, an unbroken sequence ofTriassic through Cretaceous eolian, fluvial, and marine rocks areexposed (fig. 2). The Chinle Formation (Triassic); Entrada,Todilto, and Morrison formations (Jurassic); and the Dakotaand Mancos formations (Cretaceous) form a series of sandstoneand limestone ridges with shale valleys. Regional dip of the stratais 3-5° north-northeast off the flank of the Precambrian ZuniMountains into the San Juan Basin. Younger Cretaceous andTertiary sedimentary rocks are exposed to the north near thebasin's center. To the east in the Ambrosia Lake district lies theMount Taylor volcanic field, a series of upper Miocene to Holo-cene volcanic rocks varying from rhyolitic tuffs to basaltic flows.
About 5,000 ft of sedimentary rocks are exposed in the SmithLake district. Only those rocks of Jurassic age are of economic
INDEX MAP of GRANTS MINERAL BELT AREA
FIGURE 1—LOCATION MAP FOR MARIANO LAKE. SMITH LAKE DISTRICT.
[New Mexico Bureau of Mines & Mineral Resources, Memoir 38,1980]

173
SAN RAFAELGROUP
Gollup Formotion
Mancos
Formation
TresHermanos
T3dT(OTo FormpTTonBrushy Basin Mbr.Poison <•*""-• —
Morrison
Formation
WestwoterCanyonMember
RecaptureMumhwr
Bluff Formation
Summerville Formation
-Todilto FormationEntrodo Formation
Chinle
Formation
I-!"'-;':•'•!';•;•''-j ton , m-gr, massive s$
gray or black sh
fossiliferousi calcareous
ton, f -gr to m - gr ss
wh or ton, m-or ss w/Fegr. mdst w/intbed white
or red ss units
f -gr to c-gr, red orwhite t t w/mdsl lenses
red or gr sandy mdstw/ss lenses
It red to ton, massive,f - g r to m-gr ss
red si tt y sh
massive & lith Is -red, m- qr ss
dominantly red sh
w/intbd red or
mottled as units
IShlnorump Mem. ~ . J r e d , congl. ss
FIGURE 2—STRATIGRAPHY sKTioNoi-THi-: SMITH LAKH DISTRICT (modified from Hazlcit and Kreck, 1963).
importance in the Grants mineral belt; in the Smith Lake district,economic deposits are restricted to the Morrison Formation, a se-quence of arkosic fluvial sandstones, mudstones, and bentoniticshales.
Morrison Formation stratigraphyThe Morrison Formation in the Smith Lake district consists of
a sequence of interbedded mudstones, siltstones, and arkosicsandstones approximately 500 ft thick. Sandstones range in colorfrom dark, hematitic red to pale brown and from orange to lightgray. Prominent trough crossbedding and cut-and-fill structuresare common in the sandstones. The mudstones and siltstones aremaroon, purplish red, or gray green. Thin sandstone lenses arecommon within the mudstones, as are clay galls in the sand-stones.
In the Smith Lake district, the Morrison Formation is dividedinto three members: the basal Recapture Shale, the Westwater
Canyon Sandstone, and the upper Brushy Basin Shale. A locallycontinuous basal sandstone in the Brushy Basin has been termedthe Poison Canyon sandstone, a title of economic usage.
The Recapture Shale Member overlies the Bluff Sandstone.The contact may be an erosion surface with small local relief or itmay be an intertonguing relationship. The Recapture has athickness of 130-230 ft in the Grants area. To the east, nearLaguna, the thickness decreases to 25-50 ft, and west of theSmith Lake district in Arizona a maximum thickness of 700 ft isattained. The Recapture is a sequence of distinctive alternatingmaroon-red and grayish beds of mudstone and siltstone and fine-to medium-grained sandstones. Depositional features includeripple lamination and rare, small to medium-sized crossbeds.Subeconomic deposits of uranium have been found in the Recap-ture mainly to the east, in the Ambrosia Lake district.
The Westwater Canyon Sandstone Mem ber overlies the Recap-ture Shale throughout the Grants mineral belt. The contact maybe scoured, gradations!, or intertonguing. In the Smith Lake
[New Mexico Bureau of Mines & Mineral Resources, Memoir 38,1980]

174
district the Westwater is 250-300 ft thick, but south and south-west of the area combined depositional thinning and pre-Dakotaerosion cause it to thin rapidly. The Westwater Canyon is a light-brown to light-gray, fine- to coarse-grained arkosic sandstone.Small lenses of conglomerate, mudstone, and siltstone are com-mon. Fresh grains of potassium feldspar, dark clusters oforganic matter, and white flecks of interstitial clays are commonin hand specimens. "Trash piles" of silicified Jogs and dinosaurbones may be found locally. A depositional feature common tothe Westwater Canyon is small to medium-scale crossbedding.The Westwater Canyon was deposited by a braided-channel sys-tem that flowed east-northeast across the broad alluvial flood-plain of the Recapture. Periodic flooding resulted in mudslonedeposition.
The Brushy Basin Member conformably overlies the West-water Canyon Sandstone and is unconformably overlain by theDakota Sandstone (Cretaceous). The contact with the WestwaterCanyon is gradational and imertonguing; some question existsregarding whether a mineralized, locally continuous basal sand-stone should be included in the Westwater Canyon or the BrushyBasin. The sandstone is considered part of the Brushy Basin inthis report and will be discussed using the informal terminologyof Poison Canyon sandstone.
The thickness of Ihe Brushy Basin Member ranges from 20 ftto more than 300 ft in the Grants area. In the Smith Lake district,it is between 120 and 150 ft thick. The basal Poison Canyonsandstone, where present, reaches 45 fl in thickness. The BrushyBasin thins to the west, and just northeast of Gallup it has beenremoved completely by pre-Dakoia erosion. The Brushy Basin isprincipally a gray-green montmorillonitic mudstone with inter-bedded fine- to coarse-grained arkosic sandstones. These sand-stone lenses range from narrow stringers lo beds several lens offeet thick.
In the Smith Lake district, one of the more massive sandstonebeds is the Poison Canyon sandstone (Hilpen and Freeman,1956). This unit is a locally continuous fluvial sandstone com-positionally similar to the underlying arkosic Westwater Canyonmember. The Poison Canyon sandstone in (he subsurface is achannel deposit filling a scour in Ihc Brushy Basin. Freshpotassium-feldspar grains are common, along with large flecksof clay minerals—especially kaolinite. Pyrite is abundant, eitheras cement or as macroscopic grains. Occasional "trash piles"have been encountered. Depositional features include prominenttrough crossbedding and angular rip-up clasts in the lower con-glomeratic sandstones. In the Smith Lake district, the PoisonCanyon sandstone yields most of (he economic deposiis ofuranium. The mudslone units of (he Brushy Basin appear to beaccumulations of volcanic ash. This volcanic ash is (bought to bethe result of renewed volcanic aclivUy occurring in the samevicinity as the source area of the Wesiwater Canyon.
StructureThe Smi(h Lake district is located on the southern edge of the
homoclinal Chaco slope, a tectonic province of (he San JuanBasin (Kelley, 1955). Two main periods of uplift have occurred inthe region since the end of Ihe Paleozoic, creating major ero-sional unconformities. The first period of uplift occurred in earlyor middle Jurassic time resulting in the angular unconformityand erosional surface at the base of the Enirada Sandstone. Asecond major uplift during post-Morrison but pre-Dakota time(Early Cretaceous) resulted in local erosion of the Brushy Basin;md Westwater Canyon Members of the Morrison. During early10 mid-Tertiary time the Laramide Orogeny took place, upliftingihe Zuni Mountains and causing further subsidence and north-ward tilling of the San Juan Basin. In the late Tertiary to Qua-ternary, further regional uplift of the Colorado Plateau andcreation of the Mount Taylor volcanic field occurred.
r oi us—The Smith Lake district has one major fold, theMariano (Smith) Lake anticline. This anticline is a northwest-southeast-trending Laramide structure that plunges about S. 80°
E.; it has played a significant role in localization of uraniumdeposits because its creation formed an impassable barrier forfluids migrating downdip. A number of small but economicallyimportam deposits are located along ihe south-flanking synclinewhich plunges to the northwest.
FAULTS—No major faults occur in (he Smith Lake district.However, the Mariano Lake deposit is cut by numerous smallnormal faulls showing movement of no more than 50 fl. Fauhingis most extensive in the sou(heast end of (he ore deposh, andfracturing is rare.
Geology of the ore depositsThe uranium deposiis of the Grants mineral belt are found
mainly in the Westwater Canyon Sandstone, the Jackpile sand-stone, and the Poison Canyon sandstone. Pore spaces in thesandstones are partially to completely filled with mixtures oforganic mailer (humate), uranium-silicale minerals (coffini(e),iron sulfides (pyri(e), and iron oxides (hema(ite). These ligh(-grayto black deposits may or may not parallel the bedding in the hostrock. They extend laterally up to several thousands of feet, with athickness from a few inches to several tens of feet.
Researchers of Ihe uranium deposits have recognized twodistinct (ypes of ore deposiis that differ in geometry, age, andmineral ratios. The primary ore deposit of greatest economic im-portance is the older of ihe two types of deposits. Primary ore isalso called roll, blanket, prefauli, or (rend ore. Sock ore consistsof younger orebodies (hat are controlled by and concentraiednear faults and fractures of Laramide age. Stack ore is also calledredistributed, post-fault, or secondary ore.
Primary orePrimary orebodies are flattened, elongate, or lensoid masses
forming parallel or subparallel trends. These trends or belts maybe a few thousand feet (o several miles in length and a few hun-dred to more than a thousand feel wide. Thicknesses range froma few inches (o about 15 fl. These deposiis show no obviousgenetic relauonship to Laramide structures and frequently aredisplaced by Laramide faults.
Stack oreStack orebodies are thick, lower grade deposiis closely associ-
a(ed wilh primary deposus. They are conirolled by and concen-trated near Laramide faulls and joints. Stack orcbodies exhibit aclose spatial relationship to an oxidation-reduction interface,between updip oxidized hematitic sandstone and downdip re-duced pyritic sandsione. The Mariano Lake uranium deposit is aroll-front deposit in the Poison Canyon sandstone. Cross sec-lions made from electric logs (fig. 3) show that the uranium isrestricted to (he sandstone unit by upper and lower impermeablemudslone beds. The deposit has been pooled in a south-flankingsyncline of the Mariano anticline, which caused fluids to migra(eslightly along s(rike and downdip. Surface and subsurfaceevidence indicates that oxidizing, uranium-bearing solutionsmigrating downdip encroached upon a reduced pyritic sandstonerich in organic material. Upon contact with the reducing environ-ment, a geochemical cell was created (fig. 4); uranium was pre-cipitated as a uranium silicate, pyrite was destroyed, andhematite was created. This geochemical cell continued to migratedowndip, remobilizing and redepositing uranium. Evidence ofremobilization consists of numerous small updip pods in thesoutheast that are in chemical disequilibrium. Downdip migra-tion was interrupted by formation of the Mariano Lake anticlineduring the Laramide orogeny. Cross sections and geochemicaldata indicate that since the Laramide, a backwash off the southlimb of the anticline has taken place. Downdip tails are seen inthe gamma-ray logs, and geochemically the cell has reversed.Kaolinite, more abundant in updip oxidized sandstone in a nor-mal roll front, is concentrated on the downdip reduced side. This
[New Mexico Bureau of Mines & Mineral Resources, Memoir 38,1980]

175
LU
EEC?
[New Mexico Bureau of Mines & Mineral Resources, Memoir38,1980]

176
backwash phenomenon will be discussed in more detail in a latersection.
A well-developed oxidation-reduction front was created withdark-red, highly oxidized hematitic sandstone found updip andgray, reduced pyritic ground downdip. Deposition of uraniumoccurred just downdip of the alteration envelope (fig. 4). Alluranium located near faults is offset.
SamplesSamples were obtained from mine ribs as channel samples. The
sampled area was approximately I '/2-2 inches wide and the length
EXPLANATION• •SYMBOL K- •
7ONF Hemotittc Alurotion Ort - t lagt Ore-srage Unolt«rtdu Core Envilop* Uranium PyrlU Sond«lcn«
SIGNIFICANT Hemotite Sidlrit* UraniniUMINERALS Magnditt Sulfur Pyritt
FarroMlitt F* SStlinium
PyrlleF«S
Pyrit«
JordiitttColon
Samipermeoblft rocks
Semiptrmtoble rock* \R»do« Interface ^ Roll front
I1GURL 4—TWKAI W\O\I IM, m-i KOI i DII'OSII (Cheney and Tram-mell, 1973).
of the rib height. Material collected at each site was thoroughlymixed to insure homogeneity of the sample.
Samples from which clay minerals were extracted for study areindicated as CL-1 through CL-ll (fig. 5); the remaining samplesare indicated by the mine grid numbers.
The cross section shown in fig. 3 is represented on fig. 5 as thenorthwest-trending line A-A '. Information for the cross sectionwas obtained from well logs of drill holes located at or near thesite of sample collection.
ChemistryThe mineralization in the deposit is intimately associated with
an oxidation-reduction interface. This interface is located alongthe southern, updip edge of the orebody. If this deposit is theresult of migration of ore-bearing solutions, general mineral-ogical distribution patterns should emerge as the redox frontmoved downdip.
To determine whether distribution patterns exist, 24 samplesof whole-rock Poison Canyon sandstones were analyzed for ma-jor oxides (table 1) and for arsenic, selenium, molybdenum,vanadium, sulfur, zinc, and uranium (table 2). These sampleswere analyzed using wet chemical and x-ray fluorescent tech-niques. All samples are from mineralized zones owing to the un-availability of barren samples.
The most common major element is silica (fig. 6). Whenplotted against percent uranium, a definite negative distributionpattern emerges, possibly because of the abundance of low-silicaclay minerals, organics, and other silica-deficient materialsrelative to more quartz-rich sandstone in barren rocks.
Other major chemicals include calcium (fig. 7), total iron (fig.8), and H,O + (CO,) (fig. 9). All three show a regular distributionparallel to that of uranium. Calcium is present in amounts of upto 0.55 percent. Calcite may not exist here because of the pres-
TAHl.t I—MMOR ( HiMK AI -IOMI'ONI NIS ANAIYMS <>I POISON CANYON SANDSTOM SAMIM IS. Smith Lake district, New Mexico(reported as %).
chemicalcomponents
sio2
T102
A12°3
Fe2°3FeO
MgO
CaO
N ^ O
K2°
co2
H2O-
P . O ,
1
73.59
0 . 1 3
9 .60
2 .26
1.12
0.28
0.31
1.12
3.89
5.22
0.53
0.135
80
0
8
0
0
0
0
0
3
2
0
0,
2
.72
.23
.90
.87
.59
.20
.25
.83
.12
. 8 8
.39
.10
80
0.
9.
0 .
0 .
0.
0 .
0 .
3.
2 .
0.
0.
3
.66
,20
,20
,63
69
19
24
85
11
86
27
17
4
74.69
0.08
9.25
2.43
0.70
0.28
0.50
1.15
3.83
4.51
0.99
0.105
80
0
7
1
1
0
0
0
2
3
0
0,
sample number5
.82
.22
.00
.10
.34
.33
.20
.85
.62
.76
.42
.13
80
0
9
0
0
0
0
1,
3,
2.
0.
0.
6
.03
. 1 8
.80
.75
.44
.15
.23
.18
.83
.33
.18
059
7
76.78
0.15
9.70
1.55
0.76
0.24
0.27
1.02
3.81
3.91
0.48
0.085
8
73.53
0.11
9.65
1.91
1.30
0.30
0.43
1.07
3.60
5.34
0.60
0.16
79
0
9
1
0.
0,
0,
0.
3.
3.
0.
0.
9
.28
. 2 3
.10
.08
.86
.22
.25
.89
.32
26
54
101
10
83.42
0.28
6.35
1.18
0.71
0.19
0.28
0.69
2.08
3.67
0.29
0.138
11
77
0
10
1
0
0,
0,
1,
3.
4.
0 .
0 .
.41
.14
.10
.00
.63
.11
.18
,01
,81
18
40
092
MnO 0.018 0.01 0.0085 0.022 0.009 0.005 0.01 0.0135 0.0105 0.015 0.004
SrO 0.01 0.0075 0.007 0.01 0.0055 0.008 0.009 0.0095 0.008 0.005 0.008
BaO 0.086 0.106 0.065 0.088 0.053 0.09 0.076 0.08 0.068 0.043 0.079
S 2.48 0.46 0.32 1.95 0.87 0.24 1.14 1.43 0.66 0.86 0.98
[New Mexico Bureau of Mines & Mineral Resources, Memoir 38,1980]

Oo09
3aco
3CD
s
3)<D
i
MAR.ANC . f i f E MINE
SAMPLE LOCATIONSSMITH LflKE DISTRICT
Mc/INLEY COUNTY, NEW MEXICO
FIGURE 5—SAMPLE LOCATIONS FROM MARIANO LAKE MINE IN SMITH LAKE DISTRICT. MCKINLEY COUNTY. NEW MEXICO

178
32
80
78
76
74
72
UPOIP
CL-I CL-3
- \ r*\ /\/
/•i i
SAMPLE NUMBERS
CL-2 CL-7
1 ,
CL-8
~~\
\\
/
DOWNDIP
CL-lt
_
/
\\
\\ -i
FIGURE 6—Disi Kim IION m sil ic» vs. LIKANILM.
SAMPLE NUMBERS
CL-2 CL-7
FIGURE 7—DIMKmi IIONOI i AH II M \ S URANIUM.
ence of slightly acidic water. Elsewhere in the Grants belt, calciteis thought to serve as a buffering agent for migrating alkalinesolutions. H,O + (CO2) is at least partially attributable to thehigher organic content of the ore zone. Total iron, reported asFejOj, is principally found as pyrite or hematite. The iron showsan abundance near the updip oxidized zone and a depletion withsubsequent increase in the ore zone. Ferric iron tends to increaseon the updip side of the redox front, whereas ferrous iron is mostcommon on the downdip side. Sulfur (fig. 10) shows a similardistribution pattern but is slightly more abundant updip thantotal iron; this increase would be expected with the oxidation ofpyrite to hematite and the accompanying release of sulfur.
Distribution of vanadium shows a slight depletion in the updipsediments and a very erratic distribution downdip (fig. II). Aswould be expected in a Wyoming roll front deposit (Cheney andTrammell, 1973), molybdenum is depleted updip, gradually in-creasing in concentration downdip (fig. 12). Molybdenum con-centration is greatest at the downdip reduced edge of the deposit.Arsenic (fig. 13) shows a distribution pattern quite similar touranium. The arsenic may be present as arsenopyrite or nativearsenic or may be associated with the organic material. Zinc (fig.14) is thought to be associated with sulfides. Selenium, which isfound in quantities of 50 ppm or less, is lower in concentrationhere than in many other Grants mineral belt deposits. Seleniumcould not be correlated with any other element.
The main factor in distribution of major and trace elementsacross the deposit may be the migration of oxidizing ore-bearingsolutions downdip through a reduced pyritic sandstone. Oxidiz-ing solutions appear to have destroyed pyrite and released sulfuras SO4
2" along an oxidation-reduction front. This oxidation in-creased the amount of ferric iron (present as hematite) whilereducing the amount of ferrous iron. Calcium, selenium, andarsenic are depleted in the roll front, which may indicateremobilization has occurred with respect to these elements.
UPDIP
CL
SAMPLE NUMBERS
CL-3 CL-2 CL-7 CL-800WCIP
CL-II
25
20
16
S 10(rUJa. 05
* \
\ \\ \ /
^F. jO,
\
\
\ #
1
FIGURE 8 — D M R I I I U I I O N O I IOIAI IKON VS URANIUM
MineralogyThe deposit is located below the local water table and includes
unoxidized uranium ore and associated mineral assemblages.Thin sections were made for pctrographic studies, and powderedwhole-rock and minus 2/J fractions were used in x-ray-diffractionstudies. Heavy-liquid mineral separates were obtained from dis-aggregated samples and were studied under a binocular micro-scope. Only ore-related mineral phases and ore minerals arediscussed in this report.
The mineralogy of the Mariano Lake deposit is not yet welldescribed. The extremely fine grained nature of the organic-richore may account for this. The predominant black color impliesthat uranium is present in its tetravalcnt state. Coffinite(U(SiO4),,,(OH)4,) and pitchblende (UO, 6) both may be present,but they have not been positively identified by x-ray analysis.One scanning-electron photomicrograph (proprietary location)docs show some material tentatively identified as coffinite. In ad-dition, the presence of urano-organic compounds can be neitherruled out nor confirmed.
UPDIPCL-I
O 60u
°<* 50
X40
crUJ
0- 20
CL-3
SAMPLE NUMBERS
CL-2 CL-7OOWNDIP
CL-II
\ V-\HJC
" \
\
\
\
050 .„
rn
040 s
2
0 50 2•X)
0 20 §
UPDIPCL-I
in 25(0•" 2 O
& 15
H
g 10o^ 05
SAMPLE NUMBERS
CL-2 CL-7DOWNDIP
CL-II
\ \
u /
— •^ 2 o J X r ^
- " \\
V*
0 50
"D
m040 3
mz
0 30 H
c-n
0 20 >2C
0 10 2
FIGURE 9—DISTRIBUTION OF H,O + (CO;) vs. URANIUM. FIGURE 10—DISTRIBUTIONOI TOTAI IRON ANDSUI HJR VS. URANIUM.
'New Mexico Bureau of Mines & Mineral Resources, Memoir 38,1980]

179
UPDIP SAMPLE NUMBERSI S - 4 I3W-4 IIW-I 9W-4 7W-I 5W-I
OOWNDIP
5W-2 4W-2
0 0 0
F I G U R E I I — D i s i R i m I I O N O I \ \ S \ D I I M \ S I K W U \ I
UPDIPIS-4 I3W-4 IIW-I
SAMPLE NUMBERS
9W-4 7W-I 5W-IDOWNDIP
5W-2 4W-2
F I C i U R l ; 12 —DlSIRI I I l I IONOI Mill MIDI M \ U S 1 KAMI M
UPDIPI S - 4 I3W-4
SAMPLE NUMBERS
IIW-I 9W-4 7W-I 5W-IDOWNDlP
5W-2 4W-2
0 00I'ICiURl- 13—DIM mini IIONOI ARMNU \S I RANK M
200
UPDIPIS-4 I3W-4 MW-I
SAMPLE NUMBERS
9W-4 7W-I 5W-IDOWNDlP
5W-2 4W-2200
FIGURE 14—DISTRIBUTION oi ZINC vs. URANIUM
[New Mexico Bureau of Mines & Mineral Resources, Memoir38,1980]

180
Vanadium minerals may also be present, based on high total-rock vanadium content (table 2), but no positive identificationshave been made. Based on the abundance, in some samples, ofchlorite which appears similar to rosette chlorite noted atAmbrosia Lake (Lee, 1976) with a high vanadium content, thepresence of vanadiferous chlorite at the Mariano Lake mine ispossible. Similarly, locally abundant mixed-layer illite-montmorillonite may contain appreciable amounts of vanadiumin the absence of chlorite (Lee, 1976).
No molybdenum or selenium minerals have been identified atMariano Lake; this is not surprising, because these two elementsare not abundant (table 2).
Pyrite commonly occurs as framboids, isolated cubic crystals(fig. 15), or cement-like vein fillings. Two stages of pyrite arenoted: the first stage consis's of small pyrite cubes with authi-genic quartz crystals in barite cement, which seems to be pene-contemporaneous with ore, because this material in part embaysblack, urano-organic material. The second stage is representedby pyrite cement where remobilization of primary ore is thoughtto have occurred; this material is usually noted on the trailingedge of the ore roll. Pyrite is generally more abundant in the orezone of the mine, as demonstrated by the close behavior of iron
j j ) and uranium along profile A -A' (fig. 3). Similarly, thenear-identical trends shown by uranium, sulfur, and iron (asFejO3) support this association (fig. 10). Since pyrite commonlyis enriched in roll-type deposits in Wyoming (Cheney and Tram-mell, 1973), this ore-zone abundance is not surprising. Total ironcontent drops off both in barren, reduced, pyritiferous rocks andin barren, oxidized, hematitic rocks on either side of the ore roll.
An unusual feature of the Mariano Lake deposit is the virtualabsence of calcite. At other mines nearby (Ristorcelli, thisvolume) and at other deposits in the Poison Canyon sandstone(Brookins, 1976), calcite is a common accessory constituent ofore zones. A hypothesis proposed by Brookins (1979) suggestsrelease of calcium from plagioclase as organic carbon is oxidizedto produce dissolved CO2 (as R,CO3 or HCO3"), with calcite as acommon product. Fig. 7 shows a fair correlation between ura-nium and CaO, but the calcium cannot be present in calcite. Figs.16 and 17 are SEM views of calcium-rich minerals such ascalcium-montmorillonite and gypsum (variety selenite) respec-tively. Microprobe analysis was used to determine the presence ofcalcium in the montmorillonite in fig. 16. The abundance of cal-cium and sulfur and absence of other elements, combined withhabit, allow identification of the material shown in fig. 17 as
TABLE 2—TRACF CHEMICAL-COMPONENTS ANALYSIS OH POISON CANYON SANDSTONE SAMPLES, Smith Lake district, New Mexico.
element
U
Cu
Zn
Mo
Se
As
V
chemicalcomponents
U
Cu
Ni
Pb
Co
Zn
Mo
Se
As
V2°5
Mn
8W-2
.30%
3.5
14.
7.
—
16.
.08%
1
.57%
30.
1 0 .
6 0 .
—
2 0 .
15.
1 3 .
40.
.32%
1'45.
8W-3
.86%
2 . 5
2 2 .
60.
57.
42.
.07%
2
.33%
2 5 .
10 .
1 5 .
—
10.
12 .
1 5 .
40.
.24%
9 0 .
9W-4 :
.51%
3.
23.
88.
—
23.
.146%
3
.20%
30.
1 0 .
30.
—
1 0 .
9 .
1 3 .
20.
.17%
80.
L1W-1
.62%
2 .
47.
' 8 .
1 .
3 3 .
.096%
40
15
70
-
20
120
35
30
250,
sample number
4 5 6
.72% .30% .18%
40.
15.
40.
20.
5.
62.
40.
.30% .13%
1 1 5 .
13W-4 IX-1
435 .
2.
12 .
24.
2.
21.
•
.28%
.5 3 .
7.5
114 .
—
1 5 .
106% .023%
80 .
2 0 .
30.
5 .
15.
15.
1 7 .
65.
460.
8 5 .
sample
13E-1
.48%
2 .
1 8 .
210.
3 .
25.
.068%
7
.33%
900 .
15.
60.
—
30.
11 .
13.
30.
.26%
130.
number
1S-4
.99%
4 .
1 7 .
8 9
.64% . 2 3 /
30 .
1 5 .
120.
—
2 5 .
5 0 .
5 6 .
90.
.34%
1 7 0 .
3S-1
.78%
4 .
2 3 .
5 . 1 5 2 .
1 7 .
45.
.198%
—
37.
.20%
2 5 .
1 0 .
30 .
~
2 0 .
1 6 .
1 5 .
40.
.20%
9 0 .
5W-2
1.16%
4 .
170 .
1 5 6 .
—
45.
.28%
10
I .59%
4 5 .
20 .
50.
—
20.
85.
54.
40.
.24%
200 .
4W-2
.10%
4 .
7.
380.
—
.018%
11
.34%
30.
2 0 .
35..
5 .
30 .
1 0 5 .
7.
65.
760.
75 .
5W-1 7W-1
729. 1.04%
2 . 4 .
1 4 . 2 9 .
4 0 . 1 3 0 .
2 8 .
9 . 4 2 .
.045% .193%
[New Mexico Bureau of Mines & Mineral Resources, Memoir 38,1980]

181
selenite. The lack of calcite, coupled with the presence of asulfate (selenite), argues for slightly acidic pH and slightly higherEh than for other nearby deposits.
Clay minerals have been studied by separating the minus 2 Mfraction from whole-rock samples using standard techniques(Lee, 1976). Identification of the clay minerals has been deter-mined by combined petrographic, x-ray diffraction, and SEManalyses. Only the most common and/or interesting clay min-erals will be discussed here (table 3). Sachdev (this volume) is anadditional source of in-depth study on clay minerals.
Kaolinite is the most abundant clay mineral at Mariano Lake.In the updip oxidized rocks, kaolinite is common as a cementingagent and for filling voids. In the downdip reduced rocks, it ismore abundant and is present as aggregates of books (fig. 18),vermicular stackings, or cement or void fillings. Early generationbook kaolinite has been partially corroded (fig. 18), but youngergeneration kaolinite (fig. 19) is commonly euhedral. The abun-dance of kaolinite on the downdip side of the roll front may bethe result of the relationship of the deposit to the Mariano(Smith) Lake anticline. Underground exposures reveal mineral-ization extending updip onto the south limb of the anticline. For-mation of the anticlinal structure may have interrupted downdip
FIGURE 17—SELENITE NEEDLES ATTACHED TO CI.AY-MINERAI-COATED
DETR1TA1. GRAINS (SAMPLE CL-9 , X 130).
FIGURE 15—PARTIALLY ALTERED PYRITECUBE,COMMON INORE ZONES: thecube edges are in part replaced by hematite, and faces are coated withkaolinite-rich clay minerals (sample CL-1, x 1300).
FIGURE 18—EARLY GENERATION BOOKS AND STACKINGS OF KAOLINITEPARTLY CORRODED ON EDGES (SAMPLE C L - 9 , X 3250) .
(SEP"3
FIGURE 16—LARGE NEEDLE OF SELENITE (RIGHT SIDE) NEXT TO CALCIUM-RICH, DETRITALMONTMORILLONITE ON LEFTSIDE (SAMPLE CL-6 , X 1300).
FIGURE 19—ROSETTE AND EDGE-TO-FACE CHLORITE WITH ISOLATED BOOKSOF KAOLINITE AND EUHEDRAL QUARTZ CRYSTALS: darkish part withoutclay minerals is organic coating (sample CL-9, x 1950).
[New Mexico Bureau of Mines & Mineral Resources, Memoir 38,1980]

182
TABLE 3—DISTRIBUTION OF CLAY MINERALS IN LOCATIONS SHOWN ON FIG. 5.
clay minerals
kaolinite
chlorite
illite-moncmorillonite
illite
M L - 1
64
17
16
3
ML-2
58
15
25
17
M L - 3
78
9
13
T
ML-4
48
15
35
2
ML-5
64
25
11
sample
ML-6
97
T
Tz
numbers
ML-7
52
28
20
ML-8
81
19
ML-9 ML-10
81
11
8
M L - 1 1
68
15
17
migration of a chemical front, causing local backwash migrationoff the sloping south flank. This migration would leave behindboth tails, along with some enrichment of uranium and kaoliniteon the downdip reduced side of the ore deposit. This hypothesisis admittedly highly speculative.
Chlorite is enriched in ore-zone samples, commonly as rosettechlorite (fig. 20) or less commonly as mixed-layer chlorite-montmorillonite(fig. 21). Organic carbon is rich in these samplesalso. In barren, reduced rocks, edge-to-face chlorite (fig. 22) iscommonly found with books of kaolinite.
Montmorillonite is present as typical honeycomb-habit mate-rial (fig. 23), void fillings (fig. 24), and mixed-layermontmorillonite-illite or montmorillonite-chlorite. Some mixed-layer illite-montmorillonite replaces kaolinite (fig. 25).
Feldspar is present as detrital grains (commonly microcline),and an abundance of authigenic K-feldspar, commonly associ-ated with kaolinite, is present near and in ore zones (fig. 26).
Barite has been identified as a cementing agent in oxidizedrocks and in part of the ore-zone material. The presence of bariteplus that of selenite, in association with pyrite, indicates Eh con-ditions overlapping the pyrite-hematite boundary, probably atslightly acidic pH owing to the lack of calcite.
Commonly noted heavy minerals in the deposit include zircon,anatase, rutile, and corroded magnetite. These minerals have notbeen studied as part of this work.
Table 3 represents the distribution of clay minerals in some ofthe samples from locations indicated on fig. 5.
InterpretationThe roll shape of the main ore deposit at Mariano Lake is
similar to that of Wyoming deposits (Cheney and Trammed,1973) and other deposits near an iron-sulfur redox front from thesame general area (Ristorcelli, this volume). The Mariano Lakedeposit differs from the trend ore in the deeper parts of theGrants mineral belt by relatively low abundances of molybdenumand selenium relative to uranium and vanadium, and especiallyby the virtual absence of calcite. Similarities with trend ore(Brookins, 1979) include: association of uranium with organicmatter and vanadium, presence of abundant pyrite, and abun-dance of rosette chlorite and/or mixed-layer illitc-montmorillonite in ore zones. The lateral dimensions of thedeposit (fig. 5) are too restricted to permit comparison with mostGrants mineral belt deposits. Its wide lateral extent is misleading,because it can be interpreted as resulting from a tabular mass,whereas it actually represents the plan view of a roll type ofdeposit as indicated in fig. 3.
The age of mineralization at Mariano Lake can be addressedonly by indirect reasoning coupled with some observation. Theore appears to have been remobilized from an earlier stage ofmineralization, as indicated by the location of the ore depositionat an iron-sulfur redox front with greater remobilization ofmolybdenum, selenium, and calcium (calcite), relative to ura-nium, vanadium, pyrite, and organic carbon. The presence of
both barite and selenite with pyrite confirms the Eh conditions tobe along the sulfide-sulfate Eh-pH fence. Slightly acidic condi-tions are inferred because of the absence of calcite, whereascalcite is common in other deposits. If the earliest ore wasdeposited in Late Jurassic time, similar to trend ore at AmbrosiaLake and deeper in the section at Smith Lake (Lee and Brookins,1978), then remobilization occurred in the Cretaceous or later.The deposit does not resemble Laramide stack ore (Kelley, 1963),because the ore is not necessarily controlled by Laramide fault-ing. Structural control remains a key question. If the ore wasprecipitated due to such structural control, the limiting factor forage of mineralization is whether the folding responsible for oredeposition sites was pre- or post-Laramide. The data are notclear on this point. The roll shown in fig. 3 may be pre-Cretaceous (or at least pre-Dakota Formation); this estimate isbased on orientation of remobilized oie that is normal to bed-ding, which must have occurred prior to the Dakota deposition.The ore would have to be post-Late Jurassic-pre-Dakota andtherefore pre-Laramide. If, however, the main redox front waseither formed (or rejuvenated?) during the Laramide, the ore ispost-Laramide and the ore that is normal to bedding fills earlier-formed fractures not disturbed by Laramide tectonism. At pres-ent, distinction cannot be made between these two possibilities. Athird possibility is remobilization-reprecipitation in the mid-Cretaceous (similar to the sequence of events at the Jackpile-Paguate mines, Laguna District; Adams and others, 1978) withdestruction of some of the ore during the post-Laramide. In viewof data supportive of both pre- and post-Laramide tectonism, thelatter may prove to be most plausible. Certainly the data supportit as well as the mid-Cretaceous or post-Laramide hypotheses.
FIGURE 20—CHLORITE-RICH SAMPLE, WITH EUHEDRAL QUARTZ CRYSTALSAND SOME KAOIINITE BOOKS; sample is rich in organic matter (sampleCL-5, X39OO).
[New Mexico Bureau of Mines & Mineral Resources, Memoir 38,1980]

183
F I G U R E 2 1 — MlXED-IAYER CHLORITE-MONTMOIIILLONITE WITH QUARTZ F I G U R E 24—VoiD-HLLlNC. MONTMORM I ONITI- HI-TW I I N 1)1 IRIIAI GRAINS.
(SAMPLE C L - 2 , X390O). IN TURN COATED BY CLAY MINI RAI S ( (H1OKIIK KAOIINIIL l AM) MIMI
I-L'HLDRAI QUARTZ CRYS1AI S (SAM1M I C L - 2 , X 1950).
FIGURE 22—EDGE-TO-FACT CHLORITE WITH ISOLATED BOOKS/PLATES OI
KAOI.INITE (SAMPI E CL-9, X 3900).FIGURE 25—BOOKS AND STACKINGS OF KAOUNITE BEING REPLACED BY
ILI.ITE-MONTMORILLONITE; note feathery edges (sample CL-5, x 3900).
FIGURE 23—CELLULAR MONTMORILLONITE, IN PART REPLACING (OR GROW-ING ON| KAOLINITE AND IN PART BEING REPLACED BY ILLITE ON CELL EDGES
(SAMPLE CL-9, X3250). FIGURE 26—AUTHIGENIC K-FELDSPAR (SAMPLE CL-2, x 1950).
[New Mexico Bureau of Mines & Mineral Resources, Memoir 38,1980]

184
The Mariano Lake uranium deposit represents an unusual typeof deposit for the Grants mineral belt. Its mineralogy andchemistry relative to other deposits in the Grants mineral beltsuggest similar types of deposits and chemical environmentsdistinct from those responsible for the well-known trend ore,stack ore, and middle-Cretaceous remobilized ore.
ReferencesAdams, S. S., Curtis, H. S., Hafen, P. L., and Salek-Najed, H., 1978, In-
terpretation of postpositional processes related to the formation anddestruction of the Jackpile-Paguate uranium deposit, northwesternNew Mexico: Economic Geology, v. 73, p. 1635-1654
Brookins, D. G., 1976, Uranium deposits of the Grants, New Mexicomineral belt I: U.S. Energy Research and Development Association,Rept.GJO-1636-l, 120 p.
, 1979, Uranium deposits of the Grants, New Mexico mineral beltII: U.S. Department of Energy, Rept. BFEC 76-029-E, 411 p.
Cheney, E. S., and Trammel], J. W., 1973, Isotopic evidence for in-organic precipitation of uranium roll ore bodies: American Associationof Petroleum Geologists, Bull., v. 57, p. 1297-1304
Hazlett, G. W., and Kreek, J., 1963, Geology and ore deposits of thesoutheastern part of the Ambrosia Lake area, in Geology and technol-ogy of the Grants uranium region, V. C. Kelley, compiler: New MexicoBureau of Mines and Mineral Resources, Mem. IS, p. 82-89
Hilpert, L. 5., and Freeman, V. L., 1956, Guides to uranium deposits inthe Morrison Formation, Gallup, New Mexico area: U.S. GeologicalSurvey, Prof. Paper 300, p. 299-302
Kelley, V. C , 1955, Regional tectonics of the Colorado Plateau and rela-tionships to the origin and distribution of uranium: University of NewMexico, Pubs, in Geology, no. 5, 120 p.
, compiler, 1963, Geology and technology of the Grants uraniumregion: New Mexico Bureau of Mines and Mineral Resources, Mem.15, 277 p.
Lee, M. J., 1976, Geochemistry of the sedimentary uranium deposits ofthe Grants mineral belt, southern San Juan Basin, New Mexico: Ph.D.thesis, University of New Mexico, 241 p.
Lee, M. J., and Brookins, D. G., 1978, Rubidium-strontium minimumages of sedimentation, uranium mineralization, and provenance, Mor-rison Formation (Upper Jurassic), Grants mineral belt, New Mexico:American Association of Petroleum Geologists, Bull., v. 62, no. 9, p.1673-1683
[New Mexico Bureau of Mines & Mineral Resources, Memoir38,1980]

18S
GEOPHYSICAL EXPERIMENTS AT MARIANO LAKEURANIUM OREBODY
by D. T. Thompson, Gulf Research and Development Co., P.O. Drawer 2038,Pittsburgh, Pennsylvania 15230
AbstractSeveral geophysical experiments were performed over the
Mariano Lake orebody before mining. Surface self-potentialmethods, surface-to-hole induced-polarization methods, andreflection-seismic methods were used. These geophysical tech-niques provide data which relate to the conceptual model of thisorebody. Currents generated in the productive formation byoxidation-reduction reactions do not generate measurable poten-tial anomalies at the surface. Surface-to-hole induced-polarization measurements apparently can detect an oxidation-reduction front in the vicinity of an exploration borehole.Reflection-seismic techniques can provide information concern-ing the paleostructure of the area.
IntroductionThe primary tools for uranium exploration are geologic in-
ference and geophysical logging of boreholes. For sandstone-type deposits in the United States, most of the uranium miningdistricts have been extended from outcrop exposures by drilling.As exploration for undiscovered deposits goes deeper, the ex-pense of drilling severely limits the scope of such efforts. A realneed exists for developing exploration technologies that canlocate subsurface uranium accumulations in a more efficientway. In wildcat areas, explorationists need to evaluate large areasof land so that favorable subareas can be explored in more detail.
Several attempts to apply state-of-the-art geophysical tech-niques to the uranium-exploration problem are examined in thispaper. Each geophysical method was chosen to detect some as-pect of the geological characteristics of an orebody; conversely,the success or failure of a particular geophysical technique over aknown orebody may provide some insight that will increase ourunderstanding of sandstone-type uranium orebodies. All of theexperiments described were performed over the Mariano Lakeore deposit in the Grants uranium region.
ACKNOWLEDGMENTS—The work reported in this paper wassupported and encouraged by Gulf Minerals Resources Companyand Gulf Research and Development Company, and their per-mission to publish these data is appreciated. I am especiallythankful for the extraordinary efforts of the staff of the Albu-querque Area Office of Gulf Minerals Resources Company.
Surface SP measurementsSelf-potential (SP) measurements at the surface have been used
for many years as an exploration tool for massive sulfide depos-its. Sato and Mooney (1960) have proposed a workable model forthe generation of SP anomalies by massive sulfide deposits. Ac-cording to their hypothesis, the massive sulfide provides an elec-tronic connection between reduction reactions occurring at depthand oxidizing reactions within the weathered zone near the sur-face. This electrochemical cell produces SP anomalies at the sur-face that typically range from 50 rav to 1,000 mv.
The mechanism by which surface SP anomalies may be gener-ated by roll-front deposits is somewhat different from the Satoand Mooney model for massive sulfides. For roll-front-type de-posits, the uranium is concentrated by precipitation in a geo-chemical cell (fig. I). The existence of variations of the Eh(oxidation-reduction) potential across the roll front are docu-mented by visual and geochemical inspection of samples from theproductive formation. Harshman (1974), among others, hassummarized the stability fields of key metallic compounds in this
geochemical environment. An analysis of these data indicatesthat the Eh potential may vary by as much as 600 mv in the for-mation of interest. If measurements were to be made of the Ehvoltage in the formation of interest with inert electrodes, aphysical variation in voltage would indeed be observed. Whetherthese variations in the Eh potential can be detected at the surfacewas studied in this experiment.
Because of the desired accuracy of the surface SP data, devel-opment of data-collection techniques and identification ofsources of measurement error was necessary. Since most of thedetails of the data-collection techniques have been documented inother papers (Thompson, 1975; Corwin and Hoover, 1978) onlya brief description is necessary here. The procedures establishedfor gravity surveying were applied IO making precise surface SPmeasurements. Copper-copper sulfate nonpolarizable electrodeswere used, and the gradient or leapfrog technique was applied.Loops were closed and adjusted to account for long-term drift,and the porous pots were sysiemaiically checked for spuriousvoltages. The data v/ere digitized, edited, and adjusted usingstandard data-reduction techniques.
During the summer of 1975, 336 surface SP measurementswere made in the vicinity of the Mariano Lake orebody. Theresults of these measurements are shown in fig. 2, contoured at a5 mv interval. The most striking fact about these measurements isthe existence of a strong east-west regional gradient normal to thegeneral strike of the orebody. This gradient was though! to ob-scure the smaller anomalies associated with the ore zone, so aregional-residual separation was done just as one would do for agravity interpretation. Figs. 3 and 4 are the regional and residua]fields, respectively. The second-order regional of fig. 3 shows theeast-west trend, which is removed from the measured field toproduce the residual field of fig. 4.
Inspection of the residual anomalies of fig. 4 shows dominantnorth-south alignments of highs and lows. These trends clearlydo not coincide with the trend of the orebody and must be theresult of some surface or subsurface geological phenomenon notdirectly related to the ore-forming process. In spilt of dense drill-ing and extensive subsurface-geological knowledge, no sub-surface features have been directly correlated to the SP anomalytrends shown by fig. 4. However, the direction of these trends iscoincident with the trend of faulting known to exist in the area,and several faults have been encountered in the mine coincidentwith this direction.
The possibility still remains that the SP measurements are in-fluenced by surface-chemical or environmental conditions. In
FIGURE 1—IDEALIZED CEOCHEMICAL CELL FOR ROLL-TYPE URANIUMDEPOSITS.
[New Mexico Bureau of Mines & Mineral Resources, Memoir 38,1980]

i86
FIGURE 2—Olisi KM I) SP DMA
FIGURE 3—SECONU-DECJREE REGIONAL SP DATA.
order to investigate this possibility, relevant surface informationhas been assembled in fig. 5. Shown on this figure are topog-raphy, vegetative cover, and soil type.
Based upon these data, the following conclusions may bedrawn: 1) The measurements over the known Mariano Lake ura-nium orebody conclusively deny the hypothesis of a measurablesurface SP anomaly associated with this roll front. 2) The surfaceSP data are dominated by north-souih-trending anomalies.Other geological and geophysical evidence suggests that theseanomalies may be associated with faulted or fractured zones.
Surface-to-hole IP measurementsInduced-polarization (IP) measurements are traditionally used
to detect disseminated sulfide minerals. Several successful casehistories using surface-lo-hole IP measurements to detect sulfidemineralization in the vicinity of an exploration borehole havebeen reported in the literature.
In the case of uranium deposits in sandstones, the genetic rela-tionship of pyrite with uranium is well established. At MarianoLake, pyrite is concentrated in the ore zone, as observed by Sach-dev (this volume). Pyrite constitutes 0.2-0.5 weight percent of thewhole rock in the ore zone at Mariano Lake, and it is containedin both the sand- and silt-sized fractions.
Surface-to-hole IP measurements were made at Mariano Laketo determine whether the conductive metals associated with theroll front could be detected in the vicinity of a borehole. Thegeometry for making the measurements is shown in fig. 6. Stan-dard IP transmitters and receivers were used for these measure-ments. The chargeability values reported herein represent thearea under the IP decay curve from 260 ms to 1,560 ms. When anexploration hole was completed, a receiving electrode waslowered into the hole to the level of the productive formation,and measurements were made for transmitter locations extendingradially from the hole. Fig. 7 shows how the surface plottingpositions were located for a given transmitter offset.
The chargeability values for a given hole were consistent ra-dially and in azimuth. However, the data values from one hole to
[New Mexico Bureau of Mines & Mineral Resources, Memoir 38,1980)

187
V> 74M8* Ds
- 7400 -
Msh
Ds
LEGEND
FEET ASL
TREES
MANCOS SHALE
DAKOTA SANDSTONEOR SANDY SOIL
CONTACT BETWEENMsh AND Ds
F I G U R E 5 — S i R I A C I ' C O N D I i K I S S A i n i l s i ' R v n I O I A I I O S
IPRECEIVER
SURFACEELECTRODE
DOWN HOLEELECTRODE
IPTRANSMITTER
D
-7)0
t) = 1, 2, 3..
FIGURE 6—GEOMMRY K>R SURI AC I-TOHOI E: IP MI ASLIRE MI NTS
(New Mexico Bureau of Mines & Mineral Resources, Memoir 38,1980]

188
SURFACEPLOTTING
POINT
SURFACEPLOTTING
POINT
U t i U R F 7 —Si R h u l IMoniNl.I'DINISIORDII'Oll- OII'Ol t SUR1 AC I; ARRAY\SI)M)RSl Kl \ l I HI HOI 1
FIGURE 9—SURIACL TOHOIIHOLE No. 1110.
NORMAl IZfcD CHARGE ABU 1TY DATA I OR
another could differ significantly in magnitude. This variation inmagnitude from one hole to another is probably due to the com-plicated geometrical effects introduced by the orebody (Sumner,1976). In order to facilitate comparisons of data from differentholes, a single normalization factor was computed for each hole,and the magnitudes of the changeability values were adjusted.
Fig. 8 shows the results of the surface-to-hole IP measure-ments in a hole located in the western tip of the orebody. Thechangeability values in the direction of the orebody are largerthan the changeability values in the direction of barren ground.The second offset value is proportionally larger than the nearoffset value because a larger volume of the orebody is exposed tothe charging current owing to the longer offset.
Fig. 9 demonstrates the results of surface-to-hole IP measure-ments in hole no. 1110. With the exception of the far offset valueto the east, these data confirm that larger chargeability values in-dicate the direction of the mineralized zones.
A final example is given in fig. 10. The second offset value lothe east could not be obtained owing to access limitation. Again,offsets in the direction of mineralization show higher chargeabil-ity values.
The applicability of the surface-to-hole IP techniques to ex-
N/ 105
80
115
80
113
ploration problems is clear; additionally, these results also givesome indication of the close association of uranium and con-ductive minerals, especially pyrite. This association can be dem-onstrated using fig. 8. The uranium mineralization is closelyassociated with a distinctive oxidation-reduction interface, whichcan be traced many miles to the west of hole 1086. The lack ofhigh chargeability values coincident with the oxidation-reductionfront to the west indicates the absence of pyrite. These data indi-cate that pyrite and uranium have an intimate association in thesubsurface.
Reflection-seismic techniquesDuring the summer of 1975, a high-resolution reflection-
seismic survey was performed over the Mariano Lake uraniumdeposit. These data were collected prior to any mining of thedeposit. The purpose of this survey was to determine whetherpaleostructural information could be obtained from the seismicdata and to what extent lithologic information in the productiveformation could be derived from the seismic data. Fig. 11 showsthe locations of the seismic profiles relative to the orebody.
N
87FIGURE 8—SURFACETOHOLE NORMALIZED CHARGEABILITY DATA FOR FIGURE 10— SURKACE-TO-HOLE NORMALIZED CHARGEABILITY DATA FOR
HOLE NO. 1086. HOLE NO. 1133.
[New Mexico Bureau of Mines & Mineral Resources, Memoir 38,1980]

189
FIGURE 11 —LOCATIONS OF SEISMIC LINES RELATIVE TO THE OREBODY AT MARIANO LAKE.
Shooting parameters were determined using conventionalnoise tests. Short geophone arrays were used to reduce groundroll, and a geophone group interval of 50 ft (15.2 m) wasemployed. The data were shot to obtain 600 percent subsurfacecoverage using a 1-lb concentrated charge in a 10-ft hole.
Figs. 12 and 13 are the common depth point (CDP) stackedsections for Lines C and B respectively. Reflections from the top
of the Westwater and Todilto formations were established usingwell-control and trace-to-trace correlations. By using single-channel (near-trace) sections displayed at an expanded time scale,correlation of short, discontinuous reflectors believed to be fromthe base of the Dakota formation was possible.
Present-day structure of the coherent reflectors (base Dakota,top Westwater, Todilto) can be obtained by mapping the two-
[New Mexico Bureau of Mines & Mineral Resources, Memoir 38,1980J

190
[New Mexico Bureau of Mines & Mineral Resources, Memoir 38,1980]

191
CO
UJ
z
[New Mexico Bureau of Mines & Mineral Resources, Memoir 38,1980]

192
way time to that reflector, as shown for the base of the Dakota infig. 14. Simple structure maps yield no information concerningpaleostructure, since post-Jurassic structural deformations arealso reflected in these maps; however, if the two-way time inter-val between reflectors (seismic isopach) is measured, some infor-mation concerning paleostructure can be derived.
The particular isopach of interest in this study is the Todilto-top Westwater interval (fit. 15). Since there are no erosional un-conformities in this interval, a larger Todilto-Westwater intervalimplies the development of a structural low during this time.
Therefore, paleostructure can be inferred from the isopach data.To the extent that similar structural developments continuedthrough the deposition of the Brushy Basin, the isopach repre-sents structural conditions existing at the time the host sandstonewas deposited. The structure suggested by fig. 15 shows a broadsyncline coincident with the known location of the orebody. Thisinference is in accordance with Jenkins and Cunningham's (thisvolume) conclusion that the orebody lies in an ancient streamchannel, since the channels would have been controlled by thestructure during the deposition of the host formation.
FIGURE 14—SEISMIC STRUCTURE MAP BASE OF THE DAKOTA.
[Naw Mexico Bureau of Mines & Mineral Resources, Memoir 38,1980]
193
This analysis shows that the first objective of this project hasbeen met: paleostructural information useful for uranium ex-ploration can be obtained through the use of reflection-seismictechniques.
The second objective of the survey was 10 determine whetherreflection techniques can provide lithologic information in thehost formation. A detailed comparison of lithologic informationfrom drill holes and the seismic data demonstrates that these dataare not of sufficient quality to derive liihologic information inthe productive formation. A significantly better record area and/
or recording technique would be necessary to achieve this objec-tive.
Summary and conclusionsSeveral geophysical techniques may have applications to ex-
ploration problems related to sandstone-type uranium accumula-tions. These techniques include surface SP methods, IP methods,and reflection-seismic methods. Surface self-potential measure-ments may indicate that the Mariano Lake uranium orebody is
FIGURE 15—SEISMIC TOOII.TOWESTWATER ISOPAOI MAP.
[New Mexico Bureau ol Mines & Mineral Resources, Memoir 38,1980}

194
not a currently active geochemical cell. However, this implicationis ambiguous for several reasons. Surface-to-hole IP mea-surements indicate a close association between pyrite anduranium. The chargeabilities derived from these experimentsshow an increased response along an oxidation-reduction inter-face only when there is uranium mineralization. Since pyrite isthe most likely candidate to produce an IP response, we concludethat pyrite is not present at barren oxidation-reduction inter-faces. Reflection-seismic techniques can determine the paleo-structural information at the time the host sandstones weredeposited. Since the paleostructure controls the development ofancient stream channels that are conducive to the formation ofuranium accumulations, important information can be obtainedfrom the seismic data.
ReferencesCorwin, R. F., and Hoover, D. B., 1978, The self poienlial method in
geothermal exploration: Geophysics, v. 44, no. 2, p. 226-245Harshman, E. N., 1974, Distribution of elements in some roll-type
uranium deposits, in Formation of uranium ore deposits, R. D. Nin-ninger, chairman: Vienna, International Atomic Energy Agency,Proc., Ser. no. STI/PUB/374, 750 p., maps
Sato, M., and Mooney, H. M., 1960, The electrochemical mechanism ofsulfide self potentials: Geophysics, v. 25, p. 226-249
Sumner, J. S., 1976, Principles of induced polarization for geophysicalexploration: Amsterdam, Elsevier Scientific Publishing Co., v. S,277 p.
Thompson, D. T., 1976, Self potential measurements at the surface over aknown uranium body (abs.): Society of Exploration Geophysicists,46th Annual International Meeting, Abstracts, p. 104

195
URANIUM ORE ROLLS IN WESTWATER CANYONSANDSTONE, SAN JUAN BASIN, NEW MEXICO
by Dean S. Clark, Phillips Uranium Corporation, P.O. Box26236.Albuquerque, New Mexico 8?125
AbstractRecent relatively deep uranium-exploration drilling in the Nose
Rock area, San Juan Basin, McKinley County, New Mexico, hasresulted in the discovery of previously unrecognized uranium orerolls in gray, unoxidized Westwater Canyon Sandstone of theMorrison Formation. Both the Nose Rock ores and the primaryAmbrosia Lake uranium ores were emplaced during the LateJurassic-Early Cretaceous erosional interval under the same geo-logic conditions by the same geochemical-cell process. The red,altered interior ground resulting from the geochemical-cell pro-cess has been re-reduced by the subsequent entry of reductantsinto the formation. The original roll form of the Ambrosia Lakeorebodies has been obscured and modified by redistribution re-lated to the present-day active redox interface interweaving withthe Ambrosia Lake ores.
IntroductionSince mid-1973 Phillips Uranium Corporation has been con-
ducting relatively deep uranium-exploration drilling in the3,000-4,500 ft (900-1,300 m) range in the Nose Rock area, SanJuan Basin, McKinley County, New Mexico. This work has re-sulted in new interpretations of the genesis of the New Mexicosandstone uranium deposits. This paper briefly summarizes someof the geologic interpretations from the exploration program andsuggests a new opportunity for exploration in the area.
ACKNOWLEDGMENTS—I am indebted to fellow companyemployees, J. W. Gurney, W. J. Rice, and L. Halterman, forcritical discussions and ideas that led to this paper. I also givespecial thanks to C. G. Shirley for drafting the illustrations. Iwish to express appreciation to the management of Phillips Pe-troleum Company, especially to W. R. Bohon, for permission topublish this paper.
Location of the areaThe Nose Rock area h located in north-central McKinley
County, New Mexico, approximately 12 mi (20 km) northeast ofCrownpoint and 30 mi (50 km) northwest of the Ambrosia Lakearea within the Grants uranium region (fig. 1). The Nose Rockarea is also 25 mi (40 km) north of the outcrop of the WestwaterCanyon Sandstone host rock in the southern portion of the SanJuan Basin.
The Grants uranium region includes a belt of deposits, prin-cipally in Jurassic sediments, extending some 85 mi (135 km)from the Laguna area west of Albuquerque, along the south sideof the San Juan Basin, to the Church Rock area near Gallup. Theprincipal uranium producing districts have been referred to asGallup, Grants, and Laguna (Kelley, 1963). The Ambrosia Lakearea (Grants district) and the North Laguna area (Laguna dis-trict) have been the major producing areas. For details of thegeography, general geology, uranium deposits, and mine loca-tions in the Grants uranium region, see Chapman, Wood, andGriswold, Inc. (1977).
General backgroundThe economic geology of the Grants uranium region has been
extensively described by Granger and others (1961); Kelley(1963); Moench and Schlee (1967); Kelley and others (1968);Granger (1968i; Hilpert (1969); and Rackley (1976). The largerdeposits in the region occur in the Westwater Canyon Member
and in the Poison Canyon sandstone (an informal unit within theBrushy Basin Member) of the Morrison Formation, and the fol-lowing comments refer specifically to those deposits.
Granger and others (1961) subdivided the unoxidized, tetra-valent uranium ores of the Ambrosia Lake area into prefaull andpostfault ores. Subsequent names applied to the prefaull ores in-clude run, primary, and trend ores; subsequent names for (hepostfault ores include redistributed, secondary, and stack(ed)ores. This paper uses the terms primary and redistributed to em-phasize the order of genesis and to avoid the connotation that theores are genetically related to structure.
The primary orebodies are flat-lying, mantolike masses, elon-gate in a northwesterly direction. They occur singly, side-by-side,irregularly en echelon, shingled, superimposed, and in variouscombinations of these relationships. Individual orebodies arc asmuch as 3,000 ft (1,000 m) long and several hundred feet wide(Granger and others, 1961). They are rarely more than 15 ft (5 m)thick except where there has been some redistribution of theprimary ore. The orebodies are compleiely enclosed within gray,unoxidized sandstone.
Redistributed orebodies generally are associated with—andquite often engulf—an older primary deposit. Because (hey arecontrolled by a combination of siratigraphic and structuralfeatures, they assume more varied shapes than do the primaryorebodies. Where faults and fractures are the dominant control,the redistributed orebodies are elongate in a direction parallel tothe structure. Where stratigraphic controls are dominant, theytend to parallel the trend of (he primary orebodies. Redistributedore forms thick, stacked orebodies in several of the deposits andmay be in excess of 100 ft (30 m) thick (Kelley and others, 1968;Roeber, 1972). The redistributed ore always occurs near or adja-cent to a redox interface and has many similarities to the classicalroll types of deposits found in Wyoming and Texas, although theshape of the roll is generally modified by faults, fractures, or thepresence of primary ore.
The orebodies occur in two parallel bands or trends, which arecalled the Ambrosia Lake trend and the Poison Canyon trend.The deposits in the Ambrosia Lake trend occur in the main bodyof the Westwater Canyon Sandstone and extend northwest fromsec. 36, T. 14 N., R. 9 W., approximately 9 mi (14 km) to sec. 22,T. 14 N., R. 10 W., where the trend apparently terminatesagainst the Ambrosia Lake fault zone. Extensive explorationdrilling during the past (en years or so has extended the trendsoutheast an additional 8-10 mi (13-15 km) to a point severalmiles southeast of San Mateo (Chapman, Wood, and Griswold,Inc., 1977).
The Poison Canyon ireno spans some 8 mi (13 km) from theBlue Peak mine at the outcrop in sec. 24, T. 13 N., R. 10 W.,southeasterly to the San Mateo mine where ore lies at a depth of1,400 ft (425 m). The deposits occur within the Poison Canyonsandstone, an informally named tongue of the Westwater Can-yon Sandstone. The Ruby Wells-Mariano Lake deposits in theSmith Lake area may have been once continuous with the PoisonCanyon trend south of the present outcrop of the Morrison For-mation.
The present-day oxidation-reduction interface interweaveswith the orebodies in the northwestern portion of the AmbrosiaLake trend. For example, most of the orebodies in the Sandstonemine in sec. 34, T. 14 N., R. 9 W., were remnants of primary ore-bodies that had been overrun by the northward migrating inter-face; most of the orebodies in the Ann Lee mine in sec. 28, T. 14N., R. 9 W. were primary orebodies in completely reduced sand-

196
SAN JUAN " r'RIO ARRI&A
• Shiproek
• Farmington
McKINLEY
TierraAmarillo
SANDOVAL
CoyoteCanyon
#Churchrock
*Gallup
#Crownpoint
Borrego
•SmithLak*
VALENCIA
Ambrosia Lak*Fault Zone
AmbrotiaLak* AntoSan MateoFault
San Mateo
Cuba
.Grantt
SOCORRO
Loguna
tm»WN BY CO. SHIRLEY
FIGURE 1—INDEX MAP OF NORTHWEST NEW MEXICO.
stone. Oxidation, particularly along major zones of permeabilitysuch as the San Mateo fault and the Ambrosia Lake fault zone,may extend for significant distances downdip beyond the trend.
West of the Ambrosia Lake fault zone the interface is offset tothe north approximately 6-7 mi (10-11 km). This interface thenmeanders irregularly from north of Borrego Pass to Crownpointand then to a point south of Coyote Canyon (fig. 1).
During Late Jurassic time, the Mogollon highland south andsouthwest of the Grants uranium region shed clastic debris into abroad, shallow basin to the north that roughly corresponds to thepresent configuration of the San Juan Basin. During deposition,the highland was uplifted and the basin differentially sank. Thisdownwarping permitted an accumulation of Jurassic sedimentsin the basin that now total about 1,000 ft (300 m) in thickness(Hilpert, 1969).
Jurassic sedimentation was terminated in Late Jurassic time bythe rise of the Mogollon highland, with gentle tilting to the north(Kelley, 1955). Before the Dakota Sandstone of Early (?) andLate Cretaceous age was deposited, the southern edge of theMorrison Formation was truncated during a long period of ero-sion.
The post-Morrison period of erosion ended with marine trans-gression that accompanied regional subsidence of subcontinental
dimensions which eventually covered the region with 5,000 ft(1,500 m) of sediments by Late Cretaceous time and perhaps7,000 ft (2,100 m) by Paleocene time (Kelley and others, 1968).
This depositional sequence was terminated by the Laramidedeformation that uplifted the area, forming the Zuni uplift, andincreased subsidence in the San Juan Basin and its subsidiaryGallup and Acoma embayments. In addition to the Zuni uplift,the principal folds and faults in the region were formed and thegentle northerly regional dips were established (Kelley, 1963).
Accelerated erosion probably excavated and reexposed theMorrison Formation along the southern edge of the San JuanBasin by Late Tertiary time. The sandstone aquifers, includingthe Westwater and Poison Canyon sandstones, were again ex-posed to entry by oxygenated meteoric waters, and a hydrologicregime became established that still continues.
The primary orebodies were probably emplaced during theLate Jurassic-Early Cretaceous erosional interval (Kelley andothers, 1968; Rackley, 1976). Douglas Brookins of the Universityof New Mexico has recently made a significant contribution toknowledge of the Grants uranium region by age dating the per-iods of mineralization. In a paper entitled "Geochemical genesisof uranium in the southern San Juan Basin" (1977 NationalUranium Resource Evaluation Symposium, Grand Junction,

197
Colorado; see also Brookins, this volume), Brookins concludesthat the Smith Lake-Ambrosia Lake ores were emplaced approx-imately 138 ±10 m.y. B.P. and that the Jackpile-Paguate oreswere emplaced during a distinctly younger—but still pre-Dakota—age of mineralization at 110-115 m.y. B.P. Authigenicmontmorillonite from the host rocks of both areas is dated at145 + 10 m.y., and the Dakota Sandstone and Mancos Shale(boih Cretaceous) yield a 94 ±10 m.y. date. Therefore, theJurassic-Early Cretaceous erosional interval may approximatelyencompass the time span of 138-94 m.y. B.P.
The primary orebodies are completely enclosed in unoxidizedsediments and are tabular in shape. No completely satisfactorygeochemical model has been developed to explain their forma-tion. Granger (1968) suggested that the carbonaceous material in-timately associated with these deposits was introduced into thesediments as a water-soluble humate derived from decaying plantmaterial. The humate is presumed to have moved downdipwithin the host beds into an environment, perhaps at a watertable, where it became insoluble and precipitated. Granger alsosuggested that the uranium minerals, which either precipitatedcontemporaneously or later, were reduced by this carbonaceousmaterial. Under these conditions, the likely uranium sourcewould have been the uranium disseminated in the host rocks andassociated beds.
The redistributed ore is probably less than 10 m.y. old (Shaweand Granger, 1965) and undoubtedly is related to the present ero-sion cycle. The uranium in the redistributed bodies was derivedmainly from the oxidation of primary updip orebodies. This ox-idized and solubilized uranium then moved downdip and precip-itated at the present redox interface. Thus the redistributedorebodies are genetically related to the classical roll orebodies inWyoming, even though they are not perfectly crescent shaped.
Exploration problemsWe can conclude that two genetic types of uranium deposits in
sandstone exist: 1) the Wyoming roll-type deposits and the Am-brosia Lake redistributed deposits that migrate in a geochemicalcell and precipitate at a redox interface and 2) primary tabulardeposits, enclosed by unaltered sandstone, that have been em-placed by some other mechanism.
Many uranium exploration geologists have refused to acceptthis second conclusion and consider the primary deposits to berelated to the present redox interface. Rackley (1976), for ex-ample, refused to accept a unique genesis for the Ambrosia Lakeprimary tabular deposits enclosed in reduced sediments and con-cluded that the mineralization of roll or geochemical-cell de-posits, regardless of their physical shape, is the most importantprocess leading to the formation of a uranium deposit. Brookins(1976) has also attempted to explain the Ambrosia Lake oregeometry in Eh-pH terms related to roll-front geochemistry andthe present redox interface. That many other geologists also feelthis way is demonstrated by the great amount of exploration ac-tivity along the present redox interface from the Ambrosia Lakearea to the Coyote Canyon area. The assumption is that the pri-mary Ambrosia Lake tabular deposits are directly related to thisredox interface and that exploration along the interface mayresult in the discovery of additional primary deposits there.
Another problem concerns the possible continuation of theAmbrosia Lake trend west of the Ambrosia Lake fault zone. Wehave no reason to believe that the Ambrosia Lake trend shouldterminate against a fault zone that postdates the emplacement ofthe ore. The entire area west of the fault zone and south of thePoint Lookout Sandstone outcrop has been extensively explored.The State Engineer has abandonment records of more than12,000 exploration drill holes, and many of these were drilled inattempts to locate a westward continuation of the AmbrosiaLake trend. Certainly, some deposits were found (Ruby Wells,Mariano Lake, Black Jack no. 1, and Church Rock), but they arenot continuations of the Ambrosia Lake trend.
Most of this explored area falls south of the present redox in-terface; perhaps any continuation of the trend has been strippedaway and redeposited as redistributed deposits along the inter-face. None of the deposits discovered along this interface is ofsufficient extent to lend credence to this idea. They probablyrepresent redistributions of smaller Poison Canyon sandstonedeposits which do or did exist south of the interface. Clearly, theAmbrosia Lake trend—if it does in fact exist—has to be north ofthe interface in unoxidized sandstone. Considering the depths re-quired to penetrate the Westwater Canyon Sandstone, randomdrilling north of the interface requires strong management sup-port and rising uranium prices.
Nose Rock areaIn 1973 Phillips Uranium Corporation commenced ex-
ploratory drilling in the Nose Rock area, in an attempt todiscover a continuation of the Ambrosia Lake trend. In mid-December 1975, Phillips announced the discovery of 25 millionlbs of uranium oxide contained within a 1,920-acre tract.Whether these reserves represent a continuation of the AmbrosiaLake trend remains to be seen. The following discussion will berestricted to the northwest portion of sec. 31, T. 19N., R. II W.,which is typical of the area.
StratigraphyThe surface of the area is underlain by shales and lenticular
sandstones of the Menefee Formation (Cretaceous). The top ofthe Point Lookout Sandstone is at a depth of about 500 ft (150m), and the top of the Dakota Sandstone occurs around a depthof 2,600 ft (790 m). The intervening strata consist, in ascendingorder, of the Two Wells Sandstone, Mancos Shale, Gallup Sand-stone, and Crevasse Canyon Formation.
The Dakota Sandstone (fig. 2) consists of about 200 ft (60 m)of quartzose sandstone, dark-gray shales, and, particularly in thelower part, some thin lignitic beds. The formation does not differsignificantly from its character elsewhere in the region.
The Brushy Basin Shale, about 150 ft (45 m) thick, is com-posed of greenish-gray, bentonitic mudstone; lenticular, arkosicsandstone; and thin, freshwater limestone. The member is verysiliceous and is much harder and more difficult to drill throughthan it is elsewhere in the region.
The Westwater Canyon Sandstone, the host sandstone for theuranium deposits, is about 170 ft (50 m) thick under sec. 31 butmarkedly thickens northward into the San Juan Basin. The mem-ber does not differ significantly in composition from its char-acter in the Ambrosia Lake area or elsewhere in the region. Sec.31 is 11 mi (18 km) downdip from the present redox interface,and the Westwater Canyon Sandstone is gray and unoxidized.
The quality of drill cuttings from the depths involved isgenerally very poor, and persistent red mudstone of the Recap-ture Member has not been noted. The general aspect of the resis-tivity logs and the cuttings indicate that the Westwater CanyonSandstone is underlain by the Cow Springs Sandstone in the area.The contact is often very difficult to determine from the resistiv-ity logs, cuttings, and penetration rates.
StructureThe structure of the area consists of a gentle homocline dip-
ping N. 7° E. at about 120 ft/mi (23 m/km). One small normalfaul t with a displacement of about 20 ft (6 m) has been noted (fig.3).
OrebodiesFig. 3 is a drill-hole map of the northwest portion of sec. 31.
Most of the holes deviate 50-150 ft (15-45 m) from the surfaceposition; the drill-hole locations shown are ore or mineralized in-tercept positions at an approximate depth of 3,100 ft (940 m).The map also shows the location of three uranium ore rolls. An

198
attempt was made to depict the rolls from an interface positionwhere the limbs come together to a frontal position that wouldcontain ore at a grade of 0.10 percent UjO,. Lower gradeseepage-zone material and limb ore are not shown on the map.The cross-section locations indicated on the map are depicted infig. 4.
In fig. 4 note that the solution front is shown as having mi-grated from northwest to southeast; as it migrated, the front wassplit into three superimposed components by thin, lenticularmudstones. Each of these components formed a roll uranium de-posit at a redox interface that existed in each of the respectivesandstone units at the time of emplacement.
Mineralogical observations of cores indicate the interiors ofthe rolls were once oxidized and have been re-reduced. Somesubtle relict hematite staining is readily observable in the near in-terior portions of some of the cores, and some red, oxidized claygalls now have rims or an outer skin of reduced green clay. Thefeldspars have also been extensively altered to kaolinite or akaolinite-montmorillonite mixture.
The uranium mineral has been identified as coffinite, and it iscoextensive and intimately associated with black carbonaceousmatter. The association is so intimate that it is difficult to avoidthe conclusion that the uranium and carbonaceous matter movedtogether as a coextensive unit within the solution front. Fer-roselite is concentrated near the interface and is particularlyabundant adjacent to the interior sides of the mineralized limbs.Jordisite forms an irregular exterior halo from near the interfaceto some distance in front of the uranium-bearing portion of theroll. Comparisons of chemical and radiometric uranium showthat the ore is in equilibrium.
Heavy-mineral suites from the cores have been studied in somedetail in an attempt to devise a rapid field method to help deter-mine the position of the exploration drill hole with respect to thenow obscured interface. A summary of this work is presented byRhett (this volume).
The rolls present in sec. 31 are much larger than the typicalWyoming roll; in areas where two or all three of the rolls aresuperposed, ore thicknesses may be in excess of 50 ft (15 m). Asignificant portion of the reserves is in limb ore that is thickenough to mine by underground methods. Generally, the tworemote interior limbs extend for a considerable distance north-west of the roll itself. In some cases one or both of the limbs canbe identified for more than a half mile behind the roll (but theymay be represented by a gamma anomaly only two or three timesthe background radiation).
ConclusionsThe data presented herein document the following tentative
conclusions:1) The Westwater Canyon Sandstone of the Grants uranium
region was deposited under reducing conditions in a fluvialdepositional system.
2) The Nose Rock deposits and the primary deposits of theGrants uranium region were emplaced early in the Late Jurassic-Early Cretaceous erosional interval by geochemical-cell processesthat oxidized the interior sediments and emplaced the ore atredox interfaces within the Westwater Canyon Sandstone. Forexample, Squyres (1963, figs. 2 and 4) shows what appear to bepossible rolls in the Ann Lee mine, sec. 28, T. 14 N., R. 9 W.,that seem to have been emplaced by a solution front migratingfrom south to north. Squyres also indicates that the northernedge of the main orebody is quite sharp, but the southern edgecontains abundant ore pods and isolated mineralized horizons.The author suggests that the north ore boundary is the front ofthe roll, and the south edge represents limb remnants modifiedby some unrecognized redistribution. Roeber (1972) also de-scribes a primary roll near the eastern end of the Ambrosia Lakearea. Squyres (this volume) does not interpret his data as sup-porting a roll model for the Ann Lee deposit.
HOLE #31-36
RMistivity
50 cp»/inch—-.
2500 cps/inch-
250 cps/inch—
-2700'-
-2800-
-2900'
-3000'
-3100
00
o
a
DMWN lr c«. SNI*LE<T
FIGURE 2—TYPICAL GEOPHYSICAL LOG IN THE NOSE ROCK AREA.
199
FIGURE 3—DRILL-HOLE MAP OF THE NORTHWEST PORTION OF SEC. 31, T. 19 N., R. II W., MCK:NLEY COUNTY. NEW MEXICO.Drawn br CC SWrlij

B
E
31-26
32217-
-fiz%
L
If
X P L A N A T I O N
UOAKIUM MINERALIZEDSANDSTONEMUDSTONE STRATA IN THEWESTWATER CANYON SANDSTONE
•RILL HOLE NUMBER
ELEVATION OF BASE,
AND % U j o i OF MINERAUZEOZONE
VERTICALS HORIZONTAL
^ ^ s B (o^^^^^^^ToOHitSCALE
SEE FlOURE 3 FOR LOCATION OF CR03S-3ECTK)N&
Dfo-n by C.G. Shirley
FIGURE 4—CROSS SECTIONS, SEC. 31, T. 19N..R. 11 W.,MCKINLEY COUNTY, NEW MEXICO.
201
The location and direction of emplacement of the Nose Rockdeposits, assuming gravity ground-water flow, indicate theJurassic San Juan Basin had a different structural configurationthan the present San Juan Basin. The Ambrosia Lake depositswere emplaced by a northward-migrating front and the NoseRock deposits by a southeast-migrating front about 30 mi (48km) distant. They were probably emplaced at the same timeunder the same geologic conditions by the same geochemical pro-cesses.
3) Re-reduction of the oxidized interior ground occurred dur-ing the latter part of the Late Jurassic-Early Cretaceous ero-sional interval. Perhaps the boggy, vegetative terrain duringlowermost Dakota deposition furnished a source of reductantsthat entered the hydrologic regime and re-reduced the altered in-teriors of the roll systems, diagenetically altering the entireWestwater Canyon Sandstone. Re-reduction of the sediments un-doubtedly occurred.
4) Erosion excavated and reexposed the Morrison Formationalong the southern edge of the San Juan Basin in Late Tertiarytime. The sandstone aquifers, including the Westwater Canyonand Poison Canyon sandstones, were once again exposed to en-try by oxygenated meteoric waters, and a hydrologic regimebecame established that still continues. Extensive modificationand redistribution of the Ambrosia Lake roll-front depositsresulted from these events. The present redox interface has nogenetic connection with the primary Ambrosia Lake deposits buthas, however, generally obliterated their previous roll-shapedgeometry.
5) Eventually the Nose Rock and Ambrosia Lake depositsprobably will be found to be connected in some manner. Thesearch for this connection presents an exciting exploration op-portunity.
ReferencesBrookins, D. G., 1976, Position of uraninite and/or coffinite accumula-
tions to the hematite-pyrite interface in sandstone-type deposits: Eco-nomic Geology, v. 71, p. 944-948
Chapman, Wood and Griswold, Inc., 1977, Geologic map of Grantsuranium region: New Mexico Bureau of Mines and Mineral Resources,Geologic Map 31, rev. ed.
Granger, H. C , 1968, Localization and conlroi of uranium deposits inthe southern San Juan Basin mineral belt, New Mexico—an hypothesis,in Geological Survey research: U.S. Geological Survey, Prof. Paper600-B, p. B6O-B7O
Granger, H. C , Santos, E. S., Dean, B. G., and Moore, F. B., 1961,Sandstone-type uranium deposits at Ambrosia Lake, New Mexico—aninterim report: Economic Geology, v. 56, no. 7, p. 1179-1210
Hilpert, L. S., 1969, Uranium resources of northwestern New Mexico:U.S. Geological Survey, Prof. Paper 603, 166 p.
Kelley, V. C , 1955, Regional tectonics of theColorado Plateau and rela-tionship to Ihe origin and distribution of uranium: University of NewMexico, Pubs, in Geology, no. 5,120 p.
, compiler, 1963, Geology and technology of the Grants uraniumregion: New Mexico Bureau of Mines and Mineral Resources, Mem.15,277 p.
Kelley, V. C.Kittel, D. F., andMelancon, P. E., 1968, Uranium depositsof the Grams region, in Ore deposits of the United States, 1933-67, J.D. Ridge, ed.: New York, American Institute of Mining, Metallurgical,and Petroleum Engineers, Graton-Sales volume, p. 747-769
Moench, R. H.,andSchlee, J. S., 1967, Geology and uranium deposits ofthe Laguna district, New Mexico: U.S. Geological Survey, Prof. Paper519,117 p.
Rackley, R. I., 1976, Origin of western-states type uranium mineraliza-tion, in Handbook of strata-bound and stratiform ore deposits, K. H.Wolf, ed.: Amsterdam, Elsevier Scientific Publishing Co., p. 89-156
Roeber, M. M., 1972, Possible mechanisms of lateral enrichment andphysical positioning of uranium deposits, Ambrosia Lake area, NewMexico: New Mexico Bureau of Mines and Mineral Resources, Circ.118, supplement, p. 1-16
Shawe, D. R., and Granger, H. C , 1965, Uranium ore rolls—an analysis:Economic Geology, v. 60, p. 240-250
Squyres, J. B., 1963, Geology and ore deposits of the Ann Lee mine, Am-brosia Lake area, in Geology and technology of the Grants uraniumregion, V. C. Kslley, compiler: New Mexico Bureau of Mines andMineral Resources, Mem. 15, p. 90-101

202
HEAVY-MINERAL CRITERIA FOR SUBSURFACEURANIUM EXPLORATION, SAN JUAN BASIN,
NEW MEXICOby Douglas W. Rheti, Energy Minerals Section Supervisor. 114 TRW Building,
Phillips Petroleum Company, Bartlesville, Oklahoma 74004
AbstractIn Phillips Petroleum Company's Nose Rock deposit, uranium
occurs in a series of roll-front deposits in now largely reducedrock. Mineralogical data support geological evidence that the ox-idizing ground-water regime that prevailed during active migra-tion of the roll fronts was replaced by a reducing ground-waterregime. This reducing event halted roll-front migration andgenerally obliterated macroscopic evidence of oxidation. Dia-genetic heavy-mineral assemblages have survived the reducingevent and reflect the geochemical environment in which theyformed. Consequently, diagnostic heavy-mineral assemblagescan be used to identify geochemical zones associated with roll-front mineralization in reduced ground. A field trial based on theheavy-mineral composition of drill cuttings demonstrated thatmineralogical criteria can provide a reliable means of recognizingstratigraphic horizons that were traversed by roll-front systems.
IntroductionPhillips Petroleum Company is currently developing a ura-
nium deposit northeast of Crownpoint in the San Juan Basin ofnorthwestern New Mexico. Uranium occurs in weakly cemented,feldspathic, fluvial sandstones of the Westwater CanyonMember of the Morrison Formation. Thin, discontinuous bedsof montmorillonitic mudstone are interbedded with sandysediments. Uranium occurs chiefly as coffiniie in carbonaceousorganic-matter-impregnated portions of the sandstone.
Locating subsurface uranium deposits is usually accomplishedthrough a combination of drill-hole logging techniques, examina-tion of drill cuttings, and supplemental chemical analyses. Inmany uranium prospects, the color of the drill cuttings allows theexplorationist to identify oxidized or altered sediments, and canserve as a general guide lo locating orebodies relative to the drillhole (Adler, 1970).
In the Nose Rock area, a late diagenetic reducing event oc-curred that halted the southeasterly migration of the roll frontsand generally obliterated macroscopic differences betweenbarren-interior and barren-exterior ground. Consequently,Phillips' drilling program is complicated by the generally reducedappearance of Westwater Canyon sediments surrounding theroll-front deposits. Color of the drill cuttings cannot be used todiscriminate between altered and unaltered rock.
Phillips exploration geologists felt the need for some critcr windependent of geophysical logs, to help distinguish between ex-terior ground and rock that had been traversed by the roll-frontsystems. Mineralogical studies were based on drill cores recov-ered from areas of good geologic control provided by high drill-hole density. Although microscopic studies of whole coresamples were not especially beneficial, heavy-mineral suites ob-tained from crushed core samples, employing tetrabromoethaneas the separating medium, have proven very useful.
A heavy-mineral technique was developed as a means of con-centrating minerals that are related genetically to uraniummineralization but were relatively unaffected by the latediagenetic reducing event.
ACKNOWLEDGMENTS—I am indebted to Dean Clark and manyPhillips geologists for sharing with me their insights and under-standing of roll-front deposits in the Nose Rock area. Dee Kaz-
mier provided valuable technical assistance. Special thanks go toW. R. Bohon and the management of Phillips Petroleum Com-pany for permission to publish this paper.
Significance of heavy mineralsHeavy minerals can be assigned to either of two categories:
detrital and authigenic. Detrital heavy minerals are those thatwere deposited as sand grains during sedimentation. In the NoseRock deposit, common detrital heavy minerals include zircon,tourmaline, iron-titanium-oxide grains (magnetite-ilmenitegrains), garnet, apatite, and rutile. Cadigan (1967) presents anextensive list of detrital heavy minerals that occur in theWestwater Canyon Member.
Authigenic heavy minerals are those that formed in place inresponse to a particular geochemical environment. The differentgeochemical environments associated with roll-front systemshave given rise to different assemblages of authigenic heavyminerals. Mineralogical compositions of the heavy-mineralassemblages are remarkably consistent. Thermodynamic calcula-tions show that observed mineral assemblages are composed ofchemically compatible phases that should coexist stably undergeologically reasonable conditions of Eh and pH. For example,minerals like jordisite and siderite, which are stable in a lowoxidation-potential environment, are not normally found inmineral assemblages containing oxidized species such as sulfatesor ferric-iron oxides. Thermodynamic analysis of authigenicheavy-mineral suites provides insight into the geochemical pro-cesses accompanying migration of a roll-front deposit.
Heavy-mineral assemblages can be classified into severalgroups. Each assemblage is characteristic of a geochemical en-vironment or zone associated with a roll-front cell. Roll-frontgeochemical zones and their diagnostic heavy-mineral assem-blages are summarized in figs. 1 and 2. Authigenic heavy min-erals include siderite, barite, galena, pyrite, greenockite,coffinite-organic composite grains, goethite-hematite, fer-roselite, and anatase.
Application of roll-front conceptto Nose Rock deposit
Two important processes in roll-front migration are recog-nized. The first of these is movement of an organic-rich fluidthrough the sedimentary rock framework—in this case the fluvialsands of the Westwater Canyon Member. The organic phase im-pregnated the sandstones by occupying interstitial void space.Penetration of the sandstone by the organic fluid probably wasstrongly influenced by sediment permeability. Locally theorganic matter is partially to completely pyritized, giving rise todetrital quartz and feldspar grains that are cemented by pyrite.
The organic-rich fluid also maintained a localized reducing en-vironment that served as a reductant and chemical screen forsoluble, oxidized metallic species transported by oxidizingground waters. Anomalous concentrations of selenium, iron,lead, cadmium, and molybdenum occur mainly as sulfides close-ly associated with the roll front.
As the organic-rich fluid flowed through the sediments, itreacted with detrital iron-titanium-oxide grains to produce buff-colored relicts depleted in iron and relatively enriched in TiO2, as

203
. BARREN EXTERJOR: (UNOXipiZELVUNALf ERED)
DIRECTION OF
GROUNDWATER FLOW
BARREN INTERIOR •(OXIDIZED/ALTERED). •'
SAND:
^ E l E R V . : / • , • .2 ? = = » . • . .";• .• . E X T E R I O R GROUNDC - : : ; Z O N E • ' . • . . • • • • .
..SAND:
LSHALE- : (REDUCED/UNALTERED): :SHALE:
F I G U R E 1—SCHEMATIC CROSS SECTION SHOWING THE MAJOR GEOCHEMICAL ZONES ASSOCIATED WITH A ROLL-FRONT URANIUM DEPOSIT
well as individual crystals and polycrystalline clusters of authi-genic anatase. Adams and others (1974) have described thealteration in detail. The presence of bleached magnetite-ilmenitegrains, anatase crystals, and pyrite cements is considered areliable indicator that an organic-rich phase passed through theparent rock.
The second process in roll-front migration is oxidation ofreduced mineral species by relatively oxidizing ground watersimpinging on the extended, three-dimensional crescent oforganic-saturated sediments forming the roll front. The concaveor interior portion of the crescent is characterized by a relativelyhigh oxidation potential and an oxidized suite of minerals. Thecrescent or roll of organic-impregnated sediments separates theoxidized interior from relatively reduced barren exterior groundoccurring above, below, and in front of the roll. The roll frontsapparently advanced slowly into reduced exterior ground viachemical reactions and processes not well understood but prob-
ably motivated by oxidizing ground waters moving slowly downthe hydrologic gradient. The complex spectrum of mineralassemblages associated with the roll front is maintained in asteady-state condition according to Eh, pH, and activity gra-dients existing across the roll.
Oxidation of metallic sulfides, chiefly pyrite, in the redox-interface zone causes a sharp drop in pH and liberates sulfateions and iron. Some of the iron oxidizes rapidly to form per-vasive limonite/hematite coatings on the sand grains, a charac-teristic feature of interior ground in many roll-front deposits.Some of the sulfate is precipitated rapidly by Ba+ 2 to form baritecoronas around the surviving, unoxidized pyrite grains. The re-maining sulfate probably travels down gradient in solution unlessit is consumed by sulfate-reducing bacteria or precipitated as asulfate. The sulfate anomalies reported by Harshman (1974)possibly reflect sulfate derived from oxidation of pyrite along theredox interface.
GEOCHEMICAL ZONE,
ROLL FRONT DEPOSIT ANATASE
BLEACHED
MAG-IL
GRAINS
FERRUG-
INOUS
CEMENT
DIAGNOSTIC HEAVY MINERALS
FERRO-
SELITE
PINK a
YELLOW
BARITE
ORGANIC
MATTER
PYRITE
CEMENT
GALENA/
GREEN-
OCKITE
CLEAR/
WHITE
BARITE
UNALTERED
MAG-IL
GRAINS
BARREN EXTERIOR
GROUNDmm mm
SEEPAGE ZONE
ORE ZONE
REDOX INTERFACE/
NEAR INTERIOR
BARREN INTERIOR
GROUND
FIGURE 2—AUTHIGENIC HEAVY-MINERAL ASSEMBLAGES, which are diagnostic of geochemical zones associated with roll-front deposits inthe Nose Rock area.

204
The reduction eventEvidence presented by Clark (this volume) indicates the source
of oxidizing ground waters was eliminated during Dakota (Early(?) to Late Cretaceous) time when relatively reducing watersflooded the Westwater Canyon Member. Active roll-front sys-tems were immobilized, and much of the macroscopic evidenceof roll-front geochemical activity was obliterated. Except for afew localized exceptions, the drop in redox potential reducedferric-iron oxides to ferrous species and eliminated the red andyellow iron oxides that typically coat interior-ground sand grainsin many roll-front deposits.
In a few samples, reduction of ferric-iron stains is incomplete,and ferric-iron-oxide stains coexist with thin, green chloritecements coating detrital sand grains. Therefore, the chloriticcements found in many barren-interior Nose Rock samples pos-sibly represent replacement products of once-pervasive ferric-oxide coatings.
Diagnostic heavy mineralsSome of the authigenic heavy minerals formed under relatively
restricted Eh-pH conditions. These minerals are diagnostic of thegeochemical environment in which they crystallized, and they canbe used to identify [he roll-front zone in which they formed.
siDtRiTE—Authigenic siderite is characteristic of exterior-ground and seepage-zone environments. Siderite occurs as tan-colored, turbid grains and commonly is intergrown with clays,chiefly montmorillonite. Data of Garrels and Christ (1965) in-dicate siderite is stable in moderately to strongly reducing en-vironments containing appreciable dissolved carbonate andnegligible divalent sulfur.
IRON TITANIUM-OXIDE GRAINS—Among the most ubiquitouscomponents of heavy-mineral assemblages are detrital iron-titanium-oxide grains. In an unaltered state, these black,submetallic grains commonly are intergrowths of two phases, aniron-titanium spinel or magnetite phase and an iron-titaniumrhombohedral or ilmenite phase. Normally visible only in pol-ished section under reflected light, magnetite-ilmenite in-tergrowths are highly distinctive under appropriate conditions ofalteration.
Our studies support work reported by Adams and others(1974) and Reynolds and others (1977) indicating that detritalmagnetite-ilmenite grains undergo alteration resulting from con-tact with organic matter, whereby the detrital iron-titanium ox-ides are leached of much of their iron, leaving a white to tanbleached grain relatively enriched in TiO2. The bleachediron-titanium-oxide grains often show the distinctive magnetite-ilmenite intergrowth pattern that serves as an unmistakable clueto their original identity.
Unaltered magnetite-ilmenite grains are diagnostic of rock thathas not been swept by organic matter, such as exterior ground.Conversely, an abundance of bleached magnetite-ilmenite grainsis indicative of rock that has been swept by the organic-rich fluid.Barren-interior ground typically contains far more bleached thanunaltered magnetite-ilmenite grains.
CARBONACEOUS ORGANIC MATTER—In the Nose Rock areauranium occurs chiefly as coffinite, U(SiO4)|.x(OH)4x, intimatelyassociated with carbonaceous organic matter. This organic mat-ter, which should not be confused with coal, moved through therock framework as a fluid and now occupies void space betweenthe sand grains. It has many characteristics similar to kerogen,being insoluble in most organic solvents and chemically inert.When mineralized by uranium and/or pyrite, fragments of or-ganic matter may increase in density to 3 or greater and con-tribute to the heavy-mineral fraction.
Heavy carbonaceous grains are characteristic of mineralizedzones with gamma-ray anomalies of about 200 cps or more. Lesscommonly, heavy carbonaceous grains (possibly mineralizedwith jordisite) and carbonized iron-titanium-oxide grains will oc-
cur in seepage-zone environments immediately down gradientfrom the nose of the roll.
ORGANIC CEMENTS—Organic cements are simply carbonaceouscoatings found on detrital minerals. They probably represent sur-face films of organic matter left behind as the pore-fillingorganic-rich fluid moved down gradient. Organic cements cor-relate strongly with mineralized zones, and to a lesser extent,with near-interior rock.
PYRITE CEMENT—Pyrite is a prominent constituent of heavy-mineral assemblages in the Nose Rock area. Diagenetic pyritegrains are common in exterior ground. Pyrite cements, however,are limited to rock that has been swept by organic matter.
Carbonaceous organic matter shows wide variation in degreeof replacement by pyrite; composite pyrite-organic-mattercements and pyrite-cemented sands grains are common in manyheavy assemblages. Therefore, pyrite cements almost certainlyrepresent pseudomorphous replacement of organic matter thatonce filled void space in the sediments. Pyrite cement indicatesthe organic-fluid phase was once present in the rock.
CALENA/GREENOCKITE—Galena (PbS) occurs as unmistakableeuhedral cubes which are certainly authigenic in origin. Eh-pHanalyses (Garrels and Christ, 1965) together with empirical datasuggest that galena, and probably greenockite (CdS) as well, arestable in seepage-zone and ore-zone environments. Corrodedcubes of galena occur rarely in interior-ground assemblages.
BARITE—Barite, the least soluble of the common sulfates, is aprominent constituent of many heavy-mineral assemblages.Three varieties of barite are recognized: clear to white barite,deep yellow barite that often contains inclusions of pyrite, andred to pink barite with or without inclusions of pyrite.
The significance of clear/white barite is uncertain. Large con-centration anomalies occur in both interior and exterior rock;therefore, clear/white barite seems to have limited diagnosticvalue. It may precipitate when Ba*2, liberated during alterationof feldspars, combines with SO,,-2 produced by oxidation ofpyrite. Alternatively, clear/white barite may reflect the late dia-genetic reducing event. Relatively reducing marine (?) watersthat flooded the Westwater Canyon may have supplied SO4-
2
ions that combined with Ba+ 2 released by altered feldspars.Yellow barite almost invariably is associated with strongly
mineralized zones. It frequently contains inclusions of pyriteand, less commonly, inclusions of organic matter. The yellowcolor presumably reflects Fe*2 incorporated in the crystal duringgrowth. Textural relationships indicate that yellow barite prob-ably forms when SO,,-2 ions produced during incipient oxidationof ore-zone pyrite react with Ba+2 ions derived from alteringalkali feldspars.
Like yellow barite, pink and red barites show a ciose spatialassociation with mineralized zones, suggesting a genetic relation-ship between the colored barites and roll-front geochemical pro-cesses. Red barite occasionally occurs as a cement, indicating theauthigenic origin of this mineral.
X-ray-emission analyses of red barite cements show iron pres-ent in minor to moderate amounts in all grains. The red color isapparently the result of submicroscopic inclusions of ferric-ironoxides incorporated within the barite crystal. Once surroundedby highly insoluble BaSO4, the iron-oxide inclusions effectivelywere isolated from the late diagenetic reducing waters and havepersisted to the present as evidence that an oxidizing geochemicalregime once existed in the rock. The presence of hematite-bearingbarite is considered persuasive evidence of an earlier oxidizinggeochemical regime. Red barite correlates well with bleachedmagnetite-ilmenite grains and authigenic anatase in near-interiorenvironments.
FERROSELITE—Ferroselite is an iron selenide with a distinctive,cruciform crystal. Work done by Granger (1966) indicates thatferroselite is probably diagnostic of the redox zone or barrennear-interior of a roll front. Ferroselite seems to occur in arestricted Eh-pH environment: it is abundant locally, but only asmall percentage of Phillips samples contain the mineral.

205
ANATASE—Authigenic titanium oxides are present as anatase.Anatase occurs as tetragonal dipyramids with or without prom-inent basal pinacoids Anatase is found as euhedral singlecrystals, microcrystalline drusy cements and encrustations, andinclusions in carbonate and barite cements. Textural featuressuggest that anatase precipitates in pore space from solution.
Detrital magnetite-ilmenite grains are probably the source oftitanium, which is liberated during reactions between the iron-titanium oxides and organic matter. A positive correlationbetween abundance of anatase and of bleached iron-titanium-oxide grains suggests the detrital iron-titanium oxides are thesource of titanium and that titanium is not very mobile in theroll-front environment. Empirical evidence indicates that abun-dant anatase is a reliable indicator of barren-interior ground.
FERRUGINOUS CEMENT—In a small percentage of samples, sandgrains were coated with goethitic or hematitic cements thatsomehow have survived the reducing event. Prominent ferrugi-nous coalings are evidence of an oxidizing geochemical regime.Ferruginous cements, which are often best preserved in light-fraction grains, correlate well with barren-interior-zone in-dicators such as bleached iron-titanium-oxide grains andanatase.
Geochemical zones in roll-front system
Exterior zoneExterior ground is essentially unmodified by the process of
roll-front mineralization. Mineral assemblages in exteriorground are products of the diagenetic history of the host rock,and predicting heavy-mineral assemblage compositions may bedifficult.
Iron-titanium oxides appear as unaltered, black, submetallicmagnetite grains. Diagenetic pyrite often is present as small,fresh, subhedral grains; pyrite cement typically is absent. Sideriteand siderite-montmorillonite composite grains are diagnostic ofexterior ground in the Nose Rock area.
In general, the degree of silicate alteration, such as alterationof plagioclase feldspar grains, is minimal by comparison withalteration in other geochemical zones, particularly the barren-interior zone. Phillips data support conclusions reported by Leeand others (1975) and Lee (1976) that montmorillonite is thedominant clay mineral in exterior ground. Montmorillonitecements are relatively common.
Seepage zoneThe seepage zone occurs immediately down gradient from the
roll front and is characterized by incipient roll-front-relatedmineralization. Pyrite and organic cements are present. Theiron-titanium oxides may be carbonized, in which state they arerather fragile, have a graphitic sheen, and may be difficult todistinguish from mineralized organic matter. Authigenic anataseis often present. Clear/white barite is prevalent in some samples,and it may represent a plurne of SO4-
2 ions produced by oxida-tion of pyrite in the interface zone. Galena and, less commonly,greenockite are most abundant in seepage zones.
Black, earthy streaks of jordisite (amorphous MoSj) are char-acteristic of the seepage zone, although discrete grains largeenough for optical identification in heavy-mineral concentratesapparently do not form. Jordisite was identified by x-ray-diffraction analysis of organic fragments.
Ore zoneThe ore zone generally refers to the organic-impregnated por-
tion of rock between the redox interface and the seepage zone.Ore-zone assemblages are distinctive. Uranium- and sulfide-mineralized organic matter is abundant. Organic cements andcoatings occur on many grains, and pyrite cements are common.Carbonized iron-titanium-oxide grains are locally abundant.
Altered iron-titanium-oxide grains and authigenic anatasetypically are present. Distinctive yellow and red barite grains,many of which are choked with pyrite and iron-oxide inclusions,may be abundant. Yellow and red barites are especially commonin ore-zone and redox-interface assemblages. Ferruginous ce-ments are locally prominent.
Alteration of light-fraction silicates is more advanced than inexterior-zone and seepage-zone assemblages. Iron-rich chloriteand kaolinite replace montmorillonite as the dominant phyllosili-cates. Ore-zone assemblages containing ferroselite presumablyrepresent a redox interface or near-interior environment.
Interior zoneInterior-zone assemblages are dominated by delrital heavy
minerals; many of the seepage-zone and ore-zone phases areunstable in an interior-zone environment and consequently ox-idize or dissolve. Altered iron-titanium-oxide grains andauthigenic anatase are the most prominent authigenic heavy-mineral phases. Relicts of yellow and red barite, organic coat-ings, and corroded pyrite cement survive locally.
Alteration of light-fraction silicates is most advanced, andchlorite and kaolinite are the dominant phyltosilicates. Chloriticcements on detrital silicates may reflect the earlier presence offerric-oxide coatings.
Field trialPhillips conducted a field test to evaluate the use of heavy-
mineral assemblages to discriminate between geochemical zonesin a rc'.i-front system. Nine drill holes were sampled during thetest. Test holes were drilled in areas of sufficiently high drill-holedensity to provide the necessary subsurface geologic control.
Cuttings from each test hole were sampled at 5-ft intervalsthroughout the West water Canyon. A procedure was devised forprecision collection of cuttings that enabled well-site geologists tocollect cuttings from a specific horizon with a precision of 2 or 3ft (about 1 m) at depths to about 3,500 ft (1,200 m). The im-portance of collecting accurate, representative cuttings cannot beoveremphasized.
Cuttings samples were washed lightly to eliminate fines beforeconcentrating the heavies. Heavy-mineral assemblages from eachinterval were analyzed and assigned to a geochemical zone. Thedistribution of geochemical zones in a sampled hole was used topredict the occurrence and distribution of mineralized zones andaltered horizons both up and down gradient from the sampledhole. Based on cross sections constructed from gamma-ray logs,Phillips geologists determined that roll fronts in the Nose Rockarea generally migrated to the southeast.
HOLE 86—Results of one test traverse are summarized in figs. 3aid 4. Hole 86, the first hole of the traverse drilled, was dividedinto five stratigraphic intervals based on hea^y-mineral composi-tions of the cuttings.
Interval A was characterized as barren-interior ground. Holesdrilled progressively eastward were expected to eventually en-counter roll-froni mineralization, whereas holes to the west wereexpected to hit generally barren ground and low-grade limbmineralization.
Interval B included two weakly mineralized zones separated bygenerally unaltered assemblages containing mineralized organicmatter; therefore, the interval was interpreted as a seepage zone.No uranium mineralization was predicted in the correspondinghorizon east of hole 86, but mineralization was predicted in holesto the west.
Interval C consisted of a prominent altered sequence split by ashale seam. Despite the absence of gamma anomalies, this inter-val was characterized as interior ground. Logically, then,eastward exploration was expected to eventually encounter a rollfront, and holes to the west were expected to encounter only low-grade limb mineralization.

206
NEWMEXICO
N
177
116*O o 8 6 * _50
28
DRILL HOL~LOCATION MAPTRAVERSE No I
* HOLES SAMPLED ? i , , , 5 0 ° F T
AND ANALYSED ••HZMBCUjBi
FIGURE 3—THE LOCATIONS OF DHILL HOLES SAMPLED AND LOGGED ALONGTRAVERSE NO. I OF THEF1ELDTRIAL.
Interval D was characterized as exterior ground with possibleseepage-zone indicators. Consequently, uranium mineralizationwas expected to be absent from correlative strata to the east, butprobable in the horizon west of hole 86.
Cuttings from interval E yielded strongly altered assemblagesi jical of interior ground. Occurring at the base of interval E wasa thin oxidized zone containing organic matter but lacking anygamma-ray expression. This zone represents limb mineralizationthat has been leached of uranium; therefore, relict, low-grademineralization was forecast in the basal sand unit west and im-mediately east of hole 86. However, continued eastward drillingshould ultimately encounter the roll front that traversed intervalE.
Holes SO and 28 were drilled east of hole 86 and were loggedbut not sampled. The distribution of altered and mineralizedzones deduced from the geophysical logs appeared as predictedfrom analysis of hole 86 cuttings, except that strong mineraliza-tion was found in interval D in hole 50. Evidence of interval Dmineralization in holes 50 and 28 suggested that the interval Droll front swung north of hole 86.
HOLE 116—Hole 116 was drilled west of hole 86 to test predic-tions. Cuttings were sampled and analyzed, and the intervalswere characterized according to geochemical zones. The distribu-tion of altered and mineralized horizons in hole 116 bore strongsimilarity to that encountered in hole 86 and substantiated pre-dictions based on mineralogical data from hole 86.
Interval B in hole 116 showed low levels of mineralization andslight alteration characteristic of a seepage zone or weakly min-eralized ore zone. If so, the roll front probably occurs north ofholes 116 and 86.
Horizon D in hole 116 is a generally unaltered interval separat-ing the central and jasal altered intervals C and E. Mineralogicaldata indicate that uranium mineralization has not traversed hori-zon D in hole 116 and that the roll front intercepted in interval Din hole 50 should lie northwest of holes 116 and 86.
HOLE 177—To prove or disprove that assumption, hole 177was drilled northwest of hole 116. As expected, roll-front min-eralization was indeed encountered in interval D. Furthermore,weakly mineralized limb ore and residual mineralization oc-curred in altered zones A, C, and E as anticipated.
Several similar traverses were made at Nose Rock. Heavy-mineral criteria correctly predicted the occurrence and distribu-tion of mineralized zones and altered horizons in most cases.
FIGURE 4—A CROSS SECTION OF THE WESTWATER CANYON SANDSTONEALONG TRAVERSE NO. 1, CONSTRUCTED FROM GEOPHYSICAL WELL LOGS:the patterned columns in logs of holes 116 and 86 show the distributionof altered and unaltered strata identified on the basis of mineralogicalcriteria.

207
Where predictions were not verified by sampling and analyzingdrill cuttings, mineralogical data are in good accord with dataobtained by geophysical methods.
Summary and conclusionsIn Phillips' Nose Rock deposit, uranium occurs in a series of
roll fronts in largely reduced rock.Mineralogical and geological data indicate that relatively ox-
idizing ground waters were associated with the rolls when theywere migrating actively. A change in ground-water regime oc-curring during Dakota time flooded the Westwater Canyon withrelatively reducing waters, which halted roll-front migration andgenerally destroyed macroscopic evidence of oxidation.
Some of the authigenic minerals that are genetically associatedwith roll-front mineralization were unaffected by the reducingevent. Many of these can be concentrated in heavy-mineral sep-arations and used to characterize the geochemical environmentsin which they formed. Geochemical zones associated with the rollfronts are characterized by unique assemblages of authigenicminerals.
A field trial of the heavy-mineral technique demonstrated thatmineralogical criteria applied to cores or carefully collected cut-tings can provide a reliable means of identifying strata traversedby roll fronts; these criteria may be used to guide explorationdrilling in interior portions of the San Juan Basin where uraniumroll-front deposits occur in largely reduced rock.
ReferencesAdams, S. S., Curtis, H. S., and Hafen. P. L., 1974, Alteration of
detrital magnetite-ilmenile in continental sandstones of the MorrisonFormation, New Mexico, in Formation of uranium ore deposits:Vienna, International Atomic Energy Agency, Symposium, p. 219-253
Adler, H. H., 1970, Interpretation of colour relations in sandstone as aguide to uranium exploration and ore genesis, in Uranium explorationgeology: Vienna, International Atomic Energy Agency, Symposium, p.331-344
Cadigan, R. A., 1967, Petrology of the Morrison Formation in the Colo-rado Plateau region: U.S. Geological Survey, Prof. Paper 556, 113 p.
Garrels, R. M., and Christ, C. L., 1965, Solutions, minerals, and equi-libria: New York, Harper and Row, 450 p.
Granger, H. C , 1966, Ferroselite in a roll-type uranium deposit. PowderRiver Basin, Wyoming: U.S. Geological Survey, Prof. Paper 550-C, p.C133-CI37
Harshman, E. N. , 1974, Distribution of elements in some roll-typeuranium deposits, in Formation of uranium ore deposits: Vienna, In-ternational Atomic Energy Agency, Symposium, p. 169-183
Lee, M. J., 1976, Geochemistry of the sedimentary uranium deposits ofthe Grants mineral belt, southern San Juan Basin, New Mexico: Ph.D.thesis. University of New Mexico, 241 p.
Lee, M. J., Mukhopadhyay, B., and Brookins, D. G.. 1975, Clay min-eralogy of uranium-organic enriched and barren zones in MorrisonFormation, Ambrosia Lake district. New Mexico: American Associa-tion of Petroleum Geologists, Bull., v. 59, no. 5, p. 915
Reynolds, R. L., Goldhaber, M. B., and Grauch, R. I., 1977, Uraniumassociated with iron-titanium oxide minerals and their alteration prod-ucts in a south Texas roll-type deposit, in Short papers of the U.S. Geo-logical Survey uranium-thorium symposium, J. A. Campbell, cd.: U.S.Geological Survey. Circ. 753, p. 37-39

208
PETROLOGY OF WESTWATER CANYON MEMBER,MORRISON FORMATION, EAST CHACO CANYON
DRILLING PROJECT, NEW MEXICO—COMPARISONWITH GRANTS MINERAL BELT
by Randall T. Hicks, Robert M. Lowry, Richard S. Delia Valle,and Douglas G. Brookins
Department of Geology, University of New Mexico,Albuquerque. New Mexico 87131
AbstractThe U.S. Department of Energy drilled 15 deep core holes in
the East Chaco Canyon area of the San Juan Basin. The drillingproject covers an area of 300 sq mi (775 sq km) located 40 mi (65km) north of the Ambrosia Lake district. The results of thisreport are based on 47 samples (selected from seven holes) ofWestwater Canyon Sandstone, Morrison Formation (Upper Jur-assic). The 25O-35O-ft (75-100-m) thick Westwater CanyonMember is 80 percent fine- to medium-grained arkosic sandstoneand 20 percent interbedded red and green mudstones. Nine zonesof low-grade uranium mineralization were intercepted by fivedrill holes. The alteration of Westwater Canyon sandstones inthe East Chaco Canyon project area is similar to the alteration ofsandstones near ore deposits in the Grants mineral belt. Magne-tite grains located in and near mineralization display more severedissolution than do grains far removed from mineralization.Typically, clay minerals replace feldspar along cleavages. Awidely observed alteration feature is the dissolution of feldspargrain centers, leaving a thin shell of albite. Authigenic hematiteoccurs in feldspar cleavages and in the matrix of some detritalmudstone clasts. The authigenic clay mineralogy of the 47samples does not vary significantly. Nests of authigenic kaolinitemake up less than 50 percent of the -2 micron fraction. Graincoatings of authigenic chlorite have an edge-to-face or rosettehabit and account for about one-third of the authigenic clayminerals. Mixed-layer illite-montmorillonite also forms graincoatings. Preliminary chemical analyses of the samples indicate alow uranium content in the whole-rock samples (about 2 ppm)and in the -2 micron fraction (about 5 ppm). Thorium averages26 ppm in the -2 micron fraction and 6 ppm in the whole-rocksample. Three features are more similar to ore deposits of theGrants mineral belt than to barren rocks of the Westwater Can-yon Member: 1) dissolution of magnetite is common in EastChaco Canyon cores: 2) authigenic chlorite is abundant in EastChaco Canyon samples; and 3) East Chaco Canyon samples con-tain abundant skeletalized and albitized feldspar grains. Unlikeore deposits of the Grants mineral belt, the East Chaco Canyoncores have a low uranium content and contain little organic car-bon.
IntroductionThe U.S. Department of Energy East Chaco Canyon drilling
project is located in McKinley and San Juan Counties, New Mex-ico, about 40 mi (65 km) north of the Ambrosia Lake mining dis-trict (fig. 1). The drilling project cored the Westwater CanyonMember of the Morrison Formation (Upper Jurassic). The depthof the 15 drill holes ranged from 4,200 to 5,200 ft (1,280-1,580m). This report presents preliminary results of optical and scan-ning electron microscopy, x-ray diffraction analysis, and ura-nium and thorium analysis for 47 samples selected from sevencore holes. Rare-earth and major-element analysis, now in prog-ress, as well as petrographic and geochemical studies of the addi-tional eight core holes will be published later.
ACKNOWLEDGMENTS—We wish to thank the personnel of Ben-dix field operations, Grand Junction, Colorado, for their as-sistance and for providing electric and lithologic logs from thedrilling project at East Chaco Canyon. We also wish to thank ourcolleagues, R. Miller and W. C. Riese, for their contributions tomany discussions during the past months. C. Mora and D. Olivasassisted in several facets of sample preparation and clay separa-tion; W. Mansker helped with the photography. Full financialsupport for the East Chaco Canyon study was provided by theU.S. Department of Energy through contract DOE/BFEC78-249.
Geologic settingThe project area lies on the southern flank of the San Juan
Basin, north of the Chaco slope. Regional strike is N. 30° W.;strata dip is about 4° N. The project area is undisturbed by majorfaults or folds.
Three members of the Morrison Formation are encountered(in ascending order): Recapture Member, Westwater CanyonMember, and Brushy Basin Member. The Dakota Formation(Upper Cretaceous) overlies the Morrison Formation throughoutthe project area.
The Westwater Canyon is 250-350 ft (75-100 m) thick. The unitis 80 percent fine- to medium-grained arkosic sandstones with in-terbedded red and green mudstones composing about 20 percentof the total thickness. The unit is thicker and contains more sand-stone than previous workers have indicated (Saucier, 1976; Kelly,1977).
10 Ml
m PRECAMBRIAN ,_C R O C K S GJ,,, UNDEVELOPED
DEPOSIT, CHACO CANYON
DRILL HOLES
FIGURE 1—INDEX MAP SHOWING LOCATION OF EAST CHACO CANYON
DRILL HOLES AND UNDEVELOPED URANIUM ORE DEPOSITS (afterChenoweth, 1977). CR—Churchrock; SL—Smith Lake; AL—Am-brosia Lake; L—Laguna; CC—Chaco Canyon.

209
Radiometric characterFive holes intersect nine mineralized zones. Eight zones of less
than 2 ft (0.6 m) of 0.015 percent eU,O, occur in the WestwaterCanyon and are either in or adjacent to shale lenses. Fig. 2 showsthe distribution of mineralization in the seven holes studied. Thehighest grade mineralization encountered in the East Chaco Can-yon project (0.11 percent eUiO,) is a 5-ft (2.6-m) thick zone at thebase of a 40-ft (12-m) thick sandstone of the lower Brushy BasinMember. Unmineralized sandstones display a gamma-log signa-ture of about 80 counts per second (cps), slightly more activethan that of Dakota sandstones.
Neutron-activation analyses indicate that the average uraniumvjntent of the -2 micron fraction is about 5 ppm. Whole-rockanalyses average about 2 ppm uranium. An average of 26 ppmthorium occurs in the -2 micron fraction, whereas the whole rockcontains 6 ppm. A thorium-uranium ratio of 3.6 is calculatedfrom 20 whole-rock samples. Unfortunately, both uranium andthorium were not analyzed for the same -2 micron sample; con-sequently, these ratios are not yet available for the -2 micronfraction.
Original sedimentTable 1 summarizes point-count values for 23 thin sections and
presents data from previous work by Cadigan (1967) and Fleschand Wilson (1974). The mineralogy of Westwater Canyon sand-stones of the East Chaco Canyon project is not significantly dif-ferent from that of Westwater Canyon sandstones elsewhere inthe San Juan Basin. Quartz grains typically are unstrained, milkywhite to clear, and subrounded to well rounded. Trace amountsof quartzite and chert are present and are included as total quartzin table 1.
Microcline is the dominant potassium feldspar. Orthoclase,sanidine, and perthite are present in smaller amounts. Albite is
the most common plagioclase present. Some albite may be theproduct of alteration of calcic plagioclase (Adams and others,1978); therefore, albite content may not be representative of theoriginal sediment. Plagioclase of intermediate composition ispresent in minor amounts. Feldspar grains range in size from finesand to granules. Microcline is typically coarser grained thanquartz, whereas plagioclase is finer grained.
Rounded mudstone fragments and irregularly shaped rip-upclasts (Wilson and Pitt man, 1977) are very common in the sand-stones. These lithic grains range in size from 0.5 mm to severalcentimeters. Mudstone clasts deposited in the sandstone are mostcommonly light green. Red mudstone fragments are present onlyin finer grained sandstones that are rich in detrital clay. Themineralogy of the lithics is illite and/or mixed-layer illite-montmorillonite.
Recognizable volcanic grains are rare, and they are partially ortotally replaced by clay minerals. The original amount of volcan-ics in the East Chaco Canyon cores has not been estimated. How-ever, Cadigan (1967) reports a volcanic mode of 8 percent for theWestwater Canyon Member.
Paniculate organic debris is extremely rare. Silicified orcoalified twigs and fine-grained organic-rich horizons are absent.Loss-on-ignition analyses reflect loss of water from clay mineralsrather than from organic carbon.
Alteration of detrital grainsQuartz grains are typically well-developed but unaltered, and
euhedral overgrowths are common. Grain coatings of authigenicclay minerals up to 7 microns thick com lonly occur between theoriginal grain and associated quartz overgrowth. Dissolution ofquartz occurs in areas of abundant calcite cement.
Illite-montmorillonite replacement of microcline and albite isminimal. Other feldspars exhibit a greater degree of clay-mineralreplacement, typically along cleavages.
12 8 3 4 9 5 264050
•« 0.012%
45504300
0.007%
0.012%
«0.052% p
; i - 0.030%
SAN Ml
e_JL_ c
. 9
•NM
0
INI SANDOVALo| co..McKNLEY3. CO.
* " \
I0KM V 6
\
36'
44003850: rO
Kd-l50'
200
400 FT
or 37'
SAMPLE LOCATION— U 30 8 ZONE
JOKM i SHALE- END OF CORE
FIGURE 2—DISTRIBUTION OF URANIUM MINERALIZATION; grade of uranium mineralization (ell ,00 is also plotted.

210
TABLE 1—SUMMARY OF PETROGRAPHY BASED ON POINT COUNTS (n = 400) AND X-RAY-DII-FRACTION STUDIES OF 23 SAMPLES; also included is previous work by Cadigan (1967) andFlesch and Wilson (1974).
detriial minerals
quartz
K-feldspar
plagioclase
hea\y minerals
clay minerals
calcite
anhydrite
pore spaces
authigenic minerals
kaoliniic
chlorite
illitc-montmorillonite
K-feldspar
quart/
this report
59
17
2
trace
9
7
15
10%
5O°'o
20«ij
trace
trace
Flesch and Wilson (1974)
55-80
7-17
5-22
trace
9-31
(matrix)
Cadigan (1967)
67.3
10.5
6.5
trace
5.83.1
(matrix)
A widely observed alteration feaiure in the Easi Chaco Canyonsamples is dissolution of feldspar grain centers (fig. 3). Austin(1963, p. 40) describes hollow feldspar in the Ambrosia Lakedistrict as resembling "hollow ping-pong balls," a descriptionquite appropriate for the East Chaco Canyon samples. The rimsthat survive dissolution are while, extremely fragile, and have auniform thickness of about 0.1 mm. Universal-stage examinationreveals thai the rims are albite. The mineralogy of the originalgrain is unknown.
The most common alteraiion product of magnetite grains is asurfieial coating of hematite. Dissolution of magnetite alongparting planes occurs in many samples. Dissoluiion typically pro-duces a latlnvork of fresh, highly reflective magnetite (fig. 4).Dissolution fea.»ires and hematite coals rarely coexist in the samesample. Unaltered magnetite is uncommon. Microprobe analysisreveals that (he titanium content of the magneiiies is about 2-5percent; as a result, [he alteration of magnetite does not produceauthigenic titanium minerals.
Volcanic lithic fragments consistently are altered to clay min-erals. Mudstone rock fragments appear to resist alteration.
Authigenic mineralsKaolinite, chlorite, and mixed-layer illite-montmorillonite are
(he dominant authigenic minerals. Kaolinite occurs as aggregates
of crystals (nesis) thai fill pores and enclose several grains, andit consisiently covers grain coats cf chlorite and illite-tmnimorillonite. Optical microscopy and x-ray-diffractionstudies indicate that kaolinite averages 10 percent of the clay-mineral fraction.
About 50 percent of the authigenic clay is chlorite. Chloritetypically occurs as well-developed grain coats (fig. 5a, b) in anedge-io-face or a close-spaced rosette habit (fig. 5c). Individualrosettes are common and form on top of—and possibly at the ex-pense of—preexisting clay minerals (fig. 5d). The size of thechlorite crystals (7 microns) permits optical resolution of therosette habit.
Illite-montmorillonite is common in grain coatings both as themajor mineral in detrital mudstone clasts and as an alterationproduct of feldspar grains. llltte-montmorillonite grain coatingshave a honeycomb habit (fig. 6a, b). Fig. 6b shows chlorite thathas formed over unaltered illite-montmorillonite. In this figure,chlorite probably has not formed at the expense of authigenicillite-montmorillonite. The relationship between authigenic illite-montmorillonite and authigenic chlorite needs further study.
Authigenic feldspar often is found as overgrowths on feldspargrain surfaces and as euhedral crystals within the interior ofhollow feldspar grains (fig. 7). The minute size of these crystalsprecludes determination of their composition, but scanning elec-tron microscopy of the euhedral crystals reveals a triclinic habit.
FIGURE 3—HOLLOW FELDSPAR GRAIN IN CENTER; left of center is plagio-clase that is partially replaced by illite-montmorillonite (crossed nicols;long dimension of photograph is 2 mm).
FIGURE 4—MAGNETITE GRAIN SHOWING DISSOLUTION ALONG PARTINGPLANES; reflected light; long dimension of photograph is 0.5 mm.
211
FIGURE 5—a) GRAIN IX)ATINC;S or AUTHUU:NK CHI.ORITI- (plane-
polarized light; long dimension of photograph is 0.34 mm), b) SEMI'HOTOMK'ROCiRAl'H Ol SAMPI L- IN Fill. 5a DISPI AYINCi WKl 1 -HI:Vl:l OPEDcm ORIIT CPRAIN COATINGS; note authigenic quartz crystal in lower rightquadrant, c) SFM PHOTOMICROGRAPH SHOWING -CI OSK-SPA«"E»"
ROSt Til- HAUir. llhST RK'Of.NIZED IN UI'I'liR RICiHT QUADRANT, d) S E M
I'HOTOMK ROORAI'H Ol CHIORITE ROSIiTTIS AND PKFIiXISTlNCi. UNIDliN-
in IIDCI AY MiNiRAi; well-dev loped rosette in upper left quadrant.
\ 4 " ' ^ ^

(B)F1GURF 6—a) S E M PHOIOMKROCiRAPH Ol HONEYCOMB HABIT I L L I T E - M O N T M O R I I I O N I T L GRAIN COATING (CLNTLR) AND CHIORITI- GRAIN COATINGS b)
H l t iH IKMAGMI IC ATIONOI I IG. 6a SHOWlNCi II I HI-MONTMORII 1 ONITt ( OAT1NG ANIK HL ORIT1: I ORMINli OVIR II I ITl -MONTMORIl I ONI I I .
FIGURE 7—SEM PHOTOMICROGRAPH OF AUTHIGENIC FELDSPAR WITHIN AHOLLOW, DETRITAL FELDSPAR GRAIN.
The crystals are probably albite or microcline and often encloseauthigenic clay minerals.
Cubic crystals of authigenic pyrite, ranging in size from micro-scopic to 0.75 cm, are common in green mudstone lenses. In thesandstone, however, pyrite is extremely rare. Four anhedralgrains of pyrite were noted in the 47 thin sections of sandstone.
Authigenic hematite is rare in the sandstone. Typically it oc-curs as: 1) a stain on grain surfaces and on authigenic clayminerals that are adjacent to iron minerals, 2) a stain alongcleavages of unaltered feldspar grains, and 3) minute plate-likecrystals within the matrix of mudstone clasts.
The sandstones are cemented by silica, calcite, anhydrite, andclays. Silica cement usually occurs to the exclusion of calcite oranhydrite. Calcite and anhydrite commonly are present in thesame sample
DiscussionMost alteration studies of the Westwater Canyon Member
were conducted within uranium ore deposits. These studies focusupon alteration features that correlate with ore. The East ChacoCanyon drilling project encountered no ore but did intercept low-grade mineralization. Alteration zones around mineralization arenot as well defined as in the Grants mineral belt.
Alteration of magnetite is associated with mineralization in theEast Chaco Canyon project. The distribution of mineralizationand magnetite alteration is shown in fig. 8. Hole 26 is farthestremoved from known mineralization. The magnetite of the drillcore is either partially altered to hematite or was not originallypresent. Drill holes 3 ,8 , and 12 intercept mineralization. Dissolu-tion of magnetite to lathwork remnants is prevalent in drill cores3, 8, and 4. Dissolution is also observed in the sandstone lensbelow mineralization in hole 12. Unaltered and partially oxidizedmagnetite of hole 12 occurs in sandstone units that may be iso-lated hydrologically from uranium-bearing sands, suggestingthat dissolution of magnetite occurs near mineralization.
Attempts to correlate feldspar alteration with mineralization

213
2 — Kd-1501
200
NM
400
Of 3?'10KM
SAMPLE LOCATION— U3O8 ZONEI SHALE- END OF CORE
FIGURE 8—MAciNimTK ALTERATION: U—unaltered, H—hematite on grain surface, D—dissolution along parting planes, and 0—not originallypresent.
were unsuccessful. Dissolution of feldspar and replacement byclay minerals is common throughout the project area.
The relative amounts of the authigenic clay minerals are con-stant. The preliminary data s> ow no enrichment of chlorite orillite-montmorillonite in or near mineralization.
Trends between alteration and mineralization that are evidentwithin ore deposits of the Grants mineral belt are not as obviousin the East Chaco Canyon project area. However, many altera-tion features of the East Chaco Canyon samples correlate moreclosely with ore deposits than with barren rock far removed fromore.
Several workers (Granger and others, 1961; Nash, 1968; Ken-dall, 1971) have demonstrated that magnetite is absent withinMorrison ore deposits. Cadigan (1967), Flesch and Wilson(1974), and this report, have shown that magnetite is present inunmineralized Westwater Canyon sandstones. Adams and others(1974) have discussed the relationship between the dissolution ofmagnetite-ilmenite g ns and the formation of uranium depos-its. !n their conclusion, Adams and others (1974, p. 247) statedthat total dissolution of iron characterizes magnetite-ilmenitealteration in the vicinity of uranium deposits in Morrison sands.Dissolution of iron in magnetite grains is also common in andnear mineralized zones of the East Chaco Canyon project, al-though total dissolution of magnetite grains is not apparent.
Dissolution of feldspar grain centers has been described in theAmbrosia Lake district (Austin, 1963 and this volume). Austinidentified these hollow shells as low microcline. In East ChacoCanyon samples, albite shells have morphology identical to thislow microcline. In the Laguna district, albite replaces the sur-faces of plagioclase grains, and the centers of these grains oftenare dissolved (Adams and others, 1978). Adams and others(1978) correlated the albitization of detrital feldspar with fluidsrich in Na+ and dissolved organic matter. They suggested that aninterface between fluids rich in Na* and organics and freshmeteoric waters caused precipitation of a tabular zone of car-bonaceous material. Uranium was introduced either with the
organics or at a later time to form a major ore lens in the Jackpilemine. Adams and others (1978, p. 1648) also stated: "The zoneof albitized and skeletalized feldspars . . . is locally presentaway from uranium deposits. It is believed that these isolated oc-currences indicate areas where uraniferous carbonaceous lensesmay have been destroyed. . . . " No other evidence exists to sug-gest that dissolved carbonaceous material was ever precipitatedwithin the Westwater Canyon Sandstone of the East Chaco Can-yon project.
Granger (1962) and Lee (1976) reported an enrichment ofchloritic minerals relative to montmorillonite in ore deposits ofthe Grants mineral belt. Brookins (1976a, b) demonstrated thatthe chlorite/chlorite plus montmorillonite ratio is about 0.8within ore and is 0.4 immediately adjacent to ore. No similarrelationship exists between the East Chaco Canyon mineraliza-tion and adjacent barren rock, but the chloric/chlorite plusmontmorillonite ratio in each drill hole is about 0.7.
Summary1) The detrital mineralogy, lithology, and thickness of the
Westwater Canyon Member of the East Chaco Canyonproject is similar to that of the Grants mineral belt.
2) Complete dissolution of magnetite is not observed as it is inore deposits of the Grants mineral belt. Magnetite locatedin and near mineralization displays more severe dissolutionthan does magnetite far removed from mineralization.
3) The chlorite/chlorite plus montmorillonite ratio in eachdrill hole is more similar to ore-bearing rock of the Grantsmineral belt than to barren rock adjacent to ore.
4) Albite shells and hollow feldspar grains may be related toore-forming processes in the Laguna district (Adams andothers, 1978). Whether similar ore-forming processes wereactive in the Westwater Canyon at the East Chaco Canyonproject area is unknown.
5) The average uranium content of unmineralized whole-rocksamples is about 2 ppm.

214
ReferencesAdams, S. S., Curtis, H. S., and Hafen, P. L., 1974, Alteration of
detrital magnetite-ilmenite in continental sandstones of the MorrisonFormation, New Mexico, in Formation of uranium ore deposits:Vienna, International Atomic Energy Agency, Symposium, p. 219-253
Adams, S. S., Curtis, H. S., Hafen, P. L., and Salek-Nejad, H., 19,8, In-terpretation of postdepositional processes related to the formation anddestruction of the Jackpile-Paguate uranium deposit, northwest NewMexico: Economic Geology, v. 73, p. 1635-1654
Austin, S. R., 1963, Alteration of Morrison Sandstone, in Geology andtechnology of the Grants uranium region, V. C. K;lley, compiler: NewMexico Bureau of Mines and Mineral Resources, Mem. 15, p. 38-44
Brookins, D. G., 1976a, The Grants mineral bell. New Mexico-comments on (he coffinite-uraninite relationship, clay mineral re-actions, and pyriie formation, in Tectonics and mineral resources ofsouthwestern North America, L. A. Woodward and S. A. Northrop,eds.: New Mexico Geological Society, Spec. Pub. 6, p. 158-166
, 1976b, Uranium deposits of the Grams, New Mexico mineralbell: U.S. Energy Research and Developmeni Administration (ERDA),Final Repl. GJO-1636-1, 120 p.
Cadigan, R. A., 1967, Petrology of the Morrison Formation in the Colo-rado Plateau region: U.S. Geological Survey, Prof. Paper 556, 113 p.
Chenoweih, W. L.. 1977, Uranium in the San Juan Basin—an overview:New Mexico Geological Society, Guidebook 28th field conference, p.257-262
Flesch, G. A., and Wilson, M. I)., 1974, Petrography of Morrison For-mation (Jurassic) Sandstone of the Ojito Spring quadrangle, Sandoval
County, New Mexico: New Mexico Geological Society, Guidebook25th field conference, p. 197-210
Granger, H. C , 1962, Clays in the Morris jn Formation and their spatialrelationship to the uranium deposits at Ambrosia Lake, New Mexico:U.S. Geological Survey, Prof. Paper 450-D, p. 15-20
Granger, H. C , Santos, E. S., Dean, b. G., and Moore, F. B., 1961,Sandstone-type uranium deposits of Ambrosia Lake, New Mexico—aninterim report: Economic Geology, v. 56, no. 7, p. 1179-1210
Kelly, T. E., 1977, Geohydrology of the Westwater Canyon Member,Morrison Formation, of the southern San Juan Basin, New Mexico:New Mexico Geological Society, Guidebook 28th field conference, p.285-290
Kendall, E. W., 1971, Trend orebodies of the Section 27 mine, AmbrosiaLake uranium district. New Mexico: Ph.D. thesis, University ofCalifornia (Berkeley), 167 p.
Lee, M. J., 1976, Geochemistry of ihe sedimentary uranium deposits ofthe Grants mineral belt, southern San Juan Basin, New Mexico: Ph.D.thesis, University of New Mexico, 241 p.
Nash, J. T., 1968, Uranium deposits in the Jackpile Sandstone, NewMexico: Economic Geology, v. 63, p. 737-750
Saucier, A. E., 1976, Tectonic influence on uraniferous trends in the LateJurassic Morrison Formation, in Tectonics and mineral resources ofsouthwestern North America, L. A. Woodward and S. A. Northrop,eds.: New Mexico Geological Society, Spec. Pub. 6, p. 151-157
Wilson, M. D.,and Pittman, E. D., 1977, Authigenicclays in sandstones:Recognition and influence on reservoir properties and paleo-environmental analysis: Journal of Sedimentary Petrology, v. 47, no.1,p. 3-31

215
GEOLOGY AND RECOGNITION OF A RELICT URANIUMDEPOSIT IN SEC. 28, T. 14 N., R. 10 W., SOUTHWEST
AMBROSIA LAKE AREA, McKINLEY COUNTYby D. A. Smith and R. J. Pelerson, Teton Exploration Drilling Co., Inc.,
4125 Montgomery Blvd. N.E., Albuquerque, New Mexico 87109
AbstractSandstone uranium deposits in the Morrison Formation (Jur-
assic) within the Ambrosia Lake district, New Mexico, can bebroadly classified into four types, based on their geometry andgenesis: primary (trend), redistributed fracture-controlled(stack), redistributed geochemical-cell-comroUed, and relict(remnant) deposits. Combinations of these deposits can be foundwithin individual orebodies. Many similarities exist among thesetypes of deposits, suggesting the same mechanisms and controlsfor the origin of the deposits. Probably the most important dis-tinguishing control is the position of the deposits relative to thefurthest advance of a pre-Dakota geochemical cell within theMorrison strata. Redistribution of both uranium and humatematerial occurred as oxidizing conditions migrated through thefluvial sediments. The migration of the oxidizing ground waterwas largely controlled by the differences in transmissivitydeveloped within the fluvial facies of the host rock. As a result,remnant zones of primary and redistributed uranium mineraliza-tion have become isolated by hematitic oxidation associated withthe geochemical cell, in localized areas i>( low permeability (lowtransmissivity). These isolated pods of mineralization commonlyoccur in islands of reduced ground and are referred to as relicturanium deposits. The Sec. 28 uranium deposit, southwest of themajor deposits of the Ambrosia Lake district, is here described asa relict uranium deposit. The deposit contains both remnantprimary mineralization and redistributed geochemical-cell-con!rolled mineralization. Localization of the uranium is be-lieved to be controlled mainly by organic accumulationsdeposited adjacent to zones of higher ground-water flow. Preser-vation of the Sec. 28 relict deposit probably was aided by I) therelatively insoluble character of intermixed uranium and organicmatter, 2) lower ground-water transmissivity associated with astratigraphic pinch-out of the mineralized upper Westwater Can-yon, and 3) the influence a set of bounding faults has exhibitedon the ground-water flow pattern since Laramide time. Iron-redox, isopach, and sandstone/mudstone trends observed in theMorrison strata in sec. 28 allow the development of a geneticmodel for relict orebodies within the Ambrosia Lake district.
IntroductionSandstone uranium deposits in the Morrison Formation (Jur-
assic) of the Ambrosia Lake district, New Mexico, can begrouped into four basic types. This classification is based prin-cipally on the geometries and inferred genesis of the deposits.The four types are: primary (also called trend cr prefault) depos-its, redistributed fracture-controlled (also called stack or post-fault) deposits, redistributed geochemical-cell-controlleddeposits, and relict (also called remnant) deposits. Recognitionof the first two types is common in much of the previous liter-ature, especially in Kelley (1963b). The latter two types are moreclosely related to the concept of geochemical-cell-derived depos-its and have not received as much attention in the literature. Anexcellent description and discussion of the trend and stack-oredeposits of the Grants mineral belt can be found in Hilpert(1969).
Reasons for the localization of the four types of sandstone ura-nium deposits are similar; consequently, combinations of thefour are common within an individual orebody. This close gene-
tic relationship can be appreciated when examining the geologyof the uranium deposit located on sec. 28, T. 14 N., R. 10 W. Thesec. 28 uranium mineralization is southwest of the major ura-nium orebodies of the Ambrosia Lake district (fig. I) and isdescribed here as a relict uranium deposit that has beensurrounded by hematitic oxidation produced by a pre-Dakotageochemical cell. Mineralization within the deposit probably rep-resents a combination of remnant-primary uranium and redis-tributed-secondary uranium.
ACKNOWLEDGMENTS—We wish to thank Teton ExplorationDrilling Co., Inc. and UNC Mining and Milling Co. for allowingus to publish this data. Special thanks are extended to R. L.Johnson of Teton Exploration Drilling Co., Inc. and to D. G.Brookins of the University of New Mexico for their valuablediscussions concerning the uranium geology of the Grantsmineral belt. We also wish to acknowledge O. Roybal and R. A.Pinzon for their expertise in drafting the several diagrams ac-companying this paper.
Geologic settingUranium mineralization in sec. 28 is localized within the
fluvial sandstone facies of the Westwater Canyon and BrushyBasin Members of the Morrison Formation (Jurassic). Deposi-tion of the primarily feldspathic to arkosic sand facies was by asystem of aggrading stream channels associated with, an alluvialfan developed adjacent to the Mogollon highland in centralArizona and west-central New Mexico (Cooley ;ind Davidson,1963; Galloway, this volume). Several excellent discussions ofthe Mesozoic stratigraphy of the Grants mineral belt and of theAmbrosia Lake district have been published previously (Hilpert,1963, 1969; Santos, 1963, 1970). Galloway (this volume) has con-sidered the specific depositional environmi • and resultinglithofacies of the Morrison Formation and has peculated abouttheir influence on the ground-water flow patterns.
A thorough review of the Mesozoic stratigraphy of the Am-brosia Lake area will not be discussed herein; only the pertinentstratigraphic relationships in sec. 28 are given. A generalizedstratigraphic column of sec. 28 is illustrated in fig. 2. Included infig. 2 is the sandstone zonation of the Westwater Canyon andBrushy Basin Members used by Teton Exploration Drilling Co.,Inc. The fluvial sandstone facies of the Brushy Basin are in-formally referred to as Poison Canyon sandstones. The UpperJurassic and Cretaceous stratigraphy present in sec. 28 is typicalof the transition from Jurassic fluvial sedimentation to a Creta-ceous transgressive-regressive marine and marginal marine se-quence.
Morrison strata in sec. 28 average approximately 450 ft (137m) and, in ascending order, comprise the Recapture, WestwaterCanyon, and Brushy Basin Members. Brief lithologic descrip-tions of each member are given in fig. 2.
The Dakota Formation (Upper Cretaceous) unconformablyresis on Morrison strata in the Ambrosia Lake area and consistsof approximately 75 ft (23 m) of carbonaceous quartzose sand-stone (fig. 2). Conformably overlying the Dakota is a sequence ofmarine shales and sandstones belonging to the Mancos forma-tion. All drilling in sec. 28 was collared in the lower portion ofthe Mancos.
Structurally, the Grants mineral belt lies on a regional homo-cline referred to as the Chaco slope, which forms the southern

UTAH[COLORADO _ _ _ARIZONA! NEW MEXICO
I• FARMINGTONI BLOCWflELD
GRANTSMINERAL
BELT
•CHURCHROCK DISTRICT
-AMBROSIA LAKE DISTRICT
LAGUNA DISTRICT
BERNALILLO
RIOW
1 HYDRO-NUCLEAR SECTION 12
2 DYSART#I \
3 UNITED NUCLEAR-HOMESTAKE SEC.I5\
4 KERR-McGEE SECTION 22 \\
5 UNITED NUCLEAR-HOMESTAKE SEC.23 x
6 UNITED NUCLEAR-HOMESTAKE SEC. 25 \
7 KERR-McGEE SECTION 24 \
FIGURE I—GENERALIZED LOCATION MAP OF THE SEC. 28 URANIUM DEPOSIT, RELATIVE TO ITS POSITION WITHINTHt GRANTS MINERAL BELT ANDTO SEVERAL OF THE MAJOR AMBROSIA LAKE DEPOSITS.
6
31
Sec.28
3
4 a
a
5a
1
1a
6
I
36
TI4N
flank of the San Juan Basin. The Chaco slope displays a generalnortheasterly regional dip of 2-3° (Kelley, 1963a). Superimposedon this homoclinal surface are a series of north-, northeast-, andnorthwest-trending normal faults (Thaden and Santos, 1963).This structural framework can be attributed to the tectonicsassociated with the Laramide orogeny of Late Cretaceous-earlyTertiary time (Kelley, 1963a). The following references offer amore thorough review of the structural framework of the Am-brosia Lake area: Hilpert and Moench (1960), Hazlett and Kreek(1963), Hilpert (1969), Santos . 1970), and Saucier (1976).
Local structures in sec. 28 c isist of three post-Dakota normalfaults that offset the north-dipping strata (fig. 3). These faultsexhibit varying amounts of throw along their trace, and displace-ments range from 30-110 ft (9-34 m). The observed structures insec. 28 are related to the regional structures associated withLaramide deformation.
As indicated, uranium mineralization in sec. 28 represents arelict deposit. This interpretation of the deposit is based on theobservation that mineralization is surrounded by hematitic ox-idation. The spatial relationship of sec. 28 mineralization to ma-jor uranium deposits of the southwest Ambrosia Lake area andto the furthest advancement of a pre-Dakota geochemical-celliron-redox interface is shown on the West water Canyon iron-redox map for T. 14 N., R. 10 W. (fig. <<).
Relict or remnant mineralization has been recognized for manyyears within the Grants mineral belt; however, little has beenpublished specifically concerning the geology of relict deposits.
MacRae (1963) and Hoskins (1963) reported ore pods sur-rounded by a color halo in the Blackjack Nos. 1 and 2 oredeposits of the Smith Lake area, New Mexico. Brookins (1976)discussed relict uranium mineralization more thoroughly, par-ticularly that of the United Nuclear-Homestake Partners Sec. 23mine (Ambrosia Lake district).
Geology of sec. 28uranium mineralization
Uranium mineralization in the Sec. 28 deposit is foundthroughout the vertical extent of the Westwater Canyon andPoison Canyon intervals (fig. 5). Mineralization is more con-tinuous in the northern half of the section, whereas in thesouthern half the mineralization tends to occur as isolated pods.The deposit probably consists of both primary and redistributedpre-Dakota mineralization, reflecting a polygenetic origin. Con-sequently, understanding the geologic and geochemical factorsinstrumental in both localizing and preserving the uranium min-eralization is important. Emphasis is principally on factors in-strumental in the development of the deposit as a relict uraniumdeposit. All geologic interpretations are based on drill-hole elec-tric logs and samples.
The position of sec. 28 uranium mineralization relative to thepreserved position of a pre-Dakota iron-redox interface was citedearlier as evidence for the relict character of the deposit (fig. 4).Distribution of mineralization within individual stratigraphic
[New Mexico Bureau of Mines & Mineral Resources, Memoir 38,1980]

C/)
oCO
3
MANCOS FORMATION
DAKOTA FORMATION„ UNCONFORMITY
MORRISONFORMATION
BRUSHY
BASIN
MEMBER
WESTWfTER
CANYON
MEMBER
POISONCANYON
20
POISONCANYON 10
D ZONE
C ZONE
B ZONE
A ZONE
RECAPTURE
MEMBER
MARINE SLACK SHALEWITH LIGHT COLOREDFINE GRAINED MARINESANDSTONE BEOS
\ LIGHT GRAY OR TAN< SANDSTONE WITH INTER-1 BEDDED BLACK SHALE.
- J MARINE OR NEAR SHORE.OCCASIONAL LIGNITE BEDS
GREEN MUDSTONE WITHINTERBEDDEO CHERTLIMESTONE SCOURSFILLED WITH SANDSTONEAND ARKOSE
LIGHT GRAY ARKOSICSANDSTONE W/GREENMUDSTONE BEDSPYRITE OR HEMATITECOMMON DEPENDINGON REDOX CONTAINED
MOTTLED RED MUDSTONE
OR SILTSTONE
FIGURE 2—GENERAL STRATIGRAPHIC COLUMN DEPICTING THE JURASSIC-CRETACEOUS STRATIORAPHV WITHIN SEC. 28, T. 14 N., R. 10 W.
zones, when superimposed on the iron-redox pattern, also sup-ports a relict interpretation for the mineralization. The iron-redox patterns depicted in figs. 6 through 9 are defined by thepresence of hematite (oxidized iron) as observed in drill cuttingsfrom each stratigraphic zone. The observed iron-redox patternson sec. 28 resulted from the northward migration of a pre-Dakota geochemical cell (Peterson, this volume). Some post-Laramide modifications of the pre-Dakota mineralization haveundoubtedly occurred, especially since a substantial proportionof the mineralization presently lies above the static ground-watertable. We believe that the effects of this more recent oxidationwere not instrumental in creating the Sec. 28 deposit as a relictdeposit.
Poison Canyon 10 iron-redox patternUranium mineralization within the Brushy Basin strata of sec.
28 is mainly restricted to the lower of the two Poison Canyonsandstone lenses, the Poison Canyon 10. The iron-oxidation stateand distribution of mineralization is given in fig. 6. The mineral-ization is localized dominantly within reduced ground. Isopachdata from both sec. 28 and the adjacent section to the north (sec.21) indicates a stratigraphic thinning of the Poison Canyon 10unit in the area of the mineralized, reduced ground. Lowerground-water transmissivity due to this thinning may account forthe preservation of mineralization within the reduced ground.Not all of the Poison Cany.*' 10 mineralization, however, is
[New Mexico Bureau of Mines & Mineral Resources, Memoir 38,1980]

218
Contour IntervalNormal Fault
Structure Contour Line
Top of Dakota Formation o' eoo'
FIGURE 3—STRUCTURE CONTOUR MAP OF SEC. 28, T. 14 N., R. 10 W., DRAWN ON THE TOP OF THE DAKOTAFORMATION (CRETACEOUS) AND DISPLAYING THREE POST-DAKOTA NORMAL FAULTS.
associated with reduced ground; several small pods of mineral-ization occur in the oxidized portions of the Poison Canyon 10(fig. 6).
Westwater Canyon D-C zone iron-redox patternThe D-C zone displays a similar iron-redox pattern as the
previously discussed Poison Canyon 10 sandstone (fig. 7). Thereduced ground in the D-C zone extending north into sec. 21 isprobably related to a stratigraphic thinning and pinch-out of theinterval (fig. 5). This thinning is well depicted on the D-C isopachmap discussed below. Substantially more D-C mineralization oc-curs in oxidized ground than does the overlying Poison Canyon10 mineralization.
Westwater Canyon B zone iron-redox patternThe iron-redox pattern and mineralization for the B zone is
shown in fig. 8. The area of B mineralization is significantlylarger than the overlying zones discussed above. The B zone alsocontains a greater proportion of mineralization localized in ox-idized ground. This could indicate that prior to encroachment ofoxidation related to the pre-Dakota geochemical cell, the B-zonemineralization was considerably more extensive and continuousthan the present pattern.
When data from sec. 21 is included (fig. 4), one can see that thereduced B zor - in the northeast quarter of the section actually isan island of reduced ground surrounded by a sea of oxidation.
Westwatei Canyon A zone iron-redox patternThe lowest Westwater Canyon unit, the A zone, is oxidized
everywhere on sec. 28 (fig. 9). The observed mineralization pat-tern for the A zone suggests that the mineralization was probablyalso continuous prior to geochemical-cell oxidation.
These redox patterns of the Westwater Canyon and PoisonCanyon sandstones suggest that, even though considerableamounts of primary mineralization have been redistributed, atleast remnants of primary mineralization and redistributedmineralization have been armored in some fashion from the en-croachment of geochemical-cell oxidation.
In order to understand what has preserved the mineralizationon sec. 28 from remobilization by geochemical-cell oxidation, anunderstanding of the major controls of precipitation for both theprimary and the redistributed mineralization is helpful.
The dominant control for the localization of the primary(trend) deposits in the Ambrosia Lake area is believed to be thesedimentary trends developed within the Morrison Formation(Granger, 1968). Justification for this conclusion includes theknowledge that primary ore trends in the district parallel thedepositional trends of the host sandstone. Carbonaceous debrisand its derivatives have also played a vital role in the precipita-tion of the primary mineralization (Granger, 1968; Granger andothers, 1961; Erookins, 1977).
Redistributed (geochemical-cell) deposits are also closely con-trolled by facies relationships developed within the host sand.
219
6
s<
31
OXIDIZE
ction 28
0
Jgp|
V/
\ REDU
V
1
CED
' • • *
"x."V
36
Q OXIDIZED IRON
@ URANIUM DEPOSITS
F I G U R E 4—GLNbKAl I/ED IRON-REDOX MAP Ol THE WESTWATER CANYON SANDSTONE WITHIN T. 14 N . , R. 10 W . , IM'ltTIN«.POSITIONS OF THE MAJOR TREND DEPOSITS AND THE SEl . 28 DEPOSIT RELATIVI: TO THE REGION AIIRON-Rl » O \ INTLRhAt I-
The importance of these relationships is their influence onground-water flow patterns. Contrasts in porosity and per-meability, and hence in transmissivity, developed within thedifferent fluvial facies of the Morrison strata and strongly in-fluenced the ground-water flow pattern. Ground water is thetransporting medium for an expanding geochemical cell; conse-quently, understanding its control of mineralization is critical tofurther understanding the localization of redistributed uranium.Ground-water flow patterns within the Westwater Canyon in sec.28 can be inferred from examination of isopach and sandstone/muds tone ratio data.
Westwater Canyon isopachExcellent control provided by the extensive drilling completed
on sec. 28 allowed for the construction of a detailed isopach mapof the Westwater Canyon interval (fig. 10). Thickness variationfor the Westwater Canyon ranges from 180 to 263 ft (50 to 80.m).Thin zones—less than 220 ft (68 m)—are indicated in fig. 10. Themost obvious trend is the inferred channel thalweg (line of max-imum thickness) that trends northeast across the northern half ofthe section. This thalweg is surrounded on all sides by local thin-ning and appears to bifurcate in the northeast quarter of theproperty. Based on the observed isopach trend and regional con-siderations, a northeast to east ground-water flow direction isinferred. A significant proportion of the Westwater Canyon min-eralization occurs in close proximity to this depositional andground-water flow trend.
Westwater Canyon sandstone/mudstone ratioThe sandstone/mudstone ratios for the Westwater Canyon
have been incorporated into a contour map (fig. 11). Ratiosrange from a high of 16 to a low of 3, a significant variation invalues.
The most significant trend in fig. 11 is the marked increase inmudstone content along the northern border of the property.This area, perhaps a channel margin, probably has acted as afavorable site for localization of redistributed uranium. A regionof preferred ground-water flow similar to that inferred from theisopach data can be interpreted from the sandstone/mudstoneratios (fig. 11). This easterly trend is the site of the principal oc-currences of upper Westwater Canyon (D-C zone) mineraliza-tion.
Ore controlsDifferentiation between primary (trend) uranium and secon-
dary (redistributed) uranium was not possible during the presentstudy. Primary mineralization probably was precipitated at sitesof organic accumulations along depositional trends preserved inthe Morrison strata. Shaping of the primary deposits was in-fluenced by the shape of the humate accumulations (Squyres,1972; Leventhal and Threlkeld, 1978) and/or by localized inter-formational disconformities and scour surfaces (Granger andothers, 1961). Granger and others also observed that primary

220
AT-372 T-476 T-305 T-312 T-493 T-519 T-76
AB-29
IDKO
Oin
JUR
AS
JPP
ER
DAKOTAFORMATION
C
1a
zV.accco
BRUSHY
MEMBER
WESTWATERCANYONMEMBER
RECAPTUREMEMBER
"*—" *
. i i.. I I • ' ';•,-
= = _ ...
,i ' :-t
' . • • - ^
: "•':• . - . . ,
Kd
i8i|-;i
faiyg
\-•!•••• . ; j i?W: IV : . rS I i r : W
fmrc
' ' • : • ' • • • • - • . . i i : . ' • . ' • • .
•' ' .•'-' :. - : ^ . ; ^ i - - :":" • -
- , , ' " ~
:v ' *; '-m
™ H I .PIM.*
-W:;'--- '.'••-0 :;.;i
! : : = v ; ; •...••?;.'•'.!•'•:• •. - } ; - ^. • , . • ; • • . - . . : • - ; • • ; • . . • • • • • • . . - . - •
DATUM TOP OF DAKOTA FORMATION LEGEND1 1 MARGINAL MARINEi I QUARTZOSE SANDSTONE
SECTION 21 r ^SCALE LJ
HORIZONTAL l"=8OO'VERTICAL |"=I6O [ " I MUDSTONE
FLUVIAL ARKOSIC SANDSTONE
SECTION 28URANIUM MINERALIZATION
FIGURE 5—NORTH-SOUTH STRATIORAPHIC CROSS SECTION A-A' SHOWINCJ CENERAL STRATIORAPHIC DONATION OK THE MORRISON
FORMATION (JURASSIC) AND LOCALIZATION OF URANIUM MINERALIZATION.
FIGURE 6—POISON CANYON 10 ZONE IRON-REDOX MAP INDICATING THATTHE URANIUM MINERALIZATION IS PRINCIPALLY LOCALIZED IN REDUCEDGROUND; only small pods of mineralization are found in the oxidized(hematitic) ground (see fig. 7 for symbols and scale).
1 MINERALIZATION*.
e a i.o'-.02 e u3o8
[—j OXIDIZEDL_J (Hematite Iron)
I—I REDUCEDI | (Pyntic Iron)O' 1400'I I
FIGURE 7—WESTWATER CANYON D-C ZONE IRON-REDOX MAP INDICATING
THAT THE MINERALIZATION IS FOUND IN BOTH OXIDIZED AND REDUCEDGROUND.

221
I OXIDIZEDI (Hematite Iron)
I—I REDUCEDI I (Pyritic Iron)
0' 1400'I 1
FIGURE 8—WESTWATER CANYON B ZONE IRON-REDOX MAP INDICATINGTHAT APPROXIMATELY 75 PERCENT OF THE MINERALIZATION IS SUR-ROUNDFD BY OXIDIZED (HEMATITIC) GROUND (see fig. 9 for symbols andscale).
FIGURE 9—WESTWATER CANYON A ZONE IRON-REDOX MAP INDICATINGTHAT THE MINERALIZATION IS ENTIRELY SURROUNDED BY OXIDIZED(HEMATITIC) GROUND.
FIGURE 10—WESTWATER CANYON ISOPACH MAP OF SEC. 28, T. 14 N., R. 10 W., DISPLAYING A THALWEGTRENDING NORTHEAST ACROSS THE SECTION; stippled areas depict Westwater Canyon thicknesses less than orequal to 220 ft.

222
FIGURE 11— WiisrWATtR CANYON SANDSTONE MUDSTONb RATIO MAP <»• s tc . 28, T. 14 N., R. 10 W., SHOW-
ING NURI HiASrERi > TotAsikRi.Y TRINDS; stippled areas define zones of higher mudstone contem.
mineralization commonly is localized in the thicker portions ofthe Westwater Canyon interval. This relationship appears to holdfor the mineralization within the B and A zones of the WestwaterCanyon in sec. 28.
A closer examination oi the D-C zone mineralization will de-velop a model for the relict character of the Sec. 28 deposit. TheD-C zone is a relatively easy interval to identify on electric logs, afact which allows construction of isopach and sandstone/mudstone ratio maps for the interval. The D-C isopach map isgiven as fig. 12. Thickness of the sandstone facies of the D-Czone ranges from 9 to 70 ft (3 to 1 m), and this variation is pro-duced by a significant stratigraphic thinning of the sands in anortherly direction (fig. 5). The D-C sands completely pinch outwithin the southern portion of sec. 21, located immediately to thenorth. The distribution of D-C mineralization has been super-imposed on the isopach map (fig. 12) and indicates a good cor-relation between mineralization and areas of thin sandstone,which are those of less than 40 ft (13 m). The area containing theD-C mineralization probably represents a depositional environ-ment marginal to a main thalweg of the D-C channel system.Concentrations of redistributed and/or primary uranium in thisarea of D-C thinning are interpreted as being related to sta-tionary sites of reduction created by accumulations of humatematerial.
Sandstone/mudstone ratios for the O-C. interval provide addi-tional support for the theory that this zone of thinning representsa zone of lower permeability and lower transmissivity (fig. 13).In the area where the D-C interval is thinning, sandstone/mudstone ratios indicate an increasing proportion of mudstone.
The distinct increase in mudstone is directly related to the pinch-ing out of the sandstone facies of the D-C interval. Permeabilityin this location would be significantly reduced, creating afavorable site for the entrapment and preservation of humatematerial and uranium. Superimposilion of the D-C mineral trendon the sandstone/mudstone ratio map in fig. 13 indicates that amajor proportion of the D-C mineralization lies in the areas ofhigher mudstone content.
The major controls for the precipitation of both primary andredistributed uranium show a close relationship. Primary min-eralization was controlled by humate masses distributed alongdepositional trends within the Morrison strata. Oxidation relatedto a geochemical cell caused remobilization of much of the up-gradient primary mineralization and redeposited it in sites ofhumate accumulations in overbank and/or channel-marginfacies in proximity to iron-redox interfaces.
Genesis of Sec. 28 relict uranium depositDeposition of primary (trend) mineralization in sec. 28 oc-
curred shortly after deposition of the host sands, probably some-time during late Brushy Basin sedimentation. This conclusion issupported by recent geochronologic studies, which date authi-genic clay minerals genetically associated with primary uraniummineralization at 135 ± 10 my. (Brookins, 1977). Prior to Da-kota deposition, regional tilting of the Jurassic strata to the northoccurred (Hilpert, 1969). Truncation of Morrison strata gener-ated new recharge areas south of sec. 28, and migration of theoxidizing ground water created a geochemical cell which re-

223
800D-C Mineralization Contour Interval. I01 ?(al ' - .02%eU308 )
D-C Zone thinned areas are * 4 0 '
FIGURE 12—ISOPACH MAI> OF THE WESTWATER CANYON D-C ZONE ON SEC. 28, T. 14 N., R. 10 W, showing
the distribution ol D-C zone mineralization relative to the northerly thinning of the unit.
mobilized both humate material and uranium. The remobilizedhumate material was reprecipitated at sites of lower ground-water flow in overbank and channel-margin fa:ies. Dissolveduranium in the ground water was precipitated at these same sitesof reduction lo form redistributed deposits in proximity to iron-redox interfaces. In sec. 28, the eventual encroachment ofgeochemical-cell oxidation on preexisting primary and redistrib-uted mineralization led to a partial destruction of the mineraliza-tion. Oxidizing ground water moved rapidly through the thicker,cleaner sands of the Westwater Canyon, but it migrated moreslowly into the less permeable overbank and channel-marginfacies. This lower ground-water transmissivity within the area ofthinning and higher mudstone content greatly aided in protectingthe associated uranium mineralization from the attack of oxida-tion. The relative insolubility of the organic material that concen-trated the uranium also may have aided in the preservation of themineralization (Leventhal, this volume).
By Dakota time, the major geochemical-cell iron-redox inter-face had migrated through sec. 28. (Mapping of Dakota sedi-mentation over the Morrison outcrop sealed the recharge area,halting and preserving the interface relative to the major Am-brosia Lake mineral trends (fig. 4). After the pre-Dakotageochemical-cell oxidation, more recent oxidation remobilizedportions of the uranium deposit. However, no obvious relocal-ization of mineralization along the thres Laramide-age faults onsec. 28 has been observed. In fact, these faults have probablyaided the preservation of this mineralization. Post-Laramide
ground-water flow patterns probably have been modified by thepresence of these faults. Higher ground-water flow rates existalong these fractured areas, which can indirectly shield themineralization from remobilization.
A three-stage diagram representing the important events ofmineralization in sec. 28 is shown in fig. 14. Stage I depicts theprecipitation of primary uranium along depositional trends in theMorrison strata during Brushy Basin time. Stage II represents thetilting of the Jurassic strata and generation of the pre-Dakotageochemical cell. During this time, major redistributed depositsformed proximal to the geochemical-cell iron-redox interface.Stage III represents post-Dakota time and indicates burial ofMorrison recharge areas, which halted the migration of the geo-chemical cell. By this time the geochemical-cell iron-redox fronthad migrated beyond sec. 28, preserving the mineralization as arelict uranium deposit.
ConclusionsUranium deposits in sec. 28 are of polygenetic origin, begin-
ning with primary deposits formed parallel to depositional trendsin Morrison strata during Westwater Canyon and Brushy Basintime. During pre-Dakota erosion, a geochemical cell advancedfrom Morrison outcrops down the hydrologic gradient generatedby regional northerly tilting of the strata.
Migration of this geochemical cell formed redistributed ura-nium deposits in sec. 28. The primary ore control was thelocalization of humate masses within the host rock. Continued

224
D-C Minerolization (a)1-.02% eU3OQ)
D-C Zone higher shale content oreos o r e s 2
800—i
FIGURE 13—SANDSTONE/MUDSTONE RATIO MAP OF THE WESTWATER CANYON D-C ZONE, showing distributionof D-C zone mineralization relative to the higher mudstone-contenl areas.
advancement of the geochemical cell resulted in these depositsbeing completely surrounded by oxidation. The mineralizationpresent today represents remnant portions of the originalprimary deposit, as well as redistributed deposits.
Preservation of this relict mineralization resulted from thefollowing factors:
1) Much of the preserved mineralization is found in overbankand channel-margin facies of the Morrison fluvial system.Oxidizing ground water moved rapidly in the thicker,cleaner sands of the thalweg of the fluvial system, butmigrated more slowly into the less permeable overbank andchannel-margin facies. These transmissivity differenceswere instrumental in both the precipitation and the preser-vation of the uranium mineralization, owing to their in-fluence on the migration of ground waters.
2) The relative insolubility of the organic materials andassociated uranium, which represent a major portion of the
uranium mineralization in the Grants mineral belt, contrib-uted to the preservation of the Sec. 28 relict uraniumdeposit. This increased insolubility of uranium is believedto be a function of aging and radiation damage of theorganic carbon associated with uranium mineralization.
3) Initiation of Dakota sedimentation sealed the recharge areaof Morrison aquifers south of sec. 28. By this time, thegeochemical-cell iron-redox interface had migrated pastsec. 28 to its present preserved position in the AmbrosiaLake district. This effectively halted processes related tothe geochemical cell, resulting in preservation of the re-maining uranium mineralization.
4) Laramide-age faults and associated fractures generatedsecondary permeability passageways that influenced post-Laramide ground-water flow patterns, thereby causingsome isolation of uranium mineralization from post-Lararnide oxidation.

225
STAGE IBRUSHY BASIN TIME
-175
350'
Primary mineralization localized along Morrisondepositional trends.
STAGE EPRE-DAKOTA TIME
Regional tilting to the North generatnd Morrisonoutcrops and geochemical cell redistributed depositsformed proximal to iron redox interfaces.
STAGE HIPOST-DAKOTA TIME
I SEC.I28
DAKOTA
Deposition of the Dakota halted geochemical calloxidation and preserved relict uranium mineralizationon Section 28.
FIGURE 14—IDEALIZED GENETIC MODEL FOR RELICT URANIUM DEPOSITS ONSEC. 28, T. 14 N., R. 10 W. Stage I represents Brushy Basin time andthe precipitation of primary mineralization along Morrison deposi-tional trends; stage II occurs during pre-Dakota time and indicatesregional tilting to the north, which generated Morrison outcrops; at thistime, geochemical redistributed deposits formed in proximity to iron-redox interfaces; stage III represents post-Dakota time and indicatesthat the deposition of the Dakota Sandstone halted the migration of thegeochemical cell and preserved relict uranium mineralization on sec.28.
ReferencesBrookins, D. G., 1976, Position of uraninite and/or coffinitc accumula-
tions to the hematite-pyrite interface in sandstone-type deposits: Eco-nomic Geology, v. 71, p. 944-948
, 1977, Uranium deposits of the Grants mineral belt: geochemicalconstraints on origin: Rocky Mountain Association of Geologists,Symposium, p. 337-352
Cooley, M. E., and Davidson, E. S., 1963, The Mogollon highlands—their influence on Mesozoic and Cenozoic erosion and sedimentation:Arizona Geological Society, Digest, v. 6, p. 7-33
Granger, H. C , 1968, Localization and control of uranium deposits inthe southern San Juan Basin mineral belt. New Mexico—an hypothesis:U.S. Geological Survey, Prof. Paper 600-B, p. B60-B70
Granger, H. C , Santos, E. S., Dean, B. G., and Moore, F. B., 1961,Sandstone-type uranium deposits at Ambrosia Lake, New Mexico—aninterim report: Economic Geology, v. 56, no. 7, p. 1179-1210
Hazlett, G. W., and Kreek, J., 1963, Geology and ore deposits of thesoutheastern part of the Ambrosia Lake area, in Geology and technol-ogy of the Grants uranium region, V. C. Kelley, compiler: New MexicoBureau of Mines and Mineral Resources, Mem. 15, p. 82-89
Hilpert, L. S., 1963, Regional and local stratigraphy of uranium-bearingrocks, in Geology and technology of the Grants uranium region, V. C.Kelley, compiler: New Mexico Bureau of Mines and Mineral Re-sources, Mem. 15, p. 6-18
, 1969, Uranium resources of northwestern New Mexico: U.S.Geological Survey, Prof. Paper 603,166 p.
Hilpert, L. S., and Moench, R. H., I960, Uranium deposits of the south-ern part of the San Juan Basin, New Mexico: Economic Geology, v. 53,no. 3, p. 429-464
Hoskins, W. G., 1963, Geology of the Black Jack No. 2 mine, SmithLake area, in Geology and technology of the Grants uranium region,V. C. Kelley, compiler: New Mexico Bureau of Mines and MineralResources, Mem. 15, p. 49-52
Kelley, V. C , 1963a, Tectonic setting, in Geology and technology of theGrants uranium region, V. C. Kelley, compiler: New Mexico Bureau ofMines and Mineral Resources, Mem. 15, p. 19-20
, compiler, 1963b, Geology and technology of the Grants uraniumregion: New Mexico Bureau of Mines and Mineral Resources, Mem.15,227 p.
Levemhal, J. S., and Threlkeld, C. N., 1978, Carbon-I3/Carbon-12isotope fractionation of organic matter associated with uranium oresinduced by alpha irradiation: Science, v. 202. p. 430-432
MacRae, M. E., 1963, Geology of the Black Jack No. 1 mine, Smith Lakearea, in Geology and technology of the Grants uranium region, V. C.Kelley, compiler: New Mexico Bureau of Mines and Mineral Re-sources, Mem. 15, p. 45-48
Santos, E. S., 1963, Relations of ore deposits to the stratigraphy of hostrocks in the Ambrosia Lake area, in Geology and technology of theGrants uranium region, V. C. Kelley, compiler: New Mexico Bureau ofMines and Mineral Resources, Mem. 15, p. 53-59
, 1970, Stratigraphy of the Morrison Formation and structure ofthe Ambrosia Lake district. New Mexico: U.S. Geological Survey,Bull. 1272-E,27p.
Saucier, A. E., 1976, Tectonic influence of uraniferous trends in the LateJurassic Morrison Formation, in Tectonics and mineral resources ofsouthwestern North America: New Mexico Geological Society, Spec.Pub. no. 6,218 p.
Squyres, J. B., 1972, Uranium deposits of the Grants region, New Mex-ico: Wyoming Geological Association, Earth Science Bull., v. 5, p. 3-8
Thaden, R. E., and Santos, E. S., 1963, Map showing the general struc-tural features, in Geology and technology of the Grants uraniumregion, V. C. Kelley, compiler: New Mexico Bureau of Mines andMineral Resources, Mem. IS, p. 20

REDISTRIBUTED OREBODIES OF POISON CANYON,SEC. 18 AND 19, T. 13 N., R. 9 W., McKINLEY COUNTY
by Timothy Neal Tcssendorf, Reserve Oil and Minerals Corporation,P. O. Box 546, Grants, New Mexico 87020
AbstractSince the early 1950's, the Poison Canyon mine has been con-
sidered a classic example of uranium geology. Owing to presenteconomic conditions, a close examination of the redistributedmineralization is taking place. Because of the evolution of (hestructure and geomorphology of Poison Canyon, the primarymineralization went through further oxidation and reduction.Enriched solutions of uranium migrated downdip through per-meable sands. These solutions were controlled by north-trendingfracture patterns, with some vertical movement along majorfaults. The uranium collected in structural and lithological traps,forming amoeba-like orebodies with the higher grade mineraliza-tion located in the fractures. Firsi-generation redistributed ore isprimarily coffinite. Forming later is second-generation redistrib-uted ore, which is mainly tyuyamunite. The latter formed fromfurther oxidation and redistribution of the primary and first-generation mineralization, combined with an increasing nearnessto surface. The authigenic minerals in the redistributed mineral-ization are found in carbon-deficient sands. The redistributedminerals are locally associated with pascoite, although thismineral is rare. The radiometric equilibrium of the primaryminerals differs from that of the redistributed minerals. The ura-nium has been leached from the primary minerals making chem-ical values less than radiometric values. The redistributedminerals are chemically greater than radiomeiric, producing afavorable equilibrium. The percent extraction in the mill processis greater for the redistributed ore than for the primary ore. Theparagenetic position of the different minerals has a direct bearingon these observations.
IntroductionOrebodies located by Reserve Oil and Minerals Corporation
were drilled in the spring and summer of 1976. Because earlieroperators had mined out most of the higher grade primary min-eralization, 217,000 ions at 0.23 percent UjO», Reserve intendedto locate lower grade redistributed mineralization that wasknown to exist in the area. Economic factors had discouragedearlier interest in this type of mineralization. The shallow depthto the ore horizons, 140-190 ft (43-58 m), and the accessibility ofthese horizons through the original portal of the Poison Canyonmine led Reserve to reopening the first underground mine in theGrants district.
ACKNOWLEDGMENTS—I wish to express special appreciation toHarlen Holen and Bob Nakaoka for help in locating copies ofprevious investigations. I thank Nick Ferris, whose pertinentdata helped in the descriptions of the sandstones and minerals,and S. H. Grundstedt, whose time and effort helped solve theradiometric-disequilibrium problems at Poison Canyon.
StratigraphyThe Morrison Formation, first described by Cross and Em-
mons (1896), has been studied intensively throughout the Colo-rado Plateau region. Important investigations include those ofRapaport and ethers (1952), Craig and others (1955), and Free-man and Hilpert (1956). These investigations showed that theMorrison of the Grants region may be divided into the Recap-ture, Westwater Canyon, and Brushy Basin Members, althoughthe Salt Wash Member, present elsewhere in the Colorado Pla-
teau, is absent in this region. The following description is of theupper Morrison, which includes the Brushy Basin Member andthe informal Poison Canyon sandstone. The descriptions aretaken from underground samples in the redistributed orebodiesand drill-hole lithologies.
Dakota SandstoneunconformityBrushy Basin Shale—65-75 ft (20-23 m); light-green variegated
mudstone, occasional reddish-brown mudstone near baseupper Poison Canyon sandstone—20-30 ft (6-9 m); slightly
yellowish-gray lo medium-gray, fine- to medium-grainedsandstone. Grains largely consist of quartz and microcline,with lesser plagioclase and volcanic fragments; wellcemented by calcite. Steep to low-angle, fluvial crossbed-ding; numerous scours filled with coarse-grained sandstone.Occasional mudstone galls and thin, discontinuous mud-stone lenses. Petrified logs and dinosaur bones rare
middle shale—0-15 ft (0-5 m); light-green variegated mud-stone, occasional sandy lenses
lower Poison Canyon sandstone—25-40 ft (8-12 m); slightlyyellowish-gray to medium-gray, fine- to medium-grainedsandstone. Grains mostly quartz, with lesser microcline,plagioclase, and volcanic fragments. Interstitial clay promi-nent; some areas contain no cement, while others are partial-ly cemented by calcite. The basal 2 ft (0.6 m) is a calcareoussandstone or hard pan. Steep to low-angle, fluvial crossbed-ding; numerous scours filled with coarse-grained sandstone.Occasional mudstone galls and thin, discontinuous mud-stone lenses. Petrified logs and dinosaur bones rare
lower shale—15-25 ft (5-8 m); light-green variegated mudstoneWestwaler Canyon Sandstone
The average thickness of the Poison Canyon sandstone is 55-75ft (17-23 m), but it does thicken to as much as 90 ft (28 m). Ap-proximately 50 to 75 percent of the unit is medium to coarsesand. More detailed descriptions of the Poison Canyon sand-stone may be found in reports by Konigsmark (1958) and Rapa-port (1963).
StructureThe Poison Canyon area is located on the Chaco slope on the
southern margin of the San Juan Basin. The Zuni uplift to thesouth is a northwest-trending elongate dome with a gently dip-ping, locally faulted eastern flank. Most of the faults strikeslightly west of north or slightly north of east; dips are high angle(Gilkey, 1953). Major uplift is believed to have occurred fromLate Cretaceous until late Miocene (Rapaport and others, 1952).
The Poison Canyon area is associated with a large synclinestriking N. 50° E., broken along its axis by the San Mateo fault.Displacement is approximately 250 ft (77 m). This fault roughlyfollows the location of NM-53 (Rapaport, 1963). The PoisonCanyon fault is the major one at the mine, with a displacement ofapproximately 35 ft (11 m). This normal fault strikes N. 10° W.and dips steeply to the east. It is located in the east halves of sees.18 and 19. Several minor faults and dense jointing are associatedwith the Poison Canyon fault; all have the same northerly strike(Konigsmark, 1958). The redistributed orebodies of Poison Can-yon have a definite elongation along the direction of principalfracturing, as shown in fig. 1 (Rapaport, 1963).
[New Mexico Bureau of Mines & Mineral Resources, Memoir 38,1980]

227
THE ORE BODIES
OF POISON CANYON
AND ASSOCIATED
FRACTURES
LEGEND
PRIMARY
TREND ORE
FIRST GENERATION
REDISTRIBUTED ORE
SECOND GENERATION
REDISTRIBUTED ORE
MAJOR FRACTURES
/ ,. d BASAL CONTACT OF' '", . DAKOTA SANDSTONE
SECTION LINE
400 ft
FIGU RE 1 — T H E OREBODIES OK POISON CANYON AND ASSOCIATED FKACTURts.
Environment of depositionDeposition of the Poison Canyon sandstone occurred in a
broad continental basin of low relief. Sediment came from alocal granitic highland in west-central New Mexico (Craig andothers, 1955). The sandstone was deposited by braided streams;crossbedding indicates the channels flowed east-northeast(Konigsmark, 1958). The Poison Canyon tongue itself is orientedin this same east-northeast direction. The Poison Canyon sand-stone is coarser than the Westwater Canyon, as two-thirds of theunit is medium grained or coarser (Konigsmark, 1958).' The nu-merous fossilized logs and abundant carbonaceous debris associ-ated with the channels indicate the Poison Canyon sandstonepossibly was deposited during flood stage in the Jurassic basin(Rapaport, 1963).
The upper portion of the Morrison received a considerablecontribution of pyroclastic debris (Rapaport and others, 1952).Textures and permeability of these pyroclastic sediments, in theearly stages, permit movement of ground water. Because of rapidleaching and alteration of these sediments, many metals wouldhave been released to solution (Gruner, 1956). The poor drainage
of the basin allowed pore waters to remain in the beds and leach-ing to continue until the sediments were altered to bentoniticmudstones (Gruner, 1956).
Redistributed orebodiesMineralization
The orebodies delineated during development drilling atPoison Canyon are remobilized from the primary, trend type ofmineralization that is extensively developed elsewhere in theGrants region. Study of exposures within the newer workings ofthe Poison Canyon mine has led to an interpretation of the se-quence of events causing redistribution.
The redistributed ores reflect two different types of mineraliza-tion, one largely coffinite and the other oxidized tyuyamunite.The redistributed ores show definite control by the north-south-trending fractures. Ore occurs in two distinct horizons: an upperore horizon located just above the middle shale and a lowerhorizon located immediately above the lower shale unit in the up-per part of the Morrison. The average thickness of the ore

228
horizons is approximately 9 ft (2.8 m), with ore as thick as 15-25ft (4.6-7.7 m) occurring in local scours filled by the sandstoneunit. The grade-thickness intercepts (in feet) encountered duringdrilling were low (0.3-0.5 ft-percent U3O1) relative to previousmine economics. However, higher concentrations of minerals inthe fractured areas cause intercepts of 0.5 ft-percent UjO, andhigher. A halo effect around the fractures forms amoeba-shapedorebodies in the surrounding rock. The sandstones display verysmall amounts of carbonaceous material, except for humiccoatings in some of the fractures, with occasional accumulationsof organic debris in areas of crossbedding.
Discussion of a possible sequence of events is helpful in ex-plaining the redistributed orebodies as they are related to theprimary mineralization. Processes related to the movements ofuranium-rich solutions have been investigated by Gruner (1956),Laverty and Gross (1956), Hostetler and Garrels (1962), Finch(1967), and De Voto (1978). Simplified application of these pro-cesses to Poison Canyon would be as follows:
The water-soluble uranyl ion (UO2 + 2) in combination with the
di- or tri-carbonate ion (Hostetler, 1962) would have been trans-ported by ground waters during the Late Cretaceous and earlyTertiary. Having been forced out of the Brushy Basin duringcompaction (Hostetler and Garrels, 1962), thesolutions migratedthrough the more permeable Poison Canyon sandstone, and ura-nium was precipitated as coffinite when it encountered reducingconditions. Reducing conditions may have been produced by thecarbonaceous material itself or by H2S produced from the de-composition of the carbonaceous material by bacteria (Finch,1967). Coffinite, with its low solubility under reducing condi-tions, would have occurred as cements and replacements ofaltered clastic grains during the intermediate stages of thediagenetic sequence (Laverty and Gross, 1956). Coffinite alsoreplaced plant fossils and filled pore spaces. The age of primarymineralization is approximately 60-70 m.y. (Finch, 1967).
At Poison Canyon, the primary, trend type of mineralizationis found in the carbonaceous-rich, east-northeast-trending chan-nels. This primary mineralization is found in the thicker portionof the sandstone unit, associated with carbonaceous material.The mineralization is parallel to the east-northeast-trendingchannels (fig. 1). The grain size of the sandstone is medium tocoarse, with moderately sorted, subangular grains consisting ofquartz and microcline; it is variably cemented by calcite. Cof-finite impregnates the sandstone over a 2-ft interval, a few feetabove the lower shale, that is elongate parallel to the primarysedimentary trends. The dominant sedimentary controls are per-meability of the sandstone, interbedding with muds tone lenses,and carbonaceous material associated with coffinite. The min-eralization is found in yellowish-gray to white sandstone. A redsandstone is not favorable for finding mineralization. Limoniticsandstone may have remnants of mineralization in associationwith the fossilized logs. This mineralization occurred before Ter-tiary deformation, as indicated by the offset of trend ore alongthe Poison Canyon fault (Rapaport, 1963).
The Zuni uplift and associated structures formed during theLate Cretaceous to late Miocene (Rapaport and others, 1952).Surface waters rich in carbonate increased the solubility of theprimary coffinite mineralization (Hostetler, 1962). Solutions richin uranyl dicarbonate were introduced into the more permeableenvironment of the now fractured and jointed sandstone, trans-porting the uranium downdip along these fractures (Gruner,1956). These solutions were then subjected to local slightly reduc-ing conditions, depositing higher concentrations of minerals inand near the fractures (Konigsmark, 1958). The redistributeddeposits were largely coffinite (Rapaport, 1963). This redis-tributed mineralization, derived from the primary trend mineral-ization, formed in new positions along the north-south fracturepatterns and is relatively deficient in carbon (Rapaport, 1963).Most of the physical characteristics of the sandstone in theredistributed mineralization are the same as those in the primarymineralization. The major differences are that the redistributed
mineralization is not necessarily found in the thickest part of thesandstone or associated with carbonaceous material. Only spo-radic humic material is found in the fractures. The fractures arethe major control in the redistribution of the coffinite minerals,not the sedimentary trends as in the primary ore. The elongationof the mineralization is along the N. 10° W. direction of fractur-ing (fig. 1). The color of the sandstone is light to dark gray, withareas showing oxidation lacking the coffinite mineralization.These deposits are the first-generation redistributed ore. Thisfirst-generation mineralization, along with the primary ore, wasmined by operators prior to Reserve. Reports by Konigsmark(1958) and Rapaport (1963) discuss these particular deposits inmore detail.
As mining operations by Reserve have progressed, orebodiesaway from the primary and first-generation ores have been en-countered. Fractures and jointing still control the ore; however,there is an obvious absence of carbonaceous material and ofblack coffinite mineralization. The favorable sandstone is lightyellowish to medium gray, with occasional bands of yellowminerals apparently controlled by bedding within the sandstone.These minerals are also observed in the smaller fractures in thesandstone. The yellow mineral occurs as equidimensional grainswith a radially fibrous internal structure. These grains are0.02-0.03 mm in diameter, but aggregates of grains may be 0.1mm or larger. The minerals form as rims and overgrowths on thedetrital grains. Color in transmitted light is lemon yellow, andthe mineral is highly birefringent. One specimen of mineralizedsandstone assayed 4,600 ppm vanadium. Occasionally, pascoite,the vanadium oxide, will form on post-mining surfaces. A sam-ple of the ore was sent to E. A. Elevatorski of Minobras, whoused x-ray diffraction techniques to identify both coffinite andtyuyamunite in the ores (personal communication, 1977).
The existence of tyuyamunite indicates the presence of asecond-generation redistributed ore, which may reflect continu-ing oxidation of the coffinite by ground waters, increasing theconcentration of uranyl ion in solution. The presence of vana-dium ions in the solutions caused tyuyamunite to precipitateunder oxidizing conditions (Hostetler, 1962). The second-generation mineralization is found in a sandstone similar to thefirst-generation ore; the main difference is the presence of ox-idized uranium minerals with little or no coffinite. Thismineralization is not necessarily found in the thickest part of thesandstone nor is it associated with carbonaceous material. Theredistribution is controlled by fracture patterns, forming erratic,discontinuous patches of ore, with some movement into the sur-rounding sandstone (fig. 1). Further oxidation of the coffinite isdependent on proximity to the surface, thereby contributing tothe enrichment of secondary uranium minerals in fractures andin the surrounding rocks (Gruner, 1956). Observations made dur-ing mining operations in the second-generation ore indicate thatfavorable ground is separated from oxidized areas by a stronglyoxidized solution front. These processes possibly occurred be-tween 5,000 and 170,000 years ago (Finch, 1967).
Radiometric disequilibriumBoth redistributed ores exhibit disequilibrium in favor of the
chemical uranium, whereas the primary ore exhibits the reversesituation. The presence of two types of disequilibrium was notnoticed at first, because the probing techniques at the mine werenot sufficiently sensitive. As more information was compiledfrom cl emical assays vs. radiometric assays and mill shipments,the different disequilibria became apparent.
Ore was initially delineated by surface drill holes. Because theywere on 50 ft (15 m) centers, the holes were used in mine plan-ning, with no long-hole program needed. The surface holes werelogged with a scintillation probe that was checked weekly at testpits, calibrating the instrument for 1:1 equilibrium. As mining ofthe redistributed orebodies proceeded, better grades and thick-nesses were encountered than had been shown by the surface

229
logs. To determine the exact grade of the ore, a calibration bane!was established for the probes. The calibration barrel was sam-pled, and chemical assays were performed to closely estimatechemical grade. The grade-control equipment, probes, andcounters were calibrated with the chemical reading of the barrel.A beta-gamma counter was set up in a lab trailer for closer gradecontrol, and samples of muck piles were processed to estimatechemical grade. The beta-gamma counter was also cross-checkedby chemical assays. As more information was compiled, satisfac-tory calibration was achieved.
Initial probing of the primary ore indicated exactly the op-posite relationship, with mill shipments of primary ore returningless than the probed grade. The redistributed ores had a 98 per-cent extraction rate at the mill, whereas the primary ore had anextraction rate of only 85 percent. The two ores were and are indifferent states of radiometric disequilibrium. Uranium has beenleached from the primary ore only to show up in the redistributedores. This aspect of disequilibrium has been presented by Rosholt(1959). Two possibilities exist: first, uranium may have migratedto its present location in a time less than that required to reachequilibrium with its daughter products, approximately 300,000years; alternatively, there may have been preferentially greaterleaching of the daughter products than of uranium. Rosholtstates that the second alternative is possible in carnotite and othertypes of deposits where the uranium is fixed by agents such asvanadium and phosphate. The redistributed ores at Poison Can-yon are interpreted as subjected to preferential leaching ofdaughter products, while uranium was left behind.
At the present time, mill shipments and probe readings arewithin acceptable ranges, and a conservative factor is being usedfor the primary ore. With the amount of redistributed ore thathas been indicated by drilling, in addition to clean-up operationsin the primary ore, the Poison Canyon operations should con-tinue well into the 1980's.
ReferencesCraig, L. C , Holmes, C. N., Cadigan, R. A., and others, 1955, Stratig-
raphy of the Morrison and related formations, Colorado Plateauregion, a preliminary report: U.S. Geological Survey, Bull. 1009-E, p.125-168
Cross, C. W., and Emmons, S. F., 1896, Geology of the Denver Basin inColorado: U.S. Geological Survey, Mon. 27, 556 p., maps
De Voto, R. H., 1978, Uranium geology and exploration—lectures,notes, and references: Colorado School of Mines, 396 p.
Finch, W. I., 1967, Geology of epigenetic uranium deposits >n sandstonein the United States: U.S. Geological Survey, Prof. Paper 538, 121 p.
Freeman, V. L., and Hilpert, L. S., 1956, Stratigraphy of the MorrisonFormation in part of northwestern New Mexico: U.S. GeologicalSurvey, Bull. 1030-J, p. 309-334
Gilkey, A. K., 1953, Fracture pattern of the Zuni uplift: U.S. AtomicEnergy Commission, RME-3O50,34 p.
Gruner, J. W., 1956, Concentration of uranium in sediments by multiplemigration-accretion: Economic Geology, v. 51, no. 6, p. 495-520
Hostetler, P. B., andGarrds, R. M., 1962, Transportation and precipita-tion of uranium and vanadium at low temperatures, with specialreference to sandstone-type uranium deposits: Economic Geology, v57, no. 2, p. 137-167
Konigsmark, T. A., 1958, Uranium deposits in the Morrison Formationon the northeast flank of the Zuni uplift exclusive of Ambrosia Lake,New Mexico: U.S. Atomic Energy Commission, RME-115, 34 p.
Laverty, R. A., and Gross, E. B., 1956, Paragenetic studies of uraniumdeposits of the Colorado Plateau: U.S. Geological Survey, Prof. Paper300, p. 195-201
Rapaport, I., 1963, Uranium deposits of ihe Poison Canyon ore trend,Grants district, in Geology and technology of ihe Grants region, V. C.Kelley, compiler: New Mexico Bureau of Mines and Mineral Re-sources, Mem. 15, p. 122-135
Rapaport, I., Hadfield, J. P., and Olson, R. H., 1952, Jurassic rocks ofthe Zuni uplift, New Mexico: U.S. Atomic Energy Commission,RMO-642, 60 p.
Rosholt, J. N., 1959, Natural radioactive disequilibrium of the uraniumseries: U.S. Geological Survey, Bull. 1084-A, p. 1-30
Compiler's note—Because of the depressed uraniummarket, the Poison Canyon mine was shut down as Mem-oir 38 went to press.

230
GEOLOGY AND ORE DEPOSITS OF JOHNNY M MINE,AMBROSIA LAKE DISTRICT
by Stephen K. Falkowski, Shell Oil Company, Two Shell Plaza, P.O. Box 2906,Houston, Texas 77001
AbstractThe Johnny M mine is one of very few mines in the Ambrosia
Lake district with uranium ore in two members of the MorrisonFormation (Jurassic); these members are the Westwater CanyonSandstone and the Brushy Basin Shale. The Westwater Canyonore is contained in the two upper sandstone units of the member,and the Brushy Basin ore is contained in the Poison Canyonsandstone (informal usage). The sedimentary features and struc-tures in the Westwater Canyon sandstones indicate that the sedi-ments were deposited by a system of aggrading braided streams,possibly at the distal end of coalescing alluvial fans. The PoisonCanyon sandstone was probably the result of deposition in acomplex environment of meandering and braided streams.Paleocurrent-direction indicators, such as fossilized-log orien-tation, foreset azimuths, and the axes of crossbeds and channelscours, suggest that the local paleostream flow was to the eastand southeast. The uranium mineralization is closely associatedwith 1) local accumulations of carbonaceous (humate) matter de-rived from the decay of organic material and 2) paleostreamchannels preserved in the rocks. The ore elements were derivedfrom the leaching of volcanic air-fall tuffs and ash, which wereintroduced into i.ie fluvial system during volcanic activity in thewestern United States. The mobile ore-element ions were reducedand concentrated by humic acids and bacteria present in thefluvial system and ultimately remobilized into the forms presenttoday. The uranium is thus envisioned as forming either essen-tially on the surface as the sediments were being deposited or atvery shallow depth.
IntroductionThe Johnny M mine, operated by Ranchers Exploration and
Development Corporation, is situated at the southeast edge of
r~
the Ambrosia Lake district, in sees. 7 and 18, T. 13 N., R. 8 W.,McKinley County, New Mexico. The mine is easily accessible viaNM-53.
Ranchers drilled the first hole in sec. 7 in 1968. By the end of1971, 268 holes were drilled, Jogged, and the north side (sec. 7)orebodies were delineated (Fitch, this volume). The orebodies insec. 18 (south side) were initially drilled out by United NuclearCorporation and sold to Ranchers in 1970 (figs, la, b).
The shaft for the Johnny M mine (named for its discoverer,John E. Motica) was started in 1972 and finally completed inAugust 1974. The first pound of uranium ore was recovered inMay 1976, and full production was reached during the summerof 1977. Total reserve estimates are about 3.5 million lbs U3O,.
ACKNOWLEDGMENTS—I wish to thank Clay T. Smith, NewMexico Institute of Mining and Technology, and ChristopherRautman, formerly of Shell Oil Company, for their criticalreview of the manuscript and their ideas and recommendations.Gratitude is extended to Ranchers Exploration and DevelopmentCorporation for allowing and encouraging me to undertake thisproject. Shell Oil Company gave me time to write this paper, andI am grateful to them. I also thank Esther Franco for kindly typ-ing the manuscript.
Section 7
Shaft
Eastern 1/2 ofSection 18
600 feet
Section 18FIGURE la—NORTH-SIDE OREBODIES.
Section 19FIGURE 1b—SOUTH-SIDE OREBODIES.

231
General geologyStratigraphy
The Johnny M is one of very few mines in the Ambrosia Lakedistrict with uranium ore in two members of the Morrison For-mation (Jurassic)—the Westwater Canyon and Brushy BasinMembers. The Westwater Canyon ore is contained in the uppertwo sandstone units of the member ( \ and B horizons in fig. 2),and the Brvshy Basin ore is contains. 1 in the informally desig-nated Poison Canyon sandstone.
In the vicinity of the mine, the Westwater Canyon Sandstoneaverages 155 ft (51 m) in thickness, whereas the Brushy BasinShale averages 110 ft (36 m). The A and B horizons of thtWestwater Canyon vary in thickness throughout the area, butnear the orebodies they average about 20 ft (7 m). Separatingthese sandstone horizons is usually a shale ;.one, often referred toas the Kl shale, which is fairly continuous and is about 12 ft (4m) thick.
The Westwater Canyon and Brushy Basin are separated by acontinuous shale layer known as the K shale. This layer is verysimilar to the main Brushy Basin shale and is considered thelowest shale unit of the Brushy Basin. The thickness is relativelyuniform, commonly 8-12 ft (3-4 m).
The Poison Canyon sandstone, which rests directly on the Kshale, tapers from 70 ft (23 m) thick in the northern part of sec. 7to a feather edge in the southern part of sec. 18. Where thePoison Canyon is mined, its thickness is approximately 12 ft (4m).
Above the Poison Canyon sandstone is the main shale zone ofthe Brushy Basin. Thickness varies, but it averages 90 ft (30 m)near the orebodies. Thickness is greater where the Poison Can-yon sandstone is thin and vice versa.
SPONTANEOUS RESISTIVITY
POTENTI.
FIGURE 2—LOG FROM THE JOHNNY M MINE.
Westwater Canyon SandstoneSANDSTONE—The sandstones of the upper Westwater Canyon
are arkosic; feldspars comprise about 35 percent of the rock. Thesandstone layers may be horizontally bedded or complexly cross-bedded. The crossbedding is associated with scour-and-fill struc-tures, foreset development, and erosion surfaces or diastems thatextend laterally for distances of up to 50 ft (16 m).
Sandstone varies unpredictably from weakly to strongly in-durated (principally cemented by calcite) and varies widely ingrain size, sorting, and roundness. Changes in texture and struc-ture within beds and from one bed to another are common. Clay-stone fragments up to 2 inches (5 cm) in length are dispersed insome of the coarser grained sandstone units. Claystone-cobbleconglomerates 1-2 ft (30-60 cm) thick are fairly common alongdiastems.
Plant remains and fossil trees and bones are especially wide-spread in the Johnny M mine. Fragments of logs, branches, andtwigs are abundant, along with separate accumulations of leavesand reed-like plant stems. The smaller pieces are usually coal-ified, whereas the larger logs are commonly silicified. Dinosaurbones are also abundant.
The proportions of dctrital minerals in the Westwater Canyonsandstones of the mine vary within wide limits; feldspar is usual-ly between 25 percent and 40 percent of the total, with quartzcomposing most of the remainder.
Quartz, on the average, makes up 61 percent of the detritalminerals, but can range from 35 to 71 percent. Most grains areclear and free of fractures, but some have inclusions of dust anda rare bubble. The extinction patterns commonly are uniform,but locally a strained pattern is observed. Quartz overgrowths arenot common. The roundness of the grains varies from rare, sing-ly terminated crystals to extremely well-rounded grains, but mostfall between subangular and subrounded (0.3 to 0.5 on the chartof Krumbein and Sloss, 1955). The grain size rarely exceeds 1.5mm.
Orthoclase composes 13 percent of the detrital minerals. Theorthoclase is commonly cloudy, more rounded than quartz, andfractured. Occasionally, some alteration (probably to sericite) isseen along the borders. Grain sizes are similar to those of quartz,although orthoclase grains average larger. Grain shapes rangefrom angular (rare) to rounded, with the typical grain betweensubangular arid subrounded.
Microcline is conspicuous in hand specimen as large pinkgrains and composes 8.5 percent of the detrital fractior Micro-cline grains are usually very fresh, only rarely showing clayalteration. Polysynthetic (gridiron) twinning, characteristic ofmicrocline, is very well developed. Microcline grains are usuallylarger than adjacent grains of other minerals and may be as largeas 20 mm. Angular crystal laths are fairly common. The averagemicrocline grain commonly is subangular to subrounded.
Plagioclase feldspar (14.5 percent of the detrital minerals) inthe Westwater Canyon sands is sodic. Extinction angles on albitetwinning for crystals cut normal to {010} range from 18 to 30degrees, with the majority of the angles between 20 and 25degrees (Michel-Levy method). This range, along with a positiveoptic sign, indicates that the plagioclase is principally in the com-position range An30.S0, primarily andesine. The grains are veryfinely twinned, but no zoning was observed. Plagioclase is moreintensely altered than potash feldspar, with many grains beingcompletely covered by a thin layer of alteration clay, probablykaolinite or smectite. The grain shapes and sizes are comparableto those of microcline, except that the upper size limit is 2-3 mm.A few grains of antiperthite are present.
About 3 percent of the sandstone particles are rock fragments,mostly chert, with subordinate volcanic, granitic, limestone, andquartzite fragments. Chert grains, which may be as large as 15mm in diameter, are often conspicuous in hand specimen. Rarevolcanic detritus consists mostly of semispherical masses of low-birefringent clay minerals. A few identifiable sanidine grains are

232
present, although almost completely dissolved, leaving an emptyshell (see Austin, this volume).
Biotite and chlorite are present but uncommon in the 30 thinsections examined. Biotite appears slightly altered, and thechlorite exhibits anomalous blue interference color.
The only detrital heavy mineral identified was apatite, and thiswas present in only one thin section. Magnetite and ilmenite areconspicuously absent from these sandstones. Pyrite, heavilyaltered to hematite but showing cubic form, is not abundant.
CLAYSTONE—Claystone, which is present in layers interbeddedin ;he sandstones, occurs in various shades of green and red.Frebi claystone is commonly dark green, whereas weatheredclaysione is a light grayish green, with irregularly shaped reddishlenses. Weathered claystone is very fragile and powdery, break-ing up when handled. Fresh, dry claystone is blocky, having asmooth, almost soapy feel with little grittiness and a waxy sheen;it is usually seciilc The claystone consistently contains a smallproportion of nonclay detrital particles, and the balance is com-posed of fine-grained clay minerals probably derived fromalieration of volcanic ash.
A variety of textures exists in thin sections of the claystone.They commonly contain up to 10-15 percent subangular, fine-sand-size quartz and feldspar particles. These coarser particlesare most frequently scattered randomly through the clay but maybe concentrated in very fine laminae. Clay-particle outlines areindistinct, even at magnifications of lOOx. Some orientation ofthe clay panicles is indicated by a tendency to show extinctionparallel to the bedding in polarized light.
A very interesting feature of the claystone zones is a mantlingof colors on individual clay galls. A common feature is galls afoot across, with a red core and a green mantle. The inverse colorscheme, a green core with a red mantle, is also observed but notas commonly.
AUTHIGENIC MINERALS—Kaolinite, calcite, barite, pyrite, andsilica compose the suite of authigenic minerals. Kaolinite is per-vasive throughout the mine, occurring in all sandstone horizons.The kaolin occurs as disseminated blebs or nests, ranging in sizefrom a few millimeters to a couple of centimeters. These nests arecomposed of clean, white, well-crystallized kaolinite, filling theinterstices of the sandstones and frequently surrounding severalsand grains. Nests are disseminaicd throughout all the sands, butthey are larger and more abundant in the coarser-grained sands.The nests may either be distributed randomly in the sands orfollow sedimentary structures, such as bedding; where the nestsare layered, the appearance is more that of a linear belt than thatof a series of individual blebs.
Kaolinite nests may occupy as much as 5 percent of the volumeof the sandstone; kaolinite makes up about 40 percent of thevolume within a particular bleb. Kaolinite also has been observedfilling very small, narrow fractures in sandstone, filling cracks incarbonized wood, or coating smaller pieces.of carbonized fossils.
Calcite, in addition to acting as the major cementing agent, oc-curs as small rhomb-shaped crystals filling fractures within thesandstones and claystones. Crystals typically are clear and welldefined and may be as large as a centimeter across. Calcite is alsopresent in cracks in fossil trees and bones.
Barite occurs as honey-colored, tabular crystals up to a cen-timeter long and is limited to fractures in sandstones and clay-stones that occur in and near ore. The most visible barite crystalsoccur where the fracture crosses the ore pod, but they are also-resent along the fracture away from the ore. Occasionally the• I'stais are coated with a very thin layer of uranium mineraliza-
' i o n
h rite is not particularly abundant in the Westwater Canyonsand exposed in the mine. It may be present in fractures, ore-beurlig sandstones, barren sandstones, and claystones. The formis typically that of very small cubes arranged in pockets as a thindusting perched on detrital grains in the sandstone. The presenceof the cubes is revealed by their high reflectance. The pyrite ex-posed on the mine-workings surface is typically fresh with nohematitic staining around or in the clusters.
Silica overgrowths on detrital quartz grains are pervasivethroughout the mine and are locally abundant, but they actuallymake up a very small fraction of the total rock. Overgrowthsmay be present on every quartz grain in a particular area, andthey impart a characteristic sparkle to the rock. More commonlythey occur only oi isolated grains.
Silica also occurs in the form of silk'Tied wood and bones,which are widespread and abundant. The larger detritus, such astrees and bones, are always silicified, either completely or in thecenter, surrounded by a carbonized periphery. Smaller fragmentsare commonly carbonized.
Poison Canyon sandstoneThe informally designated Poison Canyon sandstone is a gray
to tan, generally poorly sorted, medium- to very coarse grained,locally conglomeratic sandstone. The general composition is thatof an arkose, with feldspars composing about 30 percent of thedetrital grains.
The Poison Canyon sandstone typically is horizontally beddedwith thin laminae of very coarse elastics interbedded with thefiner material, but in places it is complexly crossbedded. Cement-ing agents, mostly calcite, are irregularly distributed, yieldingareas of friable sandstone and other areas that are very well in-durated. Grain size and degree of roundness and sorting mayvary considerably within beds, or from one bed to another. Clay-stone fragments are present along the bedding planes of thecoarser material but are not nearly as abundant as in WestwaterCanyon sandstones. Larger claystone fragments, up to 20 cmlong, are irregularly dispersed but rare throughout the sandhorizon.
Organic debris, abundant in Westwater Canyon sands, is vir-tually nonexistent in the Poison Canyon sands. Trash piles(Squyres, 1970) do not appear here, and small pieces of carbon-ized plants and trees are rarely encountered.
Quartz is by far the most abundant mineral in the Poison Can-yon sandstone, composing 69 percent of the detrital minerals.The amount of quartz is fairly consistent, ranging from 60 per-cent to 76 percent. Quartz grains are clear and fracture free, withrare inclusions or bubbles. Uniform extinction patterns are therule, with only a very small number of grains exhibiting astrained patter". As might be expected in a fluvial system, theroundness of the grains varies, but most of the grains fall be-tween subangular and subrounded (0.3 to 0.5 on the chart inKrumbein and Sloss, 1955), with a general tendency towards thesubrounded category. The size of the quartz grains rarely exceeds15 mm.
The second most abundant mineral is orthoclase, which com-poses 20 percent of the detrital minerals. Orthoclase grains arecloudier than quartz grains (due to alteration); they also containsome fractures. Sericite, an alteration product, is present alongthe borders of some of the grains. The orthoclase grains tend tobe a little larger than the quartz and are also more rounded.Grain shapes range from subangular to rounded, with most ofthe grains being subrounded. Perthite is irregularly present.
Microcline, often the largest grains in hand specimen, com-poses 4.5 percent of the detrital minerals in the Poison Canyonsandstone exposed in the mine. Microcline grains are very fresh,with prominent polysynthetic (gridiron) twinning. Angular crys-tal laths are fairly common, with grains up to 20 mm in diameter.The majority of the grains are subangular to subrounded, withmost being subrounded.
Plagioclase feldspar makes up 4.5 percent of the detrital min-erals. The extinction angles observed on the albite twinning rangefrom 19 to 28 degrees, and the optic signs are positive, indicatingthat the plagioclase is andesine. Twinning is coarser than in theWestwater C; iyon sands; no zoning was observed. Many grainsare altered auo. thinly covered with a clay, probably kaolinite orsmectite. Lath-shaped grains are common, and most grains aresubangular to subrounded. Grains rarely exceed 4 mm indiameter.

233
About 2 percent of the sandstone particles are rock fragments,mostly chert, with some granitic clasts and volcanic detritus.Chert grains are commonly rounded and may be as large as 15mm across. The volcanic detritus is similar to that encountered inthe Westwater Canyon sands, being spherical masses of undif-ferentiable clay minerals. Sanidine grains are rare, and the visibleones have largely been dissolved, leaving empty shells.
Biotite occurs as thin flakes and is dispersed randomlythroughout the sands. Pyrite also is present but commonly isaltered to hematite. As in the Westwater Canyon sands, magne-tite and ilmenite are absent.
The authigenic minerals present in the Poison Canyon sand-stone are the same as in the Westwater Canyon sands.
StructureThere is a striking contrast between the structure of the north
and south sides of the mine. The north side has virtually no struc-tural discontinuities, whereas the south side is extensivelyfaulted.
The north side is cut by several small normal faults, with an oc-casional reverse fault present. Most of these faults are ac-companied by a thin zone of fault gouge. All of the faults arepost-ore; the ore bands are always offset by the faults. No orehas been found along the fault planes. The majority of the faultsare high angle, with dips of 50 to 85 degrees. Fault planes strikeconsistently from N. 10° W. to N. 40° E., with an average strikeofN. 10° E.
An interesting structural feature present on the north side is asubtle monocline on the northeast edge of the orebody. To theextent that it could be determined from the mine workings, themonocline is approximately 100 ft (33 m) long and 30 ft (10 m)deep. Whereas the average dip of the beds in the mine is 3degrees, the beds along the monocline dip at an average of 35degrees in a N. 40° E. direction. The monocline dies out rapidlydownward and is not present in the mine workings 25 ft (8 m)below.
The south side of the mine is more intensely faulted than thenorth side. There are several faults or fault zones present withdisplacements of up to 75 ft (25 m). In an east-west directionacross the middle of the orebody, a series of northward-strikingfaults causes the strata to be stepfaulted down to the east (fig. 3).The total displacement across the fault series is about 93 ft (31m). All of these faults are normal, with very steeply dipping faultplanes (65-85° E.). Strike is generally in a northerly direction,with a range from N. 10° W. to N. 20° E. In addition to thesemajor faults, there are minor faults with displacements fromseveral inches to 3 ft (about 8 cm to 1 m). All of these faults arepost-ore and are probably of Laramide age. The trend of the
faults is to the north-northeast, and they are probably associatedwith a northeast splinter of the San Mateo fault zone.
Sedimentary structures and featuresThe sandstones exposed in the mine workings exhibit several
types of sedimentary features and structures. The WestwaterCanyon sandstones and the Poison Canyon sandstones have incommon channel-fill crossbedding, foresets, graded bedding,horizontal bedding, and scour-and-fill features. These featuresare more abundant and conspicuous in the Westwater Canyonsands than they are in the Poison Canyon sandstone. Sedimen-tary features and structures that are common in the WestwaterCanyon sands but lacking in the Poison Canyon sandstone arechannel-lag deposits, slump features, mudstone-cobble con-glomerates, and trash piles.
Systems of channel-fill crossbedding can vary greatly in size,ranging from 1.2 inches (3 cm) thick and I ft (.3 m) across tonearly 3 ft (1 m) thick and 16 ft (5 m) long. In these systems,several individual channels usually are present, which are filledby trough-shaped beds. These beds range from V* to 1 Va inches(about 1 to 3 cm) in thickness. Frequently, some grading existswithin each bed, with subtle changes from coarser to finermaterial. This sequence is repeated up through tht trough.Overall, the sorting is moderate (Folk, 1968) within the gradedbeds.
Foreset sequences in the mine range in size from 5 inches ( 12cm) high and 3 ft (I m) across, to 1 ft (30 cm) high and 20 ft (6 m)across. Commonly, a flat erosional surface separates sequencesof foresets stacked on top of one another. Within each sequence,the individual sets are about 1-2 inches (2-5 cm) thick. Gradedbedding is observable, with the coarser grains confined to thebasal layer. The sorting is rather poor, with fines distributedthrough the foresets.
A locally conspicuous feature that rarely is exposed in the mineis a channel-lag deposit. This is a concentration of gravel andvery coarse sand at the base of a channel-scour feature. Channel-lag deposits as much as I ft (0.3 m) thick can be traced for up to15 ft (5 m).
Lag deposits contain the largest fragments found in the mine.The gravel ranges up to 1 inch (2.5 cm) in largest dimension, withthe average size being about V* inch (.6 cm). The gravel common-ly is composed of chert, pink feldspar, granite, and claystonefragments. This coarse layer is moderately to well sorted (Folk,1968), apparently due to winnowing out of finer material; sortingbecomes poorer upward. Organic material, such as pieces of car-bonized branches, leaves, and reeds, commonly is concentratedabout a foot above the basal layer, apparently deposited after allthe fines were winnowed out.
displacementu lu
70'total
displacement DAKOTA sandstone
^y:^^>>yzK-l^l'l^^sy>St->y>>t-z^yz-y>S>^>jS>Z)^ jgrjfoison Canyon san^5ton»>-;g>:-:-:-:-:-:-:
HESTNATER CANYON s a n d s t o n e j \
WliSTWATER C/WYON s a n d s t o n e ' f~--z-z-----------------z-z-z----------"-----"-------~| 7 *>-z-z-z-z<"K" Shale :r:r-ft-;¥i>:r-r>::-;->r-:-S
[""I Sandstone ' ij' —-_-_-_-.-Z T I ^-<>z-z'«Ki"'shiiiz<-z>->>y:z>>>>^^^
(V 6 0 ' | 9 j shale \ V-----'- r--.-.-.-.->:-:-:<-:-.-_-r->:-:---------
• °» \FIGURE 3—EAST-WEST CROSS SECTION LOOKING NORTH IN SOUTH-SIDE OREBODY; NOTICE THE EXTENSIVE FAULTING.

234
Graded beds are sedimentation units characterized by a grada-tion in grain size, from coarse to fine, upward from the base tothe top of the unit. Pettijohn (1957) discusses the two types ofgrading: One type is a decrease in grain size upward resultingfrom the addition of successive increments of material, each finerthan the preceding; these increments are probably the product ofsedimentation when a current gradually decreases in velocity andcompetence. In the second type, finer material is distributedthroughout, with coarser grains gradually decreasing in abun-dance upward; this type is a product of sedimentation from asuspension in which all grain sizes are carried and out of whichthey settle.
This second type of graded bedding is apparently l he dominanttype present in the sands exposed in the mine; however, thisfeature is subtle and not easily seen. This grading is pervasivethroughout the horizontally bedded sands. Each bed incorpo-rates a sequence of coarser to finer material, repetitive overseveral feet vertically. In a particularly good exposure, a 2-ft(0.6-m) sequence of coarse sediment had thin beds, 1-2 inches(2-5 cm), of much finer material interlayered within it. Thechange from the fine to the coarse sand was abrupt—almostknife sharp—but this is rarely seen.
Reverse-graded bedding, where the finer material grades up-ward into the coarser material, was not observed in the mine ex-posures.
The most abundant and conspicuous type of bedding presentin the Westwater Canyon sands is evenly layered sand composedof parallel and almost horizontal sand layers up to 1 inch (2.5cm) thick. Individual layers are usually horizontal or slightly in-clined owing to deposition on originally inclined surfaces. Thelayers commonly can be traced laterally up to 12-15 ft (4-5 m).Bedding is commonly marked by repeated sequences of gradedbeds. Bedding ranges from very thin bedded to thin-bedded(Reineck and Singh, 1975).
The fine- to medium-grained sandstones show the best devel-oped horizontal bedding. Occasionally, a layer of coarse sand0.4-0.8 inch (1-2 cm) thick is present, interlayered with the nor-mal sequence of bedding. This feature is probably due to deposi-tion during a single Hood stage. Different sets of evenlylaminated sands are frequently separated from each other by verylow angle erosionai surfaces.
Scour-and-fill structures range in size from 1 to 20 ft (30 cm to6 m) across. The contact with the lower sand bed is concave up-ward, formed by the trough shape of the eroding channel. Thechannel-fill sand sequence usually extends upward for up to 3 ft(1 m) to where another scour-and-fill feature is present or thehorizontal bedding style is resumed.
Ripple marks, or more correctly, casts of ripple marks, havebeen observed in only one small area within the mine. Thesesmall-scale ripples have a height of approximately 0.1 inch (2mm) and a length of about 1 V* inches (3 cm). The size of the rip-ples and their formation in a fine-grained sandstone indicate thatthey formed in a quiet-water environment.
Current lineation, a bedding-plane feature consisting of astreamlining effect of sands grains on smooth bedding planes, isextremely rare. Only one set of lineations was observed, probablyowing to the very poor bedding-plane exposures in the mine.
Slump siructure is a general term that includes all thepenecontemporaneous deformation structures resulting frommovement or displacement of already-deposited sediments,mainly under the action of gravity (Reineck and Singh, 1975).Slumping of a sediment mass may result in the breakage andtransportation of sediment, producing a chaotic mixture of dif-ferent types, such as mud-fragment clasts embedded in a sandymatrix or vice versa.
Slump structures are abundant locally in the mine. Large,angular claystone clasts or galls in a mixture of coarse-grainedsandstone are not unusual. These slump structures, produced bygravity, probably originated on the oversteepened banks of achannel. Occasionally, thin claystone layers are disrupted, and
the resulting angular clasts, up to an inch (2.5 cm) long, are inter-mixed with sandstone. Distorted or contorted bedding within thesandstone beds is not a common feature.
Squyres (1970) coined the term trash piles for large, local accu-mulations of small carbonized plant fragments within the West-water Canyon Sandstone. These features are also abundant in thesandstone horizons of the Johnny M mine. The trash piles arelarge sedimentary accumulations up to 30 ft (10 m) wide and 10 ft(3.1 m) thick of various types of carbonized plant remains, suchas reeds, grasses, and small branches. The matrix is usually apoorly sorted, gray, very friable, fine- to medium-grained sand-stone that lacks any distinctive bedding. The organic debris tendsto be uniformly distributed throughout the trash pile.
Conspicuously present in several sandstone units are claystoneclasts, commonly called clay galls. Sizes range from 1/8 inch to 2inches (0.3 to 5 cm) and may be even larger. The galls tend to besubangular and elongate. The long dimension of the galls, espe-cially the small ones, is conformable with the bedding planes,giving them the appearance of being deposited along with thesand grains.
In addition to the smaller clay galls, claystone clasts are pres-ent in zones that range up to 3 ft (1 m) thick and tens of feet inlateral extent. Here are found large clasts, up to 2 ft (0.6 m) long,which represent subangular fragments of once-thick claystoneaccumulations. These accumulations broke up as a result of dif-ferential compaction prior to lithification. These galls must haveformed in situ, since they are much too large to have been trans-ported any significant distance. Sand usually fills the intersticesbetween the galls.
Paleochannel directionsOriented sedimentary structures are abundant in the mine
workings of the Johnny M. These structures include foreset dipazimuths, the long axis of channel scours, the axis of channel-fillcrossbeds, and the long-axis orientation of trees and bones. Thedirections of these sedimentary features are generally quite con-sistent in any particular channel, as well as throughout largeregions of the mine.
Directional data from all areas of the mine were collected todetermine major stream-flow directions in this part of the Mor-rison Formation. This data was then analyzed by a computerprogram for veclor analysis of paleocurrent directions. Theresult indicates that most of the stream systems that deposited thesediments present in the Johnny M flowed in a predominantlyeasterly direction, with a slight component to the south (figs.4a, b).
Environments of depositionof the Morrison Formation
The Westwater Canyon Sandstone Member of the MorrisonFormation was formed by an aggrading system of low-sinuosity,wide, braided streams. These streams flowed on broad, coalesc-ing alluvial fans emanating outward from a source in west-central New Mexico (Craig and oihers, 1955). The sedimento-logic characteristics of the Westwater Canyon sands are unusualin that they resemble neither well-documented meandering norbraided streams, but appear to fall somewhere in between. Therepetitive internal genetic sequence of scoured surface-troughfilling-horizontal stratification-clay drape is not typical ofmeandering-stream deposition. The sandstone units are wide-spread; if they did not originate as superimposed point-bar de-posits, they must have been deposited by shallow, widespreadriver systems containing smaller scale, braided or anastomosingstreams.
While the major flow of the fluvial system was to the northand northeast, filling and choking of these channels probablycaused braided, perhaps ephemeral, distributaries to spill lateral-ly off the flanks of the alluvial fan. These newly created streamswould then yield the easterly depositional trends that are evident

235
FIGURE 4a—Rost DIAGRAM OI PAI LOCURRLNT DIRECTIONS IN mi; Wi-si-WATER CANYON SANDSTONI Figures (20, 40) refer to number ofmeasurements.
2i6c 200° 190° 180° 170° 160° iJO°
FIGURE 4b—Rost DIAGRAM OI PALKOC URRLNI DIRI n IONS IN THE POISONCANYON SANDSTONE. Figures (10, 20, 30) refer (o number ofmeasurements.
in the Ambrosia Lake district (Squyres, 1970; Rapaport, 1963),in the Johnny M mine, and in the Mount Taylor area (Riese,1977).
The Brushy Basin Shale Member, with its laterally uniform,blanket-like shale units and random, discontinuous sandstoneunits, was probably deposited in an environment of stronglymeandering streams with extensive floodplains. Large, thickdaystone units contain intermixed, discontinuous sandstoneunits of local to more widespread extent which are of variabletexture (gravel to silt). The Poison Canyon sandstone wasdeposited as a result of one of these large meandering-streamsystems. The meandering nature of the stream is supported bythe wide dispersion in the paleocurrent indicators (fig. 4b). Thinbeds of limestone locally present in the Brushy Basin Shale arcprobably the result of temporary fresh-water ponds which dottedthe floodplains.
Ore depositsThe uranium ore consists of sandstone that is impregnated by a
dark, tarry organic substance which coats sand grains and fillsinterstices. The uranium is contained within the organic material.There are occurrences of organic material that contain no ura-nium mineralization, but no primary uranium mineralization hasbeen found that is not intimately associated with some type oforganic material.
The color of the ore ranges from light gray brown to very darkblack—the darker the color, the higher the uranium content. Theaverage grade of the ore from the Johnny M is about 0.40 per-cent, with concentrations ranging from the economic cutoff of0.05 percent to over 8 percent LfjO,.
Vanadium occurs in association with the uranium ore, al-though in lesser concentrations. Vanadium ranges from .02percent V!Os in very low grade uranium ore to 1.25 percent inhigh-grade uranium ore. Molybdenum, copper, selenium, andarsenic (in order of decreasing abundance) are also concentratedwith the uranium mineralization.
Westwater Canyon oreFORM—The overall trend of the orebodies is linear. The
thickness of an orebody varies; the ore is not confined to onespecific level in a given sandstone horizon but is usualiy no morethan 15 ft (5 m) thick atany one location. The lateral extent of anorebody is more predictable than is the thickness. This fact canbe weil demonstrated in mine-drilling programs (see Fitch, thisvolume) where no ore is encountered laterally outside the definedregions of the orebody, whereas ore is sporadically encounteredabove and below a major orebody.
The orebodies are not one continuous zone of uranium ore;they consist of individual ore pods that occur in various shapes.The dominant ore-pod form is that of elongated tongue-likelenses that range from 3 ft (1 m) to over 30 ft (10 m) long (fig. 5).These pods are commonly lenticular in cross section with alength-to-width ratio from 2:1 to 25:1. The thickness of anygiven individual ore pod is usually less than 5 ft (1.6 m). Numer-ous thin ore pods may occur together, resulting in complexforms.
BLANKET ORE—Blanket ore is a term given to very long, thinore pods that are irregular in ore content and unpredictably un-dulate or roll through the sandstone horizon. The pod usuallydeviates only about 6 ft (2 m) from the horizontal plane. Thisblanket ore commonly is situated in the lower part of the exposed

236
Poison Canyon Sandstone
->:->:-"K" shale -:-:-:->:-:-:
o1 25'
~ [ Sandstone
x]Shale
• Ore
FIGURE 5—EAST AVEST CROSS SECTION, LOOKING NORTH IN WESTWATEK CANYON SANDSTONE ORE; NOTICE THE FORM OF THE ORE PODS.
sandstone layer, usually occurring atop a claystone zone, if one ispresent. Calcite cement usually separates the ore from theclaystone.
Difficulty in viewing the ore pods in three dimensions meansthat a trend is not always obtainable; when an ore-pod trend isvisible, the elongation usually is parallel or subparallel to theoverall trend of the entire orebody.
The ore pods, especially the smaller ones, are generally uni-form in ore composition and have sharp boundaries with the sur-rounding barren rock. The uranium content of the sandstone atthe ore boundary can decrease several hundredfold in a distanceof 2 inches (5 cm). Some contacts are knife sharp. Some of thepods are patchy and ill defined, and these generally are muchlower in UiO, content than the more uniform ore pods. Thesmaller, more homogenous ore pods are consistently the richestones, often containing over 1 percent UJO«. The richer ore podsalso contain the most calcite cement. The cement usually extendsbeyond the ore boundary for 1-2 ft (0.3-0.6 m) and then gradual-ly dies out into more friable, barren sandstone. The larger oreblankets are more friable than the smaller pods, but they aremuch better indurated than the average barren sandstone.
ORE ROLLS—The term roll, synonymous with ore roll, is ap-plied to any curving surface which cuts across the bedding of thehost rocks (Squyres, 1970). Crescent-shaped ore pods, similar tothe overall geometry of the classic Wyoming-type roll, occur inthe Johnny M mine, but they are very rare and much smaller.These rolls may be as much as 12 ft (4 m) long and 4 ft (1.3 m)high. One roll observed had a distinct head with two tails extend-ing outward. Tails are usually interpreted to point in the direc-tion from which the ore fluids came. The roll was elongated near-ly parallel to the trend of the main orebody. The convex side(front) of the roll had a sharp contact with barren, bleachedsandstone, whereas the concave side (back) of the roll had a morediffuse contact. Ore was evenly distributed throughout the roll.The tails tended to feather out into the host sands. Sandstone im-mediately adjacent (front and rear) to the ore roll was bleachedtan gray, whereas sandstone further out around the roll was graygreen, suggesting that the bleaching effect was probably associ-ated with the formation of the ore roll.
DIRECTIONAL FEATURES—While most ore pods are situated in asandstone host with no apparent connection to any specific fea-ture, an occasional ore pod is intimately associated with fossiltrees. The ore is formed as a halo around the tree, with a distinc-tive tailing effect pointing in the presumed paleocurrent direc-
tion. There is much more ore on the lee side of the tree than onthe up-current side. The fossilized log itself is not necessarilymineralized, but a thin crust around the log usually containssome mineralization. This tailing effect is an uncommon feature,but where present, the trend of the tail is parallel to subparallel tothe overall trend of the orebody.
IRON BANDS—Accompanying nearly every well-defined, uni-form ore pod is a red band of apparently oxidized sandstone.This band is usually present along all or most of the periphery ofthe pod; and if not, it is commonly restricted to the front and/orbottom of the pod. This red band, which usually is continuous,never actually comes in contact with the ore, as there is always athin (0.5 inch, 1.3 cm) space between the red band and the ore.The total iron content of this band typically is higher than thetotal iron content of the ore and surrounding sediments.
CONCENTRIC ORE POD—Only one example was observed of aspherical pod of high-grade ore, which was completely envelop-ing an extremely well-cemented (by calcite) sphere of low-gradeore. The lithology of the host sandstone, medium-grained ar-kosic sand, was the same across the whole sphere. The whole podwas well cemented, but the center was more indurated than thericher ore. The calcite cement was pervasive throughout thewhole area, making the corresponding red band around thesphere well indurated also. The outer ore assayed 4.0 percentIJjO,, whereas the central part ran 0.2 percent—by no meansbarren, but considerably less than the surrounding ore. The con-tact between the high- and low-grade ore was almost knife sharp.
Poison Canyon oreFORM—Poison Canyon ore differs from Westwater Canyon
ore in that it is more massive and very rarely occurs as the smallindividual lenses so common in the Westwater Canyon. Individ-ual ore pods are much more extensive, continuous, thicker, andmore uniform in the Poison Canyon. Ore pods may be 50 ft (15m) long, 25 ft (8 m) wide, and up to 6 ft (2 m) thick, although theaverage ore pod is smaller. The length-to-width ratio ranges from3:1 to 10:1. Sandwiched between the K shale and the BrushyBasin, the ore may extend the entire thickness of the Poison Can-yon sandstone, about 12 ft (4 m). The best way to describe the oreform is sheet- or manto-like. The trend of the sheets of ore isparallel to the overall trend of the orebody.
Where the ore does not occur as one mass across the entirethickness, it is usually a thin layer up to 2 ft (0.6 m) thick at the
237
base of the Poison Canyon, overlying the K shale. Ore can befound anywhere in the sandstone horizon—in the middle withbarren sand on either side, or in the upper part directly belcvv theBrushy Basin. When the ore is near the K shale, it is never indirect contact with it; there is a calcite-cemented zone up to 4inches (10 cm) thick that separates ore and shale.
Besides the basic shapes and forms expressed by the PoisonCanyon ore, there are other differences in comparison to theWestwater Canyon ore. The overall grade of the Poison Canyonore is lower than the grade of the Westwater Canyon ore. Calcitecement is pervasive throughout the Poison Canyon, but the ore isnot quite as well indurated as Westwater Canyon ore. Locally,the ore is quite hard, but overall is more friable than theWestwater Canyon ore. The most obvious difference betweenorebodies in the Poison Canyon and the Westwater Canyon is thesignificant lack of organic detritus such as trees, bones, and trashpiles in the Poison Canyon sands. Only two or three pieces ofcarbonized debris have been found in the Poison Canyon sand-stone.
MINERALIZED CLAY GALLS—A few clay galls impregnated withuranium mineralization are present. Usually this occurs only inclay galls that are isolated within massive pods of ore.
Features such as ore rolls and directional indicators do not oc-cur in the Poison Canyon. The iron bands common around theore pods in the Westwater ore are rare and poorly developed inthe Poison Canyon ore.
Relation to stratigraphy, sedimentaryfeatures, and structure
Orebodies in the Johnny M mine are not subject to any definitestratigraphic control, although the overall orientation of the ore-bodies and the orientation of most of the ore pods is consistentwith the orientation of fluvial sedimentary features. While noone major stream channel has been or can be accurately mapped,the sandstone near and in the orebodies tends to be more prom-inently cross bedded and coarser grained, contains more fossildetritus, and exhibits more channel-associated characteristicsthan the sandstones at a greater distance from ore. The ore-bearing horizons are inferred to occur in at least part of a fluvialchannel complex.
Individual ore pods can occur 1) suspended within thick sand-stone beds separated from adjacent sedimentary surfaces by afew feet of barren sandstone, 2) resting on the upper surface of aclaystone bed, 3) intermixed with a claystone-cobble con-glomerate, or 4) localized on a laterally persistent scour surface.Thin layers of ore that occur in thick sandstone beds are more apt(o be associated with erosional surfaces and thin claystone zones.
Although ore locally does conform to bedding or to an ero-sional surface, ore pods consistently transect all types ofsedimentary structures, including lithologic changes, crossbed-ding, and scour surfaces. The ore boundary that transects sedi-mentary features is usually sharp, and there is no change in gradeor morphology of the ore across the feature. The most commonsedimentary feature that the ore transects is lithologic variation,most noticeably a change from a coarse-grained sandstone to afine-grained sandstone. Typically, ore that closely follows bed-ding or another sedimentary feature eventually dips down andcrosses that feature. Overall, no small-scale sedimentary featurehas been observed that exerts any significant control on theemplacement of ore.
Claystone zones commonly separate ore pods that are stacked.Interfingering of ore pods occurs where ore is at different levelsin close proximity to one another, so the ore is not confined toone specific layer in the bed. The ore pods are randomly distrib-uted throughout the orebody, indicating the lack of specific bedsor sedimentary features controlling the ore emplacement.
Two features appear to have some influence on the location ofore pods. Persistent claystone zones usually exist as a basal bar-rier to blanket ore. Tracing these claystone zones may lead tomore ore. Trash piles commonly are in close proximity to major
ore pods, the pods lying in the presumed down-current direction.These trash piles are believed to be the major source of thehumate material associated with the uranium ore.
Orebodies that occur in the Poison Canyon sandstone areunder much greater stratigraphic control. The Poison Canyonsandstone, which has an average thinness of 12 ft (4 m) in themine workings, consistently is bounded by two impermeableshale layers, the K shale below and the shales in the Brushy Basinabove. Any ore present exists between these two shale layers. Themajority of the ore occurs in the basal part of the horizon. A cor-relation seems to exist between ore occurrence and a persistentcoarse-grained sandstone bed within the Poison Canyon; the oreis not strictly confined to this one particular bed, but it appearsto be situated preferentially in or very close to the bed.
The relation between ore and faulting is very straightforward:faults cut and displace ore, with no apparent ore movementalong the fault plane (fig. 3). The extensive faulting does affectmine planning, as the fault zones are avoided owing to theirweakness. Faulting consistently displaces Poison Canyon oredown to the east, which also affects mining.
Associated jordisiteSquyres (1970) stated that a black amorphous substance iden-
tified as jordisite (MoS2) exists in close association with primaryorebodies in the Grants region. Squyres implies that jordisite isquite abundant in the Ambrosia Lake district; however, signif-icant amounts of jordisite are not present in the Johnny M mine.
Where jordisite does occur in the mine, it is much more abun-dant in association with Poison Canyon ore than with WestwaterCanyon ore. Jordisite in the Westwater Canyon occurs in afeathery pattern, selectively impregnating certain laminae of thebedded sandstone adjacent to an ore pod. The jordisite feathersextend outward peripherally from the ore pod but are never indirect contact with the ore; an inch (2.5 cm) or so of barren sand-stone separates ore and jordisite.
Jordisite associated with the Poison Canyon ore is much moremassive and extensive. Instead of feathery masses, the jordisiteoccurs as layers, often 6 inches (15 cm) thick but rarely over 1 ft(30 cm) thick. Here, also, a narrow band of barren sandstoneseparates ore and jordisite.
The jordisite, typically brownish-gray, has a molybdenum con-tent ranging from 0.03 to 0.08 percent and a U,O» content as highas 0.06 percent. In general, jordisite is locally abundant withincertain ore pods but is volumetrically unimportant in the mineworkings.
Ore controlsSEDIMENTARY CONTROLS—The one major sedimentary ore
control is the presence of a quartz-rich, arkosic, fluviatile sand-stone. This type of sandstone is the only host for ore in theGrants region. Within this sandstone are a number of smallerscale features which locally may be important to the depositionalcontrol of the ore: diastems, bedding planes, grain size and sort-ing, calcite cement, and carbonaceous n' iterial.
Observations lead to the conclusion that, of these smaller scalefeatures, only carbonaceous material exerts considerable controlover ore emplacement. Carbonaceous matter (humate) is presentin every sandstone uranium mine in the Grants region (Granger,1968). All primary ore is coextensive with carbonaceous matter.Granger (1968) also stated that all such carbonaceous materialhas been at least partially mineralized with uranium; conversely,no uranium of undisputedly primary origin has been found awayfrom carbonaceous matter.
These statements are certainly true of the Johnny M mine. Allof the ore that has been or is being mined is intimately associatedwith black to dark-brown carbonaceous material in the sand-stones; no ore has been found in sandstone devoid of this carbon-aceous matter. Patches of black material are frequently foundthat look like ore but actually consist of very low grade mineral-ization.

238
STRUCTURAL CONTROLS—Structure has been mentioned as anore control (Clark and Havenstrite, 1963). In the Johnny M minethere are no structural features that appear to control the ore.The faulting encountered in the mine offsets orebodies as muchas it offsets stratigraphic units. Where the ore abuts a fault plane,such minute amounts of ore are contained within the fault planethat virtually nc movement of ore after faulting has occurred.Consequently, no stack ore is present in the Johnny M mine.Joints and fractures also crosscut the ore in the same manner asdo the faults.
Age of the oreSeveral parameters limit the age range of the uranium ore
deposits.STRUCTURAL EVIDENCE—Faulting in the southern San Juan
Basin has been related to structural deformation associated withthe Laramide (Late Cretaceous-early Tertiary; Kelley, 1963)uplift of the Zuni Mountains. Because orebodies in the Grantsregion are displaced by some of these faults that radiate north-ward from the Zuni Mountains, the uranium-ore deposits are in-ferred to have formed before the faulting occurred, and aminimum age of pre-Laramide is indicated for the orebodies.
STRATIGRAPHIC' EVIDENCE—Granger and others (1961) havestudied collapse structures present in the Ambrosia Lake district.They concluded that ore, which is localized around the cylin-drical features, is probably pre-Laramide, the inferred age of thecollapse structures.
The Dakota Formation and the upper 30 ft (10 m) of the Mor-rison Formation are not displaced by the collapse structures inthe Cliffside mine (Clark and Havenstrite, 1963), although bedsa few tens of feet lower show full displacements. The collapsestructures and the associated ore, therefore, must have beenformed during deposition of the Morrison Formation.
Nash and Kerr (1966) established a pre-Dakota age for the ura-nium ore in the Paguate mine in the Jackpile sandstone. Theydescribed a section of ore-bearing sandstone at the lop of theJackpile sandstone that is truncated by a pie-Dakota erosion sur-face. These geologic relations are clear enough to establish adefinite pre-Dakota age for the ore.
RADIOACTIVE DATING—In 1963, Miller and Kulp, usingU-'":Pb:"7 ratios, calculated ages of 210 m.y. for she uraniumdeposits in Triassic rocks on the Colorado Plateau and of about110 m.y. for deposits in the Morrison Formation. They con-cluded that the ore deposits formed soon after deposition of thehost rocks. Granger (1963b) estimated an age of about 100 m.y.for the uranium deposits in the Ambrosia Lake district but notedthat this is probably a minimum age. R. S. Delia Valle (personalcommunication, 1978) has been engaged in a geochemical studyof several orebodies in the Grants region. His preliminary age de-terminations indicate that the ore deposits become successivelyyounger upsection in theMorrison Formation. The ages obtainedrange from 150 to 140 m.y., suggesting that the ore formed dur-ing or immediately after deposition of the host sands.
Source of the uranium andassociated ore elements
The major hypotheses concerning the source of the ore insandstone-type uranium deposits are: 1) ascending uraniferoushydrothermal solutions, 2) leaching of granitic rocks assumed tobe the source of the sediments, 3) leaching of the host sedimentsby ground water, 4) leaching of volcanic ash deposited synchron-ously with the host sediments, and 5) leaching of the bentoniticshales (Brushy Basin) stratigraphically above the host sedimentsby ground water.
The most plausible sources for the uranium are leaching ofgranitic rocks and volcanic ash. Based on the following argu-ments, volcanic ash seems to be a more likely source than graniticrock: 1) Granitic rocks are a possible source for most of the ore
elements associated with uranium but are probably not an ade-quate source for selenium and arsenic, whe.eas volcanic ashprobably is an adequate source for all of the elements. 2) Ura-nium in granite either occurs in accessory minerals (sphene andzircon) and silicates (micas) and is unavailable for ore formation;or it is present along grain-to-grain boundaries and is likely to bereleased during weathering and then dispersed and diluted in thesurface runoff. Uranium in volcanic ash is more likely to bereleased in an environment favorable to ore deposition. 3)Ground-water data tend to confirm that uranium can be derivedfrom volcanic detritus more readily than from granites.
Of the two theories employing volcanic ash as the source of theore elements, I strongly prefer the syngenetic mode! for thesereasons: 1) By having the uraniferous air-fall tuffs deposited ator near the same time as the host sands, the uranium is imme-diately put into a system with favorable environments for oreformation without requiring long transportation. 2) Uraniumleached from a bentonitic mudstone (Brushy Basin Shale) 100 ft(33 m) thick, with a very low permeability, and transported byground water to favorable sandstone horizons below is difficultto accept. 3) If the Brushy Basin Shale is actually the source forall the uranium in the Grants region, why is the Brushy Brisinuniformly and anomalously high in uranium? 4) Owing to rain-fall during deposition of the Brushy Basin, a substantial amountof the uranium probably would be lost to surface runoff andwould not be available later.
The most plausible source of the uranium and associated oreelements in the sandstone-type uranium deposits in the Grantsregion is volcanic ash; ore elements were released to the hostsediments contemporaneously with deposition of these sedi-ments.
Scenario of ore formationVolcanic ash brought to northwestern New Mexico by westerly
wind patterns presumably was derived from extensive volcanicactivity in the western United States during deposition of theMorrison Formation (C. E. Chapin, personal communication,1978). This air-fall tuff would have been deposited in the regionwhere the Morrison sediments accumulated. Deposition of theash in the fluvial system would have initiated leaching of the oreelements and their subsequent release into ihe stream water andnear-surface ground water. Owing to the wide dispersion of theair-fall tuff, surface runoff would have also contained some oreelements in solution, resulting from leaching of the ash by rain-fall.
The fluvial system that deposited the Morrison Formation con-tained much vegetation. Vegetation accumulated in local back-water swamps, abandoned channels, and on exposed bars. Thetrash piles would probably have been formed in backwaterswamps or abandoned channels that were flood-connected to theactive sedimentation system. Constant decay of the organicmaterial would have released humic acids into the fluvial system.
The uranium and ore elements were adsorbed and reduced bythe humic acids present (aided by bacteria), and uraniferous-organic complexes formed. These complexes may have formed inthe surface waters and easily permeated the recently depositedsands, thereby entering the near-surface ground water. Themigration of these uranyl humates would have been impeded bymudstone layers that acted as permeability barriers. Clay gallswould not be expected to be mineralized by the uranyl humatesbecause of their lower permeability. The uranyl humates ulti-mately formed a gel and eventually became insoluble. Theuraniferous-organic complexes formed and precipitated at orvery near the surface—an inference from our knowledge thatsome ore bands in the mine are truncated by a channel scour, in-dicating the ore processes occurred essentially on the surface.Most uranyl-humate complexes migrated into the ground waterwhere they were ultimately flocculated. The various shapes at-tained by the individual ore pods are the result of the differentflow patterns of the ground water.

239
Since the uranium complexes are envisioned as having formedin the surficial waters, the ore pods might have been expected toconform very closely to the sedimentary structures; this expecta-tion is not confirmed by the Johnny M mine. As the humate com-plex formed a gel, it migrated in the water and passed throughthe permeable sandstones. The permeabilty controls would beless effective in the newly deposited and unconsolidated sedi-ments. With time, the migrating gel became more viscous andfinally coalesced into the form we see today, with curving boun-daries truncating sedimentary structures.
Once buried under sediments, the uranium may have under-gone further secondary chemical changes in the course of thelong geological processes of coalification and fossilization(Szalay, 1958). Secondary enrichment and mineralization mayhave taken place, according to local conditions. The host rocksthemselves may have undergone changes after burial. The colorschemes present in the uranium-bearing sandstones were prob-ably caused by either diagenesis or later ground-water move-ments.
The factors controlling the time and location of concentrationof uranium and other ore elements are humic acids derived fromdecaying plant matter and deposition of a uranium-rich air-falltuff or ash. While humic acids probably would have been presentduring most of the history of the sediment deposition, uraniumand associated ore elements would have been present in thewaters on an irregular basis, owing to the sporadic nature of air-fall eruptions. This factor would explain why there are barrensand beds located between sands that are ore bearing; no ura-nium was present in the fluvial system when the barren sandswere deposited. While no absolute time can be given for the inter-val between the deposition of the volcanic ash and the ultimateformation of the ore, the processes seem to be geologically rapid.
Conclusions1) The fluvial environment in which the host sediments were
deposited consisted of a network of aggrading braidedstreams and meandering streams generally flowing in aneast-southeast direction.
2) The carbonaceous matter intimately associated with theuranium ore was originally humic material derived fromthe decay of plant material occurring in the fluvial environ-ment.
3) The uranium and associated ore elements were derivedfrom volcanic ash deposited contemporaneously with thesediments.
4) Accumulation of uranium and other ore elements tookplace while the humic acids were migrating in aqueous solu-tion, either at or near the surface.
5) Ore formation was definitely completed during Jurassictime and probably during deposition of the host rocks. Thesubsequent deep burial, coalification, and faulting of theorebodies were later processes unrelated to ore deposition.
6) The orebodies are localized in paleostream-channelsystems, thereby accounting for the linear aspects of theorebodies or trends.
7) The only factors controlling the location and time of oredeposition are the presence of anomalous amounts of ura-nium ions in the fluvial system and the existence of favor-able humic acids to trap and concentrate the uranium andother ore elements.
ReferencesClark, D. S., and Havenstrite. S. R.. 1963, Geology and ore deposits of
the Cliffside mine, Ambrosia Lake area, in Geology and technology ofthe Grants uranium region, V. C. Kelley, compiler: New Mexico Bur-eau of Mines and Mineral Resources, Mem. 15.p. 108-116
Craig, L. C , Holmes, C. N., Cadigan, R. A., and others, 1955, Stratig-raphy of the Morrison and related formations, Colorado Plateauregion, a preliminary report: U.S. Geological Survey, Bull. 1009-E, p.125-168
Folk, R. L., 1968, Petrology of sedimentary rocks: Austin. Texas, Hem-phill's. 170 p.
Granger, H. C , 1963, Radium migration and its effect on the apparentage of uranium deposits at Ambrosia Lake, New Mexico: U.S. Geolog-ical Survey, Prof. Paper 475-B, p. 60-63
, 196S, Localization and control of uranium deposits in thesouthern San Juan Basin mineral belt. New Mexico—an hypothesis:U.S. Geological Survey, Prof. Paper 600-B, p. 60-70
Granger, H. C , Santos, E. S., Dean, B. G., and Moore, F. B.. 1961,Sandstone-type uranium deposits at Ambrosia Lake, New Mexico—aninterim report: Economic Geology, v. 56, no. 7, p. 1179-1210
Kelley, V. C , 1963, Tectonic setting, in Geology and technology of theGrants uranium region, V. C. Kelley, compiler: New Mexico Bureau ofMines and Mineral Resources, Mem. 15, p. 53-59
Krumbein, W. C , and Sloss, L. L., 1955, Stratigraphy and sedimenta-tion: San Francisco, W. H. Freeman and Co., 497 p.
Miller, D. S., and Kulp, J. L., 1963, Isotopicevidence on the origin of theColorado Plateau uranium ores: Geological Society of America, Bull.,v. 74, p. 609-627
Nash, J. T., and Kerr, P. F., 1966, Geologic limitations on the age of ura-nium deposits in the Jackpile sandstone, New Mexicr Economic Geol-ogy, v. 61, p.1283-1287
Pettijohn, F. J., 1957, Sedimentary rocks: New York, Harper and Row,718 p.
Rapaport, I., 1963, Uranium deposits of the Poison Canyon trend,Grams district, in Geology and technology of the Grants uraniumregion, V. C. Kelley, compiler: New Mexico Bureau of Mines andMineral Resources, Mem. 15, p. 122-135
Reineck, H. E., and Singh, I. B., 1975, Depositional sedimentary envi-ronments: Berlin, Springer-Verlag, 438 p.
Riese, W. C , 1977, Geology and geochemistry of the Mount Tayloruranium deposit, Valencia County, New Mexico: M.S. thesis, Univer-sityofNewMexico, 118 p.
Squyres, J. B., 1970, Origin and dcpositional environment of uraniumdeposits of the Grants region, New Mexico: Ph.D. thesis, StanfordUniversity, 228 p.
Szalay, A., 1958, The significance of humus in the geochemical enrich-ment of uranium: Geneva, 2nu International Conference on PeacefulUses of Atomic Energy, Proc, v. 2, p. 182-186

240
AN ANOMALOUS OREBODY WITHIN THEAMBROSIA LAKE TREND AT SANDSTONE MINE
by John F. Foster and Roberi J. Quimanar, United Nuclear Corporation,P.O. Box 199, Grants, New Mexico 87020
AbstractThe Sandstone mine contains an anomalous orebody that lacks
the characteristic coloring and high gamma-ray expression typic-ally associated with unnium ore in the Ambrosia Lake district.The orebody occurs at the downdip edge of a tongue of hematiticsand in the basal sand unit of the Westwater Canyon Member ofthe Morrison Formation. The orebody ranges from white to lightgray in color. Preliminary analysis indicates the presence ofuranophane (C^UO^SiO^OHh-SH^O), evidently altered fromcoffinite, which is the predominant uranium mineral in the dis-trict. Equivalent U,O, indicates that this orebody is relatively re-cent. Oxidizing meteoric water, which formed a geochemical cell,remobilized uranium minerals in preexisting trend orebodies anddeposited the uranium downdip of the furthest extent ot this cell.Post-Dakota deformation influenced the course of the migratingmeteoric water and the extent of the redox interface controllingthe orebody. As sampling and mining lower grades of uraniumbecomes increasingly more economical, the potential forunknown reserves adjacent to the redox interface should not beoverlooked.
IntroductionWithin the Ambrosia Lake trend, uranium deposits occur in
the Westwater Canyon Member of the Morrison Formation. TheSandstone mine is located about 30 mi (48 km) northeast ofGrants, New Mexico, in the Ambrosia Lake district (sec. 34, T.14N..R. 9W.).
There are five ore horizons at the Sandstone mine. These orehorizons are coarse- to fine-grained crossbedded sandstones,bounded by mudstones, which dip gently to the northeast. This
paper discusses only the A level, which is the lowermost sand unitin the Westwater Canyon Member. The A sand is bounded aboveby a mudstone and below by the Recapture Member of the Mor-rison Formation. The study area extends from the eastern faultzone of the Sandstone mine graben to an unmarked boundaryabout 1,500 ft (460 m) to the east (fig. 1). Contained within thisarea is a tongue of hematitic oxidized sandstone. The purpose ofthis study was to demonstrate that the presence of this red sand-stone has had a pronounced influence on uranium mineralizationin the A sand.
Procedures used included a preliminary reconnaissance of thearea, which was then supplemented by detailed mapping andsampling programs. A step-faulted graben structure and theregion outside the graben were the focus of the mapping andsampling. The relationship between sandstone and mudstone wasestablished from surface drill holes and underground longholeprobes. Cementation, grain size, color, and surface oxidationwere noted. The boundaries between red oxidized sand and grayreduced sand were mapped, along with the occurrences of light-green to yellow surface oxidation. This bloom of oxidized ura-nium minerals occurs as a surface coating in some parts of old,well-ventilated mine workings.
Channel sampling, which is accomplished by making a groovedown a face with a rock pick and collecting the chippings, provedineffective owing to possible contamination from the bloom.Lateral capillary action, affecting an area extending approx-imately 6 inches in from the ribs, is thought to be responsible forthe bloom. By using a portable electric drill equipped with a 1-inch-diameter masonry bit, contamination by bloom was elim-inated. The first few inches of the drill cuttings were discarded,leaving a virtually bloom-free sample that has a relatively highconcentration of uranium.
Sandstone MineGraben
On Zone
SANDSTONE MINEFIGURE 1 PLAN VIEW OF A-LEVEL SANDSTONE, SHOWING OBSERVED CONTACTS AND LOCATION OF SAMPLED AREAS.

241
Preliminary analysis of the samples was done at the mine,using a gamma counter for determining eV,O, and x-ray fluores-cence for determining actual U,O,. Further analysis was per-formed by Core Laboratories in Albuquerque, New Mexico.Equivalent uranium was determined using the closed-can gammatechnique, whereby radon gas is allowed time to come into equi-librium with the sample. Colorimetric and fluoromeiric tech-niques were used to determine chemical-uranium content.
ACKNOWLEDGMENTS—We acknowledge the support of UNCResources Company in preparation of this report and extendthanks to Douglas Brookins of the University of New Mexico forhis technical assistance.
Geology of the altered sandstoneThe hematitic sandstone, like the rest of the A-level sandstone,
is characterized by abundant crossbedding and grain size thatvaries from coarse to fine. The red sandstone is poorly cemented,and color varies from moderately reddish orange to moderatelyred. Bedding planes and the coarser sandstone show the most in-tense coloration.
Oxidized sandstone has been observed only on the A level. Thehematitic sandstone extends some 1,300 ft (400 m) northeast ofthe eastern fault zone of the Sandstone mine graben. The oxi-dized portion varies in width from 1,100 ft (335 m) close to thegraben to 500 ft (150 m) about 900 ft (275 m) east of the fault(fig. 1). All dimensions of the red sandstone are measured attrack-level intercepts and at contacts within the A-10 stope (fig.1). The thickness of the red sandstone varies from more than 20ft (6 m) in the A-9 stope to less than 2 ft (60 cm) in the A-10stope. Both the no. 2 and no. 4 track exposures show the redsandstone rolling up into the back of the drift (fig. 2), indicatingthat the track-level interfaces are below the more extensive partof the oxidized sandstone.
Assays from samples taken across the oxidized/unoxidized in-terface on track level are reported in table I. Values in the oxi-dized sandstone are subore in grade and generally show slightpositive disequilibrium (cUiO^eUjO,). Samples from un-oxidized sandstone downdip of the interface are generally ofhigher grade and are also in positive disequilibrium. Assays forsamples taken from the upper part of the sandstone in the A-9stope about 15 ft (4.6 m) above the no. 4 track intercept are givenin table 2. The samples of the oxidized sandstone are in negativedisequilibrium and low in grade.
Within the A-9 stope, the oxidized sandstone is in direct con-tact with dark-gray ore-grade material. The dark-gray sandstoneis tightly cemented by calcite, whereas the red sandstone below isquite friable. Both types of sandstone are mineralized (table 2),but the dark sandstone is essentially in radiometric equilibrium,whereas the oxidized sandstone lacks radiometric expression. Be-cause of cementation and the relationship to the oxidized sand-stone, the A-9 mineralization is believed to be a relict orebody(fig. 3).
The A-10 stope and A-10 track are downdip of the red-sandstone roll. The sandstone on A-10 track is very light gray
FIGURE 2—PHOTOGRAPH OF RED SANDSTONE ROLLING INTO BACK OF DRIFTON NO. 2-W TRACK.
and is covered by uranium bloom. This bloom is a yellow tolight-green uranium oxide and is mos; prominent in sandstonewith poor cementation. Samples taken on the track show a highpositive disequilibrium and subore-grade mineralization (table3).
The A-10 stope is directly above track level and extends about80 ft (24 m) west of the track. The sandstone in the stope variesfrom light brown to dark gray. The light-brown sandstone is azone of altered, limonitic sandstone. Locally, the color is veryfaint and may be indicated only by the presence of a light-brownhalo around pyrite crystals. A lower ore horizon beneath thiszone of limonitic alteration has been confirmed and defined bylonghole drilling. These two ore horizons coalesce in the northernpart of the A-10 stope. Where the ore zones unite, the sandstonechanges from light gray or light brown to dark gray. The dark-gray sandstone is highly mineralized and is tightly cemented. Thelight-gray and some of the light-brown sandstones have subore
TABLE 2—URANIUM ASSAYS (I'LRCL-NT) OISAMPLES TAKEN ADJACENT TO RELICT ORliHODVWITHIN THE A-9 STOPE ('oxidized sandstone( - ) , relict mineralization ( + ); 'friable;'cemented).
ation' (-'U3Os
0.003
0.018
0.009
+ ' 0.455+ ' 0.270
eU3O,
0.037
0.061
0.002
0.2690.294
TABLE 1 —URANIUM ASSAYS (PERCENT) OF SAMPLES TAKEN ON TRACK LEVELNEAR BASE OF RED SANDSTONE ('distance updip ( - ) or downdip (+ ) ofredox interface).
2-W track 4-W track
TABLE 3—URANIUM ASSAYS IPER-CENTI OISAMPLES TAKEN ON A-10 TRACK LEVEL INLOWER LIMB OF A - 1 0 MINERALIZATION('distance south of A-10 stope raise, 10 ftbelow stope).
footage'
-50
- 4 0
- 5+ 5
+ 10
cUjO8
0.021
0.025
0.025
0.1110.099
eU3O8
0.001
0.003
0.008
0.016
0.016
footage
-30
- 1 5
- 5+ 5
cU3O8
0.001
0.014
0.011
0.021
eU3O8
0.003
0.005
0.0010.012
footage'
0
2550
75
100
cU3Og
0.038
0.060
0.048
0.094
0.052
eU3Og
0.018
0.027
0.021
0.0610.029

242
6Meten
SW
NE
A-ZsneSond
F I G U R E 3—ScHtMAIIC CROSS StCTION Ol HtMATIHC SANDSTONF. SHOWING Rfcl ATIONSHIPS BirWFIN A - 9 STOl'F.. TRACK INTERCEPTS, AND
A-10sTOPl.
TABLE4—URANIUM ASSAYS (I'l-RCbNTi (ii-SAMPll-s I A M N W I I H I N IHF A - 1 0 S I O P I .
limonitcU,OK
0.008
0.039
0.0590.0700.0350.060
0.059
mean 0.047
ezoneeU.,O»
0.014
0.032
0.0730.0860.081
0.051
0.162
0.071
lighl-gray ssabove limonite
cU,Os
0.064
0.079
0.133
0.170
0.225
0.133
0.216
0.146
eU,O8
0.039
0.058
0.103
0.140
0.182
0.095
0.142
0.108
dark-gray ssin front of limonitccU3OB
0.227
0.336
0.555
0.265
0.307
0.195
0.228
0.302
eU,O8
0.223
0.339
0.563
0.217
0.270
0.202
0.205
0.288
green-water assay
10-3-78 111 ppm
5-4-79 176 ppm
TABLE 5—PtTROCiRAPHIC AND X-RAY-DIFFRACTION ANALYSIS FOR SELECTED SAMPLES FROM THE A-lOsTOPE (see fig. 4 for locations).
ample
A-l
A-2A-3A-4
color
graygraygray
dk gray
porosity
goodgoodgoodgood
mairix
clayclayclayclay
calcite
trace
trace
quartzovergrowths
yesyesyesyes
pyrite
abund.abund.abund.abund.
carbonaceousmaterial
tracetracetracetrace
comments and x-ray-diffraction analysis
kaolinite
86%78%82%
chlorite
65%
12%
Hike/montmorillonite
35%14%10%12%
A-1 possible uranophane with poor crystal structure
A-2 —A-3 possible uranophane with poor crystal structure, early
hematitic alterationA-4 coarse-grained sandstone; high-grade uranium mineralization
243
Water
I ' I12 Meier*
FIGURE 4 — M A P OH A-10 STOHK SHOWINC; LOCATION OI PUTROCJRAPHIC
SAMPl.kS: I.OC AIIONOl OREI-N WATER IS OUTSIDE: Ol UMONITIC ZONK.
mineralization and exhibit both positive and negative disequil-ibrium (table 4).
As development of the upper ore horizon progressed towardthe north, the ore zone dipped sharply and increased in grade.Abundant pyrite is especially conspicuous, as is the color changefrom light to dark gray. Where the heading went down followingthe ore, a pool of drill water collected at the sill of the drift. Aftera period of two weeks, this water acquired a definite greenishcoloration. Assay of the water showed that it contained 180 ppmuranium.
DiscussionThe red, hematitic sandstone indicates the presence of a geo-
chemical cell that has created an anomalous orebody downdip of
the altered sandstone. The red sandstone is in direct contact withore-grade mineralization in the A-9 stope. A reasonable assump-tion is that part of this preexisting body was remobilized whenthe sandstone was attacked by oxidizing water. The negative dis-equilibrium of the red sandstone in the A-9 slope may verify thehypothesis that same of the uranium was remobilized. SinceTh"° and Ra!!° are gamma emitters, they may account for theanomalously high gamma assay (negative disequilibrium) whereuranium has been leached preferentially. Further investigation ofthe mobility of uranium-decay products and their effect on ura-nium equilibrium is needed. This knowledge will become in-creasingly important as lower concentrations of uranium becomeeconomical to mine.
The uranium that was mobilized from the A-9 stope moveddowndip until it was reprecipitated about 1,000 ft (300 m) north-east of the A-9 stope (fig. 3), resulting in the anomalous A-10orebody. As noted, the A-10 orebody comprises two tabular orehorizons that coalesce downdip. The negative disequilibrium(table 4) encountered in the A-10 stope is confined almost entire-ly to the zone of limonitic alteration. The positive disequilibriumof the light-gray ore is indicative of fairly recent deposition.
Samples taken in the limonitic zone and adjacent ore zone (fig.4) underwent petrographic and x-ray-diffraction analysis. Petro-graphic study suggests alteration of the pyrite and increased claycontent in the limonitic zone. X-ray-diffraction indicates thepossible presence of uranophane with very poor crystal structure(table 5). Samples adjacent to the outer edge of the limonitic zoneshowed no oxidation of the pyrite, lower clay content, and noevidence of uranophane. This analysis suggests that there is azone of hexavalent-uranium mineralization adjacent to the redoxinterface. Uranophane is not a common uranium mineral in thesandstone deposits of Ambrosia Lake; possibly, it is an alterationproduct of the abundant tetravalent mineral, coffinite. Anotheralternative is that uranophane is a primary precipitate of theenriched water that created the geochemical roll front. The poor-ly crystalline structure of the uranophane could be caused by theattack and remobilization that produced the limonitic zone.
The presence of hexavalent-uranium mineralization also couldaccount for the presence of the uranium-enriched water at thebottom of the A-10 stope. Because of the high solubility of hexa-valent uranium, it would dissolve readily, thereby enriching thewater.
Recognition and delineation of the redox interface is of im-portance in evaluating any orebody. This evaluation calls for acoordinated sampling and mapping program near the perimeterof all oxidized sandstone. The uranium industry should be ableto recognize oxidized sandstone and its economic implications.

244
SCANNING-ELECTRON-MICROSCOPE INVESTIGATIONOF PARAGENESIS OF URANIUM DEPOSITS,
MOUNT TAYLOR AND ELSEWHERE,GRANTS MINERAL BELT
by Walter C. Riese, Guif Mineral Resources Co., 6106 Kircher Blvd. N.E., Albuquerque, New Mexico 87109,Douglas G. Brookins and Richard S. Delia Valle, Department of Geology, University of New Mexico,
Albuquerque, New Mexico 87131
AbstractScanning-electron-microscope study of authigenic minerals in
(he Westwater Canyon Member of the Morrison Formation (Up-per Jurassic) indicates that compositional variations exist withinand adjacent to sandstone-type uranium deposits. Mont-morillonite is the dominant clay mineral downdip of the ore-body; ch'Ki'te is enriched in the ore zones, and kaolinite andaltered montmorillonite are enriched in ground updip of the ore.The data also suggest that clay minerals, noi pyrite or hematite,may locally be the iron-bearing species of importance. While it isnot possible to positively identify organic materials in SEM(scanning-electron microscope) photomicrographs, materials de-duced to be organic in nature postdate the beginning of authi-genic clay formation. This implies that these materials may becarriers of uranium in the ground-water system from which theore deposits precipitated. Identification of patterns of clay-mineral alteration and the role that organic materials might playas transporting media could significantly alter exploration tech-niques. These patterns may be especially useful tools in areaswhere the orebodies are known to be removed from the iron-species redox interface.
IntroductionRegional geology
The Grants mineral belt consists of a series of mining districtsstretching from east of (he town of Grams northwest to the town
of Gallup (fig. 1). The principal host rock in this area is the Mor-rison Formation (Upper Jurassic), which is composed of fluvialsandstone lenses interbedded with mudstone (fig. 2). Many ofthese sandstone lenses are arkosic, and some of the mudstonescontain clay minerals derived from volcanic ash. The streamsthat deposited the host sandstones flowed from northwest tosoutheast, along the trend of the mineral belt.
ACKNOWLEDGMENTS—We gratefully acknowledge the assist-ance and clearances permitted by the following laboratories andcompanies: Gulf Mineral Resources Company, Gulf Science andTechnology Company, Continental Oil Company, ContinentalOil Research Laboratories, Mobil Oil Research Laboratory, theAnaconda Company, United Nuclear-Homestake Partners,Kerr-McGee Corporation, Cities Service Oil Company, andUnited Nuclear, Inc. Financial support for this study was partial-ly provided by Bendix Field Engineering and the Department ofEnergy (contract numbers AT (05-D-1636-I and BFEC-f76-209-E).
Clay mineralogyThe clay mineralogy of the Morrison Formation in the Grants
mineral belt has been studied extensively by Keller (1962),Granger (1962), Nash (1968), and Kendall (1971), among others.Most of these studies have been limited to examination of localaspects of clay mineralogy; although attempts have been made toestablish relationships between clay mineralogy and uraniummineralization in this region, no clear patterns have been recog-
SMITH LAKEDISTRICT
v AMBROSIADISTRICT
MT TAYLORPEAK ° '
'--» Southern limit of Morrison fm
10 mi
INDEX MAP of GRANTS MINERAL BELT AREAFIGURE 1—INDLX MAP oj-THE GRANTS MINERAL BELT AREA, showing its several districts and the location of
the Mount Taylor deposit.

245
Jmlwc
Jmrc
FIGURE 2—GENERAI IZED CROSS SECTION OI MORRISON STRATIGRAPHY INrut MOUNT TAVT OR AREA. The total section shown is approximately300 fi; total width of section is approximately 1.5 mi; north is to therighi. The symbols on this figure refer lo the following units of theMorrison Formation: Jmrc—Recapture Member, Jmlwc—lower Wesl-waier Canyon lithosome, Jmk—K shale, and Jmbb—the Brushy BasinMember. Other units shown are: Kd—Dakota Sandstone, and Km—Mancos Shale.
nized. Keller (1962), in particular, has indicated that no specificclay minerals can be used as guides to finding uranium ore, al-though he did recognize the need for more work, especially poly-typism and trace-element studies.
This study has considered a broad, regional assemblage of clayminerals, which will be divided into four groups: outcrops, bar-ren samples taken updip from the ore, ore zones, and barrensamples taken downdip from the ore. Emphasis has been given tosamples from the Westwater Canyon Member, particularly sub-surface samples that are well removed from the effects of out-crop alteration. The analytical procedures used are outlined inLee (1976) and will not be elaborated on here. In order to cali-brate the SEM photos, x-ray diffractograms of oriented sampleswere obtained for air-dried, glycolated, heated, and acid-treatedsamples. Random powders were x-rayed mainly for the differen-tiation of polytypes and identificaion of nonclay minerals. Thecriteria used in this phase of the study are also discussed in Lee(1976).
The clay-mineral alteration patterns identified in this studyhave been found to be present whether or not the ore resides at aniron-redox interface. This observation is particularly significantbecause the Mount Taylor deposit, from which much of the datahas been obtained, does not reside at an iron-redox interface,although the other transition metals that usually form zonesacross deposits produced by lateral secretion also form zoneshere.
Additionally, although many of the photomicrographs used inthis paper are of samples from the Mount Taylor deposit, manyother deposits and areas were also examined. The majority of thetype-photomicrographs in this paper are from the Mount Taylordeposit because it is the one that has been studied in the mostdetail and because these are the best examples of the assemblagesthat are herein described.
Type samplesAn understanding of what more or less perfect samples of each
clay look like in SEM photomicrographs is important in thisstudy. Kaolinite appears as a collection of thick, stacked books,as shown in fig. 3. Kaolinite occasionally assumes a worm-likemorphology, and this vermicular form is shown in fig. 4. Chlor-ite can be seen as two distinct morphologies. The first is an openedge-to-face arrangement (fig. 5). The second is a collection of
FIGURE 3—SEMKAOLINITL.
5.0 u
PHOTOMICROGRAPH SHOWING A TYI'h SAMPl.L Oh
FIGURE 4—SEM PHOTOMICROGRAPH SHOWING A TYPE SAMPLE OI VER-
MICULAR KAO1.INITE.
FIGURE 5—SEM PHOTOMICROGRAPH SHOWING A TYPE SAMPLE OFCHLORITE IN EDGE-TO-FACE ARRANGEMENT.

246
small rosettes (fig. 6). Fig. 7 shows montmorillonite in its typicalhoneycomb morphology. Illite-montmorillonite mixed-layer as-semblages, although members of the smectite group, look morelike thin, undulating blankets with slightly curling edges (fig. 8).
Clay-mineral distributionsAlthough not " C " shaped, in other respects many orebodies in
the Grants mineral belt conform to Harshman's (1970) model forroll fronts: identifiable iron species are usually reduced downdipof the ore and oxidized updip from it, and various trace elementsare distributed in a zoned alteration pattern across the ore in thedip direction. Assuming that this chemical distribution is in-dicative of the direction that ore-forming fluids moved, we deter-mined that if clay minerals formed similar zonation patternsacross orebodies, they would further support a lateral secretionhypothesis for genesis of these deposits. Also, such zonationmight prove to be a useful tool for exploration, especially inareas like the Mount Taylor deposit where much of the iron doesnot seem to be present in either pyrite or hematite and is there-fore less visible. This study indicates that clay minerals arezoned—but in a very subtle fashion. No one clay is present ex-clusively in front of, within, or behind an orebody. This zonationcan be illustrated with a sequence of figures representing a crosssection from the front or downdip side of an orebody to the backor updip side.
Fig. 9, the first in the sequence, shows a montmorillonitehoneycomb well hidden by what is believed to be amorphousorganic material. Also present are rosettes of chlorite, alteringfrom montmorillonite, and a few authigenic quartz crystals. Thissample was taken from core that was cut about a mile downdipof the nearest known ore. Moving closer to the ore (fig. 10), in-dividual detrital grains are found covered by chlorite that hasformed as an alteration product from montmorillonite. Fig. 11 isa closer view of fig. 10. We also see a bit more organic material,shown in fig. 12. Mixed-layer illite-montmorillonite assemblagesare also found in close proximity to the ore (fig. 13).
In the ore zones, rosette chlorites such as those shown in fig. 14are the dominant clays. However, as described earlier, kaolinitesand montmorillonites may also be found in the ore zones. Ore-zone examples of these are shown in figs. 15 and 16, respectively.Other clay minerals that have been identified in the ore zones in-clude illite needles (fig. 17), chlorite-illite mixed-layer assem-blages (fig. 18), and chamosiie (?), shown in fig. 19. Nonclayminerals that have been found in the ore zones include feldspars(figs. 20, 21), carbonates (fig. 22), pyrite (fig. 23), and titaniumoxides (fig. 24), which form through the alteration of detritaltitanomagnetite grains. In at least one deposit—Mount Taylor—we have also found what appear to be plant spores (figs. 25, 26).Final identification of these forms has not yet been made becausethey are smaller than any spore previously identified. Primaryuranium-bearing species are almost nonexistent in the samplesstudied from the Grants mineral belt. Instead, the uranium seemsto be complexed by adsorbtion on clay minerals and by chelationwith various humic complexes. Only one sample has shown a pri-mary uranium mineral, coffinite, shown in fig. 27.
Updip of ore, kaolinite becomes the dominant clay (fig. 28);also present are authigenic feldspars, although in this area theyusually appear significantly more altered. An example of thisalteration is shown in fig. 29.
As noted, hematite and pyrite are not necessarily the iron-bearing species of importance. This conclusion is best illustratedby the Mount Taylor deposit where the only hematite found todate has been a full half mile updip of the ore. This sample isshown in fig. 30; note the small size of the nodules. Iron in thisorebody has been found in clay minerals such as those shown infig. 31. Elemental x-ray scans, where available, support thesefindings.
FIGURE 6—SEM PHOTOMICROGRAPHCHLORITE ROSETTES.
SHOWING A TYPE SAMPLE 01
FIGURE 7—SEM PHOTOMICROGRAPH SHOWING A TYPE SAMPLE ay MONT-
MORILI.ONITE IN ITS TYPICAL HONEYCOMB MORPHOLOGY.
FIGURE 8—SEM PHOTOMICROGRAPH SHOWING A TVPE SAMPLE OF ANILLITE-MONTMORILLONITE MIXED-LAYER ASSEMBLAGE.

247
FIGURE 9—SEM PHOTOMICROGRAPH SHOWING A MONTMORUI UNITE
HONEYCOMB WELL HIDDEN BY ORGANIC (?) MATERIAL; also shown areseveral rosettes of chlorite and several authigenic quartz grains.
FiGURE 12—SEM PHOTOMICROGRAPH SHOWING AN INTERGRANUIAR AC-
CUMULATION 01'ORGANIC (?) MATERIAL.
FIGURE 10—SEM PHOTOMICROGRAPH SHOWING AN INDIVIDUAL DETRITAL
GRAIN COMPLETELY MANTLED BY AUTHIGENIC CHLORITE; a l s o S h o w n a r e
I wo dark patches of organic material.FIGURE 13—SEM PHOTOMICROGRAPH SHOWING ILLITE-MONTMORILLON-
1TE MIXED-LAYER ASSEMBLAGES BEGINNING TO MANTIE A CHLORITE-
COATED DETRITAL GRAIN.
F I G U R E I I — A CLOSER VIEW OF HG. 10, WHICH SHOWS THE CHLORITE TO BE
IN EDGE-TO-FACE ARRANGEMENT; several flakes of illite-montmorillonitemixed-layer assemblage are shown near the upper and lower limits ofthe field of view.
FIGURE 14—SEM PHOTOMICROGRAPH SHOWING CHLORITE DEVELOPMENTIN AN ORE ZONE.
248
10.0 u
FIGURE 15—SEM PHOTOMICROGRAPH SHOWING K A O H N I T I D I V L I O P F IGURE 18—SEM PHOTOMICROGRAPH SHOWING A C H I O R I T K I L I iTt C>>MtN I IN AS OKI /ONI MIXEIM AVtK ASSfcMBl AG1: IN AN ORl ZONt.
3.3 « 3.3 u
FIGURE 16—SEM PHOTOMICROGRAPH SHOWING MONTMORII IONITE DE- FIGURE 19—SEM PHOTOMICROGRAPH SHOWING CHAMOSITE (?) DEVELOP-
VblOI'MlNl IN \SOKl /<)M MENT IN ANORE ZONE.
FIGURE 17—SEM PHOTOMICROGRAPH SHOWING ILLITE NEEDLES IN AN FIGURE 20—SEM PHOTOMICROGRAPH SHOWING AUTHIGENIC FELDSPARS
OPI /ONI . IN AN ORE ZONE; THESE ARE HIGH-NA PLAGIOCLASE FELDSPARS.

249
lO.Ou
FIGURE 21—SEM PHOTOMICROGRAPH SHOWING AUTHIGENIC FELDSPARS FIGURE 24—SEM PHOTOMICROGRAPH SHOWING TITANIUM OXIDES IANA-IN AN ORl: ZONE; THESE ARE HiGH-K FELDSPARS. TASE AND RUTILE) DEVELOPING THROUGH THE CORROSION Ol DETKITAI.
TITANOMAGNETITE.
FIGURE 22—SEM PHOTOMICROGRAPH SHOWING CARBONATE DEVELOP-
MENT IN AN ORE ZONE.
^E*v*10.0 L
FIGURE 25—SEM PHOTOMICROGRAPH SHOWING PLANT SPORES m.
FIGURE 23—SEM PHOTOMICROGRAPH SHOWING FRAMBOIDAL PYRITE DE-
VELOPMENT IN AN ORE ZONE.
l£u
FIGURE 26—A CLOSER VIEW OF FIG. 25.

H 230
FIGURE 27—SEM PHOTOMICROGRAPH SHOWING COIHNITL IN AN ORE FIGURE 30—SEM PHOTOMICROGRAPH SHOWING SMALL HEMATITEZONf- NODULES ON A CLAY SURIACE UPDIP OF AN ORE ZONE.
5.0 i
FIGURE 28—SEM PHOTOMICROGRAPH SHOWING KAOI.INITE DEVELOP- FIGURE 31—SEM PHOTOMICROGRAPH SHOWING HIGH-IRON SMECTITESMI-NT IN 1HI- ALTERED GROUND UPDIP I-ROM AN ORE ZONE. (MINNESOTA1TE?).
FIGURE 29—SEM PHOTOMICROGRAPH SHOWING AUTHIGENIC FELDSPARS FIGURE 32—SEM PHOTOMICROGRAPH SHOWING MONTMORILLONITEBEING ALTERED UPDIP IROM AN ORE ZONE. ALTERING TO ROSETTES Ol CHLORITE

251
Discussion
Updip and outcrop samplesThe updip and outcrop samples appear to have a rather uni-
form clay-mineral distribution, with montmorillonite and kao-linite being the dominant species in the Westwater CanyonMember. The distribution of minor illitic minerals is very erraticand appears to have no persistent pattern.
Most of the mommorillonite in the Morrison Formation isauthigenic, formed by devitrification and hydrolysis of the vol-canic ashes. Some may be detrital, but the crystalline, delicatemorphology shown in the photomicrographs suggests no multi-cycle deposition.
Kaolinite in the Westwater Canyon Member occurs as neststhat fill pore spaces and often enclose several sand grains. Thesenests show no oxidation coatings, and their size is proportionalto grain size and porosity. The kaolinite in the Jackpile sandstoneof the Brushy Basin Member is distributed interstitiallythroughout the sand and is not restricted to nests. In both unitspotassium feldspar grains within the nests are fresh and show nosigns of kaolinization.
Ore-zone samplesChlorite enrichment relative to montmorillonite is the most
distinctive alteration feature of ore samples. This phenomenonwas first reported by Granger (1962), who showed chlorite en-richment to be proportional not only to uranium but to mag-nesium and to organic-carbon content. This distribution has beenconfirmed by Lee (1976) and by this study.
Chlorite occurs as well-developed coatings on detrital grainsand is intimately mixed with organic carbonaceous materials. Inhigh-grade ores, chlorite has been difficult to detect visually ow-ing to the abundance of humic materials.
Varying amounts of kaolinite, montmorillonite, and illitc alsoare present in the ore zones. Kaolinite is seemingly unrelated tothe processes of ors formation and is believed to have formedafter mineralization. Similarly, the minor illitic constituents thatare found in and near the ore zones bear no significant relation tothe uranium-ore deposits.
Downdip samplesTwo distinctive features mark the suite of downdip samples:
the presence of well-crystallized chlorite and of regularly inter-stratified illite-montmorillonite. The chlorite is ubiquitous,whereas the illite-montmorillonite mixed-layer assemblages aresporadically distributed. Our study suggests that the chlorite wasformed by both direct precipitation and solid-state alteration ofpreexisting montmorillonite (fig. 32). The mixed-layer claysfound in this area are commonly of the 1:1 variety, and texturalrelations suggest that they formed later than montmorillonite butearlier than most chlorite.
Although the data presented here support a lateral secretionmodel for the Mount Taylor deposit, from which much of ourdata was obtained, such a model may not necessarily hold for allof the Grants mineral belt. The data do not solve the enigmaticproblem of trend versus roll types of deposition or of polygeneticmodels; lateral secretion locally may well be secondary to deposi-tion from the west (for trend ore) but masks such deposition.
ConclusionsThis study has demonstrated that clay minerals do form zones
in and near sandstone-type uranium deposits of the Grants min-eral belt but they do so in a fairly subtle fashion. No one clay isexclusively present in any given zone. The paragenetic sequenceof mineral formation is as follows:
MONTMORILLONITE
CARBONATE
IVERY MINOR)FELOSPAR
CHLORITE*- ORGANICS"! „ „ „ ,-*-ORGANICSJ
( INCREASING S I Z EB ABUNDANCE)
ILLITE-MONTMORILLONITECHLORITE
STAGE
(MIXED LAYER)
KAOLINITE
-QUARTZ
-ORGANICS>STAGE Jl
• ( INCREASING S I Z EI a ABUNDANCE)
FIGURE 33—PARAGI-.NI-IIC si-.gui-.Nci- oi M I N I U M IOKMAI ION IN I MLSANDSTONl-.-TVI'l: URANIUM OKI Dll'OSIlS Ol I I I I CJKANIS MIN1-.RAI HI 1 IASINTKRPRfcTLDI ROM S E M PHOTOMICROGRAPHS.
Montmoriilonite formed through the devitrification and hy-drolysis of volcanic ashfall materials in the Morrison section.The ground-water systems of the Colorado Plateau probablyalways have been high in carbonate content, which partiallyaccounts for the beginning of calcite precipitation early in theore-forming process. Organic materials (humic acids?) in theground-water system next began to bleach the sandstones and toact as a catalyst for chlorite formation from montmorillonite.Feldspars also began forming early in the ore-forming processand continued until the second stage of chlorite formation. Thissecond stage accounts for the rosette chlorite and usually isfound only near ore zones. Quartz-overgrowth formation beganbefore a second influx of organics. This second organic phasemay have brought in most of the uranium (Riese and others,1978). Finally, kaolinite formation began; at this point, some ofthe ore began to remobilize in what had become an oxidizing en-vironment: This material reprecipitated as the stack ore of thedistrict and continued further downdip as well. This sequence isdepicted graphically in fig. 33.
ReferencesGranger, H. C , 1962, Clays in the Morrison Formation and their spatial
relationship to the uranium deposits al Ambrosia Lake, New Mexico:U.S. Geological Survey, Prof. Paper 450-D, p. 15-20
Harshman, E. N., 1970, Uranium ore rolls in the United States, inUranium exploration geology: Vienna, International Atomic EnergyAgency, Symposium, p. 219-232
Keller, W. D., 1962, Clay minerals in the Morrison Formation of theColorado Plateau: U.S. Geological Survey, Bull. 1150, 90 p.
Kendall, E. W., 1971, Trend ore bodies of the Section 27 mine. AmbrosiaLake uranium district. New Mexico: Ph.D. thesis, University of Cali-fornia (Berkeley), 167 p.
Lee, M. J., 1976, Geochemistry of the sedimentary uranium deposits ofthe Grants mineral belt, southern San Juan Basin, New Mexico: Ph.D.thesis, University of New Mexico, 241 p.
Nash, J. T., 1968, Uranium deposits in the Jackpile sandstone, New Mex-ico: Economic Geology, v. 63, p. 737-750
Riese, W. C , Brookins, D. G., and Delia Valle, R., 1978, The effec-tiveness of organic acids in providing uranium mineralization in theGrants mineral belt, Mew Mexico—an experimental study (abs.): NewMexico Academy of Science, Bull., v. 18, no. I, p. 18

252
GEOLOGY AND DEVELOPMENT OF MARQUEZ,NEW MEXICO, URANIUM DEPOSIT
by Bowman A. Livingston, Jr., Bokum Resources Corporation. P.O. Box 1833,Santa Fe, New Mexico 87501
AbstractUranium deposition in the Marquez, New Mexico, area occurs
almost exclusively in the lower Westwater Canyon Member ofthe Morrison Formation (Jurassic). The average aggregate thick-ness of the Westwater Canyon is 295 ft (90 m), but it ranges froma minimum of 239 ft (73 m) to a maximum of 328 ft (100 m). A Kshale separates the upper and lower Westwater Canyon sand-stone boundaries. The lower Westwater Canyon sandstone devel-opment is more pronounced in an east-southeast directionparallel with the strike of the orebody(ies). Three distinct orezones were deposited in peneconcordant elongate patterns. Theupper zone occupies a stratigraphic interval just below the K
shale, and two lower zones lie above and below the K, shale. Cof-finite and uraninite predominate as the stable uranium species;other extrinsic elements were added during the mineralizationprocess. Humates undoubtedly exerted major control on forma-tion of the uranium. Ferrous iron pervades both within andoutside the deposit, whereas ferric iron, although limited inquantity, is confined principally to the orebody(ies). The lowerK, shale, parameters of permeability, and recurrence ofmeanders along the paleochannels also seem to influence enrich-ment. Surface drilling is continuing, a vertical mine shaft to ap-proximately 2,100 ft (640 m) is nearing completion, and a mill isbeing constructed on the property.
FIGURE I—TECTONIC MAP OF THE SOUTHEASTERN COLORADO PLATEAU (adapted from Kelley and Clinton, 1960; geology compiled 1958).
253
IntroductionThe Marquez district of the Grants uranium region lies 40 air
mi (64 km) northwest of Albuquerque, New Mexico, and isnamed after the small Spanish village of Marquez, New Mexico.The Juan Tafoya grant surrounds the village of Marquez and en-compasses approximately 4,200 acres (1,700 ha) of fee land, themajority of which is leased by Bokum Resources Corporation.
Subsurface uranium anomalies in the Morrison Formationwere first discovered in the Merquez area in the late 1960's. Thecompany has employed its two in-house drill rigs to locate anddelineate the orebody(ies), and drilling has been proceedingalmost continuously since the summer of 1974.
General geologyThe Mount Taylor volcanic field, with its awesome appearance
and extensive lava flows, is proximal to the western margin of theMarquez, New Mexico, property, while more subdued plateau-like topography, with sporadic volcanic plugs, prevails on theeast, northeast, and southeast peripheries of the property.Ephemeral surface drainage from precipitous and resistantCretaceous sand-rimmed mesas dissects broad valleys that bot-tom in weathered Mancos Shale; the drainage flows eastwardtoward the Rio Grande via the Rio Puerco valley.
StructureStructural control in the area is related to the Acoma sag and
the Puerco fault belt (fig. 1), both tectonic divisions of thesoutheast portion of the Colorado Plateau (Kelley, 1955, fig. 5).Strata exhibit a low westerly dip of less than 4 degrees. TheMcCartys syncline, which is the principal trough of the Acomasag (Kelley and Clinton, 1960), has influenced the developmentof a joint system that is apparent on the outcropping GallupSandstone. One joint set strikes slightly east of north, with asteep easterly dip. The second set strikes in a direction normal tothe first and dips steeply to the south. Both sets are nearlyperpendicular to stratification. The northerly striking jointsdominate over the westerly striking joints. Marked similarity ex-ists between the joint system in the Acoma sag, near Marquez,and that of the Puerco fault belt as noted by Kelley and Clinton(1960). The paucity of faulting and diminished displacementwestward probably means that Marquez represents the westernterminus of the Puerco fault belt. Fracturing, however, persistswestward toward the McCartys syncline as evidenced in the mineshaft. Two high-angle normal faults striking in a northerly direc-tion have been identified from subsurface stratigraphic cross sec-tions. Both are downthrown to the west. The western fault inMarquez Canyon has a throw of approximately 30 ft (9.1 m),whereas the eastern fault indicates a vertical displacementaveraging about 60 ft (18.3 m).
Jurassic stratigraphyMembers of the Morrison Formation were identified by Greg-
ory (1938) in southeast Utah and were extended to the Galluparea by Harshbarger and others (1951). Discussion herein will beconfined to those Jurassic units that were penetrated during theexploration drilling program (fig. 2). With a scarcity ofdiagnostic fossils, identification of the three Morrison Forma-tion members is predicated on textural and compositional dif-ferences between overlying and subjacent members (Cadigan,1967).
Six surface drill holes at Marquez penetrated a massive sand-stone bed below the Recapture Member of the Morrison Forma-tion. Total thickness of the sandstone was not ascertained, butthe maximum thickness encountered was 170 ft (51.8 m). Thesand is fine to medium grained, orange to light gray, rounded towell rounded, and moderately well sorted. Most of the grains arefrosted, although some exhibit a dull polish. This stratum isthought to be the eolian Bluff Sandstone.
MEDIUM GRAINED, GRAY QUARTZ SS
j-E5-Z3-iS-Sj-5S^ GREEN TO GREENISH GRAY SHALE
FINE GRAINED,LIGHT GRAY TO WHITE SS
|gggw^= GREEN TO GREENISH GRAY SHALE
Jmw -FINE TO COARSE GRAINED, LIGHT GRAY,POORLY SORTED, FELDSPATHIC S S
1600'—
1700' —
I8OO' —
1900' —
2000' —
III
—^ r- ^ '
r-=_—•£^rf—zr^^=:Z~--
° o . « *
-ir-_—^-_-ii--^
• • • ' • •
a *• o • . •
. .' * • v• . a • a
• • " • . . • ' • *
• • o • • . • D .
ft . i • a o
GREEN TO SOME RED SHALE
FINE TO COARSE GRAINED, LIGHT GRAY,POORLY SORTED, FELDSPATHIC S.S
• S 5 H _ - ^ T - = - ^ . = - = - H "K" SHALE GREEN SHALE
FINE TO COARSE GRAINED, LIGHT GRAY,POORLY SORTED, FELDSPATHIC SS
MINERALIZATION
MINERALIZATIONV SHALE GREEN SHALE
Jmr -GREEN, GREENISH GRAY TO SOMEREDDISH BROWN SHALE
FIGURE 2—GENERALIZED STRATKIRAPHIC COLUMN OI THE MORRISON
FORMATION, MARQUEZ CANYON.
The Recapture Member of the Morrison Formation, whichaverages 100 ft (30.5 m) in the area, is predominately shale andsiltstone with only local sand lenses. The shale is generally green,greenish gray, or—infrequently—maroon to chocolate brown.Locally, particularly at the top of the member, arenaceous lensesdevelop, foretelling the oncoming incursion of higher energyWestwater Canyon sedimentation. The Recapture-WestwaterCanyon contact can, however, be abrupt and is often depicted bya characteristic signature on the electric-log resistivity curve.
The Westwater Canyon Member of the Morrison Formation ispresent in the area as a thick sandstone with interstratified shale,averaging 295 ft (89.9 m) in thickness, but varying between 239and 328 ft (72.8 and 100 m). Channel sands within this memberconstitute approximately 70 percent of the total thickness. Twodistinct sandstone units separated by a K shale are identifiable inthe Marquez district. Craig and others (1955) charactei ized theWestwater Canyon Member as a broad, fan-shaped alluvial plainformed by an alluviating distributary system of braided chan-nels. Westwater sedimentation in the Marquez area is similar tothat in the Ambrosia Lake district. Variability in sand-bed lith-ologies represents the inconstant pattern of a myriad of super-imposed high-energy streams interspersed with mudstone andsiltstone deposited in a floodplain environment. The rare ap-pearance of detrital heavy minerals in the Westwater Canyonhost sandstone at Marquez may reflect the loss of much of theheavy-mineral fraction by attrition, during transport from a dis-tant source. Any heavy-mineral components probably wouldhave been derived from the parent southwest terrane. Twosources contributed to the allogenic composition of the host rockfor this area (W. Baum, Hazen Research, Inc., written com-munication, 1979). The well-rounded, equant grains of quartz,microcline, and untwinned perthitic orthoclase in the WestwaterCanyon represent material derived from a preexisting sedimen-tary source. A second source is indicated by fragments of vol-

254
canic debris and glass; irregularly shaped, corroded quartz; andzoned plagioclafe, possibly representing an acidic rhyolitic pro-genitor. Cadigan (1967) has identified several possible sourceterranes for material having a rhyolitic composition in the West-water Canyon, but he generally favors a southwest terrane.
The thicker, lower West water Canyon sandstone below the Kshale is the more important unit, hosting in excess of 99 percentof the ore reserves at Marquez. Typically, these sands are fine tocoarse grained. The fine-grained fraction averages 0.1 mm or lessin diameter, whereas the coarse fraction varies from 0.5 to 1.2mm in diameter. Sorting varies from poor to well-sorted. Thelower sandstone tends to be finer than the upper unit. A light-gray color dominates, except along trends where limited fer-ruginous staining has accentuated the feldspar grains to a reddishhue or where carbonaceous matter has coated the rock brown orblack.
A thin but remarkably pervasive shale break, designated as theK, shale, occurs in the basal Westwater Canyon. The K, shaleaverages 10 ft (3 m) thick in Marquez Canyon, but thickens east-ward to a maximum of 26 ft (7.9 m). Infrequently, this shalethins to extinction. Its color is normally green, but it may be mot-tled red, owing to the state of oxidation of iron in the clay(Weeks, 1951). Diffusion and intergrading of colors may becaused by a fluctuating ground-water table with an accompany-ing fluctuation in redox potential (Keller, 1962). The sand abovethe K, shale occupies an interval that consistently is 100-112 ft(30.5-34.1 m) thick. The lowermost Westwater Canyon sand-stone below the K, shale varies from a few feet to as much as 82 ft(25 m) in thickness and shows an elongate axis to the southeast.
The K shale that separates the upper and lower WestvvaterCanyon sandstones is traceable across the property in any direc-tion. The shale thickens and splits eastward, forming two shalebeds that sandwich a thin medial sand stringer. The K shale inthis area may be an equivalent to the K, shale in Ambrosia Lake(Clary and others, 1963, fig. 2).
Mudstone strata are abundant in the upper Westwater Canyonin the western ponion of the property. An analogous lithofaciesin the upper Westwater Canyon Member in Ambrosia Lake hasbeen noted by Santos (1970). However, at Marquez, this unitbecomes progressively more arenaceous to the cast and south-east, where sandstone overwhelmingly predominates. Reduced,gray, admixed fine- to coarse-grained, moderately to poorlysorted, feldspaihic to arkosic detrital sediments compose the up-per Westwater Canyon Member. Pyrite and other iron sulfides,together with carbonaceous debris, are observed in this unit. Ox-idation is present only rarely along fractures, as observed in theproduction shaft.
The Brushy Basin Member of the Morrison Formation, whichis approximately 140 ft (42.7 m) thick, is principally shale, greenin color, and presumably montmorillonitic in composition(Keller, 1962). Very thin limestone laminae locally intercalatewith the basal Brushy Basin shale, indicating brief lacustrineconditions. Two Brushy Basin sands that frequently coalesce aremappable, particularly in the Marquez Canyon area. These sandsshow a more consistent thickness in a northeast-southwest align-ment. They are fine grained and well cemented. An influx of 300gallons (1,135 1) per minute was pumped from the Brushy Basinsand encountered in the mine shaft, but after several days ofpumping, water volume subsided, indicating good porosity butretarded permeability.
A fine- to medium-grained, white to light-gray, kaolinitic,sparsely feldspathic sandstone with traces of carbonaceous debrisoccupies the same stratigraphic interval as the (informal) Jack-pile sandstone to the south and was intersected by surface drill-ing. A maximum thickness of 107 ft (32.6 m) is attained by thisunit to the east. Again, channel development is more pronouncedin a northeast-southwest direction. Deposition of the Jackpilesandstone was controlled by a pre-Dakota trough and favoredthe strike of this depression northeast toward Marquez from theLaguna area (Moench and Schlee, 1959).
FIGURE 3—PHOTOMICROGRAPH SHOWING MICROSTRUCTLRE OF MARQUEZCANW>N MIOIAI ORE-ZONE Hosi ROCK. Structural elements are: P,plagiodase feldspar .showing polysynthetic [winning; Q, quartz grains;M, microclinc feldspar showing Crosshatch twinning; CC, calcite ce-menl; V, volcanic rock fragments. Sample is from 1,824 ft (556 m).Transmitted light, x 22.4, x pols; photo by Hazen Research, Inc.
Westwater Canyon sandstonepetrography
A petrograpiiic thin-section analysis was made by HazenResearch, Inc., on an ore composite containing 9.6 fl (2.9 m) of0.141 percent eU,O8 from the medial Marquez Canyon ore zone;this analysis reveals a medium- to fine-grained, moderately towell-sorted, calcareous, feldspathic sandstone (fig. 3). Calcitecomposes up to 30 volume percent of the consolidated (sand-stone) rock portion, where it frequently replaces quartz andfeldspar. Calcite plus clay minerals form the major cementingagents with subordinate cryptocrystalline silica and iron oxide.
Table 1 shows a petrographic thin-section analysis of the ore-
TABLE 1—Pi lRoiiHAJ'Hu JHINSICTION SIUDV OI THI COMPOSITE SAMl"l I . INDICATING MINI KAI COMI'OSI HON AND DESCRIPTION.
individualminerals
quart/
clay minerals
K-feldspar
calciie
plagioclase
opaqueszeolite
volumepercent mineral composition and description
66.8 subrounded to well-rounded, equant,elongated and irregularly shapedgrains; grains are mostly monocrystal-line; occasionally occur as polycrystal-line aggregates
9.2 micro- to cryptocrystalline aggre-gations; some irregular portions areprobably representing mudstone relictsas well as altered feldspars
8.8 microcline and microcline perthite;fresh to slightly argillized, subroundedto well-rounded grains
7.4 occurring as discrete irregular particlesand as cementing medium of detritalsiliceous constituents
3.7 albite-oligoclase—occasionally fresh,but mostly altered in various degreesto clay and sericitic mica minerals
3.0 mostly present as shredded aggregatesand as isolated minute flakes; altera-tion product of the feldspars
0.8 coaly substances, iron oxides, pyrite0.1 fibrous crystals which are probably
natrolite

255
zone composite containing sandstone and shale. Clay-mineralidentification was made on the minus-5-micron fraction from theore-zone composite. Kaolinite was identified by x-ray diffractionas the major clay mineral, and montmorillonite was identified byethylene-glycol treatment. Other clay minerals either were notpresent or occurred in quantities insufficient for identification. Amajor portion of the clay content in the ore-zone composite waspresent as the K, shale. A modal analysis (table 2) lists thedeirital constituents, lithic particles, and authigenic minerals inthe consolidated sandstone portion of the ore zone.
Uranium mineralizationMineralization has been intersected in the Jackpile sandstone
and in the Brushy Basin, Westwater Canyon, and RecaptureMembers of the Morrison Formation. The lower Westwater Can-yon contains three ore horizons—all of which indicate fair togood continuity along trend directions (fig. 4). The ore is darkbrown to black, generally becoming darker in accordance withore tenor. All horizons occur as peneconcordant deposits (Finch,1959), assume tabular and lenticular forms, and plunge gently tothe west, grossly concordant with bedding, although locallytransecting cross lamination. The lateral, ore-waste contact isoften more abrupt along the northern edge of mineralization,whereas it is gradational along the southern margin. No ore hasbeen discovered to date on the property in the upper WestwaterCanyon Member. Surface drilling is continuing in an effort to in-terconnect the larger Marquez Canyon orebody to the southeastorebody. The presence of one continuous orebody or the oc-currence of several en echelon mineralized paleochannels alongthe trend cannot be ascertained yet (fig. 5). Only additional sur-face drilling and underground long-holing will disclose a moreprecise orebody geometry.
The three main ore-bearing horizons in Marquez Canyon oc-cur as follows (in descending order): I) An upper horizon, withina vertical span of up to 50 ft (15. 2 m) below the K shale-bedboundary, is generally low in tenor; this zone is in radiometricequilibrium. 2) A medial horizon immediately above the K, shalecontains more enriched ore and indicates a chemical enrichmentin uranium. 3) A lower horizon, locally split into two horizons, ispositioned below the K, shale and is often conterminous with theRecapture boundary. The lower ore bed(s), though lower ingrade than the medial zone, represent(s) a higher tonnage coeffi-cient; this zone also indicates a chemical enrichment in uraniumin Marquez Canyon. Almost all ore that has been discovered inthe southeast orebody was deposited in the medial zone, where aslight chemical deficiency in uranium has been noted.
Scintillation and autoradiograph measurements were taken atl-ft intervals through the 9.6 ft (2.9 m) of ore representing themedial ore horizon. These measurements isolated the strongesturanium mineralization between 1,821 and 1,826 ft (555.0 and
TABLE 2—MODAL ANALYSIS IN VOLUME I'KR-CENT OF DETRITAI CONSTITUENTS, I.ITHIC PAR-TIC I tS. AND AUTHKiENIC MINERALS O! THECONSOLIDATED SANDSTONE HOST ROCK.
mineral
quartzfeldspars
K-feldsparplagioclase
lithic fragmentsopaquesmicaclay matrixcalcile cement
volumepercent
43.0
10.09.08.3
1.8
tracetrace27.5
556.6 m) where uranium is noted to occur in two modes: 1) fine-grained disseminations embedded in the cementing material ofthe sandstones and also as discrete, large (^ 1 mm) particles thatare frequently embedded in cement and attached to quartzgrains; and 2) coatings (5 to 20 microns in thickness) aroundquartz grains, composed of carbonaceous material, extremelyfine-grained pyrite, iron oxides, and carbonates (fig. 6).
Coffinite was identified from a coarser sample using x-ray dif-fraction powder-camera analysis. Uraninite had been verified inan earlier report on mill-amenability testing of a sample con-sisting of aliquot quantities of ore from each of the ore zones(Hazeu Research, Inc., written communication, 1977). Anautoradiograph analysis of the ore-zone composite isolated threeareas where radioactivity was more concentrated. The uraniumcontent of these three areas varied between 27 and 34 percent(semiquantitatively). The more enriched area is very fine grainedand was identified by use of an electron microprobe (fig. 7).
Oscilloscope scans revealed the presence of uranium in closeassociation with silicon and subordinate calcium and phosphor-ous. The fine-grained particles may represent coffinite as thestable uranium species, although autunite and/or phosphurany-lite species could also exist (W. Bauni, Hazen Research, Inc.,personal communication, 1979).
Physical and chemical ore controlsBoth physical and chemical controls are thought to have in-
fluenced the migration and precipitation of uranium in the Mar-quez district. Avenues for solution transport were determineddominant by the Westwater Canyon stratigraphy. Precipitationof uranium was governed by the presence of reductants in thehost sandstone.
Migration of uraniumThe solubility of uranium as a uranyl-carbonate complex in
oxidizing slightly alkaline to alkaline ground waters (Hostetlerand Garrels, 1962) merits consideration at Marquez, where a pre-ponderance of a carbonate matrix occurs in the host rock,coupled with an intimate commingling of carbonates with ura-nium on quartz grains (fig. 6). Pr?-ore calcite and silicates in thehost rock would have buffered excess acidity.
The migration of uranium was influenced by paleocurrent di-rection. Paleocurrent flow is thought to have been easterly tosoutheasterly during early Westwater Canyon sedimentation(Rapaport and others, 1952; Hilpert and Moench, I960; Grangerand others, 1961). Studies by Brookins (1975), using therubidium-strontium age-dating method, indicate a Jurassicemplacement for Ambrosia Lake and Smith Lake ores shortlyafter sedimentation. A southeasterly trending valley controllingthe northwest-southeast-trending Grants mineral belt configura-tion was recently postulated by Riesr. aiid Brookins (1977).
Although cross-laminations ha-.e been observed in the Mar-quez Canyon rock core, measurement of current flow using dipdirections of cross-laminae and primary lineation is precludeduntil the mine goes into production and sedimentary structuresare exposed in place. An elongate northwest-southeast develop-ment of the lower Westwater Canyon sand facies across the prop-erty, however, would tend to support an eastward progression of.higher energy streams. Accordingly, ore deposition in the Mar-quez district favors southeasterly to easterly trends. Support forthis scenario is obtained by examining stratigraphic ore controlsfor the more enriched medial ore zone. Ore in this horizon is in-dicative of unoxidized prefault ore (Granger and others, 1961).Both ore and bedding have been displaced a correspondingamount in juxtaposition to the Marquez Canyon fault (fig. 4). Avariogram analysis on the geostatistics of ore .'Imposition in Mar-quez Canyon indicates gross mineralization along a S. 55° E.strike (D. Douglas, personal communication, 1979). When thezones are examined separately, the variogram indicates easterly

FIGURE 4—FENCE DIAORAM OF THE MAROUEZ CANYON OREBODY.

257
EZ CANYOMRE BODY
S.E ORE BODY
F1GURE 5—ORI- DEI'OSIrsWITHIN THI JUAN TAIOYA GRANT.
to slightly northeasterly trending ore patterns. Surface drillinghas revealed strong, easterly parallel to subparallel trends alongthe main northwest-southeast mineralized trunk. The easterlytrends indicate better continuity and tenor of ore.
Uranium transport apparently was influenced by the locus ofthe subjacei.t K, shale which acted as an impervious barrier,thwarting any downward movement of ore fluids. A thin, highlycalcareous, well-cemented layer of sandstone often lies im-mediately above the K, shale and provides good integrity to thehost rock. The barren calcite also seems to have acted as a barrierto uranium enrichment for several feet above the shale. A disper-
sion of ore boundaries into the lower Westwater Canyon unit isindeed noted in three areas at Marquez where the K, shale is ab-sent. Fig. 8 depicts the relationship of the medial ore zone to thesubjacent K, shale bed on Mesa Marquez in a portion of thesoutheast orebody. Westward, mineralization occurs lower in thesection with the extinction of the K, shale. Eastward, the K, shalepervades for some 3,800 ft (1,200 m), as does the medial orezone. The absence of the shale represents either the result ofscouring or a diastem.
The K shale is conspicuously absent at one locale in MarquezCanyon where a consequential upward shift of mineralization oc-
FIGURE 6—PHOTOMICROGRAPH SHOWING CHARACTERISTIC COATINGSWHICH OCCUR AROUND MOST QUARTZ GRAINS hJ URANIUM ZONE. Coat ingsare composed of carbonaceous matter, fine-grained pyrite, radioactiveminerals, iron oxides, and carbonates. Composite sample through orezone, reflected light, x200 oil immersion, 1 pol; photo by HazenResearch, Inc.
FIGURE 7—PHOTOMICROGRAPH SHOWING RADIOACTIVE PARTICLE (CENTEROF WHITE RECTANGLE) SHOWN BY MICROPROBE ANALYSIS TO CONTAIN AURANIUM CONTENT OK 34 PERCENT AND CONTAINING CA, P, ANDSI. Iden-tification is semiquantitativeand points toward coffinite. Polished sec-tion, composite, air, x 128, 1 pol; photo by Hazen Research, Inc.

FIGURE 8—ISOPACHOF K, SHALE IN SOUTHEAST OREBODY; with east-west cross section.

259
curred. Fluid migration may have occurred along the nearbyMarquez Canyon fault (fig. 4) and associated fractures, along afluctuating water table, or the two may have acted in concert toprovide the mechanism for limited migration of ore. Recent ex-ploration has disclosed some local ore enrichment in the lowerhorizon on the eastern upthrown side of the fault. The absence ofthe K shale could represent an effect of faulting or, as with the K,shale, a local diastem or scour. Panial oxidation through the up-per ore zone has imparted a buff color to the sandstone. Tar-nished euhedral-cubic and pyritohedral pyrite (sometimes show-ing framboidal clots), goethite, limonite, sparse hematite, andfragments of green to yellowish shale are present in all three orehorizons near the fault.
In addition to impervious mudsione beds, sandstone perme-ability has also influenced uranium migration at Marquez.Movement of uraniferous solutions normally favors more recep-tive host rocks, although channelways with excessive permeabil-ity would permit flushing of ore and humic components underproper Eh-pH conditions. The upper ore zone indicates greaterpermeability but contains a lower grade of ore than the middle orlower zones. Either permeability was excessive or solutions werenot as concentrated. Detrital(?) mudstone pebbles (particularlyin the medial, more enriched zone), are prevalent and appear tohave influenced both sandstone permeability and ore enrich-ment.
Orebody geometry is governed by, among other parameters,channel configuration. While the major portion of mineraliza-tion at Marquez follows a braided fluvial system, at least twoareas (one in Marquez Canyon and another in the southeast) ap-proximate a meandering fluvial system. The latter model is char-acterized by a change in velocity around the bend, with acorresponding variation in sediment grain size and sand-bodygeometry; therefore, permeability of the host sandstone is af-fected.
The influence of a channel meander on ore enrichment is amoot point, although a restriction in permeability created by ameander should be conducive to greater precipitation of uraniumfrom solution. Such sites for ore deposition seem to be morecommon to the Chinle Formation (Triassic) sandstones, prob-ably because individual channels are easier to recognize in thoserocks than in the more massive Westwater Canyon sandstones.Any impediment to ground-water flow could stimulate the gen-eration of hydrogen sulfide from sulfate waters and serve toreduce uranium from solution (Jensen, 1958). Any weak acidifi-cation caused by this process would further the precipitation ofhumic components, resulting in greater uranium extraction fromsolution (Moench and Schlee, 1967). Local shaly electric-logmotifs in the aforementioned Marquez Canyon area, coupledwith graded bedding patterns and accumulation of carbonaceousdetritus, are suggestive of meandering fluvial deposits (Selley,1978). Here mineralization spans a vertical interval of 154 ft(46.9 m). A plan view of the medial ore zone resembles ameander convex to the south. The ore trend continues eastwardin excess of 1,970 ft (600 m); west of the bend the trend con-figuration returns to the regional northwest-southeast alignment(J. Smith, personal communication, 1979). An analogous oc-currence in this same horizon is observed in the southeastorebody. Here, a S. 80° E. strike was temporarily interrupted bya meander, at which time ore fluids seemingly were transportedsouth for approximately 300 ft (90 m). The trend then continueseastward along the previous bearing (L. Hagmaier, personalcommunication, 1979). In both areas ore enrichment has oc-curred on the point-bar sequence where velocities tended towane.
Precipitation of uraniumHumates undoubtedly exerted a major influence on the fixa-
tion of hexavalent uranium from solution. Several compositesamples from the Marquez Canyon and southeast orebodies werenotably enriched in organic carbon (average 0.27 weight percent
organic carbon; analyses by Hazen Research, Inc., 1979). Bycomparison, the experimental amount of lignite required for pre-cipitation of a uraninite orebody with an average grade of 0.12percent U3O8 and a vanadium content of 0.10 percent V2O, is0.034 weight percent when the Garrels and Pommer (1959) dataare applied. 1 have identified coalified wood with the binocularmicroscope in several drill samples from the upper and lower orezones. One hand-picked specimen of coal selected from a three-ore-zone composite assayed 0.788 percent U,O8 (HazenResearch, Inc., written communication, 1977). The high geo-chemical enrichment of uranium on the humic acid componentsin lignin was empirically shown by Szalay (1964). Because theseorganic components are ineffectively solubilized (Jacobs andothers, 1970), the occurrence of urano-organic complexes in theMarquez Canyon orebody must have afforded protection fromfurther oxidation, dissolution, and migration of uranium.
The influence of hydrogen sulfide (H2S) on uranium precipita-tion at Marquez is indeterminate and cannot be quantified, but itshould be given theoretical consideration. The ability of H;S toreduce W" to U4' is recognized, whether the H2S is producedeither biogenically (Jensen, 1958) or inorganically (Granger andWarren, 1969).
The large quantity of pyrite in the southeast orebody, occur-ring as disseminated, interstitial, subhedral, and euhedral forms,would indicate more than one generation of sulfide formation.Much of this pyrite must be reconstituted, perhaps formed fromsolutions which contained thiosulfate (SiOj- ) ions (Granger andWarren, 1969). Thiosulfate is formed as an intermediate speciesduring the oxidation of pyrite with limited amounts of availableoxygen. The ultimate decomposition of thiosulfate will producehydrogen sulfide. Hydrogen sulfide and pyrite create an environ-ment more conducive to precipitation of uranium. This con-sideration may not have as much application to the MarquezCanyon orebody where pyrite is not as prevalent, nor has ironsulfide experienced much destruction except adjacent to the faultand associated fractures.
A commonly accepted exploration guide in the Grants ura-nium region is that ground high in hematite content is depleted, ifnot devoid, of uranium. At Marquez, ferrous iron (pyrite) is evi-dent within and outside of the ore boundaries. Ferric iron,though limited in quantity (table 3), is confined principally to theorebody(ies). This fact suggests some contemporaneity with oredeposition. Faint hematitic staining on quartz grains has pro-vided a useful criterion in establishing ore-trend patterns in boththe Marquez Canyon and southeast orebodies. The spatial rela-tionship of hematite to uranium deposition has been attributableto the oxidation of authigenic magnetite to hematite during themineralization process where magnetite more commonly sur-rounds ore deposits (Gabelman, 1977).
AlterationPostore alteration, perhaps by acidic fluids, is evidenced by the
presence of authigenic kaolinite nests (Knox and Gruner, 1957;Austin, 1963), particularly in the lower ore zone. Etching ofquartz grains in all three ore horizons is noteworthy. Feldsparalteration (table 1) has also occurred. Quartz and feldspar over-growths do not seem to predominate in the Marquez Canyon ore-body, although adequate reactive silica must have been availableto form coffinite. The desiiication of clay minerals by organicacids (Huang and Keller, 1971) probably provided some silica tothe system.
Accessory extrinsic elementsTwo composite samples (one in ore and the other very weakly
mineralized) taken from the same ore zone 2,600 ft (790 m) apartin Marquez Canyon were analyzed for trace-element distribu-tion. Two composite samples do not represent an adequatepopulation for a frequency distribution of elemental compositionwithin a deposit. However, certain extrinsic elements (table 3)

260
TABLE 3—ANALYSES OF COMPOSITE SAMPLES, MARQUEZ CANYON ORE-BODY (emission-specirograph analyses by Skyline Labs, Inc., Denver,Colorado, unless noted; all given in ppm unless noted).
element
Fe (total)'ferrous iron'ferric iron'Ca1
Mg1
AgAs'BBaBeBiCdCo
CrCutiaOeLa
MnMoNbNiPb
Sb
ScSe"SnSrl i
V
w
AnZr
MAR 474-BC (ore)
2.352.020.331.000.10
<10.0006
10
200<2
<10<50<51530
<20<2()500
100202020
<I(K)
<W
0.002<IOI(K)
1,000
71H)
<5017
<21M)
100
samples
MAR 393-BC (protore)
2.001.920.080.700.15
<1
0.000410
200
<2<IO<50
<5
10
20<IO ••"
200152010
<10<I(M)
<10
().(K)2
<10100
1,0002(K)
<508
<2(K)50
'atomic absorption (percent) by Hazen Research, Inc., Golden, Colo-rado
'volumetric analysis (percent) by Hazen Research, Inc.'percent'colorimctric analysis (percent) by Hazen Research, Inc.'turbidometric analysis (percent) by Hazen Research, Inc."\-ray fluorescence by Hazen Research, Inc.\-r;iy fluorescence by Ha/en Research, Inc.
seem to be coextensive with the mineralization process (Shoe-maker and others, 1959). These elements include ferric iron,calcium, arsenic, chromium, copper, manganese, molybdenum,nickel, lead, vanadium, yttrium, and zirconium. For theanalyses, no separation was made between the whole-rock sand-stones and clay-sized fractions; however, the ore composite didcontain a much greater clay-sized fraction. Some of the elementenrichment, such as zirconium in the ore composite, is un-doubtedly present in the finer fractions and is probably unrelatedto uranium mineralization.
Development of Marquez,New Mexico, project
A vertical, circular, concrete-lined production shaft of 14 ft(4.3 m) inner diameter is currently being sunk in Marquez Can-yon. Two smaller auxiliary production shafts are planned to aug-ment production. As of May 1979, the main shaft has penetratedthe upper Westwater Canyon Member of the Morrison Forma-tion, and work has begun on the additional shafts.
A mill is being constructed at the Marquez project. The mill isdesigned to accommodate 2,200 tons of ore feed per day. Metal-lurgical studies have been based on an average mill-feed grade of0.12 percent U3O8. Grinding will be accomplished by use of asemi-autogenous mill and a rod mill. A two-stage sulfuric-acidleach circuit will be included. Liquid-solid separation will use sixstages of counter-current decantation, with clarification ofoverflows from interstage thickening. Solvent extraction andstripping for solubilization and removal of uranium will be em-ployed, and ammonia will be used to precipitate UjO8 as yellow-cake.
Summary and conclusionsCertain exploration criteria can be applied to the search for
uranium in the Marquez district:1) A strong tendency existed for uraniferous ground waters to
follow the main axes of sandstone sedimentation, whichwere southeast to east.
2) Ore deposition is peneconcordant and primarily of theprefault trend type. With one local exception (on the east-ern upthrown margin of the Marquez Canyon fault), ura-nium trending patterns are well defined; remobilization wasprobably minimal.
3) Shale beds were influential in determining orebodygeometries. The mere absence of shale strata tended to dis-perse uranium, often resulting in a diminution in tenor.
4) Precipitation of uranium occurred where sand permeabilitywas optimized. Paleochannels characterized by some de-gree of sinuosity served as favorable loci for uraniumemplacement.
5) Humates were the important precipitant for uranium, withhydrogen sulfide and iron sulfide possibly playing subor-dinate roles.
6) Though subtle, ferric iron in the form of hematite is auseful exploration guide in the location of ore-trend pat-terns.
The mechanisms for uranium migration and deposition atMarquez, New Mexico, will be more fully understood and ap-preciated once the orebody is in production and can be closely ex-amined. The development of additional mines in this area willprovide an enlarged data base from which to acquire a valuablereservoir of knowledge.
ReferencesAustin, S. R., 1963, Alteration of Morrison Sandstone, in Geology and
technology of the Grants uranium region, V. C. Kelley, compiler: NewMexico Bureau of Mines and Mineral Resources, Mem. 15, p. 38-44
Brookins, D. G., 1975, Uranium deposits of the Grants, New Mexico,mineral belt: Grand Junction, Colorado, U.S. Energy Research andDevelopment Administration (ERDA), AT(05-1)-1636-1,153 p.
Cadigan, R. A., 1967, Petrology of the Morrison Formation in the^Colo-rado Plateau region: U.S. Geological Survey, Prof. Paper 556, 113 p.
Clary, T. A., Mobley, C. M., and Moulton, G. F., Jr., 1963, Geologicalsetting of an anomalous ore deposit in the Section 30 mine, AmbrosiaLake area, in Geology and technology of the Grants uranium region,V. C. Kelley, compiler: New Mexico Bureau of Mines and MineralResources, Mem. 15, p. 72-79
Craig, L. C, Holmes, C. N., Cadigan, R. A., Freeman, V. L., Mullens,T. E., and Weir, G. W., 1955, Stratigraphy of the Morrison and relatedformations, Colorado Plateau region—a preliminary report: U.S. Geo-logical Survey, Bull. 1009-E, p. 125-168
Finch, W. I., 1959, Peneconcordant uranium deposit—a proposed term:Economic Geology, v. 54, p. 944-946
Gabelman, J. W., 1977, Migration of uranium and thorium—explorationsignificance: American Association of Petroleum Geologists, Studies inGeology, no. 3, 168 p.
Garrels, R. M., and Pommer, A. M., 1959, Some quantitative aspects ofthe oxidation and reduction of ores, in Geochemistry and mineralogyof the Colorado Plateau uranium ores, R. M. Garrels and E. S. LarsenIII, compilers: U.S. Geological Survey, Prof. Paper 320, Pt. 14, p.157-164

261
Granger, H. C , Santos. E. S., Dean, B. G., and Moore, F. B., 1961,Sandstone-type uranium deposits at Ambrosia Lake, New Mexico—aninterim report: Economic Geology, v. 56, no. 7, p. 1179-1210
Granger, H. C , and Warren, C. G., 1969, Unstable sulfur compoundsand the origin of roll-type uranium deposits: Economic Geology, v. 64,p. 160-171
Gregory, H. E., 1938, The San Juan country: U.S. Geological Survey,Prof. Paper 188, 123 p.
Harshbarger, J. W., Repenning, C. A., and Jackson. R. L., 1951, Juras-sic stratigraphy of the Navajo country: New Mexico Geological Soci-ety, Guidebook 2nd field conference, p. 95-99
Hilpert, L. S., and Moench, R. H., 1960, Uranium deposits of thesouthern pan of the San Juan Basin, New Mexico: Economic Geology,no. 3, v. 55. p. 429-464
Hosteller, P. B., andGarrels, R. M.. 1962, Transportation and precipita-tion of uranium and vanadium at low temperatures with special refer-ence to sandstone-type uranium deposits: Economic Geology, no. 2, v.57, p. 137-167
Huang, W. H., and Keller, W. D., 1971, Dissolution of clay minerals indilute organic acids at room temperature: American Mineralogist, v.56. p. 1082-1095
Jacobs, M. L., Warren, C. G., and Granger, H. C , 1970, Chemical ex-traction of an organic material from a uranium ore: U.S. GeologicalSurvey, Prof. Paper 700-B, p. BI84-BI86
Jensen, M. L., 1958, Sulfur isotopes and (he origin of sandstone-typeuranium deposits: Economic Geology, v. 53, p. 598-616
Keller, W. D., 1962, Clay mii>. 'als in the Morrison Formation of theC olorado Plateau: U.S. Geologic' Survey, Bull. 1150, 90 p.
Kelley, V. C , 1955, Regional tectonics of the Colorado Plateau and rela-iKinship to the origin and distribution of uranium: University of NewMexico, Pubs, in Geology, no. 5, 120 p.
Kelley, V. C , and Clinton, N. J., I960, Fracture systems and tectonicelements of the Colorado Plateau: University of New Mexico, Pubs, inGeology, no. 6, 104 p.
Knox, J. A. , and Gruner, J..W., 195/, Mineralogy of the Ambrosia Lakeuranium deposits in McKinley County, New Mexico: U.S. AtomicEnergy Commission, Oak Ridge, Tennessee Annual Kept. April 1, 1956to March 31, 1957, RME3148, AT(30-l)-610, p. 5-28
Moench, R. H., and Schlee, J. S., 1959, Laguna district, New Mexico, inGeologic investigations of radioactive deposits semi-annual progressreport for December I, 1958 to May 31, 1959: U.S. Geological Survey,TEI-75l ,p. 14-32
, 1967, Geology and uranium deposits of the Laguna district. NewMexico: U.S. Geological Survey, Prof. Paper 519, 117 p.
Rapapon, I., Hadfield, J. P., and Olson, R. H., 1952, Jurassic rocks ofthe Zuni uplift, New Mexico: Oak Ridge, Tennessee, U.S. AtomicEnergy Commission, RMO-642,47 p.
Riese, W. C , and Brookins, D. G., 1977, Subsurface stratigraphy of theMorrison Formation in the Mount Taylor area and its relation touranium ore genesis: New Mexico Geological Societv, Guidebook 28lhfield conference, p. 271-275
Santos, E. S., 1970, Stratigraphy of the Morrison Formation and struc-ture of the Ambrosia Lake disii.c;, New Mexico: U.S. GeologicalSurvey. Bull. 1272-E, p. E1-E30
Selley, R. C , 1978, Ancient sedimentary c/ivi. onments: Cornell Univer-sity Press, 2nd edition, 287 p.
Shoemaker, E. M., Micsch, A. T., Newman, W. I... and Riley, L. B..1959, Elemental composition of the sandstone-type deposits, InGeochemistry and mineralogy of the Colorado Plateau uranium ores,R. M. Garrels and E. S. I arson I I I , compilers: U.S. Geological Survey,Prof. Paper 320, p. 25-54
Szalay, A. , 1964, Cation exchange properties of humic acid sand their im-portance in the geodiemical enrichment of UO, ' ' and other cations:Geochimicael Cosmochimica Acta, v. 28, p. 1605-1614
Weeks, A. I ) . , 1951, Red and gray clay underlying ore-bearing sandstoneof the Morrison Formation in western Colorado: U.S. GeologicalSurvey, TEM-251, 19p.

262
THE BERNABE MONTA&O URANIUM DEPOSIT,SANDOVAL COUNTY
by R. G. Kozusko, Conoco Minerals Co., N. 6S20FreyaSi., Spokane, Washington 99207, andA. E. Saucier, Consultant, P.O. Box675, CedarCrest, New Mexico 87008
AbstractUranium mineralization was discovered on the Bernabe
Montano Grant early in 1971. This old land grant, which is partof the Laguna Indian Reservation, is approximately 25 mi north-west of Albuquerque, New Mexico. About 2,000 holes have beendrilled on this property to date, and an ore reserve of 10-20million lbs of uranium oxide has been delineated in the West-water Canyon Member of the Morrison Formation. The mineralization consists of multiple, stacked blankets of mineralizedhumate which appear to be localized in an area of slightly thickerand more laterally continuous sandstones. The blankets occuralong a relatively straight mineral trend about a half mile wideand several miles in length. Holes drilled on-trend usually en-counter gamma anomalies, whereas holes drilled off-trend arebarren. The uranium is believed to have been carried through theWestwater Canyon Member by ground waters that followed the
paleochannel systems shortly after burial in Late Jurassic time.This discovery once again confirms the trend-ore concept, and itprobably represents the present eastern economic limit of theGrants mineral belt. The orebody is unusual because it occurs ina structurally deformed area called the Rio Puerco fault zone.The mineralization, which does not conform to a roll-frontmodel, represents an important addition to the ore reserves of theGrants uranium region.
IntroductionThe Bernabe Montaflo Grant is situated approximately 25 air
mi northwest of Albuquerque, New Mexico (fig. 1). This oldSpanish land grant became a part of the Laguna Indian Reserva-tion in 1936 and is under the administration of the LagunaPueblo Tribal Council. In October 1970, Continental Oil Com-
BERNABE MONTANO
'Albuquerque
NEWMEXICO
MAP LOCATIONINDEX
/Jm /W- ///
N
2 Miles
QTsf
I 2 3Km
QUATERNARY-TERTIARYSANTA FE GROUP
K CRETACEOUS FORMATIONS
Jm JURASSICMORRISON FM.
X NORMAL FAULT AND DIP' DIRECTION
/ DIP OF ROCKS
: j PRESENT CONOCO ACREAGEFIGURE 1—LOCATION OF BERNABE MONTANO GRANT AND LAGUNA INDIAN RESERVATION, NEW MEX-
ICO, showing general geology of the area.

263
pany was the high bidder for a uranium exploration permit thatcovered the northern three-quarters of this land grant. The per-mit covered approximately 37,500 acres in one large rectangularblock 5.5-6.5 mi wide and 10 mi long. Until Conoco began theirexploratory drilling program in the spring of 1971, the only holesthat had been drilled on this 60-sq-mi block were a few shallowwater wells.
Uranium mineralization was discovered during the first phaseof drilling in 1971, in the West water Canyon Member of theMorrison Formation (Upper Jurassic). To date, approximately2,000 holes have been drilled. The retained property, consistingof 6,750 acres, is still being developed. Sufficient reserves havebeen delineated to begin construction of a mine and mill complexin the near future.
ACKNOWLEDGMENTS—We thank the management of Conti-nental Oil Company for permission to publish this paper. Par-ticular thanks are due L. Koch, L. W. Heiny, and D. A. Porterwhose foresight, support, and encouragement resulted in the dis-covery of a viable orebody.
Geologic settingThe Bernabe Montaflo Grant is located just off the southeast
edge of the Colorado Plateau in a faulted transition zone be-tween the plateau and the Rio Grande trough (Kelley, 1963). Thegrant is bordered to the northwest by the broad San Juan Basin,to the east by the Rio Grande trough, and to the south and south-west by the Lucero and Zuni uplifts, respectively. Due west of theproperty is a high volcanic plateau dominated by the MountTaylor volcanic cone, which has an elevation of 11,389 ft.
The dominant rock types exposed on and around the grant aresediments of Late Jurassic, Late Cretaceous, and late Tertiaryage. Except for limited exposures of the Morrison Formation inthe northwest corner of the grant, most of the remainder of theproperty is covered by the Dakota Sandstone, Mancos Shale, andGallup Sandstone (all Upper Cretaceous), which dip about 3 de-grees to the southeast (fig. 1).
StratigraphyThe discussion of the stratigraphy will be limited to the Mor-
rison Formation (Upper Jurassic), which is the host for uraniummineralization on the Bernabe Montaflo Grant. In the Grantsuranium region, the Morrison Formation is divided into threemembers (in ascending order): the Recapture, Westwater Can-yon, and Brushy Basin Members. The Jackpile sandstone, an im-
portant ore-bearing unit in the Laguna District to the west, is aninformal name given to a large fluvial unit in the very top of theBrushy Basin Member (fig. 2). In this report it will be treated as aseparate stratigraphic unit.
Morrison FormationThe Morrison Formation is a continental fluvial and lacustrine
sedimentary sequence that was deposited toward the end of aJurassic arid deposition cycle (Green, 1975). In Early Cretaceoustime, Morrison units were tilted regionally to the northeast anderosionaily truncated. A Late Cretaceous strand line transgressedthis erosion surface from the northeast and deposited the mar-ginal marine Dakota Sandstone unconformably upon the Mor-rison Formation.
RECAPTURE MEMBER—The lowermost member of the MorrisonFormation is the Recapture, which is composed of interstratifiedmudstones, siltstones, sandstones, and a few thin fresh-waterlimestones. The sandstones are typically fine to medium grained,clay and calcite cemented, and poorly sorted. These sedimentsare grayish red to red brown and probably represent fluvial andlacustrine playa deposits of an arid environment. The Recaptureconformably overlies the eolian Bluff Sandstone, and the contactis transitional. The top of the Recapture Member locally inter-tongues with the overlying Westwater Canyon Member. On theBernabe Montaflo Grant, the Recapture ranges from 25 to 100 ftthick and averages about 50 ft.
WESTWATER CANYON MEMBER—The Westwater Canyon Mem-ber is dominantly a medium-grained, poorly sorted to unsoned,feldspathic, fluvial sandstone with subordinate interbeds ofgreen mudstone. Locally, the member is coarse to very coarsegrained, and it is almost universally cross laminated. Dip direc-tions of the cross laminae north of Grants, New Mexico, indicatea southeasterly direction of sedimentary transport. This south-easterly current direction appears to have been maintained acrossthe south end of the acreage block. On the Bernabe MontanoGrant, cuttings and core samples show that the Westwater Can-yon sandstones are a faint yellowish gray to light gray. The sand-stones are pyritic, although the pyrite content shows widevariations across the property. The Westwater Canyon Memberranges from 100 to 350 ft thick. Both the maximum and min-imum thicknesses are found at the south end of the property. Tothe north, the member averages about 200 ft thick, but it isdisrupted by discontinuous thin lenses of mudstone as shown inthe stratigraphic cross section (fig. 3). The Westwater Canyon in-tertongues with the overlying Brushy Basin Member, and thecontact often is arbitrarily chosen.
MANCOS SHALE
DAKOTA SANDSTONE
MORRISON JFORMATION \
BLUFF SANDSTONE
JACKPILE SANDSTONEO1- 300'
BRUSHY BASIN100-250"
A
WESTWATER CANYON / .I00-300' I..'
PPrADTIIRf R(V 17. • • •
mm
FIGURE 2—COLUMNAR SECTION OF THE MORRISON FORMATION ON THE BERNABE MONTANO GRANT, NEW MEXICO.

264
zo
s g
FIGURE 3—NORTH-SOUTH STRATIGRAPHIC CROSS SECTION OI- THE MOR-RISON FORMATION ON THE BERNABE MONTANO GRANT (in part fromGalloway, 1972).
BRUSHY BASIN MEMBER—The Brushy Basin Member in north-west New Mexico consists of light-gray-green, bentonitic mud-stones with thin, erratic, and discontinuous lenses of sandstone.The sandstones are generally more numerous in the lower half ofthe member and are lithologically similar to those of the West-water Canyon Member. On the Bernabe Montano Grant, thismember varies from 100 to 250 ft thick, excluding the Jackpilesandstone with which it intertongues. Locally, in the southernpart of the grant, the Jackpile was removed by erosion duringEarly Cretaceous time, and the Dakota Sandstone lies uncon-formably upon the Brushy Basin mudstones.
JACKPILE SANDSTONE—In the Laguna district, southwest of theBernabe Montano Grant, the Jackpile sandstone is a large fluviallens in the top of the Morrison Formation. It lies in a northeast-trending belt that begins at the village of Laguna and extendsacross the grant. In the Laguna area, the belt is about 13 mi wide,but fans out rapidly to the north and northeast. Because the topof the sandstone is truncated by an unconformity, the real extentof this deposit originally must have been much greater.
The Jackpile sandstone on the grant is fine to medium grained,moderate to poorly sorted, and friable. It consists mainly ofquartz with only minor amounts of feldspar. It is mostly coloredwhite by interstitial kaolin but is pink at one surface exposure.The Jackpile sandstone ranges from zero to 300 ft thick on theproperty. The two extremes in thickness are both found in thesouthern part of the tract, and, where present, the Jackpile bed-ding is very massive. To the north, the unit ranges from 50 to 150ft thick and is interrupted by lenses and partings of mudstone(fig. 3).
Where exposed on the grant, the Jackpile usually exhibitsmedium-scale crossbedding that indicates a predominantly east-northeast direction of sedimentary transport. The Jackpile isoverlain unconformably by the Dakota Sandstone. The contact isfairly planar with no evidence of large or deep scours.
StructureThe Bernabe Montano Grant is located in a highly faulted area
called the Rio Puerco fault zone. This fault zone is on the easterndowndroppcd side of the north-trending San Ignacio monocline,which is located about 3 mi west of the pram. The faulted SanIgnacio monocline marks the southeast edge of the ColoradoPlateau. In the vicinity of the grant, the monocline has acumulative displacement of about 1,000 ft. The displacement in-creases to over 2,000 ft to the south. West of the monocline, thesedimentary strata dip about 3 degrees northwest into the SanJuan Basin. East of the monocline, the regional dip is about 3degrees to the southeast. This southeasterly dip is interruptedrepeatedly by closely spaced, parallel, normal faults, which forma series of narrow horsts and grabens striking N. 25-30° E. Thefaults are spaced one-quarter to one-half mile apart across theentire grant (fig. 1) and have normal displacement of up toseveral hundred feet. Although some faults dip to the northwestand others to the southeast, the net effect is to lower the strata tothe southeast (fig. 4). East of the grant, large fault blocks havebeen dropped successively lower toward the Rio Grande trough,and the Morrison Formation has become very deeply buried. Thelarge faults cut Pliocene-Pleistocene formations and are late Ter-tiary and Quaternary in age.
Economic geologyExploration history
The Ambrosia Lake and Laguna mining districts contain thelargest sandstone-uranium deposits known in the United States.Uranium deposits are strung out in the Grants mineral belt,which is over 20 mi wide and extends more than 100 mi in anorthwest-southeast direction. One of the most striking andcharacteristic features of the uranium deposits in the Morrison

265
NW SE
RIOPUERCO
APPROXIMATELY II KILOMETERS
K CRETACEOUS— UNCONFORMITYJmj JACKPILE
Jmb BRUSHY BASINJmw WESTWATER CANYONJmr RECAPTURE
FIGURE 4—NORTHWEST-SOUTHEAST STRUCTURAL SECTION ACROSS BKR-NABE MoNTANO GRANT. NEW MEXICO.
Formation is the habit of the orebodies to line up in long, rela-tively straight and narrow trends. This phenomenon has madethe study of these trends and trend ore one of the most successfulexploration techniques used in the Grants uranium region. Froma study of the geology and the exploration activity east of MountTaylor in 1970, both the Ambrosia Lake-Westwater trend andthe Laguna-Jackpile trend seemed likely to cross the BernabeMontano Grant. The grant, therefore, offered an exceptional ex-ploration opportunity.
Drilling commenced on this acreage in January 1971, and theprojections were soon confirmed. Both Jackpile and WestwaterCanyon sandstones were indeed mineralized, but only the West-water Canyon proved to have sufficient grades and tonnage toencourage development efforts.
The original reconnaissance drilling pattern consisted of fenceswith holes spaced 4,000 ft apart in a north-south direction; thefences were spaced 6,000 ft apart in an east-west direction. Thenorth-south spacing was staggered 2,000 ft on alternate lines to
form a diamond pattern. The second stage of drilling filled in thediamond pattern so that the hole spacing became 2,000 ft in thenorth-south direction and 3,000 ft in the east-west direction. Theentire acreage block was covered with this pattern, and twoanomalous areas were discovered fairly early. The remainder of1971 drilling was devoted to additional testing of these twomineralized areas. By the end of the year, two trends had been in-dicated in the Westwater Canyon Member at depths of 1,000-2,500 ft. Following evaluation of 300 holes totaling almost a halfmillion feet, the northern third of the acreage was released at theend of this first year.
Drilling in 1972 was designed to improve definition of thetrends. The first stage of delineation drilling included north-south fences with holes spaced 500-! ,000 ft apart, with fencesstill 3,000 ft apart. The second stage involved similar fences1,000 ft apart across the trends as they became better defined.Concurrently, areas with more encouraging mineralization weredrilled on a 400-ft grid. A small number of holes was also drilledin areas of low potential for the purpose of condemning acreage.
By the end of 1972, a cumulative total of 780 holes, totaling1.2 million ft, had been completed on the grant. Except for a fewinstances, the hole spacing was no closer than 400 ft. Althoughuranium mineralization was encountered in most of the second-stage drilling, consistently hitting ore-grade intercepts wasalmost impossible, even at 400 ft spacing. Only after selectedportions of the mineralized trends were drilled on a modified200-ft grid could meaningful reserve studies be carried out. Over2,000 holes have now been completed, and much drilling remainsto be done. Mineralization occurs in the Westwater CanyonSandstone along two trends for a combined length of almost 9 mi(fig. 5).
MineralizationOre occurrences throughout the property are generally similar.
Blocking for economic purposes is determined by areal distribu-tion of ore quality and by structural boundaries. Although min-eralization is not restricted to any particular stratigraphic zone ofthe Westwater Canyon Sandstone, most ore within any given de-velopment block is usually confined to the upper, middle, orlower part of the unit. This tendency, however, shows no distri-butional pattern across the property. For purposes of discussion,
FIGURE 5—APPROXIMATE DRILLING PATTERN AT BERNABE, showing general distribution of two main mineralization trends.

266
lOOOfl
J m b ~~— ~— -^-———^._—_ ~zJ~.
•pifei^^^^i^l'—:-±==k' •' -JmwJmr
FIGU RE 6—Dl AliR AMM ATIC II I USTRAT1ON 01 AN <)RI:-01iVtl.OPMUNT BLOCK SHOWING D1S-IRIUUIION AND COMPLEXITY oi ORt HORIZONS; ore zones are stippled in plan view and
arc numbered from 4 to 11 in descending stratigraphic order.
a diagrammatic illustration of one such development block isshown in fig. 6. From the distribution of holes and ore shown,significant mineralization apparently is not always continuous.Two factors produce this observed pattern: The first factorresults from the expected lateral variation of ore quality andquantity along any given sand sheet; that is, geochemical andsedimentological conditions conducive to uranium accumulationare simply not consistent. Secondly, these favorable zones withinthe sand sheets form a tortuous network in plan view, therebycreating intervening voids.
Only limited mineralogic study has yet been completed, but thedominant uranium mineral is believed to be coffinite. As in otherdeposits in the Grants mineral belt, some uraninite also is sus-pecied. No secondary uranium minerals have been detected inany drill cuttings or core. The ore is present as a dark-gray toblack, sooty material that fills void spaces and coats sand grains.Megascopic studies of core are limited, but they do suggest thepresence of both black and brown varieties of unoxidized ore.The latter is usually found in the thicker ore accumulations(several tens of feet) and may be similar to the stack ore of theAmbrosia Lake deposits. Although such thicknesses might implyredistribution of primary ore, such vertical continuity maj be ex-plained by simple overlapping of several ore pods that have beenpartially reworked in the most permeable zones. As in the case ofsome stack ore at Ambrosia Lake, faults are not always associ-ated with these thick intercepts.
Studies indicate a strong association of uranium and organicmatter (fig. 7). The same association is commonly notedthroughout the Grants mineral belt (Granger, 1962; Kelley, 1963;Moench and Schlee, 1967), and the organic material is believed tobe a form of humate. Organic material in the form of detritus israre. Vanadium and selenium show some signs of zonal position-ing, but a definite spatial relationship to the ore has not beenclearly established. Vanadium, for example, appears to be min-imal in primary ore but is present in anomalous amounts in whatis thought to be redistributed ore. Pyrite is often present in oreintercepts and usually occurs as tarnished anhedral blebs. In the
oxidized or barren sand, it is more commonly euhedral and tar-nished. Pyrite has not been very useful as an exploration ordevelopment guide.
Grade of mineralization varies considerably from traces tohigh-grade intercepts in excess of 1.0 percent eUjOi. At a cutoffof 6 ft of 0.10 percent \JiOt, average in-place radiometric orevalues for development blocks are between 0.12 and 0.17 percenteUjO,. Ore thicknesses average approximately 7-9 ft, with ex-tremes from only a couple of feet to as much as 80 ft in thestacked profiles.
Much attention has been given to the subject of disequilibrium.Hundreds of feet of core have been assayed radiometrically andchemically and correlated to down-hole probe results. With few
so
40
30
I§20
10- v.
0 .10 .20 .30 .40 0 3 6 4 0 .60 .80 1.00 1.20CHEM. % U30g WT % ORGANIC CARBON
FIGURE 7—COMPARISON OF URANIUM AND CARBON CONTENT FROM CORESTUDY.

267
exceptions, the results show a positive disequilibrium(cU,O,>eU,O») above grades of 0.10 to 0.12 percent eU,O».Thereafter, positive disequilibrium increases with grade. Aslightly negative disequilibrium is present with grades below 0.10percent eUiO8. In a few cases, where faulting and suspectedredistribution have affected the ore, these relationships aremixed. Some mineralization, possibly redistributed by more openground-water circulation in the gouge zones, shows a negativedisequilibrium. In other cases, ore adjacent to faults seems un-affected and maintains favorable or positive disequilibrium.Overall, the orebodies are considered in equilibrium for miningpurposes, and no factor is used to increase reserves.
Ore geometryThe mineralization occurs in tabular, concordant lenses or
blankets, ranging from a few inches to ten or more feet thick;laterally, the blankets are 1,500-2,000 ft wide and thousands offeet to several miles long. This mineralization is analogous to theprimary-trend occurrences in Ambrosia Lake described bySquyres (1970) and Roeber (1970). These blankets of anomalousmineralization appear, on electric logs, to lie along minordiastems or scours within the multilayered channel sandstones, asshown on the Westwater Canyon type log (fig. 8). Together inplan view, the stacked blankets form a fairly straight mineraltrend up to three-quarters of a mile wide. The strike of theoverall trend is approximately N. 75° W., similar to the Am-brosia Lake trends.
Only a narrow zone (200 ft or less in width within each blan-ket) is found to be of sufficient grade and thickness to beclassified as ore. Because of their sinuosity and comparativelylimited extent, the ore zones within the anomalous sands sheetsare less frequently superimposed. Whereas random holes may in-tercept one or more anomalies anywhere inside the broad belt ofmineralization, only strategically located holes are likely to en-counter ore. Holes drilled outside the anomalous belt, or offtrend, are usually totally barren.
Since the blankets show up as gamma anomalies which de-crease in intensity from the ore to the edge of each blanket, thisvariation in each mineralized horizon can be contoured to projectthe ore zone between widespaced holes; for this purpose, theresistivity logs must be carefully correlated so that eachmineralized horizon, or blanket, can be mapped individually.The horizon maps can be used singly or in composite for estab-lishing drilling locations on trend—particularly desirable for thehigher-cost core holes. When projecting a number of over-lapping, sinuous ore zones in a belt 2,000-3,000 ft wide, amodified grid approach can be cost efficient in delineating re-serves. Fig. 6 also illustrates how it is possible to drill a weaklymineralized hole within the complex pattern of ore zon^s thatcompose the main mineral trend.
Host-rock characteristicsThe Westwater Canyon mineralization appears to be localized
in an area where the member is of greater than average thickness.More importantly, the mineralization is in an area where the la-teral continuity of the sandstones is also better developed, asshown schematically in fig. 3. According to Galloway (1972), thediscontinuous sandstone lenses represent meandering channelswhich cross and cut one another off. The more continuous sheetsof sandstones represent straight to sinuous channel deposits inwhich the streams had a greater width-to-thickness ratio andgenerally deposited more coarse-grained sediment. The humateblankets preserved in the sinuous facies were mineralized, prob-ably because large volumes of ground water could more easilypass through this facies. The smaller, discontinuous channeldeposits of the meandering facies were poor conduits for largevolumes of uranium-bearing waters. As a rule, areas where theindividual sandstone lenses in the Westwater Canyon cannot be
correlated across distances of 1,000-2,000 ft probably should beconsidered relatively unfavorable for the accumulation of largeuranium deposits.
Host-rock alterationThe present ground-water movement within the Morrison For-
mation on the Bernabe Montano Grant is to the southeast. Oxy-genated waters seem to have entered the grant from the north andwest, and they have apparently altered the Westwater CanyonSandstone in the northern part of the grant. Evidence of thisalteration or oxidation is the decrease in pyrite content and thepresence of a more bleached, yellowish-gray color in this north-
JmjJmbb
JmbbJmw
Jmw •
Jmr
-1200
-1300
-1400
-1500
-1600
-1700
FIGURE 8—TYPE LOG SHOWING MORRISON MEMBERS AND NUMBERED MIN-ERALIZED HORIZONS WITHIN WESTWATER CANYON MEMBER (see fig. 6 forsimilar horizon distribution).
268
em area. The weak oxidation appears to be fairly young. It hasmoved down to the edge of the northern mineralized trend whereit has been stopped or slowed in its advance by the presence of theorganic-rich mineralization. Here the oxidation has dispersed theuranium at the north edge of the primary blankets to formthicker, lower grade mineralization. By comparison, the ore inthe lower Westwater Canyon in the south trend is in totallyreduced sandstones and is in no way related to the weak oxida-tion front. Mineralization also may have been present in the up-per Westwater Canyon of the north trend; but if so, it has nowbeen destroyed by this recent oxidation.
Age and origin of mineralizationUranium mineralization on the Bernabe Montano Grant is
located in a thick sandstone lobe at the distal edge of the West-water Canyon alluvial fan. The Westwater Canyon sandstoneslens out depositionally within a few miles to the south. To thenorth, and probably also to the east, the sandstones are more len-ticular and discontinuous. These stratigraphic constraints implythat the uranium had to be introduced into this area by mildlyreduced ground waters flowing southeast along trend.
The mineralization is clearly prefault in age and probably cor-responds to the age dates of 139 to 148 m.y. proposed by Lee andBrookins (1978). The Westwater Canyon sandstones in this areaappear to have remained totally reduced since burial in Late Jur-assic time. Oxygenated waters are only now encroaching uponthis area. A Late Jurassic age for the period of mineralizationwould be compatible with both geologic and Rb-Sr geochrono-logic data.
A Late Jurassic age is also indicated if the uranium was re-leased from silicic tuffs whose alteration products are the presentBrushy Basin mudstones. The uranium probably was released tothe surface and ground-water systems during the weathering anderosion of volcanic ash on the Mogollon highland of Arizona.Argillic alteration of most of the volcanic material was fairlycomplete before deposition as the Brushy Basin mudstones. Evi-dence for this is the lack of preserved ash beds within the BrushyBasin Member and the prevalence of contemporaneous clay gallsand early plastic deformation of the clays. One endogenic sourcewould be volcanic material incorporated with the WestwaterCanyon Sandstone that was altered subsequent to burial. Theuranium, therefore, probably was mobile within the WestwaterCanyon Sandstone during sedimentation and for some time afterburial, during diagenesis.
The concentration of the uranium from dilute ground-watersolutions was effected by the humate masses within the West-water Canyon sandstones. The humate pods and sheets are prob-ably an early and common feature of fluvial deposits. Theorganic matter absorbed and complexed the uranium fromground waters that came into contact with it. Thus, the trendorebodies conform almost precisely to the configuration of thehumate distribution in the sandstones.
After the Dakota Sandstone transgressed and buried the Mor-rison Formation, the ore deposits remained locked in reducedsandstones until late Tertiary uplift and erosion allowed oxidiz-ing waters to enter the host rocks. Therefore, the presentlyobserved weak oxidation fronts are destructive rather than con-structive. Uranium is being redistributed along these young redoxfronts where they impinge upon the primary-trend mineraliza-tion. No new uranium is being added, and in the process of redis-tribution, some of the primary-trend uranium is possibly beinglost.
Summary and conclusionsTwo uraniferous trends have been discovered in the Westwater
Canyon Member of the Morrison Formation on the BernabeMontano Grant. The trends consist of multiple stacked horizonsof mineralized humate, which appear to be localized in the areasof thicker and more laterally continuous sandstones in the West-water Canyon Member. Holes drilled on-trend usually encountergamma anomalies, whereas holes off-trend are barren. Gammaanomalies are the best guides to ore, and they may be the onlyreliable guides. The ore in individual horizons occurs as long,narrow, and sinuous zones, more or less within the central por-tion of the mineralized blankets. These ore zones are generally200 ft or less in width; therefore, a minimum hole spacing of 200ft is necessary to delineate reserves. The ore is offset by the Ter-tiary faults but otherwise is little affected by the structural defor-mation. Some indication exists that better mineralization occursin structurally low areas along the trend and is definitely true onthe larger scale of the mineral belt. The uranium is believed tohave been derived from altered acidic tuffs of Jurassic age incentral Arizona. Mineralization probably occurred soon afterdeposition of the host rock in which it occurs, and it may be con-sidered penecomemporaneous. Some redistribution of mineral-ization is now taking place along the north edge of the trends,owing to the recent incursion of oxygenated ground waters.
Depending upon the various constraints, ore reserves of 10-20million lbs of uranium oxide have been delineated on the BernabeMontaflo Grant. The ore occurs in the Westwater CanyonMember of the Morrison Formation at depths of about 1,500-2,000 ft. This discovery is important in several respects: Itsupports the trend-ore concept and is a significant extension ofthe mineral belt. The orebody is unusual because it occurs in astructurally deformed area. In the past such areas have beenconsidered unfavorable for mineralization. The ore consists ofmineralized humate blankets preserved in reduced sandstones.This mineralization does not conform to a roll-front model. Thisore also represents an important addition to the reserves of theGrants uranium region, and it probably represents the presenteastern economic limit of the prolific Grants mineral belt.
ReferencesGalloway, W. E., 1972, Stratigraphy of the Westwater Canyon alluvial
fan system (Morrison Formation)—relationships to uranium mineral-ization: unpublished Conoco Tech. Rept., 10 p.
Granger, H. C , 1962, Clays in the Morrison Formation and their spatialrelation to the uranium deposits at Ambrosia Lake, New Mexico: U.S.Geological Survey, Prof. Paper 450-D, p. 15-20
Green, M. W., 1975, Paleodepositional units in upper Jurassic rocks inthe Gallup-Laguna uranium area, New Mexico: U.S. Geological Sur-vey, Open-file Rept. 75-610, 13 p.
Kelley, V. C , compiler, 1963, Geology and technology of the Grantsuranium region: New Mexico Bureau of Mines and Mineral Resources,Mem. 15, 277 p.
Lee, M. J., and Brookins, D. G., 1978, Rubidium-strontium minimumages of sedimentation, uranium mineralization and provenance, Mor-rison Formation (Upper Jurassic), Grants mineral belt. New Mexico:American Association of Petroleum Geologists, v. 62, no. 9, p.1673-1683
Moench, R. H., and Schlee, J. S., 1967, Geology and uranium deposits ofthe Laguna district, New Mexico: U.S. Geological Survey, Prof. Paper519, 117 p.
Roeber, M. M., Jr., 1970, Possible mechanics of lateral enrichmeni andphysical positioning of uranium deposits, Ambrosia Lake area, NewMexico: Socorro, New Mexico, 1970 uranium symposium, 16 p.
Squyres, J. B., 1970, Origin and depositional environment of uraniumdeposits of the Grants region. New Mexico: Ph.D. thesis, StanfordUniversity, 228 p.

269
JACKPILE-PAGUATE DEPOSIT—A REVIEWby R. G. Beck, C. H. Cherrywell, D. F. Earnest, and W. C. Feirn. The Anaconda Copper Company.
P.O. Box 638, Grams, New Mexico 87020
AbstractUranium mineralization occurs in the Jackpile sandstone, the
uppermost unit in the Brushy Basin Member of the MorrisonFormation (Jurassic), north of Laguna, New Mexico. Mineral-ization ranges from discontinuous, spotty disseminations tolenses up to 30 ft (10 m) thick and 100 ft (30 m) long. The lensesare elongate subparallel to the northeast trend of the Jackpilesandstone. Since 1952, observations during mining have indi-cated that varied forms of mineralization occur within lenses,such as rodlike features, irregular and diffused masses, and dis-continuous seams or wisps crosscutting channel boundaries. Thepositive correlation between uranium content and organic carbonfor samples greater than 0.04 percent U3C^ suggests that organiccarbonaceous material is a major large-scale controlling factorfor the deposition of uranium. No other significant geochemicalcontrols on mineralization can be postulated from the limiteddata presented.
IntroductionThe Jackpile-Paguate deposit is located in the Laguna district
between Albuquerque and Grants, New Mexico, on the LagunaIndian Reservation (fig. 1). Initial discovery was made byAnaconda on November 8, 1951. On that morning an aerialradiometric reconnaissance was conducted using a handheld scin-tillometer in a light plane. An afternoon follow-up on the groundlocated an exposure 100 ft (30 m) long and 8.5 ft (2.5 m) thickwith an average grade of 0.91 percent U3O8 (Moench and Schlee,
1967). Subsequent exploration and development has led to thewell-known . rebodies of the Jackpile and Paguate depositswhich have produced in excess of 80 million lbs of U,O8 to date(Sisselman, 1978).
The Laguna district, Jackpile sandstone, and the Jackpile-Paguate deposit have 'ieen the subject of extensive investigationssince the 1950's. A cursory examination of a report by Schilling(1975) provides an overview of the literature available from 1950through 1972. Numerous authors have presented works sincethen. This paper is an attempt to present a concise review of thework to date on the Jackpile-Paguate deposit that can also serveas a central reference for a more detailed study.
ACKNOWLEDGMENTS—We wish to acknowledge the manage-ment of the Anaconda Copper Company, New Mexico Opera-tions, for their support of the project. A special thanks isextended to the staff of the University of New Mexico GeologyDepartment for their assistance in completion of laboratorywork and to George Stanton and Annabelle Aragon for their helpin preparation of the final report.
Mining and millingThe Jackpile-Paguate deposit is currently exploited by both
open-pit and underground methods. Small, widely distributed in-dividual pits are mined by pushbacks. The overburden is drilledand blasted, then moved to waste dumps by use of 15-cu-ydloaders and 25-50-ton trucks. Approximately 2 million tons aremoved per month by a contractor, and Anaconda handles about400,000 tons.
PAGUATE
JACKPILE OREBODY
Woodrow Mine
4000 SOOO
_ . JACKPILE -PAGWTE
FEET
Albuquarqu*
N.M.
LOCATION MAPC D OREBODY
.1 CORE SAMPLE LOCATIONS
FIGURE I—GENERALIZED JACKPILE-PAGUATE DEPOSIT OREBODJES AND CORE-SAMPLE LOCATIONS. VALEN-
CIA COUNTY. NEW MEXICO.

270
Once the overburden is removed, the Jackpile ore horizon isripped by bulldozers. Company personnel move approximately500,000 tons of interior waste per month and produce 6,000 tonsof ore per day. The ore is moved to stockpiles according to graderanges; mill-grade requirements are met by blending thismaterial.
The November 1978 issue of the Engineering and Mining Jour-nal (Sisselman, 1978) gives a concise description of the open-pitmining, grade control, and reclamation procedures. This articlealso presents a summary of the Bluewater Mill operations, a6,000 lon-per-day ore-feed acid- leach facility expected to pro-duce 5 million lbs of yellowcake per year.
The underground operations produce 1,000 ions ptr day fromthe P-10 mine and 300 tons per day from PW2/3. A 2,400-ftdecline gives access to the room-and-pillar operations of P-10.Slushers are used in all retreat mining of the pillars. Combina-tions of slushers and load-haul-dump equipment move the mate-rial to ore passes. Rail haulage then trams the muck to a crusherwhere it travels up to the surface on a conveyor. PW2/3 is an aditinto the pit wall where similar methods are used. The miningmethods of the underground sandstone mines within the districtare similar, and a detailed description of the methods can be ob-tained from the associated articles in the November 1978 issue ofEngineering and Mining Journal (Sisselman, 1978).
Underground grade-control procedures are described in apaper by Forhan (1977). Only slight modificaiions have beenmade since that time.
StratigraphyThe Morrison Formation (Jurassic) is divided into three
members in the Grants district: Recapture, Westwater Canyon,and Brushy Basin, which contains the Jackpile sandstone (eco-nomic usage). The Recapture is the lowermost member and con-sists of 20-100 ft (5-35 m) of maroon and green claystonesinterbedded with thin sandstones. The Westwater Canyon inter-longues with Ihe Recapture and is 10-90 ft (3-30 m) thick in thedistrict. The Westwater Canyon is generally a buff to light-brownsandstone interbedded with thin green bentonitic mudstones. Theoverlying Brushy Basin Member consists of 250-350 ft (80-120 m)of greenish-gray bentonitic mudstones and imerbedded sand-stones. It commonly interfingers with the underlying WestwaterCanyon Sandstone. The Jackpile sandstone lies immediatelyabove the nmdslonc unit of the Brushy Basin.
The Upper Cretaceous (Landis and others, 1973) Dakota andManeos formations uncont'ormably overlie the Jackpile sand-stone. The Dakota comprises a hard, yellowish-gray basal sand-stone 10-30 ft (3-10 in) thick that interbeds with and underliesblack marine shales and buff sandstones of the Mancos forma-tion. Fossils are abundant in the black shales of the district.
Recent exposures in the underground areas show that the im-mediately overlying Dakota consists of a black, carbonaceoussiltstone interfingered with what appears to be reworked Jackpilesand. This local siltstone has many casts of organic material suchas branches, twigs, and logs. The contact zone is up to a footthick and is anomalously radioactive. The previously describedbasal Dakota sandstone is just above this siltstone unit, whichmay be up to 10 ft (3 m) thick.
Igneous rocksDiabase dikes and sills commonly are exposed in undisturbed
surface rocks as well as in the walls of the Jackpile and Paguateopen pits. The intrusives are generally tabular, up to 2 ft (0.6 m)thick, and range in attitude from near vertical to gently dipping(1-2°). They can be traced on the surface along the strike fordistances of up to 4 mi (6 km). The intrusives crosscut uraniummineralization in the mine and produce no visible evidence ofuranium enrichment along the contact with the enclosing sand-stone. The igneous bodies are traceable vertically through the
Dakota and Mancos formations, indicating that they are lateCretaceous or Tertiary in age and probably are related to epi-sodes of tectonic activity at Mount Taylor or the Rio Grandedepression (Hunt, 1938). Basalt flows of the Mount Taylorregion cap the mesas west of the Jackpile mine.
StructureThe Jackpile-Paguate mine is located in the Acoma sag
(Kelley, 1956), east of the Zuni uplift, and west of the Rio Puercofault belt. Pre-Dakota deformation includes minor folding andfaulting that affected Late Jurassic sedimentation, includingMorrison deposition. During this period of mild structural activ-ity, several sandstone-pipe structures were formed, such as themineralized Woodrow pipe (fig. I) south of the Jackpile pit(Wylie, 1963). The age of these structures is considered contem-poraneous with folding (Brookins, 1975).
Post-Jurassic structural activity was characterized by regionaltilting of the strata to the northwest (forming the McCartys syn-cline), formation of joints and fractures, and intrusion of dikesand sills (Moench and Sehlee, 1967).
Jackpile sandstoneThe geology, mineralogy, depositional environment, and
uranium potential of the Jackpile sandstone have been studied bymany authors (Freeman and Hilperi, 1956; Schlee, 1957; Schleeand Moench, 1961; Granger, 1963; Hilpert, 1963; Kittel, 1963;Moench and Schlee, 1967; Nash, 1968; Squyres, 1970; Adamsand others, 1974; Forhan, 1977; Brookins and others, 1977;Adams and others, 1978; Brookins, 1979). The following discus-sion is a concise integration of these works supplemented by re-cent observations.
The Jackpile sand is a massive fluvial sandstone that makes upthe uppermost unit of the Brushy Basin Member of the MorrisonFormation. It is relatively flat lying and dips roughly 2° to thenorth-northwest into the San Juan Basin. The Jackpile sandvaries from 90 ft (30 m) to over 200 ft (70 m) in thickness in thenorthwestern portion of the lease area. It is characterized by ex-tensive crossbedding and seour-and-t'ill features in which in-dividual channels can be traced up to 60 ft (20 m) along the trendin the underground areas. Recent exposures of channel scourscontain detritus ranging from fine sill to coarse conglomerate.The sand contains locally graded sequences of limited vertical ex-tent. Paleocurrcnt measurements indicate that stream flow was inan east-northeasterly direction.
The Jackpile is a light-gray to white, median-grained, poorlysorted, subarkosic sandstone. It is cemented chiefly by clayminerals and lesser calcite adjacent to mineralized lenses. Discon-tinuous bentonitic mudstone lenses (generally no more than 5-10ft [1.6-3.0 m] thick) are common, particularly within the lowerhalf of the unit. Numerous bentonitic clay galls are ubiquitousthroughout the Jackpile and range from an inch in diameter toseveral feet across in length. Carbonaceous material occurs asvoid fillings and as disseminated coatings on sand grains in addi-tion to the organic trash and logjams noted in other mining areas(Moench and Schlee, 1967).
The Jackpile sandstone was deposited in a broad troughformed in the underlying mudstones by a north-northeast-trending fold (Schlee and Moench, 1961). The thickening of theJackpile in its central portions, together with its interfingeredcontact with the underlying Brushy Basin mudstones and shales,suggest the basin formed during Jackpile sedimentation (Adamsand others, 1978). The Jackpile sand may be the result of a majorrejuvenation of a source area south of Gallup, New Mexico(Moench and Sehlee, 1967). The composition, internal structure,and paleocurrent directions of the Jackpile sandstone are similarto those of the Westwater Canyon Member in the Ambrosia Lakedistrict, which suggests that both units were derived from the

271
same direction (Moench and Schlee, 1967). The approximate ageof sedimentation of the Westwater Canyon-Jackpile sandstoneunits has been given as 146± 5 m.y. (Brookins, 1979).
MineralizationTrace uranium mineralization in the Jackpile sandstone may
occur throughout the entire aerial extent of the unit, althoughanomalous mineralization, at least 2.0 ft (0.6 m) of 0.05 percentor more U3O8, has been noted in only 3 percent of the total sand-stone area (Adams and others, 1978). Many authors (Hilpert andFreeman, 1956; Kelley, 1956; Schlee and Moench, 1961; Moenchand Schlee, 1967; Nash, 1968; Adams and others, 1978) havediscussed uranium occurrence within the Jackpile sandstone. Areview of these descriptions follows, including additional obser-vations from more recent expansion of open-pit and under-ground mine areas.
Anomalous uranium mineralization in the Jackpile sandstonegenerally occurs as uranium-bearing carbonaceous material inmappable lenses or horizons that are elongate subparallel to theJackfile channel outline. The lenses (figs. 2, 3) are horizontaland display a roughly flat or planar upper surface that cannot berelated to either lithology or primary sedimentary structures(Moench and Schlee, 1967). Uranium ore occurs throughout theentire thickness of the host sandstone in the Jackpile pit andunderground mine areas and occurs within the uppermost one-third to two-thirds of the sandstone in the Paguate pit (fig. 3).Ore samples from the Jackpile mine in which the authigenic clayminerals (-2 n fraction) have been dated by rubidium-strontiummethods suggest an age of uranium mineralization between110+10 m.y. and 115 ± 9 m.y. (Brookins, 1979).
Mineralized horizons range from discontinuous and spotty dis-seminations to lenses up to 30 ft (10 m) thick and 100 ft (33 m)across. Minable uranium mineralization occurs within the thick-est part of the Jackpile sandstone (Kind, 1963) and can begrouped into three or more prominent layers. Pre-Dakota ero-sion, however, has destroyed many of the ore lenses that prob-ably once were present in the southwest part of the Jackpilesandstone.
All significant mineralization in the Jackpile mine occurs insandstone, where the matrix is impregnated and cemented bydark, epigenetic, carbonaceous material as described by Moenchand Schlee (1967) and later by Adams and others (1978). Ura-nium intermixed closely with carbonaceous material fills voids,and it coats and replaces some detrital grains. This mixture of
Btnd in notion
JACKPILEOREBOOY
PAGUATEOREBODY
Pr«mlning turfoci
EL.•OOP'
URANIUM MINERALIZATION 0 2000 4000 FEET
Horll.0 XOO 400 FEET
EL. tOOO'
— URANIUM MINERALIZATION 2000 4000 FEET
Htrli.(00 400 FEET
FIGURE 2—SECTION A-A' THROUGH THE JACKPILE-PAGUATE DEPOSIT;
VIEW TOWARDS THE NORTH.
Varl.
FIGURE 3—SfccTioN B-B' THROUGH nil IN IHR^KOUND ARIA; vmvTOWARDS THE WEST.
carbonaceous material and uranium preferentially replaces clay-matrix material and quartz instead of feldspars, and it generallyattacks finer grained material (Nash, 1968).
Most carbonaceous material is redistributed, although detritalsilicified logs and carbonized plant trash and logs do occur. Ingeneral, silicified plant material is quite low in uranium content,but carbonized plant remains, although sometimes barren, maycontain up to several percent uranium. The redistributed car-bonaceous material generally is mineralized and contains aboutas much uranium by weight as carbon (Adams and others, 1978).The tendency of the epigenetic carbonaceous material to im-pregnate matrix material and to replace dctrital grains suggeststhat it probably represents humic material derived from thedecay of associated carbonized plant debris (Moench and Schlee,1967).
The distribution of uranium-bearing carbonaceous materialwithin ore lenses can be uniform or extremely irregular. The ac-cumulation of carbonaceous material and uranium ore aroundclay galls and at many sand/shale interfaces suggests that per-meability differences, at least on a local scale, may be importantin controlling uranium distribution (Nash, 1968). Within orelenses, carbonaceous material and uranium mineralization canassume many geometric forms, such as irregular and diffusemasses, rodlike features, rinds around clay galls, discontinuousseams or wisps crosscutting stratigraphic boundaries, or thinseams or bands at the boundaries between cross-sets. These fea-tures are thought to be the result of chemical and physical inter-actions between ground waters and the sediments over a longperiod of time (Moench and Schlee, 1967; Adams and others,1978).
In general, only a few, vague stratigraphic controls for ura-nium mineralization can be observed. In the Jackpile sandstone,carbonaceous material and ore commonly crosscut primary sedi-mentary structures and occur along minor intraformational dis-placements, indicating epigenetic emplacement. In local areas,carbonaceous material and uranium are concentrated along bed-ding planes, mudstone layers, around clay galls, and withincrossbeds.
Uranium mineralization varies in appearance from low-grade,gray disseminations to high-grade, black ore possessing a vitre-ous or greasy to dull luster. The major recognizable ore mineralin the Jackpile sandstone is coffinite, U(SiO4),.x(OH)4x, generallyoccurring in a complex mixture with organic matter (Moench andSchlee, 1967; Nash, 1968). Minor uranium minerals includeuraninite; complex urano-organic compounds (unidentified);and uranium sulfates, silicates, and phosphates (Moench andSchlee, 1967; Nash, 1968). Accessory pyriteand vanadium occurin minor amounts. Trace amounts of molybdenum and seleniumalso have been noted.

272
DiscussionThis discussion presents the results of investigations conducted
supplementary to work duties at the mine. We have examinedsome of the current concepts concerning uranium mineralizationas applied to the deposit by many of the workers cited at the endof the paper.
The geometry of uranium mineralization within the Jackpile-Paguate deposit is illustrated by the cross sections shown in figs.2 and 3 (lines of section are located on fig. 1). Similar cross sec-tions were constructed by earlier workers (Kittel, 1963; Adamsand others, 1978) illustrating the general relationship of themineralization with the vertical extent of the host sand. Fig. 3suggests that lenses of mineralization appear horizontal, despitethe gentle dip of the host strata.
Whole-rock chemical analyses were completed on samples ofthe Jackpile sandstone with two major objectives in mind: 1)determining criteria for distinguishing oxidized and reducedground by possible tracing of chemical trends within the minearea, and 2) determining whether chemical trends occur across amineralization front in the geometric form of a roll front.
Twenty-two samples were taken of diamond-drill core fromfive locations widely distributed within ihc mine area (fig. I). Theresults of analyses of these samples are tabulated in table 1 andindicate a lack of correlation of uranium content and the majoroxides across the mine area. Locally, within sample groups indrill holes, a positive correlation of uranium and FeO is indi-cated. Uranium and organic carbon exhibit a positive correlationin ore-grade (greater than 0.04 percent U,OS) samples (fig. 4)across the mine area. In non-ore samples (less than 0.02 percentU,OS), only poor correlation of uranium and organic carbon issuggested.
Four samples were obtained across a roll feature in theunderground portion of the mine (fig. 5). Sample I was collectedin friable, fine-grained sandstone in front of the roll feature.Sample 2 was taken in sands similar to sample I, but closer to thefront, containing low-grade mineralization. Sample 3 was col-lected from a silty, fine-grained sandstone just behind the rollfront in ore-grade mineralization. Sample 4 was obtained from amedium- to coarse-grained sand with abundant calcite cementand trace uranium mineralization on the bottom edge of the ore-grade mineralization.
No distinct relationship between uranium and the major oxidescan be suggested from the results listed in table 2. However,
1.5
0.5
JACKPILE MINESamples from Ore Zones
Organic C vs. U
0.2O.I•/• Uranium
FIGURE 4—GRAPH at ORGANIC CARBON VLRSUS URANIUM IOK SAMPII-Sl-KOMOKl- /ONtS IN THI- jA t KPIl 1-PAliUAIL MINI ARl A
organic-carbon content increases significantly in the ore-gradezone (sample 3) and is virtually absent in samples 1 and 2 in frontof the roll. The large increase in CaO in sample 4 is attributableto the abundance of CaCO, cement. Higher V,O,, F&.O,, andFeO contents are apparent in ore-grade sample 3.
Scanning-electron microscopy, commercially available sincethe mid-1960's, offers an excellent tool for micro-environmentinvestigations. A select suite of samples was collectd from thenorthern portion of the underground area (fig. 1) for SEM study.Figs. 6 and 7 are from working areas in the underground mine,and figs. 8 and 9 are from an area south of the working face. Thephotographs are briefly described in the figure captions and il-lustrate some important features described in discussions of [heproposed paragenetic sequence of mineral formation suggestedfor the Jackpile by Rieseand others (1978) and Brook ins (1979).
ConclusionsThis paper presents a review of the geology, mineralogy, and
mining of the Jackpile-Paguate deposit. The positive correlationbetween uranium content and organic carbon for samples greaterthan 0.04 percent U,OK suggests that organic carbonaceousmaterial is a major large-scale controlling factor for the deposi-tion of uranium. No other significant geochemical controls onmineralization can be postulated from the limited data presented.
O.«
0.4
0.2
ICO
12.0
• O
40
M«0
PERCENTOil
0.4
o.a
16.0
12.0
1.0
ATiO* •/. * y
0.4
0.2
AlgOs ___ .« - 4.O'
1 2 3 4SAMPLE LOCATIONS
A
C L -J5-Ai
/i-'MnO
K> M
FIGURE 5—GRAPHS OF WHOLE-ROCK ANALYTICAL DATA TAKEN ACROSS A ROLL FEATURE IN THE UNDERGROUND AREA.

TABLE I—WHOLE-ROCK ANALYSES OF CORE SAMPLES FROM THROLCHOIT THE jAiKPUE-PACiLATE MINE AREA (B—barren; TR—trace; •—samples noi run).
-16.0
To eUjO8 To SiO2 To Al2Oj
-3 .0-29.0-59.0
-98.0
129.0
158.0
TRTR
.02
.073.161TR
To Fe,O, fo FeO To MgO
Location I, north of Jackpile pit
o CaO o Na,0 H,O • °o H,O °'o TiO, % P,O, °'o MnO »b SrO <"o SO,
+ 3.0
-11.5-43.0
-71.5-95.0
-110.0
-40.5
-67.5-89.5
-115.5
- 1 . 0
-33.5-51.0
-78.0-101.0
BBBBBB
.075
.136
.019
.180
TR
TR
TRTR
.116
91.4292.9290.0889.37
86.2880.38
*
*
•
•
•*
90.39*
3.864.286.116.326.94
8.68
5.15
6.6.J6.17
7.40
6.65
6.73
5.604.64
5.88
0.610.09
0.160.15
0.450.40
Location 2,
0.28
0.480.37
0.85
Location 3,
1.40
0.860.29
0.08
0.42
Location 4,
0.330.000.17
0.230.37
0.54
.1270.014
0.0450.0480.3340.207
, north Jackpile pit
0.36
0.49
0.320.54
0.17
0.28
0.26
0.40
central Jackpile pit
0.220.24
0.260.37
0.65
0.29
0.38
0.19
0.104
0.33
south of Paguate pit
0.0450.0130.0240.034
0.0881.98
0.19
0.28
0.481.07
0.16
0.13
0.160.84
0.80
0.410.0230.0270.047
0.120.68
0.0940.17
0.260.97
0.20
0.15
0.14
0.56
0.62
1.170.0420.08
0.90
2.132.25
1.54
2.312.052.30
2.01
2.261.87
1.38
1.26
1.251.762.50
2.16
1.793.78
0.59
0.760.74
1.08
0.41
0.490.541.14
0.82
0.100.17
0.13
0.120.420.19
0.220.30
0.30
0.53
0.550.78
0.18
0.06
0.38
0.060.14
0.19
0.250.320.09
0.150.200. i .
0.22
0.220.14
0.150.24
0.23
0.015<0.01<0.01
0.0150.15
<0.01
<0.01
0.02<0.0l
0.01
0.01
<0.0l0.01
<0.010.01
0.004<0.001
0.0030.0040.007
0.068
0.0120.012
0.0130.025
0.010.011
0.008
0.008
0.019
0.0040.0010.001
0.0030.0090.011
0.0040.0070.007
0.015
0.0060.006
0.0050.005
0.011
1.08<0.1
<0.1<0.1<0.l<0.1
*
•
•
•
•
•
*
•
*
89.04 6.90
7.225.645.146.407.547.95
0.029 0.027 0.54 2.39 0.17 0.16 0.01
Location 5, underground area
1.02 0.45 0.77
0.43 0.38 0.31
0.36 0.39 0.330.41 0.46 0.280.55 1.00 0.490.27 0.97 0.32
0.002 0.001
0.14
0.12
0.11
0.132.23
4.38
0.17
0.64
0.51
1.020.97
1.43
1.54
1.801.70
2.18
2.362.67
0.610 4 0
0.56
0.322.013.10
1.370.04
0.36
0.330.71
0.27
0.280.10
0.120.19
0.24
0.12
0.030.01
<0.0l<0.01
0.01
<fl.OI
0.0060.0050.004
0.0050.0350.041
0.0090.0080.007
0.009
0.020
0.035

r 274
TABLE 2—Whiou ROIK ASAI YSISOI SAMHHS I A K I N ACROSS A ROI L FEATURE IN THE UNDERGROUND MINE AREA (ND—not determined).
samplelocation
1
2
3
4
«b U,O»
.0084
.0878
1.12
.0212
tfo SiO,
93.61
89.90
79.79
65.57
«'o A1,O, <
2.98
3.58
3.26
3.91
r'o Fe ;O, <
.20
.69
2.15
.44
».'o FcO
.26
.65
1.16
.46
<"o MgO
.03
.04
.02
.10
% CaO'
ND
ND
.12
14.62
Ufa Na-.O °
.42
.58
.49
.66
"o K ; O
.82
1.22
1.18
1.54
^oMnO '
.03
.09
.15
.32
Co T iO,
.10
.10
.06
.10
' • c.049
.42
8.74
2.98
% CO,
—
—
8.65
.13
^o S
.014
.094
.87
.020
ppm La
ND
ND
12.4
ND
ppmCe
ND
27
3.6
ND
LOI
.65
1.43
12.72
11.20
FIGURE 6—SEM I'lioroMK'RotiRAi'fi OF A SAMPLE FROM A MINERALIZED
CHANNEI HRKCIA /ONI AI'I'ROXIMAII I Y 15 I I (5 M) HEI OW rill-D A K O I \ JAC k i ' in i f iM.M I. wdl-developed quart/ overgrowths arc at-tached to the grains only at points; cabbagehead form of chlorite can beseen in the first quadrant (bar at bottom left represents 10 microns).
FIGURE 8—SEM PHOTOMICROGRAPH OK A SAMPLE FROM THE ORE ZONK OFA CORI- IIO11- lOCAIt-D APPROXIMATED' MIDWAY DETWEEN HOI IS
NiiMin R I D 4 AND 5 siiowiNti KAOI INITI- BOOKS (bar at bottom left repre-sents I micron).
FIGURE 7—SEM PHOTOMICROGRAPH OF A SAMPLE TAKEN ABOVE A THIN,HIGH-GRADE ORE ZONE WITHIN 15 FT (5 M) OF THE UPPER J A C K P I L E
CONTACT; illite-montmorillonite mixed-layer assemblages act as acementing agent for the delrital grains in this locality; note well-developed euhedral pyrite and the smectite bridging it and the quartzgrain (bar at bottom left represents I micron).
FIGURE 9—SEM PHOTOMICROGRAPH SHOWING AN ALTERED FELDSPARGRAIN (UPPER HALF) AND CALCITE (LOWER HALF). FROM SAME ZONE AS FIG.8 (bar at bottom ieft represents 1 micron).

275
ReferencesAdams, S. S., Curtis, H. S., and Hafen, P. I.., 1974, Alteration of
detrital magnetite-ilmenite in continental sandstones of the MorrisonFormalion of New Mexico, in Formation of uranium ore depos i ts -sedimentary basins and sandsione-type deposits: International AtomicEnergy Agency, Proc, Ser. St l /PUB/374, p. 219-253
Adams, S. S.. Curtis, H. S., Hafen, P. L., and Hossein, S. N., 1978. In-lerpreiaiion of post-deposiiional processes related to the formalion anddestruction of the Jackpile-Paguate uranium deposit, northwest NewMexico: Economic Geology, v. 73, no. 8, p. 1635-1654
Brookins, D. G., 1975, Uranium deposits of Grants, New Mexico mineralbelt: United States Energy Research and Development Administration,Final Rept GJO-1636-1, 120 p.
. 1979, Uranium deposits of the Grants, New Mexico, mineral bell(II): United States Department of Energy, Open-file Rept. GJBX-141(79). 411 p.
Brookins, D. G., Lee, J. M., and Riese, W. C , 1977, Trace elements aspossible prospecting tools for uranium in the southern San Juan Basin,New Mexico: New Mexico Geological Society, Guidebook 28th fieldconference, San Juan Basin III, p. 263-269
Engineering and Mining Journal, 1978, The jackpot at Jackpile is stillpaying off: Engineering and Mining Journal, v. 119, no. II, p. 86-90
Forhan, Rudi, 1977, Grade control in underground mines. Grantsmineral belt, New Mexico: 1st conference on uranium mining technol-ogy, Mackay School of Mines, Proc.
Freeman, V. L., and Hilpen, L. S., 1956, Stratigraphy of the MorrisonFormation in part of northwestern New Mexico: U.S. Geological Sur-vey, Dull. 1030-J, p. 309-334
Granger, H. C , 1963, Mineralogy, in Geology and technology of theGrants uranium region, V. C. Kelley, compiler: New Mexico Bureau ofMines and Mineral Resources, Mem. 15, p. 21-37
Ililpen, L. S., 1963, Regional and local stratigraphy of uranium-bearingrocks, in Geology and technology of the Grants uranium region, V. C.Kelley, compiler: New Mexico Bureau of Mines and Mineral Re-sources, Mem. 15, p. 6-18
, 1969, Uranium resources of northwestern New Mexico: U.S.Geological Survey, Prof. Paper 603, 165 p.
Milpcr, (.. S., and Freeman, V. 1... 1956, Guides to uranium deposits intht; Morrison Formation, Gallup-I.aguna area, New Mexico: U.S. Geo-logical Survey, Prof. Paper 300. p. 299-302
Hunt, C. B.. 1938, Igneous geology of the Moi' ' Taylor volcanic field,New Mexico: U.S. Geological Survey, Prof. Papa 189-b, p. 51-80
Kelley, V. C , 1956, Influence of regional structure and tectonic historyupon the origin and distribution of uranium on the Colorado Plateau:U.S. Geological Survey. Prof. Paper 300. p. 171-178
Kittel, D. F., 1963, Geology of the Jackpile mine area, in Geology andtechnology of the Grants uranium region. V. C. Kelley, compiler: NewMexico Bureau of Mines and Mineral Resources, Mem. 15, p. 167-176
Landis, E. R., Dane, C. H., and Cobban, W. A., 1973. Stratigraphic ter-minology of the Dakota Sandstone and Mancos Shale, west-centralNew Mexico: U.S. Geological Survey, Bull. 1372-J. 44 p.
Moench, R. H., and Schlee, J. S., 1967, Geology and uranium deposits ofthe Laguna district. New Mexico: U.S. Geological Survey, Prof. Paper519,117 p.
Nash, J. T., 1968, Uranium deposits of the Jackpile sandstone, New Mex-ico: Economic Geology, v. 63, p. 737-750
Riese, W. C , Brookins, D. G., and Lee, Moon J., 1978, SliM investiga-tions of the paragenesis of uranium deposits, Grants mineral belt. NewMexico, U.S.A., in Snowbird, Alta, Utah, International association ongenesis of ore deposits symposium, Proc.
Schilling, F. A. , Jr., 1975, Annotated bibliography of the Grantsuranium region, New Mexico, 1950 to 1972: New Mexico Bureau ofMines and Mineral Resources, Bull. 105, 69 p.
Schlee, J. S., 1957, Petrology of the Jackpile sandstone. New Mexico:Geological Society of America. Hull., v. 68, p. 1793
Schlee, J. S.. and Moench, R. H., 1961, Properties and genesis of ihc"Jackpile" sandstone, l.aguna, New Mexico, in Geometry of sand-stone bodies: Tulsa, Oklahoma. American Association of PetroleumGeologists, p. 134-150
Sisselman, Robert, 1978, Uranium fever in the U.S. is spreading as ex-plorationists step up the search: Engineering and Mining Journal,November, p. 62-69
Squyres, J. B., 1970, Origin and deposilional environment of uraniumdeposits of the Grants region, New Mexico: Ph.D. thesis. StanfordUniversity. 228 p.
Wylie, E. T., 1963, Geology of the Woodrow breccia pipe, in Geologyand technology of the Grants uranium region, V. C. Kelley, compiler:New Mexico Bureau of Mines and Mineral Resources, Mem. 1?, p.177-181
Compiler's note—As Memoir 38 goes to press, theJackpile open-pit mine is reported to be closing nearly 30years after its discovery.

276
MAGNITUDE AND VARIABILITY OF DISEQUILIBRIUMIN SAN ANTONIO VALLEY URANIUM DEPOSIT,
VALENCIA COUNTYby Stephen C. Moore, Exxon Minerals Company, USA, 5101 Copper N.E., Albuquerque. New Mexico 87108, and
Norman G. Lavery, Exxon Minerals Company, USA, P. O. Box 2189, Houston, Texas 77001
AbstractThe San Antonio Valley deposit is located in the Laguna
district of the Grants mineral belt, Valencia County, New Mex-ico. The deposit is a flat-lying tabular body of uranium min-eralization in the Westwater Canyon Member of the MorrisonFormation (Jurassic). The deposit is elongate northwest-southeast, is approximately 1 mi (1.6 km) long and 1,000 ft (0.3km) wide and averages 6-12 ft (2-4 m) in thickness, depending onthe mining parameters assumed. This trend-type deposit has achemically reduced mineralogy and occurs below the water table.The average disequilibrium factor for the deposit shows a 6 per-cent enrichment in chemical uranium; however, systematic varia-tions occur throughout the deposit. The northeastern edgeaverages 14 percent excessive chemical uranium relative toequivalent uranium, and the southwestern edge is deficient inchemical uranium. Instead of applying a single correction factorto the ore reserves calculated from radiometric data, three cor-rection factors can be used, one for each of the three northwest-southeast elongate zones. The use of multiple correction factorscan improve mine planning and should increase the total amountof uranium recovered from the deposit. Vertical profiles ofchemical uranium and closed-can equivalent uranium throughmineralized intervals suggest dispersion of uranium daughterisotopes away from uranium concentrations in some core holesand deposition of daughter isotopes in other core holes. Horizon-tal data plots usgest that depletion of daughter isotopes is pro-nounced along the northeast edge of the deposit and that theirredeposition occurs in the central and southwest parts. Ground-water flow from northeast to southwest through the deposit mayhave caused the transport and redeposition of the daughter iso-topes, which in turn created the longitudinal zones of uraniumexcess and deficiency. This flow system caused both the localmigration of daughter isotopes away from uranium concentra-
tions seen in drill cores and also the larger scale transport ofdaughter isotopes in the direction of the hydrologic gradient.This model is based on chemical-uranium assays and on closed-can equivalent-uranium assays.
IntroductionThe San Antonio Valley deposit is located in the Laguna dis-
trict of the Grants mineral belt, east of Mount Taylor (fig. 1).The trend-type deposit is in the Westwater Canyon Member ofthe Morrison Formation. It occurs below the water table andconsists predominantly of coffinite in a fine-grained organicmatrix. The deposit is elongate northwest-southeast, is ap-proximately 1 mi (1.6 km) long and 1,000 ft (0.3 km) wide andaverages 6-12 ft (2-4 m) in thickness, depending on the miningparameters assumed.
This study was designed to: 1) determine the nature and mag-nitude of disequilibrium in the deposit, 2) determine any sys-vmatic horizontal variations in disequilibrium values in thedeposit and to evaluate the implications of those variations formine development, and 3) develop a geological model to explainthe horizontal variations in the disequilibrium values. A dis-equilibrium study of a Wyoming roll-front deposit was con-ducted by Hansink in 1976. The results of that study led to amodification of the proposed pit outline and a decrease in theamount of stripping required.
Available dataApproximately 225 holes were drilled at San Antonio Valley.
Eighteen of the holes were cored, and the analytical data fromthese cores form the data base for this study (table 1). The ma-jority of the core holes are located in the higher grade southeastpart of the deposit (fig. 2). Although the core holes do not pro-
NEW MEXICO
CHURCHROCKAREA
SMITHLAKE
A AREA1Ni
1
1 120 KM
GRANTS MINERAL
AMBROSIALAKEAREA
GRANTS
BELT
M L TAYLORVOLCAHfCS
SAN ANTONIOMtfAVUt « VALLEY* OEPOSIT
JACKPILEAREA
• LAGUNA
FIGURE I—SAN ANTONIO VALLEY LOCATION MAP

«•»
V* 3<
5
i
5z2
m
=O JO -O O 2 3 : c_ i—i I cr> -n i a o O3 >
o o O c D O O i O o o o 4 ^ i £ > a } O c > o o ( - ' C ] o( A ) l*> (T* C.*.1 H-* CO QO L*.* < ^ -f^ OP lfi> C o CO O.* U>
3 -
00000(J100CJ10<J100U10000000CJ100000(JI
I—* I—' ^—s I—> (-» t—<
en .p»sen I-*
( - • I - 1 I—» •—• t—' H-'H-'I-1 ["'I""' t"1^!"1
fyOlflOHHNllflOHHlDHOtOlfifflOO^OHMVOHHhi
,i
>
s.

273
vide a uniform sample of the entire deposit, the distribution ofdata shown is common at the predevelopment stage of propertyevaluation.
Method of disequilibrium analysisChemical-uranium assays and closed-can equivalent-uranium
assays (total-gamma radiometric assays) were obtained on 0.5-ft(0.15-m) or 1-ft (0.3-m) samples of mineralized core from eachhole. Mean values of both variables were calculated for all inter-vals of core that averaged at least 0.05-percent chemical U3O1over a length of at least 6 ft (1.8 m). The data for these mineral-ized intervals are shown in table 1. Using these assays and theequivalent values from the gamma-ray logs, three parameterswere calculated (table 2). The sampling factor (SF) is the ratio ofclosed-can equivalent uranium measured in the laboratory toequivalent uranium measured by the downhole probe and re-corded on the electric log. Assuming perfect core recovery,accurate laboratory determination of equivalent uranium, andaccuraie calibration of the probe, SF is a measure of how well the3-inch (7.6-cm) diameter core represents the 2-ft (0.6-m) diametervolume of rock evaluated by the probe. When mineralization oc-curs as blebs or streaks in the core, values of SF commonly de-viate from 1.00. At San Antonio Valley, values of SF for themineralized intervals range from 0.62 to 1.36. The disequilibriumfactor (DF) is the ratio of chemical uranium to closed-canequivalent uranium. Because both the chemical- and theequivalent-uranium determinations are made on the same samplematerial, this factor is an accurate measure of the state of dis-equilibrium in the core.OThe chemical/log factor (C/L) is theratio of chemical uranium in the core to equivalent uranium,measured by the probe in the rock surrounding the drill hole.Although C/L is often used to adjust reserves of equivalenturanium to chemical uranium, the chemical- and equivalent-uranium measurements do represent different rock volumes;therefore, the ratio of the two values contains an inherent andunknown error. In cases of poor core recovery, this error isaccentuated. The disequilibrium factor is the most accurate indi-cator of the state of disequilibrium in each core hole. This factorwas used in the study of core data from the San Antonio Valleydeposit.
Average disequilibriumAt San Antonio Valley, the value of the disequilibrium factor
for each mineralized interval with a thickness of at least 6 ft (1.8m) and a grade of at least 0.05 percent chemical uranium was cal-
TABLE 2—EXPLANATION OF GEOCHEMICAL FACTORS (see table 1).
SAMPLING FACTOR: SF =
DISEQUILIBRIUM FACTOR: DF =
CHEMICAL/LOG FACTOR: C/L =
eU3O8tASSAY)
eU308(L0G)
cU308(ASSAY)
eU308(ASSAY)
cU308(ASSAY)
eU308(LOG)
culated from the individual samples. The mean value of DF for33 such mineralized intervals in the 18 core holes, calculated byweighting the DF values by the thickness of the minerdlized inter-vals, is 1.06 (fig. 3). The histogram shows that the distribution ofDF values is polymodal and that the use of a single dis-equilibrium factor for the entire deposit would not be valid.
Chemical geologyBefore possible causes for the variation in DF values in the 18
core holes are considered, the geology of the San Antonio Valleydeposit will be described in order to evaluate the processes thatmight have caused the disequilibrium.
The mineralization at San Antonio Valley is located below thewater table. Uranium is intimately associated with organic mate-rial and, like iron, it occurs in a reduced chemical state. Althoughthe age of the mineralization has not been determined, it may bethe same as the age of the mineralization in the Westwater Can-yon sandstone at Smith Lake and at Ambrosia Lake. This age of139 ± lOm.y. (Lee and Brookins, 1978) suggests that the mobilityof uranium since the time of deposition has been low.
In 1966, Dooley and others studied uranium n.ir.;, ion in theAmbrosia Lake district using ratios of daughter isotopes. Protac-tinium 231, one of the daughters measured, is a fairly long-livedisotope and is among the least soluble species in either of theuranium decay-chain series. The ratio of equivalent Pa-231 toU-238 has since been considered to be a measure of the mobilityof uranium, with values greater than 1,00 indicating uraniummigration.
.70 .75 .80 .85 .90 .95 1.05 1.10 1.15 1.20 1.25 1.30 1.35 1.40 1.45 1.50
1.00FIGURE 3—HISTOGRAM OF DF VALUES FOR 33 MINERALIZED INTERVALS.
279
% EQUIVALENT
PROTACTINIUM 231
1.0
0.8
0.6
EQUIVALENT Pa 2 3 ' /U 2 3 B =1.
0 . 0 *0.0
1.00
1.00.2 0.4 0.6 0.8
% URANIUM 238SAMPLE SUITE 9G59
FIGURE 4—MoimiTvoi-URANIUM. AMBROSIA LAKE, Nbw MEXICO (after Dooley and others, 1%6).
Although only one of the vertical suites of samples (suite9G59) studied by Dooley and others (1966) is in a geological en-vironment similar to San Antonio Valley, these limited data mayfurnish clues to the processes which might be operative. In sam-ple suite 9G59, the ratio of equivalent Pa-231 to U-238 rangesfrom 0.91 to 1.18 for the five samples (fig. 4). Only two of thesamples show a small loss of uranium. By contrast, in the samemineralized interval the ratio of equivalent Ra-226 to U-238ranges from 0.52 to 9.09 (fig. 5). The two samples that containless than 0.04 percent uranium are enriched in Ra-226, and thethree samples that contain more than 0.20 percent uranium arestrongly depleted in Ra-226. These data suggest that below thewater table uranium is relatively immobile, whereas its daughterisotope, Ra-226, is relatively mobile. The fact that Ra-226 com-monly moves away from uranium concentrations was also docu-mented by Granger (1963), who described a mineralized intervalin the Ambrosia Lake district in which Ra-226 is depleted in theore (equivalent Ra-226/U = 0.75) and strongly enriched in thesandstone adjacent to the ore (equivalent Ra-226/U = 6.00).Granger cited evidence of reprecipitation of the transportedradium in barite, in cryptomelane, and on clays.
% EQUIVALENTRADIUM 226
1.0
0.8
0.6
0.4
_ EQUIVALENT Ra
0.0
226 ,.,238
RADIUM 226 GAIN
0.2 3.68 / * » - M
• /'9.09
1 I
052
'RADIUM 226 LOSS *
• 0.65
ICO 0.2 0.4 0.6 0.8 1.0
% URANIUM 238SAMPLE SUITE 9G59
FIGURE 5—RADIUM MIGRATION. AMBROSIA LAKE. NEW MEXICO (afterDooley and others, 1966).
The most common disequilibrium pattern observed in coreholes at San Antonio Valley is the one described in the AmbrosiaLake district—an excess of chemical uranium relative todaughter isotopes (DF>1.00) in the richest part or parts ofmineralized intervals and a deficiency of chemical uraniumrelative to daughter isotopes (DF<1.00) in the rock immediatelysurrounding these high concentrations of uranium. (In 1975,Santos described an identical disequilibrium pattern in severalsandstone uranium deposits; his conclusions regarding Ra-226are compatible with those given here.) According to the isotopestudies in the Ambrosia Lake district, the mechanism suggestedto explain the observed disequilibrium pattern is migration ofdaughter isotopes—particularly Ra-226—from the uranium con-centration into the surrounding rock. The same pattern is observ-able both in mineralized intervals that are chemically enrichedoverall (DF > 1.00) and in mineralized intervals that are chemical-ly deficient overall (DF<1.00). In hole H (fig. 6), the interval of826-832 ft (251.8-253.7 m) averages 0.113 percent uranium. DFfor this interval is 1.16, with individual samples that have DFvalues >1.00 correlating with the two richest concentrations ofchemical uranium. In this example daughter isotopes may havebeen lost from the interval of mineralization. In hole M (fig. 7),the interval of 848.5-854.5 ft (258.7-260.5 m) averages 0.108 per-cent uranium. DF for this interval is 0.92, with individualsamples having DF values >1.00, again correlating with therichest concentration of chemical uranium. Based on analogywith Ambrosia Lake, this example suggests that daughter iso-topes in excess of the amount removed from the uranium concen-tration have been deposited within the interval. The excessdaughtef isotopes may have been derived laterally from else-where in the mineralized layer.
In hole L (fig. 8), the uranium mineralization of 821-824 ft(250.3-251.2 m) shows the same pattern of DF values describedabove, but in this case the DF values of all of the samples are lessthan 1.00. Daughter isotopes—dispersed from the layer ofuranium-excessive mineralization several feet higher in thehole—probably have been redeposited throughout the lowerlayer of uranium. However, some removal of uranium from thelayer cannot be ruled out, and analytical data on Pa-231 wouldbe needed to accurately evaluate the contributions of both pro-cesses.
The mineralized interval of 803-809 ft (2448-246.6 m) in holeL (fig. 9) contains one sample with a very low DF value (DF =0.27). This sample consists predominantly of clay and is an ex-

280
METERS FEET825
252
253
254
826
827
B2B
829
830
831
832
-833
B34
1.83m(6.0)-• 113%CU3O8
SAN ANTONIO VALLEYCORE HOLE"H"
O.F.= 1.16
0.50 1.00 1.50 2.00D.F.
0 .05 .10 .15 .20 .25% URANIUM
LHJ % CHEMICAL U 3 0 8 C 3 % CLOSED CAN EQUIVALENT U 3 0 8
FIGURE 6—CORE HOLE H, DEPTH-CONCENTRATION PLOT.
METERS FEET847 - . ! - 9 3 . m
259
260
SAN ANTONIO VALLEYCORE HOLE " M "
O.F. = 0.92
J 0.50 1.00 1.50.10 .20 .30 .40 .50 .60 D.F.
% URANIUM
] % CHEMICAL U3 0 8 EM % CLOSED CAN EQUIVALENT U308
FIGURE 7—CORE HOLE M, DEPTH-CONCENTRATION PLOT.

281
METERS FEET618
SAN ANTONIO VALLEYCORE HOLE " L "
O.F. = .69
0.50 1.00 1.50
0 .20 .40 .60 .80 1.00 1.20 ° F '% URANIUM
I 1 % CHEMICAL U 3 0 8 E ~ ] % CLOSED CAN EQUIVALENT U 3 0 8
FIGURE 8—CORE HOLE L, 818 FT TO 826 FT, DEPTH-CONCENTRATION pi.cn
METERS FEET802
245
246
1.83m(S.O'J-.069%CU3O8
SAN ANTONIO VALLEYCORE HOLE " L "
0.50 1.00 1.50D.F.
0 .05 .10 .15 .20 .25 .30% URANIUM
H 3 % CHEMICAL U 3 0 8 ^ % CLOSED CAN EQUIVALENT U3OgFIGURE 9—CoRr HOLE L, 802 FT TO 810 FT, DEPTH-CONCENTRATION PLOT.

282
OEPOSITOUTLINE
SAN ANTONIO VALLEY
tN
00)
ZONE III(ALL D.F. < 1.001
0.5 KM
• CORE HOLESFIGURE 10—DISEQUILIBRIUM-FACTOR ZONES.
ZONED\tD.F.5 1.00)
ample of selective redeposition of daughter isotopes in a claylayer. Clay-rich layers with low DF values, enriched in Ra-226,have been described by Granger (1963) in the Ambrosia Lake dis-trict. At San Antonio Valley, clay-rich layers that are grossly outof equilibrium in favor of equivalent uranium occur only in thecentral and southwest parts of the deposit.
Horizontal variation in disequilibriumvalues—implications for mine planningThe chemical processes suggested as causes of disequilibrium
in individual core holes at San Antonio Valley are based on datafrom vertical suites of samples. To determine whether the sameprocesses operate in the horizontal plane, lateral variations in theDF values are considered. These variations may be of value inmine planning ind will help to define a reasonable geologicalmodel that can explain the disequilibrium data.
Three zones, based on the DF values of each of the 33 mineral-ized intervals, are shown on fig. 10. The zones, all of which trendnorthwest-southeast, are defined as follows: Zone I includes core
holes in which DF values of all mineralized intervals are greaterthan 1.00. Zone II, documented only in the southeast part of thedeposit, is a transition zone and includes core holes in which DFvalues for the several mineralized intervals are both greater than1.00 and less than 1.00. Zone 111 includes core holes in which DFvalues of all mineralized intervals are less than 1.00. Histogramsof the DF values for zones 1 and HI show that the two popula-tions are distinct (fig. 11). The histogram of DF values for zoneII shows a wide scatter of values around 1.00 and an overlap withthe zone I and zone HI populations (fig. 12). The mean value ofDF in zone I is 1.14, the mean value of DF in zone III is 0.87, andthe mean value of DF in zone II is 1.02.
The recognition of disequilibrium zones with different meanDF values has important implications for mine development atSan Antonio Valley or at any other uranium deposit. First, zone-specific DF values can be used to correct reserves from equivalenturanium to chemical uranium. The use of multiple correctionfactors would be more accurate than the use of one correctionfactor for the entire deposit. Second, initial development can bedirected toward that zone in which uranium excess is most pro-nounced. Finally, multiple equivalent-uranium cutoffs can be
ZONE IIIMEAN DF VALUE: .87
ZONE IMEAN DF VALUE: 1.14
.70 .75 .80 .85 .90 .95 1.05 1.10 1.15 1.20 1.25 1.30 1.35 1.40 1.45 1.50
1.00FIGURE 11—HISTOGRAM OF DF VALUES FOR ZONE I AND ZONE III.

283
.70 .75 .80 .85 .90 .95
ZONE IIMEAN DF VALUE: 1.02
1.05 1.10 1.15 1.20 1.25 1.30 1.35 1.40 1.45 1.50
1.00FIGURE 12—HisrociRAMoi- DFVAI I ISIOR/ONI
utilized during the mining operation to optimize the gamma-rayprobe grade-control program.
Conclusions and geological modelTwo important conclusions may be drawn from this study.
First, systematic horizontal variations in DF values exist at SanAntonio Valley and may be useful in mine planning. Second,daughter isotopes appear to be significantly more mobile thanuranium in this environment.
The following geological model is proposed: The dip of theWestwater Canyon Sandstone is two degrees to the west, and thelocal direction of ground-water flow at San Antonio Valley is tothe southwest. Our hypothesis is that daughter isotopes havebeert transported in ground water from the northeast edge of thedeposit (zone I) and redeposited in the central and southwestparts of the deposit (zones II and III). This model accounts forthe observed data and is reasonable, based on present knowledgeof the behavior of uranium and of daughter isotopes in theGrants mineral belt.
ReferencesDooley. J. R., Granger, H. C , and Rosholl.J. N., 1966, Uranium-234
fractionation in sandslone-lypc uranium deposits of the AmbrosiaLake district. New Mexico: Economic Geology, v. 61, p. 1362-1.182
Granger, H. C , 1963, Radium migration and its effect on the apparentage of uranium deposits al Ambrosia Lake, New Mexico. U.S. Geolog-ical Survey, Prof. Paper 475-B, p. B6O-B63
Hansink, J. D., 1976, Equilibrium analysis of a sandstone roll fromuranium deposit, in Exploration for uranium ore deposits: Interna-tional Atomic Energy Agency, p. 683-693
Lee, M. .1., and Brookins, D. G., 1978, Rubidium-strontium minimumages of sedimentation, uranium mineralization, and provenance, Mor-rison formation (Upper Jurassic), Grams mineral bell, New Mexico:American Association of Petroleum Geologists, Bull., v. 62, p.1673-1683
Santos, E. S., 1975, A characteristic pattern of disequilibrium in someuranium ore deposits: U.S. Geological Survey, Journal oI Research, v.3, p. 363-368

284
SEDIMENTARY CONTROLS ON URANIUM OREAT L-BAR DEPOSITS, LAGUNA DISTRICT, NEW MEXICO
by L. C. Jacobsen, Consulting Geologist, 1800 Coe Court N.E.,Albuquerque, New Mexico 87110
AbstractUranium at the L-Bar deposits occurs in tabular, concordant
bodies that are considered segments of channel fills and bars de-posited in the lower flow stages of a large, braided stream. Thedeposits are composed of scores and possibly hundreds of thesemineralized bodies. The richer parts of the deposits are clustersof partially coalescing mineralized depositional units. Uraniummineralization is coextensive with the presence of carbonaceousmaterial. The bulk of this carbonaceous material occurs in cross-bedding laminae and as randomly distributed clasts and isdetrital in origin. Accumulations of vegetal material in the floodbasins of the river are the likely source of the carbonaceous mat-ter. The partially degraded humic substances were eroded by themigrating channels of the river and incorporated into the sand-stones. Both surface and ground waters carried uranium duringMorrison deposition, and this uranium was extracted and fixedby the partially degraded huinic material. The critical element inthe formation of the deposits was the conjunction of uranium-bearing waters and the presence of humic substances effective inextracting uranium from dilute solutions.
IntroductionThe L-Bar cluster of deposits is in the Laguna uranium district
about 3 mi east of the small town of Bibo and 3 mi north of theJackpile mine (fig. 1). The deposits take their name from thelarge ranch on which they occur, formerly owned by the L-BarCattle Company. The ranch and the deposits are now owned bySohio Western Mining Company and Reserve Oil and MineralsCorporation; Sohio is the operator for the joint venture.
Uranium mineralization at the L-Bar occurs at depths of 200 tonearly 700 ft, with most of this variation caused by the localtopography. Current operations are underground, and the shaftis located near the northwest end of the largest of the deposits.Shaft sinking began in February 1975, and the mine was broughtinto production in the third quarter of 1976. Plans for develop-ment of the remaining orebodics have not been announced. Twoadditional mining operations seem likely, and one of these maybe an open pit.
ACKNOWLEDGMENTS—The assistance of the Sohio mine per-sonnel and the permission to publish given by Sohio and Reserveare gratefully acknowledged.
General geologyThe deposits occur in the southeast part of the San Juan Basin,
where the surface rocks are the Mancos Shale and Tres Her-manos Sandstone. A well drilled to 3,400 ft encountered the nor-mal section of Dakota, Morrison, Bluff, Summerville, Todilto,Entrada, and Chinle Formations. Tertiary intrusives and flowsare nearby, but no igneous rocks were encountered in the drillingor in-mine development.
The formations dip to the northwest, about 75 ft/mi, into theSan Juan Basin. Several high-angle faults with displacements ofa few feet« ere found in the mine, but no major faulting seem:; tobe present. In the Jackpile area, a few miles to the south, Schleeand Moench (1961) found evidence of significant warping thatoccurred contemporaneously with Morrison sedimentation.Available evidence is not adequate to indicate whether the move-ments extended into the L-Bar area; however, the unconformityat the top of the Morrison suggests that small-scale movementprobably occurred extensively during the later stages of Morrison
deposition. Major uplift and tilting of the region occurred duringthe Laramide, with some Tertiary uplift and adjustments.
Delineated commercial mineralization is entirely within theJackpile sandstone unit in the uppermost portion of the Mor-rison Formation. These deposits are the most northerly and far-thest downdip of the known, significant Jackpile uraniumdeposits.
The contact of the Jackpile sandstone with the underlyingBrushy Basin Shale Member of the Morrison Formation has atleast 10-15 ft of local relief that is apparently the result of scour-ing as deposition gradually changed from predominantly clay topredominantly sand. The upper contact with the Dakota Sand-stone is an unconformity, with the Dakota progressively trun-cating members of the Morrison Formation southward from themining district. However, no angular discordance or truncationhas been noted in the area immediately to the north of the L-Bardeposits.
Jackpile sandstoneThe Jackpile sandstone has been identified in outcrops and
bore holes in a band extending along the east flank of the SanJuan Basin for at least 65 mi northward from the Laguna area.In the vicinity of the ore deposits, it is a single tabular body 10-15mi wide, but a few miles to the north it bifurcates into two sand-stone bodies; still further north it divides several times again. Itsmaximum thickness occuis in the vicinity of the Jackpile andPaguate mines where it is up to 200 ft thick. At the L-Bardeposits, the sandstone is 80-100 ft thick; whether this sectionrepresents all or only part of the Jackpile sandstone as defined inthe Jackpile-Paguate area is unknown.
Schlee and Moench (1961) have considered the Jackpile sand-stone to be the product of a northeastward-flowing braidedstream thai was localized by downwarping contemporaneouswith deposition. Features at the L-Bar—such as obvious scourand channel forms, iniraformational conglomerates, abrupt ter-mination of local lithologic units, relative lack of interbeddedshale beds and variable crossbedding—are all consistent withdeposition in a braided river. The river was large, choked withsediment, and aggraded rapidly; and it probably had marked sea-sonal variations in flow.
Work done since that of Schlee and Moench (1961) has raisedthe question of the source of the Jackpile sandstone. Santos(1975), mapping in the area northeast of tlje ore deposits, founda strong southerly orientation for the inclination of crossbeddingplanes, and such an orientation would be inconsistent with thenortheastward-flowing stream postulated by Schlee and Moench.
Thick, essentially uninterrupted sequences of sandstone arecharacteristic of the Jackpile. Shale or mudstone beds are nottotally absent but they are rare, and their near absence is at-tributed to the extensive reworking of sediment that occurs in abraided stream. Fine-grained sediments tend to be depositedmostly in the flood basins and backwater areas, and these wouldhave little chance of being preserved in an environment of con-stant channel migration. Instead, fine-grained sediments wouldbe eroded by the stream and reworked into the sandstone. As aresult, sand-sized and larger clasts of clay are a major constituentof the sandstone. Adams and others (1978) suggested the clay ag-gregates found in the sandstone are the result of alteration inplace of volcanic-glass fragments. This hypothesis is attractivebecause it provides an indigenous source for the uranium, butdirect evidence is sketchy, and the occurrences are much as ex-pected in the postulated environment of Jackpile sedimentation.

285
\ to Latino
FIGURE I—MAJOR URANIUM DEPOSITS IN THE JACKPILE SANDSTONE, LAGUNA DISTRICT.
The Jackpile is a fine- to medium-grained, clayey, feldspathicsandstone. Large samples from the milling operation suggest themedian grain size is about 0.2 mm; since the clay masses un-doubtedly disaggregate during size analysis, the median size ofthe framework grains is probably somewhat larger. A few gran-ules are present along an occasional bedding plane. Sorting of theframework grains is good, and rounding is markedly variable.Where fresh and unmineralized the sandstone is very light graybut may have a pinkish cast where feldspar is coarse and abun-dant. Mottling, in the form of patches of white clay severalmillimeters in diameter, is conspicuous. Local small areas ofhematite staining are seen, and near the base of the sandstone,red bands up to several inches thick are present. The uranium-
bearing sandstone ranges from light to very dark gray; the coloris contributed by black carbonaceous material.
The Jackpile is composed of about 60 to 90 percent quartz,with most of the remainder comprising feldspar and clay. A fewgrains of chert and other rock fragments are present. Over-growths occur on a small proportion of the quartz grains but donot contribute to the cementation of the rock. The feldspar ispredominantly potassium feldspar with some plagioclase. Micro-cline is relatively fresh, but orthoclase and plagioclase aremoderately to badly altered.
Clay is present in two varieties: One is white kaolinite whichoccurs as disseminated white dust, as nests encompassing severalgrains, and occasionally as wormy-looking booklets. Similar

236
occurrences of kaolinite, along with quartz overgrowths, are acommon diagenetic feature of feldspathic sandstone (Wilson andPittman, 1977) and have been described in outcrops of the Jack-pile sandstone well removed from the known uranium deposits(Flesch and Wilson, 1974).
The second, and quantitatively more important, clay is graygreen and apparently is mostly composed of montmorillonite andmixed-layer clays (Nash, 1968). Silt-sized particles of quartz andfeldspar are commonly incorporated in the clay. This type of clayoccurs as dispersed matrix, as aggregates ranging in size fromsand to pebbles, and as lenses and layers ranging from a merewisp to beds several feet thick. The greatest amount of the clayseems to be in the form of aggregates, and these locally make up10-15 percent of the sandstone. Clearly, this clay is detrital inorigin, and it does not appear to differ significantly from the claythat makes up the underlying Brushy Basin mudstone. Uraniummineralization is strongly associated with this type of clay, andthe highest-grade occurrences of ore seem IO be in clayey sand-stone or immediately adjacent today partings or pebbles.
A limy zone a few feet thick commonly is present near the baseof the sandstone, but the sandstone is notable for the absence ofcalcitc or other carbonates.
Crossbedding is conspicuous and seems to be present every-where. Crossbedding is particularly obvious in the undergroundworkings, because the carbonaceous material that gives the rockits gray color is differentially concentrated among the laminae(fig. 2). In the ore-bearing /ones, the dominant form of crossbed-ding is tabular (fig. 2). The sets range in thickness from a fewinches to about a foot. The base typically is undulatory, thelaminae are planar to gently cursed, and the orientation of thesets is variable. Large-scale trough crossbedding also is present,but it is not as prominent underground as it is at the outcrop(Moeneh and Schlee, 1967; Flesch and Wilson, 1974; Santos,1975). The more common occurrence of tabular crossbedding inore/ones suggests these /ones are the product of the lower rangeof stream velocities. Small-scale trough erossbedding occasional-ly is defined by vegetal remains (fig. 3); commonly, it may be
FIGURE 2—TABULAR C ROSSBEDDING IN MEDIUM-GRADE ORE; dark layersarc carbonaceous.
FIGURE 3—ZONI ah SMAI i s i \ u i ROUGH < ROSSBI DUINCI MAKMD in< 4KHON-M i-oi s M-iiKis IN i ITI-K H u I oi si-ic IMI N. darker gray areas ailop and lower right are areas of humic raining; scattered dark specksare carbonaceous grains.
superimposed on the larger scale features, but it is not seen read-ily except where small amounts of carbonaceous residue arepresent.
Distribution of mineralizationThe ore deposits shown in fig. 1 are the significant uranium ac-
cumulations found in the Jackpilc sandstone by mid-1979. Theyoccur in a northeast-trending band approximaiely parallel to thea.xis of the Jack pile sandstone unit. Anomalous uranium min-eralization is common in the vicinity of the deposits but is muchless widespread to the northeast; and, despite moderately inten-sive exploration, only minor indications of uranium have beenfound to the northeast of the L-Bar group of deposits.
Orientation of the individual deposits is not consistent (fig. !)and bears no obvious relation to the overall trend of the district.Similarity, bodies of mineralization within the ore deposits areoriented in diverse directions and without a consistent relation-ship lo the trend of the deposit or the district. At the L-Bar, ura-nium has been found at all levels within the Jackpilc sandstone,but the accumulations in the upper part are characteristicallysmaller and less continuous than those in the lower part.
Bodies of ore-grade mineralization occur suspended in a muchlarger envelope of low-grade mineralization. In a sample of 18holes (figs. 4, 5,6), the thickness from the uppermost anomalousmineralization to the lowermost ranged from 22 to 70 ft. Zoneswith grades above 0.10 percent ranged from 2 to 30 ft. The ag-gregate thickness of these intervals was 969 ft; of that footage, 28percent had mineralization of 0.10 percent or higher, 54 percenthad anomalous mineralization but less than 0.10 percent, and 18percent was barren. These grade levels were determined fromgamma logs; assays of core samples indicate much of the "bar-ren " material has 20 to 80 ppm of urani urn.
Fig. 4 is a cross section extending southeast about 1,000 ftfrom the northwest end of the main orebody. Shown for eachhole is the ore grade above 0.10 percent in 6-inch intervals as in-terpreted from gamma logs. In this section the ore is thick andcontinuous. Fig. 5 is a parallel section approximately 150 ft tothe southwest, and fig. 6 is a section normal to the other two. Inthese latter two sections, a large number of individual uraniumaccumulations are apparent. These may coalesce or they may beisolated, and they probably vary considerably in size. Surfacedrilling is not sufficiently closely spaced (mostly 142 ft) to permitdetailed mapping of each of these ore zones, but the major onesare extensive enough to be followed from borehole to borehole.Fig. 7 is an interpretation solely from surface boreholes of the

287
NW SE
5780
5760
Z
o
- IUJ
5740
H C J U R E 4— N O K I I U M S I -soli I H I A S I ( R O S S S K i I O N M I O U I N I . O R I t. K A D I IIY 6 - I N I II IN i i RVALS
NW SESIS
5780
5760
zo
UJ
5740
FIGURE S—NORTHWEST-SOUTHEAST CROSS SECTION PARALLEL TO AND APPROXIMATELY 150 FT SOUTHWEST OF SECTION IN FIG. 4.

288
SW 339 NE
5780
• 5760
o
UJ
• 5740
J 10II
0100-0 199 —0200-0 2990300-0399 I0 400-0 499 i
> 0500 I-
I I C J U R E 6 — S o l ItiniM'NOKIMI'ASIl'KMSSSK IION SHOW INli OKI l.KAOl
FIGURE 7—AREAL EXTENT OF INDIV:DUAL ORE ZONES IN PART OK A COMPOSITE ORE DEPOSIT.
[New Mexico Bureau or Mi.-es & Mineral Resources. Memoir 3R

289
areal extern of the major ore zones indicated on the cross sec-tions.
With the information obtained from underground drilling, de-tails of orebody configuration become available. Fig. 8 is an ex-ample of more or less isolated orebodies near the margin of thedeposit that have been defined by intensive underground drilling.The longitudinal division of ore zones and the partial overlap-ping of ore zones at slightly different elevations (fig. 8) are com-mon features.
The pattern seems reasonably clear. Ore occurs in elongatedtabular bodies up to several hundred feet wide and 1,000 ft long.Some are straigh I and some are moderately sinuous. They may beoriented in any direction but are approximately concordant withthe bedding. The maximum thickness seems to be about 10-12 fi,and the upper and lower boundaries are usually abrupt and moreor less planar. The basal portion commonly is a zone of mixedlithology with clay and clay pebbles, poorly sorted sand, and car-bonaceous dusts. The grade of mineralization is variably—butnot randomly—distributed through the orebody. Higher grademineralization invariably is in the interior of the orebody, andthe lateral margins are usually gradational and irregular.
Some tendency exists for individual orebodies to develop inclusters that compose nodes in the deposit. Coalescence ofseveral units results in the development of a central mass appre-ciably more extensive and thicker than the individual orebodiesand with protuberances at various elevations. Fig. 7 illustratesone of these nodes. Because the ore is thick and high grade inthese areas, they are of great economic importance. No specificcontrol for these concentrations has been recognized.
The morphology of the orebodies strongly suggests they aredi:pi>siiional features, probably segments of bars and channelfillings. The size and distribution is consistent with the inter-pretation that the Jackpile sandstone is a braided-strcam deposit.The characteristic crossbedding of the ore zones (fig. 2) is that ex-pected from a sediment-choked stream in the lc;ver flow regime.
U , 0 o X THICKNESS IN FEET
. 100' .FIGURE 8—INDIVIDUAL oRLiiouits AS ott INLATLDDURING
Carbonaceous materialIn addition to having exploitable uranium mineralization, the
orebodies are characterized by the presence of carbonaceousmaterial. This material clearly is the local and immediate controlfor the uranium mineralization. No significant mineralizationhas been seen without the carbonaceous material, and in general,the grade of mineralization varies with the carbonaceous content.Analytical work in several laboratories (Granger and others,1961; Moench and Schlee, 1967; Schmitt-Collerus, 1969) haveshown this material to be coal-like and humic.
The amount of such organic material ranges from a trace to aproportion that, locally, makes up a significant rock-formingconstituent. Concentration is extremely variable, and thevariability applies to every scale, from thin section to orebody.Typical variability on the microscopic (thin-section) scale isshown in fig. 9a.
Some of the carbonaceous material was deposited as detritus,and some was deposited from a mobile fluid as staining and graincoatings. The detritus has two distinctive forms of occurrence.The most common form is as randomly distributed coal-like par-ticles that are the same size or slightly larger than the mineralgrains (fig. 9b). These particles are typically somewhat deformedby pressure of adjacent grains. They are distinguished from porefillings by their random distribution and by being larger thanpores. These particles are lUe produci of ordinary .sedimentarypiocesscs, and similar particles are found in many sedimentaryrocks (Bostick, 1974). Where the particles are relatively rare, asthey are with subeconomic mineralization, the coal-like frag-ments are not obvious and are best seen with a binocular micro-scope. As concentration incicases, the ore takes on a speckledappearance; finally, when in abundance (fig. 9c), the ore ap-proaches homogeneity.
The other and more obvious detrital occurrence is as concen-trations along bedding and crossbedding planes (figs. 2, .1, 9d).These concentrations are similar to occurrences in modern sedi-ments described by Coleman (1969) for the Bhramaputra Riverand by Harms and Fahncstock (1965) for the Rio Grande. Mostbedding-plane concentrations are only a millimeter or two thick,but masses up to several centimeters thick occasionally arcfound. Contacts with clay are usually sharp, but contacts withsand usually show some intermixing and corrosion of the sandgrains by the organic material. Pressure phenomena are occa-sionally seen, which suggests that the carbonaceous materialwent through a stage in place in which it was dcformablc andprobably gel-like. Most of this coaly material is now vitreous andwithout apparent structure, but a small portion is dull andsooty—probably a natural charcoal. Large-scale plant structuresare rare, although not totally absent. This rarity sugg.sts thatplant debris was significantly degraded before it was deposited.
Carbonaceous material is found throughout the textural rangeof (he sandstone, but the greatest concentrations arc in the finergrained .sandstone and in association with green day beds or clay-stone pebble conglomerates. The association ol the organicsubstance and the green clay is considered the produci of normalsedimentary processes. Clay deposits and accumulations of plantdebris arc both the product of flood basins and backwater areas.Such environments, probably swampy, would be favorable toplant growth and the development of peat deposits. The depositswould, however, have little chance to be preserved in place andwould be eroded and transported together by the migrating chan-nels of the Jackpile River. Because both the peat and the clay areslack-water sediments, they would be deposited together duringperiods of decreasing stream velocity. Occasionally such a de-posit would be buried rapidly enough for the organic matter to beprotected from oxidation.
The grain coatings and staining are considered the products ofhumic acids formed by the decay of vegetation. The coatings oc-cur in masses ranging from a few grains to large bodies withlateral dimensions in the tens or possibly hundred? of feet. Themasses commonly are lenticular, but highly irregular shapes and

290
FIGURE 9—A) BEDDED AND FRAGMENTAL CARBONACEOUS MATERIAL: B> LARGE AND SMALL CARBONACEOUS FRAGMENTS SHOWINGDEFORMATION AROUND SAND GRAINS AND INDICATIONS OF CORROSION; C) ABUNDANT DISPERSET CARBONACEOUS GRAINS IN HIGH-GRADE ORE(LIGHTER STREAKS ARE CLAY LAMINAE); D) CARBONACEOUS DEBRIS ALONG SMALL-SCALE CROSSBEDDING.

291
boundaries are also seen. Staining frequently cuts sedimentarystructures. At the L-Bar, staining has been seen only in closeassociation with detrital carbonaceous matter. Characteristical-ly, the staining is found only a short distance from the clasts orcarbonaceous laminae, and large masses of stained sandstonehave abundant and relatively closely spaced particles of detritalcarbonaceous material. The coextensive occurrence of the graincoatings and the detrital matter strongly suggests that the humicacids that formed the coatings were derived from the decay inplace of detrital vegetal material. The humic acid apparently wasexuded from the decaying organic debris, migrated outwardfrom the parent material, and formed a general halo around thedetrital nucleus. The highly irregular shape of some of the boun-daries and smaller masses suggests that, at least in part, this pro-cess occurred when the sandstone was not completely saturatedwith water.
In the early stages of degradation, humus is extremely effectivein removing uranium from solutions of low concentrations (Sza-lay, 1958). Both the detrital humus and the humic acid apparent-ly were at a stage of degradation in which they could effectivelyremove and fix uranium at the time when uranium in ground-water solutions became available.
The reasons explaining why the requisite conditions for thedeposition and preservation of abundant humic material are par-ticularly well developed in the L-Bar-Jackpile area are not clear.A possible explanation is that gentle warping contemporaneouswith deposition, which is marked in the Jackpile area, con-tributed to the development of extensive and long-lived swampsthat may have served both as the source and as traps for thevegetal debris that became the primary ore control.
DiscussionAvailable evidence at the L-Bar deposits suggests strongly that
the key controls on uranium mineralization are the products ofcommon and normal sedimentary processes. This interpretationdiffers significantly from those on the Jackpile-Paguate deposits(Moench and Schlee, 1967; Nash, 1968; Adams and others, 1978)in minimizing the importance of sandstone mineralogy and dia-genesis, in recognizing that the ore deposit is a composite ofindividual bodies which probably are depositional units, and inrejecting the concept of an epigenetic origin for the carbonaceousmaterial that is the primary control of mineralization.
The host sandstone, in both texture and mineralogy, is a com-mon type of sedimentary rock. Similar sandstones are found in avariety of environments in the Mesozoic and Cenozoic sedimentsof the world, and specific features have not been shown to beunique to uranium occurrences.
The Jackpile sandstone is the deposit of a braided stream andhas all the internal complexities expected from deposition in con-stantly migrating channels and rapid alternation between erosionand deposition. Where individual uranium orebodies can be de-fined, they appear to have the shape and size expected in rem-nants of depositional units that were channel fills or bars in sucha stream. Crossbedding in the ore-bearing sandstones indicatesdeposition in relatively shallow water and within the lower flowregime of the depositing stream. Depositional units are con-sidered to be an important secondary control of mineralization,and the ore deposit is made up of scores and possibly hundreds ofthese individual units. Why these units should occur in clusters isunknown, but possibly some small-scale tectonism was contem-poraneous with the controlling sedimentation.
The primary control of mineralization is the carbonaceousresidue found within the sandstone. The erratic distribution ofthis material, on every scale from thin section to orebody, arguesagainst an extrinsic source for the humic parent substance. Theabundant detrital carbonaceous matter seemingly was an ade-quate source consistent with the observed physical relationships.A simple one-source explanation for the several forms of car-bonaceous residue has considerable merit.
The critical element in the formation of the ore deposits seemsto have been the conjunction of Uranium-bearing water withvegetal material in a stage of degradation in which it was efficientin assimilating and fixing uranium. How these two factors cametogether is not clear. The conventional interpretation (Moenchand Schlee, 1967) is that both the uranium and the humic matterare extrinsic and were introduced by ground water as separateevents shortly after burial of the sediments. Adams and others(1978) have suggested a markedly different theory: they proposethat the uranium was released from volcanic glass deposited withthe sandstone and altered in place. A third alternative, consistentwith what is known of the sedimentary history, is that depositionof the sandstone and accumulation of uranium were concurrentprocesses. If the uranium was derived from alteration of Mor-rison volcanic ash, which seems probable, uranium would havebeen present in both surface and ground water during Jackpiledeposition. Uranium in water of the Jackpile River probablywould have been captured by the peat deposits thai were formingin the backwater areas. These deposits were periodically erodedby the migrating channels of the river and were incorporated intothe sandstone with the uranium already fixed in the humic mate-rial. The process of accumulation may well have continued afterburial as uranium-bearing ground water came into contact withthe carbonaceous residue in the sandstone. Resolution of thesealternatives probably would be aided by detailed informationdescribing uranium distribution and fixation in the carbonaceousmaterial.
ReferencesAdams, S. S., Curtis, H. S., Hafen, P. L., and Salek-Nejad, H., 1978, In-
terpretation of post depositional processes related to formation anddestruction of the Jackpile-Paguate uranium deposit, northwest NewMexico: Economic Geology, v. 73, p. 1635-1654
Boslick, N. H., 1974, Phyloclasts as indicators of thermal meiamor-phism, Franciscan assemblage and Great Valley sequence (UpperMesozoic), California: Geological Society of America, Spec. Paper 153
Coleman, J. M., 1969, Brahmaputra River: Channel processes andsedimentation: Sedimentary Geology, v. 3, p. 129-239
Flesch, G. A., and Wilson, M. D., 1974, Petrography of Morrison For-mation (Jurassic) sandstone of the Ojito Springs quadrangle, SandovalCounty, New Mexico: New Mexico Geological Society, Guidebook25th field conference, p. 197-210
Granger, H. C , Santos, E. S., Dean, B. G., and Moore, F. B., 1961,Sandstone-type uranium deposits at Ambrosia Lake, New Mexico—aninterim report: Economic Geology, v. 56, p. 1179-1210
Harms, J. C , and Fahncstock, R. K., 1965, Stratification, bedforms, andflow phenomena (with an example from the Rio Grande): Society ofEconomic Paleontologists and Mineralogists, Spec. Pub. 12, p. 84-115
Moench, R. H., and Schlee, J. S., 1967, Geology and uranium deposits ofthe Laguna district, New Mexico: U.S. Geological Survey, Prof. Paper519, p. 117
Nash, J. T., 1968, Uranium deposits in the Jackpile sandstone, New Mex-ico: Economic Geology, v. 63, p. 737-750
Santos, E. S., 1975, Lilhology and uranium potential of Jurassic forma-tions in the San Ysidro-Cuba and Majors Ranch areas, northwesternNew Mexico: U.S. Geological Survey, Bull. 1329, p. 22
Schlee, J. S., and Moench, R. H., 1961, Properties and genesis of theJackpile sandstone, Laguna, New Mexico, in Geometry of sandstonebodies, A. J. Peterson, and J. C. Osmund, eds.: American Associationof Petroleum Geologists, p. 134-150
Schmitt-Collerus, J. J., 1969, Investigations of the relationship betweenorganic matter and uranium deposits; Pt. II—Experimental investiga-tions: University of Denver Research Institute, Rept. No. 2513, p. 192;U.S.-Atomic Energy Commission, open-file rept.
Szaly, A., 1958, The significance of humus in the geochemical enrichmentof uranium: Geneva, 2nd International Conference on Peaceful Uses ofAtomic Energy, Proc., v. 2, p. 182-186
Wilson, W. D., and Pit'man, E. D., 1977, Authigenicclays insandstones;recognition and influence on reservoir properties and paleo-environmental analysis: Journal of Sedimentary Petrology, v. 47, p.3-31

292
COMPARISON OF BRAIDED-STREAM DEPOSITIONALENVIRONMENT AND URANIUM DEPOSITS AT
SAINT ANTHONY UNDERGROUND MINEby Charles W. Baird, UNC Mining and Milling, P.O. Box 85, Seboyeta, New Mexico 87055,
Kalvin W. Martin, Consulting Professionals, Inc., P. O. Box 1844, Santa Fe, New Mexico 87501, andRobert M. Lowry, Department of Geology, University of New Mexico, Albuquerque, New Mexico 87131
AbstractUnited Nuclear's Saint Anthony mine, located in the Laguna
district, produces uranium ore from the Jackpile sandstone unitof the Morrison Formation. The Jackpile sediments were depos-ited in a fluvial environment characterized by aridity, gentleslope, distant source area, and limited flow volume. Resultantstratigraphy consists of an intricate assemblage of trough andtabular cross-stratification grading to near massive bedding atsome locations. Interbedded with the Jackpile sands are greenmudstones and siltstones that commonly display irregular thick-nesses of less than 2 ft and that are laterally discontinuous. Ma-jor penecontemporaneous and postdepositional alteration oforiginally deposited sands, silts, and clays includes: 1) infiltra-tion and filling of interstices by kaolinitic clays; 2) mobilizationand relocation of organic carbonaceous material; and 3) geo-chemical alteration of mineral constituents and fixation ofuranium ions in organic carbonaceous material. Mineralizedzones of economic volume display a spatial relationship to bed-ding features indicative of loosely packed sand deposited in duneand trough foresets. This relationship Indicates possible perme-ability control by initial stratigraphy upon the flow of mineraliz-ing solutions. Additionally, the low-energy foreset environmentfacilitates the accumulation of low-specific-gravity carbonaceousmaterial necessary for interaction with mineralizing solutions.Large volumes of loosely packed foreset sands accumulate intransverse bars in braided-stream environments. These structureshave a great potential for conducting large volumes of mineraliz-ing fluids and hosting economic quantities of uranium ore.
IntroductionThis paper presents ideas formulated from three years' obser-
vation of the Saint Anthony underground mine and associatedsurface drilling. Most of the ideas resulted from hundreds ofhours' observation of freshly excavated surfaces. Supplementaldata were gathered from many binocular and hand-specimen ex-aminations. Previous discussions of uranium trends in theGrantsregion do not emphasize correlation of palepenvironment bed-ding features to bedding features observed in economic concen-trations of uranium ore. We have made this correlation for oneorebody in the Saint Anthony mine in order to further under-stand the nature of sediments having an affinity for uraniummineralization. The analogy does not necessarily apply to otherconcentrations of ore occurring on the property.
ACKNOWLEDGMENTS—We thank UNC Mining and Milling forpermission to publish this paper. We also thank Sohio NaturalResources, D. Brookins, R. Delia Valle, R. Hicks, and A. Bairdfor their assistance.
StratigraphyThe Laguna district forms the southeastern end of the Grants
uranium region, which extends northwestward about 80 mifrom Laguna to Gallup and is described in detail by Hilpert andMoench (1960). Uranium deposits of the Laguna district, in-cluding the Saint Anthony deposit, are listed and described byMoench and Schlee (1967). The Laguna district is underlain by asequence of exposed sedimentary strata ranging in age from Tri-assic to Late Cretaceous (Moench, 1963). Excavations at the
Saint Anthony mine have exposed strata from Jurassic to UpperCretaceous. This sequence (in ascending order) comprises theJackpile sandstone unit (economic usage) of the Morrison For-mation (Upper Jurassic), Dakota Sandstone (Cretaceous), andMancos Shale (Upper Cretaceous). These units are relatively flatlying, dipping only 1 Vi ° NNW. Anomalous structural featuresoccurring within these formations have not been observed on theproperty.
The mine wor/ings now include two open pits and an under-ground mine (fig. A Ground was broken for the first surfaceexcavation, Pit No. 1, near the Dakota-Mancos contact inNovember 1975. This excavation penetrated approximately 75 ftof the Jackpile. Ground was broken for Pit No. 2 in Mancos col-luvium during the summer of 1976. Stripping operations first ex-posed the Dakota-Jackpile contact in the spring of 1977. Presentmining operations in Pit No. 2 have also penetrated 75 ft of theJackpile. Shaft construction for the underground mine began inJanuary 1977. The mine shaft, collared in Mancos colluvium, is357 ft deep and bottoms just above the Brushy Basin Member ofthe Morrison Formation.
The Brushy Basin Member contains the Jackpile sandstone, aninformal unit of economic usage, which will be treated as aseparate unit in this paper. Surface drilling indicates the BrushyBasin to be in excess of 250 ft thick at Saint Anthony. TheBrushy Basin comprises a greenish-gray, sometimes silty, well-indurated mudstone. Oxidation of minute, very fine sand inclu-sions and fracture fills imparts a disseminated reddish colorationto the siltstones and mudstones in some areas.
The Jackpile sandstone unit of the Morrison Formation is wellexposed in the open-pit walls and underground workings at SaintAnthony mine. Additionally, Jackpile outcrops occur south andeast of Pit Nos. 1 and 2 (figs. 1 and 2). The average thickness ofthe Jackpile is 100 ft, varying from 80 to 120 ft. Variations inthickness result from the intertonguing nature of the BrushyBasin and Jackpile. The Jackpile lithology consists of a wideassortment of colors, grain sizes, and bedding forms. Generally,the unit is a very light gray, medium to coarse-grained, sub-rounded, moderately sorted, subarkosic sandstone (Folk, 1968).
The Dakota Sandstone unconforniably overlies rocks of Juras-sic age throughout the Laguna district (Moench and Schlee,1967). The contact is well defined in the Willie P. orebody (fig.3). The contact contrasts planar and cross-stratified beds of theJackpile sandstone with the relatively massive, light-gray DakotaSandstone containing thin laminae of black, carbonaceous shale.Examination of the contact shows higher concentrations of kao-linite in the Jackpile sandstone. Clusters of euhedral pyritecrystals often occur in the Dakota, replacing carbon masses.Pyrite occurs less commonly in the Jackpile and is not necessarilyassociated with carbon. Arkosic stringers of probable Jackpilesand occurring in the lower few centimeters of the Dakota wereobserved in two localities.
The Dakota Formation is relatively thin, ranging in thicknessfrom 6 to 20 ft. The formation consists of nearly white to light-gray, Fine- to medium-grained, well-sorted, angular to sub-rounded, quartz sandstone that is well cemented with clay andsilica. A black carbonaceous shale, 3-6 ft thick, occurs inter-bedded in the Dakota Sandstone in some areas. In some loca-tions, a thin bed of black shale marks the base of the formation.
The Mancos formation achieves a maximum thickness of i

293
1000 2000 3000 f t l t
ORIGINALOAKOTA SANDSTONE OUTCROPSORIGINALJACKPILE SANDSTONE OUTCROPS
BOUNDARY OF EXISTING SURFACEEXCAVATIONPROPOSED SURFACE EXCAVATIONS
FIGURE 1—LOCATION MAP FOR SAINT ANTHONY UNDERGROUND MINL AND SURKACKI xt AVATIONS.
BIBO UMOQUINO
PAGUATE
PAGUATE DEPOSIT
5000 10,000 15,000 20,000ftet
frr, JACKPILE SANDSTONE OUTCROPS
MANCOS- DAKOTA OUTCROPS
ORE BODIES
FIGURE 2 LOCATION OF URANIUM-PRODUCTION PROPERTIES, LAGUNA DISTRICT (after Moench and Schlee, 1967).

294
A'
ELEVATION (ft)2 0 - D A K O T A S A N D S T O N E
Kd/Jml contact -
J A C K P I L E
0 25 50 75 t s t t
S A N D S T O N E
MESA TOE CREST
WILLIE PORE BODY
0 150 300 feet
Wn in P. oRlnom.SK TION ANDIM ,\N\n-\ks.
approximately 465 ft of Saint Anthony and comprises threeprominent sandstone units and intervening shales. The threesandstones are in the lower Mancos and are ideniified by Moenchand Schlee (1967) as the lower, middle, and upper sandstoneunits of the Mancos Shale. The middle sandstone unit, called theTres Hertnanos Sandstone Member, is the most extensive of thethree sandstone units (Moench and Schlee, 1967). The sandstoneunits are more resistant than intervening shales and form prom-inent mesa bluffs. The sandstones typically are buff colored onweathered surfaces and consist of thick to thin, flat-bedded cleanquartz sandstone. The upper sandstone unit is generally thethickest of the three units and forms a 50-ft cliff that capsGavilan Mesa (fig. 1). The shale units between the sandstoneunits are gray to black on freshly exposed surfaces and buffcolored on weathered surfaces. Nonresistant slopes consist of in-terbedded siltstones, shales, and thin limestone beds.
Petrology of sandstonePetrologic information has been gathered from binocular
examination of approximately 500 core, muckpile, and wallsamples from the Jackpile sandstone. Detrital minerals andauthigenic clays in 24 thin sections were examined for composi-tion and habit. Additionally, the material from 14 samplessmaller (nan two microns was x-rayed to identify and quantifyclay species. With this limited amount of data, this paper offersonly a basic understanding of Jackpile petrology.
Variations in the composition of the detrital fraction of theJackpile sandstone at Saint Anthony are from quartz arenitic toarkosic (Folk, 1968). The average composition is:
quartz 86 percentalkali feldspars 5 percentplagioclase feldspars 5 percentcomposite of detrital clay species 2-3 percent
(estimated from thin-section examination)rock fragments 1 percentheavy minerals trace
The detrital fraction is normally medium to coarsegrained androunded to subrounded. Sorting ranges from good in areniticvarieties to poor in arkosic varieties. Zircon is the only detritalheavy mineral observed in thin sections of 13 undergroundsamples. Binocular examination of many samples from locationson the property seldom reveal heavy-mineral grains or opaques.Observed opaques are usually altering to iron oxides. Detritalpyriteis not present.
Silt- to clay-size material is often interbedded with the sand-size fraction, forming laminations less than 1 mm to severalmillimeters thick. In barren ground these laminations frequentlyappear as a color phenomenon only. Cross-stratified sandstonedisplaying alternating laminations of green and white were exam-ined with a binocular microscope. No physical differences are ap-parent between laminations containing green interstitial clay andthose containing bleached white interstitial clays. Mineralogicdifferences between the green clays and the bleached white clayshave not been positively determined; however, the bleached whiteclays are believed to be principally kaolinite. Determination ofhow these laminations related to their original physical andchemical properties was not possible.
Binocular examination of moderately sorted sandstone speci-mens shows that approximately 80 percent of the detrital fraction

295
consists of fine to coarse sand-size material. Very fine sand andcoarse silt-size material that should be visible with the binocularmicroscope is not readily apparent. This observation has notbeen verified by sieve analysis. The grain-size distribution seemsheavily skewed toward the sand-size fraction.
The principal cementing agent is authigenic clay. The authi-genic nature of the clay cement was identified primarily by itstextural relationship with adjacent detrital grains as observed inthin section. Silica or lime cements are rare.
Green silt- and clay-size material forms distinct bedding fea-tures up to several feet thick and from tens to hundreds of feet inplan view. Two mudstone channel fills were observed in the sur-face excavations. The dimensions of one are 12 ft deep by 50 ftwide. A thin extension of this mudstone spills over into an ap-parent overbank area. The channel appears to be continuous forseveral hundred feet.
Mudstone galls and blebs were observed as minor detrital con-stituents in the sandstone thin sections where they appear asmasses much larger than neighboring grains and are usually de-formed by postdepositional compaction.
Authigenic products comprise an assemblage of several gen-erations of clay minerals (D. G. Brookins, personal communica-tion, 1979), that constitute 12-22 percent of the whole-rockvolume. X-ray diffraction of 13 samples revealed clay species oc-curring in the following approximate proportions to each other:
kaolinite 80 percentillite-montmorillonite 10 percentillite 5 percentchlorite 5 percentmontmorillonite not determined
The accuracy of x-ray-diffraction techniques for quantifyingclays is rated at ± 15 percent; the above data represent relativeproportions only.
The dominant clay species is kaolinite, which makes up about15 percent of the whole-rock volume in sandstone samples. Thekaolinite occurs as infillings of altered feldspar grains, relictgrains resulting from the complete replacement of detritalfeldspar grains, and pore-fill nests resulting from the authi-genesis of other associated clays and fine detrital fragments.Illite-montmorillonite is the next most abundant species, occur-ring as pore fill or a replacement product of altered detritalgrains. Illite occurs as grain coatings or growths within fracturesand as replacement of feldspar along grain boundaries. Mont-morillonite is only a minor authigenic constituent and may haveformed from the decomposition of volcanic ash (Adams andothers, 1978). Authigenic chlorite was not seen in thin section.
Other authigenic constituents, including hematite, Iimonite,and goethite, occur as coatings on grains and interstitial mate-rial. The coatings are common but make up a very small per-centage of the rock volume. Pyrite occurs as a rare authigenicconstituent in barren ground. It is occasionally found in associa-tion with high concentrations of organic carbonaceous materialand less frequently with interbedded mudstones. Quartz over-growths are common and are occasionally observed in thin sec-tion enveloping detrital grains previously coated with illite. Noattempt has been made to relate the location of abundant quartzovergrowths to areas of active feldspar destruction as was doneby Adams and others (1978) at the Jackpile deposit.
Nature of mineralized organiccarbonaceous material
The term organic carbonaceous material (OCM) after Lee(1976) describes vegetal material that has been coalified or liqui-fied to a humic acia. The organic carbonaceous material occurswithin the Jackpile sandstone in two forms: 1) One form is pri-mary material representing the remains of vegetal materialcoalified in situ and occurring as sand-size paniculate matter, orcoalified laminations interstratified in crossbedding, androunded to lensoid coalified masses that formed from twig and
branch material. 2) The second form is mobilized material repre-senting the remains of vegetal material liquified to a humic acid,which appears to have migrated through the sandstone, therebyforming pore fill and coating both grains and clay pore fill.
High concentrations of mobilized OCM occur as coatings ofinterstitial clay and detrital grains, and they also appear to fill in-terstices. This material, when mechanically disintegrated to apowder, is black to dark brownish gray; however, this phenom-enon may result from the interlayer staining of clays. The forma-tion of mobilized OCM is believed to be synchronous with thepassage of uranium-mineralizing solutions (Lee, 1976).
Grain-size, paniculate, primary OCM that apparently under-went partial remobiiization over a distance of a grain diameter ortwo will stain adjacent detrital and interstitial material. This tex-ture is common in low-grade massive sandstones and has beentermed speckled ore. Staining of adjacent interstitial and detritalmaterial occurred when primary OCM particles became solubleunder alkaline conditions (Lee, 1976).
The cross-stratified sandstone hosts the OCM in a variety ofrelationships to bedding. Mobilized OCM often is distributedhomogeneously throughout a particular crossbed set with thin in-terbedded laminations of coalified carbon. In the same area, thisorganic material will also occur discordant to bedding featuresand form clouds or halos that have no relationship to bedding ormineralogy. Variations in the occurrence of discordant OCM in-clude a wide variety of irregular shapes and sizes. Notable are theore rods or cones that occur in massive to poorly bedded sand-stone. The rods are often found hanging below a perforated, thinmudstoneorsiltstone lamination that restricted the movement ofmobilized OCM and mineralizing solutions.
Halo ore, common at Saint Anthony, is the occurrence of thin,highly mineralized concentrations of OCM in contact with thetops and/or bottoms of distinctly bedded mudstones or silt-stones. In adjacent sands, this material has been concentratedalong the mudstone or siltstone boundaries by adsorption. Theadsorption phenomenon is enhanced by hydraulic drag along theboundaries, which increases the relative time that mineralizedfluids are in contact with the clays. Occasionally the mudstonesand siltstones will exhibit only an irregular coating of mineral-ized OCM. In this case, adsorption properties appear to be thedominant factor in the association of the mudstone and OCM.High-grade halo ore may enhance the gamma signature of weak-ly mineralized mudstones to the point that they are misinter-preted in gamma logs as an ore thickness equal to the thickness ofthe mudstone.
Geochemical observationsThree types of ground within the Jackpile sandstone may be
distinguished on the basis of fundamental geochemical observa-tions: 1) barren ground, 2) ground through which mineralizingsolutions have passed (oxidized), and 3) well-mineralized ground(ore).
Barren ground occurs northwest of the Willie P. orebody in alldevelopment excavations. This sandstone is of a reduced geo-chemical nature, as indicated by the presence of: 1) interstitialauthigenic clays that are usually bleached white; 2) interbeddedgreen silts, mudstones, and mudstone galls; and 3) iron com-pounds in an unoxidized state. A majority of the barrensandstone is poorly indurated except where localized silicacementation occurs. This observation is in contrast to the natureof mineralized ground, which is invariably well indurated.Organic carbonaceous material is rare, occurring only in oraround mudstones and siltstones. X-ray diffraction of clayseparates from one sample of barren ground showed a higherratio of illite-montmorillonite mixed-layer clay to kaolinite thanaverages obtained from x-ray data of oxidized and mineralizedground. The ratio is also higher than that obtained from thin-section examination. The greater illite-montmorillonite tokaolinite ratio suggests that barren ground is geochemicallyyounger than ground subjected to mineralizing solutions—a

296
smaller percentage of mixed-layer clays have had the opportunityto develop compositionally toward kaolinite. These data arecompatible with expected barren-ground geochemistry; addi-tional analyses are in progress to test this concept.
Ground to the south-southwest of the Willie P. orebody hasbeen exposed to uranium-mineralizing solutions and is now ox-idized. Nearly all of this sandstone has very weak red, orange,yellow, or brown-buff hues. Binocular examination of this mate-rial shows that colors originate principally from the color of in-terstitial clays that apparently underwent oxidation of interlayercations (Adler, 1970). Interbedded mudstones and siltstonesusually maintain their green color; only in areas of heavy oxida-tion do they acquire grayish-purple to grayish-red hues. Concen-trations of carbonaceous material occur in isolated cross-stratified sets. These occurrences of mineralized organic materialconstitute satellite ore pods. Highly mineralized concentrationsof organic carbonaceous material occurring in massively beddedsandstone are usually brown when associated with oxidizedground.
Well-mineralized ground occurring in the Willie P. orebodycontains high concentrations of organic carbonaceous materialconformable or discordant to bedding. Mild oxidation of hostsandstone occurs within the orebody and is most prominent nearits margins.
Ore trends in underground mineJackpile uranium occurrences being mined in the Laguna
district are shown in fig. 2. Mineralization is locally presentthroughout the three producing properties owned separately byAnaconda Company, United Nuclear Corporation, and SohioNatural Resources and Reserve Oil and Minerals. Original min-eralization trends of the Laguna district have been obscured by anorthwest retreat of the Jackpile outcrop. The deposits shown infig. 2 are remnants of the original trends. Existing trends throughthe Saint Anthony and Sohio properties are north-northwest.Surface drilling at the Saint Anthony underground mine prior toproduction activities indicated a wide variety of plan-view ore-body configurations. Ai that time, recognition of any kind of
geochemical or stratigraphic model for the economic mineraliza-tion was impossible. After production activities had exposed asufficient amount of ground, a relationship began to be seenbetween minable volumes of ore and their internal beddingfeatures. Economic concentrations of uranium that are equi-dimensional in plan view occur in medium- to coarse-grainedsandstones displaying a very high degree of large-scale tabularcross-stratification. This observation has not been documentedstatistically but stands out as an obvious relationship when com-paring consistently heavily mineralized ground to barren orweakly mineralized ground. In barren ground northwest of theWillie P. orebody, cross-stratification occurs in a smaller per-centage of the sandstone, and the average set size is larger thanwithin the Willie P. orebody. Weakly mineralized ground south-west of the orebody contains large volumes of massively beddedsandstone. An example of consistently heavily mineralizedground is shown in fig. 3. The orebody is several hundred feetacross and averages 12 ft thick at its interior. Near the margins,the ore zone gradually thins to about a foot except where min-eralized beds have been truncated by fluvial erosion features. Theupper surface is truncated by the Dakota unconformity in thecentral portion of the orebody. Peripheral to the Willie P.orebody are many small concentrations of ore, often high gradeand occurring in isolated large-scale cross-stratified sets (fig. 4).No lateral continuity exists between these satellite pods and theadjacent orebody. Massively bedded sandstone in interveningareas is often weakly mineralized. The satellite pods in oxidizedground are probably representative of destructive processes oc-curring behind the advancing geochemical cell that mineralizedportions of the Jackpile sandstone.
Relationship between economicconcentrations of ore and braided-stream
bedding configurationsDescriptions of fluvial sediments by Smith (1970) and Harms
and Fahnestock (1965) illustrate the variety of bedding featurescommon to arid stream environments. We stress the importance
HORIZONTAL STRATIFICATIONINTERBEDDED CLAYSTONE/SILTSTONE
c—MINERALIZATION a ASSOCIATED OCM 0
MASSIVE BEDDING•^EQUIVALENT % U3 O,
FIGU RE 4—CROSS-STRATIFICATION IN VERTICAL EXPOSURES, SAINT ANTHONY UNDERGROUND MINE (view looking southeast).
297
of associating the term arid with the Jackpile paleoenvironmentbecause of the effect vegetation stabilization in humid fluvial en-vironments has on channel configurations. Development of thebraided-stream pattern is retarded by vegetation in overbankareas within the active channel zone. Sinuous, meander-beltfeatures common in humid fluvial environments cannot be seenin the Jackpile sandstone. For analysis of the Jackpile deposi-tional environment with respect to features observed in the WillieP. orebody, a fluvial lithosome must be postulated that containsa volume of sediment comparable in size to the orebody and thathosts similar bedding features. Since the mobilized organic car-bonaceous material does not appear to have traveled farther thanseveral times its longest dimension, it must also be present in thelithosome for reaction with uranium. The occurrence of primaryorganic material within the host lithosome would create a sourcefor mobilized carbonaceous material if quantities were suffi-cient. Original sandstone permeability must be suitable fortransmission of mineralizing solutions. As mentioned in thepetrologic discussion, the detrital-clay fraction of whole-rocksamples constitutes 12-22 percent and averages 17 percent of thesandstone by volume. The time relationship between interstitialplugging by authigenic clays and the movement of mineralizingsolutions will be considered later.
The classification of stratification types and bedforms in thebraided-stream environment is an attempt to model a very com-plex set of depositional variables. This complexity is particularlyevident in the field, where longitudinal- and transverse-bar formsoften interfinger (Smith, 1970) and make resulting configura-tions difficult to classify. However, the basic bedding character-istics of the transverse bar frequently maintain its identity andmake it distinguishable in the field. The transverse bar is com-posed of sand-sized material, as opposed to the longitudinal barwhich contains high concentrations of coarse-sand- to pebble-sized material (Smith, 1970). Transverse bars form by aggrada-tion of foreset beds on the downstream slip face. Stratificationforms created by this phenomenon were first called planar cross-siratification by Jopling (1966), and the name was adopted bySmith (1970). Harms and Fahnestock (1965), working with theRio Grande sediments, have not described bar features as exten-sively as Smith (1970). They describe bais as being composedpredominately of dune trough cross-stratification. Large-scaletabular cross-stratification analogous to Smith's planar cross-stratification occurs in shallow channel fills and on bar margins(Harms and Fahnestock, 1965). The difference in cross-stratifi-cation forms and lack of emphasis on bar deposits in the Harmsand Fahnestock article is probably a result of greater stream gra-dients and topographic restrictions to lateral channel develop-ment along the Rio Grande.
Harms and Fahnestock describe the dune foresets as "yieldingafoot" and attribute this to a loose packing of sand grains. Thisdescription is in contrast to close packing of sand deposited inhorizontal stratification often found capping bar deposits. Theabundance of large-scale cross-stratification, whether tabular ortrough shaped, forming on the downstream slip face of an ag-grading bar, would form a suitable accumulation of porous sandwith the potential to act as a conduit for mineralizing solutions.
During their investigation of the Rio Grande sediments.Harms and Fahnestock found leaves and twigs forming layersseveral inches thick in the fills of a few troughs. Rapid burial oflow-specific-gravity material in the foreset avalanche face byupslope reverse eddies is a plausible means of accumulatingorganics in stream sediments. Quite possibly, under the rightconditions transverse bars would contain suitable quantities ofvegetal debris to act as a source of mobile organic carbonaceousmaterial. Remnants of primary carbonaceous material inter-bedded in large-scale cross-stratification are well documented inSaint Anthony underground ore concentrations.
The maximum bar thickness, as observed by Smith and byHarms and Fahnestock, is 2.5 ft. Their observations were limitedto a depth of 5 ft by ground water in trench excavations. This
maximum is a measurement of active transverse and longitudinalbar forms. Other forms such as point bars may also occur in thebraided-stream environment (Smith, 1970). The thickness of apoint bar will be controlled by the depth of the associated chan-nel. The thickness of a transverse bar is similarly controlled bythe depth of water in the depression immediately preceding theaggrading bar. Full faces of ore in the underground mine containmultiple generations of superimposed cross-stratified sets. Sincemany of these accumulations are thicker than bar deposits ob-served in the field, they may represent an assemblage of super-imposed or stacked bar deposits.
Studies of bar deposits in existing literature describe many fea-tures that occur in the Willie P. orebody. The average grain sizeof cross-stratified sandstone in the orebody is comparable to theaverage grain sizes observed in present-day fluvial bar deposits.The plan-view configuration of the orebody is tabular, as aretransverse-bar deposits observed in the Plane River. Strati-fication forms occur in the Willie P. orebody in the same relativeproportions as in transverse-bar deposits. Channel-erosion fea-tures that breach transverse bars are found in the orebody. Notmentioned in the literature examined for this paper but common-ly observed in the Willie P. orebody are rip-up clasls and claygalls embedded in the crossbeds. These features are common dur-ing higher discharge rates which occur when spring runoff in-creases overbank sloughing and lateral channel migration.
The ratio of quartz to less-stable detrital constituents (feld-spar) and physical properties of the sandstone grains (sorting androundness) suggest that the Jackpile is a relatively mature sedi-ment. This degree of maturity would be expected of sediment oc-curring in the lower reaches of the Platte River, where Smith(1970) has observed increasing occurrence of transverse bars as afunction of distance from the source area. However, this conclu-sion would be incorrect if the Jackpile sediments included and/orconsisted of reworked Morrison sediments. Sedimentologicalwork is necessary to clarify the origin of Jackpile sediments.
Massively bedded, medium-grained sandstone increases in fre-quency of occurrence toward the peripheral margins of the WillieP. orebody. Massive bedding in a fluvial environment may formunder several conditions. The massively bedded sandstone heredoes not seem to have formed under conditions of flood bed-loaddumping because of the absence of clay- and silt-size material,mudstone galls, and rip-up clasts. Additionally, the massivesandstone does not seem to have formed from bioturbationbecause of its complete homogeneity. Massive bedding near theWillie P. orebody apparently formed under upper-flow-regimeconditions where turbulence is sufficient to winnow silt and clayfractions, depositing larger sizes homogeneously. Low-specific-gravity carbonaceous material will not be deposited in this en-vironment. The deposition occurs when heavy sediment loads arebeing transported in the upper flow regime and deposited infeatures such as pools. This phenomenon creates significantvolumes of porous sand devoid of OCM. Concentrations ofhigh-grade ore do not form in massive sandstone except whenthey occur near high concentrations of primary, mobilized OCM.
The interstitial plugging of originally deposited sand-sizedmaterial by infiltrating and authigenic clays occurred sometimeafter deposition. Mechanically infiltrating clays penetrate freshlydeposited alluvium, randomly filling voids and coating grainswith platelets oriented parallel to grain surfaces (Wilson and Pitt-man, 1977). Authigenic clays formed from the alteration of thefeldspar constituents and detrital-clay fraction. The time rela-tionship between the formation of authigenic clays and sedimentdiagenesis is not understood; however, some degree of interstitialplugging by authigenic clays must have occurred prior to themobilization of OCM and the impingement of mineralizing solu-tions in order to coat existing interstitial clays. The geochemicalenvironment in which OCM is mobile generates organic acidsthat readily break down clay minerals (Lee, 1976). Under theseconditions, sandstone porosity would be rejuvenated by theresolution of portions of the authigenic-clay fraction.

298
ConclusionsBedforms in the braided-stream depositional environment re-
semble bedding features observed in the Willie P. orebody at theSaint Anthony underground mine. Prominent bedding styles in-clude large-scale cross-stratification with tabular varietiespredominating over trough forms. The tabular cross-stratifica-tion occurs on the downstream slip face of aggrading transversebars. Concentrations of organic material become interbedded inthese foresets, creating a source for mobilized OCM internal tothe transverse-bar deposit. During diagenesis, authigenic claysform from the alteration of detrital clays and begin the slow pro-cess of plugging original rock porosity. Later geochemical eventswhich mobilize OCM and introduce uranium ions partially re-juvenate rock porosity by redissolving authigenic clays. Themobilized carbonaceous material moves for short distances,probably not more than one or two times the size of the crossbedset within which it exists. Large accumulations of transverse-barsediments or sediments of a similar genetic nature form a suitableenvironment for the accumulation of economic concentrations ofuranium ore.
ReferencesAdler, H. H., 1970, Interpretation of colour relations in sandstone as a
guide to uranium exploration and ore genesis, in Uranium explorationgeology: Vienna, Austria, International Atomic Energy Agency
Adams, S. S., Curtis, H. S., Hai'en, P. L., and Salek-Nejad, H., 1978, In-terpretation of postdepositional processes related to the formation and
destruction of the Jackpile-Paguate uranium deposit, northwest NewMexico: Economic Geology, v. 73, p. 1635-1654
Folk, R. L., 1968, Petrology of sedimentary rocks: Austin, Texas, Hem-phill's Book Store, 170 p.
Harms, J. C , and Fahnestock, R. K., 1965, Stratification, bed forms,and flow phenomena (with an example from the Rio Grande), inPrimary sedimentary structures and their hydrodynamic interpretation,G. V. Middleton, ed.: Society of Economic Paleontologists and Min-eralogists, Spec. Pub. 12, p. 84-115
Hilpert, L. S., and Moench, R. H., I960, Uranium deposits of the south-ern part of theSan Juan Basin, New Mexico: Economic Geology, v.55,p. 429-464
Jopling, A. V., 1965, Hydraulic factors controlling the shape of laminaein laboratory deltas: Journal of Sedimentary Petrology, v. 35, p.777-791
Lee, M. J., 1976, Geochemistry of the sedimentary uranium deposits ofthe Grants uranium belt, southern San Juan Basin, New Mexico: Ph.D.thesis. University of New Mexico, 241 p.
Moench, R. H., 1963, Geologic limitations on the age of uraniumdeposits in the Laguna district, in Geology and technology of theGrants uranium region, V. C. Kelley, compiler: New Mexico Bureau ofMines and Mineral Resources, Mem. 15, p. 157-166
Moench, R. H., and Schlee, J. S., 1967, Geology and uranium deposits ofthe Laguna district, New Mexico: U.S. Geological Survey, Prof. Paper519, 117 p.
Smith, N. D., 1970, The braided stream depositional environment, com-parison of the Platte River with some Silurian clastic rocks, north-central Appalachians: Geological Society of America, Bull., v. 81, p.2993-3014
Wilson, M. D., andPittman, E. D., 1977, Authigenic clays in sandstones,recognition and influence on reservoir properties and paleoenviron-ment analysis: Journal of Sedimentary Petrology, v. 47, p. 3-31

299
GEOLOGY AND CHARACTERISTICS OF URANIUMMINERALIZATION IN MORRISON FORMATION
AT DENNISON-BUNN CLAIM, SANDOVAL COUNTYby Jennie L. Ridgley, U.S. Geological Survey, MS 916, Box 25046,
Federal Center, Denver, Colorado 80225
AbstractUranium at the Dennison-Bunn claim, south of Cuba, New
Mexico, and along the east margin of the San Juan Basin, occursin fluvial channel sandstone of the Westwater Canyon Memberof the Morrison Formation (Upper Jurassic). An anomalouslyradioactive zone is bounded on the north and south by buff andorange sandstone of variable width. Within the anomalous zone,uranium is concentrated along the margins of smaller tongues ofoxidized rock in a configuration similar to that found in roll-typeuranium deposits. The uranium content in the mineralized rockranges from 0.002 to 0.07 percent UjO,. The uranium is believedto have originated within the Westwater Canyon Member or tohave been derived from the overlying Brushy Basin Member.Based on observed outcrop relations, two hypotheses are pro-posed to explain the origin of the mineralization: the anomalouszone represents 1) an original roll-type uranium deposit, or 2) anoriginal tabular deposit that has undergone subsequent oxidationwith remobilization and redeposition of uranium around themargins of smaller tongues of oxidized rock. Similarities betweenthe mineralization at the Dennison-Bunn claim and that in roll-type uranium deposits near San Ysidro suggest that a roll-typeorigin is the most probable for this deposit. Similar depositsunaffected by surface oxidation may be present in the subsurfacealong the east side of the basin.
IntroductionIn the southern part of the San Juan Basin, uranium in the
Westwater Canyon Member of the Morrison Formation (UpperJurassic) occurs in tabular, humate-conirolled deposits or inredistributed, stacked, or roll-type deposits (Granger and others,1961; Granger and Warren, 1974). Uranium in the redistributeddeposits is believed to have been derived from preexisting tabulardeposits. Along the east side of the San Juan Basin, about 17 minorth of San Ysidro, several small, surface uranium deposits,located at the boundary between oxidized and unoxidized rock,have been mined from the Collins and Goodner leases (fig. 1;Chenoweth, 1974; Kittleman and Chenoweth, 1957). In this area,several smaller uranium occurrences are also found close tooxidation-reduction boundaries in the sandstones. North fromthis area to Cuba along the outcrop bell, intervals of orange, ox-idized sandstone in the Westwater Canyon Member are present atthe surface.
The Dennison-Bunn claim is a small uranium deposit that oc-curs in gray, unoxidized sandstone of the Westwater Canyonnear one of these large tongues of oxidized rock. The claim islocated about 10 mi south of Cuba, New Mexico, along the westmargin of the Nacimiento uplift, in sec. 11, T. 19 N., R. 1 W.,Sandoval County (fig. 1). This report discusses the characteristicsand possible origin of the deposit and the relation of this oc-currence to possible uranium mineralization in the subsurface inthe eastern part of the San Juan Basin. Additional informationon this deposit may be found in Ridgley (1979).
Stratigraphy and depositionalenvironments
Sedimentary rocks, ranging in age from Permian to Creta-ceous, crop out in a north-south-trending belt just west of the
Nacimiento uplift. In ascending order, these are: the Abo, Yeso,and Chinle Formations; the Entrada Sandstone; the TodiltoLimestone; the Morrison Formation; the Dakota Sandstone; andthe Mancos Shale. Younger Cretaceous and Tertiary rocks arepresent farther west in the basin. Precambrian gneiss and schistform the exposed core of the Nacimiento uplift to the east. Abrief discussion of the lithology and environment of depositionof the Westwater Canyon Member of the Morrison Formation ispresented below. Additional information on the stratigraphy ofthe area may be found in Ridgley (1979), Santos (1975), andWoodward and Schumacher (1973).
Westwater Canyon MemberIn this area, the Westwater Canyon Member is not character-
ized by the massive ledge-forming sandstones so prevalent in thesouthern part of the basin. Rather, the sandstones form lowridges between the slope-forming Brushy Basin Member aboveand Recapture Member below. The contact between the inter -tonguing Westwater Canyon and Brushy Basin has been arbitrar-ily placed where claystone becomes the dominant lithology. TheWestwater Canyon is approximately 208 ft thick, although thethickness varies laterally to the north and south. It is composedof coarse- to fine-grained sandstone and interbedded mudstone.
Laterally and veitically, the Westwater Canyon is character-ized by a thick sequence of interconnected sand bodies split by
36°OO'
35°45'
I I
R. 1 W.
SAN PABLOANTICLINE
LA VENTAN
f . 20 N.
ENNISON"BUNNCLAIM
SAN LUIS
COLLINS &GOODNER
LEASES
13 km.
SANYSIDRO
EXPLANATIONMorrison FormationFaul t ,
IO7°00' IO6°45'FIGURE 1—LOCATION OF THE DENNISON-BUNN CLAIM, THE COLLINS AND
GOODNER LEASES, AND THE OUTCROP AREA OF THE MORRISON FORMATIONALONG THE EAST SIDE OF THE SAN JUAN BASIN, NEW MEXICO.

300
mudstone horizons. Sandstone intervals, ranging in thickness upto 46 ft, are the dominant lithology. The sandstones are dark andlight orange, buff, yellow gray, white, or light gray, dependingon the amount and type of oxidation of iron-bearing minerals.The sandstones are composed of subrounded quartz grains andminor feldspar, chert, and rock fragments. Accessory mineralsinclude zircon and iron oxides; locally, iron sulfides are alsopresent. The sandstones are friable to indurated and arecemented with calcite, chert, clay, or iron oxide. Sorting rangesfrom moderate to poor; grain size decreases from coarse tomedium near the base of the member and, near the top, frommedium to fine.
Mudstone intervals vary in thickness from a few inches toseveral feet. They are dominantly grayish green but may also bemaroon, reddish brown, or pale orange. X-ray diffraction ofmudstone samples indicates that montmorilionite, mixed-layermontmorillonite-illite, and—locally—kaolinite are the principalclay minerals present.
Bedding is indistinct, owing to surface weathering. However,close examination indicates that the sandstones contain low-angle crossbeds and exhibit some cut-and-fill structures.
Although paleocurrent measurements have not been made, thegeometry of channel sandstones indicates that the axes of thechannels lie in a roughly west-southwest to east-northeast orien-tation. The margins of the channels thin to the north and south.The interbedded nature of the sandstone and mudstone intervalsand the channel form of some of the sand bodies suggest deposi-tion under fluvial conditions of low to moderately low energy.
StructureMajor structural features in this area can be related to defor-
mation that began in Late Cretaceous time and continued, atleast intermittently, into Eocene time (Baltz, 1967). Studies byBaltz (1967) and Santos (1975) do not indicate the presence ofany pre-Dakota folds in this area; however, some local foldingmay have begun along the east side of the basin during depositionof the Upper Cretaceous Kirlland-Fruitland sequence (Baltz,1967, p. 27). Structure contours drawn on the base of the over-lying Ojo Alamo Sandstone (Paleocene) indicate the presence ofrather broad northwest-trending folds (Baltz, 1967, pi. 1).
The regional dip is locally more than 10° in the study area andbecomes progressively less northwest into the basin. The broad,northwest-plunging folds are asymmetric; the west limbs of thefolds dip more steeply than the east limbs. At the southeast ter-minus of these folds, the rocks dip steeply toward the basin or areoverturned along a hinge line that marks the position of the syn-clinal bend that parallels the Nacimiento uplift. The formation ofthe synclinal bend was closely associated with the formation, inearly Eocene time, of the high-angle fault that bounds the westside of the Nacimienlo uplift.
The Dennison-Bunn claim is located at the southern terminusof one of these folds, the San Pablo anticline (fig. 1). Theuranium deposit occurs in the upturned beds, which once mayhave been part of the west limb ol the anticline. Using limitedoutcrop data, structure contours drawn on the base of two Creta-ceous formations (the Mancos Shale and the Menefee Forma-tion) show the dip of the west limb of the fold to be just under10°
In contrast, the Dakota Sandstone (Cretaceous) and olderrocks, at the outcrop, generally dip between 35° and 50° west-northwest into the basin. Using outcrop data, structure contoursdrawn on the base of the steeply dipping Morrison Formation donot clearly reflect the San Pablo anticline structure; the com-puted structural dip exceeds 30°. The relatively high dip ofDakota and older strata reflects, in part, the original dip imposedby pre-San Jose folding; however, it may be mainly a result of in-creased steepening along the synclinal bend that formed just westof the high-angle fault bounding the Nacimiento uplift (Baltz,1967, pi. 8; Woodward and others, 1973). Just west of this belt of
steeply dipping rocks, the dips probably flatten out and would beconformable with those of the Mancos and younger rocks(Woodward and others, 1973). Additional information on thestructural history of the east side of the San Juan Basin may befound in Baltz (1967), Ridgley (1979), Santos (1975), and Wood-ward (1974).
Uranium depositUranium mineralization occurs in varying amounts in all sand-
stone horizons of the Westwater Canyon in this area; however,the greatest concentration occurs in the uppermost sand inter-vals.
Geometry and distribution of uraniumNear the uranium deposit, background radioactivity in barren
sandstone of the Westwater Canyon ranges from 60 to 80 countsper second (cps) on a scintillometer having a 38.1 by 38.1 mmsodium-iodide crystal. A minimum reading of twice backgroundwas used to define anomalous radioactivity. The approximateoutcrop area that is anomalous is about 308 ft wide, parallel tostrike, and about 80 ft thick, including interbedded mudstone in-tervals; the most continuous and highest radioactivity is in theupper 36 ft of this interval. The extent of radioactivity in thethird dimension, downdip, is not known.
The upper 36 ft consists of fluvial sandstone that is the host forthe uranium deposit at the Dennison-Bunn claim. The sandstonewithin this deposit is light gray, buff, or orange, depending onthe degree of oxidation of iron-bearing minerals. Fig. 2 is aschematic diagram of the outcrop showing the relation of gray,uraniferous zones to areas of barren to weakly mineralized,orange, oxidized sandstone. Contacts between oxidized and un-oxidized mineralized rock in the upper part of the sandstone in-terval are poorly exposed; the relations shown are inferred.
The area of unoxidized, mineralized rock is bounded laterallyon the north by a large area of orange oxidized sandstone and onthe south by an area of buff- to rusty-tan-weathering sandstoneextending over 2,640 ft in width. The mineralized rock is sepa-rated from the orange, oxidized sandstone by nearly 66 ft of grayto buff, weakly radioactive sandstone. Local anomalous radio-activity is present 1,400 ft and 2,495 ft south of the deposit inlight-gray to buff weathering sandstone of the Westwater Can-yon. Much farther south along the outcrop belt, large areas ofsandstone of the Westwater Canyon have been oxidized and ex-hibit a bright-orange color. According to Sears and others(1974), rocks equivalent to the uraniferous interval immediatelyto the west in the basin are not oxidized.
Brushy Basin Member--shale
EAXWestwater Canyon Member—mudstone
lOOmelers j3 metersTId
CZZ1
cm
EXPLANATION
Orange oxidized sandstone ^ - ^Buff, limonitic sandstone Ill l l l l jPale orange oxidized sandstone f~lLight gray, uraniferous sandstone Jj
? Covered interval
Vertical scale
Uraniferous redox zoneArea of greatest radioactivitySmall extraction holeBreak in section
FIGURE 2—SCHEMATIC DIAGRAM OF THE URANIUM-BEARING SANDSTONE INTHE UPPER PART OF THE WESTWATER C A N Y O N MEMBER, showing therelation of uraniferous zones to areas of oxidized sandstones; viewlooking west in direction of dip; scale is approximate (features labelledA, B, C are shown at a larger scale in fig. 3).

301
Within the anomalous zone, the uranium is concentrated alongthe margins of numerous small-scale tongues or zones of oxi-dized rock, which are separate from the larger areas of oxidizedrock that bound the anomalous zone (fig. 2). These oxidizedtongues are pale orange or yellow brown and are surrounded byunoxidized, light-gray, mineralized sandstone. The boundarybetween unoxidized and oxidized rock of the tongues is alwaysmarked by a black to dark-orange, iron-rich, uranium-bearingzone (referred to as the redox zone) ranging up to several inchesthick.
These small-scale tongues of oxidized rock arc from a few feetto several tens of feet wide and from less than a foot to severalfeet thick. The largest of these is about 330 ft wide and has an ir-regular configuration (fig. 2). Some tongues of oxidized rockmay be wholly enclosed within the unoxidized sandstone. Inother tongues, oxidation may terminate at the upper or lowercontact of the sandstone unit or along a thin internal clay seam(fig. 2). The shape of the oxidized tongues indicates that theyformed by ground water flowing westerly, somewhat parallel tothe present dip of the beds and to the axes of the sandstone chan-nels.
Fig. 3 is a schematic diagram of several of the small tongues ofoxidized rock described above. These small tongues are from themost highly mineralized area shown in fig. 2 and are represen-tative of those found at the surface along the entire length of theanomalous zone. Scintillometer data are used because notenough chemical data are available. The levels of radioactivityshown do not represent true concentrations of uranium owing tomigration of daughter products from the uranium.
Uranium concentration throughout the anomalous sandstoneinterval is highly variable (table 1). Radioactivity ranges from180 to 4,500 cps (2-60 times background); the average is about300-600 cps (4-8 times background). The highest radioactivity oc-curs in the northern part of the anomalous zone, 3 ft north of thenorthern boundary of the largest tongue of oxidized rock pre-viously mentioned (fig. 2). In this area, radioactivity ranges from1,000 to 4,500 cps over a distance of about 83 ft.
Table 1 shows the uranium and equivaient-uranium values ofselected samples submitted for analysis. These analyses indicate arange of uranium concentration from 0.002 to 0.07 percentUsO,. Uranium concentration of the samples was determinedradiometrically and by delayed neutron activation. Equivalent-uranium values shown in table 1 are similar to those reported bySears and others (1974) from this deposit.
The uranium occurs at the irregular boundaries between ox-
A.G
uoo _CLAY-RICH"SANDSTONE Q
160iL
/900v G S800 Cjso^~"""^
G400^-^9C
G
} meters
•°4J, liioor
c..G
G 1600" 8
—) meter —
-*s—^w600-800 3S
0 G—6 meters -
G~ \
-100C
1600
fboo30
EXPLANATION
1 1 Orange oxidized sandstone
^""™ Redox rimG Light-gray uraniferous sandstone
*_' Rp'i orange dispersion zone1 ?0U Scintillometer counts per second
FIGURE 3—SCHEMATIC DIAGRAM OF SOME OF Tub SMAU.-SCAI.I-. TONGUESOF OXIDIZED ROCK AND ASSOCIATED LEVELS OF RADIOACTIVITY AS DETERMINED BY SCINTILLOMETER; no radioactivity measurements are available
for A; scale is approximate.
idized and unoxidized sandstone, in a configuration that in-dicates small-scale roll-type geometry (figs. 2, 4; table 1). Theconcentration is generally highest immediately adjacent to aredox zone on its unoxidized side and decreases away from theredox zone farther into the unoxidized rock. The zone of ura-nium concentration varies from a foot to several tens of feet inwidth, but it is usually less than 3 ft wide. In four samples an-alyzed for organic carbon and uranium, organic carbon is moreabundant than uranium by weight percent (table 1).
TABLE 1—URANIUM, EQUIVALENT URANIUM (eU), AND CARBON VALUES OF SELECTED SAMPLES FROM THE ANOMALOUS ZONE- (NA—notanalyzed).
samplenumber
AP-Jmw2
AP-Jmw2a
AP-Jmw3a
AP-Jmw3b
AP-Jmw3c
AP-Jmw3d
U
(ppm)
22.73
83.37
73.24
52.15
324.62
657.14
eU
(ppm)
190.
180.
240.
110.
310.
610.
totalcarbon
(%)
NA
NA
NA
0.09
0.12
0.07
organiccarbon
(%)
NA
NA
NA
0.05
0.12
0.07
mineralcarbon
(%)
NA
NA
NA
<0.01
<0.01
<0.0l
lithology
light-orange-grayuraniferoussandstone
grayuranifcrousclaystone
gray uraniferousclaystone
light-orangeuraniferoussandstone
dark-orange,iron-richuraniferoussandstone
light-grayuraniferoussandstone
position in thedeposit
sandstone channel belowthe major uranium-bearing horizon
mudstone split insandstone AP-Jmw2
below major uraniferoussandstone
large oxidized tongue
redox boundary
most anomalous grayuranium zone

302
FIGUT.E 4—CROSS-SECTION VIFW SHOWING THE RELATION BETWEEN
ORANGE SANDSTONE (DARK AREA). REDOX ZONE (DARK UANDI. AND LIGHT-CRAV UBANiFEROUS SANDSTONE ITO THE LEFT AND BELOW REDOX /ONE) ONTHt MARGIN Oh ONE Ol THb SMALL ROLL-TYPE I EATURhS.
The redox zones also contain variable concentrations of ura-nium (table 1) and show levels of radioactivity generally from 4to 25 times background. Organic-carbon values appear to beslightly higher in this zone (table 1). The tongues of oxidized rockcontain a low concentration of uranium (table I) and show levelsof radioactivity generally between two and three times back-ground. Some tongues of black to dark-orange oxidized rock inthe redox zone have radioactivity as much as ten times back-ground. In one sample from the oxidized zone, organic carbon ismore abundant than uranium by weight percent. The mineral-carbon value also is higher than that in the other zones. Thehigher mineral-carbon value reflects the presence of carbonatecement.
The sandstone below the main mineralized zone and claystoneintervals within that sandstone and within the main zone are alsoradioactive but less s-1 'han the main zone itself (table I).
MineralogyThe principal epigenetic minerals in the anomalous zone are
hematite, iron sulfide, calciie, manganese oxide, and secondaryuranium minerals.
Jn oxidized rock, hematite occurs as discrete grains, irregularmasses, coatings on grains, and along cleavage planes in feldsparand biotite. The hematite masses invariably contain a remnantcore of an unidentified iron-bearing mineral whose original com-position has not yet been determined.
In the uranium-bearing, iron-rich redox zone, iron oxide(hematite?) appears to be the principal cementing material. Thehematite occurs as thick to thin concentric rims around grainsand as an alteration of feldspar grains. The material rimming thegrains may have originally contained other iron-bearing mineralsand perhaps carbonaceous material. The presence of carbonace-ous material has not been confirmed visually but is suggested bya slightly higher value of organic carbon for this zone (table 1).The iron-rich cement is also radioactive. Fission tracks recordedon a thin strip of mica show a one-to-one correlation with thedistribution of iron-rich cement (Ridgley, 1979, fig. 6). Thenature of the uranium has not yet been determined; it may occuras tiny, discrete minerals or may be adsorbed onto the surface ofthe iron oxide (van der Weijden, 1976).
Iron sulfide occurs sparsely in the unoxidized rocks, usually asextremely small aggregates, small grains in altered rock frag-ments, and coatings on sand grains. Further study of polishedthin sections should determine the identity of the sulfide species.
Calcite has been observed only in the oxidized rocks from themineralized area, in rocks from the lower sandstones of theWestwater Canyon, and in rocks from the basal sandstone of the
Brushy Basin directly above the mineralized area. In the oxidizedsandstone, fine-grained quartz cement coexists with calcite ce-ment. The calcite occurs as large, optically continuous crystals,enclosing many grains. Feldspar grains enclosed in these crystalsshow varying degrees of replacement by calcite. The age of thecalcite is not known; possibly, it is of postmineralization origin,as the acid environment present during oxidation would not havebeen conducive to its preservation.
Black manganese oxide occurs as coatings on grains or as bo-tryoidal masses along fractures (Ridgley, 1979, fig. 7). Semi-quantitative analyses of the manganese oxide show a slightenrichment of organic carbon and molybdenum and a muchgreater content of thallium, compared to the manganese-poorrocks (Ridgley, 1979, table 1). The host rock containing themanganese oxide also contains efflorescent secondary uraniumminerals, but they do not occur together. The manganese oxide isfound at the outcrop surface and was probably formed undersurface or near-surface oxidizing conditions.
Yellow and yellow-green secondary uranium minerals are vis-ible in hand specimens of uranium-rich rocks. These mineralshave been identified by E. H. Schot and R. S. Wegrzyn (Cheno-weth, 1974; written communication, 1978), using x-ray-diffraction techniques, as bayleyite and liebegite. Bayleyite, ahydrated magnesium-uranium carbonate, occurs as thin yellowcrusts coating grains. Liebegite, a hydrated calcium-uranium car-bonate, is yellow green and occurs as a thin crust on grains or asdiscrete crystals.
Origin of depositIn understanding the origin of any uranium deposit, two basic
and related questions must be answered: The first involves thesource of the uranium; the second involves the method of trans-port and concentration.
No direct evidence exists for ihe source of the uranium at thisdeposit. Some possible sources include the Westwater Canyonand Brushy Basin Members, the Ojo Alamo Sandstone, the CubaMesa Member of the San Jose Formation, and the BandelierTuff (Pleistocene). All of these units contain arkosic sandstones,volcanic-ash layers, or are known to be radioactive. The OjoAlamo and Cuba Mesa are composed of arkosic sandstones.However, neither can be demonstrated to have directly overlainthe Westwater Canyon at any time.
Chenoweth (1974) has postulated that the Bandelier Tuff,which contains up to 20 ppm uranium in grab samples, oncecovered a broader area and could have been the source of ura-nium for a number of small occurrences in the Nacimiento areaand in the southern part of the Chama Basin. Although theBandelier Tuff possibly could have been the source for theuranium at the Dennison-Bunn prospect, the formation of ura-nium deposits in the already steeply dipping Westwater Canyonis unlikely. Also, no direct evidence exists supporting depositionof the Bandelier Tuff west of the Nacimiento uplift.
Of the potential sources for uranium, the Westwater Canyonand overlying Brushy Basin seem most likely. Whether the ura-nium was disseminated or was first concentrated into local,tabular-type deposits before being redistributed in its presentform is unknown.
Conclusive answers on the origin of this deposit have not beenreached. Based on observed outcrop relations, two hypothesescould explain the origin of the mineralization: The anomalouszone represents 1) an original roll-type uranium deposit or 2) anoriginal tabular deposit that has undergone subsequent oxidationwith remobilization and redeposition of uranium around themargins of smaller tongues of oxidized rock. These hypothesesare conjecture, owing to the lack of nearby subsurface data,removal of the updip portion of the strata, and several stages oflater oxidation.
The first hypothesis is that the uranium occurrence representsa remnant of a primary roll-type deposit that has been largely

303
destroyed by near-surface oxidation. The most probable time offormation of the original roll-type deposit was during the earlyEocene, before formation of the synclinal bend. Prior to thistime, the Morrison was still buried by a thick sequence ofyounger strata that prevented access of oxygenated water neces-sary for the formation of a roll-type deposit. After this time,tilting of strata along the synclinal bend produced dips in the hostrock that are probably too steep (45 °) to allow the formation of aroll-type deposit.
In early Eocene time, the Morrison may have been exposed (ornearly so) during erosion of the crest of the San Pablo anticline.Uranium-bearing, oxygenated ground water would have enteredthe bevelled edges of the then gently dipping Westwater Canyon.Where this water encountered reducing conditions, a roll-typedeposit would have formed. After the beds were steepened, themineralizing process probably would have terminated. Subse-quent burial by the upper part of the Regina Member of the SanJose Formation during Eocene time might have prevented the in-flux of oxygenated ground water, thereby protecting the depositfrom destruction. During subsequent erosion, when the Mor-rison was again exposed at the surface, oxygenated ground waterwould have entered the host rock and remobilized some or mostof the uranium in the roll-type deposit. The present distributionof uranium concentrations may reflect portions of the originaldeposit and portions that have resulted from redeposition ofuranium around the variously shaped zones of oxidized rock.
The gross aspects of uranium mineralization at the Dennison-Bunn claim and its similarities to the roll-type uranium depositsand occurrences near San Ysidro suggest that a roll-type origin isthe most probable.
Although firm evidence is lacking, the second hypothesis pro-poses that the occurrence represents a remnant of a small tabularuranium deposit in various stages of destruction by successivestages of oxidation. The orange oxidized sandstone, which beginsabout 160 ft north of the most highly radioactive area, may rep-resent one of the later stages of oxidation in which uranium wasremobilized and removed from the area. The locally radioactive,buff, limonitic sandstone bounding the deposit to the north andsouth may represent areas where oxidation has destroyed most ofthe deposit. The remainder of the deposit now reflects more re-cent destruction, with remobilization and redeposition of ura-nium at the boundaries of small tongues of oxidized rock.
Economic speculationsThe uranium analyses shown in table 1 indicate the concentra-
tion now present at the surface and may not reflect the originalconcentrations. The low uranium concentration may reflect re-moval of uranium by various stages of oxidation and solution, orit may reflect an original low concentration. If the roll-typehypothesis is correct, possibly the time available for formation ofthe initial deposit was too short to produce a very large deposit.The steepening of the host rocks along the synclinal bend wouldhave disrupted the hydrologic regime conducive to the formationof the initial roll-type deposit. If the tabular hypothesis is cor-rect, the low concentration of uranium may reflect low amountsof uranium available to the system and/or a low concentration ofreductant in the host rock during mineralization.
The small size of the deposit at the Dennison-Bunn claim andthose mined near San Ysidro may indicate that any depositsfound in the subsurface on the east side of the San Juan Basinwill be smaller than those in the Grants area.
Roll-type uranium deposits would be limited to the margins oflarge tongues of oxidized sandstone. Areas of oxidized rock afew hundred feet to several thousand feet wide are present at in-tervals along the outcrop belt from San Ysidro to Cuba. Only alimited area would favor exploration for this type of uraniumdeposit.
In the San Ysidro area, about 395 tons of ore containing 0.13percent UjO, were mined from sandstones of the Brushy Basin atthe Goodner and Collins leases (fig. 1) from 1957 to 1959 (Chen-oweth, 1974). The relation of the uranium deposits mined tolarge tongues of oxidized rock suggests that the small depositsformed were of the roll type. If the uranium deposit at theDennison-Bunn locality is a roll-type deposit and is geneticallysimilar to the small roll-type deposits mined north of San Ysidro,the probability of finding additional deposits in the subsurface atthe margins of oxidized rock is good.
Only the presence of tabular-type uranium deposits wouldmake the east side of the basin favorable for uranium explora-tion. If the deposit at the Dennison-Bunn claim does represent anoxidized, partly remobilized, tabular deposit, all of the condi-tions necessary to produce tabular uranium deposits might existthis far north in the basin. Similar small to medium-size depositsmay exist along the major sandstone trends in the subsurface tothe west.
ReferencesBaliz, E. H., 1967, Stratigraphy and regional tectonic implications of part
of Upper Cretaceous and Tertiary rocks, east-central San Juan Basin,New Mexico: U.S. Geological Survey, Prof. Paper 552,101 p.
Chenowcth, W. L., 1974, Uranium occurrences of the Nacimienlo-Jemezregion, Sandoval and Rio Arriba Counties, New Mexico: New MexicoGeological Society, Guidebook 25th field conference, p. 309-313
Granger, H. C , Santos, E. S., Dean, B. C , and Moore, F. B., 1961,Sandstone-type uranium deposits at Ambrosia Lake, New Mexico—aninterim report: Economic Geology, v. 56, no. 7, p. 1179-1210
Granger, H. C , and Warren, C. G., 1974, Zoning in the altered tongueassociated with roll-type uranium deposits, in Formation of uraniumore deposits: Vienna, Austria, International Atomic Energy Agency, p.185-199
Kittleman, L. R., Jr., and Chenoweth, W. L., 1957, Uranium oc-currences on the Goodner lease, Sandoval County, New Mexico: U.S.Atomic Energy Commission, Open-file Rept. TM-184,14 p.
Ridgley, J. L., 1979, A preliminary report on the geology of theDennison-Bunn uranium prospect, Sandoval County, New Mexico:U.S. Geological Survey, Open-file Rept. 79-1510,40 p.
Santos, E. S., 1975, Lithology and uranium potential of Jurassic forma-tions in the San Ysidro-Cuba and Majors Ranch areas, northwesternNew Mexico: U.S. Geological Survey, Bull. 1329,22 p.
Sears, R. S., Marjaniemi, D. K., and Blomquist, J. T., 1974, A study ofthe Morrison Formation in the San Juan Basin, New Mexico and Colo-rado: U.S. Atomic Energy Commission, Rept. GJO-912-20,101 p.
van der Weijden, C. H., 1976, Sorption of uranyl by hematite-Theoretical and geochemical implications (abs.): Geological Society ofAmerica, Abstracts with Programs, v. 8, no. 6, p. 1152
Woodward, L. A., 1974, Tectonics of central-northern New Mexico: NewMexico Geological Society, Guidebook 25th field conference, p.123-129
Woodward, L. A., and others, 1973, Geologic map and sections of SanPablo quadrangle, New Mexico: New Mexico Bureau of Mines andMineral Resources, Geol. Map 26, scale 1:24,000
Woodward, L. A., and Schumacher, O. L., 1973, Morrison Formation ofsoutheastern San Juan Basin, New Mexico: New Mexico Bureau olMines and Mineral Resources, Circ. 129,7 p.

304
URANIUM IN TODILTO LIMESTONE (JURASSIC)OF NEW MEXICO—EXAMPLE OF A
SABKHA-LIKE DEPOSITby Richard R. Rawson, Marathon Oil Company, Box 120,
Casper, Wyoming 82601
AbstractThe Todilto Limestone was deposited in or near a large lake
that became restricted at times and evaporated to dryness. Theformation has a lower limestone member and an upper gypsummember. The limestone member has been divided informally intothree zones: the lower platy zone, a middle crinkly zone, and anupp-r recrystallized zone. The platy zone is interpreted to havebeen deposited below wave base under anoxic conditions. Thecrinkly zone has thin stromatolitic laminations that may formalgal domes. The upper recrystallized zone appears in part to be acollapsed breccia caused by the removal of interbedded gypsum.Uranium ore is restricted primarily to the crinkly and recrystal-lized zones. These two zones may have been formed in a sabkha-like environment. A sabkha origin has been proposed for somestratiform copper deposits. The same conditions that cause cop-per to precipitate would also cause uranium to precipitate.Ground water bearing U*6 could also be drawn upward byevaporative pumping through the decaying algal-mat zone wherethe uranium would be reduced to U ' 4 and precipitated. Car-bonate materials lithify early, destroying permeability, so thaturanium emplacement must occur before lithification. Radioiso-tope dates on uraninite in the Todilto Limestone indicate oreemplacement shortly after depos.iion. Uranium-bearing groundwater moved basinward in the underlying Entrada Sandstone andwas drawn upward through the stromatolitic zones along thesouthwest margins of Lake Todilto where uranium was precip-itated.
IntroductionSedimentary uranium deposits have been formed in such wide-
ly divergent depositional environments as marine sandstone,stream channels, alluvial fans, lake beds, and sabkha-like de-posits (Rose, 1974; Rawson, 1975; Schrader and Furbish, 1976).Recent work by Renfro (1974), Rose (1974), and Smith (1974) in-.dicates that some stratiform copper deposits were formed in anenvironment of deposition closely related to that of a coastalsabkha. The same conditions that cause the precipitation of cop-per and associated metals in a sabkha should also cause the pre-cipitation of uranium, if it is present in the ground-water system.
This paper shows that uranium deposits in the Todilto Lime-stone were emplaced as a result of physical and chemical condi-tions found in a sabkha-like environment. Production from theTodilto represents the only commercially developed limestone-uranium deposits in the United States. The Todilto Limestonewas deposited in the San Juan Basin of northwestern New Mex-ico during Late Jurassic time. The limestone has produced over2,900 tons of U3O8, which represents about 2 percent of the totaloutput of the Grants mineral belt (Chenoweth, this volume).
Sabkha model of mineralizationRenfro (1974) has proposed a model to explain evaporite-
associated metalliferous deposits (fig. 1). The depositional set-ting of the model is an extensive, shallow-marine lagoon or salineinland sea. The model requires high evaporation rates, whichwould necessitate a hot, arid climate. Bordering the lagoon or in-land sea in the supratidal zone, abundant algae is present in theform of stromatolites. The decaying algae provides a source ofhydrogen sulfide, which serves as a reducing agent to form metal-
lic sulfides. Desert landforms predominate on the low-relief land-ward side of the model. The model is underlain by terrigenouselastics that are porous and permeable.
Two ground-water environments play an active role in themodel: a high pH-low Eh water in offshore sediment and a lowpH-high Eh water of terrestrial origin in onshore sediment. Theterrestrial ground water transports trace amounts of copper,silver, lead, zinc, and iron in acidic solutions with a positive Eh.
In order for the algal sediments to overlie terrestrial elastics, atransgression (submergence) must occur, followed by a regres-sion or progradation that ushers in the sabkha environment. Pro-gradation occurs when sediment supply exceeds subsidence. Asthe sabkha progrades towards the lagoon, evaporites overlie thealgae-rich sediments. The landward edge of the sabkha receivesterrestrial flow of ground water containing the dilute metal-liferous solution. This solution is drawn upward by evaporativepumping (Hsu and Siegenthaler, 1969; Hsu and Schneider, 1973)into the zone of decaying algae.
The decaying algal mat, rich in hydrogen sulfide, causes themetals to be precipitated as sulfide minerals both upward andbasinward in a sequence reflecting their solubilities. The sulfidesmay be deposited in the terrestrial elastics or in the overlying car-bonates or evaporites, depending on the presence of hydrogensulfide. The mineralized bed probably will be stromatolitic. Themetals are transported from the source rock in solution throughthe terrigenous elastics to the sabkha trap by basinward migra-tion of ground water.
Uranium emplacement in sabkha modelAlthough Renfro (1974) did not mention uranium mineraliza-
tion in his model, others have suggested the possibility (Rose,1974; Rawson, 1975; Schrader and Furbish, 1976). The uraniumcould be transported in the high-Eh-low-pH ground water mov-ing from a source rock that was being weathered and was pro-viding uranium in the +6 oxidation state. The uranium-bearingground water is drawn up by evaporative pumping through thedecaying algal-mat zone where it is reduced to the + 4 oxidationstate and precipitates as uraninite or other similar reduced form.Because carbonates generally are cemented relatively early (de-stroying porosity and permeability), the emplacement must occurbefore lithification. This process requires early emplacement;therefore, timing becomes critical in the model. The uranium-bearing ground waters must be moving during active sabkha pro-gradation.
PROGRADINGSABKHA
evoporativepumping
J L
FIGURE 1—SABKHA MODEL OF MINERALIZATION (after Renfro, 1974).

305
Stratigraphy of Todilto LimestoneThe Todilto Limestone was named by Gregory (1917) for ex-
posures in Todilto Park, New Mexico. Harshbarger and others(1957) recognized its extent throughout the San Juan Basin. TheTodilto Limestone is considered Upper Jurassic because of itscorrelation with the Curtis Formation (Baker and others, 1947).The Todilto was deposited over 30,000 sq mi in the San JuanBasin (fig. 2). The formation overlies the Entrada Sandstone (fig.3), which is a red, crossbedded sandstone with thick sets. Thesandstone is bleached white near its contact with the Todilto (fig.4). Alder (1974) attributed the bleaching to H2S formed in theTodilto. The Entrada in this area has been interpreted by mostworkers as representing an eolian dune deposit. The Todilto isoverlain by the Summerville Formation (fig. 3), which is a greensilty shale at the contact near Grants and interpreted by Moenchand Schlee (1967) to have formed in a shallow body of freshwater.
The environment of deposition of the Todilto has long been asubject of dispute. The point of disagreement centers aroundwhether the Todilto was formed in a marine basin or in an inlandlake (Baker and others, 1947; Harshbarger and others, 1957;Ash, 1958; Anderson and Kirkland, 1960; Stapor, 1967, 1972). Itis not a key issue in this study because a sabkha-like environmentcan be formed on the edge of a large inland lake as well as in amarine basin. From the literature, the Todilto appears to havebeen formed in a lake that became restricted at times and evapo-rated to dryness. Anderson and Kirkland (1960) explained thepresence of the gypsum as having formed from Ca+ 2 and SO4-
2
ions being carried by streams that flowed into the San JuanBasin. One fact that has been overlooked in most discussions ofthe origin of the Todilto (except Stapor, 1967) is the absence ofdolomite. Gableman (1970) reported some dolomite, but mostother workers did not. If the Todilto had a marine origin, dolo-mite probably would be associated with the gypsum as it is inHolocene sediments and in most ancient rocks.
The Todilto has a lower limestone member 3-30 ft (1-10 m)thick in the Grants area, overlain by an upper gypsum-anhydritemember ranging in thickness from 10 to 120 ft (3 to 40 m) in theCuba area (Santos, 1975). The gypsum-anhydrite member coversa smaller area in the center of the San Juan Basin (fig. 2). Thelimestone member has been divided informally into three zonesby geologists working in the area: the lower platy zone, a middlecrinkly zone, and, where present, an upper massive or recrystal-lized zone (Hilpert, 1963).
Summerville
Formation
Todilto
Limestone
Entrada
Sandstone
FIGURE 3—STRATIGRAPWC COLUMN SHOWING MIMMRS AND /ONI:SWITHIN THE TODILTO LIMESTONE.
Limestone memberPLATY ZONE—The lowest or platy zone in the limestone
member is composed of a light- to medium-gray thinly laminatedlimestone with silty partings that ranges from 10 to 15 ft (3 to 5m) thick near Grants, New Mexico. McLaughlin (1963) reportedthin beds of gypsum present in this zone. The contact with theunderlying Entrada Sandstone is sharp locally and is gradationalelsewhere. When broken, the platy limestone in the Grants areaemits a fetid odor. The bedding appears undisturbed by slumpingor burrowing in contrast to the overlying crinkly zone. This platyunit is a very fine grained carbonate mudstone (fig. 5) with asmall percentage of floating silt-size quartz grains. Because of itsundisturbed bedding, absence of fossils, fine-grained nature, andfetid odor, this zone is interpreted to have been formed in a poor-ly circulated basin below wave base without life forms other thananerobic bacteria.
2OO Km
COLORADO
NEWMEXICO
FIGURE 2—AREAL EXTENT OF TODILTO LIMESTONE; A—Albuquerque, FIGURE 4—BLEACHED ENTRADA SANDSTONE NEAR GRANTS (Adler,Ga—Gallup, Gr—Grants, SF—Santa Fe. 1974).
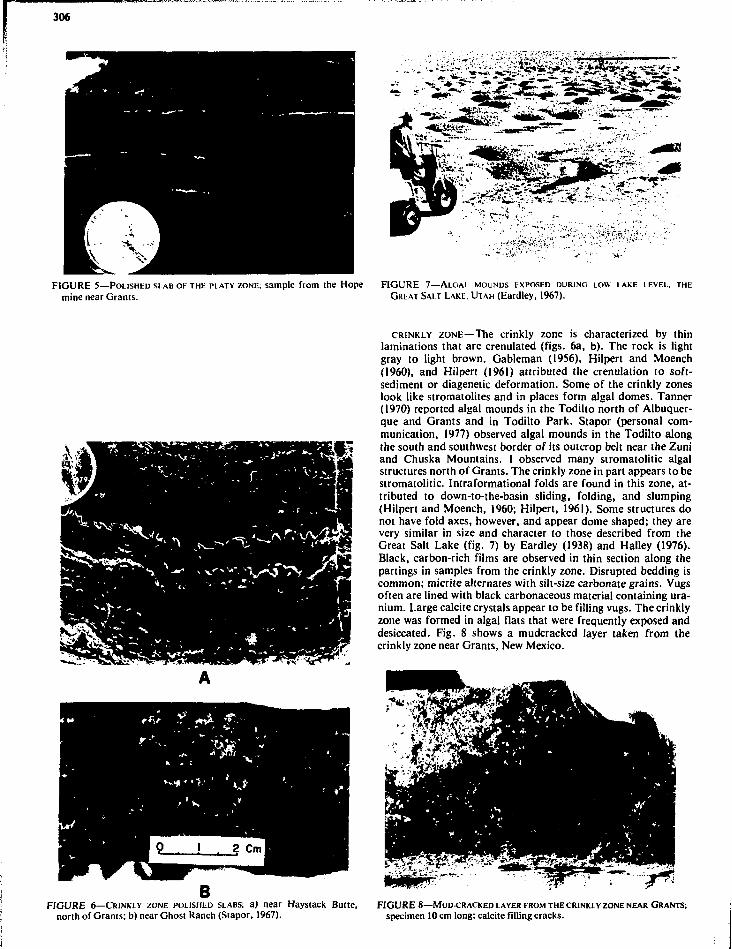
306
FIGURE 5—POLISHED SLAB OH THE PLATY ZONE; sample from the Hopemine near Grants.
FIGURE 7—ALGAL MOUNDS EXPOSED DURING LOW LAKE LEVEL, THEGREAT SALT LAKE. UTAH (Eardley, 1967).
CRINKLY ZONE—The crinkly zone is characterized by thinlaminations that are crenulated (figs. 6a, b). The rock is lightgray to light brown. Gableman (1956), Hilpert and Moench(1960), and Hilpert (1961) attributed the crenulation !o soft-sediment or diagenetic deformation. Some of the crinkly zoneslook like stromatolites and in places form algal domes. Tanner(1970) reported algal mounds in the Todilto north of Albuquer-que and Grants and in Todilto Park. Stapor (personal com-munication, 1977) observed algal mounds in the Todilto alongthe south and southwest border of its outcrop belt near the Zuniand Chuska Mountains. I observed many stromatolitic algalstructures north of Grants. The crinkly zone in part appears to bestromatolitic. Intraformational folds are found in this zone, at-tributed to down-to-the-basin sliding, folding, and slumping(Hilpert and Moench, 1960; Hilpert, 1961). Some structures donot have fold axes, however, and appear dome shaped; they arevery similar in size and character to those described from theGreat Salt Lake (fig. 7) by Eardley (1938) and Halley (1976).Black, carbon-rich films are observed in thin section along thepartings in samples from the crinkly zone. Disrupted bedding iscommon; micrite alternates with silt-size carbonate grains. Vugsoften are lined with black carbonaceous material containing ura-nium. Large calcite crystals appear to be filling vugs. The crinklyzone was formed in algal flats that were frequently exposed anddesiccated. Fig. 8 shows a mudcracked layer taken from thecrinkly zone near Grants, New Mexico.
FIGURE 6—CRINKLY ZONE POLISHED SLABS; a) near Haystack Butte,north of Grants; b) near Ghost Ranch (Stapor, 1967).
FIGURE 8—MUD-CRACKED LAYER FROM THE CRINKLY ZONE NEAR GRANTS;specimen 10 cm long; calcite filling cracks.

307
A BFIGURE 9—MASSIVE ZONE POLISHED SLABS; a) uraninite-bearing massive zone near Grants; b) near Ghost Ranch (Stapor, 1967).
MASSIVE OR RECRYSTALLIZED ZONE—The massive zone is dif-ferent from the preceding zones in that it exhibits no well-definedbedding or laminations (figs. 9a, b). In some places, it is brec-ciated with the interbreccia vugs filled by large calcite crystals. Itexhibits dome-shaped structures on its upper surface in someareas. Perry (1963) proposed that this zone represents in part areef deposit; however, the evidence he presented is not convinc-ing. The brecciated zones appear to have been formed by collapsecaused by removal of interbedded gypsum by ground-water solu-tion as demonstrated by Stapor (1967, 1972) in the Ghost Rancharea of north-central New Mexico (fig. 10). The thickness of themassive zone varies markedly from place to place. Lenses ofsiltstone occur near the top of the unit, indicating a gradationalcontact with the overlying Summerville Formation. Carbon-aceous material apparently coats grains, pore spaces, and vugs.Deposition of this unit occurred in the supratidal zone wherealgal muds and gypsum were interbedded (fig. 11). As the lakelevel rose and fell, solution of the gypsum units occurred, form-ing the breccia characteristic of this zone (fig. 12). Algal domesfound on its upper surface were formed near the strand line. Tar-ner (1970, 1974) presented evidence that a northeasterly windsystem prevailed during the deposition of the Todilto. Duringstorm periods, organic material, aquatic plants, and floatingalgae could have been piled up on the southwestern shores andmud flats, contributing to the total organic content of thesediments.
Gypsum-anhydrite memberThe gypsum-anhydrite member covers a smaller area than does
the limestone member (fig. 2). From field evidence, the unitseems to have once covered a larger area, but due to solution anderosion, the outcrop and subcrop have retreated toward thecenter of the basin. The member is not present north of Grants,where the principal uranium deposits of the Todilto occur; how-ever, it has been found in drill holes about 8 mi north of the out-crops in the Grants district (Hilpert, 1963). Anhydrite is reportedin the subsurface by Moench and Schlee (1967). Both laminatedand nodular (chicken-wire) gypsum are found in this member.Nodular gypsum has been found forming in modern sabkhas ofthe Persian Gulf by Kinsman (1966, 1969) and by Butler (1969).Dean and others (1975) point out that nodular gypsum alone can-not be used to interpret shallow water or supratidal origin of gyp-sum. Their argument is that nodular gypsum can also be found inthe Castille Formation (Permian) of west Texas associated withlaminated gypsum, which they have accepted as representing an-nual deposits in a deep-water basin. Shaw (1977) raised someserious objections to the annual nature of the Castille lamina-
FIGURE 10—FORMATION OF THE MASSIVE ZONE BY SOLUTION-CAUSED COLLAPSE, NEAR GHOST RANCH (Stapor, 1967).

308
FIGURE 11 —LAMINATED LIMESTONE AND INTERBEDDED NODULAR GYPSUMNEAR GHOST RANCH (Stapor, 1967).
tions and their deep-water origin, suggesting that laminated andnodular gypsum could be associated together in shallow-waterenvironments. Leeder and Zeidan (1977) have found associatedlaminated and nodular gypsum in (he Jurassic evaporite depositsof the Arabian Shield, which they reported as having formed in asalt pan and a sabkha environment, respectively.
Tanner (1970, 1974) proposed that the Todilto Lake was nevermuch deeper than a few feet near shore and 120 ft (40 m) in thecenter of the basin, and that during the deposition of the gypsum,the lake was reduced to about half or a third of its former size.The gypsum preserved in the Todilto represents a drying out ofthe former fresh-water lake that may have occurred severaltimes. Gypsum formed on the supratidal areas during high waterlevels could have been removed by solution and/or erosion dur-ing low-lake levels and carried to the center of the basin to bereprecipitated and/or deposited. Detrital gypsum has been
A. DEPOSITION -Gypsum & Carbonates
B. SOLUTION - Gypsu
C. COLLAPSE- Slumping & Brecciation
reported in the Permian Zechstein of Germany (Schlager andBolz, 1977) and in the upper Miocene of Italy (Vai and Ricci-Lucchi, 1977).
Uranium in the TodiltoAll of the economic uranium deposits in the Todilto are con-
fined to the southern portion of the basin near Grants, New Mex-ico. Uranium has been reported in all three limestone zones, butmost of the economic deposits are found in the crinkly andmassive zones. The primary (reduced) ore appears to be uraninitethat is restricted to layers parallel to bedding and/or smallirregular-shaped blobs rich in carbonaceous residue (fig. 13).Fig. 14 shows mineralization in carbonaceous layers in the crink-ly zone of the Hope mine. Secondary (oxidized) ore occurs alongjoints and fractures in the Todilto, and this occurrence led to thediscovery of the Grants uranium district in 1950. The secondaryore is not directly controlled by depositional environments andwill not be discussed further.
The organic-rich layers in the crinkly zone may result from anaccumulation of algal layers. Accumulations of organic materialcould also have been contributed by prevailing northeasterlystorm winds (Tanner, 1974) stacking up phytoplankton, algae,and aquatic plants on the downwind (southwestern) sabkha ofLake Todilto.
The primary ores in the massive or recrystallized zones appearto be the pore-filling type, localized in vugs and openings andassociated with black carbonaceous material. Permeability seem-ingly was enhanced in these zones by brecciation and soft-sediment deformation. Some of the large pore spaces are filledwith post-ore calcite cement. Part of the breccia and soft-sediment deformation may be due to collapse, caused by theremoval of interbedded gypsum. Stapor (1967) has documentedthe formation of collapse breccia by removal of interbedded gyp-sum in the Ghost Ranch area of New Mexico (fig. 10). Collapsedlithified units would form a breccia, whereas soft sediment not
X V\FIGURE 12—SUGGESTED MODEL FOR THE FORMATION OF THE MASSIVE FIGURE 13—URANINITE-BEARING SAMPLE WITH ITS RADIOGRAPH; from
ZONE. the Flat Top mine, near Grants (Gableman, 1970).

309
FIGURE 14—URANINITE-BEARING SAMPLE FROM THE CRINKLY ZONE; fromthe Hope mine, near Grants.
yet lithified could slide, roll over, and deform plastically. Bothmodes of failure can be observed in the massive zone, suggestingthat this zone fomed soon after deposition; lithification hadbegun, but was not yet complete. Breccia zones would have in-creased permeability and overlying soft-sediment deformationcould still have formed a trap, preventing escape of gases (H2S)formed by decaying organic matter.
Paragenetic studies of the Todilto by Laverty and Gross (1955)indicated that pyrite was precipitated after the deposition of thelime sediment, which was followed by coprecipitation of pyriteand uraninite. Hematite followed next, both as pseudomorphsafter pyrite and disseminated in the limestone in and near theorebodies. Truesdale and Weeks (I960) pointed out that precip-itation of ore minerals generally began along grain boundariesand then gradually replaced the grains themselves.
Limestones typically lose their porosity and permeability in anearly stage of lithification. Observations suggest that the primaryore was emplaced prior to lithification, owing to the dissem-inated nature of the uraninite within the limestone. If the ore waspostlithification, the localization would have been along faults,fractures, and joints as it is for the secondary ore. The primaryTodilto ore is syngenetic as observed in the field and as dictatedby an understanding of limestone lithification. Berglof andWampler (1965) and Berglof (1973) have added supporting evi-dence for the syngenetic origin from isotope dates of theuraninite in the Todilto. They have dated the uraninite as havingformed 150-155 m.y. ago and have concluded that the uraninitewas emplaced shortly after deposition, during diagenesis. Thepetrologic evidence and the isotope date support early mineral-ization, which is critical if the sabkha mod"' is valid.
Genesis of Todilto uranium depositsBefore a model can be constructed for the Todilto, certain ob-
servations and constraints need to be summarized.1) The Entrada Sandstone was deposited as an eolian dune
field in the subsiding San Juan Basin preceding and duringthe formation of Lake Todilto.
2) The Todilto Limestone was deposited in a large lake that athigh levels must have been fresh and at low levels washypersaline.
3) The lake had no outlet, so it was subject to fluctuation ofwater level caused by runoff and evaporation.
4) The lake existed in a hot, dry, evaporative environment.5) The Entrada Sandstone was an excellent aquifer, and a
hydrodynamic gradient was established toward the lake.6) Economic deposits of primary ore are associated mostly
with the crinkly and massive zones that in part have an al-gal origin.
7) The uranium deposits were concentrated in the southwestportion of the lake (Grants area) in shallow water sedi-ments which were exposed at times, forming a sabkha-likeenvironment.
8) The primary uranium in the Todilto is syngenetic.9) No economic deposits have been reported from the Todilto
where it is covered by gypsum or anhydrite.The proposed model for the origin of the uranium ores in the
Todilto is developed in eight stages as shown in fig. 15.STAGE 1—Before Middle Jurassic time, the Mogollon highland
to the south and southwest was the site of silicic volcanism(Saucier, 1976). Paleoslopes already had been established towardthe San Juan Basin during the Triassic as shown by studies of theChinle Formation (Stewart and others, 1972).
STAGE 2—During the Late Jurassic, the Entrada dune field wasestablished across the subsiding San Juan Basin, and the prevail-ing wind was from the northeast to the southwest (Tanner, 1965).The dunes migrated an unknown distance toward the Mogollonhighlands.
STAGE 3—Lake Todilto was established and began to fill as aresult of increased precipitation in areas surrounding the inter-nally drained basin. The lake was surrounded by eolian dunes,and it covered earlier formed dunes. The lake had no outlet, w >shallow, and poorly circulated. Except for phytoplankton, algae,a few fish, and ostracodes, little existed in ihe harsh environ-ment. The bottom was anoxic, and in this environment the darkgray to black, platy-zone limestones were formed. Fine, unbur-rowed, undisturbed laminations, along with the characteristicfetid odor of this zone, suggest it formed in a low-energy, almostlifeless, anoxic environment.
STAGE 4—The lake continued to rise and spread as a result ofincreased runoff. Downwind areas enjoyed better circulation dueto wave activity. In the nearshore environment, algal moundsformed in shallow water near the edge of the lake. The south-western shoreline, because of its location on the downwind sideof the fetch, developed a wide, low-lying area above lake level,carved out by storm waves.
STAGE 5—Gypsum and interbedded algal limestone weredeposited in the low-lying area slightly above the lake levelformed in Stage 4 and herein called a sabkha-like environment.In the area between the dunes and the lake shore, evaporativepumping (Hsu and Siegenthaler, 1969; Hsu and Schneider, 1973)of ground water from the Entrada occurred. At times of flood-ing, water would reflux downward, carrying with it H,Sgenerated by decaying algae. The downward percolation of HjScaused the bleaching (Adler, 1974) of the red Entrada to a whitecolor a few feet or so below the contact (fig. 3). Ground watermoved downdip through the Entrada towards Lake Todilto. Theground water moving from the south and southwest carried traceamounts of uranium leached from the silicic volcanics of theMogollon highland (Saucier, 1976). The interbedded gypsumformed in the sabkha was dissolved by fresh ground water orhigh lake levels, causing the collapse of the interbedded lime-stones and forming the massive zone of the upper part of thelimestone member.
STAGE 6—By sediment progradation, lowering of the lakelevel, or both, the massive zone regressed over the crinkly zone.The evaporative-pumped waters now had access to the algae-richcrinkly and massive zones.
STAGE 7—The uranium-bearing ground water was pulled upthrough the algae-rich areas of the limestones, and the uraniumwas reduced and precipitated while the sediment was still soft.
STAGE 8—The lake level continued to lower—possibly becauseof a climate change—and became hypersaline. Gypsum removedby solution or erosion was transported from the exposed massivezone and contributed to this concentration in the desiccatingLake Todilto. Areas covered by the basin-center gypsum couldnot be affected by evaporative pumping; therefore, no uranium

310
STAGE 1LATE TRIASSIC
UT_AH ''COLORApiARIZON~A~" I "NEW
J MEXICO
STAGE 5
STAGE 2LATE JURASSIC
STAGE 6
ENTRADA
DUNESSolution & Collapse
t t f M t fB
STAGE 3LATE JURASSIC
STAGE 7
mineralizationJ
STAGE 4 STAGE 8
desiccation B
111 1 1 It
FIGURE 15—MODEL FOR THE FORMATION OF URANIUM IN THE TODILTO LIMESTONE (explanation in text).

311
was precipitated below the basin-center evaporites. Areas whereevaporative pumping occurred had the best chance of concen-trating the uranium. The greater the volume of water movingthrough the crinkly and massive zones, the greater the uraniumconcentration. The highest pump rates occurred in the sabkha.No pumping occurred below the lake level, and any pumping oc-curring through an organic barren zone (Entrada dunes) wouldnot precipitate uranium.
Future prospectsSan Juan Basin
Future prospects in the Todilto would include extension of thepresent trend along the nearshore facies. A well-developed crink-ly zone overlain by the massive zone would provide the best pros-pects, particularly in areas where the massive zone is not overlainby gypsum. Areas between the basin-center evaporite edge andthe limestone erosional edge would be good prospects, subject toeconomic depth limitations as affected by ore grade. Possibly,another nearshore facies may exist basin ward; it would haveformed during a lower stand of Lake Todilto prior to its eventualdesiccation.
Other areasThe model outlined here for the Todilto should have applica-
tion in other areas under similar conditions. The requirementswould be 1) a source rock capable of contributing uranium toground water; 2) an aquifer capable of transporting great vol-umes of uranium-bearing water to a lake or a coastal area; 3)abundant algae and sediment production so that progradaiionmay occur; and 4) an area where evaporation exceeds precipita-tion so that evaporative pumping may be effective. With these re-quirements, timing is critical. Lime sediments do not maintainporosity and permeability for long periods of time. Once thepermeability is sealed by lithification, the rock can no longerprecipitate materials from solution—no matter how much or-ganic material is present. Two other areas that might meet theabove requirements are the Cenozoic Basin and Range lake sys-tems and the Tertiary Green River Lake. Schrader and Furbish(1976, p. 143) have reported "uranium adjacent to stromatoliticstructures in Pleistocene lake deposits of the Great Basin."
ReferencesAdler, H. A., 1974, Concepts of uranium-ore formation in reducing en-
vironments in sandstones and other sediments, in Formation ofuranium ore deposits: Vienna, Austria, International Atomic EnergyAgency, symposium, Proc, p. 141-168
Anderson, R. Y., and Kirkland, D. W., 1960, Origin, varves and cycles ofJurassic Todilto Formation, New Mexico: American Association ofPetroleum Geologists, v. 44, p. 37-52
Ash, H. O., 1958, The Jurassic Todilto Formation, New Mexico: M.S.thesis, University of New Mexico, 63 p.
Baker, A. A., Dane, C. H., and Reeside, J. B., Jr., 1947, Revised correla-tion of Jurassic formations of parts of Utah, Arizona, New Mexico,and Colorado: American Association of Petroleum Geologists, Bull.,v. 31, p. 1664-1677
Berglof, W. R., 1973, Absolute age relationships in selected ColoradoPlateau uranium ores (abs.): Dissertation Abstracts International, v.34, no. 5, p. 2093B-2094B
Berglof, W. R., and Wampler, W. F., 1965, Isotopic study of uraninitefrom the Todilto Limestone, Grams, New Mexico: Transactions of theAmerican Geophysical Union, v. 46, p. 164
Butler, G. P., 1969, Modern evaporite deposition and geochemistry ofcoexisting brines, the sabkha, Trucial Coast, Arabian Gulf: Journal ofSedimentary Petrology, v. 39, p. 70-89
Dean, W. E., Davies, G. R., and Anderson, R. Y., 1975, Sedimentolog-ical significance of nodular and laminated anhydrite: Geology, v. 3, p.367-372
Eardley, A. J., 1938, Sediments of Great Salt Lake, Utah: American As-sociation of Petroleum Geologists, Bull., v. 22, p. 1305-1411
, 1966, Sediments of Great Salt Lake, in The Great Salt Lake,W. L., Stokes, ed.: Utah Geological Society, Guidebook to the Geol-ogy of Utah, no. 20, p. 105-120
Gabelman, J., 1956, Uranium deposits in limestone: U.S. GeologicalSurvey, Prof. Paper 300, p. 388-404
, 1970, The Flat Top uranium mine, Grants, New Mexico: U.S.Atomic Energy Commission, RME-4112, 81 p.
Gregory, H. E., 1917, Geology of the Navajo country: U.S. GeologicalSurvey, Prof. Paper 93.
Halley, R. B., 1976, Textural variation within Great Salt Lake algalmounds, in Stromatolites, M. R. Walter, ed.: Amsterdam, ElsevierPublishing Co., Developments in Sedimentology, no. 20
Harshbarger, J. W., Repenning, C. A., and Irwin, J. H., 1957, Stratig-raphy of the uppermost Triassic and Jurassic rocks of the Navajo coun-try: U.S. Geological Survey, Prof. Paper 291
Hilpert, L. S., 1961, Structural control ol epigenetic uranium deposits incarbonate rocks of northwestern New Mexico: U.S. Geological Survey,Prof. Paper 424 B, p. 5-8
, 1963, Regional and local stratigraphy, in Geology and technologyof the Grants uranium region: New Mexico Bureau of Mines and Min-eral Resources, Mem. 15, p. 6-18
Hilpert, L. S., and Moench, R. H., I960, Uranium deposits of thesouthern part of the San Juan Basin, New Mexico: Economic Geology,v. 55, p. 429-464
Hsu, K. J., and Schneider, J., 1973, Progress report on dolomiiizaiion-hydrology of Abu-Dhabi sabkha, Arabian Gulf, in The Persian Gulf.B. Purser, ed.: Berlin, Springer-Verlag, p. 409-422
Hsu, K. J., and Siegenthaler, C , 1969, Preliminary experiments onhydrodynamic movement induced by evaporation and their bearing onthe dolomite problem: Sedimentology, v. 12, p. 11-25
Kinsman, D. J., 1966, Gypsum and anhydrite of Receni age, PersianGulf, in Second symposium on salt: Cleveland, Northern Ohio Geolog-ical Society, p. 302-326
, 1969, Modes of formation, sedimentary as' i. iations, and diag-nostic features of shallow-water and supratidal t aporiies: AmericanAssociation of Petroleum Geology, Bull., v. 53, p. 830-840
Laverty, R. A., and Gross, E. B., 1955, Paragenetic studies of uraniumdeposits of the Colorado Plateau: U.S. Geological Survey, Prof. Paper300, p. 195 201
Leeder, M. R., and Zeidan, R., 1977, Giant Late Jurassic sabkhas of Ara-bian tethys: Nature, v. 268, p. 42-44
McLaughlin, E. D., 1963, Uranium deposits in the Todilto Limestone ofthe Grants district, in Geology and technology of the Grants uraniumregion, V. C. Kelley, compiler: New Mexico Bureau of Mines andMineral Resources, Mem. 15, p. 136-149
Moench, R. H., and Schlee, J. S., 1967, Geology and uranium deposits ofthe Laguna district, New Mexico: U.S. Geological Survey, Prof. Paper519, 117p.
Perry, B. L., 1963, Limestone reefs as an ore control in the JurassicTodilto Limestone of the Grants district, in Geology and technology ofthe Grants uranium region, V. C. Kelley, compiler: New MexicoBureau of Mines and Mineral Resources, Mem. 15, p. 150-156
Rawson, R. R., 1975, The sabkha environment; a new frontier for ura-nium exploration (abs.): Economic Geology, v. 70, p. 1327
Renfro, A., 1974, Genesis of evaporite-associated stratiform metalliferous deposits—a sabkha process: Economic Geology, v. 69, p. 33-45
Rose, A., 1974, Chloride complexing of copper and silver in the origin ofred bed copper sandstone-type uranium and related ore deposits (abs.):Geological Society of America, v. 6, no. 7, p. 931-932
Santos, E. S., 1975, Lithology and uranium potential of Jurassic Forma-tions in the San Ysidro-Cuba and Majors Ranch areas, northwesternNew Mexico: U.S. Geological Survey, Bull. 1329,22 p.
Saucier, A. E., 1976, Tectonic influence on uraniferous trends in the LateJurassic Morrison Formation, in Tectonics and mineral resources ofsouthwestern North America, L. A. Woodward and S. A. Northrop,eds.: New Mexico Geological Society, Spec. Pub. 6, p. 151-157
Schlager, W., and Bolz, H.,1977, Clastic accumulation of sulphateevaporites in deep water: Journal of Sedimentary Petrology, v. 47, p.600-609
Schrader, E., Jr., and Furbish, W. J., 1976, Geochemistry of metaldisposition in subaerial evaporite flats: Sigma Gamma Epsilon, Com-pass, v. 53, no. 4, p. 135-144
Shaw, A. B., 1977, A review of some aspects of evaporite deposition: TheMountain Geologist, v. 14, p. 116
Smith, G. E., 1974, Depositional systems, San Angelo Formation (Per-mian), North Texas—facies control of red bed copper mineralization:University of Texas (Austin), Bureau of Economic Geology, Rept. 80,74 p.

r 312
Stapor, F. W., 1967, Stratigraphy of the Todilto Formation in the Ghost , 1974, History of Mesozoic lakes of northern New Mexico: NewRanch area, New Mexico: M.S. thesis, University of Wisconsin, 75 p. Mexico Geological Society, Guidebook 25th field conference, p.
, 1972, Origin of the Todilto gypsum mounds in the Ghost Ranch 219-223area, north-central New Mexico: The Mountain Geologist, v. 9, p. TYuesdell, A. H., and Weeks, A. D., 1960, Paragenesis of uranium ores59-64 in Todilto Limestone near Grants, New Mexico: U.S. Geological
Stewart, J. H., Poole, F. G., and Wilson, R. F., 1972, Stratigraphy and Survey, Prof. Paper400B, p. 52-53origin of the Chinle Formation and related Upper Triassic strata in the Vai, G. B., and Ricci-Lucchi, F., 1977, Algal ciusts, autochthonous andColorado Plateau region: U.S. Geological Society, Prof. Paper 690 clastic gypsum in a cannibalistic evaporite basin—a case history from
Tanner, W. F., 1965, Upper Jurassic paleogeography of the FourCorners the Messinian of Northern Appenines: Sedimentology, v. 24, p.region: Journal of Sedimentary Petrology, v. 35, p. 564-574 211-244
, 1970, Triassic-Jurassic lakes in New Mexico: The MountainGeologist, v. 7, p. 281-289

313
EFFECTS OF URANIUM MINING ON GROUND WATERIN AMBROSIA LAKE AREA, NEW MEXICO
by T. E. Kelly, Regina L. Link, and Mark R. Schipper,Geohydrology Associates, Inc., 3225 Candelaria N.E., Albuquerque, New Mexico 87107
AbstractThe principal ore-bearing zone in the Ambrosia Lake area of
the Grants uranium district is the Westwater Canyon Member ofthe Morrison Formation (Jurassic). This unit is also one of themajor artesian aquifers in the region. Significant declines in thepotentiometric head within the aquifer have been recorded, al-though cones of depression do not appear to have spread lateral-ly more than a few miles. Loss of potentiometric head in theWestwater Canyon Member has resulted in the interformationalmigration of ground water along fault zones from overlyingaquifers of Cretaceous age. This migration has produced localdeterioration in chemical quality of the ground water.
IntroductionGround water associated with an ore deposit generally is highly
mineralized and has little economic value. This generalization isnot true in the Ambrosia Lake area, where the same formationcontains high-quality ground water and uranium ore. Common-ly, water wells can be found tapping a sandstone aquifer thatsubsequently is identified as an orebody. Water from these wellsmay be potable and meet all of the standards set by the PublicHealth Service. As mining progresses, however, changes in chem-ical quality of the water occur. These changes are not limited totrace elements but also include some of the major anions and cat-
R.IIW. R.IOW.
ions. This paper discusses the impact of uranium mining on theprincipal aquifer in the Ambrosia Lake area, the Westwater Can-yon Member of the Morrison Formation.
Uranium ore was first discovered in the Morrison Formationin 1951 and was found near Ambrosia Lake in 1955. Since thattime, exploration and mining activities have intensified and ex-panded. In 1979 about 30 mines were in operation, with theheaviest concentration centered near Ambrosia Lake. Severalmore mines have been announced in the vicinity of AmbrosiaLake.
With the exception of a few mines that were either dry or underwater-table conditions, the mines are excavated in an artesianaquifer with relatively high water-producing capabilities, necessi-tating dewatering before and during mining operations. As aresult, some wells have gone dry. Owing to the low populationdensity and to the depth of the aquifer below land surface, thenumber of affected wells has not been great.
Geology and aquifer characteristicsof study area
The Ambrosia Lake area is underlain by Jurassic and Creta-ceous sedimentary deposits dipping lo (he north and northeastabout 2 to 3 degrees (fig. 1). Regional dips have been modified bylocal structural movements. Normal faulting is typical of the
R.9W. R.8W.
FIGURE 1 —PRE-QUATERNARY GEOLOGY IN THE AMBROSIA LAKE AREA; Tr—Triassic rocks, undifferemiated, Jsr—San Rafael Group(Jurassic), Jm—Morrison Formation (Jurassic), Kd—Dakota Sandstone (Cretaceous), Km—Mancos Shale (Cretaceous); CretaceousMesaverde Group: Kg—Gallup Sandstone, Kcc—Crevasse Canyon Formation, Kpl—Point Lookout Sandstone, Kmf—Menefee For-mation; Qb—Quaternary basalt (figure after Dane and Bachman, 1965).

314
FIGURE 2—PHOTOGRAPH OF TYPICAL OUTCROPS OF SEVERAL SANDSTONES
IN rHU STUDY ARLA.
area. Several major fault zones cross the area from northeast tosouthwest; many faults have displacements of 100 ft (30 m) ormore. In more localized fault zones, such as those commonlyassociated with the orebodies, displacements are 50 ft (15 m) orless.
Outcrop patterns provide a good indication of the hydrologiccharacteristics of several formations (fig. 2). Prominent cliffs areformed by the Bluff, Poison Canyon, and Dakota sandstones.Although water wells have been completed in each of these for-mations, in most instances yields are small. The cliff-formingcharacter of the outcrops indicates that the rocks are welllithified; permeabilities are correspondingly low. Conversely,most wells produce moderate quantities of water from the friablesands of the Westwater Canyon Member. This major water-bearing deposit generally is slope forming in outcrop.
San Rafael GroupThe formation of the San Rafael Group that is of chief interest
in the Ambrosia Lake area is the Bluff Sandstone (fig. 3). TheBluff Sandstone is fine to medium grained and massive; it rangesfrom ]75 to 200 ft (S3 to 61 m) thick. It is a minor aquifer in theAmbrosia Lake area (Gordon, 1961).
Morrison FormationThe Morrison Formation (Jurassic) crops out in a narrow band
along the south edge of the project area. The formation is di-vided into three members near this outcrop. In ascending order,these are the Recapture Member, the Westwater Canyon Mem-ber, and the Brushy Basin Member.
The Recapture and Brushy Basin Members are composed pri-marily of siltstone and shale with sandstone stringers (Kelly,1977). The Recapture Member separates the underlying BluffSandstone from the overlying sandstone deposits of the West-water Canyon Member of the Morrison. The thickness of the Re-capture is roughly 100 ft (30 m); however, it varies because ofintertonguing with strata above and below (Cooper and John,1968).
The Westwater Canyon Member of the Morrison Formation isunique in northwestern New Mexico owing to the presence of twovaluable commodities: uranium ore and high-quality water. Thefine- to coarse-grained arkosic sandstones of the Westwater Can-yon are typical of fluvial deposits, with cut-and-fill structures,crossbedding, and abrupt changes in grain size. These depositsinclude small lenses of pebbles and granules, as well as seams ofshale and siltstone. In outcrop, the Westwater Canyon is charac-terized by yellowish-gray to light-brown quartzose sandstone(Kelly, 1977) and locally may be cliff forming.
The Westwater Canyon is an artesian aquifer which yieldsmoderate to large amounts of good-quality water to wells. Thecoefficients of transmissivity are in the range of 100-300 sq ft perday. In outcrop areas, total dissolved solids are 500 ppm or less,but in the Ambrosia Lake area, the dissolved-solids concentra-tions are higher (Kelly, 1977). Several municipal wells at Crown-point tap the Westwater Canyon, as do stock and domestic wellsthroughout the San Juan Basin.
Mancos Shale
Dakota Sandstone
Brushy Bosin Member
Poison Canyon sondstone
Westwater Canyon Member
100-i
50-P0 J
Recapture Member
Bluff Sandstone
Black sandy shale; a poor aquifer in most places.
Yellowish-buff to gray, massive quartz sandstone interbedded with organic sandyshales in places; small yields of water high in dissolved soli.41).
Greenish-gray, incompetent, gypsiferous, and bentonitic mudstone with yellowish-brown to white sandstone lenses and some thin limestone beds; locally has carbon-aceous material interbedded; not an aquifer near Ambrosia Lake.
Gray to white and light-yellow-brown, fine to coarse, poorly sorted sandstone;crossbedded and locally conglomeratic—contains uranium and vanadium ores in theAmbrosia and Smith Lake area; moderate to high yields of good quality water underartesian pressure in most areas.
Red-brown to light-green or white siltstone, shale, and fine sandstone; in places iscoarse to conglomeratic and has thin, mottled red and green limestone; not anaquifer.
Light-green to red-brown and white interstratified sandstone, siltstone, and shale;low yields of water with 500-2,200 ppm dissolved solids.
FIGURE 3—GEOLOGIC COLUMN FOR THE AMBROSIA LAKE AREA (Cooper and John, 1968; Haskins, 1963).

315
The informal name Poison Canyon sandstone has been appliedto a sandstone unit at the base of the Brushy Basin and is men-tioned here because of its economic importance. As an aquifer,the Poison Canyon must be considered part of the WestwaterCanyon because the two form a single hydrologic unit.
The Brushy Basin Member is the uppermost unit of the Morri-son Formation. Its thickness ranges from 60 to 150 ft (18 to 46m); although primarily shale, it does contain thin beds of silt-stone and sandstone. Locally it contains uranium deposits(Cooper and John, 1968).
Dakota SandstoneThe Dakota Sandstone unconformably overlies the Morrison
Formation. The deposit is generally a crossbedded, cliff-formingyellowish-gray to buff, quartzose sandstone (Gordon, 1961;Cooper and John, 1968). The Dakota contains some uranium oreand is a minor aquifer in the northern portion of the study area(Cooper and John, 1968). The maximum thickness is about 150ft (46 m) in the study area. The outcrops form prominent land-marks throughout the southern San Juan Basin.
Mancos ShaleThe Mancos Shale (Upper Cretaceous) is composed primarily
of dark gray, fissile, marine shale. This unit forms the valleyfloor at Ambrosia Lake, where it is about 900 ft (275 m) thick(Cooper and John, 1968). Some sandstone lenses in the Mancosare tapped by stock and domestic wells, but it is a poor aquifer atbest.
Mesaverde GroupIn the northeastern portion of the study area, the Mesaverde
Group (Upper Cretaceous) consists of the Gallup Sandstone,
Crevasse Canyon Formation, Point Lookout Sandstone, andMenefee Formation (Cooper and John, 1968). The Gallup Sand-stone has a maximum thickness of about 200 ft (62 m) and gener-ally consists of lower and upper units separated by a tongue ofshale. The Crevasse Canyon Formation consists of two coalmembers separated by the Dalton Sandstone Member. Outcropsof the Point Lookout Sandstone frequently form the caprock ofescarpments and mesas. The Menefee Formation is a claystoneand shale unit with some sandstone, ironstone, and limestone.All four formations yield adequate water to stock and domesticwells in some parts of the study area; however, water from theGallup is not of high quality and is suitable primarily forlivestock.
AlluviumThe bedrock is locally blanketed by alluvium. These deposits
rarely exceed 30 ft (9 m). The most extensive deposits are locatedin the valleys formed in the Chinle Formation southwest of theMorrison outcrop and in the Mancos Shale in the Ambrosia Lakedistrict.
Effects of mining onWestwater Canyon Member
Water levelsThe configuration of the potentiometric surface of the West-
water Canyon aquifer prior to any major development of the oredeposits is shown in fig. 4. These contours are based primarily onstatic water levels in mine workings. Few stock and domesticwells existed in the Westwater Canyon in the Ambrosia Lake areabefore uranium development. In general, the contours folio theshape of the outcrop belt, where recharge of the aquifer ot.urs.
R.IIW. R. 10 W. R.9W. R.8W.
F I G U R E 4—PREDEVELOPMENT POTENTIOMETRIC CONTOURS FOR THE WESTWATER CANYON MEMBER IN THE AMBROSIA LAKE AREA; COMOUr
interval, 100 ft; stippled area represents the outcrop of the Morrison Formation.

316
R.IIW.
^ "
\
R.IOW.
AMBROSIALAKE B ^ \
DYSART ^-.13
22 B2 3
B B 2 5
R.9W.
B17
B1 9
BB 3 0 ANN Li
B 3 2 B 3 3
• E
35B
jr
36B
R.BW.
JOHNNIE MB
T.14N.
T.13N.
FIGURE 5—LOCATIONS OF MINES PRODUCING WATER FROM THE WESTWATER CANYON MEMBER OF THE MORRISON FORMATION.
The northeast dip of the potentiometric surface is toward the SanJuan Basin.
Approximately 15 active mines are currently producing waterfrom ore deposits in the Westwater Canyon aquifer (fig. 5).Mines no longer in production are not shown. Production frommines has resulted in drawdowns as great as 700 ft (200 m) belowstatic level. The 6,600-ft contour has migrated about a miletoward the outcrop and recharge area but is otherwise un-changed. Similarly, the 6,200-fi contour has not changed a greatdeal. However, the mines have created several cones of depres-sion in the water table (fig. 6).
The increased depth of the cones of depression from west toeast is due to the increasing depth of the ore zones in proportionto the static water level. As a result, greater drawdown is requiredto dewater an orebody in the eastern part of the area than in thewest.
For many years mines in the eastern part of t he Ambrosia Lakearea have been known to produce significantly more water thanthose in the west. This production is because the mines, which actas wells, have greater specific capacity in the eastern part of thearea than in the west. Specific capacity is the amount of waterproduction expressed in gallons per minute per foot of draw-down.
Water levels in a number of wells in sees. 21, 22, and 28, T. 13N., R. 9 W., have risen 40-100 ft since mining began (table 1).These wells are near San Mateo Creek. This previously ephem-eral stream is now nearly perennial as a result of the discharge ofmine effluent into it. Seemingly, the wells are being recharged bywater from the stream bed entering the alluvium and then theunderlying Westwater Canyon aquifer. Possibly, cessation ofmining in the Marquez mine in the late 1960's has permitted somerecovery of the Westwater Canyon aquifer, thereby contributingto the rise in water level in these wells.
Mine dischargeThe development of the cones of depression has been ac-
companied by decreasing production of water from individualmines (table 2). Hydrostatic head in the Westwater Canyonaquifer must be lowered significantly during the early stages ofmine development. As mining continues, the cone of depressionis enlarged, but this requires less pumpage than the initial lower-ing of the head. This enlargement results from the change fromartesian to water-table conditions in the orebody.
In 1962, the total average discharge from the United Nuclear-Homestake Partners Sees. 23 and 25 mines was 2.3 mgd (million
TABLE 1—SELECTED WELL MEASUREMENTS INT. 13 N.,R. 9 W., AMBROSIA LAKE AREA. NEW MEXICO.
location
NE'/iNWWSE'/isec. 21SE'/iNW'/iSE'/isec. 21NE'-iNW'/iNW!<isec.22NWWNEWNWW sec. 22NW '/4NW '/SNW >A sec. 28
depth to water
142
205199
date
10-30-57
12-15-5810-16-62
depth to water
62
102158
date
06-30-77
06-30-7707-01-77
depth to water
62.02
61.70
date
05-04-79
05-04-79

317
R.IOW. R.9W. R.8W.
55E5
FIGURE 6—POTENTIOMETRIC CONTOURS FOR THfc WESTWATER CANYON MEMBER IN THE AMBROSIA LAKEAREA. 1979; coniour interval, 100ft; stippled area represents the outcrop of the Morrison Formation.
TABLE 2—WATER DISCHARGE FOR SEVERAL MINES IN THE AMBROSIA LAKE AREA ('Geohydrology Associates, Inc., file data, 1954-1962; JU.S. En-vironmental Improvement Agency, 1975a, p. 22, table 2, U.S. Environmental Improvement Agency, 1975b, p. 4; !J. L. Kunklcr, personalcommunication, 1978).
station
'Homestake PartnersSec. 23 mine
'Homesiake PartnersSec. 25 mine
'Inked Nuclear-Homestake Partners,Sec. 15,23,25, 32 mines
'KermacSec. 17,22,24,30,33mines during shaft sinking
'Kerr-McGeemill effluent(Sec. 17, 22, 24, 30, 33 mines)
'Kerr-McGeeSec. 35 mine
'Kerr-McGeeSec. 36 mine
'Kerr-McGeeSec. 35 and 36 mines
'Johnny M mine
2Kerr-McGeeSec. 19 mine
'Kerr-McGeeSec. 30W mine
older measurements
average flow(million gallons
per day)
0.64
1.66
1.6
3.77
2.21
.46
.15
1.36
date
10/54-03/62
10/58-09/62
1962
02/26/75-03/06/75
02/26/75-03/06/75
1975(under development)
02/26/75-03/06/75(under development)
02/26/75-03/06/75
newer measurementsaverage flow
(million gallonsper day)
0.60
1.0
3.31.9
date
02/26/75-03/06/75
1975
06/07/78 and 08/03/7804/11/78

318
gallons per day). The average discharge from these two minesplus the United Nuclear-Homestake Partners Sees. 15 and 32mines was only 0.6 mgd in 1975. Obviously, the discharge fromthe Sees. 23 and 25 mines has been substantially reduced in spiteof an increased mine area. In 1962, during shaft sinking of theKerr-McGee Sees. 17, 22, 24, 30, and 33 mines, total productionwas about 1.6 mgd. In 1975, the mill effluent, for which waterwas produced from these mines after development had takenplace, was 1.0 mgd. A similar situation exists for the Kerr-McGeeSees. 35 and 36 mines. Total average discharge was 5.98 mgd in1975 but only 3.3 mgd in 1978.
Water qualityWith the decreased potentiometric head in the Westwater Can-
yon, leakage from the Dakota Sandstone into the WestwaterCanyon probably is induced. Available water-quality data in-dicate that such leakage has occurred.
Stiff diagrams for water samples from the Westwater Canyonand Dakota show that Westwater Canyon water is essentially asodium-bicarbonate-sulfate water, whereas the Dakota water istypically a sodium-sulfate water (fig. 7). Water from the Dakotaalso is higher in calcium and magnesium than the WestwaterCanyon water. Concentrations of sodium (plus potassium),chloride, and bicarbonate are approximately equal in the twowaters. Sulfate concentration in the Dakota water is approx-imately twice that in the Westwater Canyon.
Samples were collected in 1979 and compared with earlieranalyses from four Ambrosia Lake mines. The 1979 samples areof mine effluent, assumed to be largely or completely from theWestwater Canyon. In each case deterioration of the water qual-ity has occurred (fig. 8). Sodium (plus potassium) and chloridelevels have remained relatively unchanged in all four mines. Bi-carbonate levels have remained constant in three mines and havedecreased in the Johnny M mine. Calcium and/or magnesiumlevels have increased slightly in all four mines, and sulfate levelshave approximately doubled in each case. These changes aremost logically explained as leakage from the Dakota Sandstoneinto the Westwater Canyon aquifer. In each case, the earlier minesamples are similar to the typical Westwater Canyon sample,whereas the later sample is more like the Dakota samples (fig. 9).
WESTWATEC CANYON DAKOTA
CaKgft
\\
\\
-
ClHCO,so,CO,
FIGURE 7—STIII DIAGRAMS SHOEING WATER QUALITY FOR THE WESTWAITR CANYON MEMBER AND Thi DAKOTA SANDSTONE DURING THE DE-VI 1 OPMI'.NI 01 THKI:L MINES: scale is in equivalents per million.
The Westwater Canyon and Dakota aquifers are separated byas much as 150 ft (46 m) of nearly impermeable shale. However,minor faulting has been reported in virtually all of the mines.Although the throw along the fault planes is not great enough inmost cases to abut one aquifer against the other, the faults prob-ably do create zones of higher permeability along which leakageoccurs. Therefore, after a few years of mining, water productionincludes a significant amount of leakage from the Dakota as aresult of the dewatering of a part of the Westwater Canyonaquifer and ihe creation of a greater potential for downwardmigration of Dakota water.
ConclusionsThe original hydrologic conditions of the Ambrosia Lake area
have been modified by the creation of cones of depression as
0 5 10 0 S 10
A /|963
JOHNNIEM
ANN LEE
10 5 0 5 10
Co
Mg
F«
Jmwc \
)
Kd \ ^ / /
Cl
HCO3
S 0 4
co,
FIGURE 8—STIFF DIAGRAMS COMPARING WATER QUALITY DURING MINE DEVELOPMENT TO 1979 WATER QUALITY, FOR DIS-CHARGE FROM THE WESTWATER CANYON MEMBER: center: representative samples for the Westwater Canyon Member(jmwc) and the Dakota Sandstone (Kd); scale is in equivalents per million.

319
EXPLANATION
D**" Typical sample fromUcstwater Canyon
D Typical sample fromDakota Sandstone
O Actual sample
Westwotcr ConyonWater Chemistry
Co
FIGURE 9—TRILINEAR DIAGRAM SHOWING THE CHANGE IN WATER QUALITY WITH TIME; J-63, J-79—Johnny M mine dis-charge, 1963 and 1979; A-57, A-79—Ann Lee mine discharge, 1957 and 1979; 17-62, 17-79—Sec. 17 mine discharge,1962 and 1979; 22-57, 22-79—Sec. 22 mine discharge, 1957 and 1979; pattcmed areas show typical chemistry for waterfrom the Dakota Sandstone and Westwaler Canyon Member.
much as 700 ft (215 m) deep. These changes in the potentiometricsurface have not spread beyond the general area of mining.Changes in water quality result from leakage of more highlymineralized water from the Dakota Sandstone into the West-water Canyon Member. These changes probably are irreversible.
ReferencesCooper, J. B., and John, E. C , 1968, Geology and ground-water oc-
currence in southeastern McKinley County, New Mexico: New MexicoState Engineer, Tech. Rept. 35,108 p.
Dane, C. H., and Bachman, G. O., 1965, Geologic map of New Mexico:U.S. Geological Survey, scale 1:500,000
Gordon, E. D., 1961, Geology and ground-water resources of the Grants-Bluewater area, Valencia County, New Mexico: New Mexico StateEngineer, Tech. Rept. 20, 109 p.
Hoskins, W. G., 1963, Geology of the Black Jack No. 2 mine, SmithLake area, in Geology and technology of the Grants uranium region,V. C. Kelley, compiler: New Mexico Bureau of Mines and MineralResources, Mem. 15, p. 49-52
Kelly, T. E., 1977, Geohydrology of the Westwater Canyon Member,Morrison Formation, of the southern San Juan Basin, New Mexico:New Mexico Geological Society, Guidebook 28th field conference, p.285-290
U.S. Environmental Protection Agency, 1975a, Impacts of uranium min-ing and milling on surface and potable waters in the Grants mineralbelt, New Mexico, in Water quality impacts of uranium mining andmilling activities in the Grants mineral belt, New Mexico: EPA906/9-75-002
, 1975b, Impacts of uranium mining and milling on water qualityin the Grants mineral belt, New Mexico, in Water quality impacts ofuranium mining and milling activities in the Grants mineral belt. NewMexico: EPA 906/9-75-002

320
PRELIMINARY ESTIMATES OF EFFECTSOF URANIUM-MINE DEWATERING ON WATER
LEVELS, SAN JUAN BASINb> Forest P. Lyford and Peter F. Frenzel, U.S. Geological Survey, Albuquerque, New Mexico 87125 and
William J. Stone, New Mexico Bureau of Mines and Mineral Resources, Socorro, New Mexico 87801
AbstractMost of the uranium mines in northwestern New Mexico will
withdraw water from tlie Morrison Formation in the course ofmining operations. Using three levels of projected uranium min-ing, a digital model was used to estimate approximate dewateringrates, effects on water levels in the Morrison Formation, and ef-fects on streams to the year 2000. All effects are superimposed onother likely developments of ground water from the MorrisonFormation. Planned or announced mines, a maximum of 33 by1985, would produce 570,000 acre ft (7x 10s m3) of water by2000. The dewatering rate would be about 36 ftVs (1 mVs) inabout 1985, with drawdowns of 2,000 ft (600 m) or more ex-pected near the deepest mines. By 2000, a projected mediumrange of development of 72 mines would produce about1,300,000 acre ft (16x 10s m3) of water, and the dewatering ratewould be about 90 ft3 /s (2.6 m3 /s). Drawdowns of 4,000 ft (1,200m) or more might be expected near the deepest mines. By 2000, amaximum projected development of 105 mines would probablyproduce about 2,030,000 acre ft (25 x 10s m3) of water, and thedewatering rate would be about 117 ft Vs (3.3 mVs). By 2000,dewatering of uranium mines and other ground-waterdevelopments may reduce flow in the San Juan River by 0.04ftVs (0.001 mVs), and flow toward the Rio Grande valley maybe reduced by 0.5 ftVs (0.015 mVs). The peak effect on flow tostreams would not occur until long after the year 2000.
Introduction
Purpose and scopeThe development of uranium resources from subsurface mines
in northwestern New Mexico will result in the production of largequantities of water from the Morrison Formation, the major ore-producing unit and an important aquifer in the area of develop-ment. Mine dewatering will cause extensive water-level declinesand will reduce the ground-water flow toward the San Juan Riverand Rio Grande valley (fig. 1).
In anticipation of major increases in ground-water pumpingthat will result from the development of energy resources, theU.S. Geological Survey (USGS), New Mexico Bureau of Minesand Mineral Resources, and New Mexico State Engineer began acooperative study in 1974 to evaluate the ground-water resourcesand possible effects of ground-water development. The ex-perience and techniques developed during that study wereapplicable to an evaluation of impacts on ground-water resourcesrequested by the San Juan Basin Regional Uranium Study(SJBRUS) Task Force.
This evaluation was requested by SJBRUS Task Force in orderto estimate: 1) quantities of water that might be produced fromuranium mines in the Morrison Formation, 2) changes in waterlevels in the Morrison Formation resulting from mine dewater-ing, and 3) effects of dewatering on surface flows.
The effects of uranium mining were evaluated for three pro-jected levels of development: 1) no additional mines includedbeyond the 33 that are currently operating or planned, 2) amedium-range projection including 72 mines, and 3) a high pro-jection including 105 mines. The predicted effects of these pro-jected levels of development were to be superimposed on otherlikely water withdrawals for such uses as coal production and
municipal supply. Mine locations for the three projections weredetermined by SJBRUS.
This report presents the results of a preliminary digital modelevaluation developed by the USGS. This model was constructedusing the best available values for hydraulic properties but alsocontains many untested simplifying assumptions. The model hasnot been calibrated or tested for sensitivity to assumptions aboutthe hydrogeologic system, and the results presented should beconsidered engineering estimates giving only the rough magni-tude of effects that may result from uranium development in thebasin. A more rigorous model of the hydrologic system was notattempted because of the immediate need for these estimates.
Study areaThe study area (fig. 1) coincides approximately with the extent
of the Morrison Formation in northwestern New Mexico andsouthwestern Colorado. Most of the area lies within the San Juanstructural basin as defined by Keliey (1951). Major physio-graphic features in or near this area include the San Juan and LaPlata Mountains in Colorado, the Chuska Mountains near theNew Mexico-Arizona border, the Zuni Mountains at the southside of the study area, and the Rio Grande valley and Sierra Naci-miento on the east side of the study area. The San Juan, Animas,La Plata, and Mancos Rivers flow perennially into New Mexicofrom Colorado. Other major drainages, including the ChacoRiver, Canyon Largo, Puerco River, Rio San Jose, and RioPuerco, drain large areas but are characterized by ephemeralflow.
Much of the annual precipitation comes during short but fre-quently intense convective thundershowers. At lower elevations,such as the area drained by the Chaco River, the annual precip-itation rarely exceeds 8 inches (20 cm). The uplands, particularlythe San Juan and La Plata Mountains in Colorado where annualprecipitation exceeds 30 inches (76 cm) in some places, are thesource for most surface water in the basin. Much of the rechargeto aquifers also occurs in the upland areas.
Population centers include Durango and Cortez in Coloradoand Farmington, Shiprock, Gallup, and Grants in New Mexico.Major population increases are expected as a result of energy andrelated developments. Major energy developments currently inoperation include oil and natural-gas production, coal mining,coal-fired power production, and uranium mining. The NavajoIrrigation Project also contributes significantly to the economicgrowth of the area. Although none of these except the uraniummines are presently removing significant amounts of water fromthe Morrison Formation, additional demand for ground water isanticipated, particularly for use in coal mining and power pro-duction.
Ground water in theMorrison Formation
The Morrison Formation (Jurassic) includes three membersthroughout most of the study area. In ascending order, these are:the Recapture Member, Westwater Canyon Member, and BrushyBasin Member. In the northwest part of the area near Four Cor-ners, a fourth member—the Salt Wash Member—underlies theRecapture Member.

321
109° 108° 107°
OF THE MORRISON" FORMATION' AND
STUDY fi
0 10 20 30 KILOMETERS
FIGURE 1—LOCATION MAP OF STUDY AREA.

322
All of the members of the Morrison Formation yield water towells locally, but the Westwater Canyon Member is the principalwater-bearing unit. The thickness of the Westwater CanyonMember ranges from 430 ft (l?0 m) in the southwest part of thestudy area to 100-230 ft (30-70 m) along the east side. A con-glomeratic sandstone exists in the Westwater Canyon Member inthe southwest part of the area but disappears to the north andeast. The percentage of sandstone and average grain size decreasefrom south to north in the study area (Ridgley and others, 1978).
The Recapture and Brushy Basin Members consist mostly ofshaly sedimentary rocks that serve as confining beds for water inthe Westwater Canyon Member. The Recapture Member, whichunderlies the Westwater Canyon Member, generally ranges inthickness from 230 to 330 ft (70 to 100 m) and consists mostly ofinterbedded fine- to very fine grained sandstone, siltstone, andmudstone (Ridgley and others, 1978). The Brushy Basin Mem-ber, which overlies the Westwater Canyon Member, ranges inthickness from 230 to 425 ft (70 to 130 m) and consists of clay-stone and very fine grained sandstone (Ridgley and others, 1978).
The Salt Wash Member reaches a maximum thickness of 330 ft(100 m) at the north end of the Chuska Mountains and consistsof interbedded medium- to very fine grained sandstone, clay-stone, and siltstone (Ridgley and others, 1978).
Ground water in the Morrison Formation flows from outcropareas in the northeast and southwest parts of the study areatoward the center of the area; from there, flow is northwesttoward the San Juan River and southeast toward the Rio Grande(Lyford, 1979). Some flow probably is toward the Rio Puerco inthe southwest part of the area. The ground-water flow is assumedto be approximately perpendicular to the potentiometric surfacecontours shown on fig. 2. ("The potentiometric surface is an im-aginary surface connecting points to which water would rise intightly cased wells from a given point in an aquifer"; Lohman,1972, p. 8.)
Most of the water levels shown in fig. 2 are from wells de-veloped in the Westwater Canyon Member of the Morrison For-mation. Water levels in other members are included, but thepotentiometric surface is assumed to represent that of the West-water Canyon Member. Water-level measurements are sparse;consequently, measuremenis taken over a long period of time(1954-1978) were used. In most areas of the basin, water levelsare not changing rapidly; water levels shown are a reasonablerepresentation of the potentiometric surface.
The modelA three-dimensional finite-difference computer program
developed by Trescott (1975) and Trescott and Larson (1976) wasused to simulate ground-water conditions and impacts of miningand other ground-water pumping on the Morrison Formation.The three-dimensional program was selected because of the rel-ative ease of operation within the New Mexico district of theUSGS and because a better representation of leakage could beobtained for multiple pumping periods than could be obtainedwith the USGS two-dimensional program with leakage (Trescottand others, 1976), which was another program available for useat the time of the study.
Using finite-difference approximation, the program solves theequation of ground-water flow in three dimensions. The modeledarea is divided into three-dimensional blocks, and values of hy-draulic conductivity and storage coefficient are assigned to eachblock. Lohman (1972, p. 6) offers the following definition: "Amedium has a hydraulic conductivity of unit length per unit timeif it will transmit in unit time a unit volume of ground water atthe prevailing viscosity through a cross section of unit area,measured at right angles to the direction of flow, under a hy-draulic gradient of unit chang. in head through unit length offlow." Lohman (1972, p. 8) defines storage coefficient as "Thevolume of water an aquifer releases from or takes into storageper unit surface area of the aquifer per unit change in head."
Grid size and hydrologic properties s.The horizontal grid (fig. 3) uses squares 2 mi (3.2 km) on a side
in areas that will be most intensely developed. The grid size is ex-panded in other areas where changes in head will not be as great.
The Westwater Canyon Member of the Morrison Formationwas simulated as a single layer 300 ft (90 m) thick. The modeledtransmissivity (hydraulic conductivity multiplied by aquiferthickness) distribution for the Morrison Formation is shown onfig. 3. The members of the Morrison Formation above and belowthe Westwater Canyon Member generally have a low hydraulicconductivity. The transmissivity of the .Westwater CanyonMember is therefore assumed to be the equivalent of the trans-missivity of the Morrison Formation. A specific storage of1 x 10-6 per ft (3.3 x 10⁻⁶ per m) was assigned in the mode' exceptin outcrop areas on the south and west sides. This specific storageis typical for a confined aquifer (Lohman, 1972). Aquifer-testdata also confirm this value of specific storage for the MorrisonFormation, at least in the area near Crownpoint. Specific storageis multiplied by thickness of the layer in the model to yield thestorage coefficient of the aquifer. In outcrop areas, which wereassumed to be under water-table conditions, a storage coefficientof 0.1 was used. Where the outcrop did not cover the full area ofa rectangular block, the assigned storage coefficient was ap-proximately 0.1 times the fraction of the block covered by out-crop. Drawdowns in outcrops on the north and northeast wereassumed to be negligible; therefore, no allowance was made forgravity drainage in these areas.
Vertical leakage from units overlying the Westwater CanyonMember was simulated by three layers (ascending order): 50, 50,and 100 ft (15, 15, and 30 m) thick, rather than by a single thicklayer, to better simulate transient How in the confining beds.
A vertical hydraulic conductivity of lxlfr '* ft/s (3xlO-'icm/s) was used uniformly in these overlying layers throughoutthe modeled area. No horizontal hydraulic conductivity was as-signed to these layers, assuming all flow would be vertical. Aspecific storage of 1 x I0-* per ft (3.3 x 10⁻⁶ per m) was assumed.Because of the uncertainty of the vertical hydraulic conductivityand storage coefficient in confining layers adjacent to the West-water Canyon Member, further refinement by using thinner lay-ers and layers below the aquifer was not warranted.
Initial and boundary conditionsTo evaluate changes that might result from dewatering from
mines and other stresses on ground water in the Morrison Forma-tion, the initial potentiometric heads in the aquifer were assigneda value of zero in the model. Modeled changes in the potentio-metric surface may then be superimposed on the surface shownin fig. 2, to determine the potentiometric surface at a later date.
Boundary conditions specified in the model included no flow,constant flux, and constant head. No-flow boundaries were sim-ulated by assigning a zero hydraulic conductivity to the nodesthat marked the extent of the Morrison Formation. Because ofthe abrupt thinning and disappearance of the Westwater CanyonMember at the south end near Gallup and Laguna (fig. 3), a zerohydraulic conductivity was assumed in these areas. In the verticaldirection, a no-flow boundary was imposed immediately belowthe Westwater Canyon Member and another placed an arbitrarydistance of 200 ft (60 m) above the Westwater CanyonMember—a distance beyond most of the effects of water-leveldeclines in the Westwater Canyon Member during the simulationperiod.
Constant heads allow no head change at a node and were usedto simulate effects that ground-water production may have onflow toward theSan Juan River and the Rio Grande valley. Fig. 3shows locations of constant-head nodes used for this purpose.Constant heads were also placed under the Chuska Mountains,where flow from the Chuska Sandstone (the Tertiary unit overly-ing the Morrison Formation in this area) could be expected to in-

323
crease with head declines in the Morrison. At present, waterflows from many springs in the Chuska Sandstone.
Mines were simulated by constant heads at blocks correspond-ing to locations determined by SJBRUS. The constant-head valuefor each block with a mine is the difference between the poten-tiometric surface of the Morrison Formation (fig. 2) and the topof the Morrison Formation. The difference map shown in fig. 4was constructed from the potentiometric surface described
earlier (fig. 2) and a structure map of the top of the Morrisonthat was compiled from maps by Stone and Mizell (1978) andSilver (1950). .Where the Westwater Canyon Member is not theuppermost unit in the Morrison Formation, drawdowns areunderestimated. Two or more mines located in the same blockwere treated as a single mine.
Flow toward a 2-mi-sq (3.2-km-sq) constant-head block in themodel is approximately equivalent to flow toward a circular mine
109° 108° 107°
1965. °BISTI(73) • 1968(74)
36°—±
EXPLANATION
^ Potentiometric contour In meters.«\0 Interval is 120 meters. DashedV* where control is limited. Datum
Is mean sea level
• 1989 Measured water-level altitude in(76) meters. Number in parenthesis is
the year of measurement.
Outcrop area0 10 20 30 KILOMETERS
NOTE: The water levels measured in wells which penetrate all or part of theMorrison Formation, are assumed to be representative of the potentio-metric surface in the Westwater Canyon Member.
FIGURE 2—POTENTIOMETRIC SURFACE OF MORRISON FORMATION, 1954-1978 (outcrop area from Daneand Bachman, 196S).

324
ROWS
37°
No
Outcrop ar
Area with water table conditions; storage 4a
coefficient (S) of .1 assigned in modelunless otherwise indicated
Constant-head node
Boundary between transmissivity zones used in model - ,Q , . , Q KILOMETERS
I Boundary of sub-model
NOTE: The outcrops and transmissivities shown are assumedto represent those of the Westwater Canyon Member.
FIGURE 3— TRANSMISSIVITY AND OUTCROP MAP FOR THE MORRISON FORMATION, showing the grid and boun-daries used for digital modeling (modified from Lyford, 1979; outcrop area from Dane and Bachman,1965, and Tweto, 1976).

325
109° 108° 107°
35°
10 A R KM B A
0 10 20 30 KILOMETERS
EXPLANATION
Ltne of equal dif ference between the potentiometric surfacein the Morrison Formation and the top of the Morrison forma-t i o n , in meters. Dashed where approximately located.Interval is 150 meters. The Westwater Canyon Member islocated 0-130 meters below the top of the Morrison Formation
Outcrop area
FIGURE 4—DIFFERENCE BETWEEN THE POTENTIOMETRIC SURFACE OF AND THE TOP OF THE MORRISON FORMATION (top ofMorrison from Silver, 1950, and Stone and Mizell, 1978; outcrop area from Dane and Bachman, 1965).

326
with the same constant head and a radius of about 2,200 ft (670m; Trescott and others, 1976). This size was assumed to be repre-sentative.
At present, a typical mine has an effective radius of about1,000 ft (305 m; Marc Nelson, USGS, personal communication,1979). I f a typical mine of the future is this size, then estimates ofwater production given below may be somewhat high. To deter-mine the extent of possible error from this source, the modeleddischarge from a single mine in a 2-mi-sq (3.2-km-sq) block wascompared with the theoretical discharge from single circularmines having radii of 1,000 and 2,000 ft (305 and 610 m) (fig. 5),as determined by the constant-drawdown method (described byJacob and Lohman) for a homogeneous, laterally extensive aqui-fer (Lohman, 1972). For purposes of comparison, vertical leak-age into the aquifer was assumed to be zero. As indicated in fig.5, the potential overestimate of discharge owing to the estimatedsize of future mines is generally no greater than 20 percent.
To simulate mines with constant heads in the model, the rockssurrounding the mines are assumed to remain saturated. Themodel does not simulate possible draining of rocks surroundingthe mines. A mine-simulation problem (W. F. Guyton and Asso-ciates, 1978) showed that water produced by draining of therocks may account for up to 10 percent of the discharge frommines that are about 3,300 ft (1,000 m) deep (90 percent is de-rived from decompression of the water and compression of theaquifer).
Constant-flux nodes were used to simulate production of waterfrom certain mines, anticipated south of Shiprock, lying outsidethe area modeled by 2-mi-sq (3.2-km-sq) blocks. The dischargesat the constant-flux nodes in the ?hiprock area were approx-imately determined by using a submodel (fig. 3) covering asquare area 56 mi (90 km) on a side. Hydraulic properties wereassumed to be the same as in the main model for this area, andthe outcrop areas on the west side were treated in the same man-ner as outcrop areas in the main model. The submodel also usedconstant heads and 2-mi-sq (3.2-km-sq) blocks to simulate pro-jected mines. The discharges from these nodes at the end of eachfive-year time period were assigned to the constant-flux nodes inthe main model. Drawdowns caused by other stresses in the sys-tem were assumed to be negligible in the Shiprock area; there-fore, no-flow boundaries were used on the north, east, and southsides of the square. Development of the main model indicatedthat drawdowns caused by other mines would be no more thanabout 100 ft (30 m) in the Shiprock area (generally less), and sothe assumption was judged to be valid.
Constant-flux nodes were used to simulate production fromthe Morrison Formation for uses other than uranium mining.Production figures and time periods are shown in table 1. Thepumpage figures for coal mining were from estimates by a taskforce developing a regional coal environmental impact statement(William Weist, USGS, personal communication, 1977).
modeled discharge froma 3.2 km blockrw = 670m
10 15Time (years)
FIGURE 5—COMPARISON OF MODELED DISCHARGE FROM A CONSTANT HEADWITH THEORETICAL DISCHARGE FROM CIRCULAR MINLS WITH RADII OF1,000 AND 2,000 FT (305 AND 610 M). 0 = T2nG(o)su, where:o = Tt/Srw
2; G(o)-G function of a; Q = discharge rate; T = trans-missiviiy = 19 m2/D; sw = constant drawdown = 610 m; t = time sincemine was created; S = coefficient of storage = 3 x 10~4; r = radius ofmine (from Lohman, 1972).
The rate of production of water from the Morrison Formationaquifer may be represented by a mass-balance equation of theform:
P = A1 + AD + ASwhere,
P = rate of production from mines and wells combined;AI = increases in rate of inflow to the aquifer by leakage from
overlying beds, including the Chuska Sandstone;AD = decreases in rate of discharge to the San Juan River and
Rio Grande valley; andAS = rate of withdrawal of water from storage.The values of these quantities, as they were developed in the
model, are indicated in table 2.
TABLE 1—PUMPING PERIODS AND RATES USED TO SIMULATE WATER PRODUCTIONFROM WELLS. 1952-2000.
period
1952-2000
1960-2000
1980-20001980-20001980-2000
1980-2000
1985-20001985-20001985-2000
row
13
29
223841
45
283235
node
column
8
11
2627
26
27
282726
pumping or averageflow rate(mVsec)
2.8 X10⁻²
5.7x10⁻³
5.4x10⁻²
9.5 X10⁻³
9.5 x 10⁻³
9.2X10⁻³
5.4xlO-3
9.5x10⁻³
9.5x10⁻³
use
Tohatchiflowing well, stock
Crownpointwater supply
supply for coalsupply for coal
supply for coal
supply for coal
supply for coalsupply for coalsupply for coal

TABLE 2—MODELED WATER PRODUCTION FROM URANIUM MINES AND WEIIS. WITHDRAWAI FROM STORAC.F.. AND OTHER CHANCES IN INFLOW AND DISCHARGE.1980-2000 ('constant flux throughout the period; "constant-head boundary only).
period
1953-19801980-19851985-19901990-19951995-2000
productionfrom mines
(average ratefor period)(mVsec)
.24
1.2
.76
.65
.55
discharges(rates at end of period)
from mines(mVsec)
.37
1.0
.75
.65
.56
for otheruses
(mVsec)
.034
.12
.19
.19
.19
total(mVsec)
withdrawalfrom storage,
MorrisonFormation(mVsec)
leakage(mVsec)
planned or announced projection
.40
1.1
.94
.84
.75
.381.1
.90
.79
.70
.013
.031
.038
.043
.045
sources(rates at end of period)
increasedflow fromChuska
Mountaina r e a "
(mVsec)
.00017
.00025
.00038
.00054
.00076
decline in discharge
toSan Juan
River(mVsec)
5.6xlO-8
1.4 x 10⁻⁷
2.8x10-'
5 . 6 x 1 0 '1.1 XlO"6
toRio Grande
valley(mVsec)
.0020
.0032
.0042
.0048
.0051
total(mVsec)
.40
1.1
.94
.84
.75
medium-range project ion1980-1985
1985-19901990-19951995-2000
1.32.2
2.1
3.1
1.1
1.7
1.8
2.6
.12
.19
.19
.19
1.2
1.9
2.0
2.8
1.2
1.8
1.9
2.6
.034
.069
.094
.14
.00026
.00040
.00064
.0010
1.3x10'2.8x10-'2.4 x 10⁻⁴
8.8 XlO-4
.0033
.0060
.0080
.0098
1.2
1.9
2.0
2.8
1980-19851985-19901990-19951995-2000
3.7
4.0
2.8
3.9
2.6
3.0
2.5
3.3
.12
.19
.19
19
2.7
3.22.7
3.5
high projection
2.6
3.042.5
3.3
.08
.14
.17
.21
.00027
.00054
.0012
.0026
1.3x10'4 . 5 x 1 0 '2.9x 10-*4.0x10⁻⁵
0043.0094
.013
.015
2.7
3.2
2.7
3.5

328
Model confidenceConfidence in modeled predictions can be gained if the model
accurately simulates historical data. Although the scarcity ofhistorical data for the model area does not allow intensive verifi-cation, discharge data for mines and a history of water-leveldeclines near Church Rock (Hearne, 1977) allows checking ofmodel results in that area.
Discharge data for the Church Rock mines from 1968 to 1974from Hearne (1977), for 1976 and 1977 from USGS measure-ments below the mines, and for 1978 from company records (J.G. Dudley, New Mexico Environmental Improvement Division,personal communication, 1979) indicate that at current discharge
rates of approximately 8,000 acre ft/year (9.9 x 10s mVyear) thetotal volume of water produced from these mines between 1968and 1980 will be about 57,000 acre ft (70x 106 m3). This com-pares with a model calculated production of 60,000 acre ft(74 x 105 m3) during this period. The modeled water-level declineat a point 3.4 mi (5.4 km) southwest of the mine nodes nearChurch Rock is about 260 ft (79 m), compared with an actualdecline of about 240 ft (73 m).
Predicted drawdowns for 1980 at Crownpoint are about 100 ft(30 m) (fig. 6). Data supplied by the Bureau of Indian Affairs(E. O. Plummer, Eastern Navajo Agency, personal communica-tion, 1979) indicate a drawdown of about 200 ft (60 m) nearCrownpoint as compared to the 100 ft (30 m) predicted by the
109° 108° 107°
10 A R R\t B A
35° -
0 10 20 30 KILOMETERSi i I i
EXPLANATION
Line o f equal drawdown,in meters
Stressed node
' No-flow boundary
FIGURE 6—MODELED DRAWDOWN IN THE WESTWATER CANYON MEMBER OF THE MORRISON FORMATION FOR THE YEAR 1980WITH EXISTING URANIUM MINING, showing locations of nodes stressed during the period 1952-1980.

model. Data from the Bureau of Indian Affairs indicate a current(1978) pumping rate of 0.4 ftVs (1.2 x 10- mVs), compared to0.2 ftVs (5.7x 10⁻³ m3/s) u s ed j n t n e model. Also, pumping fromthe Morrison has continued since 1940, rather than from 1960,which was believed when the simulations were made. The greaterpumping rate and longer pumping period could account for thedifference between modeled and actual drawdowns.
Data supplied by companies operating near Ambrosia Lake(J. G. Dudley, written communication, 1979) indicate that in1978 about 12 ftVs (0.34 mVs) were discharged to surfacedrainages in this area; the model predicted only 5 ftVs (0.14mVs) in 1980 from the Morrison Formation. The reason for thedifference is unknown, but it might be attributable to gravitydrainage from rocks adjacent to the mines.
37° 109° 108°
329
Results and discussionWater-production rates through the year 2000 for each de-
velopment projection are given in table 2. By 1980 a total of170,000 acre ft (2 x 10s m3) will have been produced from existinguranium mines. Drawdowns of 490 ft (150 m) or more might beexpected around mines near Ambrosia Lake and near ChurchRock (fig. 6).
Existing and proposed mines, a maximum of 33 by 1985, mayproduce 570,000 acre ft (7x 10" m3) in 2000. With a dewateringrate of about 36 ftVs (1 mVs) of water in 1985, decreasing to 21ftVs (0.6 mVs) by the year 2000, drawdowns of 2,000 ft (600 m)or more may be expected near the deepest mines (fig. 7).
For the medium-range projection, a maximum of 72 mines
107°
35° -
, R I 0 A R R I B A /
10 20 30 KILOMETERS
EXPLANATION
Line of equal drawdown,in meters
Stressed node
No-flow boundary
FIGURE 7—MODELED DRAWDOWN IN THE WESTWATER CANYON MEMBER OF THE MORRISON FORMATION FOR THE YEAR 2000WITH PLANNED OR ANNOUNCED URANIUM MININO. showing locations of nodes stressed during the period 1980-2000.

330
may produce a total of 1,300,000 acre ft (16 x 10s m3) of water bythe year 2000 with a dewatering rate of about 90 ftVs (2.6 mVs).In the year 2000 about 5 percent of the water may come fromleakage and less than Vi percent from rivers (indicated by flow atconstant-head nodes at row 2, column 32; rows 58-60, column 3;row 61, columns 11-15; row 63, columns 21-23). Drawdowns of4,000 ft (1,200 m) or more might be expected near the deepestmines (fig. 8).
For the high projection, a maximum of 105 mines may pro-duce a total of 2,030,000 acre ft (25 x I08 m3) of water by the year2000 with a dewatering rate of 117 ftVs (3.3 mVs). In the year
2000 about 6 percent of the water may come from leakage andless than Vi percent from rivers. Drawdowns of 4,000 ft (1,200in) or more may be expected near the deepest mines (fig. 9).
By 2000, dewatering of uranium mines and other ground-waterdevelopment may reduce flow in the San Juan River by 0.04 ftVs(0.001 mVs), and flow toward the Rio Grande valley may bereduced by 0.5 ftJ/s (C.015 mVs). Table 2 indicates a greater ef-fect on discharge to the San Juan River for the moderate projec-tion than for the high projection. This effect is because minesnear Shiprock for the moderate projection were placed closer tothe San Juan River, as shown by the drawdown contours in figs.
108" 107°
RIO A R R\l 8 A
I 7
35 8VALENCIA
0 10 20 30 KILOMETERSi i i i
EXPLANATION
Line of equal drawdown,In meters
• Stressed node
!•"• "™J No-flow boundary
FIGURE 8—MODELED DRAWDOWN IN THE WESTWATER CANYON MEMBER OF THE MORRISON FORMATION FOR THE YEAR 2000WITH A MEDIUM-RANGE LEVEL OF URANIUM MINING, showing locations of nodes stressed during the period 1995-2000.

331
8 and 9. Fig. 10 shows cumulative production from mines andwells for each of the three projections.
Flow at constant-head nodes in row 5, columns 14-16 (fig. 3)indicates that diversion from springs around the Chuska Moun-tains, combined with reduction in storage in the Chuska Sand-stone, may be as high as 0.09 ftVs (0.0026 mVs) by 2000 (table2). This figure is probably a maximum, because the use ofconstant-head nodes implies a perfect hydraulic connection be-tween the Chuska Sandstone and the Westwater Canyon Memberof the Morrison Formation; also, the area represented by thesenodes is greater than the area of Morrison Formation subcropunder the Chuska Sandstone (fig. 3).
If all pumpage were to stop after the year 2000, water levelswould rise near abandoned mines and wells; but drawdownswould continue to increase in the outcrop areas, and reduction inflows to the rivers would persist, as would the increase in flowfrom the Chuska Sandstone. Owing to the relatively small mag-nitude of the effects on rivers, the present direction of flowtoward the rivers would probably not be reversed.
The model results indicate what might happen with each ofthree levels of development; however, the results should beassessed in view of the limitations of the model. No attempt wasmade to determine the sensitivity of the model results to themany simplifying assumptions and uncertain hydrologic charac-
109° 107°
•„., R I 0 A R R I S A
10 20 30 KILOMETERS
EXPLANATION
Line of equal drawdown,in meters
• Stressed node
—J No-flow boundary
FIGURE 9—MODELED DRAWDOWN IN THE WESTWATER CANYON MEMBER OF THE MORRISON FORMATION FOR THE YEAR 2000WITH A HIGH LEVEL OF URANIUM MINING, showing locations of nodes stressed during the period 1995-2000.

332
2500
I960 1970 1980Time (years)
1990 2000
F I G U R E 10—CUMUIATIVfc DJSC'HAJlljfc I-KOM LXISTJNCj AND PROJECTEDMINfcSANDWfcllS.
teristics. However, the following general statements can be maderegarding the relative importance of these assumptions and un-certainties (in approximate order of their importance):
1) MINE LOCATIONS—Many mine locations for the medium-range and high projections are pure conjecture. Some companyofficials and geologists think that these two projections areunreasonable. As shown in the accompanying tables and figures,dewatering rates and drawdowns increase with the number ofmines.
2) LEAKAGE—The value of vertical permeability used in themodel is thought to be the largest value likely for much of thestudy area. However, leakage may be higher in local, highly frac-tured ar- ?, especially near the surface where fractures may bemost effective in transmitting water. If the value of verticalpermeability used is too low, the modeled mine discharges arealso too low, and in some areas the modeled drawdowns are toogreat.
3) STORAGE COEFFICIENT—A lower storage coefficient wouldgive lower dewaterir.g rates. For the range of values that arepossible in the Westv/ater Canyon Member of the Morrison For-mation, this factor may not bi' too important. Small differencesin the magnitude of the water-table storage coefficient assignedin outcrop areas probably have little effect on the results, becauseof small drawdowns in these areas of less than 100 ft (30 m).However, a comparison of estimated drawdowns (figs. 8,9) withthe difference between the potentiometric surface and the top ofthe Morrison Formation (fig. 4) indicates that the area overwhich water-table storage is effective may increase and movetoward the mined areas. Because of this effect, drawdowns areoverestimated and discharges are underestimated.
4) METHOD OF TREATING MINES IN MODEL—The constant headsassigned to the 2-mi-sq (3.2-km-sq) blocks approximate the effectof a circular mine, with a radius of about 2,200 ft (670 m), that iscreated instantaneously. Smaller mines and those that are not cir-culur but as extensive laterally would produce less water. Aiy;.-Ical mine with a length of 4,000 ft (1,200 m) and a width of600 h (200 m) might produce about 15 percent less water than amine ipproximated by a constant-head block that is 2 mi (3.2km i on a side. The assumption that a mine is created instan-taneously also causes an overestimate, at least initially, in thetotal quantity produced.
Gravity drainage will not appreciably affect discharge fromthe confined system. However, total discharge from mines wouldbe greater than predicted discharge by an unknown amount. Sup-
posing that a typical mine drains a cylindrical volume of rockthat has a radius of 1,000 ft (300 m), a thickness of 200 ft (60 m),and a specific yield of 20 percent, then the volume of water pro-duced from the mine would be 2,800 acre ft (3.5 x 10s m'). If thisquantity were produced from each mine in addition to the quan-tity from the confined system, the model-calculated dischargevolumes are 15-20 percent too low.
5) DIFFERENCE IN ELEVATION BETWEEN TOP OF MORRISONFORMAriON AND TOP OF WESTWATER CANYON MEMBER—Thedrawdown assumed at each mining node was the difference be-tween the potentiometric surface of and the top of the MorrisonFormation. Most mines probably will be located in the West-water Canyon Member, which is below the top of the Morrisonby up to 300 ft (100 m) in the area of prospective mining. Thisassumption causes both the drawdowns and the mine dischargesto be underestimated.
6) DIFFERENCE BETWEEN POTENTIOMETRIC SURFACE OF ANDTOP OF THE MORRISON—The structure maps used to compute thedifference had a contour interval of 500 ft (150 m). For a givenlocation the difference used to represent a mine as a constanthead could easily be in error by 200 ft (60 m) or more. Althoughthis would affect the discharge from a single mine, multiplemines should balance errors provided that the structural mapsare reasonably accurate on a broad scale.
7) TRANSMISSIVITY DISTRIBUTION—Long-term discharge froma mine is approximately proportional to the transmissivity. Thetransmissivity distribution in areas of current or projected min-ing is supported by several aquifer tests. Future evaluations mayresult in changes, particularly at the east end of the mineral beltwhere present estimates may be somewhat low. Few data exist tosupport the transmissivity assumed in the northeast half of thestudy area, but for the simulation period considered here, the in-fluence of that area is relatively unimportant.
8) THE FINITE-DIFFERENCE SIMULATION—For this particularproblem, this factor is probably the least important in assessingthe results. Horizontal node spacing may affect results in the im-mediate vicinity of a mine but should not matter on a regionalscale. Leakage could have been treated more accurately by moreand thinner layers or by a special leakage option that would notuse the finite-difference approach. Since the other uncertaintiesmentioned above could introduce errors of a greater magnitudethan the leakage effect, further refinement of the model was notconsidered appropiiate.
English to metric conversion factors
The following table contains factors used herein for convertingEnglish units to metric units:
multiply English unit by to obtain metric unitinch 2.54 cm (centimeter)ft (foot) .3048 m (meter)ft/s (foot per second) .3048 m/s (meter per second)ft2day (foot squared m2 /day (meter squared
per day) .0929 per day)ftVs (cubic foot per m' /s (cubic meter per
second) .02832 second)acre 4047 m2 (square meter)mi (mile) 1.609 km (kilometer)acre ft 1233.5 m*
ReferencesDane, C. H., and Bachman, G. O., 1965, Geologic map of New Mexico:
U.S. Geological Survey, scale 1:500,000W. F. Guyten and Associates, 1978, Production of water from Westwater
Canyon aquifer near Crownpoint, New Mexico, by Phillips UraniumCorporation for uranium mining: W. F. Guyton and Associates, con-sultant report prepared for Phillips Uranium Corporation
Hearne, G. A., 1977, Evaluation of a potential well field near ChurchRock as a water supply for Gallup, New Mexico: U.S. GeologicalSurvey, Water Resources Inv. 77-98, 21 p.

333
Kelley, V. C , 1951, Tectonics of the San Juan Basin: New MexicoGeological Society, Guidebook 2nd field conference, p. 124-131
Loliman, S. W., 1972, Ground-water hydraulics: U.S. Geological Survey,Prof. Paper 708, 70 p.
Lyford, F. P., 1979, Ground water in the San Juan 5fi<=in, New Mexicoand Colorado: U.S. Geological Survey, Water Resources Inv. 79-73,22 p.
Ridgley, J. L., Green, M. W., Pierson, C. T., Finch, W. 1., and Lupe, R.D., 1978, Summary of the geology and resources of uranium in the SanJuan Basin and adjacent regions, New Mexico, Arizona, Utah, andColorado: U.S. Geological Survey, Open-file Rept. 78-964,107 p.
Silver, C , 1950, The occurrence of gas in the Cretaceous rocks of the SanJuan Basin, New Mexico and Colorado: New Mexico Geological Soci-ely, Guidebook 1st field conference, p. 109-123
Stone, W. J., and Mizell, N. H., 1978, Basic subsurface data compiledfor hydrogeologic study of the San Juan Basin, northwest New Mexico:
New Mexico Bureau of Mines and Mineral Resources, Open-file Rept.89,41 p.
Trescott, P. C , 1975, Documentation of finite-difference model forsimulation of three-dimensional ground-water flow: U.S. GeologicalSurvey, Open-file Rept. 75-438, 32 p.
Trescott, P. C , and Larson, S. P., 1976, Supplement to Open-file Rept.75-438, Documentation of finite-difference model for simulation ofthree-dimensional ground-water flow: U.S. Geological Survey, Open-file Rept. 76-591
Trescott, P. C , Pinder, G. F., and Larson, S. P., 1976, Finite-differencemodel for aquifer simulation in two dimensions with results ofnumerical experiments: U.S. Geological Survey, Techniques of Water-Resources Inv., book 7, 116 p.
Tweto, Ogden, compiler, 1976, Preliminary geologic map of Colorado:U.S. Geological Survey, Misc. Field Studies Map MF-788, 2 sheets,scale 1:500,000

334
URANIUM ROYALTIES AND SEVERANCE TAXESIN THE GRANTS REGION, WITH EXAMPLES OF THEIR
EFFECTS ON MINIMUM PRODUCIBLE GRADEby James W. Melvin, Chapman, Wood and Griswold, Inc., 4015 Carlisle Blvd. N.E.,
Albuquerque, New Mexico 87107
AbstractRoyalty agreements include devices by which unit amounts
vary with grade and with U>O, sale price. Eight actual agree-ments yield $3.63 to $9.16 per 1b of recovered U,O8 (mean =$5.60), if the average grade is 0.181 percent U,O8 and the saleprice is late 1978 spot quote of $43.00 per lb. If the sale price isthe average 1978 delivery price of $17.40 per lb, the same-graderoyalty amounts are $1.12 to $2.76 per lb (mean = $1.69).Severance taxes vary with sale price, typically amounting to$2.81 per lb U)O, sold at $43.00 and to $0.62 per Ib sold at$17.40. Calculations using a realistic, average mining situationindicate that at the $43.00 price, a minimum producible grade of0.110 percent UjO, when royalties and severance taxes amount to$7.07 per 1b increases to 0.120 percent UjO, if combined royaltiesand severance taxes increase to $10.06 per Ib, and the minimumgrade decreases to 0.100 percent U,O, if royalties and severancetaxes decrease to $3.48 per pound. Applying these effects to areal and typical uranium deposit of modest size reveals that ifminimum grade must be increased from 0.110 percent to 0.120percent U>O,, the value of the lost LhO, (at $43.00 per Ibrecoverable) is $16.5 million more than the revenue gained by thehigher royalty and taxes. If minimum grade can be decreasedfrom 0.110 perceni to 0.100 percent U,O», the value of the UjO,gained exceeds by almost $10.9 million the amount of revenuelost by the lower royalty and taxes. Extrapolation suggests thatthe economic consequences for New Mexico amount to billionsof dollars.
IntroductionBecause of the frequent mention in the popular press of the
public's natural resources, one should probably say at (he outsetthat every uranium deposit in the Grants region belongs to some-body in particular. Each owner, whether public or private, ex-pects to share in the value realized by mining. The owner's shareof production is called a royalty, and the state's share is called atax.
Royalty originally meant the sovereign's share and includedboth royalties and taxes. The medieval scholar Agricola relatesthat in 16th-century Germany, mineral production was distrib-uted as follows:
king (as landlord)king or prince (as regent)king's consortmaster of the horsecup bearergroom of the chamberBergmeister (surveyor-magistrate)miner (discoverer)total
1 share1 share1 share1 share1 share1 share1 share3 shares
10 sharesUnder this arrangement the miner worked seven days for
others for every three days worked for himself. Perhaps timeshave changed less than we suppose. Agricola's translators(Hoover and Hoover, p. 82) observed in 1912 that "the miner,ever in a minority in influence as well as in numbers, has beenbuffeted from pillar [pun excused] to post, his only protectionbeing the fact that all other parties depended on his exertion andskill."
Royalty and production taxes are not related to profit; th»ymust be paid even if the miner sustains a loss.
ACKNOWLEDGMENTS—The manuscript for this article was re-viewed by K. G. Arne, G. R. Griswold, J. P. Herndon, D. F.Irving, and L. C. Jaoobsen, each of whom offered helpful sug-gestions. Each of them has many other demands on his time, and1 appreciate their attention. Any errors or omissions that remainare my own responsibility. I also appreciate the typing by G. L.Shaw, who has many other demands on her time, and the coop-eration of Chapman, Wood and Griswold, Inc. Finally, I amgrateful to an anonymous mining company for permission topublish data pertaining to an actual uranium deposit.
Royalty agreementsUranium rights in the Grants region are owned by the Federal
Government, by the State of New Mexico, by Indian tribes andpueblos, by railroad, land, and ranching companies, and by nu-merous individuals. In many instances, the owner of uraniumrights does not own the land surface and may not own otherclasses of minerals, such as petroleum or coal.
The acquisition of uranium rights to any property entails anobligation for royalty payments in the event that successful ex-ploration and mineral production occur. Mining claims on fed-eral land are the only exception to this principle. In practice,however, exploration and mining companies usually do not ownthe claims involved and so undertake a royalty obligation to theowner of the claims.
Uranium royalty agreements in the Grants region vary greatlyin rates, terms, and basis of application. Generally, royaltyamounts are related to value of crude mine output rather than torefined or manufactured products. In many cases, attempts toanticipate the effects of changes in market economics and in min-ing technology have led to the application of sliding-rate sched-ules and to the use of indexing factors. A royalty amount foropen-pit mining may differ from the royalty amount due forunderground-mine production from the same property, while theroyalty payable on production by solution mining is differentfrom either. With the further complexity of various credits ordeductions, the calculation of royalty amounts becomes reminis-cent of the preparation of an income-tax return.
The royalty examples shown herein provide a representativesample of practices in effect in the Grants region as of 1979,although some agreements are several years old. One must re-member that royalty agreements are made when mining rightsare transferred. The aggregate lead time for exploration and,where exploration is successful, for mine development can easilyreach 10 years.
Calculation of dollar-amount royalties requires application ofvarious numerical quantities. For all the examples used here, theapplicable numerical assumptions are listed in table 1.
The average sale price applied is the spot-market U3O8 quota-tion as of late 1978; however, a large portion of 1979 and subse-quent production from the Grants region is committed at muchlower prices. The U.S. Department of Energy (DOE) reports thatthe weighted-average price received from sales covering 93 per-cent of all U.S. deliveries for 1978 was $17.40 per lb UjO, (U.S.Dept. of Energy, 1978a).
The weighted-average mined grade applied is the average gradeof all uranium ore received at New Mexico mills during 1977

335
TABLE 1— NUMERICAL ASSUMPTIONS APPLIED FOR CALCULATIONS OF EX-
EMPLARY ROYALTY AMOUNTS.
average U3O8 sale price
weighted-average mined grademill-recovery rateore haulageore milling, including amortization
$43.00 per Ib0.181% U3O8
92%
$2.24 per ton$19.00 per ton
(U.S. Dept. of Energy, 1978b). The mill-recovery rate appliedand the amounts applied for ore haulage and milling are approx-imate regional averages. Actual costs for individual operationsvary greatly. Current ore haulage, for example, ranges from amile (15« per ton) to over 100 mi ($8.00 per ton). These costsmust be specified, because many royalty agreements establishmine-output value by subtracting off-site costs from the salevalue of the refined product (UjO,).
Many royalty agreements contain pages of descriptive detail onmethods of calculation. In the examples herein, such terms arecondensed, insofar as possible, to simple arithmetic formulas.All royalty amounts are expressed as dollars per pound U,O,recovered, although in most cases royalty is paid on all UjO,mined.
State of New Mexico$ royalty = 0.125 x (sale price per pound - haulage & milling per ton \
d d UO
= 0.l25x($43- $2.24 +$190.181 x 20 x
recovered pounds UjO, per ton/
+$19 \ = u.<i20 x. 92/
This royalty applies to all State leases issued subsequent toJanuary 1977 and to all earlier leases on which production is notachieved before the end of the original 10-year term. The royaltybasis is analogous to the "net smelter returns" commonly used inbase-metal royalties. This royalty is somewhat atypical, becausethe nominal rate of 12.5 percent is constant regardless of produc-tion grade. Royalty is payable on all UjO, recovered. (The factor20 that appears in many of these formulas converts grade as per-centage to pounds of UjOt per ton of rock.)
Navajo Indian Tribe, 1968$ royalty= scheduled rate x (sale price per pound
recovered pounds VtO, per tonx recovered pounds U,O, per ton - haulage & milling per ton)
= __^ 2 i__x($43x0.18lx20x.92-$2 .24-$19)0.181 x20x.92
= $9.16This royalty is exceptionally high. A schedule in the agreement
provides that the nominal royalty rate (25 percent in the exampleabove) gradually decreases when the value of the parentheticalterm is less than $23. Under the conditions applied, this valuewould not become less than $23 unless the UjO, recovered is soldfor less than $13.28 per lb. If the mined grade is halved, from0.181 percent to 0.0905 percent, the $23-threshold is crossedwhen recovered U3O, is sold at less than $21.41 per lb. Royalty ispayable on all U3O, recovered.
Laguna Indian Pueblo, 1970$ royalty = mined grade x multiplier x (sale price per pound -
$6.50 •s- mill-recovery ratemined pounds UjO, per ton;
= 0.00181 x50x($43- $ 6 5 0 V0.92 = $4.050.181x20/
The product of mined grade and multiplier is the nominalroyalty rate. The multiplier factor is specified as 50 for grades upto 0.2999 percent, 55 for grades from 0.30-0.3999 percent, and
60 for grades of 0.40 or higher, with a maximum nominal rate of40 percent. An unusual feature of this royalty is its application ofa fixed allowance of $6.50 per ton for haulage and milling ratherthan actual costs, which are considerably greater.
Navajo Indian Tribe, 1971-72vdt$ royalty = (0.12 + 0.0013 vdt)
recovered pounds U,O, per tonwhere vdt = value per dry ton = scheduled value per pound
x mined pounds per ton x sale price$7.25
= (O.I2 + .OOI3x66.56)x $66.56 =$4.13,0.181 X 20 X.92
where vdt = $3.10 x 0.181 x 20 x J * L = $66.56$7.25
The parenthetical term is the nominal royalty rate. Thescheduled value per pound is obtained from a list in the agree-ment, under which the value of the U,O, increases from $1.50 perlb, at a grade of 0.10 percent, to $3.88 per 1b, at a grade of 0.40percent. The $7.25 is a price-indexing factor. Royalty is payableon all U,O, mined.
Navajo Indian Tribe, 1975$ royalty = (0.06+ 0.0005 vdt) vdt
recovered pounds U,O, per tonwhere vdt = value per dry ton = mined pounds U >O, per tonx sale price
= (0.06 + 0.0005x155.66) $155.66 =$6.44,0.181 X 20 X.92
wherevdt = 0.18l x20x$43 = $155.66The parenthetical term is the effective royalty rate as well as
the nominal royalty rate. The "value per dry ton" in this royaltyis not equivalent to the term of the same name in the precedingexample. Royalty hereunder is payable on all UjO, mined, andno mine-value credits are allowed for haulage and milling costs.
Land company I$ royalty = scheduled percentage x vdt j
recovered pounds U,O, per tonwhere vdt = value per dry ton = scheduled value per poundx mined pounds per ton x sale price
$8= 0-2075 x $60.71 = $ 3 7 8 )
0.181x20x0.92where vdt = $3.12x0.181 x20x§ 4 i = $60.71
$8The scheduled royalty percentage, listed in the agreement,
varies as a function of vdt, from 11 to 22 percent. The scheduledvalue per pound, listed as a function of grade, varies from $0.75for grades less than 0.10 percent to $3.88 for a grade of 0.40 per-cent. The $8 price-indexing factor is the renowned "X overeight" device.
The per-pound values for U3O,, as listed by schedules in thisroyalty agreement and in several other examples used herein,were adapted from the AEC Circular 5 uranium-purchase sched-ule.
Land company II$ royalty = scheduled rate (scheduled value per pound
recovered pounds UjO, per tonx mined pounds per ton x sale priced sale price-$8.25
$7 / 10
°-23 ($3.62x0.181 x20x?i?\0.181x20x0.92 $7/
10
336
The parenthetical term is applied to select the correspondingroyalty rate from a schedule in the agreement. No credits are pro-vided for haulage and milling. The $7 is a price-indexing factor.This royalty is very high.
TABLE 2—ROYALTY AMOUNTS IN DOLLARS PER RECOVERED POUND OFU3O8, payable under uniform conditions described in text.
Land company III$ royalty = (0.12 + .0013 vdl) vdt
recovered pounds UiO, per tonwhere vdt = value per dry ton = scheduled value per poundx mined pounds per ton x sa*e Pr'ce
$8= (0.12 + 0.0013x60.71) $ 6 0-7 1 =$3.63,
0.181x20x0.9?
where vdt = $3.12 x 0.181x20x1^ = $60.71$8
The value per pound is obtained from a schedule in the agree-ment which relates value to mined grade. No credits are allowedfor haulage and milling. However, in this agreement, as in mostothers, the dollar amounts scheduled as "value per pound U]OS"are selected with recognition of haulage and milling costs. Theprinciple underlying this practice is that the royalty owner is en-titled to a share of the value of products mined—but not to ashare of the value added by transportation and milling, to whichthe royalty owner is not a party. The other side of this coin is thatthe royalty owner expects to receive payment for all mine outputsaved or shipped, even though not all of the contained UjO, canbe extracted in a mill.
Private surface owner0.02.02 (sale price- hahaulage & milling per ton \
mill recovery rate
= °JL2($43- $2'
g g pmined pounds UjO« per ton/
0.92 0.181x20/
This is a typical surface owner's royalty, as compensation foraccess and inconvenience. It does not constitute payment for sur-face damage or for surface occupancy. Royalties to the owner ofmineral rights would be the subject of a separate and unrelatedagreement. Whether a surface owner's royalty qualifies as suchfor tax purposes is unclear.
Solution miningPrimary solution-mining of uranium has been rare in the
Grants region, but extraction of traces of uranium from pumpedmine water is commonplace. The recovery of uranium from solu-tions constitutes a situation in which the parameters usually ap-plied for royalty calculations become irrelevant or unworkable.Tons and mined grade have little meaning, and the attribution ofcosts between mining and milling becomes contentious. Manyroyalty agreements have no explicit provision for solution min-ing. Those that do generally specify a fixed percentage rate of thegross value of all product sold. This rate typically is 10 percent,yielding a royalty amount of $4.30 per lb from U3OS sold at $43.
Summary of royalty amountsA summary of the dollar amounts from the eight examples of
mineral-owner's royalties for underground mining is shown intable 2. Also shown are comparable results from calculationsmade on the same basis except for use of a U3O8 sale price of$17.40 per lb, which is the actual U.S. weighted-average 1978delivery price reported by DOE.
For most royalty agreements, calculations applying differentproduction grades require reference to individual schedules thatare too bulky to reproduce here. However, calculations of roy-alty amounts for different UjO, sale prices are easily made. Forexample, the royalty payable to the State of New Mexico on saUsat $60 per lb UjO,, with other parameters unchanged, would be
recipient
State of New MexicoNavajo Indian Tribe 1968Laguna Indian Pueblo 1970Navajo Indian Tribe 1971-72
Navajo Indian Tribe 1975
Land Company ILand Company 11Land Company 111
mean of above
U3O8 sale price per pound$43.00
$ 4.589.164.054.136.443.789.033.63
$ 5.60
$17.40
$ 1.382.761.541.25
1.731.532.191.12
$ 1.69
$6.70 per lb; however, such calculations really mean little. Theyfail to anticipate the higher production costs, including haulageand milling, which accompany a higher sale price. Also, theamount of the projected future royalty would have to be both in-dexed for inflationary effects and discounted to present value.
Severance taxesSeverance taxes are those taxes levied on removal of natural
products and are measured by value or quantity of material re-moved or sold. They are typically imposed by individual statesand exhibit variations in basis, rates, and allowable credits or ex-emptions. Some severance taxes pass under other names, such as"mining license," "occupational gross," and "resource excise"(Yasnowsky and Graham, 1978; Starch, 1979).
The State of New Mexico collects at least four taxes on ura-nium production. Gross-receipts or compensating tax, where ap-plicable, is additional. The primary severance tax is collectedaccording to the schedule in table 3, and no deductions are per-mitted. A reduced-rate tax is granted for production obligated tounmodified pre-1977 sales contracts if pass through of tax is notpossible.
New Mexico also imposes a resource-excise tax at the rate of0.75 percent of the product's sales value and an "oil and gas" taxof 0.0475 percent. An additional "tailings-stabilization" tax of10 cents per lb U,O, is collected on the first 10,000,000 lbs ofU)O8 produced at each mill; in practice, this tax is passed back tothe mine operator. The aggregate effect of the four productiontaxes is shown in table 4.
The total production tax is distinctly nonlinear, as can be seenin fig. 1. On a sale price changed by a factor close to 2.5, the tax
TABLE 3—SCHEDULE OF PRIMARY SEVERANCE TAX IMPOSED BY THE STATEOF NEW MEXICO ON URANIUM PRODUCTION.
severance tax rate per pound U3O8
1%5<r plus 1.6% of amount over $ 5.009tplus 2.0% of amount over 7.50
I4<tplus 3.0% of amount over 10.0029<tplus 4.0% of amount over 15.0049« plus 5.0% of amount over 20.0074Cplus 7.0% of amount over 25.00
109«plus 9.0% of amount over 30.001998 plus 12.5% of amount over 40.00324J plus surtax
price received per pound U3Ocontained in sold material
$ 05.0017.501
10.00115.00120.00125.001
30.001
40.00150.001 i
to
to
to
to
to
to
to
to
to
up
$ 5.007.50
10.00
15.0020.0025.0030.0040.00
50.00

337
TABLE 4—URANIUM SEVERANCE TAXES APPI ICABLE IN THE STATE OF NEWMEXICO.
U3OS sale price per pound
primary severance lax
resource-excise tax
oil and gas lax
tailings-stabilization tax
total per pound U3O8
$43.00
$ 2.365
.3225
.0204
.10
$ 2.808
$17.40
$ 0.386
.1305
.008
.10
$ 0.625
changes by a factor of 4.5. For mine operations that pay royaltiesto the State or to any Indian entity, the resource-excise tax iswaived. New Mexico's current production taxes on uranium aremuch higher than those of any other state.
Effects on minimum producible gradeEven within a particular province, generalization about the
economics of uranium production is difficult. Different physicalconditions at underground mines only a few miles apart may re-quire application of dissimilar mining systems with very differentcosts. Within a single mine, one area may require extensiveground support and dewatering not necessary other places. Ex-traction rates and royalty obligations also differ, as do millaccessibility and costs. A mine that produces from contiguousproperties must ordinarily keep separate, at a cost, the produc-tion from each segment. Mill-recovery rates for ores from loca-tions only a few miles apart can vary significantly. In short, theaverage mine, like the average family, does not exist outside ofstatistical tables.
Assessment of real effects, however, requires application toreal situations or to a model that adequately simulates reality.Because I am unable to disclose a representative number of realeconomic situations at uranium mines in the Grants region, thecalculations of economic effects presented herein apply to asingle typical uranium mine. It is a realistic model of uranium-production costs at underground mines in the Grants region as of1979.
The economic constraints are necessary in order to make a cru-cial measurement known as the operating cutoff grade (COG),which defines the economically minable grade limit of any ura-
oo
oto
— 3CD
S 2a>oc
2
o,o
OG-TS
5010 20 30 40U3O8 sole price, $ per Ib.
FIGURE 1—RELATIONSHIP OF URANIUM SEVERANCE TAXES OF THE STATEOF NEW MEXICO TO UJO, SALE PRICE; TS—tailings stabilization tax;OG—oil and gas tax; RE—resource excise tax; PS—primary severancetax.
nium deposit (Appelin, 1970). This quantity is depicted algebra-ically by
direct plus indirect mining costs + haulage cost +COG = milling cosi + royalty + severance taxes
sale price per pound UjO, x mill-recovery rate x 20with all costs expressed as dollars per ton. The grade thus derivedis a percentage of UjO,. It defines the diluted mining cutoff orbreak-even grade, at which the revenue obtained exactly equalsthe operating cost of production. In practice, a mine operatorhas no incentive to produce rock at exactly this grade. Tradingdollars on a one-for-one basis yields no benefit; however, aslightly higher grade should yield a small operating profit.
Although not news to those active in the industry, one shouldnote that the operating COG does not constitute a reserve COGfor an undeveloped uranium deposit. The formula has no provi-sion whatsoever for recovery of preproduction expenditures,which include property acquisition, exploration, and mine con-struction. The formula assumes that the presence of a reserve at agrade sufficient to amortize these costs and to provide return ofthe investment of tens to hundreds of millions of dollars hasalready been established. The operating COG defines an in-cremental reserve which must repay only the ongoing cost of pro-duction.
The operating-COG formula makes it evident that royalty andseverance taxes affect COG exactly as do other costs of produc-tion. For the present purpose of establishing an actual COG, anarithmetical complexity is that most royalty agreements specifyrates or unit payments which vary according to grade, and gradeis what we seek to specify. Identification of COG thus entailseither the application of simultaneous equations or formidabletrial-and-error tedium. For present purposes, this complexity canbe avoided by applying a royalty schedule, that of the State ofNew Mexico, under which royalty rate and unit amounts do notvary with grade. This simplification is legitimate, because theState's royalty amount is close to the weighted-average regionalmean. Formula amounts and resultant COG are
COG = SI.48+ 2.24+ 19.00 + (4.58 + 2.49) x 0.110 x 20 x 0.92$43.00x0.92x20
= 0.110 percent U,O,By applying other COGs and allowing royalty and severance
taxes to vary, we find that COG will increase to 0.120 percentUjOg if (other items being unchanged) royalty and severancetaxes increase by a combined amount of $7.91 per ton mined, or$2,995 per 1b recovered U,O,. Similarly, COG will decrease to0.100 percent UjO, if royalty and severance taxes decrease by acombined amount of $7.91 per ton mined, or $3.59 per lb recov-ered UjO,. These findings are expressed in table 5.
Examples of effectson producible reserves
Measuring the effect of each of the three exemplary COGs at areal uranium deposit in the Grants region is instructive. Table 6and fig. 2 depict in both tabular and graphic form the estimatedcontent of an actual uranium deposit in the Westwater CanyonMember of the Morrison Formation. The estimate was prepared
TABLE 5—OPERATING CUTOFF-GRADES RESULTING FROM CERTAIN ROYALTYAND SEVERANCE-TAX AMOUNTS, with all other operating costs remainingconstant as specified in text.
combined royalty and severance-taxamount per pound U3O8 recovered
cutoff grade(COG)
$10,0657.073.478
0.120% U3O8
0.1100.100

338
TABLE 6—ORSAC ESTIMATE BY U.S. DEPT. OF ENERGY OF U 3 O S CON-TENT IN A URANIUM DEPOSIT IN n ; GRANTS REGION, showing quantitiesavailable at specified cutoff gr (COG); entries under tonnage repre-sent the quantity of rock in wi .1 the corresponding pounds of U3O8are contained.
.40
tonnage abovecutoff grade
5129562
4960126
4707436
4379266
3994492
3577041
31S0487
2734418
2343149
1986133
1667860
1389557
1150044
946581
775568
633074
515183
418214
338831
274097
221476
178810
144286
116394
93889
75746
61128
49355
39874
32239
26088
21132
17135
13911
averagegrade
.095
.098
.102
.107
.113
.119
.127
.135
.143
.151
.160
.169
.179
.188
.198
.207
.217
.227
.237
.247
.257
.267
.277
.287
.297
.308
.318
.328
.338
.348
.359
.369
.379
.389
poundsU3OS
9752051
9699875
9572063
9341307
8994664
8535538
7981086
7357315
6693260
6015741
5348022
4709132
4111398
3562778
3067347
2626016
2237355
1898351
1605038
1352975
1137600
954462
799372
668490
558361
465924
388496
323755
269698
224616
187054
155780
129756
108109
cutoffgrade
.010
.020
.030
.040
.050
.060
.070
.080
.090
.100
.110
.120
.130
.140
.150
.160
.170
.180
.190
.200
.210
.220
.230
.240
.250
.260
.270
.280
.290
.300
.310
.320
.330
.340
by DOE using the ORSAC (Ore Reserve Statistical AnalysisCalculation) data-processing program (Grundy and Meehan,1963), which embodies moderately sophisticated statistical pro-cedures and which has been widely applied by DOE and its prede-cessors for many years. ORSAC estimates compare very wellwith knowledgeable manual estimates, and their mathematicalvalidity is not in doubt (David, 1977, p. 39-45). The ORSACestimate shows clearly that the amount of uranium available in adeposit changes greatly at different COGs.
The uranium deposits of the Grants region do not consist ofhomogenous masses of uniform mineralization, but rather of as-semblages of mineralization of highly variable grades. Hence,mining of uranium-bearing rock in a deposit must be—and is—highly selective. A uranium deposit is sampled in great detailfrom the mine workings, and all areas in which the mineraliza-tion does not meet cutoff grade are left unmined.
The ORSAC estimate is particularly suitable in this instancebecause it provides a summary of the UjO, content of the in-place resource or reserve present at incremental COGs. Conse-
.20
s.10
•
IN-PLACE U3°86 8 10
millions of poundsFIGURE 2—RELATIONSHIP 01 ESTIMATED U,O, CONTENT IN A URANIUM
DEPOSIT IN THE GRANTS RboioN TO CUTOFF ciRADE (ORSAC estimate byDOE).
quently, real effects of different COGs can be measured. Forsimplicity, certain production effects, including mine-extractionfactor, mining dilution, and present value of future receipts, canproperly be omitted from the calculations because they are vir-tually constant for each of the three COGs considered.
At this uranium deposit, the total revenue in combined royaltyand severance tax at COG = 0.110 percent UjOB will be
5,348,022 x 0.92 x $7.07 = $34,785,674.This amount represents the present status of royalties and sev-
erance taxes in the Grants region for UjO8 sold at $43.00 per lb.If the combined amount of royalty and severance tax were in-creased to $10,065 per lb recovered UjO,, the total revenue inroyalty and severance tax would be
4,709,132 x 0.92 X $10,065 = $43,605,620.The revenue gained by the higher royalty and severance tax
would be $8,819,946. However, the implementation of those roy-alty and tax increases would dictate that the portion of thedeposit having a grade from 0.110 to 0.120 percent UjO, shall beabandoned in the ground instead of being mined. The value ofthis resource is
(5,348,022 - 4,709,132) 0.92 x $43.00 = $25,274,488.The value of the 638,890 lbs of lost U,O, is some $16.5 million
more (nearly three times greater) than the revenue gained by thehigher royalty and severance tax.
If, alternatively, the combined amount of royalty and sever-ance tax were reduced to $3,478 per lb U,O8, the COG wouldbecome 0.100 percent UsO8, and the total revenue in royalty andseverance tax would be
6,015,741 X 0.92 X $3,478 = $19,248,927.The revenue lost by the lower royalty and severance tax is
$15,536,747. However, the reduced rates would make possiblemining the portion of the deposit having a grade from 0.110 to0.100 percent UjO,, and the value of that gained reserve is
(6,015,741 - 5,348,022) 0.92 x $43.00 = $26,414,964.The value of the additional 667,719 lbs of minable U,O, is
some $10.9 million (70 percent) greater than the revenue lost bythe lower royalty and severance taxes.
The calculations speak for themselves. This uranium deposit issomewhat smaller than that of the average operating mine in theGrants region, but its grade-distribution character is quite typ-ical. For other deposits which have larger proportions of low-grade resources, the effects of royalty and severance taxes onproducibility are even greater.

339
The economic results in the two cases calculated above portraynot total mine-output value, but only the value difference in thetrade offs between revenue as royalty and severance taxes andrevenue from incremental mine production.
Regional economic effectsThe foregoing analysis is not precisely representative of the
economic situation at each large uranium deposit in the Grantsregion. For the reasons described, every mine and undevelopeddeposit is an individual case. Nevertheless, the results presentedare representative of the region as a whole, and we can ex-trapolate these results to assess the magnitude of the regional ef-fects.
New Mexico is considered to have identified minable reservescontaining 735,400,000 lbs U,O, in deposits producible at a for-ward cost of $30 per lb U,O, (U.S. Dept. of Energy, 1978b, p.39), essentially all of which are in the Grants region. (Rememberthat forward cost is hardly the total production cost; it only in-cludes costs not yet incurred.) The actual deposit discussed, at the0.110 percent UjO, COG, contains approximately 4,706,300 pro-ducible lbs UjO, (5,348,022x88 percent mine extraction). Thisfigure represents 1/156 of the region's producible reserves, asreported by DOE, without provision for any deposits presentlyundiscovered.
Extrapolation on a proportionate basis suggests that (at 92 per-cent mill recovery) the region-wide effect of the increased royaltyand severance taxes would amount to a direct net loss of some$2.37 billion and that the region-wide effect of the decreasedroyalty and severance taxes would amount to a direct net gain ofsome $1.56 billion, provided that all of the identified recoverable
• reserves were produced and were sold at a weighted-average priceof $43.00 per Ib UjO,. The indicated direct economic benefit ofthe reduced rates over the increased rates would be $3.9 billion.
Of course, one can quickly discern that the pocket the dollarsgo into in the one alternative is not the same pocket that they gointo in the other. This observation, although factual, is probablyirrelevant and is certainly inadequate as a basis for political andtaxation policy, because dollars never remain in one pocket.Governments disburse all the money they receive, as do miningcompanies. Money circulates, and the economic-multiplier effectmakes the total social benefit or loss several times larger than theimmediate monetary difference. A recent study (Learning, 1979)of the uranium-mining industry in Texas found that, in the inter-val 1976 through 1978,adirect in-state economic benefit of $54.6million led to a total economic benefit of $372.6 million, for an
economic multiplier of 6.8. A reasonable expectation is that themultiplier effect in New Mexico is similar.
ConclusionIn uranium mining, as with other endeavors, conservation is
fostered by conditions that permit maximum recovery of the na-tural resource. The economic producibility of the uraniumdeposits in the Grants region is very sensitive to the cost of pro-duction. Royalties and severance taxes must be designed withgreat care to insure that the maximum total benefit is obtained.New Mexico's present royalties and severance taxes on uraniumare at a level at which the overall economic consequences willamount to losses of billions of dollars.
POST-MANUSCRIPT NOTE—In February 1980, subsequent to thepreparation of this article, the New Mexico Legislature enactedand the Governor signed a measure providing sharply increasedseverance taxes on uranium. Hence, the tax rates and amountsdescribed above as "current" no longer are so, and the gradesand quantities of U,O» which will now be abandoned are in-creased.
ReferencesAppelin, C. W., 1970, Ore reserve definilions and standards: Grand
Junction, Colorado, U.S. Atomic Energy Commission, open-file rept.,l i p .
David, Michel, 1977, Oeoslaiistical ore reserve esiimation: Amsterdam,Elsevier Scientific Publishing Company, 364 p.
Grundy, W. D., and Meehan, R. J., 1963, Estimation of uranium orereserves by statistical methods and a digital computer, in Geology andtechnology of the Grants uranium region, V. C. Kelley, compiler: NewMexico Bureau of Mines and Mineral Resources, Mem. IS, p. 234-243
Hoover, H. C , and Hoover, L. H., translators, 1950, De re metallica byGeorgius Agricola: New York, Dover Publications, published 1556 inLatin; original translated in 1912, 638 p.
Learning, G. F., 1979, The economic impact of the south Texas uraniumindustry: Marana, Arizona, Southwest Economic Information Center,60 p.
Starch, K. E., 1979, Taxation, mining, and the severance tax: U.S.Bureau of Mines, Inf. Circ. IC8788,65 p.
U.S. Department of Energy, 1978a, Survey of United States uraniummarketing activity: Washington, D.C., U.S. Department of Energy,RA-0006,27 p.
, 1978b, Statistical data of the uranium industry: Grand Junction,Colorado, U.S. Department of Energy, GJO-100(78), 91 p.
Yasnowsky, P. N.p and Graham, A. P., 1978, State severance taxes onnonfuel minerals as of January 1, 1978: U.S. Bureau of Mines, Inf.Circ. IC8774, 6 p.

r 340
URANIUM SOLUTION MINING—COMPARISON OFNEW MEXICO WITH SOUTH TEXAS
by W. D. Conine, Mobil Oil Corporation, Box5444,Denver, Colorado 80217
AbstractIn-situ uranium-leaching or solution-mining operations are
currently underway in both south Texas and Wyoming. MobilOil Corporation is in the process of applying solution-miningtechnology, such as that developed at the O'Hern facility insouth Texas, to uranium orebodies located near Crownpoint,New Mexico. The O'Hern facility uses an alkaline-leach processto bring the uranium to the surface, where it is removed fromsolution using ion-exchange resin and chemical precipitation.Line-drive and five-spot well field patterns are used to inject andrecover the leach solutions. Although details of ore occurrence inNew Mexico differ from those in south Texas, laboratory,engineering-design, and field-hydrology tests indicate that solu-tion mining of uranium should be feasible in New Mexico. Todetermine the commercial feasibility, Mobil is proceeding withthe construction of pilot-plant facilities for a 75-gallon-per-minute (gpm) test at an orebody near Crownpoint. The pilot testwill use five-spot patterns at various spacings for production ofuranium-bearing leachate. Initial surface processing will be thesame as that used in south Texas.
IntroductionMobil and several other companies have successfully pilot-
tested in situ uranium leaching or solution mining—these termsare interchangeable—in south Texas, and most of these com-panies have either already expanded to commercial-scale pro-duction, or, like Mobil, are constructing such plants. Severalcompanies also are conducting uranium solution-mining tests inWyoming.
Mobil has made some preliminary feasibility studies, includinglaboratory, engineering-design, and field-hydrology tests forsolution mining in New Mexico. Based on the results of thesestudies, no reason exists for doubting that solution mining can beapplied in New Mexico. However, a definitive evaluation can re-sult only from a field pilot test. Pilot-test wells have been drilledand completed at three locations near Crownpoint, New Mexico.Mobil has applied for the permits to conduct tests at the first ofthese sites.
This paper focuses on Mobil's O'Hern plant in south Texasand the major conclusions drawn from this operation. Pilot-testplans for New Mexico are described, emphasizing some of themajor differences between these plans and solution mining insouth Texas.
Pilot-test objectivesA pilot-test operation such as that planned for New Mexico
has three primary objectives: The technical feasibility of solutionmining at specific sites must be determined, the environmentalimpact of solution-mining operations must be established, andthe overall resource recovery and economics of the process mustbe evaluated.
Each objective comprises several elements. For an example oftechnical feasibility problems, the ore characteristics vary fromsite to site. Ore teachability has to be determined as a function ofthe kind of chemicals that are being used. Solution-flow ratesthat can be achieved in the formation must be determined, asmust the uranium concentrations (as a function of time) that areexpected from the recovery wells. These flow rates, uranium con-centrations, and the overall U3O, recovery are a function of thewell spacing and completion techniques used in those wells. The
choice of oxidant, the pH, and the optimum chemical concentra-tion must be adapted to the uranium ore at each site. Finally,any potential operating problems need to be identified (for ex-ample, at the O'Hern plant in south Texas, a primary operatingproblem has been calcite produced from lime in the ore-bearingformation).
In establishing the probable environmental impact, companiesmust demonstrate to regulatory agencies and others that theleachate can be confined underground to the production areathat is being mined. The overall water appropriation from theaquifer must be determined, in addition to determining the dis-charge volume and the identity and concentrations of ions in thewaste-disposal streams. The surface disturbance, socioeconomiceffects, and the overall ground-water restoration requirementsare definitely a part of establishing the total environmental im-pact.
The overall recovery efficiency of this process and the esti-mated recoverable uranium reserves must be determined. Fromthe pilot-test operations, well and chemical costs can be estab-lished. Engineering-cost studies will determine the plant capitalcosts, and from that, the solution-mining economic assessment.This assessment can be compared with alternative productionmethods (underground or pit mining) to determine the most ap-propriate production method for the location.
South Texas solution-mining operationsMost of the uranium in the coastal uranium belt of south
Texas has been found from the Rio Grande north to the area ofthe Conoco project, a conventional mill and open-pit mine nearFalls City (fig. 1). A significant number of solution-miningoperations are currently underway in south Texas.
Mobil is carrying out a solution-mining operation at theO'Hern project, which is about 50 mi east of Laredo. CorpusChristi is approximately 120 mi east of the O'Hern property.About 3 mi away from the O'Hern lease are the Holiday and ElMesquite leases, where a 2,000-gpm (650,000 lbs UjOg per year)commercial plant is under construction.
Six or seven mi north of the O'Hern plant, Wyoming Mineraloperates the Bruni commercial plant. Union Carbide has a com-
CHEVRONCONOCO s
NELL - ^
L—-./WYOMING MINERAL
PIEDRE LUMBRE
UNIONWYOMING MINERAL — CARII0E
)
I
O'HERN 5^2
T TSLIOAYMOBIL EL MESQUITE
EtiEHGY MINERALS DIVISION
S. TEXASREGIONAL
INDEX0 MILES , 0
0 KILOMETERS 1 0 °
FIGURE 1—INDEX MAP OF SOUTH TEXAS
LOCATION OF URANIUM OPERATIONS.
URANIUM BELT SHOWING

341
mercial operation at the Palangana salt dome near Benavides,Texas. Mobil began a pilot-test operation at the Brelum-PiedreLumbre property in 1979, using a 75-gpm portable unit similar tothe one proposed for the tests in New Mexico.
The largest solution-mining operation currently being con-ducted in south Texas is U.S. Steel in operation near the town ofGeorge West, where they are producing from their Clay Westand Burns Ranch properties. Wyoming Mineral also has anoperation at the Lamprecht property, a little north of GeorgeWest.
Mobil will be constructing a 400-gpm commercial plant on aproperty called Nell just west of the town of Pawnee, Texas. In-tercontinental Energy has been producing from two locations:the first is their Pawnee Project and the second is their ZamzowProject near Ray Point, Texas.
In-situ leach processat O'Hern plant
A simplified flow diagram of the process used by Mobil atO'Hern is shown in fig. 2. Essentially the same alkaline-leachprocess is used by other operators in south Texas, with someminor variations.
The pregnant leachate from the production wells is pumpedacross a train of three upflow ion-exchange columns, and mostof the barren leachate is reinjected after bringing the solutionback to the required chemical strength.
Once the ion-exchange resin in the lead column is loaded withuranium, the uranium is stripped from the resin with an eluantcontaining concentrated brine with carbon dioxide added. Sodaasii or sodium hydroxide is sometimes added to the fresh eluantto control pH in the 9.5-10 range. From elution, the concentratedpregnant eluate goes to direct chemical precipitation in a three-stage, five-vessel process. Hydrochloric acid is added in the firststage to break up the uranium carbonate complex and to driveCO: out of solution. As the CO* comes off, the eluate moves toa second tank to complete gas evolution. Hydrogen peroxide isadded in the third tank to begin precipitation of uranium per-oxide. Sodium hydroxide is added in the fourth tank to adjust thepH and achieve optimum precipitation conditions. The fifth tanksimply provides residence time to allow precipitation to proceedto completion. In current operations, the precipitated slurry ispumped to another vessel where the solids settle to the bottomand the clear decant is recycled.
Fig. 3 is a recent aerial view of the O'Hern plant near Bruni,Texas. This operation has been expanded from a pilot test to asmall-scale commercial plant. Four well fields, or grid patterns,feed leachate to the plant. The plant is operated with two leachate
» » C V MINERALS DIVISION
IN-SITU URANIUM LEACHING PROCESSNaCIco2
DISPOSAL
:>-;-:-LESS PERMEABLE FORMATION:-»--I- I -
G 3 LEACHATE CIRCUIT
1 = 1 RESIN TRANSFER
t = H ELUTION CIRCUIT
C D URANIUM
FIGURE 2—FLOW DIAGRAM OF IN-SITU URANIUM LEACHING PROCESS USEDAT THE O' HERN PLANT, SOUTH TEXAS.
FIGURE 3—AERIAL VIEW OK MOBIL O'HKRN SOLUTION-MINING IAIIUTYNEAR BRUNI. TEXAS.
circuits, including two ion-exchange trains. One ion-exchangetrain takes feed from grids I and II, which initially used NH, forpH control; the second ion-exchange train takes feed from gridsIII and IV, where NaOH is occasionally used for the same pur-pose. When restoring ground water in these grids following oredepletion, differences in restoration requirements will be deter-mined as a result of use or nonuseof NHi.
The waste-disposal ponds in fig. 3 are lined with 30-mil chlor-inated polyethylene liners; some precipitated calcite can be seenaround the edges of the pond. The laboratories, administrativeoffices, COj tank, and hydrogen-peroxide tank are locatedaround the plant perimeter. Other vessels are the ion-exchangecolumns, precipitation tanks, solution surge, and storage tanks.
Fig. 4 is a close-up view of the fiberglass upflow ion-exchangeand elution columns, including the resin-transfer lines to andfrom the elution tanks. These columns are operated at up to 12gpm per sq ft of cross-sectional area and probably could operateat higher flow rates with additional flow capacity from the wellfields. Five precipitation tanks that are also of fiberglass areshown in fig. 5. The acidification-peroxide precipitation processworks well, but it requires close control of pH and tank agita-tion.
Four well-field grids are now operating at O'Hern. Fig. 6shows grid III, placed on stream in November 1977. This grid is astaggered line-drive pattern, with a line of eight injection wellsdown the center and 19 producing wells on the perimeter of thegrid-test area. This grid represents a departure from the five-spotwell patterns that were used for grids I and II and that will beused in New Mexico. The new grid pattern was used because ofthe orebody configuration at this location and for the opportu-nity to evaluate new grid patterns during field pilot testing. Thepregnant leachate goes to headers where the flows from thevarious wells are commingled and piped to the plant.
FIGURE 4—ION-EXCHANGE AND ELUTION COLUMNS AT O'HERN FACILITY.

r 342
FIGU RE 5—PRECIPITATION TANKS AT O'HERN FA( ILITY.
Observations and conclusionsfrom south Texas operations
Performance data from the O'Hern plant is proprietary; how-ever, some general observations and conclusions are possible.Most solution-mining operators in south Texas have observedrecoveries in the range of 60-85 percent. Mobil has no reason todisagree with this observation. The rate of uranium recovery ob-viously varies with pattern spacing, flow rates, and ore geometryand permeability variations. This recovery is somewhat less thanthe usually reported resource-recovery range of 80-90 percent forunderground mining. However, the solution-mining reserve basecan be significantly greater since the leachable ore does not in-clude the same restrictions of underground or surface mining:grades, thickness, and vertical and horizontal continuity.
In the southern end of the coastal uranium belt, calcile controlis a problem. Various operators, including Mobil, have triedmany methods of solving this problem. The solution seems to beminimizing the problem, rather than eliminating it, by control-ling pH with the leach chemicals and by limiting pH changeswhere calcitc precipitation causes a severe operating problem.
The depletion profile for leach patterns is a key parameter inplant and well-field design because it affects the schedule ofbringing new patterns on stream and dictates the plant volumecapacity in the leachate circuit. Experience has shown that, onthe average, individual pattern-depletion times vary from I io 3years, but some patterns can continue to produce low-grade solu-tions even longer.
Tests of 50-ft, 70-ft, and 100-ft five-spot patterns, plus 50-by-80-fi staggered line-drive patterns have been run at O'Hern;whether ultimate recovery is affected by spacing or geometry in
CHURCHROCKMINING DISTRICT
UNITED 1 \MUCLEA«"*V^
mSALLUP
MILES 1 0
° KILOMITIM
PIONEERNUCLEAR
C X - * f HILLIf S
MOBIL CXOWNPOINTSOUTH
p ^ r a S i ^ ^ ^ M O H U M E N T
UNITED ' NCONOCONUCLEAK/T.V.A. AMBROSIA LAKE MIKING DISTRICT
Sinn McGEE
UNITED N U C L E A P T ^ ^HOMESTAKE
ANACONDA
GRANTS
* \ KEMMcCEE C *
<\GULf («T. TAUOm r y CONOCO
A IIENNAIE •DNTAND
SOHIO/RESEKVEtClARI
URANIUM MIHt»
X C IN COMTHUCTIOK
X F rnoroiH
UMHIUM MILL*
C3 OPEHATINO
IMIHY MMUMLf DIVISION
GRANTSURANIUM BELT
• ELECTED COMPITITOI ACTIVITIES
FIGURE 7—INDEX MAI> i» GRANTS MINERAL BELT, SHOWING LOCATION OFPROPOSED SOLUTION-MINING OPERATION NEAR CROWNPOINT IN RELATIONTO OTHER URANIUM OPERATIONS AND DISTRICTS.
the range tested is unknown. Perhaps some loss of recovery mayoccur as well spacings increase. Well spacing is very importantfrom an economics viewpoint, particularly as deeper orebodies,such as those in New Mexico, are developed.
Laboratory data reported in the literature indicate that NH>may enhance teachability, or at least leaching rates, in some ores;however, the data are not conclusive. Mobil has tested both NH,and non-NHi leachates at the O'Hern facility, but any conclu-sions regarding a direct comparison would be premature becauseof different field conditions (orebodies and leaching times). Akey factor in NHi use is the ground-water restoration require-ment. Two test areas have now been restored to levels consistentwith original conditions. The four grids have not begun therestoration phase because uranium is still being produced.
Mobil has tested three oxidants—NaCIO,, HjO;, and O;—atthe O'Hern pilot plant, and all of them will leach uranium.NaCIO, appears somewhat slower than the other two. HJOJ andO; appear equally effective from the data acquired. Peroxide iseasier to use than gaseous oxygen, but it is much more expensive.Oxygen use can be limited by solubility in shallow, low-pressureorcbodies. Mobil intends to continue using both of these ox-idants, fitting their use to the particular circumstances at eachsite.
New Mexico solution-mining operationsFig. 7 is an index map of the Crownpoint area of New Mexico.
The town of Crownpoint is located between Mobil's Crownpointand Monument properties. Several other facilities and miningdistricts also are shown. Mobil is planning to initiate pilot tests atthree sites on the leases near the town of Crownpoint.
Table I compares some of the characteristics of the ore zones
TABLE 1—COMPARISON OF ORE-ZONE CHARACTERISTICS BETWEEN CROWN-POINT AND SOUTH TEXAS.
FIGURE 6—WELL FIELD GRID III AT O'HERN FACILITY; grid III is a stag-gered line-drive pattern, as opposed to the more conventional five-spotpattern (the oxygen tank for injecting oxidant into grid III is at left).
depth (ft)
hydrostatic pressure (psi)sand thickness (ft)permeability (md)porosity (%)calcium carbonate (%)clay (%)
Crownpoint
1,900-2,000
740
30-40
400-1,500
16-24
4-8
1-3
south Texas
400-700
150
8-35
500-2,000
28-34
15-20
10-20

343
FIGURE 8—TRAILER-MOUNTED PILOT PLANT PROPOSED FOR USE AT
CROWNPOINT; ion-exchange columns are on trailer in center, prccipita-lion tanks arc on trailer to right.
FIGURE 9—WELL FIELD (FIVE-SPOT PATTERN) AT CROWNPOINT TEST SITE
at Crownpoint with those in south Texas. Obviously, the ore ismuch deeper at Crownpoint, averaging about 2,000 ft, comparedwith 400-700 ft in south Texas. Because of the greater depth,hydrostatic pressure in the aquifer is much higher at Crown-point—740 psi compared with about 150 psi in south Texas. Thesand thicknesses are greater at Crownpoint—30-40 ft comparedwith 8-35 ft in south Texas. In some areas at Crownpoint,uranium occurs in several sands over vertical intervals up to 150ft thick. The permeability at Crownpoint is about the same as inthe O'Hern area: a few hundred to perhaps 1,500 millidarcies.Porosity is lower, averaging 20 percent in Crownpoint comparedwith about 30 percent in south Texas. Two significant advantagesat Crownpoint are less lime and less clay than in south Texas,causing fewer calcite-precipitation problems.
Fig. 8 shows a close-up view of the 75-gpm portable pilot unitMobil intends to use at Crownpoint. The U.S. Bureau of Minesion-exchange columns are the tall structures located behind theleft trailer. The precipitation tanks arc located on the righttrailer. The remainder of the tanks provide solution-surge capac-ity or chemical storage. The advantage of this type of operationis that it is compact, easy to operate, portable, and requires littlemanpower—making it ideally suited for testing at several sites.
The first pilot-test site at Crownpoint consists of 13 injectionand production wells that form four contiguous five-spot pat-terns and seven monitor wells (fig. 9). Both 100-ft and 200-ft pat-tern spacings will be used in these tests. Because of the cost tocomplete wells at this depth, determining whether good UjO,recovery can be achieved at the wider well spacing is essential.The wells have 5 Vi-inch-diameter steel casing to the top of theore-bearing zone, which is the Westwater Canyon Member of theMorrison Formation, and 5'/2-inch fiberglass casing opposite theore zone. The fiberglass casing is perforated in the injection, pro-duction, and monitor wells.
The first pilot test will use the same process used at the O'Hernplant. In subsequent pilot tests at one of the other locations, theprocess may be modified to adapt to a different ore characteris-tic, namely the presence of carbonaceous material in the voidspaces between sand grains.
Permits and licensesThe permitting procedure for conducting the in-situ pilot
testing in New Mexico has been rather lengthy and complex.
Table 2 summarizes the number of permits, types of permits, andthe different agencies involved in their issue. TheU.S. GeologicalSurvey, with concurrence from the Bureau of Indian Affairs,issued permits for well drilling, completion, and hydrologictesting. Similar approval also was obtained from the NationalPark Service and from the New Mexico State Engineer's Office.The Intent to Discharge, Source Materials License, and Dis-charge Plan were issued or approved by the New Mexico En-vironmental Improvement Division. Archeological clearancesfor this site and for the plant were obtained from the NationalPark Service and also from the State Historic PreservationOfficer. A water appropriation was obtained from the StateEngineer's Office. Finally, Mobil is still seeking approval of thepilot-test Interim Mining and Reclamation Plan from the U.S.Geological Survey. The Bureau of Indian Affairs must concurwith the USGS on the mining plan.
This last approval should be obtained soon, allowing start-upof the first pilot test in the near future. Mobil hopes to initiate theother two tests in 1980, after the necessary permits and approvalsfor these sites have been obtained.
TABLE 2—REQUIRED PERMITS AND ISSUING AGENOI -.S IOK IN SITU I IA< HI'l l . 0 I I I S I
UJ
.5 5o .S £ 8 g 6
S l< I* M3 CD Z Z
s 5 S '
• 5 - 5 •
well drilling and completion permits
pilot test mine plan
notice of intent to discharge
source materials license (pilot test)
discharge plan
archaeological clearance
water appropriation
XX
XX
XXX

344
APPLICATION OF SOLUTION-MINERAL EQUILIBRIUMCHEMISTRY TO SOLUTION MINING OF URANIUM ORES
by A. C. Riese, Gulf Research and Development Company, 134 Union Boulevard, Suite 610, Lakewood, Colorado 80228, andC. J. Popp, New Mexico Institute of Mining and Technology, Department of Chemistry, Socorro, New Mexico 87801
AbstractModern methods of uranium solution mining are typically ac-
companied by gains and losses of mass through reagent con-sumption by rock-forming minerals, with subsequent formationof clay minerals, gypsum, carbonates, and iron oxyhydroxides.A systematic approach to alleviate such problems involves theapplication of leach solutions that are in equilibrium with thehost-rock minerals but in disequilibrium with the ore-formingminerals. This partial equilibrium can be approximated bysolution-composition adjustments within the systems K2O-A12O3-SiO2-H2O and NajO-AUOj-SiOj-HjO. Uranium ore containing0.15 percent U3O8 from the Gulf Mineral Resources Corpora-tion's Mariano Lake mine, the Smith Lake district of the Grantsmineral belt, was collected for investigation. Presented are atheoretical evaluation of leachate data and an experimental treat-ment of the ore, which contained mainly K-feldspar, plagioclasefeldspar, and quartz (with lesser amounts of micas, clay min-erals, and organic carbonaceous material). Small-scale ($ 1 kg)column-leaching experiments were conducted to model the re-sults of conventional leaching operations and to provide leachatesolutions that could be compared with solutions calculated to bein equilibrium with the matrix minerals. Leach solutions em-ployed include: I) sulfuric acid, 2) sodium bicarbonate, and3) sulfuric acid with 1.0 molal potassium chloride. The uraniumconcentrations in the sodium-bicarbonate leach solution and theacid-leach solution were about a gram per liter at the terminationof the tests. However, the permeability of the ore in the acidleach was greatly reduced, owing to the formation of clay min-erals. Uranium solubility in the leach column stabilized with thepotassium-chloride solution was calculated from leachate com-positions to be limited by the solubility of carnotite.
IntroductionThe increasing demand for uranium as a fuel for the produc-
tion of electrical energy, and the subsequent escalation in pricesince the transition from a government-controlled market to acommercial one, has dictated the increasing interest in the extrac-tive metallurgy of uranium. Sharp increases in fossil-fuel costshave contributed directly to the competitiveness of uranium as anenergy-fuel alternative; however, uranium production is limitedto available resources and the effectiveness of current miningtechniques.
Uranium raw-material production requirements for 1985 arepredicted to be three to four times the current production capa-city (Nininger, 1974; Rosenbaum, 1976). In order for future pro-duction expectations to be met, current research in extraction anddevelopment must be accelerated so that reserves in low-grade,presently noncommercial uranium deposits can be utilized.
This paper discusses laboratory-scale extraction of uranium bysolution leaching from a moderately low grade uranium ore (0.15percent U3Og) for the purposes of: 1) determining the extent ofsolution-mineral equilibrium and 2) attempting to minimize in-teraction of the lixiviant with the major rock-forming mineralsof the studied sample (Riese, 1978). An understanding ofsolution-mineral interactions enables leach solutions to bedesigned in a systematic way that minimizes problems, such asneutralization and porosity changes, and can make eventualrestoration easier if there is less alteration of the host rock.
The series of tests described in this paper were undertaken todetermine the extent of leach solution-rock interactions withuranium-bearing ore obtained from Gulf Mineral Resources Cor-
poration's Mariano Lake mine. Leach solutions of an acidic(H2SO4-sulfuric acid) and basic (NaHCOysodium bicarbonate)nature were tested, in addition to a leach solution containing po-tassium chloride and sulfuric acid (KC1/H2SO4). The latter solu-tion was chosen in an attempt to equilibrate the aqueous phasewith the rock-forming silicate minerals and minimize adverse ef-fects such as clay formation, porosity loss, and lixiviant loss(Beane and Popp, 1977).
A sample of ground water was obtained in the mine from theore-bearing Poison Canyon sandstone to determine the extent towhich the ground water is equilibrated with the rocks. In con-junction with the ground-water evaluation, a leach column wasrun using distilled water. This column was intended as a controlin order to compare results wiih those obtained from the groundwater flowing through the ore formation. These tests were con-ducted using many hundreds of pore volumes so that steady-stateconditions could be achieved as rapidly as possible.
These tests were not conducted under conditions which wouldallow either leaching efficiency or kinetic data to be obtained.The purpose was to apply thermodynamic considerations to therock-solution interactions.
ACKNOWLEDGMENTS—We wish to acknowledge the encourage-ment and many useful suggestions offered by the staff of GulfResearch and Development Company. Special acknowledgmentis made of the generosity shown by the management of Gulf,who provided financial support for the work and allowed the useof samples from the Mariano Lake mine.
Theoretical evaluationThe whole-rock mineralogy and coexisting solution chemistry
of the ore can be ' "^ximated by the chemical systemsK2O-AI2O,-SiO2-H2O a... .a2O-Al2O3-SiOrH2O. Phase equi-libria in these chemical systems are represented graphically interms of the activities of aqueous components. Solution compo-sitions are plotted on activity diagrams in which the activityratios of MgV(H^H, CaW(H+)2, K+/H+ or Na+/H+ areplotted versus the activity of H4SiO4. Boundaries betweenmineral species are determined by the appropriate chemical re-actions and their equilibrium constants. Phase-equilibriadiagrams used in this report are constructed by assuming sto-ichiometric phase compositions, T = 25CC, P = l atmosphere,aH2O= ' -0. and conservation of A12O3 in reactions definingequilibrium boundaries. Thermodynamic data used in the calcu-lation of the equilibrium constants are taken from Helgeson(1969), with the exception of muscovite, gibbsite, and pyrophyl-lite, which are from Ulbrich and Merino (1974). In the theoreticaltreatment of irreversible processes, partial equilibrium (equi-librium of the system, with at least one of the chemical processestaking place) between the minerals present and the solutions withwhich they are reacting is assumed to be maintained. Reactionkinetics of multiple mineral phases are ignored. However, theestablishment of partial equilibrium conditions permits thechanges in an aqueous phase in contact with a mineral as-semblage to be illustrated graphically on solution-mineralequilibrium diagrams. Theoretical considerations and applica-tions of such irreversible processes to geologic environments havebeen investigated extensively and are described in the literature(Hess, 1966; Helgeson, 1968; Helgeson and others, 1969,1970).
Activity-activity phase diagrams of the type shown (figs. 1-10)are used tc determine the mineral species in equilibrium with anaqueous solution. After the concentrations of the aqueous com-

345
ponents are converted to ion activities, solution compositions areplotted on the appropriate phase diagrams.
In a solution of known ionic strength, concentrations of aque-ous species present are converted to activities by a, = ^m;, wherethe activity coefficient y-, is calculated from the Debye-Hiickelequation (Garrels and Christ, 1965):
l + a° BII;
Here, A and B are constants characteristic of the solvent, a0 andZ correspond to the size and charge of the ion, and I is the ionicstrength. In aqueous solutions of particularly high ionic strength(>0.5), an extended form of the Debye-Hiickel equation must beused to calculate activity coefficients (Truesdell and Jones,1974). Stoichiometric activity coefficients for solution specieshaving lower ionic strengths K0.5) were calculated by the For-tran IV computer program WATEQF (Plummer and others,1976).
GeologyThe Mariano Lake orebody lies in sees. 11 and 12 of T. 15 N.,
R. 14 W., in the Grants mineral belt on the southern margin ofthe San Juan Basin in the southern part of the Colorado Plateauprovince. The geology of the Grants mineral belt is described inthe literature (Hilpert, 1963, 1969; Kelley, 1963; Santos, 1970;Moench and Schlee, 1969; O'Sullivan and Craig, 1973; Squyres,1970; Saucier, 1976) and detailed geology and mineralogy of theMariano orebody is described in other papers in this volume.Briefly, the Mariano orebody has a roll-front geometry that con-tains reduced rocks on the convex side and oxidized rocks on theconcave side of the roll. The ore is contained in the Poison Can-yon sandstone, which lies in the basal part of the Brushy BasinMember of the Morrison Formation.
Experimental proceduresGeneral procedure
In these experiments distilled water, sulfuric acid, sodiumbicarbonate, and pH ^ 4, 1.0 m (molal) potassium-chloride solu-tions were continually recirculated through small glass columnscontaining approximately a kilogram of disaggregated ore. In ex-periments designed to investigate acid consumption, sampleswere subjected to conventional leaching conditions by circulatingdistilled water, with the pH continually readjusted between 2.0and 2.5 with sulfuric acid. These solutions were then comparedwith those in which samples were treated with leach solutionscontaining 1.0 molal KC1 and acidified to pH 4.0. Finally, leachtests were performed with solutions containing 3.44 g/1 (gramsper liter) of sodium bicarbonate as lixiviant. In all of the tests, at-mospheric oxygen was used as a primary oxidant; the columnswere open to the air.
During these experiments, leach solutions were periodicallysampled and analyzed to monitor progressive change. Chemicalanalyses generally followed procedures outlined in Framson(1975).
Whole-rock and chemical analysesWhole-rock and solution chemical analyses for the elements
sodium, potassium, magnesium, calcium, aluminum, iron, man-ganese, molybdenum, titanium, and vanadium were performedwith a Perkin-Elmer Model 403 atomic absorption spectro-photometer. P.ock samples of 100 mg, ground to pass a 200-meshsieve, were digested in Bernas-type, teflon-lined pressure bombs(Bernas, 1973). Dissolution of samples was effected by a 4:1combination (3.2 ml:0.8 ml) of concentrated hydrofluoric andnitric acids with addition of perchloric acid (2 ml of 70 percent)where dictated by abundant organic material. Silica was analyzed
by both atomic absorption and spectrophotometric use of themolybdosilicate complex. Uranium was analyzed colori-metrically according to the procedure of Francois (1958). Sulfatewas determined gravimetrically as barium sulfate, and chloridewas determined by specific ion electrode. Eh and pH were mon-itored on a regular basis and measured with glass and platinumelectrodes. Total solution concentrations were then converted toactivities, taking into account Debye-Hiickel and ion-associationeffects. In the ore, water (+) and total carbon were obtainedfrom weight loss at 110cC and 900°C respectively.
MineralogyThe modal composition of the ore was determined by petro-
graphic and x-ray-diffraction analysis. Major phases includepotassium feldspar, plagioclase feldspar, and quartz with minormicaceous minerals and some sulfides as described in table 1.Minor amounts of clay minerals were identified by x-ray diffrac-tion and scanning-electron microscopy, and their semiquan-titative abundance was calculated by the method of Carrol(1970). Whole-rock chemical analyses were performed for sil-icon, aluminum, iron (ferrous and ferric), magnesium, calcium,sodium, potassium, titanium, manganese, molybdenum, sulfur,vanadium, uranium, phosphorus, and water content; the resultsare reported in table 2. From these results, normative mineral-ogies were computed by the C1PW system, in spite of the factthat this classification is strictly applicable only to primarymineral assemblages. The purpose of this normative calculationis to semiquantify the mineralogy in weight percent.
Leach columnsLeach columns used in the tests were small-scale bench-top col-
umns constructed from glass tubing, approximately 6 cm ID by50 cm long, mounted vertically. Solutions were pumped to thetop of the columns using Cole-Parmer masterflex tubing pumpsand allowed to gravity percolate through the ores into one-literfilter-flask reservoirs. These solutions were continually circu-lated in order to establish solution-mineral equilibrium as rapidlyas possible. Rubber stoppers with glass tubing were inserted inthe ends of the columns, and glass wool was used at the base ofthe ores to prevent the fines from washing from the columns.
Sample collectionMine water was collected as it drained from the long holes in
an area free of metal contact. The water was stored in plastic andplaced in a cooler for return to the laboratory. The Eh, pH, andbicarbonate were determined within 24 hours.
Fresh ore was obtained from the mine by breaking away por-tions of the wall in a newly opened section and placing thematerial in plastic bags from which the air was removed. The orewas then handled under nitrogen until the leaching tests were in-itiated to prevent pre-oxidation.
Results and discussionOre mineralogy
Uranium mineralization within the ore is interstitial and ap-pears from optical examination to be associated with the clayminerals, organic matter, or both. The precise uranium mineralis not known but is assumed to be either uraninite or coffinite,with coffinite the preferred designation. Coffinite has 'ueenshown to be the preferred phase in all aqueous environmentswhere the activity of SiO2 is greater than 60 ppm (Langmuir,1977). X-ray-diffraction patterns obtained from whole-rocksamples and clay fractions (<2 /nm) investigated did not revealthe presence of any uranium-bearing species, but the diffractionpattern of the 2-64 -m fraction did show several characteristiccoffinite peaks.

346
T A B L E 1—MlNERALOGlC ANALYSIS FOR MARIANO LAKE ORE AND X-RAY-DIFFRACTION ANALYSIS OF CLAY
MINERALS (less than or equal to 2 Mm).
Petrographic Analysis
Minerals
Quartz
K-Fe1dspar (Microcline)(Orthoclase)
Plagioclase Feldspar (Albite)(Anorthite)
Biotite
Sericite (Muscovite)
Pyrite
Hematite
Calcite
Clay + Organics
Gypsum
Sanidine
X-Ray Di f f rac t ion Analysis
Minerals
Kaolinite
Chlorite
Montmorillonite(Dioctahedral Smectite)
Norm (wt.%)
56
23
27
0.4
0.3
0.2
1
9
of Clay Minerals (
Weight,
88
7
5
Mode (Vol.%)
55-60
5-1010-15
3 (0.42 Ab.:0.58An.)
1
1
2-4
1
0.1
6
Trace
Trace
:- 2 m)
Ground waterThe major cations in the ground water are calcium and
magnesium, and the major anions are sulfate and bicarbonate(table 3). Traces of gypsum and calcite can be found in the hostrock, and the ground water is calculated to be in equilibrium withthese minerals. Activity-activity plots indicate that the ground-water composition is also controlled by equilibration with biotiteand clays.
Regarding silicate-mineral equilibria in normal ground-watersystems, plagioclase feldspar and mafic minerals such as biotiteare much more reactive than K-feldspar or quartz (Garrels,1967). Potassium ions and magnesium ions come chiefly frombiotite, and ground-water compositions are controlled by morereactive mineral phases, regardless of their relative abundances.Therefore, the clays and the micas, together with calcite and gyp-sum, control the ground-water composition.
The chief alteration product present within the ore is kaolinite;other clay minerals—illite, chlorite, and montmorillonite—arepresent to a minor degree. The plotted composition of the groundwater indicates equilibrium with kaolinite (fig. 1). Ground-watercomposition plotted on fig. 2 indicates apparent equilibrium withphlogophite (0.5 mole fraction magnesium) and kaolinite. Aslightly higher dissolved silica than the measured value of 9 ppm(aH4SiO4 = '0"3 8) concentration would allow the presence of Mg-montmorillonite, because changing log aH4Sio4 would change thephase boundaries of fig. 2. The stability of microcline depicted inthe potassium system apparently is fortuitous and the ground-
water chemistry is controlled by a more complex system(KjO-NajO-MgO-SiQz-HjO) than previously mentioned. Fromstudying the thin sections, one sees that microcline appears to bein equilibrium at the expense of the more reactive sanidine.
Ion exchange between ground water and clays of the mont-morillonite series offers an additional mechanism for equilibra-tion of the aqueous phase with a montmorillonite-type clay. Thecomposition of montmorillonite in equilibrium with the mea-sured value of dissolved sodium, calcium, and magnesium can becalculated (Helgeson and Mackenzie, 1970), and for this groundwater has the formula Nao.oi7Ca0.07Mg009Al?.33Si267010 (OHfe.This calculation corresponds to a sodium activity of 0.05 in themontmorillonite and agrees closely with the sodium activity inthe ground water.
Control-column leaching testA leach column was run in which distilled water was circulated
to establish a baseline determination of whether equilibriumcould be reached between solution and rocks in a short timeperiod and to compare the composition of this water to that ob-tained in the mine. A shake-flask test also was run for com-parison to the column test (table 4). The data for log aNa+ /aK+plotted on fig. 3 indicate that the control solutions are in equi-librium with a montmorillonite having an activity greater than0.1. A plot of the data for this column on an activity-activitydiagram 'fig. 1) for potassium shows that the solution is behav-ing as if in acid were added (see fig. 5); the solution pH in both

f 347
TABLE 2—WHOLE-ROCK CHEMICAL ANALYSIS FOR MARIANO LAKE.
Weight %SiO2
A12°3FeOFe2°3MgO
CaO
Na20
K2O
TiO2
MnO
MoS
V2°5U3°8H2O(+)
P2°5
+ co2
80.0
9.83
0.14
1.04
0.06
0.25
0.87
3.97
0.23
0.04
0.028
0.09
0.50
0.15
1.88
0.01
Total = 99.1%
TABLE 3—WATER CHEMISTRY. MARIANO LAKE MINE WATER.
Species ppm
Ca 234
Mg 55
Na 10
K 16
HCO3 139
S0 4 641
Cl 14
P0 4 0.00
N02 0.15
SI02 9
pH 7 . 9 2
Eh 605 mv
U 2 . 7
V 0.026
-4l o f l aH4SiO4
FIGURE 1—LOG a K + / a H + VERSUS LOG aH4sio4 DIAGRAM, WITH GROUND
WATER ( • ) , CONTROL COLUMN ( • ) , AND CONTROL SHAKE-FLASK
DATA ( • ) PLOTTED.
17
16
15
I 14is
s 11
n 13
12
11
10
PHLOGOPHITE
GROUND WATER
KAOLIN ITE , MUSCOVITE
MICROCLINE
4
log a K + / a H *FIGURE 2—LOG aM g2+/(aH + )2 VERSUS LOG aK + / a H + DIAGRAM WITH
GROUND-WATER DATA PLOTTED, LOG a H 4 S i O 4 = - 3 . 8 2 (9 PPM S i O 2 ) , ANDaM g2+ = 0 . 5 IN PHLOGOPHITE.

348
TABLE 4—EFFLUENT ANALYSES FOR MARIANO LAKE CONTROL COLUMN, FILLED WITH DISTILLED WATER; all dissolved species are in ppm, ex-cept Eh (in mv) and flow rate (in ml per minute).
Date
1-17
1-24
1-30
2-6
2-13
2-23
3-6
3-21
4-5
6-5
6-12
6-27
P1
5
6
6
6
6.
5.
5.
5.
4.
4.
4.
4.
H
.6
.7
.7
.2
.2
.8
,1
.0
5
1
2
1
1 = Corrected
Eh1
540
450
470
390
470
480
570
500
530
540
540
530
for
Na
2
11
12
3
2
15
6
11
15
4
5
4
.1
.2
.2
.4
.3
.7
.5
.6
.8
K
2,
5,
3.
4.
3.
4.
13.
18.
10.
9
9
0
.4
.0
,0
,1
6
1
2
2
6
_Mg
6
9
10
13
16
22
34,
64
17.
21.
24.
saturated calomel
0
.8
.9
.6
.8
.2
.6
5
0
8
Ca
0.1
29
43
48
52
86
85
164
320
Shake
100
95
132
Al
0
1
1
1
1
1
1
1
1
- Flask
2.1
1
2
Fe
-
2,
3,
6,
reference electrode
0
0
0
0
0
0
0
0
--
rest.4
.1
.6
Si
1
3
3
7
8
7
10
31
27
19
30
23
U
0
0
1
0
0
1
2
2
-
0
1
3
V
0
0
0
0
0
0
0
0
-
0
0
0
so4
0
100
150
175
160
300
330
600
963
350
340
460
Cl D1ss" °2
5 < 3
7
12
10
20
15
11
41 < 4
14
—
96
61
Flow(ml/min)
25
—
—
--
—
--
--
20
--
IID
m
<Oo>o
GROUNDWATER •
GIBBSITE
'Na MONT 0 1
ALB
-6
l o9aH4SiO4
FIGURE 3—LOG aNa + / a H + VERSUS LOO aH4SiO4 DIAGRAM WITH GROUND-WATER ( • ) AND CONTROL-COLUMN ( • ) DATA PLOTTED.
the column and the shake-flask has dropped and is staying atabout pH 4.1. This figure indicates that the kaolinite/microcline/muscovite fields are not controlling the reaction.Because of the rapid pH drop, possibly bacteria are responsiblefor the generation of acid after some acid production by an initialmineral-water interaction such as the oxidation of pyrite. Ex-amination of fig. 4, which is a calcium/silica activity-activitydiagram for the same experiment, indicates that initially the solu-tion is attempting to equilibrate with kaolinite and calcium-montmorillonite (path A-*B-»C, fig. 4). Acid generation by at-tack on pyrite at this time seems to have pulled the solution awayfrom equilibrium at point D. This premise is supported by theincrease in the sulfate concentration (table 4). An alternate ex-planation involves the dissolution of gypsum, but the sulfateconcentration is changing much more than the calcium concen-tration, and the ratio is not 1:1 for Ca2* :SO4
2-. The silica con-centration follows the limit of solubility for /?-cristoba!ite. Theshake-flask ends up at a lower pH faster because of increasedcontact between rocks and solution and because of agitation,which causes fresh surface to be exposed.
Calcite and gypsum dissolve to produce calcium, as indicatedby its increase in the solution (table 4). Gypsum saturation wasnot yet reached when the tests were terminated. The solution isalso equilibrated with carnotite based on solution compositionand Eh/pH considerations. The uranium composition of thecontrol-column water is about the same as found in the minewater, and the final composition of all major solution species,except for silica and pH, is also very similar to ground water ob-tained in the formation (compare tables 3 and 4). Silica increasesare due to the pH decrease.
Sulfuric-acid column leachThe efficacy of using a sulfuric-acid leach solution was tested
in a column in which sulfuric acid was added to lower the pH.Concentrated sulfuric acid was added incrementally to lower the

349
12
10
+
X
\ 8
(0
9IS
GIBBSITE
-7 -6 -5 -4l 0 B aH4SiO4
FIGURE 4—LOG a^.,2*/a,H * ,2 VLRSUS LOG aH4SiO|) DIAGRAM
CONTKOI COLUMN AND SHAKK-HLASK DATA PI OTTKD.
« 3
MUSC
GIBBSITE
-6
FIGURE 5—Loo a K < / a H .LEACH DATA PLOTTED.
-5
VI-.RSUS LOG
pH to a final value of 2.5 at the end of the experiment. As the pHrose, more acid was added. A total of 19.8 ml concentratedsulfuric acid was necessary over a 4-month period to lower thepH of leachates of 1 kg of ore to less than 3 (table 5). The solu-tion was then replaced by distilled water and the pH remainedabout 2.3-2.4, indicating equilibration or exchange of H+ for allcations and neutralization of the rock surfaces. The flow ratedropped to about 25 percent of its initial value (from 23 ml/minto between 5.5 and 6.0 ml/min).
The solution attempted to remain at the microcline-kaoliniteor Na-montmorillonite-kaolinite stability boundaries but con-tinued addition of acid caused the solution to move into thekaolinite stability field (figs. 5,6). The solution became saturatedwith gypsum almost immediately; the log of the ion activity prod-uct {(aca2+ )(aso42)} e £ l u a I s ~4-71 a t 7 / 1 9 ( t a b l e 5) and log K,p forgypsum equals -4.75. The combination of clay and gypsum for-mation probably contributed to the decrease in flow rate. Thephases in the column will not equilibrate until all the feldspar,albite, and sodium-montmorillonite surfaces are converted tokaolinite, after which the rate of dissolution is diffusion con-trolled. The final uranium concentration was about 1 g/1.
Sodium-bicarbonate leachThe ability to equilibrate an aqueous phase with rock-forrning
silicates was demonstrated with a solution containing 4.1 x 10⁻²mNaHCO3 with pH equal to 8.3. A solution with this compositionwas circulated through the ore material; progressive changes inthe effluent composition are given in table 6, and a summary ofchanges in the concentrations of major ions during this test aregiven in table 7.
For unit activity of the solid phases, the theoretical equilibriumconstant for the reaction
NaAlSi3O8 + K+ -*KAlSi3O8 + Na+
X
o
GIBBSITE
-6 -5
KAOLINITE
log aFIGURE 6—Loo aNa + / a H
COLUMN DATA PLOTTED.
-4
H4SiO4VERSUS LOG aH4SjO4 DIAGRAM WITH H2SO4

350
TABLE 5—SOLUTION COMPOSITION OFSULFURIC-ACID LEACH TEST; concentrations are in ppm except Eh (in mv) and pH.
12-6
12-13
Date
7-191
7-24
8-1
8-14
8-27
9-4
9-13
9-202
ll-l2
11-14
11-21
Eh
530
560
740
660
610
560
610
620
535
600
665
Et7.
6.
6.
7.
6.
5.
6.
7.
4.
3.
2.
!_
,0
8
6
2
8
7
9
0
4
2
1
CumulativeSuIfuric
Acid Added-ml
.34
.60
1.06
1.34
2.6
2.9
3.7
4.4
13.5
15.8
19.8
Na
12
12
82
85
17
24
36
36
130
100
100
K
8
7
47
58
25
34
33
31
34
50
68
Mg
43
55
63
59
29
31
30
30
55
71
125
Ca
410
710
820
600
690
550
650
640
432
480
500
Fe
0.1
0.2
0.2
0.5
4.1
0.5
0.5
0.5
200
300
800
Si
15
18
22
19
18
20
24
21
350
U
22
80
140
135
70
340
200
1550
3000
so4
1050
1790
1890
1770
1860
1680
1790
1880
2130
2885
4660
Cl
45
56
290
280
45
60
50
60
22
20
42
Flow(ml/min)
23
14.5
23
12
7.6
6.5
650
655
2.3
2.4
New Solution-Distilled Water
34
37
39
38
90
100
500
520
490
460
110
160
1050
1100
4960
3080
20
30
1 = Alk on 7-19 solut ion = 253 ppm as CaCO,
2 = Vanadium < 1 ppm 9-20 and 11-1 , 82 ppm 12-13
5.5
TABLE 6—EFFLUENT ANALYSES FOR MARIANO LAKE BICARBONATE COLUMN WITH 3.44 GRAMS PER LITER SODIUM BICARBONATE AS LIXI-VIANT; all dissolved species are in ppm, except Eh (in mv) and flow rate (in ml per minute).
Date
3-28
3-29
4-5
4-19
4-25
5-3
5-15
6-5
pH
8.2
7.6
7.6
7.7
7.7
7.7
7.7
7.6
Eh
310
315
345
325
285
325
305
305
Na
840
700
460
460
560
500
390
380
0
6
7
4
8
5
5
8
K
.8
.8
.0
.6
.6
.0
.0
.8
Mg
0.
13.
11.
8.
8.
9.
6.
7.
1
9
0
3
1
4
4
9
5
Ca
1
320
200
205
185
190
230
240
Al
1
0.5
1
0.5
0
1
0
0
Fe
1
1
1
1
0
1
1
1
Si
2
50
57
45
57
50
42
44
U
170
620
880
900
1070
1050
1050
1000
V
0
5
5
8
6
2
2
2
HC03
2300
2300
2100
2020
2000
1880
1800
1900
so4
20
200
290
380
380
470
450
500
Cl '
20
70
20
50
75
85
50
75
Diss 0 2
< 3
—
--
--
—
—
—
<5
fflFl0Wn
30
—
30
25
—
—
--
23
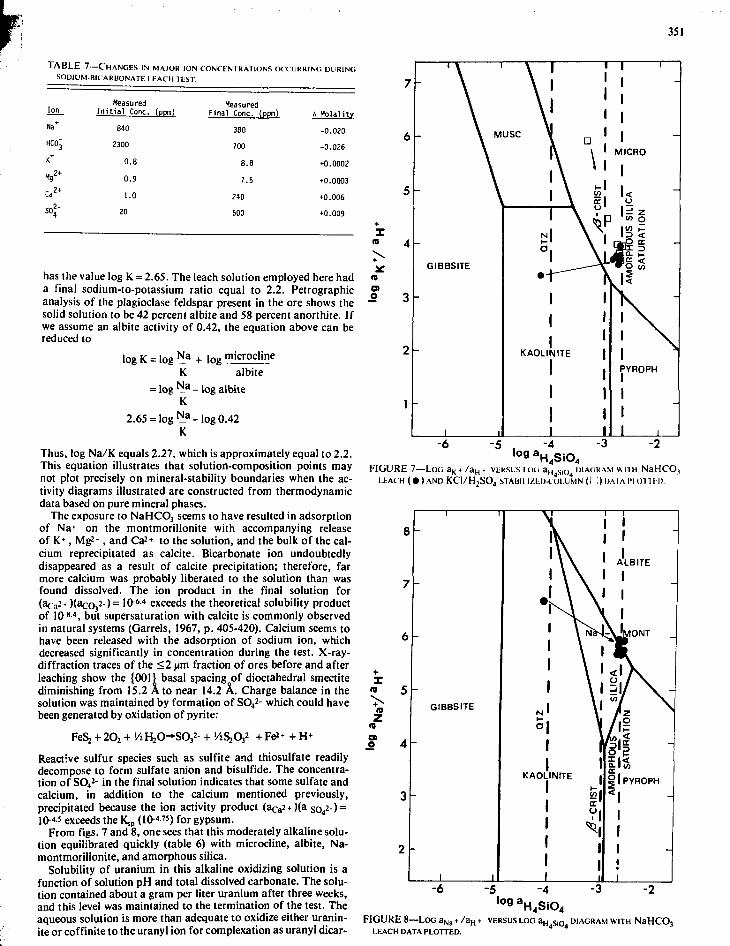
351
TABLE 7—CHANGES IN MAJOR ION CONCENTRATIONS OCCURRING DURINGSODIUM-BICARBONATE LEACH TEST
Ion
Na+
HCOj
K*
Ca2t
K
MeasuredIni t ia l Cone, (ppm)
840
2300
0.8
0.9
1.0
20
MeasuredFinal Cone, (ppm)
380
700
8.8
7.5
240
500
A Molality
-0.020
-0.026
+0.0002
+0.0003
•0.006
+0.009
has the value log K = 2.65. The leach solution employed here hada final sodium-to-potassium ratio equal to 2.2. Petrographicanalysis of the plagioclase feldspar present in the ore shows thesolid solution to be 42 percent albite and 58 percent anorthite. Ifwe assume an albite activity of 0.42, the equation above can bereduced to
log K = log Na + |Og microclineK albite
= log l a _ iOg albiteK
2.65 = log N a . log0.42K
Thus, log Na/K equals 2.27, which is approximately equal to 2.2.This equation illustrates that solution-composition points maynot plot precisely on mineral-stability boundaries when the ac-tivity diagrams illustrated are constructed from thermodynamicdata based on pure mineral phases.
The exposure to NaHCO3 seems to have resulted in adsorptionof Na* on the montmorillonite with accompanying releaseof K*, Mg2 + , and Ca2+ to the solution, and the bulk of the cal-cium reprecipitated as calcite. Bicarbonate ion undoubtedlydisappeared as a result of calcite precipitation; therefore, farmore calcium was probably liberated to the solution than wasfound dissolved. The ion product in the final solution for(aca2+ )(aco3
2-)= 10"6-4 exceeds the theoretical solubility productof \OHA, but supersaturation with calcite is commonly observedin natural systems (Garrels, 1967, p. 405-420). Calcium seems tohave been released with the adsorption of sodium ion, whichdecreased significantly in concentration during the test. X-ray-diffraction traces of the <2 pan fraction of ores before and afterleaching show the {001} basal spacing of dioctahedral smectitediminishing from 15.2 A to near 14.2 A. Charge balance in thesolution was maintained by formation of SO4
2- which could havebeen generated by oxidation of pyrite:
FeSj + 2O2 + '/2H2O-SO32- + - + Fe2* + H+
Reactive sulfur species such as sulfite and thiosulfate readilydecompose to form sulfate anion and bisulfide. The concentra-tion of SO4
2 in the final solution indicates that some sulfate andcalcium, in addition to the calcium mentioned previously,precipitated because the ion activity product (aca2+)(a so4
2-) =10-"5 exceeds the K,p (10-4 75) for gypsum.
From figs. 7 and 8, one sees that this moderately alkaline solu-tion equilibrated quickly (table 6) with microcline, albite, Na-montmorillonite, and amorphous silica.
Solubility of uranium in this alkaline oxidizing solution is afunction of solution pH and total dissolved carbonate. The solu-tion contained about a gram per liter uranium after three weeks,and this level was maintained to the termination of the test. Theaqueous solution is more than adequate to oxidize either uranin-ite or coffinite to the uranyl ion for complexation as uranyl dicar-
(0
o 3
-6
GIBBSITE
-5 -4l0 f l aH4SiO,
FIGURE 7—Lot; aK + /aH • VERSUS LOG aH s j o DIAGRAM W II H NaHCO,
LEACH ( • ) A N D KCI/H2SO4 STABII I/EU-COI.UMN(I ; ) IMIAPIOITH).
XIB
ao
8
7
6
5
4
3
2
i
-
-
-
GIBBSITE
1 1
\ 1 I I
1
1ALBITE
11
i \X 1
™. 11 / . O
i ii
KAOLINITE |
CR
IST
1 ^
| 11 1
p "§ 1PYROPH
111
1 1 1
-6 -5 -4 -3 -2'°fl aH4SiO4
FIGURE 8—Loo aNa + /aH + VERSUS LOO aH s i 0 DIAGRAM WITH NaHCO3
LEACH DATA PLOTTED.

352
Se
OO
o
-2
-3
uo2co3RUTHERFORDINE
UO,• 2
-'(UO2)2(OH)2
\
\
\j V i /
8pH
10 12 14
FIGURE 9 — PRl DOMINANT! ARLASOI UBII |TV DIAGRAM 1OR THI: SYSTbM UOi -CCVHjO;lolal uranium activity equals IO"; m.
bonate or tricarbonate ion (Riese, 1978; Langmuir, 1977). Fig. 9was constructed from the data of Capuano (1977) after the man-ner of Needes and Finkelstein (1971). Overall solubility of theuranyl ion was controlled by saturation with respect to eitherschoepite, UO,(OH)2, or rutherfordine, UO:CO,, with the latterbeing stable at lower pH's (<6; SU>102 m) according to thereaction:
UOjiOHfe + H' +HCO, - U a c O 3 + 2 H 2 OThe solubility of uranium is calculated by determining the activ-ity of UCM* in equilibrium with the stable solid at a given pHand carbonate concentration. The activities of coexisting ura-nium complexes can then be calculated from the solution com-position using the appropriate equations. After distribution ofthe uranium among polycarbonate and hydroxide complexes, thesolution is in equilibrium with UO^OH);, with uranyl tricar-bonate as the predominant aqueous uranium complex.
Potassium-chloride leach columnThis experiment was designed to establish solution equilibrium
with muscovite, microcline, and kaolinite at the triple point onfig. 1. Equilibration at this point minimizes dissolution of therock-forming silicate minerals and reduces the otherwise certainformation of clay minerals in pore spaces and on grain surfaces.The initial pH was lowered to about 4.5 using sulfuric acid (table8). During the experiment, the pH stabilized quickly at a pH of4.1 with little acid consumption and little effect on flow rate.Very little uranium was mobilized because of supersaturationwith respect to carnotite in this pH range and solution composi-
tion (Langmuir, 1977). As seen by examining the solution path offig. 7, the solution remained in the microcline stability field andbecame saturated with amorphous silica just as the sodium-bicarbonate solution did.
A solid solution of 0.1 mole fraction sodium in the exchangepositions of the montmorillonite expands the Na-montmorillon-ite stability field (fig. 10). The solution path appears to followthis boundary to a minimum and then starts back up toward al-bite. The last points going up the boundary result from the addi-tion of sodium acetate, which raises log aNa+ /a^ • The solutionthen ceases changing composition and seems to be controlled bythe solubility of amorphous silica.
A small amount of acetate ion was added to determine if thision would aid in solubilizing uranium, but no significant changein solution species or equilibrium with solid-mineral phases wasnoted.
SummaryThe application of solution-mineral equilibrium considera-
tions to current leaching methods predicts that irreversible re-actions proceeding between the leach solution and rock-formingsilicate minerals will result in significant reagent consumption, assilicates dissolve and alter to phyllosilicate minerals. The for-mation of clay minerals, as solutions are neutralized, is almostcertain to contribute to reduction in rock permeability anddecreased leaching efficiency. Studies of chemical reactions be-tween leach solutions and rocks containing uranium mineraliza-tion have provided the following information:

353
TABLE 8—EFFLUENT ANALYSES: MARIANO LAKE 1.0 m kCI SOLUTION, pH ADJUSTED TO 4.1 WITH HJSO, ; analyses in ppm, except Eh (in mv)and flow rale (in ml per minute).
Date
2-14
2-23
3-6
3-21
3-28
4-4
4-11
pH
6.1
4.7
4.3
4.1
4.1
4.1
4.2
CorrEh
380
425
465
455
445
445
344
Na
25
32
30
29
Add
125
125
130
K
36200
36000
36000
36500
0.4 g l>
33400
31800
35500
Mq
83
86
85
110
JaC2H3<
110
110
110
Ca
630
640
660
860
32 and
700
760
770
Al
0 <
0 <
4
15
Adjust
16
17
17
Fe
: 1
1
2
5
to
6
5
1
Si
10
22
30
40
pH 4.
53
44
70
U
0
0
0
2
1 (2
1
1
1
V
1
0
0
0
.9
0
0
1
so4
120
130
820
1100
ml HC2H
1050
1060
1300
Cl
34000
33500
33000
34000
3°2>
32000
32000
32000
Diss
°2< 3
--
--
—
--
--
< 5
Flowml/min
30
—
—
25
--
—
20
Cum ml
.2
.34
.42
.5
.54
.54
.64
+•
n1 5
(D
zo 4
GIBBSITE
-6 -5 -2
l o 9 a H 4 SiO 4
FIGURE 10—LOG aNa + / a H + VERSUS LOO aH4SiO4 DIAGRAM WITHNaHCO3 (D)AND H2SO4/KC1 ( STABILIZED-COLUMN LEACH DATA.
1) Strongly acid solutions with pH's <3 can reduce thepermeability of arkosic uranium ore by production of acid-stable clay minerals and gypsum.
2) Moderately acid solutions with pH between 4 and 5,containing 1.0 molal dissolved potassium chloride, equil-ibrate rapidly with the rock-forming silicates potassiumfeldspar, muscovite, and kaolinite. Leach solutions sta-bilized in this manner reach steady state with less than 5percent of the acid required to achieve the same pH in con-ventional sulfuric-acid leaching.
3) Moderately alkaline solutions with pH's between 7.5 and8.3 containing sodium bicarbonate equilibrate in very fewpore volumes with potassium feldspar, plagioclase feld-spar, montmorillonite, and muscovite with low totaldissolved solids. Carbonate-bearing solutions are also ef-fective carriers for uranium, providing for dicarbonate andtricarbonate complexing of uranyl ion.
4) Moderately alkaline sodium-bearing solutions are capableof solubilizing and transporting considerable quantities ofuranium (about a gram per liter) without the addition of anoxidant other than air.
5) Interaction between leach solutions and rock-formingsilicate minerals is a function of modal composition. Thisdependence is apparent from the reaction paths taken bythe aqueous phase in each of the leach tests.
6) Solubility of uranium in moderately acidic (pH =4-5) leachsolutions stabilized with potassium is governed by carnotitestability.
These tests indicate the importance of considering stabilityrelations of silicate minerals that make up the majority of therock mass containing leach-grade uranium mineralization.
ReferencesBeane, R. E., and Popp, C. J., 1977, The application of solution-mineral
equilibrium chemistry to the leaching of low-grade chalcocite ore:Society of Mining Engineers, American Institute of Mining Engineers,Preprint no. 77A5381
Bernas, B., 1973, Acid pressure decomposition device for interference-free AA analysis: American Laboratory, August, p. 41 -43
Capuano, R., 1977, Chemical mass transfer and solution flow in Wyo-ming roll-type uranium deposits: M.S. thesis, University of Arizona,81 p.
Carrol, D., 1970, Clay minerals—a guide to their x-ray identification:Geological Society of America, Spec. Paper 126, 80 p.

354
Framson, M. A., ed., 1975, Standard methods for the examination ofwater and waste water: American Public Health Association, AmericanWater Works Association, and Water Pollution Control Federation,p. 1193
Francois, C , 19S8, Rapid speclrophotometric determination of sub-milligram quantities of uranium: Analytical Chemistry, v. 30, p. 50-55
Garrels, R. M., and Christ, C. L., 1965, Solutions minerals andequilibria: New York, Harper and Row, 450 p.
Helgeson, H. C , 1968, Evaluation of irreversible reactions in geo-chemical processes involving minerals and aqueous solutions—I, iher-modynamic relations: Geochimica et Cosmochimica Ada, v. 32, no. 8,p. 853-877
, 1969, Thermodynamics of hydrothermal systems at elevatedtemperatures and pressures: American Journal of Science, v. 267, p.723-804
Helgeson, H. C , Brown, T. H., Nigrini, A., and Jones, T. A., 1970,Calculation of mass transfer in geochemical processes involvingaqueous solutions: Geochimica et Cosmochimica Ada, v. 34, no. S, p.569-592
Helgeson, H. C , Garrels, R. M., and Mackenzie, F. T., 1969, Evaluationof irreversible reactions in geochemical processes involving mineralsand aqueous solutions—II, applications: Geochimica et CosmochimicaActa, v. 33, no. 4, p. 455-481
Helgeson, H. C , and Mackenzie. F. T., 1970, Silicate-sea water equi-librium in the ocean system: Deep-Sea Research, v. 17, p. 877-892
Hess, P. C , 1966, Phase equilibria of some minerals in the K2O-Na : 0-AI 2 0 , -S i0 2 -H ,0 system at 25 °C and I aimosphere: AmericanJournal of Science, v' 264, p. 289-309
Hilpcrt, L. S., 1963, Regional and local stratigraphy of uranium-bearingrocks, in Geology and technology of the Grants uranium region, V. C.Kelley, compiler: New Mexico Bureau of Mines and MineralResources, Mt.it. 15, p. 6-18
, 1969, Uranium resources of northwestern New Mexico: U.S.Geological Survey, Prof. Paper 603, 166 p.
Kelley, V. C.. compiler, 1963, Geology and technology of the Grantsuranium region: New Mexico Bureau of Mines and Mineral Resources,Mem. 15,277 p.
Langmuir, D., 1977, Uranium soluiion-mineral equilibria at low tempera-tures with applications to sedimentary ore deposits: Grand Junction,Colorado, U.S. Department of Energy, Contract No. E(05-l) 1659,39 p.
Moench, R. H., and Schlee, J. S., 1969, Geology and uranium deposits ofthe Laguna district. New Mexico: U.S. Geological Survey, Prof. Paper519, 117 p.
Needes, C. R. S., and Finkelstein, N. P., 1971, Three-dimensional pre-dominant-area and solubility diagrams for the uranyl carbonate anduranyl sulfate systems at 25 °C: Department of Commerce, NationalTechnical Information Service, Nim-1144, 24 p.
Nininger, R. D. , 1974, The world uranium supply challenge—an ap-praisal, in Formation of uranium ore deposits: Vienna, InternationalAtomic Energy Agency, p. 3-18
O'Sullivan, R. B., and Craig, L. C , 1973, Jurassic rocks of northeastArizona and adjacent areas: New Mexico Geological Society, Guide-book 24lh field conference, p. 79-85
Plummer, L. N., Jones, B. F., and Truesdell, A. H., 1976, WATEQF—afortran IV version of WATEQ, a computer program for calculatingchemical equilibrium of natural waters: U.S. Geological Survey, WaterResources Inv. 76-13, 61 p.
Riese, A. C , 1978, An application of solution-mineral equilibriumchemistry within the system K2O-Na2O-Al2O3-SiO2-H2O to the solu-tion mining of uranium ores; M.S. thesis, New Mexico Institute ofMining and Technology, 150 p.
Rosenbaum, J. B., 1976, Outlook for uranium demand and productioncapacity: Washington, D.C., Proceedings of an advisory groupmeeting, November 1975,6 p.
Santos, E. S., 1970, Stratigraphy of the Morrison Formation and struc-ture of the Ambrosia Lake district. New Mexico: U.S. GeologicalSurvey, Bull. 1232-E, p. EI-E30
Saucier, A. E., 1976, Tectonic influence on uraniferous trends in the LateJurassic Morrison Formation: New Mexico Geological Society, Spec.Pub. no. 6. p. 151-157
Squyres, J. B., 1970, Origin and depositional environment of the Grantsregion, New Mexico: Ph.D. thesis, Stanford Universily, 228 p.
Truesdell, A. H., and Jones, B. F., 1974, Law tech—a computer programfor calculating chemical equilibria of natural waters: Journal ofResearch, U.S. Geological Survey, v. 2, p. 233-248
Ulbrich, H. H., and Merino, E., 1974, An explanation of standard en-thalpies of formation of selected minerals in the system SiO2-AI2Or
Na2O-K2O-H2O: American Journal of Science, v. 274, p. 510-542

355
APPLICATIONS OF COMPUTER MODELINGTO THE GENESIS, EXPLORATION, AND IN-SITU MINING
OF URANIUM AND VANADIUM DEPOSITSby Donald D. Runnells, Ralph Lindberg, Steven L. Lueck, and Gergely Markos,
Department of Geological Sciences. Environmental Trace Substances Research Program.University of Colorado. Boulder. Colorado 80309
AbstractThe geochemical behaviors of uranium and vanadium are ex-
tremely complex. Adequate characterization of the movementand deposition of these elements in nature is virtually impossiblewithout the aid of the computer. We have modified and enlargedan existing computer model, WATEQF, to include many dis-solved species and solid compounds of uranium and vanadium.The enlarged model uses (hermodynamic data and equilibriumcalculations to compute the state of saturation of an aqueoussoluiion wiih respect to approximately 540 solid compounds and650 dissolved aqueous species. The results can be used to inter-pret the behavior and interaction of aqueous solutions andminerals in such diverse situations as the genesis of uranium-vanadium deposits, in-situ mining of ores, and hydrogeochem-ical exploration for ore deposits. Included are three examples ofthe use of the model: First, water analyses from the South PlatteRiver in Colorado are examined to see if the uranium-rich watersof this system are capable of precipitating uranium minerals inthe arkosic alluvium of abandoned meanders. Second, analysesof ground waters from two known uranium deposits are mo-deled, with the output displayed as contour naps of the state ofsaturation of the waters. Third, complex solutions from an in-situ mining operation in Wyoming are examined to determine thedissolved species of uranium and vanadium, as well as the solidminerals and compounds that may control the composition andefficiency of the leaching solution. No examples are presentlyavailable of model usage for the Grants district. In principle,programs of exploration and in-situ mining in the Grants districtcould be greatly enhanced by computer interpretation of thechemistry of the aqueous fluids. The deep and expensive drillingnow required in exploration and development in this region dic-tates that as much information as possible be extracted from eachhole. For a relatively small additional cost, collecting samples ofground water should be possible; if properly analyzed and inter-preted, these samples could improve the search for hidden oredeposits and reduce the density of drilling required to outlineknown orebodies. The computer model is only as good as thechemical analyses of the waters used as input. At a minimum, thechemical analyses should include the following parameters: fieldpH, field Eh, field temperature, alkalinity, and concentrations ofcalcium, magnesium, sodium, potassium, chlorine, SO4, PO4,iron, fluorine, aluminum, SiO2, uranium, and vanadium. Addi-tional minor-element concentrations can also be measured andmodeled.
IntroductionThe complexity of natural geochemical systems demands that
the computer be employed to handle the many variables in-volved. A great many computer models have been developed inrecent years for the purpose of treating the geochemistry ofnatural waters. Nordstrom and others (1979) have published avery useful summary and comparison of most of the computer-ized chemical models for equilibrium calculations in aqueoussystems.
Truesdell and Jones (1973) published the first version of thecomputer program WATEQ, in the language PL/1, for calculat-ing chemical equilibria in natural waters. Plummer and others
(1976) subsequently published a revised version, WATEQF, inthe language FORTRAN IV. We have been using WATEQF inour research since 1976, with special emphasis on geochemicalexploration for deposits of uranium ore. Part of this work wasreported in Lueck and others (1978), and the present paper sum-marizes more recent work on the model, with applications to in-situ mining of uranium and vanadium deposits.
Principles involved in modelWATEQF (Plummer and others, 1976) considered the
simultaneous chemical equilibrium among approximately 94minerals and 113 dissolved chemical species, including all of themajor components expected in natural waters, as well as such im-portant minor and trace components as iron, boron, PO4, fluor-ine, aluminum, and manganese. We have subsequently addedmany additional trace metals, including most of the dissolvedspecies and solid compounds of uranium and vanadium forwhich thermodynamic data are available. Tables 1 and 2 list thedissolved components and solid compounds of uranium and van-adium included in our version of WATEQF.
Detailed descriptions of the structure and operation ofWATEQ and WATEQF can be found in Truesdell and Jones(1973), Plummer and others (1976), and Lueck (1978). Briefly,WATEQF operates by solving a large number of simultaneousequations that describe the known equilibrium chemical re-actions and interactions that may occur in a given water. As in-put, the program requires a relatively complete chemical analysisof the water of interest, including at least the major anions andcations, as well as those minor and trace elements that are rele-vant to the problem being investigated. For example, if one is in-terested in the chemistry of a natural water as it relates to theorigin of a deposit of uranium and vanadium, the input analysisshould include the dissolved components that are known to reactwith uranium and vanadium. For a truly meaningful model to bedeveloped for the interaction of the water with the minerals in adeposit of uranium and vanadium, the analysis of the watershould include at least the following: field pH, field Eh, fieldtemperature, alkalinity, calcium, magnesium, sodium, potas-sium, chlorine, SO4, SiO2, iron, PO4, aluminum, iron, uranium,and vanadium. The scope and value of the model will expand ordiminish in direct relationship to the number and accuracy of thedissolved components in the analysis. Regarding accuracy, careshould be taken to properly collect and preserve the water in thefield, as well as to gain assurance of the accuracy and reliabilityof the analytical techniques used in the laboratory. Using poorand incomplete analyses of water as input to the computer pro-gram is foolish and expensive.
The two most important parameters that must be measured aspart of the input to the program are field pH and field Eh.WATEQF uses the initial values of pH and Eh to solve thesimultaneous equations involved in the program; if these two in-put parameters are in error, serious flaws will exist in the com-puter output.
The computer model and the resulting output are only as goodas the thermodynamic data upon which the calculations arebased. Although we have made some minor changes in the database in WATEQF, we have generally relied upon the originalthemodynamic values in the 1976 version. Output values for the

356
TABLE 1 —URANIUM MINERALS, COMPOUNDS, AND AQUEOUS SPECIES ADDEDTO WATEQF.
S< l id
uranlnite
ruthi*rfordlne
autunite
H-autunite
N« -autunite
K-autunite
urampliite
sa lee i t i*
Sr-^autun it*.1
uranoc Ire Ite
haHHut l i e
cof f In l te
Kummit,
scliueplU-
p-Bfhoepitt'
ur.inopbane
i-arnot i t i*
carnotite-R
tyuyamunlCL>
niiiKyolte
Species
UOa(c)
U0aCO,(c)
Ca(U03)a{P0B)j(c)
Ha(U0a>3(P0h)3(c)
Na,(U03) i(P0k)3(c)
K (UO (PO ) { )
Mg(UO,)a(POh),(c)
BadfOjJatPCJ^c)
F iVti > (PO » ( )
110, (am)
U04(UH)j«Hs0(c}
Ca fUOj Ia lHS iO^ l ^c )
K, (U0a) , (V0. t , .3H a O(c>
K j ( U 0 j ) J ( V 0 , . ) 1 ( c )
Ca(UOa) i<VO f c) t ic)
CaU(POh ja*2HxO<rl
DOj(ara)
AqueouB Species
+6 va lence
UOaCQ?
uo,(co,)ruog<co,);~
uoaso2
UOa(SO4)j~
UOSC1+
UO3HP02
DO H P0+
UO,(1I,PO.)S
UO,(K,PO.>;
UO.F*
DOjFj
110 jF , "
UO,Ki"
(UOiljlOIDi*
(U0,),(OHlt
+5 valence
uot
+4 valence
Solid SpecleB
U.0.(c)
a-U,0,(c)
U(HP0»)i»4H,0(c)
Aqueous Species
+4 valence (con't)
U(OH)t
UfOH)!
U(OH)"
U0»S10(0H)t
u-+
D.(OH);t
UF*
UF;
UF!
UFi"
UC1'+
usoj+
"(SO.) ,
UHP02+
IKHPOiJS
ucpojr
U(HPO»)J"
+3 valence
V*
major and minor species from our version of WATEQF agreevery closely with corresponding output values from the severalother models available (Nordstrom and others, 1979), indicatingthat our choices of thermodynamic data are consistent. For ura-nium and vanadium, we have selected our themodynamic datafrom the following sources: Latimer (1952), Deltombe and others(1556), Evans and Garrels (1958), Naumov and others (1971),Baes and Mesmer (1976), LaPoint and Markos (1977), and Lang-muir(l978).
Certain serious limitations exist in using and interpreting theresults of the model. First, equilibrium is assumed among thedissolved aqueous species. If nonequilibrium (kinetic) factorsprevent attainment of dissolved equilibrium, the predictions withrespect to the precipitation and dissolution of minerals will alsobe in error. Second, if errors exist in the thermodynamic data,the output results will also be in error. Third, omission ofunknown or unsuspected species may cause the output results tobe misleading.
Output of modelThis discussion emphasizes two aspects of the output from the
computer model: equilibrium concentration of each of the dis-solved forms of each chemical element in the water and the stateof saturation of the water with respect to solid minerals and com-pounds.
As an example of these two types of information, we havemodeled the chemistry of some of the major components in asample of water from the South Platte River in Colorado, justsouth of Denver. The original analysis of the water is summar-ized in table 3 (Boberg and Runnells, 1971).
Table 3 shows the reported total concentration of calcium as81 mg/l; however, we know that some proportion of the totalcalcium must be present as complex ions, as well as free ionicCa» *. Using the analysis of table 3 as input for WATEQF, theoutput shows the computed calcium distribution among the dis-solved species of calcium in the water (table 4). These valuesshow that about 85 percent of the total molality of calcium in thewater is free ionic Ca+ ' , and about 15 percent is present as thedissolved CaSO}' aqueous complex. The other two aqueousspecies make up only a tiny fraction of the total dissolvedcalcium. The mode! thus yields very interesting information onthe speciation of the dissolved chemical elements.
The second emphasized aspect of the computer output is thestate of saturation of the water with respect to mineral. and solidcompounds. Only a fraction of each of the total dissolved com-ponents in the water will be free and available to form solidprecipitates; a quantitative measure of this fraction is called theactivity of the ion. Using the computer output for the activity ofthe free Ca2 + , we find that of the 1.7 millimoles/l ionic Ca*+shown in table 4, only 62 percent is truly free and available forreaction. The difference between the activity and concentrationof the free ion represents the portion of Ca2* that is electro-statically bound to other charged species in the solution at anyone instant in time, thereby remaining unavailable for precipita-tion of solid phases.
To determine whether a solid compound will precipitate fromthe water, we must look at the product of the activities of the ionsinvolved in the solid and compare this i.a.p. (ion-activity prod-uct) to the true, thermodynamic solubility constant (KT) for thesame mineral (Barnes and Clarke, 1969). If the ratio of i.a.p. toKT is greater than un.^y, the water is supersaturated with respect

357
TABLE 2—VANADIUM MINERALS AND Agutous SPECIES ADDED TO WATEQF.
Minerals
tnontroseite
paramontroseite
duttonite
karelianite
roscoelite
V0(OH)(c)
VaO<,(c)
V0(OH)a(c)
Va03(c)
(Al,. , 3 v " j
V-tnica-montmorillonite (Al.,
(Si , . , ,A1. ,,)0IO(OH) 2K. aH.
(Si3 . L ,A1. 0 j)0,o(0H) aK. , 5
Aqueous Species
+5 valence +2 valence
VOH+
+3 valenceV 3 +
V0H2 +
V(OH)
V(OH)5
valence
HVOj"
H2VOl
VOOH
V(OH)1
VOF
VOF?
vosoS
TABLE 3—ANAI YSISOI- THE MAJOR COMPONENTS IN SURI ACE WATER I KOMTHL SOUTH PIATTI RIVEK. COLORADO. January 23, 1970 (Boberg andRunnells.1971).
component
Ca
Mg
Na
K
HCO,
SO,,
Cl
field pH
field Eh
field temperature
concentration, in mg/L
81. (2.02 millimoles/L)
19.
139.
14.
157.
293.
138.
7.93
+250 mv
8.2°C
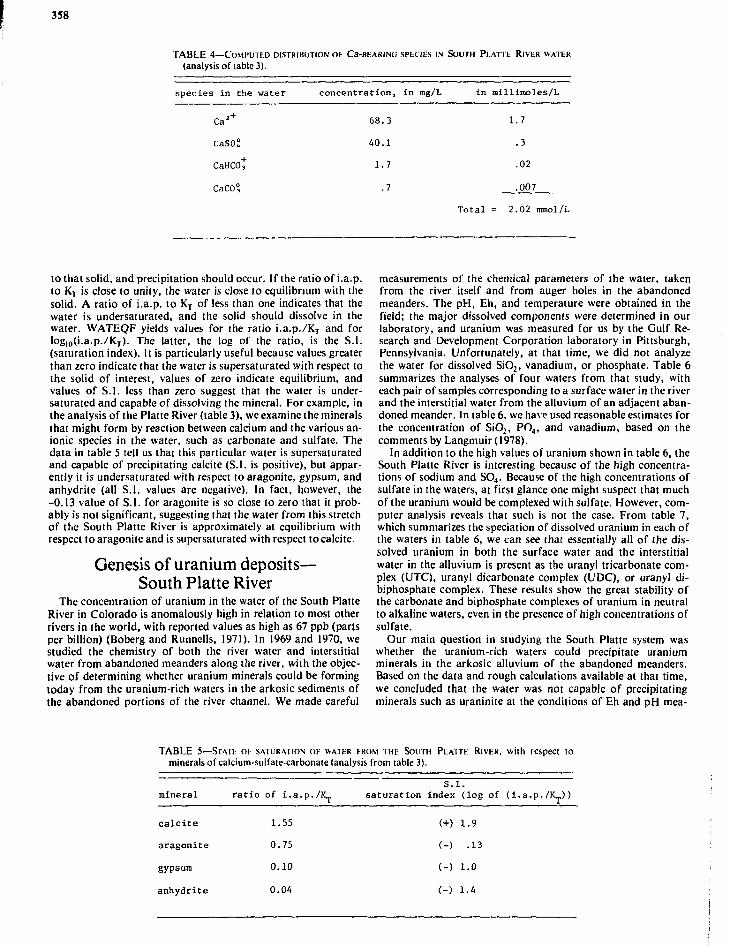
358
TABLE 4—COMPUTED DISTRIBUTION OF Ca-BEAWNG SPECIES IN SOUTH PLATTE RIVER WATER(analysis of table 3).
species in the water concent ra t ion , in rng/L in mill imoles/L
C a '
CaSO?
CaCO?
68.3
40.1
1.7
.7
1.7
.3
.02
.007
Total = 2.02 mmol/L
to that solid, and precipitation should occur. If the ratio of i.a.p.to KT is close to unity, the water is close to equilibrium with thesolid. A ratio of i.a.p. to Kr of less than one indicates that thewater is undersaturated, and the solid should dissolve in thewater. WATEQF yields values for the ratio i.a.p./KT and forlogl0(i.a.p./KT). The latter, the log of the ratio, is the S.I.(saturation index). It is particularly useful because values greaterthan zero indicate that the water is supersaturated with respect tothe solid of interest, values of zero indicate equilibrium, andvalues of S.I. less than zero suggest that the water is under-saturated and capable of dissolving the mineral. For example, inthe analysis of the Platte River (table 3), we examine the mineralsthat might form by reaction between calcium and the various an-ionic species in the water, such as carbonate and sulfate. Thedata in table 5 tell us that this particular water is supersaturatedand capable of precipitating calcite (S.I. is positive), but appar-ently it is undersaturated with respect to aragonite, gypsum, andanhydrite (all S.I. values are negative). In fact, however, the-0.13 value of S.I. for aragonite is so close to zero that it prob-ably is not significant, suggesting that the water from this stretchof the South Platte River is approximately at equilibrium withrespect to aragonite and is supersaturated with respect to calcite.
Genesis of uranium deposits—South Platte River
The concentration of uranium in the water of the South PlatteRiver in Colorado is anomalously high in relation to most otherrivers in the world, with reported values as high as 67 ppb (partsper billion) (Boberg and Runnells, 1971). In 1969 and 1970, westudied the chemistry of both the river water and interstitialwater from abandoned meanders along the river, with the objec-tive of determining whether uranium minerals could be formingtoday from the uranium-rich waters in the arkosic sediments ofthe abandoned portions of the river channel. We made careful
measurements of the chemical parameters of the water, takenfrom the river itself and from auger holes in the abandonedmeanders. The pH, Eh, and temperature were obtained in thefield; the major dissolved components were determined in ourlaboratory, and uranium was measured for us by the Gulf Re-search and Development Corporation laboratory in Pittsburgh,Pennsylvania. Unfortunately, at that time, we did not analyzethe water for dissolved SiO2> vanadium, or phosphate. Table 6summarizes the analyses of four waters from that study, witheach pair of samples corresponding to a surface water in the riverand the interstitial water from the alluvium of an adjacent aban-doned meander. In table 6, we have used reasonable estimates forthe concentration of SiO2, PO4, and vanadium, based on thecomments by Langmuir (1978).
In addition to the high values of uranium shown in table 6, theSouth Platte River is interesting because of the high concentra-tions of sodium and SO4. Because of the high concentrations ofsulfate in the waters, at first glance one might suspect that muchof the uranium would be complexed with sulfate. However, com-puter analysis reveals that such is not the case. From table 7,which summarizes the speciation of dissolved uranium in each ofthe waters in table 6, we can see that essentially all of the dis-solved uranium in both the surface water and the interstitialwater in the alluvium is present as the uranyl tricarbonate com-plex (UTC), uranyl dicarbonate complex (UDC), or uranyl di-biphosphate complex. These results show the great stability ofthe carbonate and biphosphate complexes of uranium in neutralto alkaline waters, even in the presence of high concentrations ofsulfate.
Our main question in studying the South Platte system waswhether the uranium-rich waters could precipitate uraniumminerals in the arkosic alluvium of the abandoned meanders.Based on the data and rough calculations available at that time,we concluded that the water was not capable of precipitatingminerals such as uraninite at the conditions of Eh and pH mea-
TABLE 5—STATE OI- SATURATION OF WATER IROM THE SOUTH PLAITE RIVER, with respect tominerals of calcium-sulfate-carbonate (analysis from table 3).
_ _
mineral ratio of I.a.p./K_, saturation index (log of (i.a.p./K_))
(+) 1.9
(-) .13
(-) 1.0
(-) 1.4
calcite
aragonite
gypsum
anhydrite
1.55
0.75
0.10
0.04

359
TABLE 6—CHEMICAL COMPOSITION OF SURFACE WATERS AND WATERS FROM ARKOSK. ALLUVIUM ot ABAN-DONED MEANDERS. SOUTH PLATTE RIVER, COLORADO, 1969-1970 (Boberg and Runnells, 1971);dissolved species in mg/I; note that values for SiO., PO<~, and V are estimated.
parameter
Ca
Mg
Na
K
Cl
so,1-"
HCO3-
U
field pH
field Eh (mv)
Field T^C)
est. SiOn
est. PO,~
est. V
No. 8-river
81
19
139
14
138
293
157
.016
7.93
250.
8.2
15
.1
.1
No. 8-cutoff meander
201
59
280
19
221
831
371
.007
6.98
152.
5.0
15
.1
.1
No. 17-river
133
55
174
11
86
716
155
.039
8.05
261.
7.0
15
.1
.1
No. 17-cutoffmeander
211
51
275
13
128
952
239
.007
7.48
216.
6.5
15
.1
.1
sured. A more refined analysis of the state of saturation of thewaters is now possible, and the saturation indices for a suite ofpossible precipitates of uranium and vanadium are summarizedin table 8.
From the S.I. values in table 8, one can see that none of themost probable minerals of uranium or vanadium can precipitatefrom the waters. A value of S.I. of -6.0 in table 8 would indicatethat the ion-activity product for the mineral in question is onlyI x 10-6 as large as the solubility product, KT, which must be ex-ceeded for precipitation of that mineral to occur.
Hydrogeochemical exploration—known deposits
Lueck (1978) added some species of uranium to WATEQF andtested the model for its potential usefulness in hydrogeochemical
exploration for uranium deposits. The results of that work werequite encouraging (Lueck and others, 1978). Through the cour-tesy of Wyoming Minerals Corporation (Harry Noyes and FredBusche), we were given access, prior to the initiation of miningactivity, to analyses of ground waters from two of the uraniumdeposits the company controls. The waters were relatively un-disturbed and presumably were representative of the chemistrythat would prevail between a deposit of uranium ore and the for-mation waters in the same strata. A total of 46 relatively com-plete water analyses were made available to us. The analysesseem to be of good quality with the exception of not havingvalues of measured Eh, PO4, and aluminum. We were able to usethe analyses as input to WATEQF after making reasonableestimates for Eh.
The values of Eh needed for the input to the computer pro-gram were estimated in two ways. First, for one of the deposits,all of the dissolved iron in the ground water was assumed to be
TABLE 7—SPECIATION OF DISSOLVED URANIUM in units of the log of the moles per liter; note total analyzed Uat bottom of table (from analyses in table 6).
Calculated Sample No.Uranium species Sample No. 8 cutoff
Sample No. 17-Sample No. 17 cutoff
U02(C03)s (UTC)
uo2(co3)r(iroo
U02(HP0Ol"
Total analyzed Ufrom table 6
-7.
-7.
-8.
-7.
4
7
1
2
-8.
-8.
-7.
-7.
1
1
9
5
-6
-7
-8
-6
.9
.5
.3
.8
-7.8
-8.1
-8.2
-7.5
A Minoral Rocniirroc Mornnlr Ifl 1QOni

360
TABLE 8—STATE OF SATURATION OF THE SOUTH PLATTE WATERS, with respect to probable mineralsof uranium and vanadium; positive values of the saturation index (S.I.) indicate supersatura-tion, a zero value of S.I. suggests equilibrium between the water and the solid, and a negativevalue means that (he water can dissolve the mineral in question.
Mineral orcompound
carnotite
tyuyamunite
schopeite
rutherfordine
coffinlte
Na-autunite
duttonite
uranophane
uraninite
montroseite
Sample No.
-1.9
-2.0
-4.4
-5.2
-7.5
-7.9
-8.2
-8.7
-8.7
-15.
SaturationSample No. 8-
8 cutoff
-3.5
-3.8
-5.6
-5.0
-3.0
-8.4
-4.4
-12.5
-4.3
-8.2
Index (S.I.)
Sample No. 17
-1.7
-1.6
-4.2
-5.1
-7.8
-7.7
-8.7
-7.8
-9.1
-15.
Sample No. 17-cutoff
-3.2
-3.1
-5.2
-5.3
-6.0
-8.4
-6.6
-11.
-7.3
-12.
Fe*' , and it was assumed to be in equilibrium with Fe(OH), inthe deposit. This equilibrium can be written as follows:
(1) Fe(OH)j|s, + 3Ha^ + e- =Fe2j<| + 3H,O,,l)Because (I) is a redox reaction, we can calculate an equilibriumvalue of Eh for each given set of values of total Fe2+ and pH.The resulting values of Eh ranged from approximately -580millivolts to -320 millivolts. Although these figures are quitelow, they are not impossible for an anaerobic ground water.
For the second deposit, we were able to esiimate the values ofEh using an assumed equilibrium between the abundant H2S gasin the water and the measured dissolved SO,,2-. Stumm andMorgan (1970) have suggested this approach in their textbook,based on the redox reaction:
(2) 10H ;q + 8e - = H2Spas + 4 H:Qiq
For waters with an obvious odor of H,S, Stumm and Morgan(1970) suggest that partial pressures of H,S between 10-' and 1O8
atmospheres prevail. By substituting such values into (he redoxequation for reaction (2), together with an observed value ofdissolved SO4
:- and observed pH, we can calculate Eh. Theresulting average values for this deposit ranged from approx-imately -220 millivolts to about -150 millivolts, which seemreasonable. Stumm and Morgan (1970) discuss in some detail thedifficulty of determining a meaningful Eh in a natural water.
In a first attempt to make use of WATEQF in hydrogeochem-ical exploration, we plotted the resulting saturation indices formany minerals listed in the output from the program. Figs. Ithrough 6 show the locations of the wells around the two ore-bodies and the isosaturation contours for one possible oremineral, uraninite, and one probable gangue mineral, calcite.Comparison of figs. I and 2, for Location 1, shows that the iso-saturation contours for uraninite clearly define the location ofthe orebody. Values of S.I. toward the interior of the contours infig. 2 exceed a value of 4, indicating that the waters seem super-saturated with respect to uraninite by a factor of more than 10*.In fig. 3, the location of the orebody is defined equally well by achange in state of saturation of the ground waters with respect tocalcite, going from undersaturation west of the ore to oversatura-tion east of the ore. The information in fig. 3 suggests that thestate of saturation of the ground waters with respect to alteration
and gangue minerals may form halos that could also prove to beuseful guides to ore.
In the case of Location 2, comparison of figs. 4 and 5 againshows that the calculated saturation contours for uraninite clear-ly define the location of the orebody. Fig. 6 shows also that thecentral portion of the orebody is generally surrounded by a haloof ground waters that are undersaturated with respect to calcite.In Location 2, however, the ore can be equally well defined
LOCATION ONE
. CONFINESU— OF ORE
\
V [
I 1 10 500 1000
'/EET
yFIGURE 1—DISTRIBUTION OF ORE AT LOCATION 1 (courtesy of Wyoming
Minerals Corporation).

361
3.0
\
\°4.15
\\ 3.88 \» 4.0
1,2, \
LOCATION ONE
„ URANINITE SI VALUES?
\4.0
\
3.67
o3.78
\
I \
\ 30 \
o \ \ \
\ )S, \
o
(4.06)
o3.51
4.62
4 , 6
3.0
o3.59
O3.79
(4.064.16 4.31
/
/A??
? II 0 1
J 3.41/ /
(4.05)3.0
500
72.0
11000 FEET
FIGURE2—SATURATION INDICES IORURANINITEAT LOCATION I.
o-0.45
0-0.32
O-0.35
0-0.30
O
\
\
o-0 .70
CALCITEUNDERSATURATIOr
0O -0.33
-0.26 _ 0
-0.41
LOCATION ONE
CALCITE SI VALUES
CALCITf
\
O-0.64t
O-0.63
0-0.28
>
o
6 0
: OVERSATURATION
00.46
O
\0\0.23
\
jJy
, -0.04 °
5 0 0
00.43
00.26
00.20
00.27
O
1000 FEET
LOCATION TWO
APPROXIMATE BOUNDARYBETWEEN OXIDIZED ANDREDUCED 6R0UND
OXIDIZED ° / REDUCED
0—I 1500 1000 FEET
FIGURE 4—DISTRIBUTION OF ORI. AT LOCATION 2; ore occurs along theinterface between the oxidized and reduced areas (courtesy of Wyo-ming Minerals Corporation).
LOCATION TWO ^.— |.o —
URANINITE SI VALUES / o ^
?—1.0 —
o?—3.02.91
9 - y
^ 2 . 0 - ? ,
°29 /'-{
) l l
2.0
5 0 0 1000 FEET
FIGURE 5—SATURATION INDICES FOR URANINITE AT LOCATION 2.
LOCATION TWO
CALCITE SI VALUES
0.0'
o-0 .09
O0.29
-0.15O
0.0
-0.03 o.lO° ° P ^ 4
9
.oe\° )-0.08
O-0.10
-0.120
/0.0
/
O0.12
- 0 . 3 8 o
5 0 0 1000 FEET
FIGURE 3—SATURATION INDICES FOR CALCITE AT LOCATION 1. FIGURE 6—SATURATION INDICES FOR CALCITE AT LOCATION 2.

362
simply by plotting the concentrations of total uranium in theground waters without using the computer model.
One important conclusion to be drawn from figs. 1 through 6is that the chemistry of the ground waters seems to reflect thepresence of the ore at a distance that is greater than the apparentlimits of the orebodies themselves. This factor is critical, espe-cially in a district such as Grants, where drilling depths and costsare great.
Many factors enter into determining the final composition of anatural water. In the case of dissolved uranium, for example, alow Eh near the center of a rich orebody may reduce the totalconcentration of uranium in the ground water to a very lowvalue, whereas oxygen-rich waters (high Eh) may lead to muchhigher concentrations of total uranium in ground waters far fromthe ore. Such a potentially misleading situation can be properlyinterpreted only by considering all of the chemical relationshipsin the water and calculating the apparent state of saturation ofthe water with respect to uranium minerals.
Although we have confined our remarks to uranium, the prin-ciples and conclusions regarding hydrogeochemical prospectingobviously will apply to other type; of ore deposits as well, espe-cially to stratiform deposits of base metals.
In-situ leaching—Nine Mile LakeAs an example of a different application of the computer
model, we shall consider the results of an acid leach of auranium-vanadium ore deposit at Nine Mile Lake, Wyoming.The data for this work have been supplied to us by John Lan-kenau, Joe Milbourne, and Jim Babcock of Rocky Mountain En-ergy Corporation and Daryl Tweeton of the U.S. Bureau ofMines.
The Nine Mile Lake deposit is just north of Casper, Wyoming.The ore occurs in arkosic sandstone, and the depth below groundlevel of the zone being leached is about 502 ft (162 m). A descrip-tion of the deposit and a summary of the chemical-leaching datacan be found in Tweeton and others (1979). The lixiviant consistsof sulfuric acid, in concentrations up to 5 g/1, with addedhydrogen peroxide. The chemical data available to us consist ofreasonably complete analyses, including pH, Eh, vanadium, ura-nium, PQ,, molybdenum, selenium, and arsenic, taken betweenDecember 8, 1977, and April 12, 1978. Unfortunately, dissolvedH2S was not reported, so we could not consider any of the sulfideminerals in the computer modeling described below. Lixiviantwas injected into the four corner wells of a five-well pattern,about 175 ft (53 m) on a side (wells 16A, 17, 18, and 19 in fig. 7)and recovered from a central well (well 15 in fig. 7). We weregiven the chemical data from two observation wells, OB-1 andOB-3, to the northwest and southeast of the recovery well,
1-12
N
1 23•
0 30.5
SCALE
ROCKY MOUNTAIN ENERGYHALIBURTON JOINT VENTURE
20
21
I6A 17• 24 •
OB- I»* »0B-2
• 19 » I8
22
61 METERS
WELL LOCATION MAPNINE MILE LAKE SITE. WYO
FIGURE 7—WELI LOCATIONS AT NINE MILE LAKE, WYOMING (courtesyof Rocky Mountain Energy Corporation and the U.S. Bureau ofMines).
respectively (fig. 7). Although the data differ in detail, thegeneral chemical trends are the same from both OB-1 and OB-3;we will emphasize only well OB-1 in this paper. Tweeton andothers (1979) discuss chemical techniques, precision, and ac-curacy of the analyses. The analyses used in our modeling forwell OB-1 are presented in table 9, with the original values ofU3Og, silicon, and phosphorous recalculated to uranium, SiO2,and PO4, respectively.
The changing compositions of the leachates from well OB-ican be followed in figs. 8, 9, and 10. The data points shown inthe figures were chosen at intervals sufficiently close together toallow accurate plotting. The dates along the abscissa were chosensimply for convenience in drafting. As indicated in the figuresand listed in table 9, seven analyses were used as input to the
TABLE 9—CHEMICAL ANALYSES USED IN MODEI.INC: THE I EACHINC SOLUTIONS FROM WELL OB-1; dates correspond to those shown on figs. 8,9, and 10(all dissolved components in ppm; n.d.—not detected; from Tweeton and others, 1979).
Date pH Eh(mv) U V Na K Ca Mg SO,. Cl S102 Al P 0 , Fe Mn HC0s
11/30/77
12/16
01/07/78
01/30
03/11
04/0'.
04/12
6.7
5 . 6
1.9
1.8
2 . 5
2 . 3
1.8
-120
- 10
160
250
170
190
360
0.2 .5 740 11 150 96 2300 50
0.4 3.5 740 12 167 107 2300 49
39 100 740 20 237 150 4400 45
41 150 720 20 277 162 3100 49
53 490 750 17 220 125 3900 49
70 520 760 18 235 137 4200 46
111 820 740 20 260 150 5900 47
11
28
62
107
88
128
201
n.d .
1
36
45
36
52
85
n.d .
n .d .
1.8
1.5
2.1
4 . 9
12.9
1
1
1
1
1
.5
. 5
. 1
.5
. 5
.5
.5
.6
1.5
8 . 1
14
16
39
39(est.)
.3
.4
. 7
1.0
.9
1.0
1.3
250
70
n.d.
n.d.
n.d.
n.d.
n.d.

363
NINE MILE LAKE, WYO.IROCKY MOUNTAIN ENERGY AND US. BUREAU OF MINESI
WELL O B - l7000,
4 0 0
o o oFIGURE 8—OHM KM D pH, Eh, AND DISSOI \ ID SO, is sol i IIOSSIRIIM
WI 11 OB-l \s \ M M IIONOI IIMI
NINE MILE LAKE, WYO.(ROCKY M O U N T A I N ENERGY A N D U.S. B U R E A U OF M I N E S )
W E L L O B - l
- . 5 5 0
, £ « o - OJ o
£2 = ~ ~ ~ o
O in — O in w— c\j — CM O ~
s g s s i sFIGURE 9—C()N< LNIRAIION ()l- URANIl.M AND VANADIUM IN SOU 1IONN
IROM Wll 1 O B - l .
computer model. (A similar number of analyses were employedfor well OB-3 but are not presented here.) Because variations intemperature were minor, we used a constant 12°C (Tweeton andothers, 1979).
The original conditions in the ground water from well OB-lare illustrated for the date November 30, 1977, in figs. 8, 9, and10, and listed in table 9. The dramatically changing chemistrycan be followed in the diagrams for several months of leaching,through April 12, 1978. The pH dropped as low as 1.8 during theleaching. An important point (emphasized below) is the closesimilarity of the trends in concentration of uranium and SiO,.
Figs. 11, 12, and 13 present the original composition andchanges upon leaching for the solutions from well OB-3. Again,a strong similarity is observed in the form of the curves foruranium and SiO;.
Table 10 summarizes the computed model molalities of thedominant species of uranium and vanadium for each of the sevenwaters reported here from well OB-l. The trends in changingspeciation arc very clear. For example, in the natural groundwater, prior to leaching, vanadium was present in the +3 valencestale, predominantly as V(OH),". Uranium was present pre-dominantly in the +4 valence state, as the ion U(OH)< . In thesecond sample (table 10), after the pH had dropped slightly to 5.6and the Eh had risen about 110 millivolts, the vanadium waslargely in the +4 state. The uranium in this early leach water oc-curred chiefly in the +5 valence state. The changing valences andspeciation of vanadium and uranium reflect the rising Eh and thefalling pH.
The third sample (table 10), taken on January 7, 1978, reflectsthe influence of the sulfuric acid and resulting low pH. The chiefdissolved species of vanadium is V • , followed by VO: • . Thesedissolved species of vanadium show that the Eh was not yet highenough to produce a predominant +4 valence slate at such a lowpH. Similarly, the uranium was still present in the reduced +4valence state.
Beginning with the fourth sample, dated January 30, 1978, thespecies of vanadium and uranium became relatively uniformthroughout the remainder of the leach period. The vanadium ispredominately present in +4 valence form, but still with someVJ>, until the highest values of Eh (360 millivolts) were reachedon April 12, 1978. The sulfate complex of vanadium (VOSOj")remained a minor component. The uranium existed chiefly in theoxidized +6 state. Interestingly, the sample from April 12, 1978,showed a significant content of the biphosphate complex ofuranium, UO^HPQ,^2 • Unfortunately, we do not yet have the
NINE MILE LAKE, WYO.(ROCKY MOUNTAIN ENERGY AND U.S. BUREAU OF MINES)
WELL 08-1
220
200
180
-~ 160
I 140— 120
CM
O 100
S 80
60
40
20
-
o
; :
<
SiO
i—<f
—
L
oo
1.0/
O /1 /? /
/
ofO
5
1
/ \/ ^
1 1
N> < ^
i 1
_
•s,fO
OI
J>
o
o
IJ
//
/
X/
X
1
i -A •/M -OJ _
*ro
_
i
OK, O - jv, o ~ S v00 — CO (\J
w - OJ -
o oro tO O
NINE MILE L A K E , WYO.ROCKY MOUNTAIN ENERGY AND U.S. BUREAU OF MINESI
WELL 08-3500 r
400
100
90
8 0
70
60
50
40
30
20
10
~EQ.Q.
a;U-
B
7
6 -
5 -
I 4 .CL
3 -
2 -
1 -
r >200
- ^ 100 -
FIGURE 10—CONCENTRATIONS OI IRON AND SILICA IN SOLUTIONS FROM
W T L L O B - 1 .
0 L -200
FIGURE 11— OBSERVED pH, Eh, AND DISSOLVED SULFATE IN SOLUTIONSFROM WELL OB-3 AS A FUNCTION OI TIME.

364
TABLE 10—COMPUTED DISTRIBUTION OF PREDOMINANT AQUEOUS SPECIES OF VANADIUM AND URANIUM IN LEACHINGFLUIDS FROM NINE MILE LAKE. WYOMING, sampled from observation well OB-1; dates correspond to points onfigs. 8, 9, and 10. The value given in parentheses behind each computed species is the molality, expressed in togunits; note the pH and Eh observed on each date given.
DatepHEh
11/30/776.7
-120 mv
12/16/775.6
-10 mv
01/07/781.9
+160 mv
01/30/781.8
+250 mv
Logarithm oftotal measuredvanadium
-5.00
-4.16
-2.70
-2.53
Computed speciesof vanadium
V(OH)1 (-5.03)
V(OH)t (-6.52)
V*or (-4.76)
V0 2 + (-8.59)
V 3 + (-2.96)
V0 2 + (-3.08)
V0 2 + (-2.57)
V s + (-3.82)
Logarithm oftotal measureduranium
-6.14
-5.75
-3.78
-3.76
Computed speciesof uranium
U(OH)7 (-6.15)
Uot (-5.86)
U(OH), (-6.68)
U02C0? (-6.90)
U(SO,.)S (-3.80)
UOjSO!: '-4.21)
UOj(SO4)l" (-4.2;
U05 ( -4 .36)
03/11/782.5
+170 mv
-2.01 VO2 ( -2 .05)
V1 + ( -3 .30)
-3 .65 UOjSO? (-4.151
110,(SO*)!" ( -4 .20)
U O j (-4.31)
04/04/782.3
+190 mv
-1 .99 VO2 ( -2 .03)
,,3+ ( -3 .23)
-3 .53 UO2SO2 (-4.02)
U02(S0»)r (-4.07)
U02+ (-4.18)
04/12/781.8
+ ' ">0 mv
-1.79 V02+ (-1.81)
V0S02 (-3.25)
-3.33 UO2(SOo)l ( -3 .79)
U02S0£ (-3.80)
U0l+ (-3.93)
(-4.61)
NINE MILE LAKE, WYO.ROCKY MOUNTAIN ENERGY AND U.S. BUREAU OF MINES)
WELL OB-3
NINE MILE LAKE, WYO.ROCKY MOUNTAIN ENERGY AND U.S. BUREAU OF MINES)
WELL OB-3
FIGURE 11—CONCENTRATIONS OF URANIUM AND VANADIUM IN SOLUTIONS
FROM WEI I. OB-3.FIGURE 13—CONCENTRATIONS OF IRON AND SILICA IN SOLUTIONS FROM
WELL OB-3.

365
necessary thermodynamic constants to compute the concentra-tion of the uranyl trisulfate complex, UO^SO.,),4 , nor thephosphate complexes of vanadium.
Table 11 summarizes the saturation indices for a few of themore interesting minerals and solid compounds. The mineralsand compounds listed in the output from WATEQF do notnecessarily correspond to the true mineralogy of the ore and thehost rock. The saturation indices yielded by the computer modelsimply refer to the suite of minerals and compounds that could,theoretically, form from the dissolved components in the solu-tion. Actual minerals known to be present in the primary zones
of uranium deposits in Wyoming include uraninite and coffinite(Anderson, 1969), with such minerals as carnotite, tyuyamunite,and uranophane in the oxidized areas (Davis, 1969). Table 11lists the minerals and compounds in order, from greatest degreeof undersaturation to greatest degree of oversaturation. The ap-proximate value of the saturation index for each solid is shown inparentheses behind the name or formula.
In the preleach ground water (November 30, 1977, table 11), ahigh degree of supersaturation is computed for such solids asU^O,, coffinite, uraninite, karelianite, magnetite, hematite, andparamontroseite (chemical composition in tables 1, 2). The only
T A B L E 1 1 — C o M P l M t - U S A I ' U K A r i O N INDK'I'S ( l o g ( i . a . p . / K [ ) ) I O R S H l ( II D M I N I K A I S A N I X D M I ' O t NDSOI IN 11 Kl SI
mow NINI Mil i LAKI . WYOMING, OBSI-KVAHON » H I OB-I; the number in parentheses behind each solid com-pound is the saturation index, and the solids are listed in order of decreasing slate ol saturation with respect to Ihefluid.
Date
PHEh
11/30/776.7
-120 mv
undersaturation(S.I. less than
-0.3)
gypsum (-0.3)amorphous SiO2 (-0.6)amorphous U02 (-1.)duttonite (-1.)carbonates (below-1.)
saturation, orequilibrium(S.I. approximately
zero)
SiOj solids(0.4 to 0.)
supersatur.it ion(S.I. greater than
0.3)
lUO,coffiniteuraninitekarelianitemagnet i tepara-mont rose i tohematitemontroseite
(14)(6.)(5.)(4.)(3.)(3. )U.)(0.5)
12/16/77 amorphous U02 (-0.4)5.6 hematite (-0.7)
-10 mv carbonates (below -2 . )magnetite (-3.)
01/07/78 U(HP04)2 (-3.)1.9 amorphous U0 2 (-4.)
+160 mv U02HP0,. (-5.)all clays (below -8.)
01/30/781.8
+250 mv
u-o,ningyoiteU02HP0<,(U02)3(P0O2IKHPOOJ
(-0.7)
(-1.)(-3.)(-4.)(-5.)
03/11/78 (U02)3(P0,,)2 (-2.)2.5 amorphous (J02 (-2.)
+170 mv U(HP04)2 (-3.)
U 30 e (-4.)
04/04/78 (U02)3(P0,,)2 (-.1)2.3 U02HP0,. (-2.)
+190 mv amorphous U0 2 (-3.)
04/12/781.8
+360 mv
coffinite(U02)3(POJaUOjHPO,.uraniniteningyoite
(-0.4)(-2)(-2.)(-3.)(-4.)
amorphous S1O2 (-0.2)albite (-0.2)phlllipsite (-0.2)gypsum (-0.3)
amorphous SiO2 (0.2)gypsum (-1.)
gypsum
gypsum
(0.)
(-0.1)
gypsum
gypsum
(-0.1)
(-0.1)
U..0, (18.)coffinite (7.)alunite (f>.)all clays (1. to 6.)uraninite (6.)roscoelite (4.)V-montmorillonite (I.)
U 3 0 B (2.)adularia (.5)SiO2 solids (0.3)
coffiniteIUO,uraniniteSiO2 solidsningyoite
coffiniteSiO2 solidsuraninite
lUO,coffiniteuraniniteSiO2 solidsningyoite
U»0,coffiniteuraniniteSi02 solidsningyoiteamorphous SiO2
SiO2 solidsamorphous SiO2
(4.)(3.)(2.)
(1.)(.4)
(3.)(1.)(.7)
(10.)(6.)(4.)
(1.)(1.)
(7.)(5.)
(3.)
(1.)(1.)(0.5)
(2.)
(1.)

r 366
minerals that are close to equilibrium with the ground water aresome of the crystalline solid compounds of SiO:, such as quartz,chalcedony, and cristobalite. Prior to leaching, the water isundersaturated with respect to amorphous silica, amorphousUO;, dutlonite, the carbonate minerals (such as calcite), and allother minerals of uranium and vanadium. The concentration ofaluminum in the water was too low to detect in this native water,so we could not compute the state of saturation for the clayminerals.
In the early leach solution, on December 16, 1977, enough alu-minum had dissolved into the water ai a slightly lower pH toallow measurement (table 9). The resulting S.I. values (table II)show that the water was supersaturated with respect to severalminerals, including alunite, adularia, and several clays, such asroseoelitcand vanadium-rich montmorillonite. This informationis important because roscoelite is known to be abundant in thewallrock of the deposits (Tweeton and others, 1979). The waterwas supersaturated with respect to U4O,, coffinite, uraninite,L',OS. quartz, and chalcedony. Only amorphous silica, albite,phillipsite, and gypsum were close to equilibrium with this earlyleach fluid.
A profound chemical change occurred in the leaching solutionsampled on January 7, 1978. The pH dropped to 1.9 and the Ehrose to +160 millivolts; all of the vanadium minerals were thenstrongly undersaturated in the solution. This change was re-flected in the sudden rise in the conceniration of total vanadiumshown for well OB-1 (fig. 9), presumably a result of the break-down of the abundant roscoelite in the deposit. A very similarjump occurred in the total dissolved concentration of vanadiumin well OB-3 (fig. 12)on December 31, 1977, again correspondingto a computed instability of roscoelite.
The behavior of uranium in the leaching solution was note-worthy. After rising to a value of approximately 40 ppm in theearly leach solutions in both OB-1 and OB-3 (figs. 9, 12), thetotal concentration of uranium tended to level off and then tofluctuate around 40 ppm. This behavior is in contrast to therelatively continuous rise in vanadium; certainly, it is partiallythe result of continuous stripping of the uranium from the preg-nant solution by passage through an ion-exchange column on thesurface (Tweeton and others, 1979). However, a significant con-trol seems to exist on the concentration of uranium by one ormore solid phases in the ore. lor example, our calculated satura-tion indices (table II) show that the waters taken from OB-1remained supersaturated with respect to both uraninite and cof-finite throughout the leaching period, with the exception of thelast few samples in April 1978. This fact suggests that uraniniteand coffinite held the concentration of uranium to about 40 mg/1until the Eh finally rose to high values (fig. 8), at which time theuraninite, coffinite, and U4O,, finally became unstable and beganto dissolve readily into the leaching solution. Exactly the samestory unfolds for the waters from well OB-3.
Looking at the concentration of dissolved SiO, in figs. 10 and13, »e see that it also tended to level off, fluctuating around 100ppm for much of the period of leaching. Only if coffinite becameunstable and began to dissolve readily, as the calculations suggestfor the last few days of the leach, could the concentrations ofboth SiO, and uranium rise to high values. Comparison of therelative effects of pH and Eh on the chemistry of the leachingsolutions shows that Eh exerts the major influence on the stabil-ity of the uranium oxides; therefore, this parameter should bemaximized in the lixiviant.
The computer model also suggests a potentially important rolefor dissolved phosphate in controlling the solubility of uraniumin the leaching solutions. The concentration of dissolved phos-phate (calculated as PO4) never exceeds 13 ppm in any of thesolutions from either OB-1 or OB-3. Nevertheless, the mineralningyoite, a calcium uranium phosphate, appears supersaturatedin many of the solutions from both wells. Several other solidcompounds of uranium and phosphate are also close to satura-tion in the leaching solutions from both observation wells (table
11). These compounds obviously are quite insoluble under theconditions of the sulfuric acid leach and may reduce leaching ef-ficiency, at least until the Eh reaches very high values.
ConclusionAlthough many more comments could be made regarding use
of the model in studying leaching operations and in understand-ing the complex chemistry involved, this brief paper probably of-fers adequate insight into the potential usefulness of WATEQF inthis situation. The chemistry of natural aqueous systems and in-dustrial processes is so complex that use of a computer model isalmost essential to follow and understand the reactions and inter-relationships. Our modified version of WATEQF seems to offerpromise for additional understanding of uranium deposition,hydrogeochemical exploration for deposits, and in-situ leachingof ore deposits. Our present computer model is still too crudeand simplistic to provide a full understanding of the problems ofinterest; however, as we continue to work with the model, wehope to significantly improve usefulness of this tool.
A great many cautions could be offered regarding the practicalapplication of this computer program. Perhaps the most criticalaspect of the entire approach is the collection, preservation, andanalysis of the original samples of water. The field samplingshould be supervised by trained personnel who have some under-standing of the purpose and ultimate use of the samples, and thechemical analyses must be performed by laboratories that havedemonstrated their reliability and accuracy. The results of thecomputer model will be only as good as the chemical analysesthat arc used as input.
The greatest potential value of this approach may lie indistricts such as the Grants mineral belt, where deep drilling andhigh costs demand that maximum information be extracted fromeach drill hole.
ReferencesAnderson, D. C , 1969, Uranium deposits of ihe Gas Hills: University of
Wyoming, Contributions to Geology, v. 8, no. 2, pi. 1, p. 93-104Baes, t". F., Jr., and Mesmer, R. E., 1976, The hydrolysis of cations:
New York, John Wiley and Sons, 487 p.Barnes, I., and Clarke, F. E., 1969, Chemical properties of ground water
and (heir corrosion and encrustation effects on wells: U.S. GeologicalSurvey. Prof. Paper 498-D, 58 p.
Boberg, W. W., and Runnells, D. D., 1971, Reconnaissance study ofuranium in the South Platte River, Colorado: Economic Geology, v.66, p. 435-450
Davis, J. F., 1969, Uranium deposits in the Powder River basin: Univer-sity of Wyoming, Contributions to Geology, v. 8, no. 2, pi. I, p.131-142
Deltombe, E., DeZoubov, N., and Pourbaix, M., 1956, Comportmentelectrochimique du vanadium. Diagramme d'equilibre tension-pH dusysieme V-H,O a 25°C: Bruxelles, Centre Beige d'Etude de le Corro-sion, Rapport Technique No. 29
Evans, H. T., Jr., and Carrels, R. M., 1958, Thermodynamic equilibriumof vanadium in aqueous systems as applied to the interpretation of theColorado Plateau ore deposits: Geochimica el Cosmochimica Acia, v.15, p. 131-149
Langmuir, D., 1978, Uranium mineral solution equilibrium at low tem-perature, with application to sedimentary ore deposits: Geochimica etCosmochimica Acta, v. 42, p. 547-569
LaPoini, D. J., and Markos, G., 1977, Geochemical interpretation of orezonation at the Rifle vanadium mine, Colorado: U.S. GeologicalSurvey, Circ. 753, p. 53-55
Latimer, W. M., 1952, Oxidation potentials: New York, Preniicc-Hall,2nd edition, p. 259
Lueek, S. L., 1978, Computer modelling of uranium species in naturalwaters: M.S. thesis, University of Colorado (Boulder), 170 p.
Lueck, S. L., Runnells, D. D., and Markos, G., 1978, Computer model-ling of uranium species in natural waters: applications to exploration(abs.): Geological Society of America, Abstracts with Programs, v. 10,no. 7, p. 448

367
Naumov, G. B., Ryzhenko, B. N., and Khodalovsky, I. L.. 1971, Hand-book of thermodynamic data: U.S. Geological Survey, National Tech-nical Information Service, Doc. PB226 722, 328 p.
Nordstrom, D. K., and others, 1979, A comparison of computerizedchemical models for equilibrium calculations in aqueous systems, inChemical modeling in aqueous systems, Everett A. Jenne, ed.: Amer-ican Chemical Society, Symposium Series No. 33,914 p.
Plummer. L. N., Jones, B. F., and Truesdell, A. H.. 1976, WATEQF—aFORTRAN IV version of WATEQ, a computer program for calcu-lating chemical equilibrium of natural waters: U.S. Geological Survey,Water-Resources Inv. 76-13,61 p.
Stumm, W., and Morgan, J. J., 1970, Aquatic chemistry: New York,Wiley-lnterscience, 583 p.
Truesdell, A. H., and Jones, B. F., 1973, WATEQ, a computer programfor calculating chemical equilibria of natural waters: U.S. GeologicalSurvey, National Technical Information Service, Doc. PB 220 464,73 p.
Tweeton, D. R., Anderson, G. R., Ahlness, J. K., Peterson, O. M., andEngelmann, W. H., 1979, Geochemical changes during in-siiu uraniumleaching with acid: Society of Mining Engineers, American Institute ofMining Engineers, Preprint no. 79-43, 27 p.

368
USE OF HELIUM IN URANIUM EXPLORATION,GRANTS DISTRICT
by Richard H. DeVoto, Department of Geology. Colorado School of Mines. Golden. Colorado 80401.Richard H. Mead, Rocky Mountain Energy Company, 190 Pronghorn, Casper, Wyoming 82601,
Joseph P. Martin and Lyle E. Bergquist, Martin Marietta Corporation, Box 179, Denver, Colorado 80201
AbstractThe continuous generation of inert helium gas from uranium
and its daughter products provides a potentially useful means forremote detection of uranium deposits. The practicality of con-ducting helium surveys in the atmosphere, soil gas, and groundwater to explore for buried uranium deposits has been tested inthe Grants district and in the Powder River Basin of Wyoming.No delectable helium anomalies related to buried or surfaceuranium deposits were found in the atmosphere. However, re-producible helium-in-soil-gas anomalies were detected spatiallyrelated to uranium deposits buried from SO to 800 ft deep. Di-urnal and atmospheric effects can cause helium content var-iations (noise) in soil gas thai are as great as the anomaliesobserved from instantaneous soil-gas samples. Cumulative soil-gas helium analyses, such as those obtained from collecting un-disturbed soil samples and degassing them in the laboratory, mayreveal anomalies from S to 100 percent above background.Ground water samples from the Grants district, New Mexico,and the Powder River Basin, Wyoming, have distinctly anom-
alous helium values spatially related to buried uranium deposits.In the southern Powder River Basin, helium values 20-200 per-cent above background occur 2-18 mi down the ground-waterflow path from known uranium roll-front deposits. In the Grantsdistrict, helium contents 40-700 percent above background levelsare present in ground waters from the host sandstone in thevicinity of uranium deposits and from aquifers up to 3,000 ftstratigraphically above the deep uranium deposits. The use ofhelium in soil and ground-water surveys, along with uranium andradon analyses of the same materials, is strongly recommendedin expensive, deep, uranium-exploration programs such as thosebeing conducted in the Grants district.
IntroductionThe radioactive decay of uranium and its daughter products
has led historically to the effective use of the detection of theseproducts as remote sensors of uranium mineralization. Detectionof high-energy gamma radiation from the Bi-214 daughter in theU-238 decay series (fig. I) has led to widespread, effective use of
,236 SERIES
u92
Po91
Th90
Ac89
Ra88
Fr87
Rn86
At85
Po84
Bi83
Pb82
238 q4.5 X I0 9
YRS1
1 S23424
DAYS
234 .2.5 X I 0 5
^ YRS234 11.2
' MIN \230
8 XIO4
YRS1
•2261620YRS
J2223.8
OAYS
12183
MIN
121427
MIN
ALPHAPARTICLE
BETAPARTICLE
214 _41.6 X 10*
' SEC214
, 2 0MIN
2105
'DAYS
210138
DAYS
21020YRS
206STABLE
FIGURE 1—URANIUM-238 RADIOACTIVE-DECAY SERIES.

369
remote detection of anomalous Bi-214 concentrations and in-directl> of its ultimate parent, U-238, by borehole, ground, andairborne gamma-ray detection systems. Such gamma-ray detec-tion has led to discoveries of most of (he world's known uraniumdeposits (DeVoto, 1978a, 1978b). Gamma radiation, however, isattenuated in rock, soil, and air. Bi-214 gamma rays are ef-fectively shielded by 4-6 inches of soil or rock. Therefore, inexploration programs for buried uranium deposits, the remote-sensing aspect of gamma-ray detection of uranium mineraliza-tion is limited to borehole uses or to detection of halos ofanomalous radioactivity that are geologically related to theburied uranium mineralization.
Ra-222 is the only gaseous daughter product in the U-238decay series. Because of its gaseous and inert nature, Ra-222 mayescape and migrate away from its immediate parent, Ra-226, andits ultimate parent, U-238. Detection of anomalous radon con-centrations (by detecting alpha particles generated during itsradioactive decay) in soil gas and both surface and ground watershas been used with some success in the location of uranium min-eralization at shallow depths (Dyck, 1969, 1972; Fisher, 1976).The 3.8-day half life of Ra-222 limits the distance that it canmove from its immediate parent, Ra-226, and still be detectableas an anomalous concentration. The utility of radon detection atthe ground surface as an indirect remote-sensing technique forburied uranium deposits is limited to exploration targets atshallow depths, unless deep ground waters are sampled and an-alyzed for their radon content.
During the radioactive decay of the U-238 series, alpha par-ticles—helium nuclei (He* •)—are emitted by eight decay steps,including the decay of U-238 itself (fig. I). Alpha particles arepositively charged and readily pick up available free electrons inthe subsurface environment; they then become gaseous, inerthelium atoms. Because helium itself is not radioactive, it does notdecay away. The constant generation of nonradioactive, inerthelium gas from uranium and its daughter products provides apotentially useful means of remote detection of buried uraniumdeposits. The inert nature of helium insures that it will not com-bine chemically with other elements in rocks and waters. Thenonradioactivc nature of helium makes the detection of anom-alous amounts of it at substantial distances from uranium depos-its much more likely than Ra-222, with its short (3.8-day) halflife, or Bi-214 gamma rays, with their very short range in soil (4-6inches).
As a result of the remote sensing aspects of these radioactivedecay products, many workers have begun research to test theusefulness of helium detection in uranium exploration (Dyck,1976; Clark and Kugler, 1973; Clark and others, 1977; DeVotoand others, 1978; Reimer, 1976; Reimer and Otton, 1976; Pogor-ski and others, 1976, 1977). This paper summarizes the uses ofhelium in uranium exploration in the Grants district. New Mex-ico, based on test work conducted in the district as well as resultsof test work conducted in similar geologic settings. Much of thework summarized here was conducted jointly by staff membersof the Colorado School of Mines, Martin Marietta Corporation,and Earth Sciences, Inc., in a research program sponsored by theElectric Power Research Institute and the Wyoming MineralCompany (DeVoto and others, 1978). The test work includedsampling and analysis of the helium content of a) the at-mosphere, b) soil gas, and c) ground water in the vicinity ofseveral deeply buried (100-3,000 ft) uranium deposits in theGrants district. New Mexico, and in the southern Powder RiverBasin, Wyoming. In the Powder River Basin, the uranium depos-its occur in sandstones of the Ft. Union Formation (Paleocene)and Wasatch Formation (Eocene). In the Grants district, the testwork was conducted over uranium deposits in the WestwaterCanyon Member of the Morrison Formation.
The gas samples were analyzed in the field by a modifiedhelium-leak-detector mass spectrometer installed in a 4-wheel-drive truck. Instrument modifications and procedures providedfor batch sampling, removal of active gases, constant volume
and pressure measurements, and constant reference gas calibra-tion, which produced a sensitivity of ± 10 ppb (parts per billion)helium in air.
Atmospheric heliumThe helium concentration in the atmosphere at the surface of
the earth is approximately S.24 ppm (parts per million), althoughit varies from minute to minute and from place to place. At eachof the lest sites within the Grants district and the southernPowder River Basin, the atmospheric helium concentration gen-erally varied within the range of 5.16-5.29 ppm, although someindividual concentrations as low as 5.04 ppm and as high as 5.32ppm were measured. The instantaneous range was from 60 to 150ppb at different locations in a field site at the same time. Theaverage helium concentrations of the atmosphere at the groundsurface within the different test sites ranged from 5.22 to 5.24ppm.
At no test site did the variations of the ground-surface heliumconcentrations of the atmosphere display a systematic rela-tionship with diurnal or metcorologic changes. This seeminglyrandom nature of the variations in the atmospheric helium con-centration contrasts strikingly with the systematic diurnal varia-tions of the helium concentration in soil gas at the same localities(fig. 2).
No detectable helium anomalies were found in the atmosphereat ground level related to buried or surface uranium deposits.The lack of anomalous atmospheric helium over uranium de-posits from the surface to 3,000 ft below the ground surfaceindicates that atmospheric sampling for helium concentrationvariations is not a useful technique for uranium exploration.
Soil-gas heliumSurvey techniques
The helium-in-soil-gas test work has been conducted in severaldifferent modes: a) detailed profile and grid surveys of varioussample spacings over known uranium deposits buried 50-3,000 ftdeep; b) continuous-pumping and batch collection modes, gener-ally with the use of a 20-cm3 (cubic-centimeters) syringe; c)sampling grid surveys over short (2-3 hours) and long (1-3 days)time periods; d) soil collection in metal containers and laboratorydegassing and analysis; and e) using wide-spaced regional pro-files.
This test work has demonstrated the following factors con-cerning field soil-gas collection techniques: a) The syringe collec-tion technique yields increased flexibility, greater portability,and more reproducible results than the continuous-pun'ping sys-tem, b) Portable, lightweight, tubular soil-gas probes are dif-ficult to insert consistently to a ground depth greater than 2.5 ft.
ppm
He
5.30-
5.25-
5.20-
5.15-
5.10-
5.05'
ATMOSPHERE
I7OO 2100 0100 0500 0900 1300 1700TIME OF DAY
FIGURE 2—DIURNAL VARIATIONS OF HELIUM CONTENT IN SOIL GAS AND
m t AT MOSPHERE. AVERAGE oi- 12 STATIONS (DeVoto and others, 1978).

370
c) The results of helium-in-soil-gas sampling along profiles aremuch more difficult to interpret and are more ambiguous thangrid-sampling results, d) Grid-sampling on a spacing of 1,000 ftyielded results as interpretable and meaningful as results onsmaller grid spacings; larger (1,500- and 2,000-ft) grid spacingsdid not yield results that were as interpretable, so a maximumgrid spacing of 1,000 ft seems optimum for such surveys, e) Pro-nounced diurnal variations in the helium concentration of soilgas occurred at most of the test sites.
The helium concentration in soil gas increases during the nightand decreases by as much as 100-200 ppb during the sunlighthours (fig. 2). The diurnal variations display an inverse correla-tion with atmospheric temperature and, generally, a direct cor-relation with atmospheric humidity. Diurnal variations seem tobe reduced during the cold winter months. Based upon theseobservations, instantaneous helium-in-soil-gas surveys should beconducted with a probe collection system, on a grid pattern, andover a short time period or with careful and frequent reference toseveral base stations where frequent soil-gas measurements aremade throughout the survey.
Survey datasHOKT-HMt: SLRviYS—Reproducible helium-in-soil-gas
anomalies spatially related to uranium deposits buried 50-800 ftwere usually detected when the grid-sampling soil-gas surveyswere conducted in short time intervals. When an instantaneousgas sample was collected and analyzed, the anomalies averagedan amplitude between ' :-2 percent (25-100 ppb) and a maximumof i;p to 5 percent (250 ppb) above the background helium con-tent in the atmosphere (figs. 3, 4). The detailed patterns of theanomalies vary both from time to time throughout a single dayand from day to day. However, the significant areas of anom-alous helium in soil gas invariably occurred either spatially overor slightly displaced down the ground-water flow direction fromthe buried uranium deposit.
When surveys were conducted in both the morning and after-noon, the amplitude of the hclium-in-soil-gas anomalies abovebackground threshold levels was always greater in the afternoonthan in the morning. Generally, the amplitude of the anomalyabove background threshold was 30-60 ppb in the morning and50-100 ppb in the afternoon. The amplitude of the helium anom-aly showed no relationship to the depth of the subsurface ura-nium deposit. Because of the apparent displacement of some ofthe anomalies and the different sample spacing at different testsites, no clear relationship between the breadth of the anomaliesand the depth of the subsurface uranium mineralization was ap-parent. The broader soil-gas anomalies generally occurred overthe most deeply buried uranium deposits.
Gamma-ray spectrometry data of the eU and eTh contents ofthe soil and alpha electrometer data of the cumulative soil-gas
Uranium "roll-front"mineralization(380-600f1 deep)/
Uranium"roll-front"mineralization(700-800 ft. deep)
ICii. Kr. 5 —HI.I K M !N. son ov> ANOMALY MAP (ppb above background),SHuri-unre .sur»c>, wuihern Powder River Basin, Wyoming (DeVotoandultu:!!.. IVS)
FEE?FIGURE 4—Hi I IUM-IN sou I.AS ANOMAI Y MAM (ppb above background),
short-time survey, southern Powder River Basin, Wyoming (DeVotoand others, 1978).
radon content at the measurement sues show the importance ofmeasuring uranium, radon, and thorium contents of the soilwhile conducting soil-gas helium or radon surveys; locallygenerated radon and helium anomalies can then be separatedfrom those that are generated by buried uranium deposits.
LONGTIME SURVEYS—When the grid-sampling, soil-gassurveys were conducted over many hours in one or several days,the pattern of helium-in-soil-gas data seemed to bear very littlesystematic relationship to the distribution of subsurface uraniumdeposits. Soil-gas helium measurements were also made at refer-ence stations. The reference-station data showed that diurnalvariations of the helium content significantly influence dataresults and usability from samples collected over these long timeperiods. The average amplitude range of the anomalies dis-covered over buried uranium deposits in short-time surveys was25-100 ppb, and the average variations in daytime backgroundsoil-gas helium were at least 60 ppb (figs. 2, 3, 4). Therefore, realsoil-gas helium anomalies can be obscured and lost in the highlevel of background variations in soil-gas surveys over long timeperiods.
Laboratory analyses for HeVAr36 and HeVNe22 ratios wereconducted on soil-gas samples collected during a short timeperiod from the same locations as the field-analysis soil-gassamples taken over a much longer period of time. The short-timesamples showed anomalous soil-gas helium concentrations in ahalo above uranium deposits buried as deeply as 1,000-3,000 ft,whereas the long-duration soil-gas survey showed no anomalousconcentrations.
These data indicate that comparing soil-gas helium data fromsamples that were collected over long periods of time is difficultand possibly unreasonable. In order to realistically detectanomalous helium concentrations in soil gas over subsurfaceuranium deposits, one must either collect samples over a shortperiod of time or use a cumulative collection system in which thesample represents the helium accumulated in the soil gas over alonger period of time.
ACCUMULATOR SURVEYS—To devise a collection system inwhich the gas sample represents the helium accumulated in thesoil gas over a long time period, undisturbed soil samples werecollected in metal containers, and the helium was degassed fromthe soil and its contained moisture in the laboratory. Such soil-helium grid surveys have yielded helium anomalies 5-100 percentover background levels above uranium deposits buried 300-800 ft

371
N
1000
FEET
I K i l Kl 5—Hi 111 M I S son i.Kinxi K \ n . M I 13. T. 14 N., R. 10 \ \ ..t iKvsis DIMKU I (Chemical Projects, l t d . . 1978). Numbers on con-louis indicate anomalous helium content in soil moisture andmicmpores, expressed as percent above background content of appro\-imaicK 10 ppm He. Uranium ore occurs in Westvuiter Canyon Memberat 6(111 -fi in 750 It depths.
deep (fig. 5; Chemical Projects, Ltd., 1978). Soil sampling andmeasuring of the accumulated helium entrapped in soil moistureand microporcs have revealed helium anomalies with amplitudesthat were substantially greater than the background variation. Asin the case of radon soil-gas surveys (Fisher, 1976), a cumulative,helium soil-gas dcicction-and-analysis system is more effectiveand practical, and it may often be necessary to discern anom-alous helium in soil gas related lo buried uranium deposits. Thispreliminary work suggests that soil sampling, using the soil mois-ture's inherent capacity to trap and accumulate helium, is a prac-tical system that can be used effectively in detailed explorationprograms for buried uranium deposits.
KK.IONAI I'KOI ii is—Regional hclium-in-soil-gas traverses ofinstantaneous gas samples were performed in the Grants districtand the Powder River Basin to determine whether the large dis-tricts of uranium mineralization could be detected by a regionalsoil-gas helium survey of this type. Another purpose of thesereconnaissance traverses was to determine whether helium wasescaping from the outcrops of the upturned host sandstones andthe uranium mineralization. Soil-gas samples were collected overa period of days at varying hours by the syringe-probe collectionmethod. The samples were analyzed by the field-based mass spec-trometer using 1-mi sample spacing on long-distance profilesalong roads.
The reconnaissance data showed clustering of anomalous soil-gas helium concentrations over a portion of the southern PowderRiver Basin and Pumpkin Butics uranium districts in Wyomingand over most of the Ambrosia Lake uranium deposits in theGrams district (fig. 6). However, these regional traversesrevealed other areas of anomalous helium concentration appar-ently unrelated to uranium districts. No increase in helium con-centration was detected at the outcrop band of the uranium hostsandstones of the Morrison Formation in the Grants district.Since the regional data were collected over a period of severaldays in each survey, they reflect changes in meteorologic andother environmental factors as well as the presence of heliumderived from buried uranium deposits. The difficulty in cor-relating the regional anomalies with uranium districts and the up-turned host sandstones suggests that the interpretability andusefulness of regional soil-gas surveys are limited. However, thesuperiority of the cumulative collection system demonstrated atthe specific test sites suggests that regional surveys might be moreuseful if this collection system were used.
Helium in ground waterPreliminary reconnaissance ground-water sampling and
analysis for helium content were conducted in the Grants districtand in the southern portion of the Powder River Basin, Wyo-ming. When the helium was degassed from ground-water sam-ples into air samples, the air-sample helium concentration rangedfrom 4.60 to 16.09 ppm. Since the helium concentration of theatmosphere is usually 5.24 ±0.10 ppm, the degassed sampleswith significantly higher helium concentration represeni groundwater of anomalous helium content. A significant cluster ofground-water helium levels from 6.00-16.09 ppm (20-200 percentabove background levels) are found in the degassed air samplestaken 2-18 mi northeast of the uranium deposits of the southernPowder River Basin; this cluster is offset from the uraniumdeposits in the direction of ground-water flow (fig. 7). Theshallow ground water in the immediate area of the uranium de-posits generally does not display significantly anomalous heliumconcentrations. In fact, a large area of lower-ihan-atmospheriehelium concentrations (4.60-5.00 ppm) occurs over and down theground-water flow direction from some of the uranium deposits.The large area of anomalous helium concentration in I he groundwater seemingly results from helium emanating from the sub-surface uranium deposits, along with its movement verticallydown the stratigraphic sequence in the recharge area and up thestratigraphic sequence to shallow aquifers in the discharge area(fig. 8). Therefore, the position of anomalous helium concentra-tion in ground water derived from subsurface uranium deposits isdependent on the ground-water hydrology of the area.
In contrast, the uranium distribution in ground water in thesame area of the southern Powder River Basin is >1.0 ppb south-west of and up the ground-water gradient from the uraniumdeposits and generally <I.O ppb uranium north and east of thedeposits (fig. 9). Uranium distribution in this ground water con-forms to the model of soluble uranyl dicarbonate, moving insolution in the oxidizing ground water from the southwest to theuranium deposit area. The uranium-bearing water there en-counters a reducing environment in the sandstones where most ofthe uranium is precipitated from the ground water. The area of<!.() ppb uranium in ground water !< iln> :ir«-:i o f the reducedsandstone. Collection of shallow ground-wat" samples and an-alysis for uranium and helium concentrations would have beenvery useful in reconnaissance exploration and delineation ofrelatively small uranium-bearing areas if this type of survey hadbeen conducted prior to uranium discoveries in the southernPowder River Basin.
A reconnaissance hydrogeochemica! survey in the Grantsdistrict was limited by a scarcity of wells and showed ground-water uranium concentrations of 2-980 ppb. Anomalous ura-nium concentrations (>20 ppb) were confined to samples takenfrom the Dakota and Morrison Formations (fig. 10) in closeproximity to uranium deposits. No anomalous uranium inground water occurred where the uranium deposits were deeplyburied and where shallow wells produced water from stratigraph-ically higher sandstones—even when the well was directly overburied uranium deposits. A uranium-in-ground-water survey canbe extremely useful in exploration for uranium deposits if watercan be sampled from aquifers that are potential hosts for the ura-nium mineralization; however, the utility of such surveysdiminishes as the stratigraphic distance from and hydraulicdiscontinuity with the uraniferous aquifer increases. As deeperuranium deposits are sought, ground-water sampling from shal-low water wells becomes less useful. An important explorationtool might be sampling the water from exploration drill-holes inseveral aquifer horizons that are potential hosts for uraniummineralization. This sampling would be a search for a geo-chemical halo (larger area of uranium in ground water thanuranium in the rock) related to an undiscovered, deeply buried,uranium deposit. Water recovery from water-bearing zones indeep exploration drill holes—followed by geochemical analysis

—— ROADS
- ^ - OUTCROP
- - -" APPROXIMATE
^ 2 9 URANIUM MINERALIZATION(DASHED BOUNDARIES AREAPPROXIMATE)
(•) TOWNS
SOIL GAS SAMPLING POINT, Kgc GALLUP SANDSTONE S OVERLYINGJ"-' HELIUM CONCENTRATION = 5255ppm ' ' CREVASSE CANYON FORMATION
HELIUM CONCENTRATION = 5 280 PPm I Kdml DAKOTA FORMATION 8 LOWER1 ' MANCOS SHALE
STATION REFERENCE NUMBER240
I— [Qv I QUATERNARY VOLCANICS
| Tv | TERTIARY VALCANICS
lKpn.1 POINT LOOKOUT SANDSTONE1 ' ft MENEFEE FORMATION
Jm | MORRISON FORMATION
J I JURASSIC BENEATH' MORRISON FORMATION
n I TRIASSIC STRATA' (UNOIFFERENTIATEO)
Base Map: Chapman, Wood,and* Grlswold, Inc./1973
RISW RI7W RI6W RI6W RI4W RI3W RI2W RIIW RIOW R 9 W R8W R6 W
FIGURE 6—REGIONAL PROFILES, HELIUM IN SOU GAS. GRANTS DISTRICT (DeVoto and others, 1978).

373
\ 5300'\ Water
\\
\\
Level
TTownship6 Omll««
1
\\\
\• WELL LOCATIONS
6 91 HELIUM ppm IN WATER
<SS URANIUM MINERALIZATION
CONTOURS OF STATIC WATER LEVELS
• , SUBSURFACE WATER FLOW DIRECTION
— " CONTOUR OF HELIUM = 6.0 ppm
CONTOUR OF HELIUM = 5.0 ppm
Level
I I I I I
FIGURE 7—HELIUM IN GROUND WATER, SOUTHERN POWDER RIVER BASIN. WYOMING (DeVoto and others, 1978).

374
RECHARGE AREA
SW HIGH U, B.G. He
DISCHARGE AREA
HIGH He
NE
K r l . ' R h 8 — C i K O l M> » . \ I 1 K I HlW I'M US IN Rl I M I O S 11) HI 1 II M 'VM) I KAMI M ( D M I M IS ( jROl Nl> WAI l R SAMI'I I S AND URANIUM OR!
ID COM is. soi mi RN. I'CIUDI K RIM R UASI\ (DeVotoand others, 1978; cross section from Dahl and Hagmaier, 1974; Hagmaicr, 1971).
for uranium, helium, radon, and other constituents—could be acost-effective exploration technique. Packer isolation of theaquifers in the drill holes may be necessary to accurately deter-mine the formalion hosting the tested water.
The helium concentrations in the ground-water samples alsotested for uranium in the Grants district were 4.52-44.73 ppm.Anomalous helium concentrations in ground water do not coin-cide with anomalous uranium concentrations of the same watersamples. The water samples from the San Mateo uranium depos-its, all from Menefee and Point Lookout sandstones 2,000-3,000ft stratigraphically above the uranium-bearing Morrison sand-stones (figs. 10, II, 12), contain anomalous helium concen-trations (6.95-13.46 ppm) and background levels (<2 ppb) ofuranium. Water samples taken nearby in the Westwater Canyonore deposits, Ambrosia Lake area, have concentrations of bothanomalous helium (up to 44.74 ppm) and anomalous uranium(63-74 ppb). The ground-water samples with the highest uraniumconcentrations (320-980 ppb) were obtained from the WestwaterCanyon Member and Todilto Formation near uranium mineral-ization; these samples have background helium levels (4.52-4.88ppm). The ground-water sample from the Crevasse Canyon For-mation, near the Crown Point deposits, has an anomaloushelium concentration (8.81 ppm) but only a background uraniumcontent. These deposits occur 1,800-2,200 ft deeper stratigraph-ically than the Crevasse Canyon Formation (figs. 10,12).
The data suggest that helium moves with the ground water aswell as through the ground water vertically from subsurfaceuranium deposits. Anomalous helium concentrations can befound in ground waters located in stratigraphically higherhorizons than the uranium-bearing horizons. This movement ofhelium toward the atmosphere, independent of the ground-watermovement and through rocks relatively impervious to water,could permit surveys for helium in ground water to be useful inuranium exploration at all.depths. Sampling of water fromshallow water wells may be effective in detecting anomaloushelium concentrations derived from the radioactive decay of amuch deeper uranium deposit. Therefore, helium analysis shouldbe conducted routinely on all ground-water samples obtained by
a hydrogeochemical exploration survey or exploration drillingprogram.
ConclusionsThe continuous generation of inert helium gas from both ura-
nium and its daughter products provides a potentially usefulmeans for remote detection of uranium deposits. Reproduciblesoil-gas helium anomalies spatially related to buried uraniumdeposits at depths of 50-3,000 ft were detected in both instan-taneous gas samples and in gas trapped and accumulated in soilmoisture and micropores. This finding suggests that helium-in-soil-gas grid surveys may be useful in remote sensing for burieduranium deposits in exploration programs. These surveys will bemost useful if conducted a) over a short time period in an instan-taneous gas-collection mode or b) with an accumulator gas-collection system. Accumulator gas-collection systems (such assampling and degassing the soil) clearly render helium soil-gassurveys most useful in a uranium-exploration program. Thedetection of soil-gas helium anomalies over known uraniumdeposits buried as deeply as 800-3,000 ft suggests that suchsurveys can be extremely important in uranium-exploration pro-grams in which drilling depths are great and costs are high.
The helium and uranium ground-water data suggest that: a)detection of helium, uranium, and radon in ground-water sur-veys may be an extremely useful tool in reconnaissance and semi-detailed uranium-exploration programs; b) in shallow groundwaters, anomalous helium may be detected that originated fromradioactive decay of a deeply buried uranium deposit; c) helium,uranium, and radon anomalies in the ground water of a potentialhost rock for uranium deposits, such as the Westwater Canyonor Jackpile sandstone of the Morrison Formation, should pro-vide a larger exploration drilling target than the mineralizationitself; and, d) sampling ground water from favorable strati-graphic units and using the larger target provided by theanomalous helium, uranium, and radon would reduce explora-tion drilling required and be cost effective.
The use of helium in soil and ground-water surveys, along with

375
v 5300'\ WATER
\XEVEL
150001 WATER | 0| LEVEL •; m • IO
2.0
I
• WELL LOCATIONS
10 ppb URANIUM IN WATER
{0 URANIUM MINERALIZATION
CONTOURS OF STATIC WATER LEVELS
» SUBSURFACE WATER FLOW DIRECTION
— 3— URANIUM CONTOURS, ppb
FIGURE 9—URANIUM CONTENT UN PPBI av SHALLOW GROUND WATERS IN SOUTHERN POWDER RIVER BASIN, WYOMING (DeVoto and others,
1978).

376
SW NE
LOWERPART OFMANCOSSHALE
DAKOTASANDSTONE
MORRISONFORMATION
COW SPRINGSSANDSTONE
BLUFFSANDSTONE
MENEFEE FORMATION (Kmf)POINT LOOKOUT SANDSTONE (Kp)
UPPER I
SATAN TONGUE(Km«) OF MANCOS SHALEHOSTA TONOUE IKrh) OF POINT LOOKOUT'SANDSTONE
GIBSON COAL MEMBER (Keg) OF CREVASSE CANYON FORMATION
DALTON SANDSTONE MEMBER (Kcdo) OF CREVASSE CANYON F O R M A f W
STRAY SANDSTONE (Kc«) OF LOCAL USAGE M U L A T T 0 TONGUE (Kmm) OF MANCOS SHALE
DILCO COAL MEMBER (Kcdl) OF CREVASSE CANYON FORMATION
MAIN BODY OF GALLUP SANDSTONE (Kg)
MAIM BODY OF MANCOS SHALE (Km)
LOWER PART OF GALLUP SANDSTONE (Kgb)
LOWEST PART OF GALLUP SANDSTONE (Kgo) MAIN BODY OF MANCOS SHALE (Km)
MANCOS SHALE
SANDSTONE
KltlC
BRUSHY BASIN MEMBER (Jmb) MUDSTONE
"POISON CANYON 9AND3TONE OF ECONOMIC USAGEMUD3T0NE
WESTWATER CANYON MEMBER (Jmw)SANDSTONE
RECAPTURE MEMBER (Jmr)
Jet
Jb
Jmwu
Jmwl
FIGURE 10—SCHEMATIC DIAGRAM OF STRATICRAPHIC RELATIONS OF CRETACEOUS AND JURASSIC ROCKS, GRANTSDISTRICT (Santos and Thaden, 1966).

Groundwater Flow
Direction
ROADS
OUTCROP
. - - APPROXIMATE
GEOLOGICFORMATIONS
URANIUM MINERALIZATIONDASHED BOUNDARIES AREAPPROXIMATE Kdm| DAKOTA FORMATION 8 LOWER
MANCOS SHALE® TOWNS
>£ URANIUM CONCENTRATION (ppb)
• LOCATION OF WELL
5.09 HELIUM CONCENTRATION (pptn)
o 7 1 QUATERNARY VOLCANICS
Tv I TERTIARY VOLCANICS
Jm | MORRISON FORMATION
J JURASSIC BENEATHMORRISON FORMATION
TRIASSIC STRATA(UNDIFFERENTIATED)
(Kpm) Aquifer of nurc* of water
Kpml POINT LOOKOUT SANDSTONEAND MENEFEE FORMATION
Kge I GALLUP SANDSTONE 8 OVERLYINGCREVASSE CANYON FORMATION
FIGURE 11—URANIUM AND H E L I U M IN GROUND WATER. GRANTS DISTRICT (DeVoto and others, 1978).

378
HIGH U,B.G. He
AMBROSIALAKE
TREND
HIGH U,HIGH He
B.G. U,HIGH He
FIGURE 12—SCHEMATIC C;EOU>GK CROSS SECTION 01 URANIUM AND HELIUM CONTENT OF GROUND WATER WITH RESPECT TO AQUIFERS OF WATERSAMPI FS AND URANIUM ORF DEPOSITS. ORANTS-AMBROSIA LAKE DISTRICT. Note high helium content of ground waters from aquifers thousandsof feet above ore deposit at right end of diagram (DeVoto, Mead, Martin, and Bergquist, 1978).
uranium and radon analyses of the same ground waters, isstrongly recommended in uranium-exploration programs such asthose being conducted in the Grants district. Packer isolation andanalysis of ground-water samples (obtained by drill-stem tests ofthe favorable aquifers or other systems) for helium, radon, anduranium should become standard practice in deep-drilling ex-ploration programs.
Selected referencesAdkisson, C. W., and Reimer, G. M., 1976, Helium and radon-
emanation bibliography—selected references of geologic interest touranium exploration: U.S. Geological Survey, Open-file Rept. 76-860,44 p.
Auberts, A. A., Friedman, I., Donovan, T. J., and Demon, E. H., 1975,Helium survey—a possible technique for locating geothermal reser-voirs: Geophysical Research Letters, v. 2, p. 209-210
Bowie, S. H., Ball, T. K., and Ostle, D., 1971. Geochemical methods inthe detection of hidden uranium deposits, in Geochemical exploration:Canadian Institute of Mining and Metallurgy, Spec. V. II, p. 103-111
Brady, B. T., and Rice, R. S., 1977, Helium determinations as an ex-ploration technique in the Ambrosia Lake uranium district, McKinleyCounty, New Mexico: U.S. Geological Survey, Open-file Rept. 77-669,8 p.
Chapman, Wood, and Griswold, Inc., 1977, Geology of Grants uraniumregion: New Mexico Bureau of Mines and Mineral Resources, Geol.Map 31, 3 Sheets, scale 1:126,720
Chemical Projects, Ltd., 1978, Supplemental report, helium survey insec. 13, T. 14 N., R. 10 W., McKinley County, New Mexico, in Thepotential of helium as a guide to uranium ore: Electric Power ResearchInstitute, Rept. EPRI-EA-813, 25 p.
Clark, W. B., and Kugler, G., 1973, Dissolved helium in groundwater—apossible method for uranium and thorium prospecting: EconomicGeology, v. 68, p. 243-251
Clark, W. B., Top, Z., Beavan, A. P., and Gandhi, S. S., 1977, Dissolvedhelium in lakes—uranium prospecting in the Precambrian terrain ofcentral Labrador: Economic Geology, v. 72, p. 233-242
Dahl, A. R., and Hagmaier, J. L., 1974, Genesis and characteristics ofthe southern Powder River basin uranium deposits, Wyoming, U.S.A.,in Formation of uranium ore deposits: International Atomic EnergyAgency, p. 201-218
DeVoto, R. H., 1978a, Uranium exploration, in Uranium resource tech-nology update, J. G. Morse, ed.: ColoraJo School of Mines, p. 1-83
, 1978b, Uranium geology and exploration, lecture notes andreferences: Golden, Colorado, Colorado School of Mines, 396 p.
DeVoto, R. H., Mead, R. H., Martin, J. P., and Bergquist, L. E., 1978,The potential of helium as a guide to uranium ore: Electric PowerResearch Institute, Rept. EPRI-EA-813, 155 p.
Dyck, W., 1969, Development of uranium exploration methods usingradon: Geological Survey of Canada, Paper 69-46, 26 p.
, 1972, Radon methods of prospecting in Canada, in Uraniumprospecting handbook: Institute of Mining and Metallurgy, p. 212-243
-, 1976, The use of helium in mineral exploration: Journal of Geo-chemical Exploration, v. 5, p. 3-20
Eremeev, A. N., Sokolov, V. A., Solovov, A. P., and Yanitskiy, 1. N.,1972, Application of helium surveying to structural mapping and oredeposit forecasting, in Proceedings of the fourth international geo-chemical exploration symposium, M. L. Jones, ed,: London, Instituteof Mining and Metallurgy, p. 183-192
Fisher, J. C , 1976, Remote sensing applied to exploration for vein-typeuranium deposits, From Range, Colorado: Colorado School of Mines,Remote-sensing Rept. 76 2
Goldak, G. R., 1973, 4He mass spectrometry in uranium exploration(abs.): Society of Mining Engineers, v. 25, p. 47
Golubev, V. S., Osipov, Yu. G., and Yanitskiy, I. N., 1970, Some charac-teristics of migration of helium in the permeable systems of the upperpan of the earth's crust: Geochemistry International, p. 943-950;translated from] Geokhimiya, no. 11, p. 1341-1348
Golubev, V. S., Yeremeyev, A. N., and Yanitskiy, I. N., 1974, Analysisof some models of helium migration in the lithosphere: [translatedfrom] Geokhimiya, no. 7, p. 1067-1076
Grammakov, A. G., Glebouskaya, V. S., and Khaikovich, 1. M., 1965,On the theory of the helium method of prospecting for deposits ofradioactive elements: Voprosy Rudnoi Geofiziki, 5, p. 3-19, Cos. Geol.Kom. SSSR
Hagmaier, J. L., 1971, Ground water flow, hydrochemistry, and uraniumdeposition in the Powder River basin, Wyoming: Ph.D. thesis, Univer-sity of North Dakota
Hurley, P.M., 1954, The helium age method and the distribution andmigration of helium in rocks, in Nuclear geology, Henry Faul, ed.:New York, John Wiley and Sons, p. 301-329
Martin, J. P., and Bergquist, L. E., 1977, Study of the applicability of the3He/4He ratio of uranium prospecting: Final Rept. MCR-76-567,MMA Contract with ERDA/BFEC, Subcontract 76-006-L
Mead, R. H., 1979, The uses of helium in uranium exploration: Ph.D.thesis, Colorado School of Mines
Morrison, P., and Pine, J., 1955, Radiogenic origin of the helium iso-topes in rocks: New York Academy of Science, Annals, v. 62, p. 71-92
Naughton, J. J., Lee, J. H., Keeling, D., Finlayson, J. B., and Dority,G., 1973, Helium flux from the earth's mantle as estimated fromHawaiian fumarolic degassing: Science, v. 180, p. 55-57

379
Osile, D., Coleman, R. F., and Ball, T. K., J972, Neutron activationanalysis as an aid to geochemical prospecting for uranium, in Uraniumprospecting handbook: Institute of Mining and Metallurgy, p. 95-109
Pogorski, L. A., Quirt, S. G., and Blascheck, J. A., 1976, Heliumsurveys: A new exploration tool for locating uranium, petroleum, andgeothermal rources: Ontario, Chemical Projects, Ltd., Tech. PaperCPL-5/76
. 1977, Helium surveys—a new exploration tool for locatinguranium deposits: Ontario, Chemical Projects, Ltd., Tech. PaperCP1-6/77
Reimer. G. M,, 1976, Design and assembly of a portable helium detectorfor evaluation as a uranium exploration instrument: U.S. GeologicalSuney, Open-file Rept. 76-398
Reinier. G. M., Demon, E. H.. Friedman, Irving, and Otton, J. K., 1979,Recent developments in uranium exploration using the U.S. GeologicalSurvey's mobile helium detector: Journal of Geochemicnl Exploration,\. II. p. 1-12
Reimer. G. M., and Otton, J. K., 1976. Helium in soil gasand well waterin the vicinity of a uranium deposit, Weld County, Colorado: U.S.Geological Survey, Open-file Rept. 76-699
Santos, E. S., and Thaden, R. E., 1966, Geologic map of the AmbrosiaLake quadrangle, McKinley County, New Mexico: U.S. GeologicalSur\e>, MapGQ-515, scale 1:24,000

380
RADON EMANATION OVER AN OREBODY—SEARCH FOR LONG-DISTANCE TRANSPORT OF RADON
by Robert L. Fleischer, Howard R. Hart, Jr . , and Antonio Mogro-Campero,General Electric Research and Development Center, P. O. Box 8, Schenectady, New York 12301
AbstractDiscovery of subsurface uranium ore could be facilitated by
recognition of measurable concentrations of the radioactive gas2"Rn near the surface of the earth. Integrated measurementsmade over several weeks' lime show promise of giving greaterreproducibility than short-term measurements, which are moresubject to meteorological variability. Improved methods of in-tegrated radon measurements—free of "°Rn, thermal-track fad-ing, and moisture-condensation effects—allow readings that gen-erally are highly stable over time. Sixteen kilometers north ofThoreau, New Mexico, readings taken at 60-cm depth over a 13-month interval for 55 positions give different—but nearlyconstant—monthly readings at each position; the typical stan-dard deviation was 22 percent. Superimposed on that stable pat-tern have been three periods during which spatially groupedradon readings increased by a factor of two or more over theirnormal values. The simplest tenable description of the increasesis sporadic puffs of upflowing gas, originating from unknowndepths. The measurements are consistent with an upward veloc-ity of flow of about 10' cm/s (centimeters per second). If thisvelocity is maintained io depth, it is still insufficient to transportdetectable amounts of radon from the orebody at 90-m depth,uut it would be sufficient to reveal ore at 50 m or less. Downholemeasurements of permeability yield values generally too low forsignals to be delivered from the orebody by any of the mech-anisms already modeled. Occasional localised regions of ade-quately high permeability have been found, but their orientationand extent have not been measured. Although it is improbablethat this orebody was located by distant transport of radon, thepossible existence of occasional gas flow in the earth gives en-couragement thai at some sites such flow will aid exploration.
IntroductionOne method of searching for subsurface uranium deposits is
by recognizing elevated near-surface concentrations of gasemitted from ore. Of the three gases released by the radioactivityof uranium—the noble gases 4He, -'"*Rn. and -"Rn—only 22:Rn(radon) is both diagnostic of uranium and long-lived enough toundergo significant transport from its source. Since radon isradioactive, it can be readily measured in very low concentra-tions—down to one or two radon atoms in I020 molecules of gas.
Because various atmospheric fluctuations can alter the instan-taneous near-surface radon concentration in the ground, thepreferred method of measuring is to integrate radon concentra-tions ovgr periods of several weeks in order to average the short-term variations (Alter and Price, 1972; Fleischer and others,1972, 1975; Gingrich, 1975).
ACKNOWLEDGMENTS—We are indebted to R. P. Anderson, G.R. Morris, S. Ristorcelli, and J. Robertson for helpful discus-sions; to N. Salo of Western Nuclear, Inc., for his kindness insupplying data and allowing access to the New Mexico site; to C.Newton for providing earthquake data; and to W. R. Giard andL. G. Turner for experimental assistance. Portions of this workwere supported by the U.S. Department of Energy through Ben-dix Field Engineering Corporation.
Radon transportSince motion of radon in the ground is limited by decay of the
radon (with its 5.5-day mean life), diffusion theory implies thatmeasurable amounts of radon will not arrive from distances over
10-15 m (Tanner, 1964; Mogro-Campero and Fleischer, 1977,1980; Fleischer and Mogro-Campero, 1978). Radon signals frcmore at greater distances can only be recognized if a more system-atic transport mechanism than diffusion is present. Mogro-Campero and Fleischer (1977, 1980) have discussed possiblemechanisms, including atmospheric pumping (Clements andWilkening, 1974) and geothernjally induced convection. For oreat 100-m depth, sustained upward gas-motion speeds of 3 x 10 •'cm/s are required. (For an isotropic medium the gas-motionspeed is the flow speed divided by the porosity: cm'/cm2 -s).
This work represents a search for specific evidence of gas flowat a site where ore 90-100 m deep was located by drilling guidedby integrated radon measurements (Gingrich, 1975).
Vertical-flow testA simple but sensitive means of delecting vertical gas motion is
to measure the change that flow produces in the near-surfaceconcentration of radon (fig. 1). If the medium were in-homogeneous, the profiles would differ in detail, but the generalcharacter of the changes effected by flow would be similar. Infig. 1, the typical reading for the usual monitoring depth of 0.6 mwould be increased by a factor of approximately 2-3 by an up-ward flow of 7 V/D/T (corresponding to a gas speed of about1.5 x 10 Vcm/s for D = 0.03 cnvVs and T= 5.5 days) or decreasedby a factor of 6 if the flow is downward. Flow in this velocityrange could deliver recognizable signals from ore that is buried50 m or less.
RADOH CONCENTRATION (pCi/f)0 100 200 300 400 500 600 700 800
O
0.5
- : 1.0
1.5
2.0
EFFECTOFDOWNWARDFLOW,2.5
FIGURE I —RADON CONCENTRATION RATE VERSUS DEPTH CALCULATED FOR
ZERO VERTICAL FLOW AND FLOWS PER UNIT POROSITY OF ± 7 V U / T ,WHERE THE MEAN DIFFUSION DISTANCE V DT IS 1.2 M. AND THE MEAN DIF-FUSION TIME T is 5.5 DAYS; the horizontal scale is calculated to corre-spond to typical field values at Thoreau.

381
Test siteThe radon surveys were made 16 km north of Thoreau, Grants
mineral belt, in sec. 26, R. 13 W., T. 15 N., an area described byKistorcelli (this volume). The site was chosen because it includesa known orebody positioned well above the water table, locatedwith guidance from a radon survey, in a dry region which is partof the best-known uranium area in the United States. The areawas also chosen because it is stratigraphically uniform within ap-proximately 1-2 km of the site.
Surface exposures within a few kilometers of the site are eitherDakota Sandstone or Mancos Shale, with strata dipping by about4° to the north-northwest. The immediate survey area, hole loca-tions, and numbering are given in fig. 2 for the 200 grid. The sur-face slopes downward from both the north and south to thecenter; the low drainage line runs between holes 228-231, 233,221, and 218, and between 245-242, 232, 255, and 220. An 18-mescarpment rises in the northwest corner between sites 210 and207, and between 208 and 209. Fig. 2 indicates the location ofdrill holes used in our down-hole studies. The figure also showswhere ore at depths of 90-100 m was located by Western Nuclear,Inc. Exploration drilling was guided by a radon survey taken bytrack etching during the winter of 1972-73. As shown in fig. 3 theore, which is at least 40 m above the water table, was displaced 10m horizontally from the highest radon reading. Depths to waterin wells within a few kilometers of the site are 6.7-244 m, withdeeper values being observed close to the field site.
The ore sands in this and nearby sections lie in the BrushyBasin Member of the Morrison Formation, which contains avariety of distinct, different chemical environments. The strataassociated with the mineralized zones are believed to be discon-tinuous and often lenslike in character since they arc of fluvialorigin. Paths may exist for gas flow through or around the mud-stone near the ore. In contrast, the overlying Dakota and Mancosstrata are believed to be uniform and horizontally continuous.Just above the ore is a mudstone layer that closed off the hole ineach of 18 drill holes.
No major faults traverse the immediate survey area, but occa-sional earthquakes occur in the region. Within 75 km of the sitethe largest earthquake magnitude was 1.8 during the last year and4.6 during the last five years. No weathered or visibly altered
200-GRID
209 208 2 Q 7 206^205^204 203 202 201
G E - l f Y210 211 212 213 [214 215 | 216 217 216
6E-3-
227 226 225 224 223 222 221 220 219
GE-2-f. 233228 229 230 231 232 255 234 235 236
245 244 243 2 4 2 ^ 1 240 239 238 237
246 247 \248%/249 250 251 252 253 254
100 mOUTLINE OF URANIUMORE AT~l00m DEPTH
FIGURE 2—SITES FOR RADON MLASUREMENTS RELATIVE TO AN OREBODV AT90-100 M DEPTH: shallow holes arc numbered 201 to 255; deep holesused for permeability measurements are numbers GE-1, GE-2, GE-3,and 26-39.
40
NOV. 1972 TO JAN. 1973
10
K-0UTLINE OF URANIUMORE AT~!00m DEPTH
KIUURE 3—RADON \ \ H I S (IKAI KS M M ; - 3 0 J ) DI H KMINI I> \n Wi xn RNN u n AR 1N< .IN IHI WINII ROI 1972-7.1 (data courtesy of N. Salo).
cracks have been recognized in the few cores taken in or near theore zone. This absence implies that the region is not highly frac-tured, unless recent fraccring has occurred. How recent fractur-ing would need to be in order to escape detection throughchemical alteration is unknown.
In recent geological mapping, J- Robertson (personal com-munication, 1979) recognized the Blucwatcr fault, a major north-south feature, running closely along NM-57, 5 km to the east ofthe field site; lesser faults fan out from the Bluewater. From theBluewater fault an anticline extends westward close to McKinleyCounty Route 49, 3.5 km north of the site. Although Robertsonshows no faults crossing the radon-monitoring grid, a 1966photo-geological interpretation by Knox-Bergman-Shearcr (writ-ten communication, 1966, revised in 1971) shows joints in (henearby area, including one that extends cast-west along the northedge of our array. If these faults are genuine, smaller scale jointsand fractures arc probably present but not visible on aerialphotographs. Robertson also recognized northeast-southwest-trending vertical joints in sec. 25, just east of our study area.
The soil cover ranges from near zero at the top of the escarp-ment and at the south edge of the drainage to a depth of 10 m at aposition 18 m from (he base of the escarpment. The thickness ofthe soil cover grades to 7 m and 4 m at horizontal distances of 40m and 60 m, respectively, south of the escarpment. All of the gridholes are 61 cm deep except 208 and 209. These two encounteredrock at 51 cm, at the top of the escarpment.
TechniquesThe original device used for integrated-radon measurements
was simply an open cup with an alpha-sensitive plastic strip in theclosed end. The cup is placed at the bottom of a covered 60-cm-deep hole; radon enters the cup, and its alpha-particle decays arerecorded in the plastic as damage tracks that are counted afterbeing revealed by chemical attack. The improved device picturedin fig. 4 utilizes several improvements (Fleischer, 1977; Ward,1977; Ward and others, 1977; Fleischer and Mogro-Campero,1978, 1979a; Likes and others, 1979). The simpler, earlier systemhad several problems: 1) Another radon isotope, 22ORn, a decayproduct of thorium known as thoron, is recorded in abundancesthat are typically comparable with those from 222Rn (Fleischerand Mogro-Campero, 1979b). The unwanted signal can beeliminated by closing the end of the cup with a permeable mem-brane, delaying the entry of appreciable quantities of radon into

382
MC'rliRI: 4—A Ti RRAIH \ TRACK-HICII' RADON MONIIORINC, C L I' WIIH
\ M I R I > " " M I \ I H R \ M w u i u s u i \ M . in this example a color-changinghumidity gauge was used to slu>u that an acceptable humidity level waspresent.
the cup. The delay causes ihe shorter-lived -"Rn to decay, andonly tracks due 10 -"Rn are observed. 2) Water vapor that entersthe cup and cools can condense on the detector and reduce thesignal from the radon. That problem is eliminated by using adesiccant within the membrane-closed cup to lower the humidity.3) The original detector allowed track fading under warm ormoist field conditions. Replacement with thermally stable, water-insensitive plastics has solved thai problem. 1 horon-free, ther-mally insensitive radon detection is available commercially onlythrough Terradcx Corporation, Wj. ,iut Creek, California.
Data consistencyA critical question is whether our present-day radon-
monitoring technique is reproducible and sensitive enough to rec-ognize clearly an increase by a factor of approximately 2 (fig. 1).
The improvements described make the data capable of revealingsuch changes.
Fig. 5 compares data acquired at the site using the old open-cup system in 1976 with 1978 data from the new, dry, thoron-free, thermally insensitive system. The median values of the 1976readings appeared to vary in a systematic manner—high in thewinter and low in the summer—but the observation that, usingthe improved technique, the data does not vary significantly im-plies the earlier variations were probably instrumental (affectedby heat and moisture).
Month-by-month reproducibility at individual 60-cm-deepholes is characterized by a standard deviation of 22 percent,assuming distribution of values is Gaussian when no flow of gasis occurring. A change by a factor of two should be clearly recog-nizable, and a change by 40 percent (nearly two standard devi-ations) is probably genuine rather than instrumental.
Near-surface experimentsWe now have 13 sets of month-long readings taken by the im-
proved methods, which cover the interval December 10, 1977, toJanuary 13, 1979. These readings allow us to observe the stablepattern of the measurements and to seek natural temporal vari-ations in readings. In fig. 6, readings at individual holes areshown as a function of time. Two sorts of behavior are frequent.The simplest is a lack of variation, as seen in the northwest sec-tion for holes 225, 226, and 227. In the other common pattern,large changes are superimposed on the normally constant read-ings, as occurs in the north-central section for holes 204, 205, and206. Clear increases are most common in the 2nd, 6th, 12th, and13th monitoring periods.
Stable patternIn fig. 7, the median value at each hole is plotted to represent
the most usual value. Plotting averages rather than medians givessimilar qualitative results. Comparison of this map with theearlier one (fig. 3) shows remarkably little similarity, except thatthe second highest reading in fig. 7 is only 50 m from the highestvalue in fig. 3. However, the recent pattern shown in fig. 7 is areasonably stable one as shown by the relatively small variationsin the fig. 6 graphs. Relative to the median values, only 84 of 702readings are high by more than 5/3 times the median or low byless than 3/5 limes the median.
4 6 8TIME [MONTHS]
FIGURE 5—MhoiAN RIAOINCJSON THE ciRiD SHOWN IN Mci. 2 DURiNo RtptATUO SURVKYS; lower curve: values derived from the early, simpleopen-cup detectors show an apparent secular variation; upper data: new, dry, ihoron-free, thermally insensitive detection schemeshows no meaningful variation with the lime of year.

S 8 3TMCK PRODUCTIOH MTE (K IOO/O 1 -30 0MSI
§ 8 8 8 3 8 B S S 3 S 8 s 8 a
TUCK PRODUCTION RtTE ( l 000 / tm ! -30 O i t i l
O
73
mr
~ i KIMI 11 mi ™ i i i 'TTI i i i 11 mi r
J i i 111 „"—i—i 11i • i 1 1
TRICK PfiODuCTiO* <»»T( (lOOO'fn -50 D*»S»
O O O O O O O O O O O O O O O
1 I 1 . I 1
1 1 1 1 1 1 III
4 i
T *
1 1 1 1 I M i l
1 1 1 1 1 1 M |
X ,•• \
' V* >v• \>
s %%
i i 1111111 ,
i i f
9
*i
*
I I
>
\
i l id I 1 M i:
»
• -
-
. 1 1 1 ) 1 1 1 1 1 I
• - •
C;
TUC« MO0UCTIOM «»TC H0OO«>'- ]OD«J)
O 3 O O C
i i 1111
8 S
"-I \
r i><*..
i
II i
S S3
si
1 1 1 1 IL
S 3 S 8 3 S 81 1 '. 1 1 1 I I O 3
_ »
Jl 1 1 1 1 1 I l l l 1 1 1 1 I I *
»Tt ['O00'!»'-!OD11SI
K S 3 g
„ 1 1 I I I I III " " I I I Mill I I I IM1 M Mi l | 1 1 1 | |
\ i
i i i 11 II
£8£

384
200
4004I0./350 310
0 310 245 245205 310 230 340 2
400 340 245 275 300
0EC.IO.I977 TO JAN.I3J97 .OUTLINE OF URANIUMORE AT~IOOm DEPTH JAN. 15 TO FEB. 19,1978
I ICiURt 7—MlDIAN VAUISOI KI\I)IM.S At IAIH (II Mil HOI IS IORuini i i DAI \ is I . I W S IN I I I . 6; (mils arc as in fig. 1; here 0.95trucks/ nun--30Jcc|iiuls IpCi /.
Superimposed variations in radonThe unusual values just noted consist of 50 high readings and
34 low readings thai are distributed in time as shown in fig. 8.The noteworthy features are the peaks in the 2nd, 6th, and 13thperiods. In each case these peaks are preceded by a higher thanusual number of lows at times when there were no highs (in the1st, 5th, and 10th periods). These observations are consistentwith alternate intakes and emission of gas by the earth.
l-'ig. 9 consists of radon maps for the three periods of specialinterest, in which most of the unusually high readings appear. Ingeneral these high ratios are grouped, rather than randomlylocated, .in observation supporting the idea that a real systematicbehavior is being observed—not merely statistical fluctuations. Aportion of these data has pre iously been presented by Fleischerand Mogro-C'ampero (1979a).
0.30r-
120 180 240 300 360 "20TIME (DAYS)
FIGURE 8—VAKIAIION VMIH JIMI OI THE NUMIIEK OI LNUSLAIIV HIGH
READINGS (^. ' SIANDARI) DtVIAMONS) AND L'NUSUAI l\ LOW READINGSIOR THIRTI'lN 4-OH-5-»l'Ek I'I'XIODN.
OUTLINE OF URANIUMORE AT~l00m DEPTH
\^a%
1.04 0.86 — 0.83/B0.39
OUTLINE OF URANIUMORE AT~l00m DEPTHMAY 13 TO JUNE 17, 1978
1.26
OUTLINE OF URANIUMORE AT~l00m DEPTH
FIGURE 9—TRACK-PRODUCTION RATES IN THE 2ND. 6TH. AND 13THPERIODS RELATIVE TO T.ME MEDIAN VALUF AT EACH I OCATiON.

385
Origin of increasesOne possible origin of the increased radon observed during the
three events shown in fig. 9 is upward gas flow, which gives in-creases in near-surface concentrations of radon (fig. 1). Beforetrying to analyze this flow, we consider whether less interestingexplanations can be constructed for the increases. Possible causesof anomalous radon values have been discussed by Mogro-Campero and Fleischer (1980).
Radon concentrations versus depth may show shifts similar tothat displayed in fig. I for upward gas flow of 7 \ / D / T that couldbe produced by reducing D, because the escape rale of radon(given by -D times the concentration gradient dc/dz) would bereduced. The required change in D—by a factor of nearly 50—would demand a radical change in the soil. This change seemspossible only by wetting (Tanner, 1964). Since the input of waterwould need to occur over most of a month in each of ihe unusualperiods, we examined the weather records (available in detail fornearby Albuquerque) to learn whether unusual precipitation pat-terns were present. Correlations in rainfall between Albuquerqueand Thoreau will be imperfect, particularly during the summerthundershower season; however, periods of high shower activityat one site will normally also be active ones at the other. Fig. 10gives the records of three meteorological parameters, includingprecipitation summed over each of the 13 intervals for which wehave radon values. No correlation of high precipitation existswith cither high or low radon readings, nor does the average tem-perature or pressure seem related to the observed radon fluctua-tions. The wind velocity and direction are not shown becausethey do not correlate with the radon data; neither do more recent-ly acquired precipitation data S km from the field site.
A second explanation for the increased radon values is a local(near surface) increase in cmanaiion. Again, by controllingmoisture one might be able to alter the fraction of the radon thaiis released from the mineral grains. This alteration might occurthrough bursts of radon released by water etching of alpha-recoiltracks as hypothesized by Fleischer and Raabe (1978). Althoughthis increase is still an unproved phenomenon in nature, theproblem of poor correlation remains between the timing of pre-cipitation and the increases in radon. This model also fails to ex-plain the changing locations of the groups of high readings.
Intermittent vertical flows of a month or more in duration mayhave occurred in our survey area. The flow velocity can be de-duced from the model if the mean diffusion distance is known.From other (unpublished) experiments at Thoreau, we have in-
i I i I i I i I i I i I
§ 20
£^10
- TEMPERATUREVA ^ O \ ~_
7 jy^/PRESSURE N.
1 1 1 I i I i I i I
00
840 3U l
ce.GOGO
835
60 120 160 240 300 360 420TIME (DAYS)
FIGURE 10—VARIATION<»• PRUII'ITAIIONI'LH CLRIDU. AVIRAIATURfc. AND AVI RAlil PRtSSURfc (MtASURkl) AT Al UUOUbKOUl:) OYTH Tllfci3 I'tRIODSOl OBSfcRVATION
ferred a value of 1.13 m. Using this value, the gas velocitythrough the pores required to double the radon concentration atour measuring depth of 60 cm is 0.7 x 10-' cm/s. The depth fromwhich such flow originates is not determined by our near-surfacemeasurements, but the horizontal extent of the regions of upflowsuggests that depths of much less than 100 m are unlikely, unlesshorizontal permeabilities are much greater than vertical ones.The existence of a water table at 200 m or 300 m in the generalvicinity implies an upper limit on the vertical extent of the regionof gas flow.
Although the origin of the inferred puffs of radon is unknown,their existence indicates how to use radon to locate uranium inore. If sporadic puffs are to deliver radon messages from buried(but shallow) radon emitters, we need to establish baseline localreadings and regularly monitor those readings over enough timefor puffs to occur in an appreciable fraction of the area. Until thefrequency of these events in various geological settings is known,a realistic duration for such monitoring cannot be set. We ob-served four periods of significant updrafts out of 13, and thehigh regions included 40 of the 55 individual holes where radonwas measured.
Driving forceIf the observed enhancements are due to vertical flow, how is
the flow driven? Some possibilities appear unlikely. Sustainedatmospheric-pressure variations are probably not responsible forthe increases observed, because two of the emissions were duringdecreasing pressure, one during increasing, and one at a time ofconstant long-term pressure (fig. 10). Intermittent pressurechanges such as those associated with frontal passages (Clementsand Wilkening, 1974) or with wind effects (Fleischer and others,1979) arc probably not the cause; they are short events relative toour monitoring periods.
To assess whether earth strains could be affecting radon con-centrations, we obtained data from the Los Alamos ScientificLaboratory on earthquakes within 75 km of the survey site. Noearthquakes of magnitude greater than 1.8 occurred within thisperiod, and the nearest recorded event was of magnitude 1.3,with epicenter 18 km distant and 55 km deep. This event occurredduring period 5 of our monitoring—one of our two quietestperiods. Interestingly, the largest event recorded sinceSeptember, 1973 was of magnitude 4.6, 35 km distant and at ap-proximately that same depth. It happened during the beginningof the highly unusual two-month radon event described byMogro-Campero and Fleischer (1977) as possible evidence forconvective flow within the earth. However, in contrast to thatobservation, the highs observed here are not accompanied bysimultaneous nearby lows of comparable statistical significance.If the present phenomenon is also due to convective flow, thecharacteristic dimension of the cells must be larger than the ap-proximately 400 m size of the array, and the cells must undergohorizontal translations during periods of about a month. If thecause is not convection, a new, presently unidentified mechanismmust be sought. Earth tidal effects are being evaluated.
Effective in-situ permeabilitymeasurements
Several mechanisms have been suggested for the transport ofradon from orebodies at appreciable depth (approximately 100m). Such mechanisms include convection of soil gas by the geo-thermal gradient (Mogro-Campero and Fleischer, 1977) andpumping of soil gas by the changing barometric pressure (Clem-ents and Wilkening, 1974). The ultimate test of these mechanismsis a direct measurement of the predicted natural flow. Until suchmeasurements have been made, critical evaluations of proposedmechanisms must be based on theoretical models. A ksy un-known parameter in these models has been the permeability ofthe formations covering the orebody. Laboratory measurements

386
of the permeabilities of typical sandstone and mudstone coresamples yield values generally lower than 1 darcy (10 s cirf),whereas model calculations for convection or atmospheric pump-ing require greater than approximately 500 darcy for the suc-cessful transport of radon over distances of approximately 100 m(Mogro-Campero and Fleischer, 1980). A question which re-mains is the extent to which cracks, joints, and fractures lead tosignificantly higher effective permeabilities in the actual forma-tions. The goal of the experiments described in this section wasthe determination of effective permeabilities in the field. Themeasurements of effective permeability were made by injectinggas into the formation through a selected portion of a drill hole,measuring the flow (throughput) of gas and the pressure as func-tions of time, and interpreting the resulting data in terms of thepermeability of a homogeneous medium that would yield thesame data. A more detailed description of the experiment andresults is given by Fleischer and others (1979).
Two holes, designated GE-1 and GE-2, were drilled to depthsof about 85 m and 76 m (tig. 2); several existing Western Nuclearholes were opened and tested in their as-found conditions; andone existing hole (26-48) was redrilled and designated GE-3. Nowall-sealant was applied until after the completion of the ex-periments. Design and analysis of the field experiment are basedon an idealized model experiment. The description of the modelexperiment will be followed by a description of the experimentalapparatus and a discussion of the res'.ilis.
Consider a homogeneous permeable medium which oiieysDarcy's law and is charactered by a porosity c and a permeabil-ity k. Let the pressure-diffusivity be D = kP' «j, where P is theaverage pressure of the gas and 17 is the viscosity of the gas.Assume that the medium is penetrated by a drill hole of radius a.Start with zero gas flow and a uniform pressure in the medium.At time zero, force gas into the medium through the wall of thedrill hole with a constant tlux, F,, at the wall of the hole. The ex-cess pressure in the drill hole, P(t), will rise with time; P(t) isrecorded until the termination of the experiment at time T.
The mathematical analysis of the experiment is availablethrough the solution of the analogous thermal-diffusivity prob-lem (Carslaw and and Jaeger, 1959). The exact solution, used inthe analysis of the data, is a complicated integral of Bessel func-tions. A simple approximate solution suitable for qualitativediscussions is:
^J_a^L_'> [In2k
^ + 0.809] (1)
This approximation is good for Dt/a-»IO, an inequality which isfound retrospectively to hold for over 80 percent of the runs.Equation 1 implies that no final, steady-state value exists for themeasured parameter; it continues to change logarithmically, evermore slowly, as time progresses. The parameter must be mea-sured as a function of time in order to calculate the permeabilityk from the data, A plot of pressure versus time for he model ex-periment is presented in fig. 11.
The experimental apparatus comprised an array of packers, orinflatable plugs, to define the portion of the drill hole into whichgas was being injected; a blower and hose to inject air into thedesired region; and flowmeters and pressure gauges to measurethe throughput of air and pressure rise. The packers were con-structed of gum-rubber tubing (Minor Rubber Co., Inc., Bloom-field, New Jersey), 7.5 cm ID (inside diameter) by 0.55 cm wallthickness, with aluminum end flanges. Two lengths of packerswere used; the primary packers were 2 m long, and the secondarypackers were 0.75 m long. The packers were inflated with nitro-gen to 1.35 atm (atmospheres) in drill holes about 13 cm indiameter. The blower was an electrical spiral regenerative blower(4.7 //s at 0.07 atm, Rotron, Inc., Woodstock, New York). Theinjection hose was a 1.9-cm ID rubber garden hose. The pres-sures were measured by Magnehelic™ differential pressuregauges (Dwyer Instruments, Inc., Michigan City, Indiana). Thethroughput was measured either by pressure drop along a stan-
UJae•f)
10 P
RE
i
FLUX ^ —
S ^ PRESSURE
r^ I MODEL EXPERIMENT
1 1 . itoo 200
Ot/a2300 400
FIGURE II—PRI-SMM WKSIS IIMI t A I U 1 \ni> ion \ MOMI IM-IKIM l - M IS W H I l H P R I S S I R I IS Ml \SL Rl l> \ | ; 1 K \ I O N S 1 \ M 11 O \ \ IS
IMI'OSl I)
dard section of hose or by a ball-in-tube flowmeter made byDwyer.
In all experiments the uppermost packer was well below thesoil-sandstone interface (greater than 10 m) to avoid the highlypermeable soil. In the majority of the experiments the portion ofthe drill hole used was defined by the primary packer at the upperend and the bottom of the drill hole at the lower end. In order toensure that no leakage occurred around the primary packer, asecondary packer was placed about a mei'.r above the primarypacker to define a guard space whose pressure could either bemonitored to test for a leak or mainta'.ied at the same pressure asthe main test space in order to prevent any leakage. In practicethe primary packers formed good seals in the drill holes at •'••'site. In a few experiments two primary packers were i> tcdefine an intermediate portion of the drill hole.
The data for a typical run are shown in fig. 12. A conn", i onof figs. II and 12 shows that the experiment in the field is veryclose to the model experiment. The throughput, which is verynearly propo: ional to the flux, is almost constant during the ex-
ec
to
O.OIO
0005
n
-
—
T H R O U G H - P U T ^ ^ o °
s^ PRESSURE
f
, 1 , 1 , ! . | 1
120
100
8 0
60
4o
20
60 180 240120t (seconds)
FIGURE 12—EXCESS PRESSLRI- \SD IJIKOI I;HPI I W-RSI S risn urn \s t vPERIMENT PERFORMED isist. HOI i GEO (5.V9 M-77.5 \i); data are to becompared wiih predictions of mode! calculation presented in fie. 11.
[New Mexico Bureau of Mines & Mineral Resources, Memoir 38,1980J

387
TABLE 1 - S P K I H Ctested).
drill-holenumber
(date ot" run)
GE-1 (5'15/78)
GE i (5 1678)
GE-2 (5 16/78)
GE-2 (5 17-78)-
GE-3 (5 17 78)26-39 (5 10 78)
26-39 (5 12 78):
ADMITTANl't
totaldepth(m)
87
87
77.577.5
84
86.5
86.5
Oh DRILL HOIES
averagediameter
(cm)
12.7
12.7
12.812.8
16.312.9
12.9
('measured from
sectiontested1
im)
13.5-87
13.3-87
13.4-77.5
ffl 13.4-77.5
« 29.1-77.5
#3 44.8-77.5#4 53.9-77.5
13.7-84
14.5-86.5
#1 14.6-30.9« 30.3-46.6#3 46.0-62.3
#4 38.4-54.7
surface;
lime(s)
240
240
240
240
240
240240
240
120
240
240
120
(240)
-four vertical section
specificadmittance. Y
(Ss i aim-' m 1 )
2.802.84
5.2
5.05.9
8.37.1
4.3
310
4.7
1.6
610
1.6
periment; the pressure increases with time as predicted. Themodel experiment can be used as the basis for the analysis of ourdata.
Table 1 presents a simplified display of the experimental data.For the tested region of each drill hole the specific admittance Y(the ratio of the throughput per unit length of drill hole to thepressure rise), measured at the time indicated, is listed. Fromthese data and (he exact solutions for the model experiment, theequivalent permeabilities can be calculated for the regions pene-trated by the drill holes. The applicability of this approach islimited by several factors. In calculating the effective permeabil-ity, one infers the permeability of a single homogeneous,Darcy's-law medium that would yield the same data. In practicethe situation is quite different. The discrepancies may be of threedifferent forms:
1) A drill hole penetrates several formations of permeablesandstones and impermeable mudstones, and the analysis re-places these formations with a single average formation. Noattempt was made during the experiments to restrict the gas in-jections to specific lithologic units.
2) In one region the gas may move through a permeablesandstone, properly characterized by a Darcy permeability; inanother region the gas may move through large cracks andfissures that are not properly characterized by a Darcypermeability. Our analysis again artificially replaces thesequite different flow behaviors with a single Darcy permeabil-ity. Significant joints are very near the region of these exper-iments, and smaller fractured regions and joints are possiblethroughout this region.
3) The vertical orientation of the drill holes tends to yieldmeasurements of effective horizontal permeability. Any long-distance transport of radon from the orebody to an overlyingsurface depends on the effective permeability in a verticaldirection.The permeabilities obtained from the analysis of the data de-
pend only very weakly on the value of porosity t used; t appearsonly in the logarithm, whereas the permeability k appears as adirect factor. A value of i = 0.25 was used, midway in the ex-pected range of 0.15-0.35. The insensitivity of k to the value of eused can be illustrated by noting that a change in £ of a factor oftwo either way leads to only a 10 percent change in the valuecalculated for k.
Table 2 and figs. 13 and 14 present the results of the permeabil-ity analysis. The effective permeabilities vary widely, but mea-
surements made on different days (GE-1 and GE-2) agree. Intests of essentially the full length of the hole, the range of effec-tive permeabilities for the three freshly drilled holes is from 0.27to 0.56 darcy.
Some of the measurements presented in tables 1 and 2 weremade on restricted portions of the drill holes, obtained either bythe use of two primary packers (26-39) or by differences in admit-tance as a single primary packer was lowered (GE-2).
Measurements of permeability of core samples of the same for-mations taken about 2 km to the east indicate maximum inherentpermeabilities of about 0.2 darcy. As the region has a relativelysimple sedimentary geology, one can probably expect similarmaximum inherent permeabilities at the present site. Thus,
TABLE 2—Entciivi piHMI AMI n* oi DRIH n o u s ('measured fromsurface; ;four vertical sections tested; 'calculated from results of sec-tions indicated).
drili-holenumber
(date of run)
GE-1 (5/15/78)
GE-1 (5/16/78)GE-2 (5/16/78)GE-2 (5/17/78)
GE-3 (5/17/78)26-39 (5/10/78)26-39 (5/12/78)2
totaldepth(m)
87
87
77.577.5
84
86.586.5
#1
#2«#4
(#1.#2)
(#2, m(#3, #4)
#1#2
#3#4
(#3, #4)
sectiontested'
(m)
13.5-87
13.3-87
13.4-77.5
13.4-77.5
29.1-77.544.8-77.5
53.9-77.5(13.4-29.1)-1
(29.1-44.8)'
(44.8-53.9)'13.7-84
14.5-86.5
14.6-30.9
30.3-46.646.0-62.338.4-54.7
(54.7-62.3P
effectivepermeability, k
(Darcy, or KMcm-)
0.27
0.28
0.56
0.54
0.650.950.800.220.0881.35
0.4550.
0.500.14
105.0.14
240.
[New Mexico Bureau of Mines & Mineral Resources, Memoir 38,1980]

388
|MODELS, 100m OREft MODELS, 100 m ORE
1 - K i L ' R K 1.1 — l . O l i \ R I I I I M H IHM'l \ \ HI H I I ( I I V ) I'l K M ! M i l l H U N . l e f t :
range of permeabilities required h> models ol atmospheric pumpingiimi geoihermalh driven convection and range observed for coresamples; center: average effective permeabilities for the subsoil regionpenetrated by Cifc-1, -2. and -3: right: results for limited vertical sec-tions measured using C'ili-2.
FIGURE 14—Loi.ARtiHMii DISCIA> OI IKHIIIVI- pi -RMI \HII i n MIA
SI Rl I). I SINti AN Ol 1)11 OKI! 1 HIM t VVHK H INT1 HSI11S AN AMftIM 1)1 S
RH.ION 01 HII.H ci RMtABit i n The value in the center is ihe average ef-fective permeability of the subsoil region penetrated; the values to theright are for limited vertical sections; the highest value, 250 darcy, ismeasured ai a depth of about 60 m.
equivalent permeabilities much greater than 0.2 darcy probablyindicate the presence of cracks or fractured regions. The averageeffective permeabilities for the three holes drilled for this experi-ment are indeed somewhat larger than expected from corepermeabilities (fig. 13). However, these effective permeabilitiesof less than I darcy are much smaller than those required by thetwo transport mechanisms under consideration. In order for at-mospheric pumping or convection driven by the geothermal gra-dient to bring a significantly elevated radon concentration to thesurface from an orebody at approximately- 100-in depth, effectivepermeabilities greater than about 500 darcy are required (Mogro-Campero and Fleischer, 1980).
In the discussion of these transport mechanisms, we haveassumed the motion of the soil gas is through a quasihomogene-ous medium. The same physical driving forces could be effectivefor an extremely inhomogeneous medium, penetrated by a fewrelatively isolated channels or conduits, provided the conduitslead from the orebody to the surface with a sufficiently low im-pedance. The existing hole 26-39 has a limited region of very highadmittance or effective permeability (240 darcy) (fig. 14). Thisregion occurs at a depth of about 60 m, coincident with an ir-regularity in the drill hole which prevented the passage of the log-ging probe. This region, possibly a highly fractured region,would appear sufficiently permeable to be a potential conduit forthe transport of radon. Unfortunately, the orientation and extentof the highly permeable region is not yet known.
ConclusionsThe results show strikingly improved techniques, but they im-
ply limitations on the applicability of radon for sensing of deepuranium (uranium that is well below diffusionally traversedthickness of soil and rock). The improved instrumentation elim-inates spurious signals (fig. 5) and enhances reproducibility (fig.6). The clear difference between the 2.5-month radon survey (fig.3) and the 13-month survey (fig. 7) could be due to noise re-duction from the improved procedures; or it may come from a
change in radon patterns effected by the many holes that weredrilled during the time between the two surveys.
The magnitude of the inferred flow and its restriction here tocertain portions of the area at certain unpredictable times limitsthe chances of detection of subsurface ore to no more than 50 mdepth at such sites. Thorough sensing over the area requires morethan a single survey. At the present site, the changes in radonconcentration can be interpreted as due to long-distance trans-port of radon, but it does not appear that signals from the ore at100 m depth are presently recognizable. If drilling were based noton the results during times of updrafts but upon the stable long-term pattern (fig. 7), one of the two nearly equal persistent highvalues would have led to the location of the orebody. The originof the two highs is not presently understood.
ReferencesAlter. H. W., and Price, P. B., 1972, Radon detection using track
registration material: Terradex Corporation, U.S. Patent 3,665, 194Carslaw, H. W., and Jaeger, J. C , 1959, Conduction of heat in solids:
London, Oxford University Press, 2nd ed., p. 334-339Clements, W. E., and Wilkening, M. H., 1974, Atmospheric pressure ef-
fects on transport across the earth-air interface: Journal of GeophysicalResearch, v. 79, p. 5025-5029
Fleischer, R. L., 1977, Reducing noise in uranium exploration: TerradexCorporation, U.S. Patent 4,063,087
Fleischer, R. L., Alter, H. W., Furman. S. C , Price, P. B., and Walker,R. M., 1972, Particle irack etching: Science, v. 178, p. 255-263
Fleischer, R. L., Fiske, M. D., Hart, R. R., Jr., Likes, R. S., and Mogro-Campero, A., 1979, Anomalies in concentrations of radon in the earth:Grand Junction, Colorado, U.S. Department of Energy, open-filerept., GJBX-97(79), Oct. 30
Fleischer, R. L., and Mogro-Campero, A., 1978, Mapping of integratedradon emanation for detection of long-distance migration of gaseswithin the earth—techniques and principles: Journal of GeophysicalResearch, v. 83, p. 3539-3549
, 1979a, Radon enhancements in the earth: evidence for intermit-tent upflows?: Geophysical Research Letters, v. 6, no. 5, p. 361-364
, 1979b, Integrated radon mapping in the earth—assessment of the22ORn signal and its exclusion: Geophysics, v. 44, no. 9, p. I54I-IS4S
[New Mexico Bureau of Mines & Mineral Resources, Memoir 38,1980]

389
, 1980, Techniques and principles for mapping of integrated radonemanation within the earth, in Proceedings of natural radiation en-vironment I I I , T. G. Gesell, W. M. Lowder, and J. E. McLaughlin,eds.: Washington, D.C., Department of Energy, Conference-780422
Fleischer, R. L., Price, P. B., and Walker, R. M. . 1975. Nuclear tracks insolids—principles and applications: Berkeley, University of CaliforniaPress, 605 p.
Fleischer, R. L., and Raabe, O. G., 1978, Recoiling alpha-emittingnuclei—mechanisms for uranium series disequilibrium: Geochimica etCosmochimica Acta, v. 42, p. 973-978
Gingrich, J. E., 1975, Results from a new uranium exploration method:American Institute of Mining, Metallurgical, and Petroleum Engineers,Trans., v. 258, p. 61-54
Likes, R. S., Mogro-Campero, A., and Fleischer, R. L., 1979, Moisture-insensitive monitoring of radon: Nuclear Institute Methods, v. 159, p.395-400
Mogro-Campero, A., and Fleischer, R. L., 1977, Subterrestrial fluidconvection—a hypothesis for long-distance migration of radon withinthe earth: Earth and Planetary Science Letters, v. 34. p. 321-325
, 1980, Search for long-distance migration and subsurface r a d o n -natural radiation environment I I I , T. G. Gesell, W. M. Lowder, and J.E. McLaughlin, eds.: Washington, D.C., Department of Energy,Conference-780422
Tanner, A. B., 1964. Radon migration in the ground—a review, in Thenatural radiation environment, J. A. S. Adams and W. M. Lowder,eds.: University of Chicago Press, p. 161-190
Ward, W. J., I l l , 1977, A convenient method for reducing the "°Rnbackground in uranium exploration: Terradex Corporation. U.S.Patent 4,064, 436
Ward. W. J. , I l l , Fleischer, R. L., and Mogro-C'ampero, A., 1977, Bar-rier technique for separate measurement of radon isotopes: Review ofScientific Instruments, v. 48, p. 1440-1441
[New Mexico Bureau of Mines & Mineral Resources, Memoir 38,1980]
390
DIRECT MEASUREMENT OF URANIUM BYPROMPT-FISSION NEUTRON METHOD OFPULSED-NEUTRON BOREHOLE LOGGING
by Hugh M. Bivens, D. H. Jensen, Ralston W. Barnard, and William A. Siephenson,Sandia Laboratories. Division 2355, Albuquerque, New Mexico 871/5
AbstractThe capability provided by neutron logging techniques for the
direct measurement of uranium is extremely valuable, especiallyin low-grade uranium mineralization not in equilibrium. SandiaLaboratories is developing a technique based on the detection ofepithermal prompt-fission neutrons that result from the irradia-tion of uranium by 14-MeV neutrons from a pulsed-neutron gen-erator. A development-model logging probe 23/> inches (70 mm)in diameter has been used in a limited field evaluation of theprompt-fission neutron method of logging. From this a proto-type logging probe and the basis for log interpretation hasevolved. Additional logs required for interpretation are caliperand density logs. Additional probe development is underway, in-cluding a neutron generator with a neutron output greater thanW n/s (neutrons per second). A vendor is being developed as acommercial source for the neutron generator. A definition of theinterim logging system has been released, and the system even-tually developed will be defined in the open literature.
IntroductionDisequilibrium between uranium and its gamma-emitting
daughter products, and gamma emission by : ' :Th and •"'K, can bea significant source of error in the estimation of ore grade—and,therefore, ore reserves—from gross-count natural gamma-raylogs. An approach taken to correct for disequilibrium is deter-mining a disequilibrium factor, either positive or negative, for allor parts of an orebody and applying ihis factor uniformly to thegamma-ray logs. The disequilibrium factor is determined bycomparing the chemical assay from core holes to the gamma-raylogs of those core holes. This method has been generally suc-cessful in the past, although failures of the method probably arenot publicized. Dodd (1976) states that problems with gross-count gamma logging are increasing now that lower grades arebeing evaluated and that exploration is expanding to deposits inless familiar geologic and geoehemical environments.
Development of logging methods for the direct measurementof uranium has been undertaken by private industry and by theU.S. Department of Energy (DOE) as part of the technology-development portion of its National Uranium Resources Evalua-tion (NURE) Project. One group of logging methods involves theuse of a source of neutrons to irradiate the formation and thedetection of additional neutrons resulting from the fission ofuranium by the source neutrons (Duray, 1976). These direct-measurement neutron logging methods can be classified initiallyby the neutrons detected from the fission of uranium—thePrompt-Fission Neutron (PFN) and the Delayed-Fission Neutron(DFN) methods. The DFN method can be further classified bythe type of neutron source used, either a pulsed-neutron gen-erator or a 252Cf steady-state, isotopic neutron source. Czubek(1972) described the DFN and PFN methods using a pulsed-neutron generator. The 252Cf method was initially developed byprivate industry using a fairly intense 252Cf source (Eberline andSchreve, 1971,1972). Through its NURE project office at GrandJunction, Colorado, DOE later subcontracted the developmentof a «2Cf logging method using a much less intense neutronsource (Steinman, 1976). The DFN logging method using apulsed-neutron generator was developed by private industry(Givens and others, 1976). It is now offered by a uranium well-
logging service company (West and Hallenburg, 1978) which, atthe time of this writing, holds an exclusive license fiom the patentholder for the domestic use of the DFN uranium-loggingmethod.
The development of the PFN method was subcontracted byDOE through the NURE project office in Grand Junction toSandia Laboratories, a prime contractor to the DOE (CaldweU,1976). This development was undertaken because it had potentialadvantages over the DFN method. For example, the PFN methodis not affected by the fission of thorium, if it is present, nor bydelayed neutrons from the neutron activation of the oxygen iso-tope I7O. The much shorter observation time of the PFN methodalso offers the possibility of faster logging and high neutron-generator outputs through a higher pulse-repetition rate.
The objectives of the PFN logging project consist of a feasi-bility determination, development of the PFN method and loginterpretation, field demonstration of the PFN method andhardware, and support for the commercialization of hardware.This paper presents the current status of the PFN developmentproject.
ACKNOWLEDGMENT—This work was supported by the U.S.Department of Energy.
Theory of operationBoth the PFN and DFN logging methods for the direct mea-
surement of uranium rely on basic principles of neutron physics(Jensen, 1977). For the sake of conciseness, only the methods us-ing a pulsed-neutron generator will be described.
The PFN method and the pulsed-neutron DFN method bothuse a pulsed-neutron generator as source of 14-MeV neutrons.Although specific characteristics of neutron generators vary, thegenerators consist of a neutron tube (a miniature linear ac-celerator) which accelerates deuterium (D) and/or tritium (T)ions into a deuterium- and/or tritium-loaded target. The ac-celeration is accomplished with an accelerating gap in the tube.The accompanying D-T and/or T-D reactions generate pulses ofmonoenergetic 14-MeV neutrons. These pulses are typically 3-8microseconds in duration, which is the full width of the pulse atthe half-maximum level. The average generated-neutron-outputrate for currently available neutron generators is about the samefor both methods (about 1 x 10a n/s); however, the neutron out-put per pulse varies significantly between the PFN and DFNsystems. The DFN system has an optimum DFN signal at a pulse-repetition rate of 1 pps (pulse per second) but is generallyoperated at 2-5 pps to provide sufficient neutron output withoutany serious degradation of the DFN signal (Givens, 1976). Withthe PFN method, the neutron generator can be operated at ahigher pulse-repetition rate (100 pps or more), because a shortertime is required for counting the PFN signal after each pulse thanthat required to count the DFN signal.
Both methods are governed by the same physical processes thataffect the transport of the 14-MeV (million electron volts) neu-trons from the neutron generator through the borehole and intothe formation. The 14-MeV neutrons quickly lose energy, owingto collision of the neutrons with light nuclei (primarilyhydrogen). These collisions are referred to as elastic scattering.As the source neutrons slow down to a condition of thermalequilibrium, they traverse an energy region described asepithermal—above the thermal energy range. The lower limit of
[New Mexico Bureau of Mines & Mineral Resources, Memoir 38,1980]
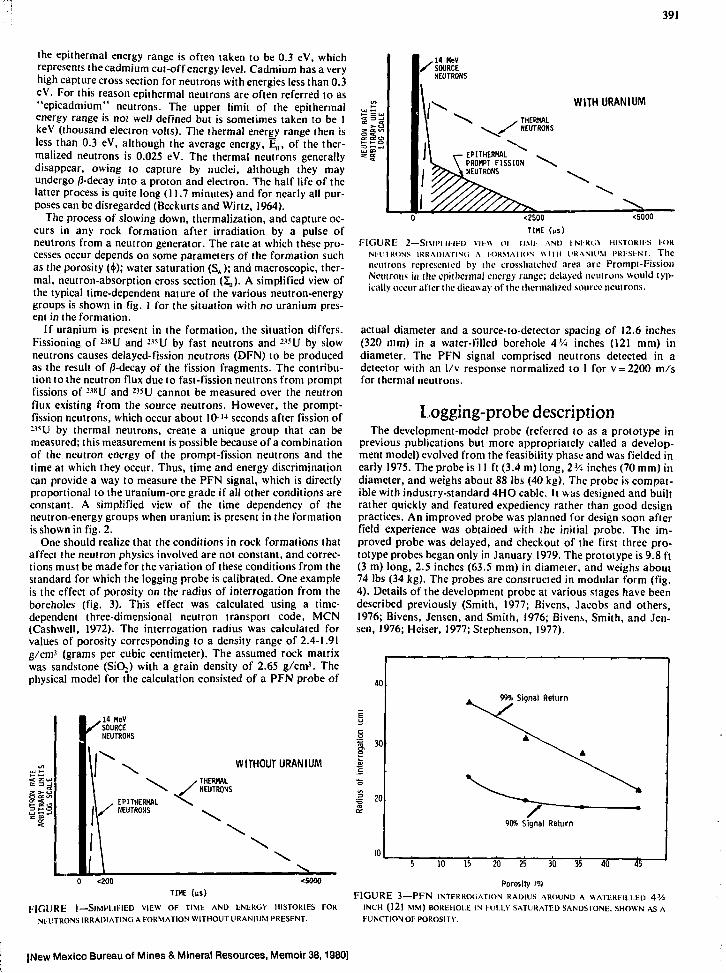
391
the epithermal energy range is often taken to be 0.3 eV, whichrepresents (he cadmium cut-off energy level. Cadmium has a veryhigh capture cross section for neutrons with energies less than 0.3eV. For this reason epithermal neutrons are often referred to as"epicadmium" neutrons. The upper limit of the epithermalenergy range is not well defined but is sometimes taken to be IkeV (thousand electron volts). The thermal energy range then isless than 0.3 eV, although the average energy, E ,, of the ther-malized neutrons is 0.025 eV. The thermal neutrons generallydisappear, owing lo capture by nuclei, although they mayundergo /3-decay into a proton and electron. The half life of thelatter process is quite long (11.7 minutes) and for nearly all pur-poses can be disregarded (Beckurts and Wirtz, 1964).
The process of slowing down, thermalization, and capture oc-curs in any rock formation after irradiation by a pulse ofneutrons from a neutron generator. The rate at which these pro-cesses occur depends on some parameters of the formation suchas the porosity (ij>); water saturation (Sv); and macroscopic, ther-mal, neutron-absorption cross section (Z,). A simplified view ofthe typical time-dependent nature of the various neutron-energygroups is shown in fig. 1 for the situation with no uranium pres-ent in the formation.
If uranium is present in the formation, the situation differs.Fissioning of 238U and -35U by fast neutrons and -'5U by slowneutrons causes delayed-fission neutrons (DFN) to be producedas the result of /J-decay of the fission fragments. The contribu-tion to the neutron flux due to fast-fission neutrons from promptfissions of :38U and 2'SU cannot be measured over the neutronflux existing from the source neutrons. However, the prompt-fission neutrons, which occur about 1014 seconds after fission of: "U by thermal neutrons, create a unique group that can bemeasured; this measurement is possible because of a combinationof the neutron energy of the prompt-fission neutrons and thetime at which they occur. Thus, time and energy discriminationcan provide a way to measure the PFN signal, which is directlyproportional to the uranium-ore grade if all other conditions areconstant. A simplified view of the time dependency of theneutron-energy groups when uranium is present in the formationis shown in fig. 2.
One should realize that the conditions in rock formations thataffect the neutron physics involved are not constant, and correc-tions must be made for the variation of these conditions from thestandard for which the logging probe is calibrated. One exampleis the effect of porosity on the radius of interrogation from theboreholes (fig. 3). This effect was calculated using a time-dependent three-dimensional neutron transport code, MCN(Cashwell, 1972). The interrogation radius was calculated forvalues of porosity corresponding to a density range of 2.4-1.91g/cm' (grams per cubic centimeter). The assumed rock matrixwas sandstone (SiO2) with a grain density of 2.65 g/cm3. Thephysical model for the calculation consisted of a PFN probe of
V 1 4 HeVSOURCENEUTRONS
WITHOUT URANIUM
THERMALNEUTRONS
<200 <5000TIME (us)
FIGURE 1—SIMPLIFIED VIEW OF TIME AND ENERGY HISTORIES FOR
NEUTRONS IRRADIATING A FORMATION WITHOUT URANIUM PRESENT.
-14 KeVif SOURCE
NEUTRONS
WITH URANIUM
<25O0 <5000
TtME (us)
FIGURE 2—SiMi'i iuii) VII » oi JIMI AND I N I R I A HISTORIES IORNllIRdNS IRRADIATING A IORMAIION WMII URANIUM PRESINI. Theneutrons represenied by the erosshatched area are Prompt-FissionNeutrons in the epithcrmal energy range; delayed neuirons would typ-ically occur after the dieawav of the ihcrmalizcd source neutrons.
actual diameter and a source-to-detector spacing of 12.6 inches(320 mm) in a water-filled borehole 4% inches (121 mm) indiameter. The PFN signal comprised neutrons detected in adetector with an 1/v response normalized to 1 for v = 2200 m/sfor thermal neutrons.
logging-probe descriptionThe development-model probe (referred to as a prototype in
previous publications but more appropriately called a develop-ment model) evolved from the feasibility phase and was fielded inearly 1975. The probe is 11 ft (3.4 m) long, 2% inches (70 mm) indiameter, and weighs about 88 lbs (40 kg). The probe is compat-ible with industry-standard 4HO cable. It was designed and builtrather quickly and featured expediency rather than good designpractices. An improved probe was planned for design soon afterfield experience was obtained with the initial probe. The im-proved probe was delayed, and checkout of the first three pro-totype probes began only in January 1979. The prototype is 9.8 ft(3 m) long, 2.5 inches (63.5 mm) in diameter, and weighs about74 lbs (34 kg). The probes are constructed in modular form (fig.4). Details of the development probe at various stages have beendescribed previously (Smith, 1977; Bivens, Jacobs and others,1976; Bivens, Jensen, and Smith, 1976; Bivens, Smith, and Jen-sen, 1976;Heiser, 1977; Stephenson, 1977).
40
99% Signal Return
90% Signal Return
10 15 20 25 30 35 40
Porosity TO
F I G U R E 3—PFN I N T E R R O G A T I O N R A D I U S A R O U N D A W A T U R I I L L E D 4V4
INCH (121 MM) BOREHOLE IN FULLY SATURATED SANDSTONE. SHOWN AS AFUNCTION OF POROSITY.
[New Mexico Bureau of Mines & Mineral Resources, Memoir 38,1980]

392
RESERVOIRCONTROLCIRCUIT
PULSEFORMINGNETWORK
PROMPT/THERMALMONITOR
TUBETRANSFORMER
ASSEMBLY PROPORTIONALCOUNTER TUBEAND AMPLIFIER
70 m\2 75 inl
Weight 40 kg (88 Ib.)
FIGURE4—Block DIAGRAMoi PFN PROUL.
Design and fabrication of Ihe neutron generator and the pulse-genfrating assembly in the development probe were subcon-tracted by Sandia lo the General Electric Neutron DevicesDepartment (GEND), St. Petersburg, Florida (Thibideau, 1977).For the prototype probe, Sandia also subcontracted to GEND theredesign of ihc DC-DC converter and pressure-conirol moduleand the fabrication of all modular hardware (plus spares) forthree complete probes.
The neutron generator for the prototype probe was redesignedto operate at a higher voltage (125 kV)than that of the generatorin the development probe. The generator is essentially a neutron-tube-transformer assembly (TTA) as shown in fig. 5; a com-parison of the external configuration of the initial TTA designand the present one is shown in fig. 6. The new TTA has adiameter 0.25 inches (6 mm) smaller, which allows a correspond-ingly smaller diameter logging probe. The higher voltage TTAplus changes in the neutron tube will provide a neutron output ofI01* iv s, at 100 pps. The original goal was 10'° n/s, but this goaldocs not now appear feasible in • mall probe.
The operational life of the neutron generator seems to belimited by the pulse transformer in the TTA. The longest lifeobserved has been aboul 35 hours of operation (12x I0*1 shots at100 pps). On the other hand, this neutron tube has been tested100 hours in one test and 65 hours in another test without failure.We have not tested a tube to failure yet. Techniques are beingde\ eloped to re-use neuiron tubes in TTAs. Why the pulsetransformers last only 25-35 hours is not clear. A possible ex-planation is that electrical stresses created in the transformer andits encapsulant due to occasional breakdowns across the ac-celerating gap in the tube eventually lead to electrical failure ofthe pulse transformer. A series resistor has been added between
the pulse transformer and the neutron tube to minimize these ef-fects, but TTA operational-life data have not yet been obtainedwith this configuration.
The neutron-generator output is monitored by a 360° cir-cumferential plastic scintillator around the neutron-tube target.The plastic scintillator is an efficient detector of the 14-MeVsource neutrons, but neutrons backscattered into the detectorfrom the formation cause a significant but relatively constant er-ror. The light scintillations are transmitted by light pipes to aphotomultiplier tube in an adjacent module. Through appropri-ate circuitry, the downhole neutron-output signal modulates thewidth of a 28-voIt pulse, which is transmitted uphole for displayas the neutron output on a chart recorder.
The epithermal PFN signal is derived from a3He proportional-counting (P.C.) tube wrapped with 1.5 mm of cadmium foil. The3He tube is pressurized at 10 atm (atmospheres), is 2 inches (50.8mm) in diameter, and has an active length of 10 inches (254 mm).The normal bias voltage of 1,900 volts is reduced to 1,300 voltsfor a period of 50 microseconds after the start of each neutronpulse. This bias removes the'He P.C. tube from the multiplica-tion region of operation and reduces its sensitivity to overloadfrom the 14-MeV neutrons. Through amplification and signalconditioning, the PFN signal pulses from the JHe detector areconverted downhole to 5-microsecond-wide 28-volt pulses whichare transmitted uphole.
The thermal-neutron flux is measured by a surrogate method;high-energy gamma rays resulting from the absorption of ther-mal neutrons by nuclei in the rock matrix are detected andcounted instead of thermal neutrons. A 19 mm by 19 mm Nalscintillator is used for detection of gamma rays. The scintilla-tions are viewed with a photomultiplier tube, the output of which
TUBETRANSFOflMBJ ASSEMBLY (CONTBOlATRONt f f ^ -. T—ifc '"W^ -Mggfjr- //
FIGURE 5—CROSS SECTIONAL VIEW OF NEUTRON TUBE-TRANSFORMER FIGURE 6—PHOTOGRAPH COMPARING TWO TTA JES'JNS; the TTA in iheASSEMBLY (TTA). bottom of the picture is 6 mm smaller in diameter.
[New Mexico Bureau of Mines & Mineral Resources, Memoir 38,1980]

393
is biased to eliminate all gamma rays with energies less thanabout 2.6 MeV. This bias, of course, eliminates the 2.2-MeV cap-ture gamma from hydrogen. The most prolific contributor to thehigh-energy capture signal is silicon, which has 3.5 and 4.9 MeVcapture gammas. Silicon is a relatively constant constituent ofsandstone, which is the host rock for most domestic uraniumdeposits. The commitment to the gamma-ray-surrogate methodof measuring the thermal flux is being reviewed. For oil-well log-ging at least, the gamma-ray method is considered preferable fordetermining the neutron lifetime (absorption cross section) of therock matrix around a borehole.
Uphole instrumentationThe uphole instrumentation in the logging vehicle is mainly
made up of standard equipment such as count-rate meters, strip-chart recorders, tape drives, power supplies, and the instrumen-tation associated with the draw works. The nonstandard butcommercial equipment comprises a multichannel analyzer oper-ated in a muliiscaling mode and associated buffers for acquisi-tion and read-out of time-resolved data from the PFN probe.Because commercial logging probes such as caliper and gamma-gamma density are run in addition to the PFN probe, a controlbox was designed and built to properly interface each probe tothe data-acquisition and control instrumentation.
Power is supplied to the PFN probe by 500 VDC (volts DC) onone conductor of the 4HO cable. This conductor also carries thetrigger pulse to the neutron generator in the probe. The otherthree conductors in the cable carry the neutron-generator outputmonitor (called the prompt monitor), the epilhermal PFN signal,and a signal that is proportional to the thermal-neutron flux inthe formation. The cable armor provides a common ground. ThePFN signal pulses are fed into the multiscaler which time-resolves the PFN input pulses into 50-microsecond bins and ac-cumulates the PFN signal pulses after every pulse of 14-MeVneutrons. The PFN data are accumulated until a data-dump sig-nal is received, and the PFN data are then written on tape. Eachdata-dump signal also causes data identifiers to be written ontape at the same time. Until September, 1978, the data-dumpsignal was generated when the neutron-generator output monitorindicated a cumulative output of I01* neutrons. Since the depth-encoding equipment in the logging truck provides depth measure-ments in meters, the logging speed was adjusted to provide ap-proximately 109 neutrons per 5.9 inches (0.15 m). This methodwas changed to dump the data on depth (every 0.15 m). The log-ging speed is varied to provide sufficient neutron irradiationevery 0.15 m as required by the lower cut-off level of uraniumgrade.
Logging procedureOur field logging is presently accomplished with a logging
truck and a heavy-duty van. The van carries all the loggingprobes and other equipment. Because this is still a developmentproject, the van also is configured with a small bench and somebasic lab equipment to allow the probes to be repaired in the fieldif necessary. The use of this van has become an integral part ofour logging operation, which now uses a two-man crew. The twovehicles are located back to back around the borehole. Probes areremoved from their racks and replaced in them with the aid ofthe logging truck and its "A" frame (fig. 7).
The normal logging procedure is to run the PFN log first andthen run the caliper and y-y density probes. The caliper and den-sity probe is a single tool, and both measurements are made inone pass of the probe. This probe also contains a Nal crystal usedto run a gross-count natural gamma log at the same time. How-ever, the gross-count gamma signal is not calibrated and cannotbe directly compared with other y logs. It is used to compensatefor natural y background in the determination of density of y-ybackscatter.
f
FIGURE 7—PHOTOGRAPH <>I LOGGING TRUCK AND HI.I D-SUPPOKT VANUSLDIOR P F N LOGGING DLMONS1 RATIONS.
The PFN logging procedure consists of a downhole scan at9-18 m/min (meters per minute) to identify zones of interest.Logging uphole to assay these zones has been done at speeds be-Iween 0.3 m/min and I m/min depending on the estimated oregrade.
All the data from the logging probes are recorded on magnetictape. The data are entered on tape corresponding to a data-dumpsignal which can be adjusted for variable depth intervals.
A four-channel strip-chart recorder provides an analog displayof all count-rate data in the field. The PFN analog signal in-dicates the presence of uranium but does not reliably indicateeven a gross estimate of ore grade. The data written on magnetictapes are analyzed on computers at Sandia. Although having acomputer in the logging truck for data analysis would be desir-able, the limitations of space and time for software developmentprecluded such an approach.
Log interpretationField evaluations of the PFN probe have been conducted in
northern Arizona, the Grants mineral district of New Mexico,south Texas, and various districts of Wyoming. In the last twoyears the field logging has been almost exclusively in Wyomingand Texas. This time period also coincides with the period inwhich we have used caliper and density logs for interpretation ofthe PFN log and incorporated the measurement of the thermal-neutron dieaway in the PFN probe. The thermal-neutron die-away time (re) is also used for log interpretation in one of themodels being used.
Computer calculations with neutron-transport codes show thatfor all formation parameters being constant, the PFN counts are

394
directly proportional to the uranium ore grade. However, thePFN signal can also be shown to vary because of changes in for-mation parameters even if the uranium-ore grade remains con-stant. The crux of the log-interpretation problem is to determinewhether changes in the PFN signal from a known calibrationcondition in a test pit result from changes in the formationparameters or changes in the uranium-ore grade. The principalproperties of a formation that affect the PFN signal are theamount of hydrogen in the formation and the macroscopicthermal-neutron absorption cross section (1,) of the formation.The hydrogen is usually contained in the formation water, al-though it can also be bound chemically within the rock matrixitself.
The approach that has been taken in log interpretation is todevelop a universal model that describes the PFN signal as afunction of all the parameters affecting it. The log-interpretationmodel that has been used is based on the theoretical PFNresponse functions derived by Czubek (1972). This approach toiog interpretation is rather idealistic and difficult, but eventuallyit should be more beneficial than a strictly empirical approach.From a practical standpoint, however, using empirical relation-ships in our log interpretation was necessary.
The functional relationship between ihe epithermal PFNcounts and the parameters of the formation and the borehole canbe expressed as
Cl = f(U.d,e.2s,2 a ,N0---)where C, = epithermal PFN counts
U = uranium amountd = borehole diameterQ = formation density
\ = formation macroscopic scattering cross section£, = formation macroscopic absorption cross sectionNo = number of 14-MeV neuirons
The number of thermal-neutron counts, Ce, can be expressedfunctionally as
= f(Z.a,No)Thus, the ratio, R, would be
or conversely the estimated uranium amount, Ue, would be
U, = C< f(e)g(d)h(2;)Q
This relationship can be determined from boreholes, either realor simulated, with accurately known uranium amounts and for-mation and borehole parameters. This calibration equation wasdetermined using the gamma-ray calibration pits at the DOE fa-cility in Grand Junction, Colorado. However, this approach gavevery inconsistent results when PFN logs run in various locationswere compared to core.
A model that resulted in improved consistency was developedfrom theoretical relationships developed by Czubek (1972), em-ploying the macroscopic absorption cross section, SI, (which canbe determined from the thermal-neutron mean lifetime, te, ignor-ing any effects of neutron diffusion) from the relationship
8
where v = average velocity of thermal neutrons (2200 m/s). Ob-viously, one may choose simply to use T9 instead of X, in derivinga functional relationship involving the effect of the absorptioncross section. This model then yields the functional relationshipfor the estimated amount (in weight/volume) of uranium as
Ue = 9 f(e)g(d)j(N0)
To determine the ore grade in weight percent, the value for Ue isdivided by the formation dry density.
A calibration equation using this functional relationship wasdetermined from the gamma-ray calibration test pits at the DOEfacility at Grand Junction. Use of this second calibration equa-tion has considerably reduced the discrepancy observed betweenthe uranium-ore grades predicted by the PFN logs and those in-dicated by core assays.
ResultsThe application of a single correction model for PFN log inter-
pretation generally results in good agreement between the PFNlog and core assay (fig. 8).
Although errors can occur in core assays, a core assay tends tobe the standard against which the assay accuracy of the PFN logis compared. Accordingly, we have always attributed any dis-crepancies between the PFN log and the core assay to error in thePFN log.
One of the problems involved in comparing the chemical assayof core with the PFN log (and the DFN log) comes from the dif-ference in the volume of the rock matrix sampled by the neutron-logging tools and the core. In narrow zones both the PFN andDFN logging probes underestimate the peak uranium-ore grade.This effect was evaluated with the Monte Carlo computer code,MCN, described earlier (fig. 9; Cashwell and others, 1972). Thezone was assumed to be located at the effective center betweenthe neutron source and the center of the detector. The physicalmodel for the calculation consisted of a water-filled borehole 4%inches (121 mm) in diameter. The rock matrix was sandstone,having a bulk density of 2.2 g/cm3 (<t> = 27 percent) and contain-ing a 0.1 percent uranium concentration. The PFN signal con-sisted of fission neutrons between 0.4 eV and 1000 eV. Theresults of this calculations have not yet been incorporated intothe correction model.
Another source of error is in the density measurement. Al-though the density probe has been calibrated in the U.S. Geolog-ical Survey test pits in Denver, the design of this commercialprobe is such that error in measuring density is almost unavoid-able. The probe is positioned in the hole by an arm that alsomakes the single-arm caliper measurements. An error due to aspace between the gamma source or detector and the boreholewall is unavoidable. Better designed density probes are used byoil-well logging-service companies, but these are not commercial-ly available.
An example of a discrepancy between a PFN log and a coreassay is shown in fig. 10. While this discrepancy can be attributedto the known potential sources of error, the fact remains that our
URANIUM ORE GRADE (wt % U3Og)
38 0
39.0
40.0
41.0
42.0
0.00 0.10 020 030 040 050
43.0
r WATER FILLED BOREHOLE (850-1)
HOLE DIAMETER - 25.40 cm
. FORMATION BULK DENSITY - 1 3 0 g/cc -
J PFN LOG3 CORE ANALYSIS
G-T=.28wt.% -m= (.92wt%-FT)
FIGURE 8—COMPARISON OF PFN LOG AND CORE ASSAY WHICH SHOWS
GOOD AGREEMENT.
[New Mexico Bureau of Mines & Mineral Resources, Memoir 38,1980]
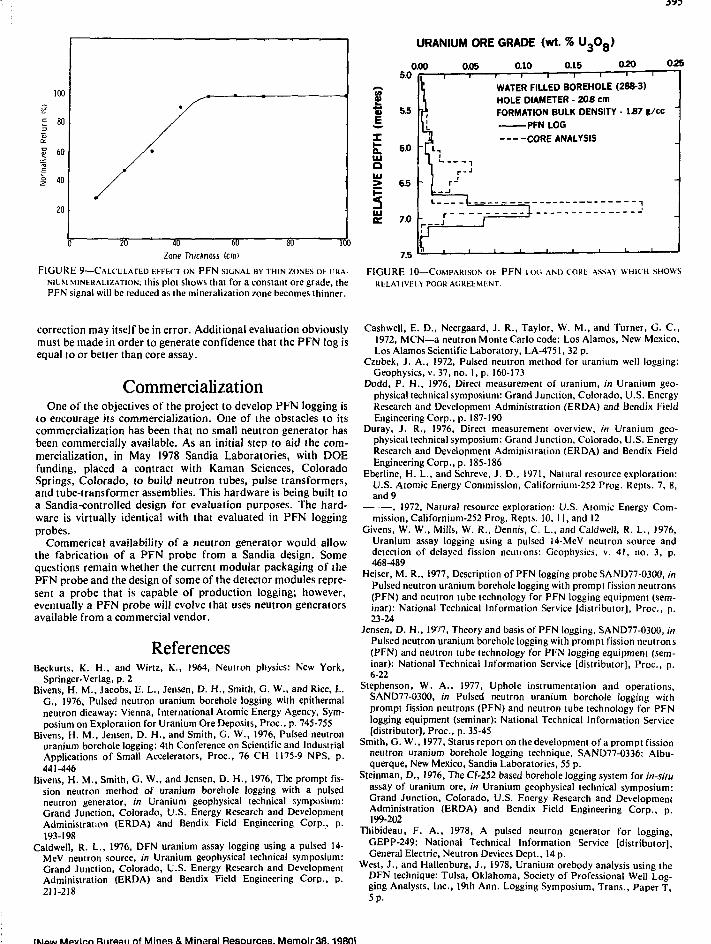
URANIUM ORE GRADE (wt. %
0.05 0.10 0.15 020
0 20 30 6!)Zone Thickness (cm)
FIGURE 9—CALCULATED EKKECT ON PFN SIGNAL BY THIN ZONES OK LIRANIUM MINERALIZATION; this plot shows that for a constant ore grade, thePFN signal will be reduced as the mineralization zone becomes thinner.
- i 1 1 1 1 r IWATER FILLED BOREHOLE (288-3)HOLE DIAMETER - 20S cmFORMATION BULK DENSITY - 137 g/cc
PFN LOG
025
FIGURE 10—COMPARISON OV PFN ion AND CORE ASSAY WHICH SHOWSRELATIVELY POOR AUREbMENT.
correction may itself be in error. Additional evaluation obviouslymust be made in order to generate confidence that the PFN log isequal to or better than core assay.
CommercializationOne of the objectives of the project to develop PFN logging is
to encourage its commercialization. One of the obstacles to itscommercialization has been that no small neutron generator hasbeen commercially available. As an initial step to aid the com-mercialization, in May 1978 Sandia Laboratories, with DOEfunding, placed a contract with Kaman Sciences, ColoradoSprings, Colorado, to build neutron tubes, pulse transformers,and tube-transformer assemblies. This hardware is being built toa Sandia-controlled design for evaluation purposes. The hard-ware is virtually identical with that evaluated in PFN loggingprobes.
Commerical availability of a neutron generator would allowthe fabrication of a PFN probe from a Sandia design. Somequestions remain whether the current modular packaging of thePFN probe and the design of some of the detector modules repre-sent a probe that is capable of production logging; however,eventually a PFN probe will evolve that uses neutron generatorsavailable from a commercial vendor.
ReferencesBeckurts, K. H., and Wirtz, K., 1964, Neulron physics: New York,
Springer-Verlag, p. 2Bivens, H. M., Jacobs, E. L., Jensen, D. H., Smith, G. W., and Rice, L.
G., 1976, Pulsed neutron uranium borehole logging with epiihermalneuiron dieaway: Vienna, International Atomic Energy Agency, Sym-posium on Exploration for Uranium Ore Deposits, Proc, p. 745-755
Bivens, H. M., Jensen, D. H., and Smith, G. W., 1976, Pulsed neutronuranium borehole logging: 4th Conference on Scientific and IndustrialApplications of Small Accelerators, Proc, 76 CH 1175-9 NPS, p.441-446
Bivens, H. M., Smith, G. W., and Jensen, D. H., 1976, The prompt fis-sion neutron method of uranium borehole logging with a pulsedneutron generator, in Uranium geophysical technical symposium:Grand Junction, Colorado, U.S. Energy Research and DevelopmentAdministration (ERDA) and Bendix Field Engineering Corp., p.193-198
Caldwell, R. L., 1976, DFN uranium assay logging using a pulsed 14-MeV neutron source, in Uranium geophysical technical symposium:Grand Junction, Colorado, U.S. Energy Research and DevelopmentAdministration (ERDA) and Bendix Field Engineering Corp., p.211-218
Cashwell, E. D., Neergaard, J. R., Taylor, W. M., and Turner, G. C ,1972, MCN—a neutron Monte Carlo code: Los Alamos, New Mexico,Los Alamos Scientific Laboratory, LA-4751, 32 p.
Czubek, J. A., 1972, Pulsed neutron melhod for uranium well logging:Geophysics, v. 37, no. 1, p. 160-173
Dodd, P. H., 1976, Direct measurement of uranium, in Uranium geo-physical technical symposium: Grand Junction, Colorado, U.S. EnergyResearch and Development Administration (ERDA) and Bendix FieldEngineering Corp., p. 187-190
Duray, J. R., 1976, Direct measurement overview, in Uranium geo-physical technical symposium: Grand Junction, Colorado, U.S. EnergyResearch and Development Administration (ERDA) and Bendix FieldEngineering Corp., p. 185-186
Eberline, H. L., and Schreve, J. D., 1971, Natural resource exploration:U.S. Atomic Energy Commission, Californium-252 Prog. Repts. 7, 8,and 9
, 1972, Natural resource exploration: U.S. Alomic Energy Com-mission, Californium-252 Prog. Repts. 10, II,and 12
Givens, W. W., Mills, W. R., Dennis, C. L., and Caldwell, R. L., 1976,Uranium assay logging using a pulsed 14-McV neutron source anddetection of delayed fission neutrons: Geophysics, v. 41, no. 3, p.468-489
Heiser, M. R., 1977, Description of PFN logging probe SAND77-03OO, inPulsed neutron uranium borehole logging with prompt fission neutrons(PFN) and neutron tube technology for PFN logging equipment (sem-inar): National Technical Information Service (distributor), Proc., p.23-24
Jensen, D. H., 19V7, Theory and basis of PFN logging, SAND77-0300, inPulsed neutron uranium borehole logging with prompt fission neutrons(PFN) and neutron tube technology for PFN logging equipment (sem-inar): National Technical Information Service [distributor], Proc., p.6-22
Stephenson, W. A., 1977, Uphole instrumentation and operations,SAND77-0300, in Pulsed neutron uranium borehole logging withprompt fission neutrons (PFN) and neutron tube technology for PFNjogging equipment (seminar): National Technical Information Service[distributor), Proc., p. 35-45
Smith, G. W., 1977, Status report on the development of a prompt fissionneutron uranium borehole logging technique, SAND77-0336: Albu-querque, New Mexico, Sandia Laboratories, 55 p.
Steinman, D., 1976, The Cf-252 based borehole logging system for in-siiuassay of uranium ore, in Uranium geophysical technical symposium:Grand Junction, Colorado, U.S. Energy Research and DevelopmentAdministration (ERDA) and Bendix Field Engineering Corp., p.199-202
Thibideau, F. A., 1978, A pulsed neutron generator for logging,GEPP-249: National Technical Information Service [distributor],General Electric, Neutron Devices Dept., 14 p.
West, J., and Hallenburg, J., 1978, Uranium orebody analysis using theDFN technique: Tulsa, Oklahoma, Society of Professional Well Log-ging Analysts, Inc., 19th Ann. Logging Symposium, Trans., Paper T,5 p.
o. Movirn Rnraan of Mines & Mineral Resources. Memoir 38 19801

396
GEOCHEMICAL AND CLAY MINERALOGICAL STUDIES,GRANTS MINERAL BELT
by Douglas G. Brookins, Department of Geology, University of New Mexico,Albuquerque, New Mexico 87131
AbstractUranium for the deposits of the Grants mineral belt
was most likely carried in solution as an oxyion, probably(UOj(CO3)2-2H2O)2- or (UO,(HPO4)2)2-, although organictransport cannot be entirely ruled out. Oxyions of vanadium,selenium, molybdenum, and possibly arsenic and antimony, areinterpreted from Eh-pH diagrams to have been segregated andtransported with U6* soluble species and precipitated when achemically reducing environment was reached. The rare-earthelements are also enriched in ore zones, but whether they weretransported with the U-V-Se-Mo-(As)-(Sb) suite or derived froma more local source is not clear. Eh-pH diagrams can also be usedto infer which solid species should be present in uraniumdeposits. Uranium is most common in coffinite, although pitch-blende is also present; and, although not identified to date,urano-organic compounds cannot be ruled out. Vanadium ismost commonly fixed in clay minerals, with some fixed in oxidesand hydroxides. Selenium occurs as the native element, in selenif-erous pyrite, and in ferroselite. Molybdenum is usually present asjordisite, although some is present in sulfides, along with arsenicand antimony. The rare-earth elements are fixed in vanadiferousclays, with lesser amounts fixed as oxides, hydroxides, or pos-sibly in calcite. Clay mineralogieal studies of ore versus barrenrocks show that some combinations of chlorite (rosette form), il-lite, mixed-layer illite-montmorillonite, ( ±Mg-montmorillonite)are penecontemporaneous with uranium minerals in trend ore;thesesameclay minerals plus kaoliniteare related to the roll-type
ore near the main redox front of the Grants mineral belt. Clayminerals from barren rocks are characterized by a greater abun-dance of Na-montmorillonite, kaolinite, and face-to-edge-formchlorite. Chlorites from ore zones contain much more vanadiumthan do chlorites from barren rocks. Trend ore probably formedfrom southeasterly flowing waters following paleochanneis in theLate Jurassic. These deposits are found almost entirely in re-duced rocks. Organic carbon may have been an important reduc-tant to remove U-V-Se-Mo from solution; carbonate from orezones contains some organic carbon based on stable-isotopestudies. Uplift, remobilization, and reprecipitation of some ofthe trend ore resulted in the formation of redistributed ore, someof which possesses a roll-type geometry. Mineralization for theroll-type ore apparently was controlled by sulfide-sulfateequilibria at or near the main redox front in the Grants mineralbelt. Trend and roll-type ore possess different assemblages ofclay minerals and different trace element abundances. Laramidefaults cut both trend and some roll-type ore. Stack ore is foundin Laramide fault zones. Limited oxygen isotopic data from clayminerals in reduced rocks from two mines at Ambrosia Lake in-dicate probable preservation of ancient, formational waters andshow no evidence for infiltration by young meteoric waters. Thisinformation plus the pre-Laramide faults suggest, but do not un-equivocally prove, that the main redox front has been relativelystable since its formation, which was probably some time in theCretaceous. However, younger encroachment of the redox frontin post-Laramide time is proposed by others, and the problem isunresolved.
[New Mexico Bureau of Mines & Mineral Resources, Memoir 38,1980]

397
MOUNT TAYLOR URANIUM DEPOSIT, SAN MATEO,NEW MEXICO
by Walter C. Riese, Gulf Mineral Resources Company, 6106 Kircher Blvd. N.E., Albuquerque, New Mexico 87109, andDouglas G. Brookins, Deparlment of Geology, University of New Mexico, Albuquerque, New Mexico 87131
AbstractThe Mount Taylor uranium deposit is at the extreme eastern
end of the Ambrosia Lake district in the Grants mineral belt.New Mexico. This deposit is a sandsione-type uranium depositthat was formed by lateral secretion. Ore is preferentially dis-tributed in particular stratigraphic facies of the Westwater Can-yon Member of the Morrison Formation (Jurassic): the ore is inpoint bars and overbank deposits of meandering sections of theWestwater channels and in braid bars and channel fills of braidedsections of the Westwater channels. The shape of the deposit,although crude in form, resembles the roll fronts of the Wyo-ming Tertiary basins. The Mount Taylor deposit also resemblesthe deposits of the Wyoming basins chemically. Arsenic, molyb-denum, selenium, and several other less commonly analyzedtrace elements zone across the orebody, parallel to the directionof dip, and are indicative of a redox cell. This deposit ischemically different from other lateral-secretion uranium depos-its; it is not located at an iron redox interface. Iron is depleted inthe orebody, and that iron which is present is complexed in smec-tites. Therefore, the Mount Taylor deposit differs mineralogic-ally not only from the Wyoming Tertiary deposits but with mostother deposits in the Ambrosia Lake district. It does have con-centrations of calcite along its downdip and bottom edges. Nouranium-bearing minerals have yet been identified. This study
has demonstrated the existence of a clay-mineral alteration pat-tern around the Mount Taylor deposit. Montmorilionite is thedominant clay downdip of the deposit. As the deposit is ap-proached from the downdip side, montmorillonite gives way tochlorite in edge-to-face arrangement. In the orebody, chlorite (asrosettes) is the dominant clay mineral. Updip of the ore zone thedominant clay mineral is kaolinite. A positive correlation hasbeen demonstrated between uranium and organic materials as de-termined by LOI (loss on ignition) in the ore zones of the deposit.Organic geochemical-leaching studies have also shown organicacids to be effective uranium-leaching agents; and traces of themhave been found in SEM (scanning-electron-microscope) photo-micrographs. These findings suggest that organic acids or short-chain functional groups may have been transporting agents forthe uranium. Adsorption of these polar molecules to clays toform the orebody would explain the lack of uranium-bearingminerals. Several of the trace elements studied may be usefulpathfinders: manganese, ytterbium, and cerium show positivedowndip anomalies; sodium and samarium show negative updipanomalies; and zinc and uranium show positive updip anomalies.Additional work is needed to verify the usefulness of each ofthese. The presence of a redox interface in a deposit that is3,000-5,000 ft deep suggests that the oxidation phenomenaresponsible for ore remobilization may be a relic Morrisonfeature.
[New Mexico Bureau of Mines & Mineral Resources, Memoir 38,1980]

398
THERMOLUMINESCENCE OF URANIUM HOST ROCKSIN AMBROSIA LAKE AREA
by D. L. Hayslip. G. E. Fuller, and P. W. Levy.Physics Department, Brookhaven National Laboratory. Upton, New York 11973, and
J. R. Renault. New Mexico Bureau of Mines and Mineral Resources, Socorro, New Mexico 87801
AbstractExposure to radiation during the formation or redistribution
of uranium ore deposits is expected to affect the thermoluminescence (TL) properties of the host rock. For example, TLmeasurements on samples from a traverse of a Wyoming roll-type deposit display the following intensity-versus-distance pat-tern: Starting from barren oxidized ground, the intensityincreases slowly with decreasing distance to ore, is extremely highin ore, and drops rapidly with distance in reduced ground to alevel substantially below that observed in oxidized ground. Thispattern is in accord with currtnt hypotheses concerning the gene-sis of this type of deposit. Reported here are measurements ofboth natural and artificial TL made on quartz separates fromdrill cores and samples collected underground in Ihe Ambrosia
Lake area. Because of the intensity and structure of their respec-tive glow curves, discrimination among oxidized ground, reducedground, and mineralized areas is possible. Samples from oxi-dized ground also show TL intensities and glow-curve charac-teiistics that have been correlated with structural featurescontrolling the redistribution of ore. Although the data exhibitsome statistical variation, the general intensity-versus-disiancepattern has been observed in many cases. All currently availableresults suggest that TL can be developed into a viable tool foruranium exploration.
ACKNOWLEDGMENTS—Research supported bv U.S. Depart-ment of Energy, Grand Junction Office and Division of BasieEnergy Sciences.
[New Mexico Bureau of Mines & Mineral Resources. Memoir 38,1980]

399
GEOCHEMICAL STUDIES OF GRANTS MINERAL BELTby Richar J S. Delia Valle and Douglas G. Brookins, Department of Geology. University of Sew Mexico,
Albuquerque, S'ew Mexico 87131
AbstractSeveral hundred clay-mineral and whole-rock samples of ores
and barren rocks from the Grants mineral bell have been an-alyzed by instrumental neutron-activation analysis (INAA) anddelayed neutron-activation analysis (DNAA). The DNAAmethod allows high precision and accuracy for uranium andthorium determination, whereas the INAA method allows deter-mination of some 20-30 trace elements. The trace-element datacan only properly be interpreted if the clay mineral (-2JJ) fractionis compared directly with whole rock samples. The JNAA datasupport mineralization of trend ore as resulting from south-easterly flowing solutions; the DNAA determination of uraniumsuggests that the source of uranium in the VVestwater CanyonMember of the Morrison Formation was not from the overlying
Brushy Basin Member. Local zonation of trace elements, espe-cially the rare-earth elements (REE), indicates fixation of manytrace elements when uranium mineralization occurred. ThusREE depleted, oxidized ground can (with caution) be used for ex-ploration purposes. Vanadium originally precipitated as V* inchlorites remains in the original sites after oxidation to V* andis alstj valuable as a pathfinder. Data for antimony suggest thatit, too, may be useful. In general, trend-ore deposits are charac-terized by a high chlorite + illite, illite + illite-montmorillonite,orillite + chlorite + illite-montmorilloniie, whereas ore near theredox front may contain primary kaolinite. The REE are concen-trated greatly in all types of ore, primary or secondary, and,coupled with uranium halos, are useful as ore guides.
7y/vMv.\. Text in »*pi. I r t i s h Times. leaded one pointKctcrcnv.es in K-pt. English Times, leaded one pointMain heads in 18-pt. linglish TimesSubheads in 14-pt. English Times
Presswtirk: Michlc Single Color OffseiHarri.v Single Color Offset
Binding: Smyth sewn
Paper: Cover on I7-pi. KivarText on 70-lb. Patina mane
Ink: Cover—PMS 320text—Black
Press Hun: 2000
[New Mexico Bureau of Mines & Mineral Resources, Memoir 38,1980]

400 Stratigraphic section.Ambrosia Lake area, McKinley and Valencia Counties, New MexicoACE GROUP FORMATION
Point
MEMBER
Boar
I Sjlan Tonggt 'U
Sandstone
Mesa-verde
CO
O(UCJ03
03
c5CD
CrevassCanyon
Formation
Gibson Coal Memtiei
PIJL' P.I*N lentil
,. Ciyl Vrmtiei
GallupSandstone
M a n c o s '•'•"""'"''
Shale
Dakota " -<
Sandstone n j j
Morrison
Formation
00ooCD
LITHOLOGV THICKNESS(Feel)
60-160
0-140
CHARACTER
Light gray and reddish bto«n medium lo tine grained massive sandstone
Patk giay sami* shale same mterbedrted pale yellowish brown lined mamed silly sandstone and vi
100-140 I W M i a » imattim ro tme giamcd undsto
^ 80~300 it sandstone inleibedded with giav siltslone caibonaceons shale and co;
60— I 50
220—400 Pale lellomsh brown sandy shale daik gray shale
0-40 Giay line medium and coa'se grained samisloue
80-180 Yellowish gtay |iale oiange sandstune siltstone carbonjceons shale <
0-120 Pale reddish brown and light ytav tme and medmiu giamed sandstone
140-160 Oamyiav si»« shale
1 0~40 ^ld* lossililenuis tine and coarse yamed sandslone
600-650
95-150
50-90
85-160
v sha'e tv>lh in"l0t liqh> bu)wn s
Yellowish titown lo hull medniin to fine guniprf sant
t •
, Guv black shale
Giay. very tint grained sandstone
Odik i)i,i> shale iWanco^l
Gi,i) very Imp giained sjnrt
Ulitici i i j i t light (juy and giayish tan raihcinareDiis ve'v tuie yumri i sandstone and sitlsfniteLower pail Pale yellowish btown. oiange, white, tine «nd medium grained sindslone
40-220
90-290
70-250
Giet-iiisii igiay iiiiidslnne with imnoi leniimlai light giay and yellowish gray fine and medium gunnedsaiiitMonp
Light yellowish and leddish Qiay medioin giained sandstone wilh gieenish gray, lentiEiilai miidstone
Inteihedded vainjated imidstone clavMone silKtone and sandstone
Bluff Sandstone
j _ SanOj Rafael
CL Sunirnerville Formation 160-270
TotMio 25-35 thick lieddcd hmrsione
Entrada ""'""Sj"""""
Sandstone i vptM Sil't""iti
^ 50—1 85 Vmlpi.Hi- hiutvi fme iiidmrd massive (los^cddt-d Sdiid^tone
40-60 [ (5ldl''vl ' t"(lvvn talcdieuui sillstone
80- 115 Miirli't.iif lituwii to ninrlPtdtp iedrl>\li orange uifilinin ijidnied ciossbedded sandstone
i |iiii|iir i Ijysione dini MIIVIQUI- uilpilietlrirtl wuli IMIP IIIIIP la i|ieemsli gray and pint tinic stone anrf
ViCO
Q3n.CL
Chinle
Formation
e ijtayish red in pale teddish blown and purple tnudslone. stlisione. and sand* silislone
1100-1600 ;
Permian San Andres Limestone 35-115
While li[|l.i (ir.ty rn vt?ltnwi<.h ijiay am\ hinwii vpiy line grained to tnmjfnmerate sanrtstomlerheilltprf tvilli vdiinilnrcd rlaystonp
flense iitdy .mil yrilomsti InuiMi tn trjtl limeManp with mieilipilded yellow line 10 tnednini grained• KiwIipiMril v.iriiKloiii' njigipr suitdrp kdiM
Compiled by W. L. Chenoweih and E. A. Lurried. Jinutry 1979
Stratigraphic section.Church Rock area. Me Kin ley County, New Mexico
AGE GROUP FORMATION MEMBER LITHOLOGY THICKNESS(Fm)
CHARACTER
Menefee Formation
Point Lookout Sandstone
800 +
0-1 SO
Inttrbediad tan ID tttown. vtnr ' ' « • >O mediunvgiained sandstone jiltslormudstont. gray shale ihm to i l beds, top not exposed
Yellowish o/iY ID bull l int to v«nr line-grained massive undsio
CO
oo
CD
03
Mesa-verde
CrevassCanyon
Formation
GallupSandstone
Gibson Coal Membei 100-300 intttbtdfSui medium to very toarst plained sandstone jiltjione muditone
Ihm coal btds
Bartlett Ban enMember 0-160
tnttftuddad reltDwishgtay to olive-gray shall, nitstone yellowish owhite sandstone carbonaceous shile. irregulai toal bedi _
Oalton Ss
Membei 130-150 Yellowish gray 'me <o »«t tine g ivmd sandslane spin 0» tongut ot MuHno
UuiallO Tongu
(Mancosl 45-100 tight to d i d gffl» shall vmih thin b id i ol tan sandstone
Dilco CoalMenbei 120-180 Inleibeddtd hgM guy io irellomsh brown, tine to medium grained sandstone
siltiione shale coal bedt
65-200 Vcllowish blown to white l in i ID medium Qtained ctpssbedded sandstone
Vellowish btown very fine lo medium gtfined sandsrone Tongues D 60 teer
MancosShale
500-700Oath olive giai silly shale mdiilinct beds o> vHlowistt biautn undy ultsianrand silt* sandstone Thm ItmesionE beds mlBilongues with Mesaveiae indDakota
DakotaSandstone
i Ss Tungue 20-60
Sh loniue (Mancos)60-130
50-150llDWisfi biown ID bull line to medium giained sandslone conglomeratic
ndiipne. caibonactoui shale, ligmle ^ ^
0-100
MorrisonFormation
100-250light red lo 'eddish oiangi white tint to very coarse ginned, ciossbedded
^ndifone and conglomeiatic sandslone. with lenses ol siltsione
00ooCO
03a.ex.
Rf capture 0-150Reddish blown 10 buck n
grained tanditone
1 white to greenish gra> line to medium
SanRafael
Cow SpringsSandstone 300-500
Light gretmsh gta, pale oiange light teddish brown line to medium grained
cas'Lauded massivi sandstone
Summerville Formation 20-130 Reddish brawn lo greenish white very fine ID fine grimed sit'y sindsfone
Todilto Limestone 2-30 liQhl to dark grat sandv lin
EntradaSandstone
• 5 ' ^ ' * ' 200-250 Reddish oringe line to ver> line grimed massive ciossbedded sandstone
Medial Sillslone35-65 Dark tc lighl bncl red sandy siltslone
80-140 Moderaie iuJdishorangi. line 10 medmm-giained triable, ctossbedded sandstone
COCO
CD
ChinlePetrified Fotesi
Upper
Interbidded puiplish white to greenish gray thirty, nodular limestone and
\si1l i lonB
Oirh to lightourpdshgrgy and rectdnh-gr.fr s'Ks(one ai<6 cl»rstane. contain]several thin fine to coirse-gramed sandstone beds
Sonsela Ss
Bed
1400-2000
lightgray to yiHowish-btown. vafy fine-gtained lo conglomeratic sandstoneintetttddid with bluish gray mudsion« ind sillstani
Petntied ForestLowti Blue to gray and reddish-purple mudstone and siltstone
Formation
iray. very line- to fine grained, ciossbedded sindstone and vingilnd silistone
iwif ft Middle
(?) Tnmt t
Yetlowish-giay. very Ima- to coarse sandsioni. siltstoni
Moenkopi (?) 0-50 Vangattd sittitone. mudilone. silly tanduoni. conglomeiaie
San Andres Limestone! !
0-145Gray lo yillowithgray limittom upper lurfice karst. stndstona bid in lipan
Compilad byW L ChenoweihE A L«arfiedJuly 1980