Medical Geology - MDPI
181
Edited by Medical Geology Marina Cabral Pinto Printed Edition of the Special Issue Published in International Journal of Environmental Research and Public Health www.mdpi.com/journal/ijerph
-
Upload
khangminh22 -
Category
Documents
-
view
5 -
download
0
Transcript of Medical Geology - MDPI

Edited by
Medical Geology
Marina Cabral Pinto
Printed Edition of the Special Issue Published in
International Journal of Environmental Research and Public Health
www.mdpi.com/journal/ijerph

Medical Geology


Medical Geology
Editor
Marina Cabral Pinto
MDPI • Basel • Beijing • Wuhan • Barcelona • Belgrade • Manchester • Tokyo • Cluj • Tianjin

Editor
Marina Cabral Pinto
Geosciences, GeoBioTec
Research Centre
University of Aveiro
Aveiro
Portugal
Editorial Office
MDPI
St. Alban-Anlage 66
4052 Basel, Switzerland
This is a reprint of articles from the Special Issue published online in the open access journal
International Journal of Environmental Research and Public Health (ISSN 1660-4601) (available at: www.
mdpi.com/journal/ijerph/special issues/M G).
For citation purposes, cite each article independently as indicated on the article page online and as
indicated below:
LastName, A.A.; LastName, B.B.; LastName, C.C. Article Title. Journal Name Year, Volume Number,
Page Range.
ISBN 978-3-0365-1840-4 (Hbk)
ISBN 978-3-0365-1839-8 (PDF)
© 2021 by the authors. Articles in this book are Open Access and distributed under the Creative
Commons Attribution (CC BY) license, which allows users to download, copy and build upon
published articles, as long as the author and publisher are properly credited, which ensures maximum
dissemination and a wider impact of our publications.
The book as a whole is distributed by MDPI under the terms and conditions of the Creative Commons
license CC BY-NC-ND.

Contents
About the Editor . . . . . . . . . . . . . . . . . . . . . . . . . . . . . . . . . . . . . . . . . . . . . . vii
Preface to ”Medical Geology” . . . . . . . . . . . . . . . . . . . . . . . . . . . . . . . . . . . . . . ix
Maria Orquıdia Neves, Jose Marques and Hans G.M. Eggenkamp
Lithium in Portuguese Bottled Natural Mineral Waters—Potential for Health Benefits?Reprinted from: International Journal of Environmental Research and Public Health 2020, 17, 8369,doi:10.3390/ijerph17228369 . . . . . . . . . . . . . . . . . . . . . . . . . . . . . . . . . . . . . . . . 1
Abraham Addo-Bediako and Karabo Malakane
Preliminary Assessment of Chemical Elements in Sediments and Larvae of Gomphidae(Odonata) from the Blyde River of the Olifants River System, South AfricaReprinted from: International Journal of Environmental Research and Public Health 2020, 17, 8135,doi:10.3390/ijerph17218135 . . . . . . . . . . . . . . . . . . . . . . . . . . . . . . . . . . . . . . . . 15
Hui-Ching Wu, Ming-Hseng Tseng and Chuan-Chao Lin
Assessment on Distributional Fairness of Physical Rehabilitation Resource Allocation:Geographic Accessibility Analysis Integrating Google Rating MechanismReprinted from: International Journal of Environmental Research and Public Health 2020, 17, 7576,doi:10.3390/ijerph17207576 . . . . . . . . . . . . . . . . . . . . . . . . . . . . . . . . . . . . . . . . 25
Bianca Gerardo, Marina Cabral Pinto, Joana Nogueira, Paula Pinto, Agostinho Almeida,
Edgar Pinto, Paula Marinho-Reis, Luısa Diniz, Paula I. Moreira, Mario R. Simoes and Sandra
Freitas
Associations between Trace Elements and Cognitive Decline: An Exploratory 5-Year Follow-UpStudy of an Elderly CohortReprinted from: International Journal of Environmental Research and Public Health 2020, 17, 6051,doi:10.3390/ijerph17176051 . . . . . . . . . . . . . . . . . . . . . . . . . . . . . . . . . . . . . . . . 47
Celia Alves, Ana Vicente, Ana Rita Oliveira, Carla Candeias, Estela Vicente, Teresa Nunes,
Mario Cerqueira, Margarita Evtyugina, Fernando Rocha and Susana Marta Almeida
Fine Particulate Matter and Gaseous Compounds in Kitchens and Outdoor Air of DifferentDwellingsReprinted from: International Journal of Environmental Research and Public Health 2020, 17, 5256,doi:10.3390/ijerph17145256 . . . . . . . . . . . . . . . . . . . . . . . . . . . . . . . . . . . . . . . . 65
Carla Marina Bastos, Fernando Rocha, Angela Cerqueira, Denise Terroso, Cristina Sequeira
and Paula Tilley
Assessment of Clayey Peloid Formulations Prior to Clinical Use in Equine RehabilitationReprinted from: International Journal of Environmental Research and Public Health 2020, 17, 3365,doi:10.3390/ijerph17103365 . . . . . . . . . . . . . . . . . . . . . . . . . . . . . . . . . . . . . . . . 85
Pedro Dinis, Amılcar Armando and Joao Pratas
Sources of Potentially Toxic Elements in Sediments of the Mussulo Lagoon (Angola) andImplications for Human HealthReprinted from: International Journal of Environmental Research and Public Health 2020, 17, 2466,doi:10.3390/ijerph17072466 . . . . . . . . . . . . . . . . . . . . . . . . . . . . . . . . . . . . . . . . 101
v

Amit Kumar, Amit Kumar, Cabral-Pinto M.M.S., Ashish K. Chaturvedi, Aftab A. Shabnam,
Gangavarapu Subrahmanyam, Raju Mondal, Dipak Kumar Gupta, Sandeep K. Malyan,
Smita S. Kumar, Shakeel A. Khan and Krishna K. Yadav
Lead Toxicity: Health Hazards, Influence on Food Chain, and Sustainable RemediationApproachesReprinted from: International Journal of Environmental Research and Public Health 2020, 17, 2179,doi:10.3390/ijerph17072179 . . . . . . . . . . . . . . . . . . . . . . . . . . . . . . . . . . . . . . . . 115
Marina M. S. Cabral Pinto, Paula Marinho-Reis, Agostinho Almeida, Edgar Pinto, Orquıdia
Neves, Manuela Inacio, Bianca Gerardo, Sandra Freitas, Mario R. Simoes, Pedro A. Dinis,
Luısa Diniz, Eduardo Ferreira da Silva and Paula I. Moreira
Links between Cognitive Status and Trace Element Levels in Hair for an EnvironmentallyExposed Population: A Case Study in the Surroundings of the Estarreja Industrial AreaReprinted from: International Journal of Environmental Research and Public Health 2019, 16, 4560,doi:10.3390/ijerph16224560 . . . . . . . . . . . . . . . . . . . . . . . . . . . . . . . . . . . . . . . . 149
vi
About the Editor
Marina Cabral Pinto
Dr Marina Cabral-Pinto works in environmental geochemistry research, on an array areas
such as medical geology, epidemiology, water, soil, air quality, geo-bio-remediation, and ecological
health assessment, carbon sequestration, climate changes, etc. She completed a degree in geological
engineering, MsD (University of Aveito and University of Coimbra), and Ph.D and postdoc at the
University of Aveiro, where he is now working as an investigator and invited professor. During her
academic career, she has published more than 60 research/review articles of international repute
and attended several training and conferences. In addition to this, she has handled Special Issues
in (MDPI), Land (MDPI), Applied Sciences (MDPI), and Mine Water Association (Springer). She
is supervising/has supervised more than 15 PhD and MSc students. She was granted, by the
Portuguese Society of Neurology, with the Orlando Leitao premium, due to her research and results
on links between environmental PTE and cognitive disorders.
vii


Preface to ”Medical Geology”
Among the topics to be discussed are: health effects from trace elements, metals, and
metalloids; regional and global impacts of natural dust (including the study of nanoparticles);
chemical and environmental pathologies of diseases associated with the natural environment;
novel analytical approaches to the study of natural geochemical and environmental agents;
research on beneficial health aspects of natural geological materials; risk management, risk
communication, and risk mitigation in medical geology; remote sensing and GIS applications in
medical geology; epidemiology and public health studies in medical geology; climate change and
medical geology; clinical and toxicological research on biomarkers of exposure; veterinary medical
geology biosurveillance and biomonitoring studies in medical geology.
Marina Cabral Pinto
Editor
ix


International Journal of
Environmental Research
and Public Health
Article
Lithium in Portuguese Bottled Natural MineralWaters—Potential for Health Benefits?
Maria Orquídia Neves 1,* , José Marques 1 and Hans G.M. Eggenkamp 2
1 Department of Civil Engineering, Architecture and Georesources, CERENA (Centro de Recursos Naturais eAmbiente), Instituto Superior Técnico, University of Lisbon, 1049-001 Lisbon, Portugal;[email protected]
2 Department of Petrology and Mineral Resources, Eberhard-Karls University of Tübingen,Schnarrenbergstraße 94-96, 72076 Tübingen, Germany; [email protected]
* Correspondence: [email protected]
Received: 9 October 2020; Accepted: 8 November 2020; Published: 12 November 2020
Abstract: There is increasing epidemiologic and experimental evidence that lithium (Li) exhibitssignificant health benefits, even at concentrations lower than the therapeutic oral doses prescribed astreatment for mental disorders. The aim of this study is to determine the content of Li in 18 brandsof bottled natural mineral waters that are available on the Portuguese market and from which thesources are found within the Portuguese territory, to provide data for Li intake from drinking water.Analyses of Li were performed by inductively coupled plasma-mass spectrometry. The results indicatehighly different Li concentrations in natural mineral waters: one group with low Li concentrations(up to 11 µg Li/L) and a second group with Li concentrations higher than 100 µg/L. The highestLi concentrations (>1500 µg Li/L) were observed in the highly mineralized Na-HCO3 type watersthat are naturally carbonated (>250 mg/L free CO2). As a highly bioavailable source for Li dietaryintake these natural mineral waters have potential for Li health benefits but should be consumed in acontrolled manner due to its Na and F− contents. The consumption of as little as 0.25 L/day of Vidagonatural mineral water (2220 µg Li/L), can contribute up to 50% of the proposed daily requirement of1 mg Li/day for an adult (70 kg body weight). In future, Li epidemiological studies that concern thepotential Li effect or health benefits from Li in drinking water should consider not only the Li intakefrom tap water but also intake from natural mineral water that is consumed in order to adjust the Liintake of the subjects.
Keywords: lithium intake; natural mineral water; health benefits; public health
1. Introduction
One of the challenges of the present century is the improvement of human health and to preventthe spreading of diseases. This specifically also applies to mental disorders that occur in all regions andcultures of the world. The most prevalent of these being depression and anxiety, which are estimatedto affect nearly one in ten people on the planet. At its worst, depression can lead to suicide [1].
Lithium is the gold standard treatment for several psycho-neurological diseases (e.g., as bipolardisorders). The relationship between Li and health has been shown over time, since the time ofthe Roman Empire but the clinical history of lithium only started in the mid-19th century when itwas used to treat gout, that proved to be ineffective. Its use in the treatment of psycho-neurologicalbegan in 1948, by John Cade [2] in Australia. It is administered essentially as carbonate (Li2 CO3)and at therapeutic doses within the limits of 600 to 1200 mg/day (113–226 mg Li/day [3]). Due tothe toxicity of Li there is a rather narrow therapeutic window (between 0.6 and 1.2 mmol/L bloodserum) for Li medication, which must be continuously monitored. Lithium is known to interact with
1
Int. J. Environ. Res. Public Health 2020, 17, 8369
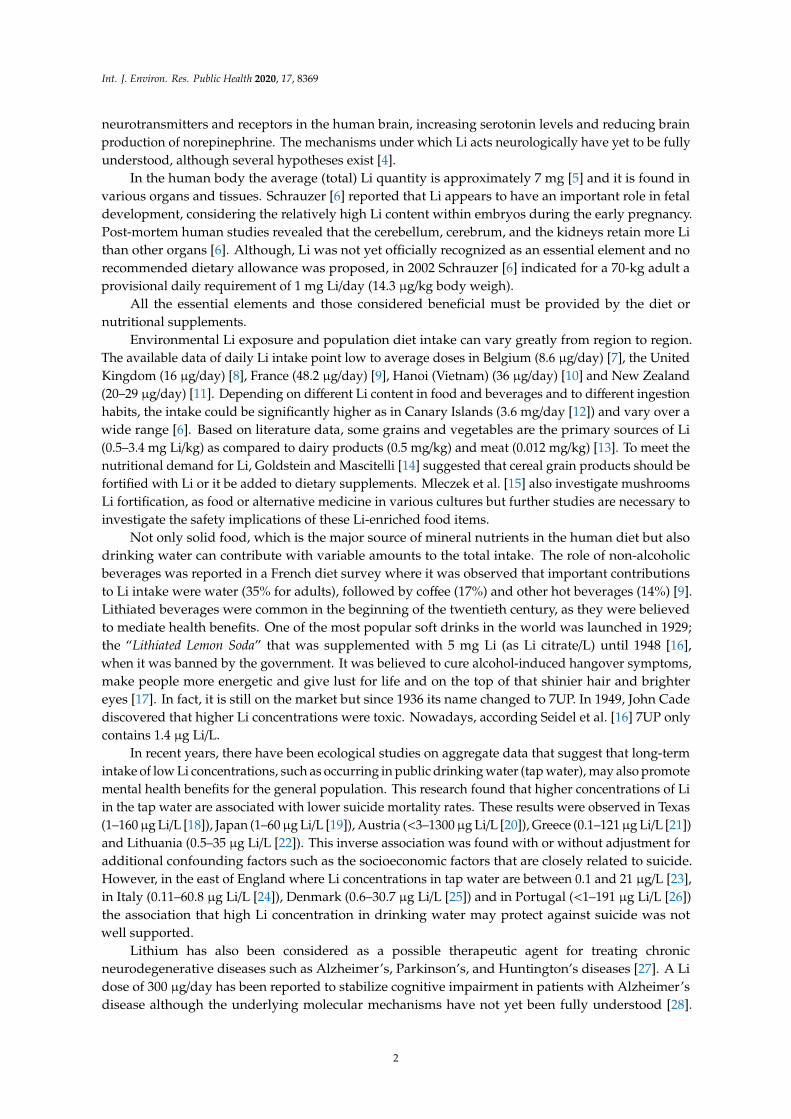
neurotransmitters and receptors in the human brain, increasing serotonin levels and reducing brainproduction of norepinephrine. The mechanisms under which Li acts neurologically have yet to be fullyunderstood, although several hypotheses exist [4].
In the human body the average (total) Li quantity is approximately 7 mg [5] and it is found invarious organs and tissues. Schrauzer [6] reported that Li appears to have an important role in fetaldevelopment, considering the relatively high Li content within embryos during the early pregnancy.Post-mortem human studies revealed that the cerebellum, cerebrum, and the kidneys retain more Lithan other organs [6]. Although, Li was not yet officially recognized as an essential element and norecommended dietary allowance was proposed, in 2002 Schrauzer [6] indicated for a 70-kg adult aprovisional daily requirement of 1 mg Li/day (14.3 µg/kg body weigh).
All the essential elements and those considered beneficial must be provided by the diet ornutritional supplements.
Environmental Li exposure and population diet intake can vary greatly from region to region.The available data of daily Li intake point low to average doses in Belgium (8.6 µg/day) [7], the UnitedKingdom (16 µg/day) [8], France (48.2 µg/day) [9], Hanoi (Vietnam) (36 µg/day) [10] and New Zealand(20–29 µg/day) [11]. Depending on different Li content in food and beverages and to different ingestionhabits, the intake could be significantly higher as in Canary Islands (3.6 mg/day [12]) and vary over awide range [6]. Based on literature data, some grains and vegetables are the primary sources of Li(0.5–3.4 mg Li/kg) as compared to dairy products (0.5 mg/kg) and meat (0.012 mg/kg) [13]. To meet thenutritional demand for Li, Goldstein and Mascitelli [14] suggested that cereal grain products should befortified with Li or it be added to dietary supplements. Mleczek et al. [15] also investigate mushroomsLi fortification, as food or alternative medicine in various cultures but further studies are necessary toinvestigate the safety implications of these Li-enriched food items.
Not only solid food, which is the major source of mineral nutrients in the human diet but alsodrinking water can contribute with variable amounts to the total intake. The role of non-alcoholicbeverages was reported in a French diet survey where it was observed that important contributionsto Li intake were water (35% for adults), followed by coffee (17%) and other hot beverages (14%) [9].Lithiated beverages were common in the beginning of the twentieth century, as they were believedto mediate health benefits. One of the most popular soft drinks in the world was launched in 1929;the “Lithiated Lemon Soda” that was supplemented with 5 mg Li (as Li citrate/L) until 1948 [16],when it was banned by the government. It was believed to cure alcohol-induced hangover symptoms,make people more energetic and give lust for life and on the top of that shinier hair and brightereyes [17]. In fact, it is still on the market but since 1936 its name changed to 7UP. In 1949, John Cadediscovered that higher Li concentrations were toxic. Nowadays, according Seidel et al. [16] 7UP onlycontains 1.4 µg Li/L.
In recent years, there have been ecological studies on aggregate data that suggest that long-termintake of low Li concentrations, such as occurring in public drinking water (tap water), may also promotemental health benefits for the general population. This research found that higher concentrations of Liin the tap water are associated with lower suicide mortality rates. These results were observed in Texas(1–160µg Li/L [18]), Japan (1–60µg Li/L [19]), Austria (<3–1300µg Li/L [20]), Greece (0.1–121µg Li/L [21])and Lithuania (0.5–35 µg Li/L [22]). This inverse association was found with or without adjustment foradditional confounding factors such as the socioeconomic factors that are closely related to suicide.However, in the east of England where Li concentrations in tap water are between 0.1 and 21 µg/L [23],in Italy (0.11–60.8 µg Li/L [24]), Denmark (0.6–30.7 µg Li/L [25]) and in Portugal (<1–191 µg Li/L [26])the association that high Li concentration in drinking water may protect against suicide was notwell supported.
Lithium has also been considered as a possible therapeutic agent for treating chronicneurodegenerative diseases such as Alzheimer’s, Parkinson’s, and Huntington’s diseases [27]. A Lidose of 300 µg/day has been reported to stabilize cognitive impairment in patients with Alzheimer’sdisease although the underlying molecular mechanisms have not yet been fully understood [28].
2

Int. J. Environ. Res. Public Health 2020, 17, 8369
Furthermore, there is experimental evidences that Li may have positive effects on bone health [29] andmuscle function [30].
From these findings it has been suggested that Li should be added to public drinking watersupplies to improve the mental health of the general population, although this would be prematureand raises ethical concerns [31] and further research on this subject is necessary.
Lithium doses used for mental health treatment are considerably higher than those obtained fromdaily exposure to Li in tap water. This raises questions regarding whether (an increased) daily intakeof Li from tap water can reduce the risk of suicide or otherwise be beneficial towards the mental healthof the population. As reported above, tap water is not the only liquid dietary source of Li and theearlier discussed studies did not take it into account.
Several studies have shown that various bottled waters are rich in Li; the highest values reported(9860 and 5450 µg Li/L) were from bottled waters from Slovakia [32] and Armenia (Hankavan-Lithia:5.45 mg Li/L). Mineral waters such as Vichy Catalan (1.3 mg Li/L) and Evian (6.6 µg Li/L) were initiallyalso promoted as Li waters based on their Li content [33].
Bottled water plays a more and more important role in daily life. The worldwide bottled waterconsumption is characterized by a significant growth over the last decade. Its consumption is stillincreasing [34], especially in developed countries, even though tap water quality is good and severalorders of magnitudes less expensive than bottled water. Although all bottled waters might look thesame, in fact each natural mineral or spring water has its own distinctive taste, a unique set of propertiesand a specific chemical composition at the source from where it is extracted, that reflects the geologicalcharacteristics of the region and water-rock interactions occurring at depth. Moreover, the definingcharacteristics of naturally sourced waters are reflected in their protected origin status and are guaranteedby strict European Union (EU) legislation governing the extraction and packaging of the product [35].
European and national legislation distinguish three categories of waters: natural mineral water,spring water and drinking water.
The EU has laid down specific rules for natural mineral and spring waters, which clearly set themapart from drinking water, more commonly known as tap water [36]. Lithium is one of the elementsfor which no potable water standards are defined in Europe. In Australia Li is listed as a pollutantthat causes environmental harm and it is limited to 2.5 mg/L for general irrigation and to a limit of0.075 g/L for the irrigation of citrus cultures, respectively [37].
Bottled water in the EU is predominantly made up of the natural mineral water category [35].The bottling and commercialization of natural mineral waters first began in Europe in the mid-16thcentury, with the mineral waters from Spa in Belgium, Vichy in France, Ferrarelle in Italy, and Apollinarisin Germany.
In 2016, natural mineral water accounted for 83% of EU bottled water retail, with spring wateraccounting for 14% [34].
In Portugal, like in other countries, natural mineral and spring waters have always aroused greatinterest due to their exceptional quality, diversity, and health-friendly effects. In 2018, the Portugueseper capita consumption of bottled waters was 134 L/year, which is the 7th highest European Unionaverage consumption (EU average is 119 L/year) [35].
Each natural mineral water in Europe must receive official recognition from the State’s competentauthority. In the list of natural mineral waters brands recognized by the EU 27 Member States, Portugalaccounts for 22 brands [38].
According to Portuguese Legislation [39] natural mineral waters (the subject of this study) arebacteriologically pure waters, of underground circulation, with stable physico-chemical characteristicsat the source within the range of natural fluctuations and which may result in possible therapeuticproperties or favorable health effects. Spring waters are also natural waters of underground circulation,bacteriologically pure, which do not have the characteristics necessary for qualification as naturalmineral waters, provided that at the source they are suitable for drinking.
3

Int. J. Environ. Res. Public Health 2020, 17, 8369
The present study aims to quantify the Li concentration in Portuguese marketed bottled naturalmineral waters to identify if they may represent a significant source of dietary Li intake. Due to itsbiological impact, it becomes more and more important to understand the Li content in drinking waterobtained from different sources, particularly in bottled natural mineral waters, especially in big cities.These data will be very helpful for evaluating the future Li intake via drinking water and diet ofPortuguese epidemiological studies related with Li health effects on the population or at an individuallevel, also contributing to the development of a Li food data base.
2. Materials and Methods
2.1. Sample Collection
The eighteen brands of bottled natural mineral waters characterized in this study were selectedfrom the list of the bottled natural mineral waters recognized by Portugal, updated in September2019 [39]. On this list, the brands Monchique and Chic are, according their label, the same mineralwater but commercialized in different packages. Also, the mineral waters Pedras Salgadas and PedrasLevíssima only differ in their CO2 content [40].
All studied natural mineral waters were purchased in supermarkets and local shops. Regardingthe type of packaging, nine of the natural mineral waters were bottled in polyethylene terephthalate(PET) and ten in glass bottles. It is not expected that the content of Li and other trace elementunder study in these mineral waters can be affected by bottled material leaching. According someexperiments [32] this becomes problematic for Sb in PET bottles and for Pb, Cr and Ce in glass bottlesat acid pH but not for Li.
These natural mineral waters have their catchment area on the Portugal mainland. Only the brandMagnificat issues at the volcanic island of São Miguel, Azores Archipelago (Figure 1).
Figure 1. (a) Portugal geographic location; (b) Distribution of the catchment location of the studiedPortuguese bottled natural mineral waters (adapted from Reference [41]).
4

Int. J. Environ. Res. Public Health 2020, 17, 8369
2.2. Sample and Data Analysis
The pH value of the samples was measured with a glass electrode connected to a WTW pH325-meter, previously calibrated against buffer solutions at pH 4.0, pH 7.0 and 10.0 (Merck), with anaccuracy of the pH measurement of about ±0.05 pH units. Electric conductivity corrected to atemperature of 25 C was measured using a WTW Cond 330i probe (WTW, Weilheim, Germany),previously calibrated with a 0.01 M KCl standard solution (WTW).
The anions, fluoride, chloride, nitrate, and sulphate were analyzed in non-acidified samples at theLaboratory of Mineralogy and Petrology of the Instituto Superior Técnico (LAMPIST, Lisboa, Portugal)by ion chromatography. A Thermo ScientificTM DionexTM ICS-900 (Dionex, Sunnyvale, CA, USA) withauto-sampler equipped with a conductivity detector, an IonPac AS22 column and a self-regeneratingsuppressor using a sodium carbonate–sodium bicarbonate eluent was used for the analyses. Standardsolutions (Merck) and ultrapure deionized water (resistivity 18.2 MΩ.cm at 25 C) produced in aDirect-Q®3 water purification system (Merck Millipore) were used to prepare calibration standards.A multi ion anion IC standard solution (Alfa Aesar Specure) was used every batch of samples as referenceand recalibration was performed if the average of triplicate measurements deviated by more than 10%.
The alkalinity was determined by volumetric titration on unfiltered and unacidified samples(50 mL) with a 0.02 N HCL solution, using an automatic Metrohm titrator (titration end point pH8.3 to determine OH- and/or CO2
3−, followed to titration end point pH 4.5 to determine HCO3
−
concentration, according to Standard Method 2.320B [42]).The dry residue (DR) content,was obtained from evaporation and drying the water sample at 180 C.The cations were analyzed at Activation Laboratories, Ltd. (Actlabs) (Vancouver, BC, Canada),
an accredited Laboratory, by inductively coupled plasma-mass spectrometry using a Thermo iCAP Q,after the samples had been acidified with concentrated HNO3 (≥65%) to a pH < 2. The Detection andQuantification Limits (LOD/LOQ) in µg/L are as follow: Li (0.02/0.06), Na (2/7), K (1/5), Ca (20/70),Mg (2/6), Mn (0.1/0.3), Rb (0.002/0.006) and Cs (0.001/0.003). Quality controls were achieved accordingto the Laboratory standards methods and quality assurance and protocols. The standards NIST 1643eand SLRS was used by Actlabs to check the validity and reproducibility of the results.
All samples were analyzed without filtration to represent the water consumed as it is in the bottle.The charge-balance errors, based on the percentage difference between the total positive charge
and the total negative charge (mEq), was below 10% for each sample.Pearson’s correlation coefficient and linear regression with a confidence interval of 95% were
calculated with TIBCO®Data Science—Statistica® (Palo Alto, CA, USA) software (version 13.5.017)and Piper diagram projections with RockWorks17 software.
3. Results and Discussion
The natural mineral waters discussed in this study are groundwaters abstracted from boreholes andbottled directly at the source. Their distribution across the Portuguese mainland is uneven, with a greaterconcentration in northern part of the country (Figure 1), mainly caused by the (i) geomorphologicand climatic conditions (higher mountains, colder climate, more rainfall/recharge), (ii) structuralcharacteristics such as the prevalence of deep faults responsible for meteoric waters infiltration at deepand natural mineral waters up flow to the surface as springs and (iii) geological signatures (morefractured and permeable rocks promoting water-rock interaction at depth and developing differentwater geochemical characteristics (e.g., Reference [43]).
The main characteristics of the studied Portuguese bottled natural mineral waters are presentedin Table 1.
5

Int. J. Environ. Res. Public Health 2020, 17, 8369
Table 1. Characteristics of the studied Portuguese bottled natural mineral waters.
Mineral Water Brand Type pHEC DR F− Cl− HCO3
− NO3− SO4
2− Na+ K+ Ca2+ Mg2+ Mn2+ Li+ Rb+ Cs+Water Type Place of Exploitation
µS/cm mg/L µg/L mg/L mg/L mg/L mg/L mg/L mg/L mg/L mg/L µg/L µg/L µg/L µg/L
1 Salutis S 5.2 49 32 16 7.8 1.2 3.8 1.8 4.3 0.7 0.8 0.57 10 1 2.4 0.04 Na-Cl Ferreira—Paredes deCoura
2 Fastio S 6.0 35 141 19 3.8 8.5 2.3 0.8 4.3 0.6 1.2 0.47 1 <1 1.7 0.11 Na-HCO3Chamoim—Terras de
Bouro
3 Monchique S 9.4 419 107 1058 31.7 126.9 nd 47.8 76.9 2.0 1.3 0.05 <1 1 5.1 0.03 Na-HCO3Caldas de
Monchique—Monchique4 Vimeiro Lisa S 7.1 83 75 <10 8.4 21.4 0.4 3.6 9.2 0.3 5.6 1.46 <1 1 0.3 0.02 Na-HCO3 Maceira—Torres5 Vitalis S 5.7 50 71 28 6.3 3.7 2.2 2.7 5.2 2.1 0.9 0.55 8 1 14.5 0.34 Na-Cl Castelo de Vide
6 Caldas dePenacova S 5.5 48 41 <10 7.8 4.3 1.8 1.3 6.1 0.3 0.7 1.10 4 2 0.9 0.19 Na-Cl Penacova
7 Magnificat NC 5.0 166 234 533 18.0 81.0 13.6 4.2 21.9 9.7 8.4 5.04 142 3 33.9 0.15 Na-HCO3 Serra do Trigo—Açores8 Castello AC 5.4 793 472 123 46.2 361.7 18.3 18.0 34.3 0.9 94.8 26.20 <1 7 0.4 0.04 Ca-HCO3 Pisões -Moura9 Luso S 5.6 58 56 31 7.3 12.2 1.5 1.4 7.4 0.8 0.8 1.81 3 7 3.5 0.39 Na-Cl Luso—Mealhada
10 Vimeiro AC 5.7 1050 2291 221 176.3 425.8 7.8 79.4 144.0 3.7 112 27.1 <1 11 3.4 0.19 Na/Ca-HCO3 Maceira—Torres11 Carvalhelhos S 7.0 248 453 963 2.6 141.5 0.2 6.9 55.0 1.4 5.6 0.70 1 173 16.3 30.90 Na-HCO3 Carvalhelhos -Boticas12 Carvalhelhos AC 5.3 189 208 498 2.7 124.4 1.1 7.6 52.3 1.4 5.9 0.62 <1 177 17.9 32.60 Na-HCO3 Carvalhelhos -Boticas
13 Melgaço NC 5.7 840 439 657 10.6 691.7 1.2 7.5 87.5 3.6 145 3.01 275 600 19.5 6.73 Ca-HCO3Quinta do
Peso—Melgaço14 Campilho AC 5.9 1892 1289 4131 15.6 1288.3 0.9 8.7 428.0 27.1 37.4 10.06 1 1590 215.0 222.00 Na-HCO3 Vidago—Chaves15 Frize NC 6.5 2300 2336 1440 100.2 1941.0 1.6 nd 630.0 41.1 75.6 25.05 53 1760 335.0 331.00 Na-HCO3 Sampaio—Vila Flor
16 PedrasSalgadas NC 6.1 2660 1825 1265 22.9 1897.1 0.2 7.5 594.0 34.4 95.6 24.70 213 1800 238.0 49.00 Na-HCO3
Pedras Salgadas—VilaPouca de Aguiar
17 Bem-Saúde NC 6.0 2310 1600 2100 90.0 1596.0 20.3 7.2 510.0 46.0 84.0 21.00 100 2000 na na Na-HCO3 Sampaio -Vila Flor18 Vidago NC 6.0 1554 1797 25 25.5 1869.0 0.8 7.7 624.0 53.8 73.7 14.40 20 2210 415.0 253.00 Na-HCO3 Vidago—Chaves
Notes: S—still natural mineral water; NC—naturally carbonated natural mineral water; AC—artificially carbonated natural mineral water; na—not available; nd—not detected.
6

Int. J. Environ. Res. Public Health 2020, 17, 8369
The natural mineral waters are commercialized with or without CO2 gas (carbonated or stillwater, respectively). In some of the sources, the dissolved CO2 can be present due to natural geologicalprocesses. If bottled as such it must be labelled as “naturally carbonated natural mineral water”(Table 1: NC waters). For example, in the case of Vidago and Pedras Salgadas waters, following [44]and references therein, their δ13 CCO2 values vary between −7.2 and −5.1‰ vs. V-PDB and CO2/
3Heratios range from 1 × 10⁸ to 1 × 10⁹, indicating a deep (upper mantle) source for the CO2. It may also bepossible to capture the natural source of CO2 and re-inject it into the water prior to bottling or addedit artificially, being, in the second case, described as “artificially carbonated natural mineral water”(Table 1: AC waters). If the waters are subjected to gasification processes, this must be indicated onthe label.
Considering the major ions present (expressed as percentage of the total mEq/L), the naturalmineral waters under study are mainly of the Na-HCO3 type, follow by the Na-Cl type (Salutis, Vitalis,Caldas de Penacova and Luso) and Ca-HCO3 type (Castello and Melgaço) (Table 1 and Figure 2).
δ − −
Figure 2. Piper Diagram showing the chemical composition of the studied Portuguese natural mineralwaters (water type legend: Ca-HCO3 (triangles); Na-Cl (circles), Na-HCO3 (squares); low and high Licontent (open and closed symbols, respectively); sample identification (number) as indicated in Table 1).
The natural mineral waters studied present a large range of Li concentrations. It ranges from lessthan 1 to 2210 µg/L and two groups can be recognized from the dataset: one group with low Li content(up to 11 µg/L) that represents 55.5% of the natural mineral water samples and a second group withhigher Li contents (173 to 2210 µg/L).
3.1. Bottled Natural Mineral Waters with Low Li Content
The group with low Li samples ascribed to natural mineral waters with Li ranging between<1 and 11 µg/L) are also waters with very low (DR < 50 mg/L) or low dissolved salts (50 < DR <500 mg/L). An exception is Vimeiro, with 2291 mg/L, due to water circulation through evaporite (withhalite and gypsum) and carbonate rocks that occur at the contact of diapiric structures [45]. The Liconcentrations measured in this group compare to Li concentrations observed in public drinking watersfrom 54 Portuguese municipalities [26]. According to Neves et al. [46], 75% of the water samples studiedby Oliveira et al. [26] show concentrations below 10µg Li/L, with a median of 4µg Li/L. This is also lowerthan the median of 14.9 µg/L detected for Li, in 1785 samples of bottled waters collected in 38 European
7

Int. J. Environ. Res. Public Health 2020, 17, 8369
countries and analyzed for the European Groundwater Geochemistry Atlas [32]. In comparison to Lidata available from German beverages such as wine (11.6 ± 1.97 µg/L), beer (8.5 ± 0.77 µg/L), soft andenergy drinks (10.2 ± 2.95 µg/L) as reported by Reference [16], these Portuguese natural mineral waterscan be considered Li-poor food items. The contribution of these natural mineral waters to the dietaryLi supply will not be significantly different from the contribution of tap water.
Little is known on the effects of dietary Li on the Li status in the human body that is estimatedeither from the concentration in blood (plasma or serum) or from urinary Li excretion. Like it is forsodium, Li homeostasis is adaptively regulated by the kidney and Li is mainly reabsorbed in theproximal tubule. Under normal conditions, approximately 80% of Li is reabsorbed by renal tubes [47].Excretion of Li occurs within 24 h after its oral intake and is facilitated by the kidneys. A small extent(2–3%) it is also excreted with feces and sweat [48].
Considering that the amount of Li taken by drinking water or food is probably reflected in serumor urinary Li levels, it will be necessary measure such levels, particularly in individuals that do notreceive Li therapy.
In a study performed by Bochud et al. [49] both serum and urinary lithium concentrations weremeasured in Belgians and South Africa participants and in the tap water consumed by them (10 µg Li/Land 0.21 µg Li/L, respectively). Their results showed that the 24-h urinary lithium excretion was higherand more dispersed in the Belgians than in the South African participants (8.2 ± 5.6 and 3.1 ± 4.1 µmolper 24 h) but serum lithium levels were almost identical (0.31 ± 0.16 and 0.32 ± 0.21 µmol Li/L).These observations suggested that serum lithium is tightly regulated even when there are largevariations in Li dietary intake from natural sources.
No increase in serum Li concentration was also observed by Seidel et al. [50] in the group thatreceived low Li mineral water (1.7 µg/L) and they reported that the 24-h urinary Li excretion exceedthe total uptake. At very low dietary intake, filtered Li is not fully reabsorbed [51] and Seidel et al. [50]suggested that there could be a minimum dietary need for Li to ensure a positive Li balance.
Concerning the protective effect of low exposure of Li from drinking water, future epidemiologicstudies are required. The only individual-level cohort study carried out, on the Danish population forthe period 1991–2012 [25], did not find any association for Li levels up to 31 µg/L in drinking water.However, information is still lacking regarding the quantity and/or duration of low Li exposure that isnecessary to be achieved for relating Li either with anti-suicide effects or to reduced aggressivity andimpulsivity, both associated with an increased risk of suicide [52].
3.2. Bottled Natural Mineral Waters with Higher Li Content
The group of the natural mineral waters with higher Li contents (173 to 2210 µg/L) are mostly of theNa-HCO3 water type, except in the case of Melgaço that is of the Ca-HCO3 type (ascribed to granodioriticrocks [53]). The highest Li content is measured in Vidago (Table 1). These waters are mainly exploitedfrom Hercynian granitic rocks in the north of Portugal, from within the Minho and Trás-os-Montesregions, in the Geotectonic unit Galiza-Trás-os-Montes Zone (Figure 1). The catchment areas of theseLi-rich waters is well correlated with regional fault systems, such as the “Penacova-Régua-VerinFault”(Campilho, Vidago and Pedras Salgadas), the “Vilariça Fault” (Frize and Bem-Saúde) and the“River Minho Fault” (Melgaço) (Figure 1), since they normally provide the best conditions for therising of fluids from deep crustal zones [43–45,53,54]. With exception of Campilho, all these Li-richnatural mineral waters are naturally carbonated, with free CO2 contents above 250 mg/L, identified onthe bottle label as a “gasocarbonic” water. Carbonated waters were preferred by the consumers, as inaddition to the slightly acidic taste, it stimulate the papillae tastes, favors digestion and especially ifthey are sodium carbonated water, they help to neutralize the acidity of the stomach [55].
Natural mineral waters with Li contents above 1500 µg/L present also high dissolved solids (DR >1000 mg/L) and they are rich in sodium (Na > 400 mg/L), potassium (K > 27 mg/L) and magnesium(Mg > 10 mg/L). A good correlation was observed between Li and Na (r = 0.966, p < 0.05) and betweenLi and K (r = 0.976 p < 0.05), as also reported by Reference [50]. As their Na contents are higher than
8

Int. J. Environ. Res. Public Health 2020, 17, 8369
200 mg/L they are classified as “water with sodium” [36] and so a regular consumption of these watersis not recommended for individuals that are on a low sodium diet.
Other elements that stand out in this Li rich group of bottled natural mineral waters, are fluorine(F−), rubidium (Rb) and cesium (Cs) (Table 1). Fluorine ranges from 1265 µg/L (Pedras Salgadas)to 4131 µg/L (Campilho), which according to Reference [36] can be also classified as “water withfluorine” (F− > 1 mg/L). In this group the Vidago natural mineral water with only 25 µg F−/L, is theexception. According to Calado and Almeida [56], this anomalous F− content, that does not resultfrom the dissolution of fluorite, as it was supposed but has a deep genesis, related to the circulation ofmineralizing fluids meso and/or infra-crustal origin. These fluids will be related to the lifting crustalphenomena (uplift) that mainly affect the north and center of the country [56].
The European Union (EU) Directive [57] defines a maximum admissible concentration of 5 mgF−/L in natural mineral waters and requires that F− concentrations above 1.5 mg/L are indicated on thelabel, following the general EU Directive [58] for drinking water. Excessive F− (>1.5 mg/L) incurs arisk of possible dental fluorosis, especially when the water is drunk regularly by children below theage of 7 and should be avoided also by adults.
Rubidium and Cs are also elements that are reported, together with Li, as a characteristic for somemineral waters related with water circulation through Hercynian granites. The maps of Rb (maximum673 µg/L) and Cs (maximum 415 µg/L) in European bottled water [32] also shows up flow sites innorthern Portugal and France (Massif Central) related to young granitic intrusions and complex typepegmatites of the LTC (Li-Ca-Ta) family.
It should be noted here that Li in water is present in aqueous solution in the form of hydratedLi+ ions. Being in solution, it may assimilate in the human body more easily as compared to solidfood or with the salts as used in medication. If the beneficial effect of Li could be achieved at saferlower doses, increasing its dietary intake would offer an approach to the prevention of the incidence ofmental disorders and a reduction in suicide attempts, aggressive behavior and conducted disorder asreported [18,59–61]. This way, it may be possible to reduce the amounts necessary to be administeredand could also reduce side effects.
A recent study with healthy male volunteers [50] indicates that Li derived from medium to highLi mineral water (171 and 1724 µg/L, respectively), is highly bioavailable. The consumption of themineral water with higher Li concentrations resulted in a peak serum content of up to 10–12 µmol Li/Lwhich did not return to baseline levels within 24 h. Also, the total urinary excretion of Li was positivelyassociated with Li uptake via mineral water. The data suggested that some minerals waters are animportant and bioavailable Li source for human intake. If confirmed, these findings have public healthrelevance and emphasize the need for more data on Li concentrations in drinking water, as bottlednatural mineral water, and their intake in a daily basis.
Among the Portuguese bottled natural mineral waters, Campilho, Frize, Pedras Salgadas,Bem-Saúde and Vidago waters, are the ones that can contribute more intensively to a significant Liabsorption or even to reach the provisional daily adult intake (1 mg Li/day).
A consumption of 0.5 L of each of these waters may provide between 0.75 and 1.1 mg Li/day,assuring adequate Li intakes, especially people that are at risk of Li nutritional deficiencies.So, as a source of bioavailable Li, its amount and frequency of ingestion cannot be ignored inecologic/epidemiologic Portuguese studies evaluating relations with intake of natural doses of Li viadrinking water or diet and mental health benefits.
It must be realized that the studied Li mineral waters are also rich in other elements as F− andNa, which can limit recommendations to be consumed regularly as source of Li for all individuals.For example, Vidago natural mineral water, due its lower F− content could be indicated as one thatcan be used for this purpose but attention should be put to its Na+ concentration, as excessive Nain the human diet can harm the kidneys and acerbate high blood pressure that is associated withhypertension and coronary diseases in some individuals [62]. On the other hand, a higher Na content
9
Int. J. Environ. Res. Public Health 2020, 17, 8369
in the water can also modify the Li absorption process, as an increased of Na intake may increase theexcretion of Li [48].
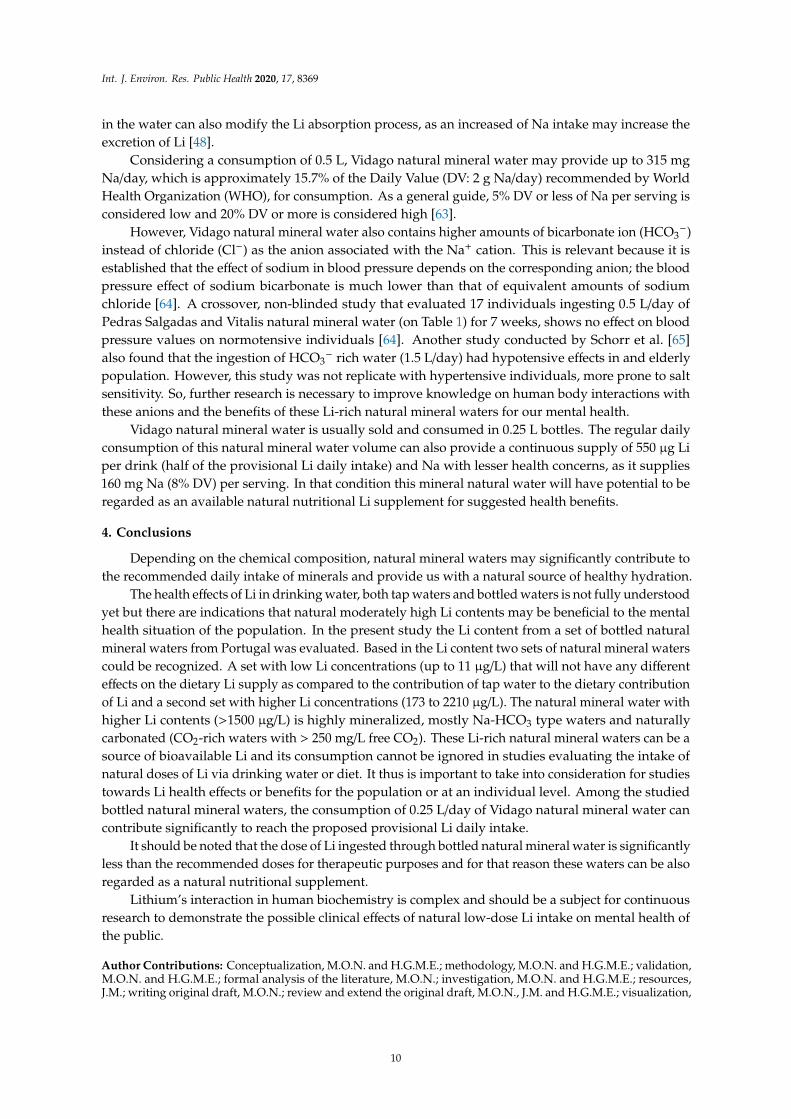
Considering a consumption of 0.5 L, Vidago natural mineral water may provide up to 315 mgNa/day, which is approximately 15.7% of the Daily Value (DV: 2 g Na/day) recommended by WorldHealth Organization (WHO), for consumption. As a general guide, 5% DV or less of Na per serving isconsidered low and 20% DV or more is considered high [63].
However, Vidago natural mineral water also contains higher amounts of bicarbonate ion (HCO3−)
instead of chloride (Cl−) as the anion associated with the Na+ cation. This is relevant because it isestablished that the effect of sodium in blood pressure depends on the corresponding anion; the bloodpressure effect of sodium bicarbonate is much lower than that of equivalent amounts of sodiumchloride [64]. A crossover, non-blinded study that evaluated 17 individuals ingesting 0.5 L/day ofPedras Salgadas and Vitalis natural mineral water (on Table 1) for 7 weeks, shows no effect on bloodpressure values on normotensive individuals [64]. Another study conducted by Schorr et al. [65]also found that the ingestion of HCO3
− rich water (1.5 L/day) had hypotensive effects in and elderlypopulation. However, this study was not replicate with hypertensive individuals, more prone to saltsensitivity. So, further research is necessary to improve knowledge on human body interactions withthese anions and the benefits of these Li-rich natural mineral waters for our mental health.
Vidago natural mineral water is usually sold and consumed in 0.25 L bottles. The regular dailyconsumption of this natural mineral water volume can also provide a continuous supply of 550 µg Liper drink (half of the provisional Li daily intake) and Na with lesser health concerns, as it supplies160 mg Na (8% DV) per serving. In that condition this mineral natural water will have potential to beregarded as an available natural nutritional Li supplement for suggested health benefits.
4. Conclusions
Depending on the chemical composition, natural mineral waters may significantly contribute tothe recommended daily intake of minerals and provide us with a natural source of healthy hydration.
The health effects of Li in drinking water, both tap waters and bottled waters is not fully understoodyet but there are indications that natural moderately high Li contents may be beneficial to the mentalhealth situation of the population. In the present study the Li content from a set of bottled naturalmineral waters from Portugal was evaluated. Based in the Li content two sets of natural mineral waterscould be recognized. A set with low Li concentrations (up to 11 µg/L) that will not have any differenteffects on the dietary Li supply as compared to the contribution of tap water to the dietary contributionof Li and a second set with higher Li concentrations (173 to 2210 µg/L). The natural mineral water withhigher Li contents (>1500 µg/L) is highly mineralized, mostly Na-HCO3 type waters and naturallycarbonated (CO2-rich waters with > 250 mg/L free CO2). These Li-rich natural mineral waters can be asource of bioavailable Li and its consumption cannot be ignored in studies evaluating the intake ofnatural doses of Li via drinking water or diet. It thus is important to take into consideration for studiestowards Li health effects or benefits for the population or at an individual level. Among the studiedbottled natural mineral waters, the consumption of 0.25 L/day of Vidago natural mineral water cancontribute significantly to reach the proposed provisional Li daily intake.
It should be noted that the dose of Li ingested through bottled natural mineral water is significantlyless than the recommended doses for therapeutic purposes and for that reason these waters can be alsoregarded as a natural nutritional supplement.
Lithium’s interaction in human biochemistry is complex and should be a subject for continuousresearch to demonstrate the possible clinical effects of natural low-dose Li intake on mental health ofthe public.
Author Contributions: Conceptualization, M.O.N. and H.G.M.E.; methodology, M.O.N. and H.G.M.E.; validation,M.O.N. and H.G.M.E.; formal analysis of the literature, M.O.N.; investigation, M.O.N. and H.G.M.E.; resources,J.M.; writing original draft, M.O.N.; review and extend the original draft, M.O.N., J.M. and H.G.M.E.; visualization,
10

Int. J. Environ. Res. Public Health 2020, 17, 8369
M.O.N. and J.M.; funding acquisition, J.M. All authors have read and agreed to the published version ofthe manuscript.
Funding: This research was funded by FCT—Fundação para a Ciência e a Tecnologia, grant numberPest-OE/CTE/UI0098/2011) and supported by CERENA Research Center (UIDB/04028/2020), funded by FCT,FEDER funds.
Acknowledgments: The authors would like to thank Antunes da Silva (SuperBock group) for helpful discussionsduring the development of the study. The authors are also grateful to Sumol + Compal (Companhia Portuguesade Conservas Alimentares, SA) for the availability of data of the bottled natural mineral water “Bem-Saúde.”An early draft of the manuscript was critically read by four anonymous reviewers and we gratefully acknowledgetheir contributions.
Conflicts of Interest: The authors declare no conflict of interest.
References
1. World Health Statistics 2016: Monitoring Health for the SDGs. Chapter 6. pp. 29–42. Available online:https://www.who.int/gho/publications/world_health_statistics/2016/en/ (accessed on 12 May 2020).
2. Cade, J.F. Lithium salts in the treatment of psychotic excitement. Med. J. Aust. 1949, 2, 349–352. [CrossRef][PubMed]
3. Young, W. Review of lithium effects on brain and blood. Cell Trans. 2009, 18, 951–975. [CrossRef] [PubMed]4. Oruch, R.; Elderbi, M.A.; Khattab, H.A.; Pryme, I.F.; Lund, A. Lithium: A review of pharmacology, clinical
uses, and toxicity. Eur. J. Pharmacol. 2014, 740, 464–473. [CrossRef] [PubMed]5. Emsley, J. The Elements, 2nd ed.; Clarendon Press: Oxford, UK, 1991; p. 107.6. Schrauzer, G.N. Lithium: Occurrence, dietary intakes, nutritional essentiality. J. Am. Coll. Nutr. 2002, 21,
14–21. [CrossRef]7. Cauwenbergh, R.V.; Hendrix, P.; Robberecht, H.; Deelstra, H. Daily dietary lithium intake in Belgium using
duplicate portion sampling. Eur. Food Res. Technol. 1991, 208, 153–155. [CrossRef]8. Ysart, G.; Miller, P.; Crews, H.; Robb, P.; Baxter, M.; De L’Argy, C.; Lofthouse, S.; Sargent, C.; Harrison, N.
Dietary exposure estimates of 30 elements from the UK Total Diet Study. Food Addit. Contam. 1999, 16,391–403. [CrossRef]
9. ANSES. Second French Total Diet Study (FTDS2) Report 1. Inorganic Contaminants, Minerals, PersistentOrganic Pollutants, Mycotoxins and Phytoestrogens. 2011, p. 60. Available online: https://www.anses.fr/en/system/files/PASER2006sa0361Ra1EN.pdf (accessed on 12 May 2020).
10. Marcussen, H.; Jensen, B.H.; Petersen, A.; Holm, P.E. Dietary exposure to essential and potentially toxicelements for the population of Hanoi, Vietnam. Asia Pac. J. Clin. Nutr. 2013, 22, 300–311.
11. Pearson, A.J.; Ashmore, E. Risk assessment of antimony, barium, beryllium, boron, bromine, lithium, nickel,strontium, thallium and uranium concentrations in the New Zealand diet. Food Addit. Contam. Part A 2020,37, 451–464. [CrossRef]
12. González-Weller, D.; Rubio, C.; Gutiérrez, A.J.; González, G.L.; Mesa, J.M.C.; Gironés, C.R.; Ojeda, A.B.;Hardisson, A. Dietary intake of barium, bismuth, chromium, lithium, and strontium in a Spanish population(Canary Islands, Spain). Food Chem. Toxicol. 2013, 62, 856–868. [CrossRef]
13. Weiner, M.I. Overview of lithium toxicity. In Lithium in Biology and Medicine; Schrauzer, G.N., Klippel, K.F.,Eds.; VCH Verlag: Weinheim, Germany, 1991; pp. 83–99.
14. Goldstein, M.R.; Mascitelli, L. Is violence in part a lithium deficiency? Med. Hypotheses 2016, 89, 40–42.[CrossRef]
15. Mleczek, M.; Siwulski, M.; Rzymski, P.; Budzynska, S.; Gasecka, M.; Kalac, P.; Niedzielski, P. Cultivation ofmushrooms for production of food biofortified with lithium. Eur. Food Res. Technol. 2017, 243, 1097–1104.[CrossRef]
16. Seidel, U.; Jans, K.; Hommen, N.; Ipharraguerre, I.R.; Lüersen, K.; Birringer, M.; Rimbach, G. Lithium Contentof 160 Beverages and Its Impact on Lithium Status in Drosophila melanogaster. Foods 2020, 9, 795. [CrossRef][PubMed]
17. El-Mallakh, R.S.; Roberts, R.J. Lithiated Lemon-Lime Sodas. Am. J. Psychiatr. 2007, 164, 1662. [CrossRef][PubMed]
18. Schrauzer, G.N.; Shrestha, K.P. Lithium in drinking water and the incidences of crimes, suicides, and arrestsrelated to drug addictions. Biol. Trace Elem. Res. 1990, 25, 105–113. [CrossRef] [PubMed]
11

Int. J. Environ. Res. Public Health 2020, 17, 8369
19. Ohgami, H.; Terao, T.; Shiotsuki, I.; Ishii, N.; Iwata, N. Lithium levels in drinking water and risk of suicide.Br. J. Psychiatr. 2009, 194, 464–465. [CrossRef] [PubMed]
20. Kapusta, N.D.; Mossaheb, N.; Etzersdorfer, E.; Hlavin, G.; Thau, K.; Willeit, M.; Praschak-Rieder, N.;Praschak-Rieder, N.; Sonneck, G.; Leithner-Dziubas, K. Lithium in drinking water and suicide mortality.Br. J. Psychiatr. 2011, 198, 346–350. [CrossRef]
21. Giotakos, O.; Nisianakis, P.; Tsouvelas, G.; Giakalou, V. Lithium in the public water supply and suicidemortality in Greece. Biol. Trace Elem. Res. Biolog. 2013, 156, 376–379. [CrossRef]
22. Liaugaudaite, V.; Mickuviene, N.; Raskauskiene, N.; Naginiene, R. Lithium levels in the public drinkingwater supply and risk of suicide: A pilot study. J. Trace Elem. Med. Biol. 2017, 43, 197–201. [CrossRef]
23. Kabacs, N.; Memom, A.; Obinwa, T.; Stochl, J.; Perez, J. Lithium in drinking water and suicide rates acrossthe East of England. Br. J. Psychiatr. 2011, 198, 406–407. [CrossRef]
24. Pompili, M.; Vichi, M.; Dinelli, E.; Pycha, R.; Valera, P.; Albanese, S.; Lima, A.; De Vivo, B.; Cicchella, D.;Fiorillo, A.; et al. Relationships of local lithium concentrations in drinking water to regional suicide rates inItaly. World J. Biol. Psychiatr. 2015, 16, 567–574. [CrossRef]
25. Knudsen, N.N.; Schullehner, J.; Hansen, B.; Jørgensen, L.F.; Kristiansen, S.M.; Voutchkova, D.D.; Gerds, T.A.;Andersen, P.K.; Bihrmann, K.; Grønbæk, M.; et al. Lithium in Drinking Water and Incidence of Suicide:A Nationwide Individual-Level Cohort Study with 22 Years of Follow-Up. Int. J. Environ. Res. Public Health
2017, 14, 627. [CrossRef] [PubMed]26. Oliveira, P.; Zagalo, J.; Madeira, N.; Neves, O. Lithium in Public Drinking Water and Suicide Mortality in
Portugal: Initial Approach. Acta Med. Port. 2019, 32, 47–52. [CrossRef] [PubMed]27. Marmol, F. Lithium: Bipolar disorder and neurodegenerative diseases. Possible cellular mechanisms of the
therapeutic effects of lithium. Prog. NeuroPsychopharmacol. Biol. Psychiatry 2008, 32, 1761–1771. [CrossRef]28. Andrade Nunes, M.; Viel, T.A.; Buck, H.S. Microdose lithium treatment stabilized cognitive impairment in
patients with Alzheimer’s disease. Curr. Alzheimer Res. 2013, 10, 104–107.29. Liu, B.; Wu, Q.; Zhang, S.; Del Rosario, A. Lithium Use and Risk of Fracture: A Systematic Review and
Meta-Analysis of Observational Studies. Osteoporos. Int. 2018, 30, 257–266. [CrossRef] [PubMed]30. Jung, S.; Koh, J.; Kim, S.; Kim, K.E. Effect of Lithium on the Mechanism of Glucose Transport in Skeletal
Muscles. J. Nutr. Sci. Vitaminol. 2017, 63, 365–371. [CrossRef] [PubMed]31. Ng, J.; Manne Sjöstrand, M.; Eyal, N. Adding Lithium to Drinking Water for Suicide Prevention—The Ethics.
Public Health Ethics 2019, 12, 274–286. [CrossRef]32. Reimann, C.; Birke, M. Geochemistry of European Bottled Water; Borntraeger Science Publishers: Stuttgart,
Germany, 2010; pp. 46–159.33. Schafer, U. Evaluation of beneficial and adverse effects on plants and animals following lithium deficiency
and supplementation, and on humans following lithium treatment of mood disorders. Trace Elem. Electrolytes
2012, 29, 91–112. [CrossRef]34. STATISTA. Per Capita Consumption of Bottled Water in Europe in 2017, by Country. Available online:
https://www.statista.com/statistics/455422/bottled-water-consumption-in-europe-per-capita/ (accessed on15 May 2020).
35. EFBW. Natural Waters: The Natural Choice for Hydration. Available online: https://www.efbw.org/ (accessedon 15 May 2020).
36. Council Directive 2009/54/EC/18-6-2009 on the exploitation and marketing of natural mineral waters. Off. J. EU
2009, L164, 45–58.37. ANZ Guidelines. ANZECC-ARMCANZ-2000-Guidelines-Vol1. Available online: https://www.waterquality.
gov.au/media/57 (accessed on 20 May 2020).38. Publications Office of the EU. List of Natural Mineral Waters Recognized by Member States. Available
online: https://op.europa.eu/en/publication-detail/-/publication/b9453284-4083-11e3-b4f5-01aa75ed71a1/language-en/format-PDF/source-140676132 (accessed on 15 May 2020).
39. Lei 54/2015. Bases do regime jurídico da revelação e do aproveitamento dos recursos geológicos existentesno território nacional, incluindo os localizados no espaço marítimo nacional. DRE 2015, 54, 4296–4308.
40. Super Bock Group. Águas. Água das Pedras. Ficha Técnica. Available online: https://www.superbockgroup.com/produto/aguas/ (accessed on 15 May 2020).
12
Int. J. Environ. Res. Public Health 2020, 17, 8369
41. Lourenço, C.; Pascoal, R. O Estudo Metagenómico das Águas Minerais Naturais tendo em vista oReconhecimento Científico das Vocações Terapêuticas. Bol. Minas (Ed. Espec. Term.) 2018–2019, 53,39–53.
42. Greenberg, A.; Clesceri, L.S.; Andrew, D.; Eaton, A.D. Standard Methods for the Examination of Water and
Wastewater, 18th ed.; American Public Health Association, American Water Works association, WaterEnvironment Federations: Washington, DC, USA, 1992; pp. 25–27.
43. Marques, J.M.; Carreira, P.M.; Neves, O.; Espinha Marques, J.; Teixeira, J. Revision of the hydrogeologicalconceptual models of two Portuguese thermomineral water systems: Similarities and differences.Sustain. Water Resour. Manag. 2019, 5, 117–133. [CrossRef]
44. Marques, J.M.; Carreira, P.M.; Aires-Barros, L.A.; Monteiro Santos, F.A.; Antunes da Silva, M.;Represas, P. Assessment of Chaves Low-Temperature CO2-Rich Geothermal System (N-Portugal) Using anInterdisciplinary Geosciences Approach. Geofluids 2019, 2019, 1379093. [CrossRef]
45. Lourenço, C.; Ribeiro, L.; Cruz, J. Classification of natural mineral and spring bottled waters of Portugalusing Principal Component Analysis. J. Geoch. Explor. 2010, 107, 362–372. [CrossRef]
46. Neves, O.; Machete, I.; Marques, J.M.; da Silva, J.A.L.; Simões do Couto, F. Lítio em águas engarrafadas e deabastecimento público portuguesas. Com. Geol. 2015, 102, 103–106.
47. Rybakowski, J.; Drogowska, J.; Abramowicz, M.; Chłopocka-Wozniak, M.; Czekalski, S. The effect oflong-term lithium treatment on kidney function. Psychiatr. Pol. 2012, 246, 627–636.
48. Szklarska, D.; Rzymski, P. Is Lithium a Micronutrient? From Biological Activity and EpidemiologicalObservation to Food Fortification. Biol. Trace Elem. Res. 2019, 189, 18–27. [CrossRef]
49. Bochud, M.; Staessen, J.A.; Woodiwiss, A.; Norton, G.; Maillard, M.; Burnier, M. Context dependency ofserum and urinary lithium: Implications for measurement of proximal sodium reabsorption. Hypertension
2007, 49, e34. [CrossRef]50. Seidel, U.; Baumhof, E.; Hägele, F.A.; Bosy-Westphal, A.; Birringer, M.; Rimbach, G. Lithium-Rich Mineral
Water is a Highly Bioavailable Lithium Source for Human Consumption. Mol. Nutr. Food Res. 2019, 63,e1900039. [CrossRef]
51. Uwai, Y.; Arima, R.; Takatsu, C.; Furuta, R.; Kawasaki, T.; Nabekura, T. Sodium-Phosphate CotransporterMediates Reabsorption of Lithium in Rat Kidney. Pharmacol. Res. 2014, 87, 94–98. [CrossRef]
52. Kovacsics, C.E.; Gottesman, I.I.; Gould, T.D. Lithium’s Antisuicidal Efficacy: Elucidation of NeurobiologicalTargets Using Endophenotype Strategies. Annu. Rev. Pharmacol. Toxicol. 2009, 49, 175–198. [CrossRef][PubMed]
53. Carreira, P.M.; Marques, J.M.; Carvalho, M.R.; Nunes, D.; Antunes da Silva, M. Carbon isotopes andgeochemical processes in CO2-rich cold mineral water, N-Portugal. Environ. Earth Sci. 2014, 71, 2941–2953.[CrossRef]
54. Lourenço, M.C. Modelação Estatística das Águas Gasocarbónicas de Vidago e Pedras Salgadas. Master’sThesis, Instituto Superior Técnico, Lisbon, Portugal, April 2000.
55. APIAM. Águas Minerais Naturais e Águas de Nascente—Livro Branco. Available online: http://www.apiam.pt/publicacoes/Livro-Branco-APIAM/-/47/23/175 (accessed on 18 May 2020).
56. Calado, C.; Almeida, C. Geoquímica do Flúor em Águas Minerais da Zona Centro Ibérica. Memórias 1993, 3,319–323.
57. Council Directive 2003/40/EC/16-5-2003/ establishing the list, concentration limits and labelling requirementsfor the constituents of natural mineral waters and the conditions for using ozone-enriched air for thetreatment of natural mineral waters and spring waters. Off. J EU 2003, L126, 34–39.
58. Council Directive 98/83/EC/3-11-1998/on the quality of water intended for human consumption. Off. J EU
1998, L330, 32–54.59. Campbell, M.; Adams, P.B.; Small, A.M.; Kafantaris, V.; Silva, R.R.; Shell, J.; Perry, R.; Overall, J.E. Lithium in
hospitalized aggressive children with conduct disorder: A double-blind and placebo-controlled study. J. Am.
Acad. Child Adolesc. Psychiatr. 1995, 34, 445–453. [CrossRef]60. Cipriani, A.; Pretty, H.; Hawton, K.; Geddes, J. Lithium in the prevention of suicidal behavior and all-cause
mortality in patients with mood disorders: A systematic review of randomized trials. Am. J. Psychiatr. 2005,162, 1805–1819. [CrossRef]
13

Int. J. Environ. Res. Public Health 2020, 17, 8369
61. Jones, R.; Arlidge, J.; Gillham, R.; Reagu, S.; van den Bree, M.; Taylor, P. Efficacy of mood stabilisers in thetreatment of impulsive or repetitive aggression: Systematic review and meta-analysis. Br. J. Psychiatr. 2011,198, 93–98. [CrossRef]
62. Rodriguez, C.J.; Bibbins-Domingo, K.; Jin, Z.; Daviglus, M.L.; Goff, D.C., Jr.; Jacobs, D.R. Association ofsodium and potassium intake with left ventricular mass: Coronary artery risk development in young adults.Hypertension 2011, 58, 410–416. [CrossRef]
63. U.S. Food & Drug Administration. Sodium in Your Diet—Use the Nutrition Facts Label and Reduce YourIntake. Available online: https://www.fda.gov/food/nutrition-education-resources-materials/sodium-your-diet (accessed on 18 September 2020).
64. Santos, A.; Martins, M.J.; Severo, M.; Guimarães, J.; Azevedo, I. Ingestão de água mineral naturalgasocarbónica hipersalina e pressão arterial. Rev. Port. Cardiol. 2010, 29, 159–172.
65. Schorr, U.; Distler, A.; Sharma, A.M. Effect of sodium chloride and sodium bicarbonate-rich mineral water onblood pressure and metabolic parameters in elderly normotensive individuals: A randomized double-blindcrossover trial. J. Hypertens. 1996, 14, 131–135. [PubMed]
Publisher’s Note: MDPI stays neutral with regard to jurisdictional claims in published maps and institutionalaffiliations.
© 2020 by the authors. Licensee MDPI, Basel, Switzerland. This article is an open accessarticle distributed under the terms and conditions of the Creative Commons Attribution(CC BY) license (http://creativecommons.org/licenses/by/4.0/).
14
International Journal of
Environmental Research
and Public Health
Communication
Preliminary Assessment of Chemical Elements inSediments and Larvae of Gomphidae (Odonata) fromthe Blyde River of the Olifants River System,South Africa
Abraham Addo-Bediako * and Karabo Malakane
Department of Biodiversity, University of Limpopo, Private Bag X1106, Sovenga 0727, South Africa;[email protected]* Correspondence: [email protected]; Tel.: +27-15-2683145
Received: 21 July 2020; Accepted: 17 August 2020; Published: 4 November 2020
Abstract: Benthic macroinvertebrates and sediments can act as good indicators of environmentalquality. The aim of this study was to assess the accumulation of chemical elements in the Gomphidae(Odonata) collected in the Blyde River. Seven sites were sampled for river sediments assessmentand five sites for larvae (naiads) of Gomphidae bioaccumulation analysis. The tissue samples wereanalysed using inductively coupled plasma optical emission spectrometry (ICP-OES). The resultsshowed high levels of all of the tested elements except Cd in the sediment. The mean concentrationsof As, Cu and Cr exceeded the standard guideline values, whereas Pb and Zn were below thestandard guideline values. In the insect body tissue, the concentrations of most elements were higherthan in the sediments. The elements with the highest concentrations were Mn, Zn, Cu, and As.The bioaccumulation factor (BF) showed a tendency for bioaccumulation for almost all of the selectedelements in the insect. The BF value was high for Cu, Mn, Sb, and Zn (BF > 1). The high concentrationsof elements in the insect body tissue may pose a risk to fish that consume them, and subsequentlyto humans when fish from the river are consumed. It is therefore important to monitor the river toreduce pollution to prevent health risks in humans, especially in communities that rely on the riverfor water and food.
Keywords: bioaccumulation; Gomphidae; heavy metals; naiads; metalloids; pollution; sediments
1. Introduction
Globally, rivers and streams are threatened by anthropogenic pollution, such as toxic elements,due to intensive land-use and inadequate environmental management practices [1–3]. Though mostelements occur naturally in the biogeochemical cycle, many are released into inland waters asindustrial, mining, agricultural, and domestic effluents, and may be harmful to aquatic systems [4].River sediments serve as a habitat for various benthic macroinvertebrates and can serve as a sinkfor elements such as heavy metals. The burrowing activity of some benthic organisms leads to theirchronic exposure to sediments contaminated with chemical elements [5].
Some elements are essential micronutrients for living organisms, while some (e.g., Cd, Cr andPb) are toxic to living organisms, even at low concentrations. The toxicity of elements in aquaticecosystems is complex and dependent on their bioavailability. Due to their prevalence and toxicity,heavy metal contamination in aquatic ecosystems poses a serious environmental threat [6–8]. This maylead to a decline in freshwater ecosystem functioning and biodiversity [9]. The available elements inthe environment (sediment and water) can be assimilated into living tissues through direct uptakeand the food chain, and if accumulated at unacceptable concentrations can affect the aquatic biota [10].
15

Int. J. Environ. Res. Public Health 2020, 17, 8135
When the contaminants are incorporated into the food chain, it poses a toxicity risk to the organismsthat consume them: fish, fish-eating birds, mammals and humans [11].
Many benthic organisms represent a link for the transfer of elements from the sediments toupper trophic levels. Macroinvertebrates play a major ecological role in conveying energy from lowertrophic levels upwards. They serve as food for many predatory organisms in the water including fish,which are a vital food for many rural communities, especially low-income groups [12]. Humans whoregularly consume contaminated fish are at risk to genotoxic, carcinogenic, and non-carcinogenichealth impairment from long-term exposure to toxic contaminants [13,14]. Thus, it has becomeincreasingly important to assess the levels of chemical elements in the body tissues of aquatic organismsas an indicator of metal and metalloid pollution in aquatic systems and to determine whether the food(e.g., fish) from impacted river systems are suitable for human consumption [15].
The Blyde River is one of the main tributaries of the Olifants River System. The river serves asa source of drinking water and food (fish) to the rural communities living in the catchment. The larvae(naiads) of dragonflies (Gomphidae, order Odonata) were selected for the study. They are goodecological indicators and reflect the quality of aquatic systems [16,17]. The larvae are importantpredators in aquatic ecosystems and prey on benthic and planktonic invertebrates [18] and also serve asfood for many fish species. The aim of the study was to assess the concentration of chemical elements(bioaccumulation) in the larvae of Gomphidae and to predict the potential risk of transfer of toxicelements to fish species.
2. Materials and Methods
2.1. Study Area
The Blyde River rises on the western slopes of the north-south trending Drakensberg Mountainsand flows northwards towards the escarpment edge where it is dammed. From the dam, the Blyde Rivercascades down a steep series of rapids to its lower reaches, where the river again flows northwards to jointhe Olifants River at the town of Hoedspruit in Limpopo Province [19]. The Blyde River sub-catchmentis approximately 2000 km2 in size. Geologically, the northern part of the sub-catchment is made upof crystalline gneissic and granitic rocks of the Basement Complex, underlying the catchment [19].The sub-catchment lies partly on the escarpment and, as a result, experiences considerably higherrainfall than the other sub-catchments in the Olifants River Basin, with mean annual precipitationsometimes exceeding 1000 mm [19]. During the last decade, there has been an increase in humanactivities in the area, especially agriculture, which are likely to cause environmental pollution in thefreshwater systems.
The river is subjected to various sources of anthropogenic pollution, including domestic waste(S1 and S2), agricultural runoff (S3 and S5), and industrial waste (Site 4), while S6 and S7 are naturereserves (Table 1). The sampling sites were spread along the Blyde River until near the confluence withthe Olifants River. The study sites ranged between 2430′59.46” S 3047′56.14” E and 2415′30.38” S3050′13.22” E (Figure 1).
Table 1. Location, description of activities, vegetation cover and substrate type (%).
Site Activity Vegetation Cover Cobbles Sand Silt Mud
S1 Domestic 70% (mainly shrubs and trees) 50 20 20 10
S2 Domestic/agriculture 60% (mainly shrubs, grass, and a few trees) 30 30 20 20
S3 Agriculture (mainly mangoes and citrus) 90% (mainly trees and shrubs) 40 30 20 10
S4Industries (mainly local furnituremanufacturing, automotive services andfruit processing factories)
20% (mainly shrubs and grass) 30 20 30 20
S5 Agriculture (mainly mangoes and citrus) 70% (mainly trees and shrubs) 20 20 30 30
S6 Nature reserve (little human activity) 80% (mainly trees, shrubs and grass) 20 20 30 30
S7 Nature reserve (little human activity) 50% (mainly shrubs and grass, and a few trees) 30 30 20 20
16

Int. J. Environ. Res. Public Health 2020, 17, 8135
Figure 1. Map of the study area, showing the locations of the seven sampling sites of the Blyde River.
2.2. Sampling and Analysis
Sediment samples were collected at seven sites along the Blyde River during the monthsof February, April, July and October, in 2018. The samples were collected in acid pre-treatedpolyethylene bottles. The sediment was frozen prior to chemical analysis. Gomphidae larvae weresampled using a 30 by 30 cm SASS net with a 500 µm mesh size [20]. The samples collected at S3and S7 were not sufficient for chemical analysis. Sediments and macroinvertebrate samples werethen analysed for elements at an accredited (ISO 17025) chemical laboratory (WATERLAB (PTY)LTD, Pretoria, South Africa). The samples were put in acid-washed polypropylene pre-weighedvials and dried at 60 C for 24 h, and a mixture of HNO3 and HCl was added. Subsequently,the samples were digested in an oven [21]. The digested samples were cooled at room temperature,filtered using filter papers, and collected in beakers. The following metals and metalloids were thenanalysed in batches with blanks using inductively coupled plasma–optical emission spectrometry(ICP-OES; Perkin Elmer, Optima 2100 DV, Pretoria, South Africa): Arsenic (As), Antimony (Sb),Cadmium (Cd), Chromium (Cr), Copper (Cu), Lead (Pb), Manganese (Mn), Nickel (Ni) and Zinc (Zn).The analytical accuracy was determined using certified standards (De Bruyn Spectroscopic Solutions500 MUL20 - 50 STD2) and recoveries were within 10% of certified values. The detection limitswere: As—0.001 mg/kg, Cd—0.0001 mg/kg, Cr—0.001 mg/kg, Cu—0.001 mg/kg, Mn—0.0025 mg/kg,Ni—0.001 mg/kg, Pb—0.001 mg/kg, Sb—0.001 mg/kg, and Zn—0.001mg/kg.
2.3. Statistical Analysis
The mean and standard deviation of four samples at each site from the respective concentrationsof the elements in the sediments were calculated. Analysis of variance (ANOVA) was performedusing SPSS to determine whether there were significant differences among the different sites for theconcentrations of the elements. Pearson’s correlation matrix was used to identify the relationshipbetween the metals. The ability of benthic macroinvertebrates to accumulate chemical elements wasquantified through the bioaccumulation factors (BF) according to Klavinš et al. [22]
17

Int. J. Environ. Res. Public Health 2020, 17, 8135
The bioaccumulation factor is calculated using the following formula:
BF = Corg/Csediment
where Corg is the element mass fraction in the organism (mg kg−1 dry weight) and Csediment is theelement concentration of the sediment (mg kg−1 dry weight).
3. Results and Discussion
The mean concentrations of the elements in the sediment samples at the different sites are shownin Table 2. The concentrations of As, Cu and Sb varied significantly among the different sites (p < 0.05).The variations in the concentrations of the elements among sites could be due to the type of effluentswashed into the river from the catchment. The highest concentrations of As, Cu, Sb, and Zn wererecorded at S3. The highest concentrations of Cr, Mn and Ni were recorded at S5, and the highestconcentrations of Cd at S6.
The high concentrations of most of the chemical elements may be due to direct or indirect landsurface runoff of agricultural fields at S3 and the release of urban sewage and industrial effluents atS5 [23,24]. Furthermore, the grain-size distribution of the sediments at different sites could have alsocontributed to the type and concentrations of the elements. The proportion of finer particles at S5was higher than that of coarse grains and may have contributed to the high concentration of chemicalelements. Thus, as the grain size decreases, the metal content increases [25,26]. The mean concentrationof As was greater than the CCME [27] guideline value of 13 mg kg−1, dw at all the sites. The highAs concentration at S3 might have been coming from pesticides and fertilizers used in agriculturalfields [28,29]. The mean concentrations of Cr exceeded the guideline value of 37.3 mg kg−1, dw at all thesites. Chromium and its salts are used in pigments and paints, in fungicides, and in chrome alloy andchromium metal production [30]. In this study, the main source of Cr in the sediment was mainly fromagricultural activities. The concentration of Cu exceeded the guideline value of 37.3 mg kg−1, dw at allthe sites except S7. The high concentration of Cu in the study sites could be attributed to agriculturalactivities (pesticides, herbicides and fungicides) and to municipal wastewater and discharges fromthe catchment.
18

Int. J. Environ. Res. Public Health 2020, 17, 8135
Table 2. Concentrations (mg kg−1) of chemical elements at different sites in the Blyde River sediment samples.
ElementS1 S2 S3 S4 S5 S6 S7 SQG
AVE ± SD AVE ±SD AVE ±SD AVE ±SD AVE ±SD AVE ±SD AVE ±SD
As 29.04 19.6 57.2 59.2 107.57 49.3 51.03 40.5 44.88 46.6 50.79 46.0 6.23 3.6 5.9Cd ND - 0.04 0.05 0.09 0.1 0.01 0.02 0.11 0.18 0.41 0.7 ND - 0.6Cr 56.33 15.5 48.9 16.8 98.24 42.5 80.44 50.3 108.0 73.8 41.5 12.8 76.1 449 37.3Cu 36.74 20.4 82.0 90.2 274.34 148.3 73.99 50.8 63.46 52.8 63.62 62.1 15.23 8.9 35.7Mn 494.6 69.1 748.7 530.4 1175 490.5 949.8 635 1298.8 776 685.31 263 984.3 404 -Ni 137.4 118 126.9 111.2 166.4 104.8 115.1 101 281.69 329 109.9 104 288.1 301 -Pb 4.94 0.57 7.23 1.68 16.13 4.1 7.18 1.83 7.36 1.1 7.49 2.1 6.57 0.75 35Sb 1.48 1.1 8.19 7.71 24.74 6.7 6.3 5.6 7.24 7.0 7.11 5.4 0.4 0.69 -Zn 29.19 24.2 30.1 22.19 75.68 62.2 48.26 25.0 38.58 23.6 42.83 38.7 45.58 40.9 123
AVE: Average; SD: standard deviation; ND—not detected. SQG: Sediment quality guideline (CCME).
19
Int. J. Environ. Res. Public Health 2020, 17, 8135
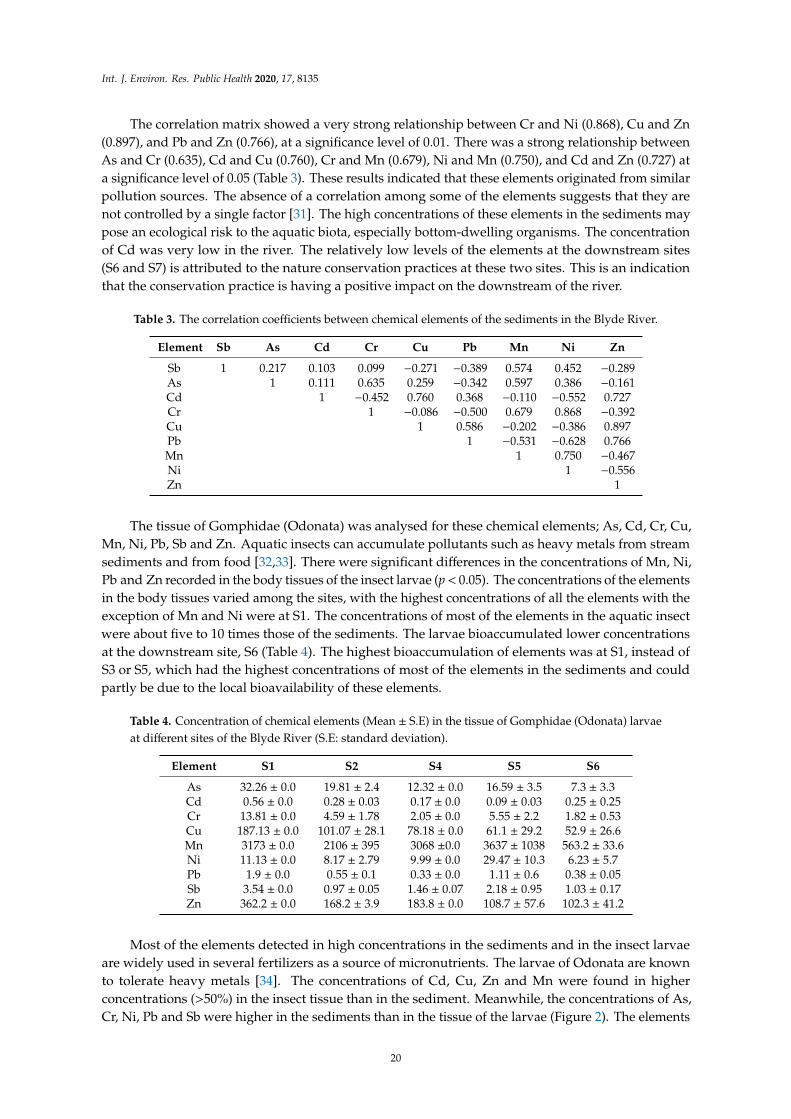
The correlation matrix showed a very strong relationship between Cr and Ni (0.868), Cu and Zn(0.897), and Pb and Zn (0.766), at a significance level of 0.01. There was a strong relationship betweenAs and Cr (0.635), Cd and Cu (0.760), Cr and Mn (0.679), Ni and Mn (0.750), and Cd and Zn (0.727) ata significance level of 0.05 (Table 3). These results indicated that these elements originated from similarpollution sources. The absence of a correlation among some of the elements suggests that they arenot controlled by a single factor [31]. The high concentrations of these elements in the sediments maypose an ecological risk to the aquatic biota, especially bottom-dwelling organisms. The concentrationof Cd was very low in the river. The relatively low levels of the elements at the downstream sites(S6 and S7) is attributed to the nature conservation practices at these two sites. This is an indicationthat the conservation practice is having a positive impact on the downstream of the river.
Table 3. The correlation coefficients between chemical elements of the sediments in the Blyde River.
Element Sb As Cd Cr Cu Pb Mn Ni Zn
Sb 1 0.217 0.103 0.099 −0.271 −0.389 0.574 0.452 −0.289As 1 0.111 0.635 0.259 −0.342 0.597 0.386 −0.161Cd 1 −0.452 0.760 0.368 −0.110 −0.552 0.727Cr 1 −0.086 −0.500 0.679 0.868 −0.392Cu 1 0.586 −0.202 −0.386 0.897Pb 1 −0.531 −0.628 0.766Mn 1 0.750 −0.467Ni 1 −0.556Zn 1
The tissue of Gomphidae (Odonata) was analysed for these chemical elements; As, Cd, Cr, Cu,Mn, Ni, Pb, Sb and Zn. Aquatic insects can accumulate pollutants such as heavy metals from streamsediments and from food [32,33]. There were significant differences in the concentrations of Mn, Ni,Pb and Zn recorded in the body tissues of the insect larvae (p< 0.05). The concentrations of the elementsin the body tissues varied among the sites, with the highest concentrations of all the elements with theexception of Mn and Ni were at S1. The concentrations of most of the elements in the aquatic insectwere about five to 10 times those of the sediments. The larvae bioaccumulated lower concentrationsat the downstream site, S6 (Table 4). The highest bioaccumulation of elements was at S1, instead ofS3 or S5, which had the highest concentrations of most of the elements in the sediments and couldpartly be due to the local bioavailability of these elements.
Table 4. Concentration of chemical elements (Mean ± S.E) in the tissue of Gomphidae (Odonata) larvaeat different sites of the Blyde River (S.E: standard deviation).
Element S1 S2 S4 S5 S6
As 32.26 ± 0.0 19.81 ± 2.4 12.32 ± 0.0 16.59 ± 3.5 7.3 ± 3.3Cd 0.56 ± 0.0 0.28 ± 0.03 0.17 ± 0.0 0.09 ± 0.03 0.25 ± 0.25Cr 13.81 ± 0.0 4.59 ± 1.78 2.05 ± 0.0 5.55 ± 2.2 1.82 ± 0.53Cu 187.13 ± 0.0 101.07 ± 28.1 78.18 ± 0.0 61.1 ± 29.2 52.9 ± 26.6Mn 3173 ± 0.0 2106 ± 395 3068 ±0.0 3637 ± 1038 563.2 ± 33.6Ni 11.13 ± 0.0 8.17 ± 2.79 9.99 ± 0.0 29.47 ± 10.3 6.23 ± 5.7Pb 1.9 ± 0.0 0.55 ± 0.1 0.33 ± 0.0 1.11 ± 0.6 0.38 ± 0.05Sb 3.54 ± 0.0 0.97 ± 0.05 1.46 ± 0.07 2.18 ± 0.95 1.03 ± 0.17Zn 362.2 ± 0.0 168.2 ± 3.9 183.8 ± 0.0 108.7 ± 57.6 102.3 ± 41.2
Most of the elements detected in high concentrations in the sediments and in the insect larvaeare widely used in several fertilizers as a source of micronutrients. The larvae of Odonata are knownto tolerate heavy metals [34]. The concentrations of Cd, Cu, Zn and Mn were found in higherconcentrations (>50%) in the insect tissue than in the sediment. Meanwhile, the concentrations of As,Cr, Ni, Pb and Sb were higher in the sediments than in the tissue of the larvae (Figure 2). The elements
20

Int. J. Environ. Res. Public Health 2020, 17, 8135
in high concentrations in the sediments, such as Mn, Cu and Zn, were highly bioaccumulated inthe insects. In this study, the transfer of Cr, Ni and Sb into the body tissue of the insect larvae wasrelatively less efficient, whereas Cu, Mn and Zn showed relatively high transfer efficiency. In aquaticinsects, the concentrations of Cd, Ni, Cr, As, Pb, Cu, Ti, Zn and Mn change with size, life cycle stages,and different bioaccumulation patterns [35]. For example, Caddisflies have been found to accumulatePb, regulate Zn and Cu, while Stoneflies accumulate Pb and regulate Zn [36].
0%
10%
20%
30%
40%
50%
60%
70%
80%
90%
100%
As Cd Cr Cu Ni Pb Sb Zn Mn
Tissue sediment
0
2
4
6
8
10
12
14
16
18
As Cd Cr Cu Mn Ni Pb Sb Zn
S1 S2 S4 S5 S6
Figure 2. Composition of chemical elements in the sediments and the tissue of Gomphidae larvae.
The bioaccumulation factor (BF) of the elements in the insect larvae of Gomphidae from the BlydeRiver are shown in Figure 3. The BF value was >1 for Cu, Mn, Sb and Zn, thus these elements maybe transferred to fish, and then to humans who consume fish from the river. The BF was high atthe upstream sites, S1 and S2, indicating a high bioavailability of the elements for the insect larvae,whereas the lowest BF was at S6 (downstream site), with relatively low concentrations of the elements inthe sediments. The results show that the larvae of Gomphidae accumulate chemical elements from theenvironment and they can be used to detect metal and metalloid pollution in aquatic environments [37].
0%
10%
20%
30%
40%
50%
60%
70%
80%
90%
100%
As Cd Cr Cu Ni Pb Sb Zn Mn
Tissue sediment
0
2
4
6
8
10
12
14
16
18
As Cd Cr Cu Mn Ni Pb Sb Zn
S1 S2 S4 S5 S6
Figure 3. Bioaccumulation factor (BF) for larvae of Gomphidae samples from the Blyde River (ratio ofconcentrations of chemical elements in the larval tissue and in the sediment).
21

Int. J. Environ. Res. Public Health 2020, 17, 8135
4. Conclusions
The metal and metalloid analysis of the river sediments showed variations in their concentrationsamong the sites. The effects of these elements may have consequences not only on aquatic insects,but also on higher trophic levels, such as fish and humans. In the insect body tissue, the concentrations ofmost of the chemical elements were higher than in the sediments, meaning that the insects accumulatedthe elements from the sediments. The study suggests that the concentrations of many of the elementsstudied are too high in the sediment and the larval tissue; it is therefore necessary to monitor andcontrol chemical pollution in the river. Further study is required to assess the level of accumulation inthe different functional groups of macroinvertebrates and to determine the transfer of toxic elementsthrough the food chain.
Author Contributions: Conceptualization, A.A.-B., K.M.; Methodology, K.M. Formal Analysis, A.A.-B.;Investigation, K.M.; Writing—Original Draft Preparation, A.A.-B.; Writing—Review and Editing, A.A.-B., K.M.;Funding Acquisition, A.A.-B. All authors have read and agreed to the published version of the manuscript.
Funding: This project was funded by a grant from the Belgian VLIR-IUC (Vlaamse InteruniversitaireRaad—University Development Cooperation) Funding Programme.
Acknowledgments: The authors thank the Belgian VLIR-IUC (Vlaamse Interuniversitaire Raad—UniversityDevelopment Cooperation) Funding Programme, for funding.
Conflicts of Interest: The authors declare no conflict of interest.
References
1. Ferreira, A.R.L.; Sanches Fernandes, L.F.; Cortes, R.M.V.; Pacheco, F.A.L. Assessing anthropogenic impactson riverine ecosystems using nested partial least squares regression. Sci. Total Environ. 2017, 583, 466–477.[CrossRef]
2. Santos, R.M.B.; Sanches Fernandes, L.F.; Cortes, R.M.V.; Varandas, S.G.P.; Jesus, J.J.B.; Pacheco, F.A.L.Integrative assessment of river damming impacts on aquatic fauna in a portuguese reservoir. Sci. Total Environ.
2017, 601–602, 1108–1118. [CrossRef]3. Addo-Bediako, A.; Matlou, K.; Makushu, E. Heavy metal concentrations in water and sediment of the
Steelpoort River, Olifants River System, South Africa. Afr. J. Aquat. Sci. 2018, 43, 413–416. [CrossRef]4. Dallas, H.F.; Day, J.A. The Effect of Water Quality Variables on Aquatic Ecosystems: A Review; Water Research
Commission: Pretoria, South Africa, 2004.5. Thomas, P.; Liber, K. An estimation of radiation doses to benthic invertebrates from sediments collected near
a Canadian uranium mine. Environ. Int. 2001, 27, 341–353. [CrossRef]6. Xu, J.; Chen, Y.; Zheng, L.; Liu, B.; Liu, J.; Wang, X. Assessment of heavy metal pollution in the sediment of
the main tributaries of Dongting lake, China. Water 2018, 1, 1060. [CrossRef]7. Addo-Bediako, A. Assessment of heavy metal pollution in the Blyde and Steelpoort Rivers Of The Olifants
River System, South Africa. Pol. J. Environ. 2020, 29, 3023–3029. [CrossRef]8. Venkateswarlu, V.; Venkatrayulu, C. Bioaccumulation of heavy metal lead (Pb) in different tissues of brackish
water fish Mugil cephalus (Linnaeus, 1758). J. Appl. Biol. Biotechnol. 2020, 8, 1–5.9. Bhaskar, A.S.; Beesley, L.; Burns, M.J.; Fletcher, T.D.; Hamel, P.; Oldham, C.E.; Roy, A.H. Will it rise or will it
fall? Managing the complex effects of urbanization on base flow. Freshw. Sci. 2016, 35, 293–310. [CrossRef]10. Chen, C.Y.; Stemberger, R.S.; Klaue, B.; Blum, J.D.; Pickhardt, P.C.; Folt, C.L. Accumulation of heavy metals
in food web components across a gradient of lakes. Limnol. Oceanogr. 2000, 45, 1525–1536. [CrossRef]11. Varol, M.; Sen, B. Assessment of nutrient and heavy metal contamination in surface water and sediments of
the Upper Tigris River, Turkey. Catena 2012, 92, 1–10. [CrossRef]12. Sayer, J.; Cassman, K.G. Agricultural innovation to protect the environment. Proc. Natl. Acad. Sci. USA 2013,
110, 8345–8348. [CrossRef] [PubMed]13. Du Preez, H.H.; Heath, R.G.M.; Sandham, L.A.; Genthe, B. Methodology for the assessment of human health
risks associated with the consumption of chemical contaminated freshwater fish in South Africa. Water SA
2003, 29, 69–90. [CrossRef]
22

Int. J. Environ. Res. Public Health 2020, 17, 8135
14. Jooste, A.; Marr, S.M.; Addo-Bediako, A.; Luus-Powell, W.J. Sharptooth catfish shows its metal: A case study ofmetal contamination at two impoundments in the Olifants River System, South Africa. Ecotoxicol. Environ. Saf.
2015, 112, 96–104. [CrossRef]15. Addo-Bediako, A.; Marr, S.; Jooste, A.; Luus-Powell, W.J. Are metals in the muscle tissue of Mozambique
tilapia a threat to human health? A case study of two impoundments in the Olifants River, Limpopo, SouthAfrica. Ann. Limnol. Int. J. Lim. 2014, 50, 201–210. [CrossRef]
16. Haro, R.J. All along the watchtower: Larval dragonflies are promising biological sentinels for monitoringmethylmercury contamination. Park Sci. 2014, 31, 70–73.
17. Pryke, J.S.; Sammays, M.J.; De Saedleer, K. An ecological network is as good as a major protected area forconserving dragonflies. Biol. Conserv. 2015, 191, 537–545. [CrossRef]
18. Nasirian, H.; Irvine, K.N. Odonata larvae as a bioindicator of metal contamination in aquatic environments:Application to ecologically important wetlands in Iran. Environ. Monit. Assess. 2017, 189, 436. [CrossRef]
19. Department of Water Affairs and Forestry (DWAF). Olifants Water Management Area: Internal Strategic
Perspective; DWAF: Cape Town, South Africa, 2004.20. Dickens, C.W.; Graham, P. The South African Scoring System (SASS) version 5 rapid bio-assessment method
for rivers. Afr. J. Aquat. Sci. 2002, 27, 1–10. [CrossRef]21. Bervoets, L.; Blust, R. Metal concentrations in water, sediment and gudgeon (Gobio gobio) from a pollution
gradient: Relationship with fish condition factor. Environ. Pollut. 2003, 26, 9–19. [CrossRef]22. Klavinš, M.; Briede, A.; Parele, A.; Rodinov, V.; Klavina, I. Metal accumulation in sediments and benthic
invertebrates in lakes of Latvia. Chemosphere 1998, 36, 3043–3053. [CrossRef]23. Pandey, J.; Singh, R. Heavy metal in sediment of Ganga River: Up- and downstream urban influences.
Appl. Water Sci. 2017, 7, 1669–1678. [CrossRef]24. Kumar, A.; Jha, K.D. Assessment of heavy metal concentration in the sediments of Mahananda River in the
Seemanchal zone of Northen Bihar, India. J. Emerg. Technol. 2019, 6, 876–892.25. Dinis, P.; Armando, A.; Pratas, J. Sources of potentially toxic elements in sediments of the Mussulo Lagoon
(Angola) and implications for human health. Int. J. Environ. Res. Public Health. 2020, 17, 2466. [CrossRef]26. Yu, T.; Zhanga, Y.; Zhanga, Y. Distribution and bioavailability of heavy metals in different particle-size
fractions of sediments in Taihu Lake, China. Chem. Spec. Bioavailab. 2012, 24, 205–215. [CrossRef]27. CCME (Canadian Council of Ministers of the Environment). Canadian Water Quality Guidelines
for the Protection of Aquatic Life. In Canadian Council of Ministers of the Environment;CCME: Winnipeg, MB, Canada, 2012.
28. Wei, X.; Gao, B.; Wang, P.; Zhou, H.D.; Lu, J. Pollution characteristics and health risk assessment of heavymetals in street dusts from different functional areas in Beijing, China. Ecotoxicol. Environ. Saf. 2015, 112,186–192. [CrossRef]
29. Zhou, J.; Liang, J.N.; Hu, Y.M.; Zhang, W.T.; Liu, H.L.; You, L.Y.; Zhang, W.H.; Gao, M.; Zhou, J. Exposurerisk of local residents to copper near the largest flash copper smelter in China. Sci. Total Environ. 2018,630, 453–461. [CrossRef]
30. WHO (World Health Organization). Guidelines for Drinking Water Quality; World Health Organization:Geneva, Switzerland, 1996; Volume 2.
31. Bhuyan, M.S.; Bakar, M.A.; Rashed-Un-Nabi, M.; Senapathi, V.; Chung, S.Y.; Islam, M.D. Monitoring andassessment of heavy metal contamination in surface water and sediment of the Old Brahmaputra River,Bangladesh. Appl. Water Sci. 2019, 9, 125. [CrossRef]
32. Prommi, T.O.; Payakka, A. Monitoring cadmium concentrations in sediments and aquatic insects(Hydropsychidae: Trichoptera) in a stream near a zinc mining area. Pol. J. Environ. Stud. 2018, 27, 2237–2243.[CrossRef]
33. Corbi, J.J.; Froehlich, C.G.; Trivinho-Strixino, S.; Dos Santos, A. Bioaccumulation of metals in aquatic insectsof streams located in areas with sugar cane cultivation. Química Nova 2010, 3, 644–648. [CrossRef]
34. Tollett, V.D.; Benvenutti, E.L.; Deer, L.A.; Rice, T.M. Differential toxicity to Cd, Pb, and Cu in dragonfly larvae(Insecta: Odonata). Arch. Environ. Contam. Toxicol. 2009, 56, 77–84. [CrossRef]
35. Cid, N.; Ibánez, C.; Palanques, A.; Prat, N. Patterns of metal bioaccumulation in two filter-feedingmacroinvertebrates: Exposure distribution, inter-species differences and variability across developmentalstages. Sci. Total Environ. 2010, 408, 2795–2806. [CrossRef]
23

Int. J. Environ. Res. Public Health 2020, 17, 8135
36. Goodyear, K.L.; McNeillb, S. Bioaccumulation of heavy metals by aquatic macro-invertebrates of differentfeeding guilds: A review. Sci. Total Environ. 1999, 229, 1–19. [CrossRef]
37. Souto, R.M.G.; Juliano, J.; Corbi, J.J.; Jacobucci, J.B. Aquatic insects as bioindicators of heavy metals insediments in Cerrado streams. Limnetica 2019, 38, 575–586. [CrossRef]
Publisher’s Note: MDPI stays neutral with regard to jurisdictional claims in published maps and institutionalaffiliations.
© 2020 by the authors. Licensee MDPI, Basel, Switzerland. This article is an open accessarticle distributed under the terms and conditions of the Creative Commons Attribution(CC BY) license (http://creativecommons.org/licenses/by/4.0/).
24

International Journal of
Environmental Research
and Public Health
Article
Assessment on Distributional Fairness of PhysicalRehabilitation Resource Allocation:Geographic Accessibility Analysis IntegratingGoogle Rating Mechanism
Hui-Ching Wu 1,2,† , Ming-Hseng Tseng 3,† and Chuan-Chao Lin 4,5,*
1 Department of Medical Sociology and Social Work, Chung Shan Medical University,Taichung 402367, Taiwan; [email protected]
2 Social Service Section, Chung Shan Medical University Hospital, Taichung 402367, Taiwan3 Department of Medical Informatics, Chung Shan Medical University, Taichung 402367, Taiwan;
[email protected] School of Medicine, Chung Shan Medical University, Taichung 402367, Taiwan5 Department of Physical Medicine and Rehabilitation, Chung Shan Medical University Hospital,
Taichung 402367, Taiwan* Correspondence: [email protected]; Tel.: +886-4-22621652 (ext. 70519)† These authors contributed equally to this work.
Received: 31 July 2020; Accepted: 13 October 2020; Published: 18 October 2020
Abstract: Identifying and treating co-existing diseases are essential in healthcare for the elderly,while physical rehabilitation care teams can provide interdisciplinary geriatric care for the elderly.To evaluate the appropriateness of demand and supply between the population at demand andphysical rehabilitation resources, a comparative analysis was carried out in this study. Our studyapplied seven statistical indices to assess five proposed methods those considered different factors forgeographic accessibility analysis. Google ratings were included in the study as a crucial factor ofchoice probability in the equation for calculating the geographic accessibility scores, because people’sbehavioral decisions are increasingly dependent on online rating information. The results showedthat methods considering distances, the capacity of hospitals, and Google ratings’ integrally generatedscores, are in better accordance with people’s decision-making behavior when they determine whichresources of physical rehabilitation to use. It implies that concurrent considerations of non-spatialfactors (online ratings and sizes of resource) are important. Our study proposed an integratedassessment method of geographical accessibility scores, which includes the spatial distribution,capacity of resources and online ratings in the mechanism. This research caters to countries thatprovide citizens with a higher degree of freedom in their medical choices and allows these countries toimprove the fairness of resource allocation, raise the geographic accessibilities of physical rehabilitationresources, and promote aging in place.
Keywords: physical rehabilitation; elderly; geographic accessibility; resources allocation; spatial inequality;medical geology
1. Introduction
1.1. Physical Rehabilitation Resources and Active Aging
The World Health Organization (WHO) proposed a policy framework for active aging in 2002,emphasizing that active aging is a process wherein aging is guided by policies. By providing theelderly with the best opportunities in pursuit of health, social participation, and a safe environment,
25

Int. J. Environ. Res. Public Health 2020, 17, 7576
their quality of life can be effectively promoted [1]. Therefore, the crucial implication active aging is tohelp the elderly achieve the stage of successful aging. Phelan et al. [2] pointed out that the elderlybelieve successful aging involves the integration of multi-faceted health conditions, including physical,functional, psychological, and social abilities. In addition to medical services, social activities thatincrease mental flexibility and connection to support networks that strengthen health also promote thequality of life of the elderly. Due to the physical limitations of the elderly, the geographical accessibilityof physical rehabilitation resources affects their ability to use community care resources and reflectsfairness in the design of the resource allocation policy.
Identifying and treating co-existing diseases are essential in the healthcare for the elderly,while physical rehabilitation care teams can provide high-quality and interdisciplinary geriatric carefor the elderly [3–5]. Board-certificated physiatrists are practitioners who complete their training inphysical medicine and rehabilitation residency and pass the national examinations. They possessthe professional knowledge to diagnose and treat many diseases of the elderly. Research has shownthat with the intervention of physiatrists, the elderly enjoy better functional recovery from injuriesand illnesses [6]. With the rapid growth of the elderly population, Taiwan is about to become asuper-aged society. Every older person in Taiwan has the same health insurance. The current healthcaresystem in Taiwan, known as National Health Insurance (NHI), was instituted in 1995. NHI is asingle-payer compulsory social insurance plan that centralizes the disbursement of healthcare funds.The system promises equal access to healthcare for all citizens, and the population coverage has reached99% [7]. The National Health Insurance of Taiwan covers medical insurance for 99% of the population.People are free to choose from medical centers, community hospitals, and specialist clinics whenthey look for treatments. The integrated medical specialist teams led by physiatrists and supportedby physiotherapists, occupational therapists, speech therapists, nurses, nutritionists, and orthotistscan provide interdisciplinary physical rehabilitation care in appropriate environments with properequipment and provide comprehensive care for the elderly [8,9].
1.2. Accessibility Assessment of Elderly Physical Rehabilitation Resources
Some studies addressed the perception of accessibility of elderly physical resources, such as reportsby clinic managers versus actual accessibility in healthcare clinics for persons using wheelchairs [10],problems of access to primary care [11], people with physical disabilities feel they are experiencingdifficulty accessing adequate and appropriate primary healthcare services [12]. According to thesestudies, the transportation factor is important for the elderly to access healthcare resources. Therefore,evaluating the appropriateness of the demand and supply between the population at demand andphysical rehabilitation resource is important for policy-making. In a comprehensive review of theliterature, studies that address a geographic accessibility assessment of elderly physical rehabilitationresources are rare.
A geographic accessibility assessment could provide a fair distribution in allocating healthcareresources [13–24]. Identifying and treating co-existing diseases are essential in healthcare for theelderly, while the accessibility of physical rehabilitation resources should be taken seriously.
Frail older adults can go to hospitals by their family’s vehicles or apply for the governmentalrehabilitation bus service. Taiwan’s NHI provides a free rehabilitation bus service for those who havea handbook of physical and mental disabilities with moderate or above multiple disabilities includinglimbs, moderate or above visually impaired, vegetative (wheelchair accessible), and extremely severelydisabled vital organs [25]. For those who could not pay the premium, the premium is fully subsidizedfor the households below the poverty line. Or, the NHI can refer those very poor persons to charitableorganizations for help. The transportation for older adults is organized by families and the NHI.Therefore, income would not become the main obstacle of transportation, but the accessibility ofresources would be an important issue for aging in place.
The discussion of fairness in the distribution of physical rehabilitation resources involves thedegree of coordination between the population at demand and service supply as well as distance
26

Int. J. Environ. Res. Public Health 2020, 17, 7576
factors. For frail older adults who need regular and periodic physical rehabilitation, high-geographicaccessibility is important to promote aging in place. The use of assessment methods for resourceaccessibility help examine whether the allocation of physical rehabilitation resources shows inequitydue to regional differences. The author of this study attempted to employ geographic accessibility asthe assessment method. The investigation analyzed and compared the results drawn from five typesof geographic accessibility calculation methods examining the adequacy of physical rehabilitationresource allocation.
In this study, open data of 2020 were retrieved from Taiwan Academy of Physical Medicine andRehabilitation, and its member list of board-certificated physiatrists and registered clinics was thesupply points for the resources. People aged 65 and above in towns were held to be the populationat demand. With the aforementioned data, the geographical accessibility of rehabilitation resourcesfor the population at demand in towns were examined. For the presentation of analytical data,assessments focused on the data of county/city levels, which were aggregated from the data of townlevels. Therefore, the counties/cities over the island that need to be prioritized for the improvementof resource accessibilities at physical rehabilitation points are pointed out in this study to presentthe problems in the appropriateness of demand and supply between geographical locations and thedensity distribution of population at demand. The research results are expected to turn into referencesfor relevant administrative and management departments when they formulate resource allocationpolicies of rehabilitation resources.
The current distribution of the population at demand and physical rehabilitation resources,population at demand to physical rehabilitation resources ratio, and the service load of rehabilitationhospitals were examined in the study. The investigation helped consider how to increase theaccessibilities of physical rehabilitation for the elderly by assisting them to look for treatment atclinics nearest to their homes and reduce traffic obstacles they may encounter to promote their health.The author explored the following issues:
1. The spatial distribution of the population at demand and number of physical rehabilitationresources in towns.
2. To carry out a comparative analysis on geographical accessibility scores of physical rehabilitationresources with five calculation methods based on different decision-making considerations andchoice probabilities.
3. To suggest follow-up improvements of policies based on the differences in densities of physicalrehabilitation resources in counties/cities.
2. Materials and Methods
2.1. Data Collection: Study Area and Datasets
The geographical area covered by the analysis in this study includes 19 counties/cities and349 towns on the main island of Taiwan. Information about board-certificated physiatrists wasretrieved from the open data of Taiwan Academy of Physical Medicine and Rehabilitation in 2020 [26].Information about the population aged 65 and above in towns was retrieved from the database ofDepartment of Household Registration, Ministry of the Interior, which was released in March 2020 [27].
The convenience of transportation is an important factor that determines senior citizens’ accessto community care resources. However, to examine the differences in convenience of transportationin counties/cities, we will have to consider the types of vehicles, frequencies of running and traveltime, fare policies, as well as fare subsidy policies of counties/cities. Due to the scarcity or lowcredibility of relevant data, it is infeasible to include such information in the analysis of road networkdata. In the evaluation of factors that affect geographic accessibility, the study took reference fromthe research method of Page et al. [28]. While retrieving data for the analysis of transportationinfluencing factors, the road network data in government open data representing actual route distanceswere adopted instead of the traditional map distances (the linear distance between two points) to
27
Int. J. Environ. Res. Public Health 2020, 17, 7576
reduce the error. As for map data, numerical maps were taken from the Ministry of Transportationand Communications [29]. The ArcGIS application, which adopts geographic information systems,was used to calculate geographic accessibility by a geography information system (GIS)-based networkanalysis. As the geographic accessibility analysis focused on the convenience of users’ mobility, if thedata of supply points in the main island and outlying islands of Taiwan are mixed and assessedcollectively, the issues in traffic and geographic distance will produce deviations in resource accessibilityassessment. Therefore, the study area was limited to the main island of Taiwan.
To define the searching area of physiatrist resources, registered specialist clinics were listed andfiltered in this study, according to the Taiwan Academy of Physical Medicine and Rehabilitation.As these resource data only list service units, we had to search for the addresses of every serviceunit before converting the addresses to coordinates by geocoding applications. Next, with the useof the geography information system (GIS), the latitudes and longitudes of the locations of everyresource were positioned in the TWD97 2-degree transverse Mercator coordinate system. Cartographicvisualization was employed to test the accuracy of every coordinated point and reduce location error.Finally, the cartographic data of physiatrist resources were produced. As of March 2020, there were688 physiatrist service points in the main island of Taiwan, while there were 1140 physiatrists in total.
Preliminary investigations in this study indicated that there were 3,618,878 people aged 65 andabove on the main island of Taiwan as of March 2020. As there were 1140 physiatrists in total, it meansthat for every 10,000 elderly people there were 3.15 physiatrists on average. As the number is close tothe population of towns, the weighted center point of towns (generated by the weighed calculation ofpopulation in villages) would represent the center point of people in demand for resources.
2.2. Measuring Geographic Accessibility to Elderly Physical Rehabilitation Resources
The geographic accessibility of resources is a critical basis for considering resource allocation.A main method to analyze resource accessibility is to calculate the ratio of resources allocated (amountand spatial distribution) to the population at demand.
At present, Taiwan’s policy formulation relies on the regional average method in weighingmedical resource accessibility. Taking each administrative region as a unit, the number of hospitals,medical personnel, and hospital beds per 10,000 (or per 100,000) people in the region is calculated andbecomes a potential accessibility indicator for the framework of accessibility to medical resources [30].In terms of the assessment of medical resources, the method assumes that the administrative regionequal to the activity space where people utilize medical resources and distances does not bring aboutdifferences in the usage of medical resources within the region. However, patients can seek treatmentsby crossing into different administrative regions in reality. This characteristic of spatial mobility isnot taken into consideration in the regional average method, and this is where problems arise [15].The method was identified as method A0 in this study, with Equation (1) as follows:
Ai,0 =
∑
j∈DiS j
Pi(1)
where Ai is the geographic accessibility score of a town i and implies the average amount of supplypoint resources enjoyed by each person in demand in the region of the town i;
∑
j∈DiS j represents the
amount of supply point resources in region i of the town; Pi represents the population at demand aged65 or above in the region i of towns.
Luo and Wang [14] proposed the two-step floating catchment area method, which breaks theaforementioned limitations caused by setting administrative regions as activity areas. Not only does theresearch method consider the possibilities of cross-region healthcare utilization by people, but it alsosets a reasonable range of seeking treatment and, in turn, assesses the spatial accessibility of medicalresources. The two-step floating catchment area method is primarily divided into two stages [19,21,31].In stage one, the service loads of each service provider of resources are calculated. In stage two,
28

Int. J. Environ. Res. Public Health 2020, 17, 7576
the ratios of resources that can be reached by each location of the population at demand are calculatedto assess the geographic accessibility scores of resources [20].
The three-step floating catchment area method [32] is an advanced and improved search methodderived from the two-step floating catchment area method. The new method evaluates differentchoice probabilities of the population at demand when people approach nearby locations of medicalresources. The effects of hospitals’ capacities and travel distances on the utilization behavior of medicalresources are specifically taken into consideration. The concept of this method is to calculate theprobability of seeking treatment, which represents the probability of each patient to visit differenthospitals through distance weighting and hospital capacities. The probability of seeking treatment isthen used to estimate the average ability of the medical resource allocation of each hospital. In thesame manner, with the hospitals’ capacities and distances from the served regions, the probability ofeach region in demand to visit different hospitals is calculated. According to the choice probabilities,the average ability of the medical resource allocation of each hospital will be allocated to the region indemand appropriately, wherein we obtain the distribution situation of geographical accessibility tomedical resources in the research area.
The calculation of geographical accessibility proposed in this study originates from the calculusconcepts of the three-step floating catchment area method. Equations (2)–(5) are as follows:
Ai,1 =∑
r=1∼h
∑
j∈Dr
S j ∗ f(
di j
)
∑
r=1∼h
∑
k∈DrPk ∗ f
(
d jk
) (2)
Ai,2 =∑
r=1∼h
∑
j∈Dr
S j ∗Ki j ∗ f(
di j
)
∑
r=1∼h
∑
k∈DrPk ∗K jk ∗ f
(
d jk
) (3)
Ai,3 =∑
r=1∼h
∑
j∈Dr
S j ∗Vi j ∗ f(
di j
)
∑
r=1∼h
∑
k∈DrPk ∗V jk ∗ f
(
d jk
) (4)
Ai,4 =∑
r=1∼h
∑
j∈Dr
S j ∗KVij∗ f(
di j
)
∑
r=1∼h
∑
k∈DrPk ∗KV
jk∗ f(
d jk
) (5)
where Ai,1 is the simplest calculation of the geographical accessibility score of a location at demand i
and implies the average amount of supply point resources enjoyed by people at demand in the locationat demand i; Sj represents the scale of supply at each service point (physiatrist) j; Pk represents the sizeof the elderly population in the location at demand k; dij is the route distance between the location atdemand i and the service point j; djk is the route distance between the service point j and the location atdemand k. In the equations, f(dij) is the distance-decay function, while the search radii of resourcesin this study are divided into three districts (r = 1~3) according to the respective distance. The firstdistrict (dij ≤ 3 km) is the area that the elderly can reach on foot in about an hour [24]. The seconddistrict (3 km < dij ≤ 15 km) is the area that the elderly can reach by driving for about half an hour.The third district (15 km < dij ≤ 30 km) is the area that the elderly can reach by driving for about anhour. f(dij) is shown in Equation (6):
(
di j
)
=
1, di j ≤ 3 km3
di j, 3 km < di j ≤ 15 km
15
(di j)2 , 15 km < di j ≤ 30 km
0, di j > 30 km
(6)
Ai,2 calculates the geographical accessibility score of a location at demand i when Kij, which is thedifferent choice probabilities of the population at demand to approach various nearby service points,
29

Int. J. Environ. Res. Public Health 2020, 17, 7576
is taken into consideration. With considerations of the scale of supply at service points Sj and distancedecay dij, Kij represents the choice probabilities of the location at demand i to service point j and isexpressed in Equation (7):
Ki j =∑
r=1∼h
S j ∗ f(
di j
)
∑
k∈DrSk ∗ f (dik)
(7)
Ai,3 is a new method of calculation introduced in this study, which calculates the geographicalaccessibility score of a location at demand i when Vj, the overall rating of the location point j summitedto Google by ordinary users, is taken into consideration. It represents the crucial decision basis ofpeople when they choose to visit a particular service point in reality. With considerations on rating Vj
and distance decay dij, Vij represents the choice probabilities of the location at demand i to servicepoint j and is expressed in Equation (8):
Vi j =∑
r=1∼h
V j ∗ f(
di j
)
∑
k∈DrVk ∗ f (dik)
(8)
Ai,4 is another new method of calculation introduced in this study. It calculates the geographicalaccessibility score of a location at demand i while integrating the factors of rating Vj, the scale ofsupply at service points Sj, distance decay dij, and the different choice probabilities of the population atdemand to approach various nearby service points KV
ij. KV
ijis expressed in Equation (9):
KVij =
∑
r=1∼h
V j ∗ S j ∗ f(
di j
)
∑
k∈DrVk ∗ Sk ∗ f (dik)
(9)
The flow of calculation follows Equations (1)–(8). First, we calculated the service load to beprovided by each service point of physiatrists to the three districts divided by the distances andwithin a 30-km search radius of resources (the service load = the total population at demand in townswithin a 30-km search radius/scale of service at the particular service point). Finally, we calculated theaccumulated service load provided by the service points of physiatrists to each weighted center point ofpeople at demand in towns, while the service points are within a 30-km search radius of the weightedcenter point. In this way, the accessible ratio of resources at the service points of physiatrists to thepopulation at demand in towns was obtained, which is held to be the geographical accessibility score.Table 1 shows the calculation equations used in this study to evaluate the geographic accessibilityscores of physical rehabilitation resources.
30

Int. J. Environ. Res. Public Health 2020, 17, 7576
Table 1. Definition of elderly physical rehabilitation resources geographic accessibility scores.
Method Description Equation Distance-Decay Function
A0 Regional average method Ai,0 =
∑
j∈DiS j
Pi
1
A1 Two-step floating catchment area method withoutchoice probability Ai,1 =
∑
r=1∼h
∑
j∈Dr
S j∗ f(di j)∑
r=1∼h
∑
k∈Dr Pk∗ f(d jk)
f(
di j
)
=
1, di j ≤ 3 km3
di j, 3 km < di j ≤ 15 km
15(di j)
2 , 15 km < di j ≤ 30 km
0, di j > 30 km
A2 Three-step floating catchment area method withconsiderations of choice probability Kij
Ai,2 =∑
r=1∼h
∑
j∈Dr
S j∗Ki j∗ f(di j)∑
r=1∼h
∑
k∈Dr Pk∗K jk∗ f(d jk)
A3 Three-step floating catchment area method withconsiderations of choice probability Vij
Ai,3 =∑
r=1∼h
∑
j∈Dr
S j∗Vi j∗ f(di j)∑
r=1∼h
∑
k∈Dr Pk∗V jk∗ f(d jk)
A4 Three-step floating catchment area method withconsiderations of choice probability KV
ijAi,4 =
∑
r=1∼h
∑
j∈Dr
S j∗KVij∗ f(di j)
∑
r=1∼h
∑
k∈Dr Pk∗KVjk∗ f(d jk)
31

Int. J. Environ. Res. Public Health 2020, 17, 7576
2.3. Google Rating
In the era of Web 2.0, consumers increasingly rely on the rating mechanism of online serviceplatforms as crucial factors for decision-making. The online rating mechanism has become an importantasset in the digital “reputation” economy [33]. For example, people who prepare to choose a hotel put ahigh value on the review scores left by tourists on travel information websites Agoda and Tripadvisor.
In 1995, Taiwan implemented the National Health Insurance policy, which provides convenientmedical services to citizens. People are free to choose from various hospitals when they look fortreatments. Faced with the competition in the free market, hospitals have adopted business modelsof marketing and branding to attract patients. Hospital rating mechanisms on online platforms,where people provide reviews voluntarily and freely, have emerged as crucial sources of referencesfor patients’ healthcare-seeking decisions. Broadly speaking, rating mechanisms include blogging,Facebook, YouTube, and Google’s rating mechanism for businesses. Among them, Google Rating is therating mechanism that performs best in structuring consumers’ feelings and is the most recognized bythe public [33–35]. Google Rating scores are divided into 1~5 points, representing evaluations rangingfrom least satisfied to most satisfied.
Based on the open competition in Taiwan’s medical market, the high degree of freedom enjoyed bypeople in seeking treatment, and the multiple choice factors in healthcare-seeking decisions, this studyinnovates and introduces new methods of calculating the geographic accessibility scores of physicalrehabilitation resources, in which Google ratings for businesses is included as a choice factor inthe calculation equations. The methods are detailed in the descriptions of methods A3 and A4 orEquations (7) and (8).
2.4. Gini Coefficient
The Gini coefficient was defined by Italian statistician Corrado Gini based on the Lorenz curveas a measure of income distribution equality within a society [36]. The Gini coefficient can rangefrom 1 to 0, wherein 1 represents complete inequality in people’s annual income distribution and 0represents complete equality in income distribution. Generally speaking, a Gini coefficient below0.2 indicates highly equitable income distribution, 0.2–0.3 represents equitable income distribution,0.3–0.4 indicates bearable inequitable income distribution, 0.4–0.6 tends toward serious inequality inincome distribution, and above 0.6 indicates high inequality in income distribution [37]. Therefore,when the Gini coefficient is above 0.6, the ruling authority would usually be advised to be on thealert for excessive income inequality within the society, as the situation may lead to social conflicts.Due to its nature, the Gini coefficient is also called the inequality coefficient. With reference to theabove-mentioned scaling of the coefficient, this study explains the disparity in the accessible ratio ofresources at service points of physiatrists to the population at demand in counties/cities.
The Gini coefficient was used in this study to evaluate the equality of the accessible ratio of servicepoint resources to the population at demand. Therefore, a higher Gini coefficient in a county/cityrepresents a more inequitable distribution of resources at service points to the population at demand.Based on the definition of y1 = f (x) of the Lorenz curve, the y-axis measures the accumulatedpercentage of the accessible ratio of service point resources in each town, while the x-axis measuresthe accumulated percentage of the population at demand in each town. The Gini coefficient is equalto the area between curve y1 and line y2, divided by the area below line y2. The Equation (10) is asfollows [38]:
G =
∫ 10 (y2 − y1)dx∫ 1
0 y2dx=
∫ 10 (x− f (x))dx∫ 1
0 xdx= 2∫ 1
0(x− f (x))dx (10)
32

Int. J. Environ. Res. Public Health 2020, 17, 7576
3. Results
3.1. Distribution of People at Demand in Towns and Physical Rehabilitation Resources
Table 2 summarizes the results of resource assessments using the regional average method(method A0). The National Health Insurance of Taiwan adopts an ideology of open and freecompetition concerning the setting up of hospitals. As a result, operating in metropolitan areas toattract clients is the first choice of most physical rehabilitation clinics and physiatrists. Furthermore,teaching hospitals focusing on physical rehabilitation training tend to cluster in metropolitan areas.Consequently, many physiatrists choose to register and practice in the same metropolitan area wherethey complete their specialist trainings. Therefore, in the six most urbanized municipalities (Taipei City,Kaohsiung City, New Taipei City, Taichung City, Tainan City, and Taoyuan City) where 68.12% of theelderly population live, the density of physiatrists per 10,000 elderly people ranged between 1.55%and 5.29%, while the average density of physiatrists on the main island of Taiwan was 1.80%.
Table 2. Summary statistics of 65+ population and physical rehabilitation physicians’ scores byadministrative districts (method A0).
AdministrativeDistrict
65+
Population65+
Population %Number of
TownsNumber ofPhysicians
Physicians-to 10,000Population %
Yilan County 76,134 2.10% 12 25 1.82Hsinchu County 71,911 1.99% 13 16 0.91Miaoli County 91,283 2.52% 18 21 1.13
Changhua County 205,532 5.68% 26 42 0.99Nantou County 89,157 2.46% 13 12 0.79Yunlin County 127,220 3.52% 20 19 0.81Chiayi County 99,858 2.76% 18 13 0.92
Pingtung County 140,607 3.89% 32 18 0.65Taitung County 35,707 0.99% 14 8 0.54Hualien County 55,009 1.52% 13 20 1.49
Keelung City 62,020 1.71% 7 23 3.35Hsinchu City 57,138 1.58% 3 22 3.29Chiayi City 42,062 1.16% 2 24 5.72Taipei City 483,523 13.36% 12 255 5.29
Kaohsiung City 444,875 12.29% 38 143 2.52New Taipei City 590,644 16.32% 29 172 2.09Taichung City 368,586 10.19% 29 141 3.66
Tainan City 299,640 8.28% 37 83 1.55Taoyuan City 277,972 7.68% 13 83 2.19
Total 3,618,878 100% 349 1140 1.80
3.2. Overview of the Google Ratings of Physical Rehabilitation Hospitals in Towns
Table 3 shows the Google ratings of physical rehabilitation hospitals in towns. Concerningmean values, eight counties/cities had a mean value lower than Taiwan’s average value. The eightcounties/cities are Hsinchu County, Miaoli County, Yunlin County, Chiayi County, Pingtung County,Chiayi City, New Taipei City, and Taoyuan City. Among them, New Taipei City and Taoyuan City aredensely populated and highly urbanized. The two municipalities also have a high number of hospitalsand a physiatrist to elderly population ratio higher than Taiwan’s average value. However, the meanvalues of physical rehabilitation institutes’ Google ratings in the two municipalities are lower thanTaiwan’s average value, while the standard deviations are higher than Taiwan’s average value. In thedigital era, people rely heavily on the rating mechanism of online service platforms as crucial factorsfor decision-making, and the ratings can alter patients’ preference in seeking treatment. They maybe more inclined to choose hospitals that have high ratings but greater travel distance comparatively.Therefore, as an innovation, this study introduced methods A3 and A4, which integrated Googleratings into the calculation of choice probabilities affecting geographic accessibility.
33

Int. J. Environ. Res. Public Health 2020, 17, 7576
Table 3. Summary statistics of physical rehabilitation hospitals’ Google rating.
Administrative District Number of Hospitals Mean SD Min Max
Yilan County 15 3.71 0.74 ⊚ 2.40 * 5.00Hsinchu County 13 3.65 * 0.47 2.60 4.60 *Miaoli County 12 3.49 * 0.63 2.50 * 4.80 *
Changhua County 23 3.75 0.70 ⊚ 2.50 * 5.00Nantou County 11 3.87 0.86 ⊚ 2.70 5.00Yunlin County 11 3.69 * 0.57 3.00 4.90Chiayi County 5 3.64 * 0.21 3.40 3.90 *
Pingtung County 15 3.41 * 0.58 2.50 * 4.30 *Taitung County 6 3.78 0.77 ⊚ 2.50 * 4.90Hualien County 11 3.76 0.80 ⊚ 2.10 * 5.00
Keelung City 11 3.85 0.55 2.80 4.50 *Hsinchu City 12 3.79 0.67 ⊚ 3.10 4.90Chiayi City 11 3.66 * 0.49 3.20 4.50 *Taipei City 114 3.79 0.56 2.60 5.00
Kaohsiung City 96 3.78 0.68 ⊚ 2.20 * 5.00New Taipei City 102 3.62 * 0.72 ⊚ 1.90 * 5.00Taichung City 83 3.75 0.68 ⊚ 2.50 * 5.00
Tainan City 57 3.74 0.69 ⊚ 2.20 * 5.00Taoyuan City 50 3.63 * 0.70 ⊚ 2.00 * 4.90
Total 658
Average 3.72 0.66 2.56 4.80
Note: 1. *: lower than average. 2. ⊚: higher than average.
Some conventional inequality measures are the mean, median, Gini coefficient, maximum andminimum values [39]. The median is the middle number in a sorted list of numbers, with the sameamount of numbers below and above. The median is sometimes used as opposed to the mean whenthere are outliers in a sequence that might skew the average of the values. The median of a sequencecan be less affected by outliers than the mean. As physical rehabilitation resources are unequal inTaiwan, especially between urban and rural districts, this study applied these inequality measures tocompare accessibility values between methods. Table 4 shows the comparison of all resulting scores ofgeographic accessibilities. All equations generated a minimum value (Min) of 0, which means thatregardless of the calculation method chosen, there exist situations in which no physical rehabilitationresources are reachable within 30 km. The mean value of the results of the regional average method(method A0) is the lowest, but its value of standard deviation and maximum value are the highestamong all methods. As the regional average method completely disregards the effectiveness of distanceand sets limits on the cross-district usage of resources, the results of the regional average method createan illusion wherein the dispersion of geographic accessibility scores is the highest, with a median at 0and the highest Gini coefficient.
Table 4. Summary statistics of physical rehabilitation resources accessibility scores by methods A0–A4.
Method Mean Median SD Min Max Median-Mean Gini Coefficient
A0 1.80 0.00 3.32 0.00 31.74 −1.80 0.53
A1 1.87 1.56 1.58 0.00 6.27 −0.31 0.05
A2 1.89 1.20 1.72 0.00 8.96 −0.69 0.10
A3 1.91 1.16 1.96 0.00 15.06 −0.75 0.15
A4 1.90 1.21 1.74 0.00 9.13 −0.69 0.11
In the results of the two-step floating catchment area method (method A1), the dispersion ofgeographic accessibility scores is the lowest, with the highest median and the lowest Gini coefficient.
34

Int. J. Environ. Res. Public Health 2020, 17, 7576
Method A2 represents the results of the traditional three-step floating catchment area method withconsideration of choice probabilities related to distances and resource sizes; method A3 representsthe results of the new three-step floating catchment area method with considerations of choiceprobabilities related to distances and Google ratings, and method A4 represents the results of thenew three-step floating catchment area method with comprehensive considerations of distances,resource sizes, and Google ratings. The results in Table 4 show that, when comparing the results ofmethods A2–A4, which considered the choice probabilities of people’s healthcare-seeking behavior,and the results of method A1, which disregarded choice probabilities, the results of the former groupshow higher mean values, standard deviations, and maximum values and had lower median values.The results of methods A2–A4 also show higher dispersions of geographic accessibility scores andhigher Gini coefficients.
When comparing the scores of geographic accessibilities in methods A2–A4, which consideredthe choice probabilities of people’s healthcare-seeking behavior, the values generated from method A4show a tendency to land between the values of methods A3 and A2. With consideration of distancedecays, sizes of hospitals, and Google ratings, the standard deviation and maximum value of theresults of method A4 are lower than method A3, while the median value is higher than method A3.The dispersion of geographic accessibility scores and the Gini coefficient of method A4 are lower thanmethod A3. It implies that concurrent consideration of non-spatial factors (online ratings and sizes ofresource) are in better accordance with people’s decision-making behavior when they determine whichresources of physical rehabilitation to use compared with the sole consideration of online rating factors.
3.3. Assessment of Distribution Inequality of People at Demand in Towns and Physical Rehabilitation Resources
Table 5 shows the mean values, standard deviations, and median values of geographic accessibilityscores of counties/cities, which were evaluated by different calculation methods, while the differencesin the resulting values are presented. Method 3 considers distances and Google ratings, whereasmethod A4 adds resource size factors to the basis of method 3. When the median values and meanvalues are compared, if the median value is lower than the mean value in a county/city, it impliesthat more than 50% of the resources have low accessibilities. In methods A3 and A4, only threecounties/cities (Hsinchu City, New Taipei City, and Taoyuan City) have median values higher thanmean values, which implies that the majority of the towns in the counties/cities enjoy plentiful resources.When we take the next step and compare the median values, 12 counties/cities have higher geographicaccessibility scores in method A4 than in method A3, which are marked with “*” next to the medianvalues of method 4. Among the counties/cities with more than 30 towns, Kaohsiung City and PingtungCounty have higher accessibility scores in method A4, which means that in counties/cities with vastadministrative regions, the resources of medical services are more inclined to concentrate in denselypopulated areas. Therefore, the people may have access to better medical services, as they wouldconsider the credibility and service sizes of the hospitals and choose to visit hospitals that are fartherbut larger in size. The median values of method A4 rise due to the above reasons.
35

Int. J. Environ. Res. Public Health 2020, 17, 7576
Table 5. Summary statistics of physical rehabilitation resources accessibility scores by methods A0–A4.
Administrative District Number of Towns
Estimated by 10,000 * Capacity/People
Method A0 Method A1 Method A2 Method A3 Method A4
Mean Median SD Mean Median SD Mean Median SD Mean Median SD Mean Median SD
Yilan County 12 1.82 0.00 3.33 2.43 2.52 1.73 2.27 1.72 1.90 2.27 1.72 2.00 2.28 1.75 * 1.90Hsinchu County 13 0.91 0.00 1.96 1.67 1.64 1.13 1.45 0.91 1.42 1.41 0.89 1.39 1.44 0.91 * 1.42Miaoli County 18 1.13 0.00 1.79 1.57 1.66 1.34 1.45 1.10 1.51 1.44 1.08 1.51 1.44 1.08 1.50
Changhua County 26 0.99 0.00 1.78 1.61 1.06 0.96 1.49 0.75 1.25 1.46 0.72 1.27 1.49 0.75 * 1.25Nantou County 13 0.79 0.00 1.06 0.83 0.81 0.74 0.92 0.50 0.94 0.89 0.51 0.90 0.92 0.52 0.93Yunlin County 20 0.81 0.00 1.78 1.17 1.02 0.97 1.16 0.71 1.2 1.18 0.64 1.31 1.16 0.70 * 1.21Chiayi County 18 0.92 0.00 3.02 1.59 1.64 1.05 1.33 0.95 1.11 1.30 0.85 1.48 1.33 0.95 * 1.11
Pingtung County 32 0.65 0.00 1.47 0.88 0.97 0.70 0.89 0.74 0.94 0.88 0.70 0.98 0.89 0.74 * 0.93Taitung County 14 0.54 0.00 1.38 0.55 0.02 1.25 0.87 0.03 1.76 0.88 0.03 1.81 1.00 0.03 2.14Hualien County 13 1.49 0.00 2.50 1.63 0.78 2.03 1.66 0.82 2.04 1.65 0.82 2.06 1.66 0.82 2.04
Keelung City 7 3.35 1.83 4.07 2.67 2.52 0.58 3.45 3.45 1.32 3.38 3.23 1.72 3.45 3.40 * 1.31Hsinchu City 3 3.29 1.92 4.15 3.41 3.88 1.16 3.26 4.03 1.80 3.29 3.91 1.9 3.26 4.03 * 1.80Chiayi City 2 5.72 5.72 0.34 4.21 4.21 0.12 4.64 4.64 0.07 4.59 4.59 0.22 4.64 4.64 * 0.06Taipei City 12 5.29 5.43 2.45 4.74 5.00 0.86 4.73 4.66 0.44 4.84 4.67 0.63 4.70 4.64 0.43
Kaohsiung City 38 2.52 0.47 4.73 2.06 1.78 1.55 2.11 1.52 1.72 2.29 1.45 2.63 2.12 1.54 * 1.73New Taipei City 29 2.09 1.43 3.09 2.08 2.08 1.70 2.30 2.48 2.00 2.37 2.48 2.69 2.31 2.44 2.03Taichung City 29 3.66 2.52 6.09 3.13 2.83 1.99 3.10 3.03 1.87 3.15 2.88 1.96 3.10 3.03 * 1.89
Tainan City 37 1.55 0.00 2.93 1.68 1.28 1.41 1.67 1.00 1.51 1.65 1.01 1.54 1.67 0.99 1.51Taoyuan City 13 2.19 2.34 1.72 2.13 2.00 1.18 2.30 2.58 1.24 2.24 2.38 1.22 2.29 2.55 * 1.24
Total 349
Average 1.80 0.00 3.32 1.87 1.56 1.58 1.89 1.20 1.72 1.91 1.16 1.96 1.90 1.21 * 1.74
Note: *: (median by A3) − (median by A4) < 0.
36

Int. J. Environ. Res. Public Health 2020, 17, 7576
4. Discussion
Table 6 compares the regional average method (A0), the two-step floating catchment area method(A1), and the innovative three-step floating catchment area method A4 introduced in this study bythe values of “median value minus mean value” and Gini coefficients. When the value of “medianvalue minus mean value” of a county/city is negative, it implies that 50% of the medical resourcesin its towns have low accessibilities distribution. In addition, the mean values of the counties/citiesthat are lower than Taiwan’s average are marked with “*”. In the regional average method (A0),the counties/cities with low accessibilities in 50% of the medical resources in its towns are entirelydifferent from those in methods A1 and A4. When we take a further step and compare the degreeof inequality in resource accessibilities of counties/cities using the Gini coefficient, we can see thatwhen we carry out an assessment with the regional average method (A0), as the analysis only includedthe amount of physical rehabilitation resources within the respective administrative regions, it led tocalculation results in which 11 counties/cities fell into the category of resource distribution inequality.When the government allocates resources with reference to the regional average method (A0), it iseasy to neglect the effects of distance and cross-district usage of services, and the phenomenon ofresource distribution inequality worsens as a result. In method A4, Taitung County is the only placewith a negative value of “median value minus mean value” and has a Gini coefficient that representsmedian inequality. The county belongs to Eastern Taiwan and comprises 14 towns. Despite the vastadministrative region, there are only six hospitals and 14 board-certificated physiatrists operating inthe county, which makes it the county with the highest inequality in resource accessibilities.
In this study, the geographical accessibility scores are grouped into quintiles and the spatialdistributions of the accessibility scores of rehabilitation physicians are clearly presented on maps.The colors from lowest to highest accessibility score are red (0%~20%), orange (21%~40%),green (41%~60%), light blue (61%~80%), and dark blue (81%~100%). Figure 1 shows that redareas (low accessibility) measured by method A0 cover almost the entire island, meaning that manytowns’ accessibility scores are evaluated as low because their medians are 0.0. Figures 2 and 3 aredrawn using method A1 and method A4, respectively. The difference between these two methods isthat the latter considers the selection probability of each hospital. Figure 3 shows that the number ofhigh-accessibility towns (light-blue and dark-blue area) is increased compared to Figure 2. This resultshows that the distribution of medical service resources tends to concentrate in densely populatedareas and downtowns. People may travel farther based on the reputation and service capacity ofhospitals to get better medical services.
37

Int. J. Environ. Res. Public Health 2020, 17, 7576
Table 6. Measures of geographic inequality of physical rehabilitation resources accessibility scores by methods A0, A1, A4.
Estimated by 10,000 * Capacity/People
Administrative DistrictMethod A0 Method A1 Method A4
Median-Mean Gini Coefficient Median-Mean Gini Coefficient Median-Mean Gini Coefficient
Yilan County −1.82 * 0.49 ⊚ 0.09 0.08 −0.53 0.11Hsinchu County −0.91 0.45 ⊚ −0.03 0.10 −0.54 0.16Miaoli County −1.13 0.39 0.09 0.23 −0.36 0.24
Changhua County −0.99 0.27 −0.55 * 0.38 −0.74 * 0.28Nantou County −0.79 0.43 ⊚ −0.02 0.16 −0.40 0.25Yunlin County −0.81 0.61 ⊚⊚ −0.16 0.24 −0.46 0.29Chiayi County −0.92 0.81 ⊚⊚ 0.06 0.18 −0.38 0.26
Pingtung County −0.65 0.70 ⊚⊚ 0.09 0.13 −0.16 0.15Taitung County −0.54 0.20 −0.53 * 0.19 −0.97 * 0.59 ⊚
Hualien County −1.49 0.30 −0.85 * 0.08 −0.84 * 0.09Keelung City −1.51 0.47 ⊚ −0.14 0.02 −0.05 0.11Hsinchu City −1.37 0.33 0.47 0.03 0.77 0.02Chiayi City 0.00 0.03 0.00 0.01 0.00 0.01Taipei City 0.14 0.22 0.27 0.09 −0.07 0.03
Kaohsiung City −2.05 * 0.63 ⊚⊚ −0.28 0.03 −0.58 0.09New Taipei City −0.66 0.48 ⊚ 0.00 0.08 0.13 0.11Taichung City −1.13 0.55 ⊚ −0.31 0.18 −0.08 0.20
Tainan City −1.55 0.59 ⊚ −0.40 * 0.05 −0.68 0.09Taoyuan City 0.15 0.14 −0.13 0.06 0.26 0.06
Average −1.80 0.53 ⊚ −0.31 0.05 −0.69 0.11
Notes: 1. Level of distribution inequality estimated by score of “Median-Mean”. *: smaller than average. 2. Level of distribution inequality estimated by Gini coefficient. ⊚: 0.4~0.6,median inequality, ⊚⊚: > 0.6, high inequality.
38

Int. J. Environ. Res. Public Health 2020, 17, 7576
Figure 1. Accessibility score of rehabilitation physician service in Taiwan using method A0.
Figure 2. Accessibility score of rehabilitation physician service in Taiwan using method A1.
39

Int. J. Environ. Res. Public Health 2020, 17, 7576
Figure 3. Accessibility score of rehabilitation physician service in Taiwan using method A4.
Based on the three-step floating catchment area method, Table 7 shows the results of assessmentson inequality in resource accessibility with methods A2–A4. According to the calculation results ofthe three methods, 50% of the medical resources in towns had low accessibilities (negative value of“median value minus mean value”) in Taitung County and Hualien County. When we compared theinequality in resource accessibilities of counties/cities with the Gini coefficient, the value of TaitungCounty was close to the critical value of high inequality.
Comparing Figures 3–5: Figure 3 was drawn by method A4 which considers both spatial factors(distance) and non-spatial factors (Google Rating score and resource capacity). In Figure 3, the number ofdark-blue areas is increased in vast towns of the central and eastern administrative regions. Comparedwith method A2 (which only considers the selection probability of distance and resource capacity),and method A3 (which only considers the selection probability of distance and Google Rating score),the assessment result of method A4 may be more in line with people’s decision-making in choosingrehabilitation medical resources.
With method A4 proposed in this study, an assessment of physiatrist resource allocation policieson the main island of Taiwan was carried out. The results of our study have important implications forrehabilitation physician services and elderly care policy in Taiwan. In the first stage, the improvementof resources in Taitung County should be prioritized. The next in line should be the three counties/cities(Taitung County, Changhua County and Hualien County) where 50% of the medical resources in townshad low accessibilities and scored lower than Taiwan’s average. In the third stage, work should becarried out on the 12 counties/cities with low accessibilities in 50% of the medical resources in towns.
40

Int. J. Environ. Res. Public Health 2020, 17, 7576
Table 7. Measures of geographic inequality of physical rehabilitation resources accessibility scores by methods A2–A4.
Estimated by 10,000 * Capacity/People
Administrative DistrictMethod A2 Method A3 Method A4
Median-Mean Gini Coefficient Median-Mean Gini Coefficient Median-Mean Gini Coefficient
Yilan County −0.55 0.12 −0.55 0.18 −0.53 0.11Hsinchu County −0.53 0.16 −0.52 0.16 −0.54 0.16Miaoli County −0.35 0.24 −0.35 0.24 −0.36 0.24
Changhua County −0.73 * 0.28 −0.74 0.26 −0.74 * 0.28Nantou County −0.42 0.20 −0.38 0.25 −0.40 0.25Yunlin County −0.45 0.29 −0.54 0.31 −0.46 0.29Chiayi County −0.39 0.26 −0.44 0.31 −0.38 0.26
Pingtung County −0.15 0.15 −0.18 0.17 −0.16 0.15Taitung County −0.84 * 0.54 ⊚ −0.85 * 0.55 ⊚ −0.97 * 0.59 ⊚
Hualien County −0.84 * 0.09 −0.84 * 0.10 −0.84 * 0.09Keelung City 0.00 0.11 −0.14 0.14 −0.05 0.11Hsinchu City 0.77 0.02 0.62 0.03 0.77 0.02Chiayi City 0.00 0.01 0.00 0.00 0.00 0.01Taipei City −0.08 0.03 −0.17 0.05 −0.07 0.03
Kaohsiung City −0.60 0.09 −0.83 * 0.21 −0.58 0.09New Taipei City 0.17 0.12 0.11 0.22 0.13 0.11Taichung City −0.07 0.19 −0.27 0.23 −0.08 0.20
Tainan City −0.67 0.09 −0.63 0.10 −0.68 0.09Taoyuan City 0.28 0.07 0.14 0.07 0.26 0.06
Average −0.69 0.10 −0.75 0.15 −0.69 0.11
Notes: 1. Level of distribution inequality estimated by score of “Median-Mean”. *: smaller than average. 2. Level of distribution inequality estimated by Gini coefficient. ⊚: 0.4~0.6,median inequality.
41

Int. J. Environ. Res. Public Health 2020, 17, 7576
Figure 4. Accessibility score of rehabilitation physician service in Taiwan using method A2.
Figure 5. Accessibility score of rehabilitation physician service in Taiwan using method A3.
5. Conclusions
As the free market influences the medical environment, people have many choices of medicalservices and have access to duplicate medical treatments. Therefore, when we discuss the distributionalfairness of physical rehabilitation resources, not only do we focus on the degree of coordination
42

Int. J. Environ. Res. Public Health 2020, 17, 7576
between the population at demand and service supply, but we also have to consider the distance factorwhen the patients travel to hospitals. In the information age, the rating mechanism of online serviceplatforms, which allows ordinary people to review freely, has become a crucial source of references forpeople when they choose from numerous hospitals. In this study, various methods were utilized toassess the geographic accessibility of resources, while Google ratings were added as a choice factorfor when people examine the credibility of hospitals. These features were integrated into methodA4, which is an innovative research method to assess the appropriateness in the demand and supplyof physical rehabilitation resources. Method A4 combines the spatial condition of travel distance,non-spatial conditions of hospital capacity, and Google Rating mechanism. This helps examine whetherthe allocation of physical rehabilitation resources shows inequality due to regional differences.
With restrictions on the access of data and lack of details, the limitations encountered in this studyinclude the following: (1) The people at demand were positioned at the weighted center points ofpopulation in geometry. This only provides reference locations of the people at demand and cannotreflect the exact locations of each elderly person at demand in reality. The author suggests employingfiner space scales such as the scale of basic statistical areas (BSAs) for better research in the future.(2) Activity areas regarding geographical accessibility were merely represented by route distances andthe estimation of the range of activities of the elderly may not be precise. In the future, transportationtime or different vehicles can be integrated into calculations and evaluations. (3) This study onlyexamines geographical accessibility. Relevant social and economic conditions can be weighted andadded to the calculation processes in the future to facilitate analysis combined with geographicalaccessibility. (4) The open data of the government do not disclose the number of users, statistics ofservice items, and details of duplicate medical treatments in hospitals. Therefore, concerning thedifferences in people at demand and the actual number of users, a cross-validation cannot be carriedout in this study. At the same time, assessments and comparisons between the service loads and theactual service effectiveness of hospitals cannot be carried out.
Author Contributions: Conceptualization: C.-C.L., H.-C.W. and M.-H.T.; Data curation: C.-C.L., H.-C.W. andM.-H.T.; Formal analysis: C.-C.L., H.-C.W. and M.-H.T.; Funding acquisition: M.-H.T.; Investigation: C.-C.L.,H.-C.W. and M.-H.T.; Methodology: C.-C.L., H.-C.W. and M.-H.T.; Project administration: H.-C.W. and M.-H.T.;Resources: C.-C.L., H.-C.W. and M.-H.T.; Software, H.-C.W. and M.-H.T.; Supervision: C.-C.L., H.-C.W. andM.-H.T.; Validation: H.-C.W. and M.-H.T.; Visualization: M.-H.T.; Writing—original draft preparation: C.-C.L. andH.-C.W.; Writing—review and editing: C.-C.L., H.-C.W. and M.-H.T. All authors have read and agreed to thepublished version of the manuscript.
Funding: This work was partially supported by the Ministry of Science and Technology, Taiwan, under grantnumber MOST 108-2621-M-040-002 and MOST 109-2410-H-040-003-SS2. The support is greatly appreciated.
Conflicts of Interest: The authors declare no conflict of interest.
References
1. World Health Organization. Active Ageing: A Policy Framework. Available online: http://www.who.int/ageing/publications/active_ageing/en/ (accessed on 1 May 2018).
2. Phelan, E.A.; Anderson, L.A.; Lacroix, A.Z.; Larson, E.B. Older Adults’ Views of “Successful Aging”—HowDo They Compare with Researchers’ Definitions? J. Am. Geriatr. Soc. 2004, 52, 211–216. [CrossRef] [PubMed]
3. Rusin, M. Stroke rehabilitation: A geropsychological perspective. Arch. Phys. Med. Rehabil. 1990, 71, 914–922.[PubMed]
4. Lippmann, H.I.; Fishman, L.; Lewis, C.B. Medical care for the elderly: A counterview. Arch. Phys. Med. Rehabil.
1991, 72, 430. [PubMed]5. Strasser, D.C.; Solomon, D.H.; Burton, J.R. Geriatrics and physical medicine and rehabilitation: Common
principles, complementary approaches, and 21st century demographics. Arch. Phys. Med. Rehabil. 2002, 83,1323–1324. [CrossRef]
6. Momosaki, R.; Kakuda, W.; Kinoshita, S.; Yamada, N.; Abo, M. Clinical Effectiveness of Board-certificatedPhysiatrists on Functional Recovery in Elderly Stroke Patients During Convalescence: A RetrospectiveCohort Study. Int. J. Gerontol. 2017, 11, 7–11. [CrossRef]
43

Int. J. Environ. Res. Public Health 2020, 17, 7576
7. MInistry of Health and Welfare (Taiwan). National Health Insurrance Administration. Available online:http://www.nhi.gov.tw/english/index.aspx (accessed on 1 March 2020).
8. Franceschini, M.; Caso, V.; Zampolini, M.; Negrini, S.; Giustini, A. The Role of the Physiatrist in StrokeRehabilitation: A European Survey. Am. J. Phys. Med. Rehabil. 2009, 88, 596–600. [CrossRef]
9. Lipner, R.S.; Hess, B.J.; Phillips, R.L.J. Specialty Board Certification in the United States: Issues and Evidence.J. Contin. Educ. Health Prof. Autumn 2013, 33, S20–S35. [CrossRef]
10. Sanchez, J.; Byfield, G.; Brown, T.T.; LaFavor, K.; Murphy, D.; Laud, P. Perceived Accessibility Versus ActualPhysical Accessibility of Healthcare Facilities. Rehabil. Nurs. 2000, 25, 6–9. [CrossRef]
11. Burns, T.J.; Batavia, A.I.; Smith, Q.W.; DeJong, G. Primary health care needs of persons with physicaldisabilities: What are the research and service priorities? Arch. Phys. Med. Rehabil. 1990, 71, 138–143.
12. Veltman, A.; Stewart, D.E.; Tardif, G.S.; Branigan, M. Perceptions of primary healthcare services amongpeople with physical disabilities. Part 1: Access issues. Medscape Gen. Med. 2001, 3, 18.
13. Pan, J.; Zhao, H.; Wang, X.; Shi, X. Assessing spatial access to public and private hospitals in Sichuan, China:The influence of the private sector on the healthcare geography in China. Soc. Sci. Med. 2016, 170, 35–45.[CrossRef] [PubMed]
14. Luo, W.; Wang, F. Spatial Accessibility to Primary Care and Physician Shortage Area Designation: A CaseStudy in Illinois with GIS Approaches. In Geographic Information Systems and Health Applications; Khan, O., Ed.;IDEA Group Publishing: London, UK, 2003; pp. 261–279.
15. Luo, W.; Wang, F. Measures of Spatial Accessibility to Health Care in a GIS Environment: Synthesis and aCase Study in the Chicago Region. Environ. Plan. B 2003, 30, 865–884. [CrossRef]
16. McLafferty, S.L. GIS and Health Care. Annu. Rev. Public Health 2003, 24, 25–42. [CrossRef] [PubMed]17. Guagliardo, M.F. Spatial accessibility of primary care: Concepts, methods and challenges. Int. J. Health Geogr.
2004, 3, 3. [CrossRef] [PubMed]18. Arcury, T.A.; Gesler, W.M.; Preisser, J.S.; Sherman, J.; Spencer, J.; Perin, J. The Effects of Geography and
Spatial Behavior on Health Care Utilization among the Residents of a Rural Region. Health Serv. Res. 2005,40, 135–156. [CrossRef] [PubMed]
19. Wang, F.; Luo, W. Assessing Spatial and Nonspatial Factors for Healthcare Access: Towards An IntegratedApproach to Defining Health Professional Shortage Areas. Health Place 2005, 11, 131–146. [CrossRef]
20. Luo, W.; Qi, Y. An Enhanced Two-Step Floating Catchment Area (E2SFCA) Method for Measuring SpatialAccessibility to Primary Care Physicians. Health Place 2009, 15, 1100–1107. [CrossRef]
21. McGrail, M.R.; Humphreys, J.S. Measuring spatial accessibility to primary care in rural areas: Improving theeffectiveness of the two-step floating catchment area method. Appl. Geogr. 2009, 29, 533–541. [CrossRef]
22. Wang, F. Measurement, optimization, and impact of health care accessibility: A methodological review.Ann. Assoc. Am. Geogr. 2012, 102, 1104–1112. [CrossRef]
23. Cabrera-Barona, P.; Blaschke, T.; Gaona, G. Deprivation, Healthcare Accessibility and Satisfaction:Geographical Context and Scale Implications. Appl. Spat. Anal. Policy 2017. [CrossRef]
24. Wu, H.-C.; Tseng, M.-H. Evaluating Disparities in Elderly Community Care Resources: Using a GeographicAccessibility and Inequality Index. Int. J. Environ. Res. Public Health 2018, 15, 1353. [CrossRef]
25. Social and Family Affairs Adminstration Ministry of Health and Welfare. Assistive Benefits. Available online:https://newrepat.sfaa.gov.tw/home/repat-welfare (accessed on 1 June 2020).
26. Taiwan Academy of Physical Medicine and Rehabilitation. Associators. Available online: https://www.pmr.org.tw/associator/associator-all.asp (accessed on 1 March 2020).
27. Taiwan, M.O.I. Department of Household Resistration. Available online: http://www.ris.gov.tw/en/web/ris3-english/home (accessed on 1 June 2020).
28. Page, N.; Langford, M.; Higgs, G. An evaluation of alternative measures of accessibility for investigatingpotential ‘deprivation amplification’ in service provision. Appl. Geogr. 2018, 95, 19–33. [CrossRef]
29. Ministry of Transportation and Communications. GIS-T. Available online: https://gist.motc.gov.tw/gist_web(accessed on 1 March 2018).
30. Ruger, J.P.; Kim, H.J. Global health inequalities: An international comparison. J. Epidemiol. Community Health
2006, 60, 928–936. [CrossRef] [PubMed]31. McGrail, M.R.; Humphreys, J.S. The Index of Rural Access: An Innovative Integrated Approach for Measuring
Primary Care Access. BMC Health Serv. Res. 2009, 9, 124. [CrossRef] [PubMed]
44

Int. J. Environ. Res. Public Health 2020, 17, 7576
32. Wan, N.; Zou, B.; Sternberg, T. A three-step floating catchment area method for analyzing spatial access tohealth services. Int. J. Geogr. Inf. Sci. 2012, 26, 1073–1089. [CrossRef]
33. Hearn, A. Structuring feeling: Web 2.0, online ranking and rating, and the digital‘reputation‘economy.Ephemer. Theory Politics Organ. 2010, 10, 421–438.
34. Dabholkar, P.A. Factors Influencing Consumer Choice of a “Rating Web Site”: An Experimental Investigationof an Online Interactive Decision Aid. J. Mark. Theory Pract. 2006, 14, 259–273. [CrossRef]
35. Wang, S.; Zheng, Z.; Wu, Z.; Lyu, M.R.; Yang, F. Reputation measurement and malicious feedback ratingprevention in web service recommendation systems. IEEE Trans. Serv. Comput. 2014, 8, 755–767. [CrossRef]
36. Ceriani, L.; Verme, P. The origins of the Gini index: Extracts from Variabilità e Mutabilità (1912) by CorradoGini. J. Econ. Inequal. 2012, 10, 421–443. [CrossRef]
37. Yitzhaki, S. Relative Deprivation and the Gini Coefficient. Q. J. Econ. 1979, 93, 321–324. [CrossRef]38. Tseng, M.-H.; Wu, H.-C. The geographic accessibility and inequality of community-based elderly learning
resources: A remodeling assessment, 2009~2017. Educ. Gerontol. 2018, 44, 226–246. [CrossRef]39. Cowell, F.A. Measuring Inequality, 3rd ed.; Oxford University Press: Oxford, UK, 2011.
Publisher’s Note: MDPI stays neutral with regard to jurisdictional claims in published maps and institutionalaffiliations.
© 2020 by the authors. Licensee MDPI, Basel, Switzerland. This article is an open accessarticle distributed under the terms and conditions of the Creative Commons Attribution(CC BY) license (http://creativecommons.org/licenses/by/4.0/).
45

International Journal of
Environmental Research
and Public Health
Article
Associations between Trace Elements and CognitiveDecline: An Exploratory 5-Year Follow-Up Study ofan Elderly Cohort
Bianca Gerardo 1,2,* , Marina Cabral Pinto 3 , Joana Nogueira 1,2, Paula Pinto 2,
Agostinho Almeida 4 , Edgar Pinto 4,5 , Paula Marinho-Reis 3,6 , Luísa Diniz 4,
Paula I. Moreira 7,8 , Mário R. Simões 1,2 and Sandra Freitas 1,2
1 Center for Research in Neuropsychology and Cognitive and Behavioral Intervention (CINEICC),Faculty of Psychology and Educational Sciences (FPCEUC), Univ Coimbra, 3000-115 Coimbra, Portugal;[email protected] (J.N.); [email protected] (M.R.S.); [email protected] (S.F.)
2 Psychological Assessment and Psychometrics Laboratory (PsyAssessmentLab), Faculty of Psychology andEducational Sciences (FPCEUC), Univ Coimbra, 3000-115 Coimbra, Portugal; [email protected]
3 Geobiotec Research Centre, Department of Geosciences, University of Aveiro, 3810-193 Aveiro, Portugal;[email protected] (M.C.P.); [email protected] (P.M.-R.)
4 LAQV/REQUIMTE, Laboratory of Applied Chemistry, Faculty of Pharmacy, University of Porto,4050-313 Porto, Portugal; [email protected] (A.A.); [email protected] (E.P.); [email protected] (L.D.)
5 Department of Environmental Health, School of Health, P.Porto, CISA/Research Center in Environment andHealth, 4200-072 Porto, Portugal
6 Departamento de Ciências da Terra, Instituto de Ciências da Terra, Polo da Universidade do Minho,Campus de Gualtar, 4710-057 Braga, Portugal
7 Center for Neuroscience and Cell Biology (CNC), University of Coimbra, 3004-504 Coimbra, Portugal;[email protected]
8 Institute of Physiology, Faculty of Medicine, University of Coimbra, 3000-548 Coimbra, Portugal* Correspondence: [email protected]; Tel.: +351-963-309-490
Received: 30 June 2020; Accepted: 18 August 2020; Published: 20 August 2020
Abstract: Trace elements (TE) homeostasis is crucial in normal brain functioning. Although imbalanceshave the potential to exacerbate events leading neurodegenerative diseases, few studies have directlyaddressed the eventual relationships between TE levels in the human body and future cognitive status.The present study aimed to assess how different TE body-levels relate to cognitive decline. Thisexploratory research included a study-group (RES) of 20 elderly individuals living in two Portuguesegeographical areas of interest (Estarreja; Mértola), as well as a 20 subjects neuropsychologicalcontrol-group (CTR). Participants were neuropsychologically assessed through the Mini MentalState Examination (MMSE) and the Montreal Cognitive Assessment (MoCA) and the RES groupwas biomonitored for TE through fingernail analysis. After 5 years, the cognitive assessments wererepeated. Analyses of the RES neuropsychological data showed an average decrease of 6.5 and5.27 points in MMSE and MoCA, respectively, but TE contents in fingernails were generally withinthe referenced values for non-exposed individuals. Higher levels of Nickel and Selenium significantlypredicted lesser cognitive decline within 5 years. Such preliminary results evidence an associationbetween higher contents of these TE and higher cognitive scores at follow-up, suggesting theircontribution to the maintenance of cognitive abilities. Future expansion of the present study is neededin order to comprehensively assess the potential benefits of these TE.
Keywords: cognitive decline; longitudinal study; risk for dementia; trace elements; nickel; selenium;human tissues; industrial area; mining area
47

Int. J. Environ. Res. Public Health 2020, 17, 6051
1. Introduction
The rapid aging of the world’s population is a current phenomenon that imposes great socialand economic challenges. It is estimated that by 2050, there will be 1.5 billion people with agesabove 65 years worldwide, corresponding to 16% of the population [1]. It is further foreseen thatthis proportion will be much higher in specific countries, such as Italy, Portugal, Greece, Japan, andKorea, where it will exceed the one-third mark [2]. Specifically, in Portugal, the estimations predicta ratio of 464 elderly (≥65 years old) per 100 young individuals by 2060, the quadruple of the ratioregistered in 2001 [3]. Such aging rebounds in a growing number of people living with dementia—acondition characterized by the gradual loss of cognitive and functional capacities that interferes withthe performance and execution of daily-living activities—as its prevalence/incidence increases sharplywith age (from 2.3% among 65–69 years old individuals to 42% among elderly aged 90 or older) [2].With a forecast of 41 million cases across OECD countries by 2050 [2], dementia is currently a majorpublic health priority [4].
Strict genetic etiology is rare in dementia, being the vast majority of cases sporadic in origin [5–7].Among elderly people, Alzheimer’s disease (AD) is the most frequent form of the condition andis mainly expressed by an accentuated loss of memory, as well as by the progressive decline ofother cognitive and functional capacities. At the cellular level, AD pathology is characterized byneurofibrillary tangles (abnormal accumulations of hyperphosphorylated tau protein) and senileplaques (aggregations of amyloid-β protein) [8]. Several factors have been reported as contributorsto the development of sporadic AD—besides aging, genetics is another well-established risk factor,with the presence of the APOE ε4 allele being the strongest genetic elicitor of increased risk for thedisease [9]. Meanwhile, environmental exposure to toxic metals, to certain chemical compounds(such as pesticides and industrial chemicals) and to air pollutants have also been proposed as a riskfactor [5,7,10].
Although not all environmental contaminants/toxins have been tested in regards to their effects onthe central nervous system, it is hypothesized that there may be a risk for older adults to develop AD(and other neurodegenerative diseases such as Parkinson’s disease) that is associated with the neurologicimpairments resulting from such environmental exposures [10–13]. Trace elements homeostasis iscrucial in normal brain functioning, and disturbances may exacerbate AD-associated events [14,15].Amongst trace metals, the relationship between AD and aluminum (Al) seems to be the best understood,with larger environmental studies, epidemiological studies and case-control evidence supportingan association between high levels of exposure to Al and the risk for AD [11,16]. For instance, thisassociation has been suggested by studies reporting high rates of AD among older adults exposedto high concentrations of the metal [17], as well as by evidence of higher blood Al levels among ADpatients (e.g., [18–20]). Copper (Cu) is another widely investigated element. Post-mortem case-controlstudies report a significant decrease of Cu in brain tissues of AD patients [21,22], particularly inregion such as the hippocampus, amygdala [23], frontal cortex [24], cerebellum, motor and sensorycortex, cingulate gyrus, temporal gyrus, and entorhinal cortex [25]. In turn, research on iron (Fe)evidences higher contents of this metal in the same biological matrix [26], namely, in the Brodmannarea [21], frontal cortex [27], and amygdala [23]. Furthermore, epidemiological studies report anassociation between higher levels of Fe in soil and the diagnosis of AD [28] as well as between theseconcentrations and AD-related mortality [29]. Indeed, this metal seems to be responsible for oxidativestress and increases amyloid deposition [30]. Abnormalities of brain copper (Cu), iron (Fe) and zinc(Zn) homeostasis in AD were reported [31].
Systematic exposure to trace elements (TE) is a common occurrence worldwide. Humancontamination may result from various pathways, namely, through inhalation of contaminatedair/ambient particulate matter, ingestion of contaminated soil/dust, water and foodstuffs (such asagriculture crops, meat, and seafood), and dermal absorption of TE present in soil/dust [10,32,33].The toxicity of each TE is dependent on the route and absorbed dose, which is in turn dependent onthe concentration and duration of exposure [34]. Furthermore, each TE has a specific half-life, and
48

Int. J. Environ. Res. Public Health 2020, 17, 6051
the elimination of different elements from the body widely varies [35]. Previous studies report thesignificance of occupational exposure to specific TE and their effects on the development of cognitivedisorders and dementia [5,6,35–37].
Despite the increasing evidence reporting the role of environmental exposures in the developmentof neurodegenerative diseases, the real effects of long-term exposure to TE in cognition remainunclear—literature on the possible pathogenic role of different metals do not provide direct evidence todefine a causal relationship between environmental exposure to certain metals and AD [15,16]. Thus,the study of the influence of TE in the cognition of elderly people is necessary. The crossing of biologicaland neuropsychological assessment data to address this matter is an interesting approach. On the onehand, a comprehensive neuropsychological assessment is an essential component to identify subtlecognitive and behavioral deficits associated with neurotoxic exposure [38–40]. On the other hand, theuse of fingernails for biomonitoring purposes provides a valid measurement of relatively long-term TEintake/exposure in a single specimen analysis [41]. Human nails are mainly constituted by keratin-richproteins, and as they remain isolated from further metabolic activities after growth, they retain a highcontent of most TE. Moreover, the incorporation of TE in the nails’ matrix occurs in a time-integratedfashion and in proportion to the dietary intakes and other exposures to which an individual may besubjected [41,42]. Bioaccumulation ratios show that nails have higher mass/mass ratios (mass of TEper mass of sample) compared to blood and urine [32,41,43]. As nail samples are easy to collect (nailclipping is a non-invasive procedure), transport, and store [44], fingernails are useful and cost-effectivespecimens for element profiling.
Considering this translational approach, the present exploratory study comprises the cognitiveassessment of a group of elderly individuals residing in potential environmentally-toxic geographicregions 5 years after the TE biomonitoring, in order to assess whether nail TE levels are associated withperformance scores. The main aim is to investigate the effects of TE on future cognitive status.
2. Materials and Methods
2.1. Participants and Study Design
The present research comprised a study-group (RES) and a neuropsychological control-group(CTR). Criteria for participants’ inclusion accounted: (i) being a native Portuguese speaker, (ii) beingover 50 years of age (given the likelihood of this cohort to report cognitive complaints and/or beinginvolved in pathological aging processes of the dementia spectrum), (iii) having resided in the studyareas for at least the past 5 years (prior to this study, in order to ensure minimum exposure time [45];applicable for the RES group), (iv) having maintained the same occupation/professional activity.
The exclusion criteria were the following: (a) having a history of neurological disease (other thanof the dementia spectrum); (b) having a history of psychiatric illness, including depression with theexception of stable mild depressive symptoms (depression symptomatology was assessed throughthe application of the Geriatric Depression Scale—30 [46–48]; individuals with total scores ≥ 21 wereexcluded); (c) having a significant visual, auditory, or language impairment that would negativelyaffect their ability to satisfactorily complete cognitive tests or understand test instructions; (d) currentor prior alcohol, drugs, and other substances abuse; (e) current or prior use of antipsychotic medication;(f) being a smoker; (g) current or prior intake of supplements containing any of the analyzed TE;(h) significant changes in diet.
All subjects enrolled in the RES group were permanent residents from the municipality of Estarrejaor from the municipality of Mértola and were voluntarily recruited through convenience sampling.Participants from the CTR group were randomly selected from an already existing longitudinal cohortcomposed of 250 community-residents recruited from several social institutions, aging associations andprimary health care centers, who have been neuropsychologically assessed for the past 10 years. Thiscohort has been stratified according to several sociodemographic variables with a distribution similar
49

Int. J. Environ. Res. Public Health 2020, 17, 6051
to that observed in the Portuguese population, resulting in a cohort representative of the population ofthe country.
The RES group was initially composed of 76 participants who were cognitively assessed byan experienced neuropsychologist and whose fingernail clippings were collected and analyzed forbiomonitoring of twenty selected TE: Al, arsenic (As), barium (Ba), cadmium (Cd), cobalt (Co),chromium (Cr), Cu, Fe, mercury (Hg), lithium (Li), manganese (Mn), nickel (Ni), lead (Pb), antimony(Sb), selenium (Se), tin (Sn), strontium (Sr), titanium (Ti), vanadium (V), and zinc (Zn). Out of theinitial group, a total of 20 individuals were available for the second neuropsychological assessment,performed 5 years after the biomonitoring study. The neuropsychological data was paired withthe biological data resulting from the nails TE profiling. In turn, the CTR group was composed of20 subjects randomly selected from the mentioned pre-existing cohort of 250 subjects, previouslymatched by educational level with the RES group. For comparability reasons, since this pre-existingcohort has been followed for 10 years, the data considered for the CTR group referred to the 5-yearfollow-up benchmark.
All cognitive performances were assessed through the application of two cognitive screeningtools: the Mini-Mental State Examination (MMSE [49,50]) and the Montreal Cognitive Assessment(MoCA [51,52]). The referred educational pairing between the two groups was performed based onprevious evidences that report educational level as the variable that most significantly contributes tothe prediction of scores on cognitive screening tests, such as MMSE and MoCA [53–57].
Ethical approval for the present research was obtained from the National Committee for DataProtection (No. 11726/2017). This study complies with the ethical guidelines for human experimentationstated in the Declaration of Helsinki committee and all participants gave written informed consentprior to participation after the aims and research procedures were fully explained by a member of thestudy group.
2.2. Geographical Areas of Interest
The study included residents from two distinct areas in Portugal—a northern industrial region(Estarreja) and a southern region associated with the mining industry (Mértola). Both areas displayinteresting characteristics to study the potential effect of long-term environmental exposure to chemicals.
Estarreja, a municipality located near one of the largest Portuguese cities, Aveiro, hosts one of thelargest chemical complexes of the country. In this municipality, located near the small town with thesame name, the Estarreja Chemical Complex (ECC) has been intensively operating since the 1950s inthe production of aniline and derivatives, chlorine-alkalis, sodium and chlorate compounds throughelectrolysis using Hg cathodes, polyvinyl chloride resins, and polymeric methyl diphenyl isocyanate.In the past, the ECC also produced ammonium sulphate, ammonium nitrate, and sulphuric acid [58].Until the 21st century such activity had serious deleterious effects on the environment with regardsto soils/agricultural fields, surface waters, groundwater, and atmosphere [59–63]. Toxic solid wastesand liquid effluents were discharged directly into manmade, permeable water channels, without anyprevious treatment [58]. Environmental remediation works only began in 1998 [63].
Mértola is a municipality located in Baixo Alentejo, a southern area with several abandonedmanganese mines spatially related with the Iberian Pyrite Belt. Mining releases large amountsof potentially toxic elements into the environment, which contaminate soils, surface waters, andgroundwater. Right next to Mértola are the São Domingos Mines, the biggest Portuguese miningexploration until their shutdown in 1996. Close to the mines, the abandoned tailings deposits remainexposed to the weathering conditions that promote mineral leaching, with the release of elementssuch as As, Pb, Cd, and Cr. In addition, depending on the weather conditions, fine and ultrafinemineral particles are re-suspended and added to the ambient particulate matter, being transported tothe neighboring areas [64–66].
50

Int. J. Environ. Res. Public Health 2020, 17, 6051
2.3. Neuropsychological Assessment
All participants were inquired in regards of their sociodemographic features (i.e., age, educationallevel, nationality, number of years residing in the regions of interest, marital status) through asociodemographic questionnaire; their current and past clinical history (i.e., weight, height, medicalrecords) through a clinical structured interview; and their professional activity and consumption habits(i.e., main profession, working-time in agriculture/factories/mines, use of pesticides, consumption ofhome-grown foodstuff, and source of water for consumption/irrigation), through specifically developedquestionnaires. Furthermore, all participants underwent a neuropsychological assessment performedby an experienced neuropsychologist. The screening tools of the assessment battery were administratedin a fixed order and were the following:
1. The Mini Mental State Examination (MMSE [49,50]), which is a brief cognitive screening tool widelyused in the assessment of cognitive impairment [53]. It is composed of 30 dichotomous items(0—incorrect; 1—correct) and assesses 5 cognitive domains: Orientation, Memory, Attention andCalculus, Language, and Visuoconstruction. Higher scores indicate better cognitive performance.
2. The Montreal Cognitive Assessment (MoCA [51,52]), which is a screening tool developed todetect milder forms of cognitive decline, such as Mild Cognitive Impairment (MCI [67]). Thisinstrument assesses 6 cognitive domains—Executive Functions; Visuospatial Abilities; Memory;Language; Attention Concentration and Working Memory; Temporal and Spatial Orientation—ona scale of 30 points, whose higher global scores translate better cognitive functioning.
3. The Geriatric Depression Scale—30 (GDS-30 [46–48]), which is a brief scale specifically developedfor the screening of depressive symptoms in advanced adulthood. It is composed of 30 yes/noquestions regarding the affective and cognitive domains of depression. Greater scores indicatemore severe symptomatology.
2.4. Fingernail Samples and Analysis
Fingernail clippings from the RES participants were collected individually with a synthetic quartzknife and put into decontaminated plastic bags. Plastic forceps were used to remove visible exogenousmaterial when needed.
The procedure used is described elsewhere [68]. Fingernail clippings were properly washed inorder to remove exogenous contamination while preserving endogenous TE content. Samples werethen dried at 95 C in a laboratory drying oven (Raypa, Spain) until a constant weight was reached(ca. 40 h). The dried samples (approximately 0.1 mg) were mineralized in a Milestone (Italy) MLS1200 Mega high-performance microwave digestion unit equipped with an HPR 1000/10 rotor, througha microwave-assisted acid digestion procedure using 1 mL of concentrated HNO3 (>69.0% m/m;TraceSELECT®, Fluka, France) and 0.5 mL of H2O2 (≥30% v/v; TraceSELECT®, Fluka, Germany).The used microwave oven program (W/min) was the following: 250/1, 0/2, 250/5, 400/5 and 600/5. Aftercooling, ultrapure water was added to the samples digest, and the volume was brought to 10 mL Thesolutions were then stored at 4 C in closed propylene tubes until analysis.
All labware materials were decontaminated by immersion for at least 24 h in a 10% HNO3 bathfollowed by thorough rinsing with ultrapure water. The ultrapure water (resistivity > 18.2 MΩ·cmat 25 C) was produced in an aarium® pro (Sartorius, Germany) water purification system. Foreach digestion run (10 samples), a sample blank was prepared, and the average blank level wassubtracted from the samples’ values. The certified reference material ERM-DB001—Trace Elementsin Human Hair was used for analytical quality control, digested and analyzed through the sameprocedures as for the study samples. TE concentrations were determined through Inductively CoupledPlasma-Mass Spectrometry (ICP-MS) using a Thermo Fisher Scientific (Waltham, MA, USA) iCAP™Q instrument equipped with a MicroMist™ nebulizer (Glass Expansion, Port Melbourne, Australia),a Peltier-cooled baffled cyclonic spray chamber, a standard quartz torch, and a two-cone interfacedesign (nickel sample and skimmer cones) operated under the instrumental conditions presented
51

Int. J. Environ. Res. Public Health 2020, 17, 6051
in Table S1. High-purity argon (99.9997%; Gasin, Portugal) was used as nebulizer and plasma gas.The instrument was tuned before each analytical series for maximum sensitivity and signal stabilityand minimum formation of oxides and double-charged ions. Calibration standards and the internalstandard solution were prepared from commercially available multi-element stock solutions (PlasmaCAL, SCP Science, Baie-D’Urfe, QC, Canada, and ICP-MS Internal Std, Isostandards, Material, Madrid,Spain, respectively).
The following elemental isotopes were monitored for analytical determinations: 7Li, 27Al, 48Ti,51V, 52Cr, 55Mn, 57Fe, 59Co, 60Ni, 63Cu, 66Zn, 75As, 82Se, 88Sr, 111Cd, 118Sn, 121Sb, 137Ba, 202Hg, and208Pb. The elemental isotopes 45Sc, 89Y, 115In, and 159Tb were used as internal standards. Limits ofdetection were calculated as the concentration corresponding to three times the standard deviation of10 replicate measurements of the blank solution (2% v/v HNO3) and are presented in Table S2. Resultsfor the certified reference material are presented in Table S3. The reference material used providesdata for a limited set of TE, but the analytically most problematic elements are included. Since theanalytical procedure has been validated for this set, accuracy problems are not expected for the otherdetermined elements.
2.5. Statistical Analysis
Descriptive statistics were used to characterize both groups, RES and CTR, as well as the analyticalresults. Differences between the cognitive assessment scores of RES subjects at baseline and pastfive years were studied through a Wilcoxon signed-rank test analysis. Group differences betweenthe cognitive decline registered for the RES group and for the CTR group were assessed through aMann–Whitney U test. This option for non-parametric tests was based on the small size of the follow-upstudy group (the RES group). A probability of ≤0.05 was assumed as significant in testing the nullhypotheses of no differences between the two moments of assessment and of no differences betweenthe two groups. Potential relationships between TE contents in fingernails and neuropsychologicaldata from the follow-up were firstly assessed through correlation analyses. Linear regression models(simple and multiple) were then computed to further investigate these relationships and assess whetherTE significantly predicted future cognitive performance. A significance level of 95% was also used ascriteria in both correlation and regression analyses. Comparisons between regression models werebased on changes in the variance explained by each model, indexed by the adjusted coefficient ofdetermination (R2
adjusted). All statistical analyses were conducted using the Statistical Package for theSocial Sciences (SPSS) for Windows, version 22 [69].
3. Results
3.1. Sample Characterization
The baseline and the follow-up assessments were separated by a 5-year interval (M = 5.30;SD = 0.47). Out of the 76 RES participants initially enrolled in the study, a total of 20 individuals (26.3%)could be included in the follow-up. Drop-outs were mainly due to death (42 out of 56 cases). Of the42 deceases registered, 10 were due to cardiovascular disorders, 8 to respiratory infections, 8 to cancer,5 to stroke, 4 to dementia complications (1 case of AD, 1 case of Parkinson’s disease, and 2 cases ofnon-specified dementia, diagnosed by general practitioners), 1 to gastrointestinal hemorrhage, and6 due to unknown reasons. Other reasons for experimental death were medical conditions (2 cases),unreachability (9 cases), and unavailability (3 cases). Most RES participants enrolled in the follow-upwere female (80%), with an average age of 83.60 ± 6.98 years, 2.45 ± 1.73 years of formal education(6 were illiterate), and a mean time of residence in the study areas of 61.93 ± 25.08 years. As for theeducation-matched control group (CTR), this was composed of 20 subjects, 55% of which were females,with a mean age of 74.70 ± 4.51 years and an average educational level of 3.30 ± 0.80 years (p > 0.05).Descriptive statistics of the two groups regarding marital status, occupation/professional activity, andmedical history are presented in Table 1.
52

Int. J. Environ. Res. Public Health 2020, 17, 6051
Table 1. Descriptive statistics of the total sample in terms of marital status, occupation/professionalactivity, and medical history, discriminated by group.
RES n = 20 CTR n = 20
Marital Status, n (%)Single 2 (10) 1 (5)
Married 2 (10) 12 (60)Divorced 3 (15) 1 (5)Widowed 13 (65) 6 (30)
Occupation/professional activity, n (%)Agriculture/fishery 6 (30) 1 (5)
Industry/construction 4 (20) 3 (15)Commerce/Services 8 (40) 14 (70)
Housewife 2 (10) 3 (10)
Medical History, n (%)Diabetes 4 (20) 2 (10)
Dyslipidemia 12 (60) 9 (45)Cardiovascular diseases 16 (80) 15 (75)
3.2. Neuropsychological Data
Overall, RES participants exhibited worse cognitive capacities at follow-up, comparatively tothe baseline. Subjects scored on average less 6.5 points in MMSE (Baseline: M = 23.80; SD = 5.06;Follow-up: M = 17.30; SD = 6.94; Z = −3.628, p < 0.001, r = −0.811) and less 5.27 points in MoCA(Baseline: M = 16.00; SD = 4.472; follow-up: M = 10.73; SD = 5.985; Z = −2.317, p = 0.020, r = 0.699)after 5 years. When compared to the Portuguese normative data established according to age andeducational level, the percentage of individuals classified as “with cognitive deficit” (i.e., with scores at1 standard deviation or more below the expected mean considering age and education) raised from65.0% to 85.0% according to the MMSE [70] and from 78.6% to 81.8% according to the MoCA [67].The percentage of individuals with scores below the cut-off defined for AD, Frontotemporal Dementia(FTD), and Vascular Dementia (VD) raised from 60.0% to 85.0% according to the MMSE (cut-off of<26) [71–73] and from 71.4% to 83.3% according to the MoCA (cut-off of <17) [71–73].
In order to assess whether the cognitive decline of RES participants significantly differed fromthe cognitive decline observed in the general Portuguese population, differences between the RESgroup and the CTR group were explored based on the decline observed in MMSE and MoCA scores(decline = baseline score—follow-up score). While the CTR group exhibited a mean score difference of1.40 ± 1.59 points in the MMSE and of 2.06 ± 1.35 points in the MoCA, the RES group presented scoredifferences of 6.50 ± 4.27 and 5.27 ± 5.20 points, respectively. The observed decline was significantlydifferent between the two groups for both the MMSE (U = 56.500, p < 0.001, r = −0.616) and the MoCA(U = 19.000, p = 0.005, r = −0.583).
3.3. TE Content in Fingernails
Descriptive statistics for TE content in fingernails of the RES group are summarized in Table 2.Observed values were compared to values reported in the literature for non-exposed people [74] andhealthy centenarians [75]. For most TE, the obtained results were within the reported ranges, with Cd,Co, Li, and Pb contents falling in the lower part of the intervals reported for non-exposed individuals.The same was observed for Co and Mn contents when compared to the intervals reported for healthycentenarians. The contents of Ba, Sr, and Se fell within the reported range for non-exposed people butwere below (Ba and Sr) and above (Se) the reference range for healthy centenarians.
53

Int. J. Environ. Res. Public Health 2020, 17, 6051
Table 2. Descriptive statistics for the observed trace elements (TE) contents in fingernails (research study-group (RES)), expressed as µg/g; values reported in theliterature are presented for comparison purposes.
RES Group (µg/g)Literature Data
Non-Exposed Individuals [74] Healthy Centenarians [75]
Min-Max M SD Md Min-Max M SD Md Min-Max M SD Md
Al 3.57–54.61 18.93 14.22 14.42 12.00–137.00 36.00 22.00 32.00 - - - -
As 0.07–0.30 0.12 0.06 0.11 0.07–1.09 0.27 0.19 0.22 - - - -
Ba 0.11–2.21 0.64 0.73 0.31 0.28–3.99 1.34 1.35 0.89 0.94–22.92 5.10 3.92 3.85
Cd 0.002–0.06 0.01 0.01 0.01 0.01–0.44 0.11 0.18 0.06 0.004–0.19 0.03 0.03 0.02
Co 0.003–0.04 0.01 0.01 0.01 0.01–0.12 0.03 0.03 0.02 0.01–0.64 0.10 0.10 0.07
Cr 0.25–0.93 0.61 0.20 0.60 0.22–3.20 1.16 1.05 0.76 0.08–2.51 0.82 0.44 0.82
Cu 2.66–7.40 4.67 1.32 4.83 4.20–17.00 8.40 3.50 7.60 2.02–8.53 3.71 0.99 3.55
Fe 7.31–49.84 24.01 13.25 20.06 12.00–189.00 42.00 30.00 37.00 16.52–692.00 154.40 124.80 116.70
Hg 0.12–0.85 0.42 0.20 0.42 0.03–0.31 0.12 0.098 0.098 - - - -
Li 0.005–0.18 0.04 0.04 0.02 0.01–0.25 0.07 0.07 0.05 0.02–2.07 0.31 0.32 0.23
Mn 0.04–2.93 0.58 0.79 0.17 0.19–3.30 0.90 0.75 0.65 0.21–15.40 3.09 2.18 2.62
Ni 0.09–2.98 0.93 1.04 0.36 0.14–6.95 1.65 2.20 0.84 0.02–3.67 0.95 0.85 0.66
Pb 0.07–1.73 0.38 0.38 0.30 0.27–4.75 1.38 1.14 1.06 0.13–9.61 1.86 1.81 1.33
Sb 0.008–0.13 0.04 0.04 0.03 0.01–0.13 0.05 0.05 0.04 - - - -
Se 0.60–1.03 0.803 0.13 0.80 0.62–1.53 0.94 0.21 0.93 0.24–0.70 0.44 0.11 0.44
Sn 0.01–1.20 0.33 0.36 0.17 0.11–2.56 0.63 0.51 0.48 - - - -
Sr 0.07–2.24 0.48 0.53 0.27 0.17–1.39 0.43 0.21 0.39 1.40–18.50 6.20 2.47 5.80
Ti 3.68–6.75 5.14 0.77 5.15 0.94–16.10 4.46 5.01 2.71 - - - -
V 0.05–0.38 0.120 0.07 0.10 0.02–0.48 0.08 0.05 2.71 - - - -
Zn 88.65–219.31 144.10 39.15 137.34 80.00–191.00 120.00 29.00 116.00 93.00–326.00 148.00 36.00 138.00
Note: Min =minimum; Max =maximum; M =mean; SD = standard deviation; Md =median; Al = aluminum; As = arsenic; Ba = barium; Cd = cadmium; Co = cobalt; Cr = chromium;Cu = copper; Fe = iron; Hg =mercury; Li = lithium; Mn =manganese; Ni = nickel; Pb = lead; Sb = antimony; Se = selenium; Sn = tin; Sr = strontium; Ti = titanium; V = vanadium;Zn = zinc.
54

Int. J. Environ. Res. Public Health 2020, 17, 6051
3.4. Relationship between Fingernail TE Content and Cognitive Performance
In order to assess the relationship between TE in fingernails and the results of theneuropsychological assessment (total scores obtained with the MMSE and MoCA), a correlationanalysis was performed. Correlation coefficients for the relationship between MMSE scores and Nicontent (r = 0.489), MoCA scores and Ni content (r = 0.626), and MoCA scores and Se content (r = 0.647)were the only ones that reached statistical significance (p < 0.05), evidencing a moderate to strongpositive association between these elements and the cognitive screening tests’ scores [76,77].
To further investigate whether TE contents could predict the cognitive performance of the RESgroup 5 years after the biomonitoring, linear regression analyses were run. The computed linearmodels assumed as predictor variables the TE contents of Ni and Se (the elements that led to significantcorrelation coefficients with the cognitive scores). Models are reported in Table 3.
Table 3. Linear regression models.
Linear Regression Models R2adjusted Model Significance
MMSE-1 MMSE = 14.258 + 3.259 Ni 0.197 p = 0.029MMSE-2 MMSE = 10.329 + 1.436 Education + 3.700 Ni 0.288 p = 0.022MoCA-1 MoCA = 7.503 + 3.369 Ni 0.331 p = 0.029MoCA-2 MoCA = −9.258 + 26.821 Se 0.361 p = 0.023MoCA-3 MoCA = −9.460 + 2.851 Ni + 23.017 Se 0.622 p = 0.005MoCA-4 MoCA = −16.147 + 1.556 Education + 3.525 Ni + 24.022 Se 0.679 p = 0.007
Note: MMSE =Mini Mental State Examination; MoCA =Montreal Cognitive Assessment; MMSE-n = regressionmodels assuming MMSE total scores as the dependent variable; MoCA-n = regression models assuming MoCAtotal scores as the dependent variable.
Initially, simple linear regressions showed Ni as a significant predictor of MMSE total scores(β = 0.489, t = 2.381, p = 0.029), with the regression model (MMSE-1) explaining 19.7% of the varianceof the scores. Regarding MoCA total scores, both Ni (β = 0.626, t = 2.538, p = 0.029) and Se (β = 0.647,t = 2.687, p = 0.023) showed as relevant predictors. After gathering both TE in a single regressionmodel, the statistical significance for both variables persisted, with Se being highlighted as the bestpredictor variable (explaining 55.6% of MoCA scores, vs. the 52.9% for Ni). The resulting statisticallysignificant model (MoCA-3; p = 0.005) could explain 62.2% of the MoCA total scores variance (anincrease of 29.1% and 26.1% of the variance explained by the models MoCA-1 and -2, respectively).
Because education greatly influences cognitive performance on screening tests [53–57,78] andsince aging seems to be associated with cognitive decline [63,64], age and educational level wereincluded in the regression equations in order to account for these two confounding variables. Modelsfor MMSE and MoCA with the inclusion of age showed a lack of statistical significance, and age wasnot a relevant predictor of the tests’ total scores (p > 0.05). Contrastingly, when the educational levelwas included into the equations, Ni and Se remained as relevant predictors, with the regression modelsshowing statistical significance. Compared to the MMSE-1, a 9.1% increase in the variance explainedby the model was observed, despite education being shown as a non-significant predictor (β = 0.358,t = 1.818, p > 0.05). In the resulting MMSE-2 model, both Ni and education explained together 28.8%of MMSE total scores. The same was true when the educational level was added to the MoCA-3model. Although education was not a significant predictor (β = 0.304, t = 1.605, p> 0.05) of MoCAtotal scores, its inclusion caused an increase of 5.7% of the variance explained by the regression model.The resulting MoCA-4 model explained 67.9% of MoCA total scores. Therefore, MMSE-2 (where Ni:β = 0.556, t = 2.821, p = 0.012) and MoCA-4 (where Ni: β = 0.655, t = 3.441, p = 0.009; Se: β = 0.580,t = 3.329, p = 0.010) were selected as the final linear models. In MoCA-4 model, Ni is highlighted as thebest predictor variable. In both MMSE-2 and MoCA-4 models, higher contents of Ni/Se in fingernailspredict better cognitive performances in screening tests 5 years after biomonitoring analyses.
55

Int. J. Environ. Res. Public Health 2020, 17, 6051
4. Discussion
Despite the increasing evidence reporting the role of environmental exposures in the developmentof neurodegenerative diseases, literature on the possible pathogenic role of different metals does notprovide direct evidence to define a causal relationship between environmental exposure to certainmetals and AD [15,16]. Therefore, research on the influence of TE on the cognition of elderly people iswarranted. The present study aimed to explore potential relationships between TE levels in the humanbody and cognition. Specifically, the goal was to assess how TE content in fingernails relate to futurecognitive performance.
Analyses of the RES neuropsychological data revealed an average decrease of 6.5 points and5.27 points on the global scores of MMSE and MoCA, from baseline to follow-up (5 years later), aswell as an increase in the portion of elderly individuals classified as “with cognitive deficit”—from65.0% to 85.0% and from 78.6% to 81.8%, respectively. When compared to the CTR group, the decreaseobserved in MMSE and MoCA scores was significantly greater among the RES participants, indicatingthat the residents of the geographical areas of interest suffered a steeper cognitive decline than thegeneral Portuguese population of the same educational level (within a 5-years period).
In terms of the RES participants with a cognitive performance similar to patients diagnosed withdementia (AD, FTD, and VD), they constituted 85.0% and 83.3% of the study group, according to thecut-offs of the screening tools [71–73]. These percentages of dementia-like performances are greaterthan expected considering the prevalence rate of the condition estimated for the Portuguese population(9.2% based on the 10/66 Dementia Research Group’ dementia diagnostic algorithm [79]), which indicatesa higher frequency of cognitive impairment across the study group in comparison to the generalPortuguese population older than 65 years. Literature systematically reports aging as the primaryrisk factor for neurodegenerative diseases, as this process implies a set of biological changes at thecellular level, from genomic instability to altered intercellular communication [80]. Indeed, cognitivedecline seems to be intimately associated with age, and the prevalence of dementia cases increasesexponentially after 65 years of age [80,81]. Considering that the average age of the RES elders includedin this study was 83.6 years (with the youngest participant being 68 years old) and that the average agereported by Gonçalves-Pereira et al. for their study group was 74.9 years [79], it is plausible to admitthat the difference observed in the frequency of cognitive impairment between both studies can be atleast partially explained by the approximately 9-years gap between both groups of elders. However,the observed percentages of dementia-like performances seem to remain disproportioned even whencompared to the prevalence estimated for the sub-group of individuals with ages above 80 years(18.37–19.61% based on the 10/66 Dementia Research Group’s dementia diagnostic algorithm [79]) assessedby Gonçalves-Pereira et al., suggesting that such differences are not attributed to age discrepancies.
The comparison between fingernails TE content in the RES group and values reported in theliterature for non-exposed individuals [74] showed an overall good fit, suggestive of non-significantexposure to environmental contaminants. Nevertheless, it is worth noting that the mean age of thestudy sample (approximately 84 years) is substantially different from the average age of the populationassessed by Rodushkin and Axelsson [74], which mean age was 33 years (range: 1–76 years).
With regards to the potential association between TE content in fingernails and cognitiveperformance, we found positive significant correlations between Ni and Se levels and the globalscores of MMSE and MoCA. Regression analysis showed Ni and Se as significant predictors of futurecognitive performances and revealed that, together with educational level, Ni explains 33% of thevariance observed in MMSE total scores after 5 years, while Ni and Se explained 68% of the variance inMoCA. It is important to note that age proved to be a non-significant, non-relevant, predictor of thetests’ total scores, which is in line with the previous hypothesis that the cognitive decline observedamong RES participants is not age-derived.
Nickel is a silver-white metal that belongs to the ferromagnetic elements group and that is widelydistributed across the environment. It can be absorbed through the respiratory track, digestive system,and skin [82], and besides being essential for some plants and animal species [83], this metal is also a
56

Int. J. Environ. Res. Public Health 2020, 17, 6051
micronutrient essential for proper functioning of the human body (as it increases hormonal activityand is involved in lipid metabolism [82]). Depending on the duration, intensity, and pathway ofexposure, Ni can act as an immunotoxin, as well as a carcinogenic agent, and cause several healthproblems (e.g., [84–87]). Furthermore, Ni accumulates in the brain and can act as a neurotoxicant [88].Despite the molecular mechanisms not being well understood, its actions seem to be linked withoxidative stress, mitochondrial dysfunctions, and Ni-induced apoptosis (please see [83] and [88] formore details). Defective apoptotic processes may lead to excessive cell death, which underlies severalneurodegenerative conditions. Toxicological studies in rats have shown alterations in the neuronalmorphology of rat’s brain after Ni administration [89]. A significant reduction of intact neurons inthe hippocampus and striatum was observed, as well as ultrastructural alterations in neurons of thehippocampus, striatum, and cortex [89,90]. Mitochondria seemed to be the key target in Ni-inducedneurodegeneration [90]. Cognitive and motor behavior were also compromised [89].
Literature reports tend to portrait Ni as an element with neurotoxic repercussions that mayaffect cognition and contribute to the development of neurodegenerative diseases. Our study seemsto contradict such evidence, as the results obtained showed that fingernail Ni content significantlypredicts a lower cognitive decay within 5 years. However, the observation that Ni content in fingernailswas within the interval reported for both non-exposed individuals [74] and healthy centenarians [75] isrelevant, as it not only suggests that our study group was not significantly exposed to this TE but alsothat our results are limited to normal (non-toxic) content levels. Therefore, our findings suggest that,in spite of its potential neurotoxic effects, Ni may also have beneficial effects on long-term cognitiveperformance maintenance, provided it is maintained within certain concentration levels.
The role of Se in the human organism seems to be much better understood. Se exists in severalchemical species [91–93], being a TE of interest for both nutritional and toxicological reasons. While itis an essential element for the biosynthesis of selenoproteins when in the selenocysteine-bound organicform [94], it is also a toxicant when in the selenomethionine and inorganic forms [93]. Furthermore, Sehas a very narrow range of safe exposure [95], and both its deficiency and excess are associated withimportant adverse health effects [96]. In the human body, Se plays an essential antioxidant role [97]and is very important for the maintenance of the homeostasis of the central nervous system [98]. Itsbeneficial effects are mediated by selenium-containing proteins (the selenoproteins) such as glutathioneperoxidases (GPx), the plasma Se-transport protein (SePP), and thioredoxin reductases (TrxR) [99].One of the roles of these selenoproteins is to regulate oxidative stress, which has been linked with anincreased risk of cognitive decline [100]. For GPX specifically, whose main function is to eliminateperoxides (therefore maintaining lower levels of reactive oxygen species), it is also known that isexpressed in neurons and glia cells [101]. Additionally, Se also appear to be inversely associated withsystemic inflammation, a critical process in age-associated cognitive decline and dementia [102,103].In vitro studies observed this negative relationship in several cells, including neurons [104] andmacrophages [105]. Such features are essential for neuroprotection and therefore brain metabolismof this TE is different from other organs [106]. In case of deficiency, the brain is the last organ to bedepleted and is the first one to return to normal store levels when Se is replenished [107].
Given its beneficial effects, Se has been widely studied within the scope of healthy aging andcognitive impairment. Reduced levels of Se are believed to lead to neurons destruction and increasedrisk of cognitive decline/dementia [108,109]. Studies show that, compared to healthy elder adults, ADpatients exhibited reduced levels of Se in plasma, erythrocyte, blood, cerebrospinal fluid (CSF), andnails [97,110–112]. Specifically, the levels of this TE seem to be decreased in the temporal, hippocampal,and cortex regions of AD patients [113]. Higher CSF levels of selenite (a common inorganic Se species)seem to predict progression to AD in non-vascular MCI patients [114]. Studies on Chinese elderly reportan association between lower levels of Se in nails and poorer cognitive performances and that apoE4carriers have significantly lower nail content of Se than non-carriers [111,113]. Concordantly to thisevidence, our findings highlight the beneficial effects of Se in cognition, as higher fingernail Se contentspredict lesser cognitive decline in 5 years. The determined Se content in fingernails was also within the
57

Int. J. Environ. Res. Public Health 2020, 17, 6051
reported interval for non-exposed individual [74], which suggests non-excessive exposure and linesup with the well-known U-shaped relationship between Se levels in the human body and adversehealth effects. Interestingly, Se levels were higher in our participants when compared with healthycentenarians [75]. As age increases, the decrease of organs’ physiological functioning can greatly affectthe absorption, distribution, metabolism, and function of Se in the human organism [115]. Given thedifferences in age between our study group (with a mean age of approximately 84 years) and thecentenarians, this may explain the difference in Se levels. Indeed, previous studies report a reductionof Se levels in red blood cells not only in AD and MCI but also in normal elderly people [116,117].Nevertheless, information on this topic is inconsistent, as studies have also shown higher levels of Sein the plasma among centenarians, when compared to septuagenarians [118] and nonagenarians [119].An important variable contributing for the heterogeneity of results is the choice of different tissues andfluids when assessing TE levels. Literature findings show how the relationship between Se and certaindiseases may vary across studies based on different tissues [120].
The main limitation of the present research lies on the number of drop-outs, mainly due toparticipants passing away (55% of the initial study sample), which led to a reduced sample size thatpotentially may have prevented results from reaching statistical significance. Notwithstanding, thislimitation stems from a longitudinal methodology based on a 5-years follow-up that was implementedin a cohort whose average age is higher than the life expectancy of its population (estimated to be80.8 years for Portugal [121]). Furthermore, the present study does not include the measurement of TEin the CTR group, and therefore, results should be interpreted in a preliminary/exploratory framework.
5. Conclusions
The present exploratory study provides original preliminary evidence of an existing associationbetween the concentration levels of TE in the human body and future cognitive status—our findingsshow that fingernail contents of Ni and Se predict lesser cognitive decline within 5 years. Futureexpansion of the present research is warranted. More comprehensive samples and individual-levelmeasurements of TE for control groups must be included in order to assess the real beneficial potentialof these TE in the maintenance of cognitive capacities. Further research on humans is needed, andsimilar translational approaches based on crossing other biomarkers with neuropsychological datashould be considered. Such contributions have the potential to open new avenues for a more successfulprevention of cognitive impairment and dementia.
Supplementary Materials: The following are available online at http://www.mdpi.com/1660-4601/17/17/6051/s1.Table S1: Operating conditions for the iCAPTMQ ICP-MS instrument. Table S2: Limits of detection (LOD)for the analyzed trace elements. Table S3: Results obtained in the analysis of the certified reference materialERM®—DB001 Trace Element in Human Hair.
Author Contributions: Conceptualization, B.G.; formal analysis, A.A. and E.P.; funding acquisition, B.G., M.C.P.,and S.F.; investigation, B.G., M.C.P., J.N., P.P., and S.F.; methodology, B.G., M.C.P., J.N., P.P., P.M.-R., L.D.,M.R.S., and S.F.; project administration, B.G., M.C.P., M.R.S., and S.F.; supervision, M.C.P., M.R.S., and S.F.;writing—original draft, B.G.; writing—review and editing, B.G., M.C.P., A.A., P.I.M., M.R.S., and S.F. All authorshave read and agreed to the published version of the manuscript.
Funding: This research was supported by the Portuguese Foundation for Science and Technology (Fundaçãopara a Ciência e a Tecnologia (FCT))—grants SFRH/BPD/71030/2010, IF/01325/2015, SFRH/BD/146680/2019, andUIDB/04035/2020. Funding for this research was also provided by the Labex DRIIHM, French programme“Investissements d’Avenir” (ANR-11-LABX-0010), which is managed by the ANR.
Acknowledgments: A special thank you to all participants involved in this research, as well to the local institutionsof social solidarity for the partnership (Santa Casa da Misericórdia de Estarreja, Associação Humanitária deSalreu, Centro Paroquial Social São Tomé de Canelas, Centro Paroquial Social de Avanca, Fundação Cónego FilipeFigueiredo, Centro Paroquial de Pardilhó, and Santa Casa da Misericórdia de Mértola).
Conflicts of Interest: The authors declare no conflict of interest.
58

Int. J. Environ. Res. Public Health 2020, 17, 6051
References
1. WHO. Global Health and Aging. Available online: https://www.who.int/ageing/publications/global_health.pdf (accessed on 9 March 2020).
2. OECD. Health at a Glance 2019. Available online: https://www.oecd-ilibrary.org/social-issues-migration-health/health-at-a-glance-2019_4dd50c09-en (accessed on 9 March 2020).
3. Statistics Portugal. Censos 2011, XV Recenseamento Geral da População, V Recenseamento Geral da Habitação,
Resultados Definitivos, Portugal [2011 Census, XV General Population Census, V General Housing Census, Definitive
Results, Portugal]; INE: Lisbon, Portugal, 2015; ISBN 978-989-25-0181-9.4. Wimo, A.; Guerchet, M.; Ali, G.C.; Wu, Y.T.; Prina, A.M.; Winblad, B.; Jönsson, L.; Liu, Z.; Prince, M.
The worldwide costs of dementia 2015 and comparisons with 2010. Alzheimers Dement. 2017, 13, 1–7.[CrossRef] [PubMed]
5. Tartaglione, A.M.; Venerosi, A.; Calamandrei, G. Early-life toxic insults and onset of sporadicneurodegenerative diseases—An overview of experimental studies. In Neurotoxin Modeling of Brain
Disorders-Life-Long Outcomes in Behavioral Teratology; Kostrzewa, R.M., Archer, T., Eds.; Springer: Cham,Switzerland; Boston, MA, USA, 2015; Volume 29, pp. 231–264. ISBN 978-3-319-34136-1.
6. Yan, D.; Zhang, Y.; Liu, L.; Yan, H. Pesticide exposure and risk of Alzheimer’s disease: A systematic reviewand meta-analysis. Sci. Rep. 2016, 6, 32222. [CrossRef] [PubMed]
7. Paglia, G.; Miedico, O.; Cristofano, A.; Vitale, M.; Angiolillo, A.; Chiaravalle, A.E.; Corso, G.; Di Costanzo, A.Distinctive pattern of serum elements during the progression of Alzheimer’s disease. Sci. Rep. 2016, 6, 22769.[CrossRef] [PubMed]
8. Perl, D.P. Neuropathology of Alzheimer’s disease. Mt. Sinai J. Med. 2010, 77, 32–42. [CrossRef] [PubMed]9. Dourlen, P.; Kilinc, D.; Malmanche, N.; Chapuis, J.; Lambert, J.C. The new genetic landscape of Alzheimer’s
disease: From amyloid cascade to genetically driven synaptic failure hypothesis? Acta Neuropathol. 2019,138, 221–226. [CrossRef]
10. Yegambaram, M.; Manivannan, B.; Beach, T.G.; Halden, R.U. Role of environmental contaminants in theetiology of Alzheimer’s disease: A review. Curr. Alzheimer Res. 2015, 12, 116–146. [CrossRef]
11. Killin, L.O.; Starr, J.M.; Shiue, I.J.; Russ, T.C. Environmental risk factors for dementia: A systematic review.BMC Geriatr. 2016, 16, 1–28. [CrossRef]
12. McAllum, E.J.; Finkelstein, D.I. Metals in Alzheimer’s and Parkinson’s disease: Relevance to dementia withlewy bodies. J. Mol. Neurosci. 2016, 60, 279–288. [CrossRef]
13. Ayton, S.; Lei, P.; Bush, A.I. Metallostasis in Alzheimer’s disease. Free Radic. Biol. Med. 2013, 62, 76–89.[CrossRef]
14. Gupta, V.B.; Anitha, S.; Hegde, M.L.; Zecca, L.; Garruto, R.M.; Ravid, R.; Shankar, S.K.; Stein, R.;Shanmugavelu, P.; Rao, K.J. Aluminium in Alzheimer’s disease: Are we still at a crossroad? Cell Mol. Life Sci.
2005, 62, 143–158. [CrossRef]15. Lucaroni, F.; Ambrosone, C.; Paradiso, F.; Messinese, M.; Di Domenicantonio, R.; Alessandroni, C.; Cicero, C.E.;
Cerutti, F.; Di Gaspare, F.; Morciano, L.; et al. Metals Dyshomeostasis in Alzheimer’s Disease: A SystematicReview. Biomed. Prev. 2017, 2, 112. [CrossRef]
16. Cicero, C.E.; Mostile, G.; Vasta, R.; Rapisarda, V.; Santo Signorelli, S.; Ferrante, M.; Zappia, M.; Nicoletti, A.Metals and neurodegenerative diseases. A systematic review. Environ. Res. 2017, 159, 82–94. [CrossRef][PubMed]
17. Ferreira, P.C.; Tonani, K.A.; Julião, F.C.; Cupo, P.; Domingo, J.L.; Segura-Muñoz, S.I. Aluminum concentrationsin water of elderly people’s houses and retirement homes and its relation with elderly health. Bull. Environ.
Contam. Toxicol. 2009, 83, 565–569. [CrossRef] [PubMed]18. Zapatero, M.D.; Garcia de Jalon, A.; Pascual, F.; Calvo, M.L.; Escanero, J.; Marro, A. Serum aluminum levels
in Alzheimer’s disease and other senile dementias. Biol. Trace Elem. Res. 1995, 47, 235–240. [CrossRef][PubMed]
19. Smorgon, C.; Mari, E.; Atti, A.R.; Dalla Nora, E.; Zamboni, P.F.; Calzoni, F.; Passaro, A.; Fellin, R. Traceelements and cognitive impairment: An elderly cohort study. Arch. Gerontol. Geriatr. 2004, 9, 393–402.[CrossRef] [PubMed]
20. González-Domínguez, R.; García-Barrera, T.; Gómez-Ariza, J.L. Characterization of metal profiles in serumduring the progression of Alzheimer’s disease. Metallomics 2014, 6, 292–300. [CrossRef]
59

Int. J. Environ. Res. Public Health 2020, 17, 6051
21. Graham, S.F.; Nasaruddin, M.B.; Carey, M.; Holscher, C.; McGuinness, B.; Kehoe, P.G.; Love, S.; Passmore, P.;Elliott, C.T.; Meharg, A.A.; et al. Age-Associated changes of brain copper, iron and zinc in alzheimer’sdisease and dementia with lewy bodies. J. Alzheimers Dis. 2014, 42, 1407–1413. [CrossRef]
22. Rembach, A.; Doecke, J.D.; Roberts, B.R.; Watt, A.D.; Faux, N.G.; Volitakis, I.; Pertile, K.K.; Rumble, R.L.;Trounson, B.O.; Fowler, C.J.; et al. Longitudinal analysis of serum copper and ceruloplasmin in Alzheimer’sdisease. J. Alzheimers Dis. 2013, 34, 171–182. [CrossRef]
23. Akatsu, H.; Hori, A.; Yamamoto, T.; Yoshida, M.; Mimuro, M.; Hashizume, Y.; Tooyama, I.; Yezdimer, E.M.Transition metal abnormalities in progressive dementias. Biometals 2012, 25, 337–350. [CrossRef]
24. Magaki, S.; Raghavan, R.; Mueller, C.; Oberg, K.C.; Vinters, H.V.; Kirsch, W.M. Iron, copper, and ironregulatory protein 2 in alzheimer’s disease and related dementias. Neurosci. Lett. 2007, 418, 72–76. [CrossRef]
25. Xu, J.; Begley, P.; Church, S.J.; Patassini, S.; McHarg, S.; Kureishy, N.; Hollywood, K.A.; Waldvogel, H.J.;Liu, H.; Zhang, S.; et al. Elevation of brain glucose and polyol-pathway intermediates with accompanyingbrain-copper deficiency in patients with alzheimer’s disease: Metabolic basis for dementia. Sci. Rep. 2016, 6,27524. [CrossRef] [PubMed]
26. Smith, M.A.; Zhu, X.; Tabaton, M.; Liu, G.; McKeel Jr, D.W.; Cohen, M.L.; Wang, X.; Siedlak, S.L.; Dwyer, B.E.;Hayashi, T.; et al. Increased iron and free radical generation in preclinical Alzheimer disease and mildcognitive impairment. J. Alzheimers Dis. 2010, 19, 363–372. [CrossRef] [PubMed]
27. Szabo, S.T.; Harry, G.J.; Hayden, K.M.; Szabo, D.T.; Birnbaum, L. Comparison of metal levels betweenpostmortem brain and ventricular fluid in alzheimer’s disease and nondemented elderly controls. Toxicol.
Sci. 2015, 150, 292–300. [CrossRef] [PubMed]28. Emard, J.F.; Andre, P.; Thouez, J.P.; Mathieu, J.; Boily, C.; Beaudry, M.; Cholette, A.; Robitaille, Y.; Bouchard, R.;
Daoud, N.; et al. Geographical distribution of Alzheimer’s disease cases at birth and the geochemicalprofile of Saguenay-lac-Saint-Jean/Québec, Canada (image project). Water Air Soil Pollut. 1994, 72, 251–264.[CrossRef]
29. Shen, X.L.; Yu, J.H.; Zhang, D.F.; Xie, J.X.; Jiang, H. Positive relationship between mortality from Alzheimer’sdisease and soil metal concentration in mainland China. J. Alzheimers Dis. 2014, 42, 893–900. [CrossRef][PubMed]
30. Jomova, K.; Valko, M. Advances in metal-induced oxidative stress and human disease. Toxicology 2011, 283,65–87. [CrossRef]
31. Barnham, K.J.; Bush, A.I. Metals in Alzheimer’s and Parkinson’s diseases. Curr. Opin. Chem. Biol. 2008, 12,222–228. [CrossRef]
32. Mohmand, J.; Eqani, S.A.M.A.S.; Fasola, M.; Alamdar, A.; Mustafa, I.; Ali, N.; Liu, L.; Peng, S.; Shen, H.Human exposure to toxic metals via contaminated dust: Bio-accumulation trends and their potential riskestimation. Chemosphere 2015, 132, 142–151. [CrossRef]
33. Antoniadis, V.; Shaheen, S.M.; Boersch, J.; Frohne, T.; Du Laing, G.; Rinklebe, J. Bioavailability and riskassessment of potentially toxic elements in garden edible vegetables and soils around a highly contaminatedformer mining area in Germany. J. Environ. Manag. 2017, 186, 192–200. [CrossRef]
34. Cabral Pinto, M.M.S.; Marinho-Reis, P.; Almeida, A.; Pinto, E.; Neves, O.; Inácio, M.; Gerardo, B.; Freitas, S.;Simões, M.R.; Dinis, P.A.; et al. Links between cognitive status and trace element levels in hair for anenvironmentally exposed population: A case study in the surroundings of the estarreja industrial area. Int. J.
Environ. Res. Public Health 2019, 16, 4560. [CrossRef]35. Cabral Pinto, M.M.S.; Marinho-Reis, A.P.; Almeida, A.; Ordens, C.M.; Silva, M.M.; Freitas, S.; Simões, M.R.;
Moreira, P.I.; Dinis, P.A.; Diniz, M.L.; et al. Human predisposition to cognitive impairment and its relationwith environmental exposure to potentially toxic elements. Environ. Geochem. Health 2018, 40, 1767–1784.[CrossRef] [PubMed]
36. Júlvez, J.; Paus, T.; Bellinger, D.; Eskenazi, B.; Tiemeier, H.; Pearce, N.; Ritz, B.; White, T.; Ramchandani, P.;Gispert, J.D.; et al. Environment and brain development: Challenges in the global context. Neuroepidemiology
2016, 46, 79–82. [CrossRef]37. Genuis, S.J.; Kelln, K.L. Toxicant exposure and bioaccumulation: A common and potentially reversible cause
of cognitive dysfunction and dementia. Behav. Neurol. 2015, 620143. [CrossRef] [PubMed]38. Haut, M.W.; Hartzell, J.W.; Moram, M.T. Toxins in the Central Nervous System. In Textbook of Clinical
Neuropsychology, 2nd ed.; Morgan, J.E., Ricker, J.H., Eds.; Routledge: New York, NY, USA, 2018; pp. 587–602.
60
Int. J. Environ. Res. Public Health 2020, 17, 6051
39. Singer, R. Neurotoxicity in Neuropsychology. In The Little Black Book of Neuropsychology: A Syndrome-Based
Approach; Schoenberg, M.R., Scott, J.G., Eds.; Springer: New York, NY, USA, 2014; pp. 813–838.40. White, R.F.; Krengel, M.; Grashow, R. Neurotoxicology. In Clinical Neuropsychology: A Pocket Handbook for
Assessment, 3rd ed.; Parsons, M.W., Hammeke, T.A., Eds.; American Psychological Association: Washington,DC, USA, 2014; pp. 338–362.
41. He, K. Trace elements in nails as biomarkers in clinical research. Eur. J. Clin. Investig. 2011, 41, 98–102.[CrossRef]
42. Clarkson, T.W.; Friberg, L.; Nordberg, G.F.; Sager, P.R. Biological Monitoring of Toxic Metals; Springer Science &Business Media: New York, NY, USA, 2012.
43. Sureda, A.; Bibiloni, M.M.; Julibert, A.; Aparicio-Ugarriza, R.; Blé, G.P.L.; Pons, A.; Gonzalez-Gross, M.;Tur, J.A. Trace element contents in toenails are related to regular physical activity in older adults. PLoS ONE
2017, 12. [CrossRef]44. WHO. Human Biomonitoring: Facts and Figures. Available online: http://www.euro.who.int/__data/assets/
pdf_file/0020/276311/Human-biomonitoring-facts-figures-en.pdf (accessed on 9 March 2020).45. Cabral-Pinto, M.M.; Inácio, M.; Neves, O.; Almeida, A.A.; Pinto, E.; Oliveiros, B.; da Silva, E.A.F. Human
health risk assessment due to agricultural activities and crop consumption in the surroundings of anindustrial area. Expos. Health 2019, 1–12. [CrossRef]
46. Yesavage, J.A.; Brink, T.L.; Rose, T.L.; Lum, O.; Huang, V.; Adey, M.; Leirer, O. Development and validationof a geriatric depression screening scale: A preliminary report. J. Psychiatr Res. 1983, 17, 37–49. [CrossRef]
47. Pocinho, M.T.S.; Farate, C.; Dias, C.A.; Lee, T.T.; Yesavage, J.A. Clinical and psychometric validation of thegeriatric depression scale (GDS) for portuguese elders. Clin. Gerontol. 2009, 32, 223–236. [CrossRef]
48. Simões, M.R.; Prieto, G.; Pinho, M.S.; Firmino, H. Geriatric Depression Scale (GDS-30). In Escalas e Testes
na Demência [Scales and Tests in Dementia], 3rd ed.; Simões, M.R., Isabel Santana e Grupo de Estudos deEnvelhecimento Cerebral e Demência, Eds.; Novartis: Lisboa, Portugal, 2015; pp. 128–133.
49. Folstein, M.; Folstein, S.; McHugh, P. Mini-mental state: A practical method for grading the cognitive state ofpatients for the clinician. J. Psychiatr. Res. 1975, 12, 189–198. [CrossRef]
50. Guerreiro, M.; Silva, A.P.; Botelho, M.A.; Leitão, O.; Castro-Caldas, A.; Garcia, C. Adaptação à populaçãoportuguesa da tradução do “Mini Mental State Examination” (MMSE). Rev. Port. Neurol. 1994, 1, 9.
51. Nasreddine, Z.S.; Phillips, N.A.; Bédirian, V.; Charbonneau, S.; Whitehead, V.; Collin, I.; Cummings, J.L.;Chertkow, H. The Montreal Cognitive Assessment, MoCA: A brief screening tool for Mild CognitiveImpairment. J. Am. Geriatr. Soc. 2005, 534, 695–699. [CrossRef] [PubMed]
52. Simões, M.R.; Freitas, S.; Santana, I.; Firmino, H.; Martins, C.; Nasreddine, Z.; Vilar, M. Montreal Cognitive
Assessment (MoCA): Versão Portuguesa [Montreal Cognitive Assessment (MoCA): Portuguese Version]; Serviço deAvaliação Psicológica da Faculdade de Psicologia e de Ciências da Educação da Universidade de Coimbra:Coimbra, Portugal, 2008.
53. Freitas, S.; Simões, M.R.; Alves, L.; Santana, I. The relevance of sociodemographic and health variables onMMSE normative data. Appl. Neuropsychol. Adult 2015, 22, 311–319. [CrossRef] [PubMed]
54. Freitas, S.; Simões, M.R.; Alves, L.; Santana, I. Montreal cognitive assessment: Influence of sociodemographicand health variables. Arch. Clin. Neuropsychol. 2012, 27, 165–175. [CrossRef] [PubMed]
55. Anderson, T.M.; Sachdev, P.S.; Brodaty, H.; Trollor, J.; Andrews, G. Effects of sociodemographic and healthvariables on minimental state exam scores in older Australians. Am. J. Geriatr. Psychiatry 2007, 15, 467–476.[CrossRef]
56. Bravo, G.; Hébert, R. Age and education specific reference values for the mini-mental and modifiedmini-mental state examination derived from a non-demented elderly population. Int. J. Geriatr. Psychiatry
1997, 12, 1008–1018. [CrossRef]57. Matallana, D.; Santacruz, C.; Cano, C.; Reyes, P.; Samper-Ternent, R.; Markides, K.S.; Ottenbacher, K.J.;
Reyes-Ortiz, C.A. The relationship between educational level and Mini-Mental State Examination domainsamong older Mexican Americans. J. Geriatr. Psych. Neur. 2011, 24, 9–18. [CrossRef]
58. Costa, C.; Jesus-Rydin, C. Site investigation on heavy metals contaminated ground in Estarreja—Portugal.Eng. Geol. 2001, 60, 39–47. [CrossRef]
59. Inácio, M.; Neves, O.; Pereira, V.; da Silva, E.F. Levels of selected potential harmful elements (PHEs) in soilsand vegetables used in diet of the population living in the surroundings of the estarreja chemical complex(Portugal). J. Appl. Geochem. 2014, 44, 38–44. [CrossRef]
61

Int. J. Environ. Res. Public Health 2020, 17, 6051
60. Patinha, C.; Reis, A.P.; Dias, A.C.; Abduljelil, A.A.; Noack, Y.; Robert, S.; Cave, M.; da Silva, E.F. The mobilityand human oral bioaccessibility of Zn and Pb in urban dusts of Estarreja (N Portugal). Environ. Geochem.
Health 2015, 37, 115–131. [CrossRef]61. Leitão, T.B.E. Metodologia Para A Reabilitação De Aquíferos Poluídos. Ph.D. Thesis, University of Lisbon,
Lisbon, Portugal, 1996.62. Van der Weijden, C.; Pacheco, F.A.L. Hydrogeochemistry in the Vouga River basin (central Portugal):
Pollution and chemical weathering. J. Appl. Geochem. 2006, 21, 580–613. [CrossRef]63. Ordens, C.M. Estudo Da Contaminacão Do Aquífero Superior Na Região De Estarreja. Master’s Thesis,
University of Coimbra, Coimbra, Portugal, 2007.64. Abreu, M.M.; Tavares, M.T.; Batista, M.J. Potential use of Erica andevalensis and Erica australis in
phytoremediation of sulphide mine environments: São Domingos, Portugal. J. Geochem. Explor. 2008, 96,210–222. [CrossRef]
65. Oliveira, J.S.; Farinha, J.; Matos, J.X.; Ávila, P.; Rosa, C.; Machado, M.J.C.; Daniel, F.S.; Martins, L.; Leite, M.R.M.Diagnóstico ambiental das principais áreas mineiras degradadas do país [Environmental diagnosis of themain degraded mining areas of the country]. Boletim Minas 2002, 39, 67–85.
66. Pérez-López, R.; Álvarez-Valero, A.M.; Nieto, J.M.; Sáez, R.; Matos, J.X. Use of sequential extraction procedurefor assessing the environmental impact at regional scale of the São Domingos Mine (Iberian Pyrite Belt).Appl. Geochem. 2008, 23, 3452–3463. [CrossRef]
67. Freitas, S.; Simões, M.R.; Alves, L.; Santana, I. Montreal Cognitive Assessment (MoCA): Normative study forthe Portuguese population. J. Clin. Exp. Neuropsychol. 2011, 33, 989–996. [CrossRef]
68. Bass, D.A.; Hickok, D.; Quig, D.; Urek, K. Trace element analysis in hair: Factors determining accuracy,precision, and reliability. Altern Med. Rev. 2001, 6, 472–481.
69. IBM Corp. IBM SPSS Statistics for Windows; Version 22.0; IBM Corp: Armonk, NY, USA, 2013.70. Freitas, S.; Simões, M.R.; Alves, L.; Santana, I. Mini Mental State Examination (MMSE): Normative study for
the Portuguese population in a community stratified sample. Appl. Neuropsychol. Adult 2015, 22, 311–319.[CrossRef]
71. Freitas, S.; Simões, M.R.; Alves, L.; Santana, I. Montreal cognitive assessment: Validation study for mildcognitive impairment and Alzheimer disease. Alzheimer Dis. Assoc. Disord. 2013, 27, 37–43. [CrossRef]
72. Freitas, S.; Simões, M.R.; Alves, L.; Duro, D.; Santana, I. Montreal Cognitive Assessment (MoCA): Validationstudy for frontotemporal dementia. J. Geriatr. Psychiatry Neurol. 2012, 25, 146–154. [CrossRef]
73. Freitas, S.; Simões, M.R.; Alves, L.; Vicente, M.; Santana, I. Montreal Cognitive Assessment (MoCA):Validation study for vascular dementia. J. Int. Neuropsychol. Soc. 2012, 18, 1031–1040. [CrossRef]
74. Rodushkin, I.; Axelsson, M.D. Application of double focusing sector field ICP-MS for multielementalcharacterization of human hair and nails. Part II. A study of the inhabitants of northern Sweden. Sci. Total
Environ. 2000, 262, 21–36. [CrossRef]75. Li, Y.; Zou, X.; Lv, J.; Yang, L.; Li, H.; Wang, W. Trace elements in fingernails of healthy chinese centenarians.
Biol. Trace Elem. Res. 2012, 145, 158–165. [CrossRef] [PubMed]76. Cohen, J. Statistical Power Analysis for the Behavioural Sciences, 2nd ed.; Academic Press: New York, NY, USA,
1988.77. Cohen, J. A power primer. Psychol. Bull. 1992, 112, 155–159. [CrossRef] [PubMed]78. Moraes, C.; Pinto, J.A.; Lopes, M.A.; Litvoc, J.; Bottino, C.M. Impact of sociodemographic and health variables
on mini-mental state examination in a community-based sample of older people. Eur. Arch. Psychiatry Clin.
Neurosci. 2010, 260, 535–542. [CrossRef] [PubMed]79. Gonçalves-Pereira, M.; Cardoso, A.; Verdelho, A.; da Silva, J.A.; de Almeida, M.C.; Fernandes, A.;
Raminhos, C.; Ferri, C.P.; Prina, M.; Prince, M. The prevalence of dementia in a Portuguese communitysample: A 10/66 Dementia Research Group study. BMC Geriatr. 2017, 17, 261. [CrossRef] [PubMed]
80. Hou, Y.; Dan, X.; Babbar, M.; Wei, Y.; Hasselbalch, S.G.; Croteau, D.L.; Bohr, V.A. Ageing as a risk factor forneurodegenerative disease. Nat. Rev. Neurol. 2019, 15, 565–581. [CrossRef]
81. Larson, E.B.; Yaffe, K.; Langa, K.M. New insights into the dementia epidemic. N. Engl. J. Med. 2013, 369,2275–2277. [CrossRef]
82. Kumar, S.; Trivedi, A.V. A review on role of nickel in the biological system. Int. J. Curr. Microbiol. Appl. Sci.
2016, 5, 719–727. [CrossRef]
62

Int. J. Environ. Res. Public Health 2020, 17, 6051
83. Song, X.; Kenston, S.S.F.; Kong, L.; Zhao, J. Molecular mechanisms of nickel induced neurotoxicity andchemoprevention. Toxicology 2017, 392, 47–54. [CrossRef]
84. Chen, Q.Y.; Brocato, J.; Laulicht, F.; Costa, M. Mechanisms of Nickel Carcinogenesis. In Essential and
Non-Essential Metals. Molecular and Integrative Toxicology; Mudipalli, A., Zelikoff, J., Eds.; Springer InternationalPublishing AG: New York, NY, USA, 2017; pp. 181–197. ISBN 978-3-319-55446-4.
85. Zambelli, B.; Uversky, V.N.; Ciurli, S. Nickel impact on human health: An intrinsic disorder perspective.Biochim. Biophys. Acta Proteins Proteom. 2016, 1864, 1714–1731. [CrossRef]
86. Poonkothai, M.; Vijayavathi, B.S. Nickel as an essential element and a toxicant. Int. J. Eng. Sci. Technol. 2012,1, 285–288.
87. Zhao, J.; Shi, X.; Castranova, V.; Ding, M. Occupational toxicology of nickel and nickel compounds. J. Environ.
Pathol. Toxicol. Oncol. 2009, 28, 177–208. [CrossRef] [PubMed]88. Genchi, G.; Carocci, A.; Lauria, G.; Sinicropi, M.S.; Catalano, A. Nickel: Human health and environmental
toxicology. Int. J. Environ. Res. Public Health 2020, 17, 679. [CrossRef] [PubMed]89. Ijomone, O.M.; Okori, S.O.; Ijomone, O.K.; Ebokaiwe, A.P. Sub-acute nickel exposure impairs behavior, alters
neuronal microarchitecture, and induces oxidative stress in rats’ brain. Drug Chem. Toxicol. 2018, 41, 377–384.[CrossRef] [PubMed]
90. Ijomone, O.M.; Olatunji, S.Y.; Owolabi, J.O.; Naicker, T.; Aschner, M. Nickel-induced neurodegeneration inthe hippocampus, striatum and cortex; an ultrastructural insight, and the role of caspase-3 and α-synuclein.J. Trace Elem. Med. Biol. 2018, 50, 16–23. [CrossRef]
91. Weekley, C.M.; Harris, H.H. Which form is that? The importance of selenium speciation and metabolism inthe prevention and treatment of disease. Chem. Soc. Rev. 2013, 42, 8870–8894. [CrossRef]
92. Vinceti, M.; Grill, P.; Malagoli, C.; Filippini, T.; Storani, S.; Malavolti, M.; Michalke, B. Selenium speciation inhuman serum and its implications for epidemiologic research: A cross-sectional study. J. Trace Elem. Med.
Biol. 2015, 31, 1–10. [CrossRef]93. Marschall, T.A.; Bornhorst, J.; Kuehnelt, D.; Schwerdtle, T. Differing cytotoxicity and bioavailability of
selenite, methylselenocysteine, selenomethionine, selenosugar 1 and trimethylselenonium ion and theirunderlying metabolic transformations in human cells. Mol. Nutr. Food Res. 2016, 60, 2622–2632. [CrossRef]
94. Labunskyy, V.M.; Hatfield, D.L.; Gladyshev, V.N. Selenoproteins: Molecular pathways and physiologicalroles. Physiol. Rev. 2014, 94, 739–777. [CrossRef]
95. Vinceti, M.; Filippini, T.; Wise, L.A. Environmental selenium and human health: An update. Curr. Environ.
Health Rep. 2018, 5, 464–485. [CrossRef]96. Rayman, M.P. Selenium intake, status, and health: A complex relationship. Hormones 2020, 19, 9–14.
[CrossRef]97. Varikasuvu, S.R.; Prasad, S.; Kothapalli, J.; Manne, M. Brain selenium in Alzheimer’s disease (BRAIN SEAD
study): A systematic review and meta-analysis. Biol. Trace Elem. Res. 2019, 189, 361–369. [CrossRef][PubMed]
98. Cardoso, B.R.; Roberts, B.R.; Bush, A.I.; Hare, D.J. Selenium, selenoproteins and neurodegenerative diseases.Metallomics 2015, 7, 1213–1228. [CrossRef] [PubMed]
99. Robberecht, H.; De Bruyne, T.; Davioud-Charvet, E.; Mackrill, J.; Hermans, N. Selenium status in elderlypeople: Longevity and age-related diseases. Curr. Pharm. Des. 2019, 25, 1694–1706. [CrossRef] [PubMed]
100. Berr, C.; Balansard, B.; Arnaud, J.; Roussel, A.M.; Alpérovitch, A.; EVA Study Group. Cognitive decline isassociated with systemic oxidative stress: The EVA study. J. Am. Geriat. Soc. 2000, 48, 1285–1291. [CrossRef][PubMed]
101. Garcia, T.; Esparza, J.L.; Nogués, M.R.; Romeu, M.; Domingo, J.L.; Gómez, M. Oxidative stress status andRNA expression in hippocampus of an animal model of Alzheimer’s disease after chronic exposure toaluminum. Hippocampus 2010, 20, 218–225. [CrossRef]
102. McGeer, P.L.; Rogers, J.; McGeer, E.G. Inflammation, antiinflammatory agents, and Alzheimer’s disease: Thelast 22 years. J. Alzheimers Dis. 2016, 54, 853–857. [CrossRef]
103. Lin, T.; Liu, G.A.; Perez, E.; Rainer, R.D.; Febo, M.; Cruz-Almeida, Y.; Ebner, N.C. Systemic inflammationmediates age-related cognitive deficits. Front Aging Neurosci. 2018, 10, 236. [CrossRef]
104. Savaskan, N.E.; Bräuer, A.U.; Kühbacher, M.; Eyüpoglu, I.Y.; Kyriakopoulos, A.; Ninnemann, O.; Behne, D.;Nitsch, R. Selenium deficiency increases susceptibility to glutamate-induced excitotoxicity. FASEB J. 2003, 17,112–114. [CrossRef]
63

Int. J. Environ. Res. Public Health 2020, 17, 6051
105. Prabhu, K.S.; Zamamiri-Davis, F.; Stewart, J.B.; Thompson, J.T.; Sordillo, L.M.; Reddy, C.C. Seleniumdeficiency increases the expression of inducible nitric oxide synthase in RAW 264.7 macrophages: Role ofnuclear factor-κB in up-regulation. Biochem. J. 2002, 366, 203–209. [CrossRef]
106. Schweizer, U.; Schomburg, L. Selenium, selenoproteins and brain function. In Selenium; Hatfield, D.L.,Berry, M.J., Gladyshev, V.N., Eds.; Springer: Boston, MA, USA, 2006; pp. 233–248. ISBN 978-0-387-33827-9.
107. Pitts, M.W.; Kremer, P.M.; Hashimoto, A.C.; Torres, D.J.; Byrns, C.N.; Williams, C.S.; Berry, M.J. Competitionbetween the brain and testes under selenium-compromised conditions: Insight into sex differences inselenium metabolism and risk of neurodevelopmental disease. J. Neurosci. 2015, 35, 15326–15338. [CrossRef]
108. Berr, C. Cognitive impairment and oxidative stress in the elderly: Results of epidemiological studies.Biofactors 2000, 13, 205–209. [CrossRef] [PubMed]
109. Berr, C.; Arnaud, J.; Akbaraly, T.N. Selenium and cognitive impairment: A brief-review based on resultsfrom the EVA study. Biofactors 2012, 38, 139–144. [CrossRef] [PubMed]
110. Cardoso, B.R.; Ong, T.P.; Jacob-Filho, W.; Jaluul, O.; Freitas, M.I.Á.; Cozzolino, S.M.F. Nutritional status ofselenium in Alzheimer’s disease patients. Br. J. Nutr. 2010, 103, 803–806. [CrossRef] [PubMed]
111. Gao, S.; Jin, Y.; Hall, K.S.; Liang, C.; Unverzagt, F.W.; Ji, R.; Murrell, J.R.; Cao, J.; Shen, J.; Ma, F.; et al. Seleniumlevel and cognitive function in rural elderly Chinese. Am. J. Epidemiol. 2007, 165, 955–965. [CrossRef]
112. Reddy, V.S.; Bukke, S.; Dutt, N.; Rana, P.; Pandey, A.K. A systematic review and meta-analysis of thecirculatory, erythrocellular and CSF selenium levels in Alzheimer’s disease: A metal meta-analysis (AMMAstudy-I). J. Trace Elem. Med. Biol. 2017, 42, 68–75. [CrossRef]
113. Gao, S.; Jin, Y.; Hall, K.S.; Liang, C.; Unverzagt, F.W.; Ma, F.; Cheng, Y.; Shen, J.; Cao, J.; Matesan, J.; et al.Selenium level is associated with apoE ε4 in rural elderly Chinese. Public Health Nutr. 2009, 12, 2371–2376.[CrossRef]
114. Vinceti, M.; Chiari, A.; Eichmüller, M.; Rothman, K.J.; Filippini, T.; Malagoli, C.; Weuve, J.; Tondelli, M.;Zamboni, G.; Nichelli, F.; et al. A selenium species in cerebrospinal fluid predicts conversion to Alzheimer’sdementia in persons with mild cognitive impairment. Alzheimers Res. Ther. 2017, 9, 100. [CrossRef]
115. McClain, C.J.; McClain, M.; Barve, S.; Boosalis, M.G. Trace metals and the elderly. Clin. Geriatr. Med. 2002,18, 801–818. [CrossRef]
116. Cardoso, B.R.; Bandeira, V.S.; Jacob-Filho, W.; Cozzolino, S.M.F. Selenium status in elderly: Relation tocognitive decline. J. Trace Elem. Med. Biol. 2014, 28, 422–426. [CrossRef]
117. Forte, G.; Deiana, M.; Pasella, S.; Baralla, A.; Occhineri, P.; Mura, I.; Madeddu, R.; Muresu, E.; Sotgia, S.;Zinellu, A.; et al. Metals in plasma of nonagenarians and centenarians living in a key area of longevity. Exp.
Gerontol. 2014, 60, 197–206. [CrossRef]118. Alis, R.; Santos-Lozano, A.; Sanchis-Gomar, F.; Pareja-Galeano, H.; Fiuza-Luces, C.; Garatachea, N.; Lucia, A.;
Emanuele, E. Trace elements levels in centenarian ‘dodgers’. J. Trace Elem. Med. Biol. 2016, 35, 103–106.[CrossRef] [PubMed]
119. Xu, J.W.; Shi, X.M.; Yin, Z.X.; Liu, Y.Z.; Zhai, Y.; Zeng, Y. Investigation and analysis of plasma trace elementsof oldest elderly in longevity areas in China. Zhonghua Yu Fang Yi Xue Za Zhi 2010, 44, 119–122. [PubMed]
120. Cai, Z.; Zhang, J.; Li, H. Selenium, aging and aging-related diseases. Aging Clin. Exp. Res. 2018, 1–13.[CrossRef] [PubMed]
121. INE. Tábuas de Mortalidade em Portugal [Mortality Tables in Portugal]. Availableonline: https://www.ine.pt/xportal/xmain?xpid=INE&xpgid=ine_destaques&DESTAQUESdest_boui=354096866&DESTAQUESmodo=2&xlang=pt (accessed on 2 April 2020).
© 2020 by the authors. Licensee MDPI, Basel, Switzerland. This article is an open accessarticle distributed under the terms and conditions of the Creative Commons Attribution(CC BY) license (http://creativecommons.org/licenses/by/4.0/).
64
International Journal of
Environmental Research
and Public Health
Article
Fine Particulate Matter and Gaseous Compounds inKitchens and Outdoor Air of Different Dwellings
Célia Alves 1,* , Ana Vicente 1, Ana Rita Oliveira 1, Carla Candeias 2,* , Estela Vicente 1,
Teresa Nunes 1 , Mário Cerqueira 1 , Margarita Evtyugina 1, Fernando Rocha 2 and
Susana Marta Almeida 3
1 Centre for Environmental and Marine Studies (CESAM), Department of Environment, University of Aveiro,3810-193 Aveiro, Portugal; [email protected] (A.V.); [email protected] (A.R.O.);[email protected] (E.V.); [email protected] (T.N.); [email protected] (M.C.); [email protected] (M.E.)
2 Geobiosciences, Geotechnologies and Geoengineering Research Centre (GeoBioTec), Department ofGeosciences, University of Aveiro, 3810-193 Aveiro, Portugal; [email protected]
3 Centre for Nuclear Sciences and Technologies (C2TN), Instituto Superior Técnico, University of Lisbon,Estrada Nacional 10, 2695-066 Bobadela, Portugal; [email protected]
* Correspondence: [email protected] (C.A.); [email protected] (C.C)
Received: 19 June 2020; Accepted: 16 July 2020; Published: 21 July 2020
Abstract: Passive diffusion tubes for volatile organic compounds (VOCs) and carbonyls and lowvolume particulate matter (PM2.5) samplers were used simultaneously in kitchens and outdoor air offour dwellings. PM2.5 filters were analysed for their carbonaceous content (organic and elementalcarbon, OC and EC) by a thermo-optical technique and for polycyclic aromatic hydrocarbon (PAHs)and plasticisers by GC-MS. The morphology and chemical composition of selected PM2.5 sampleswere characterised by SEM-EDS. The mean indoor PM2.5 concentrations ranged from 14 µg m−3 to30 µg m−3, while the outdoor levels varied from 18 µg m−3 to 30 µg m−3. Total carbon representedup to 40% of the PM2.5 mass. In general, the indoor OC/EC ratios were higher than the outdoorvalues. Indoor-to-outdoor ratios higher than 1 were observed for VOCs, carbonyls and plasticisers.PAH levels were much higher in the outdoor air. The particulate material was mainly composed ofsoot aggregates, fly ashes and mineral particles. The hazard quotients associated with VOC inhalationsuggested a low probability of non-cancer effects, while the cancer risk was found to be low, but notnegligible. Residential exposure to PAHs was dominated by benzo[a]pyrene and has shown to posean insignificant cancer risk.
Keywords: dwellings; indoor/outdoor; VOCs; carbonyls; PM2.5; OC/EC; morphology; PAHs
1. Introduction
We spend most of our time in indoor environments. As building infrastructures are increasinglyairtight to save energy, epidemiological studies need to understand the extent to which outdoorlevels of air pollutants persist as a determining factor of exposure and, consequently, of health in theindoor environment. Many of the outdoor pollutants are also prevalent within homes, contributingto unhealthy air. Kitchens are spaces not only for preparing meals, but also for socialising withfamily and friends, and where children often do their homework, and most of us watch television.The kitchen is indeed the heart of the home. Places where meals are made and eaten are consideredmicroenvironments with specific characteristics [1]. After the bedroom, this indoor area is probablythe room people spend the most time in. Air quality in a kitchen is influenced by many factors,such as the method of meal preparation and ingredients used, the cooking style, the temperature ofthe cooking process, the volume of the room, the efficiency of the exhaust hood, and the number of
65

Int. J. Environ. Res. Public Health 2020, 17, 5256
persons using the space [1–3]. However, in developing countries wood stove emissions are the maincause of kitchen-related air pollution in many deprived homes [4–6]. Nearly 3 billion people use solidfuels, especially biomass and coal, for cooking and heating and this number will continue to rise in thenext decade [5] (and references therein). Since biomass-burning cookstoves are a noteworthy sourceof carbonaceous aerosols and gaseous compounds, this source of pollution has received increasingattention because emissions greatly contribute to the global burden of disease [5,7–13]. Estimatesby the World Health Organisation (WHO) indicate that exposure to air pollution from cooking withsolid fuels contribute to more than four million annual premature deaths globally, half a million ofwhich are children under the age of 5 who die of pneumonia [14]. Emissions from biomass-burningcookstoves encompass products of incomplete combustion, such as volatile organic compounds (VOCs)and particulate matter with an aerodynamic diameter less than or equal to 2.5 µm (PM2.5), which canpenetrate deeply into the alveolar sacs, where they can deposit and be absorbed, contributing to theentry of toxic substances into the bloodstream, including carcinogenic polycyclic aromatic hydrocarbons(PAHs) [15].
In the last two years, a substantial number of research articles has been published with the objectiveof documenting the indoor air quality in kitchens with low-efficiency biomass cookers, especially inunderdeveloped countries. Some of these articles aimed at comparing emissions from traditionalbiomass stoves for household cooking with those from improved cookstoves [16–33]. In developedcountries, in most cases, gas or electric stoves/cookers are used for meal preparation. Furthermore,a ventilation system mounted directly over the cooker/stove is an essential element in every kitchento reduce the transport of odours and pollutants to neighbouring rooms. However, despite thepollutant levels in well-equipped modern kitchens are reportedly much lower, studies on this typeof microenvironment are scarce and mostly focused on gaseous contaminants [34–38]. The WHOconcluded that there is no convincing evidence of a difference in the hazardous nature of particulatematter from indoor sources as compared with those from outdoors and that the indoor levels are usuallyhigher than the outdoor levels [39]. Continuous pressure to re-evaluate air quality standards stemsfrom studies that have observed effects at low levels of particulate matter. These studies have suggestedthat, instead of mass concentration, some chemical components (e.g. carbonaceous compounds) maybe a better metric for estimating the health risks [40]. A better understanding of indoor air pollutants,their levels and sources in specific microenvironments can help in adopting more efficient managementstrategies and mitigation measures to reduce health risks from exposure to PM2.5 and associatedtoxic constituents.
This study is based on a multi-pollutant monitoring campaign carried out in four biomass-freekitchens, for which studies are comparatively much scarcer, in order to answer the following questions:Are there significant differences in pollutant levels between modern kitchens equipped with gas rangesor electric hobs? Do the observed levels and compounds depend on housing factors or outdoor air?Are the risks resulting from inhalation of pollutants (VOCs and PM2.5-bond PAHs) routinely consideredby international agencies of concern to health? Are these metrics sufficient to infer sources and effectsor can the particle morphological analysis give us additional indications? The aim of this pilot study isnot only to characterise air quality in a poorly studied microenvironment, such as kitchens, but also todraw lessons for conducting wider researches in the future.
2. Methodologies
2.1. Sampling and Analysis
A monitoring programme involving four kitchens with different characteristics (Table 1) and therespective outdoor air was conducted in the region of Aveiro, Portugal, in October and November 2017.Along with the neighbouring city of Ílhavo, Aveiro is part of an urban agglomeration that includes120,000 inhabitants. Aveiro is located on the Atlantic coast, in the Central Region, at about 250 km to
66

Int. J. Environ. Res. Public Health 2020, 17, 5256
the North of Lisbon and 70 km to the South of Oporto. It is surrounded by beaches and by an extensivecoastal lagoon.
Table 1. Characterisation of dwellings and sampling details.
Characteristics House 1 House 2 House 3 House 4
Location Ílhavo Aveiro Aveiro Aveiro
Area Periurban/rural Urban Suburban Urban
Type of dwelling
Detached housewith lawn and
extensivevegetable garden
City centreapartment with
permanentoccupancy
Detached house onthe outskirts, withsmall garden, neara main road with
intense traffic
Terraced house in aresidential
neighbourhood,near a main road
with intense traffic
Kitchen area (m2) 24.5 16.5 15.4 20.2
Number ofpermanentoccupants
3 3 3 4
Number of dailyoccupancy hours 15 24 15 17
Smokers No No No No
Pets 1 dog, 1 cat No No No
Source of energyfor cooking Gas Gas Electricity Electricity
Ventilation Natural Natural Natural Natural
Range hood Under cabinet Under cabinet Under cabinet Under cabinet
PM2.5 samplingequipment TCR Tecora MiniVol TCR Tecora MiniVol
Number of samples 10 (indoor)10 (outdoor)
7 (indoor)7 (outdoor)
10 (indoor)10 (outdoor)
7 (indoor)7 (outdoor)
Sampling period 16/10/2017 to05/11/2017
16/10/2017 to06/11/2017 06 to 26/11/2017 07 to
28/11/2017
Low volume samplers were used to collect particulate matter (PM2.5) onto 47 mm diameter quartzfilters. ECHO PM samplers (TCR Tecora, Cogliate, Italy) operating at 38.3 L min−1 were deployed intwo residences, in which ten pairs of PM2.5 samples were collected for periods of 48 h. MiniVolTM
TAS samplers (Airmetrics, Springfield, OR, USA) were used in the other two dwellings, in whichseven pairs of PM2.5 samples were collected for periods of 72 h at a flow of 5 L min−1. In the kitchens,the samplers were positioned near the dining tables in a central location. Outside, the equipment wasplaced on the porch, terrace or balcony adjacent to the kitchens. VOCs and carbonyls were sampled inparallel, also indoors and outdoors, using Radiello® (Merck, Darmstadt, Germany) diffusive passivetubes (cartridges codes 145 and 165, respectively) in triplicate. Two consecutive samplings, each lasting10 days, were performed at each site. VOCs were analysed by thermal desorption coupled to gaschromatography-mass at the Istituti Clinici Scientifici Maugeri (Pavia, Italy). The carbonyl-DNPHderivatives were analysed at the University of Aveiro by eluting with 2 mL of acetonitrile poureddirectly into the cartridge and stirring from time to time for 30 min. The extracts were filtered and thenanalysed in a high-performance liquid chromatography system (Jasco, Cremella, Italy) equipped witha PU- 980 pump, also from Jasco (Cremella, Italy), a manual injection valve (20 µL loop, Rheodyne,Rohnert Park, CA, USA), a Supelcosil LC-18 column (250×4.6 mm; 5 µm; Supelco, Darmstadt, Germany)and a Jasco MD-1510 diode array detector (Cremella, Italy). The elution was performed with an
67

Int. J. Environ. Res. Public Health 2020, 17, 5256
isocratic mixture of acetonitrile and water (60:40), with a flow rate of 1.5 mL min−1. External calibrationcurves in six concentration levels were constructed from standard solutions.
The gravimetric quantification of PM2.5 was performed on a RADWAG MYA 5/2Y/F (Radom,Poland) microbalance with an accuracy of 1 µg in a humidity (50 ± 5%) and temperature (20 ± 1 C)controlled room. Filter weights were obtained from the average of six consecutive measurements withvariations between them of less than 0.02%. The carbonaceous content (organic and elemental carbon,OC and EC) of PM2.5 samples was analysed by a thermal-optical transmission technique. At least,two replicate analyses were performed for each filter. In each analytical run, two 9 mm punchesare first heated in a non-oxidising atmosphere of N2 in order to volatilise the carbonaceous organiccompounds. After the first step of controlled heating, the remaining carbonaceous fraction is burnt inan oxygen-containing gas mixture. During anoxic heating, some OC is pyrolysed (PC), and quantifiedas EC in the second stage of heating. The minimise the bias in the OC/EC split, the blackening of thefilter is continuously monitored by a laser beam and a photodetector, which allows reading the lighttransmittance. OC and EC are measured in the form of CO2 by an infrared non-dispersive analyser.
For chemical and morphological characterisation, the filters with the lowest and highestconcentration in each kitchen and the respective outdoor pairs were chosen. Two 5 mm diameterpunches were cut from each of these filters. A Hitachi S-4100 scanning electron microscope (SEM)coupled to a Bruker Quantax 400 Energy Dispersive Spectrometer (EDS) (Bonsai Advanced, Madrid,Spain) was employed.
Since several punches were removed from each filter for analysis of the carbonaceous materialand for morphological characterisation, the remaining area did not contain enough mass for thequantification of PAHs. Thus, for each site, the leftover area of the various filters was combinedand extracted together to obtain an “average” of the concentrations. Each set of filters was extractedthree times with dichloromethane (DCM) in an ultrasonic bath (25 mL for 15 min, each extraction,with 5 min stops between them). After each extraction, the 3 DCM organic extracts of each compositesample were combined, filtered through pre-cleaned cotton and concentrated to a volume of 0.5 mLusing a Turbo Vap®II evaporation system (Biotage, Charlotte, NC, USA). The concentrated sampleswere transferred into vials and dried under a gentle nitrogen stream. The extracts were analysedin a gas chromatographer-mass spectrometer (GC-MS) from Agilent (Santa Clara, CA, USA) withsingle quadrupole. The chromatographic system (GC model 7890B, MS model 5977A) was equippedwith a CombiPAL autosampler (Agilent, Santa Clara, CA, USA) and a TRB-5MS (60 m × 0.25 mm ×0.25 µm) column (Teknokroma, Barcelona, Spain). The quantitative analysis was performed by singleion monitoring (SIM). Blank filters were analysed in the same way to obtain blank-corrected results.Data were acquired in the electron impact (EI) mode (70 eV). The oven temperature programme was asfollows: 60 C (1 min), 60 to 150 C (10 C min−1), 150 to 290 C (5 C min−1), 290 C (30 min) and usinghelium as carrier gas at 1.2 mL min−1. The following mixture of deuterated internal standards (IS) wasused to quantify PAHs: 1,4-dichlorobenzene-d4, naphtalene-d8, acenaphthene-d10, phenanthrene-d10,chrysene-d12, perylene-d12, fluorene-d10 and benzo[a]pyrene-d12 (Supelco). In the case of plasticisers,deuterated diethyl phthalate-3,4,5,6-d4 and bis (2-ethylhexyl) phthalate-3,4,5,6-d4 (Supelco) were usedas IS. Calibrations were performed with authentic standards (Sigma-Aldrich, St. Louis, MO, USA) ateight different concentration levels.
2.2. Data Analysis
For the statistical treatment, SPSS (IBM Statistics Software V.25, Armonk, NY, USA) was used.The normality of the data was assessed by the Shapiro-Wilk test. The Mann-Witney non-parametrictest was applied to obtain the statistically significant differences with a significance of 0.05 (TablesS1–S4). Uncertainties of measurements were estimated as 5/6 times the method detection limit, which isa common procedure adopted in factor analysis. On average, the absolute uncertainties for PM2.5,OC and EC were 0.40, 0.14 and 0.13 µg m−3, which correspond to relative errors of 1.4–2.9%, 1.8–4.4%and 2.0–5.8%, respectively. For organic compounds, depending on the PAH or plasticiser, uncertainties
68

Int. J. Environ. Res. Public Health 2020, 17, 5256
were estimated to be in the range from 1.2 to 25 pg m−3, accounting for relative errors of 1.3–5.2%.In the case of volatile organic compounds, individual uncertainties were always < 0.1 µg m−3 withrelative errors ranging from 0.28 to 6.6%.
2.3. Health Risk Assessment
To estimate the risk associated with inhalation of pollutants, the methodology proposed bythe United States Protection Agency (USEPA), and extensively described in the literature (e.g.) [41],was followed. The assessment refers only to the period at home, since information on the time spent atwork or other microenvironments or outdoors was not available. Given that several studies suggest thatthere are no significant differences between the levels in the various subcompartments of the residentialdwelling (e.g.) [42,43], measurements in the kitchens were taken as representative of exposure at home.To account for the permanence in each household, time-adjusted concentrations (Ei) were calculatedusing the following equation:
Ei =∑
j
Cijtj ×EFNY×
EDAL
(1)
where Ei is the time-weighted daily personal exposure to compound i (µg m−3), Cij is the measuredconcentration of compound i (µg m−3) in each household, tj is the time fraction spent at home, EF isthe exposure frequency (350 days/year considering that people spend 15 days on vacation away fromhome), NY is the number of days per year (365 days/year), ED is the exposure duration (30 years),and AL is the average lifetime (70 years).
The inhalation unit risk (IUR) is the excess cancer risk resulting from continuous exposure to aunit increase of a compound via inhalation. IUR values listed in Table 2 are derived from previousstudies by the USEPA for the general population with a default body weight of 70 kg and a defaultinhalation rate of 20 m3 day−1. The chronic inhalation cancer risk (CR) is the increased probability ofdeveloping cancer as a result of a specific exposure to a certain compound. CR is calculated using thefollowing equation:
CRi = Ei × IURi (2)
Cancer risks < 1 in a million are considered negligible, whereas values above 1.0 × 10⁻⁴ areclassically considered of concern.
The inhalation non-cancer risk is estimated as follows:
HQi = Ei/RfCi (3)
where HQi is the hazard quotient of compound i, and RfCi is the chronic reference concentration ofcompound i in µg m−3 (Table 2). The hazard index (HI) is the summation of non-cancer risks frommultiple compounds. Values higher than 1 express a chance that non-carcinogenic effects may happen,whilst values below 1 indicate low or no risk of non-carcinogenic effects on humans.
Table 2. Toxicity parameters for VOCs provided by the Office of Environmental Health HazardAssessment (OEHHA) and Integrated Risk Information System (IRIS) of USEPA (n.a.—not available).
Compound. IUR (µg m−3) −1 RfC (µg m−3)
Benzene 2.2 × 10⁻⁶ 30Toluene n.a. 5 × 10³
Xylenes n.a. 100Ethylbenzene 2.5 × 10⁻⁶ 1 × 10³
Styrene 1.63 × 10⁻⁷ 900Tetrachloroethylene 2.6 × 10⁻⁷ 401,4-Dichlorobenzene 1.1 × 10⁻⁵ 800
Formaldehyde 1.3 × 10⁻⁵ 9Acetaldehyde 2.7 × 10⁻⁶ 9
69

Int. J. Environ. Res. Public Health 2020, 17, 5256
The carcinogenic risk due to exposure to PAHs is based on benzo[a]pyrene equivalentconcentrations (BaPeq). These are calculated multiplying the individual PAH concentrations bytheir toxic equivalent factor (TEF) [44]. The inhalation cancer unit risk of BaP is 1.11 × 10⁻⁶ (ng m−3) −1.It is estimated from the cancer potency factor (CPF) using the following equation:
IUR = CPF × 20 m3/(70 kg × 106) (4)
where inhalation unit risk (IUR) represents the excess cancer risk associated with an exposure to aconcentration of 1 µg m−3, CPF (equal to 3.9 (mg/kg-day) −1 for BaP) indicates the excess cancer riskfor an exposure to 1 mg of a compound per kg of body weight (70 kg), 20 m3 is the default inhalationrate per day, and 106 is the conversion factor from mg to ng. The excess cancer risk for a receptorexposed to PAHs via the inhalation pathway can be estimated by equation 2, where Ei represents thetime-weighted daily personal exposure to the sum of BaPeq concentrations.
3. Results and Discussion
3.1. Carbonyls and Volatile Organic Compounds
Formaldehyde (HCHO) and acetaldehyde (CH3CHO) are highly reactive carbonyl compoundsthat are normally found in both indoor and outdoor environments. Formaldehyde is emitted by variousbuilding and insulating materials, some consumer products (e.g. disinfectants and cosmetics), carpets,fabrics and new furniture, principally if made of plywood [45,46]. In indoor environments, combustionprocesses, including tobacco smoking, also emit large amounts of these compounds. Acetaldehydeis also present in various consumer products such as deodorants, and in many foods and alcoholicdrinks [45], which can represent emission sources in kitchens.
Indoor and outdoor formaldehyde concentrations were 7.61 ± 3.08 and 1.49 ± 0.67 µg m−3,respectively, whilst the corresponding acetaldehyde levels were 7.94 ± 4.63 and 0.41 ± 0.36 µg m−3
(Table 3).
Table 3. Comparison of carbonyl concentrations (µg m−3) obtained in the present study with thosereported for other places.
Location Environment Formaldehyde Acetaldehyde Reference
Aveiro region, PortugalKitchens 7.61 ± 3.08 7.94 ± 4.63 Present
studyOutdoor 1.49 ± 0.67 0.41 ± 0.36
61 flats in Paris, France Kitchens 21.7 ± 1.9 10.1 ± 1.8 [42]
Dwellings in Bari, ItalyKitchens 16.0 ± 8.0 10.7 ± 8.8
[45]Outdoor 4.4 ± 1.7 3.4 ± 2.0
59 homes in Prince EdwardIsland, Canada Not provided 5.5–87.5
(median 29.6)4.4–79.1
(median 29.6) [46]
Shiraz, IranOutdoor-summer 15.1 ± 9.17 8.40 ± 4.29
[47]Outdoor-winter 8.57 ± 5.91 3.52 ± 1.69
Formaldehyde levels in the kitchen of the detached house on the outskirts were found tobe statistically different (p < 0.0146) from those in houses 1 (rural) and 2 (city centre apartment).The acetaldehyde levels of house 2 differed significantly from the values obtained in house 1 (p = 0.0224).Concentrations in kitchens were much higher than those observed outdoors. Statistically significantdifferences between the values of the indoor and outdoor environments were registered (p = 0.0001for formaldehyde, p = 0.0004 for acetaldehyde, α = 0.05). These carbonyls are known to be irritantsof the eyes and upper airways. Formaldehyde is a known human carcinogen [48]. In the presentstudy, its concentrations never exceeded the protection limit of 100 µg m−3 imposed by the Portuguese
70

Int. J. Environ. Res. Public Health 2020, 17, 5256
legislation. Acetaldehyde was incorporated by the WHO in Group 2, which comprises pollutantsof potential interest, but additional investigation would be needed before it is clear whether there isenough evidence to warrant their inclusion in the guidelines. Based on studies of short- and long-termexposure, countries such as Canada have set a maximum daily limit of 280 µg m−3. An extended reviewof formaldehyde concentrations worldwide in all types of indoor environments has been compiledby Salthammer et al. [49]. In a study carried out in dwelling in Bari, Italy, indoor formaldehydeand acetaldehyde concentrations were found to be significantly higher than outdoor concentrations.No significant relation was observed by the authors between the levels of aldehydes in the kitchensand the age or restoration of the building, the time windows or balcony doors were kept open or thetime the burners were kept alight [45]. These two carbonyl compounds were also assessed in threeprincipal rooms of 61 flats in Paris [42]. Statistically, the levels monitored in the kitchens did not differfrom those registered in bedrooms and living rooms.
Many of the sources that contribute to carbonyls are also emitters of other VOCs. A few of theseVOCs, such as benzene, are designated by multiple authorities as human carcinogens. Short- andlong-term exposures can affect many organs and cause multiple symptoms [50]. In the present study,for most compounds, all the kitchens registered indoor-to-outdoor VOC concentration ratios higherthan one, proving the strong contribution of endogenous emission sources. Statistically significantdifferences were found between indoor and outdoor levels of toluene (p = 0.0236), ethylbenzene(p = 0.0397), m + p-xylene (p = 0.0273), styrene (p = 0.005), o-xylene (p = 0.0500) and α-pinene(p = 0.0001). The dwelling with the most significant differences for a greater number of compoundscompared to the others was the permanently occupied apartment, where an elderly woman whoneeds nursing care at home resides. The concentrations of VOCs in the four dwellings are withinthe wide range of values measured in homes of several other regions [41,43,51–53], although closerto the lower levels. The indoor concentrations of benzene, trichloroethylene, toluene, styrene andtetrachloroethylene were well below the thresholds laid down by the national regulation (Table 4).
Table 4. Minimum, maximum and mean values for VOC concentrations and I/O ratios, and legal limits.
VOCIndoor Concentration
Range and Meanµg m−3
Indoor-to-OutdoorRatio
Threshold by the PortugueseLegislation [54]
µg m−3
Benzene 0.78–3.3 (1.6) 0.39–1.3 (0.68) 5Ethylbenzene 0.87–6.6 (2.4) 1.1–7.4 (2.9)
Toluene 4.1–21.6 (9.4) 1.1–4.6 (2.3) 250m + p-xylene 2.7–20.2 (7.6) 1.1–7.6 (3.1)
o-Xylene 1.0–8.9 (3.1) 0.97–8.0 (3.0)Styrene 0.33–1.6 (1.0) 1.5–5.0 (3.5) 260
1,4-Dichlorobenzene <0.10–1.2 (0.38) 25Trichloroethylene <0.10
Tetrachloroethylene 0.30–2.9 (0.96) 0.56–1.2 (0.89) 250α-Pinene 2.9–17.4 (9.5) 16.4–152 (71.1)
Indoors, benzene, toluene, ethylbenzene and xylenes (BTEX) were highly correlated with eachother (r2 from 0.64 to 1.0), suggesting common emission sources. Outdoors, toluene, ethylbenzeneand xylenes correlated well (r2 from 0.73 to 0.97), but the relationships involving benzene wereweaker. However, the indoor concentrations of the various compounds did not correlate with therespective outdoor levels, indicating that the emitting sources in the kitchens are different from thoseobserved outside. The only exceptions were tetrachlorethylene (r2 = 0.95) and styrene (r2 = 0.68).Tetrachlorethylene is mainly used for dry cleaning of fabrics, whereas styrene occurs naturally insmall amounts in some plants and foods, such as peanuts, cinnamon, and coffee beans, although itis mostly used to make products such as food containers, rubber, plastic, carpet backing, insulation,fiberglass, pipes, and automobile parts. The highest indoor concentration was generally observedfor α-pinene, followed by toluene and m + p-xylene. α-Pinene concentrations were 16 to 152 times
71
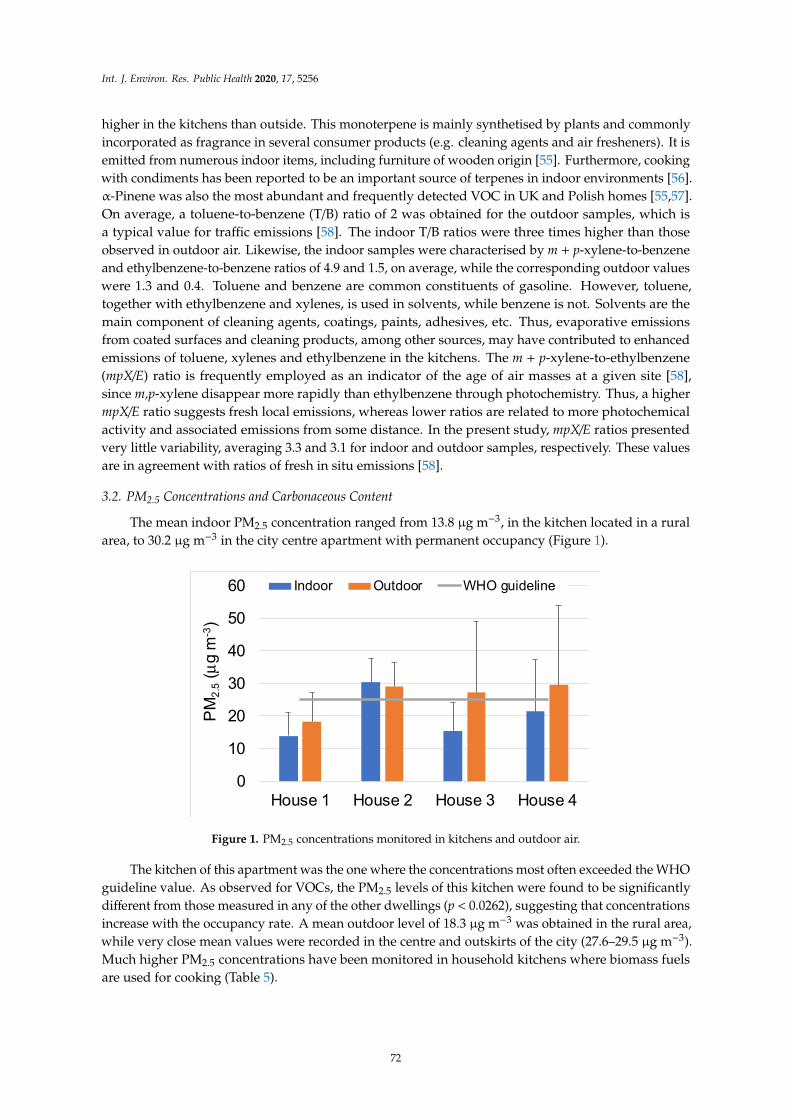
Int. J. Environ. Res. Public Health 2020, 17, 5256
higher in the kitchens than outside. This monoterpene is mainly synthetised by plants and commonlyincorporated as fragrance in several consumer products (e.g. cleaning agents and air fresheners). It isemitted from numerous indoor items, including furniture of wooden origin [55]. Furthermore, cookingwith condiments has been reported to be an important source of terpenes in indoor environments [56].α-Pinene was also the most abundant and frequently detected VOC in UK and Polish homes [55,57].On average, a toluene-to-benzene (T/B) ratio of 2 was obtained for the outdoor samples, which isa typical value for traffic emissions [58]. The indoor T/B ratios were three times higher than thoseobserved in outdoor air. Likewise, the indoor samples were characterised by m + p-xylene-to-benzeneand ethylbenzene-to-benzene ratios of 4.9 and 1.5, on average, while the corresponding outdoor valueswere 1.3 and 0.4. Toluene and benzene are common constituents of gasoline. However, toluene,together with ethylbenzene and xylenes, is used in solvents, while benzene is not. Solvents are themain component of cleaning agents, coatings, paints, adhesives, etc. Thus, evaporative emissionsfrom coated surfaces and cleaning products, among other sources, may have contributed to enhancedemissions of toluene, xylenes and ethylbenzene in the kitchens. The m + p-xylene-to-ethylbenzene(mpX/E) ratio is frequently employed as an indicator of the age of air masses at a given site [58],since m,p-xylene disappear more rapidly than ethylbenzene through photochemistry. Thus, a highermpX/E ratio suggests fresh local emissions, whereas lower ratios are related to more photochemicalactivity and associated emissions from some distance. In the present study, mpX/E ratios presentedvery little variability, averaging 3.3 and 3.1 for indoor and outdoor samples, respectively. These valuesare in agreement with ratios of fresh in situ emissions [58].
3.2. PM2.5 Concentrations and Carbonaceous Content
The mean indoor PM2.5 concentration ranged from 13.8 µg m−3, in the kitchen located in a ruralarea, to 30.2 µg m−3 in the city centre apartment with permanent occupancy (Figure 1).
−
−
−
−
μ −
0
10
20
30
40
50
60
House 1 House 2 House 3 House 4
PM
2.5
(µg
m-3
)
Indoor Outdoor WHO guideline
Figure 1. PM2.5 concentrations monitored in kitchens and outdoor air.
The kitchen of this apartment was the one where the concentrations most often exceeded the WHOguideline value. As observed for VOCs, the PM2.5 levels of this kitchen were found to be significantlydifferent from those measured in any of the other dwellings (p < 0.0262), suggesting that concentrationsincrease with the occupancy rate. A mean outdoor level of 18.3 µg m−3 was obtained in the rural area,while very close mean values were recorded in the centre and outskirts of the city (27.6–29.5 µg m−3).Much higher PM2.5 concentrations have been monitored in household kitchens where biomass fuelsare used for cooking (Table 5).
72

Int. J. Environ. Res. Public Health 2020, 17, 5256
Table 5. PM2.5 concentrations measured in the present study and in kitchens of other countries usingdifferent cooking fuels or energy sources.
Location PM2.5 (µg m−3) Cooking Fuel or Energy Source Reference
Aveiro region, Portugal 20.6 ± 10.917.8 ± 12.2
gaselectricity This study
Bhaktapur, Nepal
630 ± 924759 ± 988656 ± 924169 ± 207101 ± 13080 ± 103
woodrice husk
biomass mixture (wood + rice husk)kerosene
LPGelectricity
[59]
Rural households, India
91044743278
dung cakesagricultural residues
fuel mixture (wood + dung)LPG
[60]
Lanzhou, northwest China(heating season)
204 ± 50114 ± 39107 ± 43
coalgas
electricity[61]
Lanzhou, northwest China(non-heating season)
213 ± 8965 ± 4255 ± 35
coalgas
electricity[61]
In these kitchens, it has been observed that particulate matter levels vary according to the fueltype: cow dung cakes > rice husk > agricultural residues > firewood > gas. Li et al. [61] evaluatedthe household concentrations of PM2.5 among urban residents of Lanzhou, China, concluding thatchanging from coal to gas or electricity could result in a reduction of PM2.5 in the kitchens by 40–70%.The application of a statistical test to the databases of the present study indicated that the PM2.5
concentrations in kitchens equipped with gas ranges are not statistically different from those in kitchenswith electrical appliances (p = 0.486, α = 0.05).
Total carbon accounted for about 30% of the PM2.5 mass in the kitchens of the rural area and citycentre apartment (Figure 2). In the kitchens of houses with less central location, but near roads withintense traffic, the TC/PM2.5 values were higher (40–50%). The corresponding outdoor mass fractionsranged, in general, between 20 and 40%, the highest values being registered at the two locations moreinfluenced by traffic. In the kitchens, OC represented 30–35% of PM2.5, while lower mass fractionsof this carbonaceous constituent (18–23%) were obtained in the outdoor air. In general, the indoorOC/EC ratios were higher than the corresponding outdoor values. Regardless of location, ratios >2were usually observed. The highest OC/EC ratios were measured at the beginning of the samplingcampaign, when the region was hit by wildfires. Measurements carried out in a busy roadway tunnelin central Lisbon exhibited an OC/EC ratio in a narrow range from 0.3 to 0.4, reflecting the compositionof fresh vehicular exhaust emissions. Much higher ratios are indicative of secondary OC formation,biomass burning emissions, and cooking fumes [62] (and references therein). Additional sourcesthat contribute to the organic carbonaceous component of PM2.5 in indoor air include paper andclothing fibres, microscopic specks of plastics, contaminants brought on the soles of our shoes, bacteria,skin flakes, cosmetics, cleaning products, etc. [63]. On the other hand, VOCs in indoor air react andform lower volatility reaction products. These reaction products may condense on existing particles ornucleate, producing secondary organic aerosols (SOA), which grow with time into larger particles.Surface chemistry can also be a source of indoor SOA [64].
73

Int. J. Environ. Res. Public Health 2020, 17, 5256
0
0.1
0.2
0.3
0.4
0.5
0.6
0.7
House 1 House 2 House 3 House 4
TC/PM
2.5
Indoor Outdoor
02468
1012141618
House 1 House 2 House 3 House 4
OC/EC
Indoor Outdoor
Figure 2. Ratios between total carbon (TC = EC + OC) and PM2.5 and between organic carbon andelemental carbon.
PM2.5 outdoor concentrations were weakly or moderately correlated with indoor concentrationsfor three of the households (r2 = 0.23–0.53), while an excellent relationship (r2 = 0.96) was found forthe terraced house in a residential neighbourhood, near a main road with intense traffic. Similarrelationships were observed for EC. The indoor and outdoor OC levels correlated well for all households(r2 = 0.76–0.91), indicating common sources or formation processes. The slopes of the correlationsbetween indoor and outdoor concentrations represent the infiltration factors, i.e., the fraction of theoutdoor PM2.5 carbonaceous component that penetrates indoors and remains suspended [65]. It wasestimated that from 32% (rural house) to 74% (city centre apartment with permanent occupancy andwith a window often open) of the indoor OC was infiltrated from the outside.
3.3. PM2.5-Bound Polycyclic Aromatic Hydrocarbons and Plasticisers
Eight phthalate plasticisers and one non-phthalate plasticizer [bis(2-ethylhexyl) adipate] werequantified in PM2.5 (Table 6). This type of compounds can be found in large quantities in plastics,vinyl flooring, varnishes, coating agents, sealing compounds, industrial and natural rubber articles,and adhesives. The finishing of textiles also relies on the use of flexibilising substances to improvetheir feel and pliability. Plasticisers can leak out of the different products, thus escaping into theenvironment, making them ubiquitous. Total concentrations in the kitchens ranged from 44 to 171 ngm−3. These values were three to 12 times higher than those detected in the outdoor air, reflecting thewidespread employment of plasticised indoor materials. Total concentrations in the kitchens werefound to be significantly different from those outdoors (p = 0.0343). The most abundant compoundswere diisobutyl phthalate and bis (2-ethylhexyl) phthalate, together with di-n-butyl phthalate in two ofthe kitchens. The latter two compounds have been listed as major plasticisers in household dust [63].Health concerns related to phthalate ester exposures have focused primarily on cancer and reproductiveeffects [66]. Evidence for an association between phthalate exposure and diabetes risk and obesity wasalso found [67]. Moreover, it has emerged that exposure to phthalates aggravate pulmonary functionand airway inflammation in asthmatic children [68].
PAHs are prevalent environmental pollutants generated primarily during the incompletecombustion of organic materials. Except in the permanently occupied housing, PAH concentrationswere much higher in the outdoor air. It should be noted that in this house a greater number of mealsare prepared, and gas is used for cooking. The total concentrations obtained in the kitchens werestatistically different from those found outdoors (p = 0.0499).
74

Int. J. Environ. Res. Public Health 2020, 17, 5256
Table 6. Indoor and outdoor concentrations (ng m−3) of plasticisers and polyaromatic compounds anddiagnostic ratios.
House 1 House 2 House 3 House 4
Indoor Outdoor Indoor Outdoor Indoor Outdoor Indoor Outdoor
Plasticisers
Dimethyl phthalate 0.0993 0.00616 1.57 0.115 0.281 0.0105 0.916 0.119Diethyl phthalate 1.49 0.0538 5.55 1.24 0.825 8.87 1.53
Diisobutyl phthalate 13.4 4.15 72.3 13.2 7.96 3.11 76.5 3.12Di-n-butyl phthalate 1.44 30.9 3.92 2.80 56.8
Benzyl butyl phthalate 0.547 0.394 2.05 0.160 0.302 0.135 0.580 0.132Bis(2-ethylhexyl) adipate 7.93 2.70 6.34 0.847 3.20 2.18 6.11 0.985
Bis(2-ethylhexyl) phthalate 29.8 7.11 29.1 11.2 25.4 8.18 20.4 6.92Di-n-octyl phthalate 2.95 1.16 0.113 1.91 0.254 0.747 0.294Diisononyl phthalate 1.31 0.168 0.211 0.0376 1.17 0.0601 0.265 0.101
Total 59.0 14.6 149 30.8 43.8 13.9 171 13.2
PAHs
Naphthalene 1.13 1.19 1.93 0.0192 1.81 1.22Acenaphthylene 0.156 0.00896 0.0425 0.354 0.101 0.244Acenaphthene 0.491
Fluorene 0.0202 0.00557 0.0219 0.0387Phenanthrene 0.0540 0.0411 0.000917 0.00745 0.185 0.0415 0.233
Anthracene 0.0132 0.00579 0.0159 0.0529 0.0473 0.0402Fluoranthene 0.501 0.0484 0.0710 0.0963 0.666 0.183 0.602
Pyrene 0.656 0.0293 0.0534 0.0109 0.718 0.188 0.662p-Terphenyl 0.0229 0.0110 0.0155 0.0168
Retene 0.106 5.26 0.568 1.31 0.117 0.621 0.136 0.581Benzo[a]anthracene 0.0387 0.780 0.0705 0.0981 0.0604 1.13 0.194 0.731
Chrysene 0.0612 1.11 0.0950 0.162 0.0643 1.64 0.330 1.30Benzo[b]fluoranthene 0.319 1.86 0.297 0.329 0.671 2.43 0.830 1.77
7,12-Dimethylbenz[a]anthracene 0.164 1.60 0.486 0.448 0.0910 0.298 0.0933 0.190Benzo[k]fluoranthene 0.277 1.83 0.261 0.280 0.715 2.24 0.813 1.80
Benzo[e]pyrene 0.258 1.37 0.288 0.304 0.556 1.71 0.665 1.28Benzo[a]pyrene 0.202 1.36 0.128 0.157 0.627 1.89 0.668 1.15
Perylene 0.108 0.719 0.0806 0.0920 0.301 0.875 0.314 0.528Indeno[1,2,3-cd]pyrene 0.533 1.72 0.345 0.332 0.633 1.68 1.05 1.50Dibenzo[a,h]anthracene 0.0749 0.245 0.0424 0.0389 0.0924 0.222 0.122 0.180
Benzo[g,h,i]perylene 0.460 1.47 0.359 0.345 0.547 1.52 1.05 1.41Total 3.73 21.9 5.10 4.55 4.65 18.3 8.65 15.5
Ratios between PAHs
BaA/(BaA + Chry) 0.39 0.41 0.43 0.38 0.48 0.41 0.37 0.36IP/(IP + BghiP) 0.54 0.54 0.49 0.49 0.54 0.53 0.50 0.52
BaP/(BaP + BghiP) 0.36 0.48 0.45 0.47 0.50 0.53 0.39 0.48BaP/BghiP 0.44 0.92 0.36 0.46 1.2 1.2 0.64 0.82
Empty cells mean below detection limit or of the same order of the blanks; BaA—Benzo[a]anthracene;Chry—Chrysene; IP—Indeno[1,2,3-cd]pyrene; BghiP—Benzo[g,h,i]perylene; BaP—Benzo[a]pyrene.
The highest PAH levels were obtained in the house under the influence of wildfires. In the outdoorair of this dwelling, the retene concentration deserves to be highlighted. This alkylated phenanthrenehas been described as the most abundant polyaromatic in particulate matter samples from severalwildfire events [69]. An overwhelming proportion of retene has also been found in the organic extractsof PM2.5 from the combustion of vegetal charcoal in barbecue grills [70]. More recently, it has beendetected in non-exhaust particles resulting from tyre wear [71]. Retene in tyre-related samples mayoriginate from the natural waxes and resins added as softeners and extenders to rubbers. In additionto biomass burning, this traffic non-exhaust source may justify the detection of retene in the outdoorair, which in part penetrates inside the buildings. In all samples, high PAH molecular weights with≥ 4 rings dominated over lighter compounds, indicating prevalence of pyrogenic with respect topetrogenic sources.
Concentration ratios between PAHs have been frequently used as diagnostic tools to infer theirsources [69,70,72]. In the present study, regardless of the location, BaA/(BaA + Chry) ratios around 0.4
75

Int. J. Environ. Res. Public Health 2020, 17, 5256
were obtained, revealing a mixed contribution from petrogenic sources, cooking fumes and biomassburning emissions. Also, irrespective of the sampling site, a rather constant IP/(IP + BghiP) ratioaround 0.5 was observed. Values ≥ 0.5 have been linked to wildfires, coal combustion and residentialwood burning, while emissions from petroleum combustion are characterised by much lower ratios.Values between 0.4 and 0.5 have been described as typical of cooking emissions [73]. In contrast,the BaP/BghiP ratio showed some variations. The indoor ratios were always lower than those observedoutdoors. The highest ratios were obtained in the suburban detached house, which is close to a charcoalgrilled chicken restaurant without fume removal or scrubbing system. BaP/BghiP ratios > 1.2 havebeen pointed out as typical of both wildfires and coal combustion, whilst values around 0.4–0.5 arecharacteristic of vehicle emissions [69,70,72].
3.4. PM2.5 Morphological Characteristics
SEM images are widely used in the study of atmospheric particle morphology, and can directlyshow the particle size, shape, aggregation characteristics, composition, and even sources. The individualparticle details could contribute to establish pollution tracers emitted by specific sources in future studies.The filters used in this study are made of quartz fibres with different diameters in a tree-dimensionalfiltration substrate. A blank/clean quartz filter (Figure 3a) was analysed by SEM in order to compareits microstructure with that of the filters on which the particles were collected. The particulate materialwas mainly composed of soot aggregates, fly ash particles and mineral particles, which mainly derivefrom combustion and dust.
(a) (b)
(c) (d)
Figure 3. SEM imagens of (a) control blank quartz filter with 1.0 µm scale; (b–d) collected particles.
Figure 3b shows the diverse types of materials found in the outdoor environment of house 1(rural) between 22 and 24 October 2017. Black arrows (Figure 3c) indicate some of the PM2.5 present indifferent depths of the quartz fibre filter and the size of the circles on the bottom right corner represents
76

Int. J. Environ. Res. Public Health 2020, 17, 5256
the aerodynamic diameter cut-off for PM1 and PM2.5 in a sample collected in the kitchen of house 2(city centre apartment). The kitchen samples from house 3 (Figure 3d) also reveal a mix compositionof different materials, reflecting the contribution from diverse sources, e.g. cooking activities andparticle resuspension.
In outdoor samples, carbonaceous particles represent a significant amount of the total particulates,being soot aggregates the dominant carbonaceous material (Figure 4a,b). These soot masses are formedby ultrafine aggregates of spherical particles with nanometric variable sizes (50–200 nm). Previousstudies suggest that these types of particles are formed during combustion processes, e.g. biomass,coal, and diesel [74]. The EDS analysis revealed carbon, oxygen and sulphur peaks typical fromcombustion. Indoor particles from households 1 and 2 also show soot aggregates with lower sulphurcontent, which are likely associated with the use of burner gas hobs in these two kitchens. Additionally,silicate and iron plerospheres and cenospheres (Figure 4c,d) fly ashes, with diameter ≤ 2 µm, were alsofound in outdoor samples, with Fe-Si-Cu-Al-Ca variable composition. In the outdoor sample of house1 collected from 16 to 18 October, soot materials and fly ashes were more abundant than in other filtersfrom the same location, possibly due to the occurrence of wildfires in those days in the nearby forests.
≤
(a) (b)
(c) (d)
Figure 4. SEM images of soot aggregates with branching structures (a,b) and with cenosphere fly ash(c,d) in outdoor samples.
In indoor samples of house 1, several particles related to the peri urban/rural environment werefound. Brochosomes (Figure 5a) are spherical honeycomb like particles, composed of proteins andlipids < 1 µm in diameter with which the leafhoppers (family Cicadellidae) coat themselves [75]. Also,in all houses, kitchen salt (NaCl) particles with dimensions <2.5 µm were abundantly found (Figures 3cand 5b).
77

Int. J. Environ. Res. Public Health 2020, 17, 5256
− −
− −
0.0
0.10.2
0.30.4
0.50.6
0.7
House 1 House 2 House 3 House 4
HQ
Benzene TolueneTetrachloroethylene Ethylbenzenem+p-Xylene Styreneo-Xylene 1,4-DichlorobenzeneFormaldehyde Acetaldehyde
(a) (b)
Figure 5. SEM imagens of (a) brochosomes, and (b) salt (NaCl) particles in indoor samples.
In summary, PM2.5 was not only comprised of irregularly shaped agglomerate particles but alsocontained spherical, elongated, and flocculent particles. It is known that spherical particles and sootaggregates can enable the fine particles to easily adsorb toxic and harmful substances, such as heavymetals, volatile organic contaminants, and semivolatile organic pollutants. The observation of manyparticles in the ultrafine mode, including in the nanoscale size range, is relevant from the point ofview of health. In addition to being able to penetrate deeply into the airways, these particles have ahigh adhesion surface to adsorb various chemical constituents, resulting in an enhanced complexityand toxicity.
3.5. Cancer and Non-Cancer Risks
Regardless of household, the hazard quotients associated with VOC inhalation were always below1, indicating a low probability of non-cancer effects (Figure 6). The total hazard index ranged from 0.40to 0.64. As observed in previous works [41,43], formaldehyde and acetaldehyde were the compoundsthat contributed most to the total risk, accounting for 25–63% and 32–70% of HI, respectively. The globalexcess lifetime cancer risk varied between 2.7 × 10⁻⁵ and 4.7 × 10⁻⁵. Thus, CR was lower than theUSEPA guideline of 1.0 × 10⁻⁴, but not negligible (>1 × 10⁻⁶). The major contribution to CR came,once again, from formaldehyde (59–81%) and acetaldehyde (8–35%). The highest risks were obtainedin households located near roads with more intense traffic.
− −
− −
0.0
0.10.2
0.30.4
0.50.6
0.7
House 1 House 2 House 3 House 4
HQ
Benzene TolueneTetrachloroethylene Ethylbenzenem+p-Xylene Styreneo-Xylene 1,4-DichlorobenzeneFormaldehyde Acetaldehyde
(a) (b)
Figure 6. Hazard quotients (HQ) for individual VOCs for the four dwellings.
78

Int. J. Environ. Res. Public Health 2020, 17, 5256
The cancer risks associated with domestic exposure to PAHs through the inhalation pathwayranged from 1.1 × 10⁻⁷ to 3.5 × 10⁻⁷, which can be taken as negligible. Benzo[a]pyrene accountedfor more than a half (51–61%) of the total cancer risk, followed by dibenzo[a,h]anthracene andindeno[1,2,3-cd]pyrene with shares of 10–19% and 7–13%, respectively.
4. Conclusions
Particulate matter (PM2.5), VOCs and carbonyls were monitored in the indoor and outdoor air ofmodern kitchens of four houses. Except for benzene and tetrachloroethylene, all pollutants presentedindoor-to-outdoor ratios higher than 1, demonstrating the contribution of domestic emission sources.Concentrations were lower than the thresholds stipulated in the legislation or recommended byinternational organisations and well below the values reported for kitchens in developing countrieswhere solid fuels are used for cooking. The levels of both PM2.5 and VOCs in the kitchen of thepermanently occupied home were significantly different from those observed in the other dwellings.Thus, it seems that a higher frequency of activities associated with full-time occupancy is the mostdetermining factor for air quality. Carbonaceous constituents represented about 30–50% of thePM2.5 mass, with the highest mass fractions recorded in houses closest to high traffic routes. It wasestimated that from 32% to 74% of the indoor OC penetrates from outdoors. OC/EC ratios werehigher indoors than outdoors, always surpassing 2, and peaked when the region was plagued bywildfires. In outdoor samples, pherospheres and cenospheres fly ashes composed of Fe-Si-Cu-Al-Cawere abundant, while ultrafine soot aggregates represented the dominant carbonaceous material.Soot aggregates with lower sulphur content were also found in kitchens with burner gas hobs. Salt andmineral particles from soil resuspension were observed in all kitchens. Brochosomes were only detectedin the kitchen of the rural house. Although the particle levels were found to be statistically differentin only one of the dwellings, the PM2.5 morphology indicated the presence of particles with distinctproperties in kitchens with gas cooking appliances compared to those equipped with electric hobs.
Irrespective of the type of house, a low probability of non-cancer effects due to inhalation ofVOCs was estimated. The global excess lifetime cancer risk was lower than the USEPA guidelineof 1 × 10⁻⁴ but was higher than 1 × 10⁻⁶, so it cannot be considered negligible. Formaldehyde andacetaldehyde were the compounds that contributed most to the total cancer and non-cancer risksin the indoor environments. The cancer risk associated with residential exposure to particle-boundPAHs via inhalation was found to be insignificant. However, it is necessary to bear in mind that themorphological analysis revealed the presence of numerous ultrafine particles, including nanometricvariable sizes, with a complex composition that comprises metals known to cause oxidative stress andother health hazards.
Although logistically difficult, future studies should consider the analysis of other gaseouspollutants and a more detailed chemical characterisation of size distributed particulate material for alarger number of samples in order to be able to apply source apportionment models. The fact thatconcentrations are generally low does not offer a complete guarantee of health protection. For thisreason, it is advisable that, in the future, chemical analyses be accompanied by in vitro toxicity testingto assess which constituents can be related to health impairment.
Supplementary Materials: The following are available online at http://www.mdpi.com/1660-4601/17/14/5256/s1,Table S1: Statistical comparison between carbonyl concentrations in the kitchens of the four dwellings for aconfidence level of 95%. p-values of statistically significant differences are in bold, Table S2: Statistical comparisonbetween VOC concentrations in the kitchens of the four dwellings and in the outdoor air for a confidence levelof 95%. p-values of statistically significant differences are in bold, Table S3: Statistical comparison of VOCconcentrations in the kitchens for a confidence level of 95%. p-values of statistically significant differences are inbold, Table S4: Statistical comparison between the PM2.5 concentrations in the kitchens of the four dwellings for aconfidence level of 95%. p-values of statistically significant differences are in bold.
Author Contributions: Conceptualisation, C.A., T.N., and M.C.; sampling, C.A., T.N., and M.E.; weightingand carbon analyses, A.R.O. and T.N.; SEM analysis, C.C. and F.R.; GC-MS analyses, A.V.; VOC and carbonyldeterminations, E.V., S.M.A. and M.C.; writing of original draft, C.A.; review of original draft, C.A. in collaborationwith all co-authors. All authors have read and agreed to the published version of the manuscript.
79

Int. J. Environ. Res. Public Health 2020, 17, 5256
Funding: Estela Vicente and Margarita Evtyugina acknowledge, respectively, the grants FRH/BD/117993/2016and SFRH/BPD/123176/2016 from the Portuguese Foundation for Science and Technology (FCT). Ana Vicente issubsidised by national funds (OE), through FCT, I.P., in the framework contract foreseen in the numbers 4, 5 and 6 ofarticle 23, of the Decree-Law 57/2016, of August 29, changed by Law 57/2017, of July 19. We are also grateful for thesupport to CESAM (UIDB/50017/2020+UIDP/50017/2020), to GeoBioTec (UID/GEO/04035/2019+UIDB/04035/2020),and to C2TN (UIDB/04349+UIDP/04349/2020) to FCT/MCTES through national funds, and co-funding by FEDER,within the PT2020 Partnership Agreement and Compete 2020.
Acknowledgments: We thank all homeowners who have allowed the installation of noisy sampling equipment intheir kitchens and helped to change the filters.
Conflicts of Interest: The authors declare no competing interests.
References
1. Marc, M.; Smiełowska, M.; Namiesnik, J.; Zabiegała, B. Indoor air quality of everyday use spaces dedicatedto specific purposes—A review. Environ. Sci. Pollut. Res. 2017, 25, 2065–2082. [CrossRef]
2. Huboyo, H.S.; Tohno, S.; Cao, R. Indoor PM2.5 characteristics and CO concentration related to water-basedand oil-based cooking emissions using a gas stove. Aerosol Air Qual. Res. 2011, 11, 401–411. [CrossRef]
3. Torkmahalleh, M.A.; Gorjinezhad, S.; Unluevcek, H.S.; Hopke, P.K. Review of factors impactingemission/concentration of cooking generated particulate matter. Sci. Total. Environ. 2017, 586, 1046–1056.[CrossRef] [PubMed]
4. Ambade, B. A critical comparative study of indoor air pollution from household cooking fuels and its effecton health. Orient. J. Chem. 2016, 32, 473–480. [CrossRef]
5. Chakraborty, D.; Mondal, N.K.; Datta, J.K. Indoor pollution from solid biomass fuel and rural health damage:A micro-environmental study in rural area of Burdwan, West Bengal. Int. J. Sustain. Built Environ. 2014, 3,262–271. [CrossRef]
6. Huboyo, H.S.; Tohno, S.; Lestari, P.; Mizohata, A.; Okumura, M. Characteristics of indoor air pollution inrural mountainous and rural coastal communities in Indonesia. Atmos. Environ. 2014, 82, 343–350. [CrossRef]
7. Rajkumar, S.; Clark, M.L.; Young, B.N.; Benka-Coker, M.L.; Bachand, A.M.; Brook, R.D.; Nelson, T.L.;Volckens, J.; Reynolds, S.J.; L’Orange, C.; et al. Exposure to household air pollution from biomass-burningcookstoves and HbA1c and diabetic status among Honduran women. Indoor Air 2018, 28, 768–776. [CrossRef][PubMed]
8. Das, I.; Jagger, P.; Yeatts, K. Biomass cooking fuels and health outcomes for women in Malawi. Ecohealth
2016, 14, 7–19. [CrossRef]9. GBD 2015 Risk Factors Collaborators. Global, regional, and national comparative risk assessment of 79
behavioural, environmental and occupational, and metabolic risks or clusters of risks, 1990–2015: A systematicanalysis for the Global Burden of Disease Study 2015. Lancet 2016, 388, 1659–1724. [CrossRef]
10. Lacey, F.; Henze, D.K.; Lee, C.J.; van Donkelaar, A.; Martin, R.V. Transient climate, and ambient healthimpacts due to national solid fuel cookstove emissions. Proc. Natl. Acad. Sci. USA 2017, 114, 1269–1274.[CrossRef]
11. Sehgal, M.; Rizwan, S.A.; Krishnan, A. Disease burden due to biomass cooking-fuel-related household airpollution among women in India. Glob. Heal. Action 2014, 7, 25326. [CrossRef] [PubMed]
12. Gioda, A.; Tonietto, G.B.; de Leon, A.P. Exposure to the use of firewood for cooking in Brazil and itsrelationship with the health problems of the population. Cienc. Saude Coletiva 2019, 24, 3079–3088. [CrossRef][PubMed]
13. Sana, A.; Meda, N.; Badoum, G.; Kafando, B.; Bouland, C. Primary cooking fuel choice and respiratory healthoutcomes among women in charge of household cooking in Ouagadougou, Burkina Faso: Cross-sectionalstudy. Int. J. Environ. Res. Public Heal. 2019, 16, 1040. [CrossRef]
14. World Health Organization (WHO). WHO Guidelines for Indoor Air Quality: Household Fuel Combustion;World Health Organization: Geneva, Switzerland, 2014.
15. Zhao, Y.; Zhao, B. Emissions of air pollutants from Chinese cooking: A literature review. Build. Simul. 2018,11, 977–995. [CrossRef]
16. Sharma, D.; Jain, S. Impact of intervention of biomass cookstove technologies and kitchen characteristics onindoor air quality and human exposure in rural settings of India. Environ. Int. 2019, 123, 240–255. [CrossRef]
80

Int. J. Environ. Res. Public Health 2020, 17, 5256
17. Jiang, R.; Bell, M. A comparison of particulate matter from biomass-burning rural and non-biomass-burningurban households in Northeastern China. Environ. Heal. Perspect. 2008, 116, 907–914. [CrossRef] [PubMed]
18. Singh, S.; Gupta, G.P.; Kumar, B.; Kulshrestha, U. Comparative study of indoor air pollution using traditionaland improved cooking stoves in rural households of Northern India. Energy Sustain. Dev. 2014, 19, 1–6.[CrossRef]
19. Chowdhury, Z.; Le, L.T.; al Masud, A.; Chang, K.C.; Alauddin, M.; Hossain, M.; Zakaria, A.; Hopke, P.K.Quantification of indoor air pollution from using cookstoves and estimation of its health effects on adultwomen in Northwest Bangladesh. Aerosol Air Qual. Res. 2012, 12, 463–475. [CrossRef]
20. Dasgupta, S.; Martin, P.; Samad, H.A. Lessons from rural Madagascar on improving air quality in the kitchen.J. Environ. Dev. 2015, 24, 345–369. [CrossRef]
21. Mukhopadhyay, R.; Sambandam, S.; Pillarisetti, A.; Jack, D.; Mukhopadhyay, K.; Balakrishnan, K.;Vaswani, M.; Bates, M.N.; Kinney, P.L.; Arora, N.; et al. Cooking practices, air quality, and the acceptabilityof advanced cookstoves in Haryana, India: An exploratory study to inform large-scale interventions. Glob.
Heal. Action 2012, 5, 1–13. [CrossRef] [PubMed]22. Gautam, S.K.; Suresh, R.; Sharma, V.P.; Sehgal, M. Indoor air quality in the rural India. Manag. Environ. Qual.
Int. J. 2013, 24, 244–255. [CrossRef]23. Bhargava, A.; Khanna, R.; Bhargava, S.; Kumar, S. Exposure risk to carcinogenic PAHs in indoor air during
biomass combustion whilst cooking in rural India. Atmos. Environ. 2004, 38, 4761–4767. [CrossRef]24. Naeher, L.P.; Leaderer, B.P.; Smith, K.R. Particulate matter and carbon monoxide in Highland Guatemala:
Indoor and outdoor levels from traditional and improved wood stoves and gas stoves. Indoor Air 2000, 10,200–205. [CrossRef] [PubMed]
25. Wangchuk, T.; He, C.; Knibbs, L.D.; Mazaheri, M.; Morawska, L. A pilot study of traditional indoor biomasscooking and heating in rural Bhutan: Gas and particle concentrations and emission rates. Indoor Air 2016, 27,160–168. [CrossRef] [PubMed]
26. Chartier, R.; Phillips, M.; Mosquin, P.L.; Elledge, M.; Bronstein, K.; Nandasena, S.; Thornburg, V.; Thornburg, J.;Rodes, C. A comparative study of human exposures to household air pollution from commonly usedcookstoves in Sri Lanka. Indoor Air 2016, 27, 147–159. [CrossRef]
27. Röllin, H.B.; Mathee, A.; Bruce, N.; Levin, J.; von Schirnding, Y.E.R. Comparison of indoor air qualityin electrified and un-electrified dwellings in rural South African villages. Indoor Air 2004, 14, 208–216.[CrossRef]
28. Chen, Y.; Du, W.; Shen, G.; Zhuo, S.; Zhu, X.; Shen, H.; Huang, Y.; Su, S.; Lin, N.; Pei, L.; et al. Household airpollution and personal exposure to nitrated and oxygenated polycyclic aromatics (PAHs) in rural households:Influence of household cooking energies. Indoor Air 2016, 27, 169–178. [CrossRef]
29. Colbeck, I.; Nasir, Z.A.; Ali, Z. Characteristics of indoor/outdoor particulate pollution in urban and ruralresidential environment of Pakistan. Indoor Air 2010, 20, 40–51. [CrossRef]
30. Mccord, A.I.; Stefanos, S.A.; Tumwesige, V.; Lsoto, D.; Meding, A.H.; Adong, A.; Schauer, J.J.; Larson, R.A.The impact of biogas and fuelwood use on institutional kitchen air quality in Kampala, Uganda. Indoor Air
2017, 27, 1067–1081. [CrossRef]31. Siddiqui, A.R.; Lee, K.; Bennett, D.; Yang, X.; Brown, K.H.; Bhutta, Z.A.; Gold, E.B. Indoor carbon monoxide
and PM2.5 concentrations by cooking fuels in Pakistan. Indoor Air 2009, 19, 75–82. [CrossRef]32. Giwa, S.O.; Nwaokocha, C.N.; Odufuwa, B.O. Air pollutants characterization of kitchen microenvironments
in southwest Nigeria. Build. Environ. 2019, 153, 138–147. [CrossRef]33. Muralidharan, V.; Sussan, T.; Limaye, S.; Koehler, K.; Williams, D.L.; Rule, A.M.; Juvekar, S.; Breysse, P.N.;
Salvi, S.; Biswal, S. Field testing of alternative cookstove performance in a rural setting of Western India. Int.
J. Environ. Res. Public Heal. 2015, 12, 1773–1787. [CrossRef]34. Less, B.; Mullen, N.; Singer, B.; Walker, I. Indoor air quality in 24 California residences designed as
high-performance homes. Sci. Technol. Built Environ. 2015, 21, 14–24. [CrossRef]35. Perrino, C.; Tofful, L.; Canepari, S. Chemical characterization of indoor and outdoor fine particulate matter
in an occupied apartment in Rome, Italy. Indoor Air 2015, 26, 558–570. [CrossRef] [PubMed]36. Mullen, N.A.; Li, J.; Russell, M.L.; Spears, M.; Less, B.D.; Singer, B.C. Results of the California Healthy Homes
Indoor Air Quality Study of 2011-2013: Impact of natural gas appliances on air pollutant concentrations.Indoor Air 2015, 26, 231–245. [CrossRef]
81

Int. J. Environ. Res. Public Health 2020, 17, 5256
37. Liu, Y.; Misztal, P.K.; Xiong, J.; Tian, Y.; Arata, C.; Weber, R.J.; Nazaroff, W.W.; Goldstein, A.H. Characterizingsources and emissions of volatile organic compounds in a northern California residence using space- andtime-resolved measurements. Indoor Air 2019, 29, 630–644. [CrossRef]
38. Lee, S.-C.; Li, W.-M.; Ao, C.-H. Investigation of indoor air quality at residential homes in Hong Kong—Casestudy. Atmos. Environ. 2002, 36, 225–237. [CrossRef]
39. World Health Organization (WHO). Air Quality Guidelines. Risks Hazard. Wastes 2011, 379. [CrossRef]40. Cassee, F.R.; Héroux, M.-E.; Gerlofs-Nijland, M.E.; Kelly, F.J. Particulate matter beyond mass: Recent health
evidence on the role of fractions, chemical constituents, and sources of emission. Inhal. Toxicol. 2013, 25,802–812. [CrossRef] [PubMed]
41. Fang, L.; Norris, C.; Johnson, K.; Cui, X.; Sun, J.; Teng, Y.; Tian, E.; Xu, W.; Li, Z.; Mo, J.; et al. Toxic volatileorganic compounds in 20 homes in Shanghai: Concentrations, inhalation health risks, and the impacts ofhousehold air cleaning. Build. Environ. 2019, 157, 309–318. [CrossRef]
42. Clarisse, B.; Laurent, A.; Seta, N.; le Moullec, Y.; el Hasnaoui, A.; Momas, I. Indoor aldehydes: Measurementof contamination levels and identification of their determinants in Paris dwellings. Environ. Res. 2003, 92,245–253. [CrossRef]
43. Cheng, Z.; Li, B.; Yu, W.; Wang, H.; Zhang, T.; Xiong, J.; Bu, Z. Risk assessment of inhalation exposure toVOCs in dwellings in Chongqing, China. Toxicol. Res. 2018, 7, 59–72. [CrossRef] [PubMed]
44. Alves, C.A.; Vicente, E.D.; Vicente, A.M.P.; Rienda, I.C.; Tomé, M.; Querol, X.; Amato, F. Loadings, chemicalpatterns, and risks of inhalable road dust particles in an Atlantic city in the north of Portugal. Sci. Total
Environ. 2020, 737, 139596. [CrossRef]45. Lovreglio, P.; Carrus, A.; Iavicoli, S.; Drago, I.; Persechino, B.; Soleo, L. Indoor formaldehyde and acetaldehyde
levels in the province of Bari, South Italy, and estimated health risk. J. Environ. Monit. 2009, 11, 955. [CrossRef][PubMed]
46. Gilbert, N.L.; Guay, M.; Miller, J.D.; Judek, S.; Chan, C.C.; Dales, R.E. Levels and determinants of formaldehyde,acetaldehyde, and acrolein in residential indoor air in Prince Edward Island, Canada. Environ. Res. 2005, 99,11–17. [CrossRef] [PubMed]
47. Delikhoon, M.; Fazlzadeh, M.; Sorooshian, A.; Baghani, A.N.; Golaki, M.; Ashournejad, Q.; Barkhordari, A.Characteristics and health effects of formaldehyde and acetaldehyde in an urban area in Iran. Environ. Pollut.
2018, 242, 938–951. [CrossRef]48. Swenberg, J.A.; Moeller, B.C.; Lu, K.; Rager, J.E.; Fry, R.C.; Starr, T.B. Formaldehyde carcinogenicity research:
30 years and counting for mode of action, epidemiology, and cancer risk assessment. Toxicol. Pathol. 2013, 41,181–189. [CrossRef] [PubMed]
49. Salthammer, T.; Mentese, S.; Marutzky, R. Formaldehyde in the indoor environment. Chem. Rev. 2010, 110,2536–2572. [CrossRef] [PubMed]
50. IAQ-SFRB. Indoor Air Quality (IAQ) Volatile Organic Compounds. Scientific Findings Resource Bank(IAQ-SFRB). Available online: https://iaqscience.lbl.gov/voc-summary (accessed on 6 April 2020).
51. Rovelli, S.; Cattaneo, A.; Fazio, A.; Spinazzè, A.; Borghi, F.; Campagnolo, D.; Dossi, C.; Cavallo, D.M. VOC’smeasurements in residential buildings: Quantification via thermal desorption and assessment of indoorconcentrations in a case-study. Atmosphere 2019, 10, 57. [CrossRef]
52. Chin, J.-Y.; Godwin, C.; Parker, E.; Robins, T.; Lewis, T.; Harbin, P.; Batterman, S. Levels and sources ofvolatile organic compounds in homes of children with asthma. Indoor Air 2014, 24, 403–415. [CrossRef]
53. Li, Y.; Cakmak, S.; Zhu, J. Profiles, and monthly variations of selected volatile organic compounds in indoorair in Canadian homes: Results of Canadian national indoor air survey 2012–2013. Environ. Int. 2019, 126,134–144. [CrossRef]
54. Ordinance No. 353-A/2013 (Portaria no. 353-A/2013)—Regulamento de Desempenho Energético dos Edifícios
de Comércio e Serviços (RECS)—Requisitos de Ventilação e Qualidade do ar Interior; Ministério do AmbienteOrdenamento do Território e Energia da Saúde e da Solidariedade Emprego e Segurança Social: Lisbon,Portugal, 2013.
55. Król, S.; Namiesnik, J.; Zabiegała, B. α-Pinene, 3-carene and d-limonene in indoor air of Polish apartments:The impact on air quality and human exposure. Sci. Total. Environ. 2014, 985–995. [CrossRef] [PubMed]
56. Klein, F.; Farren, N.J.; Bozzetti, C.; Daellenbach, K.R.; Kilic, D.; Kumar, N.K.; Pieber, S.M.; Slowik, J.G.;Tuthill, R.N.; Hamilton, J.F.; et al. Indoor terpene emissions from cooking with herbs and pepper and theirsecondary organic aerosol production potential. Sci. Rep. 2016, 6, 36623. [CrossRef]
82

Int. J. Environ. Res. Public Health 2020, 17, 5256
57. Wang, C.M.; Barratt, B.; Carslaw, N.; Doutsi, A.; Dunmore, R.E.; Ward, M.W.; Lewis, A.C. Unexpectedly highconcentrations of monoterpenes in a study of UK homes. Environ. Sci. Process. Impacts 2017, 19, 528–537.[CrossRef]
58. Bretón, J.G.C.; Bretón, R.M.C.; Ucan, F.V.; Baeza, C.B.; Fuentes, M.D.L.L.E.; Chi, M.P.U.; Marrón, M.R.;Pacheco, J.A.M.; Guzmán, A.R.; Chi, M.P.U. Characterization and sources of aromatic hydrocarbons (BTEX)in the atmosphere of two urban sites located in Yucatan Peninsula in Mexico. Atmosphere 2017, 8, 107.[CrossRef]
59. Pokhrel, A.; Bates, M.N.; Acharya, J.; Valentiner-Branth, P.; Chandyo, R.K.; Shrestha, P.S.; Raut, A.; Smith, K.R.PM2.5 in household kitchens of Bhaktapur, Nepal, using four different cooking fuels. Atmos. Environ. 2015,113, 159–168. [CrossRef]
60. Sidhu, M.K.; Khaiwal, R.; Mor, S.; John, S. Household air pollution from various types of rural kitchens andits exposure assessment. Sci. Total. Environ. 2017, 586, 419–429. [CrossRef] [PubMed]
61. Li, T.; Cao, S.; Fan, D.; Zhang, Y.; Wang, B.; Zhao, X.; Leaderer, B.P.; Shen, G.; Zhang, Y.; Duan, X. Householdconcentrations and personal exposure of PM2.5 among urban residents using different cooking fuels. Sci.
Total. Environ. 2016, 548, 6–12. [CrossRef]62. Alves, C.A.; Duarte, M.; Nunes, T.; Moreira, R.; Rocha, S. Carbonaceous particles emitted from cooking
activities in Portugal. Glob. Nest J. 2014, 16, 412–420.63. Vicente, E.D.; Vicente, A.; Nunes, T.; Calvo, A.; Blanco-Alegre, C.; Oduber, F.; Castro, A.; Fraile, R.; Amato, F.;
Alves, C. Household dust: Loadings and PM10-bound plasticizers and polycyclic aromatic hydrocarbons.Atmosphere 2019, 10, 785. [CrossRef]
64. Weschler, C.J.; Carslaw, N. Indoor Chemistry. Environ. Sci. Technol. 2018, 52, 2419–2428. [CrossRef] [PubMed]65. Othman, M.; Latif, M.T.; Matsumi, Y. The exposure of children to PM2.5 and dust in indoor and outdoor
school classrooms in Kuala Lumpur City Centre. Ecotoxicol. Environ. Saf. 2019, 170, 739–749. [CrossRef][PubMed]
66. Kay, V.R.; Bloom, M.S.; Foster, W.G. Reproductive and developmental effects of phthalate diesters in males.Crit. Rev. Toxicol. 2014, 44, 467–498. [CrossRef] [PubMed]
67. Radke, E.G.; Galizia, A.; Thayer, K.A.; Cooper, G.S. Phthalate exposure and metabolic effects: A systematicreview of the human epidemiological evidence. Environ. Int. 2019, 132, 104768. [CrossRef] [PubMed]
68. Kim, Y.-M.; Kim, J.; Cheong, H.-K.; Jeon, B.-H.; Ahn, K. Exposure to phthalates aggravates pulmonaryfunction and airway inflammation in asthmatic children. PLoS ONE 2018, 13, e0208553. [CrossRef] [PubMed]
69. Vicente, A.; Calvo, A.; Fernandes, A.P.; Nunes, T.; Monteiro, C.; Pio, C.; Alves, C.A. Hydrocarbons inparticulate samples from wildfire events in central Portugal in summer 2010. J. Environ. Sci. 2017, 53, 122–131.[CrossRef] [PubMed]
70. Vicente, E.; Vicente, A.; Evtyugina, M.; Carvalho, R.L.; Tarelho, L.A.C.; Oduber, F.; Alves, C.A. Particulate,and gaseous emissions from charcoal combustion in barbecue grills. Fuel Process. Technol. 2018, 176, 296–306.[CrossRef]
71. Alves, C.A.; Vicente, A.; Calvo, A.; Baumgardner, D.; Amato, F.; Querol, X.; Pio, C.; Gustafsson, M. Physicaland chemical properties of non-exhaust particles generated from wear between pavements and tyres. Atmos.
Environ. 2020, 224, 117252. [CrossRef]72. Alves, C.A. Characterisation of solvent extractable organic constituents in atmospheric particulate matter:
An overview. Anais Acad. Brasil. Ciênc. 2008, 80, 21–82. [CrossRef]73. Zhang, N.; Han, B.; He, F.; Xu, J.; Zhao, R.; Zhang, Y.; Bai, Z. Chemical characteristic of PM2.5 emission and
inhalational carcinogenic risk of domestic Chinese cooking. Environ. Pollut. 2017, 227, 24–30. [CrossRef]74. Huang, Y.; Wang, L.; Zhang, S.; Zhang, M.; Wang, J.; Cheng, X.; Li, T.; He, M.; Ni, S. Source apportionment
and health risk assessment of air pollution particles in eastern district of Chengdu. Environ. Geochem. Heal.
2020, 1–13. [CrossRef]75. Schroeder, T.B.H.; Houghtaling, J.; Wilts, B.D.; Mayer, M. It is not a bug; it is a feature: Functional materials
in insects. Adv. Mater. 2018, 30, e1705322. [CrossRef] [PubMed]
© 2020 by the authors. Licensee MDPI, Basel, Switzerland. This article is an open accessarticle distributed under the terms and conditions of the Creative Commons Attribution(CC BY) license (http://creativecommons.org/licenses/by/4.0/).
83


International Journal of
Environmental Research
and Public Health
Article
Assessment of Clayey Peloid Formulations Prior toClinical Use in Equine Rehabilitation
Carla Marina Bastos 1,2,*, Fernando Rocha 1 , Ângela Cerqueira 1, Denise Terroso 1,
Cristina Sequeira 1 and Paula Tilley 3
1 GeoBioTec Research Centre, Department of Geosciences, University of Aveiro, 3810-193 Aveiro, Portugal;[email protected] (F.R.); [email protected] (Â.C.); [email protected] (D.T.); [email protected] (C.S.)
2 Exatronic, Lda, 3800-373 Aveiro, Portugal3 CIISA – Centre for Interdisciplinary Research in animal Health, Faculty of Veterinary Medicine, University of
Lisbon, 1300-477 Lisbon, Portugal; [email protected]* Correspondence: [email protected]; Tel.:+351-234-370357
Received: 31 March 2020; Accepted: 9 May 2020; Published: 12 May 2020
Abstract: Clays are natural ingredients used to prepare therapeutic cataplasms suitable for topicalapplication. The knowledge about these formulations and their preparations to be applied on humansand animals has been orally transmitted since ancient times. Several empirical methods using clayshave demonstrated fast and effective results in the reduction of the inflammatory response andthe formation of edemas in horse limbs. The use of traditional and alternative medicine, such aspelotherapy, is now becoming more popular in veterinarian medical practice, alone or combinedwith other therapies in horse muscle and tendon rehabilitation. This study characterizes the use ofcommercial equine clays and an old therapeutic clay cataplasm formulation, using acetic acid, totreat tendon injuries in horses. This work might contribute to a major database characterization ofclays used empirically on equine health, the potential of dermal absorption, the risks of exposure tosome toxic elements, and safety assessment for these formulations. The present study was carried outto characterize the suitability of four commercial equine clays (Group II) and a protocoled healingmixture: “clay acetic acid cataplasm”, (Group III), to treat tendon injuries in horses. In this mixture,three conventional “green” clays (Group I) without any mineralogical specificity were used andblended with acetic acid. The mineralogical composition was determined through X-ray powderdiffraction and X-ray fluorescence data. To determine the performance of the samples, cooling kinetics,oil absorption, expandability, and specific surface area were measured. According to the mineralogicalcomposition, Group I was mainly composed of carbonates and silicates, while Group II was muchricher in silicates with the main clay minerals kaolinite and illite. Group II exhibited the highest valuesfor As, Pb, Cr, Ni, and Zn, considered potentially toxic. Both groups showed low cation exchangecapacities and exchanged mainly Ca2+, with the exception of VET.1 and VET.7, which also highlightNa+, and VET.5 and VET.6, which have K+ as an exchangeable main cation. The addition of aceticacid (Group III) does not reveal any significant chemical changes. The results confirm that both claygroups are adequate for the therapeutic propose. They have good plastic properties (skin adherence),good oil absorptive capabilities (cleaning), and exchange an essential physiological element, calcium.Group II has prior industrial preparation, which is probably why it showed better results. Group Ipresented lower heat retention capacity and higher abrasiveness, which could be improved usingcosmetic additives. The clinical benefit of the “clay acetic acid cataplasm” (Group III) could be thesystemic anti-inflammatory effect established by the acetic acid.
Keywords: ethnoveterinary; pelotherapy; healing clays; quality control; equine limb injuries
85

Int. J. Environ. Res. Public Health 2020, 17, 3365
1. Introduction
It is well documented that clayey formulations have been important resources for human andanimal health care, because of their therapeutic and curative properties, since the first records inhistory [1,2].
Several traditional veterinary practices use zootherapeutic resources in the health care of domesticanimals, the medicinal value of which maintains its relevance in ethnoveterinary medicine (EVM),the scientific term for traditional animal health care [3]. Clay minerals and their healing powers in wildanimals are well documented by the practice of eating clay (geophagy) for detoxification of the bodyand alleviation of gastrointestinal infections and are now being rediscovered [4]. Kaolin and smectiticclays are commonly used in animal nutrition as growth promoters and supplements for the treatmentof gastrointestinal disturbances. The introduction of kaolin clay, as feed additive, to treat foals with“heat” diarrhea, caused by disturbances in the intestinal osmotic balance of the young horses succeedswell as an absorbent and as an anticaking agent, alleviating the severity and duration of foal heatdiarrhea [5].
The veterinary industry responds to the equine market with specific clayey products, promotingthem by their pharmacological effects. The clayey products tailored for lameness injury prevention arerelevant indicators for the evaluation of the therapeutic impact of pelotherapy in equine health andproduct procurement.
The clays’ efficacy for lameness or other musculoskeletal injuries on horses is free of regulatorycompliance. Most of these clayey products are designed accordingly with requirements andspecifications supported by specialized equine technicians.
The use of pelotherapy as a therapeutic modality is scientifically little explored in equine health,despite its recognition as a valid non-invasive therapeutic option.
There are a few veterinarian databases, designed to search for relevant studies and clinical trialsreported by researchers, such as PubMed and IVIS Quick-Links. The AVMA Animal Health StudiesDatabase (www.avma.org/findvetstudies) allows submission and search of studies for health careissues in dogs, cats, horses, or other animals. Using “horse” and “equine” as a keyword we did notfind any issue related to the use of clays in equine rehabilitation.
Clay minerals are widely used in pharmaceutical formulations as excipients and because of theirbiological activities [6] and are used in cosmetics because of their physical and physical–chemicalproperties such as adsorption capacity, specific surface area, swelling capacity, and reactivity to acids [7].
Williams and Haydel (2010) made the distinction between “healing clays” and “antibacterial clays”,which may cure several diseases only by their unique physical and chemical properties (e.g., highabsorbance, surface area, heat capacity, exchange capacity, etc.) or by killing pathogenic bacteria [8].
The absorptive capabilities of clays have been explored in a variety of cosmetic and pharmaceuticalformulations and as a contributor to the healing of diseases, as well as for their cation exchangecapacity and extremely fine particle size, which are important properties for removing oils, secretions,toxins, and contaminants from the skin. Cation exchange experiments showed that the antibacterialcomponent of the clay can be moved, implying the presence of exchangeable cations in the antibacterialprocess [8]. Studies made on a natural clay from the Colombian Amazon and compared to the standardreference of smectite and kaolinite showed chemical interactions that are detrimental to bacteria byabsorbing nutrients (e.g., Mg, P) and by toxic metal supply (e.g., Al) [9].
Humans and equine athletes share acute and chronic tendon injuries as the most commonorthopedic affections, having similar structural (reparation) and functional (regeneration) recoveryprocess. [10].
Ca, P, K, and S play a pivotal role in both the growth and the degeneration of thecollagenous bone–cartilage interface of articulating joints demonstrated on equine osteoarthriticlesions (metacarpophalangeal joint) by detecting variations of elemental presence, using Synchrotronradiation micro X-ray fluorescence analysis [11].
86

Int. J. Environ. Res. Public Health 2020, 17, 3365
The conservative veterinary therapy protocols include the same considerations as the humanmedicine protocols for orthopedic affections: cold applications, pressure-supporting bandages,controlled exercise, medicines to be injected, electrotherapy sessions, electromagnetic stimulation,ultrasound and laser therapy, or in an extreme clinical recommendation, surgical therapy [10].Intra-articular (IA) administration of drugs in the treatment of musculoskeletal injuries has the objectiveof directing the drug delivery to the affected tissues and is commonly used by veterinarians and byMedical Physical Rehabilitation specialists. The use of corticosteroids or nonsteroidal anti-inflammatorydrugs is common in racehorses and has become a problem for veterinarians due to the fact that themedicine could be masking a possible musculoskeletal condition and may contribute to injuries duringcompetition [10,12]. Although there are a significant number of nonsteroidal anti-inflammatory drug(NSAID) formulations designed for the treatment of muscle and tendon traumatic conditions in humanbeings, when compared with the same problem in equine clinical practice, these formulations aremore commonly used in horses. In vitro studies to evaluate and compare the penetration of diclofenac,a common NSAID designed for human application, revealed a significantly lower penetration throughhorse skin [13].
Complementary and alternative medicine (CAM) gained good acceptance in human medicine,mainly in the treatment of musculoskeletal pathologies and is now getting some popularity in veterinarymedicine [14], therefore, regenerative therapies in horses may have applications for future humanmedicine and vice versa [10]. The initial interest and positive opinion on complementary alternativeveterinary medicine (CAVM) started amongst horse owners. Most of them applied CAM therapieswithout the previous knowledge of their veterinarian, mainly to avoid possible conflict and fearing thattheir veterinarian might not want to continue providing veterinary care for their horse [14]. Some ofthis CAVM was supported by traditional Chinese veterinary medicine (TCVM), using acupuncturephysiology to treat pain [15].
There is a lack of dissemination of traditional therapeutic procedures or rehabilitation programsusing pelotherapy by key users (e.g., equine owners, equine trainers, equine veterinary, and industry)in the research field.
Equine rehabilitation programs must be designed with the previous identification of the risk factorsthat could predispose to musculoskeletal injury, considering the phases of healing, the rehabilitationgoals, and the techniques used for acute injuries in horses [16].
The use of clays in these rehabilitation programs should fulfill the requirements regarding theirsafety and stability and should preferably be subjected to pre-market approval.
In this work, we characterize the mineralogical composition and technical performance of equinepeloids used in prevention and rehabilitation programs. The main goals are contribution to theestablishment of veterinarian clay therapeutic criteria, disclosure of the protocoled healing mixture:“clay acetic cataplasm”, and to contribute to ethnoveterinary scientific databases.
2. Materials and Methods
2.1. Data Preparation
For this study, we selected seven commercial clays routinely used in veterinary medicine andsuggested by the CIISA—Center for Interdisciplinary Research in Animal Health (University of Lisbon,Portugal) for the treatment of equine musculoskeletal injuries, namely front- and hind-limb tendon andligament injuries. VET.1, VET.5, VET.6, and VET.7 are four industrial pasty clays sold in the market asan equine clay treatment to be applied in a thick layer against the lay of the hair, after intensive exerciseor a competition. VET.2, VET.3, and VET.4 are natural “green” clays, sold for human application andwith no specific usage recommendations.
The protocol performed by CIISA for the treatment of horse musculoskeletal limb injuries proposesa 1:10 acetic acid (AA) and piped water solution with the necessary proportion of dried “green” clay.The CIISA protocoled solution was prepared with food acetic acid, pH 2.7 at 25 C resulting in a
87

Int. J. Environ. Res. Public Health 2020, 17, 3365
solution (1:10) with pH of 2.9 at 25 C. This protocol solution is only applied on VET.2, VET.3, and VET.4.This resulting cataplasm must ensure adhesive proprieties when applied to the injured area. After this,the injured area is wrapped in cling film, which acts as a thermal adjuvant, prolonging the therapeuticeffect of the clays. The animal is then supervised by the clinical therapist, who decides when the clayeffect is assured. We compared the commercial clays’ results with the protocoled healing clay andacetic acid mixture.
Clays were distributed in three groups (Table 1), Group I and Group II according to theircommercial purpose, and Group III for the protocoled healing mixture. All samples were dried at50 C, with no previous treatment, and maintained in closed containers at room temperature. For thepreparation of the protocoled mixture, 10 g of the Group I clays was dispersed in 10 mL of acetic acidsolution (1:10) and left to rest for 24 hours. These samples, VET.2AA, VET.3AA, and VET.4AA, werealso dried at 50 C. The pH value of the samples was measured with a HANNA HI 9126 pH meter,previously calibrated with standards (Titisol standard solutions) at pH 4 and pH 7 with an accuracyof ±0.05.
Table 1. Sample identification.
Group Samples Type Commercial Purpose
IVET.2 Powder Human dermal applicationVET.3 Powder Human dermal applicationVET.4 Powder Human dermal application
II
VET.1 Paste Equine dermal applicationVET.5 Paste Equine dermal applicationVET.6 Paste Equine dermal applicationVET.7 Paste Equine dermal application
III 1VET.2AA Paste Protocoled healing mixtureVET.3AA Paste Protocoled healing mixtureVET.4AA Paste Protocoled healing mixture
1 CIISA—Center for Interdisciplinary Research in Animal Health protocol.
2.2. Mineralogical, Chemical, and Technological Analysis
The mineralogical analysis was carried out by X-ray diffraction (XRD) analysis, using aPhilips/Panalytical X’Pert-Pro MPD, Kα Cu (α = 1.5405 Å) radiation, with 0.02 2θ s−1 steps ingoniometer speed. For the preparation of preferentially oriented aggregates of the clay (<2 µm fraction),a suspension was placed on a glass slide and air dried. XRD scans were run on this air-dried glassslide, and afterward a glycerol saturation and a final heat treatment at 500 C were carried out [17].The semi-quantitative identification of the principal clay minerals was obtained by measuring peakareas of the basal reflections, considering the full width at half maximum and then weighted byempirically estimated factors [17,18].
The particle size distribution of these clays was determined by an X-ray beam particle size analyzer(Micromeritics Sedigraph III Plus). The samples were dried and washed with distilled water, restingfor 24 hours to ensure the separation between all particles. Then, the samples were sieved (106 µm)and dried. The dried sample was gently disaggregated, and the uniformity was ensured by quartiledistribution. After that, 80 mL of sodium hexametaphosphate was added to 5.8 g of each sample andleft to stand for 8 hours with magnetic stirring. At the end, the sample was sieved again (106 µm) andsubmitted to ultrasound for 40 s before the equipment measurement step.
The chemical composition of the commercial clays was assessed by X-ray fluorescence (XRF)using a Panalytical AX-IOS PW 4400/40. Loss on ignition (LOI) was also assessed by heating 1 g of thesample at 1000 C for 1 hour in a furnace.
Abrasiveness was measured with an Einlehner AT-100 apparatus [19,20], and Atterberg limitswere assessed using Casagrande Shell to obtain the liquid limit and using molding rolls in a glass platefor the plastic limit [20,21]. The plasticity index was calculated in accordance with the Portuguese
88

Int. J. Environ. Res. Public Health 2020, 17, 3365
standard, NP 143-1969. The expansion index test was performed by the standard LNEC E200-1967,Portuguese edition for ASTM (2008) to measure the swelling capacity of the samples when absorbingdistilled water [20].
Samples were heated to 60 C and the heat diffusiveness was assessed by a dual-channelthermometer, Lutron TM-9064. The range of time values was measured between 60 and 29 C. Linseedoil was used to measure the oil absorption capacity of the clays. Fifteen grams of dry clay was weighedtogether with an amount of linseed oil. In a glass plate, linseed oil was slowly added, drop by drop,until it was possible to achieve the consistency necessary to obtain a solid roll of clay. The remainingoil and the clay roll were weighted for the oil absorption calculation.
The cation exchange capacity (CEC) was estimated by the ammonium acetate method, and theexchangeable cations (Na+, K+, Mg2+, and Ca2+) were determined by an atomic absorptionspectrophotometer [22]. Specific surface area (SSA) was estimated by BET analysis—Gemini II 2370.
3. Results
3.1. Mineralogical and Chemical Characterization
3.1.1. Grain Size Distribution and Mineralogical Composition
The results from the particle size distribution of the samples are shown in Figure 1. Group Isamples contained more than 55% of fine fraction content, with an average diameter of ~3 µm. In GroupII, VET.1, VET.6, and VET.7 had around 65%, 68%, and 79%, respectively, of particles sized between2 and 100 µm, and different average diameters, VET.1 and VET.6 had a D50 of 0.708 and 0.373 µm,and VET.7 had a D50 of 1.292 µm. For the VET.5 sample, the granulometry size distribution was as inGroup I samples, 66% of fine fraction content and an average diameter of ~3 µm.
μ
μ
μ μ μ
0
0.5
1
1.5
2
2.5
3
3.5
0
20
40
60
80
100
VET 1 VET 2 VET 3 VET 4 VET 5 VET 6 VET 7
Average Grain Diam
eterr (μm
)
Grain Size distribution (%)
Samples
<2 μm (%) 2 ‐ 100 μm (%) D50 μm
Figure 1. Grain size distribution of the Group I and Group II samples.
The mineralogical composition of the Group I and Group II clays is reported in Table 2. All sampleswere polymineralic (Figure 2) and exhibited differences in mineralogical composition. Consideringthe average for each group, we can classify Group I (n = 3) mineralogically as being composed bycarbonates (calcite and dolomite) and silicates (quartz and phyllosilicates/clay minerals), while GroupII is much richer in silicates, with a pronounced increase in phyllosilicates/clay minerals. The mainclay minerals (Figure 3) are kaolinite (25%) followed by illite (7%) in Group I, and illite (68%) followedby kaolinite (2%) in Group II, except for VET.7 (67% kaolinite and 28% illite).
89

Int. J. Environ. Res. Public Health 2020, 17, 3365
‐
Figure 2. X-ray diffraction (Cal: calcite; Qz: quartz; Dol: dolomite; Phy: phyllosilicates).
‐
(a)
Figure 3. Cont.
90

Int. J. Environ. Res. Public Health 2020, 17, 3365
(b)
(c)
Figure 3. Cont.
91

Int. J. Environ. Res. Public Health 2020, 17, 3365
(d)
(e)
Figure 3. Cont.
92

Int. J. Environ. Res. Public Health 2020, 17, 3365
(f)
(g)
‐ ‐
‐
‐
‐
‐ ‐
‐ ‐ ‐
Figure 3. X-ray diffraction patterns of air-dried oriented aggregates (a) VET.1; (b) VET.2; (c) VET.3;(d) VET.4; (e) VET.5; (f) VET.6; (g) VET.7. (Ill: illite; Sm: smectite; Kt: kaolinite).
93

Int. J. Environ. Res. Public Health 2020, 17, 3365
Table 2. Mineralogical composition (%).
Total Sample (%) Clay Minerals (%)
Group Samples Qz Hal Calc Dol Sm Kt Ill
IVET.2 6 - 47 13 <1 29 5VET.3 9 - 43 21 <1 21 6VET.4 10 - 39 17 <1 24 10
II
VET.1 44 2 - - 1 3 50VET.5 8 - 15 - - 4 73VET.6 3 - 16 - - 1 80VET.7 5 - - - - 67 28
IIIVET.2AA 7 - 52 16 <1 19 6VET.3AA 14 - 56 10 <1 17 3VET.4AA 11 - 58 11 <1 17 3
Qz = quartz; Hal = halite; Calc = calcite; Dol = dolomite; Sm = smectite; Kt = kaolinite; Ill = illite.
3.1.2. Chemical Composition
The content of major and minor chemical elements is shown in Table 3. Differences in chemicalcomposition were in accordance with those detected in the mineralogical composition; Group I (themore carbonated) was richer in CaO (27%) while Group II was richer in SiO2 (44%) as well as in Al2O3,Fe2O3, and K2O.
Table 3. Major and minor element composition of the samples. LOI = loss on ignition.
Samples
Group I Group III Group II
VET.2 VET.3 VET.4VET.2
AAVET.3
AAVET.4
AAVET.1 VET.5 VET.6 VET.7
Maj
orel
emen
ts(w
t.%)
SiO2 24.424 26.272 24.924 25.457 25.009 25.499 46.078 41.723 41.110 46.206Al2O3 10.508 11.147 10.488 11.062 10.906 11.120 15.417 18.195 17.980 35.098Fe2O3 2.597 2.957 2.664 2.885 2.721 2.916 6.185 6.423 6.354 0.778MgO 3.364 2.742 3.423 2.334 2.535 2.415 2.626 3.129 3.271 0.427CaO 26.859 25.976 27.391 28.636 27.071 28.811 4.233 4.901 5.841 0.049
Na2O 0.096 0.083 0.082 0.093 0.084 0.088 3.292 0.146 0.147 0.781K2O 1.568 1.649 1.585 1.793 1.692 1.788 2.976 6.111 6.184 1.831TiO2 0.328 0.363 0.342 0.352 0.348 0.366 0.824 0.629 0.649 0.023P2O5 0.046 0.048 0.041 0.052 0.047 0.046 0.196 0.166 0.233 0.144SO3 1.295 1.265 1.219 1.081 0.998 1.068 2.239 0.323 0.029 0.100LOI 28.65 27.20 27.65 25.96 28.270 25.550 13.83 17.85 17.80 14.3
Min
orel
emen
ts(p
pm)
As * • • • • • • 17 24.6 21.5 8.2Cd * • • • • • • • • • •
Pb * 13.7 14.4 12.8 16.1 14.8 16.1 31.6 32.2 31.8 21.6Cr 51.9 57.4 53.4 54.6 52.3 54.8 130 68.5 66.7 4.2Cu 15.4 8.1 15.0 8.4 11.6 11.6 14 22.2 24.4 29.5Ni 16.0 19.7 16.0 17.7 15.4 16.1 33.6 29.0 29.3 5.0Zn 24.3 28.2 26.9 24.3 23.0 23.2 95.2 120 140 22.3Ba 110 120 150 160 150 110 250 280 200 150Co • 7.5 4.9 5.5 6.1 4.8 14.7 10.2 11.7 •
Sr 230 220 200 240 220 240 210 180 280 160V 59.7 74.5 72.4 57.2 56.4 57.7 100 72.2 78.1 5.4
Sb * • • • • • • • • • •
Sc 19.8 18.6 17.1 20.6 17.9 21.0 10.9 10.1 11.2 •
• Not determined; * Potentially toxic elements.
Considering the chemical elements that are potentially toxic and not allowed in care products(Regulation (EC) 1223/2009), the Group II exhibited the highest values for As, Pb, Cr, Ni, and Zn whencompared with Group I, for human usage.
94
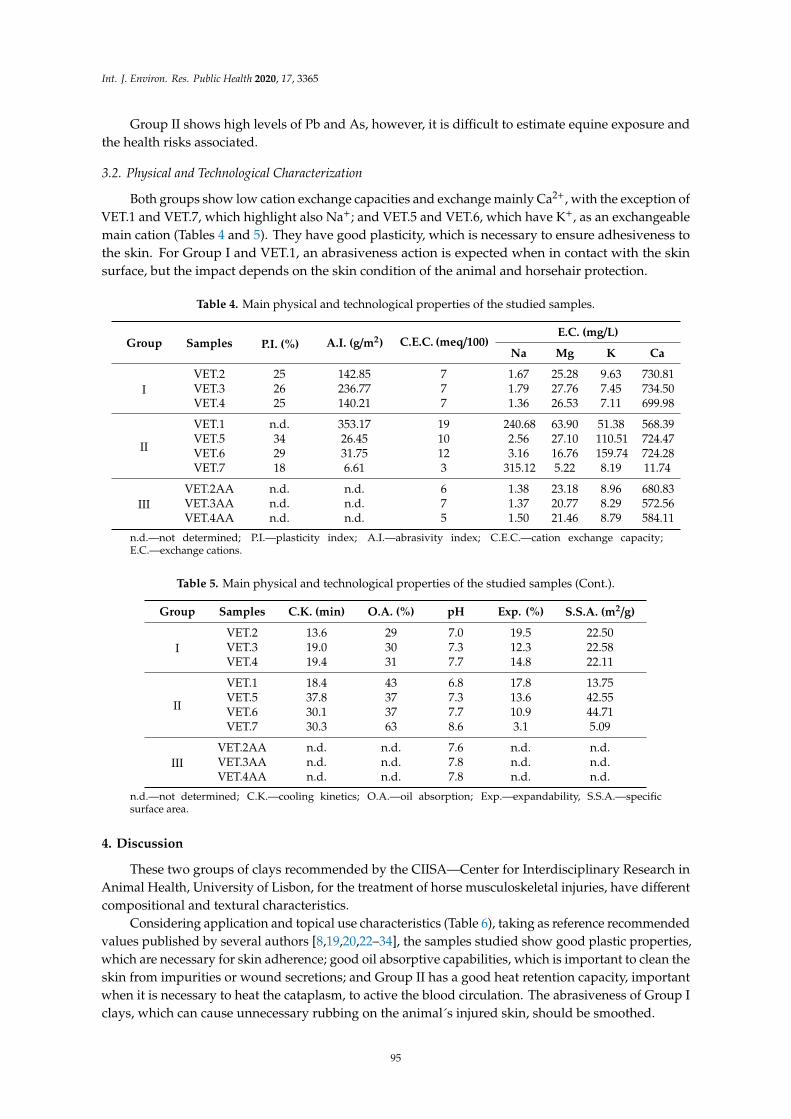
Int. J. Environ. Res. Public Health 2020, 17, 3365
Group II shows high levels of Pb and As, however, it is difficult to estimate equine exposure andthe health risks associated.
3.2. Physical and Technological Characterization
Both groups show low cation exchange capacities and exchange mainly Ca2+, with the exception ofVET.1 and VET.7, which highlight also Na+; and VET.5 and VET.6, which have K+, as an exchangeablemain cation (Tables 4 and 5). They have good plasticity, which is necessary to ensure adhesiveness tothe skin. For Group I and VET.1, an abrasiveness action is expected when in contact with the skinsurface, but the impact depends on the skin condition of the animal and horsehair protection.
Table 4. Main physical and technological properties of the studied samples.
Group Samples P.I. (%) A.I. (g/m2) C.E.C. (meq/100)E.C. (mg/L)
Na Mg K Ca
IVET.2 25 142.85 7 1.67 25.28 9.63 730.81VET.3 26 236.77 7 1.79 27.76 7.45 734.50VET.4 25 140.21 7 1.36 26.53 7.11 699.98
II
VET.1 n.d. 353.17 19 240.68 63.90 51.38 568.39VET.5 34 26.45 10 2.56 27.10 110.51 724.47VET.6 29 31.75 12 3.16 16.76 159.74 724.28VET.7 18 6.61 3 315.12 5.22 8.19 11.74
IIIVET.2AA n.d. n.d. 6 1.38 23.18 8.96 680.83VET.3AA n.d. n.d. 7 1.37 20.77 8.29 572.56VET.4AA n.d. n.d. 5 1.50 21.46 8.79 584.11
n.d.—not determined; P.I.—plasticity index; A.I.—abrasivity index; C.E.C.—cation exchange capacity;E.C.—exchange cations.
Table 5. Main physical and technological properties of the studied samples (Cont.).
Group Samples C.K. (min) O.A. (%) pH Exp. (%) S.S.A. (m2/g)
IVET.2 13.6 29 7.0 19.5 22.50VET.3 19.0 30 7.3 12.3 22.58VET.4 19.4 31 7.7 14.8 22.11
II
VET.1 18.4 43 6.8 17.8 13.75VET.5 37.8 37 7.3 13.6 42.55VET.6 30.1 37 7.7 10.9 44.71VET.7 30.3 63 8.6 3.1 5.09
IIIVET.2AA n.d. n.d. 7.6 n.d. n.d.VET.3AA n.d. n.d. 7.8 n.d. n.d.VET.4AA n.d. n.d. 7.8 n.d. n.d.
n.d.—not determined; C.K.—cooling kinetics; O.A.—oil absorption; Exp.—expandability, S.S.A.—specificsurface area.
4. Discussion
These two groups of clays recommended by the CIISA—Center for Interdisciplinary Research inAnimal Health, University of Lisbon, for the treatment of horse musculoskeletal injuries, have differentcompositional and textural characteristics.
Considering application and topical use characteristics (Table 6), taking as reference recommendedvalues published by several authors [8,19,20,22–34], the samples studied show good plastic properties,which are necessary for skin adherence; good oil absorptive capabilities, which is important to clean theskin from impurities or wound secretions; and Group II has a good heat retention capacity, importantwhen it is necessary to heat the cataplasm, to active the blood circulation. The abrasiveness of Group Iclays, which can cause unnecessary rubbing on the animal´s injured skin, should be smoothed.
95

Int. J. Environ. Res. Public Health 2020, 17, 3365
Table 6. Veterinary clay group characterizations.
Properties VET.1 VET.2 VET.3 VET.4 VET.5 VET.6 VET.7
Adhesiveness[17,18,20,22,29,31] N N N N N N •
Abrasiveness[17,18,20–22,29,31,32] H H H H N N N
Hazardous elements[20,23,28,31,32] H N N N H H H
Essential elements[20,21,30–32]
N
Ca2+,Na+
N
Ca2+N
Ca2+N
Ca2+
N
Ca2+,K+
N
Ca2+,K+
N
Na+
Oil Absorption[18,20–22,31,32] N N N N N N N
Heat Retention[18,20,21,27,31,32] N • • • N N N
Antibacterial performance[6,24–26] H
N
VET.2AAN
VET.3AAN
VET.4AA H H H
N Advisable; • Advisable with limitations; H Needs vigilance.
Calcium is an essential element that is important for the growth and regeneration of collagenousbone-cartilage and this may explain the traditionally used “green” carbonated clay for the acetic acidcataplasm formulation. Despite As and Pb being technically avoidable above 0.5 and 2.0 mg/kg [25],respectively, the fact that they are above the risk limit that is internationally accepted for pharmaceuticalformulations and cosmetics applied to human beings, and that several factors should be considered intransdermal penetration for humans and for horses, the same formulation may have different efficaciesand safety profiles when used in species for which they were not developed [13]. Group II are claysthat were industrially developed specifically for equine usage.
The addition of acetic acid (Group III) does not reveal any significant chemical changes whencompared with Group I, apart from the pH that becomes more alkaline (closer to 8). All samples havea pH around 7 and 8. Organic acids (e.g., acetic acid) are usually used in food as natural preservativesand antibacterial agents. The manipulation of clay minerals to eliminate clinical and environmentalbacteria is very common and the investigation of the antibacterial properties of natural clays has takena new approach [8,26–28], where the possibility of incorporating bactericidal properties into clays mayalso be activated by the use of an acid solution in the treatment [27]. Some studies reveal the strongantibacterial effect of acetic acid combined with silver nanoparticles (AgNPS), where the release of Ag+
responsible for the antibacterial activity increased by the addition of acetic acid [28].The obtained data, when analyzed in comparison to reference values, allowed us to consider that
both groups are adequate for therapeutic proposes, such as the treatment of horse musculoskeletalinjuries, but Group II shows the best characteristics. Group II, having a prior industrial preparation,is technologically adapted for use in horses. The use of additives and preservatives in their preparationmay be the reason why they are less abrasive and toxic.
The establishment of a health database considering ethnoveterinary medicine studies may enrichthe equine health databases, useful to institutions, veterinarians, animal owners, and also providingguidelines for the investigation of new therapies and for scientific evidence findings.
5. Conclusions
The potential benefit of using therapeutic clays in equine lameness injuries is to minimize theside-effects associated with oral and intra-articular administration of anti-inflammatory medicines andto sustain a local release of therapeutic elements. This study can also be considered as a contributionto a major database of clays used for animal topical application, to the awakening of traditional andancestral methodologies in healing clay preparations, and also to the knowledge about the contributionof these clays in the rehabilitation programs developed by veterinarians.
96

Int. J. Environ. Res. Public Health 2020, 17, 3365
Through this study we tried to address the knowledge gaps about the mineralogical and chemicalcomposition of clays used for equine peloid preparation and assessed their technical performance.This research assured that the studied clays fulfill the safety and stability requirements for theserehabilitation programs, thus, enabling them to be submitted for pre-market technical and legalapproval process.
The main limitation of this study was the impossibility to correlate CIISA therapeutic formulationresults with results obtained with specific equine commercial clays. Further work is needed to comparethe antibacterial effectiveness of this protocol with other mud cataplasm protocols applied to horsesand humans. This would be important and necessary for the establishment of healing criteria forveterinary clays.
Most of the thermal spas around the world recommend their own mud baths or local mudcataplasm applications, as they recognize therapeutic results through their anti-inflammatory, analgesic,and antiseptic effects on musculoskeletal and dermatologic pathologies, which are increasinglysupported by clinical trials. The efficacy of the candidate clays to be used in veterinary pelotherapyshould be evaluated and compared with human pelotherapy results and supported by clinical trials.
The safety and regulatory compliance of these products should also be a priority. The identificationof unwanted trace elements or toxic substances based on the raw material source (natural orsynthetic) should be a determinant for market surveillance of the appropriate limits expected inthese natural products.
Author Contributions: Conceptualization, C.M.B.; methodology C.M.B. and F.R.; resources, C.M.B., Â.C., D.T.and C.S.; investigation, C.M.B., F.R. and P.T.; project administration, C.M.B.; writing—original draft preparation,C.M.B.; writing—review and editing, C.M.B. and F.R.; supervision, F.R. All authors have read and agreed to thepublished version of the manuscript.
Funding: This research was funded by FCT—Fundação para a Ciência e a Tecnologia and Exatronic, Lda,grant number SFRH/BDE/11062/2015 and also supported by GeoBioTec Research Center (UIDB/04035/2020),funded by FCT, FEDER funds through the Operational Program Competitiveness Factors—COMPETE.
Acknowledgments: We are grateful to CIISA—Center for Interdisciplinary Research in Animal Health, Universityof Lisbon, for the samples used for experiments.
Conflicts of Interest: The authors declare no conflict of interest.
References
1. Gomes, C. Healing and edible clays: A review of basic concepts, benefits and risks. Environ. Geochem. Health
2018, 40, 1739–1765. [CrossRef]2. Williams, B.W. Natural antibacterial clays: Historical uses and modern advances. Clays Clay Miner. 2019, 67,
7–24. [CrossRef]3. González, J.A.; Amich, F.; Postigo-Mota, S.; Vallejo, J.R. The use of wild vertebrates in contemporary Spanish
ethnoveterinary medicine. J. Ethnopharmacol. 2016, 191, 135–151. [CrossRef] [PubMed]4. Slamova, R.; Trckova, M.; Vondruskova, H.; Zraly, Z.; Pavlik, I. Clay minerals in animal nutrition. Appl. Clay Sci.
2011, 51, 395–398. [CrossRef]5. Pieszka, M.; Łuszczynski, J.; Hedrzak, M.; Goncharova, K.; Pierzynowski, S.G. The efficacy of kaolin clay in
reducing the duration and severity of “heat” diarrhea in foals. Turk. J. Vet. Anim. Sci. 2016, 40, 323–328.[CrossRef]
6. López-Galindo, A.; Viseras, C.; Cerezo, P. Compositional, technical and safety specifications of clays to beused as pharmaceutical and cosmetic products. Appl. Clay Sci. 2007, 36, 51–63. [CrossRef]
7. Carretero, M.I.; Pozo, M. Clay and non-clay minerals in the pharmaceutical industry. Part I. Excipients andmedical applications. Appl. Clay Sci. 2009, 46, 73–80. [CrossRef]
8. Williams, L.B.; Haydel, S.E. Evaluation of the medicinal use of clay minerals as antibacterial agents. Int. Geol.
Rev. 2010, 52, 745–770. [CrossRef]9. Londono, S.C.; Williams, L.B. Unraveling the antibacterial mode of action of a clay from the Colombian
Amazon. Environ. Geochem. Health 2015, 38, 363–379. [CrossRef]
97

Int. J. Environ. Res. Public Health 2020, 17, 3365
10. Spaas, J.H.; Guest, D.J.; Van de Walle, G.R. Tendon regeneration in human and equine athletes. Sports Med.
2012, 42, 871–890. [CrossRef]11. Kaabar, W.; Gundogdu, O.; Tzaphlidou, M.; Janousch, M.; Attenburrow, D.; Bradley, D.A. Investigation of
essential element distribution in the equine metacarpophalangeal joint using a synchrotron radiation microx-ray fluorescence technique. In Proceedings of the National Physics Conference 2007—PERFIK 2007, KualaTerengganu, Malaysia, 26–28 December 2007; Volume 25, pp. 18–24. [CrossRef]
12. Soma, L.R.; Uboh, C.E.; Maylin, G.M. The use of phenylbutazone in the horse. J. Vet. Pharmacol. Ther. 2012,35, 1–12. [CrossRef] [PubMed]
13. Andreeta, A.; Verde, C.; Babusci, M.; Muller, R.; Simpson, M.I.; Landoni, M.F. Comparison of diclofenacdiethylamine permeation across horse skin from five commercial medical human formulations. J. Equine
Vet. Sci. 2011, 31, 502–505. [CrossRef]14. Bergenstrahle, A.; Nielsen, B.D. Attitude and behavior of veterinarians surrounding the use of complementary
and alternative veterinary medicine in the treatment of equine musculoskeletal pain. J. Equine Vet. Sci. 2016,45, 87–97. [CrossRef]
15. Robinson, N.G. Making sense of the metaphor: How acupuncture works neurophysiologically. J. Equine Vet.
Sci. 2009, 29, 642–644. [CrossRef]16. Davies, L. Equine rehabilitation. In Pain Management in Veterinary Practice, 1st ed.; Egger, C.M., Love, L.,
Doherty, T., Eds.; John Wiley & Sons: Hoboken, NJ, USA, 2013; Volume 1, pp. 1–464. [CrossRef]17. Oliveira, A.; Rocha, F.; Rodrigues, A.; Jouanneau, J.; Dias, J.; Weber, O.; Gomes, C. Clay minerals from the
sedimentary cover from the Northwest Iberian shelf. Prog. Oceanogr. 2002, 52, 233–247. [CrossRef]18. Galhano, C.; Rocha, F.; Gomes, C. Geostatistical analysis of the influence of textural, mineralogical and
geochemical parameters on the geotechnical behaviour of the “Argilas de Aveiro” Formation (Portugal).Clay Miner. 1999, 34, 109–116. [CrossRef]
19. Quintela, A.; Costa, C.; Terroso, D.; Rocha, F. Abrasiveness index of dispersions of Portuguese clays usingthe Einlehner method: Influence of clay parameters. Clay Miner. 2014, 49, 27–34. [CrossRef]
20. Rebelo, M.; Viseras, C.; Galindo, A.L.; Rocha, F.; Silva, E.F. Rheological and thermal characterization ofpeloids made of selected Portuguese geological materials. Appl. Clay Sci. 2011, 52, 219–227. [CrossRef]
21. Quintela, A.; Costa, C.; Terroso, D.; Rocha, F. Liquid limit determination of clayey material by Casagrandemethod, fall cone test and EBS parameter. Mater. Technol. Adv. Perform. Mat. 2014, 29, 82–87. [CrossRef]
22. Rebelo, M.; Rocha, F.; Ferreira da Silva, E. Mineralogical and physicochemical characterization of selectedPortuguese Mesozoic-Cenozoic muddy/clayey raw materials to be potentially used as healing clays.Clay Miner. 2010, 45, 229–240. [CrossRef]
23. Quintela, A.; Terroso, D.; Ferreira da Silva, E.; Rocha, F. Certification and quality criteria of peloids in use fortherapeutic purposes. Clay Miner. 2012, 47, 441–451. [CrossRef]
24. Quintela, A.; Terroso, D.; Costa, C.; Sá, H.; Nunes, J.C.; Rocha, F. Characterization and evaluation ofhydrothermally influenced clayey sediments from Caldeiras da Ribeira Grande fumarolic field (AzoresArchipelago, Portugal) used for aesthetic and pelotherapy purposes. Environ. Earth Sci. 2015, 73, 2833–2842.[CrossRef]
25. Bund, B.V.L. Technically avoidable heavy metal contents in cosmetic products. J. Consum. Prot. Food Saf.
2017, 12, 51–53. [CrossRef]26. Kalfa, A.; Rakovitsky, N.; Tavassi, M.; Ryskin, M.; Ben-Ari, J.; Etkin, H.; Shuali, U.; Nir, S. Removal of
Escherichia coli and total bacteria from water by granulated micelle-clay complexes: Filter regeneration andmodeling of filtration kinetics. Appl. Clay Sci. 2017, 147, 63–68. [CrossRef]
27. Santos, M.F.; Oliveira, C.M.; Tachinski, C.T.; Fernandes, M.P.; Pitch, C.T.; Angioletto, E.; Riella, H.G.;Fiori, M.A. Bactericidal properties of bentonite treated with Ag+ and acid. Int. J. Miner. Process. 2011, 100,51–53. [CrossRef]
28. Sedira, S.; Ayachi, A.A.; Lakehal, S.; Fateh, M.; Achour, S. Silver nanoparticles in combination with aceticacid and zinc oxide quantum dots for antibacterial activities improvement—A comparative study. Appl. Surf.
Sci. 2014, 311, 659–665. [CrossRef]29. García-Villén, F.; Sánchez-Espejo, R.; Carazo, E.; Borrego-Sánchez, A.; Aguzzi, C.; Cerezo, P.; Viseras, C.
Characterization of Andalusian peats for skin health care formulations. Appl. Clay Sci. 2017, 160, 201–205.[CrossRef]
98
Int. J. Environ. Res. Public Health 2020, 17, 3365
30. Bocca, B.; Pino, A.; Alimonti, A.; Forte, G. Toxic metals contained in cosmetics: A status report. Regul. Toxicol.
Pharmacol. 2014, 68, 447–467. [CrossRef]31. Pozo, M.; Carretero, M.I.; Maraver, F.; Pozo, E.; Gómez, I.; Armijo, F.; Rubí, J.A.M. Composition and
physico-chemical properties of peloids used in Spanish spas: A comparative study. Appl. Clay Sci. 2013,83–84, 270–279. [CrossRef]
32. Fernández-González, M.V.; Martín-García, J.M.; Delgado, G.; Párraga, J.; Delgado, R. A study of the chemical,mineralogical and physicochemical properties of peloids prepared with two medicinal mineral waters fromLanjarón Spa (Granada, Spain). Appl. Clay Sci. 2013, 80–81, 107–116. [CrossRef]
33. Costa, C.; Fortes, A.; Rocha, F.; Cerqueira, A.; Santos, D.; Amaral, M.H. Characterization of Portuguesegypsums as raw materials for Dermocosmetics. Clay Miner. 2019, 54, 277–281. [CrossRef]
34. Cerqueira, A.; Costa, C.; Sequeira, C.; Terroso, D.; Rocha, F. Assessment of clayey materials from Santa MariaIsland (Azores, Portugal) for peloids preparation. Clay Miner. 2019, 54, 299–307. [CrossRef]
© 2020 by the authors. Licensee MDPI, Basel, Switzerland. This article is an open accessarticle distributed under the terms and conditions of the Creative Commons Attribution(CC BY) license (http://creativecommons.org/licenses/by/4.0/).
99


International Journal of
Environmental Research
and Public Health
Article
Sources of Potentially Toxic Metals in Sediments ofthe Mussulo Lagoon (Angola) and Implications forHuman Health
Pedro Dinis 1,* , Amílcar Armando 2 and João Pratas 3
1 MARE - Marine and Environmental Sciences Centre, Department of Earth Sciences, University of Coimbra,3030-790 Coimbra, Portugal
2 Universidade Metodista de Angola, Rua Nossa Senhora da Muxima 10, Caixa Postal 6739, Luanda, Angola;[email protected]
3 Geosciences Center, Department of Earth Sciences, University of Coimbra, Rua Sílvio Lima, Univ. Coimbra –Pólo II, 3030-790 Coimbra, Portugal; [email protected]
* Correspondence: [email protected]
Received: 10 March 2020; Accepted: 1 April 2020; Published: 4 April 2020
Abstract: The Mussulo lagoon is a coastal environment located near Luanda, one of the SW Africancities that has been growing more rapidly during the last decades. Geochemical, mineralogical, andgrain-size data obtained for the lagoon sediments are analyzed together, in order to establish the factorsthat control the distribution of some potentially toxic elements (PTEs). Sediments from northernlocation tend to be enriched in feldspar and, despite some variability in grain-size distributions,in fine-grained detrital minerals; southern lagoon sediments display very homogenous grain-sizedistribution and are enriched in minerals associated with salt precipitation (halite and gypsum).Multivariate statistics reveal a close link between some PTEs, namely Co, Hg, Ni, and Pb, for whichan anthropogenic source can be postulated. On the other end, As seems to be associated with naturalauthigenic precipitation in southern lagoon sectors. Sediments enriched in clay also tend to yieldmore Fe, Mn, Zn, and Cu, but it is unclear whether their sources are natural or anthropogenic. Hazardindexes calculated for children are higher than 1 for As and Co, indicating potential non-carcinogenicrisk. For the other elements, and for adults, there is no potential carcinogenic or non-carcinogenic risk.
Keywords: Mussulo lagoon; Sediment composition; Factors controlling sediment geochemistry;Human Health Risk Assessment
1. Introduction
Luanda is one the African cities that has been growing more rapidly during the early 21stcentury [1]. The tendency for rapid rises in the number of inhabitants started before, in particularduring the civil war after the independence of Angola, in 1975, when the population left the ruralareas and sought refuge in the main cities. Hence, the city, projected to hold ~500,000 inhabitants,grew dramatically during the last decades, holding more than 10 times that number today. The risein population also saw a rise in problems at the level of basic sanitation, collection, transport, andtreatment of municipal solid waste, as well as limitations in the regulation of potentially hazardouswaste disposal. Besides its large population, the city of Luanda also comprises the biggest industrialpark in the country, leading to additional risks of environmental pollution. Some of the potentiallyhazardous wastes produced in Luanda are actually disposed of in open sites and dragged into the riversand the sea during periods of rainfall. Thus, significant concentrations of potentially toxic elements(PTEs) are likely transported to coastal environments and can be concentrated in low hydrodynamicsettings, such as the Mussulo lagoon, which is located a few km to the south of Luanda city centre.
101
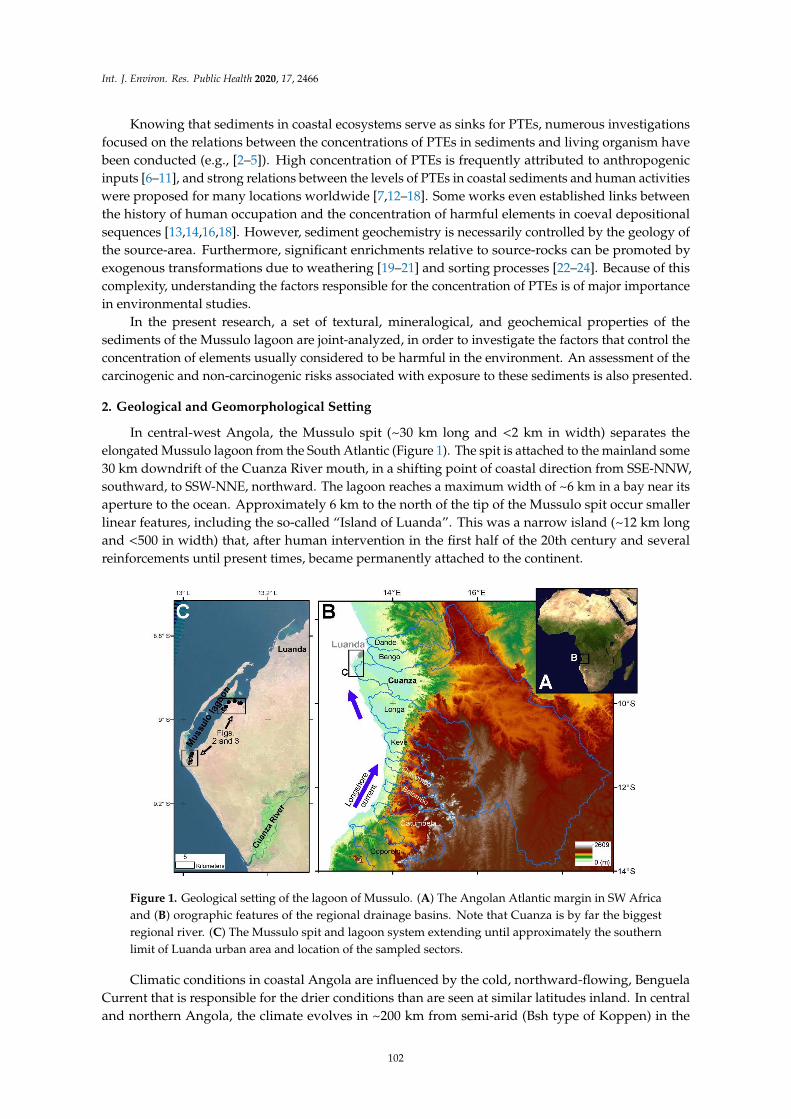
Int. J. Environ. Res. Public Health 2020, 17, 2466
Knowing that sediments in coastal ecosystems serve as sinks for PTEs, numerous investigationsfocused on the relations between the concentrations of PTEs in sediments and living organism havebeen conducted (e.g., [2–5]). High concentration of PTEs is frequently attributed to anthropogenicinputs [6–11], and strong relations between the levels of PTEs in coastal sediments and human activitieswere proposed for many locations worldwide [7,12–18]. Some works even established links betweenthe history of human occupation and the concentration of harmful elements in coeval depositionalsequences [13,14,16,18]. However, sediment geochemistry is necessarily controlled by the geology ofthe source-area. Furthermore, significant enrichments relative to source-rocks can be promoted byexogenous transformations due to weathering [19–21] and sorting processes [22–24]. Because of thiscomplexity, understanding the factors responsible for the concentration of PTEs is of major importancein environmental studies.
In the present research, a set of textural, mineralogical, and geochemical properties of thesediments of the Mussulo lagoon are joint-analyzed, in order to investigate the factors that control theconcentration of elements usually considered to be harmful in the environment. An assessment of thecarcinogenic and non-carcinogenic risks associated with exposure to these sediments is also presented.
2. Geological and Geomorphological Setting
In central-west Angola, the Mussulo spit (~30 km long and <2 km in width) separates theelongated Mussulo lagoon from the South Atlantic (Figure 1). The spit is attached to the mainland some30 km downdrift of the Cuanza River mouth, in a shifting point of coastal direction from SSE-NNW,southward, to SSW-NNE, northward. The lagoon reaches a maximum width of ~6 km in a bay near itsaperture to the ocean. Approximately 6 km to the north of the tip of the Mussulo spit occur smallerlinear features, including the so-called “Island of Luanda”. This was a narrow island (~12 km longand <500 in width) that, after human intervention in the first half of the 20th century and severalreinforcements until present times, became permanently attached to the continent.
−–
–
– –
called “Island of Luanda”. This w
Figure 1. Geological setting of the lagoon of Mussulo. (A) The Angolan Atlantic margin in SW Africaand (B) orographic features of the regional drainage basins. Note that Cuanza is by far the biggestregional river. (C) The Mussulo spit and lagoon system extending until approximately the southernlimit of Luanda urban area and location of the sampled sectors.
Climatic conditions in coastal Angola are influenced by the cold, northward-flowing, BenguelaCurrent that is responsible for the drier conditions than are seen at similar latitudes inland. In centraland northern Angola, the climate evolves in ~200 km from semi-arid (Bsh type of Koppen) in the
102

Int. J. Environ. Res. Public Health 2020, 17, 2466
littoral to tropical savannah (Aw type of Koppen), a transition clearly evidenced by an increase inrainfall from less than 500 mm of annual precipitation to more than ~1000 mm. Further inland rainfallbecomes even higher, reaching ~1500 mm in the most elevated areas draining towards the AtlanticOcean. Annual average temperatures are usually above 25 C near the coast, decreasing inland with anelevation of slightly less than 20. In Luanda region, almost all rain occurs from October to April, withMarch and April being the months with the highest rainfall. The dry months tend to be slightly cooler,but still with average temperatures above 20. The semi-arid conditions and the limited connectivity ofthe lagoon with the open ocean are responsible for high water salinity, averaging 39 in the dry season.
Throughout the Atlantic margin of Central Angola, the basement is made mostly of silica-richplutonic and metamorphic rocks that belong to the Congo Craton, which also includes mafic complexesin its north-eastern tip [25,26]. To the north, the West Congo Supergroup, with a volcano-sedimentarysuccession, is covered by siliciclastic and carbonate strata outcrops along a large area that extendsparallel to the coastline [27]. These basement units are overlain by Meso-Cenozoic successionsdeposited in the Benguela, Cuanza, and West Congo basins in association with the opening of theSouth Atlantic [28,29], and in the hinterland basins of Congo [30,31] and Kalahari [32]. Locally, thicktholeiitic rocks occur close to the contact between the basement and the sedimentary succession ofthe Cuanza Basin [33]. The natural development of the Mussulo spit and Luanda Island is stronglylinked with persisting northward littoral transport, controlled by the oblique wave incidence on thecoast. In Angola, where sand spits grow in the downdrift side of the mouth of major regional rivers,it is assumed that they are mostly sourced by bedload material supplied by these rivers [34,35]. But acomparison of the composition of sediments, collected at Cuanza River mouth with those from theMussulo spit and the Island of Luanda, point to an additional sediment contribution that resemblesthe bedloads transported from the southern regions by coastal drift, or derived from volcanic rocksthat outcrop in Mezo-Cenozoic basins [36].
At the time of its foundation, around 1575, Luanda was just a small colonial settlement thatwas designed for a limited number of families and was placed in “Luanda Island”. A year later,in search of better amenities, it moved to the mainland, and then evolved into the so-called village of“São Paulo de Loanda”. Most accurate estimations from the mid-18th century onward indicate that thepopulation oscillated between a few thousand, and may have even decreased slightly during someperiods [37], reaching more than 100,000 during the first half of the 20th century [38]. During the lastdecades of colonial occupation, the population started to grow more rapidly, becoming approximately500,000 at the time of independence [39], ~3 million by the end of the 20th century, and ~6 million in2018 [1]. Growth with limited land planning and the development of diverse industrial facilities likelypromoted environmental pollution in potentially toxic metals.
3. Materials and Methods
3.1. Sampling and Pre-Treatment
Samples of fine-grained sediments of the Mussulo bay were collected during October 2013 inareas exposed at low-tide periods. Sampling sites are clustered in outer (i.e., northern) and inner(i.e., southern) sectors of the Mussulo lagoon (Figure 1). All samples were air-dried in areas isolated ofpossible atmospheric contamination and sieved at 2 mm, before being analyzed in the laboratories ofthe Earth Sciences Department of University of Coimbra (DCT-UC).
3.2. Analytical Procedures
The grain-size distributions of the sampled sediments were determined in the SedimentologyLaboratory of DCT-UC using a laser diffraction granulometer Coulter LS 230 that is able to measurethe proportion of particles ranging from 0.5–2000 µm. Each sample was measured at least twice, andaveraged results of these runs were used in the grain-size characterization.
103

Int. J. Environ. Res. Public Health 2020, 17, 2466
The mineralogy was determined by X-ray diffraction (XRD) using a Philips®® PW 3710 equipmentwith CuKα radiation and the software APD-PW1877 (version 3.6 J). Bulk mineralogy was determinedon randomly oriented grains in the range 2–60 2θ. Clay mineralogy was determined on orientedaggregates after pipetting clay suspension (<2 µm) to glass slides. XRD was then applied on airdried slides (2–30 2θ) and after solvation with ethylene-glycol and heating at 550 C (2–15 2θ).Semi-quantitative estimations of mineral proportions are based on the areas of characteristic reflectionsafter confirming the presence of the mineral with other XRD peaks. In bulk samples the followingreflections were adopted: ~7.6 Å for gypsum, 4.26 Å for quartz, 3.23 Å for K-feldspar, 3.18 Å forplagioclase, 3.03 Å for calcite, 2.89 Å for dolomite, 2.82 Å for halite, and 2.72 Å for pyrite. In the clayfractions the glycolated diffractograms were adopted using the reflection of ~15–17 Å for smectite,~12–13 Å for mixed layer clays, 10 Å for mica illite, 7.6 Å for gypsum, and 7.1 Å for kaolinite.
Concentrations of chemical elements were obtained with approximately 0.5 g of the fraction<0.18 mm of each sample. Dried sediment samples were placed in Teflon vessels (Multiwave 3000,Anton Paar) with 9 mL of 37% HCl, and 3 mL of 70% HNO3. The vessels were heated in a microwaveapparatus within 10 min of ramp, and remained at about 180 C for 15 min. The determination of totalmetal(loid) contents was performed using current analytical methods, including: Atomic AbsorptionSpectrometry (AAS, SOLAAR M Series equipment from Thermo Scientific, Madison, USA) for Ca, Cu,Co, Fe, Mg, Mn, Ni, and Zn with atomization source of flame. The same equipment using the grafitefurnace mode was used to determine As, Co, and Pb, with ashing temperatures of 1100 C, 1000 C,and 800 C, respectively; and atomization temperatures of 2600 C, 2100 C, and 1200 C respectively.The observed detection limits were 0.05 mg/kg for As, Co and Hg, 0.3 mg/kg for Mg, 0.5 mg/kg for Pband Zn, 1 mg/kg for Cu, and Ni, 3 mg/kg for Ca, Mn, and Fe. As a control, reference materials NIST2709-San Joaquin Soil and RTC - CRM015 were used, and the recoveries obtained for the differentelements showed values in the range of 86.2 and 100.7%, being highest for Fe and lowest for Ni.
3.3. Statistical Data Treatment
Conventional univariate and multivariate statistical analysis were performed using the softwareJMP Pro 14.0. In order to better evaluate the associations between textural and compositional parametersobtained for the present investigation, a correlation-based Principal Component Analysis (PCA) wasperformed. A centered log–ratio transformation (clr) [40] was previously applied to the compositionaldata to remove the non-negativity and constant-sum constraints on compositional data. When theconcentration of geochemical variables was below the detection limit in some samples, to allow theirinclusion in the PCA, it adopted the square root of this limit divided by two. Supplementary MaterialST1 shows the compositional data obtained for the present study.
3.4. Human Health Risk Assessment
The non-carcinogenic and carcinogenic risks were estimated according to the United StatesEnvironmental Protection Agency (USEPA) methodology [41]. The human health risk assessmentwas calculated assuming that both children and adult groups are directly exposed to potentiallytoxic elements (HMTE) hosted by sediments. Chronic Daily Intake (CDI.; mg·kg−1 bw per day) wasdetermined for exposition to toxic elements by ingestion (CDIingest), dermal contact (CDIdermal), andinhalation (CDIinhalation). The following equations were adopted:
CDIingest =C× IR× EF× ED×CF
BW×AT(1)
CDIdermal =C× SA×AF×ABS× EF× ED×CF
BW×AT(2)
CDIinhalation =C× InhR× ET× EF× ED
PEF× BW×AT(3)
104

Int. J. Environ. Res. Public Health 2020, 17, 2466
where C is the concentration of PTEs in sediment (mg·kg−1). An explanation for the remainingparameters is presented in Table 1.
Table 1. Values adopted for the parameters used in the determination of Chronic Daily Intake (CDI)based on USEPA (2011).
Parameter Adult Children
IR (Ingestion Rate of sediment) 100 mg·day−1 200 mg·day−1
EF (Exposure Frequency) 312 days·year−1 312 days·year−1
ED (Exposure Duration) 35 years 6 yearsBW (Body Weight) 15 kg 70 kg
AT (Averaging Time for non-carcinogenic risk 365 days × 6 365 days × 35AT (Averaging Time for carcinogenic risk 365 days × 70 365 days × 70
CF (Conversing Factor) 10–6 mg·day−1 10–6 mg·day−1
SA (Skin Surface Area available for contact) 6032 cm2 2373 cm2
AF (Soil to skin Adherence Factor) 0.07 mg cm−2 0.2 mg cm−2
ABS (Absorption Factor) 0.001 0.001InhR (Inhalation Rate) 1.56 m3·h−1 1.2 m3·h−1
ET (Exposure Time) 8 h·day−1 4 h·day−1
PEF (Particle Emission Factor) 1.36 × 10⁹ m3·kg−1 1.36 × 10⁹ m3·kg−1
The human health non-carcinogenic risk caused by PTEs exposure is expressed as a hazardquotient (HQ) = CDI/RfD. The CDI is the average daily dose that a child or adult is exposed. The RfDis a reference dose, below which no adverse non-carcinogenic health effects should result from alifetime of exposure. The HI is the chronic hazard index that is the sum of the hazard quotientsfor multiple exposure pathways. For HI values > 1, there is a chance that non-carcinogenic riskmay occur; otherwise, the individuals are exposed to concentrations that do not present a hazard.The carcinogenic risks (CR) for As and Ni exposure of the studied groups were calculated according tothe Exposure Factors Handbook [41] and using the Slope Factors according to the U.S. Department ofEnergy (USDE) [42].
4. Results and Discussion
4.1. Compositional Variability Within the Lagoon
4.1.1. Grain-Size
The sampled sediments can be organized into four groups based on their grain-size distributions(Figure 2). Samples collected in inner lagoon locations (group A.; samples A1 to A8) are characterizedby a clear predominance of sand-size particles (95–98%) and very low clay content (<1%), displayingcoarse-skewed unimodal distributions with modal sizes in classes ranging 0.12–0.25 mm. In westernlocations of the northern sectors of the lagoon, finer-grained sediments (58%< sand< 77%) predominate,which tend to show relatively wide grain-size distributions, frequently with a main mode in theinterval 63–177 µm and a secondary population with modal size in the interval 0.25–0.5 mm (group B.;samples A9 to A15). Sediments further north (group C.; samples A16 to A19) are characterized byfine-skewed unimodal distributions, which tend to become finer northwards with decreasing sandcontent (from 70% to 40%), increasing silt (from 27% to 51%) and clay (from 3% to 6%) content, and amodal-size evolving from 0.088–0.125 to 0.063–0.088 mm. Finally, in the outermost locations of thelagoon (group D.; samples A20 to A22), grain-size becomes coarser again, with higher sand content(79%–89%), but still with significant amounts of clay (up to 5%).
105

Int. J. Environ. Res. Public Health 2020, 17, 2466
Figure 2. Grain-size of the Mussulo lagoon sediments. General features of different grain-size types(A) and their spatial distribution (B).
4.1.2. Mineralogy
Sediment mineralogy for bulk samples and the clay fraction are represented in Figure 3.The sediments of Mussolo lagoon are strongly enriched in quartz (65%–89%), followed by feldspars(2%–32%), phyllosilicates (1%–14%), and halite (<1%–13%). Gypsum, calcite, and dolomite, are usuallypresent, but always in minor or trace amounts (<3%). Traces of pyrite are occasionally found andMg-salts (e.g., carnalite, kainite, polyhalite) may also be present. Halite contents are higher in southern(3%–13%) than in northern locations (1%–4%), whilst feldspar tends to display an opposite spatialdistribution (Figure 3). There are no clear geographic trends for quartz content or the remaining minerals.
Figure 3. Bulk and clay mineral assemblages obtained for sediments of the Mussolo lagoon.
The composition of the clay fraction is highly variable and can be organized in three mineralassemblages with specific spatial distribution. Most sediments collected in southern realms of the lagoon(samples A1, A3, A5, and A6) are strongly enriched in gypsum (40%–100%), followed by mica-illite(0%–30%). A second assemblage is characterized by an enrichment in expansive clays (smectite andmixed-layer clays; 72%–100%), usually with secondary amounts of mica-illite (6%–26%) and kaolinite(3%–21%). This clay-mineral assemblage is characteristic of samples collected near the mouth of coastalstreams in the northern sector of the lagoon (samples A11, A12, A20, and A21). Sediments from thenorthern sector of the lagoon can also yield a mix composition, with a variable abundance of kaolinite(13%–59%) and expansive clays (<55%), and more homogenous mica-illite (13%–25%).
106
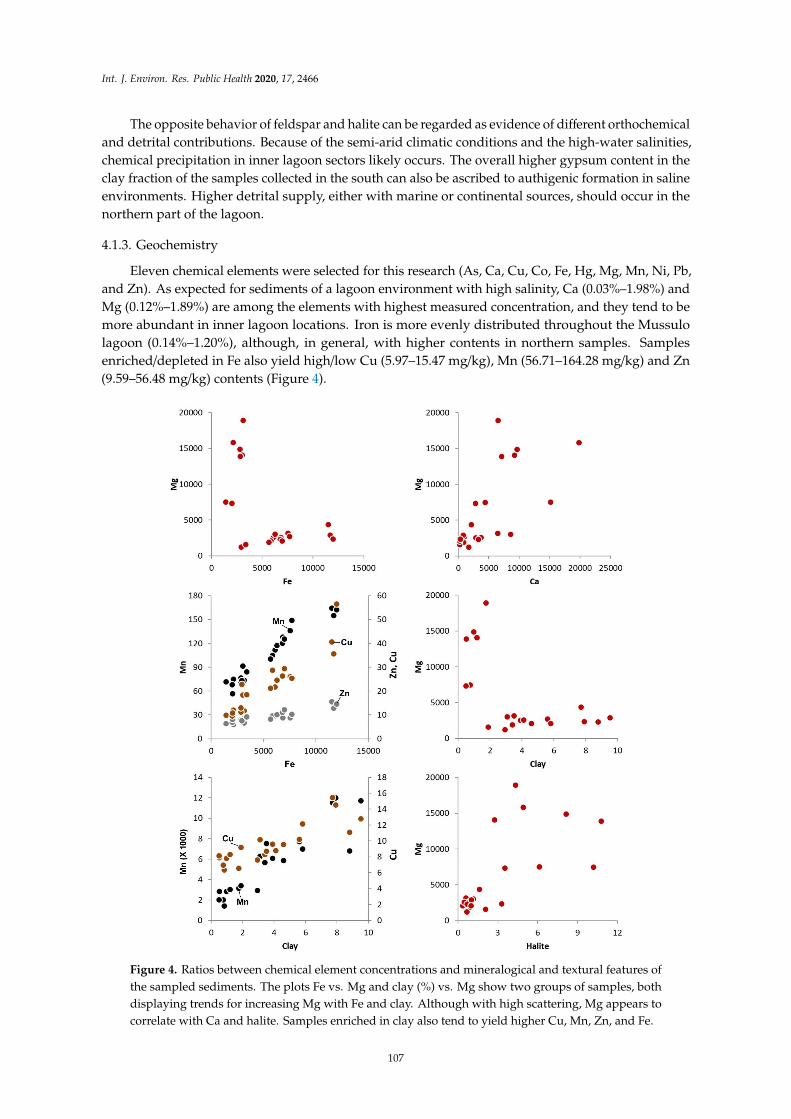
Int. J. Environ. Res. Public Health 2020, 17, 2466
The opposite behavior of feldspar and halite can be regarded as evidence of different orthochemicaland detrital contributions. Because of the semi-arid climatic conditions and the high-water salinities,chemical precipitation in inner lagoon sectors likely occurs. The overall higher gypsum content in theclay fraction of the samples collected in the south can also be ascribed to authigenic formation in salineenvironments. Higher detrital supply, either with marine or continental sources, should occur in thenorthern part of the lagoon.
4.1.3. Geochemistry
Eleven chemical elements were selected for this research (As, Ca, Cu, Co, Fe, Hg, Mg, Mn, Ni, Pb,and Zn). As expected for sediments of a lagoon environment with high salinity, Ca (0.03%–1.98%) andMg (0.12%–1.89%) are among the elements with highest measured concentration, and they tend to bemore abundant in inner lagoon locations. Iron is more evenly distributed throughout the Mussulolagoon (0.14%–1.20%), although, in general, with higher contents in northern samples. Samplesenriched/depleted in Fe also yield high/low Cu (5.97–15.47 mg/kg), Mn (56.71–164.28 mg/kg) and Zn(9.59–56.48 mg/kg) contents (Figure 4).
Figure 4. Ratios between chemical element concentrations and mineralogical and textural features ofthe sampled sediments. The plots Fe vs. Mg and clay (%) vs. Mg show two groups of samples, bothdisplaying trends for increasing Mg with Fe and clay. Although with high scattering, Mg appears tocorrelate with Ca and halite. Samples enriched in clay also tend to yield higher Cu, Mn, Zn, and Fe.
107

Int. J. Environ. Res. Public Health 2020, 17, 2466
Arsenic and Co were found in all samples, but in wide variable abundances (0.09–31.49 mg/kg and0.78–26.04 mg/kg, respectively) and high contents can occur both in northern and southern locations.The other measured elements (Hg, Ni, and Pb) were detected only in part of the samples, Hg in eight ofthem (<0.12 mg/kg), Ni in 11 (<13.34 mg/kg), and Pb in 12 (<30.12 mg/kg). Sediments with relativelyhigh amounts of at least two of these elements were collected both in the northern sector of the lagoon,namely near Luanda (samples A20, A21, and A22), and in some of the innermost southern locations(samples A2, A3, A6, and A8).
The plots of Mg vs. Fe and of Mg vs. grain-size variables reveal two distinct groups (Figure 4).Finer samples collected in the northern sector yield lower Mg and higher Fe; coarser samples collectedin the southern sector yield higher Mg and lower Fe. However, if the two groups are isolated,Mg concentrations appear to be higher in finer sediments, which also tend to be enriched in Fe.The trend for higher Mg in sediments enriched in halite supports the possibility that Mg is stronglyinfluenced by authigenic mineral formation, which prevails in southern lagoon settings with coarsersediments. On the other hand, the distribution of the two groups of samples in the bi-plots suggeststhat the presence of detrital fine-grained particles hosting Mg and Fe, along with other siderophileelements, is also influencing their concentrations.
4.2. Factors Controlling Sediment Composition
A PCA using grain-size, bulk mineralogy, and geochemical variables helps to ascertain thecompositional variability for the studied sediments. Variables strongly correlated or anti-correlatedwere not considered in the PCA. Clay mineralogy was also excluded because of the low amount ofclay fraction in the studied sediments, such that in two samples it was not possible to establish clayassemblages, and the fact that no mineral was detected in all samples. The first three componentsexplain 64.3% of the observed variance (Figure 5).
The first component (PC1, 41.7% of the variance) reflects a contrast between a set of variables thatare probably linked with chemical or biochemical precipitation, such as halite, Mg, and Ca, and otherslinked with detrital supply, such as feldspar, Fe, Mn, Zn, and Cu. It also separates coarser sedimentswith high negative loadings of precipitation-associated variables, from finer sediments with highpositive loadings of detrital-associated variables, reinforcing the possibility that a significant proportionof the coarser particles are authigenic and not physically transported to the lagoon (Figure 5). Based onthe relations between geochemical and grain-size variables, it can be assumed that most Zn and Cuare hosted by fine-grained particles, although one cannot draw conclusions about whether they havenatural or anthropogenic sources. It is interesting to note that Ca and Mg are not correlated withcarbonate content, indicating that other minerals are hosting these elements. The correlation betweenhalite and Mg suggest that Mg-bearing salts are being precipitated in the lagoon, as suggested before.XRD data is compatible with the possible occurrence of traces of Mg-salts.
Relatively low loadings of PC1 were also obtained for As, associating this element with theauthighenic variables. Arsenic concentrations in non-contaminated near shore or estuarine sedimentsare in the order of 5–15 mg/kg [43], which encompasses the majority of the values obtained for Mussulosediments. This element tends to be enriched in sea water relative to river water [44] and it canprecipitate in reduced marine environments [45]. Taking into consideration the influence of authigenicsalt-minerals on sediment composition and the occurrence of traces of pyrite in some samples, it isprobable that the relatively high As concentration in some inner lagoon locations is related with localsalt-mineral formation.
The second (PC2) and third (PC3) components explain substantially lower proportions of totalvariability (13.1% and 10.2%, respectively). PC2 yields high positive loadings of Hg, Pb, Ni, and Co,all elements for which a source related to human activities can be postulated [7–11,13–18]. The plotPC1 vs. PC2 (Figure 5) shows the links among this group of elements, suggesting a closer associationof Pb and Ni with the variables with high loadings of PC1 (clay, Fe, Mn, Zn, and Cu), whilst Co islargely independent of PC1. Arsenic is not plotted with these elements, reinforcing the possibility
108

Int. J. Environ. Res. Public Health 2020, 17, 2466
of a natural origin associated with salt precipitation in the lagoon. Samples with high scores of thiscomponent are from both the northern and southern sectors.
Figure 5. Maps of the principal components for geochemical, grain-size and mineralogical variables.(A) The vector loadings for the two main components of the Principal Component Analysis (PCA)define two perpendicular links, indicating two independent controls on the data. The first link connectselements assumed to be carried with fine-grained detrital minerals in opposition to elements that mayresult from precipitation in the lagoon. The second link connects a set of elements that may haveanthropogenic sources. (B) The plot of PC2 vs. PC3 shows the opposition of quartz and feldspar,two detrital minerals whose relative enrichment in the lagoon sediments can be attributed to specificsource areas. Gypsum seems to be associated with feldspar, which is compatible with a source inMeso-Cenozoic units of the neighboring Cuanza Basin.
PC3 shows an opposition between quartz and feldspar (Figure 5), which are the two most commonminerals in the studied sediments, being both of detrital origin. Gypsum appears linked with feldspar.Differences between the sands of the Mussulo spit and at the mouth of the Cuanza river, which yieldless feldspar along with alkali and alkaline earth metals, and more quartz and ultra-stable heavyminerals [36], support the possibility of different detrital sources in this costal environment. We proposehere that sediment material enriched in feldspar and gypsum came from a proximal source, most likelythe previous-cycle depositional units of the Cuanza Meso-Cenozoic basin that are enriched in theseminerals; quartz-rich sediment is probably derived from more distant regions (i.e., the Cuanza Rivermouth and further up-drift). Except for As, which displays a close link with quartz, this componentdoes not seem to have a major influence on the distribution of the studied PTEs.
109

Int. J. Environ. Res. Public Health 2020, 17, 2466
In summary, an anthropogenic influence on sediment composition is probably responsible foroccasional enrichments in Hg, Pb, Ni, and Co. Other elements found in higher abundances infine grained sediments near Luanda, such as Cu and Zn, may also be partially human derived.On the other hand, natural factors seem to account for the observed distribution of As contents.
4.3. Health Implications of Sediment Composition
High concentrations of PTEs in near-surface environment can threaten human health via sedimentingestion (geophagism), rare in adults but quite common in children, or by hand to-mouth intake,inhalation of dust particles, or dermal contact [46,47]. The Hazard Indices obtained from the healthrisk assessment for Cu, Hg, Mn, Ni, Pb, and Zn were below 1, pointing to no non-carcinogenic risk(Table 2). Regarding As and Co for children, HI reached 1.2 and 1.1, respectively, indicating potentialnon-carcinogenic risk due to sediment exposure. The proportion of cases with HI > 1 is 5% for As and9% for Co. According to these results, it is highly recommendable that children spent less time playingin the lagoon sediments and avoid hand-to-mouth intake.
Table 2. Range of results obtained for Hazard Indexes (HI) and Cancer Risks (CR) due to sedimentexposure for the different PTEs. Maximum results that are above the target values are in bold.
HI CR
Children Adult Children Adult
As 0.0–1.2 0.0–0.1 9 × 10⁻¹⁰ to 5 × 10⁻⁵ 3 × 10⁻¹¹ to 3 × 10⁻⁵
Mn 0.0–0.2 0.0–0.0Co 0.0–1.1 0.0–0.1Cu 0.0–0.0 0.0–0.0Hg 0.0–0.1 0.0–0.0Ni 0.0–0.0 0.0–0.0 1 × 10⁻¹¹ to 1 × 10⁻⁹ 4 × 10⁻¹¹ to 1 × 10⁻¹⁰
Pb 0.0–0.1 0.0–0.0Zn 0.0–0.0 0.0–0.0
According to the International Agency on Research of Cancer (IARC) [48], of the analyzedelements, only As and Ni poses significant carcinogenic risk. Cancer Risks values determined with thesampled sediments of the Mussulo lagoon (Table 2) are within the classes of acceptable carcinogenicrisk for As (1 × 10⁻⁴ to 1 × 10⁻⁶; [41]) and no risk for Ni (<1 × 10⁻⁶; [27]).
5. Conclusions
The geochemical composition of the sediments of the Mussulo lagoon is mainly determined bynatural processes that influence the abundance of detrital components, which can be derived fromdifferent source areas, and authigenic components associated with mineral precipitation within thelagoon setting and surrounding regions. Human action may have a subsidiary role, contributing to theabundance of some PTEs, such as Co, Hg, Ni, and Pb, in parts of the lagoon sediments. Fine grainedsamples collected near Luanda yield relatively high concentrations of Zn and Cu, but whether theirsources are natural or anthropogenic is uncertain. Arsenic is more abundant in inner (i.e., southern)locations of the lagoon, probably in association with natural processes due to precipitation fromsalt-water. The health risk assessments suggest no major carcinogenic risk due to sediment intake,but the concentrations of As and Co indicate potential non-carcinogenic risk for children.
The present research shows that health risks associated with element concentrations can emergefrom enrichment due to both natural and anthropogenic processes. Although some PTEs preferentiallyhosted by fine grained particles (e.g., Co, Hg, Ni, Pb, Zn, and Cu) may be associated with humanactivities, in coastal settings of arid regions, the possibility of high concentrations of As due to naturalprecipitation should be fully considered in environmental assessments.
110

Int. J. Environ. Res. Public Health 2020, 17, 2466
Supplementary Materials: The following are available online at http://www.mdpi.com/1660-4601/17/7/2466/s1.
Author Contributions: Conceptualization: P.D.; Data curation: P.D., J.P.; Funding acquisition: J.P., P.D.; Methodology:P.D., J.P.; Sampling: A.A.; Formal analysis: A.A., P.D., J.P.; Investigation: P.D., J.P., A.A.; Visualization: P.D.; Writingoriginal draft: P.D., J.P.; Writing, reviewing and editing: P.D., J.P. All authors have read and agreed to the publishedversion of the manuscript. Funding: Fundação para a Ciência e Tecnologia, I.P. (FCT).
Acknowledgments: The present work was supported by the FCT through the project UIDB/04292/2020 (MARE-Marine and Environmental Sciences Centre). The Guest Editor, Marina C. Pinto, provided valuable indications forthe assessment of human health risks. Two anonymous reviewers are thanked for their constructive and pertinentcomments, which helped to improve the article.
Conflicts of Interest: The authors declare no conflict of interest.
References
1. UN (United Nations). The World’s Cities in 2018: Data Booklet, Statistical Papers—United Nations (Ser. A),Population and Vital Statistics Report, UN, New York. 2018. Available online: https://doi.org/10.18356/c93f4dc6-en (accessed on 4 January 2020).
2. Cheggour, M.; Chafik, A.; Langston, W.J.; Burt, G.R.; Benbrahim, S.; Texier, H. Metals in sediments andthe edible cockle Cerastoderma edule from two Moroccan Atlantic lagoons: Moulay Bou Selham and SidiMoussa. Environ. Pollut. 2001, 115, 149–160. [CrossRef]
3. Fernandes, C.; Fontainhas-Fernandes, A.; Peixoto, F.; Salgado, M.A. Bioaccumulation of heavy metals inLiza saliens from the Esmoriz–Paramos coastal lagoon, Portugal. Ecotoxicol. Environ. Saf. 2007, 66, 426–431.[CrossRef]
4. Spada, L.; Annicchiarico, C.; Cardellicchio, N.; Giandomenico, S.; Di Leo, A. Mercury and methylmercuryconcentrations in Mediterranean seafood and surface sediments, intake evaluation and risk for consumers.Int. J. Hyg. Environ. Health 2012, 215, 418–426. [CrossRef]
5. María-Cervantes, A.; Jiménez-Cárceles, F.J.; Álvarez-Rogel, J. As, Cd, Cu, Mn, Pb, and Zn contents insediments and mollusks (Hexaplex trunculus and Tapes decussatus) from coastal zones of a Mediterraneanlagoon (Mar Menor, SE Spain) affected by mining wastes. Water Air Soil Pollut. 2009, 200, 289–304. [CrossRef]
6. Pinto, M.M.; Silva, M.M.; Neiva, A.M. Pollution of water and stream sediments associated with the Vale DeAbrutiga Uranium Mine, Central Portugal. Mine Water Environ. 2004, 23, 66–75. [CrossRef]
7. Pekey, H. The distribution and sources of heavy metals in Izmit Bay surface sediments affected by a pollutedstream. Mar. Pollut. Bull. 2006, 52, 1197–1208. [CrossRef]
8. Biasioli, M.; Grcman, H.; Kralj, T.; Madrid, F.; Díaz-Barrientos, E.; Ajmone-Marsan, F. Potentially toxicelements contamination in urban soils. J. Environ. Qual. 2007, 36, 70–79. [CrossRef]
9. Qingjie, G.; Jun, D.; Yunchuan, X.; Qingfei, W.; Liqiang, Y. Calculating pollution indices by heavy metalsin ecological geochemistry assessment and a case study in parks of Beijing. J. China Univ. Geosci. 2008, 19,230–241. [CrossRef]
10. Ye, S.; Zeng, G.; Wu, H.; Zhang, C.; Liang, J.; Dai, J.; Liu, Z.; Xiong, W.; Wan, J.; Xu, P.; et al. Co-occurrence andinteractions of pollutants, and their impacts on soil remediation—A review. Crit. Rev. Environ. Sci. Technol.
2017, 47, 1528–1553. [CrossRef]11. Cabral-Pinto, M.M.; Inácio, M.; Neves, O.; Almeida, A.A.; Pinto, E.; Oliveiros, B.; da Silva, E.A. Human health
risk assessment due to agricultural activities and crop consumption in the surroundings of an industrial area.Expo. Health 2019, 1–2. [CrossRef]
12. Mirlean, N.; Andrus, V.E.; Baisch, P.; Griep, G.; Casartelli, M.R. Arsenic pollution in Patos Lagoon estuarinesediments, Brazil. Mar. Pollut. Bull. 2003, 46, 1480–1484. [CrossRef]
13. Elbaz-Poulichet, F.; Dezileau, L.; Freydier, R.; Cossa, D.; Sabatier, P. A 3500-year record of Hg and Pbcontamination in a Mediterranean sedimentary archive (The Pierre Blanche Lagoon, France). Environ. Sci.
Technol. 2011, 45, 8642–8647. [CrossRef]14. Covelli, S.; Langone, L.; Acquavita, A.; Piani, R.; Emili, A. Historical flux of mercury associated with mining
and industrial sources in the Marano and Grado Lagoon (northern Adriatic Sea). Estuar. Coast. Shelf Sci.
2012, 113, 7–19. [CrossRef]15. Fujita, M.; Ide, Y.; Sato, D.; Kench, P.S.; Kuwahara, Y.; Yokoki, H.; Kayanne, H. Heavy metal contamination of
coastal lagoon sediments: Fongafale Islet, Funafuti Atoll, Tuvalu. Chemosphere 2014, 95, 628–634. [CrossRef]
111

Int. J. Environ. Res. Public Health 2020, 17, 2466
16. Alyazichi, Y.M.; Jones, B.G.; McLean, E. Source identification and assessment of sediment contamination oftrace metals in Kogarah Bay, NSW, Australia. Environ. Monit. Assess. 2015, 187, 20. [CrossRef]
17. Ke, X.; Gui, S.; Huang, H.; Zhang, H.; Wang, C.; Guo, W. Ecological risk assessment and source identificationfor heavy metals in surface sediment from the Liaohe River protected area, China. Chemosphere 2017, 175,473–481. [CrossRef]
18. Mejjad, N.; Laissaoui, A.; El-Hammoumi, O.; Fekri, A.; Amsil, H.; El-Yahyaoui, A.; Benkdad, A. Geochemical,radiometric, and environmental approaches for the assessment of the intensity and chronology of metalcontamination in the sediment cores from Oualidia lagoon (Morocco). Environ. Sci. Pollut. Res. 2018, 25,22872–22888. [CrossRef]
19. Lottermoser, B.G. Natural enrichment of topsoils with chromium and other heavy metals, Port Macquarie,New South Wales, Australia. Soil Res. 1997, 35, 1165–1176. [CrossRef]
20. Kraepiel, A.M.; Dere, A.L.; Herndon, E.M.; Brantley, S.L. Natural and anthropogenic processes contributingto metal enrichment in surface soils of central Pennsylvania. Biogeochemistry 2015, 123, 265–283. [CrossRef]
21. Pinto, M.M.; Silva, M.M.; da Silva, E.A.; Dinis, P.A.; Rocha, F. Transfer processes of potentially toxic elements(PTE) from rocks to soils and the origin of PTE in soils: A case study on the island of Santiago (Cape Verde).J. Geochem. Explor. 2017, 183, 140–151. [CrossRef]
22. Komar, P.D. The entrainment, transport and sorting of heavy minerals by waves and currents. In Heavy
Minerals in Use; Developments in Sedimentology Series; Mange, M.A., Wright, D.T., Eds.; Elsevier:Amsterdam, The Netherlands, 2007; Volume 58, pp. 3–48.
23. Garzanti, E.; Andò, S.; Vezzoli, G. Grain-size dependence of sediment composition and environmental biasin provenance studies. Earth Planet. Sci. Lett. 2009, 277, 422–432. [CrossRef]
24. Garzanti, E.; Dinis, P.; Vermeesch, P.; Andò, S.; Hahn, A.; Huvi, J.; Limonta, M.; Padoan, M.; Resentini, A.;Rittner, M.; et al. Sedimentary processes controlling ultralong cells of littoral transport: Placer formation andtermination of the Orange sand highway in southern Angola. Sedimentology 2018, 65, 431–460. [CrossRef]
25. De Carvalho, H.; Tassinari, C.; Alves, P.H.; Guimarães, F.; Simões, M.C. Geochronological review of thePrecambrian in western Angola: Links with Brazil. J. Afr. Earth Sci. 2000, 31, 383–402. [CrossRef]
26. Vaughan, A.P.; Pankhurst, R.J. Tectonic overview of the West Gondwana margin. Gondwana Res. 2008, 13,150–162. [CrossRef]
27. Tack, L.; Wingate, M.T.; Liégeois, J.P.; Fernandez-Alonso, M.; Deblond, A. Early Neoproterozoic magmatism(1000–910 Ma) of the Zadinian and Mayumbian Groups (Bas-Congo): Onset of Rodinia rifting at the westernedge of the Congo craton. Precambrian Res. 2001, 110, 277–306. [CrossRef]
28. Moulin, M.; Aslanian, D.; Unternehr, P. A new starting point for the South and Equatorial Atlantic Ocean.Earth Sci. Rev. 2010, 98, 1–37. [CrossRef]
29. Guiraud, M.; Buta-Neto, A.; Quesne, D. Segmentation and differential post-rift uplift at the Angola marginas recorded by the transform-rifted Benguela and oblique-to-orthogonal-rifted Kwanza basins. Mar. Pet.
Geol. 2010, 27, 1040–1068. [CrossRef]30. Daly, M.C.; Lawrence, S.R.; Diemu-Tshiband, K.; Matouana, B. Tectonic evolution of the Cuvette Centrale,
Zaire. J. Geol. Soc. 1992, 149, 539–546. [CrossRef]31. Kadima, E.; Delvaux, D.; Sebagenzi, S.N.; Tack, L.; Kabeya, S.M. Structure and geological history of the
Congo Basin: An integrated interpretation of gravity, magnetic and reflection seismic data. Basin Res. 2011,23, 499–527. [CrossRef]
32. Haddon, I.G.; McCarthy, T.S. The Mesozoic–Cenozoic interior sag basins of Central Africa: The late-cretaceous–Cenozoic Kalahari and Okavango basins. J. Afr. Earth Sci. 2005, 43, 316–333. [CrossRef]
33. Marzoli, A.; Melluso, L.; Morra, V.; Renne, P.R.; Sgrosso, I.; D’antonio, M.; Morais, L.D.; Morais, E.A.; Ricci, G.Geochronology and petrology of Cretaceous basaltic magmatism in the Kwanza basin (western Angola),and relationships with the Paraná-Etendeka continental flood basalt province. J. Geodyn. 1999, 28, 341–356.[CrossRef]
34. Abecasis, C.K. As Formações Lagunares e Seus Problemas de Engenharia Litoral; Junta de Investigação do Ultramar:Lisbon, Portugal, 1961; pp. 1–174.
35. Dinis, P.A.; Huvi, J.; Cascalho, J.; Garzanti, E.; Vermeesch, P.; Callapez, P. Sand-spits systems from Benguelaregion (SW Angola). An analysis of sediment sources and dispersal from textural and compositional data.J. Afr. Earth Sci. 2016, 117, 171–182. [CrossRef]
112

Int. J. Environ. Res. Public Health 2020, 17, 2466
36. Garzanti, E.; Dinis, P.; Vermeesch, P.; Andò, S.; Hahn, A.; Huvi, J.; Limonta, M.; Padoan, M.; Resentini, A.;Rittner, M.; et al. Dynamic uplift, recycling, and climate control on the petrology of passive-margin sand(Angola). Sediment. Geol. 2018, 375, 86–104. [CrossRef]
37. Curto, J.C.; Gervais, R.R. A dinâmica demográfica de Luanda no contexto do tráfico de escravos do AtlânticoSul, 1781–1844. Topoi (Rio de Janeiro) 2002, 3, 85–138. [CrossRef]
38. Amaral, I.D. Subsídios para o estudo da evolução da população de Luanda. Garcia Orta Rev. Junta Missões
Geográficas Investig. Do Ultramar 1959, 7, 211–226.39. Amaral, I. Luanda e os seus “muceques”, problemas de Geografia Urbana. Finisterra 1983, 18, 293–325.
[CrossRef]40. Aitchison, J. The statistical analysis of compositional data. J. R. Stat. Soc. Ser. B (Methodological) 1982, 44,
139–160. [CrossRef]41. USEPA (United States Environmental Protection Agency). Exposure Factors Handbook 2011 Edition (Final); United
States Environmental Protection Agency: Washington, DC, USA, 2011. Available online: http://cfpub.epa.gov/ncea/risk/recordisplay.cfm?deid=236252 (accessed on 18 January 2020).
42. USDE (U.S. Department of Energy). The Risk Assessment Information System (RAIS); U.S. Department ofEnergy’s Oak Ridge Operations Office: Oak Ridge, TN, USA, 2013. Available online: https://rais.ornl.gov/(accessed on 4 December 2019).
43. Neff, J.M. Ecotoxicology of arsenic in the marine environment. Environ. Toxicol. Chem. Int. J. 1997, 16,917–927. [CrossRef]
44. Dong, W.Q.; Cui, Y.; Liu, X. Instances of soil and crop heavy metal contamination in China. Soil Sediment
Contam. 2001, 10, 497–510. [CrossRef]45. Kalia, K.; Khambholja, D.B. Arsenic contents and its biotransformation in the marine environment. In Handbook
of Arsenic Toxicology; Flora, S.J.S., Ed.; Academic Press: San Diego, CA, USA, 2015; Chapter 28; pp. 675–700.46. Viers, J.; Dupré, B.; Gaillardet, J. Chemical composition of suspended sediments in World Rivers: New insights
from a new database. Sci. Total Environ. 2009, 407, 853–868. [CrossRef]47. Sun, Y.; Zhou, Q.; Xie, X.; Liu, R. Spatial, sources and risk assessment of heavy metal contamination of urban
soils in typical regions of Shenyang, China. J. Hazard. Mater. 2010, 174, 455–462. [CrossRef]48. IARC (International Agency for Research on Cancer). List of Classifications 1–123. 2017. Available online:
https://monographs.iarc.fr/agents-classified-by-the-iarc/ (accessed on 25 March 2019).
© 2020 by the authors. Licensee MDPI, Basel, Switzerland. This article is an open accessarticle distributed under the terms and conditions of the Creative Commons Attribution(CC BY) license (http://creativecommons.org/licenses/by/4.0/).
113


International Journal of
Environmental Research
and Public Health
Review
Lead Toxicity: Health Hazards, Influence on FoodChain, and Sustainable Remediation Approaches
Amit Kumar 1 , Amit Kumar 2,*, Cabral-Pinto M.M.S. 3 , Ashish K. Chaturvedi 4 ,
Aftab A. Shabnam 2, Gangavarapu Subrahmanyam 2, Raju Mondal 5, Dipak Kumar Gupta 6,
Sandeep K. Malyan 7, Smita S. Kumar 8 , Shakeel A. Khan 9 and Krishna K. Yadav 10
1 School of Hydrology and Water Resources, Nanjing University of Information Science and Technology,Nanjing 210044, China; [email protected]
2 Central Muga Eri Research and Training Institute, Central Silk Board, Jorhat, Assam 785000, India;[email protected] (A.A.S.); [email protected] (G.S.)
3 Geobiotec Research Centre, Department of Geosciences, University of Aveiro, 3810-193 Aveiro, Portugal;[email protected]
4 Water Management (Agriculture) Division, Centre for Water Resources Development and Management,Kozhikode, Kerala 673571, India; [email protected]
5 Central Sericultural Germplasm Resources Centre (CSGRC), Central Silk Board, Ministry of Textiles,Thally Road, Hosur, Tamil Nadu 635109, India; [email protected]
6 ICAR-Central Arid Zone Research Institute Regional Research Station Pali Marwar, Rajasthan 342003, India;[email protected]
7 Institute of Soil, Water and Environmental Sciences, Agricultural Research Organization (ARO), The VolcaniCenter, Rishon LeZion 7505101, Israel; [email protected]
8 Department of Environment science, J.C. Bose University of Science & Technology, YMCA, NH-2, Sector-6,Mathura Road, Faridabad, Haryana 121006, India; [email protected]
9 Centre for Environment Science and Climate Resilient Agriculture, ICAR-Indian Agricultural ResearchInstitute, New Delhi 110012, India; [email protected]
10 Institute of Environment and Development Studies, Bundelkhand University, Kanpur Road,Jhansi 284128, India; [email protected]
* Correspondence: [email protected]
Received: 28 January 2020; Accepted: 22 March 2020; Published: 25 March 2020
Abstract: Lead (Pb) toxicity has been a subject of interest for environmental scientists due to itstoxic effect on plants, animals, and humans. An increase in several Pb related industrial activitiesand use of Pb containing products such as agrochemicals, oil and paint, mining, etc. can lead to Pbcontamination in the environment and thereby, can enter the food chain. Being one of the most toxicheavy metals, Pb ingestion via the food chain has proven to be a potential health hazard for plantsand humans. The current review aims to summarize the research updates on Pb toxicity and itseffects on plants, soil, and human health. Relevant literature from the past 20 years encompassingcomprehensive details on Pb toxicity has been considered with key issues such as i) Pb bioavailabilityin soil, ii) Pb biomagnification, and iii) Pb- remediation, which has been addressed in detail throughphysical, chemical, and biological lenses. In the review, among different Pb-remediation approaches,we have highlighted certain advanced approaches such as microbial assisted phytoremediation whichcould possibly minimize the Pb load from the resources in a sustainable manner and would be aviable option to ensure a safe food production system.
Keywords: lead toxicity; lead contamination; health hazards; remediation
115

Int. J. Environ. Res. Public Health 2020, 17, 2179
1. Introduction
Lead (Pb) is a highly noxious, non-disintegrative heavy metal with a bluish-gray color, an atomicnumber of 82, molecular weight 207.2, density 11.34 g/cm3, and a melting point of 621.43 F. It canbe easily shaped, molded, and used to form alloys through mixing with other metals. It can exist inboth organic as well as inorganic form. The inorganic Pb dominantly occurs in dust, soil, old paint,and other different user products, while organic Pb (Tetra-ethyl Pb) is predominantly found in leadedgasoline. Both of these forms of Pb are toxic, however organic Pb-complexes are excessively toxicto biological systems compared to inorganic Pb [1]. Pb is the second most toxic metal after Arsenic(As), comprises 0.002% of Earth’s crust [2,3], and its natural level remains to be below 50 mg kg−1 [4].Although earlier literature did not focus on the biological importance of Pb, recent findings suggestthat traces of Pb (~29 ng/g diet) is important for enzyme activities and cellular systems, especiallyduring cell development, hematopoiesis, and reproduction [5].
In general, Pb salts/oxides through atmospheric dust, automobile exhaust, paint, polluted food,and water are the key pathways for human exposure. The food canning industry is also an importantsource of Pb intake due to its leaching ability into canned foods. Currently, humans are exposed to Pbthrough dust particles from soil transmitted into homes and/or drinking water. Lead is consideredcarcinogenic (Group 2B) to humans [6]. Humans are impacted by Pb primarily through ingestion as20–70% of ingested Pb is absorbed by the human body. Children have a high absorption capacity ofPb [7,8].
Enhanced Pb concentration in blood affects behavior, cognitive performance, postnatal growth,delays puberty, and reduces hearing capacity in infants and children. In adults, Pb causes cardiovascular,central nervous system, kidney, and fertility problems. During pregnancy, Pb can also hamper fetalgrowth in the early stage [1,3]. The Commission Regulation E.C., No 1881/2006, documented the Pbconcentration (0.3 mg kg−1) thresholds for different agriculture products such as leafy vegetables andfresh aromatic herbs [9]. Pb sources, their inclusion in soil, Pb bioavilability to plants, soil role for Pbtransfer to plants, plant toxicity and accumulation mechanism, Pb effect on plants and humans, anddifferent remediation technologies are basically covered in the present review. The main objective ofthis review is to summarise the research updates on Pb toxicity, bioavailability, and its imposed toxiceffects on plants and on human health, including recently tested/recommended remediation options.
2. Methodological Approach for Selecting and Reviewing the Literature in a Meaningful Way forTargeting Specific Objectives
2.1. Collection, Compilation, and Identification of Relevant Literature for the Study
The criteria for selection of recent literature for targeting up-to-date information on the topicwas done through search string/keywords such as “Lead”, “sources of Lead”, “Lead toxicity”,“bioaccumulation of Pb in food and human”, “toxic forms of Pb”, “Pb tolerance in human and plants”,“health effect of Pb toxicity”, and “Pb remediation”. The extensive search of existing literature onthe specific keywords was performed to collect the data from Scopus, Science Direct and Googlescholar, MDPI, and other academic university websites. Three important criteria were considered foraddressing relevant updated information (i) peer-reviewed, (ii) highly cited (i–10), and (iii) articlesappearing in journals with a minimum impact factor (>1.0, Thomson Reuters) (iv) few articles except theabove listed criteria based on recent/specific information was also included. The selection criteria/ruleswere adopted and modified from Sandin and Peters [10].
2.2. Extraction of Data and Data Representation
All the available relevant literature was studied carefully based on the key objectives of thepresent review. Omission of work was based on literature that was published before 2000, was withoutquantitative results, non-English, and/or was general/duplicate/similar in nature, which did not fit the
116

Int. J. Environ. Res. Public Health 2020, 17, 2179
questions of this review. Later, the results from all representative literature published from the year2000 onwards were extracted and represented in tabular form.
3. Sources of Pb Contamination in Soil, Crops, and Water Resources
Pb contamination in air, soil, and water resources has been associated with natural causes, such asgeochemical weathering, sea spray emissions, volcanic activity, and remobilization of sediment, soil,and water from mining areas [11–13]. Table 1 represents the various sources of lead contaminationin agricultural soils, crops, and water in different countries/regions of the world. It is evidenced inTable 1 that the anthropogenic products and processes (such as industrial, oil-processing activities,agrochemicals, paint, smelting, mining, refining, informal recycling of lead, cosmetics, peeling windowand door frames, jewelry, toys, ceramics, pottery, plumbing materials and alloys, water from old pipes,vinyl mini-blinds, stained glass, lead-glazed dishes, firearms with lead bullets, batteries, radiators forcars and trucks, and some colors of ink) are considered to be major sources of Pb contamination in theenvironment [14–21].
Pb is available in soil/sediments as a free metal ion, is associated with inorganic molecules (e.g.,HCO3
−, CO32−, SO4
2−, and Cl−), and can also exist as organic ligands (e.g., amino acid, fulvic acid,and humic acid). Pb can also be adsorbed onto particle surfaces such as biological material, oxides ofiron, clay particles, and organic matter [22,23]. In general, a higher concentration of anthropogenic Pbaccumulates on the soil surface and can decrease with depth [24]. Pb has a high affinity with organicand colloidal materials and, thereby, is readily available for plant uptake [25].
Table 1. Table of Pb contamination in agricultural soils, crops, and water in different countries [18].
Sources Contaminati-on Plant Species Region References
Wastewater ofShitalakhya river
Soil andvegetables
Amaranthus lividus, Basellaalba, Cucurbita moschata,
Spinacia oleracea, andTrichosanthes cucumerina
Bangladesh [26]
Wastewater treatmentplant
Soil, water, andcrops
Eruca sativa, Madia sativa,Malus sylvestris, Triticum
æstivum, Triticum turgidum,Urtica dioica, and Vicia faba
Morocco [27]
Mine affected area Soil and vegetable
Amaranthus dubius, Ipomoeaaquatic, Ipomoea batatas,Phaseolus vulgaris, Piper
nigrum, Solanum lycopersicum,and Solanum melongena
China [28]
Sewage water Soil and crop Oryza sativa Iran [29]
Agricultural/Urbanisationactivities
Water andsediments Lemna minor India [30]
Urbanization Soil, water, andvegetables
Brassica oleracea, Momordicacharantia, Phaseolus vulgaris,
Raphanus raphanistrum,Solanum lycopersicum, and
Triticum aestivum
China [31]
Anthropogenic activities Soil andvegetables
Cucurbita maxima, Lagenariasiceraria, Solanum melongena,
and Spinacia oleraceaPakistan [32]
Glass industry Soil andagricultural crops
Brassica juncea, Hordeumvulgare, and Triticum aestivum
India [33]
117

Int. J. Environ. Res. Public Health 2020, 17, 2179
4. Pb Bioavailability in Soil and Its Influencing Factors
Lead bioavailability in soil is strongly controlled by its species, especially free-Pb ionsconcentration [22,34]. Plants absorb lead in dissolved form via the soil solution [25]. Moreover, theconcentration of the free lead ion in soils depends on its physical process (e.g., adsorption/desorption) [23].
The behavior of lead species (bioavailability, mobility, and solubility) in soil is controlled bycomplex interactions of different biogeochemical factors [25]. These factors are redox conditions [35],pH [23,36], cation-exchange capacity [23], soil mineralogy, biological and microbial conditions [2],lead quantity [26,37,38], inorganic and organic legend concentration [22,34,39], competing cationconcentration [40,41], and the type of plant species involved [37]. The behavior (uptake rate) of leadspecies in soil and plants is influenced by either biogeochemical factor independently or in combinationwith geochemical factors. The effects of some factors on Pb bioavailability are summarized below:
4.1. Soil pH
Soil pH is the most important factor that controls Pb availability to plants. Soil pH dictatesPb availability in soil as a negative correlation between Pb solubility and soil pH is noticed [42].In acidic soil (pH < 7), Pb exists as aqueous Pb(H2O6)+2, while in alkaline soil (pH > 7), Pb formsaqueous complexes with OH− (hydroxyl ions). Specific adsorption of Pb is directly proportional to soilpH [16,43]. At a low soil pH (3–5), adsorption is the dominant process, whereas at a high pH (6–7),precipitation is the dominant process [16,44].
4.2. Soil Redox Potential
Redox potential controls Pb dynamics in soil. The solubility of Pb is inversely proportionalto soil redox potential (i.e., Pb solubility increases along with a decrease in soil redox potential).Generally, heavy metals dissolve easily in waterlogged soils. Pb was dissolved by acetic acid in highlyimpeded drainage soil (1.9 µg g−1) as compared to freely drained soils (0.1 µg g−1) in a region of slatebedrock [16].
4.3. Soil Texture
Soil texture significantly affects Pb solubility. In Clay soils, heavy metal ions are adsorbedthrough ion exchange and specific adsorption mechanisms [45]. Pb adsorption also varies betweentypes of clay minerals [16]. For example, the affinity between iolite and Pb is ~32 times higherthan montmorillonite [46]. Mao et al. [47] observed low Pb adsorption on montmorillonite due tocompetition between Ca and Pb for cation exchange sites on clay.
4.4. Soil Minerals
Soil minerals such as Mn and Fe affect Pb solubility in soils. Mn oxides have a high affinity towardsPb, thus they significantly decrease Pb uptake by plants grown in Pb contaminated soil [2,16,48–50].O’Reilly and Hochella [50] emphasized that microbial activity is responsible for Pb mobilization fromoxides and carbonate. Tao et al. [51] reported that earthworms could enhance Pb availability to plants.
4.5. Nutrients, Organic Carbon, and O2
These are the essential factors for microbial growth and metabolism and are directly involvedin the degradation of contaminants. Some of the bioactive nutritional elements include carbon (e.g.,backbone of all organic compounds), nitrogen (e.g., cellular protein and cell wall component synthesis),phosphorus (e.g., cell membrane, ATP, and nucleic acid), sulfur (e.g., amino acid synthesis), calcium(signaling transport), and magnesium (e.g., enzymatic activities functioning) [52,53] etc. Zhao et al. [54]concluded that soil physical properties such as permeability and fracturing could also affect Pbdynamics in soils. Li et al. [48] elucidated the effect of soil organic matter (OM) on Pb solubility through
118

Int. J. Environ. Res. Public Health 2020, 17, 2179
the formation of complexes during metals’ interaction. Kögel-Knabner et al. [49] emphasized that soilOM drives a sizeable amount of Pb concentration by the formation of organo-Pb complexes.
The ion exchange capacity (particularly CEC), pH, ion redox potential, microbial community,texture, mineralogy, and organic matter of soils are the key regulating factors that affect Pb dynamics(e.g., adsorption, solubility, and mobility) in soil and bioavailability to plants.
5. Lead Bioavailability/Bioaccessibility in Animals and Humans
Lead toxicity is an important environmental health hazard and its effects on the human body aredevastating. Total Pb in a human body is subject to environment, age, and occupation. It is estimatedthat a person weighing 70 kg will have an average of 120 mg of Pb, with 0.2 mg/L in the blood, 5–50in their bones (in mg/kg), and 0.2–3 in tissues [55]. The Center for Disease Control and Prevention(USA) has set the standard elevated blood Pb levels for both adults and children (10 µg/dL and5 µg/dL,respectively) [56].
Bioavailability (BA) is an ingested fraction that crosses the gastrointestinal epithelium and isdistributed into internal tissues and organs [57]. Bioavailability of Pb was established through in-vivomodels such as in mice (Mus), monkeys (Cercopithecidae), rabbits (Oryctolagus cuniculus), rats (Rattus),and swine (Sus scrofa). However, extrapolation of the in-vivo models into human has not provided arealistic effect due to their physiological differences and species diversity. In-vivo experiments aremuch simpler than epidemiological studies because they are cheaper, faster, highly reproducible, anddo not involve ethical issues. However, critical parameters (e.g., exposure levels, conditions, andabsorbed Pb concentration) need to be considered while performing in-vivo specimen evaluation. Thefollowing key factors are to be considered for decision making in public health issues using in-vivomodels: (a) specific features and limitations of the model; (b) targeting the human population inthe design of animal studies at developmental stage; (c) the use of acceptable environmental doses,and (d) Pb speciation. In-vitro studies such as Relative Bioavailability Leaching Procedure (RBALP),Unified Bio-accessibility Research Group Europe Method (UBM), Solubility Bio-accessibility ResearchConsortium assay (SBRC), Physiologically Based Extraction Test (PBET), In Vitro Gastrointestinal (IVG)Method, and the In Vitro Digestion Model (RIVM) can be used to measure Pb bioaccessibility [58].Pb relative bioavailability (RBA) refers to the comparative bioavailability of different Pb forms that areavailable in source substance [58]. For estimating the relative bioavailability of Pb, a reference materialsuch as Pb acetate can be used. Lead RBA in soil can be measured by either blood or tissues (kidney,liver, and femur) [58,59]. Deshommes et al. [60] conducted an in-vivo experiment on Pb particles(especially particulate Pb forms including those in paint and dust and those in drinking water supplysystems) and stated that the relative bio-accessibility leaching procedure (RBLP) offers the highestdegree of validation and simplicity in animal models.
Literature suggests that due to unavailability of data and the existing model (e.g., animal model),we could not predict/estimate human risk assessment and human absorption of Pb particles, particularlyfor childhood exposure assessment, e.g., neuro-behavioral and neuro-developmental deficiencies, andthe effects on growth, hearing, and blood pressure.
6. Lead Transportation, Toxicity, and Bioaccumulation Through Food Chain Contamination
Lead is one of the most toxic and frequently encountered heavy metals in the environment [34].Different quantitative indices are currently being used to estimate Pb toxicity at trophic levels in thefood chain (Table 2). Once Pb reaches the soil by any source and penetrates into the plant root system,it may accumulate there or may be translocated to aerial plant parts (APP). Pb mostly accumulates(≥95%) in the roots of plant species and only a small fraction is translocated to APP. Some of the studiedplants species with respect to Pb transportation, toxicity, and bioaccumulation are Allium sativum [61],Avicennia marina [62], Pisumsativum, Phaseolus vulgaris and Vicia faba [34,63,64], Lathyrus sativus [65],Nicotiana tabacum [66], Sedum alfredii [67], V. unguiculata [68], and Zea mays [69].
119
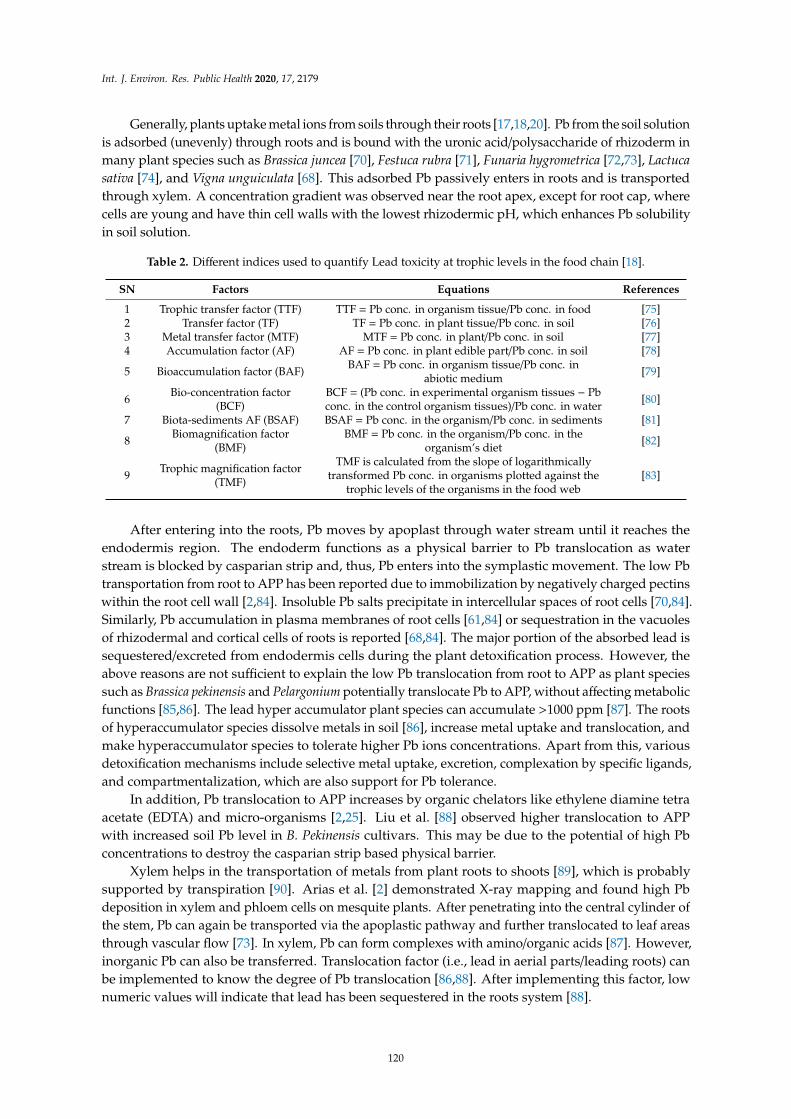
Int. J. Environ. Res. Public Health 2020, 17, 2179
Generally, plants uptake metal ions from soils through their roots [17,18,20]. Pb from the soil solutionis adsorbed (unevenly) through roots and is bound with the uronic acid/polysaccharide of rhizoderm inmany plant species such as Brassica juncea [70], Festuca rubra [71], Funaria hygrometrica [72,73], Lactuca
sativa [74], and Vigna unguiculata [68]. This adsorbed Pb passively enters in roots and is transportedthrough xylem. A concentration gradient was observed near the root apex, except for root cap, wherecells are young and have thin cell walls with the lowest rhizodermic pH, which enhances Pb solubilityin soil solution.
Table 2. Different indices used to quantify Lead toxicity at trophic levels in the food chain [18].
SN Factors Equations References
1 Trophic transfer factor (TTF) TTF = Pb conc. in organism tissue/Pb conc. in food [75]2 Transfer factor (TF) TF = Pb conc. in plant tissue/Pb conc. in soil [76]3 Metal transfer factor (MTF) MTF = Pb conc. in plant/Pb conc. in soil [77]4 Accumulation factor (AF) AF = Pb conc. in plant edible part/Pb conc. in soil [78]
5 Bioaccumulation factor (BAF) BAF = Pb conc. in organism tissue/Pb conc. inabiotic medium [79]
6 Bio-concentration factor(BCF)
BCF = (Pb conc. in experimental organism tissues − Pbconc. in the control organism tissues)/Pb conc. in water [80]
7 Biota-sediments AF (BSAF) BSAF = Pb conc. in the organism/Pb conc. in sediments [81]
8 Biomagnification factor(BMF)
BMF = Pb conc. in the organism/Pb conc. in theorganism’s diet [82]
9 Trophic magnification factor(TMF)
TMF is calculated from the slope of logarithmicallytransformed Pb conc. in organisms plotted against the
trophic levels of the organisms in the food web[83]
After entering into the roots, Pb moves by apoplast through water stream until it reaches theendodermis region. The endoderm functions as a physical barrier to Pb translocation as waterstream is blocked by casparian strip and, thus, Pb enters into the symplastic movement. The low Pbtransportation from root to APP has been reported due to immobilization by negatively charged pectinswithin the root cell wall [2,84]. Insoluble Pb salts precipitate in intercellular spaces of root cells [70,84].Similarly, Pb accumulation in plasma membranes of root cells [61,84] or sequestration in the vacuolesof rhizodermal and cortical cells of roots is reported [68,84]. The major portion of the absorbed lead issequestered/excreted from endodermis cells during the plant detoxification process. However, theabove reasons are not sufficient to explain the low Pb translocation from root to APP as plant speciessuch as Brassica pekinensis and Pelargonium potentially translocate Pb to APP, without affecting metabolicfunctions [85,86]. The lead hyper accumulator plant species can accumulate >1000 ppm [87]. The rootsof hyperaccumulator species dissolve metals in soil [86], increase metal uptake and translocation, andmake hyperaccumulator species to tolerate higher Pb ions concentrations. Apart from this, variousdetoxification mechanisms include selective metal uptake, excretion, complexation by specific ligands,and compartmentalization, which are also support for Pb tolerance.
In addition, Pb translocation to APP increases by organic chelators like ethylene diamine tetraacetate (EDTA) and micro-organisms [2,25]. Liu et al. [88] observed higher translocation to APPwith increased soil Pb level in B. Pekinensis cultivars. This may be due to the potential of high Pbconcentrations to destroy the casparian strip based physical barrier.
Xylem helps in the transportation of metals from plant roots to shoots [89], which is probablysupported by transpiration [90]. Arias et al. [2] demonstrated X-ray mapping and found high Pbdeposition in xylem and phloem cells on mesquite plants. After penetrating into the central cylinder ofthe stem, Pb can again be transported via the apoplastic pathway and further translocated to leaf areasthrough vascular flow [73]. In xylem, Pb can form complexes with amino/organic acids [87]. However,inorganic Pb can also be transferred. Translocation factor (i.e., lead in aerial parts/leading roots) canbe implemented to know the degree of Pb translocation [86,88]. After implementing this factor, lownumeric values will indicate that lead has been sequestered in the roots system [88].
120

Int. J. Environ. Res. Public Health 2020, 17, 2179
The molecular mechanism of Pb entrance in roots is not clear yet. It is believed that severalpathways can be used by Pb for the same purpose, especially ionic channels. However, Pb uptakeis a non-selective phenomenon and is independent of the H+/ATPase pump [91]. Lead absorptionis inhibited by calcium [92] as Pb competes with Ca for calcium channels. Ca2+-permeable channelsare important gateways for Pb to penetrate into the root system [91,93]. The transgenic plant studiesreveal that Pb can also penetrate into roots through other alternative non-selective pathways, e.g.,cyclic nucleotide-gated ion channels and low-affinity cation transporters [94]. Comprehensive detailsfor the average lead content in different food crop plants are summarized in Table 3. It is noted thathigher concentrations of Pb are associated with fruit crops (Table 3).
Table 3. Details for the average lead contents in different crop plants.
Plant Species Scientific Name Concentration (mg/kg) References
Vegetable crops
Coriander Coriandrum sativum 4.5 [95]Spinach Spinacia oleracea 0.98–9.2 [96–99]
Coriander Coriandrum sativum 0.4–75.5 [98,100–105]Cabbage Brassica oleracea 0.07–12 [97,104,106–108]
Radish leaf Raphanus sativus 0.4 [100]Amaranthus Amaranthus blitum 23.26 [109]
Parsley Petroselimum crispum 2.31 [97]Slender amaranth Amaranthus viridis 2.56 [101]
Sugar beet Beta vulgaris L 149.5 [102]Slender amaranth Amaranthus viridis 5.44 [110]
Tomato Solanum lycopersicum 5.5 [99]Brinjal Solanum melongena 2.1 [95]
Cucumber Cucumis sativus 1.5 [95]Brinjal Solanum lycopersicum 2.2 [98]
Raddish Raphanus sativus 0.75 [111]Eggplant Solanum melongena 4.93 [112]
Brinjal Solanum tuberosum 6.19 [112]Pumpkin Cucurbita maxima 0.25 [113]
Chilli Capsicum annuum 0.17 [113]Carrot Daucus carota 0.72–7.8 [95–97]
Sugar beet Beta vulgaris L. 26.35 [109]Potato Solanum tuberosum 0.012–2.58 [106,107]
Cauliflower Brassica oleracea 0.36–6.1 [95,97,104]
Spices Crops
Aniseed Pimpinella anisum 0.26–5.68 [114,115]Bay leaf Cinnamomum tamala 0.98–3.58 [116–118]
Cardamom Elettaria cardamomum 0.583 [115]Cassia Cinnamonum cassia 4.159 [115]Curry Murraya koenigii 3.617 [117]
Dill Anethum graveolens L. 0.81 [119]Fennel Foeniculum vulgare 0.316 [115]
Fenugreek Trigonella foenum-graecum L. 9.38 [114]Rosemary Rosmarinus officinalis 10.8 [120]
Tulsi Ocimum sanctum 4.59 [116]
Fruit Crops
Mango Magnifera indica 0.642–1.620 [121,122]Orange Citrus sinensis 26
[123]
Pomegranate Punica granatum 28Grapes Vitis vinifera 24Lemon Citrus limon 29
Strawberry Fragaria ananassa 10Buckthorn Hippophae rhamnoides 20
Peaches Prunus persica 11
121

Int. J. Environ. Res. Public Health 2020, 17, 2179
Table 3. Cont.
Plant Species Scientific Name Concentration (mg/kg) References
Banana Musa sp. 0.003–0.05 [122,124]Jackfruit Artocarpus heterophyllus 0.017Orange Citrus sinensis 0.106
[125]Trengerine Citrus tangernia 0.097Banana Musa 0.118Papaw Carica papaya 0.072
Cereals and Legumes Crops
Pearl millet Pennisetum glaucum 0.12 [126]Sorghum Sorghum bicolor 0.18 [126]
Wheat Triticum aestivum0.40 [127]0.47 [128]
Barley Hordeum vulgare 0.22 [129]Quinoa Chenopodium quinoa 0.37 [130]
Maize Zea mays0.50 [131]0.34 [132]0.31 [133]
Rice Oryza sativa0.52 [134]0.89 [135]
Black gram Vigna mungo 0.60 [133]Lentil Lens culinaris 0.55 [133]
Common bean Phaseolus vulgaris 0.12 [136]Soybean Glycine max 0.08 [137]Safflower Carthamus Tinctorius 0.80 [138]Rapeseed Brassica napus 0.51 [138]Sunflower Helianthus annus 0.57 [131]
Accidental soil ingestion is a major Pb exposure pathway for humans inhabited in a Pb pollutedarea [9,139]. However, the intake of Pb contaminated plants has been an important exposure to humansand animals [9,139,140]. Edible/wild plants cultivated/grown in the vicinity of phosphate industriescan be Pb bio-indicators of toxic metals [9]. Inhabitants and workers of these industries/provincesmay be exposed to Pb contamination. The Pb exposures and blood concentration to these closelyinhabited/living populations is subject to the season as well as industrial activity. The children’s bloodlead levels (BLLs) were observed to be higher during the summer and early fall [141]. The BLLs are highlysignificant, are evident in multiple locations, periods, and ages, and are population-specific [142,143].Higher levels were observed (10–60%) in warm-weather and levels increased in 2-year-old children,more so than 1 or over 4-year-olds [142,143]. Zahran et al. [143] emphasized that lead seasonality mustbe considered for Pb risk analysis. One health concept was proposed to take care of animal, human,and environmental health all together [144,145].
7. Mechanistic Understanding of Pb Toxicity and Tolerance in Plants and Humans
Lead causes a broad range (physiological, morphological, and biochemical) of toxic effects on livingorganism. In plants, Pb toxicity is characterized with impaired chlorophyll (Chl a) production, celldivision, elongation of root, lamellar organization in the chloroplast, plant growth, seed germination,seedling development, and transpiration [67,87]. However, the magnitude of the effects varies and/ordepends on Pb levels, exposure time, plant stress intensity, and plant developmental stage. Plantshave internal detoxification mechanisms to deal with Pb toxicity, i.e., complexation by specific ligands,selective metal uptake, excretion, and compartmentalization [18,21,61,87].
Lead induced oxidative stress is reported to produce reactive oxygen species (ROS) inplants [146,147]. These ROS synthesized as a result of oxidative stress in plants can cause deleteriouseffects such as lipid peroxidation, disrupted cell membrane, DNA and protein damage, inhibition ofphotosynthesis, and inhibition of ATP production [148]. To overcome the adverse effects of ROS, plantsproduce a variety of antioxidative enzymes. Lead imposed changes in antioxidative enzyme production
122

Int. J. Environ. Res. Public Health 2020, 17, 2179
of various food crops have been well established (Table 4). The activity of antioxidative enzymes, suchas superoxide dismutase, peroxidase, and ascorbate peroxidase, were positively correlated with Pbcontent, while Catalase, Glutathione reductase, and Glutathione peroxidise were decreased in both leafand root tissues (Table 4).
Lead poisoning cases in humans are mostly the result of oral ingestion and absorption via thegut [149]. Pb absorption from the gastrointestinal tract is subject to physical characteristics (such asage, pregnancy, fasting, and Fe and Ca status) and the physico-chemical nature of the material ingested(e.g., size of particles, solubility, mineralogy, and Pb species) [150]. The Pb absorbed in the intestineis further carried to soft tissue, e.g., in the liver, kidneys, and bone tissue, where it accumulates overtime [149]. The main transport processfor Pb to different body tissues from the intestine is via red bloodcells, where binding takes place between Pb and haemoglobin (HB). Nearly 99% of the Pb in blood isobserved in erythrocytes, with approximately 1% in both serum and plasma. Distribution of Pb in theorgans (the lungs, spleen, brain, aorta, renal cortex, bones, and teeth) relies greatly on Pb concentrationin plasma rather than on the whole blood. The half-life of Pb in blood is estimated to be 35 days,whereas the half-life of Pb in soft tissue is estimated to be 40 days. Pb can be resident in bone for up to30 years and concentrations of Pb in teeth and bone grow in proportion to age [149]. The Pb biologicalhalf-time is believed to be significantly greater in children than in adults. Lead creates chemical bondswith thiol groups of proteins and Pb toxicity is believed to inhibit enzymes and subsequently interferewith homeostasis of Mg, Ca, and Zn. Lead-induced oxidative stress is caused due to Pb poisoning as itdisrupts the pro-oxidant/antioxidant cell defence system. Antioxidant nutrients, such as vitamins E, C,B6, and B-carotene, and also Zn and Se, are believed to combat Pb-induced oxidative stress [151].
High levels of Pb absorption are found in children rather than in adults. It is approximated thatadults may absorb 3–10% of an oral dose of water-soluble Pb, whereas for children, it may be as highas 40–50%. Higher Pb concentrations are found in the blood of children who are Fe- or Ca-deficientthan those with replete Fe or Ca. Pb absorption may raise during the pregnancy period and over 95%of Pb deposits in skeletal bones as insoluble phosphate [149]. According to autopsy studies, corticalbone and teeth together account for 90–95% of the body’s Pb burden. The total Pb body burden inthe skeleton is 80–95% in adults and about 73% in children [149]. Mothers may transfer Pb to thefoetus and also to infants during the period of breastfeeding [152]. Pb toxicity principally targets thehuman central nervous system and children’s ingestion of large amounts of Pb from the environment,particularly when anaemic, is linked to lower intelligence and impaired motor function [149].
The Joint FAO/WHO Expert Committee on Food Additives (JECFA) made an estimation oftolerable weekly intake based on dose-response analyses and concluded that the provisional tolerableweekly intake (PTWI) is linked to a reduction in children’s IQ of at least 3 points and systolic bloodpressure of approximately 3 mmHg (0.4 kPA) higher in adults [149]. When observed in terms of ashift in IQ distribution or blood pressure in a population, these changes assume greater importance.The JECFA’s conclusion, therefore, was that the PTWI is no longer adequately protective of healthand they withdrew it. The lack of an indication of a threshold level for key effects of Pb based on thedose-response analysis led the JECFA to conclude that a new PTWI considered as health-protectivecould not be established. The JECFA reiterated that foetuses, infants, and children are the subgroupsthat have the highest sensitivity to Pb [150,153] due to the neuro-developmental effects. The EuropeanCommission [154] has set guidelines for maximum permissible levels of Pb in some foodstuffs (Table 5).Interventions such as eliminating leaded petrol, banning the use of Pb in wine bottles, and thediscontinuation of soldered cans are seen as an important factor in successful reduction of Pb infood. In children, Pb toxicity symptoms are loss of appetite, anemia, behavioral changes, delayedmental growth and learning, fatigue, headaches, hyperactivity, insomnia, metallic taste, reduced nerveconduction, weight loss, and possibly neuron disorders [155]. The behavior changes are irreversibleand untreatable as the cerebrum of Homo sapiens has little capability for reparation. A daily Pb intake ofup to 7 µg/kg body weight or 490 µg of Pb for an adult was accepted by WHO, FAO. However, no suchguideline is given for infants and children, who are relatively more sensitive to low Pb levels [156].
123

Int. J. Environ. Res. Public Health 2020, 17, 2179
In broilers that have high Pb acetate (200 mg/kg) exposure in their diet, these show anorexia,greenish diarrhea, leg paresis, weight loss, wing droop, and lethargy symptoms including gross changein kidney, spleen, and liver function, gizzard lining, hemorrhages on muscles [157], etc. Gao et al. [157]concluded that Pb could alter the expression of selenoprotein related genes in the cartilage tissue ofbroilers. Rahman and Joshi [158] revealed that Pb acetate (i.e., 250–400) in drinking water could lead toreduced feed intake and growth indices in broilers due to higher oxidative stress. Pb-induced oxidativestress can also reduce antioxidant activities such as catalase, glutathione superoxide dismutase [159],etc. and erythrocytes burst due to lipid peroxidation in erythrocytes membranes and may causehemolytic anemia [160]. Pb could also respond to change in the activities and expression of antioxidantenzyme–related genes [161,162]. Most animal experiments confirm that Pb transportation in the bodyoccurs through blood circulation and accumulates in soft tissues, bones, and other pivotal organs [163].Bones are a major sink of Pb (~90%) and mostly replace calcium, thus decreasing in bone mineraldensity (BMD) due to Pb exposure [164].
Table 4. Effects of Pb toxicity on activities of different antioxidant enzymes in different plants [16].
EnzymesPb Exposure Level Duration References
Enhanced Reduced
Sedum alfredii SOD APX 0–200 µM 14 [63]
Triticumaestivum
SOD, POX, APX CAT 0, 0.15, 0.3, 1.5, 3.0 mM 6 [165]SOD, POX, CAT, APX - 0, 1, 2, 4 mM 3 [166]
SOD, CAT APX, GPX,GR 0, 8, 40 mg L−1 5 [167]
SOD GPX 0, 500, 1000, 2500 µM 7 [168]
Oryza sativa SOD CAT, POD 0, 50, 100, 200 M 16 [169]
Triticumaestivum
SOD, CAT APX, GPX,GR 0, 50, 100, 250, 500 µM 4 [170]
Zea maysSOD, APX, GPX, GR CAT 0, 16, 40, 80 mg L−1 Pb2+ 8 [146]
APX, DHAR,MDHAR - 0, 16, 40, 80 mg L−1 Pb2+ 1 [171]
Oryza sativa SOD, APX, GR CAT 0, 10, 50 µM 4 [172]
SOD: Superoxide dismutase; POX: Peroxidase; APX: Ascorbate peroxidase; CAT: Catalase; GPX: Glutathioneperoxidise; GR: Glutathione reductase; MDHAR: monodehydroascorbate reductase; DHAR: dehydroascorbatereductase.
Table 5. Maximum permissible level of Pb in foodstuffs (mg/kg Fresh Weight).
Lead in Food Stuffs (mg/kg Fresh Weight) Maximum Permissible Level
Food of Plant OriginRye, grain 0.20
Wheat, grain 0.20Bread -
Miscellaneous cereals -Cabbage 0.30
Carrot and potatoes 0.10Apple 0.10
Milk chocolate -Food of animal origin
Carcass meat 0.10Offal -Fish 0.30
Fresh water fish, 0.30Eggs -Milk 0.02
Dairy products -
124

Int. J. Environ. Res. Public Health 2020, 17, 2179
8. Human Health Effects Due to the Consumption of Pb Contaminated Foodstuffs
Lead enters into the body through pathways like inhalation of wind-blown Pb-laden dust, ingestionof Pb contaminated soils, oral intake of Pb contaminated water, and food grown in Pb-contaminatedareas. Pb accumulation in livestock tissues may also pose a major risk to human health throughlivestock meat consumption [173,174]. After absorption, Pb is distributed in the body through redblood cells (RBC). Pb is mostly bound to hemoglobin rather than RBC membrane after entering thecell [175]. The hematopoietic is a sensitive system for critical Pb toxicity and may lead to anemia [160].Histopathological observations confirmed that Pb ions are transported to the liver, where they caninduce chronic damage to the liver. Pb toxicity also increases blood enzyme levels and reduces proteinsynthesis [176–178]. Pb imposes toxic effects on kidneys through structural damage and changes in theexcretory function [176,177,179]. The other organ and tissue systems affected due to lead toxicity arethe nervous, cardiovascular, and reproductive systems [160,175,180]. Pb toxicity imposes mineralizingof bones and teeth, which is a major body burden [3]. The International Agency for Research on Cancer(IARC) stated that inorganic Pb is probably carcinogenic to humans (Group 2A) based on limitedevidence in humans and sufficient evidence in animals [181]. Generalized clinical symptoms of Pbpoisoning in humans are comprehensively summarized in Table 6.
Table 6. Generalized clinical symptoms of Pb poisoning in humans.
SL No. Body Organ/System Clinical Symptoms of Pb Poisoning
1 Eyes Blindness of parts of visual fieldHallucinations
2 Ears Hearing loss
3 MouthUnusual tasteSlurred speech
Blue line along the gum
4 Kidney Structural damage and failureChanges in the excretory function
5 Liver
JaundiceLead-induced oxidative stress
Decreased liver functionMicrovesicular and macrovesicular steatosis
Hemosiderosis and cholestasis
6 Skin Pallor and/or lividity
7 Central nervous system (CNS)
InsomniaLoss of appetiteDecreased libido
DepressionIrritability
Cognitive deficitsMemory loss
HeadachePersonality changes
DeliriumComa
Encephalopathy
8 Reproductive organsSperm dysfunctions
Pregnancy complicationsPreterm birth
9 Abdomen/Stomach
PainNausea
DiarrhoeaConstipation
125

Int. J. Environ. Res. Public Health 2020, 17, 2179
Table 6. Cont.
SL No. Body Organ/System Clinical Symptoms of Pb Poisoning
10 Blood Anaemia
11 GeneralMalaiseFatigue
Weight loss
12 Neuro- muscular
TremorPain
Delayed reaction timesLoss of coordination
ConvulsionsFoot or ankle drop
SeizersWeakness
13 BonesMineralizing bones and teeth
Decreased bone density
9. Pb Remediation approaches
Innovative and site-specific Pb remediation technologies for efficient clean-up of contaminatedsites are prerequisites for a healthy life and safe food production. There are different (physical, chemical,and biological) processes developed to reduce total Pb concentration and Pb bioavailability to mitigatePb accumulation in the food chain [182,183].
9.1. Physical Approaches
9.1.1. Replacement of the Medium (Soil/Water)
In this method, the complete or partial replacement of the contaminated resources (soil/water) isdone based on the magnitude of the contamination [183]. This method of remediation is very usefulat a small scale at the local level. The biggest challenge for this method is the safe disposal of thecontaminated soil/water in a cost-effective manner.
9.1.2. Vitrification
This method can be applied through both in-situ and ex-situ remediation mechanisms.In vitrification methods, soil is melted with the help of a high-temperature process and Pb sequestrationachieved in solidified vitreous mass [183,184]. Vitrification can be used long-term and effective lowvolume can be obtained for reuse [183]. This is a costly method and may not be suitable for applicationsin large areas. Dellisanti et al. [185] carried out the vitrification of Pb-rich ceramic waste. Wanget al. [186] treated fly ash from a municipal solid waste incinerator to radiated heavy metals includingPb. Navarro et al. [187] applied vitrification for remediating the hazardous mine wastes from oldmercury and Ag-Pb mines in Spain.
9.1.3. Electrokinetic Remediation
Electrokinetic remediation is achieved by applying current in the field. This processinvolves techniques such as electrophoresis, electric seepage/electro-migration, electro-osmosis, andelectrolysis [188]. Kim et al. [189] has shown that contaminated rice soil could be cleaned using anelectrokinetic technique, which reduces Pb contamination by 19.4% in 4 weeks. Jeon et al. [190]remediated a soil contaminated with Pb in a paddy rice crop using EDTA as an electrolyte. Theelectrokinetic remediation technique generates almost nil waste. Electrokinetic remediation is applicablefor saturated soils with low groundwater flow, requires short repair time and low energy, and provides a
126

Int. J. Environ. Res. Public Health 2020, 17, 2179
complete repair [183]. The heterogeneity of soil and treatment depths are the two important limitationsof this method.
9.2. Chemical Approaches
Various chemical amendments are widely used for immobilization of lead in soil and groundwater at the field scale (Table 7).
9.2.1. Chemical stabilization
This method is used to decrease the mobility, bioavailability, and bio-accessibility of heavy metalsin soil. The immobilizing agents, i.e., biochar (Wheat, Rice, Miscanthus straw biochar, Sugarcanebagasse biochar, Holm oak chips biochar), clay minerals (Sepiolite with limestone, Palygorskite,and Bentonite), liming materials (Oyster shells and eggshells), metal oxides (Mn oxides and Ferricoxyhydroxide powder with limestone), organic composts (Biosolid), and phosphate compounds(Phosphate rock, Calcium magnesium Phosphate, and Single superphosphate) were previously usedin the chemical stabilization process [183], details of which are given in Table 7. Chemical stabilizationis a simple, quick, relatively cost-effective chemical approach by which Pb can be immobilized byadsorption, chemical precipitation, ion exchange, and surface complexation mechanisms to limit Pbtransport and bioavailability. However, in this process, Pb remains in the soil and hence, long-termimmobility is recommended.
9.2.2. Solidification/Stabilization
Solidification/stabilization (waste fixation) is relatively low cost, low risk, easily implemented, andhighly resistant to biodegradation with abroad engineering applicability [183]. Soil solidification refersto the encapsulation of waste materials in a monolithic solid with high structural integrity [183,191].Soil stabilization is achieved by stabilization of soil contaminants through chemical interaction betweenPb and binding reagents [192]. Wang et al. [193] and Antemir et al. [194] demonstrated the potentialcement-based binders in remediating heavy metals including Pb in England. Navarro-Blasco et al. [195]assessed the Pb adsorption capacities of calcium aluminate cement. Voglar and Lestan [196] usedcalcium aluminate cement and sulfate resistant Portland cement as binders for Pb immobilizationin Slovenian soil. Wang et al. [197] assessed Portland cement, ground granulated blast furnace slag,pulverized fuel ash, MgO, and zeolite for on-site soil solidification/stabilization of Pb in UK soil.
9.2.3. Soil Washing
The soil washing process is achieved by Pb leaching from soil matrix using reagents/extractantssuch as chelating agents, inorganic acids, organic acids, surfactants, and water. The soil mixing withrespective reagents/extractants is done where extractants transfer Pb from soil to the liquid phase throughchelation or desorption, chemical dissolution, and ion exchange mechanisms [198]. Soil washing is a rapid,permanent, effective chemical method for Pb remediation with long term liability [199]. Hu et al. [200]achieved removal of 73% Pb using EDTA as a chelating agent. Wang et al. [201] used iminodisuccinic acid,glutamate-N, N-diacetic acid, glucomonocarbonic acid, and polyaspartic acid to extract 53% and 55% Pbfrom Pb-Zn contaminated soil. However, these technologies have certain hurdles for their practical utilitydue to change in soil properties, loss of nutrients, adverse effect of washing chemicals, generation ofwastewater, and cost of chemicals and their negative impact on the environment.
9.3. Biological Approaches
Biological methods for Pb remediation are the most eco-friendly alternatives to remediate Pbfrom the contaminated resources. Biological remediation can be referred as direct utilization of anynatural/genetically engineered living organism and their product for Pb detoxification to restore soilfunction and quality.
127

Int. J. Environ. Res. Public Health 2020, 17, 2179
Table 7. Chemical amendments for immobilization of lead in soil and groundwater at the fieldscale [183].
SN AmendmentsImmobilization
MechanismsObservations Reference
1. Clay minerals
Sepiolite + limestoneChemical precipitation
and surface complexation
The treatment decreasedexchangeable Pb (99.8%) and
reduced Pb in brown rice (81.2%).[202]
The treatment significantlyincreased soil pH and CEC,decreased Pb exchangeablefractions, and inhibited Pb
accumulation in rice.
[203]
Palygorskite Significantly reduced waterleachable Pb fractions (50%). [204]
Bentonite
Reduced Pb exchangeablefractions (20.3–49.3%). Increased
residual portions (6.73–10.0%).Pb concentrations in the riceroots (5.13–26.7%) and shoot
(3.73–7.8%) were reduced.
[205]
2. Phosphate compounds
Phosphate rock(Ca10(PO4)6Cl2
Calcium magnesiumphosphate (Ca3(PO4)2)Single superphosphate
(Ca(H2PO4)2)
Pb: Pb phosphateprecipitation, especially
pyromorphite-likemineral;
P fertilizers decreased watersoluble and exchangeable Pbfractions (22.03–81.4%) and
reduced Pb uptakes (16.03–58.0%)by a Chinese green vegetable.
[206]
3. Liming materials
Oyster shells and eggshells Chemical precipitation TCLP-leachable Pb was
effectively reduced. [207]
4. Organic composts
Biosolid Surface complexation andchemical precipitation
The treatment enhanced soil pH,cation exchange capacity, and
humic acids, with improved soilsorption capacity. The readily
soluble Pb forms were reduced.
[208]
5. Metal oxides
Ferric oxyhydroxidepowder + limestone
Specific sorption,co-precipitation, andinner-sphere complex
Pb decreased by 97% in porewater. Pb was transformed into
residual mineral.[209]
Mn oxides Pb immobilization. [210]
6. Biochar
Wheat Straw BiocharIncrease in soil pH, total
organic carbon, abundantfunctional groups, andcomplex structures of
biochar leads to reductionin heavy metals extractable
fractions
The soil extractable Pb wasdecreased. As a result, Pb in roottissues was significantly reduced.
[211]
Biochar significantly transformedthe exchangeable Pb fractionsinto relatively stable fractions.
[212]
Sugarcane bagasse biochar
The exchangeable Pb wasreduced and the
organically-bound fractionincreased with increased biocharinput. Pb bioavailability to plantshoots and roots decreased with
increasing biochar input.
[213]
128

Int. J. Environ. Res. Public Health 2020, 17, 2179
Table 7. Cont.
SN AmendmentsImmobilization
MechanismsObservations Reference
Holm oak chips biochar Biochar stabilized Pb and reducedits accumulation in barley grain. [214]
Rice straw biocharRice straw biochar decreased. Pb
bioavailability and reduced Pbcontents in vegetables.
[215]
Miscanthus (Miscanthusgiganteus) straw biochar
CaCl2-extractability of Pbsignificantly decreased with
increased biochar input.[216]
9.3.1. Phytoremediation
Phytoremediation is an environmentally-friendly, attractive, aesthetically pleasing, noninvasive,energy-efficient, and cost-effective technology that can remediate Pb in low to moderate contaminatedsoil. It includes phytostabilization and phytoextraction. Phytostabilization decreases the mobility/bioavailability of Pb through adsorption by roots, chemical precipitation, and complexation in theroot zone. Phytostabilization is only effective up to the root depth of plants. Cheng et al. [217]observed the Pb phytoremediation potential of Miscanthus floridulus. Yang et al. [218] ascertainedthe phyto-extraction potential of a co-planting system of Pteris vittata L. and the Ricinus communis L.in Pb contaminated soil and observed an increased yield of P. vittata after Pb uptake. Metal hyperaccumulater plant species such as Eichhornia crassipes, Lemna sp., and Pistia stratiotes have been widelyused to remediate Pb from diversified environments (Table 8).
9.3.2. Microbial Remediation
Microbial remediation refers to decreasing the availability of Pb in the environment usingindigenous/exotic microbes. Bacterial species such as Alcaligenes sp., Bacillus firmus, Bacillus licheniformis,Enterobacter cloacae, Escherichia coli, Micrococcus luteus, Pseudomonas fluorescens, and Salmonella typhi
show adsorption potential of Pb from the contaminated resources [219–223]. Wang et al. [224]concluded that bacterial strain B38 (mutant of Bacillus subtilis) has immense potential to remediateheavy metals including Pb in China. Zeng et al. [225] observed that Aspergillus niger strain SY1effectively removed Pb (99.5%) from contaminated sediment through bioleaching. The fungal biomassof Lepiotahystrix, Aspergillus niger, Aspergillus terreus, and Trichoderma longibrachiatum are reported aspotential bio-sorbents [223,226,227]. The algal species i.e., Palmaria palmate, Spirulina maxima, Spirogyra
hyaline, Cystoseira barbata, Cladophora sp., Chara aculeolata, Nitella opaca, and Ulva lactuca are wereidentified to be efficient bio-sorbents [223,228,229]. Microbial remediation is considered to be a natural,safe, and effective eco-friendly technology with low energy and low operation cost inputs [183]. Mostimportantly, microbial remediation does not impose any environmental and health hazards. Theprocess depends on the environmental condition and inputs such as nutrients, oxygen, and otheramendments to stimulate microbial activity for Pb remediation [183].
9.3.3. Microbial Assisted Phytoremediation
Many approaches including molecular fingerprinting techniques viz. length heterogeneity analysisby PCR (LH-PCR), terminal restriction fragment length polymorphism (T-RFLP), denaturing gradientgel electrophoresis (DGGE), single strand conformation polymorphism (SSCP), ribosomal intergenicspacer analysis (RISA), cloning, and In Situ Hybridization (ISH/FISH) were used to identify thepotent microbial community involved in phytoremediation [230–234]. This approach is based onthe rhizosphere associated microbes such as Bacillus, Beijerinckia, Burkholderia, Enterobacter, Erwinia,Flavobacterium, Gluconacetobacter, Klebsiella, Pseudomonas, and Serratia [235–237]. Babu et al. [235]inoculated soil with rhizospheric bacteria Pinus sylvestris and found significant increases in biomass,chlorophyll content, nodule number, and Pb accumulation in Alnus firma seedlings.
129

Int. J. Environ. Res. Public Health 2020, 17, 2179
Table 8. Phytoremediation potential of different plant species for Pb contaminated water and soil [21].
Species Treatments Observation Findings References
Ceratophyllumdemersum
Artificial wastewater Removal rate 92.0–95.0% Maximum BCF of 1284.35 in 4 mg/L of Pb12th Day. [238]
Leptodictyum riparium Artificial wastewater Removal rate 96.7% Having high resistance and effectiveness for Pbaccumulation. [239]
Scirpus grossus600 L spiked water in Pb (10, 30,and 50 mg/L), duration 98 days
Pb concentration in water decreased up to99% after 28 days and highest Pb uptake:1343, 4909, 3236 mg/kg for the treatmentof 10, 30, and 50 mg/L Pb, respectively
Highest BCF and TF were 485, 261, and 2.52 onday 42 of Pb treatment at 30 mg/L
concentration in 70 days retention time.[240]
Pistia stratiotesGreenhouse condition using
glass pots with a definedamount of added HMs
Pb removal was >90% in the first week No enhancement of Pb removal efficiency withincreased Pb concentrations. [241]
Eichhornia crassipesOperation in up-flow anaerobic
packed bed reactors system Pb Removal rate: 98%In the coupled pond system, water hyacinthwas observed to have enhanced Pb removal
efficiency by accumulating Pb into root[242,243]
Eichhornia crassipesStock solutions with initial
concentration of 20 g/L Pb Removal rate: 98.33% Powdered root of water hyacinth absorbedhigher Pb. [244,245]
Brassica oleracea var.Acephala
Treatments of differentConcentration Pb = 0, 1, 5, and
10 mg/kg
Phytoremediation of saline soils with 10and 16 mg/kg Pb
Negatively correlated with plant fresh and dryweights. [246]
Posidonia oceanica Sediments Pb Levels (mg/kg) in root: 4.52 ± 0.55,
Ability of Posidonia oceanic to accumulate anddetoxify Pb rather than being attributed to
differences in ecological andmorpho-anatomical characteristics.
[247]
Datura inoxiaConcentrations of 0.5, 1.0, 3.0,5.0, 10, 15, 20, 25, 30, 35, 40, 45,
50 mg/L metalSurvival rate = 50% Datura exhibits phytoremediation potential. [248]
Magnolia grandiflora Soil Pb Accumulation rate: 63.4%,Relationship between heavy metal
concentrations in soils and washed new andold leaves.
[249]
Pistia stratiotesHMs from steel effluents: 120 g
of plant in 10 L effluent Removal rates: Pb = 70.7%, E. crassipes more efficient than P. stratiotes. [250]
Lemna sp. Artificial by concentration of 2,5, and 10 mg/L
Pb removal rates by Lemna gibba: 60.1% at2 mg/L
at pH 9, 98.1% at 10 mg/L at pH 7,
BCF and metal uptake yield per unit of drybiomass for Pb is 403–738. [251]
130

Int. J. Environ. Res. Public Health 2020, 17, 2179
Table 8. Cont.
Species Treatments Observation Findings References
Pistia stratiotes Stock solution (2000 mg/L)96% removal of Pb(II) from 25 mL of
solution in60 min by only 0.125 g of biomass
Results consistent with the Langmuir model bymaximum biosorption capacity of 122.70 mg Pb
(II)/g of biomass.[252]
Mixture of Typhaangustifolia and
Limnocharis flavaWastewater oxidation pond Removal rate: Pb = 62.07% Positive relation between retention time and
heavy metal removal. [253]
Lemna sp.200 g fresh plant in mixedsewage of industrial and
municipal effluentsPb Removal efficiency >80% BCFs for Pb = 523, indicating that this plant is
a moderate accumulator of Pb. [254]
Lemna sp. Artificial: Pb = 0.25 mg/L Removal rates: Pb = 36%Removal efficiency up to 80% at higher metal
loading rate where 24 h light andpre-treatment steps required.
[242,243]
Eichhornia crassipes Mining wastewater Accumulation in leaves (mg/kg):Pb = 3.40–5.06 BCF: Pb = 242–506 [255]
Mixture of P. australisand T. latifolia
Urban sewage mixed withindustrial effluents Removal rate: Pb = 61.0 ± 1.2% - [256]131

Int. J. Environ. Res. Public Health 2020, 17, 2179
9.4. Biotechnological and Genetic Approaches
Genomics, metagenomics, metabolomics, proteomics, transcriptomics, nanoparticles, and isotopeprobing are modern technologies to understand Pb phytoremediation [234,235,257]. The biotechnologyand genetic approaches to remediate Pb from the contaminated resources have great potential andhave been proved in some plants [19]. Hattab et al. [258] observed a significant increase in ROS andcellular oxidative stress in Medicago sativa through influencing the expression of CuZn-SOD, GSHsynthase (GS), and GPX against Pb stress. Fan et al. [259] observed an unknown protein, product ofPSE1 (Pb-sensitive1) gene with NC domain, which is localized in cytoplasm and has potential for Pbtolerance in A. thaliana. Jiang et al. [260] studied the role of PDR12 knockout Arabidopsis and underPb stress conditions and concluded that PDR12 is responsible for the activation of a Pb exclusionmechanism. ABC transporter of the mitochondria 3 (ATM3) [260–262], acyl-CoA-binding protein [263],and leucine-rich repeat2 (LRR2) and ethylene-insensitive 2 (EIN2) [264] are also important to regulate Pbtransportation to the exterior of the cell [19,265]. A cytosol-localized malate dehydrogenase (CMDH4)protein functions as regulation of Pb tolerance mechanisms [19,266]. Pb is easily affected by GSHreductase in the plant cell [267]. Pb-mediated increased expression phytochelatins were also observedin Salvinia minima [268]. M. sativa plants showed 23-fold increased expression of PCS gene in thepresence of Pb [258]. Furthermore, GMO plants develop efficient metabolic processes and over expressgenes/enzymes that are capable of bioremediation specific pollutant. Different omic-approaches helpto explore different potential solutions targeting precise pollutants. For utilizing the omic-approachesbelow, certain research should be covered:
(a) Identification of candidate genes for effective and efficient removal of Pb contaminants.(b) Diversity and phylogenetic studies of gene and protein sequences which control Pb bioremediation.(c) Development of Genetically modified organism (GMO) plants through transgenesis.
GMO plants are capable of remediating various waste effluents and polluted lands and could beadvantageous for bioremediation practical applications. Moreover, information on the fundamentalomic-approaches concerned in bioremediation can also contribute towards the development of efficientbioremediation systems. Besides that, analysis of comparative genomic and proteomic study, theirfunctional variations, as well as evolutionary relationships existing between them can contributetowards designing new efficient bioremediation systems. Systems biology information like molecularpathways, gene ontogeny analysis, co-expression, and protein-protein interactions can influencethe Pb bioremediation processes. Therefore, with the help of bioinformatic analyses and modernbiotechnological techniques, one can evaluate and justify the need for genetically modified organismsfor the development of efficient remediation systems in the near future (Figure 1).
9.5. Nano-Technological Approaches
Recent scientific development in nanoscience research opens the way to cost-effective, eco-friendly,and sustainable remediation approaches. A nano technological approach has been successfully usedin soil, sediments, solid waste, and a wastewater remediation [18,269] process. Nano-materials aredynamic, efficient, and broadly applicable with economic expediency [18,270]. The characteristicfeatures of nano-materials such as Nanocatalysts, CNTs, graphenes, nano-scale metal oxides,nanomembranes, carbon nanotubes, nanobiological processes and zero-valent iron (FeO), Fe2O3,Fe3O4, TiO2, SiO2, and Al2O3 are summarized in Table 9. Nanoparticles (1–100 nm) provide very highadaptability for both in-situ and ex-situ remediation approaches [18]. Nanomaterials, nanoadsorbents,and nanosized compounds (quantum dots, nanofilms, nanoparticles, nanotubes, nanowires, and othervarious colloids) used for Pb remediation are listed in Table 9. Nanoparticles (less than 50 nm) havehigh potential as Pb adsorbents. Nano-adsorbents, i.e., activated carbon, alginate biopolymer, claymaterials, silica, magnetic iron oxide nanoparticles (MNPs), metal oxides, nano-titanates, etc. havebeen utilized to remove Pb [18,271,272]. The researchers showed that nano-material can enhance the
132

Int. J. Environ. Res. Public Health 2020, 17, 2179
accumulation of metals by improving the cell wall permeability, co-transportation of nanomaterialswith heavy metals, and transporter gene regulation [18,273].
Figure 1. Biotechnological and Genetic Approaches for the development of efficient remediationsystems.
Table 9. Characteristics of nano-particles in Pb removal [18].
SN Nano-Particles Characters NP SynthesisAbsorbent
DoseOptimum
pHRemovalEfficiency
References
1 Iron oxides NPs Magnetitenanoparticles
Co-precipitationfrom a mixture of
Fe(II) and (III)salts with aqueous
NH3 and KOH
50mg/20cm3 5.31–9.37 Pb(II)—
76–92% [274]
2 Ferrite nano particles -Modified
co-precipitationsynthesis
0.008 - Pb(II) upto 38.1% [275]
3 Activated carbon NPsHigh surface area
and greateradsorption capacity
- 0.02 2–10 Pb up to87% [276]
4 Nano scale zero valentiron(nZVI)
High surface areaand cation exchange
capacity
Reduction of Fe(II)using
borohydride- - - [277]
5 Starch stabilized zero valent Ironnanoparticles(nZVI-Starch)
Larger surface areafor sorption
reactions
Chemicalreduction method 1 g/kg soil 4.2 100% [278]
6 Zeolite materials obtained fromfly ash Greater specific area Hydrothermal
process 6.0 5.6–6.6 >80% [279]
7
Pyromellitic aciddianhydride/N-(3-(trimethoxysilyl)
propylethylenediamine(PMDA/TMSPEDA)
Bound heavy metalions via co-ordinate
and electrostaticinteractions
Ring openingpolymerization
and sol-gelreaction
0.01 7 Pd(II)—79.60% [280]
8 Ag and Zn nanoparticlesfunctionalized cellulose
High catalyticactivity, great
biocompatibility,high adsorption
capacity, highsurface-area,
reusability, andgreater dispersion
degree
Co-precipitationmethod 0.5 and 1.0 5.5 - [281]
133

Int. J. Environ. Res. Public Health 2020, 17, 2179
Table 9. Cont.
SN Nano-Particles Characters NP SynthesisAbsorbent
DoseOptimum
pHRemovalEfficiency
References
9 ZnO@ChitosancoreshellNanocomposite (ZOCS)
Hydrophilicity,biocompatibility,biodegradability,non-toxicity, andHigh adsorption
capacity
Directprecipitationfollowed by
thermaldecarbonation
0.02 6 Pb(II) upto 99% [282]
10 ZnO-Fe3O4 nanocompositesHigh adsorption
capacity and surfacearea
Chemicalco-precipitation 0.50 5.5 Pb(II) up
to 39.2% [283]
10. Conclusion and Future Prospects
The source, bioaccumulation, and health hazards of Pb are due to industrial and agriculturalactivities. Translocation of Pb from soil to a crop system is a complex and species dependentphenomenon. The human consumptive plant species have shown different bioaccumulation, tolerance,and toxicity levels for lead. Based on the tolerance mechanism, different concentrations of Pb accumulatein the food chain and cause different magnitudes of human health hazards. To minimize these Pb basedhealth risks, different remediation options are available for reducing the concentration of heavy metalsin soil and the food chain. However, site and source-specific integrated approaches must be practicedto formulate suitable remediation strategies. Biological remediation, such as phytoremediation andPGPR, can be an environmentally friendly and cost-effective strategy for alleviating Pb toxicityin moderately contaminated soils. Eco-feasible technological innovations such as nano-tools andawareness among farmers’ fraternity could possibly boost local economies and livelihoods withcertain financial guarantees. Similarly, suggestive measures should be taken to ensure the sustainedefficacy of Pb remediation such as the development of promising plants/mechanisms suitable for Pbphytoremediation. Exploitation of molecular approaches is required to manipulate Pb transportersand their cellular targeting to specific cell types. Development of transgenic plants with enhancedplant-microbe interaction is also a viable option to enhance phyto-remediation of Pb.
Author Contributions: The authors have made the following declaration about their contributions.Conceptualization: A.K. (Amit Kumar) 1, A.K. (Amit Kumar) 2, A.A.S., and A.K.C.; Methodology and structureof review: A.K. (Amit Kumar) 1, A.K. (Amit Kumar) 2, A.K.C., and C.-P.M.M.S.; Formal analysis of literature:A.K. (Amit Kumar) 1, G.S., and D.K.G.; Data curation and table preparation: D.K.G., S.K.M., C.-P.M.M.S., S.S.K.,S.A.K., G.S., and K.K.Y.; Contribution in their respective specialization in different sections: A.K. (Amit Kumar)1, A.K. (Amit Kumar) 2, C.-P.M.M.S., A.K.C., A.A.S., G.S., R.M., D.K.G., S.K.M., S.S.K., S.A.K., and K.K.Y.; Theoriginal draft preparation: A.K. (Amit Kumar) 1, A.K. (Amit Kumar) 2, A.K.C., G.S., R.M., and D.K.G.; Edited andfinalized the manuscript: A.K. (Amit Kumar) 2, A.K.C., G.S., C.-P.M.M.S., D.K.G., and A.A.S. All authors haveread and agreed to the published version of the manuscript.
Funding: This research received no external funding.
Conflicts of Interest: The authors declare no conflict of interest.
References
1. World Health Organisation (WHO). Action Is Needed on Chemicals of Major Public Health Concern. Public
Health Environ. 2010, 1–4. Available online: https://www.who.int/ipcs/assessment/public_health/chemicals_phc/en/ (accessed on 27 November 2019).
2. Arias, J.A.; Peralta-Videa, J.R.; Ellzey, J.T.; Ren, M.; Viveros, M.N.; Gardea-Torresdey, J.L. Effects of Glomus
deserticola inoculation on Prosopis: Enhancing chromium and lead uptake and translocation as confirmed byX-ray mapping, ICP-OES and TEM techniques. Environ. Exp. Bot. 2010, 68, 139–148. [CrossRef]
3. ATSDR. Case Estudies in EnvironmentalL Medicine (CSEM) Lead Toxicity. Available online: https://www.atsdr.cdc.gov/csem/lead/docs/CSEM-Lead_toxicity_508.pdf (accessed on 27 November 2017).
4. Pais, I.; Jones, J.B. The Handbook of Trace Elements; Saint Lucie Press: Boca Raton, FL, USA, 1997.
134
Int. J. Environ. Res. Public Health 2020, 17, 2179
5. Assi, M.A.; Hezmee, M.N.M.; Haron, A.W.; Sabri, M.Y.; Rajion, M.A. The detrimental effects of lead onhuman and animal health. Vet. World 2016, 9, 660–671. [CrossRef] [PubMed]
6. IARC. Agents Classified by the IARC Monographs. Volume 1–123. Available online: https://monographs.iarc.fr/wp-content/uploads/2019/02/List_of_Classifications.pdf (accessed on 24 November 2019).
7. EPA-IRIS. Lead and Compounds (Inorganic); CASRN 7439-92-1. Integrated Risk Information System(IRIS), Chemical Assessment Summary. Available online: https://cfpub.epa.gov/ncea/iris/iris_documents/documents/subst/0277_summary.pdf (accessed on 30 December 2019).
8. WHO. Lead Poisoning and Health. Available online: https://www.who.int/newsroom/fact-sheets/detail/lead-poisoning-and-health (accessed on 1 September 2019).
9. Saba, D.; Manouchehri, N.; Besançon, S.; El Samad, O.; Bou Khozam, R.; Nafeh Kassir, L.; Kassoufe, A.;Chebibe, H.; Ouainib, N.; Cambier, P. Bioaccessibility of lead in Dittrichia viscosa plants and risk assessmentof human exposure around a fertilizer industry in Lebanon. J. Environ. Manag. 2019, 250, 109537. [CrossRef][PubMed]
10. Sandin, G.; Peters, G.M. Environmental impact of textile reuse and recycling—A review. J. Clean. Prod. 2018.[CrossRef]
11. Cabral-Pinto, M.M.S.; Inácio, M.; Neves, O.; Almeida, A.A.; Pinto, E.; Oliveiros, B.; Ferreira da Silva, E.A.F.Human Health Risk Assessment Due to Agricultural Activities and Crop Consumption in the Surroundingsofan Industrial Area. Expo. Health 2019, 1–12. Available online: https://cerena.ist.utl.pt/news/paper-published-human-health-risk-assessment-due-agricultural-activities-and-crop-consumption (accessed on23 November 2019).
12. Cabral-Pinto, M.M.S.; Ordens, C.M.; de Melo, M.T.C.; Inácio, M.; Almeida, A.; Pinto, E.; da Silva, E.A.F. AnInter-disciplinary Approach to Evaluate Human Health Risks Due to Long-Term Exposure to ContaminatedGroundwater Near a Chemical Complex. Expo. Health 2019, 1–16. Available online: https://espace.library.uq.edu.au/view/UQ:996aa4e (accessed on 15 December 2019). [CrossRef]
13. Cabral Pinto, M.; Ferreira da Silva, E. Heavy Metals of Santiago Island (Cape Verde) alluvial deposits: Baselinevalue maps and human health risk assessment. Int. J. Environ. Res. Public Health 2019, 16, 2. [CrossRef]
14. Lee, J.W.; Choi, H.; Hwang, U.K.; Kang, J.C.; Kang, Y.J.; Kim, K.; Kim, J.H. Toxic effects of lead exposureon bioaccumulation, oxidative stress, neurotoxicity, and immune responses in fish: A review. Environ.
Toxi.Pharma. 2019, 68, 101–108. [CrossRef]15. Hindarwati, Y.; Soeprobowati, T.R.; Sudarno. Heavy metal content in terraced rice fieldsat Sruwen Tengaran
Semarang—Indonesia. E3S Web Conf. 2018, 31, 03009. [CrossRef]16. Zulfiqar, U.; Farooq, M.; Hussain, S.; Maqsood, M.; Hussain, M.; Ishfaq, M.; Ahmad, M.; Anjum, M.J. Lead
toxicity in plants: Impacts and remediation. J. Environ. Manag. 2019, 250, 109557. [CrossRef] [PubMed]17. Kumar, A.; Chaturvedi, A.K.; Yadav, K.; kumar, K.P.; Malyan, S.K.; Raja, P.; Kumar, R.; Khan, S.A.; Yadav, K.K.;
Rana, K.L.; et al. Fungal Phytoremediation of Heavy Metal-Contaminated Resources: Current Scenario andFuture Prospects. Recent Advancement in White Biotechnology through Fungi. In Fungal Biology; Yadav, A.,Singh, S., Mishra, S., Gupta, A., Eds.; Springer: Berlin, Germany, 2019.
18. Kumar, S.; Prasad, S.; Yadav, K.K.; Shrivastava, M.; Gupta, N.; Nagar, S.; Bach, Q.V.; Kamyab, H.; Khan, S.A.;Yadav, S.; et al. Hazardous heavy metals contamination of vegetables and food chain: Role of sustainableremediation approaches—A review. Environ. Res. 2019, 179, 108792. [CrossRef] [PubMed]
19. Kumar, A.; Prasad, M.N.V. Plant genetic engineering approach for the Pb and Zn remediation: Defensereactions and detoxification mechanisms. In Transgenic Plant Technology for Remediation of Toxic Metals and
Metalloids; Elsevier: San Diego, CA, USA, 2019; Volume 17, pp. 359–380.20. Gupta, N.; Yadav, K.K.; Kumar, V.; Kumar, S.; Chadd, R.P.; Kumar, A. Trace elements in soil-vegetables
interface: Translocation, bioaccumulation, toxicity and amelioration: A review. Sci. Total Environ. 2019, 651,2927–2942. [CrossRef] [PubMed]
21. Yadav, K.K.; Gupta, N.; Kumar, A.; Reece, L.M.; Singh, N.; Rezania, S.; Khan, S.A. Mechanistic understandingand holistic approach of phytoremediation: A review on application and future prospects. Ecol. Eng. 2018,120, 274–298. [CrossRef]
22. Sammut, M.; Noack, Y.; Rose, J.; Hazemann, J.; Proux, O.; Depoux Ziebel, M.; Fiani, E. Speciation of Cd andPb in dust emitted from sinter plant. Chemosphere 2010, 78, 445–450. [CrossRef] [PubMed]
135

Int. J. Environ. Res. Public Health 2020, 17, 2179
23. Vega, F.; Andrade, M.; Covelo, E. Influence of soil properties on the sorption and retention of cadmium,copper and lead, separately and together, by 20 soil horizons: Comparison of linear regression and treeregression analyses. J. Hazard. Mater. 2010, 174, 522–533. [CrossRef] [PubMed]
24. Cecchi, M.; Dumat, C.; Alric, A.; Felix-Faure, B.; Pradere, P.; Guiresse, M. Multi-metal contamination of acalcic cambisol by fallout from a lead-recycling plant. Geoderma 2008, 144, 287–298. [CrossRef]
25. Punamiya, P.; Datta, R.; Sarkar, D.; Barber, S.; Patel, M.; Das, P. Symbiotic role of glomus mosseae inphytoextraction of lead in vetiver grass. J. Hazard. Mater. 2010, 177, 465–474. [CrossRef]
26. Ratul, A.K.; Hassan, M.; Uddin, M.K.; Sultana, M.S.; Akbor, M.A.; Ahsan, M.A. Potential health risk of heavymetals accumulation in vegetables irrigated with polluted riverwater. Int. Food Res. J. 2018, 25, 329–338.
27. Chaoua, S.; Boussaa, S.; El Gharmali, A.; Boumezzough, A. Impact of irrigation withwastewater onaccumulation of heavy metals in soil and crops in the region of Marrakech inMorocco. J. Saudi Soc. Agric. Sci.
2018, 18, 429–436.28. Yang, J.; Ma, S.; Zhou, J.; Song, Y.; Li, F. Heavy metal contamination in soils andvegetables and health risk
assessment of inhabitants in Daye, China. J. Int. Med. Res. 2018, 46, 3374–3387. [CrossRef] [PubMed]29. Rahimi, G.; Kolahchi, Z.; Charkhabi, A. Uptake and translocation of some heavy metalsby rice crop (oryza
sativa) in paddy soils. Agriculture 2017, 63, 163–175.30. Showqi, I.; Lone, F.A.; Naikoo, M. Preliminary assessment of heavy metals in water, sediment and macrophyte
(Lemna minor) collected from Anchar Lake, Kashmir, India. Appl. Water Sci. 2018, 8, 3–11. [CrossRef]31. Sawut, R.; Kasima, N.; Maihemuti, B.; Hue, L.; Abliz, A.; Abdujappar, A.; Kurbana, M. Pollution characteristics
and health risk assessment of heavy metals in the vegetable bases ofnorthwest China. Sci. Total Environ.
2018, 642, 864–878. [CrossRef]32. Latif, A.; Bilal, M.; Asghar, W.; Azeem, M.; Ahmad, M.I. Heavy metal accumulation invegetables and
assessment of their potential health risk. J. Environ. Anal. Chem. 2018, 5, 234. [CrossRef]33. Kumar, V.; Chopra, A.K. Heavy metals accumulation in soil and agricultural crops grown in the province of
Asahi India Glass Ltd., Haridwar (Uttarakhand), India. Adv. Crop Sci. Technol. 2015, 4, 1. [CrossRef]34. Shahid, M.; Pinelli, E.; Pourrut, B.; Silvestre, J.; Dumat, C. Lead-induced genotoxicity to Vicia faba L. roots in
relation with metal cell uptake and initial speciation. Ecotoxicol. Environ. Saf. 2011, 74, 78–84. [CrossRef]35. Tabelin, C.; Igarashi, T. Mechanisms of arsenic and lead release from hydrothermally altered rock. J. Hazard.
Mater. 2009, 169, 980–990. [CrossRef]36. Lawal, O.; Sanni, A.; Ajayi, I.; Rabiu, O. Equilibrium, thermodynamic and kinetic studies for the biosorption
of aqueous lead(II) ions onto the seed husk of Calophyllum inophyllum. J. Hazard. Mater. 2010, 177, 829–835.[CrossRef] [PubMed]
37. Bi, X.; Ren, L.; Gong, M.; He, Y.; Wang, L.; Ma, Z. Transfer of cadmium and lead from soil to mangoes in anuncontaminated area, Hainan Island, China. Geoderma 2010, 155, 115–120. [CrossRef]
38. Cenkci, S.; Cigerci, I.H.; Yildiz, M.; Ozay, C.; Bozdag, A.; Terzi, H. Lead contamination reduces chlorophyllbiosynthesis and genomic template stability in Brassica rapa L. Environ. Exp. Bot. 2010, 67, 467–473. [CrossRef]
39. Padmavathiamma, P.K.; Li, L.Y. Phytoavailability and fractionation of lead and manganese in a contaminatedsoil after application of three amendments. Bioresour. Technol. 2010, 101, 5667–5676. [CrossRef]
40. Kopittke, P.M.; Asher, C.J.; Kopittke, R.A.; Menzies, N.W. Prediction of Pb speciation in concentrated anddilute nutrient solutions. Environ. Pollut. 2008, 153, 548–554. [CrossRef] [PubMed]
41. Komjarova, I.; Blust, R. Effect of Na, Ca and pH on simultaneous uptake of Cd, Cu, Ni, Pb, and Zn inthe water flea Daphnia magna measured using stable isotopes. Aquat. Toxicol. 2009, 94, 81–86. [CrossRef][PubMed]
42. Mager, E.M.; Esbaugh, A.J.; Brix, K.V.; Ryan, A.C.; Grosell, M. Influences of water chemistry on the acutetoxicity of lead to Pimephales promelas and Ceriodaphnia dubia. Comp. Biochem. Physiol. C Toxicol.
Pharmacol. 2011, 153, 82–90. [CrossRef] [PubMed]43. Levin, R.; Vieira, C.L.Z.; Mordarski, D.C.; Rosenbaum, M.H. Lead seasonality in humans, animals, and the
natural environment. Environ. Res. 2019, 180. [CrossRef]44. Esbaugh, A.J.; Brix, K.V.; Mager, E.M.; De Schamphelaere, K.; Grosell, M. Multilinear regression analysis
preliminary biotic ligand modeling, and cross species comparison of the effects of water chemistry on chroniclead toxicity in invertebrates. Comp. Biochem. Physiol. C Toxicol. Pharmacol. 2012, 155, 423–431. [CrossRef]
45. Kamel, M.M.; Ibrahm, M.A.; Ismael, A.M.; Motaleeb, M.A.E. Adsorption of some heavy metal ions fromaqueous solutions by using kaolinite clay. Ass. Univ. Bull. Environ. Res. 2004, 7, 101–109.
136

Int. J. Environ. Res. Public Health 2020, 17, 2179
46. Suzuki, T.; Niinae, M.; Koga, T.; Akita, T.; Ohta, M.; Choso, T. EDDS-enhanced electrokinetic remediation ofheavy metal-contaminated clay soils under neutral pH conditions. Colloids Surf. Physicochem. Eng. Asp. 2014,440, 145–150. [CrossRef]
47. Mao, L.C.; Bailey, E.H.; Chester, J.; Dean, J.; Ander, E.L.; Chenery, S.R.; Young, S.D. Lability of Pb in soil:Effects of soil properties and contaminant source. Environ. Chem. 2014, 11, 690–701. [CrossRef]
48. Li, X.; Meng, D.; Li, J.; Yin, H.; Liu, H.; Liu, X. Response of soil microbial communities and microbialinteractions to long-term heavy metal contamination. Environ. Pollut. 2017, 231, 908–917. [CrossRef] [PubMed]
49. Kögel-Knabner, W.; Amelung, Z.; Cao, S.; Fiedler, P.; Frenzel, R. Biogeochemistry of paddy soils. Geoderma
2010, 157, 1–14. [CrossRef]50. O’Reilly, S.E.; Hochella, M.F. Lead sorption efficiencies of natural and synthetic Mn and Fe-oxides. Geochem.
Cosmochim. Acta 2003, 67, 4471–4487. [CrossRef]51. Tao, J.; Liu, X.; Liang, Y.; Niu, J.; Xiao, Y.; Gu, Y. Maize growth responses to soil microbes and soil properties
after fertilization with different green manures. Appl. Microbiol. Biotechnol. 2016, 13, 1–11. [CrossRef]52. Xu, X.; Hui, D.; King, A.W.; Song, X.; Thornton, P.E.; Zhang, L. Convergence of microbial assimilations of soil
carbon, nitrogen, phosphorus, and sulfur in terrestrial ecosystems. Sci. Rep. 2015, 5, 17445. [CrossRef]53. Frank, J.J.; Poulakos, A.G.; Tornero-Velez, R.; Xue, J. Systematic review and meta-analyses of lead (Pb)
concentrations in environmental media (soil, dust, water, food, and air) reported in the United States from1996 to 2016. Sci. Tot. Envir. 2019, 694, 133489. [CrossRef]
54. Zhao, F.J.; Ma, Y.B.; Zhu, Y.G.; Tang, Z.; McGrath, S.P. Soil contamination in China: Current status andmitigation strategies. Environ. Sci. Technol. 2015, 49, 750–759. [CrossRef]
55. Emsley, J. Nature’s Building Blocks: An AZ Guide to the Elements; Oxford University Press: Oxford, UK, 2011.56. CDC. Advisory Committee on Childhood Lead Poisoning Prevention (ACCLPP); Jessica Kingsley Publishers:
London, UK, 2012.57. United States Environmental Protection Agency (USEPA). Estimation of Relative Bioavailability of Lead in Soil
and Soil-Like Materials Using In Vivo and In Vitro Methods; Report No.: OSWER 9285.7-77; Office of Solid Wasteand Emergency Response: Washington, DC, USA, 2007.
58. Yan, K.; Dong, Z.; Wijayawardena, M.A.A.; Liu, Y.; Naidu, R.; Semple, K. Measurement of soil leadbioavailability and influence of soil types and properties: A review. Chemosphere 2017, 184, 27–42. [CrossRef]
59. Denys, S.; Caboche, J.; Tack, K.; Rychen, G.; Wragg, J.; Cave, M.; Jondreville, C.; Feidt, C. In Vivo Validationof the Unified BARGE Method to Assess the Bioaccessibility of Arsenic, Antimony, Cadmium, and Lead inSoils. Environ. Sci. Technol. 2012, 46, 6252–6260. [CrossRef]
60. Deshommes, E.; Tardif, R.; Edwards, M.; Sauvé, S.; Prevost, M. Experimental determination of the oralbioavailability and bioaccessibility of lead particles. Chem. Cent. J. 2012, 6, 138–154. [CrossRef]
61. Jiang, W.; Liu, D. Pb-induced cellular defense system in the root meristematic cells of Allium sativum L. BMC
Plant Biol. 2010, 10, 1–40. [CrossRef] [PubMed]62. Yan, Z.Z.; Ke, L.; Tam, N.F.Y. Lead stress in seedlings of Avicennia marina, a common mangrove species in
South China, with and without cotyledons. Aquat. Bot. 2010, 92, 112–118. [CrossRef]63. Piechalak, A.; Tomaszewska, B.; Baralkiewicz, D.; Malecka, A. Accumulation and detoxification of lead ions
in legumes. Phytochemistry 2002, 60, 153–162. [CrossRef]64. Małecka, A.; Piechalak, A.; Morkunas, I.; Tomaszewska, B. Accumulation of lead in root cells of Pisum
sativum. Acta Physiol. Plant. 2008, 30, 629–637. [CrossRef]65. Brunet, J.; Varrault, G.; Zuily-Fodil, Y.; Repellin, A. Accumulation of lead in the roots of grass pea (Lathyrus
sativus L.) plants triggers systemic variation in gene expression in the shoots. Chemosphere 2009, 77, 1113–1120.[CrossRef]
66. Gichner, T.; Znidar, I.; Száková, J. Evaluation of DNA damage and mutagenicity induced by lead in tobaccoplants. Mutat. Res. Genet. Toxicol. Environ. Mutagen. 2008, 652, 186–190. [CrossRef]
67. Gupta, D.; Huang, H.; Yang, X.; Razafindrabe, B.; Inouhe, M. The detoxification of lead in Sedum alfredii H.is not related to phytochelatins but the glutathione. J. Hazard. Mater. 2010, 177, 437–444. [CrossRef]
68. Kopittke, P.M.; Asher, C.J.; Kopittke, R.A.; Menzies, N.W. Toxic effects of Pb2+ on growth of cowpea (Vignaunguiculata). Environ. Pollut. 2007, 150, 280–287. [CrossRef]
69. Metanat, K.; Ghasemi-Fasaei, R.; Ronaghi, A.; Yasrebi, J. Lead Phytostabilization and Cationic MicronutrientUptake by Maize as Influenced by Pb Levels and Application of Low Molecular Weight Organic Acids.Commun. Soil Sci. Plant Anal. 2019, 50, 1–10. [CrossRef]
137
Int. J. Environ. Res. Public Health 2020, 17, 2179
70. Meyers, D.E.R.; Auchterlonie, G.J.; Webb, R.I.; Wood, B. Uptake and localisation of lead in the root system ofBrassica juncea. Environ. Pollut. 2008, 153, 323–332. [CrossRef]
71. Ginn, B.R.; Szymanowski, J.S.; Fein, J.B. Metal and proton binding onto the roots of Fescue rubra. Chem Geol.
2008, 253, 130–135. [CrossRef]72. Krzeslowska, M.; Lenartowska, M.; Mellerowicz, E.J.; Samardakiewicz, S.; Wozny, A. Pectinous cell wall
thickenings formation–a response of moss protonemata cells to lead. Environ. Exp. Bot. 2009, 65, 119–131.[CrossRef]
73. Krzesłowska, M.; Lenartowska, M.; Samardakiewicz, S.; Bilski, H.; Wozny, A. Lead deposited in the cell wallof Funaria hygrometrica protonemata is not stable–a remobilization can occur. Environ. Pollut. 2010, 158,325–338. [CrossRef] [PubMed]
74. Uzu, G.; Sobanska, S.; Sarret, G.; Munoz, M.; Dumat, C. Foliar lead uptake by lettuce exposed to atmosphericfallouts. Environ. Sci. Technol. 2010, 44, 1036–1042. [CrossRef] [PubMed]
75. De Forest, D.K.; Brix, K.V.; Adams, W.J. Assessing metal bioaccumulation in aquatic environments: Theinverse relationship between bioaccumulation factors, trophic transfer factors and exposure concentration.Aquat. Toxicol. 2007, 84, 236–246. [CrossRef] [PubMed]
76. Bhatia, A.; Singh, S.; Kumar, A. Heavy metal contamination of soil, irrigation water and vegetables inperi-urban agricultural areas and markets of Delhi. Water Environ. Res. 2015, 87, 2027–2034. [CrossRef][PubMed]
77. Jan, F.A.; Ishaq, M.; Khan, S. A comparative study of human health risks via consumptionof food cropsgrown on wastewater irrigated soil (Peshawar) and relatively clean waterirrigated soil (lower Dir). J. Hazard.
Mater. 2010, 179, 612–621. [CrossRef]78. Balkhair, K.S.; Ashraf, M.A. Field accumulation risks of heavy metals in soil andvegetable crop irrigated
with sewage water in western region of Saudi Arabia. Saudi J. Biol. Sci. 2016, 23, 32–44. [CrossRef]79. Maurya, P.K.; Malik, D.S.; Yadav, K.K.; Kumar, A.; Kumar, S.; Kamyab, H. Bioaccumulation and potential
sources of heavy metal contamination in fish species in River Ganga basin: Possible human health risksevaluation. Toxicol. Rep. 2019, 6, 472–481. [CrossRef]
80. Chalkiadaki, O.; Dassenakis, M.; Lydakis-Simantiris, N. Bioconcentration of Cd and Ni invarious tissues oftwo marine bivalves living in different habitats and exposed to heavilypolluted seawater. Chem. Ecol. 2014,30, 726–742. [CrossRef]
81. Ziyaadini, M.; Yousefiyanpour, Z.; Ghasemzadeh, J. Biota-sediment accumulation factorand concentration ofheavy metals (Hg, Cd, As, Ni, Pb and Cu) in sediments and tissues ofChiton lamyi (Mollusca: Polyplacophora:Chitonidae) in Chabahar Bay, Iran. Iran. J. Fish. Sci. 2017, 16, 1123–1134.
82. Yarsan, E.; Yipel, M. The important terms of marine pollution biomarkers andbiomonitoring, bioaccumulation,bioconcentration, biomagnification. J. Mol. Biomark. Diagn. 2013, 1, 1–4. [CrossRef]
83. Conder, J.M.; Gobas, F.A.P.C.; Borga, K. Use of trophic magnification factors and relatedmeasures to characterizebioaccumulation potential of chemicals. Integr. Environ. Assess. Manag. 2012, 8, 85–97. [CrossRef]
84. Zhang, C.; Wang, X.; Ashraf, U.; Qiu, B.; Ali, S. Transfer of lead (Pb) in the soil-plant-mealybug-ladybirdbeetle food chain, a comparison between two host plants. Ecotoxicol. Environ. Saf. 2017, 143, 289–295.[CrossRef]
85. Xiong, Z.; Zhao, F.; Li, M. Lead toxicity in Brassica pekinensis Rupr: Effect on nitrate assimilation and growth.Environ. Toxicol. 2006, 21, 147–153. [CrossRef] [PubMed]
86. Arshad, M.; Silvestre, J.; Pinelli, E.; Kallerhoff, J.; Kaemmerer, M.; Tarigo, A.; Shahid, M.; Guiresse, M.;Pradere, P.; Dumat, C. A field study of lead phytoextraction by various scented Pelargonium cultivars.Chemosphere 2008, 71, 2187–2192. [CrossRef] [PubMed]
87. Maestri, E.; Marmiroli, M.; Visioli, G.; Marmiroli, N. Metal tolerance and hyperaccumulation: Costs andtrade-offs between traits and environment. Environ. Exp. Bot. 2010, 68, 1–13. [CrossRef]
88. Liu, W.; Zhou, Q.; Zhang, Y.; Wei, S. Lead accumulation in different Chinese cabbage cultivars and screeningfor pollution-safe cultivars. J. Environ. Manag. 2010, 91, 781–788. [CrossRef]
89. Verbruggen, N.; Hermans, C.; Schat, H. Molecular mechanisms of metal hyperaccumulation in plants.New Phytol. 2009, 181, 759–776. [CrossRef]
90. Liao, Y.; Chien, S.C.; Wang, M.; Shen, Y.; Hung, P.; Das, B. Effect of transpiration on Pb uptake by lettuceand on water soluble low molecular weight organic acids in rhizosphere. Chemosphere 2006, 65, 343–351.[CrossRef]
138

Int. J. Environ. Res. Public Health 2020, 17, 2179
91. Wang, H.; Shan, X.; Wen, B.; Owens, G.; Fang, J.; Zhang, S. Effect of indole-3-acetic acid on lead accumulationin maize (Zea mays L.) seedlings and the relevant antioxidant response. Environ. Exp. Bot. 2007, 61, 246–253.[CrossRef]
92. Kim, Y.Y.; Yang, Y.Y.; Lee, Y. Pb and Cd uptake in rice roots. Physiol. Plant. 2002, 116, 368–372. [CrossRef]93. Pourrut, B.; Perchet, G.; Silvestre, J.; Cecchi, M.; Guiresse, M.; Pinelli, E. Potential role of NADPH-oxidase in
early steps of lead-induced oxidative burst in Vicia faba roots. J. Plant Physiol. 2008, 165, 571–579. [CrossRef][PubMed]
94. Wojas, S.; Ruszczynska, A.; Bulska, E.; Wojciechowski, M.; Antosiewicz, D.M. Ca2+-dependent plant responseto Pb2+ is regulated by LCT1. Environ. Pollut. 2007, 147, 584–592. [CrossRef]
95. Sonawane, V.Y. Analysis of Heavy metals in vegetables collected from selected area around Dhulia, NorthMaharashtra, Maharashtra, India. Analysis 2015, 8, 1935–1939.
96. Jolly, Y.N.; Islam, A.; Akbar, S. Transfer of metals from soil to vegetables and possible health risk assessment.SpringerPlus 2013, 2, 385. [CrossRef]
97. Ali, M.H.; Al-Qahtani, K.M. Assessment of some heavy metals in vegetables, cereals and fruits in SaudiArabian markets. Egypt. J. Aquat. Res. 2012, 38, 31–37. [CrossRef]
98. Labhade, K.R. Assessment of heavy metal contamination in vegetables grown in and around Nashik City,Maharashtra State, India. IOSR J. Appl. Chem. 2013, 5, 9–14.
99. Mohod, C.V. A review on the concentration of the heavy metals in vegetable samples like spinach andtomato grown near the area of AmbaNalla of Amravati City. Int. J. Innov. Res. Sci. Eng. 2015, 4, 2788–2792.[CrossRef]
100. Maleki, A.; Amini, H.; Nazmara, S.; Zandi, S.; Mahvi, A.H. Spatial distribution of heavy metals in soil, water,and vegetables of farms in Sanandaj, Kurdistan, Iran. J. Environ. Health Sci. Eng. 2014, 12, 136. [CrossRef]
101. Gupta, S.; Jena, V.; Jena, S.; Davic, N.; Matic, N.; Radojevic, D.; Solanki, J.S. Assessment of heavy metalcontents of green leafy vegetables. Croat. J. Food Sci. Technol. 2013, 5, 53–60.
102. Ramesh, H.L.; YoganandaMoorthy, V.N. Assessment of heavy metal contamination in green leafy vegetablesgrown in Bangalore urban district of Karnataka. Adv. Life Sci. Technol. 2012, 6, 40–51.
103. Ramteke, S.; Sahu, B.L.; Dahariya, N.S.; Patel, K.S.; Blazhev, B.; Matini, L. Heavy metal contamination ofvegetables. J. Environ. Prot. 2016, 7, 996–1004. [CrossRef]
104. Guerra, F.; Trevizam, A.R.; Muraoka, T.; Marcante, N.C.; Canniatti-Brazaca, S.G. Heavy metals in vegetablesand potential risk for human health. Sci. Agric. 2012, 69, 54–60. [CrossRef]
105. Anwar, S.; Nawaz, M.F.; Gul, S.; Rizwan, M.; Ali, S.; Kareem, A. Uptake and distribution of minerals andheavy metals in commonly grown leafy vegetable species irrigated with sewage water. Environ. Monit.
Assess. 2016, 188, 541. [CrossRef] [PubMed]106. Gebrekidan, A.; Weldegebriel, Y.; Hadera, A.; Van der Bruggen, B. Toxicological assessment of heavy metals
accumulated in vegetables and fruits grown in Ginfelriver near Sheba Tannery, Tigray, Northern Ethiopia.Ecotoxicol. Environ. Saf. 2013, 95, 171–178. [CrossRef]
107. Deribachew, B.; Amde, M.; Nigussie-Dechassa, R.; Taddese, A.M. Selected heavy metals in some vegetablesproduced through wastewater irrigation and their toxicological implications in Eastern Ethiopia. Afr. J. Food
Agric. Nutr. Dev. 2015, 15, 10013–10032.108. Mohammed, N.K.; Khamis, F.O. Assessment of heavy metal contamination in vegetables consumed in
Zanzibars. Nat. Sci. 2012, 4, 588. [CrossRef]109. Priya, E.S.; Sunil, G.; Shivaiah, K.; Gaddameedi, A.; Kumar, A. Extent of heavy metal contamination in leafy
vegetables, soil and water from surrounding of Musi river, Hyderabad, India. J. Ind. Pollut. Control. 2014, 30,289–293.
110. Adedokun, A.H.; Njoku, K.L.; Akinola, M.O.; Adesuyi, A.A.; Jolaoso, A.O. Potential human health riskassessment of heavy metals intake via consumption of some leafy vegetables obtained from four market inLagos metropolis, Nigeria. J. Appl. Sci. Environ. Manag. 2016, 20, 530–539. [CrossRef]
111. Taghipour, H.; Mosaferi, M. Heavy metals in the vegetables collected from production sites. Health Promot.
Perspect. 2013, 3, 185–193. [PubMed]112. Soloman, P.E.; Jain, S.; Chauhan, S.S. Bio accretion of heavy metals by Okra and Eggplant grown in polluted
areas of Jaipur City and associated health risks. Int. J. Innov. Res. Sci. Eng. Technol. 2017, 6, 428–434.113. Islam, M.S.; Hoque, M.F. Concentrations of heavy metals in vegetables around the industrial area of Dhaka
city, Bangladesh and health risk assessment. Int. Food Res. J. 2014, 21, 12–18.
139

Int. J. Environ. Res. Public Health 2020, 17, 2179
114. Jawad, I. Determination of Heavy Met Herbs Available on the Iraq. Adv. Environ. Biol. 2016, 10, 66–69.115. Matloob, M.H. Using Stripping Voltammetry to Determine Heavy Metals in Cooking Spices Used in Iraq.
Pol. J. Environ. Stud. 2016, 25, 2057–2070. [CrossRef]116. Inam, F.; Deo, S.; Narkhede, N. Analysis of minerals and heavy metals in some spices collected from local
market. J. Pharaceut. Biol. Sci. 2013, 8, 40–43. [CrossRef]117. Gaya, U.I.; Ikechukwu, S.A. Heavy metal contamination of selected spices obtained from Nigeria. J. Appl.
Sci. Environ. Manag. 2016, 20, 681–688. [CrossRef]118. Nkansah, M.A.; Amoako, C.O. Heavy metal content of some common spices available in markets in the
Kumasi metropolis of Ghana. Am. J. Sci. Ind. Res. 2010, 1, 158–163. [CrossRef]119. Esetlili, B.Ç.; Pekcan, T.; Çobanoglu, Ö.; Aydogdu, E.; Turan, S.; Anac, D. Essential plant nutrients and heavy
metals concentrations of some medicinal and aromatic plants. J. Agric. Sci. 2014, 20, 239–247.120. Mosleh, Y.Y.; Mofeed, J.; Almaghrabi, O.A.; Kadasa, N.M.; El-Alzahrani, H.S.; Fuller, M.P. Residues of heavy
metals, PCDDs, PCDFs, and DL-PCBs some medicinal plants collected randomly from the Jeddah, centralmarket. Life Sci. J. 2014, 11, 1–8.
121. Ogunkunle, A.T.J.; Bello, O.S.; Ojofeitimi, O.S. Determination of heavy metal contamination of street-vendedfruits and vegetables in Lagos state, Nigeria. Int. Food Res. J. 2014, 21, 18–27.
122. Shaheen, N.; Irfan, N.M.; Khan, I.N.; Islam, S.; Islam, M.S.; Ahmed, M.K. Presence of heavy metals infruits and vegetables: Health risk implications in Bangladesh. Chemosphere 2016, 152, 431–438. [CrossRef][PubMed]
123. Ibraheen, L.H.; Abed, S.A. Accumulation detection of some heavy metals in some types of fruits in the localmarket of Al-Diwaniyah City, Iraq. Rasayan J. Chem. 2017, 10, 339–343.
124. Radwan, M.A.; Salama, A.K. Market basket survey for some heavy metals in Egyptian fruits and vegetables.Food Chem. Toxicol. 2006, 44, 1273–1278. [CrossRef]
125. Sobukola, O.P.; Adeniran, O.M.; Odedairo, A.A.; Kajihausa, O.E. Heavy metal levels of some fruits and leafyvegetables from selected markets in Lagos, Nigeria. Afr. J. Food Sci. 2010, 4, 389–393.
126. Dahiru, M.F.; Umar, A.B.; Sani, M.D. Cadmium, copper, lead and zinc levels in sorghum and millet grown inthe city of Kano and its environs. Glob. Adv. Res. J. Environ. Sci. Toxicol. 2013, 2, 82–85.
127. Guo, G.; Lei, M.; Wang, Y.; Song, B.; Yang, J. Accumulation of As, Cd, and Pb in sixteen wheat cultivarsgrown in contaminated soils and associated health risk assessment. Int. J. Environ. Res. Public Health 2018,15, 2601. [CrossRef]
128. Rezapour, S.; Atashpaz, B.; Moghaddam, S.S.; Damalas, C.A. Heavy metal bioavailability and accumulationin winter wheat (Triticum aestivum L.) irrigated with treated wastewater in calcareous soils. Sci. Total Environ.
2018, 656, 261–269. [CrossRef]129. Sakizadeh, M.; Ghorbani, H. Concentration of heavy metals in soil and staple crops and the associated health
risk. Arch. Hyg. Sci. 2017, 6, 303–313. [CrossRef]130. Haseeb, M.; Basra, S.M.A.; Afzal, I.; Wahid, A. Quinoa response to lead: Growth and lead partitioning. Int. J.
Agric. Biol. 2018, 20, 338–344. [CrossRef]131. Kacalkova, L.; Tlustos, P.; Szakova, J. Chromium, nickel, cadmium, and lead accumulation in maize,
sunflower, willow, and poplar. Pol. J. Environ. Stud. 2014, 23, 753–761.132. Akenga, T.; Sudoi, V.; Machuka, W.; Kerich, E.; Ronoh, E. Heavy metals uptake in maize grains and leaves in
different agro ecological zones in Uasin Gishu County. J. Environ. Prot. 2017, 8, 1435–1444. [CrossRef]133. Islam, M.S.; Ahmed, M.K.; Habibullah-Al-Mamun, M. Heavy metals in cereals and pulses: Health implications
in Bangladesh. J. Agric. Food Chem. 2014, 62, 10828–10835. [CrossRef] [PubMed]134. Lee, K.J.; Feng, Y.Y.; Choi, D.H.; Lee, B.W. Lead accumulation and distribution in different rice cultivars.
J. Crop Sci. Biotechnol. 2016, 19, 323–328. [CrossRef]135. Ihedioha, J.N.; Ujam, O.T.; Nwuche, C.O.; Ekere, N.R.; Chime, C.C. Assessment of heavy metal contamination
of rice grains (Oryza sativa) and soil from Ada field, Enugu, Nigeria: Estimating the human health risk.Hum. Ecol. Risk Assess. Int. J. 2016, 22, 1665–1677. [CrossRef]
136. Kahraman, A.; Onder, M. Accumulation of heavy metals in dry beans sown on different dates. J. Elem. 2018,23, 201–216. [CrossRef]
137. Sadrabad, E.K.; Boroujeni, H.M.; Heydari, A. Heavy metal accumulation in soybeans cultivated in Iran,2015–2016. J. Nutr. Food Secur. 2018, 3, 27–32.
140

Int. J. Environ. Res. Public Health 2020, 17, 2179
138. Palizban, A.; Badii, A.; Asghari, G.; Nafchi, M. Lead and cadmium contamination in seeds and oils of Brassicanapus L. and Carthamus tinctorius grown in Isfahan province/Iran. Iran. J. Toxicol. 2015, 8, 1196–1202.
139. Barbillon, A.; Aubry, C.; Nold, F.; Besancon, S.; Manouchehri, N. Health Risks Assessment in Three UrbanFarms of Paris Region for Different Scenarios of Urban Agricultural Users: A Case of Soil Trace MetalsContamination. J. Agric. Sci. 2019, 10, 352–370. [CrossRef]
140. Liu, X.; Song, Q.; Tang, Y.; Li, W.; Xu, J.; Wu, J.; Fan, W.; Brookes, P.C. Human health risk assessment ofheavy metals in soil–vegetable system: A multi-medium analysis. Sci. Total Environ. 2013, 463–464, 530–540.[CrossRef]
141. Laidlaw, M.A.S.; Filippelli, G.M.; Sadler, R.C.; Gonzales, C.R.; Ball, A.S.; Mielke, H.W. Children’s Blood LeadSeasonality in Flint, Michigan (USA), and Soil-Sourced Lead Hazard Risks. Int. J. Environ. Res. Public Health
2016, 13, 358. [CrossRef] [PubMed]142. Ngueta, G.; Abdous, B.; Tardif, R.; St-Laurent, J.; Levallois, P. Use of a cumulative exposure index to estimate
the impact of tap water lead concentration on blood lead levels in 1- to 5-year-old children (Montreal,Canada). Environ. Health Perspect. 2016, 124, 388–395. [CrossRef] [PubMed]
143. Zahran, S.; Laidlaw, M.A.S.; McElmurry, S.P.; Filippelli, G.M.; Taylor, M. Linking Source and Effect:Resuspended Soil Lead, Air Lead, and Children’s Blood Lead Levels in Detroit, Michigan. Environ. Sci.
Technol. 2013, 47, 2839–2845. [CrossRef] [PubMed]144. Lebov, J.; Grieger, K.; Womack, D.; Zaccaro, D.; Whitehead, N.; Kowalcyk, B.; MacDonald, P.D.M. A framework
for One Health research. One Health 2017, 3, 44–50. [CrossRef] [PubMed]145. Davisa, M.F.; Rankin, S.C.; Schurer, J.M.; Cole, S.; Conti, L.; Rabinowitz, P. COHERE Expert Review Group.
Checklist for One Health Epidemiological Reporting of Evidence (COHERE). One Health 2017, 4, 14–21.[CrossRef] [PubMed]
146. Kaur, G.; Singh, H.P.; Batish, D.R.; Kohli, R.K. Adaptations to oxidative stress in Zea mays roots under shortterm Pb2+ exposure. Biologia 2015, 70, 190–197. [CrossRef]
147. Rai, P.K.; Lee, S.S.; Zhang, M.; Tsang, Y.F.; Kim, K.H. Heavy metals in food crops: Health risks, fate,mechanisms, and Management. Environ. Inter. 2019, 125, 365–385. [CrossRef]
148. Ekmekci, Y.; Tanyolac, D.; Ayhan, B. A crop tolerating oxidative stress induced by excess lead: Maize.Acta Physiol. Plant. 2009, 31, 319–330. [CrossRef]
149. Kabata-Pendias, A.; Szteke, B. Trace Elements in Abiotic and Biotic Environments; CRC Press: Boca Raton, FL,USA, 2015.
150. World Health Organisation (WHO). Safety evaluation of certain food additives and contaminants. Availableonline: https://apps.who.int/iris/bitstream/handle/10665/44515/WHO_TRS_960_eng.pdf;jsessionid=AFB1D9565016562EA09FFBFF1734B190?sequence=1 (accessed on 25 December 2019).
151. Hsu, P.C.; Guo, Y.L. Antioxidant nutrients and lead toxicity. Toxicology 2002, 180, 33–44. [CrossRef]152. Concha, G.; Eneroth, H.; Hallstrom, H.; Sand, S. Contaminants and Minerals in Foods for Infants and Young
Children; National Food Agency: Uppsala, Sweden, 2013.153. World Health Organisation (WHO). Childhood Lead Poisoning; WHO: Geneva, Switzerland, 2010.154. EC. Commission of the European Communities. Commission Regulation (EC) No. 1881/2006 Regulation
ofsetting maximum levels for certain contaminants infoodstuffs L364-5/L364-24. Off. J. Eur. Union 2006, 364,5–24.
155. Bellinger, D.C.; Malin, A.; Wright, R.O. The Neurodevelopmental Toxicity of Lead: History, Epidemiology,and Public Health Implications. Adv. Neurotoxicol. 2018, 2, 1–26.
156. Wani, A.L.; Ara, A.; Usmani, J.A. Lead toxicity: A review. Interdiscip. Toxicol. 2015, 8, 55–64. [CrossRef][PubMed]
157. Gao, H.; Liu, C.P.; Song, S.Q.; Fu, J. Effects of Dietary Selenium Against Lead Toxicity on mRNA Levels of 25Selenoprotein Genes in the Cartilage Tissue of Broiler Chicken. Biol. Trace Elem. Res. 2016, 172, 234–241.[CrossRef] [PubMed]
158. Rahman, S.; Joshi, M.V. Effect of lead toxicity on growth and performance of broilers. Tamilnadu J. Vet. Anim.
Sci. 2009, 5, 59–62.159. Flora, G.; Gupta, D.; Tiwari, A. Toxicity of lead: A review with recent updates. Interdiscip. Toxicol. 2012, 5,
47–58. [CrossRef]160. Flora, S.J.S. Nutritional components modify metal absorption, toxic response and chelation therapy. J. Nutr.
Environ. Med. 2002, 12, 53–67. [CrossRef]
141

Int. J. Environ. Res. Public Health 2020, 17, 2179
161. Kasperczyk, A.; Machnik, G.; Dobrakowski, M.; Sypniewski, D.; Birkner, E.; Kasperczyk, S. Gene expressionand activity of antioxidant enzymes in the blood cells of workers who were occupationally exposed to lead.Toxicology 2012, 301, 79–84. [CrossRef]
162. Kasperczyk, S.; Dobrakowski, M.; Kasperczyk, A.; Ostałowska, A.; Birkner, E. The administration ofN-acetylcysteine reduces oxidative stress and regulates glutathione metabolism in the blood cells of workersexposed to lead. Clin. Toxicol. 2013, 51, 480–486. [CrossRef]
163. Gangoso, L.; Lloret, P.A.; Rodrıguez-Navarro, A.A.B.; Mateo, R.; Hiraldo, F.; Donazar, J.A. Long-term effectsof lead poisoning on bone mineralization in vultures exposed to ammunition sources. Environ. Pollut. 2009,157, 569–574. [CrossRef]
164. Theppeang, K.; Glass, T.A.; Bandeen-Roche, K.; Todd, A.C.; Rohde, C.A.; Links, J.M.; Schwartz, B.S.Associations of Bone Mineral Density and Lead Levels in Blood, Tibia, and Patella in Urban-Dwelling Women.Environ. Health Perspect. 2008, 116, 784–790. [CrossRef]
165. Lamhamdi, M.; Bakrim, A.; Aarab, A.; Lafont, R.; Sayah, F. Lead phytotoxicity on wheat (Triticum aestivum
L.) seed germination and seedlings growth. Comptes Rendus Biol. 2011, 334, 118–126. [CrossRef] [PubMed]166. Yang, Y.; Zhang, Y.; Wei, X.; You, J.; Wang, W.; Lu, J.; Shi, R. Comparative antioxidative responses and proline
metabolism in two wheat cultivars under short term lead stress. Ecotoxicol. Environ. Saf. 2011, 74, 733–740.[CrossRef]
167. Kaur, G.; Singh, H.P.; Batish, D.R.; Kohli, R.K. A time course assessment of changes in reactive oxygenspecies generation and antioxidant defense in hydroponically grown wheat in response to lead ions (Pb2+).Protoplasma 2012, 249, 1091–1100. [CrossRef] [PubMed]
168. Kaur, G.; Singh, H.P.; Batish, D.R.; Kumar, R.K. Growth, photosynthetic activity and oxidative stress in wheat(Triticum aestivum) after exposure of lead to soil. J. Environ. Biol. 2012, 33, 265–269. [PubMed]
169. Li, X.; Bu, N.; Yueying, L.; Maa, L.; Xin, S.; Zhang, L. Growth, photosynthesis and antioxidant responses ofendophyte infected and noninfected rice under lead stress conditions. J. Hazard. Mater. 2012, 213, 55–61.[CrossRef] [PubMed]
170. Kaur, G.; Singh, H.P.; Batish, D.R.; Kohli, R.K. Lead (Pb)-induced biochemical and ultrastructural changes inwheat (Triticum aestivum) roots. Protoplasma 2013, 250, 53–62. [CrossRef]
171. Kaur, G.; Kaur, S.; Singh, H.P.; Batish, D.R.; Kohli, R.K.; Rishi, V. Biochemical adaptations in Zea maysrootsto short-term Pb2+ exposure: ROS generation and metabolism. Bull. Environ. Contam. Toxicol. 2015, 95,246–253. [CrossRef]
172. Thakur, S.; Singh, L.; Zularisam, A.W.; Sakinah, M.; Din, M.F.M. Lead induced oxidative stress and alterationin the activities of antioxidative enzymes in rice shoots. Biol. Plant. 2017, 61, 595–598. [CrossRef]
173. Rumbeiha, W.K.; Braselton, W.E.; Donch, D. A retrospective study of the disappearance of blood lead incattle with accidental lead toxicosis. J. Vet. Diagn. Investig. 2001, 13, 373–378. [CrossRef]
174. Sharpe, R.T.; Livesey, C.T. Lead poisoning in cattle and its implications for food safety. Vet. Rec. 2006, 159,71–74. [CrossRef]
175. Abadin, H.; Ashizawa, A.; Stevens, Y.W.; Llados, F.; Diamond, G.; Sage, G.; Quinones, A.; Bosch, S.J.;Swarts, S.G. Toxicological Profile for Lead, Atlanta (GA): Agency for Toxic Substances and Disease Registry (US);Lewis Publishers: Boca Raton, FL, USA, 2007.
176. Yuan, G.; Dai, S.; Yin, Z.; Lu, H.; Jia, R.; Xu, J.; Song, X.; Li, L.; Shu, Y.; Zhao, X. Toxicological assessment ofcombined lead and cadmium: Acute and sub-chronic toxicity study in rats. Food Chem. Toxicol. 2014, 65,260–268. [CrossRef] [PubMed]
177. Cobbina, S.J.; Chen, Y.; Zhou, Z.; Wu, X.; Zhao, T.; Zhang, Z.; Feng, W.; Wang, W.; Li, Q.; Wu, X.; et al. Toxicityassessment due to sub-chronic exposure to individual and mixtures of four toxic heavy metals. J. Hazard.
Mater. 2015, 294, 109–120. [CrossRef] [PubMed]178. Shaban El-Neweshy, M.; Said El-Sayed, Y. Influence of vitamin C supplementation on lead-induced
histopathological alterations in male rats. Exp. Toxicol. Pathol. 2011, 63, 221–227. [CrossRef] [PubMed]179. Abdou, H.M.; Hassan, M.A. Protective role of omega-3 polyunsaturated fatty acid against lead acetate-induced
toxicity in liver and kidney of female rats. BioMed Res. Int. 2014, 2014, 435857. [CrossRef] [PubMed]180. Carocci, A.; Catalano, A.; Lauria, G.; Sinicropi, M.S.; Genchi, G. Lead toxicity, antioxidant defense and
environment. Rev. Environ. Contam. Toxicol. 2016, 238, 45–67. [PubMed]181. International Agency for Research on Cancer (IARC). Agents Classified by the IARC Monographs, Volumes
1–121; IARC Monographs: Lyon, France, 2018; pp. 1–25.
142

Int. J. Environ. Res. Public Health 2020, 17, 2179
182. Bhargava, A.; Carmona, F.F.; Bhargava, M.; Srivastava, S. Approaches for enhanced phytoextraction of heavymetals. J. Environ. Manag. 2012, 105, 103–120. [CrossRef] [PubMed]
183. Gong, Y.; Zhao, D.; Wang, Q. An overview of field-scale studies on remediation of soil contaminated withheavy metals and metalloids: Technical progress over the last decade. Water Res. 2018, 147, 440–460.[CrossRef]
184. Mallampati, S.R.; Mitoma, Y.; Okuda, T.; Simion, C.; Lee, B.K. Dynamic immobilization of simulatedradionuclide 133Cs in soil by thermal treatment/vitrification with nanometallic Ca/CaO composites. J. Environ.
Radioact. 2015, 139, 118–124. [CrossRef]185. Dellisanti, F.; Rossi, P.L.; Valdre, G. In-field remediation of tons of heavy metal-rich waste by Joule heating
vitrification. Int. J. Miner. Process. 2009, 93, 239–245. [CrossRef]186. Wang, Q.; Tian, S.; Wang, Q.; Huang, Q.; Yang, J. Melting characteristics during the vitrification of MSWI fly
ash with a pilot-scale diesel oil furnace. J. Hazard. Mater. 2008, 160, 376–381. [CrossRef]187. Navarro, A.; Cardellach, E.; Canadas, I.; Rodríguez, J. Solar thermal vitrification of mining contaminated
soils. Int. J. Miner. Process. 2013, 119, 65–74. [CrossRef]188. Yao, Z.; Li, J.; Xie, H.; Yu, C. Review on remediation technologies of soil contaminated by heavy metals.
Proc. Environ. Sci. 2012, 16, 722–729. [CrossRef]189. Kim, W.S.; Park, G.Y.; Kim, D.H.; Jung, H.B.; Ko, S.H.; Baek, K. In situ field scale electrokinetic remediation
of multi-metals contaminated paddy soil: Influence of electrode configuration. Electrochim. Acta 2012, 86,89–95. [CrossRef]
190. Jeon, E.K.; Jung, J.M.; Kim, W.S.; Ko, S.H.; Baek, K. In situ electrokinetic remediation of As-, Cu-, andPb-contaminated paddy soil using hexagonal electrode configuration: A full scale study. Environ. Sci. Pollut.
Control Ser. 2015, 22, 711–720. [CrossRef] [PubMed]191. Khan, F.I.; Husain, T.; Hejazi, R. An overview and analysis of site remediation technologies. J. Environ.
Manag. 2004, 71, 95–122. [CrossRef] [PubMed]192. Chen, Q.Y.; Tyrer, M.; Hills, C.D.; Yang, X.M.; Carey, P. Immobilisation of heavy metal in cement-based
solidification/stabilisation: A review. Waste Manag. 2009, 29, 390–403. [CrossRef]193. Wang, F.; Wang, H.; Al-Tabbaa, A. Leachability and heavy metal speciation of 17-year old stabilised/solidified
contaminated site soils. J. Hazard. Mater. 2014, 278, 144–151. [CrossRef]194. Antemir, A.; Hills, C.D.; Carey, P.J.; Magnie, M.C.; Polettini, A. Investigation of 4-year-old stabilised/solidified
and accelerated carbonated contaminated soil. J. Hazard. Mater. 2010, 181, 543–555. [CrossRef]195. Navarro-Blasco, I.; Duran, A.; Sirera, R.; Fernández, J.M.; Alvarez, J.I. Solidification/stabilization of toxic
metals in calcium aluminate cement matrices. J. Hazard. Mater. 2013, 260, 89–103. [CrossRef]196. Voglar, G.E.; Leštan, D. Equilibrium leaching of toxic elements from cement stabilized soil. J. Hazard. Mater.
2013, 246–247, 18–25. [CrossRef]197. Wang, F.; Wang, H.; Jin, F.; Al-Tabbaa, A. The performance of blended conventional and novel binders in the
in-situ stabilisation/solidification of a contaminated site soil. J. Hazard. Mater. 2015, 285, 46–52. [CrossRef][PubMed]
198. Ferraro, A.; Fabbricino, M.; van Hullebusch, E.D.; Esposito, G.; Pirozzi, F. Effect of soil/contaminationcharacteristics and process operational conditions on aminopolycarboxylates enhanced soil washing forheavy metals removal: A review. Rev. Environ. Sci. Biotechnol. 2015, 15, 111–145. [CrossRef]
199. Park, B.; Son, Y. Ultrasonic and mechanical soil washing processes for the removal of heavy metals fromsoils. Ultrason. Sonochem. 2017, 35, 640–645. [CrossRef] [PubMed]
200. Hu, P.; Yang, B.; Dong, C.; Chen, L.; Cao, X.; Zhao, J.; Wu, L.; Luo, Y.; Christie, P. Assessment of EDTA heapleaching of an agricultural soil highly contaminated with heavy metals. Chemosphere 2014, 117, 532–537.[CrossRef] [PubMed]
201. Wang, G.; Zhang, S.; Zhong, Q.; Xu, X.; Li, T.; Jia, Y.; Zhang, Y.; Peijnenburg, W.J.G.M.; Vijver, M.G. Effect ofsoil washing with biodegradable chelators on the toxicity of residual metals and soil biological properties.Sci. Total Environ. 2018, 625, 1021–1029. [CrossRef] [PubMed]
202. Wu, Y.J.; Zhou, H.; Zou, Z.J.; Zhu, W.; Yang, W.T.; Peng, P.Q.; Zeng, M.; Liao, B.H. A three-year in-situ studyon the persistence of a combined amendment (limestone+sepiolite) for remedying paddy soil polluted withheavy metals. Ecotoxicol. Environ. Saf. 2016, 130, 163–170. [CrossRef] [PubMed]
143

Int. J. Environ. Res. Public Health 2020, 17, 2179
203. Zhou, H.; Zhou, X.; Zeng, M.; Liao, B.H.; Liu, L.; Yang, W.T.; Wu, Y.M.; Qiu, Q.Y.; Wang, Y.J. Effects ofcombined amendments on heavy metal accumulation in rice (Oryza sativa L.) planted on contaminatedpaddy soil. Ecotoxicol. Environ. Saf. 2014, 101, 226–232. [CrossRef]
204. Zotiadis, V.; Argyraki, A.; Theologou, E. Pilot-scale application of attapulgitic clay for stabilization of toxicelements in contaminated soil. J. Geotech. Geoenviron. Eng. 2012, 138, 633–637. [CrossRef]
205. Sun, Y.; Li, Y.; Xu, Y.; Liang, X.; Wang, L. In situ stabilization remediation of cadmium (Cd) and lead (Pb)co-contaminated paddy soil using bentonite. Appl. Clay Sci. 2015, 105–106, 200–206. [CrossRef]
206. Wang, B.; Xie, Z.; Chen, J.; Jiang, J.; Su, Q. Effects of field application of phosphate fertilizers on the availabilityand uptake of lead, zinc and cadmium by cabbage (Brassica chinensis L.) in a mining tailing contaminatedsoil. J. Environ. Sci. 2008, 20, 1109–1117. [CrossRef]
207. Lim, J.E.; Ahmad, M.; Lee, S.S.; Shope, C.L.; Hashimoto, Y.; Kim, K.R.; Usman, A.R.A.; Yang, J.E.; Ok, Y.S.Effects of lime-based waste materials on immobilization and phytoavailability of cadmium and lead incontaminated soil. Clean-Soil Air Water 2013, 41, 1235–1241. [CrossRef]
208. Placek, A.; Grobelak, A.; Kacprzak, M. Improving the phytoremediation of heavy metals contaminated soilby use of sewage sludge. Int. J. Phytoremediat. 2016, 18, 605–618. [CrossRef] [PubMed]
209. Okkenhaug, G.; Grasshorn Gebhardt, K.A.; Amstaetter, K.; Lassen Bue, H.; Herzel, H.; Mariussen, E.;Rossebø Almås, Å.; Cornelissen, G.; Breedveld, G.D.; Rasmussen, G.; et al. Antimony (Sb) and lead (Pb) incontaminated shooting range soils: Sb and Pb mobility and immobilization by iron based sorbents, a fieldstudy. J. Hazard. Mater. 2016, 307, 336–343. [CrossRef] [PubMed]
210. McCann, C.M.; Gray, N.D.; Tourney, J.; Davenport, R.J.; Wade, M.; Finlay, N.; Hudson-Edwards, K.A.;Johnson, K.L. Remediation of a historically Pb contaminated soil using a model natural Mn oxide waste.Chemosphere 2015, 138, 211–217. [CrossRef] [PubMed]
211. Bian, R.; Joseph, S.; Cui, L.; Pan, G.; Li, L.; Liu, X.; Zhang, A.; Rutlidge, H.; Wong, S.; Chia, C.; et al. Athree-year experiment confirms continuous immobilization of cadmium and lead in contaminated paddyfield with biochar amendment. J. Hazard. Mater. 2014, 272, 121–128. [CrossRef]
212. Cui, L.; Pan, G.; Li, L.; Bian, R.; Liu, X.; Yan, J.; Quan, G.; Ding, C.; Chen, T.; Liu, Y.; et al. Continuousimmobilization of cadmium and lead in biochar amended contaminated paddy soil: A five-year fieldexperiment. Ecol. Eng. 2016, 93, 1–8. [CrossRef]
213. Nie, C.; Yang, X.; Niazi, N.K.; Xu, X.; Wen, Y.; Rinklebe, J.; Ok, Y.S.; Xu, S.; Wang, H. Impact of sugarcanebagasse-derived biochar on heavy metal availability and microbial activity: A field study. Chemosphere 2018,200, 274–282. [CrossRef]
214. Moreno-Jimenez, E.; Fernandez, J.M.; Puschenreiter, M.; Williams, P.N.; Plaza, C. Availability and transfer tograin of As, Cd, Cu, Ni, Pb and Zn in a barley agri-system: Impact of biochar, organic and mineral fertilizers.Agric. Ecosyst. Environ. 2016, 219, 171–178. [CrossRef]
215. Niu, L.; Jia, P.; Li, S.; Kuang, J.; He, X.; Zhou, W.; Liao, B.; Shu, W.; Li, J. Slash-and char: An ancient agriculturaltechnique holds new promise for management of soils contaminated by Cd, Pb and Zn. Environ. Pollut.
2015, 205, 333–339. [CrossRef]216. Houben, D.; Evrard, L.; Sonnet, P. Mobility bioavailability and pH-dependent leaching of cadmium, zinc and
lead in a contaminated soil amended with biochar. Chemosphere 2013, 92, 1450–1457. [CrossRef]217. Cheng, S.F.; Huang, C.Y.; Chen, K.L.; Lin, S.C.; Lin, Y.C. Phytoattenuation of lead-contaminated agricultural
land using Miscanthus floridulus—An in situ case study. Desalin. Water Treat. 2016, 57, 7773–7779. [CrossRef]218. Yang, J.; Yang, J.; Huang, J. Role of co-planting and chitosan in phytoextraction of as and heavy metals by
Pteris vittata and castor bean—A field case. Ecol. Eng. 2017, 109, 35–40. [CrossRef]219. Basha, S.A.; Rajaganesh, K. Microbial Bioremediation of Heavy Metals from Textile Industry Dye Effluents
using Isolated Bacterial Strains. Int. J. Curr. Microbiol. Appl. Sci. 2014, 3, 785–794.220. Kang, C.H.; So, J.S. Heavy metal and antibiotic resistance of ureolytic bacteria and their immobilization of
heavy metals. Ecol. Eng. 2016, 97, 304–312. [CrossRef]221. Puyen, Z.M.; Villagrasa, E.; Maldonado, J.; Diestra, E.; Esteve, I.; Solé, A. Biosorption of lead and copper by
heavy-metal tolerant Micrococcus luteus DE2008. Bioresour. Technol. 2012, 126, 233–237. [CrossRef]222. Jin, Y.; Luan, Y.; Ning, Y.; Wang, L. Effects and mechanisms of microbial remediation of heavy metals in soil:
A critical review. Appl. Sci. 2018, 8, 1336. [CrossRef]
144

Int. J. Environ. Res. Public Health 2020, 17, 2179
223. Jacob, J.M.; Karthik, C.; Saratale, R.G.; Kumar, S.S.; Prabakar, D.; Kadirvelu, K.; Pugazhendhi, A. Biologicalapproaches to tackle heavy metal pollution: A survey of literature. J. Environ. Manag. 2018, 217, 56–70.[CrossRef]
224. Wang, T.; Sun, H.; Mao, H.; Zhang, Y.; Wang, C.; Zhang, Z.; Wang, B.; Sun, L. The immobilization of heavymetals in soil by bioaugmentation of a UV-mutant Bacillus subtilis 38 assisted by NovoGro biostimulationand changes of soil microbial community. J. Hazard. Mater. 2014, 278, 483–490. [CrossRef]
225. Zeng, X.; Wei, S.; Sun, L.; Jacques, D.A.; Tang, J.; Lian, M.; Xu, Z. Bioleaching of heavy metals fromcontaminated sediments by the Aspergillus niger strain SY1. J. Soils Sediments 2015, 15, 1029–1038. [CrossRef]
226. Dursun, A.Y.; Uslu, G.; Cuci, Y.; Aksu, Z. Bioaccumulation of copper (II), lead (II) and chromium (VI) bygrowing Aspergillus niger. Process. Biochem. 2003, 38, 1647–1651. [CrossRef]
227. Kariuki, Z.; Kiptoo, J.; Onyancha, D. Biosorption studies of lead and copper using rogers mushroom biomassLepiota hystrix. S. Afr. J. Chem. Eng. 2017, 23, 62–70. [CrossRef]
228. Sooksawat, N.; Meetam, M.; Kruatrachue, M.; Pokethitiyook, P.; Nathalang, K. Phytoremediation potentialof charophytes: Bioaccumulation and toxicity studies of cadmium, lead and zinc. J. Environ. Sci. 2013, 25,596–604. [CrossRef]
229. Ibrahim, W.M.; Abdel Aziz, Y.S.; Hamdy, S.M.; Gad, N.S. Comparative Study for Biosorption of HeavyMetals from Synthetic Wastewater by Different Types of Marine Algae. J. Bioremed. Biodegrad. 2018, 9, 1–425.[CrossRef]
230. Jafari, M.; Younes, R.D.; Yubert, G. Molecular Techniques in Fungal Bioremediation. In Fungi as Bioremediators;Springer: Berlin/Heidelberg, Germany, 2013; pp. 453–465.
231. Subrahmanyam, G.; Hu, H.W.; Zheng, Y.M.; Gattupalli, A.; He, J.Z.; Liu, Y.R. Response of ammonia oxidizingmicrobes to the stresses of arsenic and copper in two acidic alfisols. Appl. Soil Ecol. 2014, 77, 59–67. [CrossRef]
232. Subrahmanyam, G.; Shen, J.P.; Liu, Y.R.; Archana, G.; Zhang, L.M. Effect of long-term industrial wasteeffluent pollution on soil enzyme activities and bacterial community composition. Environ. Monit. Assess.
2016, 188, 112. [CrossRef]233. Subrahmanyam, G.; Sharma, R.K.; Kumar, G.N.; Archana, G. Vigna radiata var. GM4 plant growth
enhancement and root colonization by a multi-metal-resistant plant growth-promoting bacterium Enterobacter
sp. C1D in Cr (VI)-amended soils. Pedosphere 2018, 28, 144–156. [CrossRef]234. Jaiswal, S.; Singh, D.K.; Shukla, P. Gene editing and systems biology tools for pesticide bioremediation:
A review. Front. Microbiol. 2019, 10, 87. [CrossRef]235. Babu, A.G.; Kim, J.D.; Oh, B.T. Enhancement of heavy metal phytoremediation by Alnus firma with
endophytic Bacillus thuringiensis GDB1. J. Hazard. Mater. 2013, 25, 477–483. [CrossRef]236. Sheng, X.F.; Xia, J.J.; Jiang, C.Y.; He, L.Y.; Qian, M. Characterization of heavy metal-resistant endophytic
bacteria from rape (Brassica napus) roots and their potential in promoting the growth and lead accumulationof rape. Environ. Pollut. 2008, 156, 1164–1170. [CrossRef]
237. Tak, H.I.; Ahmad, F.; Babalola, O.O. Advances in the Application of Plant Growth-Promoting Rhizobacteria inPhytoremediation of Heavy Metals. In Reviews of Environmental Contamination and Toxicology; Whitacre, D.M.,Ed.; Springer: New York, NY, USA, 2013; p. 223.
238. Lima, L.K.S.; Pelosi, B.T.; Silva, M.G.C.; Vieira, M.G.A. Lead and chromium biosorption by Pistia stratiotesbiomass. Chem. Eng. Trans. 2013, 32, 1045–1050.
239. Basile, A.; Sorbo, S.; Conte, B.; Cobianchi, R.C.; Trinchella, F.; Capasso, C.; Carginale, V. Toxicity, accumulation,and removal of heavy metals by three aquatic macrophytes. Int. J. Phytoremediat. 2012, 14, 374–387. [CrossRef][PubMed]
240. Tangahu, B.V.; Abdullah, S.R.S.; Basri, H.; Idris, M.; Anuar, N.; Mukhlisin, M. Phytoremediation of wastewatercontaining lead (Pb) in pilot reed bed using Scirpus grossus. Int. J. Phytoremediat. 2013, 15, 663–676. [CrossRef][PubMed]
241. Veselý, T.; Tlustos, P.; Száková, J. The use of water lettuce (Pistia stratiotes L.) for rhizofiltration of a highlypolluted solution by cadmium and lead. Int. J. Phytoremediat. 2011, 13, 859–872. [CrossRef] [PubMed]
242. Sekomo, C.B.; Rousseau, D.P.L.; Saleh, S.A.; Lens, P.N.L. Heavy metal removal in duckweed and algae pondsas a polishing step for textile waste water treatment. Ecol. Eng. 2012, 44, 102–110. [CrossRef]
243. Sekomo, C.B.; Kagisha, V.; Rousseau, D.; Lens, P. Heavy metal removal by combining anaerobic upflowpacked bed reactors with water hyacinth ponds. Environ. Technol. 2012, 33, 1455–1464. [CrossRef] [PubMed]
145

Int. J. Environ. Res. Public Health 2020, 17, 2179
244. Li, Q.; Chen, B.; Lin, P.; Zhou, J.; Zhan, J.; Shen, Q.; Pan, X. Adsorption of heavy metal from aqueous solutionby dehydrated root powder of long-root Eichhornia crassipes. Int. J. Phytoremediat. 2016, 18, 103–109.[CrossRef]
245. Li, R.; Zhou, Z.; Xie, X.; Li, Y.; Zhang, Y.; Xu, X. Effects of dissolved organic matter on uptake and translocationof lead in Brassica chinensis and potential health risk of Pb. Int. J. Environ. Res. Public Health 2016, 13, 687.[CrossRef]
246. Haghighi, M.; Kafi, M.; Pessarakli, M.; Sheibanirad, A.; Sharifinia, M.R. Using kale (Brassica oleracea var.acephala) as a phytoremediation plant species for lead (Pb) and cadmium (Cd) removal in saline soils. J. Plant
Nutr. 2016, 39, 1460–1471. [CrossRef]247. Bonanno, G.; Borg, J.A.; Martino, V.D. Levels of heavy metals in wetland and marine vascular plants and
their biomonitoring potential: A comparative assessment. Sci. Total Environ. 2017, 576, 796–806. [CrossRef]248. Waoo, A.A. Comparative effect of four heavy metals, Cd, Pb, Ni, and Cr, on Datura inoxia in Tissue Culture.
Int. J. Adv. Eng. Technol. Sci. 2016, 2, 7–11.249. Liang, J.; Fang, H.L.; Zhang, T.L.; Wang, X.X.; Liu, Y.D. Heavy metal in leaves of twelve plant species from
seven different areas in Shanghai, China. Urban For. Urban Green. 2017, 27, 390–398. [CrossRef]250. Aurangzeb, N.; Nisa, S.; Bibi, Y.; Javed, F.; Hussain, F. Phytoremediation potential of aquatic herbs from steel
foundry effluent. Braz. J. Chem. Eng. 2014, 31, 881–886. [CrossRef]251. Verma, R.; Suthar, S. Lead and cadmium removal from water using duckweed-Lemna gibba L.: Impact of
pH and initial metal load. Alex. Eng. J. 2015, 54, 1297–1304. [CrossRef]252. Volf, I.; Rakoto, N.G.; Bulgariu, L. Valorization of Pistia stratiotes biomass as biosorbent for lead (II) ions
removal from aqueous media. Sep. Sci. Technol. 2015, 50, 1577–1586. [CrossRef]253. Syukor, A.R.A.; Sulaiman, S.; Siddique, M.N.I.; Zularisam, A.W.; Said, M.I.M. Integration of phytogreen for
heavy metal removal from wastewater. J. Clean. Prod. 2016, 112, 3124–3131. [CrossRef]254. Bokhari, S.H.; Ahmad, I.; Mahmood-Ul-Hassan, M.; Mohammad, A. Phytoremediation potential of Lemna
minor L. for heavy metals. Int. J. Phytoremediat. 2016, 18, 25–32. [CrossRef]255. Prasad, B.; Maiti, D. Comparative study of metal uptake by Eichhornia crassipes growing in ponds from
mining and nonmining areas—A field study. Bioremediat. J. 2016, 20, 144–152. [CrossRef]256. Kumari, M.; Tripathi, B.D. Efficiency of Phragmites australis and Typha latifolia for heavy metal removal
from wastewater. Ecotoxicol. Environ. Saf. 2015, 112, 80–86. [CrossRef]257. Lorenzo-Gutiérrez, D.; Gómez-Gil, L.; Guarro, J.; Roncero, M.I.G.; Fernández-Bravo, A.; Capilla, J.; López-
Fernández, L. Role of the Fusarium oxysporum metallothionein Mt1 in resistance to metal toxicity andvirulence. Metallomics 2019, 11, 1230–1240. [CrossRef]
258. Hattab, S.; Flores-Casseres, M.L.; Boussetta, H.; Doumas, P.; Hernandez, L.E.; Banni, M. Characterisationof lead-induced stress molecular biomarkers in Medicago sativa plants. Environ. Exp. Bot. 2016, 123, 1–12.[CrossRef]
259. Fan, T.; Yang, L.; Wu, X.; Ni, J.; Jiang, H.; Zhang, Q.A.; Fang, L.; Sheng, Y.; Ren, Y.; Cao, S. The PSE1 genemodulates lead tolerance in Arabidopsis. J. Exp. Bot. 2016, 67, 4685–4695. [CrossRef]
260. Jiang, L.; Wang, W.; Chen, Z.; Gao, Q.; Xu, Q.; Cao, H. A role for APX1 gene in lead tolerance in Arabidopsisthaliana. Plant Sci. 2017, 256, 94–102. [CrossRef]
261. Kim, D.Y.; Bovet, L.; Kushnir, S.; Noh, E.W.; Martinoia, E.; Lee, Y. AtATM3 is involved in heavy metalresistance in Arabidopsis. Plant Physiol. 2006, 140, 922–932. [CrossRef] [PubMed]
262. Jiang, Y.; Wang, W.; Xie, Q.; Liu, N.; Liu, L.; Wang, D.; Zhang, X.; Yang, C.; Chen, X.; Tang, D.; et al. Plantstransfer lipids to sustain colonization by mutualistic mycorrhizal and parasitic fungi. Science 2017, 356,1172–1175. [CrossRef] [PubMed]
263. Xiao, S.; Gao, W.; Chen, Q.F.; Ramalingam, S.; Chye, M.L. Overexpression of membrane-associatedacyl-CoA-binding protein ACBP1 enhances lead tolerance in Arabidopsis. Plant J. 2008, 54, 141–151.[CrossRef] [PubMed]
264. Cao, S.; Chen, Z.; Liu, G.; Jiang, L.; Yuan, H.; Ren, G.; Bian, X.H.; Jian, H.; Ma, X. The Arabidopsis Ethylene-Insensitive 2 gene is required for lead resistance. Plant Physiol. Biochem. 2009, 47, 308–312. [CrossRef][PubMed]
265. Zhu, F.Y.; Li, L.; Lam, P.Y.; Chen, M.X.; Chye, M.L.; Lo, C. Sorghum extracellular leucine-rich repeat proteinSbLRR2 mediates lead tolerance in transgenic Arabidopsis. Plant Cell Physiol. 2013, 54, 1549–1559. [CrossRef]
146

Int. J. Environ. Res. Public Health 2020, 17, 2179
266. Yang, L.; Fan, T.; Guan, L.; Ren, Y.; Han, Y.; Liu, Q.; Liu, Y.; Cao, S. CMDH4 encodes a protein that is requiredfor lead tolerance in Arabidopsis. Plant Soil 2016, 412, 317–330. [CrossRef]
267. Anjum, M.; Miandad, R.; Waqas, M.; Gehany, F.; Barakat, M.A. Remediation ofwastewater using variousnano-materials. Arab. J. Chem. 2016, 11, 1–23.
268. Estrella-Gomez, N.; Mendoza-Cozatl, D.; Moreno-Sanchez, R.; Gonzalez-Mendoza, D.; Zapata-Perez, O.;Martınez-Hernandez, A.; Santamaria, J.M. The Pb-hyperaccumulator aquatic fern Salvinia minima Baker,responds to Pb21 by increasing phytochelatins via changes in SmPCS expression and in phytochelatinsynthase activity. Aquat. Toxicol. 2009, 91, 320–328. [CrossRef]
269. Adeleye, A.S.; Conway, J.R.; Garner, K.; Huang, Y.; Su, Y.; Keller, A.A. Engineerednanomaterials for watertreatment and remediation: Costs, benefits, and applicability. Chem. Eng. J. 2016, 286, 640–662. [CrossRef]
270. Wernisch, S.; Trapp, O.; Lindner, W. Application of cinchona-sulfonate-based chiralzwitterionic ion exchangersfor the separation of proline-containing dipeptide rotamers anddetermination of on-column isomerizationparameters from dynamic elution profiles. Anal. Chim. Acta 2013, 795, 88–98. [CrossRef] [PubMed]
271. Yong-Mei, H.; Man, C.; Zhong-Bo, H. Effective removal of Cu (II) ions from aqueoussolution byamino-functionalized magnetic nanoparticles. J. Hazard. Mater. 2010, 184, 392–399.
272. Yadav, K.K.; Singh, J.K.; Gupta, N.; Kumar, V. A review of nano-bioremediationtechnologies for environmentalcleanup: A novel biological approach. J. Mater. Environ. Sci. 2017, 8, 740–757.
273. Srivastav, A.; Yadav, K.K.; Yadav, S.; Gupta, N.; Singh, J.K.; Katiyar, R.; Kumar, V. Nano-phytoremediation ofpollutants from contaminated soil environment: Current scenario and future prospects. In Phytoremediation;Springer: Cham, Switzerland, 2018; pp. 383–401.
274. Bobik, M.; Korus, I.; Dudek, L. The effect of magnetite nanoparticles synthesis conditionson their ability toseparate heavy metal ions. Arch. Environ. Prot. 2017, 43, 3–9. [CrossRef]
275. Klekotka, U.; Winska, E.; Zambrzycka-Szelewa, E.; Satuła, D.; Kalska-Szostko, B. Heavy-metal detectorsbased on modified ferrite nanoparticles. Beilstein J. Nanotechnol. 2018, 9, 762–770. [CrossRef]
276. Hegazi, H.A. Removal of heavy metals from wastewater using agricultural and industrialwastes as adsorbents.HBRC J. 2013, 9, 276–282. [CrossRef]
277. Mohammed, A.A.; Brouers, F.; Sadi, S.I.A.; Al-Musawi, T.J. Role of Fe3O4 magnetitenanoparticles used tocoat bentonite in zinc (II) ions sequestration. Environ. Nanotechnol. Monit. Manag. 2018, 10, 17–27.
278. Okuo, J.; Emina, A.; Stanley, O.; Anegbe, B. Synthesis, characterization and applicationof starch stabilizedzerovalent iron nanoparticles in the remediation of Pb-acid battery soil. Environ. Nanotechnol. Monit. Manag.
2018, 9, 12–17.279. Visa, M. Synthesis and characterization of new zeolitematerials obtained from fly ash forheavy metals
removal inadvanced wastewater treatment. Powder Technol. 2016, 294, 338–347. [CrossRef]280. Alsohaimi, I.H.; Wabaidur, S.M.; Kumar, M.; Khan, M.A.; Alothman, Z.A.; Abdalla, M.A. Synthesis,
characterization of PMDA/TMSPEDA hybrid nano-composite and itsapplications as an adsorbent for theremoval of bivalent heavy metals ions. Chem. Eng. J. 2015, 270, 9–21. [CrossRef]
281. Ali, A.; Mannan, A.; Hussain, I.; Hussain, I.; Zi, M. Effective removal of metal ions fromaquous solutionby silver and zinc nanoparticles functionalized cellulose: Isotherm, kineticsand statistical supposition ofprocess. Environ. Nanotechnol. Monit. Manag. 2018, 9, 1–11.
282. Saad, A.H.A.; Azzam, A.M.; El-Wakeel, S.T.; Mostafa, B.B.; El-latif, M.B.A. Removal oftoxic metal ions fromwastewater using ZnO@Chitosan core shell Nanocomposite. Environ. Nanotechnol. Monit. Manag. 2018, 9,67–75.
283. Goyal, P.; Chakraborty, S.; Misra, S.K. Multifunctional Fe3O4-ZnO nanocomposites forenvironmentalremediation applications. Environ. Nanotechnol. Monit. Manag. 2018, 10, 28–35.
© 2020 by the authors. Licensee MDPI, Basel, Switzerland. This article is an open accessarticle distributed under the terms and conditions of the Creative Commons Attribution(CC BY) license (http://creativecommons.org/licenses/by/4.0/).
147


International Journal of
Environmental Research
and Public Health
Article
Links between Cognitive Status and Trace ElementLevels in Hair for an Environmentally ExposedPopulation: A Case Study in the Surroundings of theEstarreja Industrial Area
Marina M. S. Cabral Pinto 1,*, Paula Marinho-Reis 2, Agostinho Almeida 3 , Edgar Pinto 3 ,
Orquídia Neves 4 , Manuela Inácio 1, Bianca Gerardo 5 , Sandra Freitas 5 , Mário R. Simões 5,
Pedro A. Dinis 6 , Luísa Diniz 3, Eduardo Ferreira da Silva 1 and Paula I. Moreira 7
1 Geobiotec Research Centre, Department of Geosciences, University of Aveiro, 3810-193 Aveiro, Portugal;[email protected] (M.I.); [email protected] (E.F.d.S.)
2 Instituto de Ciências da Terra, University of Minho, 4710–057 Braga, Portugal; [email protected] Laboratory of Applied Chemistry, Department of Chemical Sciences, Faculty of Pharmacy,
LAQV/REQUIMTE, Porto University, 4050-313 Porto, Portugal; [email protected] (A.A.);[email protected] (E.P.); [email protected] (L.D.)
4 CERENA, DECivil, Instituto Superior Técnico, University of Lisbon, 1049-001 Lisbon, Portugal;[email protected]
5 Center for Research in Neuropsychology and Cognitive and Behavioral Intervention (CINEICC),University of Coimbra, 3030-548 Coimbra, Portugal; [email protected] (B.G.);[email protected] (S.F.); [email protected] (M.R.S.)
6 MARE—Marine and Environmental Sciences Centre, Department of Earth Sciences, University of Coimbra,3030-790 Coimbra, Portugal; [email protected]
7 CNC—Center for Neuroscience and Cell Biology, University of Coimbra and Institute of Physiology,Faculty of Medicine, University of Coimbra, 3030-548 Coimbra, Portugal; [email protected]
* Correspondence: [email protected]; Tel.: +351-964332189
Received: 26 October 2019; Accepted: 15 November 2019; Published: 18 November 2019
Abstract: In the present study, trace elements (TE) levels were evaluated in scalp hair along thecontinuum from healthy subjects (HS) to patients suffering from subjective memory concerns (SMC),and/or mild cognitive impairment (MCI), and those with already installed dementia (DEM) in order to:(i) assess the effects of environmental and lifestyle factors on TE concentrations and (ii) evaluate theanalyzed elements as possible diagnostic biomarkers for the disease. The study involved 79 mainlypermanent residents, >55 years old, from the city of Estarreja (northern Portugal), a former industrialarea. The health status of the participants was assessed by means of a complete socio-demographicquestionnaire and through cognitive screening tests, namely the Mini-Mental State Examination(MMSE). The test scores were categorized and used in the statistical analysis. Hair samples werecollected and analyzed by inductively coupled plasma-mass spectrometry (ICP-MS) ICP-MS forselected TE. Dementia appears to be associated with higher age, the female gender, lower educationlevel, and longer residence time in the study area. In addition, most of the participants diagnosed withdementia frequently consume home-grown foodstuffs, some irrigated with contaminated well water.The calculation of the TE enrichment factors of soil samples collected in kitchen gardens/small farmsin the vicinity of the Estarreja Chemical Complex (ECC) reinforces the degree of Hg soil contaminationin the area, due to anthropogenic sources that can be a source for the population Hg exposure routeamong others. Mercury levels in hair differed significantly between the four individual groups (HS,SMC, MCI, and DEM), increasing from healthy to dementia participants. Improved diagnostic resultscan be obtained using hair TE signatures coupled with MMSE scores. This strategy may prove usefulfor predictive diagnosis in population screening for cognitive impairment.
149

Int. J. Environ. Res. Public Health 2019, 16, 4560
Keywords: exposure; trace elements; cognitive impairment; mercury
1. Introduction
The aging of human populations around the world is leading to an epidemic of Alzheimer’sdisease (AD), with the number of cases estimated to rise to nearly 106 million by 2050 [1]. Human ADis characterized by a progressive decline of cognitive function, with marked loss of memory and othercognitive functions, leading to a gradual loss of functionality and autonomy. It is the most frequent andfearsome form of dementia in the elderly, and its cure and prevention are among the primary challengesof modern medicine. Nowadays, it is accepted that the preclinical stage of AD can begin more than adecade before symptoms are evident, and therefore detection of preclinical stages is a critical factor tofight the disease. Mild cognitive impairment (MCI) is a prodromal stage of AD and affected individualsexperience memory loss and/or other cognitive impairments greater than would be expected basedon their age and level of education, but not enough to allow a diagnosis of dementia. Longitudinalstudies show that MCI patients progress to overt dementia at a rate of 10–15% per year, comparedwith a rate of 1–2% in the control subjects [2]. This explains why MCI is now the focus of predictionstudies and the target of clinical trials of new disease-modifying therapies. Research on significantmemory impairment is very contradictory. On one hand, numerous studies have proven that subjectivememory concerns (SMC) reflect objective cognitive impairment [3–7] and is associated with increasedrisk of MCI and dementia. For instance, a meta-analysis conducted by Mitchell and colleagues [8]shows that 6.6% of older individuals with SMC, but with no objective complaints, will convert toMCI per year, comparatively to 1% in those without SMC, and that individuals in this conditiondouble their risk of dementia. Furthermore, there is clear evidence that SMC are a reliable predictor ofconversion to dementia [9–12]. However, some other studies refute these findings by reporting a lackof value of SMC [13,14] and SMC severity [15] in predicting dementia. Additionally, a longitudinalstudy conducted with healthy elderly showed that SMC are not associated with significant changes incognitive performances over time [16]. Also, a review conducted by Reid and MacLullich [17] reportedinconsistency in the association between SMC and cognitive impairment.
Multiple factors have been reported as contributing to the etiology of sporadic (late-onset) ADincluding aging, genetics, head injury, and exposure to certain chemical compounds. Whilst the geneticcomponent of sporadic AD risk has been increasingly recognized in recent years due to genome-wideassociation studies (GWAS) [18], the presence of the APOEε4 allele being the strongest genetic risk factor,the role of environmental exposures and the mechanisms of their contribution to the pathogenesis ofAD continues to be a subject of discussion. This is partly because of the extended time lapse betweenexposure and onset of the disease. However, while not all environmental contaminants and toxinshave been tested in research studies in terms of their impact on the central nervous system (CNS), therisks of developing AD (and other neurodegenerative diseases, like Parkinson’s disease) in elderlypersons as a result of neurologic impairments caused by environmental toxins, is established [19].Recent studies also support close gene-environment interactions [20].
Systemic human exposure to trace elements (TE) is a common circumstance worldwide, resultingfrom multiple exposure pathways including inhalation of ambient particulate matter, dermal absorptionof trace elements from soil and dust, and ingestion of contaminated soil/dust (through hand-to-mouthmovements or clearance of particulate matter from airways by swallowing), water and foodstuff, suchas agricultural crops, meat and seafood. Toxicity of TE depends upon the absorbed dose, route, andduration of exposure.
Currently, no marker exists as an AD indicator in its early stages, only mainly in its prodromalstage, and the diagnosis of the disease is still based on clinical ground. Biomarkers capable ofidentifying the preclinical stage of AD have the potential to open a therapeutic window in whichneurons would remain responsive to treatment. Furthermore, biomarkers capable of defining the
150

Int. J. Environ. Res. Public Health 2019, 16, 4560
at-risk state may drive novel therapeutic strategies to finally achieve a disease-modifying status ofAD. Elemental profiling is an interesting approach for understanding neurodegenerative processes,considering that compelling evidence shows that element toxic effects might play a crucial role in theonset and progression of AD [21].
The use of hair for biomonitoring purposes offers the possibility of integrating a relatively long-termexposure in a single-specimen analysis and presents important practical aspects: non-invasive samplecollection and easy sample transport and storage [22]. The concentration of trace elements in hairvaries greatly according to the environmental exposure of the subject. On the other hand, hair is aninert tissue and trace elements are slowly incorporated into its structure. Their concentrations do notfluctuate over a short time scale, as in blood, and thus they can be used as a long-term diagnostictool [23]. It has been reported that several characteristics such as age, sex, ethnicity, nutrition, andgeographical location might affect some element concentrations in human hair [24–26]. It has beenshown by clinical research that the levels of specific TE in hair, especially those with higher toxicpotential, may present a strong correlation with specific pathological disorders. It should be notedthat aging is associated with changes in metabolism and several nutrient imbalances [27] and themaintenance of an adequate TE status, in addition to macrominerals and vitamins, is particularlyimportant in the elderly population, for maintenance of the physiological homeostasis and preventionof several age-associated diseases [28,29]. Many studies exist in elderly populations, focused on theirhealth status regarding a specific area of gerontological epidemiology, such as mental diseases [30] andcognitive impairment [31].
The Estarreja Chemical Complex (ECC), located near Aveiro, in the center region of Portugal,has had intense industrial activity since the early 1950s, and high environmental levels of potentiallytoxic elements such as arsenic (As) and mercury (Hg) have been reported at this region [32,33].Despite the significant number of studies focusing on determining the severity and the extensionof the contamination [34–38] only a few have tried to assess potential health effects on the residentpopulation [39–43]. Hence, the area displays interesting characteristics to study the potential effect oflong-term exposures to chemicals in the environment.
In the present study, trace elements levels were evaluated in scalp hair along the continuum fromhealthy subjects (HS) to patients suffering from SMC and/or MCI and those with already installed ADin order to: (i) assess the effects of environmental and lifestyle factors on TE concentrations in the hairof the elderly and (ii) evaluate the analyzed elements as possible diagnostic biomarkers for the disease.
2. Methods
2.1. Participants
Ethical approval for this study was obtained from the National Committee for Data Protection (nº11726/2017). The study involved 79 participants, voluntarily recruited through convenience sampling,who met the criteria: (i) to have resided in the study area at least the last 5 previous years, in orderto ensure minimum exposure time [44] and (ii) be over 55 years of age (age group of interest due tothe likelihood of this population reporting subjective cognitive complaints and/or being involved inpathological aging processes, such as the dementia spectrum).
Additionally, the following exclusion criteria were considered: (a) absence of Portuguese languageskills required for cognitive testing; (b) a current or past history of neurological disease (other than SCM,MCI or dementia), traumatic brain injury, or psychiatric disorder, including depression—depression atscreening was assessed with the Geriatric Depression Scale (GDS), and participants with a GDS score≥21 [45–47] were considered depressed and excluded from the study; (c) previous or current alcoholor other substance abuse; (d) severe visual or auditory impairment that would negatively affect theability to satisfactorily complete tests or understand test instructions; or (V) current or prior use ofantipsychotic medication.
The same expert neuropsychologist administered a battery of tests to all participants in a fixedorder, which included the following instruments:
151

Int. J. Environ. Res. Public Health 2019, 16, 4560
(1) Sociodemographic and clinical questionnaire: During a personal interview, demographic andclinical data were collected through an extensive sociodemographic questionnaire and aninventory of past habits, current clinical health status, and medical history. The following datawere collected: age, marital status, weight, height, nationality, education level, the period of timeworking in agriculture, pesticide application methods and time of exposure, use of personalprotective equipment, home-grown foodstuff consumption, irrigation water source, and drinkingwater source. Additionally, a full medical record was obtained during this interview, includinginformation on 29 symptoms typically associated with toxic elements exposure or essentialelements deficiency [48];
(2) The Mini-Mental State Examination (MMSE) [49–51] is a brief screening test for assessment of theglobal cognitive status. The MMSE score ranges from 0–30, with higher scores indicating bettercognitive performance. In this study we considered the following categories: (i) 0–25 points:dementia; (ii) 26–28 points: mild cognitive impairment (MCI); and (iii) 29–30 points: normalcognitive functioning [51]. The MMSE is the most broadly used brief cognitive screeninginstrument in clinical, epidemiological, and research contexts. Despite the existence of otherneuropsychological instruments with greater sensitivity in detecting cognitive decline at earlierstages (e.g., probably due to the lack of MMSE in including executive functioning assessmentand the usage of rather simple tasks to assess short-term memory, working memory, attention,and concentration, language and visuospatial skills), the MMSE has been largely validated fordifferent populations, thus representing a common reference in the communication betweenhealth professionals, including psychologists, neurologists, and psychiatrists [51];
(3) The Geriatric Depression Scale (GDS) [45–47] is a brief instrument to assess depressivesymptoms in older adults, composed of 30 dichotomous questions that evaluate emotionaland behavioral symptoms. The maximum score is 30 points, with higher scores indicating greaterseverity of depressive symptomatology. In this study, we considered the following categories:(i) 0–10 points: absence of depressive symptoms; (ii) 11–20 points: mild depressive symptoms;and (iii) 21–30 points: moderate to severe depressive symptoms.
2.2. Study Groups
The study groups were generated according to their education levels and their subjective memorycomplaints. The four groups were selected based on MMSE and memory scale complaints score rangesfrom 0–30. According to Kaup et al. [52] and O’Bryant et al. [53], the following categories were used inthe statistical analysis described below: a) to lower education level [53], 0–23: dementia (DEM), 24–28:mild cognitive impairment (MCI), 29–30 (and reaching 4 on the scale of complaints): subjective memorycomplaints (SMC), and 29–30: healthy status (HS); b) to higher education level, 0–26: dementia, 27–28:mild cognitive impairment (MCI), 29–30 (and reaching 4 on the scale of complaints): SMC, 29–30: HS.
2.3. Hair Samples and Analysis
Human biomonitoring, defined as “the method for assessing human exposure to chemicals ortheir effects by measuring these chemicals, their metabolites or reaction products in human specimens”,involves the measurement of biomarkers in different body fluids (e.g., blood, urine, and breast milk) ortissues (e.g., nails, and hair) [22].
Hair samples (ranging from 100 to 300 mg) were collected near the scalp from 79 inhabitants ofthe city of Estarreja. Only hair samples presenting their natural color and from individuals residingpermanently in the study area were considered for analysis.
Following a procedure reported elsewhere [54], hair samples were duly washed to completelyremove exogenous contamination without significantly altering the endogenous trace element contentof the sample. After washing, samples were dried in a laboratory drying oven (Raypa, Spain) at 95 Cfor 40 h (the time required to achieve a constant weight). Dried samples (~0.1 mg) were mineralizedthrough a microwave-assisted acid digestion procedure with 1 ml of concentrated HNO3 (>65% m/m;
152

Int. J. Environ. Res. Public Health 2019, 16, 4560
TraceSELECT®, Fluka, France) and 0.5 ml of H2O2 (≥30% v/v; TraceSELECT®, Fluka, Seelze, Germany)in a Milestone (Sorisole, Italy) MLS 1200 Mega high performance microwave digestion unit, equippedwith an HPR 1000/10 rotor. The flowing microwave oven program (W/min) was used: 250/1, 0/2, 250/5,400/5, and 600/5. After cooling, sample solutions were made up to 8.5 mL with ultrapure water andstored in closed propylene tubes at 4 C until analysis.
Ultrapure water (at 25 C the resistivity value is 18.2 MΩ cm) produced in an Aarium®pro(Sartorius, Gottingen, Germany) water purification system was used throughout the work. All labware was duly decontaminated by 24 h immersion in a 10% HNO3 bath and thoroughly rinsing withultrapure water. A sample blank was prepared in each digestion run (10 samples). Average blanklevels were subtracted from the samples values. For analytical quality control, the certified referencematerial (CRM) ERM-DB001—human hair was used, using the same acid digested procedure.
Trace element concentrations were determined through inductively coupled plasma-massspectrometry (ICP-MS) using a Thermo Fisher Scientific (Waltham, MA, USA) iCAP™ Q instrument,equipped with standard components and accessories: a MicroMist™ nebulizer (Glass Expansion, PortMelbourne, Australia), a Peltier-cooled baffled cyclonic spray chamber, a standard quartz torch, and atwo-cone interface design (nickel sample and skimmer cones). High-purity argon (99.9997%; Gasin,Leça da Palmeira, Portugal) was used as the nebulizer and plasma gas. Before each analytical series,the ICP-MS instrument was tuned for maximum sensitivity and signal stability while keeping theformation of oxides and double-charged ions to a minimum. Commercially available multi-elementstandard solutions (Plasma CAL, SCP Science, Baie D’Urfé, Canada) were used to prepare calibrationstandards. The internal standard solution was prepared from an Isostandards Material (Madrid, Spain)commercial solution.
The limits of detection (LoD) were calculated as the concentration corresponding to three timesthe standard deviation of 10 replicate measurements of the blank solution (2% v/v HNO3).
2.4. Soil Samples and Analysis
Composite top layer (0–15 cm) soil samples were randomly collected from 26 kitchen gardensand/or small farms, in an area of approximately 20 km2 in the vicinity of the Estarreja ChemicalComplex. The sample sites were selected in order to provide a representative area of the agriculturalsoils throughout the community that surround this industrial area. All soil samples were air-dried andsieved at 2 mm. The analysis of soils was performed by ICP-MS in ACME certified laboratory afterextraction with aqua regia, and according to the laboratory standards methods and quality assuranceand quality control and protocols. The accuracy and precision were checked through the analysisof certified reference materials, blank spikes and duplicates (analytical splits) of randomly selectedsamples. The analytical precision was better than 10%.
Enrichment Factor
The environmental risk was evaluated calculating the enrichment factor (EFi), proposed byBuat-Menard and Chesselet [55], and calculated as follows:
EFi = (CM/Cnor) sample/(CM/Cnor) background (1)
The enrichment factor is calculated for each element (i) and indicates the enrichment of themetal (CM: concentration of each metal) in a sample, relative to the concentration of that metal inthe chosen geochemical background, after normalization (Cnor) to a conservative geogenic element,which is usually Al, Fe, Zr or Sc. The normalization points to differences caused by the samplingand by the variability of behaviors of the chemical elements in the surface geochemical processes [55].The normalizing element used was Al, also used by Islam et al. [56–58]. Enrichment factors above1.5 indicates anthropogenic influence in soil composition and it can be minor (2 < EF), moderate(2 < EF < 5), significant (5 < EF < 20), very strong (20 < EF < 40), and extreme (EF > 40) [59].
153

Int. J. Environ. Res. Public Health 2019, 16, 4560
2.5. Statistical Techniques
Variables were examined for outliers and normal distribution by means of histograms, box plots,normal quantile-quantile plots, and the Shapiro–Wilk test. When normal distribution could not beaccepted, variable transformations (square, square root, and logarithmic) were attempted. The base-10logarithm of Al, Mn, Fe, and Pb levels, and the square root of Hg, Cu, and Zn concentrations helped toimprove the distribution shape. Differences between groups were tested using the Kruskal–Wallis Htest with post-hoc tests, with the results interpreted based on rank differences. A probability ≤ 0.05was assumed as significant in testing the null hypothesis of no differences across the considered clinicalconditions. The one-way analysis of covariance was used to determine whether there were significantdifferences in element hair contents between the study groups, while “statistically controlling” theeffects of the confounding variables (covariates) that were believed to affect the results. The assumptionof equality of variance was assessed by means of Levene’s test, which indicated heterogeneity ofvariances for hair Cu levels. Finally, post hoc pairwise multiple comparisons were performed usingBonferroni correction in order to detect significant differences between two specific groups.
3. Results and Discussion
3.1. The Study Population Cognitive Status
Clinical and demographic characteristics of the individuals recruited, divided by the four studygroups, are reported in Table 1. The Kruskal–Wallis H test showed statistically significant differencesfor age (χ2(3) = 11.626, p = 0.009) between SMC and Dementia (DEM) subjects (p = 0.013), for the levelof education (χ2(3) = 26.988, p < 0.0001) between HS and DEM (p = 0.001), as well as between SMC andDEM subjects (p < 0.001), and for the amount of time living in the city (χ2(3) = 12.662, p = 0.005) betweenHS and DEM subjects (p = 0.012). Table 1 shows that in this study, dementia appears to be associatedwith higher age, female gender, lower education level, and longer residence time in the study area, i.e.,in the surrounding industrial zone. Several authors [51,60–64] have shown that sociodemographicvariables have an important effect on cognitive-screening test performance, predominantly age andeducation level. Old age has been found to significantly increase the probability of obtaining lowerscores, whereas the worst performance has been found among those with lower education levels andceiling effects have been observed among highly educated individuals. The magnitude of the effect ofeducation level is so strong that education is invariably considered a criterion for the establishment ofnormative data for the MMSE [65–67]. Some studies further suggest that high diet quality in terms ofthe consumption of vitamins, minerals, and trace elements can be expected when education levels arehigh [68,69]. However, the relationship between education and diet quality seems to be significant fordeficient intake only. In our study, none of the participants were reported to have TE deficiency.
Previous studies regarding the effect of gender have proven to be more controversial; only a few haveshown a significant association between this variable and cognitive-screening test performance [70–72].However, a recent study report that female APOE ε4 carriers have faster rates of memory declinethan their male counterparts among MCI individuals [73] corroborating the observations of Iwata andcolleagues [74].
In Table 1 it is also noticeable that participants whose professional activity is associated withagriculture and fisheries seem the most vulnerable to dementia. In addition, most of the participantsdiagnosed with dementia frequently consumed local home-grown foodstuffs. Cabral Pinto et al. [41,43,44]reported a link between cognitive status and both agricultural activity and the consumption of cropscultivated in soils irrigated with groundwater from wells in the ECC surroundings. Regarding medicalhistory, there was no clear relation with the cognitive levels, although it was found that cardiovasculardiseases were relatively common in the participants with lower cognitive level, which is in accordancewith previous observations of [75].
154

Int. J. Environ. Res. Public Health 2019, 16, 4560
Table 1. Demographic, lifestyle habits, and clinical characteristics of the study groups. Healthy subjects(HS), patients suffering from subjective memory concerns (SMC) and/or mild cognitive impairment(MCI), and those with already installed dementia (DEM).
HS SMC MCI DEM
n = 10 n = 14 n = 16 n = 39
Age (mean ± SD) 74.0 ± 9.6 73.3 ± 7.2 78.4 ± 7.8 81.7 ± 9.0
Gender (n; %) Male 2; 20% 2; 14% 6; 37% 3; 8%Female 8; 80% 12; 86% 10; 63% 36; 92%
Level of Education (mean ± SD) 7.40 ± 5.10 ** 4.43 ± 2.34 ** 2.88 ± 1.54 1.91 ± 3.36 **
Time of residence (mean ± SD) 53.20 ± 17.76 * 58.36 ± 27.80 58.69 ± 26.64 70.82 ± 26.08 *
Profession Housewife 2; 20% 2; 14% 4; 25% 8; 21%Agriculture/Fishery 2; 20% 3; 21 % 4; 25% 16; 41%
Industry/Construction - 5; 36% 4; 25% 5; 13%Commerce/Services 6; 60% 4; 29 % 4; 25% 10; 26%
Medical History (n, %)
Diabetes - - 2; 13% 6; 15%Dyslipidemia 1; 10% 3; 21% - 1; 3%
Cardiovascular 3; 30% 5; 36% 8; 50% 9; 25%Respiratory 3; 30% 1; 7% 1; 6% 2; 5%
Other 2; 20% 3; 21% 2; 13% 5; 13%
Lifestyle factors (n; %)
Supplements - 5; 36% 3; 19% 7; 18%Homegrown food 7; 70% 11; 79% 13; 81% 26; 67%
Drinking Water Bottled 6; 60% 11; 79% 12; 75% 22; 56%Bottled & tap water 2; 20% 1; 7% - 1; 3%
Tap water 2; 20% 1; 7% 4; 25% 11; 28%Well or borehole - 1; 7% - -
* (p < 0.05); ** (p < 0.01); age, level of education and time of residence are expressed in years; SD: standard deviation.
3.2. TE Levels in Hair and Population Cognitive Status Relations
Biomonitoring is used as a means for assessing the impact of environmental chemical elements onliving organisms [76]. Regardless of whether they are essential, nonessential, or highly toxic, humanhair acts as an excretory tissue for all elements, which become incorporated into the hair matrix duringits growth. In general, a target population’s health and nutrition status regarding TE can be assessedby measuring the levels in hair samples [22], i.e., the determination of TE in hair is a way of indirectlytesting for the body’s overload or deficiency.
In this study, seven TE (Al, Mn, Fe, Cu, Zn, Hg, and Pb) were measured in the hair of Estarrejaresidents with or at risk of AD. Among them, two TE [Zn (χ2 (3) = 11.723, p = 0.008) and Hg (χ2 (3)= 17.772, p < 0.001)] showed statistically significant differences in their hair concentrations betweenthe study groups (Table 2). Pairwise comparisons showed significant differences between SMC vs.DEM subjects for Zn and between HS vs. DEM subjects for Hg. Table 2 also presents reference intervalvalues (P5–P95) for toxic TE (Al, Hg, and Pb) estimated in accordance with International Union of Pureand Applied Chemistry recommendations [77] and reference range values for essential TE (Cu, Fe, Mn,and Zn), reported from a review of Mikulewicz et al. [78]. In general, the mean levels of the analyzedTE found in this study were well within the range reported for non-exposed people, in all the groups(four different cognitive status), except for Hg (Table 2). The mean level of Pb in hair was above thereference range in the DEM group; the mean level of Mn in hair was above the reference range in theMCI and DEM groups, and the mean levels of Zn in the DEM group were also out of reference valuesfor many participants, but there was no statistically significant difference (p > 0.05). The mean level ofHg in hair was above the reference range in the SMS, MCI, and DEM groups. The TE body burden inthe study groups suggests a potential long-term environmental exposure, which is evidenced by thesignificantly higher (p < 0.05) hair Hg content compared to non-exposed people.
155

Int. J. Environ. Res. Public Health 2019, 16, 4560
Table 2. Trace elements levels (µg/g) in hair samples of the study participants, reported as mean ± standard deviation (SD) and (range) according to the cognitivestatus (HS = healthy subjects; SMC = subjective memory complaints; MCI =mild cognitive impairment; DEM = Dementia). Also present are hair reference valueranges for non-exposed people reported from Skalny et al. [77] and Mikulewicz et al. [78].
Element HS SMC MCI DEM Kruskal-Wallis Pairwise Comparisons (a) (p-Value)Hair Reference
Values *
µg/g n = 10 n = 14 n = 16 n = 39 H(3) p-ValueDEM vs.
HSDEM vs.
SMCDEM vs.
MCIHS vs.SMC
HS vs.MCI
SMC vs.MCI
Al 6.67 ± 10.69 4.18 ± 3.36 3.80 ± 3.95 6.26 ± 8.76 1.222 0.748 N/A N/A N/A N/A N/A N/A 2.91–11.63(0.23–35.96) (0.16–11.70) (0.78–14.02) (0.51–49.08)
Mn 0.19 ± 0.17 0.18 ± 0.24 0.85±1.38 1.39 ± 2.83 7.089 0.069 N/A N/A N/A N/A N/A N/A 0.002–0.91(0.04–0.54) (0.05–0.87) (0.03–5.46) (0.03–16.10)
Fe 16.37 ± 12.24 10.79 ± 7.75 12.67 ± 9.65 18.47 ± 40.24 2.266 0.519 N/A N/A N/A N/A N/A N/A 3.66–36.8(0.59–43.77) (0.59–27.78) (3.60–40.47) (3.41–259.26)
Cu 10.57 ± 10.24 10.77 ± 5.82 9.85 ± 2.54 17.99 ± 36.71 1.581 0.664 N/A N/A N/A N/A N/A N/A 7.2–82.7(1.62–37.10) (0.56–22.20) (3.83–13.39) (2.66–237.40)
Zn 140.29 ± 65.66 118.17 ± 58.33 151.69 ± 28.64 258.10 ± 519.33 11.723 0.008 ** n.s. 0.006 ** n.s. n.s. n.s. n.s. 30–327(10.70–234.86) (3.99–229.00) (103.00–200.38) (63.25–3396.26)
Hg 0.88 ± 0.92 1.48 ± 1.40 1.63 ± 1.18 4.43 ± 13.86 17.772 <0.001 ** 0.001** n.s. n.s. n.s. n.s. n.s. 0.17–1.19(0.12–3.24) (0.11–5.38) (0.63–5.13) (0.06–88.46)
Pb 0.29 ± 0.39 0.46 ± 0.56 0.33 ± 0.42 1.02 ± 2.11 8.839 0.077 N/A N/A N/A N/A N/A N/A 0.19–1.39(0.048–1.33) (0.001–2.20) (0.03–1.58) (0.03–12.75)
a Post hoc analysis using Bonferroni method; N/A: not applicable; n.s.: not significant; * (p < 0.05); ** (p < 0.01).
156

Int. J. Environ. Res. Public Health 2019, 16, 4560
It has been demonstrated that several factors have the potential to influence TE concentrations inhuman hair (e.g., Hartmann and Kist [23], and references therein). Our study groups presentedsignificant differences in age and education level (Table 1), suggesting that they are potentialconfounding variables. The effect of factors such as sex, age, education level, etc., on hairTE concentration has been shown by many authors (e.g., [26,79–83]). Therefore, an analysis ofcovariance was performed considering several variables such as age, gender, level of education, use ofminerals-containing food supplements, time period of residence in Estarreja, home-grown foodstuffconsumption, and type of drinking water as covariates. Three outliers were excluded from thiscovariance analysis, which is highly influenced by the presence of extreme values in the dataset. Thehomogeneity of regression slopes was tested and no interaction existed between the covariates andthe independent variable. However, the hair Cu levels failed Levene’s test, and it was not possible toassume the equality of variance. These results could indicate that the significant differences in hair Znlevels between SMC and DEM subjects could result from one or more of the confounding factors, suchas the time period of residence or the use/exposure of water from wells containing high levels of Zn,as reported in Cabral Pinto et al. [41]. Nevertheless, available data on the exposure of the Estarrejapopulation through soil/dust, and home-grown foodstuffs consumption [44] did not support anexcessive Zn exposure. Zinc is an essential element involved in many metabolic functions and is crucialfor a healthy body status [84]; however, excess Zn can be harmful and cause toxicity [85]. Excessiveingestion of Zn can suppress Cu and Fe gastrointestinal absorption [84,86]. Toxicity associated withexcessive exposure to Zn is not well known. Situations in which toxicity has been observed includeinhalation of zinc fumes, deliberate ingestion, exposure to contaminated food and/or drinking waterand epidemiological causes [85,87]. Occupational and environmental (chronic) exposure to specificlevels of Zn has led it to be suggested as a possible cause of cognitive dysfunction and dementia ([88]and references therein).
As previous reported, only Hg differed significantly between the four groups. Pairwise multiplecomparisons showed that Hg was significantly higher in DEM compared to HS (Table 3). While noneof the covariates significantly predicted (p > 0.050) the hair Hg content, MMSE was a good predictorof the dependent variables (p = 0.005). Hence, the results indicate that none of the tested covariatesseems to influence the concentration of Hg in the hair of the elderly. This element has been identifiedas one of the most toxic nonradioactive materials known to man [89]. Although it is a naturallyoccurring element, anthropogenic Hg is now a major worldwide concern and is an internationalpriority pollutant as it is persistent, bioaccumulative, and toxic even at very low levels to humans andaquatic/terrestrial ecosystems. Sensory disturbances (hypoesthesia), lack of coordination of voluntarymovements (ataxia), impairment of hearing, concentric constriction of the visual field, and slurredspeech (dysarthria) are some of the signs of Hg poisoning [90]. It was recently shown that circulatorylevels of Hg are significantly higher in AD patients [91] and it is known that Hg favors misfoldingand aggregation of amyloid beta (Aβ) protein, a neurotoxic protein present in AD patients brain [92],which supports the idea that Hg is a risk factor for this neurodegenerative disease.
The risk of mercury toxicity depends very much on the form of Hg (elemental, organic, andinorganic) and route of exposure. Due to the health risks of excessive Hg exposure, the FAO/WHOJoint Expert Committee on Food Additives established a “Provisional Tolerable Weekly Intake” (PTWI)of 4 µg kg−1 body weight per week for inorganic Hg and 1.6 µg kg−1 bw per week for MeHg [93,94].The United States Environmental Protection Agency [76] presented a lower value for the intake ofMeHg, setting a reference dose (RfD) of 0.1 µg kg−1 bw per day [95]. The PTWI and RfD correspondto a hair Hg concentration of 2.2 and 1.0 µg g−1, respectively [93–95]. WHO, through the analysis ofneurotoxicological data, considered the Hg concentration of 50 µg g−1 in the human hair as the “noobserved adverse effect level” value for MeHg [95]. During hair growth (~1 cm per month), circulatingHg passes from the bloodstream to the hair follicle and is incorporated into the hair shaft, where itbecomes stable and is carried along its length as the hair grows, providing an accumulation patternand the history of exposure [96–99]. Mercury concentration in scalp hair is used to assess blood Hg
157

Int. J. Environ. Res. Public Health 2019, 16, 4560
concentrations during hair growth [76], and the methylmercury (MeHg) exposure level can also beestimated from hair Hg levels, since approximately 80% of hair Hg is MeHg [100].
Table 3. Results of the analysis of covariance (ANCOVA) performed on the hair trace elements data.
Element ANCOVA a Pairwise Comparisons b (p-Value)
F(3, 68) p-Value partial η2 DEMvsHS DEMvsSMC DEMvsMCI HSvsSMC HSvsMCI SMCvsMCI
Al 0.597 0.620 0.03 N/A N/A N/A N/A N/A N/AMn 1.13 0.344 0.05 N/A N/A N/A N/A N/A N/AFe 0.982 0.407 0.05 N/A N/A N/A N/A N/A N/ACu 0.455 0.715 0.22 N/A N/A N/A N/A N/A N/AZn 2.477 0.07 0.11 N/A N/A N/A N/A N/A N/AHg 4.411 0.007 * 0.18 0.005 * n.s. n.s. n.s. n.s. n.s.Pb 2.757 0.500 0.02 N/A N/A N/A N/A N/A N/A
a Covariates: age, education level, mineral-containing food supplements use, residence time in the study area,home-grown foodstuff consumption and type of drinking water. b Post hoc analysis using Bonferroni method; N/A:not applicable; n.s.: not significant; * (p < 0.01).
3.3. Trace Elements Hair Versus Risk of AD
TE are present at very low concentrations in tissues, and even small variations in theseconcentrations could be harmful or a sign of disease [23]. The levels of a biomarker may change overtime after the onset of AD, namely from the early to the middle and the advanced stages. TE profiling isan interesting approach for understanding neurodegenerative processes, considering that compellingevidence shows that TE toxic effects might play a crucial role in the onset and progression of AD. Dueto its more stable nature, the analysis of these elements in human hair is potentially more reliable thanin blood [23]. Figure 1 shows a trend of an increase of Hg hair mean values between the four groups,increasing from HS to SMS, SMS to MCI (less evident), and from MCI to DEM groups. However, forthe other toxic TE (Al and Pb) this signature is not followed. Lead in hair, for example shows highermean concentrations in SMS and DEM groups. On the other hand, aluminum seems to decrease withthe increase of cognitive decline groups.
Essential TE in hair (Mn, Fe, Cu, and Zn) showed a different behavior between the four cognitivestatuses. Manganese and Zn in hair tended to increase from the HS to DEM group (Figure 1). CabralPinto et al. [42] found the highest contents of Zn and Mn in fingernails associated with the groupof dements. Many studies have investigated the association between TE levels in hair and the riskof AD, but the results have also been ambiguous. Koseoglu et al. [101] found that AD patientspresented significantly different concentrations of Al, Pb, Fe, Mn, Hg, and Cu in hair compared tocontrol individuals. Vance et al. [102] compared the results of the hair analysis of 63 AD patients and117 controls and also found that Zn levels were higher in AD patients and that no significant differenceexisted for the Fe concentrations, similar to our results. Koc et al. [101], in a study involving 45 patientswith AD and 33 controls, found that AD patients had significantly higher hair Cu and Mn levels, butno significant differences for Fe, in accordance with our results. In contrast to our results, these authorsfound significantly lower Zn levels in AD patients compared to control participants; however theyfound no significant difference between the hair Zn levels of the two groups. Koc and co-authors [103]also found that some TE levels were changed in patients with AD. The small number of participants isa limitation of the study, which might not be enough to reach significant values in some cases.
The discovery of biomarkers that could confer high confidence to a presymptomatic AD diagnosiswould be a great step forward to study the etiology of the disease, to identify the risk factors and toultimately discover effective treatments [23]. According to the previous authors, studies such as theone presented here have the interesting potential to find reliable biomarkers in noninvasive samples forAD and MCI. However, many more studies must be conducted to allow the extraction of much moreaccurate information that may eventually lead to a panel of analyses that produce high-confidence ADdiagnoses, especially in the early stages. The findings of our results suggest that Hg could contributeto generating a distinctive signature during the progression of dementia, and monitoring them in theelderly might help to detect preclinical stages of AD.
158

Int. J. Environ. Res. Public Health 2019, 16, 4560
0.0
0.5
1.0
1.5
2.0
2.5
3.0
3.5
4.0
0 1 2 3 4 5
ug
/g
Manganese
HS SMC MCI DEM Average
0
1
2
3
4
5
6
0 1 2 3 4 5
ug
/g
Mercury
HS SMC MCI DEM Average
0
5
10
15
20
25
30
35
40
45
50
0 1 2 3 4 5
ug
/g
Iron
HS SMC MCI DEM Average
0.0
0.5
1.0
1.5
2.0
2.5
3.0
3.5
0 1 2 3 4 5
ug
/g
Lead
HS SMC MCI DEM Average
0
5
10
15
20
25
30
35
40
0 1 2 3 4
ug
/g
Copper
HS SMC MCI DEM Average
0.0
5.0
10.0
15.0
20.0
25.0
30.0
35.0
40.0
0 1 2 3 4 5
ug
/g
Aluminium
HS SMC MCI DEM Average
0
50
100
150
200
250
300
350
0 1 2 3 4 5
ug
/g
Zinc
HS SMC MCI DEM Average
Figure 1. Trace elements hair levels in the different study groups.
Plagia et al. [104] also found a variable behavior in the TE serum of subjects with or at risk ofAD relatively to a control group. Paglia et al. [104] found a decreased signature for essential TE (Zn,Mn, Fe) in the serum of subjects with or at risk of AD relative to a control group. The results of ameta-analysis of Li et al. [105] provided rigorous statistical support for the association of the serumlevels of TE and the risk of AD, suggesting a positive relationship between the serum Cu levels and ADrisk, and a negative relationship between the serum Zn levels and AD risk. The differences betweenour observations and those from other authors may be simply related to the nature of the biologicalspecimen: hair vs. serum.
3.4. Metal Population Environmental Exposure
Table 4 summarizes (a) the quality of the soil samples collected in the ECC surroundings, used bythe population for agricultural proposes; (b) the soil background values (BG), presented by Inácio [106],calculated by the average of Cambisoil and Podzol toplayers representative soils of the study area;
159

Int. J. Environ. Res. Public Health 2019, 16, 4560
(c) and the Canadian Environmental Quality Guidelines for agricultural use [107]. Manganese, iron,and aluminum have no international guidelines for any use, but their mean values in the sampledagricultural soils are impoverished relative to the mean local background values. The content of Cu,Hg, Pb, and Zn of the agricultural soil were higher than the background values, particularly Hg, Cu,and Pb (100%, 46%, and 42% of the samples). In general, the mean values of metals in soils are belowCanadian limits, except for the Hg mean value which exceeded the Canadian guideline for agriculturaluses. However, in some soil sampling locations, maximum Cu concentrations were also well above theCanadian guidelines for agricultural proposes.
Table 4. Descriptive statistics for metal contents (mg kg-1) in Estarreja Chemical Complex (ECC)agricultural soils, soil top layer local background (BG) values from Inácio [104] and (CEQG) CanadianEnvironmental Quality Guidelines (mg kg− 1) for agricultural land use [107].
Al Cu Hg Mn Fe Pb Zn
Minimum 0.31 3 0.03 36 0.26 6 16Mean 0.60 33 1.5 120 0.66 33 84
Median 0.56 23 0.15 110 0.62 23 67Maximum 1.15 103 14 255 1.15 109 199
SD 0.21 27 4 56 0.2 23 44Cambisoil 2.14 2 0.05 251 2.39 20 55
Podzol 0.13 12 0.05 154 0.17 6 4BG 1.14 7 0.05 203 1.28 13 30
CEQG NA 62 0.16 NA NA 45 290% > BG 0 96 100 12 0 84 96
% > CEQG NA 15 35 NA NA 23 0
Note: In bold are the trace elements (TE) values relatively higher than the respective guidelines; SD:standard deviation.
As previous reported, the enrichment factor (EF) for studied metals [55] has been employed forcalculating differences between the metals originating from human activities and those from naturalsources and it can also be used to assess and explain the contamination of metals in soils [108]. Toaccess the degree of soil contamination through this factor, the local background values were used asit is easier to isolate anthropogenic factors from the geogenic ones, because when using generalizedvalues, spurious enrichment due to natural local concentrations of elements may appear [109–112].
The calculated EF values are presented in Figure 2. Considering the average EF value for eachelement, the enrichment decreases in the order: Hg > Cu > Zn > Pb >Mn > Fe = Al. The observed EFvalues indicate that 26% of the sampled agricultural soils are very strong and extremely contaminatedin Hg and 65% of the samples reach significant contamination; 58%, 42%, and 27% of the sampledagricultural soils reach significant contaminant in Cu, Zn, and Pb, respectively. The soil enrichmenton these elements is mainly due to the former industrial activity and agriculture practices that weregreatly lowering soil quality. The degradation of soil quality by metals/metalloids pollution causesenvironmental risks, leads to groundwater pollution, is harmful for human health and lowers humanlife quality.
Biomonitoring and cognitive status relations of residents’ hair in the ECC surrounding areastudied in this work highlight that Hg has features which distinguish it from remaining studiedchemical elements and could be the result of long-term environmental exposure. The causes of totalresident exposure to Hg may be due to the use of contaminated water for cooking and showering,inhalation, ingestion, and dermal contact of soil/dust, consumption of Hg-contaminated home-grownfoodstuffs, and even fish.
The assessment of health risks for ECC surrounding residents done by Cabral Pinto et al. [44]showed that the elements of greatest concern were As and Hg, regarding both carcinogenic andnon-carcinogenic risk. Reis [112] detected that total Hg concentrations in well water samples rangedbetween 26 and 846 ng L−1, and all samples presented concentrations below the maximum level
160

Int. J. Environ. Res. Public Health 2019, 16, 4560
allowable for drinking water as defined in Portuguese law (1.0 µg L−1). Even at low concentrations,water from these wells that was used for irrigation may be a problem due to the Hg bioaccumulationand biomagnification capacity associated with high toxicity. The highest concentration was detectednear the S. Filipe effluent (10 m away). However, Cabral Pinto et al. [43] reported a mean/max total Hgconcentration of 23.6/659 µg L−1 (in 2006), 60/473 µg L−1 (in 2010) and 1.2/4 µg L−1 in groundwater(in 2013). In this sampling campaign, these Hg levels exceeded both the limit for Portuguese drinkingwater and the groundwater intervention value of the Dutch legislation [113] for soil remediation(0.3 µg L−1). When this groundwater was considered for ingestion and dermal contact exposure, Hgconcentrations such as those reported for some locations may constitute a non-cancer health risk.
According to Cabral Pinto et al. [44], fresh cabbage leaves (Brassica Oleracea L.), one of thehome-grown foodstuffs consumed by the residents, yielded a total Hg concentration of 0.012 mg/kgin 4% of the studied samples, which is slightly above the limit of 0.01 mg/kg for fresh vegetableconsumption, proposed in 2005 by the Ministry of Health of the People’s Republic of China [114].Reis [112] also observed a Hg concentration of 0.01 to 0.42 mg/kg in different fish captured in the Ria deAveiro (site of effluent discharges for many years, among others, from the Estarreja chlor-soda industrialplant). These Hg concentrations did not exceed the limits defined in Commission Regulation (EC) No.466/2001 of 8 March (0.5 mg kg –1 fresh weight) or official journal of European Communities [115]recommendation (1.0 mg kg−1).
of residents’ hair in the ECC surrounding
−
Portuguese law (1.0 μg L−
concentration of 23.6/659 μg L− (in 2006), 60/473 μg L− (in 2010) and 1.2/4 μg L−
−
People’s
Figure 2. Enrichment factors for the studied elements in sampled agricultural soils fromECC surroundings.
4. Conclusions
The inter-disciplinary approach applied in this study was successful in identifying links betweendifferent datasets. The following conclusions can be drawn:
- Participants whose professional activity was associated with agriculture and fisheries were shownto be the most vulnerable to dementia.
161

Int. J. Environ. Res. Public Health 2019, 16, 4560
- Participants diagnosed with dementia frequently consume home-grown foodstuffs, some of themprobably irrigated with contaminated well water.
- Biomonitoring and the analysis of the cognitive status of the residents surrounding ECC suggestthat Hg levels in hair differed significantly between the four cognitive groups (healthy, subjectivememory complaint, mild cognitive impairment, and dementia), increasing from healthy todementia participants.
- Mercury mean levels in soil samples were above Canadian guidelines for soil for agriculturaluses and the enrichment factor calculation values highlighted that 26% of the studied soilsreached the “extremely contaminated” class for Hg, with 65% of the soils reaching the “significantcontamination” class.
- Improved diagnostic results can be obtained using hair TE signatures coupled with MMSEscores. This strategy may prove useful for predictive diagnosis in populations screening ofcognitive impairment.
The discovery of biomarkers that could confer high confidence to presymptomatic AD diagnosiswould be a great step forward to study the etiology of the disease, to identify the risk factors, and toultimately discover effective treatments. Supplementary studies must be conducted to achieve anadequate panel of analyses capable of providing high-confidence AD diagnoses, especially in the earlystages. Our research suggest that Hg could contribute to generate a distinctive signature during theprogression of dementia, and the monitoring of this in the elderly might help to detect preclinicalstages of AD.
Author Contributions: Conceptualization, M.C.P.; Data curation, P.M.R. and M.I.; Formal analysis, P.M.R., A.A.,E.P. and P.D.; Funding acquisition, M.C.P.; Investigation, M.C.P., B.G., S.F. and P.A.D.; Methodology, M.C.P., P.M.R.,B.G., S.F., M.R.S., P.A.D. and L.D.; Project administration, M.C.P.; Writing—original draft, M.C.P.; Writing – review& editing, M.C.P., O.N., A.A., M.R.S., E.F.d.S. and P.I.M.
Funding: FCT—Fundação para a Ciência e Tecnologia and Centre National de la Recherche Scientifique (CNRS).
Acknowledgments: Funding for this research was provided by the Projects SFRH/BPD/71030/2010, ProjectUID/GEO/04035/2019 (GeoBioTec Research Centre) financed by FCT – Fundação para a Ciência e Tecnologia andby the Labex DRIIHM, Réseau des Observatoires Hommes-Millieux–Centre National de la Recherche Scientifique(ROHM–CNRS) and OHMI-Estarreja. We thank also the participants for taking part in this research and the localprivate institutions of social solidarity for their collaboration (Santa Casa Misericórdia de Estarreja, AssociaçãoHumanitária de Salreu, Centro Paroquial Social São Tomé de Canelas, Centro Paroquial Social Avanca, FundaçãoCónego Filipe Figueiredo Beduído and Centro Paroquial de Pardilhó). The manuscript benefited from careful andconstructive reviews by three anonymous reviewers.
Conflicts of Interest: The authors declare no conflicts of interest.
References
1. Brookmeyer, R.; Johnson, E.; Ziegler-Graham, K.; Arrighi, H.M. Forecasting the global burden of Alzheimer’sdisease. Alzheimers Dement. 2007, 3, 186–191. [CrossRef] [PubMed]
2. Petersen, R.C.; Smith, G.E.; Waring, S.C.; Ivnik, R.J.; Tangalos, E.G.; Kokmen, E. Mild cognitive impairment:Clinical characterization and outcome. Arch. Neurol. 1999, 56, 303–308. [CrossRef] [PubMed]
3. Zandi, T. Relationship between subjective memory complaints, objective memory performance, anddepression among older adults. Am. J. Alzheimers Dis. 2004, 19, 353–360. [CrossRef] [PubMed]
4. Youn, J.C.; Kim, K.W.; Lee, D.Y.; Jhoo, J.H.; Lee, S.B.; Park, J.H.; Woo, J.I. Development of the subjectivememory complaints questionnaire. Dement. Geriatr. Cogn. Disord. 2009, 27, 310–317. [CrossRef] [PubMed]
5. Benito-León, J.; Mitchell, A.J.; Vega, S.; Bermejo-Pareja, F. A population-based study of cognitive function inolder people with subjective memory complaints. J. Alzheimers Dis. 2010, 22, 159–170. [CrossRef]
6. Genziani, M.; Stewart, R.; Béjot, Y.; Amieva, H.; Artero, S.; Ritchie, K. Subjective memory impairment,objective cognitive functioning and social activity in French older people: Findings from the Three Citiesstudy. Geriatr. Gerontol. Int. 2013, 13, 139–145. [CrossRef]
162

Int. J. Environ. Res. Public Health 2019, 16, 4560
7. Vaskivuo, L.; Hokkanen, L.; Hänninen, T.; Antikainen, R.; Bäckman, L.; Laatikainen, T.; Ngandu, T.Associations between Prospective and Retrospective Subjective Memory Complaints and NeuropsychologicalPerformance in Older Adults: The Finger Study. J. Int. Neuropsychol. Soc. 2018, 24, 1099–1109. [CrossRef]
8. Mitchell, A.J.; Beaumont, H.; Ferguson, D.; Yadegarfar, M.; Stubbs, B. Risk of dementia and mild cognitiveimpairment in older people with subjective memory complaints: Meta–analysis. Acta Psychiatr. Scand. 2014,130, 439–451. [CrossRef]
9. Geerlings, M.I.; Jonker, C.; Bouter, L.M.; Adèr, H.J.; Schmand, B. Association between memory complaintsand incident Alzheimer’s disease in elderly people with normal baseline cognition. Am. J. Psychiatry 1999,156, 531–537.
10. Jorm, A.F.; Christensen, H.; Korten, A.E.; Jacomb, P.A.; Henderson, A.S. Memory complaints as a precursorof memory impairment in older people: A longitudinal analysis over 7–8 years. Psychol. Med. 2001, 31,441–449. [CrossRef]
11. Wang, L.; Van Belle, G.; Crane, P.K.; Kukull, W.A.; Bowen, J.D.; McCormick, W.C.; Larson, E.B. Subjectivememory deterioration and future dementia in people aged 65 and older. J. Am. Geriatr. Soc. 2004, 52,2045–2051. [CrossRef] [PubMed]
12. Waldorff, F.B.; Siersma, V.; Vogel, A.; Waldemar, G. Subjective memory complaints in general practicepredicts future dementia: A 4-year follow-up study. Int. J. Geriatr. Psychiatry 2012, 27, 1180–1188. [CrossRef][PubMed]
13. Amieva, H.; Letenneur, L.; Dartigues, J.F.; Rouch-Leroyer, I.; Sourgen, C.; D’Alchée-Birée, F.; Fabrigoule, C.Annual rate and predictors of conversion to dementia in subjects presenting mild cognitive impairmentcriteria defined according to a population-based study. Dement. Geriatr. Cogn. Disord. 2004, 18, 87–93.[CrossRef] [PubMed]
14. Devier, D.J.; Villemarette-Pittman, N.; Brown, P.; Pelton, G.; Stern, Y.; Sano, M.; Devanand, D.P. Predictiveutility of type and duration of symptoms at initial presentation in patients with mild cognitive impairment.Dement. Geriatr. Cogn. Disord. 2010, 30, 238–244. [CrossRef] [PubMed]
15. Silva, D.; Guerreiro, M.; Faria, C.; Maroco, J.; Schmand, B.A.; Mendonça, A.D. Significance of subjectivememory complaints in the clinical setting. J. Geriatr. Psychiatry Neurol. 2014, 27, 259–265. [CrossRef][PubMed]
16. Mol, M.E.; Van Boxtel, M.P.; Willems, D.; Jolles, J. Do subjective memory complaints predict cognitivedysfunction over time? A six-year follow-up of the Maastricht Aging Study. Int. J. Geriatr. Psychiatry J. Child
Psychol. Psychiatry 2006, 21, 432–441. [CrossRef]17. Reid, L.M.; MacLullich, A.M. Subjective memory complaints and cognitive impairment in older people.
Dement. Geriatr. Cogn. Disord. 2006, 22, 471–485. [CrossRef]18. Dourlen, P.; Kilinc, D.; Malmanche, N.; Chapuis, J.; Lambert, J.C. The new genetic landscape of Alzheimer’s
disease: From amyloid cascade to genetically driven synaptic failure hypothesis? Acta Neuropathol. 2019,138, 221–226. [CrossRef]
19. Yegambaram, M.; Manivannan, B.; Beach, G.T.; Halden, U.R. Role of environmental contaminants in theetiology of Alzheimer’s disease: A review. Curr. Alzheimer Res. 2015, 12, 116–146. [CrossRef]
20. Eid, A.; Mhatre, I.; Richardson, J.R. Gene-environment interactions in Alzheimer’s disease: A potential pathto precision medicine. Clin. Pharm. 2019, 199, 173–187. [CrossRef]
21. Paglia, G.; D’Alessandro, A.; Rolfsson, Ó.; Sigurjónsson, Ó.E.; Bordbar, A.; Palsson, S.; Palsson, B.O.Biomarkers defining the metabolic age of red blood cells during cold storage. Blood 2016, 128, 43–50.[CrossRef] [PubMed]
22. WHO 2015 Human Biomonitoring: Facts and Figures. Available online: http://www.euro.who.int/__data/assets/pdf_file/0020/276311/Human--biomonitoring-facts-figures-en.pdf (accessed on 1 September 2018).
23. Hartmann, S.; Ledur Kist, T.B. A review of biomarkers of Alzheimer’s disease in noninvasive samples.Biomark. Med. 2018, 12, 677–690. [CrossRef] [PubMed]
24. Wilhelm, M.; Hafner, D.; Lombeck, I.; Ohnesorge, F.K. Monitoring of cadmium, copper, lead and zincstatus in young-children using toenails—Comparison with scalp hair. Sci. Total Environ. 1991, 103, 199–207.[CrossRef]
25. Savarino, L.; Granchi, D.; Ciapetti, G.; Cenni, E.; Ravaglia, G.; Forti, P. Serum concentrations of zinc andselenium in elderly people: Results in healthy nonagenarians/ centenarians. Exp. Gerontol. 2001, 36, 327–339.[CrossRef]
163

Int. J. Environ. Res. Public Health 2019, 16, 4560
26. Hao, Z.; Li, Y.; Liu, Y.; Li, H.; Wang, W.; Yu, J. Hair elements and healthy aging: A cross-sectional study inHainan Island, China. Environ. Geochem. Health 2016, 38, 723–735. [CrossRef]
27. Ahluwalia, N.; Gordon, M.A.; Handte, G.; Mahlon, M.; Li, N.Q.; Beard, J.L. Iron status and stores declinewith age in Lewis rats. J. Nutr. 2000, 130, 2378–2383. [CrossRef]
28. Pike, J.; Chandra, R.K. Effect of vitamin and traceelement supplementation on immune indexes in healthyelderly. Int. J. Vitam. Nutr. Res. 1995, 65, 117–121.
29. Schmidt, K. Vitamins, minerals, and trace-element in elderly people. Zentralblatt für Hygiene und
Umweltmedizin 1991, 191, 327–332.30. Selim, A.J.; Fincke, G.; Berlowitz, D.R.; Miller, D.R.; Qian, S.X.; Lee, A. Comprehensive health status
assessment of centenarians: Results from the 1999 large health survey of veteran enrollees. J. Gerontol. A Biol.
Sci. Med. Sci. 2005, 60, 515–519. [CrossRef]31. Andersen-Ranberg, K.; Vasegaard, L.; Jeune, B. Dementia is not inevitable: A population-based study of
Danish centenarians. J. Gerontol. B Psychol. Sci. Soc. Sci. 2001, 56, 152–159. [CrossRef]32. Pereira, M.E.; Lillebø, A.I.; Pato, P.; Válega, M.; Coelho, J.P.; Lopes, C. Mercury pollution in Ria de Aveiro
(Portugal): A review of the system assessment. Environ. Monit. Assess. 2009, 155, 39–49. [CrossRef] [PubMed]33. Cachada, A.; Pereira, M.E.; Ferreira da Silva, E.; Duarte, A.C. Sources of potentially toxic elements and
organic pollutants in an urban area subjected to an industrial impact. Environ. Monit. Assess. 2012, 184,15–32. [CrossRef] [PubMed]
34. Inácio, M.; Neves, O.; Pereira, V.; da Silva, E.F. Levels of selected potential harmful elements (PHEs) in soilsand vegetables used in diet of the population living in the surroundings of the Estarreja Chemical Complex(Portugal). J. Appl. Geochem. 2014, 44, 38–44. [CrossRef]
35. Patinha, C.; Reis, A.P.; Dias, A.C.; Abduljelil, A.A.; Noack, Y.; Robert, S.; Cave, M.; da Silva, E.F. The mobilityand human oral bioaccessibility of Zn and Pb in urban dusts of Estarreja (N Portugal). Environ. Geochem.
Health 2015, 37, 115–131. [CrossRef] [PubMed]36. Leitão, T.B.E. Metodologia Para A Reabilitação De Aquíferos Poluídos. Ph.D. Thesis, Faculdade de Ciências
da Universidade de Lisboa, Lisboa, Portugal, 1996.37. Van der Weijden, C.; Pacheco, F.A.L. Hydrogeochemistry in the Vouga River basin (central Portugal):
Pollution and chemical weathering. J. Appl. Geochem. 2006, 21, 580–613. [CrossRef]38. Ordens, C.M. Estudo Da Contaminacão Do Aquífero Superior Na Região De Estarreja. Master’s Thesis,
Coimbra University, Coimbra, Portugal, 2007. Unpublished. Available online: http://www.lneg.pt/download/3268/carlos_ordens.pdf (accessed on 11 March 2018).
39. Reis, A.P.; Costa, S.; Santos, I.; Patinha, C.; Noack, Y.; Wragg, J. Investigating relationships between biomarkersof exposure and environmental copper and manganese levels in house dusts from a Portuguese industrialcity. Environ. Geochem. Health 2015, 37, 725–744. [CrossRef]
40. Plumejeaud, S.; Reis, A.P.; Tassistro, V.; Patinha, C.; Noack, Y.; Orsière, T. Potentially harmful elements inhouse dust from Estarreja, Portugal: Characterization and genotoxicity of the bioaccessible fraction. Environ.
Geochem. Health 2018, 40, 127–144. [CrossRef]41. Cabral Pinto, M.M.S.; Marinho-Reis, A.P.; Almeida, A.; Ordens, C.M.; Silva, M.M.; Freitas, S.; Simões, M.;
Dinis, P.; Moreira, P.; de Melo, T.C.; et al. Human predisposition to cognitive impairment and its relationwith environmental exposure to potentially toxic elements. Environ. Geochem. Health 2018, 40, 1767–1784.[CrossRef]
42. Cabral Pinto, M.M.S.; Marinho-Reis, A.P.; Almeida, A.; Freitas, S.; Simões, M.R.; Diniz, M.L.; da Silva, E.F.;Moreira, P.I. Fingernail trace element content in environmentally exposed individuals and its influence ontheir cognitive status in ageing. Expo. Health 2018, 11, 181–194. [CrossRef]
43. Cabral Pinto, M.M.S.; Ordens, C.M.; de Melo, M.T.C.; Inácio, M.; Almeida, A.; Pinto, E.; da Silva, E.A.F. AnInter-disciplinary Approach to Evaluate Human Health Risks Due to Long-Term Exposure to ContaminatedGroundwater Near a Chemical Complex. Expo. Health 2019, 1–16. [CrossRef]
44. Cabral-Pinto, M.M.S.; Inácio, M.; Neves, O.; Almeida, A.A.; Pinto, E.; Oliveiros, B.; Ferreira da Silva, E.A.F.Human Health Risk Assessment Due to Agricultural Activities and Crop Consumption in the Surroundingsof an Industrial Area. Expo. Health 2019, 1–12. [CrossRef]
45. Yesavage, J.A.; Brink, T.L.; Rose, T.L.; Lum, O.; Huang, V.; Adey, M.; Leirer, V.O. Development and validationof a geriatric depression screening scale: A preliminary report. J. Psychiatr. Res. 1983, 17, 37–49. [CrossRef]
164

Int. J. Environ. Res. Public Health 2019, 16, 4560
46. Pocinho, M.T.S.; Farate, C.; Dias, C.A.; Lee, T.T.; Yesavage, J.A. Clinical and psychometric validation of theGeriatric Depression Scale (GDS) for Portuguese Elders. Clin. Gerontol. 2009, 32, 223–236. [CrossRef]
47. Simões, M.R.; Prieto, G.; Pinho, M.S.; Firmino, H. Geriatric Depression Scale (GDS-30). In Escalas e Testes na
Demência (3a. edição) (Scales and tests in dementia), 3rd ed.; Simões, M.R., Isabel Santana e Grupo de Estudosde Envelhecimento Cerebral e Demência, Eds.; Novartis: Lisboa, Portugal, 2015; pp. 128–133.
48. Kuiper, N.; Rowell, C.; Nriagu, J.; Shomar, B. What do the trace metal contents of urine and toenail samplesfrom Qatar’s farm workers bioindicate? Environ. Res. 2014, 131, 86–94. [CrossRef] [PubMed]
49. Folstein, M.; Folstein, S.; McHugh, P. Mini-mental state: A practical method for grading the cognitive state ofpatients for the clinician. J. Psychiatr. Res. 1975, 12, 189–198. [CrossRef]
50. Freitas, S.; Simões, M.R.; Alves, L.; Santana, I. Montreal Cognitive Assessment (MoCA): Validation study formild cognitive impairment and Alzheimer’s disease. Alzheimer Dis. Assoc. Disord. 2013, 27, 37–43. [CrossRef][PubMed]
51. Freitas, S.; Simões, M.R.; Alves, L.; Santana, I. The relevance of sociodemographic and health variables onMMSE normative data. Appl. Neuropsychol. Adult 2015, 22, 311–319. [CrossRef]
52. Kaup, A.R.; Nettiksimmons, J.; LeBlanc, E.S.; Yaffe, K. Memory complaints and risk of cognitive impairmentafter nearly 2 decades among older women. Neurology 2015, 85, 1852–1858. [CrossRef]
53. O’Bryant, S.E.; Humphreys, J.D.; Smith, G.E.; Ivnik, R.J.; GraffRadford, N.R.; Petersen, R.C.; Lucas, J.A.Detecting dementia with the Mini-Mental State Examination (MMSE) in highly educated individuals. Arch.
Neurol. 2008, 65, 963–967. [CrossRef]54. Bass, D.A.; Hickok, D.; Quig, D.; Urek, K. Trace element analysis in hair: Factors determining accuracy,
precision, and reliability. Altern. Med. Rev. 2001, 6, 472–481.55. Buat-Menard, P.; Chesselet, R. Variable influence of the atmospheric flux on the trace metal chemistry of
oceanic suspended matter. Earth Planet. Sci. Lett. 1979, 42, 399–411. [CrossRef]56. Islam, S.; Ahmed, K.; Masunaga, S. Potential ecological risk of hazardous elements in different land-use
urban soils of Bangladesh. Sci. Total Environ. 2015, 512, 94–102. [CrossRef] [PubMed]57. Islam, M.N.; Park, J.H. Immobilization and reduction of bioavailability of lead in shooting range soil through
hydrothermal treatment. J. Environ. Manag. 2017, 191, 172–178. [CrossRef] [PubMed]58. Cabral Pinto, M.M.S.; Silva, M.M.; da Silva, E.A.F.; Dinis, P.A.; Rocha, F. Transfer processes of potentially
toxic elements (PTE) from rocks to soils and the origin of PTE in soils: A case study on the island of Santiago(Cape Verde). J. Geochem. Explor. 2017, 183, 140–151. [CrossRef]
59. Sutherland, R.A. Depth variation in copper, lead and zinc concentrations and mass enrichment ratios in soilsof an urban watershed. J. Environ. Qual. 2000, 29, 1414–1422. [CrossRef]
60. Anderson, T.M.; Sachdev, P.S.; Brodaty, H.; Trollor, J.; Andrews, G. Effects of sociodemographic and healthvariables on MiniMental State Exam scores in older Australians. Am. J. Geriatr. Psychiatry 2007, 15, 467–476.[CrossRef]
61. Bravo, G.; Hébert, R. Age and education specific reference values for the Mini-Mental and ModifiedMini-Mental State Examination derived from a non-demented elderly population. Int. J. Geriatr. Psychiatry
1997, 12, 1008–1018. [CrossRef]62. Gallacher, J.E.; Elwood, P.C.; Hopkinson, C.; Rabbitt, P.M.; Stollery, B.T.; Sweetnam, P.M.; Huppert, F.A.
Cognitive function in the Caerphilly study: Associations with age, social class, education and mood. Eur. J.
Epidemiol. 1999, 15, 161–169. [CrossRef]63. Matallana, D.; Santacruz, C.; Cano, C.; Reyes, P.; Samper-Ternent, R.; Markides, K.S.; Reyes-Ortiz, C.A. The
relationship between educational level and Mini-Mental State Examination domains among older MexicanAmericans. J. Geriatr. Psychiatry Neurol. 2011, 24, 9–18. [CrossRef]
64. Moraes, C.; Pinto, J.A.; Lopes, M.A.; Litvoc, J.; Bottino, C.M. Impact of sociodemographic and health variableson Mini-Mental State Examination in a community-based sample of older people. Eur. Arch. Psychiatry Clin.
Neurosci. 2010, 260, 535–542. [CrossRef]65. Han, C.; Jo, S.A.; Jo, I.; Kim, E.; Park, M.H.; Kang, Y. An adaptation of the Korean Mini-Mental State
Examination (K-MMSE) in elderly Koreans: Demographic influence and population-based norms (the AGEStudy). Arch Gerontol. Geriatr. 2008, 47, 302–310. [CrossRef] [PubMed]
66. Mathuranath, P.S.; Cherian, J.P.; Mathew, R.; George, A.; Alexander, A.; Sarma, S.P. Mini Mental StateExamination and the Addenbrooke’s Cognitive Examination: Effect of education and norms for a multiculturalpopulation. Neurol. India 2007, 55, 106–110. [CrossRef] [PubMed]
165

Int. J. Environ. Res. Public Health 2019, 16, 4560
67. Measso, G.; Cavarzeran, F.; Zappalà, G.; Lebowitz, B.D.; Crook, T.H.; Pirozzollo, F.J.; Grigoletto, F. TheMini-Mental State Examination: Normative study of an Italian random sample. Dev. Neuropsychol. 1993, 9,77–85. [CrossRef]
68. Thiele, S.; Mensink, G.B.; Beitz, R. Determinants of diet quality. Public Health Nutr. 2004, 7, 29–37. [CrossRef][PubMed]
69. Li, J.; Powdthavee, N. Does more education lead to better health habits? Evidence from the school reforms in
Australia. Soc. Sci. Med. 2015, 127, 83–91. [PubMed]70. Mías, C.D.; Sassi, M.; Masih, M.E.; Querejeta, A.; Krawchik, R. Deterioro cognitivo leve: Estúdio de
prevalência y factores sociodemográficos en la ciudad de Córdoba, Argentina [Mild cognitive impairment: Aprevalence and sociodemographic factors study in the city of Córdoba, Argentina]. Rev. Neurol. 2007, 44,733–738. [PubMed]
71. Ribeiro, P.C.; Oliveira, B.H.; Cupertino, A.P.; Neri, A.L.; Yassuda, M.S. Desempenho de idosos na bateriacognitiva CERAD: Relações com variáveis sociodemográficas e saúde percebida [Performance of the elderly inthe CERAD Cognitive Battery: Relations with socio-demographic variables and perceived health]. Psicologia,
Reflexão e Crítica 2010, 23, 102–109. [CrossRef]72. Scazufca, M.; Almeida, O.P.; Vallada, H.P.; Tasse, W.A.; Menezes, P.R. Limitations of the Mini-Mental State
Examination for screening dementia in a community with low socioeconomic status. Eur. Arch. Psychiatry
Clin. Neurosci. 2009, 259, 8–15. [CrossRef]73. Wang, X.; Zhou, W.; Ye, T.; Lin, X.; Zhang, J. Alzheimer’s Disease Neuroimaging Initiative. Sex Difference in
the Association of APOE4 with Memory Decline in Mild Cognitive Impairment. J. Alzheimer’s Dis. 2019, 69,1161–1169. [CrossRef]
74. Iwata, A.; Iwatsubo, T.; Ihara, R.; Suzuki, K.; Matsuyama, Y.; Tomita, N.; Ikeuchi, T. Effects of sex, educationalbackground, and chronic kidney disease grading on longitudinal cognitive and functional decline in patientsin the Japanese Alzheimer’s Disease Neuroimaging Initiative study. Alzheimer’s Dement. Transl. Res. Clin.
Interv. 2018, 4, 765–774. [CrossRef]75. Gorelick, P.B.; Scuteri, A.; Black, S.E.; DeCarli, C.; Greenberg, S.M.; Iadecola, C.; Petersen, R.C. Vascular
contributions to cognitive impairment and dementia: A statement for healthcare professionals from theAmerican Heart Association/American Stroke Association. Stroke 2011, 42, 2672–2713. [CrossRef] [PubMed]
76. USEPA. Mercury Study Report to Congress; Office of Air Quality Planning and Standards and Office of Researchand Development: Washington, DC, USA; USEPA: Washington, DC, USA, 1997.
77. Skalny, A.V.; Skalnaya, M.G.; Tinkov, A.A.; Serebryansky, E.P.; Demidov, V.A.; Lobanova, Y.N.; Skalnaya, O.A.Hair concentration of essential trace elements in adult non-exposed Russian population. Environ. Monit.
Assess. 2015, 187, 677–688. [CrossRef] [PubMed]78. Mikulewicz, M.; Chojnacka, K.; Gedrange, T.; Górecki, H. Reference values of elements in human hair: A
systematic review. Environ. Toxicol. Pharmacol. 2013, 36, 1077–1086. [CrossRef] [PubMed]79. Rodushkin, I.; Axelsson, M.D. Application of double focusing sector field ICP-MS for multielemental
characterization of human hair and nails. Part II. A study of the inhabitants of northern Sweden. Sci. Total
Environ. 2000, 262, 21–36. [CrossRef]80. Kazi, T.G.; Memon, A.R.; Afridi, H.I.; Jamali, M.K.; Arain, M.B.; Jalbani, N.; Sarfraz, R.A. Determination of
cadmium in whole blood and scalp hair samples of Pakistani male lung cancer patients by electrothermalatomic absorption spectrometer. Sci. Total Environ. 2008, 389, 270–276. [CrossRef] [PubMed]
81. Brulle, R.J.; Pellow, D.N. Environmental justice: Human health and environmental inequalities. Annu. Rev.
Publ. Health. 2006, 27, 103–124. [CrossRef] [PubMed]82. Ginter, E.; Simko, V. Women live longer than men. Bratisl. Lek. Listy 2013, 114, 45–49. [CrossRef]83. Luy, M.; Gast, K. Do women live longer or do men die earlier? Reflections on the causes of sex differences in
life expectancy. Gerontology 2014, 60, 143–153. [CrossRef]84. Serdar, M.A.; Akin, B.S.; Razi, C.; Akin, O.; Tokgoz, S.; Kenar, L.; Aykut, O. The correlation between smoking
status of family members and concentrations of toxic trace elements in the hair of children. Biol. Trace Elem.
Res. 2012, 148, 11–17. [CrossRef]85. Zatta, P.; Lucchini, R.; Van Rensburg, S.J.; Taylor, A. The role of metals in neurodegenerative processes:
Aluminum, manganese, and zinc. Brain Res. Bull. 2003, 62, 15–28. [CrossRef]86. Loef, M.; Von Stillfried, N.; Walach, H. Zinc diet and Alzheimer’s disease: A systematic review. Nutr.
Neurosci. 2012, 15, 2–12. [CrossRef] [PubMed]
166

Int. J. Environ. Res. Public Health 2019, 16, 4560
87. Prodan, C.I.; Holland, N.R. CNS demyelination from zinc toxicity? Neurology 2000, 54, 1705–1706. [CrossRef][PubMed]
88. Genuis, S.J.; Kelln, K.L. Toxicant exposure and bioaccumulation: A common and potentially reversible causeof cognitive dysfunction and dementia. Behav. Neurol. 2015, 2015, 620143. [CrossRef] [PubMed]
89. Zahir, F.; Rizwi, S.J.; Haq, S.K.; Khan, R.H. Low dose mercury toxicity and human health. Environ. Toxicol.
Chem. 2005, 20, 351–360. [CrossRef] [PubMed]90. Waldron, I.; Johnston, S. Why do women live longer than men? J. Hum. Stresss 1976, 2, 19–30. [CrossRef]
[PubMed]91. Ninomiya, T.; Ohmori, H.; Hashimoto, K.; Tsuruta, K.; Ekino, S. Expansion of methylmercury poisoning
outside minamata: An epidemiological study on chronic methylmercury poisoninig outside of Minamata.Environ. Res. 1995, 70, 47–50. [CrossRef]
92. Xu, L.; Zhang, W.; Liu, X.; Zhang, C.; Wang, P.; Zhao, X. Circulatory Levels of Toxic Metals (Aluminum,Cadmium, Mercury, Lead) in Patients with Alzheimer’s Disease: A Quantitative Meta-Analysis andSystematic Review. J. Alzheimers Dis. 2018, 62, 361–372. [CrossRef]
93. Meleleo, D.; Notarachille, G.; Mangini, V.; Arnesano, F. Concentration-dependent effects of mercury and leadon Aβ42: Possible implications for Alzheimer’s disease. Eur. Biophys. J. 2019, 48, 173–187. [CrossRef]
94. Food and Agriculture Organization World Health of the United Nations. In Proceedings of the JointFAO/WHO Expert Committee on Food Additives Sixty-Third Meeting, Geneva, Switzerland, 8–17 June 2004.Available online: http://www.fao.org/3/a-at878e.pdf (accessed on 1 April 2019).
95. JECFA. Evaluation of Certain Contaminants in Food. In The Seventy-Second Report of Joint FAO/WHO Expert
Committee on Food Additives; WHO technical report series; JECFA: Geneva, Switzerland, 2011; Volume 959,pp. 1–115.
96. WHO. Environmental Health Criteria 101—Methylmercury; World Health Organization: Geneva, Switzerland,1990.
97. Agusa, T.; Kunito, T.; Sudaryanto, A.; Monirith, I.; Kan-Atireklap, S.; Iwata, H.; Tanabe, S. Exposureassessment for trace elements from consumption of marine fish in Southeast Asia. Environ. Pollut. 2007, 145,766–777. [CrossRef]
98. Freire, C.; Ramos, R.; Lopez-Espinosa, M.J.; Díez, S.; Vioque, J.; Ballester, F.; Fernández, M.F. Hair mercurylevels, fish consumption, and cognitive development in preschool children from Granada, Spain. Environ.
Res. 2010, 110, 96–104. [CrossRef]99. Díez, S.; Esbrí, J.M.; Tobias, A.; Higueras, P.; Martínez-Coronado, A. Determinants of exposure to mercury in
hair from inhabitants of the largest mercury mine in the world. Chemosphere 2011, 84, 571–577. [CrossRef][PubMed]
100. Dolbec, J.; Mergler, D.; Larribe, F.; Roulet, M.; Lebel, J.; Lucotte, M. Sequential analysis of hair mercury levelsin relation to fish diet of an Amazonian population, Brazil. Sci. Total Environ. 2001, 271, 87–97. [CrossRef]
101. Koseoglu, E.; Koseoglu, R.; Kendirci, M.; Saraymen, R.; Saraymen, B. Trace metal concentrations in hair andnails from Alzheimer’s disease patients: Relations with clinical severity. J. Trace Elem. Med. Biol. 2017, 39,124–128. [CrossRef] [PubMed]
102. Vance, D.E.; Ehmann, W.D.; Markesbery, W.R. Trace element imbalances in hair and nails of Alzheimer’sdisease patients. Neurotoxicology 1998, 9, 197–208.
103. Koc, E.R.; Ilhan, A.; Ayturk, Z.; Acar, B.; Gürler, M.; Altuntas, A.; Karapirli, M.; Bodur, A.S. A comparison ofhair and serum trace elements in patients with Alzheimer disease and healthy. Turk. J. Med. Sci. 2015, 45,1034–1039. [CrossRef]
104. Paglia, G.; Miedico, O.; Cristofano, A.; Vitale, M.; Angiolillo, A.; Chiaravalle, A.E.; DiCostanzo, A. Distinctivepattern of serum elements during the progression of Alzheimer’s disease. Sci. Rep. 2016, 6, 22679. [CrossRef]
105. Li, Y.H.; Zou, X.Y.; Lv, J.M.; Yang, L.S.; Li, H.R.; Wang, W.Y. Trace elements in fingernails of healthy Chinesecentenarians. Biol. Trace Elem. Res. 2012, 145, 158–165. [CrossRef]
106. Inácio, M.M.S. Dados Geoquímicos De Base De Solos De Portugal Continental, Utilizando AmostragemDe Baixa Densidade. Ph.D. Thesis, University of Aveiro, Aveiro, Portugal, 2004. Available online:http://hdl.handle.net/10773/18827 (accessed on 20 February 2019).
107. Canadian Guideline: Minister of the Environment (Canada). Soil, Ground Water and Sediment Standardsfor Use under Part XV.1 of the Environmental Protection Act. Available online: http://www.mah.gov.on.ca/AssetFactory.aspx?did=8993 (accessed on 15 March 2018).
167

Int. J. Environ. Res. Public Health 2019, 16, 4560
108. Thiombane, M.; Di Bonito, M.; Albanese, S.; Zuzolo, D.; Lima, A.; De Vivo, B. Geogenic versus anthropogenicbehaviour and geochemical footprint of Al, Na, K and P in the Campania region (Southern Italy) soilsthrough compositional data analysis and enrichment factor. Geoderma 2019, 335, 12–26. [CrossRef]
109. Reimann, C.; Garrett, R.G. Geochemical background—concept and reality. Sci. Total Environ. 2005, 350,12–27. [CrossRef]
110. Cabral Pinto, M.M.S.; da Silva, E.F.; Silva, M.; Melo-Gonçalves, P.; Candeias, C. Environmental risk assessmentbased on high-resolution spatial maps of potentially toxic elements sampled on stream sediments of Santiago,Cape Verde. Geosciences 2014, 4, 297–315. [CrossRef]
111. Cabral Pinto, M.M.S.; da Silva, E.F.; Silva, M.; Melo-Gonçalves, P. Heavy metals of Santiago Island (CapeVerde) top soils: Estimated background value maps and environmental risk assessment. J. Afr. Earth Sci.
2015, 101, 162–176. [CrossRef]112. Reis, A.T. Impact of Mercury on Human Health: Aveiro, A Study Case. Master’s Thesis, University of Aveiro,
Aveiro, Portugal, 2008; p. 112.113. Dutch Soil Remediation Circular. Esdat Environmental Database Managment Software. 2009. Available
online: ww.esdat.net (accessed on 10 October 2019).114. Ministry of Health of the People’s Republic of China. The maximum levels of contaminants
in foods (GB 2762-2005). Maximum Levels of Contaminants in Foods_Beijing_China—PeoplesRepublic of_12-11-2014.pdf. 2005. Available online: https://apps.fas.usda.gov/newgainapi/api/report/downloadreportbyfilename?filename=Maximum%20Levels%20of%20Contaminants%20in%20Foods%20_Beijing_China%20-%20Peoples%20Republic%20of_12-11-2014.pdf (accessed on 11 April 2019).
115. Jornal Oficial das Comunidades Europeias, L77/1 de 16/3/2001. p. 1. Available online: https://www.europarl.europa.eu/RegData/PDF/r1049_pt.pdf (accessed on 6 March 2019).
© 2019 by the authors. Licensee MDPI, Basel, Switzerland. This article is an open accessarticle distributed under the terms and conditions of the Creative Commons Attribution(CC BY) license (http://creativecommons.org/licenses/by/4.0/).
168

MDPISt. Alban-Anlage 66
4052 BaselSwitzerland
Tel. +41 61 683 77 34Fax +41 61 302 89 18
www.mdpi.com
International Journal of Environmental Research and Public Health Editorial OfficeE-mail: [email protected]
www.mdpi.com/journal/ijerph

MDPI
St. Alban-Anlage 66
4052 Basel
Switzerland
Tel: +41 61 683 77 34
Fax: +41 61 302 89 18
www.mdpi.com ISBN 978-3-0365-1839-8