
Optical identification of radio-loud active galactic nuclei in the ROSAT-Green-Bank sample with SDSS...
30
arXiv:0906.1361v2 [astro-ph.HE] 12 Jul 2009 Research in Astron. & Astrophys. Vol.0 (200x) No.0, 000–000 (http://www.raa-journal.org) Research in Astronomy and Astrophysics Optical identification of radio-loud active galactic nuclei in the ROSAT-Green-Bank sample with SDSS spectroscopy De-Liang Wang 1; 2 , Jian-Guo Wang 1; 2 and Xiao-Bo Dong 3 1 National Astronomical Observatories/Yunnan Observatory, Chinese Academy of Sciences, Kunming, Yunnan, 650011, China; [email protected] 2 Graduate School of the Chinese Academy of Sciences, 19A Yuquan Road, Beijing 100039, China 3 Center for Astrophysics, University of Science and Technology of China, Hefei, 230026, China Abstract Results of extended and refined optical identification of 181 radio/X-ray sources in the RASS-Green Bank (RGB) catalog (Brinkmann et al. 1997) are presented which have been spectroscopically observed in the Sloan Digital Sky Survey (SDSS) DR5. The SDSS spectra of the optical counterparts are modeled in a careful and self-consistent way by in- corporating the host galaxy’s starlight. The optical emission line parameters are presented, which are derived accurately and reliably, along with the radio 1.4–5 GHz spectral indices estimated using (non-simultaneous) archival data. For 72 sources, the identifications are pre- sented for the first time. It is confirmed that the majority of strong radio/X-ray emitters are radio-loud active galactic nuclei (AGNs), particularly blazars. Taking advantage of the high spectral quality and resolution and our refined spectral modeling, we are able to disentan- gle narrow line radio galaxies (NLRGs), as vaguely termed in most previous identification work, into Seyfert II galaxies and LINERs (low-ionization nuclear emission regions), based on the standard emission line diagnostics. The NLRGs in the RGB sample, mostly belonging to ‘weak line radio galaxies’ (Tadhunter et al. 1998), are found have optical spectra consis- tent predominantly with LINERs, and only a small fraction with Seyfert II galaxies. A small number of LINERs have radio power as high as 10 23 10 26 W Hz 1 at 5 GHz, being among the strongest radio emitting LINERs known so far. Two sources are identified with radio-loud narrow line Seyfert 1 galaxies (NLS1s), a class of rare objects. The presence is also confirmed of flat-spectrum radio quasars whose radio–optical–X-ray effective spectral indices are simi- lar to those of High-energy peaked BL Lacs (HBLs), as suggested by Padovani et al. (2003), albeit it is yet a debate as to whether this is the case for their actual spectral energy distribu- tions. Key words: galaxies: active; galaxies: quasars; BL Lacerate objects: general; X-rays: gen- eral; radio continuum: general. 1 INTRODUCTION Sources detected in both X-ray and radio surveys are predominantly radio emitting active galactic nuclei (AGNs), especially blazars. Optical identification of such sources has proved to be an efficient way to compile radio-loud AGNs and blazar samples. With the advent of the ROSAT satellite—both the ROSAT all-sky survey (RASS, Voges et al. 1999) and pointed observations—in the X-ray band and several large area sky surveys in the radio bands, large samples of radio-loud AGNs and blazars have been discovered and identified. Examples of such samples are the RGB (RASS–Green Bank) sample comprising 2127 sources (Brinkmann et al. 1995, 1997; Laurent-Muehleisen et al. 1998, 1999), the REX (radio-emitting X-ray) sample (Caccianiga et al. 1999, 2000), the DXRBS (Deep X-ray radio blazar survey) sample (Perlman
Transcript of Optical identification of radio-loud active galactic nuclei in the ROSAT-Green-Bank sample with SDSS...

arX
iv:0
906.
1361
v2 [
astr
o-ph
.HE
] 12
Jul
200
9
Research in Astron. & Astrophys. Vol.0 (200x) No.0, 000–000(http://www.raa-journal.org)
Research inAstronomy andAstrophysics
Optical identification of radio-loud active galactic nuclei in theROSAT-Green-Bank sample with SDSS spectroscopy
De-Liang Wang1;2, Jian-Guo Wang1;2 and Xiao-Bo Dong3
1 National Astronomical Observatories/Yunnan Observatory, Chinese Academy of Sciences, Kunming,Yunnan, 650011, China;[email protected]
2 Graduate School of the Chinese Academy of Sciences, 19A Yuquan Road, Beijing 100039, China3 Center for Astrophysics, University of Science and Technology of China, Hefei, 230026, China
Abstract Results of extended and refined optical identification of 181radio/X-ray sourcesin the RASS-Green Bank (RGB) catalog (Brinkmann et al. 1997)are presented which havebeen spectroscopically observed in the Sloan Digital Sky Survey (SDSS) DR5. The SDSSspectra of the optical counterparts are modeled in a carefuland self-consistent way by in-corporating the host galaxy’s starlight. The optical emission line parameters are presented,which are derived accurately and reliably, along with the radio 1.4–5 GHz spectral indicesestimated using (non-simultaneous) archival data. For 72 sources, the identifications are pre-sented for the first time. It is confirmed that the majority of strong radio/X-ray emitters areradio-loud active galactic nuclei (AGNs), particularly blazars. Taking advantage of the highspectral quality and resolution and our refined spectral modeling, we are able to disentan-gle narrow line radio galaxies (NLRGs), as vaguely termed inmost previous identificationwork, into Seyfert II galaxies and LINERs (low-ionization nuclear emission regions), basedon the standard emission line diagnostics. The NLRGs in the RGB sample, mostly belongingto ‘weak line radio galaxies’ (Tadhunter et al. 1998), are found have optical spectra consis-tent predominantly with LINERs, and only a small fraction with Seyfert II galaxies. A smallnumber of LINERs have radio power as high as1023 � 1026 W Hz� 1 at 5 GHz, being amongthe strongest radio emitting LINERs known so far. Two sources are identified with radio-loudnarrow line Seyfert 1 galaxies (NLS1s), a class of rare objects. The presence is also confirmedof flat-spectrum radio quasars whose radio–optical–X-ray effective spectral indices are simi-lar to those of High-energy peaked BL Lacs (HBLs), as suggested by Padovani et al. (2003),albeit it is yet a debate as to whether this is the case for their actual spectral energy distribu-tions.
Key words: galaxies: active; galaxies: quasars; BL Lacerate objects:general; X-rays: gen-eral; radio continuum: general.
1 INTRODUCTION
Sources detected in both X-ray and radio surveys are predominantly radio emitting active galactic nuclei(AGNs), especially blazars. Optical identification of suchsources has proved to be an efficient way tocompile radio-loud AGNs and blazar samples. With the adventof the ROSAT satellite—both the ROSATall-sky survey (RASS, Voges et al. 1999) and pointed observations—in the X-ray band and several largearea sky surveys in the radio bands, large samples of radio-loud AGNs and blazars have been discovered andidentified. Examples of such samples are the RGB (RASS–GreenBank) sample comprising 2127 sources(Brinkmann et al. 1995, 1997; Laurent-Muehleisen et al. 1998, 1999), the REX (radio-emitting X-ray)sample (Caccianiga et al. 1999, 2000), the DXRBS (Deep X-rayradio blazar survey) sample (Perlman

2 De-Liang Wang, Jian-Guo Wang, Xiao-Bo Dong
et al. 1998, Landt et al. 2001), the “Sedentary” sample (Giommi et al. 1999, 2005; Piranomonte et al. 2007),and the ROXA sample (Turriziani et al. 2007), etc., which were compiled using various selection criteria.Objects identified optically in these samples include radioquasars, BL Lac objects, broad-line and narrow-line radio galaxies, and even clusters of galaxies. For mostof these samples, the optical identification is farfrom complete; more identifications still await new opticalspectroscopic observations.
In most previous identification studies of large samples of radio/X-ray sources, the spectral classi-fication was generally rather coarse, given generally low spectral resolution and/or signal-to-noise ratio(S/N) acquired, and/or poor spectrophotometry calibration. For instance, weak or relatively narrow broad-line components were hard to detect, leading to incorrect classifications between type I and type II AGNs.Moreover, emission line objects without an apparent broad line component were often classified collectivelyas narrow line radio galaxies (NLRGs), which are commonly thought to be the radio-loud counterparts ofSeyfert II galaxies (e.g. Osterbrock 1976; Koski 1978; Urry& Padovani 1995). However, this practice isvague and sometimes misleading, since it has been known for along time that some radio galaxies haveoptical spectra that hardly qualify as NLRGs (or Seyfert II galaxies). Even from the early work on identifi-cation of radio sources, some radio galaxies were found to show spectra dominated by low-ionization lines,unlike Seyfert II galaxies (e.g. Costero & Osterbrock 1977;Laing et al. 1994), especially in FR I sources(e.g. Hine & Longair 1979; Laing et al. 1994). On the other hand, there also exists a distinct group of radiosources with weak [O III] line strength, termed as weak line radio galaxies (WLRG, Tadhunter et al. 1998).In fact, most of these objects, when observed with a better spectral resolution and S/N, turned out to beLINERs (Lewis et al. 2003). Rigorous classification of emission line galaxies should rely on the emissionline ratio diagnostics (e.g. Baldwin et al. 1981; Veilleux &Osterbrock 1987). This, however, requires goodspectrophotometric calibration and sufficient spectral resolution and S/N, which could not be reached insome of the identification work of radio and X-ray sources in the past.
Furthermore, the ground-based slit or fiber spectra of moderately or under- luminous AGNs are oftencontaminated by starlight of the host galaxies. The spectraof host galaxy starlight could severely affectthe detection and measurement of emission lines, by suppressing some weak emission lines (such asH �),distorting the line fluxes, and even generating spurious weak broad emission lines.
The Sloan Digital Sky Survey (SDSS, Stoughton et al. 2002) has acquired optical spectra of about onemillion galaxies and quasars with homogeneous quality and reasonably good spectral resolution, as wellas good spectrophotometric calibration accuracy (� 8% , Vanden Berk et al. 2004). Furthermore, efficientalgorithms have been developed to decompose nuclear emission line spectra from the host galaxy starlight,making it possible to accurately measure emission line fluxes and to recover weak emission line features.These improvements allow refined optical spectral classification of radio or X-ray sources. This is partic-ularly relevant to low-luminosity AGNs (LLAGNs) with relatively weak emission lines. Identification ofthese sources with LLAGNs would complement the study of LLAGNs in general by providing useful radioand X-ray data.
In recent studies of X-ray–radio AGN samples, a few interesting new trends were found. One wasthe suggestion of the presence of flat-spectrum radio quasars (FSRQs) appearing to show spectral energydistributions (SEDs) typical of high-energy peaked BL Lac objects (HBLs) (e.g. Padovani et al. 2003;Perlman et al. 1998). Such objects were claimed to be mostly found in X-ray selected samples for theirstrong X-ray emission, and were missed in earlier pure radio-selected blazar samples. If the SEDs of theseobjects indeed similar to those of HBLs, they would present achallenge to the so-called “blazar sequence”—a model in which the blazar SED is strongly correlated with the source power (Fossati et al. 1998; Ghiselliniet al. 1998). This is because objects with HBL-type SED at quasar luminosities are not a consequence ofthe model (Padovani et al. 2003). Independent confirmation of the presence of such FSRQs would still beworthwhile, although it is still a subject to actively debate whether the effective two-point spectral indicesare good indicators of HBL-type SEDs (Maraschi et al. 2008).Moreover, recently Yuan et al. (2008) founda fraction of very radio-loud narrow line Seyfert 1 galaxies(NLS1) in their small sample appearing tohave HBL-type effective spectral indices (though at relatively low luminosities). A related question thenis what is the fraction of NLS1 in FSRQs with “apparent” HBL-type SEDs. This can only be addressedby observations with sufficient S/N ratios and spectral resolutions that resolve a relatively narrow broad-component (< 2000km s� 1) in the presence of (strong) narrow Balmer lines.
Optical identification of radio-loud AGNs in the RGB sample 3
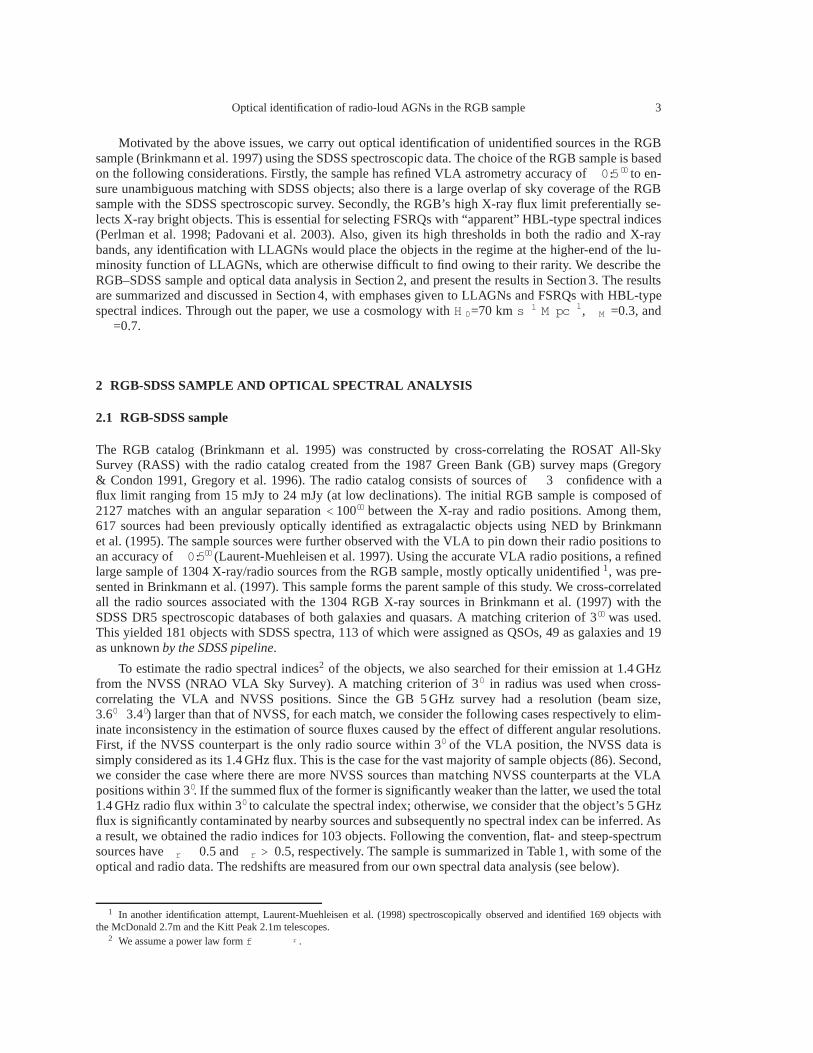
Motivated by the above issues, we carry out optical identification of unidentified sources in the RGBsample (Brinkmann et al. 1997) using the SDSS spectroscopicdata. The choice of the RGB sample is basedon the following considerations. Firstly, the sample has refined VLA astrometry accuracy of� 0:500 to en-sure unambiguous matching with SDSS objects; also there is alarge overlap of sky coverage of the RGBsample with the SDSS spectroscopic survey. Secondly, the RGB’s high X-ray flux limit preferentially se-lects X-ray bright objects. This is essential for selectingFSRQs with “apparent” HBL-type spectral indices(Perlman et al. 1998; Padovani et al. 2003). Also, given its high thresholds in both the radio and X-raybands, any identification with LLAGNs would place the objects in the regime at the higher-end of the lu-minosity function of LLAGNs, which are otherwise difficult to find owing to their rarity. We describe theRGB–SDSS sample and optical data analysis in Section 2, and present the results in Section 3. The resultsare summarized and discussed in Section 4, with emphases given to LLAGNs and FSRQs with HBL-typespectral indices. Through out the paper, we use a cosmology with H 0=70 kms� 1 M pc
� 1, M =0.3, and� =0.7.
2 RGB-SDSS SAMPLE AND OPTICAL SPECTRAL ANALYSIS
2.1 RGB-SDSS sample
The RGB catalog (Brinkmann et al. 1995) was constructed by cross-correlating the ROSAT All-SkySurvey (RASS) with the radio catalog created from the 1987 Green Bank (GB) survey maps (Gregory& Condon 1991, Gregory et al. 1996). The radio catalog consists of sources of� 3� confidence with aflux limit ranging from 15 mJy to 24 mJy (at low declinations).The initial RGB sample is composed of2127 matches with an angular separation< 10000 between the X-ray and radio positions. Among them,617 sources had been previously optically identified as extragalactic objects using NED by Brinkmannet al. (1995). The sample sources were further observed withthe VLA to pin down their radio positions toan accuracy of� 0:500 (Laurent-Muehleisen et al. 1997). Using the accurate VLA radio positions, a refinedlarge sample of 1304 X-ray/radio sources from the RGB sample, mostly optically unidentified1, was pre-sented in Brinkmann et al. (1997). This sample forms the parent sample of this study. We cross-correlatedall the radio sources associated with the 1304 RGB X-ray sources in Brinkmann et al. (1997) with theSDSS DR5 spectroscopic databases of both galaxies and quasars. A matching criterion of 300 was used.This yielded 181 objects with SDSS spectra, 113 of which wereassigned as QSOs, 49 as galaxies and 19as unknownby the SDSS pipeline.
To estimate the radio spectral indices2 of the objects, we also searched for their emission at 1.4 GHzfrom the NVSS (NRAO VLA Sky Survey). A matching criterion of 30 in radius was used when cross-correlating the VLA and NVSS positions. Since the GB 5 GHz survey had a resolution (beam size,3.60� 3.40) larger than that of NVSS, for each match, we consider the following cases respectively to elim-inate inconsistency in the estimation of source fluxes caused by the effect of different angular resolutions.First, if the NVSS counterpart is the only radio source within 30 of the VLA position, the NVSS data issimply considered as its 1.4 GHz flux. This is the case for the vast majority of sample objects (86). Second,we consider the case where there are more NVSS sources than matching NVSS counterparts at the VLApositions within 30. If the summed flux of the former is significantly weaker than the latter, we used the total1.4 GHz radio flux within 30 to calculate the spectral index; otherwise, we consider that the object’s 5 GHzflux is significantly contaminated by nearby sources and subsequently no spectral index can be inferred. Asa result, we obtained the radio indices for 103 objects. Following the convention, flat- and steep-spectrumsources have�r � 0.5 and�r > 0.5, respectively. The sample is summarized in Table 1, withsome of theoptical and radio data. The redshifts are measured from our own spectral data analysis (see below).
1 In another identification attempt, Laurent-Muehleisen et al. (1998) spectroscopically observed and identified 169 objects withthe McDonald 2.7m and the Kitt Peak 2.1m telescopes.
2 We assume a power law formf� � ��� r .

4 De-Liang Wang, Jian-Guo Wang, Xiao-Bo Dong
Table 1 Source number of optical identification and classificationsfor the RGB-SDSS sample
classification number(1) (2)QSO(type I) 84Seyfert I 27NLSy1 2LINERs 12Seyfert II 2BL Lac 32BL Lac candidate 11Galaxy 11
2.2 Optical spectral analysis
SDSS spectra were taken through fibers with an aperture of 300 in diameter and have a wavelength coveragefrom 3800 to 9200A and a resolution of R� 1800–2200. For some objects, especially those assigned asgalaxies by the SDSS pipe-line, their spectra include significant amounts of (or even are dominated by)starlight from the host galaxies. Thus, the removal of the stellar spectrum is essential for the proper detectionand measurement of nuclear emission lines, especially whenthe lines, broad or narrow, are not strong. Thisis important for ensuring reliable spectral classificationof identified objects. We consider objects as havingnon-negligible star-light contribution if their spectra show (possible) absorption lines of Ca K (3934A), Ca K+ H� (3970A), or the high-order Balmer line H� (with detection significance> 2�). For proper modelingof host galaxy starlight, we used the algorithm developed atthe University of Science of Technology ofChina, which was described in detail in Zhou et al. (2006) (see also Lu et al. 2006) and is summarized inAppendixA. The modeled host galaxy stellar spectrum is thensubtracted from the SDSS spectrum.
For most of the RGB-SDSS objects, the SDSS spectra or the leftover spectra (modeled starlight spec-trum subtracted) show significant emission lines. The emission line spectra are fitted using an updatedversion of the code as described in Dong et al. (2005), with improvements made for optimized recoveryof weak emission lines. The method of the spectral fitting is also summarized in AppendixA. The Balmeremission lines are de-blended into a narrow and a broad component if the latter is present. If a broad linecomponent is detected at the� 5� confidence level, we regard it as genuine. As shown in Zhou et al. (2006),this analysis procedure yields reliable detection of emission lines and accurate measurements of the line pa-rameters. The derived parameters of the common emission lines are given in Table 3 and Table 4 for thenarrow- and broad-line components, respectively.
3 RESULTS OF OPTICAL IDENTIFICATION AND CLASSIFICATION
Thanks to the accurate astrometry of radio VLA positions andoptical SDSS positions, the optical identi-fications of the RGB-SDSS objects are unambiguous. Here, we present detailed spectral classification ofthe 181 RGB-SDSS objects (see table 1). The sample is first separated into two groups: (i) emission-lineobjects with at least a few common significantly detected emission lines (e.g.H �, H �, [O III], [N II], [SII]) detected significantly, with signal-to-noise ratio S/N > 3 and equivalent widthE W � 5A for at leastone emission line (127 sources); and (ii) objects with weak or no emission lines (54 sources) (see below fortheE W threshold distinguishing Seyfert galaxies and BL Lac objects).
3.1 Broad line AGNs
Of the 113 emission line objects with a significant broad component (see table 4), there are 91 that have abroad component of the Balmer lines detected at S/N> 5, and the others with Mg II broad emission lines. Bybroad component we mean that its line width is significantly broader than that of the corresponding narrowcomponent of the line, typically several hundred kilo-meters per second. The smallest width of the broadcomponent found in our sample is 1500km s� 1 , still much broader than the narrow lines. We collectivelyclassify these objects as broad line AGNs (BLAGNs), i.e. or type I AGN. They are further separated into

Optical identification of radio-loud AGNs in the RGB sample 5
Fig. 1 Examples of the rest frame spectra (black) of identified broad line (type I) AGNs fora quasar (upper panel) and a BLRG (lower panel, with nuclear–starlight decomposition per-formed). Also plotted are the best-fit model components: starlight (blue), nuclear power-law con-tinuum (grey) with the Fe II multiplets superimposed (cyan), the nuclear continuum plus starlight(yellow), residuals after subtraction of the nuclear continuum and starlight (green), broad (pur-ple) and narrow (red) emission line components.
quasars and Seyfert I galaxies, using the common absolute magnitude dividing line3 M B = � 22:27. Ofthe 84 objects qualifying quasar luminosity, all have radio-loudness R> 10 (defined as R=L5G H z=L
4400A,
Kellermann et al. 1989) and thus are radio-loud. The remaining 29 are Seyfert I galaxies, i.e. broad lineradio galaxies (BLRGs). As a demonstration, Fig. 1 shows examples of the spectra of a quasar and a BLRG,respectively.
We note that among these BLAGNs two have the FWHM ofH � or H � smaller than 2000km s� 1
, namely, J094857.31+002225.5, J164442.53+261913.2. Their SDSS spectra reveal relatively strong FeII multiplet and weak [O III] emission ([O III]/H � < 3), satisfying the conventional criteria of NLS1s(Osterbrock & Pogge 1985). It should be noted that NLS1 AGNs with strong radio emission are veryrare, and were found to be present in small numbers only recently (see e.g. Komossa et al. 2006; Whalen
3 We usedM B = � 21:5+ 5log(H 0=100)(Peterson 1997). The B-band magnitude was transformed fromthe Galactic extinctioncorrected SDSS psf magnitude in the u and g band following B=g+0.17(u-g)+0.11 (Jester 2005). The B-band absolute magnitude wascalculated asM B = B � 5logdL � 25 � K (z), wheredL is the luminosity distance andK (z) is the K-correction,K (z) =
2:5(�� � 1)log(1 + z)(Peterson 1997.)

6 De-Liang Wang, Jian-Guo Wang, Xiao-Bo Dong
et al. 2006; Yuan et al. 2008). In fact, J094857.31+002225.5and J164442.53+261913.2 were included inthe radio-loud NLS1 sample of Yuan et al. (2008). Very recently, the gamma-ray emission from relativisticjets in J094857.31+002225.5 (PMN J0948+0022) has been detected by Fermi/LAT (Abdo et al. 2009).
3.2 Narrow line radio galaxies
For the remaining 14 emission-lined objects, no significantbroad components of the lines can be detected.Traditionally, they were collectively referred to as NLRGsin previous works about their identification.Among them, nine have [O III] emission line equivalent widths smaller than 10A, and thus belong tothe class of so-called weak-line radio galaxies (WLRGs) as suggested by Tadhunter et al. (1998). In fact,galactic nuclei with narrow emission line spectra are of heterogeneous types, including Seyfert II nuclei,low-ionization nuclear emission regions (LINERs, Heckman1980), as well as star-forming galaxies. Thenature of LINER is still a matter of debate, though recent studies tend to support the idea that the energysource is predominately from accretion on to a central blackhole, as in normal AGNs (e.g. Ho et al. 1997).In this paper, we consider LINERs to be a subclass of AGNs, though they represent AGNs at a low level ofactivity.
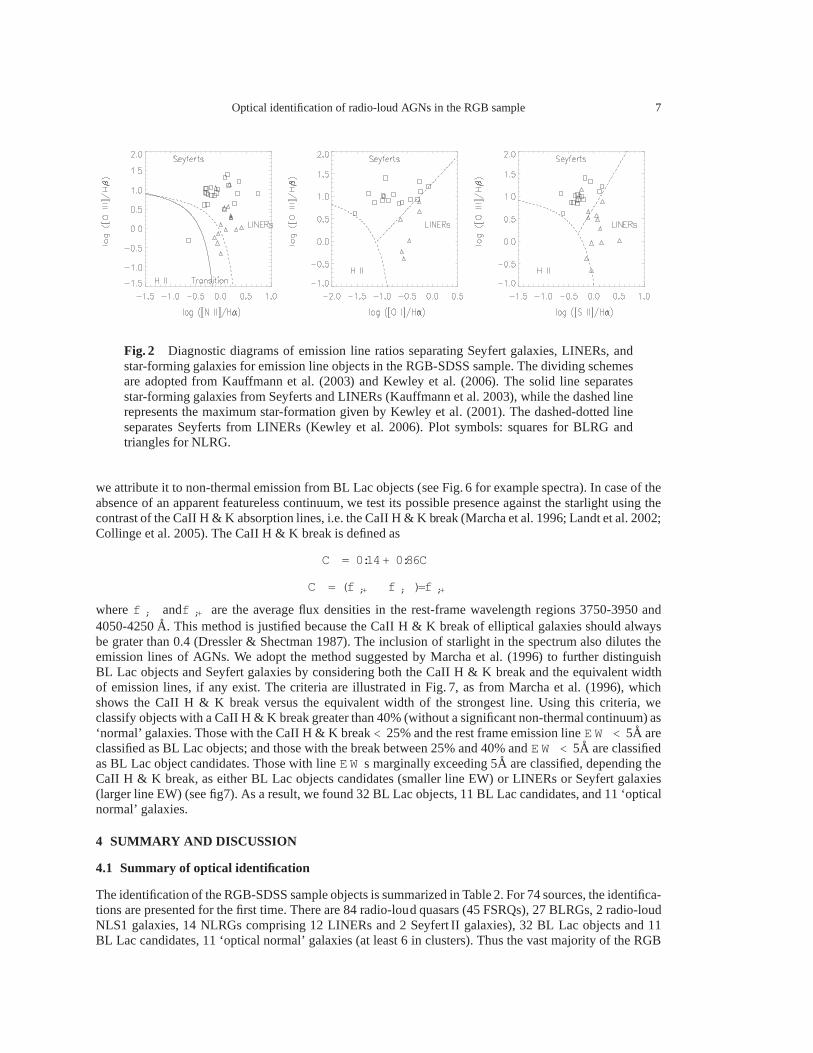
Further classification of the narrow emission line nuclei ofgalaxies can be carried out based on a setof emission line ratios, as suggested by Baldwin et al. (1981) and developed by a number of authors (e.g.Veilleux & Osterbrock 1987; Kewley et al. 2001; Kauffmann etal. 2003; Kewley et al. 2006). Here, we adoptthe most recent variant of this classification scheme as proposed by Kewley et al. (2006) and Kauffmannet al. (2003). In this scheme, AGNs (Seyferts and LINERs) arebest separated from star-forming galaxieson the [N II]/H � versus [O III]/H � diagnostic diagram. Seyferts and LINERs are further distinguishedusing the [O I]/H � and [S II]/H � ratios, as shown in Fig. 2. We found two Seyfert II and 12 typical LINERspectra(see Fig. 3 for example spectra). No star-forming galaxy is found, as expected for sources with strongX-ray and radio emission as studied here. All of the nine WLRGs are classified as LINERs. Moreover, wealso examined the LINER classification using the traditional criteria of [O II]�3727/[O III] �5007� 1 and[O I]�6300/[O III] �5007� 1=3of Heckman (1980), and found that these criteria were also met for most ofthe LINERs. It should be noted that a few of the LINERs identified here show somewhat higher ionizationatypical of LINERs. In fact, these objects are located very close to the border line separating LINERs andSeyferts in the diagnostic diagram of Kewley et al. (2006) and Kauffmann et al. (2003) and may havebeen classified as Seyferts if other classification criteriawere used, e.g. Veilleux & Osterbrock (1987),Heckman (1980) and Ho et al. (1997). Thus they are actually border-line objects between Seyferts andLINERs. We further point out that the LINER J151838.90+404500.2 was classified as Seyfert I galaxy byLaurent-Muehleisen et al. (1998); however, no significant broad component is found in its SDSS spectra.
We notice that the host galaxies of some sources identified with LINERs are associatedwith clusters of galaxies, as given by NED (Crawford et al. 1999; Koester et al. 2007);these are J111421.76+582319.8, J111908.94+090022.8, J113518.79+125311.1, J132419.67+041907.0,J153253.78+302059.3, J160239.61+264606.0 and J172010.03+263732.0. Their host galaxies are mostlikely giant ellipticals in the centers of the clusters. Forthese objects the X-ray fluxes are mostly the dif-fuse emission of the clusters. Three of the objects, namely,J111421.76+582319.8, J153253.78+302059.3and J172010.03+263732.0, were previously observed in optical by Crawford et al. (1999), and the SDSSspectra and the narrow line ratios are consistent with thosepresented in Crawford et al. (1999). Of particu-lar interest, J111421.76+582319.8 is in a merging system, with two nuclei separated by 2.300at nearly thesame redshift. Its SDSS image is shown in Fig. 4. Three of the classified LINERs (J113518.79+125311.1,J150324.77+475829.6 and J085004.65+403607.7) have the CaII H & K break values smaller than 0.40, in-dicating possible contribution of a non-thermal (BL Lac) component in their optical emission, as previouslyfound in J150324.77+475829.6 (Edge et al. 2003).
3.3 BL Lac objects and normal galaxies
The second group of objects, those without significant emission lines, broadly show two kinds of spectra:a nearly featureless continuum (see table 7 and see Fig. 5 forexample spectra) and a stellar spectrum withabsorption lines. In the case where a prominent featurelesscontinuum (unlike stellar spectrum) is present,
Optical identification of radio-loud AGNs in the RGB sample 7
Fig. 2 Diagnostic diagrams of emission line ratios separating Seyfert galaxies, LINERs, andstar-forming galaxies for emission line objects in the RGB-SDSS sample. The dividing schemesare adopted from Kauffmann et al. (2003) and Kewley et al. (2006). The solid line separatesstar-forming galaxies from Seyferts and LINERs (Kauffmannet al. 2003), while the dashed linerepresents the maximum star-formation given by Kewley et al. (2001). The dashed-dotted lineseparates Seyferts from LINERs (Kewley et al. 2006). Plot symbols: squares for BLRG andtriangles for NLRG.
we attribute it to non-thermal emission from BL Lac objects (see Fig. 6 for example spectra). In case of theabsence of an apparent featureless continuum, we test its possible presence against the starlight using thecontrast of the CaII H & K absorption lines, i.e. the CaII H & K break (Marcha et al. 1996; Landt et al. 2002;Collinge et al. 2005). The CaII H & K break is defined as
C� = 0:14+ 0:86C�
C� = (f�;+ � f�;� )=f�;+
wheref�;� andf�;+ are the average flux densities in the rest-frame wavelength regions 3750-3950 and4050-4250A. This method is justified because the CaII H & K break of elliptical galaxies should alwaysbe grater than 0.4 (Dressler & Shectman 1987). The inclusionof starlight in the spectrum also dilutes theemission lines of AGNs. We adopt the method suggested by Marcha et al. (1996) to further distinguishBL Lac objects and Seyfert galaxies by considering both the CaII H & K break and the equivalent widthof emission lines, if any exist. The criteria are illustrated in Fig. 7, as from Marcha et al. (1996), whichshows the CaII H & K break versus the equivalent width of the strongest line. Using this criteria, weclassify objects with a CaII H & K break greater than 40% (without a significant non-thermal continuum) as‘normal’ galaxies. Those with the CaII H & K break< 25% and the rest frame emission lineE W < 5A areclassified as BL Lac objects; and those with the break between25% and 40% andE W < 5A are classifiedas BL Lac object candidates. Those with lineE W s marginally exceeding 5A are classified, depending theCaII H & K break, as either BL Lac objects candidates (smallerline EW) or LINERs or Seyfert galaxies(larger line EW) (see fig7). As a result, we found 32 BL Lac objects, 11 BL Lac candidates, and 11 ‘opticalnormal’ galaxies.
4 SUMMARY AND DISCUSSION
4.1 Summary of optical identification
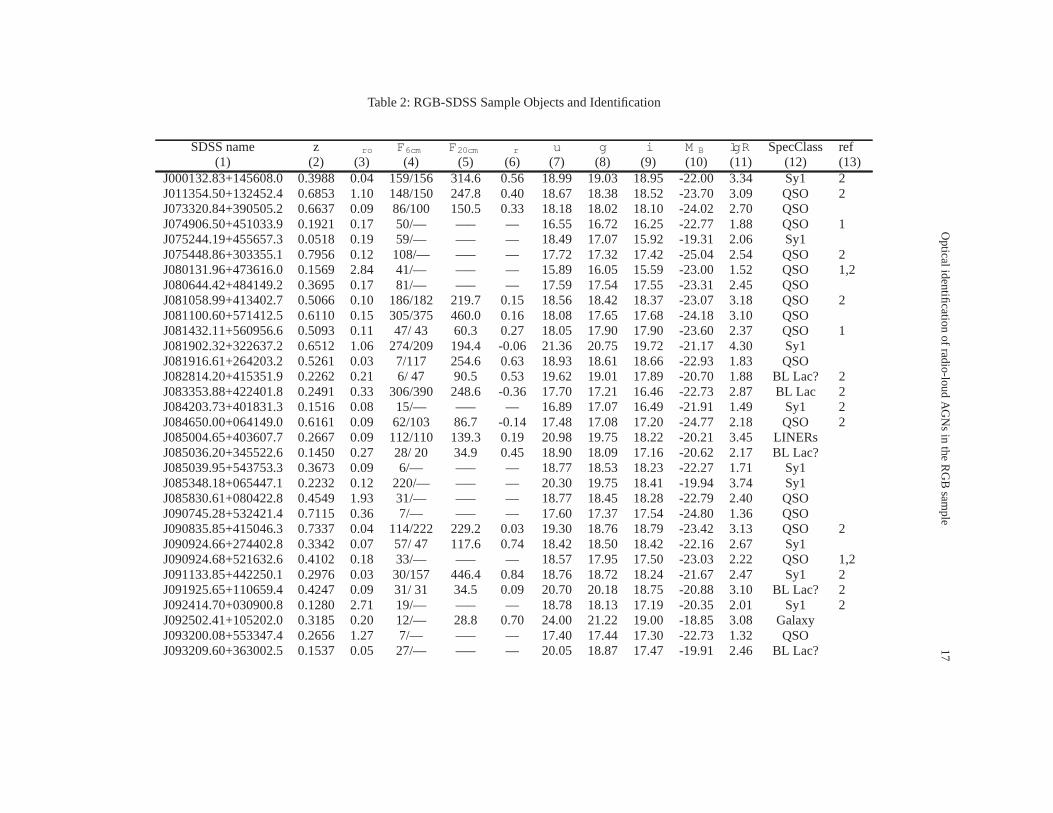
The identification of the RGB-SDSS sample objects is summarized in Table 2. For 74 sources, the identifica-tions are presented for the first time. There are 84 radio-loud quasars (45 FSRQs), 27 BLRGs, 2 radio-loudNLS1 galaxies, 14 NLRGs comprising 12 LINERs and 2 Seyfert IIgalaxies), 32 BL Lac objects and 11BL Lac candidates, 11 ‘optical normal’ galaxies (at least 6 in clusters). Thus the vast majority of the RGB

8 De-Liang Wang, Jian-Guo Wang, Xiao-Bo Dong
Fig. 3 Example spectra of identified narrow line AGNs in the rest frame for a Seyfert II galaxy(upper panel) and a LINER (lower panel). See Fig. 1 for the plot coding.
sources are identified with radio-loud AGNs, particularly blazars, confirming previous results. The advan-tage of our result is the refined spectroscopic classification based on emission line ratios for NLRGs. Mostof these NLRGs have weak emission lines (WLRGs) and have typical optical LINER spectra(12/14).
Of the RGB–SDSS sample, 36 sources have been previously identified by Laurent-Muehleisenet al. (1998) using 2-m class telescopes. Our results are in good agreement with theirs except for twoobjects (see Table 6). Furthermore, in the course of our work, Turriziani et al. (2007) published resultsof the identification of the ROXA sample, which was compiled from the RASS and the NVSS radio sur-vey, and also made use of SDSS spectroscopic data. We note that 80 objects in that sample are includedin our RGB–SDSS sample. For most of them (69 source), our classifications are consistent with those ofTurriziani et al. (2007), while this is not the case for the remaining sources (11) , as listed in Table 6. It

Optical identification of radio-loud AGNs in the RGB sample 9
Fig. 4 Optical SDSS image of the LINER SDSS J111421.76+582319.8 (marked by the cross)shows that it is in a merging system with one or more other galaxies/cores.
Fig. 5 Example SDSS spectrum of a BL Lac object with a featureless continuum.
should be pointed out that Turriziani et al. (2007) simply adopted the classification and spectral parame-ters given by the SDSS pipeline, which are coarse in general and even incorrect in some cases. We thusargue that our results are more accurate and reliable, especially for AGNs with weak emission lines or withnarrower broad-lines than usual.

10 De-Liang Wang, Jian-Guo Wang, Xiao-Bo Dong
Fig. 6 Example spectra of an identified weak-lined BL Lac object (upper panel) and a normalgalaxy (lower panel) in the rest frame. See Fig. 1 for plot coding.
4.2 Broad band SED
From the radio, optical, and X-ray data of the sample objects, we calculated their broadband effective spec-tral indices�ox , �ro and�rx between 5 GHz radio, 5000A optical, and 1 keV X-ray using the monochro-matic luminosities,
�ox = �log(L1keV =L
5000A)
log(�1keV =�5000A
)= � 0:384log(
L1keV
L5000A
)
�ro = �log(L
5000A=L5G H z)
log(�5000A
=�5G H z)= � 0:196log(
L5000A
L5G H z
)

Optical identification of radio-loud AGNs in the RGB sample 11
Fig. 7 The Ca H&K break contrast versus the EW of the strongest emission line for objectswithout significant emission lines in the RGB-SDSS sample. The EW distribution is only shownout to EW = 60A as in Marcha et al. (1996). The solid line represents the expected decrease forthe EW of an emission line in the presence of an increasing amount of continuum followingMarcha et al. (1996). The dotted line marks the Ca H&K break contrastC� = 0.40 and the shortdashed line marks EW = 5A. The area enclosed by the long dashed line corresponds to EW�5A and Ca H&K break contrast� 0.25, as used by Stocke et al. (1991) for the classificationof BL Lac. Plot symbols: triangles for BL Lacs, diamonds for BL Lac candidates, squares forLINERs, plus signs for Sy IIs, crosses for Sy Is, and asterisks for galaxies.
�rx = �log(L1keV =L5G H z)
log(�1keV =�5G H z)= � 0:130log(
L1keV
L5G H z
)
The choice of frequencies, as introduced in Ledden & Odell (1985), makes it easy to compare with theresults of Padovani et al. (2003). The optical monochromatic fluxes at 5000A in the rest frame were derivedfrom the Galactic extinction corrected SDSS PSF magnitude in the i-band using the extinction map ofSchlegel et al. (1998), assuming an optical spectral index�o=0.5 for the K-correction in the frequencydomain. The monochromatic X-ray fluxes were derived from theintegrated 0.1–2.4keV fluxes correctedfor Galactic absorption which are given in Brinkmann et al. (1997); for this, the X-ray spectral indices werealso taken from Brinkmann et al. (1997) if available (estimated from the hardness ratios) or assumed to be�x=1.2 otherwise. For the radio spectral indices, the estimated 1.4–5 GHz indices were used if available;otherwise a slope of0:5was assumed.
Figure 8 shows�ro versus�ox for the FSRQs and SSRQs, as well as BL Lac objects identified inthiswork. It can be seen that the distributions of the AGNs in the RGB–SDSS sample are very consistent withthose found in previous studies (e.g. Brinkmann et al. 1995,Padovani et al. 2003) on the�ro –�ox plane.The nominal dividing line between LBL (low-energy peaked BLLac objects) and HBL (dashed�rx=0.78)are indicated (solid lines), as well as the more strict locusfor HBL, following Padovani et al. (2003). Thefigure shows that while many of the blazars (FSRQs and BL Lac objects) follow the trend of LBL, there areindeed a number of objects falling within the locus of HBL, including some FSRQs. Therefore, our resultis consistent with that of Padovani et al. (2003) in the presence of FSRQs with the broad band two-pointspectral indices resembling those of HBL.
One would like to know if these unusual FSRQs differ from normal FSRQs in terms of any otherproperties. We examined the distributions of the central black hole mass (M B H ) and the luminosity of the

12 De-Liang Wang, Jian-Guo Wang, Xiao-Bo Dong
BLR (LB LR ). TheM B H are estimated using the width and luminosity of the broad H� or H� line, followingVestergaard & Peterson (2006); Greene & Ho (2007); and McGill et al. (2008), for FSRQs with measuredH� or H� lines. TheLB LR were calculated following the method suggested by Celotti et al. (1997)4. Thedistributions ofM B H andLB LR for both the HBL-like FSRQs and the classical FSRQs are shownin Fig. 9and Fig. 10, respectively. As can be seen, and also confirmed by the K-S (Kolmogorov-Smirnov) test, theM B H andLB LR distributions are indistinguishable for these two groups of FSRQs. We also compared thedistributions of the Eddington ratios5 Lbol=Ledd for the HBL-like FSRQs (median 0.105) and classicalFSRQs (median 0.029) and concluded that they are marginallyindistinguishable (with a probability levelof 0.03 by the K-S test) .
In light of the finding of Yuan et al. (2008) that a fraction of the very radio-loud NLS1 AGNs in theirsample has an HBL-like�ro–�ox distribution, it would be interesting to ask whether there is a link betweenNLS1s (or the narrowness of broad emission lines) and FSRQ with HBL-like SED. Figure 11 shows theline-width distribution of the broad lines (H�, H�) for the normal FSRQs including Seyferts (dashed line)and the 14 candidate HBL-like FSRQs (solid line). The medianline width of the HBL-like FSRQs is3699km s� 1, smaller than 6159km s� 1 for normal FSRQs and Seyferts. However, the sample size is toosmall to confirm the difference; the K-S test gives a probability level of 0.34. Thus, our sample is too smallto give a conclusive answer to this question.
However, it should be pointed out that whether or not the broad band spectral indices are good indicatorsof HBL-type blazars is still a matter of active debate (for a different view, see Maraschi et al. (2008)).Therefore, the determination of whether these objects are genuine HBL-type FSRQs has to await properestimation of the synchrotron peak frequency by obtaining the broad band SED data in the future.
4.3 LINERs in the RGB-SDSS sample
In previous identification work performed by Laurent-Muehleisen et al. (1998) and also by some others,objects without broad permitted emission lines were generally classified as NLRGs. Here, we are able tobreak this degeneracy and further classify them into Seyfert II nuclei and LINERs, based on their emissionline ratios. Of particular interest, our results show that the majority of the narrow emission-line galaxies areidentified with LINERs, and only a small fraction are identified with Seyfert II nuclei. Furthermore, all ofthose with weak emission lines (WLRGs) are in fact LINERs. This result is consistent with that of Lewis etal. (2003), who found that a large fraction (� 50% � 75% ) of WLRGs is in fact LINERs, whenever a highquality optical spectrum was obtained.
The nature of LINERs is not yet well understood, but recent studies tend to suggest that a significantfraction of them consists of low-luminosity AGNs (LLAGNs),i.e. powered by black hole accretion (e.g.see Ho (2008) for a recent review). The radio properties of LINERs have been studied extensively overthe years. It has been established that they often show radiocore emission (e.g. Heckman 1980; Nagar etal. 2005) or sometimes even sub-parsec-scale jets (e.g. Falcke et al. 2000; Nagar et al. 2005), mostly with flator event inverted spectra (e.g. Nagar et al. 2000; Falcke et al. 2000). A detection rate of compact radio coresas high as44% was found in LINERs, similar to that in Seyferts (Nagar et al.2005). Given that LINERS areradio emitters with flat spectra, the identification of some of the RGB sources with LINER is not surprising.However, for the majority of LINERs, the radio powers are generally quite modest—mostly in the range of
4 Following Celotti et al. (1997),
LB L R =
X
i
Li;obs
< L�B L R
>P
iL�i;ext
whereP
iLi;obs is the sum of the measured luminosities of the observed broadlines, scaled by the ratio of the estimated total
luminositiesL�B L R
to the estimated luminosities of the observed broad lines. Both estimates were taken from the quasar templatespectrum of Francis et al. (1991) andH � �6563 from Gaskell et al. (1981). From this approach,LB L R = 25:26LH � or LB L R =
16:35LM gII or LB L R = 7:22LH �
5 The bolometric luminositiesLbolwere calculated following the relationship of Richards et al. (2006) from the continuum lumi-nosity.
Lbol = 9:26L5100A
In order to eliminate the possible contamination of a non-thermal emission component from relativistic jets in FSRQs, we estimatedthe continuum luminosity from the emission line luminosityfollowing the relations in Greene & Ho (2005).

Optical identification of radio-loud AGNs in the RGB sample 13
Fig. 8 �ro versus�ox for the identified radio-loud quasars and BL Lac objects in the RGB-SDSSsample. The dashed line represents a constant�rx =0.78, which is commonlyused to divide BLLac objects into LBLs and HBLs.A more conservative, schematic locus for HBL is also indicatedfollowing Padovani et al. (2003) (solid line). Plot symbols: circles for FSRQs, squares for SSRQs,upside-down triangles for BL Lac candidates and triangles for BL Lac objects.
1019� 21 W Hz� 1 at 5 GHz for optically selected samples. The modest radio power is consistent with theirlow nuclear luminosities, in light of the suggested correlation between radio luminosity and emission lineluminosity (e.g. Nagar et al. 2005). In comparison, some of the LINERs identified in this work have veryhigh radio core luminosities,Lcore
5G H z=1023 � 1025 W Hz� 1 at 5 GHz (see Fig 12). They are of particular
interest as they are possibly among the strongest radio emitters of the LINER population. In fact, theseobjects are at the higher-end of the radio luminosity function either of E/S0 galaxies (Sadler et al. 1989)or of LLAGNs (Nagar et al. 2005), with both classes composed significantly of LINERs. We do not expecta significant relativistic beaming effect in these objects,since their radio core-dominance parameters arelow or modest, as given in Laurent-Muehleisen et al. (1998).Thus, the large radio luminosities should beintrinsic.
It has been suggested that the radio powerLrof LINERs is correlated with the emission line luminosity(e.g. Nagar et al. 2005). Indeed, the emission line luminosities (or the power of the NLR) of these LINERsare very high,LH �+ N II ranging from1040:7 to 1042:8 ergs� 1, on average� 2 orders of magnitude higherthan those of the LINERs in the Palomar nearby galaxy sample of Ho et al. (1995) which were detectedin radio by Nagar et al. (2005). We estimated their NLR luminosities following Celotti & Fabian (1993)6,which havelogLN LR (ergs� 1)=41.7–43.6, with a median of 42.2. Interestingly, these values fall in between(with considerable overlaps) those of high-power FRI/FRIIradio galaxies and normal low-power LLAGNs
6 LN L R = 3(3L[O II]3727 + 1:5L[O III]5007)

14 De-Liang Wang, Jian-Guo Wang, Xiao-Bo Dong
Fig. 9 Distribution of the black hole masses for normal FSRQs (dashed line) and those with thetwo-point spectral indices similar to that of HBL (solid line).
Fig. 10 Distribution of the luminosities of the broad line region for normal FSRQs (dashed line)and those with the two-point spectral indices similar to that of HBL (solid line)
as found in the Ho et al. (1995) sample and other optically selected LINER samples. Hence, they are theradio luminosities. This result is in line with the previousfinding that LINERs and low-luminosity Seyfertsfollow the same radio–NLR-luminosity relation as FR I and FRII radio galaxies (e.g. Nagar et al. 2005),which is shown in Fig. 13. It can be seen that our LINERs are located close to FR IIs, similar to the LINERsin non-elliptical host galaxies in the Palomar sample (see the left panel of their Fig. 3 in Nagar et al. (2005)).

Optical identification of radio-loud AGNs in the RGB sample 15
Fig. 11 Distribution of the broad line width (FWHM) for normal FSRQs(dashed line) and thosewith the two-point spectral indices similar to that of HBL (solid ).
Fig. 12 Distribution of the radio core luminosities for the LINERs identified in this work.
A more fundamental relationship is the dependence of the radio power on bothM B H and the Eddingtonratio, as suggested in e.g. Nagar et al. (2005). If this is thecase, we anticipate that our LINERs musthave the highest possible accretion rates for LINER and are harboring very massive central black holes.Among the 12 LINERs, 8 have reliable estimates of stellar velocity dispersion (��) from the central galac-tic stellar spectra within the 300 SDSS fibers, obtained via the nuclear-starlight decomposition algorithm(AppendixA). We estimated the central black hole mass usingthe well knownM B H –� relation (Tremaine

16 De-Liang Wang, Jian-Guo Wang, Xiao-Bo Dong
Fig. 13 Radio core luminosity versus narrow emission lineH �+[N II]��6548;6583luminosityfor the LINERs (triangles) and Seyfert II galaxies (crosses) identified in this work. Also, plottedare the linear fits of the same relationship for FR I(dashed line) and FR II (dot-dashed line) radiogalaxies from Zirbel & Baum (1995); see also Nagar et al. (2005)
et al. 2002), which ranges fromlog(M B H /M � )= 8.4 – 9.7 with a median of 9.3, as listed in Table 5. Indeed,our LINERs are among those galaxies harboring the most massive central black holes, since thisM B H
range is in the high-end of the Black Hole mass function of galaxies at low redshifts(z< 0.3) (McLure &Dunlop 2004, Greene & Ho 2007). Detailed investigation on the Eddington ratios, radio jet power, as wellas other multi-wavelength properties is beyond the scope ofthis paper and will be pursued in future work.
The finding of radio luminous LINERs in this work is not surprising, given the relatively high cutoffsin the radio/X-ray selection of the RGB sample. We also compared our results with previous work in theliterature. We calculated the radio luminosities of the WLRGs identified from the 2 Jy sample (Tadhunter etal. 1998) which were further classified as LINERs by Lewis et al. (2003), and found that they have the sameluminosity range as our LINERs. We therefore suggest that aneffective way of finding powerful LINERs isto search for the associated LINERs with strong radio sources.
ACKNOWLEDGMENTS
This work is supported by the Chinese Natural Science Foundation through project No. NSF10533050,and by the National Basic Research Program of China - 973 Program 2009CB824800. Funding for thecreation and the distribution of the SDSS Archive has been provided by the Alfred P. Sloan Foundation,the Participating Institutions, the National Aeronauticsand Space Administration, the National ScienceFoundation, the U.S. Department of Energy, the Japanese Monbukagakusho, and the Max Planck Society.The SDSS is managed by the Astrophysical Research Consortium (ARC) for the Participating Institutions.The Participating Institutions are the University of Chicago, Fermilab, the Institute for Advanced Study,the Japan Participation Group, the Johns Hopkins University, Los Alamos National Laboratory, theMax-Planck-Institute for Astronomy (MPIA), the Max-Planck-Institute for Astrophysics (MPA), NewMexico State University, Princeton University, the UnitedStates Naval Observatory, and the Universityof Washington. This research has made use of the NASA/IPAC Extragalactic Database (NED) which is op-erated by the Jet Propulsion Laboratory, California Institute of Technology, under contract with the NationalAeronautics and Space Administration.
Opticalidentification
ofradio-loudA
GN
sin
theR
GB
sample
17
Table 2: RGB-SDSS Sample Objects and Identification
SDSS name z � ro F6cm F20cm �r u g i M B lgR SpecClass ref(1) (2) (3) (4) (5) (6) (7) (8) (9) (10) (11) (12) (13)
J000132.83+145608.0 0.3988 0.04 159/156 314.6 0.56 18.99 19.03 18.95 -22.00 3.34 Sy1 2J011354.50+132452.4 0.6853 1.10 148/150 247.8 0.40 18.67 18.38 18.52 -23.70 3.09 QSO 2J073320.84+390505.2 0.6637 0.09 86/100 150.5 0.33 18.18 18.02 18.10 -24.02 2.70 QSOJ074906.50+451033.9 0.1921 0.17 50/— —– — 16.55 16.72 16.25-22.77 1.88 QSO 1J075244.19+455657.3 0.0518 0.19 59/— —– — 18.49 17.07 15.92-19.31 2.06 Sy1J075448.86+303355.1 0.7956 0.12 108/— —– — 17.72 17.32 17.42 -25.04 2.54 QSO 2J080131.96+473616.0 0.1569 2.84 41/— —– — 15.89 16.05 15.59-23.00 1.52 QSO 1,2J080644.42+484149.2 0.3695 0.17 81/— —– — 17.59 17.54 17.55-23.31 2.45 QSOJ081058.99+413402.7 0.5066 0.10 186/182 219.7 0.15 18.56 18.42 18.37 -23.07 3.18 QSO 2J081100.60+571412.5 0.6110 0.15 305/375 460.0 0.16 18.08 17.65 17.68 -24.18 3.10 QSOJ081432.11+560956.6 0.5093 0.11 47/ 43 60.3 0.27 18.05 17.90 17.90 -23.60 2.37 QSO 1J081902.32+322637.2 0.6512 1.06 274/209 194.4 -0.06 21.3620.75 19.72 -21.17 4.30 Sy1J081916.61+264203.2 0.5261 0.03 7/117 254.6 0.63 18.93 18.61 18.66 -22.93 1.83 QSOJ082814.20+415351.9 0.2262 0.21 6/ 47 90.5 0.53 19.62 19.0117.89 -20.70 1.88 BL Lac? 2J083353.88+422401.8 0.2491 0.33 306/390 248.6 -0.36 17.7017.21 16.46 -22.73 2.87 BL Lac 2J084203.73+401831.3 0.1516 0.08 15/— —– — 16.89 17.07 16.49-21.91 1.49 Sy1 2J084650.00+064149.0 0.6161 0.09 62/103 86.7 -0.14 17.48 17.08 17.20 -24.77 2.18 QSO 2J085004.65+403607.7 0.2667 0.09 112/110 139.3 0.19 20.98 19.75 18.22 -20.21 3.45 LINERsJ085036.20+345522.6 0.1450 0.27 28/ 20 34.9 0.45 18.90 18.09 17.16 -20.62 2.17 BL Lac?J085039.95+543753.3 0.3673 0.09 6/— —– — 18.77 18.53 18.23 -22.27 1.71 Sy1J085348.18+065447.1 0.2232 0.12 220/— —– — 20.30 19.75 18.41 -19.94 3.74 Sy1J085830.61+080422.8 0.4549 1.93 31/— —– — 18.77 18.45 18.28-22.79 2.40 QSOJ090745.28+532421.4 0.7115 0.36 7/— —– — 17.60 17.37 17.54 -24.80 1.36 QSOJ090835.85+415046.3 0.7337 0.04 114/222 229.2 0.03 19.30 18.76 18.79 -23.42 3.13 QSO 2J090924.66+274402.8 0.3342 0.07 57/ 47 117.6 0.74 18.42 18.50 18.42 -22.16 2.67 Sy1J090924.68+521632.6 0.4102 0.18 33/— —– — 18.57 17.95 17.50-23.03 2.22 QSO 1,2J091133.85+442250.1 0.2976 0.03 30/157 446.4 0.84 18.76 18.72 18.24 -21.67 2.47 Sy1 2J091925.65+110659.4 0.4247 0.09 31/ 31 34.5 0.09 20.70 20.18 18.75 -20.88 3.10 BL Lac? 2J092414.70+030900.8 0.1280 2.71 19/— —– — 18.78 18.13 17.19-20.35 2.01 Sy1 2J092502.41+105202.0 0.3185 0.20 12/— 28.8 0.70 24.00 21.2219.00 -18.85 3.08 GalaxyJ093200.08+553347.4 0.2656 1.27 7/— —– — 17.40 17.44 17.30 -22.73 1.32 QSOJ093209.60+363002.5 0.1537 0.05 27/— —– — 20.05 18.87 17.47-19.91 2.46 BL Lac?

18D
e-Liang
Wang,Jian-G
uoW
ang,Xiao-B
oD
ongSDSS name z � ro F6cm F20cm �r u g i M B lgR SpecClass ref
(1) (2) (3) (4) (5) (6) (7) (8) (9) (10) (11) (12) (13)J093430.68+030545.3 0.2252 0.07 83/119 310.3 0.77 21.23 19.78 18.09 -19.77 3.33 LINERsJ093712.33+500852.1 0.2756 0.19 212/315 170.8 -0.49 19.6519.10 18.07 -21.04 3.47 Sy1 2J094857.31+002225.5 0.5846 0.19 127/— —– — 18.60 18.36 18.12 -23.41 3.00 NLSy1 2J095855.10+423704.0 0.6641 1.88 23/ 60 98.0 0.39 19.09 18.77 18.93 -23.25 2.43 QSOJ101244.30+422957.0 0.3651 0.13 28/— —– — 18.89 18.57 17.91-22.21 2.39 BL Lac 1,2J101258.34+393238.8 0.1709 0.04 18/— —– — 19.95 19.03 17.86-20.02 2.35 BL Lac? 2J101447.77+442133.3 0.7955 0.09 5/ 22 67.9 0.91 19.31 18.8718.96 -23.48 1.83 QSO 2J102044.32+492046.2 0.3899 0.14 8/— —– — 18.53 18.55 18.45 -22.43 1.85 QSOJ102106.04+452331.8 0.3642 0.61 22/ 82 127.2 0.35 18.23 18.19 18.35 -22.63 2.14 QSO 1,2J102235.57+454105.4 0.7434 0.05 12/ 59 145.6 0.73 21.06 20.81 19.96 -21.44 2.98 Sy1J102237.44+393150.1 0.6036 0.90 40/— —– — 17.68 17.32 17.01-24.49 2.09 QSO 2J102504.20+414332.6 0.6818 0.04 6/ 20 8.9 -0.65 18.99 18.4318.60 -23.59 1.72 QSO 2J102523.04+040229.0 0.2077 0.10 31/— —– — 19.54 19.01 18.09-20.53 2.59 BL Lac? 2J102738.53+605016.5 0.3320 0.07 8/— —– — 17.76 17.57 17.32 -23.03 1.44 QSOJ103024.95+551622.7 0.4346 0.11 6/ 80 156.1 0.54 17.18 16.94 16.68 -24.22 1.09 QSOJ103144.75+602030.4 1.2296 0.89 231/253 320.8 0.19 18.22 18.17 17.89 -25.06 3.26 QSO 2J103214.53+635950.3 0.5564 0.16 17/ 31 34.3 0.08 18.80 18.48 18.57 -23.17 2.17 QSOJ103854.49+513937.4 0.4701 0.07 21/ 22 7.8 -0.83 23.36 22.55 20.01 -18.68 3.88 GalaxyJ104149.15+390119.5 0.2084 0.10 23/ 19 33.4 0.45 20.01 19.24 17.97 -20.27 2.55 BL Lac?J104334.81+343232.5 0.7330 0.18 49/ 42 113.5 0.80 20.92 20.18 20.23 -21.96 3.33 Sy1J104410.67+532220.5 1.9033 0.10 307/437 493.0 0.10 19.41 19.38 19.11 -24.59 3.92 QSO 2J105431.89+385521.6 1.3664 1.89 47/ 56 61.2 0.07 17.24 17.15 17.17 -26.26 2.17 QSOJ105837.73+562811.1 0.1433 0.11 177/247 228.0 -0.06 16.8416.42 15.95 -22.34 2.30 BL Lac 1,2J110409.63+122157.5 0.5908 0.15 33/— —– — 17.78 17.30 17.48-24.45 1.99 QSOJ111421.76+582319.8 0.2057 0.09 2/— 65.7 2.81 22.01 20.38 18.60 -18.95 1.95 LINERs 3J111908.94+090022.8 0.3316 0.30 13/— 22.3 0.43 23.13 21.0919.09 -19.19 3.07 LINERs 2J113251.05+631144.0 0.1114 0.26 7/— —– — 20.50 18.42 16.98 -19.51 1.69 GalaxyJ113255.96+051539.6 0.1009 0.06 78/— —– — 20.04 18.35 17.10-19.43 2.70 LINERsJ113518.79+125311.1 0.2040 0.13 64/ 57 143.9 0.75 20.20 19.30 18.01 -20.14 3.02 LINERs 2J114510.39+011056.2 0.6260 0.02 15/— 41.9 0.83 19.29 18.9818.98 -22.92 2.32 QSO 2J114803.17+565411.4 0.4511 0.04 25/ 51 65.9 0.21 17.93 17.70 17.75 -23.54 2.01 QSO 2J115227.48+320959.4 0.3746 0.46 45/— —– — 19.22 19.08 18.55-21.78 2.81 Sy1J115232.86+493938.7 1.0930 0.07 215/167 110.3 -0.33 17.3617.17 16.91 -25.82 2.81 QSO 2J115323.95+583138.4 0.2024 0.29 105/— —– — 20.04 19.64 18.17 -19.87 3.37 Sy1 2J115326.70+361726.3 1.3574 0.09 49/ 60 60.5 0.01 17.35 17.23 17.10 -26.16 2.22 QSO

Opticalidentification
ofradio-loudA
GN
sin
theR
GB
sample
19
SDSS name z � ro F6cm F20cm �r u g i M B lgR SpecClass ref(1) (2) (3) (4) (5) (6) (7) (8) (9) (10) (11) (12) (13)
J115409.28+023815.1 0.2105 0.26 59/ 87 115.2 0.23 20.81 19.67 18.13 -19.80 3.13 Sy1 2J115700.59+324457.8 0.4862 0.12 86/ 82 159.9 0.54 18.54 18.33 18.39 -23.07 2.80 QSOJ115727.60+431806.3 0.2300 0.16 93/106 256.0 0.71 18.34 18.30 17.55 -21.54 2.79 Sy1J120303.50+603119.1 0.0653 0.16 145/182 190.3 0.04 17.62 16.89 15.98 -20.11 2.38 BL Lac 2J120335.39+451049.5 1.0760 0.16 50/ 43 38.5 -0.09 17.89 17.65 17.38 -25.30 2.37 QSO 1,2J120436.17+485653.9 0.4509 2.10 39/— —– — 17.83 17.72 17.83-23.54 2.21 QSO 2J120837.11+612106.4 0.2748 0.14 56/118 180.3 0.34 19.50 18.86 17.65 -21.26 2.80 BL LacJ121509.95+462715.1 0.7201 1.58 178/168 271.5 0.39 17.69 17.34 17.58 -24.83 2.76 QSOJ122313.21+540906.5 0.1558 0.14 41/140 387.6 0.82 17.51 17.34 16.68 -21.64 2.03 Sy1 1,2J122353.05+465048.8 0.2606 0.10 9/— 12.8 0.28 20.43 19.57 18.20 -20.40 2.29 BL Lac? 2J122424.23+401510.5 0.4169 0.08 29/— —– — 18.05 17.89 18.02-23.20 2.15 QSOJ122506.50+483435.1 0.6467 1.17 19/ 38 76.1 0.56 19.72 19.25 19.31 -22.68 2.54 QSO 2J122751.22+632305.3 0.1455 0.00 5/ 71 242.0 0.99 21.03 18.98 17.51 -19.54 1.77 GalaxyJ123157.08+542028.7 0.5158 0.26 13/ 26 61.0 0.69 19.35 19.10 19.03 -22.41 2.30 QSO 2J123807.76+532556.0 0.7640 0.10 37/ 56 114.6 0.58 17.36 17.32 17.36 -25.02 2.07 QSO 2J123819.62+412420.5 0.4980 0.04 9/— —– — 18.59 18.29 18.33 -23.14 1.81 QSOJ124139.72+493405.5 0.4737 0.07 6/ 40 140.2 1.01 17.72 17.38 17.36 -23.94 1.27 QSOJ124834.30+512807.8 0.3509 0.15 55/ 88 114.1 0.21 18.65 18.19 17.39 -22.48 2.53 BL Lac 1,2,cJ125223.78+645137.9 0.3120 0.21 20/ 25 42.3 0.42 18.01 18.24 18.21 -22.30 2.11 QSOJ125303.17+450044.8 0.0777 0.25 11/— —– — 19.87 18.12 16.68-19.09 1.76 GalaxyJ125326.15+505428.3 0.1217 0.11 4/— —– — 20.78 18.81 17.48 -19.33 1.60 Galaxy 1J130612.15+514407.0 0.2773 0.07 15/— —– — 22.83 20.62 18.68-19.25 2.93 GalaxyJ131211.14+480925.3 0.7151 0.15 58/— —– — 17.50 17.12 17.28-25.03 2.18 QSO 2J131931.73+140533.1 0.5729 0.14 52/ 57 76.2 0.23 18.14 17.93 17.40 -23.81 2.44 BL LacJ132419.67+041907.0 0.2631 0.22 13/ 46 161.7 1.01 22.49 20.62 18.94 -19.20 2.86 LINERs 2J132631.44+473755.8 0.6821 0.02 12/— —– — 19.00 18.60 18.65-23.45 2.08 QSOJ133245.24+472222.6 0.6693 0.12 302/333 233.2 -0.29 18.0917.66 17.10 -24.35 3.11 QSO 2J133437.49+563147.9 0.3428 1.21 36/107 185.5 0.44 18.35 18.40 18.50 -22.31 2.43 QSO 1,2J133655.51+654116.0 0.4375 0.50 6/ 69 206.4 0.88 18.60 18.35 18.17 -22.82 1.65 QSO 1,2J134136.23+551437.9 0.2069 0.13 30/ 34 37.1 0.07 19.35 18.79 17.83 -20.74 2.49 BL Lac 2J134545.35+533252.2 0.1353 0.31 70/223 429.8 0.53 18.35 18.08 17.09 -20.58 2.56 Sy1 2J134617.54+622045.4 0.1164 0.30 7/— —– — 17.15 17.08 16.27 -21.29 1.15 Sy1 1,2J134751.58+283629.7 0.7399 1.27 41/ 92 290.0 0.92 17.95 17.44 17.54 -24.75 2.16 QSOJ135229.02+490823.0 0.3966 0.20 61/124 70.4 -0.46 19.17 19.11 19.01 -21.88 2.96 Sy1J135305.54+044338.6 0.5234 0.81 58/ 95 154.5 0.39 17.99 17.75 17.91 -23.79 2.41 QSO 2

20D
e-Liang
Wang,Jian-G
uoW
ang,Xiao-B
oD
ongSDSS name z � ro F6cm F20cm �r u g i M B lgR SpecClass ref
(1) (2) (3) (4) (5) (6) (7) (8) (9) (10) (11) (12) (13)J135341.72+431052.5 1.1140 0.16 15/— —– — 17.44 17.24 17.10-25.79 1.69 QSO 1,2J141149.43+524900.1 0.0765 0.25 96/354 846.8 0.70 18.58 17.33 16.14 -19.93 2.38 Galaxy 2J141159.73+423950.3 0.8861 0.13 46/— —– — 17.19 17.02 17.00-25.58 2.06 QSO 1,2J141446.64+392818.6 0.6573 0.14 11/— —– — 19.91 19.46 19.41-22.51 2.39 QSO 2J141628.66+124213.5 0.3346 0.05 75/ 98 110.2 0.09 17.41 17.44 17.65 -23.21 2.37 QSO 2J141740.44+381821.1 0.4495 0.06 173/ 95 111.3 0.13 18.45 18.32 18.31 -22.93 3.10 QSO 2J142020.67+462440.8 1.2445 0.17 30/ 34 46.3 0.25 19.61 19.77 19.23 -23.52 3.01 QSO 2J142106.03+385522.7 0.4888 0.30 97/103 85.7 -0.15 18.89 18.59 18.45 -22.80 2.96 QSO 2J142314.19+505537.3 0.2759 2.61 125/— —– — 17.75 17.93 17.71 -22.34 2.77 QSO 2J142421.17+370552.8 0.2896 1.79 11/ 29 78.6 0.80 20.41 19.65 18.20 -20.56 2.41 BL Lac? 2J142606.19+402432.0 0.6639 0.29 18/— —– — 20.41 19.91 19.63-22.08 2.78 Sy1J142730.27+540923.7 0.1060 0.80 23/ 26 44.0 0.42 19.76 18.46 17.15 -19.49 2.22 Galaxy 1J143726.14+504555.8 0.7835 0.56 6/— —– — 17.86 17.53 17.57 -24.81 1.37 QSO 1J143942.83+582759.2 0.4249 0.02 13/ 45 46.3 0.02 18.02 17.91 18.09 -23.22 1.81 QSO 1,2J144542.78+390921.4 0.1625 0.81 7/— —– — 22.19 20.64 19.29 -18.20 2.59 Sy2J145224.68+452223.6 0.4676 2.10 123/— —– — 16.97 16.80 16.87 -24.52 2.35 QSOJ145247.37+473529.1 1.1576 0.04 14/— —– — 18.94 18.85 18.64-24.26 2.31 QSOJ145958.43+333701.8 0.6449 0.15 103/ 48 15.3 -0.92 16.88 16.62 16.77 -25.35 2.22 QSO 1,2J150117.97+545518.2 0.3386 0.15 18/— —– — 20.56 19.92 18.15-20.64 2.74 Sy2 2J150324.77+475829.6 0.3445 0.08 9/ 56 111.2 0.55 18.39 18.00 17.30 -22.65 1.67 LINERsJ150455.56+564920.2 0.3590 1.39 5/— —– — 17.06 17.00 17.09 -23.79 1.02 QSO 1J151017.82+422155.0 0.4876 0.04 19/111 262.5 0.69 21.60 21.20 19.85 -20.17 3.30 Sy1 2J151830.93+483214.4 0.5757 0.16 4/— —– — 18.66 18.27 18.32 -23.44 1.46 QSO 1J151838.90+404500.2 0.0652 0.07 25/— —– — 19.28 17.63 16.56-19.21 1.91 LINERs 1J151844.76+461855.1 0.8852 0.13 35/163 436.0 0.79 20.20 19.91 19.80 -22.67 3.10 QSOJ151913.35+362343.4 0.2857 0.11 59/— —– — 19.49 19.51 18.79-20.81 3.08 Sy1J152556.22+591659.5 0.9551 0.08 7/— —– — 18.51 18.33 18.21 -24.42 1.77 QSOJ153102.48+435637.6 0.4520 0.10 18/— —– — 17.31 17.13 16.91-24.12 1.64 QSO 1,2J153253.78+302059.3 0.3622 0.14 8/— —– — 20.65 20.00 19.15 -20.71 2.42 LINERs 2,3J153447.20+371554.5 0.1428 0.86 18/ 24 22.0 -0.07 18.28 17.77 17.00 -20.97 1.84 BL Lac 2J154232.03+493842.5 0.5897 0.12 24/ 34 53.8 0.37 19.58 19.16 19.26 -22.60 2.60 QSO 2J154535.56+532421.1 0.2082 0.10 4/ 49 216.8 1.20 22.06 19.89 18.11 -19.38 2.05 GalaxyJ160051.34+331205.9 0.2835 0.69 4/ 32 108.4 0.98 24.12 20.92 18.87 -18.83 2.48 GalaxyJ160239.61+264606.0 0.3716 0.19 98/— —– — 22.35 21.29 19.82-19.40 4.03 LINERsJ160317.91+090037.9 0.4884 2.93 6/ 99 203.7 0.58 18.35 17.98 17.98 -23.40 1.51 QSO

Opticalidentification
ofradio-loudA
GN
sin
theR
GB
sample
21
SDSS name z � ro F6cm F20cm �r u g i M B lgR SpecClass ref(1) (2) (3) (4) (5) (6) (7) (8) (9) (10) (11) (12) (13)
J160658.30+271705.5 0.9335 0.17 143/228 178.0 -0.20 19.2318.88 18.79 -23.79 3.30 QSOJ160813.79+292126.3 1.2006 1.08 12/— 38.9 0.95 18.87 19.0818.67 -24.16 2.33 QSOJ160822.16+401217.9 0.6282 0.12 121/240 200.9 -0.14 21.0920.68 19.89 -21.21 3.91 Sy1 2J161706.32+410647.0 0.2667 0.03 81/124 95.1 -0.21 19.03 18.48 17.57 -21.59 2.81 BL LacJ161826.93+081950.7 0.4459 0.33 150/119 130.7 0.08 17.30 17.02 16.78 -24.19 2.52 QSOJ161902.49+303051.5 1.2878 0.21 37/— —– — 16.95 16.84 16.52-26.46 1.94 QSO 1,2J162111.27+374604.9 1.2734 0.09 154/201 631.0 0.92 21.22 19.85 18.27 -23.22 3.76 QSO 2J162229.31+400643.5 0.6877 1.15 27/ 58 36.9 -0.36 18.81 18.48 18.63 -23.60 2.39 QSO 1,2J162358.25+074130.5 1.2970 0.55 170/149 100.1 -0.32 17.8918.01 17.59 -25.35 3.07 QSOJ162711.89+314359.3 0.7324 0.33 36/ 76 127.9 0.42 20.92 20.34 20.10 -21.83 3.26 Sy1J163624.31+471535.9 0.8232 0.08 5/— 19.1 1.08 19.12 18.79 18.93 -23.64 1.80 QSOJ163726.66+454748.9 0.1922 0.12 11/ 20 45.3 0.66 19.78 19.01 17.83 -20.32 2.14 BL Lac?J163856.53+433512.5 0.3392 1.21 5/ 50 191.8 1.08 18.48 18.45 18.27 -22.22 1.60 Sy1 2J164054.16+314329.9 0.9571 0.87 27/ 41 60.2 0.31 20.39 20.03 19.93 -22.68 3.04 QSOJ164442.53+261913.2 0.1442 0.13 92/ 99 131.6 0.23 18.03 18.02 17.43 -20.82 2.66 NLSy1 2J165005.47+414032.4 0.5850 0.38 100/136 232.0 0.43 17.88 17.55 17.52 -24.20 2.57 QSO 2J170112.38+353353.4 0.5013 0.08 130/ 50 70.7 0.28 18.55 18.33 18.39 -23.13 2.99 QSO 2J170123.97+385136.9 1.1132 0.13 49/ 61 198.5 0.95 18.84 18.95 18.66 -24.13 2.89 QSO 2J171322.58+325627.9 0.1014 0.22 25/— —– — 18.00 17.77 16.91-20.27 1.98 Sy1 1J172010.03+263732.0 0.1592 0.14 7/— —– — 20.78 19.32 18.11 -19.49 2.06 LINERs 3J172242.16+281500.0 0.9468 0.12 150/224 249.4 0.09 18.20 18.03 18.01 -24.70 2.98 QSO 1,2J205456.85+001537.7 0.1508 0.32 38/ 65 56.5 -0.11 19.07 18.45 17.52 -20.38 2.44 BL Lac? 2

22D
e-Liang
Wang,Jian-G
uoW
ang,Xiao-B
oD
ongNotes: (1): SDSS name — Jhhmmss.s+ddmmss.s
(2): z — redshift(3): � ro — the distance between the position of radio and optical inunits of arcsec(4): F6cm — flux of 4.85GHz core and total in units of mJy(5): F20cm — flux of NVSS 1.40GHz in units of mJy(6): �r — radio spectral index between 4.85GHz and 1.40GHz
�r = �log(F4:85G H z=F1:4G H z)
log(�4:85G H z=�1:4G H z)
(7): u — Galactic extinction corrected psf magnitude of SDSS u band(8): g— Galactic extinction corrected psf magnitude of SDSS g band(9): i— Galactic extinction corrected psf magnitude of SDSS i band(10):M B — Galactic extinction corrected B band absolute magnitude(11):lgR — log radio loudness, radio loudness follow 1989(12): SpecClass — SDSS spectral class(13): ref — reference about source spectral identificationNo reference suggests that it is firstly identified by our work.1:Laurent-Muehleisen et al. 19982:Turriziani et al. 20073:Crawford et al. 1999

Optical identification of radio-loud AGNs in the RGB sample 23
Table 3: SDSS Narrow Emission Line Parameters
SDSS name F(H �) F([OIII] F(H �) F([NII]) F([SII]) F([OI]) F([OII]) SpecClass�4861 �5007 �6563 �6583 �6716/�6731 �6300 �3727
(1) (2) (3) (4) (5) (6) (7) (8) (9)J074906.50+451033.9 308 3557 1600 1026 213/ 143 86 562 Sy1J075244.19+455657.3 54 899 282 643 205/ 202 233 362 Sy1J080131.96+473616.0 163 1292 228 1251 120/ 0 31 0 Sy1J084203.73+401831.3 75 595 222 115 44/ 57 23 29 Sy1J085004.65+403607.7 14 64 66 124 26/ 25 37 50 LINERJ085348.18+065447.1 17 354 88 108 38/ 38 49 82 Sy1J091133.85+442250.1 78 325 421 229 46/ 18 7 102 Sy1J092414.70+030900.8 87 624 420 315 76/ 72 104 147 Sy1J093200.08+553347.4 99 399 439 206 55/ 51 13 44 Sy1J093430.68+030545.3 35 108 180 213 97/ 112 42 195 LINERJ111421.76+582319.8 25 23 93 117 48/ 35 30 104 LINERJ111908.94+090022.8 9 17 47 75 16/ 0 9 20 LINERJ113255.96+051539.6 33 261 71 154 49/ 58 39 100 LINERJ113518.79+125311.1 22 43 66 106 48/ 40 24 95 LINERJ115323.95+583138.4 75 630 203 99 51/ 50 101 168 Sy1J115409.28+023815.1 19 155 91 73 29/ 28 33 130 Sy1J115727.60+431806.3 134 1417 402 207 88/ 79 41 287 Sy1J122313.21+540906.5 352 2595 1490 822 319/ 266 106 782 Sy1J132419.67+041907.0 32 7 99 99 49/ 39 15 99 LINERJ133437.49+563147.9 12 316 67 90 23/ 21 8 48 Sy1J134545.35+533252.2 27 342 90 130 61/ 55 52 87 Sy1J134617.54+622045.4 121 1332 426 213 106/ 93 72 583 Sy1J144542.78+390921.4 13 146 83 66 25/ 18 10 31 Sy2J150117.97+545518.2 56 779 218 326 55/ 67 45 173 Sy2J150324.77+475829.6 54 180 140 162 40/ 68 12 0 LINERJ151838.90+404500.2 50 185 252 352 156/ 130 71 292 LINERJ151913.35+362343.4 43 300 159 104 34/ 40 34 111 Sy1J153253.78+302059.3 248 145 880 653 0/ 0 216 855 LINERJ160239.61+264606.0 57 119 277 439 0/ 0 91 273 LINERJ164442.53+261913.2 331 164 1065 242 0/ 13 0 31 Sy1J171322.58+325627.9 107 1069 521 460 161/ 134 57 261 Sy1J172010.03+263732.0 91 38 324 281 128/ 102 87 272 LINER
Notes: (1): SDSS name — Jhhmmss.s+ddmmss.s(2)-(8):Narrow emission line flux in units of10�17 ergs�1 cm �2
(9): SpecClass — SDSS spectral class
Table 4: SDSS Broad Emission Line Parameters
SDSS name z line flux FWHM lgLB L R lgM B H SpecClass(1) (2) (3) (4) (5) (6) (7) (8)
J000132.83+145608.0 0.3989H � 535 3175 43.88 8.0 Sy1J011354.50+132452.4 0.6854H � 563 3699 44.47 8.5 QSOJ073320.84+390505.2 0.6638H � 496 3471 44.38 7.5 QSOJ074906.50+451033.9 0.1922H � 5462 3779 43.62 8.3 QSO
H � 7535 4840 44.30 8.6J075244.19+455657.3 0.0518H � 4058 3067 42.27 7.5 Sy1

24 De-Liang Wang, Jian-Guo Wang, Xiao-Bo Dong
SDSS name z line flux FWHM lgLB L R lgM B H SpecClass(1) (2) (3) (4) (5) (6) (7) (8)
J075448.86+303355.1 0.7955H � 1798 8502 45.13 8.6 QSOJ080131.96+473616.0 0.1569H � 11568 7287 44.29 9.0 QSO
H � 9426 6319 43.66 8.7J080644.42+484149.2 0.3700H � 1076 14698 44.11 9.5 QSOJ081058.99+413402.7 0.5067H � 842 3483 44.32 8.3 QSOJ081100.60+571412.5 0.6110H � 2226 4568 44.94 8.0 QSOJ081432.11+560956.6 0.5094H � 782 2300 44.30 8.0 QSOJ081902.32+322637.2 0.6512H � 139 17188 43.81 9.4 Sy1J081916.61+264203.2 0.5261H � 368 6880 44.00 8.7 QSOJ084203.73+401831.3 0.1516H � 4188 8810 43.82 8.8 Sy1
H � 3358 7774 43.18 8.7J084650.00+064149.0 0.6161H � 2751 7836 45.04 9.5 QSOJ085039.95+543753.3 0.3673H � 1079 12595 44.10 9.3 Sy1J085348.18+065447.1 0.2234H � 704 3813 42.87 7.9 Sy1J085830.61+080422.8 0.4549H � 1132 6634 44.34 8.9 QSOJ090745.28+532421.4 0.7113H � 1074 7213 44.79 9.3 QSOJ090835.85+415046.3 0.7337H � 867 3545 44.73 8.6 QSOJ090924.66+274402.8 0.3342H � 454 9815 43.63 8.8 Sy1J090924.68+521632.6 0.4102H � 1507 10542 44.36 9.3 QSOJ091133.85+442250.1 0.2976H � 873 2861 43.80 7.8 Sy1
H � 734 2688 43.18 7.8J092414.70+030900.8 0.1280H � 460 6140 42.16 8.0 Sy1
H � 2087 6148 43.36 7.5J093200.08+553347.4 0.2657H � 2104 4531 44.06 8.4 QSO
H � 1738 4198 43.44 8.3J093712.33+500852.1 0.2756H � 123 2922 42.32 7.5 Sy1
H � 543 2923 43.51 6.9J094857.31+002225.5 0.5846H � 301 1850 44.03 7.6 NLSy1J095855.10+423704.0 0.6641H � 415 2817 44.30 7.3 QSOJ101447.77+442133.3 0.7956H � 320 5468 44.38 8.8 QSOJ102044.32+492046.2 0.3899H � 898 4396 44.08 7.5 QSOJ102106.04+452331.8 0.3644H � 1086 7669 44.09 8.9 QSOJ102235.57+454105.4 0.7432H � 424 16214 44.43 9.7 Sy1J102237.44+393150.1 0.6036H � 473 4747 44.26 8.6 QSOJ102504.20+414332.6 0.6818H � 706 6159 44.56 9.0 QSOJ102738.53+605016.5 0.3320H � 1312 23649 44.08 9.9 QSO
H � 727 15006 43.28 9.4J103024.95+551622.7 0.4345H � 3828 2244 44.82 8.3 QSOJ103144.75+602030.4 1.2303 MgII 465 3041 44.82 — QSOJ103214.53+635950.3 0.5562H � 536 5623 44.23 8.7 QSOJ104334.81+343232.5 0.7330H � 197 6264 44.08 8.7 Sy1J104410.67+532220.5 1.9008 MgII 236 2591 44.99 — QSOJ105431.89+385521.6 1.3661 MgII 352 2452 44.81 — QSOJ110409.63+122157.5 0.5907H � 1791 5493 44.81 8.1 QSOJ114510.39+011056.2 0.6261H � 264 6572 44.04 8.7 QSOJ114803.17+565411.4 0.4510H � 1979 6159 44.57 9.0 QSOJ115227.48+320959.4 0.3747H � 527 5080 43.81 8.3 Sy1J115232.86+493938.7 1.0929 MgII 1991 3801 45.33 — QSOJ115323.95+583138.4 0.2024H � 1203 6066 43.01 8.4 Sy1
H � 4592 6066 44.14 7.8J115326.70+361726.3 1.3580 MgII 371 2034 44.83 — QSO

Optical identification of radio-loud AGNs in the RGB sample 25
SDSS name z line flux FWHM lgLB L R lgM B H SpecClass(1) (2) (3) (4) (5) (6) (7) (8)
J115409.28+023815.1 0.2106H � 602 3278 42.75 7.8 Sy1J115700.59+324457.8 0.4862H � 898 2318 44.31 8.0 QSOJ115727.60+431806.3 0.2300H � 670 2867 42.88 7.7 Sy1
H � 952 3274 43.58 7.8J120335.39+451049.5 1.0766 MgII 1230 3726 45.10 — QSOJ120436.17+485653.9 0.4509H � 965 3422 44.26 8.3 QSOJ121509.95+462715.1 0.7201H � 2276 4550 45.13 9.1 QSOJ122313.21+540906.5 0.1559H � 3118 6708 43.72 8.5 Sy1
H � 2221 5111 43.03 8.3J122424.23+401510.5 0.4164H � 1879 5500 44.47 8.8 QSOJ122506.50+483435.1 0.6468H � 534 5092 44.38 8.7 QSOJ123157.08+542028.7 0.5156H � 337 6794 43.94 7.9 QSOJ123807.76+532556.0 0.3475H � 2021 14772 43.77 9.6 QSO
H � 2206 13890 44.35 9.6J123819.62+412420.5 0.4980H � 1041 9322 44.40 9.2 QSOJ124139.72+493405.5 0.4739H � 1785 8082 44.58 9.2 QSOJ125223.78+645137.9 0.3119H � 1579 4217 44.10 8.4 QSO
H � 1330 4322 43.48 8.3J131211.14+480925.3 0.7149H � 2411 4673 45.14 8.1 QSOJ132631.44+473755.8 0.6822H � 838 5025 44.63 8.9 QSOJ133245.24+472222.6 0.6694H � 499 3372 44.39 8.4 QSOJ133437.49+563147.9 0.3428H � 784 3662 43.89 8.1 QSO
H � 633 3397 43.25 8.0J133655.51+654116.0 0.4368H � 1196 15462 44.32 9.6 QSOJ134545.35+533252.2 0.1354H � 2135 5413 43.42 8.2 Sy1
H � 2121 5253 42.87 8.2J134617.54+622045.4 0.1165H � 2234 5721 42.75 8.3 Sy1
H � 8607 5724 43.88 7.7J134751.58+283629.7 0.7399H � 1524 5358 44.98 9.1 QSOJ135229.02+490823.0 0.3966H � 441 4704 43.79 8.3 Sy1J135305.54+044338.6 0.5234H � 1098 10857 44.47 9.4 QSOJ135341.72+431052.5 1.1136 MgII 494 2291 44.74 — QSOJ141159.73+423950.3 0.8865 MgII 1838 4069 45.07 — QSOJ141446.64+392818.6 0.6571H � 366 4044 44.24 8.4 QSOJ141628.66+124213.5 0.3345H � 3353 9439 44.50 9.3 QSOJ141740.44+381821.1 0.4494H � 804 2947 44.18 8.1 QSOJ142020.67+462440.8 1.2450 MgII 327 9294 44.68 — QSOJ142106.03+385522.7 0.4888 MgII 954 3426 44.15 — QSOJ142314.19+505537.3 0.2759H � 1667 1270 44.00 7.3 QSO
H � 1352 2848 43.37 7.9J142606.19+402432.0 0.6639H � 421 4168 44.31 8.5 Sy1J143726.14+504555.8 0.7833H � 2439 5826 45.25 9.4 QSOJ143942.83+582759.2 0.4250H � 969 4575 44.20 8.5 QSOJ145224.68+452223.6 0.4671H � 4419 6566 44.96 9.3 QSOJ145247.37+473529.1 1.1582 MgII 643 6007 44.90 — QSOJ145958.43+333701.8 0.6448H � 3185 4704 45.16 8.1 QSOJ150455.56+564920.2 0.3589H � 3085 6036 44.53 8.9 QSOJ151017.82+422155.0 0.4873H � 724 1880 44.22 7.7 Sy1
MgII 205 5621 43.48 —J151830.93+483214.4 0.5757H � 951 8909 44.51 9.3 QSOJ151844.76+461855.1 0.8853 MgII 449 3651 44.45 — QSO

26 De-Liang Wang, Jian-Guo Wang, Xiao-Bo Dong
SDSS name z line flux FWHM lgLB L R lgM B H SpecClass(1) (2) (3) (4) (5) (6) (7) (8)
J151913.35+362343.4 0.2857H � 404 8218 42.88 8.6 Sy1H � 1642 8222 44.03 8.1
J152556.22+591659.5 0.9551 MgII 1421 8940 45.03 — QSOJ153102.48+435637.6 0.4520H � 908 2330 44.24 7.9 QSOJ154232.03+493842.5 0.5897H � 381 5499 44.14 7.8 QSOJ160317.91+090037.9 0.4883H � 1497 9389 44.54 9.3 QSOJ160658.30+271705.5 0.9337 MgII 669 3041 44.68 — QSOJ160813.79+292126.3 1.2005 MgII 362 6339 44.69 — QSOJ160822.16+401217.9 0.6281H � 216 3274 43.96 8.1 Sy1J161826.93+081950.7 0.4455H � 4067 19802 44.87 10.2 QSOJ161902.49+303051.5 1.2875 MgII 1209 3351 45.29 — QSOJ162111.27+374604.9 1.2728 MgII 175 3159 44.43 — QSOJ162229.31+400643.5 0.6878H � 814 3545 44.63 8.5 QSOJ162358.25+074130.5 1.2973 MgII 648 3137 45.02 — QSOJ162711.89+314359.3 0.7324H � 490 13816 44.48 9.6 Sy1J163624.31+471535.9 0.8233H � 441 3570 44.56 7.6 QSOJ163856.53+433512.5 0.3390H � 1163 11516 44.05 9.2 Sy1
H � 978 10092 43.43 9.1J164054.16+314329.9 0.9580 MgII 602 5985 44.66 — QSOJ164442.53+261913.2 0.1443H � 980 1535 42.60 7.0 NLSy1
H � 2771 1544 43.59 6.4J165005.47+414032.4 0.5848H � 1296 5240 44.66 8.9 QSOJ170112.38+353353.4 0.5011H � 495 2256 44.08 7.8 QSOJ170123.97+385136.9 1.1125 MgII 435 4625 44.68 — QSOJ171322.58+325627.9 0.1013H � 1033 3933 42.29 7.7 Sy1
H � 3786 3933 43.40 7.1J172242.16+281500.0 0.9447 MgII 663 2762 44.69 — QSO
Notes: (1): SDSS name — Jhhmmss.s+ddmmss.s(2): z — redshift of emission line(3): line — broad emission line(4): flux — broad emission line flux in units of10�17 ergs�1 cm �2
(5): FWHM — FWHM for broad emission line in units ofkm s�1
(6): lgLB L R —log broad emission line region luminosity in units ofergs�1
(7): lgM B H — log Black Hole mass in units of Solar mass(8): SpecClass — SDSS spectral class
Table 5: Narrow line region luminosities and black Hole masses of theidentified LINERs
SDSS name lgLN L R �� lgM B H
(1) (2) (3) (4)J085004.65+403607.7 42.21 412� 22 9.4J093430.68+030545.3 42.53 393� 16 9.3J111421.76+582319.8 42.11J111908.94+090022.8 41.96 315� 29 8.9J113255.96+051539.6 41.73 231� 7 8.4J113518.79+125311.1 42.10J132419.67+041907.0 42.29 375� 38 9.2J150324.77+475829.6 42.68J151838.90+404500.2 41.55 241� 7 8.5

Optical identification of radio-loud AGNs in the RGB sample 27
SDSS name lgLN L R �� lgM B H
(1) (2) (3) (4)J153253.78+302059.3 43.57J160239.61+264606.0 43.15 429� 87 9.5J172010.03+263732.0 42.26 364� 19 9.2
Notes: (1): SDSS name — Jhhmmss.s+ddmmss.s(2): lgLN L R — log narrow emission line region luminosity in Unit:ergs�1
(3): �� — velocity dispersion and velocity dispersion error of the hostgalaxy in Unit:km s�1
(4): lgM B H — log Black Hole mass in Unit: Solar mass
Table 6: Comparison with previous RGB and ROXA identifications
SDSS name our ID previous ID ref(1) (2) (3) (4)
J083353.88+422401.8 BL Lac FSRQ 2J111908.94+090022.8 LINERs BL Lac 2J113518.79+125311.1 LINERs Radio Galaxy 2J115409.28+023815.1 FSRQ FSRQ/BL Lac 2J120303.50+603119.1 BL Lac LINERs 3,2J124834.30+512807.8 BL Lac Star 1,2,4J132419.67+041907.0 LINERs SSRQ 2J141149.43+524900.1 Galaxy BL Lac 2J142730.27+540923.7 Galaxy BL Lac 1J150117.97+545518.2 Seyfert 2 SSRQ 2J153253.78+302059.3 LINERs NELG 2
Notes: (1): SDSS name — Jhhmmss.s+ddmmss.s(2): our ID — our SDSS spectral class(3): previous ID — previous spectral class(4): ref — reference about source spectral identification1:Laurent-Muehleisen et al. 19982:Turriziani et al. 20073:Carrillo et al. 19994:Collinge et al. 2005
Table 7: BL Lac with a featureless continuum
SDSS name u g r i z ref(1) (2) (3) (4) (5) (6) (7)
J085409.88+440830.2 17.33 17.02 16.81 16.67 16.55 1,2J092915.43+501336.1 17.26 16.86 16.49 16.22 16.01 2J100110.20+291137.6 19.02 18.52 18.08 17.75 17.41J103744.30+571155.6 17.07 16.68 16.38 16.13 15.91 1,2J110124.72+410847.4 19.35 19.06 18.80 18.58 18.37 2J110748.07+150210.5 18.53 18.27 18.05 17.88 17.71J112453.82+493409.7 18.96 18.70 18.50 18.37 18.15 2J115124.67+585917.7 16.40 16.08 15.89 15.64 15.58 2J120922.78+411941.3 18.38 17.99 17.61 17.34 17.10 2J124700.72+442318.7 19.02 18.84 18.50 18.37 18.12 2J130145.65+405624.6 18.55 18.28 18.04 17.91 17.76 2J135120.84+111453.0 18.99 18.72 18.50 18.21 18.04 2

28 De-Liang Wang, Jian-Guo Wang, Xiao-Bo Dong
SDSS name u g r i z ref(1) (2) (3) (4) (5) (6) (7)
J141536.80+483030.4 19.61 19.18 18.74 18.36 18.11 1J142607.71+340426.3 17.95 17.59 17.33 17.09 16.90J144052.93+061016.1 17.77 17.38 17.08 16.83 16.63J144800.58+360831.0 17.32 16.96 16.75 16.50 16.41 1,2J145427.13+512433.7 18.58 18.17 17.77 17.46 17.20 1,2J150947.97+555617.2 18.44 18.03 17.72 17.47 17.21 2J153324.26+341640.3 18.29 18.04 17.86 17.65 17.49 1,2J160218.06+305109.4 18.49 18.13 17.91 17.77 17.59 1,2J161830.59+062211.5 19.25 18.84 18.46 18.16 17.97J165249.92+402310.1 18.90 18.57 18.31 18.12 18.04 1,2
Notes: (1): SDSS name — Jhhmmss.s+ddmmss.s(2)-(6): Galactic extinction corrected psf magnitude of SDSS(7): ref — reference about source spectral identificationNo reference suggests that it is firstly identified by our work.1:Laurent-Muehleisen et al. 19982:Turriziani et al. 2007
Appendix A: SDSS STARLIGHT SPECTRAL MODELING
The spectra are first corrected for Galactic extinction using the extinction map of Schlegel et al. (1998) andthe reddening curve of Fitzpatrick (1999), and transformedinto the rest frame using the redshift providedby the SDSS pipeline. Then, host-galaxy starlight and AGN continuum, as well as the optical Fe II emissioncomplex are modeled as
S(�)= Ahost(EhostB � V ;�)A(�)+ Anucleus(E
nucleusB � V ;�)[bB (�)+ cbCb(�)+ cnCn(�)]
whereS(�) is the observed spectrum.A(�) =P
6
i= 1ai ICi(�;��) represents the starlight component
modeled by our six synthesized galaxy templates, which was built up from the spectral template libraryof Simple Stellar Populations (SSPs) of Bruzual & Charlot (2003) using our new method based on theEnsemble Learning Independent Component Analysis (EL-ICA) algorithm. The details of the galaxy tem-plates and their applications are presented in Lu et al. (2006). A(�) is broadened by convolving it with aGaussian of width�� to match the stellar velocity dispersion of the host galaxy.The un-reddened nuclearcontinuum is assumed to beB (�)= �� 1:7 as given in Francis (1996). We modeled the optical Fe II emis-sion, both broad and narrow, using the spectral data of the FeII multiplets for I Zw I in the�� 3535–7530Arange provided by Veron-Cetty et al. (2004)(Table A1,A2).We assume that the broad Fe II lines (Cb inEq.(A.1)) have the same profiles as the broad H� line, and the narrow Fe II lines (Cn), both permitted andforbidden, have the same profiles as the that of the narrow H� component, or of [O III]�5007 if H� is weak.A host(E
hostB � V
;�)andAnucleus(EnucleusB � V
;�)are the color excesses due to possible extinction of the hostgalaxy and the nuclear region, respectively, assuming the extinction curve for the Small Magellanic Cloudof Pei (1992). The fitting is performed by minimizing the�2 with E host
B � V, E nucleus
B � V, ai, ��, b, cb andcn
being free parameters. To account for possible errors of theredshifts provided by the SDSS pipeline, inpractice, we iterate the procedure with redshifts with a step of 5km s� 1 near the SDSS redshift and use thebest-fit result.
The emission line spectra are fitted in the following way. As the narrow Balmer lines and the[N II] ��6548, 6583 doublet have similar profiles to the [S II]��6716, 6731 doublet lines (Filippenkoet al. 1988; Ho et al. 1997; Zhou et al. 2006), we use the [S II]��6716, 6731 doublet lines as a tem-plate to fit the narrow lines. If [S II] is weak, [O III]�5007 is used as the template. Each of the [S II] doubletlines is assumed to have the same profile and redshift, and is fitted with as many Gaussians as is statisticallyjustified; generally 1–2 Gaussians are needed. Likewise, the [O III]��4959, 5007 doublet are fitted in asimilar way, with the flux ratio of [O III]�5007/[O III]�4959 fixed to the theoretical value of 3. When agood model of the narrow-line template is achieved, we scaleit to fit the narrow Balmer lines and the [NII]��6548, 6583 doublet lines. The flux ratio of the [N II] doublet�6583/�6548 is fixed to the theoretical

Optical identification of radio-loud AGNs in the RGB sample 29
value of 2.96. For possible broad H� and H� lines, we use multiple Gaussians to fit them, as many as isstatistically justified. If a broad H� line is too weak to get a reliable fit, we then re-fit it assumingit has thesame profile and redshift as a broad H�. If a broad-line emission is detected at the� 5� confidence level,we regard it as genuine.
References
Abdo, A. A., Ackermann, M., Ajello, M., et al., 2009, ApJ, 699, 976
Baldwin, J. A., Phillips, M. M., Terlevich, R., 1981, PASP, 93, 5
Brinkmann, W., Siebert, J., Reich, W. et al., 1995, A&AS, 109, 147
Brinkmann, W., Siebert, J., Feigelson, E. D. et al., 1997, A&A, 323, 739
Bruzual, G., Charlot, S., 2003, MNRAS, 344, 1000
Caccianiga, A., Maccacaro, T., Wolter, A. et al., 1999, ApJ,513, 51
Caccianiga, A., Maccacaro, T., Wolter, A. et al., 2000, A&AS, 144, 247
Carrillo R., Masegosa, J., et al., 1999, Rev.Mex.AA, 35, 187
Celotti, A., Fabian, A. C., 1993, MNRAS, 264, 228
Celotti, A., Padovani, P., & Ghisellini, G. 1997, MNRAS, 286, 415
Costero, R. & Osterbrock, D.E., 1977, ApJ, 211, 675
Collinge, M. J., Strauss, M. A., Hall, P. B. et al., 2005, AJ, 129, 2542
Crawford, C. S., Allen, S. W., Ebeling, H., Edge, A. C., Fabian, A. C, 199, MNRAS, 306, 857
Dong, X.B., Zhou, H.Y., Wang, T.G. et al., 2005, ApJ, 620, 629
Dressler, A., Shectman, S. A., 1987, AJ, 94, 899
Edge, A. C., Ebeling, H., Bremer, M. et al., 2003, MNRAS, 339,913
Falcke, H., et al., 2000, ApJ, 542, 197
Filippenko, A. V., Sargent, W.L.W., et al., 1988, ApJ, 324, 134
Fitzpatrick, E. L., 1999, PASP, 111, 63
Fossati, G., Maraschi, L., Celotti, A. et al., 1998, MNRAS, 299, 433
Francis, P. J., Hewett, P. C., Foltz, C. B. et al., 1991, ApJ, 373, 465
Francis, P. J., 1996, Publ.Astron.Soc.Australia, 13, 212
Gaskell, C. M., Sheilds, G. A., Wampler, E. J., 1981, ApJ, 249, 443
Ghisellini, G., Celotti, A., Fossati, G. et al., 1998, MNRAS, 301, 451
Giommi, P., Menna, M. T., & Padovani, P, 1999, MNRAS, 310, 465
Giommi, P., Piranomonte, S., Perri, M. et al., 2005, A&A, 434, 385
Greene, J. E., Ho, L. C., 2005, ApJ, 630, 122
Greene, J. E., Ho, L. C., 2007a, ApJ, 670, 92
Greene, J. E., Ho, L. C., 2007b, ApJ, 667, 113
Gregory P. C., Condon J. J., 1991, ApJS, 75. 1011
Gregory P. C., Scott W. K., Douglas K., 1996, ApJS, 103, 427
Heckman T. M., 1980, A&A, 87, 152
Hine, R.G. & Longair, M.S., 1979, MNRAS, 188, 111
Ho, L.C., Filippenko, A.V., & Sargent,W. L.W., 1995, ApJS, 98, 477
Ho, L. C., et al., 1997, ApJs, 112, 315
Ho, L.C., 2008, ARA&A, 46, 475
Jester, Sebastian, 2005, AJ, 130, 873J
Kauffmann, G., Heckman, T. M., Tremonti, C. et al., 2003, MNRAS, 346, 1055
Kellermann, K. I., Sramek, R., Schmidt, M. et al., 1989, AJ, 98, 1195
Kewley, L. J., Groves, B., Kauffmann, G. et al., 2006, MNRAS,372, 961

30 De-Liang Wang, Jian-Guo Wang, Xiao-Bo Dong
Kewley, L. J., Dopita, M. A., Sutherland, R. S. et al., 2001, ApJ, 556, 121
Komossa, S., Voges, W., Xu, D. et al.,2006, AJ, 132, 531
Koester, B. P., McKay, T. A., Annis, J. et al., 2007, ApJ, 660,239
Koski, A.T., 1978, ApJ, 223, 56
Laing, R.A., et al. 1994, ’The physics of Active Galaxies’, Bicknell G.V., Dopita, M.A., Quinn P.J. (eds.) ASPC, 54,
201
Landt, H., Padovani, P., Perlman, E. S. et al., 2001, MNRAS, 323, 757
Landt, H., Padovani, P., Giommi, P., 2002, MNRAS, 336, 945
Laurent-Muehleisen, S. A., Kollgaard, R. I., Ryan, P. J. et al., 1997, A&AS, 122, 235
Laurent-Muehleisen, S. A., Kollgaard, R. I., Ciardullo, R.et al., 1998, ApJS, 118, 127
Laurent-Muehleisen, S. A., Kollgaard, R., Feigelson, E. D.et al., 1999, ApJ, 525, 127
Ledden, J. E., Odell, S. L., 1985, ApJ, 298, 630
Lewis, L., Eracleous, M., Sambruna, R.M., 2003, ApJ, 593, 115
Lu, H.L, Zhou, H.Y., et al., 2006, AJ, 131, 790
Maraschi, L., et al., 2008, MNRAS, 391, 1981
Marcha, M. J. M., Browne, I. W. A., Impey, C. D et al., 1996, MNRAS, 281, 425
McLure, R. J., Dunlop, J. S. 2004, MNRAS, 352, 1390
McGill, K. L., Woo, J.H., Treu, T. et al., 2008, ApJ, 673, 703
Nagar, N.M., et al., 2000, ApJ, 542, 186
Nagar, N.M., Falcke, H., & Wilson, A.S., 2005, A&A, 435, 521
Osterbrock D.E., 1976, PASP, 88, 589
Osterbrock, D. E., Pogge, R. W., 1985, ApJ, 297, 166
Padovani, P., Perlman, E. S., Landt, H. et al., 2003, ApJ, 588, 128
Pei, Y. C., 1992, ApJ, 395, 130
Perlman, E. S., Padovani, P., Giommi, P. et al., 1998, AJ, 115, 1253
Peterson, B. M., 1997, An Introduction to Active Galactic Nuclei(Cambridge: Cambridge Univ.Press)
Piranomonte S., Perri M., Giommi P. et al, 2007, A&A, 470, 787
Richards, G. T., Lacy, M., Storrie-Lombardi, L. J., et al., 2006, ApJS, 166, 470
Sadler, E.M., Jenkins, C.R., Kotanyi, C.G., 1989, MNRAS, 240, 591
Schlegel, D. J., Finkbeiner, D. P., Davis, M., 1998, ApJ, 500, 525
Stocke, J.T., Morris, S.L., Gioia, I. M., et al, 1991, ApJS, 76, 813
Stoughton, C., Lupton, R. H., Bernardi, M. et al., 2002, AJ, 123, 485
Tadhunter, C.N., et al., 1998, MNRAS, 298, 1035
Tremaine, S., Gebhardt, K., Bender, R. et al., 2002, ApJ, 574, 740
Turriziani, S., Cavazzuti, E., Giommi, P., 2007, A&A, 472, 699
Urry, C.M. & Padovani, P., 1995, PASP, 107, 803
Vanden Berk, D. E., et al., 2004, ApJ, 601, 692
Veilleux, S. & Osterbrock, D. E., 1987, ApJS, 63, 295
Veron-Cetty, M.-P., Joly, M., Veron, P., 2004, A&A, 417, 515
Vestergaard, M., Peterson, B. M., 2006, ApJ, 641, 689
Voges, W., Aschenbach, B., Boller, Th. et al, 1999, A&A, 349,389
Whalen, D. J., Laurent-Muehleisen, S. A. et al, 2006, AJ, 131, 1948
Yuan, W., Zhou, H.Y., & Komossa, S. et al., 2008, ApJ, 685, 801
Zhou, H.Y., Wang, T.G., Yuan, W.M. et al., 2006, ApJS, 166, 128
Zirbel, E.L., Baum, S.A., 1995, ApJ, 448, 521
This paper was prepared with the RAA LATEX macro v1.2.