Galactic chimney sweeping: the effect of 'gradual' stellar ...

A&A 460, 539–545 (2006)DOI: 10.1051/0004-6361:20064828c© ESO 2006
Astronomy&
Astrophysics
Near-infrared variability of a sample of galactic carbon Miras�,��
F. Kerschbaum1, M. A. T. Groenewegen2, and C. Lazaro3,4
1 Institute for Astronomy, University of Vienna, Türkenschanzstrasse 17, 1180 Vienna, Austriae-mail: [email protected]
2 Instituut voor Sterrenkunde, KU Leuven, Celestijnenlaan 200B, 3001 Heverlee, Belgium3 Dpto. de Astrofísica, Fac. de Física, Universidad de La Laguna, 38200 La Laguna, Tenerife, Spain4 Instituto de Astrofísica de Canarias, 38200-La Laguna, Tenerife, Spain
Received 9 January 2006 / Accepted 16 July 2006
ABSTRACT
Aims. In this paper we aim to determine the longest pulsation period of infrared carbon stars.Methods. Forty-seven infrared carbon stars were selected based on (1) IRAS colours and spectral classification from the IRAS LRSatlas, and (2) known carbon stars with large CO expansion velocities. Multi-epoch JHKL′ photometry was obtained.Results. Reliable periods could be derived for 31 stars. The two longest periods are 840 and 870 days, only slightly longer thanthe previously longest known period for a galactic carbon star of 783 days. This is considerably shorter than the periods of someOH/IR stars. As the present survey targeted carbon stars that are likely to be among those with the longest periods expected, thisdifference appears real. To try to understand the longest observed period, the synthetic AGB code of Wagenhuber & Groenewegen(1998, A&A, 340, 183) was fine-tuned to reproduce the models of Vassiliadis & Wood (1993, ApJ, 413, 641). For several initialmasses the fundamental mode period distribution was calculated for stars inside observed instability strip. Depending on details of theadopted mass loss rate, it is found that the mass limit where a carbon star has a probability of less than 1% of being in the observedinstability strip with a period longer than 900 days is between 2.6 and 3.1 M�.Conclusions. Synthetic AGB calculations suggest that the observed upper limit in period can be interpreted as an upper mass limitof carbon star formation, with a value of between 2.6 and 3.1 M�, depending on the adopted AGB mass loss rate. Such a mass limitis predicted by stellar evolution through the occurence of Hot Bottom Burning where (dredged-up) carbon is converted into nitrogen;this is predicted to occur at higher masses (∼4 M�), although this depends on convection and core overshoot.
Key words. stars: carbon – stars: AGB and post-AGB – stars: variables: general – infrared: stars
1. Introduction
Pulsation is a critical aspect of the late stages of stellar evo-lution. The longest known indication of these pulsations arethe well-expressed regular and irregular variations in brightnessof objects on the Asymptotic Giant Branch (AGB) like Mira-,Semiregular (SRV), and Irregular Variables (IRV). This pulsa-tion affects the structure of the stellar atmosphere. As it drivesthe extension of the outer stellar layers, it produces an environ-ment for the formation of dust, which is an important factor forthe mass loss and therefore for the stellar evolution.
The theoretical description of the pulsational phenomenain the atmosphere of AGB stars is now making consider-able progress (e.g., Höfner et al. 1998; Höfner 1999; Winterset al. 2000; Nowotny et al. 2005, and references therein).
Moreover, for the more regular pulsators among theAGB variables, well established Mira period-luminosity andperiod-K magnitude relations are available (e.g., Feast et al.1989; Groenewegen & Whitelock 1996), allowing for a reliabledetermination of distances to individual field stars or even out-side the local group (e.g., the Miras in Cen A, Rejkuba 2004).
� Based on observations made with the Carlos Sánchez Telescopeoperated on the island of Tenerife by the Instituto de Astrofísica deCanarias (IAC) in the Observatorio del Teide, Izaña.�� Appendix A is only available in electronic form athttp://www.aanda.org
The results from the micro-lensing surveys are very impres-sive (e.g., Wood et al. 1999; Ita et al. 2004; Groenewegen 2004;Fraser et al. 2005) and have revealed several sequences that canbe interpreted as being due to the fundamental mode pulsationof the Mira variables, and overtone pulsation for the smaller am-plitude variables.
Also, robotic large area or even all sky surveys like theAll Sky Automated Survey (ASAS, Pojmanski 2002) or theNorthern Sky Variability Survey (NSVS, Wozniak et al. 2004)provide valuable and systematic information on AGB variability(see also Sect. 3.1).
Nevertheless, these surveys have been carried out in theoptical and therefore miss the most obscured stars that un-dergo significant mass loss and then become faint to invisiblein the optical. One should note that Kiss & Bedding (2004)and Groenewegen (2004) did find a large number of very red(J − K � 1.4 mag) “faint Miras” in the OGLE-II observationsof the SMC, which fall below the fiducial Mira P-L relation by1.5–2 mag in K and 4–6 mag in I, so that they are very likelycandidates for being obscured carbon-rich Mira stars.
The pulsational properties of such stars are poorly studied,in particular the carbon-rich ones, the so-called “infrared carbonstars”. Few periods have been determined, except, e.g., by Joneset al. (1990) and Le Bertre (1992). Interestingly, the longestknown period for a carbon star is around 780 days in the Galaxy(AFGL 809, AFGL 2494, Jones et al. 1990) and near 940 daysin the LMC (IRAS 05190–6748, Whitelock et al. 2003), while
Article published by EDP Sciences and available at http://www.aanda.org or http://dx.doi.org/10.1051/0004-6361:20064828
540 F. Kerschbaum et al.: Near-infrared variability of a sample of galactic carbon Miras
among the dust obscured oxygen-rich stars (often called OH/IRstars), periods of well over a 1000 days and up to 2800 days areknown (e.g., van Langevelde et al. 1990). Is this an evolutionaryeffect?
From observations in the LMC and SMC, it has become clearthat the brightest AGB stars are not carbon stars, but MS andS-stars (e.g., Smith et al. 1995). This should be reflected in theperiods carbon stars can attain. It is clear however that manymore periods for infrared carbon stars are needed to quantifythis.
Therefore, we present in this paper new multi-epoch near-infrared photometry of a sample of IR bright, high mass losscarbon stars not studied in the optical range at all. For most ofthe objects in our sample this is the first measurement of theirinfrared light change.
2. The sample and observations
The sample was selected as follows: as a first step stars withan IRAS LRS classification of 4n, suggestive of a carbon staras it indicates the presence of the silicon carbide dust feature(this was verified visually), and IRAS fluxes S25> 0.4 × S12and S12 > 50 Jy were selected from the IRAS PSC. The formercriterium selects carbon stars that, based on existing data, pref-erentially contain stars with P > 500 days. The latter criteriumensures that even the reddest stars can be observed in K and L(K < 10), while the bluer stars can be monitored in JHKL. In ad-dition, carbon stars with expansion velocities larger than about23 km s−1 (selected from the catalogue of CO measurements ofLoup et al. 1993) were added to the sample with the rationalethat high expansion velocities are a sign of high luminosities inthe theory of radiation driven wind (Elitzur & Ivezic 2001) andcarbon stars with high luminosities based on reasonably well de-termined kinematic distances (Kastner et al. 1993). Those addi-tional stars that are outside the colour and/or flux criterium wereonly included if existing NIR data indicated that they are not toofaint.
The observations were carried out at the Observatorio delTeide, the 1.5 m “Carlos Sánchez Telescope” of the Instituto deAstrofísica de Canarias (IAC) on Izaña, Tenerife was used withthe “CVF Photometer-Spectrophotometer”. The L-filter there isactually L′ (3.78µm).
All sources were searched for at their IRAS positions, mostlyin filter K. A diaphragm of 15′′ was used; beam-switching wasdone in the East-West direction with a throw of generally 20′′.Standard and programme stars were observed at similar air massranges to avoid the nonlinear effects of atmospheric extinctionin the infrared. The JHKL′-photometry was calibrated on theKoornneef (1983a,b) system.
The observations were done by the authors during 25 ded-icated runs between September 1995 and August 1999. A fewadditional measurements where carried out by Stefano Bagnuloand Mathias Schultheis.
3. Results
3.1. Period finding
As noted already in Lebzelter (1999), classical methods for de-riving a period, like Fourier analysis (Sperl 1998), alone do notalways provide satisfying results for light curves of AGB vari-ables. We therefore combined it with visual inspection (maxima,minima) and least square fitting techniques (Sperl 1998).
Fig. 1. Examples of K-band photometry for 5 stars with correspondingfit solutions.
To illustrate the typical K-band variability of these stars weplotted the K-band light curves of five stars from our sample inFig. 1. To allow a direct comparison of amplitude and period ofthe variation we used the same scaling for all stars shown.
The formal frequency uncertainty ∆ f from Fourier analy-sis is indirectly proportional to the sample length ∆T . A prac-tical rule of thumb ∆ f = 1.5/∆T comes from Loumos &Deeming (1978), which corresponds, for our data sets (∆T typ-ically 1000 days, which is of the same order as the expectedperiods) in the period domain, to ∆P of about 135, 375, and735 days for periods of 300, 500, and 700 days, respectively.These very conservative values are considerably improved toabout 10% of the period, when least-square fitting techniquesare carried out, but one should keep in mind this principal limita-tion, which can only be overcome by a longer time base. Anotherlimitation is the density of the sampling, which is responsiblefor the high frequency, i.e. short period cut-off. For our sam-pling (say 10 points in 1000 days, a typical Nyquist cut-off isfound at around 200 days in period, below the expected periodsof long period variables. A detection of more rapid variationsor the detailed shape of the light curves would require a muchbetter sampling.
Table 1 gives an overview of the resulting periods derivedfrom the K-band light curves as well as the correponding ampli-tudes (used in the mathematical sense, i.e., half of the peak-to-peak variation). Moreover, mean colours of the fitted light curvesare calculated. Only in the two cases where no period solutionscould be found were straight average colours calculated. n gives
F. Kerschbaum et al.: Near-infrared variability of a sample of galactic carbon Miras 541
Table 1. Mean near-infrared photometry, variability, luminosity and distance. n gives the number of datapoints in the corresponding filter. A “:”after the K-band amplitude indicates uncertainties in period and amplitude determination. Luminosity and distance information is derived via thePL relation discussed in the text.
IRAS Variable Name Jm Hm Km L′m nJ nH nK nL′ PK (d) AK MK Mbol L (L�) rK (pc)01105+6241 NSV 438 AFGL177 5.27 3.63 2.35 0.56 7 7 7 4 711 1.32 : −9.01 −5.37 1.08 × 10⁴ 1.87 × 10³
02152+2822 YY Tri 12.75 10.13 7.05 2.62 5 7 7 2 841 0.77 −9.27 −5.55 1.29 × 10⁴ 1.84 × 10⁴
03192+5642 KX Cam 9.14 6.91 5.20 3.44 8 8 8 3 795 0.98 : −9.19 −5.49 1.22 × 10⁴ 7.54 × 10³
03238+6034 KY Cam AFGL4277 11.42 8.51 6.10 2.93 7 10 10 4 642 0.86 −8.86 −5.25 9.75 × 10³ 9.81 × 10³
03385+5927 12.32 9.61 6.92 3.42 6 10 10 2 629 1.02 −8.82 −5.23 9.54 × 10³ 1.41 × 10⁴
03448+4432 AFGL5102 13.69 10.47 7.24 2.99 6 8 8 3 729 0.73 −9.05 −5.39 1.11 × 10⁴ 1.81 × 10⁴
04179+5951 AFGL5118 10.76 8.03 5.76 2.90 3 7 7 1 536 0.88 : −8.58 −5.05 8.08 × 10³ 7.36 × 10³
05136+4712 11.65 9.14 6.85 3.46 6 9 9 4 552 0.85 −8.62 −5.08 8.33 × 10³ 1.24 × 10⁴
06088+1909 8.42 6.25 4.44 2.12 7 7 7 1 405 0.68 −8.14 −4.73 6.04 × 10³ 3.28 × 10³
06226−0905 V636 Mon AFGL933 4.96 3.32 1.99 0.50 5 5 5 3 490 0.78 : −8.44 −4.95 7.37 × 10³ 1.22 × 10³
06268+0849 V477 Mon AFGL5196 8.34 6.25 4.32 1.72 6 6 6 3 422 0.74 : −8.21 −4.78 6.31 × 10³ 3.19 × 10³
06487+0551 8.82 6.48 4.53 2.03 6 6 6 2 552 0.55 : −8.62 −5.08 8.33 × 10³ 4.26 × 10³
06531−0216 AFGL1039 6.93 5.12 3.62 1.83 6 6 6 1 no solution17581−1744 AFGL2047 8.07 5.89 4.12 1.82 10 10 10 5 590 0.71 −8.72 −5.16 8.93 × 10³ 3.71 × 10³
18040−0941 FX Ser AFGL2067 6.56 4.21 2.45 0.35 8 8 8 4 605 0.67 −8.76 −5.19 9.17 × 10³ 1.75 × 10³
18239−0655 NSV 24440 AFGL2154 10.11 7.38 4.79 1.34 8 9 9 3 638 0.72 : −8.84 −5.24 9.68 × 10³ 5.34 × 10³
18240+2326 V1076 Her AFGL2155 11.76 9.29 6.02 1.42 7 8 8 5 662 0.93 −8.90 −5.29 1.01 × 10⁴ 9.67 × 10³
18244−0815 11.16 8.49 5.83 2.72 5 7 7 5 695 0.61 −8.98 −5.34 1.06 × 10⁴ 9.13 × 10³
18248−0839 12.66 9.42 6.34 2.25 6 6 8 4 652 1.01 −8.88 −5.27 9.89 × 10³ 1.10 × 10⁴
18269−1257 13.70 10.35 7.35 3.56 2 5 6 1 872 1.97 −9.33 −5.60 1.34 × 10⁴ 2.16 × 10⁴
18320−0352 AFGL7012 13.11 11.13 8.20 3.94 3 4 6 3 596 0.77 : −8.74 −5.17 9.01 × 10³ 2.45 × 10⁴
18367−0452 12.22 10.62 8.02 3.62 6 7 8 4 649 0.95 −8.87 −5.26 9.85 × 10³ 2.39 × 10⁴
18397+1738 V821 Her AFGL2232 5.56 3.60 1.83 –0.74 11 11 11 7 478 0.75 −8.40 −4.92 7.17 × 10³ 1.11 × 10³
18398−0220 V1417 Aql AFGL2233 5.47 3.40 1.71 –0.50 7 7 7 2 687 0.56 −8.96 −5.33 1.04 × 10⁴ 1.36 × 10³
18424+0346 9.42 6.95 4.91 2.26 8 8 8 2 456 1.07 −8.33 −4.87 6.83 × 10³ 4.43 × 10³
18475+0926 AFGL2259 11.58 9.20 6.41 2.22 8 10 10 4 610 0.80 −8.78 −5.19 9.24 × 10³ 1.09 × 10⁴
19029+0808 NSV 24681 AFGL2316 11.45 9.08 6.11 2.05 7 10 10 4 742 1.10 −9.08 −5.41 1.13 × 10⁴ 1.09 × 10⁴
19029+2017 AFGL2318 7.83 5.65 3.86 1.84 6 6 6 3 594 0.68 −8.73 −5.16 8.99 × 10³ 3.30 × 10³
19068+0544 7.84 5.57 3.94 2.02 8 8 8 2 661 0.85 −8.90 −5.28 1.00 × 10⁴ 3.69 × 10³
19175−0807 V1420 Aql 7.22 4.71 2.66 –0.15 10 10 10 5 636 1.10 −8.84 −5.24 9.65 × 10³ 2.00 × 10³
19455+0920 AFGL4253 11.93 9.34 6.68 3.01 7 6 7 2 538 0.99 −8.58 −5.05 8.11 × 10³ 1.13 × 10⁴
19548+3035 AFGL2477 10.15 8.94 8.46 6.57 4 5 5 2 no solution20072+3116 V1969 Cyg AFGL2513 7.54 5.30 3.43 0.95 9 9 9 4 706 0.96 −9.00 −5.36 1.07 × 10⁴ 3.07 × 10³
20082+3228 11.56 8.68 6.14 2.82 5 6 6 2 654 0.91 −8.88 −5.27 9.93 × 10³ 1.01 × 10⁴
20171+3519 11.72 10.91 8.04 3.74 3 4 5 2 860 0.94 : −9.31 −5.58 1.32 × 10⁴ 2.94 × 10⁴
20435+3825 11.46 8.45 5.84 2.17 8 9 9 4 487 0.49 : −8.43 −4.94 7.32 × 10³ 7.13 × 10³
20532+5554 V703 Cep 11.95 8.99 6.26 2.49 5 9 9 2 656 0.94 −8.89 −5.28 9.97 × 10³ 1.07 × 10⁴
20570+2714 V442 Vul AFGL2686 9.49 6.83 4.21 0.63 9 8 8 5 659 1.06 −8.90 −5.28 1.00 × 10⁴ 4.19 × 10³
21003+4801 10.54 7.84 5.35 2.08 6 7 7 4 766 0.55 −9.13 −5.45 1.17 × 10⁴ 7.87 × 10³
21027+5309 V1899 Cyg AFGL2699 9.71 7.33 5.15 2.29 8 8 8 5 662 0.69 −8.90 −5.29 1.00 × 10⁴ 6.47 × 10³
21147+5110 13.18 11.34 8.40 3.86 6 7 8 4 772 0.99 −9.14 −5.46 1.18 × 10⁴ 3.21 × 10⁴
21223+5114 13.35 10.05 7.14 3.40 4 5 6 2 663 0.88 −8.91 −5.29 1.01 × 10⁴ 1.62 × 10⁴
21373+4540 11.35 8.69 6.21 2.78 5 8 8 3 644 0.87 −8.86 −5.25 9.77 × 10³ 1.03 × 10⁴
21449+4950 V2358 Cyg 11.43 8.65 6.24 3.13 6 8 8 2 665 0.60 : −8.91 −5.29 1.01 × 10⁴ 1.07 × 10⁴
22241+6005 V384 Cep AFGL2901 9.60 6.91 4.42 1.19 8 9 9 4 641 0.74 : −8.85 −5.25 9.73 × 10³ 4.51 × 10³
23174+5941 V571 Cas 9.43 7.16 5.22 2.73 9 9 9 4 509 0.63 : −8.50 −4.99 7.66 × 10³ 5.54 × 10³
23279+5336 9.86 7.54 5.40 2.85 7 6 8 5 583 0.69 : −8.71 −5.14 8.81 × 10³ 6.64 × 10³
the number of datapoints in the corresponding filter. A “:” afterthe K-band amplitude indicates uncertainties in period and am-plitude determination mostly because of poor sampling of thelight curves.
To visualise our attempts to fit the observed light curves,Fig. 1 gives five examples. It is obvious that the phase coverageof our NIR measurements is not comparable with well-sampledlight curves in the visual. Sometimes it is better to speak ofmulti-epoch photometry. Nevertheless it can be used to estimatea better average luminosity or at least to get a lower limit for thepulsational amplitudes in the infrared.
Only a few objects of our sample have already pub-lished periods. In total, 13 stars were also independently mon-itored by Whitelock et al. (2006). For two C stars we cameto exactly (within a few days) the same periods, namely,IRAS 18239−0655 and 20570+2714, which is quite a sur-prise given the intrinsic uncertainties in period determinationas discussed above. Seven additional objects only deviate up toabout 10% in their periods. Using our new periods the datasets ofIRAS 06226−0905, 06487+0551, 17581−1744, 18240+2326,18397+1738 (see Fig. 1), 18398−0220, and 19175−0807 cantypically be fitted with residuals of a half or a third of those
with the published periods. Nevertheless, taking into accountthe very small number of points in the individual light curves,this is not a final proof. For only four stars we arrived at dif-ferent periods. In the case of IRAS 02152+2822 we found 841instead of 624 days; for 06088+1909, 405 instead of 493 days;for 06268+0849, 422 instead of 619 days, and for 18040−0941,605 instead of 519 days. In all cases we tried the published val-ues again but even after wider variations no fit solutions withcomparable small residuals could be found. Again, the limiteddatasets leave some uncertainties since the results could be dif-ferent with only a few points added or deleted.
A quite similar comparison was carried out for the fewobjects that have positional counterparts (variables within onearcminute) in the NSVS (see above, for ASAS no counter-parts were found). In the case of NSVS six stars match theJ2000 IRAS coordinates within only 5 arcsec. Three NSVS ob-jects, corresponding to IRAS 03192+5642, 19029+2017 and19068+0544 support our period findings very well.
The three others, IRAS 01105+6241, 18040−0941, and18397+1738, all show very well defined but quite different vari-ability in their NSVS data sets, in the 250 to 650 day pe-riod ranges with amplitudes well below 1 mag. All are clearly
542 F. Kerschbaum et al.: Near-infrared variability of a sample of galactic carbon Miras
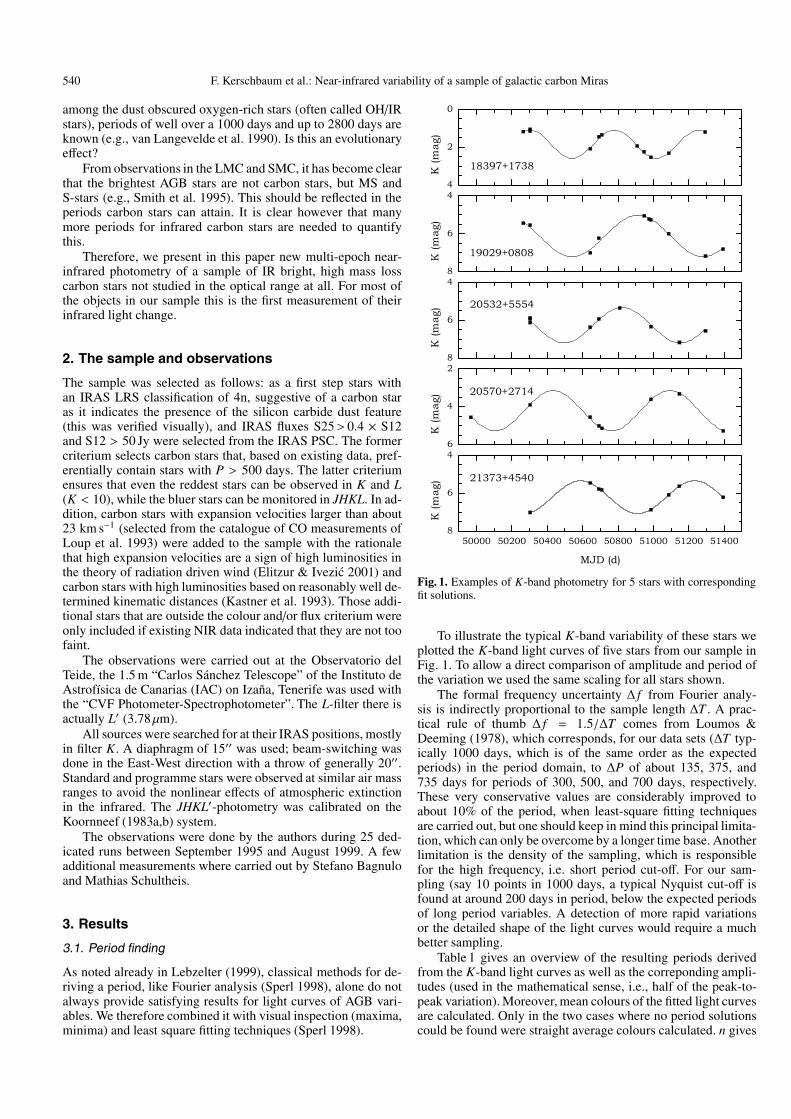
Fig. 2. Infrared two colour diagram according to that of Epchtein et al.(1987) to discriminate O-rich from carbon stars. The colours for black-bodies of different temperatures [K] are indicated. The two outliers inbox “o3” are discussed in the text.
incompatible with our IR material. The most probable interpre-tation is in terms of an incidental positional association.
3.2. Mean colours
Using the light curve fits described above, it is possible to derivemean magnitudes in all filters. For some objects with very fewmeasurements in certain colours (mainly L′m), no fit was possibleand the mean colour index between simultaneous measurementsin K and the respective other filter “X” was used to calculate thecolour index between the mean K magnitude Km and “Xm”.
Taking our mean colour indices and corresponding IRASfluxes1 from the IRAS point source catalogue (PSC, 1988), theinfrared two colour diagram shown in Fig. 2 was produced.Following Epchtein et al. (1987), it can be used to characteriseAGB objects according to their mass loss rates and chemicalproperties. Regions “o2” and “o3” contain mainly O-rich starswith increasing mass loss towards higher (K − L′) indices. Tothe left of them, “pure” photosphere without mass loss would besituated. Below in the large area denoted “c”, towards the black-body line, carbon stars of different mass loss rates can be found.Again, higher rates are found to the right.
The aim of the original selection described in Sect. 2 was toselect carbon stars. The data points in Fig. 2 confirm the carbonstar nature for the overall majority of the stars.
The star located at (K − L) = 1.76 and[12 µm]−[25 µm]= 0.95 is IRAS 03192+5642. It is lo-cated quite close to the borderline between regions “o3” and“c”. This is unquestionably a carbon star because of its strongSiC feature and its listing in the “General catalog of galacticcarbon stars” (Alksnis et al. 2001).
The object located far outside region “c” in the upper partof Fig. 2 is IRAS 19548+3035 (AFGL 2477). This object was
1 The use of IRAS-PSC magnitudes varies in the literature. Both zeropoint corrected and not zero point corrected values are found. To avoidconfusion, for this paper we defined a zero point corrected [x µm] ≡−2.5 · log(F/F0)x µm. The F0-values were taken from the IRAS-PSC.
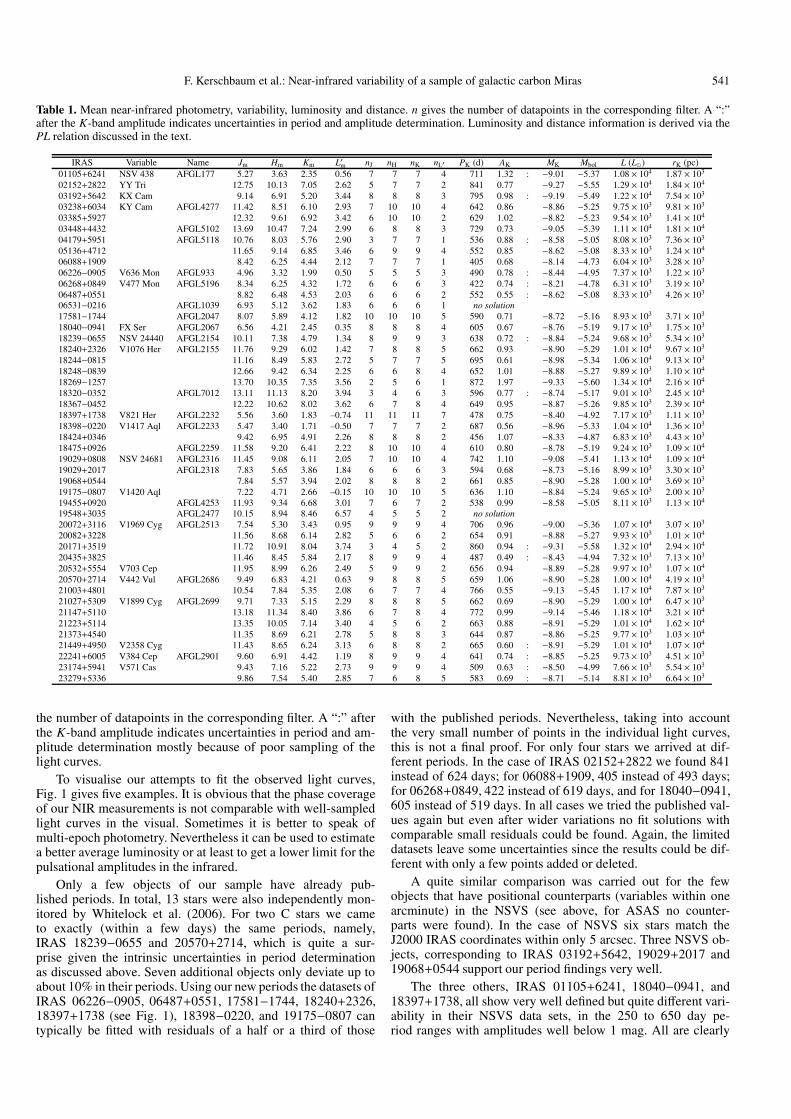
Fig. 3. Bolometric magnitude and IRAS flux-ratio. The line indicatesthe relation given in Groenewegen et al. (2002).
previously studied by Groenewegen et al. (1996). This is a veryinteresting star with a bi-modal spectral energy distribution witha M6S star dominating the light from the optical up to ∼3 µm andoptically thick carbon-rich material (as evidenced from the IRASLRS spectrum and molecular line emission) emitting longwards.The JHK magnitudes trace the M6S star and our observationsthen imply that this star is not variable. Our magnitudes are ingood agreement with 2MASS (J = 10.20, H = 8.98, K = 8.46).Our new observations do not resolve the nature of this object,which could be a chance coincidence on the sky, or a peculiarbinary system with two AGB stars possibly in a disk configura-tion (Groenewegen et al. 1996).
3.3. Absolute magnitudes and distances
Using the period-luminosity and period-K magnitude relationsgiven in Groenewegen & Whitelock (1996), absolute K magni-tudes MK, bolometric magnitudes Mbol, as well as luminosities Lwere calculated and listed in Table 1. Together with the meanapparent K magnitudes individual distances rK could be derivedand are also listed there.
In Groenewegen et al. (2002), a relation between bolomet-ric magnitudes and an IRAS flux ratio was established to derivedistances. Our independent dataset can be used to check this re-lation. The corresponding plot is shown in Fig. 3. For reasonsdiscussed above, IRAS 19548+3035 was omitted in the figure.
4. Discussion and conclusions
Near-infrared observations for a sample of 47 infrared carbonstars are presented, with reliable periods for 31 of them. All am-plitudes are such that these objects are Mira type variables. Thelongest two periods are 840 and 870 days, only slightly longerthan the previously longest known period for a galactic carbonstar of 783 days. Still, this is considerably shorter than the peri-ods of some OH/IR stars. As the present survey was targeted atcarbon stars that are likely to be among those with the longestperiods expected, this difference appears real.
F. Kerschbaum et al.: Near-infrared variability of a sample of galactic carbon Miras 543
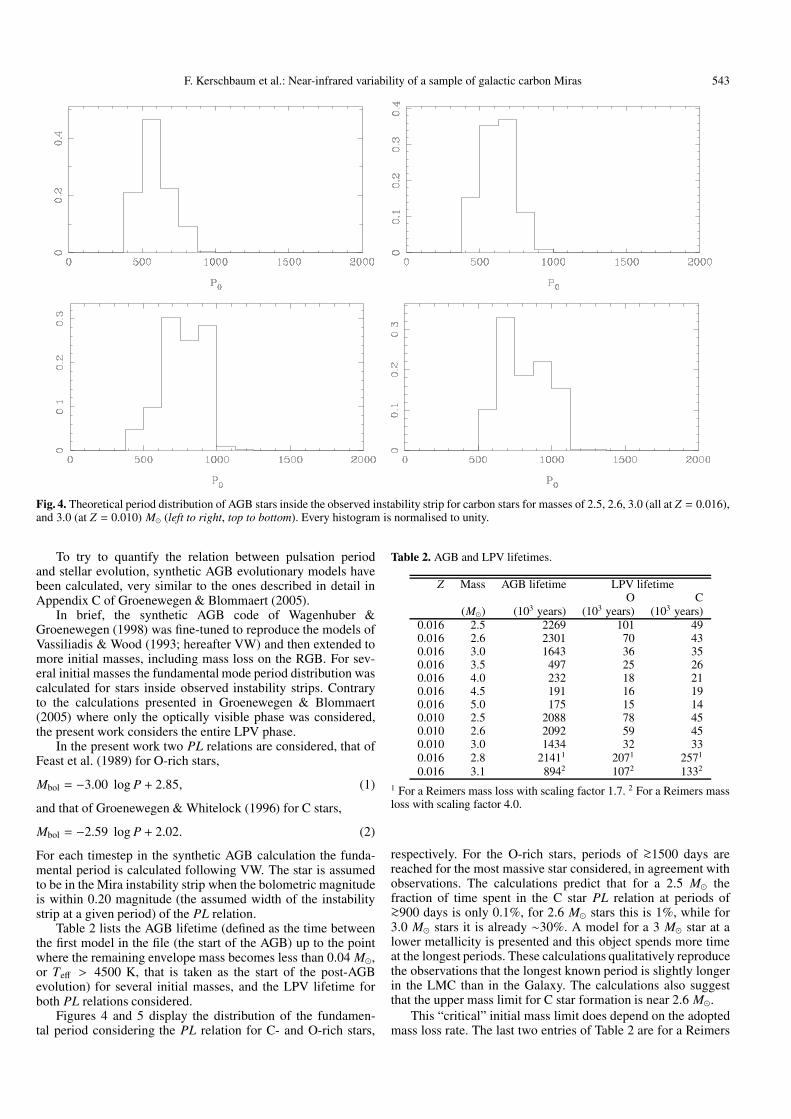
Fig. 4. Theoretical period distribution of AGB stars inside the observed instability strip for carbon stars for masses of 2.5, 2.6, 3.0 (all at Z = 0.016),and 3.0 (at Z = 0.010) M� (left to right, top to bottom). Every histogram is normalised to unity.
To try to quantify the relation between pulsation periodand stellar evolution, synthetic AGB evolutionary models havebeen calculated, very similar to the ones described in detail inAppendix C of Groenewegen & Blommaert (2005).
In brief, the synthetic AGB code of Wagenhuber &Groenewegen (1998) was fine-tuned to reproduce the models ofVassiliadis & Wood (1993; hereafter VW) and then extended tomore initial masses, including mass loss on the RGB. For sev-eral initial masses the fundamental mode period distribution wascalculated for stars inside observed instability strips. Contraryto the calculations presented in Groenewegen & Blommaert(2005) where only the optically visible phase was considered,the present work considers the entire LPV phase.
In the present work two PL relations are considered, that ofFeast et al. (1989) for O-rich stars,
Mbol = −3.00 log P + 2.85, (1)
and that of Groenewegen & Whitelock (1996) for C stars,
Mbol = −2.59 log P + 2.02. (2)
For each timestep in the synthetic AGB calculation the funda-mental period is calculated following VW. The star is assumedto be in the Mira instability strip when the bolometric magnitudeis within 0.20 magnitude (the assumed width of the instabilitystrip at a given period) of the PL relation.
Table 2 lists the AGB lifetime (defined as the time betweenthe first model in the file (the start of the AGB) up to the pointwhere the remaining envelope mass becomes less than 0.04 M�,or Teff > 4500 K, that is taken as the start of the post-AGBevolution) for several initial masses, and the LPV lifetime forboth PL relations considered.
Figures 4 and 5 display the distribution of the fundamen-tal period considering the PL relation for C- and O-rich stars,
Table 2. AGB and LPV lifetimes.
Z Mass AGB lifetime LPV lifetimeO C
(M�) (103 years) (103 years) (103 years)0.016 2.5 2269 101 490.016 2.6 2301 70 430.016 3.0 1643 36 350.016 3.5 497 25 260.016 4.0 232 18 210.016 4.5 191 16 190.016 5.0 175 15 140.010 2.5 2088 78 450.010 2.6 2092 59 450.010 3.0 1434 32 330.016 2.8 21411 2071 2571
0.016 3.1 8942 1072 1332
1 For a Reimers mass loss with scaling factor 1.7. 2 For a Reimers massloss with scaling factor 4.0.
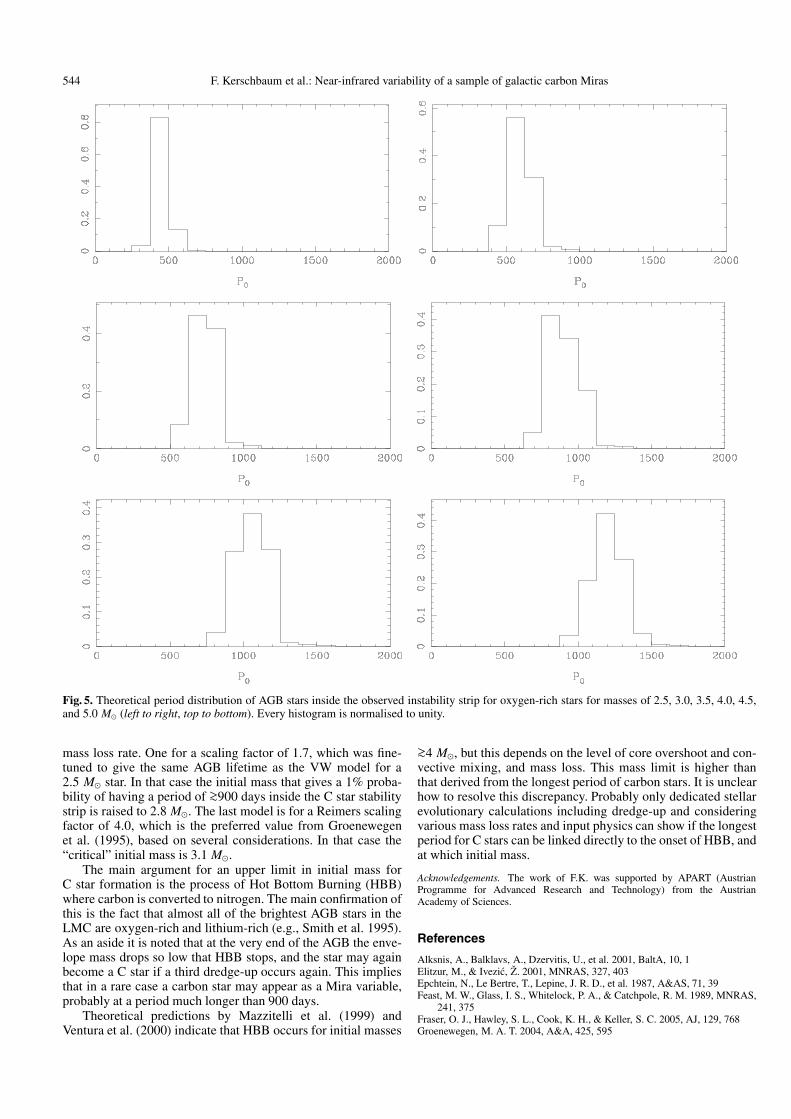
respectively. For the O-rich stars, periods of >∼1500 days arereached for the most massive star considered, in agreement withobservations. The calculations predict that for a 2.5 M� thefraction of time spent in the C star PL relation at periods of>∼900 days is only 0.1%, for 2.6 M� stars this is 1%, while for3.0 M� stars it is already ∼30%. A model for a 3 M� star at alower metallicity is presented and this object spends more timeat the longest periods. These calculations qualitatively reproducethe observations that the longest known period is slightly longerin the LMC than in the Galaxy. The calculations also suggestthat the upper mass limit for C star formation is near 2.6 M�.
This “critical” initial mass limit does depend on the adoptedmass loss rate. The last two entries of Table 2 are for a Reimers
544 F. Kerschbaum et al.: Near-infrared variability of a sample of galactic carbon Miras
Fig. 5. Theoretical period distribution of AGB stars inside the observed instability strip for oxygen-rich stars for masses of 2.5, 3.0, 3.5, 4.0, 4.5,and 5.0 M� (left to right, top to bottom). Every histogram is normalised to unity.
mass loss rate. One for a scaling factor of 1.7, which was fine-tuned to give the same AGB lifetime as the VW model for a2.5 M� star. In that case the initial mass that gives a 1% proba-bility of having a period of >∼900 days inside the C star stabilitystrip is raised to 2.8 M�. The last model is for a Reimers scalingfactor of 4.0, which is the preferred value from Groenewegenet al. (1995), based on several considerations. In that case the“critical” initial mass is 3.1 M�.
The main argument for an upper limit in initial mass forC star formation is the process of Hot Bottom Burning (HBB)where carbon is converted to nitrogen. The main confirmation ofthis is the fact that almost all of the brightest AGB stars in theLMC are oxygen-rich and lithium-rich (e.g., Smith et al. 1995).As an aside it is noted that at the very end of the AGB the enve-lope mass drops so low that HBB stops, and the star may againbecome a C star if a third dredge-up occurs again. This impliesthat in a rare case a carbon star may appear as a Mira variable,probably at a period much longer than 900 days.
Theoretical predictions by Mazzitelli et al. (1999) andVentura et al. (2000) indicate that HBB occurs for initial masses
>∼4 M�, but this depends on the level of core overshoot and con-vective mixing, and mass loss. This mass limit is higher thanthat derived from the longest period of carbon stars. It is unclearhow to resolve this discrepancy. Probably only dedicated stellarevolutionary calculations including dredge-up and consideringvarious mass loss rates and input physics can show if the longestperiod for C stars can be linked directly to the onset of HBB, andat which initial mass.
Acknowledgements. The work of F.K. was supported by APART (AustrianProgramme for Advanced Research and Technology) from the AustrianAcademy of Sciences.
References
Alksnis, A., Balklavs, A., Dzervitis, U., et al. 2001, BaltA, 10, 1Elitzur, M., & Ivezic, Ž. 2001, MNRAS, 327, 403Epchtein, N., Le Bertre, T., Lepine, J. R. D., et al. 1987, A&AS, 71, 39Feast, M. W., Glass, I. S., Whitelock, P. A., & Catchpole, R. M. 1989, MNRAS,
241, 375Fraser, O. J., Hawley, S. L., Cook, K. H., & Keller, S. C. 2005, AJ, 129, 768Groenewegen, M. A. T. 2004, A&A, 425, 595
F. Kerschbaum et al.: Near-infrared variability of a sample of galactic carbon Miras 545
Groenewegen, M. A. T., & Blommaert, J. A. D. L. 2005, A&A, 443, 143Groenewegen, M. A. T., & Whitelock, P. 1996, MNRAS, 281, 1347Groenewegen, M. A. T., Oudmaijer, R. D., Goudfrooij, P., van den Hoek, L. B.,
& van Kerkwijk, M. H. 1996, A&A, 305, 475Groenewegen, M. A. T., Van den Hoek, L. B., & de Jong, T. 1995, A&A, 293,
381Groenewegen, M. A. T., Sevenster, M., Spoon, H. W. W., & Pèrez, I. 2002, A&A,
390, 501Höfner, S. 1999, A&A, 346, L9Höfner, S., Jørgensen, U. G., Loidl, R., & Aringer, B. 1998, A&A, 340, 497IRAS Science Team 1988, IRAS Catalogs and Atlases, Volumes 2–6, NASA
RP–1190Ita, Y., Tanabé, T., Matsunaga, N., et al. 2004, MNRAS, 347, 720Jones, T. J., Bryja, C. O., Gehrz, T. E. H., et al. 1990, ApJS, 74, 785Kastner, J. H., Forveille, T., Zuckerman, B., & Omont, A. 1993, A&A, 275, 163Kiss, L., & Bedding, T. 2004, MNRAS, 347, L83Koornneef, J. 1983a, A&AS, 51, 489Koornneef, J. 1983b, A&A, 128, 84Le Bertre, T. 1992, A&AS, 94, 377Lebzelter, T. 1999, A&A, 351, 644Loumos, G. L., & Deeming, T. J. 1978, Ap&SS, 56, 285
Loup, C., Forveille, T., Omont, A., & Paul, J. F. 1993, A&AS, 99, 291Mazzitelli, I., D’Antona, F., & Ventura, P. 1999, A&A, 348, 846Nowotny, W., Lebzelter, T., Hron, J., & Höfner, S. 2005, A&A, 437, 285Pojmansky, G. 2002, Acta Astronomica, 52, 397Rejkuba M. 2004, A&A, 413, 903Smith, V. V., Plez, B., Lambert, D. L., & Lubowich, D. A. 1995, ApJ, 441, 735Sperl, M. 1998, Comm. Asteroseismology (Vienna), 111, 1van Langevelde, H. J., van der Heiden, R., & van Schooneveld, C. 1990, A&A,
239, 193Vassiliadis, E, & Wood, P. R. 1993, ApJ, 413, 641 (VW)Ventura, P., Mazzitelli, I., & D’Antona, F. 2000, A&A, 363, 605Wagenhuber, J., & Groenewegen, M. A. T. 1998, A&A, 340, 183Whitelock, P. A., Feast, M. W., van Loon, J. Th., & Zijlstra, A. A. 2003,
MNRAS, 342, 86Whitelock, P. A., Feast, M. W., Marang, F., & Groenewegen, M. A. T. 2006,
MNRAS, 369, 751Winters, J. M., Keady, J. J., Gauger, A., & Sada, P. V. 2000, A&A, 359, 651Wood, P. R., Alcock, C., Allsman, R. A., et al. 1999, in Asymptotic Giant Branch
Stars, ed. T. Le Bertre, A. Lèbre, & C. Waelkens, IAU Symp., 191, ASP, 151Wozniak, P. R., Vestrand, W. T., Akerlof, C. W., et al. 2004, AJ, 127, 2436
F. Kerschbaum et al.: Near-infrared variability of a sample of galactic carbon Miras, Online Material p 1
Online Material

F. Kerschbaum et al.: Near-infrared variability of a sample of galactic carbon Miras, Online Material p 2
Table A.1. Mean total errors of NIR photometry.
Mag σJ σH σK σL′<5 0.m02 0.m02 0.m02 0.m025–8 0.m03 0.m02 0.m02 0.m048–11 0.m04 0.m03 0.m03
11–14 0.m06
Appendix A: NIR photometry
Estimates of the mean total errors of the NIR photometry aregiven in Table A.1. The given values are calculated from theindividual programme- and standard-star measurements. The er-rors do not include uncertainties of the photometric system.
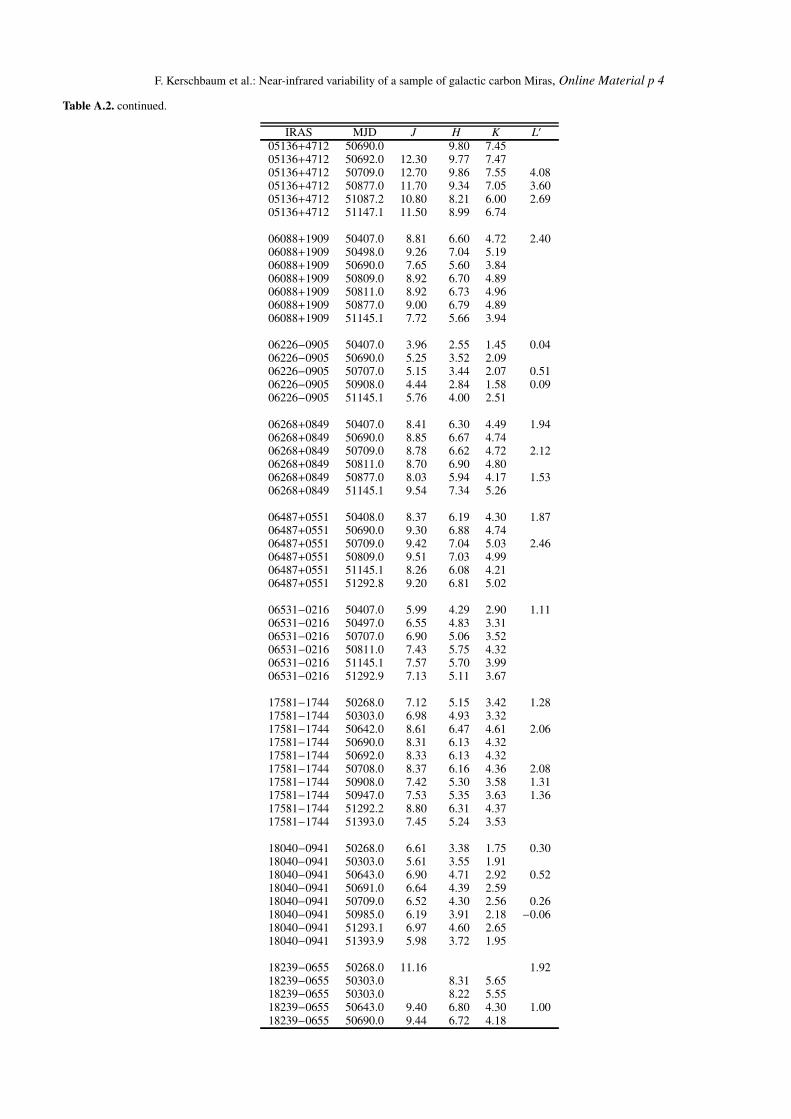
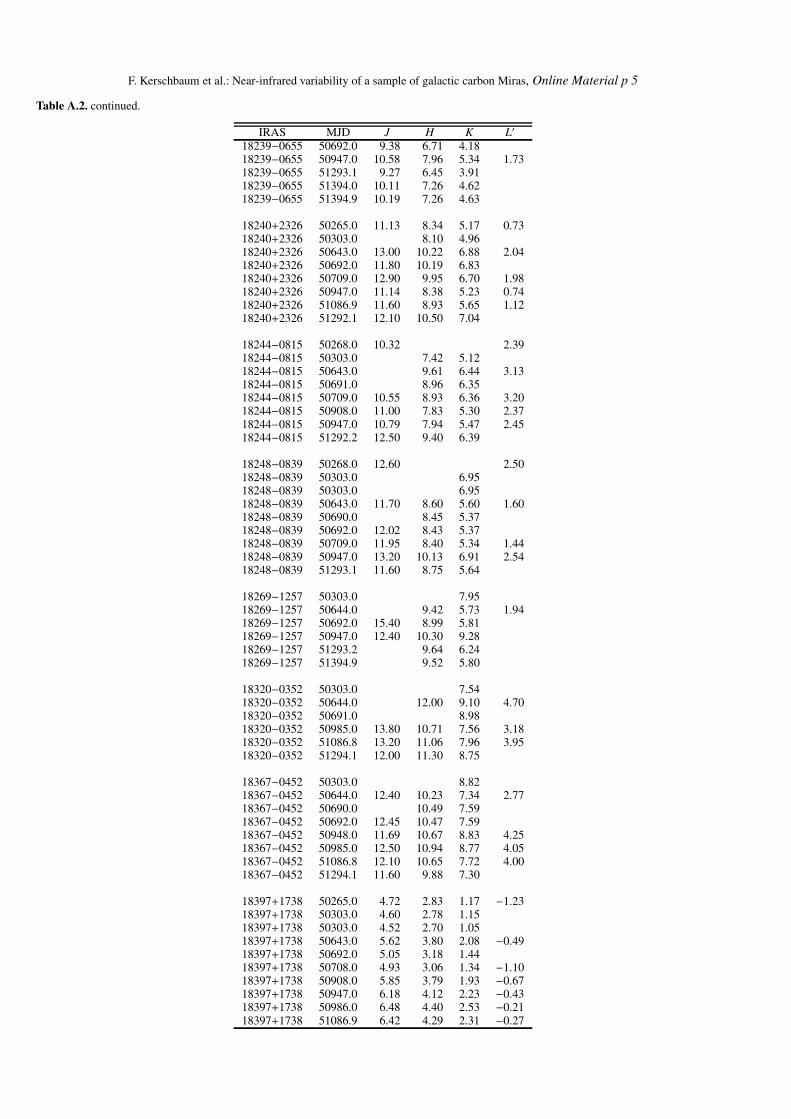
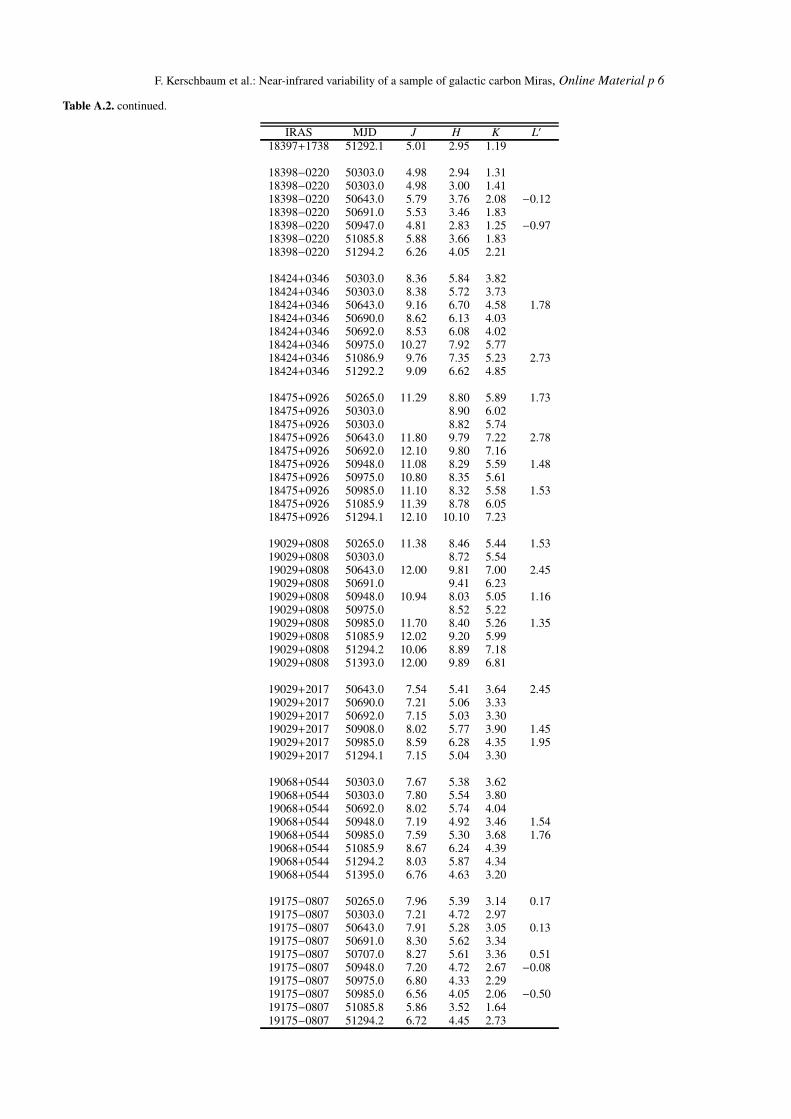
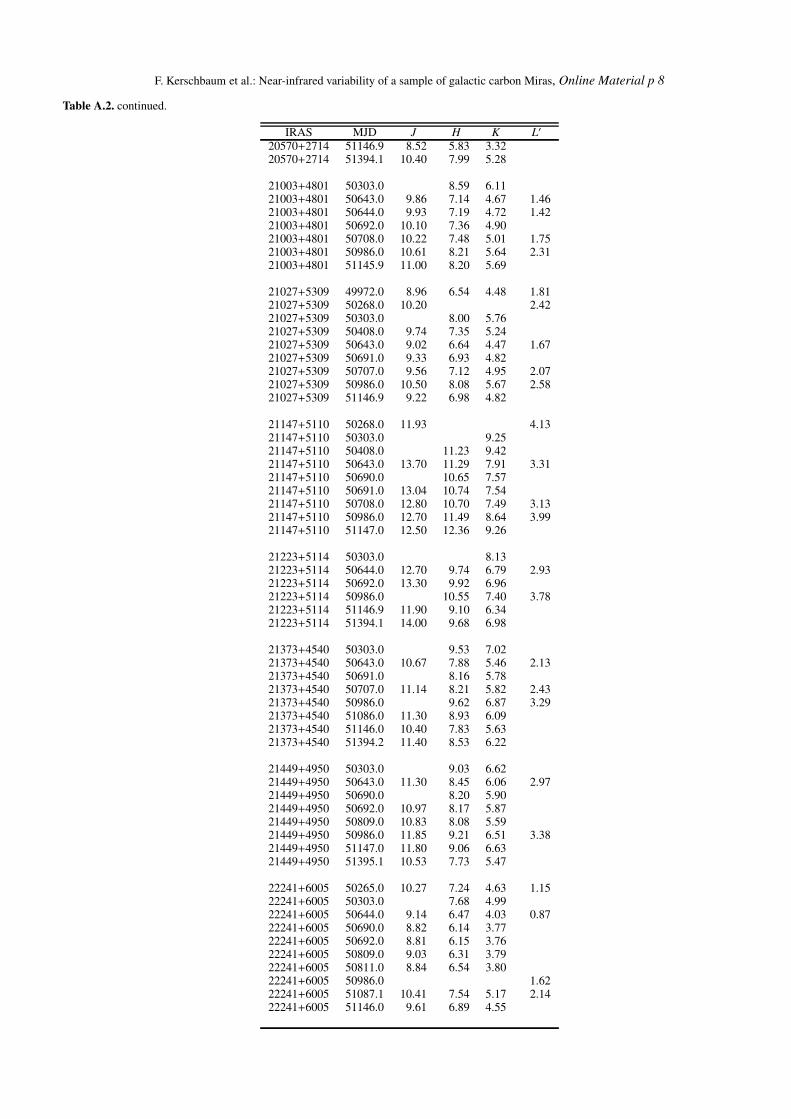
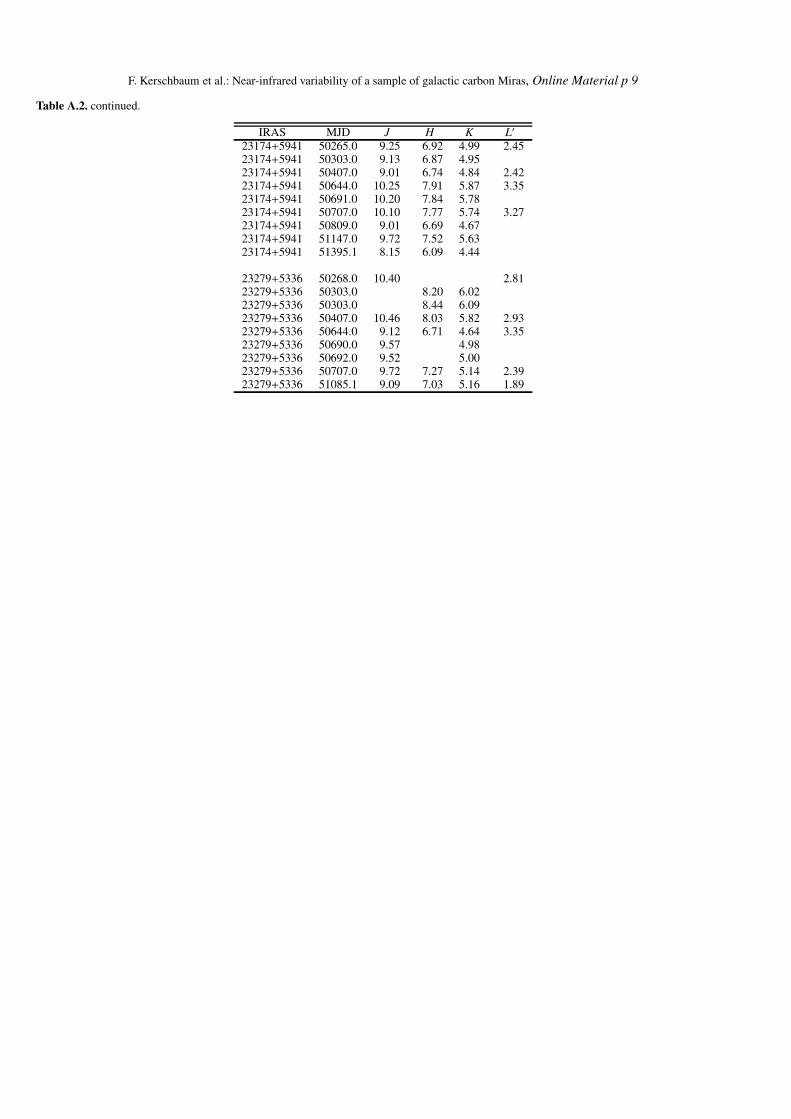
Table A.2 lists all near-infrared photometry presented in thispaper. Besides IRAS name, the modified Julian day number isgiven.

F. Kerschbaum et al.: Near-infrared variability of a sample of galactic carbon Miras, Online Material p 3
Table A.2. Individual NIR photometry.
IRAS MJD J H K L′
01105+6241 50407.0 4.97 3.24 1.90 0.2701105+6241 50498.0 4.34 2.69 1.4201105+6241 50644.0 4.58 2.86 1.54 −0.1101105+6241 50690.0 4.91 3.16 1.7801105+6241 50707.0 5.06 3.30 1.91 0.2301105+6241 51085.1 5.15 3.78 2.77 0.5601105+6241 51144.9 4.13 2.58 1.34
02152+2822 50303.0 9.40 6.3102152+2822 50303.0 9.35 6.3002152+2822 50407.0 12.11 9.31 6.31 2.0502152+2822 50692.0 13.30 10.93 7.8102152+2822 50708.0 13.30 10.94 7.83 3.2202152+2822 50809.0 13.10 10.76 7.6502152+2822 51086.1 12.80 9.54 6.52
03192+5642 50303.0 9.31 7.01 5.2703192+5642 50303.0 9.19 6.93 5.2103192+5642 50408.0 8.06 6.01 4.50 2.5103192+5642 50690.0 9.19 6.90 5.1803192+5642 50692.0 9.13 6.85 5.1403192+5642 50707.0 8.98 6.74 5.08 3.2303192+5642 51085.2 9.59 7.33 5.37 3.9303192+5642 51144.9 8.68 6.47 4.85
03238+6034 50303.0 9.32 6.8203238+6034 50303.0 9.20 6.8203238+6034 50408.0 11.90 8.84 6.47 3.1603238+6034 50498.0 7.81 5.5603238+6034 50692.0 10.86 7.96 5.6103238+6034 50709.0 11.20 8.12 5.74 2.5703238+6034 50809.0 12.20 9.34 6.7303238+6034 50877.0 12.40 9.35 6.77 3.3003238+6034 51085.2 11.40 8.77 6.41 3.6703238+6034 51144.9 10.20 7.51 5.21
03385+5927 50303.0 8.90 6.3203385+5927 50303.0 8.76 6.2003385+5927 50408.0 11.26 8.34 5.81 2.4203385+5927 50498.0 9.14 6.5103385+5927 50690.0 10.57 7.7903385+5927 50692.0 12.80 10.64 7.8303385+5927 50811.0 12.60 10.67 7.7303385+5927 50877.0 12.90 9.44 6.7003385+5927 51087.1 11.60 8.73 6.09 2.4803385+5927 51145.0 12.10 9.43 6.68
03448+4432 49970.0 14.90 11.49 8.20 3.8003448+4432 50303.0 9.60 6.5603448+4432 50407.0 12.66 9.70 6.72 2.5803448+4432 50690.0 11.42 7.8703448+4432 50692.0 14.30 11.17 7.9103448+4432 50708.0 15.90 11.14 7.91 3.7003448+4432 50809.0 13.50 10.96 7.5703448+4432 51145.0 12.40 9.74 6.68
04179+5951 50303.0 8.20 5.9404179+5951 50303.0 8.26 6.0004179+5951 50498.0 8.30 6.0404179+5951 50691.0 10.04 7.45 4.9304179+5951 50809.0 11.15 8.39 5.9404179+5951 51085.2 8.06 6.06 3.2004179+5951 51145.0 9.52 7.01 4.85
05136+4712 50303.0 9.75 7.2305136+4712 50407.0 10.85 8.40 6.22 2.9205136+4712 50497.0 8.33 6.11
F. Kerschbaum et al.: Near-infrared variability of a sample of galactic carbon Miras, Online Material p 4
Table A.2. continued.
IRAS MJD J H K L′
05136+4712 50690.0 9.80 7.4505136+4712 50692.0 12.30 9.77 7.4705136+4712 50709.0 12.70 9.86 7.55 4.0805136+4712 50877.0 11.70 9.34 7.05 3.6005136+4712 51087.2 10.80 8.21 6.00 2.6905136+4712 51147.1 11.50 8.99 6.74
06088+1909 50407.0 8.81 6.60 4.72 2.4006088+1909 50498.0 9.26 7.04 5.1906088+1909 50690.0 7.65 5.60 3.8406088+1909 50809.0 8.92 6.70 4.8906088+1909 50811.0 8.92 6.73 4.9606088+1909 50877.0 9.00 6.79 4.8906088+1909 51145.1 7.72 5.66 3.94
06226−0905 50407.0 3.96 2.55 1.45 0.0406226−0905 50690.0 5.25 3.52 2.0906226−0905 50707.0 5.15 3.44 2.07 0.5106226−0905 50908.0 4.44 2.84 1.58 0.0906226−0905 51145.1 5.76 4.00 2.51
06268+0849 50407.0 8.41 6.30 4.49 1.9406268+0849 50690.0 8.85 6.67 4.7406268+0849 50709.0 8.78 6.62 4.72 2.1206268+0849 50811.0 8.70 6.90 4.8006268+0849 50877.0 8.03 5.94 4.17 1.5306268+0849 51145.1 9.54 7.34 5.26
06487+0551 50408.0 8.37 6.19 4.30 1.8706487+0551 50690.0 9.30 6.88 4.7406487+0551 50709.0 9.42 7.04 5.03 2.4606487+0551 50809.0 9.51 7.03 4.9906487+0551 51145.1 8.26 6.08 4.2106487+0551 51292.8 9.20 6.81 5.02
06531−0216 50407.0 5.99 4.29 2.90 1.1106531−0216 50497.0 6.55 4.83 3.3106531−0216 50707.0 6.90 5.06 3.5206531−0216 50811.0 7.43 5.75 4.3206531−0216 51145.1 7.57 5.70 3.9906531−0216 51292.9 7.13 5.11 3.67
17581−1744 50268.0 7.12 5.15 3.42 1.2817581−1744 50303.0 6.98 4.93 3.3217581−1744 50642.0 8.61 6.47 4.61 2.0617581−1744 50690.0 8.31 6.13 4.3217581−1744 50692.0 8.33 6.13 4.3217581−1744 50708.0 8.37 6.16 4.36 2.0817581−1744 50908.0 7.42 5.30 3.58 1.3117581−1744 50947.0 7.53 5.35 3.63 1.3617581−1744 51292.2 8.80 6.31 4.3717581−1744 51393.0 7.45 5.24 3.53
18040−0941 50268.0 6.61 3.38 1.75 0.3018040−0941 50303.0 5.61 3.55 1.9118040−0941 50643.0 6.90 4.71 2.92 0.5218040−0941 50691.0 6.64 4.39 2.5918040−0941 50709.0 6.52 4.30 2.56 0.2618040−0941 50985.0 6.19 3.91 2.18 −0.0618040−0941 51293.1 6.97 4.60 2.6518040−0941 51393.9 5.98 3.72 1.95
18239−0655 50268.0 11.16 1.9218239−0655 50303.0 8.31 5.6518239−0655 50303.0 8.22 5.5518239−0655 50643.0 9.40 6.80 4.30 1.0018239−0655 50690.0 9.44 6.72 4.18
F. Kerschbaum et al.: Near-infrared variability of a sample of galactic carbon Miras, Online Material p 5
Table A.2. continued.
IRAS MJD J H K L′
18239−0655 50692.0 9.38 6.71 4.1818239−0655 50947.0 10.58 7.96 5.34 1.7318239−0655 51293.1 9.27 6.45 3.9118239−0655 51394.0 10.11 7.26 4.6218239−0655 51394.9 10.19 7.26 4.63
18240+2326 50265.0 11.13 8.34 5.17 0.7318240+2326 50303.0 8.10 4.9618240+2326 50643.0 13.00 10.22 6.88 2.0418240+2326 50692.0 11.80 10.19 6.8318240+2326 50709.0 12.90 9.95 6.70 1.9818240+2326 50947.0 11.14 8.38 5.23 0.7418240+2326 51086.9 11.60 8.93 5.65 1.1218240+2326 51292.1 12.10 10.50 7.04
18244−0815 50268.0 10.32 2.3918244−0815 50303.0 7.42 5.1218244−0815 50643.0 9.61 6.44 3.1318244−0815 50691.0 8.96 6.3518244−0815 50709.0 10.55 8.93 6.36 3.2018244−0815 50908.0 11.00 7.83 5.30 2.3718244−0815 50947.0 10.79 7.94 5.47 2.4518244−0815 51292.2 12.50 9.40 6.39
18248−0839 50268.0 12.60 2.5018248−0839 50303.0 6.9518248−0839 50303.0 6.9518248−0839 50643.0 11.70 8.60 5.60 1.6018248−0839 50690.0 8.45 5.3718248−0839 50692.0 12.02 8.43 5.3718248−0839 50709.0 11.95 8.40 5.34 1.4418248−0839 50947.0 13.20 10.13 6.91 2.5418248−0839 51293.1 11.60 8.75 5.64
18269−1257 50303.0 7.9518269−1257 50644.0 9.42 5.73 1.9418269−1257 50692.0 15.40 8.99 5.8118269−1257 50947.0 12.40 10.30 9.2818269−1257 51293.2 9.64 6.2418269−1257 51394.9 9.52 5.80
18320−0352 50303.0 7.5418320−0352 50644.0 12.00 9.10 4.7018320−0352 50691.0 8.9818320−0352 50985.0 13.80 10.71 7.56 3.1818320−0352 51086.8 13.20 11.06 7.96 3.9518320−0352 51294.1 12.00 11.30 8.75
18367−0452 50303.0 8.8218367−0452 50644.0 12.40 10.23 7.34 2.7718367−0452 50690.0 10.49 7.5918367−0452 50692.0 12.45 10.47 7.5918367−0452 50948.0 11.69 10.67 8.83 4.2518367−0452 50985.0 12.50 10.94 8.77 4.0518367−0452 51086.8 12.10 10.65 7.72 4.0018367−0452 51294.1 11.60 9.88 7.30
18397+1738 50265.0 4.72 2.83 1.17 −1.2318397+1738 50303.0 4.60 2.78 1.1518397+1738 50303.0 4.52 2.70 1.0518397+1738 50643.0 5.62 3.80 2.08 −0.4918397+1738 50692.0 5.05 3.18 1.4418397+1738 50708.0 4.93 3.06 1.34 −1.1018397+1738 50908.0 5.85 3.79 1.93 −0.6718397+1738 50947.0 6.18 4.12 2.23 −0.4318397+1738 50986.0 6.48 4.40 2.53 −0.2118397+1738 51086.9 6.42 4.29 2.31 −0.27
F. Kerschbaum et al.: Near-infrared variability of a sample of galactic carbon Miras, Online Material p 6
Table A.2. continued.
IRAS MJD J H K L′
18397+1738 51292.1 5.01 2.95 1.19
18398−0220 50303.0 4.98 2.94 1.3118398−0220 50303.0 4.98 3.00 1.4118398−0220 50643.0 5.79 3.76 2.08 −0.1218398−0220 50691.0 5.53 3.46 1.8318398−0220 50947.0 4.81 2.83 1.25 −0.9718398−0220 51085.8 5.88 3.66 1.8318398−0220 51294.2 6.26 4.05 2.21
18424+0346 50303.0 8.36 5.84 3.8218424+0346 50303.0 8.38 5.72 3.7318424+0346 50643.0 9.16 6.70 4.58 1.7818424+0346 50690.0 8.62 6.13 4.0318424+0346 50692.0 8.53 6.08 4.0218424+0346 50975.0 10.27 7.92 5.7718424+0346 51086.9 9.76 7.35 5.23 2.7318424+0346 51292.2 9.09 6.62 4.85
18475+0926 50265.0 11.29 8.80 5.89 1.7318475+0926 50303.0 8.90 6.0218475+0926 50303.0 8.82 5.7418475+0926 50643.0 11.80 9.79 7.22 2.7818475+0926 50692.0 12.10 9.80 7.1618475+0926 50948.0 11.08 8.29 5.59 1.4818475+0926 50975.0 10.80 8.35 5.6118475+0926 50985.0 11.10 8.32 5.58 1.5318475+0926 51085.9 11.39 8.78 6.0518475+0926 51294.1 12.10 10.10 7.23
19029+0808 50265.0 11.38 8.46 5.44 1.5319029+0808 50303.0 8.72 5.5419029+0808 50643.0 12.00 9.81 7.00 2.4519029+0808 50691.0 9.41 6.2319029+0808 50948.0 10.94 8.03 5.05 1.1619029+0808 50975.0 8.52 5.2219029+0808 50985.0 11.70 8.40 5.26 1.3519029+0808 51085.9 12.02 9.20 5.9919029+0808 51294.2 10.06 8.89 7.1819029+0808 51393.0 12.00 9.89 6.81
19029+2017 50643.0 7.54 5.41 3.64 2.4519029+2017 50690.0 7.21 5.06 3.3319029+2017 50692.0 7.15 5.03 3.3019029+2017 50908.0 8.02 5.77 3.90 1.4519029+2017 50985.0 8.59 6.28 4.35 1.9519029+2017 51294.1 7.15 5.04 3.30
19068+0544 50303.0 7.67 5.38 3.6219068+0544 50303.0 7.80 5.54 3.8019068+0544 50692.0 8.02 5.74 4.0419068+0544 50948.0 7.19 4.92 3.46 1.5419068+0544 50985.0 7.59 5.30 3.68 1.7619068+0544 51085.9 8.67 6.24 4.3919068+0544 51294.2 8.03 5.87 4.3419068+0544 51395.0 6.76 4.63 3.20
19175−0807 50265.0 7.96 5.39 3.14 0.1719175−0807 50303.0 7.21 4.72 2.9719175−0807 50643.0 7.91 5.28 3.05 0.1319175−0807 50691.0 8.30 5.62 3.3419175−0807 50707.0 8.27 5.61 3.36 0.5119175−0807 50948.0 7.20 4.72 2.67 −0.0819175−0807 50975.0 6.80 4.33 2.2919175−0807 50985.0 6.56 4.05 2.06 −0.5019175−0807 51085.8 5.86 3.52 1.6419175−0807 51294.2 6.72 4.45 2.73

F. Kerschbaum et al.: Near-infrared variability of a sample of galactic carbon Miras, Online Material p 7
Table A.2. continued.
IRAS MJD J H K L′
19455+0920 50268.0 12.64 3.7419455+0920 50303.0 7.4919455+0920 50642.0 11.97 9.75 6.70 3.0319455+0920 50692.0 12.47 9.68 7.0719455+0920 51085.9 11.10 8.35 5.8119455+0920 51146.8 11.80 8.72 6.1119455+0920 51293.2 12.20 10.15 7.6719455+0920 51394.0 12.60 9.95 7.30
19548+3035 50268.0 10.28 4.9619548+3035 50303.0 8.90 8.4419548+3035 50303.0 8.88 8.3819548+3035 50644.0 10.16 8.95 8.49 6.6019548+3035 50691.0 10.13 8.92 8.5319548+3035 51393.0 10.25 9.03 8.44
20072+3116 49967.0 7.22 4.92 3.19 0.8620072+3116 50690.0 6.81 4.61 2.8220072+3116 50692.0 6.78 4.61 2.8320072+3116 50709.0 6.76 4.56 2.78 0.3120072+3116 50908.0 6.98 4.74 2.93 0.3720072+3116 50985.0 7.57 5.28 3.41 0.8520072+3116 51145.8 8.70 6.33 4.3520072+3116 51293.2 8.24 6.10 3.8720072+3116 51394.1 7.07 4.85 3.00
20082+3228 50303.0 7.51 5.1920082+3228 50644.0 11.80 9.15 6.58 3.1120082+3228 50692.0 12.10 9.24 6.6120082+3228 50985.0 11.27 8.12 5.62 2.4520082+3228 51146.8 12.10 9.54 6.9120082+3228 51395.0 11.78 8.80 6.20
20171+3519 50303.0 8.7620171+3519 50643.0 10.20 7.00 3.0020171+3519 50985.0 12.90 13.00 9.00 4.4020171+3519 51145.9 10.50 9.04 8.4720171+3519 51293.2 13.20 11.80 8.09
20435+3825 50265.0 11.21 8.28 5.88 1.9620435+3825 50303.0 8.39 5.6720435+3825 50642.0 12.03 9.00 6.25 2.6420435+3825 50692.0 11.36 8.45 5.7820435+3825 50707.0 12.01 8.91 6.24 2.7320435+3825 50986.0 11.90 8.91 6.11 2.4820435+3825 51145.9 11.70 8.90 6.3020435+3825 51293.3 11.70 8.09 5.5520435+3825 51395.1 10.25 7.48 5.07
20532+5554 50303.0 8.55 5.8720532+5554 50303.0 8.63 5.9320532+5554 50303.0 8.76 6.1220532+5554 50642.0 11.82 9.20 6.37 2.6020532+5554 50691.0 8.63 5.9320532+5554 50809.0 11.20 8.19 5.3520532+5554 50986.0 12.20 9.21 6.34 2.5720532+5554 51146.9 13.00 9.96 7.1720532+5554 51294.2 12.00 9.10 6.56
20570+2714 49968.0 9.68 7.01 4.56 0.9820570+2714 50266.0 9.92 0.9220570+2714 50303.0 9.07 6.38 3.9020570+2714 50642.0 9.96 7.17 4.55 0.9920570+2714 50692.0 10.30 7.70 5.0120570+2714 50709.0 10.51 7.83 5.14 1.3520570+2714 50986.0 9.15 6.38 3.61 0.21
F. Kerschbaum et al.: Near-infrared variability of a sample of galactic carbon Miras, Online Material p 8
Table A.2. continued.
IRAS MJD J H K L′
20570+2714 51146.9 8.52 5.83 3.3220570+2714 51394.1 10.40 7.99 5.28
21003+4801 50303.0 8.59 6.1121003+4801 50643.0 9.86 7.14 4.67 1.4621003+4801 50644.0 9.93 7.19 4.72 1.4221003+4801 50692.0 10.10 7.36 4.9021003+4801 50708.0 10.22 7.48 5.01 1.7521003+4801 50986.0 10.61 8.21 5.64 2.3121003+4801 51145.9 11.00 8.20 5.69
21027+5309 49972.0 8.96 6.54 4.48 1.8121027+5309 50268.0 10.20 2.4221027+5309 50303.0 8.00 5.7621027+5309 50408.0 9.74 7.35 5.2421027+5309 50643.0 9.02 6.64 4.47 1.6721027+5309 50691.0 9.33 6.93 4.8221027+5309 50707.0 9.56 7.12 4.95 2.0721027+5309 50986.0 10.50 8.08 5.67 2.5821027+5309 51146.9 9.22 6.98 4.82
21147+5110 50268.0 11.93 4.1321147+5110 50303.0 9.2521147+5110 50408.0 11.23 9.4221147+5110 50643.0 13.70 11.29 7.91 3.3121147+5110 50690.0 10.65 7.5721147+5110 50691.0 13.04 10.74 7.5421147+5110 50708.0 12.80 10.70 7.49 3.1321147+5110 50986.0 12.70 11.49 8.64 3.9921147+5110 51147.0 12.50 12.36 9.26
21223+5114 50303.0 8.1321223+5114 50644.0 12.70 9.74 6.79 2.9321223+5114 50692.0 13.30 9.92 6.9621223+5114 50986.0 10.55 7.40 3.7821223+5114 51146.9 11.90 9.10 6.3421223+5114 51394.1 14.00 9.68 6.98
21373+4540 50303.0 9.53 7.0221373+4540 50643.0 10.67 7.88 5.46 2.1321373+4540 50691.0 8.16 5.7821373+4540 50707.0 11.14 8.21 5.82 2.4321373+4540 50986.0 9.62 6.87 3.2921373+4540 51086.0 11.30 8.93 6.0921373+4540 51146.0 10.40 7.83 5.6321373+4540 51394.2 11.40 8.53 6.22
21449+4950 50303.0 9.03 6.6221449+4950 50643.0 11.30 8.45 6.06 2.9721449+4950 50690.0 8.20 5.9021449+4950 50692.0 10.97 8.17 5.8721449+4950 50809.0 10.83 8.08 5.5921449+4950 50986.0 11.85 9.21 6.51 3.3821449+4950 51147.0 11.80 9.06 6.6321449+4950 51395.1 10.53 7.73 5.47
22241+6005 50265.0 10.27 7.24 4.63 1.1522241+6005 50303.0 7.68 4.9922241+6005 50644.0 9.14 6.47 4.03 0.8722241+6005 50690.0 8.82 6.14 3.7722241+6005 50692.0 8.81 6.15 3.7622241+6005 50809.0 9.03 6.31 3.7922241+6005 50811.0 8.84 6.54 3.8022241+6005 50986.0 1.6222241+6005 51087.1 10.41 7.54 5.17 2.1422241+6005 51146.0 9.61 6.89 4.55
F. Kerschbaum et al.: Near-infrared variability of a sample of galactic carbon Miras, Online Material p 9
Table A.2. continued.
IRAS MJD J H K L′
23174+5941 50265.0 9.25 6.92 4.99 2.4523174+5941 50303.0 9.13 6.87 4.9523174+5941 50407.0 9.01 6.74 4.84 2.4223174+5941 50644.0 10.25 7.91 5.87 3.3523174+5941 50691.0 10.20 7.84 5.7823174+5941 50707.0 10.10 7.77 5.74 3.2723174+5941 50809.0 9.01 6.69 4.6723174+5941 51147.0 9.72 7.52 5.6323174+5941 51395.1 8.15 6.09 4.44
23279+5336 50268.0 10.40 2.8123279+5336 50303.0 8.20 6.0223279+5336 50303.0 8.44 6.0923279+5336 50407.0 10.46 8.03 5.82 2.9323279+5336 50644.0 9.12 6.71 4.64 3.3523279+5336 50690.0 9.57 4.9823279+5336 50692.0 9.52 5.0023279+5336 50707.0 9.72 7.27 5.14 2.3923279+5336 51085.1 9.09 7.03 5.16 1.89
Copyright © 2022 FDOKUMEN