Functional Near Infrared Spectroscopy Conference
182
Abstract Book Functional Near Infrared Spectroscopy Conference University College London 26 th -28 th October 2012 Program Chair Clare Elwell Organizing Committee Richard Aslin David Boas Joseph Culver Clare Elwell Maria Angela Franceschini Ted Huppert Charles Nelson Hellmuth Obrig Gentaro Taga Martin Wolf 1
-
Upload
khangminh22 -
Category
Documents
-
view
2 -
download
0
Transcript of Functional Near Infrared Spectroscopy Conference

Abstract Book
Functional Near Infrared Spectroscopy Conference
University College London 26th-28th October 2012
Program Chair Clare Elwell
Organizing Committee Richard Aslin David Boas
Joseph Culver Clare Elwell
Maria Angela Franceschini Ted Huppert
Charles Nelson Hellmuth Obrig
Gentaro Taga Martin Wolf
1

Hosts
Sponsors
2

Session Speaker Location Page #Friday 26th October 2:00pm REGISTRATION OPENS North Cloisters
5:15pm Welcome and Introduction of Sponsors Clare Elwell Cruciform Lecture Theatre5:30pm KEYNOTE: David Boas Cruciform Lecture Theatre Page 13
6:30pm WELCOMERogue Res
Saturday 27th OctoberHARDWARChair: Heid
8:00 -‐ 8:30am Invited Taldiffuse cor(DOS-‐NIRS
8:30-‐8:45 Time resolvgated syste
8:45-‐9:00 Imaging mu
MULTI-‐MOChair: Mar
9:00 -‐ 9:30am False PositInfluencesTasks.
9:30 -‐ 9:45am Neurovasca Rat ModeImpact of ENear Infrar
10:00 -‐ 10:45am COFFEE Sp
DATA ANAChair: Jose
10:45 -‐11:15am Methodolocognitive n
11:15 -‐ 11:30am Low frequespectroscodependent
11:30 -‐ 11:45pm Integrated
11:45 -‐ 12:00pm Is it possibloptical ima
12:00 -‐ 12:15pm Non-‐contafeaturing c
12:15 -‐ 12:30pm Functional
12:30 -‐ 12:45pm Hierarchicaaccuracy an
12:45 -‐ 1:45pm LUNCH S
NEURODEVChair: Rich
1:45 -‐ 2:15pm A cognitive2:15 -‐ 2:30pm Evoked cha
2:30 -‐ 2:45pm Building frosensory co
2:45 -‐ 3:00pm The specifi
3:00 -‐ 5:00pm POSTER VITEA Spons
NEURODEVChair: Gerg
5:00 -‐ 5:30pm NIRS imagi5:30 -‐ 5:45pm Cortical Ma
5:45 -‐ 6:00pm Interactionresponses
6:00 -‐ 6:15pm DevelopmeVisual Wor
6:15 -‐ 6:45pm KEYNOTE LChair: Jerem
7:00 -‐ 11:30pm SOCIAL EV
SCHEDULE
"Trends in Functional Near Infrared Spectroscopy"
RECEPTION Sponsored by Hitachi Medical Corporation and earch Inc.
North Cloisters
E DEVELOPMENTS Cruciform Lecture Theatrerun Wabnitzk: "Ischemic stroke & hybrid diffuse optics combining relation spectroscopy (DCS) and diffuse optical spectroscopy )"
Turgut Durduran
Page 15ed functional near infrared spectroscopy by means of time m at small interfiber distance
Davide ContiniPage 16
ltiple functional networks with diffuse optical tomography Adam T. EggebrechtPage 17
DAL MONITORING Cruciform Lecture Theatreia Angela Franceschiniives in fNIRS: Identifying and Quantifying Systemic on Neurovascular Coupling in fNIRS Data during Cognitive
Ilias Tachtsidis
Page 19ular Coupling Varies with Level of Global Cerebral Ischemia in l
Wesley B BakerPage 20
xtracranial Vessels on Task-‐Evoked Artefacts in Functional ed Spectroscopy for Multiple Tasks
Evgeniya KirilinaPage 21
onsored by Spectratech Inc. North Cloisters
LYSISph Culvergical challenges in the application of fNIRS for infant euroscience
Emmanuel Dupoux Cruciform Lecture TheatrePage 23
ncy oscillations measured in the periphery with near infrared py (NIRS) are strongly correlated with blood oxygen level-‐ functional magnetic resonance imaging (BOLD fMRI) signals
Yunjie Tong
Page 24 Data Analysis Environment for fNIRS Takusige Katura
Page 25e to extract cortical depth information from traditionally 2D ging spectroscopy using concurrent fMRI data?
A.J.Kennerley
Page 26ct photogrammetric spatial registration system for fNIRS olor-‐coded markers
Daisuke Tsuzuki
Page 27Connectivity of the PFC via Partial Correlation Analysis Z. Einalou Page 28l Bayesian estimation with ARD prior improves depth d spatial resolution of diffuse optical tomography
Takeaki ShimokawaPage 29
ponsored by TechEn, Shimadzu and ISS North Cloisters
ELOPMENT (I) Cruciform Lecture Theatreard Aslin neuroscience approach to the early identification of autism Charles Nelson Page 31nges in oxygen consumption in premature neonates Nadege Roche-‐Labarbe
Page 32m Basics: fNIRS recordings from 6-‐month olds investigate rtex selectivity and response suppression
Lauren L. Emberson
Page 33city of the neural response to language at birth Lillian May Page 34
EWING OF EVEN NUMBERED POSTERS North Cloisters and Old Refectoryored by Loptek
ELOPMENT (II) Cruciform Lecture Theatreely Csibrang of spatiotemporal activity in the developing brain Gentaro Taga Page 36pping of 3D Optical Topography in infants Maria D Papademetriou Page 37 between brain maturation and experience: hemodynamic to speech categories in full term and preterm neonates
Minagawa-‐KawaiPage 38
ntal Changes in Frontal-‐Parietal Activation Associated with king Memory Capacity
John SpencerPage 39
ECTURE: Brain connectivity inference for fMRI data Will Penny Cruciform Lecture Theatre Page 41y Hebden
ENT: AN EVENING IN A GREAT BRITISH PUB Jeremy Bentham Pub, University Street
3

Session Speaker Location Page #Sunday 28th October CLOCKS GO BACK ONE HOUR ON SUNDAY MORNING
APPLICATIONS: ADULT (I) Cruciform Lecture TheatreChair: Daniel Leff
8:00 -‐ 8:30am Application of functional near infrared spectroscopy in Psychiatry Andreas FallgatterPage 43
8:30 -‐ 8:45am Physiological Correlates of Perceptual Learning Uma Shahani Page 448:45 -‐ 9:00am Neural correlates of spontaneous deception Kang Lee
Page 459:00 -‐ 9:15am Frontal activation scales with working memory load: a near-‐infrared
spectroscopy studyFrank A. Fishburn
Page 469:15 -‐ 9:30am The effect of inner speech on arterial pCO2, cerebral hemodynamics and
oxygenationMartin Wolf Page 47
9:30 -‐ 11:30am POSTER VIEWING OF ODD NUMBERED POSTERS North Cloisters and Old RefectoryCOFFEE Sponsored by NIRx
APPLICATIONS : ADULT (II) Cruciform Lecture TheatreChair: Hellmuth Obrig
11:30 -‐ 12:00pm Adult Clinical Applications of Near Infrared Spectroscopy Martin SmithPage 49
12:00 -‐ 12:15pm Assessments of memory impairments associated with posttraumatic stress disorder (PTSD) by near infrared spectroscopy
Fenghua TianPage 50
12:15 -‐ 12:30pm Simultaneous EEG and fNIRS assessment of language processing: A tool to investigate changes in aphasia during (sub)acute stroke?
Sonja RossiPage 51
12:30 -‐ 12:45pm Characterising the response of cytochrome c oxidase to changes in cerebral oxygen supply and demand in the healthy adult brain
Christina KolyvaPage 52
12:45 -‐ 1:00pm Investigating the origin of hemodynamic fluctuations using high-‐resolution diffuse optical tomography in humans
Christina HabermehlPage 53
1:00 -‐ 2:00pm LUNCH Sponsored by TechEn, Shimadzu and ISS
2:00 -‐ 2:30pm KEYNOTE LECTURE: Interpreting NIRS data: the modelling challenge Murad Banaji Cruciform Lecture Theatre Page 55Chair: Clare Elwell
APPLICATIONS: NEONATAL AND PAEDIATRIC Cruciform Lecture TheatreChair: Martin Wolf
2:30 -‐ 3:00pm Clinical application of Near infrared Spectroscopy in the Neonate Frank Van Bel Page 573:00 -‐ 3:15pm A Study of Preschool Irritability: NIRS Brain Imaging of correlates of
clinical irritabilitySusan B. Perlman
Page 583:15 -‐ 3:30pm Development of a Multimodal Functional Brain Imaging Laboratory for
Newborn InfantsT Austin
Page 59
3:30 -‐ 3:45pm Round Up and Close Clare Elwell
4

1 Heidrun Wabnitz "A non-‐contact fNIRS scanner: First in-‐vivo tests" Page 612 Luke Dunne "Design of a new fNIRS multi-‐wavelength, multi-‐channel
time resolved spectrometer using a supercontinuum laser for measuring brain tissue haemodynamics and metabolism"
Page 62
3 Louis Gagnon "Multiple short separation measurements for removal of systemic oscillation in NIRS data"
age 63
4 Marcin Pastewski "A wireless, self-‐calibrating sensor for fNIRS studies in preterm infants"
Page 64
5 Yui Yamaguchi "Development of new fNIRS-‐EEG system for seamless whole brain study"
Page 65
6 Udo Weigel "DOCNEURO: Towards pre-‐commercial, clinical prototype development of hybrid diffuse correlation spectroscopy (DCS) and frequency domain diffuse optical spectroscopy (DOS) for bed-‐side neuromonitoring"
Page 66
7 Sophie Piper "A wearable multi-‐channel NIRS imaging system for brain imaging in freely moving subjects"
Page 67
8 Raphael Zimmermann "Silicon photomultipliers bear potential for fNIRS instrumentation"
Page 68
9 Masashi Kiguchi "New techniques for advanced optical topography" Page 6910 Fumio Kawaguchi "Development of multichannel fNIRS system with
transcranial pulse oximetry function using CDMA technique"
Page 70
11 Paolo Giacometti "Head probe for combined near-‐infrared spectroscopy and electroencephalography"
Page 71
12 Blasie Frederick "A low cost NIRS spectrometer for monitoring global physiological hemodynamic fluctuations"
Page 72
13 Angela Harrivel "Improved light injection and detection methods for fNIRS headgear for use in avionics and astronautics"
Page 73
14 Chester Wildey "Advances in customized headgear and optode-‐hair penetration"
Page 74
15 Felipe Orihuela-‐Espina "Towards a device capable of detecting the fast optical signal and its application to stroke rehabilitation"
Page 75
16 Chester Wildey "Smaller, lighter, cheaper. A new fNIRS system from MRRA Inc."
Page 76
17 Arthur "Buzz" DiMartino "TechEn: Advancing fNIRS technology for results" Page 77
Poster PresentationsEven numbers will present on Saturday the 27th. Odd numbers will present on Sunday the 28th.
Hardware Developments
5

18 Theodore Huppert "Multimodal investigation of neural-‐vascular coupling during somatosenory stimulation and resting state using concurrent MEG-‐NIRS and MRI-‐NIRS"
Page 79
19 Ilias Tachtsidis "Investigation of brain tissue oxygenation, cytochrome-‐c-‐oxidase and intracellular metabolites during perinatal cerebral hypoxia-‐ischaemia"
Page 80
20 Makii Muthalib "Multimodal correlation analysis between fNIRS, fMRI and EEG during motor tasks"
Page 81
21 Kunal Shetty "A study of executive control during intracorporeal minimally invasive suturing (ICS)"
Page 82
22 Anique Driessen "Simultaneous (Q)EEG and NIRS measurements during eyes open and eyes closed resting state conditions in healthy volunteers"
Page 83
23 Katherine Perdue "Comparison of NIRS, EEG and MEG sensitivity to spatial scale of brain activity"
Page 84
24 Kunal Shetty "Effects of visuomotor rotation in laparoscopic surgery on the prefrontal cortex (PFC)"
Page 85
25 Alp Özdemir "High frequency content in blood volume signal is predictive of migraine without aura"
Page 87
26 Uma Shahani "Haemodynamic responses to moving sinusoidal gratings" Page 8827 Felix Scholkmann "A new approach to extract stimulus-‐evoked
hemodynamic responses in fNIRS singals using Ensemble Empirical Mode Decomposition"
Page 89
28 Hamid Dehghani "Development and utilisation of computational models for tomographic fNIRS imaging and co-‐registration with multi-‐modal data"
Page 90
29 Mehrdad Dadgostar "Comparison of denoising algorithms in fNIRS" Page 9130 Na Yu "Wavelet cross correlation for identification of
interference between systemic physiological processes and brain haemodynamics measured by time-‐domain fNIRS during frontal lobe activation"
Page 92
31 Florian Haeussinger "Influence of static and dynamic physiological parameters on the measurement of neural activation with functional near-‐infrared spectroscopy (fNIRS)"
Page 93
32 Juliette Selb "Contamination of NIRS functional connectivity maps by superficial vasculature symmetries"
Page 94
33 Willaim Simpson "Kernal distributed lag model applied to fNIRS recordings from visual cortex"
Page 95
34 Sinem Burcu Erdogan "Analysis of task-‐dependent scalp signal contribution in fNIRS by use of reciprocal information from fMRI"
Page 96
Multi-‐Modal Monitoring
Data Analysis
6

35 Toshifumi Sano "Using variable hemodynamic response functions to optimize differential temporal information of hemodynamics in functional near-‐infrared spectroscopy"
Page 97
36 Ata Akin "Consistency of functional connectivity maps" Page 9837 Christoph Schmitz "Enhancement of hemodynamic contrast in the cancerous
breast by carbogen inspiration"Page 99
38 Makiko Imai "Region-‐specific cortico-‐cortical synchronization and desynchronization of hemodynamic changes"
Page 100
39 Sabrina Brigadoi "The importance of motion artifacts correction in cognitive studies"
Page 101
40 David Highton "Model enhanced interpretation of NIRS singals in brain injured patients"
Page 102
41 Arcangelo Merla "GLM based detection of fast optical singlas in visual cortex"
Pge 103
42 Tanveer Talukdar "Continuous correction of differential path length factor in near-‐infrared spectroscopy"
Page 104
43 Kazuki Kurihara "Segmentation of magnetic resonance images for individual head models for DOT"
Page 105
44 Lucian Comandar "Development of a flexible neurofeedback system for brain-‐machine interface using fNIRS"
Page 106
45 Angela Harrivel "Artifact removal for assessment of cross-‐network anticorrelation with fNIRS"
Page 107
46 Randall Barbour "A computing environment for multimodal integration of EEG and fNIRS"
Page 108
47 Theodore Huppert "Group level analysis methods in NIRS" Page 10948 Shunsuke Ichimura "Morphological modification of brain structure for optical
brain activation imaging"Page 110
49 Nima Hemmati "Correlation based signal improvement (CBSI) combined with motion artifact removal algorithm (MARA) for enhancing synthetic fNIRs signals
Page 111
50 Satoru Kohno "Quantitative indexes of artifacts for NIRS signals Page 11251 Masaya Ohtake "Head phantom including multiple absorption inclusions
for near infrared topography"Page 113
52 Fenghua Tian "Depth-‐compensated tomography (DC-‐Tomo) based on standard brain atlas"
Page 114
53 Kevin Mandrick "fNIRS data analysis by Slope: an alternative method to distinguish the level of cortical activation pattern during functional tasks"
Page 115
54 Hirokazu Tanaka "Task-‐related component analysis for functional neuroimaging and application to near-‐infrared spectroscopy data"
Page 116
7

55 Fumitaka Homae "Fronto-‐posterior connectivity during phonological processing in the infant brain"
Pge 118
56 Hellmuth Obrig "Prelexical cues in first language acquisition: Training induced changes in the processing of phonotactically legal and illegal consonant clusters"
Page 119
57 Heather Bortfeld "Classifying hemodynamic responses to auditory input in preverbal infants"
Page 120
58 Sho Tsuji "Six-‐month-‐olds' brains respond more to highly frequent vowels"
Page 121
59 Camillia Bouchon "Vowels and consonants at birth: a NIRS study" Page 12260 Teresa Wilcox "Experience-‐dependent changes in infant brain and
behavior: The case of color priming"Page 123
61 Yukifumi Monden "Randomized, double blind, placebo controlled, crossover design to evaluate MPH effect in ADHD children using fNIRS monitoring during Go/NoGo task"
Page 124
62 Teresa Wilcox "Different patterns of activation in temporal cortex to function vs. non-‐function events"
Page 125
63 Laura Edwards "Hemodynamic correlates of ratio-‐based numerical discrimination in infancy: An fNIRS study"
Page 126
64 Alejandrina Cristia "DBIfNIRS: A community-‐augmented online database of infant functional near infrared spectroscopy studies"
Page 127
65 Nawal Abboub "Perception of rhythmic grouping: An optical imaging study"
Page 128
66 Teresa Wilcox "Age-‐related changes in the functional organization of object processing pathways"
Page 129
67 Madeleine Verriotis "Multimodal EEG-‐NIRS studies of noxious and sensory stimulation in newborn infants"
Page 130
68 John Spencer "Integrating behavioral and neural dynamics over development in the dimensional change card sort (DCCS) task"
Page 131
69 Laura Anderson "Neural responses to point-‐light displays of biological motion in the first year of life: a functional near-‐infrared study"
Page 132
70 Maria Arredondo "Location, location, location-‐Where are we in the brain?" Page 133
71 Fabio Scarpa "Assessment of hemodynamic activity modulations: investigating visual short-‐term memory mechanisms through fNIRS and EEG"
Page 135
72 Hiroaki Suzuki "Measurements of hemoglobin concentration of the deep brain tissue using near-‐infrared time-‐resolved spectroscopy"
Page 136
Neurodevelopment (I) and (II)
Applications: Adult (I)
8

73 Meryem Yücel "Brain response to painful versus non-‐painful electrical stimuli"
Page 137
74 Simone Cutini "An exploratory fNIRS study with immersive virtual reality" Page 138
75 Marie McGrath "Examining resting state functional activity in the medial prefrontal cortex using fNIRS: A "proof-‐of-‐concept" study"
Page 139
76 Mayank Rehani "Driving errors and cerebral hemodynamics during simulated driving with and without hands-‐free telecommunication: It's not about where your hands are, it's about where your mind is"
Page 140
77 Cathy Mondloch "The neural correlates of the face attractiveness aftereffect: A functional near-‐infrared spectroscopy (fNIRS) study"
Page 141
78 Yagesh Bhambhani "Cerebral & muscle hemodynamics during unilateral knee extensions at different loads & velocities"
Page 142
79 Sara Basso Moro "Verbal and visual working memory investigated by multi-‐channel time-‐resolved functional near-‐infrared spectroscopy"
Page 143
80 Francesca Ferri "Being social: a NIRS study on the social simon effect" Page 14481 Hercules Grant "Cerebral hemodynamic responses during carbon dioxide
rebreathing, aerobic exercise and cognitive activity"Page 145
82 Silvia Bisconti "Prefrontal cortex is not activated by observation of disgusting and pleasant pictures: a multi-‐channel time-‐resolved functional near-‐infrared spectroscopy study in healthy subjects"
Page 146
83 Jeff Dunn "Quantification of cerebral hemoglobin in adult brain using near-‐infrared spectroscopy"
Page 147
84 Meeri Kim "Cerebral hemodynamics at altitude: Effects of hyperventilation and acclimatization on cerebral blood flow and oxygenation"
Page 149
85 Arnab Ghosh "Reduction of cytochrome c oxidase during vasovagal hypoxia-‐ischaemia in human adult brain: a case study"
Page 150
86 Matthew Cloud "Longitudinal fNIRS stroop study of adult traumatic brain injured patients in post-‐acute treatment"
Page 151
87 Eiju Watanabe "Presurgical diagnosis of the epieptogenic focus using near-‐infrared spectroscopy mapping"
Page 152
88 Christoph Schmitz "Enhancement of hemodynamic contrast in the cancerous breast by controlled articulation"
Page 153
89 Daniel Milej "Validation of the time-‐resolved optical measurement combined with ICG-‐bolus tracking in assessment of brain perfusion in posttraumatic brain injury patients"
Page 154
Applications: Adult (II)
9

90 Ingo Helmich "Differential cortical mechanisms of tool use related gesture production"
Page 155
91 Anouk Vermeij "Very-‐low-‐frequency oscillations of cerebral hemodynamics and blood pressure are influenced by aging and cognitive activation"
Page 156
92 Jeff Dunn "Functional near-‐infrared spectroscopy shows altered functional connectivity in the brain of patients with multiple sclerosis"
Page 157
93 Alessandro Torricelli "Cortical response during motor task in adult volunteers and epileptic patients with movement disorders: a multimodality fNIRS-‐EEG, fMRI-‐EEG and TMS clinical study"
Page 158
94 Jeff Dunn "Methylphenidate-‐mediated reduction in prefrontal hemodynamic responses to working memory task: A functional near-‐infrared spectroscopy study"
Page 159
95 Michal Kacprzak "Analysis of frequency components in optical signals measured by time-‐resolved near infrared spectroscopy on adults head: preliminary study"
Page 160
96 Yoko Hoshi "Cerebral vasoreactivity to carbon dioxide and neural activation in schizophrenia: a study with near-‐infrared time resolved spectroscopy"
Page 161
97 Christian Rummel "Multi-‐channel and multi-‐distance NIRS during neuroangiography: Feasibility and technical aspects"
Page 162
98 Daan Meester "Prefrontal cortex activity and H-‐reflex variability during dual and single task treadmill walking in healthy subjects"
Page 163
99 Rebecca Dewey "fNIRS of auditory, visual and somatosensory responses in normal-‐hearing individuals"
Page 164
100 Christian Rummel "NIRS during neuroangiography: First results and potential added value"
Page 165
101 Xin Zhang "Abnormal activation pattern of schizophrenia in performing Tower of London test"
Page 166
102 Jose Leon-‐Carrion "The rate of deoxy-‐Hb changes can be used as a neuromarker to detect the emergence from deep to light anesthesia"
Page 167
103 Arnold Wilkins "Uncomfortable visual stimulation and the shape of the haemodynamic response"
Page 168
104 Theodore Huppert "Investigation of resting state and visual evoked functional activity in neonates during concurrent NIRS and MRI"
Page 170
105 Mahdi Mahmoudzadeh "The impact of neonatal intraventricular hemorrhage on auditory hemodynamic response"
Page 171
Applications: Neonatal and Paediatric
10

106 George Aleandrakis "Concurrent functional near-‐infrared spectroscopy and motion tracking to assess functional improvement of children with cerebral palsy after constrained induced motion therapy"
Page 172
107 Tingting Zhu "Optimal wavelength combinations for resolving in-‐vivo concentration changes of haemoglobin and cytochrome-‐c-‐oxidase with fNIRS"
Page 174
108 Heidrun Wabnitz "Performance assessment of time-‐domain fNIRS instruments in the 'nEUROPt' project"
Page 175
109 Andrew Macnab "Near infrared spectroscopy of the bladder to monitor physiologic function in health and disease"
Page 176
110 Yukari Tanikawa "In vivo time-‐resolved DOT images of human forearm under exercises"
Page 177
111 Theodore Huppert Page 178112 Gerrita van Spijker "Exploring the effects of Nilvadipine on blood pressure,
cerebral blood flow and cerebral autoregulation in patients with mild to moderate Alzhimer's Disease: a NILVAD add-‐on sutdy"
Page 179
113 Kevin Mandrick "Hemodynamic cerebral responses as a function of the neurovascular coupling to brain activation: NIRS signal changes"
Page 180
114 Ata Akin "Analysis of Stroop Test fNIRS data by use of singular value decomposition"
Page 181
115 Terence Leung "Cerebral oxygenation meausrement with acousto-‐optics: a simulation study"
Page 182
Other
11

Oral Session Keynote
Friday, 26th October 5:30pm
12

T
M
fNIRS continuof functional search of (Tomography”
EEG, TMS, afurther over tcognitive stimintegration winfant studiefunctional con The successfto applicationjournals publand health sdisciplines. During my tawork comingopportunities our communi
Figure 1. Numthat this only c
rends in Functional Near Infrared Spectroscopy
David Boasartinos Center for Biomedical Imaging, Massachusetts General Hospital, Harvard Medical School 149 13th St, Charlestown, MA 02129
es to experience exponential growth as it approaches 20 years since the first studies brain activation were published in 1993. The manually culled results of a PubMed “Near Infrared Spectroscopy” or “NIRS” or “Optical Topography” or “Optical ) and “Brain” support this exponential growth model in terms of number of
publications per year, as shown in figure 1. Note that 2012 only contains 8 months of publications and thus is projected to increase by 50%. The line is an exponential fit with a doubling time of 3.5 years. Will we have 400 publications in 2015? This database of results contains 1150 publications, with only 149 from the first ten years. The first ten years already broadly covered fNIRS applications domains with papers containing brain activation paradigms with visual, motor/sensory, cognitive, language, auditory, and psychological stimuli; exploring clinical applications for schizophrenia, depression, Alzheimer’s disease, epilepsy, and stroke; exploring multi-modal integration with fMRI, PET, TCD, MEG,
nd DBS; as well as studying brain activation in infants. These domains were explored he next 10 years with particular emphasis on
uli; schizophrenia and stroke; multi-modal ith fMRI, EEG, and TMS; strong growth in s; and a recent explosion of resting state nectivity studies.
ully translation from technology development is further supported by 8 of the top 10
ishing fNIRS papers coming from the neuro ciences, with only 2 coming from technology
lk, I will discuss these trends, some of the out of our group at MGH, exciting new that are emerging, as well as the grass-roots efforts to further strengthen and grow
ty.
ber of fNIRS papers published each year. Note ontains 8 months of 2012.
1) 159 Neuroimage 2) 68 J Biomed Opt 3) 47 Conf Proc IEEE Eng Med
Biol Soc 4) 41 Neurosci Lett 5) 40 Adv Exp Med Biol 6) 31 Neuroreport 7) 23 Brain Res 8) 21 Human Brain Mapping 9) 20 Neurosci Res 10) 18 PLoS ONE
13

Oral Session Hardware Developments
Saturday, 27th October 8:00am
Chair: Heidrun Wabnitz
14

Ischemic stroke & hybrid diffuse optics combining
diffuse correlation spectroscopy (DCS) and diffuse
optical spectroscopy (DOS-NIRS)
Turgut Durduran
ICFO- Institut de Ciencies Fotoniques, Mediterranean Technology Park, 08860Castelldefels (Barcelona), Spain
Tel: +34935534151, Fax: +34935534000, E-mail: [email protected]
I will present a brief summary of the development of diffuse correlation spectroscopy (DCS) (also knownas “diffuse wave spectroscopy”) for non-invasive measurement of cerebral blood flow (CBF) in human brain[1, 2]. DCS was introduced for “deep-tissue” biomedical optics by Arjun Yodh’s laboratory at Universityof Pennsylvania, Philadelphia [3] where we have shown that by combining DCS with simultaneous diffuseoptical spectroscopy (DOS/NIRS), changes in cerebral blood flow (CBF), oxy-hemoglobin (HbO2) and deoxy-hemoglobin (Hb) concentrations and total hemoglobin concentration (THC) can be measured and the cerebralmetabolic rate of oxygen extraction (CMRO2) can be calculated. This combined approach is termed “hybriddiffuse optics” since we are combining two diffuse optical methods to get a more complete picture of thebrain physiology.
The technology has, since, was validated against an array of other modalities and was introduced to theclinics for applications ranging from peripheral vascular diseases to oncology to neuro-monitoring [1,2]. Thevalidation studies have demonstrated that DCS can indeed non-invasively measure changes in CBF even inadult brain, albeit with some limitations. In this presentation, I will focus on its utility in clinical ischemicstroke monitoring from the emergency care to acute, bed-side management to risk assessment. I will describea time-line of common clinical care that an ischemic stroke patient receives upon arrival to the unit anduse examples from various studies to demonstrate the potential for these technologies in clinical settings forearly diagnosis, management and risk assessment. Finally, I will outline the next-generation instrumentationand the immediate and long-term goals.
This work was partially funded by Fundacio Cellex Barcelona, Marie Curie IRG (FP7, RPTAMON), In-stituto de Salud Carlos III (FIS), Ministerio de Ciencia e Innovacion (Ramon y Cajal Fellowship, ACIO),OPTIMILK, LASERLAB (FP7), European regional development funds (FEDER), Institucio CERCA andNational Institutes of Health (NIH). It is the product of many years of collaborations with many faculty,researchers and students from University of Pennsylvania, Children’s Hospital of Philadelphia and Hospitalde la Santa Creu i Sant Pau. In particular, AG Yodh, JA Detre, JH Greenberg, DJ Licht, JM Fabregas, RMDelgado have been the leaders of this effort.
References
1. T Durduran, R Choe, W Baker, and A G Yodh. Diffuse optics for tissue monitoring and tomography. Rep Prog Phys,73(7):076701–076744, 2010.
2. Rickson C. Mesquita, Turgut Durduran, Guoqiang Yu, Erin M. Buckley, Meeri N. Kim, Chao Zhou, Regine Choe, UlasSunar, and Arjun G. Yodh. Direct measurement of tissue blood flow and metabolism with diffuse optics. PhilosophicalTransactions of the Royal Society A: Mathematical, Physical and Engineering Sciences, 369(1955):4390–4406, 2011.
3. D A Boas, L E Campbell, and A G Yodh. Scattering and imaging with diffusing temporal field correlations. Phys RevLett, 75(9):1855–1858, 1995.
15

Time resolved functional near infrared spectroscopy by means of time
gated system at small interfiber distance
Davide Contini1, Alberto Dalla Mora1, Laura Di Sieno1, Alessandro Torricelli1, Lorenzo Spinelli2, Rinaldo Cubeddu1, Alberto Tosi3, Gianluca Boso3, Antonio Pifferi1 1 Politecnico di Milano–Dipartimento di Fisica, Milano, Italy
2 CNR-IFN, Consiglio Nazionale delle Ricerche–Istituto di Fotonica e Nanotecnologie, Milano, Italy
1 Politecnico di Milano–Dipartimento di Elettronica e Informazione, Milano, Italy
Functional near infrared spectroscopy (fNIRS) is an emerging new tool to non-invasively monitor
task-related hemodynamic changes in the human brain, due to the ability of photon migration
measurements to investigate inner structures of biological tissues. As a matter of fact, for the brain the
potentially interesting optical changes or alterations occurring in the cortex are masked by the scalp,
skull and clear layer that cover the brain cortex. In this work we focused on small (few millimeters)
source-detector distance time-resolved measurements, which are predicted to have better contrast,
better spatial resolution, and lower noise than the typical measurements performed at few centimeters.
A common assumption, in fact, is that the larger is the source-detector (inter-fiber) distance, the deeper
is the visited region. Even if this is true for continuous-wave measurements, in time domain the mean
depth visited by collected photons is independent from the inter-fiber distance, while it increases for
longer arrival times of photons.
The instrumental set-up we consider is an improved version of the one used for the first experimental
feasibility of such a kind of measurements. We developed an instrument based on a fiber laser
providing two independent output at 710nm and 820nm with a repetition frequency of 40MHz and a
FWHM of few tens of picoseconds. In our instrumental set-up we exploited a fast-gating (<500ps)
front-end electronics enabling a silicon Single-Photon Avalanche Diode (SPAD) for time-correlated
single-photon counting. By means of this detector, we can acquire “late” (strongly attenuated) photons
of the diffused light collected few millimeters apart from the injection point. Such photons traveled
long paths through the head, then exploring the brain cortex. This is possible because the fast-gated
SPAD rejects the huge amount of “early” photons which otherwise would saturate the detection
electronic chain. Two fast time-gated detectors are used to acquire independently late photons at the
two wavelengths in order to estimate concentrations of oxy- and deoxy-hemoglobin during brain
activity. This prototype, differently from the previous ones, can follow the hemodynamic behavior of
tissues for both oxy- and deoxy-hemoglobin at the same time with measurement at small distance
between injection and detection points.
We validated the instrument on tissue phantoms attaining photon-timing resolutions of 100ps
(FWHM) and photon-counting dynamic ranges of around 108 (160dB). Preliminary results in-vivo
show for the first time the possibility to detect the dynamic of oxygenated and deoxygenated
hemoglobin concentration during a cerebral activation with an interfiber distance of few millimeters.
16

Imaging multiple functional networks with diffuse optical tomography Adam T. Eggebrecht1, Silvina L. Ferradal1,2, Amy R. Viehoever1,3,4, Mahlega Hassanpour1,5, Abraham Z. Snyder1,4, Joseph P. Culver1,2,5
1Department of Radiology, Washington University School of Medicine, St. Louis, MO, 63110, USA 2Department of Biomedical Engineering, Washington University, St. Louis, MO, 63130, USA. 3Department of Pediatrics, Washington University School of Medicine, St. Louis, MO, 63130, USA. 4Department of Neurology, Washington University School of Medicine, St. Louis, MO, 63110, USA 5Department of Physics, Washington University, St. Louis, MO, 63130, USA
High-density diffuse optical tomography (HD-DOT) methods have improved localization and resolution compared to traditional near infrared spectroscopy (NIRS). However HD-DOT systems have generally suffered from a limited field of view (FOV) and studies have focused on sensory and motor areas. In order to consider a wider range of clinical applications, it is necessary to sample a large contiguous FOV that permits the study of multiple functional brain networks in parallel. We have developed an HD-DOT system and cap that spans over 50% of the superficial cortical surface (Fig. 1A), covering occipital, temporal, and much of the parietal and frontal lobes. In this study, the DOT image reconstructions are calculated within the subject-specific anatomical space; data are affine transformed into a standard MNI atlas space to create group averages of the activations. Stimuli include somatosensory, visual (Fig. 1B), auditory (Fig. 1C), and language tasks. Locations of activation within the language processing system are clearly separable into passive auditory and visual processing regions and regions responsible for the generation of language. Activation locations are validated with subject-matched non-concurrent fMRI. In parallel, we evaluate brain networks with spontaneous resting-state functional connectivity methods. The seeds chosen in the field of view of the HD-DOT system provide access to the visual, motor, and language networks. Seed-based correlation maps of resting-state networks generated from HD-DOT data are then compared with fMRI. Cortical maps from both modalities show clear differentiation between the three networks investigated.
Figure 1: Our high-density diffuse optical tomography (HD-DOT) system covers much of the superficial cortical surface. (A) A subject-specific T1-weighted MRI-based mesh with the positions of source (red) and detector (blue) fibers of our system. (B) Example of an activation in response to a flickering checkerboard stimulation located within the right visual field. (C) Example of an activation in response to an auditory stimulus composed of a series of words. All activation are threshed at 50% of the maximum value for that given activation. Data are presented on the MIN152 atlas cortical surface.
17

Oral Session Multi-‐Modal Monitoring
Saturday, 27th October 9:00am
Chair: Maria Angela Franceschini
18

False Positives in fNIRS: Identifying and Quantifying Systemic Influences on Neurovascular Coupling in fNIRS Data during Cognitive Tasks. Ilias Tachtsidis Dept. of Medical Physics and Bioengineering, Biomedical Optics Research Laboratory, University College London, U.K. [email protected] Brain functional studies of task-specific activation using functional neuroimaging rely on the existence of a close coupling between neuronal electrical excitation and regional changes in brain metabolism and regional cerebral blood flow, sometimes referred to as activation-flow coupling or neurovascular coupling. Regional haemodynamic changes are used as a surrogate marker for changes in regional brain function that occur due to changes in metabolism during excitatory or inhibitory neurotransmission, both of which are energy consuming processes. Functional near-infrared spectroscopy (fNIRS) is used to non-invasively measure the changes in oxygenated and deoxygenated haemoglobin ([HbO2], [HHb]) and hence investigate the brain haemodynamic changes, which occur in response to functional activation at specific regions of the cerebral cortex. The fNIRS signal is an indirect measure of neuronal activity.
Neuronal excitation causes oxidative metabolism increases that lead to brain vascular responses; blood vessels dilate causing an increase in cerebral blood flow and cerebral blood volume. This oversupply of oxygenated blood causes the [HbO2] to increase and the [HHb] to reduce. In order for this response to be monitored unambiguously it is important that the haemodynamic task related activity is occurring on top of an unchanged global systemic and brain resting state. Comparisons of the fNIRS signals implicitly assume that the coupling between [HbO2], [HHb] and neuronal activity (neurovascular coupling) is equivalent during the duration of activation in individual and between individuals. However, changes in cerebrovascular dynamics due to task related systemic cardiovascular changes can lead to results that are unrelated to neuronal activity; in addition to producing extracranial vasculature changes that can lead to fNIRS signal contamination.
fNIRS is increasingly being used to investigate higher level cognitive functions, some of which might produce significant changes in systemic variables. For several years now (see references) we have investigating the relationship between task related brain fNIRS and systemic changes in a large group of young healthy adults during cognitive functional tasks that included anagram solving and video gaming. Our results suggest that task related changes seen in systemic variables in some volunteers might contribute to the changes in the fNIRS signals leading to false positives. References: Tachtsidis I., Leung T.S., Chopra A., Koh P.H., Reid C.B., Elwell C.E. “False positives in functional near-infrared topography.” Advances in Experimental Medicine and Biology, 645, 307-314, (2009).
Patel S., Katura T., Maki A., Tachtsidis I. “Quantification of systemic interference in optical topography data during frontal lobe and motor cortex activation: an independent component analysis.” Advances in Experimental Medicine and Biology, 915:45-51 (2011).
Tachtsidis I., Koh P.H., Stubbs C., Elwell C.E. “Functional optical topography analysis using statistical parametric mapping (SPM) methodology with and without physiological confounds.” Advances in Experimental Medicine and Biology, 662:237-243 (2010).
Jelzow A, Tachtsidis I, Kirilina E, Niessing M, Bruhl R, Wabnitz H, Heine A, Ittermann B, Macdonald R, “Simultaneous measurement of time-domain fNIRS and physiological signals during a cognitive task.” SPIE-INT SOC OPTICAL ENGINEERING, DIFFUSE OPTICAL IMAGING III, Volume 8088 (2011).
Kirilina, E., Jelzow, A., Heine, A., Niessing, M., Wabnitz, H., Brühl, R., Ittermann, B., Jacobs, A. M., Tachtsidis, I. The physiological origin of task-evoked systemic artefacts in functional near infrared spectroscopy. Neuroimage 61(1),70-81 (2012).
19
Neurovascular Coupling Varies with Level of Global Cerebral Ischemia in a Rat Model
Wesley B Baker 1, Zhenghui Sun2,5, Teruyuki Hiraki2, Mary E Putt3, Turgut Durduran4, Martin Reivich2, Arjun G Yodh1, Joel H Greenberg2
Departments of 1Physics and Astronomy, 2Neurology, 3Biostatistics and Epidemiology, University of Pennsylvania, Philadelphia, PA 19104, USA
4ICFO-Institut de Ciencies Fotoniques, Mediterranean Technology Park, 08860 Castelldefels (Barcelona), Spain
5Department of Neurosurgery of General Hospital of PLA, Beijing, China
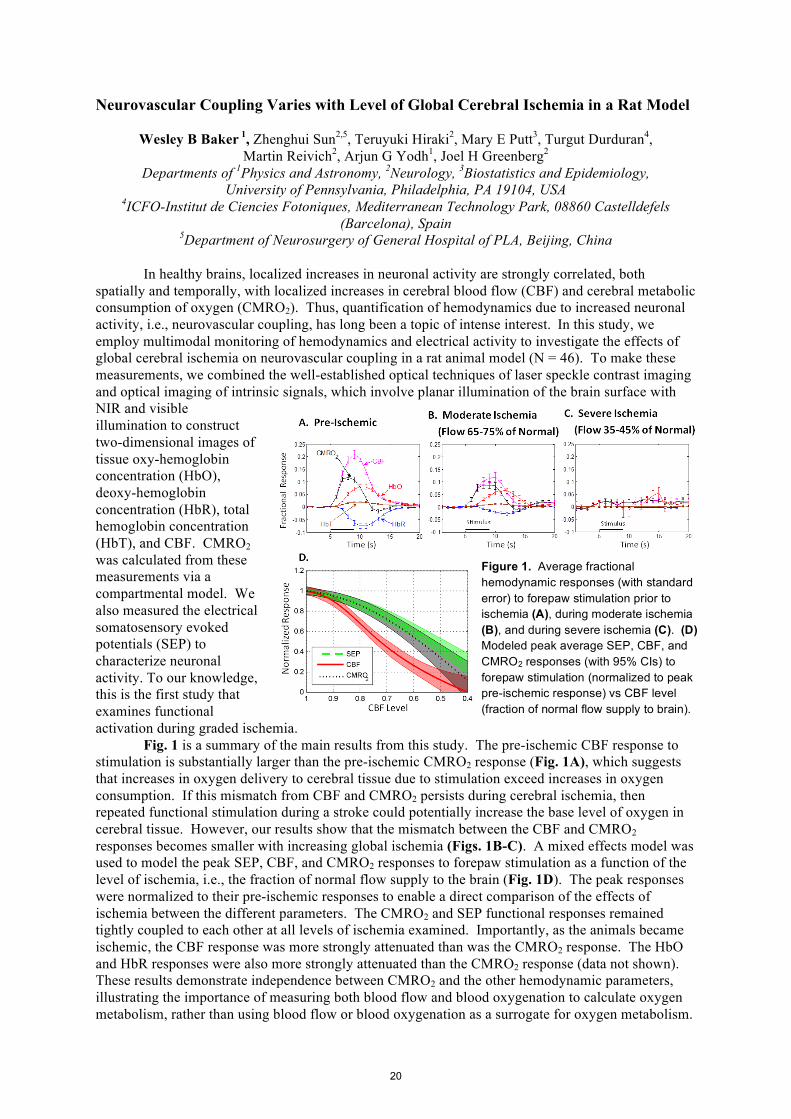
In healthy brains, localized increases in neuronal activity are strongly correlated, both spatially and temporally, with localized increases in cerebral blood flow (CBF) and cerebral metabolic consumption of oxygen (CMRO2). Thus, quantification of hemodynamics due to increased neuronal activity, i.e., neurovascular coupling, has long been a topic of intense interest. In this study, we employ multimodal monitoring of hemodynamics and electrical activity to investigate the effects of global cerebral ischemia on neurovascular coupling in a rat animal model (N = 46). To make these measurements, we combined the well-established optical techniques of laser speckle contrast imaging and optical imaging of intrinsic signals, which involve planar illumination of the brain surface with NIR and visible illumination to construct two-dimensional images of tissue oxy-hemoglobin concentration (HbO), deoxy-hemoglobin concentration (HbR), total hemoglobin concentration (HbT), and CBF. CMRO2 was calculated from these measurements via a compartmental model. We also measured the electrical somatosensory evoked potentials (SEP) to characterize neuronal activity. To our knowledge, this is the first study that examines functional activation during graded ischemia. Fig. 1 is a summary of the main results from this study. The pre-ischemic CBF response to stimulation is substantially larger than the pre-ischemic CMRO2 response (Fig. 1A), which suggests that increases in oxygen delivery to cerebral tissue due to stimulation exceed increases in oxygen consumption. If this mismatch from CBF and CMRO2 persists during cerebral ischemia, then repeated functional stimulation during a stroke could potentially increase the base level of oxygen in cerebral tissue. However, our results show that the mismatch between the CBF and CMRO2 responses becomes smaller with increasing global ischemia (Figs. 1B-C). A mixed effects model was used to model the peak SEP, CBF, and CMRO2 responses to forepaw stimulation as a function of the level of ischemia, i.e., the fraction of normal flow supply to the brain (Fig. 1D). The peak responses were normalized to their pre-ischemic responses to enable a direct comparison of the effects of ischemia between the different parameters. The CMRO2 and SEP functional responses remained tightly coupled to each other at all levels of ischemia examined. Importantly, as the animals became ischemic, the CBF response was more strongly attenuated than was the CMRO2 response. The HbO and HbR responses were also more strongly attenuated than the CMRO2 response (data not shown). These results demonstrate independence between CMRO2 and the other hemodynamic parameters, illustrating the importance of measuring both blood flow and blood oxygenation to calculate oxygen metabolism, rather than using blood flow or blood oxygenation as a surrogate for oxygen metabolism.
Figure 1. Average fractional hemodynamic responses (with standard error) to forepaw stimulation prior to ischemia (A), during moderate ischemia (B), and during severe ischemia (C). (D) Modeled peak average SEP, CBF, and CMRO2 responses (with 95% CIs) to forepaw stimulation (normalized to peak pre-ischemic response) vs CBF level (fraction of normal flow supply to brain).
20

Impact of Extracranial Vessels on Task-Evoked Artefacts in Functional Near Infrared Spectroscopy for Multiple Tasks.
Evgeniya Kirilina2*, Daniel Adebiyi1, Arthur Jacobs2
1 Free University of Berlin, Department of Educational Science and Psychology
2 Free University Berlin, Department of Biology, Germany 3 Dahlem Institute for Neuroimaging of Emotions, Free University Berlin, Germany
*E-Mail to: [email protected]
Introduction: A major limitation in functional Near Infrared Spectroscopy (fNIRS) is its high sensitivity to hemodynamics of non-cerebral superficial tissue layers including scalp, skull and pial vessels. While pulsatile noise components induced by heart beat and respiration can be effectively removed by filtering, Mayer waves and low frequency vascular fluctuations strongly interfere with cerebral hemodynamical signals (1,2). Moreover, facial blood flow is controlled by the autonomic nervous system, and is therefore systematically influenced by certain tasks. This fact results in false positives in fNIRS activation maps (1-4). In order to separate superficial contribution from cerebral response, precise knowledge about skin hemodynamic response is indispensable. In the present study we used concurrent multi-distance fNIRS and skin-sensitive functional Magnetic Resonance Imaging (fMRI) in order to quantify the contribution of superficial vessels in fNIRS and quantify their response to stimuli of different types. Since conventional fMRI usually exhibits poor sensitivity to the skin, we used a dedicated skin sensitive fMRI method based on multi-echo (5) and high-resolution 3D (6) echo planar imaging (EPI). Methods: We combined multi-distance fNIRS and skin-sensitive fMRI in functional experiment using four different tasks: (i) working memory, (ii) emotional processing, (iii) speech production, (iv) gustatory stimulation. Concentration changes of oxygenated (oxy-Hb) and deoxygenated (deoxy-Hb) hamoglobin were recorded using NIROScout (NIRx, Berlin, Germany) with a dense grid of optodes consisting of fNIRS channels with short (15 mm) and long (30 mm) source-detector separations. Experiments were performed inside a 3T MR scanner (Siemens, Erlangen, Germany) using multi-echo EPI (5) in working memory experiments and high-resolutions 3D-EPI (6) providing 1.5x1.5x1.5 mm3 resolution for all other tasks. Results: We observed pronounced task-evoked superficial signals in the oxy-Hb time courses in near as well as in far fNIRS channels, for all subjects in all tasks. For deoxy-Hb we found similar behaviour, but with weaker signal intensities than for oxy-Hb. The oxy-Hb concentration changes in short-distance channels demonstrate strong correlation with fMRI signal of temporal skin vessels for gustatory stimulations and speech production task and with the supraorbital forehead veins for working memory tasks. The skin vessels response functions for both stimuli types could be obtained. Conclusion We demonstrated that hemodynamics of facial veins contribute to task-evoked fNIRS signals. This superficial contribution depends on the face position and the type of stimulus. The skin vessel response function obtained in our experiment could be further used in GLM analysis of fNIRS data in order to separate task-evoked signals resulting from the skin and from brain signals. References 1) Kirilina et al., Neuroimage 61, (2012), p. 70-81 2) Gagnon, L. et al., Neuroimage 59, (2011), p. 2518-2528 3) Tachtsidis et al., Oxygen Transport to Tissue XXX, 645, (2009), p. 307-314 4) Sato et al, JBO, 2012 5) Poser, B.A., et al., MRM, 55, (2006), p. 1227-1235 6) Lutti, A. et al., MRM, 2012, doi: 10.1002/mrm.24398
21

Oral Session Data Analysis Saturday, 27th October
10:45am Chair: Joseph Culver
22

Methodological challenges in the application of fNIRS for infant cognitive neuroscience Emmanuel Dupoux & Alex Cristia
Functional Near InfraRed Spectroscopy (fNIRS) is a promising, rapidly expanding technique for the study of infant cognition. However, a number of methodological stumbling block remain to be lifted for the widespread acceptance of this technique by the cognitive neuroscience community at large. We illustrate three such stumbling blocks in three separate studies conducted in our group. The first one deals with brain lateralization for language in neonates and raises the issue of the shape of the Hemodynamic Response Function in newborns. The second addresses language discrimination and raises the issue of free parameters in data analysis and replicability. The third one addresses the representation of self body motion and raises the issue of head-brain co-registration. We propose that public repositories of published result should help to increase the quality of analysis and methods by enabling large scale meta-analyses.
23

Low frequency oscillations measured in the periphery with near infrared spectroscopy (NIRS) are strongly correlated with blood oxygen level-‐dependent functional magnetic resonance imaging (BOLD fMRI) signals
Yunjie Tong1,3, Lia M. Hocke1,2, Stephanie C. Licata1,3 and Blaise deB. Frederick1,2,3
1McLean Hospital Brain Imaging Center, 2Tufts University Department of Biomedical Engineering, 3Harvard Medical School Department of Psychiatry
Abstract: Low frequency oscillations (LFOs) in the range of 0.01-0.15Hz are commonly observed in functional imaging studies, such as blood oxygen level-dependent functional magnetic resonance imaging (BOLD fMRI) and functional near infrared spectroscopy (fNIRS). Some of these LFOs are non-neuronal
and are closely related to autonomic physiological processes. In the current study, we conducted a concurrent resting state fMRI and NIRS experiment with healthy volunteers. LFO data was collected simultaneously at peripheral sites, e.g. middle fingertip and big toes by NIRS, and centrally in the brain by BOLD fMRI. The cross-correlations of the LFOs collected from the finger, the toes, and the brain were calculated. Our data shows that the LFOs measured in the periphery (NIRS signals) and in the brain (BOLD fMRI) were strongly correlated with varying time delays. This demonstrates that some portion of the LFOs actually reflect systemic
physiological circulatory effects. Furthermore, we demonstrated that NIRS is effective for measuring the peripheral LFOs, and that these LFOs and the temporal shifts between them are consistent in healthy participants, and may serve as useful biomarkers for detecting and monitoring circulatory dysfunction. Email: [email protected] Reference: 1. H. Obrig, M. Neufang, R. Wenzel, M. Kohl, J. Steinbrink, K. Einhaupl and A. Villringer, "Spontaneous low frequency oscillations of cerebral hemodynamics and metabolism in human adults," Neuroimage 12(6), 623-639 (2000) 2. Y. Tong and B. D. Frederick, "Time lag dependent multimodal processing of concurrent fMRI and near-infrared spectroscopy (NIRS) data suggests a global circulatory origin for low-frequency oscillation signals in human brain," Neuroimage 53(2), 553-564 (2010) 3. J. Allen and A. Murray, "Age-related changes in peripheral pulse timing characteristics at the ears, fingers and toes," J Hum Hypertens 16(10), 711-717 (2002)
Figure 1: The LFOs measured simultaneously at toe (a), finger (b) by NIRS and at brain by BOLD fMRI (c) are showed (d and e). The LFO signal of the finger leads that of the toe by 3.06 s (d) and lags that of the brain (voxel marked by blue circle in c) by 2.16s (e).
24

Integrated Data Analysis Environment for fNIRS
Takusige Katura
Hitachi, Ltd., Central Research Laboratory
Data analysis is important in the field of fNIRS because of rich source information in
measured signals. There are considerable variations in obtained signals according to the
experimental designs for data acquisition. Therefore in order to obtain reliable results
exploring for adequate signal analysis methods and the best parameters for them is required.
To meet these requirements we developed platform software for testing analysis methods,
“Platform for Optical Topography Analysis Tools” (POTATo) [1]. There are three conceptual
architectures in the software; an analysis script creator, a visualization designing tool and a
plug-in wizard. Analysis script creator automatically produces a code for analyzing data
according to an analysis recipe which was designed by the user using Graphical User
Interface (GUI). By referring to the created script, users can read all the analysis that POTATo
does and also modify it. For visualization of data and analysis results we can use a Layout
editor which enables us to design layout and drawing contents. Additional functionality for
signal analysis is supported by the Plug-in wizard. By using this tool users can create and
import additional analysis functions into POTATo. Some useful analysis functions have been
implemented and provided as plug-in file sets including: “Motion detection using wavelet
analysis” [2] which was developed for neonate measurement to detect not only spike-like
changes but also slower changes; “T-Test with peak search” [3] which enables the detection of
significant signal changes by searching time of peak value for each trial and subject;
“Transfer entropy analysis” [4] which is similar to correlation analysis but this function
returns the amount of information transferred from one to another data array; “Time delayed
decorrelation and clustering” [5] which enables extracting activation signals from a group of
subjects. The concept of integrated data analysis environment will help researchers to test and
evaluate traditional and novel signal analysis methods on fNIRS data and to obtain fruitful
results.
References
[1]. POTATo for Matlab2010a: www.hitachi.co.jp/products/ot/study/kaiseki.html
[2]. Sato H, et al., (2005) Intersubject variability of near-infrared spectroscopy signals during
sensorimotor cortex activation. J Biomed Opt. 10(4):44001
[3]. Sato H, et al., (2006). Wavelet analysis for detecting body-movement artifacts in optical
topography signals. Neuroimage. 3(2):580-7.
[4]. T. Katura, et al., (2006). Quantitative evaluation of interrelations between spontaneous
low-frequency oscillations in cerebral hemodynamics and systemic cardiovascular dynamics.
Neuroimage 31(4), 1592-1600
[5]. Katura T, et al., (2008). Extracting task-related activation components from optical
topography measurement using independent components analysis. J Biomed Opt. 13(5):
054008.
[6]. Tanaka H, et al., Task-Related Component Analysis for Functional Neuroimaging and
Application to Near-Infrared Spectroscopy Data. Neuroimage (accepted)
Acknowledgement: Part of this research was supported by the Network Human Interface
Project Foundation of the Ministry of Internal Affairs and Communications of the Japanese
Government.
25

Figure 1 – Hemodynamic data is input into a MCS of MR signal attenuation to predict the concurrent BOLD fMRI signal. Good agreement only when using the heterogeneous tissue model.
Is it possible to extract cortical depth information from traditionally 2D optical imaging spectroscopy using concurrent fMRI data?
A.J.Kennerley, J.E.Mayhew, & J.Berwick Signal Processing in Neuroimaging and Systems Neuroscience (SPiNSN), Department of Psychology, University of Sheffield, Sheffield, UK.
Optical imaging spectroscopy is a technique used in neuro-imaging for the quantification of changes in cerebral blood volume and oxygenation during neural activity, with high temporal and 2D spatial resolution. One disadvantage is that the technique relies on many assumptions concerning the light absorption and scattering properties of the imaged tissue. For example both baseline and relevant changes in blood volume and oxygenation are often assumed to homogeneous throughout the brain tissue (Frostig et al., 1990; Malonek and Grinvald, 1996; Mayhew et al., 2000). This assumption is common place as one only needs an estimate of the path length (often from Monte Carlo simulations) to use a simple Beer-Lambert relationship to extract 2D images of chromophore (e.g. Hbr & HbO2) concentration changes from light attenuation data. However it is well known that cortical brain tissue has a heterogeneous distribution of vascular and physiological structures (Pawlik et al., 1981). This suggests that using a homogeneous tissue model in OIS to assess the hemodynamic changes (to neuronal activity) to help understand the nature and time course of the Blood oxygenation level dependent (BOLD) functional magnetic resonance imaging (fMRI) signal is inappropriate. In the current research we take the opposite approach and use concurrent fMRI data to help us to understand the nature and time course of the optical imaging ‘measurements’ in terms of cortical depth and tissue/absorption heterogeneity. Three dimensional 7 Tesla fMRI measurements were used to parameterize and refine a multi layered heterogeneous tissue model for use in the Monte Carlo simulations (MCS) of light transport through tissue. Simulations showed that fMRI data can be used to estimate absorption depth sensitivity and response profiles. These profiles can be used in the Beer-Lambert law to weight the path length estimate from the MCS; thus dramatically changing the magnitude of the chromophore (e.g. Hbr & HbO2) concentration changes. We implemented concurrent fMRI and OIS, with light attenuation captured using interleaved illumination at four wavelengths (495, 586, 559 and 575nm), in an animal model. When hemodynamic measurements estimated from the heterogeneous optical imaging spectroscopy algorithm were input into Monte Carlo simulations of MR signal attenuation it resulted in consistent prediction of the concurrently measured BOLD signal. In contrast the homogeneous model under-estimates BOLD changes by approximately 40% (see figure 1). Furthermore the response depth profile was dynamic over time and thus we estimated depth information from a traditionally 2D imaging method. This has important implications for research investigating effects such as the negative BOLD effect which have been shown to originate deeper in the cortical tissue (Boorman et.al. 2010). Using the three dimensional characteristics of the functional magnetic resonance imaging signal we have improved and refined our optical imaging spectroscopy analysis. This work will be extended and exploited in our current research using MRI to parameterize a diffuse optical tomography algorithm in a project investigating the metabolic monitoring of cortical activity. References: Boorman et.al. (2010). J. NeuroSci 30(12). Frostig et.al. (1990) PNAS 87. Malonek & Grinvald (1996) Sci 272. Mayhew et.al. (2000) NI 12. Pawlik et.al. (1981) Brain Res 208.
26

Non-contact photogrammetric spatial registration system for fNIRS featuring
color-coded markers
Daisuke Tsuzuki a, *
, Takuya Moriyama b, Tsutomu Mizutani
a, Mitsuharu Yamada
b, Nobuo
Kochi b, Eiju Watanabe
c, Ippeita Dan
a
a Functional Brain Science Lab, Center for Development of Advanced Medical Technology,
Jichi Medical University, 3311-1 Yakushiji, Shimotsuke, Tochigi 329-0498, Japan b
Imaging and Measuring Laboratory, Corporate R&D Center, Topcon Corporation, 75-1
Hasunumacho, Itabashi-ku, Tokyo 174-8580, Japan c
Department of Neurosurgery, Jichi Medical University, 3311-1 Yakushiji, Shimotsuke,
Tochigi 329-0498, Japan
Functional near-infrared spectroscopy (fNIRS) is a neuroimaging technique which has several
merits in comparison with other imaging methods. However, as a neuroimaging tool, fNIRS
faced a fundamental dilemma. In its stand-alone setting, fNIRS can obtain only functional
information and no structural information. Thus, we recently developed an anchor-based
probabilistic registration method which based on canonical probabilistic registration method
that uses MRIs in a reference database instead of the subject's own MRIs, and
probabilistically registers the fNIRS optode or channel positions onto a standard template in
standard stereotactic brain coordinate system such as Montreal Neurological Institute (MNI).
In this session we present a new approach called the photogrammetric spatial registration that
applies photogrammetric method to measure the three reference points (Nz, AL and AR) and
optode positions (plus any given anchor points) on subject's head to achieve the anchor-based
probabilistic registration. The proposed system utilizes a digital camera instead of a magnetic
3D-digitizer. The photogrammetric method is non-contact, and features use of color-coded
targets that enable automatic rendering of acquired images. Although the current measurement
system focuses on the usage of registration for fNIRS data on healthy adults heads, it would
be applicable, with some minor modifications, in clinical studies and also useful in infant
studies which require non-contact and remote sensing environment.
References
Singh, A.K., Okamoto, M., Dan, H., Jurcak, V., Dan, I., 2005. Spatial registration of
multichannel multi-subject fNIRS data to MNI space without MRI. Neuroimage 27, 842-851.
Tsuzuki, D., Cai, D., Dan, H., Kyutoku, Y., Fujita, A., Watanabe, E., Dan, I., 2012. Stable and
convenient spatial registration of stand-alone NIRS data through anchor-based probabilistic
registration. Neuroscience research, 72, 163-171.
─────
* Presenting author.
E-mail address: [email protected] (D. Tsuzuki).
27

Functional Connectivity of
Z. Einalou1, K. Maghooli
{
1. Department Of Biomedical E2. Department
3. Institute of Biomedical
In this study, we aimed to investigate modified version of the color-wparticular stimulus dimension while suppressing a competing stimulus dimension, is commonly usevaluate PFC function [1, 2]. TCongruent (C) and Incongruent (IC). Connectivity stimulus is expected to be different because of A continuous wave 16 channelsTurkey) was used to measure the was placed on the forehead with approximate cortical sampling regions as depicted data were band-pass filtered using a correlation (PC) values were computedthe effect of indirect paths, by applying this method, the activity at all other 14 regions regressed out.channels that reside on two hemispheres:F(2,33) =3.84, p = 0.031. The rest of condition, 0.057 ± 0.0632 for C condition and 0.056for C condition, meaning a reversal of the temporal dynamics between those two chanpositive for IC condition, representing a synchronous contribution of those two channels to the suppression of irrelevant stimulus dimension standard cross correlation due to its inall the channels and highlighting only the actual correlation
Table 1: Statistical properties of partial correlation
Stimulus Type Channels: 5th
Mean ±Neutral -0.098 ±
Congruent -0.024 ±Incongruent 0.062 ± 0
References:
[1] Zysset S, Müller K, Lohmann G, von Cramon DYseparating interference and response conflict
[2]M. L. Schroeter S. Zysset, Th. Kupka, F. Kruggel, and D. Yves von Cramon, Spectroscopy Can Detect Brain Activity During a ColorEvent-Related Design”, Human Brain Mapping, vol.17, pp.61
[3] S. Aydore, M. Kıvanc Mıhcak, K. Ciftic, and A. AkıVia Gauss–Markov Modeling of fNIRS Signals”, Engineering, Vol. 57, No. 3, pp. 761-768, 2010.
[4] G. Marrelec, A. Krainik,d, H. Duffau, S. Lehe´ricy, J. Doyon and H. Benalicorrelation for functional brain interactivity investigation invol. 32, pp.228-237, 2006.
ctivity of the PFC via Partial Correlation A1, M. Dadgostar1, S. K. Setarehdan2, H. Y. Keskin
[email protected], [email protected]}
al Engineering, Science and Research Branch, Islamic Azad University, Tehran, Iran.t of Electrical and Computer Engineering, University of Tehran, Iran.e of Biomedical Engineering, Bogazici University, Istanbul, Turkey
tigate the functional connectivity in the prefrontal cortexword matching Stroop task. Stroop task, which requires responding while suppressing a competing stimulus dimension, is commonly us
This task consists of three different stimulus conditions: (IC). Connectivity patterns obtained from hemodynamic response to each ent because of the contribution of partially different neural networks [1]. ls near-infrared spectroscopy device (ARGES Cerebro, Hemosoft Inc., e changes in HbO2 concentrations from 11 healthy volunteers. approximate cortical sampling regions as depicted ing a wavelet algorithm with frequency range
mputed for each stimulus condition [4]. Since PCpplying this method, the PC between two channels is correlatedegressed out. We report in Table 1 the major PC change in two pairs of
mispheres: 1st and 12th with F(2,33) =4.1, p =0.025 st of the channel pairs have PC values in the range 0.058C condition and 0.056 ± 0.072 for IC condition. rsal of the temporal dynamics between those two chanresenting a synchronous contribution of those two channels to the
us dimension and decision making effort. The PC method is preferable to o its inherent elimination of the most common and underlying activity in only the actual correlation between the two channels.
al correlationh and 14th Channels: 1st and 12th
Std Mean ± Std0.149 0.044 ± 0.119 0.136 -0.085 ± 0.147 0.138 0.0821 ± 0.177
ramon DY, “Color-word matching stroop task: flict. Neuroimage. 2001;13:29-36.
. Kruggel, and D. Yves von Cramon, “Near-Infrared During a Color–Word Matching StroopTask in an pping, vol.17, pp.61–71, 2002.
c, and A. Akın, “On Temporal Connectivity of PFC RS Signals”, IEEE Transactions on Biomedical 010.
u, S. Lehe´ricy, J. Doyon and H. Benali, “Partial vity investigation in functional MRI”, NeuroImage,
ation Analysis
n-Ergen3, A. Akin3
sity, Tehran, Iran.Iran.
tal cortex (PFC) during a requires responding to a on, is commonly used to conditions: Neutral (N),
dynamic response to each rent neural networks [1]. Cerebro, Hemosoft Inc., hy volunteers. The probe ed in Figure 1 [3]. fNIRS of 0.003-0.08Hz. Partial analysis helps to remove
els is correlated, with the C change in two pairs of 025 and 5th and 14th with ge 0.058 ± 0.0647 for N n. PC values are negative o channels, while they are se two channels to the C method is preferable to nd underlying activity in
nnels.
Figure1: Placement of the fNIRS probe on the PFC
28

Hierarchical Bayesian estimation with ARD prior improves depth accuracy and
spatial resolution of diffuse optical tomography
Takeaki Shimokawa,1*
Takashi Kosaka,1 Okito Yamashita,
1 Nobuo Hiroe,
1
Takashi Amita,2 Yoshihiro Inoue,
2 and Masa-aki Sato
1
1ATR Neural Information Analysis Laboratories, Kyoto 619-0288, Japan
2R & D Department Medical Systems Division, Shimadzu Corporation, Kyoto 604-8511, Japan
Recently, high-density diffuse optical tomography (HD-DOT) has received much attention as an
advanced technique for visualizing the cortical activities. The large number of overlapping
measurement channels due to the use of high-density probe arrays permits the reconstruction of the
internal activities, even with a reflectance-only measurement. However, accurate three-dimensional
reconstruction is still a challenging problem. First, the exponentially decaying sensitivity causes a
systematic depth-localization error. Second, the nature of diffusive light makes the image blurred. In
this presentation, we propose a three-dimensional reconstruction method that overcomes these two
problems by introducing sensitivity-normalized regularization and sparsity into the hierarchical
Bayesian method [1]. We performed phantom experiments to validate the proposed method under
three conditions of probe interval: 26 mm, 18.4 mm, and 13 mm. We found that two absorbers with
distances shorter than the probe interval could be discriminated under the high-density conditions of
18.4-mm and 13-mm intervals. This discrimination ability was possible even if the depths of the two
absorbers were different from each other (see Fig. 1). These results show the high spatial resolution of
the proposed method in both depth and horizontal directions.
In addition, we extended this method to estimate the hemodynamic responses both in the cortex and in
the superficial layers incorporating prior knowledge that the hemodynamic responses in the cortex is
local and that in the superficial layers are rather global in the Bayesian method. We also show the
preliminary results of the extended method.
Fig. 1 (a) True absorber position. (b) Estimation result of the proposed method.
[1] T. Shimokawa et al., Opt. Express 20, 20427-20446 (2012).
29

Oral Session Neurodevelopment (I)
Saturday, 27th October 1:45pm
Chair: Richard Aslin
30

A cognitive neuroscience approach to the early identification of autism Charles A. Nelson III Abstract: There is wide support for the notion that the outcome of children diagnosed with autism is superior among those who receive early intervention. However, early intervention is predicated on early identification, and at the present time, the average age of diagnosis is 3 years. For a number of years now an international consortium of more than 18 sites has been studying infants at high risk for developing autism by virtue of having an older sibling with the disorder (placing the infant’s chances of developing an ASD at 1:5). Despite great promise, there are few behavioral signs of the disorder that are predictive in infants less than 12-‐18 months. One reason for the failure to identify signs in younger infants is how limited the behavioral repertoire is in infants less than 12 or so months. In the program of research I will talk about, we hypothesize that examining the brain directly, bypassing behavior, may prove more efficacious, as changes in behavioral development typically follow changes in brain development. In this context I will describe preliminary findings from a longitudinal study focused on tracking high risk infants from 3-‐36 months of life, using a battery of EEG, ERP, and fNIRS tasks, although the major focus of this talk will be on our fNIRS data.
31

Evoked changes in oxygen consumption in premature neonates
Nadege Roche-Labarbe1,2, Angela Fenoglio3, Harsha Radakrishnan1, Marcia Kocienski-Filip4, Stefan A. Carp1, Jay Dubb1, David A. Boas1, P. Ellen Grant3,4, Maria Angela Franceschini1 1A.A. Martinos Center for Biomedical Imaging, Massachusetts General Hospital - Harvard Medical School, Charlestown, MA, USA 2Psychologie des Actions Langagières et Motrices, Université de Caen Basse-Normandie, FRANCE 3Fetal-Neonatal Neuroimaging & Developmental Science Center, Children’s Hospital Boston, MA, USA 4Newborn Medicine, Brigham and Women’s Hospital, Boston, MA, USA Corresponding author: N. Roche-Labarbe at [email protected] The hemodynamic functional response is used as a reliable marker of neuronal activity in countless studies of brain function and cognition. In newborns and infants however, conflicting results have appeared in the literature concerning the typical response, and there is little information on brain metabolism and functional activation. Measurement of all hemodynamic components and oxygen metabolism is critical for understanding neurovascular coupling in the developing brain, and for using the functional response as a reliable functional imaging marker of brain development. To this aim we combined multiple NIRS techniques: we used diffuse correlation spectroscopy (DCS) to measure relative cerebral blood flow changes (rCBF), frequency domain near infrared spectroscopy (FDNIRS) to measure baseline hemoglobin oxygenation (SO2), oxy- and deoxy-hemoglobin concentrations (HbO and HbR respectively) and cerebral blood volume (CBV), and continuous wave near infrared spectroscopy (CWNIRS) to measure relative hemoglobin concentration and oxygenation changes (rSO2). By combining all these measures we estimated relative changes in the cerebral metabolic rate of oxygen (rCMRO2) in the somatosensory cortex of 6 preterm neonates during passive tactile stimulation of the hand. We are the first to report functional changes in cerebral blood flow and cerebral oxygen consumption in premature newborns. Our data shows in preterm neonates the typical pattern of hemodynamic response to sensory stimulation: an increase in rSO2 and CBV. However, the “preterm” response however is slower (longer time to peak, see figure) compared with adults. We did not observe any inverted response pattern associated with stimulation. Blood flow starts increasing immediately after stimulus onset, and returns to baseline before blood volume. This is consistent with the model of pre-capillary arteriole active dilation driving the CBF response, with a subsequent CBV increase influenced by capillaries and veins dilating passively to accommodate the extra blood. The higher compliance of the veins relative to arterioles can explain the slower return to baseline of CBV with respect to CBF. rCMRO2 shows a biphasic pattern: an increase immediately after stimulus onset, followed by a significant post-stimulus undershoot due to blood flow returning faster to baseline than oxygenation. However, if we calculate rCMRO2 taking into account the longer mean transit time through the venous compartment in preterm infants compared with adults (τ≥5s), the undershoot disappears (see figure). We observed an evoked flow-metabolism ratio of n=2.8, consistent with numerous studies in animals and human adults.
32
Building from Basics: fNIRS recordings from 6-month olds investigate sensory cortex selectivity and response suppression
Lauren L. Emberson, Holly Palmeri, & Richard N. Aslin Brain and Cognitive Sciences Department, University of Rochester
While the last 15 years has seen a veritable explosion in both interest and knowledge
about the neural mechanisms supporting cognition, methodological constraints have prevented investigations into the functional organization of the brain early in the lifespan. FNIRS is uniquely poised to facilitate such investigations by providing many of the benefits afforded by fMRI (e.g. unambiguous spatial location of neural responses) but without the same methodological hurdles (e.g. the need for rigid head stabilization). Of course, using fNIRS to investigate the neural mechanisms supporting infant cognition has it’s own set of methodological issues to tackle (see Aslin, in press for a review). Part of the challenge in establishing methodologically rigorous investigations is the fact that so little is known about the young, developing brain. Some early surprising findings (e.g. the involvement of the prefrontal cortex in simple habituation studies, e.g., Nakano, Watanabe, Homae, & Taga, 2009) suggest that the infant brain could be functionally quite different from the adult brain. Thus, it is unclear whether a given pattern of results has arisen from unanticipated methodological limitations or is a result of functional differences in the infant brain.
In an effort to gain traction on this issue, the current project employs established, rigorous behavioral paradigms from the adult cognitive neuroscientific literature to probe functional neural activity in infants at 6 months. These paradigms provide strong hypotheses that will support a comparison of the adult and infant brain. Here, we describe a part of this broader effort, in which we utilize a well-established phenomenon in adult fMRI studies, response suppression. Response suppression has been described as “[o]ne of the most robust experience-related cortical dynamics” (Grill-Spector, Henson, & Martin, 2006) and is defined as a reduction in neural response during the repetition of a stimulus compared to the presentation of variable stimuli. These differential neural responses occur in cortex that is selective for a particular stimulus.
We employed a response suppression paradigm to investigate responses of visual and auditory cortex to auditory or visual stimuli. Infants viewed smiling, female faces and heard familiar, two-syllable words spoken in infant-directed speech (e.g., “diaper”). Stimuli were presented in uni-modal blocks (auditory or visual stimuli presented at 1sec SOA) that were either repeated (a single face or word presented 8 times) or variable (eight different faces or eight different words). After each block, a jittered ISI was employed (mean duration = 6.5 secs, 4 to 9 secs). While this project is ongoing, data collected from 16 infants demonstrate that auditory presentation produces responses in the auditory cortex but not the visual cortex. Moreover, repeated auditory presentation results in a weaker fNIRS response than variable presentation in these channels. We interpret this as strong evidence for response suppression in auditory cortex. We also find responses in visual cortex to visual presentation but evidence for repetition enhancement rather than response suppression in occipital channels. Future analyses will probe these potential modality-differences in neural selectivity and response suppression. Aslin, R. N. (in press). Questioning the questions that have been asked about the infant brain using NIRS. Cognitive
Neuropsychology. Grill-Spector, K., Henson, R., & Martin, A. (2006). Repetition and the brain: neural models of stimulus-specific
effects. Trends in Cognitive Sciences, 10, 14-23. Nakano, T., Watanabe, H., Homae, F., & Taga, G. (2009). Prefrontal cortical involvement in young infants’ analysis
of novelty. Cerebral Cortex, 19, 455-463.
33

The specificity of the neural response to language at birth Lillian May (1), Judit Gervain (2), Manuel Carreiras (3,4), Janet F. Werker (1) 1. University of British Columbia; 2. CNRS-Paris Descartes; 3. Basque Centre for Cognition, Brain, & Language; 4. IKERBASQUE Basque Foundation for Science Contact: [email protected]
From birth, the human brain responds specially to language. Greater neural activation is reported
in neonates when listening to forward language versus acoustically matched but non-linguistic backwards language (Pena et al., 2003). Recent research has indicated that this response to language at birth is not purely a result of language experience: the neonate brain responds to unfamiliar language in similar neural areas as familiar language, although less strongly (Sato et al., 2011; May et al., 2011). However, it is still unknown whether the neural response to language seen at birth is triggered only by language stimuli, or if stimuli sharing some properties of language might also elicit a similar brain response in neonates. To answer this question, we compared the newborn neural response to familiar language, unfamiliar language, and whistled language.
Silbo Gomero is a whistled surrogate language of Spanish, used in parts of the Canary Islands. As a surrogate language, it shares Spanish prosody and grammar, but uses whistled contours instead of speech sounds and has a very limited phonological inventory. Moreover, Silbo Gomero is never acquired as a first language. Crucially, the adult brain seems to require experience to process Silbo Gomero specially: only Silbo speakers – and not Spanish speakers - show greater left hemisphere activation to forward versus backwards Silbo (Carreiras, 2005).
In the present studies, we used functional Near Infrared Spectroscopy to examine cortical activation in English-exposed newborns in response to both forward and backward familiar language (English), unfamiliar language (Spanish), and whistled language (Silbo Gomero). Activation was measured across 12 optical channels in temporal regions of each hemisphere (24 channels in total). If the newborn brain response to language is triggered specifically by language stimuli, we expected to find strong activation for both familiar and unfamiliar language, but little or no activation to whistled language. In contrast, if the newborn brain responds to all communicative forms that contain prosodic and rhythmical properties of language, we expected to find activation to whistled language as well as to familiar and unfamiliar language.
In Study 1, we measured the neural response to forward and backward English (familiar language) as well as forward and backward Spanish (unfamiliar language), while in Study 2 we measured the neural response to forward and backward Spanish and forward and backward Silbo Gomero. Results revealed strong bilateral activation in similar anterior temporal regions to both forward English and forward Spanish. Additionally, we found greater activation to forward versus backward English, but no difference in the response to forward versus backward Spanish. When comparing the neonates’ neural activation to Spanish versus Silbo Gomero we observed a significant difference in activation between languages: the neural response to Spanish was significantly larger than the response to Silbo, primarily in the anterior temporal regions. The neonate brain response to both forward and backward Silbo was very small across all regions.
Our results indicate that the newborn brain is broadly tuned to respond to both familiar and unfamiliar language, with an additional advantage for forward versus backwards only in response to familiar language, but that the neural response to language is not triggered by stimuli sharing only the rhythmical and prosodic properties of language. This suggests a high level of specificity in the neural response to language from the first days of life, and suggests that all properties of language—including phonological complexity-- may need to be present to activate this response.
34

Oral Session Neurodevelopment (II)
Saturday, 27th October 5:00pm
Chair: Gergely Csibra
35

NIRS imaging of spatiotemporal activity in the developing brain
Gentaro Taga
Graduate School of Education, The University of Tokyo
The multi-channel continuous wave NIRS technique has a great advantage in studying
detailed hemodynamics in relation to cortical activity in young infants. The technique has
been used to reveal not only functional activations in response to stimuli but also resting-state
networks of spontaneous activity during sleeping in infants. It is notable that detecting timing
information among different regions of the cortex does not necessarily need measurement of
absolute values of hemodynamic signals, which has been a long-lasting problem of
continuous wave NIRS. Here, I will discuss open issues concerning spatiotemporal property
of hemodynamics in the developing brain.
(1) Do subtle differences in timing of response to stimuli reflect flows of cortical activation?
(Watanabe et al. Hum Brain Map 2012; Taga et al. Phil. Trans. R. Soc. A 2011)
(2) Do specific patterns of response of oxy-Hb and deoxy-Hb changes represent cortical
activation or deactivation? (Watanabe et al. Dev Psychobiol 2012)
(3) Is the information on phase differences between oxy-Hb and deoxy-Hb changes useful to
understand mechanisms of interaction between neural and metabolic processes? (Taga et
al. Neurosci Let 2000; Pierro et al. NeuroImage 2012)
(4) Do the resting state network change depending on sleep states?
(5) Do the resting state network reflect developmental disorders? (White et al. NeuroImage
2012)
(6) Are the resting state networks different between preterm and term infants? (kato et al.
Brain & Dev 2012; Arichi et al. NeuroImage 2012)
(7) How the spontaneous hemodynamic changes affect responses to stimuli? (Colonnese &
Khazipov NeuroImage 2012)
(8) Is the resting state network modified by repetition of stimuli or by behavioral learning?
(Homae et al. Frot Psychol 2011)
(9) Do the sequences of transient spatiotemporal patterns of hemodynaic changes encode
functional information that the brain creates?
(10) How does the development of the anatomical connectivity change the resting state
network?
36
Cortical Mapping of 3D Optical Topography in infants
Maria D Papademetriou1, John Richards2, Teresa Correira1, Anna Blasi3, Sarah Lloyd-Fox4, Mark Johnson3, Clare E Elwell1
1Medical Physics and Bioengineering, University College London, UK 2Department of Psychology, University of South Carolina, Columbia, USA
3Department of Forensic and Neurodevelopmental science, Kings College, London, UK 4Centre for brain and cognitive development, Birkbeck College, London, UK
Over the last decade optical topography (OT) has to study functional brain imaging in infants. The technology can be used to study awake infants and address topics such as biological motion, face and voice processing. Even though OT has been used to map haemodynamic responses during activation with specific regions of the cortex, co-registration between the haemodynamic response measured at the surface of the head and the underlying cortical anatomy remains a challenge. This is primarily due to the lack in capacity for measuring brain structure for anatomical reference and the lack of common control points between the optical array, the head and the anatomical image. Furthermore, OT studies treat the data as single source-detector (channel) heamodynamic responses even if the data are measures from multiple channels at different separations. Conventional image reconstruction involves finding the optical properties of the medium from a set of measurements, which are then combined to calculate the chromophore concentrations. We use a multispectral imaging algorithm to reconstruct haemodynamic responses and obtain 3D optical topography images. In order to make a precise statement about cerebral specialisation during cortical activation it is necessary to co-register functional activation onto an anatomical atlas. In this paper we describe a method for co-registering 3D optical topography images on 3D brain volumes rendered from MRI scans. In this paper we are presenting a method for co-registering 3D optical topography images onto anatomical brain images obtained from MRI structurals of the individual infants.
Five 4-7 month old infants were included in the study. The experiment consisted of three types of auditory experimental trials – voice, non-voice and silence. The trials alternated beginning with 10-s baseline followed by 10-s experimental trial. The UCL optical topography system was used for data acquisition. Two optical imaging arrays were placed on each temporal lobe, providing a total of 19 channels per array. The probes were placed according to anatomical landmarks which were obtained by measuring each infants head circumference, distance between the forehead, ears and lower point of the back of the skull. Increases in oxyhaemoglobin concentration (HbO2) were measured and reconstructed using a multispectral imaging algorithm with spatially variant regularisation to optimise depth discrimination. Images were obtained showing the distribution of activation in a plane parallel to the surface, as well as changes in activation with depth. Structural MRIs of the subjects were also obtained. The scans were used to reconstruct 3D head and brain images of the participants. The anatomical landmarks used for placing the probes were marked on the head reconstructions as offsets from the anterior commissure. These marks were used to reconstruct the probes and channel positions on the head reconstructions. The images of the HbO2 changes during activation were co-registered on the 3D brain reconstructions rendered from the MRI scans.
State-of-the-art optical topography systems, coupled with sophisticated data analysis and image reconstruction can provide a practical tool which can be used to answer research questions in developmental psychology.
37

Interaction between brain maturation and experience: hemodynamic responses to speech categories in
full term and preterm neonates
Minagawa-Kawai, Y.1,2,*, Cristia, A3., Arimitsu, T.4, Uchida-Ota, M. 1, Ikeda, K.4, Takahashi, T.4,
Dupoux, E. 5
1. Graduate School of Human Relations, Keio University
2. Institut d'étude de la cognition, Ecole Normale Supérieure
3. Max Planck Institute for Psycholinguistics
4. Department of Pediatrics, Keio University, School of Medicine
5. LSCP, École des Hautes Etudes en Sciences Sociales
* presenting author e-mail: [email protected]
The development of near-infrared spectroscopy (NIRS) has allowed us to effectively measure
auditory-related neural system in very young human brains. Utilizing this advantage, we measured
cerebral responses to vowel and intonation changes in full term neonates (37-41 weeks of gestation),
preterm neonates (26-33 weeks of gestation) shortly after birth and preterm infants (26-33 weeks of
gestation) at their due date. We document differences and similarities between the three groups with
respect to (1) the time course and shape of the evoked hemodynamic response (oxygenated
hemoglobin and deoxygenated hemoglobin) in comparison with the adult Hemodynamic Response
Function (HRF), (2) response amplitudes and activated regions depending on the two change
conditions, (3) the connectivity of frontal and temporal regions and (4) analysis of resting state is still
ongoing. In this dataset, HRFs similar to the adults’ was observed for full term neonates and preterm
infants at due date., but not for preterm neonates Asymmetrical cerebral activations were also
observed for the former two groups around the Supra Marginal Area in response to both types of
changes. Interestingly, connectivity during presentation of speech was stronger for the preterm infants
at due date than the other two groups, suggesting a critical role of auditory experience outside the
utero. In current analyses, we are investigating resting state connectivity in all three groups. These
results underline the interaction between maturation and auditory experience for the functional
development of neonates’ brain.
38

Developmental Changes in Frontal-Parietal Activation Associated with Visual Working Memory Capacity
John P. Spencer ([email protected]), Aaron T. Buss, Nicholas Fox
& Larissa Samuelson Department of Psychology & Delta Center, University of Iowa
For decades, we have known that children’s visual working memory (VWM) capacity
increases over development. Moreover, several theories have proposed that changes in working memory capacity underlie major transitions in thought. Nevertheless, there have been relatively few investigations of the neural systems that underlie the development of VWN capacity, particularly early in development when changes are most dramatic.
Work using fMRI with adults has shown that activation in the intra-parietal sulcus (IPS) and dorso-lateral prefrontal cortex (DLPFC) increases as working memory loads increase. For instance, in the change detection task, participants are asked to remember the features of a set of objects presented in a sample array. After a 1 second delay, they are shown a second test array and are asked whether the objects are the ‘same’ or ‘different’. Activation in IPS increases with set size. Critically, neural activation asymptotes once the set size increases beyond the participant’s VWM capacity. That is, for participants with a VWM capacity of 4 items, there is comparable activation in IPS at set sizes 4-8. Moreover, studies have shown that activation in DLPFC is robust, particularly at higher set sizes when the memory demands are severe.
In the present study, we asked whether these signatures of VWM processes are evident early in development during periods of rapid change in working memory capacity. 14 3-year-old children and 16 4-year-old children completed a change detection task with set sizes of 1, 2, and 3 objects in an event-related design. On each trial, the sample array was presented for 2s, there was a 1s delay, and then the test array appeared until participants responded. This was followed by a jittered inter-trial interval. In each run, children completed 6 ‘same’ trials and 6 ‘different’ trials at each set size. They completed a total of 4 runs across two visits to the lab. Behavioral data from these sessions replicated previous findings showing that 3-year-olds have a VWM capacity of roughly 1 item (M = 1.28 items), while 4-year-olds have a VWM capacity of roughly 2 items (M = 1.73 items).
NIRS data were recorded using a TechEn CW6 system with 16 detectors and 8 sources. We recorded from frontal (F5/F3; F4/F6) and parietal (P5/P3; P4/P6) areas in both hemispheres. The data were high pass filtered at .016 Hz and low pass filtered at .5 Hz. Pre-processing eliminated noisy signals (<80dB) and trials with motion artifact (dOD > .35). Analyses focused on trials with correct behavioral performance. 76% of correct trials for 3-year-olds had usable NIRS data (11.3 trials/participant), while 65% of correct trials for 4-year-olds had usable NIRS data (11.4 trials/participant).
Results showed an increase in left parietal activation (near P3) as set size increased, with a statistically robust correlation (R2 = 0.152) between NIRS activation at high set sizes and behaviorally-measured VWM capacity. This was also the case in left frontal regions (near F5; R2 = 0.332). Right parietal activation (near P4) showed an increase in activation over set sizes, but this effect was primarily driven by the neural response on ‘different’ trials (R2 = 0.368). These data are generally consistent with data from adult fMRI studies; however, unlike studies in later development, our data suggest that the VWM system shows greater lateralization in early childhood.
39

Oral Session Keynote
Saturday, 27th October 6:15pm
40

TITLE: Brain connectivity inference for fMRI data
William Penny
ABSTRACT: I will describe a set of differential equations which describe how (i) stimulus activity gives rise to neurodynamics which in turn (ii) give rise to changes in blood volume and deoxyhemoglobin which in turn (iii) give rise to the BOLD fMRI signal. Parameters of this model are then estimated from fMRI data using a Bayesian estimation approach. This produces posterior estimates of model parameters and an approximation to the model evidence. Different assumptions about brain connectivity (or other aspects of the forward model) can then be formally compared using Bayesian model inference. This approach can be applied to NIRS by updating part (iii) of the forward model.
41

Oral Session Applications: Adult (I)
Sunday, 28th October 8:00am
Chair: Daniel Leff
42

Application of functional near infrared spectroscopy in Psychiatry
Andreas J. Fallgatter
Dept. of Psychiatry
University of Tuebingen
Germany
Functional near infrared (fNIR) spectroscopy can be used for an in-vivo assessment of
activation changes in brain tissue. Due to its simple and quick applicability as well as the
absence of side effects, fNIR spectroscopy is particularly well tolerated by psychiatric patients
and can hence markedly contribute to the understanding of the neurobiological basis of
psychiatric disorders. Validity and reliability of fNIR spectroscopy measurements to assess
task-related cognitive activation have been repeatedly confirmed among healthy subjects.
Beyond that, the application of fNIR spectroscopy in order to detect altered cortical
oxygenation in psychiatric patients during cognitive tasks has been highly intensified over the
last two decades. In this context, hypofrontality, a decrease in frontal lobe activity that is
associated with a number of clinical symptoms and psychiatric disorders, has been
demonstrated in a wide range of fNIR spectroscopy studies with psychiatric patients. Despite
its variety of beneficial properties, the most apparent disadvantages of NIR spectroscopy
compared to other imaging techniques are its limited spatial as well as depth resolution and its
restriction to cortical areas. Further technical development and a broadened implementation of
combined measurements are necessary in order to uncover distinct brain activity alterations in
different psychiatric disorders. In addition broad and longitudinal applications of fNIR
spectroscopy measurements in psychiatric research are required in order to identify robust
diagnostic markers which are needed to establish NIR spectroscopy as a valid interindividual
screening instrument in psychiatry.
43

PHYSIOLOGICAL CORRELATES OF PERCEPTUAL LEARNING Uma Shahani1*, Sobana Wijeakumar1, Ross Aitchison1, Pamela Knox1, Anita Simmers1 1Department of Life Sciences, Glasgow Caledonian University, Cowcaddens Road, Glasgow G4 0BA *[email protected] Purpose: To compare haemodynamic and electrophysiological responses in amblyopic and normally sighted participants whilst they did a perceptual learning task Methods: Functional near infrared spectroscopy (fNIRS) and electroencephalography (EEG) (Wijeakumar et al 2012) were used to record the extent of change in activation patterns in normal and amblyopic cortices while the observers were trained in a dichoptically presented game of tetris. fNIRS measured concentrations of oxyhaemoglobin (HbO), deoxyhaemoglobin (Hb) and total haemoglobin (THC) on a 2 channel oximeter (Oxiplex TS). EEGs were recorded on a multichannel Brain Vision EEG acquisition system. Global motion thresholds were measured using a 2-Alternative Forced Choice (2-AFC) discrimination task in normal and amblyopic participants while viewing random dot kinematograms. The stimuli were viewed via eMagin Z800 3DVisor goggles (HMD), which allowed the manipulation of individual input to either eye. Visual feedback was given in the form of the fixation dot changing in colour to reinforce correct responses. Binocular motion coherence thresholds were measured for each participant. The mean threshold number of dots was then used in a second program where the signal dots for motion coherence set at a high contrast were presented to the AE with noise dots increasing in contrast from 0% presented to the FE (randomly assigned in the visually normal participants). This technique of matching visibility ‘balance point’ between eyes allows for maximum binocular combination of the visual stimuli and is described by Knox et al (2012) Training: A dichoptic perceptual training task of the game tetris that involved the manipulation of the position and orientation of falling 4-block shapes was undertaken for 5 days (3 x 15 minute sessions/day). The aim of the game was to form a complete wall of blocks with no gaps. It was modified so that the falling blocks were presented to the AE. The blocks that formed the wall were presented to the FE via the HMD goggles. Inter-ocular contrast thresholds measured previously were then used to match the visibility of the blocks in each eye by reducing the contrast of the blocks presented to the FE while the blocks presented to the AE were maintained at 70% contrast. This stimulus arrangement required binocular interaction to complete the task. Physiological Recordings: fNIRS and electrophysiological recordings were taken from normal and amblyopic observers from over the primary visual cortex (V1) on Day 1, Day 3 and Day 5 of the training. Clinical assessments and behavioural data (task-based scores – levels reached) were also collected. Results: VA and stereo acuity measures were taken both pre and post training. These showed improvements post training in amblyopic observers. Normal participants also showed an increase in performance at the task. fNIRS: All three haemoglobin chromophores were recorded and normalized to a pre-stimulus baseline. Changes in HbO levels in response to the tetris stimulus on Day 1 were smaller in amblyopes than in normal participants. Post training: HbO levels increased as a result of training, being greatest on Day 3 of the training period. Normal participants showed a steady increase in HbO until Day 5 of the training period. Electrencephalography: FFTs were performed on EEG records from O1, Oz and O2 in amblyopic and normal participants. No difference was seen between amblyopic and normal participants in the gamma band response (GBR) on Day 1. Post Training: Increased GBRs were observed from Day 1 to Day 5 over all examined areas and observers. A linear correlation was observed between behavioral, electrophysiological and fNIRS measures over V1. Conclusion: Our results, which included behavioral, clinical and physiological measures, have shown that visual perception ‘improves’ as a consequence of perceptual learning. References: 1. Knox PJ, Simmers AJ, Gray LS, Cleary M (2012): An Exploratory Study: Prolonged Periods of Binocular
Stimulation Can Provide an Effective Treatment for Childhood Amblyopia Investigative Ophthalmology & Visual Science, February 2012, Vol. 53, No. 2
2. Wijeakumar S, Shahani U, McCulloch DL & Simpson WA (2012) Neural and vascular responses to fused binocular stimuli: A VEP and fNIRS study Investigative Ophthalmology & Visual Science. (In Press)
44

Neural correlates of spontaneous deception Xiao Pan Ding1, Xiaoqing Gao2, Genyue Fu3,Kang Lee4
1East China Normal University, 2York University, 3Zhejiang Normal University, 4University of Toronto. Presenting author email address: [email protected]
Recently, research on the neural basis of deception has flourished. While most of the existing studies instructed participants when and how to lie, the present study focused on the neural correlates underlying spontaneous deception. Participants took part in a novel guessing game where they guessed which side a coin would appear on a computer screen by moving their left or right hand hidden in the drawers of a table (Figure 1). Then, the correct answer would appear on the screen. Participants could gain points if they had guessed correctly. Participants were asked to self-report whether their guesses were correct. Because participants’ hand movements appeared invisible to the experimenter, participants had opportunities to report falsely that they guessed correctly when in fact they did not. Unbeknownst to the participants, their hand movements were recorded by hidden cameras inside the drawers and thus could be verified against their verbal report of correctness of their guesses. Participants were motivated to lie spontaneously because the more points they gained, the sooner they could finish the experiment and receive payment. We used the near-infrared spectroscopy (NIRS) methodology to collect neural responses when participants made incorrect guesses and lied, incorrect guesses and told the truth, and correct guesses and told the truth. We found that the incorrect-lie trials elicited significantly greater [oxy-Hb] changes in the prefrontal cortex, specifically in the left superior frontal gyrus, relative to the incorrect-truth trials (Figure 2). This finding suggests that spontaneous lying, like the instructed lies, is an executive functioning intensive task and engenders greater involvement of the prefrontal cortical executive function network. We also found that the correct-truth trials produced greater neural activities in the frontal area than both the incorrect-truth and incorrect-lie trials, suggesting the important roles of rewarding and self-evaluation systems in response to the success and failure of truth-telling and deception.
Figure 1
Figure 2
45

Frontal activation scales with working memory load: a near-infrared spectroscopy study
Frank A. Fishburn1, Andrei V. Medvedev2, Chandan J. Vaidya3,4
1Interdisciplinary Program in Neuroscience, Georgetown University Medical Center, Washington, DC
2Center for Functional and Molecular Imaging, Georgetown University Medical Center, Washington, DC
3Department of Psychology, Georgetown University, Washington, DC
4Children’s Research Institute, Children’s National Medical Center, Washington, DC Email: [email protected]
Introduction Working memory, the ability to maintain and manipulate information temporarily, is a fundamental component of higher level cognition. Working memory is commonly measured using the 'n-back' which requires subjects to remember a stimulus that occurred n trials ago. As the to-be-remembered stimulus is updated with every new trial, the subject must resist interference from irrelevant stimuli while constantly updating what is to be remembered. Thus, the amount of information that is maintained and manipulated varies with n, the working memory load. Functional magnetic resonance imaging (fMRI) studies show that working memory depends upon the frontal lobes, with activation of frontal regions increasing in response to working memory load [1],[2]. The present study attempts to replicate these findings using near-infrared spectroscopy (NIRS), as a cognitive load effect has not yet been demonstrated with this imaging modality.
Method Three subjects (2 female, 1 male) performed an n-back task with loads of 1-, 2-, and 3-back. Each load condition contained 100 randomized stimuli (40 targets, 60 nontarget) with a jittered iterstimulus interval. Optical data were recorded on a two-wavelength (760 and 830 nm) continuous-wave CW5 imaging system (TechEn, Inc., Milford, Massachusetts). Four probes each holding 3 sources and 8 detectors were placed bilaterally on the scalp covering the inferior and middle frontal gyri as well as parietal cortex. Demodulation and low pass filtering (.8 Hz) were performed within the CW5 software. Artifact removal was performed using ICA (FastICA) and visual inspection. Signals were converted to oxygenated- and deoxygenated-hemoglobin concentrations using HOMer [3]. These data were then segmented, baselined, and averaged around the onsets of target stimuli. Each target trial was then averaged over a 7-second window, starting from 5 seconds after stimulus onset. Two-sample one-tailed t-tests were then used to compare each load condition for each channel. For a given contrast, each of the reported statistics represents the best channel from the best subject.
Results All subjects demonstrated a load effect on at least one frontal channel, for both oxygenated (an increase) and deoxygenated (a decrease) signals. Positive load effect was detected for 2-back > 1-back (Hb-oxy: t=2.39, p<.05; Hb-deoxy: t=-1.77, p<.1), 3-back > 2-back (Hb-oxy: t=2.83, p<.01; Hb-deoxy: t=-2.06, p<.05;), and 3-back > 1-back (Hb-oxy: t=2.43, p<.05; Hb-deoxy: t=-2.46, p<.05).
Discussion These preliminary results are compatible with the existing fMRI literature, indicating that frontal activity increases with n-back load. This is the first demonstration that NIRS can be used to measure parametric increases of working memory load. Continuing research will provide better information about the spatiotemporal dynamics of this load effect and the extent of inter-subject differences.
References [1] Braver, T. S., Cohen, J. D., Nystrom, L. E., Jonides, J., Smith, E. E., & Noll, D. C. (1997). A Parametric Study of Prefrontal Cortex Involvement in Human Working Memory. NeuroImage, 5(1), 49–62. doi:10.1006/nimg.1996.0247 [2] Manoach, D. S., Schlaug, G., Siewert, B., Darby, D. G., Bly, B. M., Benfield, A., Edelman, R. R., et al. (1997). Prefrontal cortex fMRI signal changes are correlated with working memory load. Neuroreport, 8(2), 545. [3] Huppert, T. J., Diamond, S. G., Franceschini, M. A., & Boas, D. A. (2009). HomER: a review of time-series analysis methods for near-infrared spectroscopy of the brain. Applied optics, 48(10), D280–298.
46

The effect of inner speech on arterial pCO2, cerebral hemodynamics and oxygenation
F. Scholkmanna,b, M. Wolfa and U. Wolfb
a Biomedical Optics Research Laboratory, Division of Neonatology, University Hospital Zurich, Switzerland [email protected]
b Institute for Complementary Medicine KIKOM, University of Bern, Switzerland
Introduction: We showed in previous studies that different speech tasks cause changes in cerebral oxy-, deoxy- and total hemoglobin concentration ([O2Hb], [HHb], [tHb]) [1, 2], which are accompanied by changes in arterial carbon dioxide pressure (PaCO2) [2], the latter possibly being the cause of the former. The aims of this study were 1) to possibly reduce the influence of PaCO2 by using inner speech instead of externally voiced speech and 2) to test how inner speech affects cerebral [O2Hb], [HHb], [tHb]. Material and methods: In 7 adult volunteers each measurement lasted 38 min (8 min pre-baseline, 5 min task, 5 min recovery, 5 min task, 15 min post-baseline). Each subject performed 3 different tasks (inner recitation of hexameter (IRH) or prose (IRP) verses) and a control task (mental arithmetic (MA)) on different days according to a randomized crossover design. Absolute concentrations of cerebral [O2Hb], [HHb], [tHb] and tissue oxygen saturation (StO2) were measured using an ISS OxiplexTS NIRS instrument. NIRS sensors were placed over the left and right pre-frontal cortex (PFC). A Nellcor N1000 gas analyzer measured end-expiratory CO2 pressure, which represents PaCO2. Statistical analysis was applied to the differences between pre-baseline, 2 task and 4 post-baseline periods. The 2 brain hemispheres and 3 tasks were tested separately. Results: During the tasks: 1) PaCO2 decreased significantly (p<0.05) during the IRH (~3 mmHg) and MA (~0.5 mmHg) task. 2) [O2Hb] and StO2 decreased significantly during IRH (~1.5 µM; ~1.5 %), IRP (~1 µM; ~1.5 %) and MA (~1 µM; ~1.5 %) tasks. During the post-baseline period: [O2Hb] and [tHb] of the left PFC decreased significantly after the IRP and MA task (~1 µM and ~2 µM, respectively). Conclusion: The study showed that inner speech affects PaCO2, probably due to changes in respiration. Although a decrease in PaCO2 is causing cerebral vasoconstriction and could potentially explain the decreases of [O2Hb] and StO2 during inner speech, the changes in PaCO2 were significantly different between the three tasks (no change in PaCO2 for MA), but led to very similar changes in [O2Hb] and StO2. Thus, the cerebral changes cannot solely be explained by PaCO2. References: [1] U. Wolf, F. Scholkmann, R. Rosenberger, et al. Changes in hemodynamics and tissue oxygenation
saturation in the brain and skeletal muscle induced by speech therapy – a near-infrared spectroscopy study (2011). ScientificWorldJournal, 11: 1206–1215.
[2] F. Scholkmann, S. Klein, U. Gerber, et al. End-expiratory CO2: an important parameter for a correct interpretation of cerebral hemodynamics and oxygenation changes measured with fNIRS. Advances in Experimental Medicine and Biology (in press).
47

Oral Session Applications: Adult (II)
Sunday, 28th October 11:30am
Chair: Hellmuth Obrig
48

Adult Clinical Applications of Near Infrared Spectroscopy Martin Smith
Consultant and Honorary Professor Neurocritical Care Unit, University College London Hospitals
Department of Medical Physics and Bioengineering, University College London Near infrared spectroscopy (NIRS) is a non-‐invasive technique that offers the potential for bedside monitoring of cerebral oxygenation, haemodynamics and metabolic status over multiple regions of interest and across a wide spectrum of clinical scenarios. Despite the potential of NIRS to address many of the shortcomings inherent in other cerebral monitoring techniques, there has been limited adoption into clinical practice more than three decades since its first description [1]. In the last decade there has been a rapid expansion of clinical experience using NIRS to monitor cerebral oxygenation, particularly in cardiac surgery where there is some evidence that NIRS-‐guided brain protection protocols might lead to a reduction in peri-‐operative neurological complications [2]. There are no data to support the wider application of NIRS to monitor cerebral oxygenation during routine anesthesia and surgery despite claims of benefit by manufacturers of cerebral oximeters [3]. Cellular hypoxia/ischemia is a key component of the multiple pathophysiological processes in acute brain injury (ABI), and a logical application for NIRS is after ABI where secondary ischaemic injury is common and associated with adverse outcome. However, there has been limited research into the utility of NIRS in this area and no outcome studies. To date, studies of NIRS in adult ABI have been observational and highlight the problem of defining a threshold for hypoxia/ischaemia, particularly in the presence of acutely disordered cerebral metabolic function. NIRS measurement of cytochrome c oxidase concentration might provide additional information about metabolic failure after ABI and, in association with oxygenation variables, aid in the determination of NIRS-‐defined ischemia following ABI [4]. Cerebrovascular autoregulation is frequently impaired after ABI and this is also associated with poor outcome. NIRS can be used to monitor cerebrovascular reactivity [5] and might provide a sensitive assessment of autoregulation that will readily translate into clinical practice. The challenges of describing NIRS variables in the normal brain are accentuated by the presence of intracranial hematoma, cerebral edema and subarachnoid blood which may invalidate some of the assumptions upon which NIRS algorithms are based. Newer NIRS technology will play an important role in overcoming these issues [6]. NIRS and other multimodal monitoring techniques generate large and complex datasets whose interpretation is difficult and often incomplete. Furthermore, what can be measurable at the bedside and what clinicians really need to know are often very different. The development of mathematical models of brain hemodynamics and metabolism allows in silico derivation of physiological variables which can be compared with measured signals to facilitate their interpretation [7]. Such models will allow access at the bedside to simultaneously measured signals and model predictions of measured and unmeasured variables, thereby delivering enhanced information that can be used to support clinical decision making in real-‐time. NIRS has many potential advantages over other neuromonitoring techniques but further investigation and technological advances are necessary before it can be introduced more widely into clinical practice [3]. 1. Kirkman M, Smith M. Anesthesiol Clin 2012: 30: 269-‐87 2. Vohra H, et al. Interact Cardiovasc Thorac Surg 2009; 9: 318-‐22 3. Smith M. Phil Trans R Soc 2011; 369: 4452-‐69 4. Smith M, Elwell C. Anesth Analg 2009; 108; 1055-‐7 5. Zweifel C,et al. J Neurotrauma 2010; 27: 1951-‐8 6. Elwell C, Cooper C. Phil Trans R Soc 2011;369:4358-‐79 7. Banaji M,et al. PLoS Comput Biol 2008; 4: e1000212
49

Fig 1. Regions of significant activation (t<-4 or t>4) identified
with GLM analysis. Black circles indicate three clusters of
measurements for classification.
Assessments of memory impairments associated with posttraumatic stress disorder (PTSD)
by near infrared spectroscopy
Fenghua Tian1, Alexa Smith-Osborne
2, Amarnath Yennu
1, Rohit Rawat
3, Michael T. Manry
3, Hanli Liu
1
1 Department of Bioengineering;
2 School of Social Work;
3 Department of Electrical Engineering
University of Texas at Arlington, Arlington, TX, USA
Email: [email protected]
Introduction: Post-traumatic stress disorder (PTSD) is a common neuropsychiatric disorder that can be
formed after exposure to any traumatic event that results in psychological trauma. Combat-related PTSD
affects up to 20 percent of service members in the global war on terror and is often persistent in their
return to civilian life. Numerous studies have reported the presence of cognitive dysfunction, particularly
the memory impairments, associated with PTSD. In this study, we have used functional near infrared
spectroscopy (fNIRS) to assess the PTSD-associated, memory-related dysfunction at the frontal cortex.
Twelve student veterans with PTSD were recruited from UT Arlington campus. Their brain activations in
response to a digit span task were measured by fNIRS and compared with those from fifteen healthy
controls. At last, a neural network classifier in combination with feature selection, using piecewise linear
orthonormal floating search, is utilized and examined for diagnostic assessments of PTSD.
Methods: The digit span task assesses the memory-related functions and consists of encoding,
maintaining and recall processes. A sparse optode array, which consisted of 12 sources and 16 detectors,
was used to acquire the fNIRS data at 10.8 Hz. Tomographic images were generated by our newly-
developed depth-compensated tomography (DC-Tomo) method. Based on the tomographic image, GLM
analysis was conducted to identify the regions of significant activation (t<-4 or t>4) at each processing
stage (i.e., encoding, maintaining and recall). For classification, fNIRS readings from both control and
PTSD groups were analyzed after grouping multiple channels into clusters, some of which were identified
for their significant differences in oxygenated
hemoglobin concentrations (HbO2) between
the two groups. Then, the corresponding
HbO2 values in those cluster regions were
used to train a neural network classifier,
along with 9-fold cross validation after
feature selection was performed.
Results: Significant difference in behavioral
scores (i.e., response time and error rate)
were identified between healthy controls and
veterans with PTSD. A strong correlation
between response time and error rate was
also observed. The regions of significant
activation (t<-4 or t>4) identified through
GLM analysis are shown in Fig. 1. While healthy controls show representative activation on the
dorsolateral frontal cortices, veterans with PTSD show reduced activation at the same location. Veterans
with PTSD also show significant deactivation at the left frontopolar region. For classification, HbO
features (0-30 s of the epoch) were selected from three clusters of measurements, as indicated in Fig. 1.
Parameters that summarize the classification ability after feature selection are shown in Table 1, reporting
excellent sensitivity, specificity, and accuracy in classifying PTSD subjects.
Table 1. Classification statistics obtained using MLR along with 9-fold cross validation.
Sensitivity (%) Specificity (%) Accuracy (%) AUC
94 ± 11 82 ± 23 88 ± 14 84 ± 21
50

SIMULTANEOUS EEG AND FNIRS ASSESSMENT OF LANGUAGE PROCESSING: A TOOL TO
INVESTIGATE CHANGES IN APHASIA DURING (SUB)ACUTE STROKE?
Sonja Rossi1,2
, Juliane Burmester1,2,3
, Dorothee Saur4, Hellmuth Obrig
1,2
1 University of Leipzig, Medical Faculty, Clinic for Cognitive Neurology, Leipzig, Germany
2 Max Planck Institute for Human Cognitive and Brain Sciences, Leipzig, Germany
3 University of Potsdam, Department of Linguistics, Potsdam, Germany
4 University of Leipzig, Medical Faculty, Department of Neurology, Leipzig, Germany
correspondence: [email protected]
Background: Aphasia may be considered the most prominent neuropsychological sequel of ischemic
stroke. During the acute and subacute phase of the disease the aphasic symptoms are highly dynamic.
This high degree of clinical dynamics and variability in patients has been explored with regard to the
neuronal correlates and predictors of such plasticity (Saur et al., 2010, Saur et al., 2006). Based on
BOLD-contrast fMRI measurements a dynamic transitory shift in auxiliary right hemisphere
recruitment has been suggested. Due to constraints of MRI-instrumentation such investigations are
limited with regard to repetitive assessment and may not be feasible in larger clinical populations.
Therefore we here explore the option to use two bed-side methods, namely EEG and fNIRS, to assess
language processing in an undemanding design, compatible with bed-side assessment also on stroke
units (Obrig and Steinbrink, 2011). Methods and Results: Semantically correct (/The pilot flies the
plane/) and incorrect (/The pilot eats the plane/) sentences, either as forward or backward (/enalp eht
stae tolip ehT/) speech were auditorily presented to 20 right-handed healthy young subjects (material
from (Saur et al., 2006). Electroencephalography (EEG) and functional near-infrared spectroscopy
(fNIRS) were simultaneously acquired over frontal, temporal and parietal regions bilaterally. Results
showed a larger N400 followed by a larger P600 for semantically incorrect in contrast to correct
forward sentences. This confirms the robustness of the paradigm with regard to the well-established
N400-effect for semantic integration at the sentence level. The fNIRS results showed converging
evidence for a stronger activation for semantically incorrect compared to correct sentences.
Additionally, when comparing forward to backward speech fNIRS disclosed a left-lateralized response
over frontal regions for the forward condition. This suggests recruitment of a language-relevant
network in response to linguistically relevant stimuli. Conclusions and Perspectives: The study in
healthy volunteers shows that two key neurophysiological correlates of language processing are
accessible by simultaneous EEG-fNIRS measurements. Here EEG robustly evidences differences in
lexico-sematic processing demands while NIRS provides evidence for differential lateralization in
response to intelligible vs. unintelligible speech. The undemanding paradigm can be used in patients
suffering from aphasia and the methodological approach allows for bed-side assessment. Ongoing
measurements investigate the response pattern in chronic aphasic patients to eventually perform
longitudinal studies during acute and subacute aphasia.
OBRIG, H. & STEINBRINK, J. 2011. Non-invasive optical imaging of stroke. Philos Transact A Math Phys Eng
Sci, 369, 4470-94.
SAUR, D., LANGE, R., BAUMGAERTNER, A., SCHRAKNEPPER, V., WILLMES, K., RIJNTJES, M. &
WEILLER, C. 2006. Dynamics of language reorganization after stroke. Brain, 129, 1371-84.
SAUR, D., RONNEBERGER, O., KUMMERER, D., MADER, I., WEILLER, C. & KLOPPEL, S. 2010. Early
functional magnetic resonance imaging activations predict language outcome after stroke. Brain, 133,
1252-64.
51

Characterising the response of cytochrome c oxidase to changes in cerebral oxygen supply and
demand in the healthy adult brain
C. Kolyvaa, A. Ghosh
b, I. Tachtsidis
a, D. Highton
b, M. Smith
a,b and C.E. Elwell
a
aDept. of Medical Physics and Bioengineering, University College London, U.K.
bNeurocritical Care Unit, University College Hospitals, London, U.K.
Background Transcranial near-infrared spectroscopy (NIRS) may provide an assessment of cerebral
oxygen metabolism by monitoring changes in the concentration of oxidised cytochrome c oxidase
(Δ[oxCCO]). This measurement is technically complex both in terms of instrumentation and algorithm
development, and despite its potential as a non-invasive bedside marker of oxygen utilisation, there is
still debate about its use outside research settings. A hybrid optical spectrometer (pHOS) and
accompanying algorithm specifically optimised for the measurement of Δ[oxCCO] have recently been
developed by our group. To contribute to the better understanding of this measurement and thus gain
confidence in its regular use as a biomarker of cerebral metabolic status, we aimed to characterise the
changes in Δ[oxCCO] in response to changes in cerebral oxygen supply and demand in healthy adults.
Methods Cerebral oxygen delivery was decreased by reducing arterial oxygen saturation to 80% and
increased by inducing systemic hyperoxia. Both hypoxia and hyperoxia were delivered in 15 healthy
adults by appropriate manipulation of the inspired oxygen fraction. Brain functional activation through
anagram solving was the paradigm used in an additional 11 healthy volunteers for stimulating frontal
lobe functional activation, leading to an increase in cerebral oxygen demand. The pHOS measures
light absorption and scattering at discrete wavelengths, as well as multi-distance broadband light
attenuation, and was used for obtaining frontal lobe NIRS measurements from all subjects during the
protocols. Δ[oxCCO] and concentrations of total haemoglobin (Δ[HbT]) and haemoglobin difference
(Δ[Hbdiff]) were derived with the UCLn algorithm, fitting the wavelength range 780-900 nm.
Simultaneous systemic monitoring data were also available.
Results All reported results (mean ± SD) are in the absence of optical scattering changes and from the
detector furthest from the broadband light source, which is more likely to reflect cerebral events1.
During hypoxia a 0.54 ± 0.46 µmolar decrease in Δ[oxCCO] (P<0.001) was measured in the presence
of an increase in Δ[HbT] and decrease in Δ[Hbdiff] (P<0.001 for both), whereas during hyperoxia a
0.24 ± 0.20 µmolar increase in Δ[oxCCO] (P<0.001) was observed in the presence of the opposite
Δ[HbT] and Δ[Hbdiff] haemodynamic response (P<0.001 for both). Such unambiguity in the group
response of Δ[oxCCO] was not observed during functional activation, despite the fact that the
interrogated datasets demonstrated a uniform haemodynamic response consistent with functional
activation (defined as a statistically significant increase in oxygenated haemoglobin and decrease or no
change in deoxygenated haemoglobin). Closer examination of the individual rather than group data
revealed that the Δ[oxCCO] response measured in the presence of functional activation was
heterogeneous, with the majority of subjects showing statistically significant increase in oxidation, but
others having a statistically significant decrease.
Conclusion The observed Δ[oxCCO] responses to hypoxia and hyperoxia have a rational
physiological explanation, since the induced changes in cerebral oxygen delivery will have a direct
impact on mitochondrial oxygen availability, and are in agreement with what has been reported
previously1,2
. The heterogeneity in the Δ[oxCCO] response to functional activation, although
somewhat surprising, also has physiological rationales, for example, the fact that functional activation
can cause an increase in both oxygen and NADH levels, factors that will affect the cytochrome c
oxidase oxidation state in opposite directions. This heterogeneity is not likely to have been induced by
confounding factors in the measurements, especially as demonstrated by the uniformity and
unambiguity of the response to global changes in cerebral oxygen delivery. These findings suggest
that NIRS-measured Δ[oxCCO] may be a useful marker of cerebral cellular oxygen metabolism.
[1] Tisdall MM, Tachtsidis I, Leung TS et al (2007). J Biomed Opt 12:024002.
[2] Tachtsidis I, Tisdall MM, Leung TS et al (2009). Adv Exp Med Biol 645:315-20.
52

Investigating the origin of hemodynamic fluctuations using high-‐resolution diffuse optical tomography in humans
Christina Habermehl1, Christoph H. Schmitz1,2, Stefan P. Koch1, Jan Mehnert1,3, Jens Steinbrink1,4, 1Charité Dept. of Neurology, Berlin, Germany; 2 NIRx Medizintechnik GmbH, Berlin, Germany; 3Department for Neurology, Max Planck Institute for Human Cognitive and Brain Sciences, Leipzig, Germany; 4Center for Strokeresearch Berlin (CSB),
Charité Universitätsmedizin, Berlin, Germany Presenting author e-mail address: [email protected]
Near infrared spectroscopy and DOT signals are often contaminated with spontaneous low frequency oscillations (LFO) in the 0.1 Hz band and heart beat (HB) signals (1.2Hz). LFO are often described in human brain imaging studies [1] and may represent auto-regulatory processes of cerebral blood flow. Since 2D NIRS cannot separate superficial from deeper layers, we investigate the origin (brain or scalp) of LFO and HB in NIRS signals using 3D DOT. We used a NIRScoutX (NIRx Medizintechnik, Germany) cw tomography imager (32 sources* 32 detectors, 760 nm & 830 nm). We placed two grids of optical fibers bilateral, pericentrally over C3 and C4 (each side: 16s*16d) achieving 2*256 data channels with a 3.41 Hz sampling frequency. Three subjects performed a 10 min resting task. Image reconstruction was performed for both hemispheres independently. We reconstructed time series of relative absorption changes using the normalized difference method [2]. The weight matrix was determined using BrainModeler (NIRx Medical Technology LLC) which provides a library of subvolumes from a MRI-scan based finite element mesh (FE) with precalculated inverse parameters. To investigate LFO and HB, the reconstructed time series were band pass filtered at 0.1Hz /1.2Hz and normalized (z-score). We calculated the power spectral density (PSD) for the reconstructed HbO time courses in every node of the FE mesh. For visualization purpose, the results (power at 0.1 Hz and 1.2Hz) were transformed into volumes and superimposed on a brain structure. We found a high relative fraction of LFO in deeper layers, whereas HB could be seen mainly in superficial layers. We demonstrate that DOT with a 3D image reconstruction allows a depth profiling of hemodynamic rhythms in the adult head. Monitoring these hemodynamic features and detecting changes in the individual patterns could be an additional module to noninvasively detect changes in cerebral blood flow, e.g. in neurointensive care patients. References [1] H. Obrig, M. Neufang, R. Wenzel, M. Kohl, J. Steinbrink, K. Einhaupl, and A. Villringer, "Spontaneous low frequency oscillations of cerebral hemodynamics and metabolism in human adults," NeuroImage 12, 623-639 (2000). [2] Y. Pei, H. Graber, and R. Barbour, "Normalized-constraint algorithm for minimizing inter-parameter crosstalk in DC optical tomography," Optics express 9, 97-109 (2001).
Fig. 1 Result of a PSD of HbO time courses for a) low frequency oscillations and b) heart beat
53

Oral Session Keynote
Sunday, 28th October 2:00pm
54

Interpreting NIRS data: the modelling challenge
Murad Banaji1
1Department of mathematics, University of Portsmouth
As NIRS has progressed as a technology, the robust extraction of scientifically – and evenclinically – relevant information from NIRS signals has become an increasingly challengingtask. Each NIRS signal is the outcome of an interaction between complex underlyingphysiological processes and the physics of a complex measurement process. Simultaneousacquisition of several signals provides hope of more meaningful and accurate information,but also complicates matters: the signals are related to each other in various ways, and thuswhile providing more data, also require simultaneous interpretation. Entering into the mixare the inevitable gaps in our understanding of both physiology and measurement; inter-and intra-individual physiological variation; “noise” from various sources; and (especiallyin the human in vivo context) severe practical and ethical limitations to validation viamore invasive measurement.
In this context, a natural framework for extraction of useful information from NIRS datainvolves the construction of in silico models, of both physiology and measurement. Con-structing and simulating computer models holds out the hope of not only explaining mea-sured data, but going on to make robust predictions of hard-to-measure but importantquantities. Unfortunately, we are led quickly to an apparent vicious circle – where under-standing physiology requires measurement whose interpretation is itself dependent on anunderstanding of the physiology. Some practical and philosophical issues associated withtrying to escape from this vicious circle will be outlined. The conclusion will be that themodelling approach is both necessary and holds considerable potential, provided a set ofpriciples are adhered to during the modelling and data analysis process.
Combining data-driven and physiology-driven approaches; if appropriate combining de-terministic and stochastic approaches; adopting pragmatic, but consistent, approachesto questions of model construction, identification and validation; acknowledging and at-tempting to explain (rather than throwing out) inconsistent or suprising data, whetherexperimental or from simulation: all of these must at least be on the wish-list for themodelling/data-analysis project. Perhaps most important is taking a long-term view wheremodel assumptions are presented transparently, models are seen at the outset as evolvingobjects designed to be shared, and a principled approach is adopted to model evolutionand interaction with data over time.
55

Oral Session Applications: Neonatal and Paediatric
Sunday, 28th October 2:30pm
Chair: Martin Wolf
56

Clinical application of Near infrared Spectroscopy in the Neonate
Frank van Bel and Petra Lemmers, Department of Neonatology, Wilhelmina Children’s Hospital, Utrecht, The Netherlands Near InfraRed Spectroscopy (NIRS) is a non-invasive monitoring technique initially mainly used as
a research technique to monitor changes in neonatal cerebral hemodynamics and oxygenation and is
based on absorption of near infrared light by chromophores which are present in hemoglobin in the
brain. Absorption changes can be converted by the NIRS apparatus in concentration changes of HbO2
and HbR in the neonatal brain. It are mainly the acute changes of HbO2 and HbR which can be
detected nicely and that made this method applicable as a research tool.
However, for monitoring cerebral oxygenation and extraction over longer episodes in clinical
practice on the Neonatal Intensive Care Unit (NICU) the assessment of changes in HbO2 and HbR are
not usable because these relative variables are prone to movement artefacts.
What really is needed is the possibility to monitor the integrity of neonatal brain function, providing
us with parameters with absolute values which can be compared over extended periods of time and
indicating the balance between O2-delivery and O2-consumption of the neonatal brain. Promising
variables in this respect are regional (mixed: arterial, capillary and venous) cerebral O2-saturation
(rScO2), measuring (changes in) cerebral O2-supply and secondly the rSO2-derived cerebral fractional
tissue O2-extraction or cFTOE, which correlates with actual cerebral O2-extraction. They provide us
with absolute values which are stable and reproducible. Normal values in the neonatal period for
cerebral oxygenation are supposed to be between 55 and 75%. The main clinical applications of NIRS,
using rScO2 and cFTOE, in Neonatology are to monitor the balance between oxygen supply and
oxygen extraction in the preterm baby in various pathological conditions such as severe respiratory
distress syndrome, a hemodynamically significant patent ductus arteriosus and if related to
simultaneous arterial pressure monitoring, NIRS-monitored rScO2 can be used to assess whether of
not cerebral vascular autoregulation is in tact. Also its use to predict secondary energy failure of the
neuronal cells after severe birth asphyxia in term babies can be used as an additional prognostic tool to
assess long-term neurodevelopmental outcome.
As stated by Greisen cs (Semin Fetal Neonat Med 2006), it is however important to realize that
different types of NIRS devices and optodes are used with different algorithms to separate the signals
of oxyhemoglobin and deoxyhemoglobin. Differences in results may therefore merely caused by
differences in NIRS methodology and not based on (patho)physiologic changes in actual neonatal
cerebral oxygenation and oxygen extraction.
57

A Study of Preschool Irritability: NIRS Brain Imaging of correlates of clinical irritability Susan B. Perlman1, Theodore Huppert2,3
1. University of Pittsburgh, Psychiatry, Pittsburgh, PA, United States 2. University of Pittsburgh, Radiology, Pittsburgh, PA, United States 3. University of Pittsburgh, Bioengineering, Pittsburgh, PA, United States
Introduction: NIRS is a portable brain imaging technology that is well suited for studies involving child or infant populations. In this study, NIRS was used during a frustration task to look at the relationship of clinical child frustration metrics and brain activity.
Methods: A total of 21 typically developing children (mean age: 4 years 4 months, range 36-70 months) participated in our tasks during fNIRS data collection. Children ranged in parent reported irritable temperament on the Child Behavior Questionnaire (CBQ- anger/frustration subscale) from 1.5-6.3 on a 1-7 scale (mean 4.78). A TechEn Cw6 NIRS system with a bilateral NIRS probe (4source /8 detectors per side) covering frontal, prefrontal, and DLPFC cortices was used. NIRS scanning was done a dedicated child imaging lab with child and parent present. The Frustrative Emotion Task for Children (FETCH) and a second Go/No-Go task was used in this study. NIRS data was collected and analyzed using custom analysis software developed by the Huppert lab. Analysis included the use of a general linear model and image reconstruction methods utilizing a structural MRI from one of the age-matched participants of the previous fMRI study for display and interpretation purposed.
Results: The FETCH Task: Preliminary results (Fig 2) indicate increased activity in the bilateral dorsomedial prefrontal cortex during Winning blocks (compared to Frustration blocks), while activation in the bilateral dorsolateral prefrontal cortex was greater for Frustration blocks (compared to Winning Blocks) [t(16) = ± 11.76, p < .05, corrected]. Similar results were found in the PI’s previous fMRI studies (Perlman and Pelphrey 2010; Perlman and Pelphrey 2011). Irritability score was positively correlated with the increase in deoxygenated hemoglobin during Frustration blocks [r(15) = .48, p = .05, two tailed]. These data suggest that children high in irritability may have experienced increased frustration, compared to their low irritability counterparts, requiring increased activation of the DLPFC to regulate emotion for task completion.
The Rain or Shine Go/No-Go Task: Preliminary results (Fig 3) indicate decreased activity in the right dorsolateral prefrontal cortex during Inhibitory Control blocks (compared to Motor Control blocks). This effect was right lateralized, with the opposite effect present in the left hemisphere. Conclusions: Results point to evidence for dissociable areas of the prefrontal cortex related to frustration and inhibitory control in preschool children. Future studies are planned to address the nature of neural dysfunction of these areas in child clinical populations.
Fig 1: A child plays FETCH on a touch screen computer while his cortical brain activity is monitored via fNIRS
Fig 2: (Left Panel) Increased activity during Frustration in the left DLPFC. (Right Panel) Levels of irritability correlated with increase in deoxygenated hemoglobin in the left DLPFC.
Fig 3: Increased DMPFC activity during inhibitory control.
58
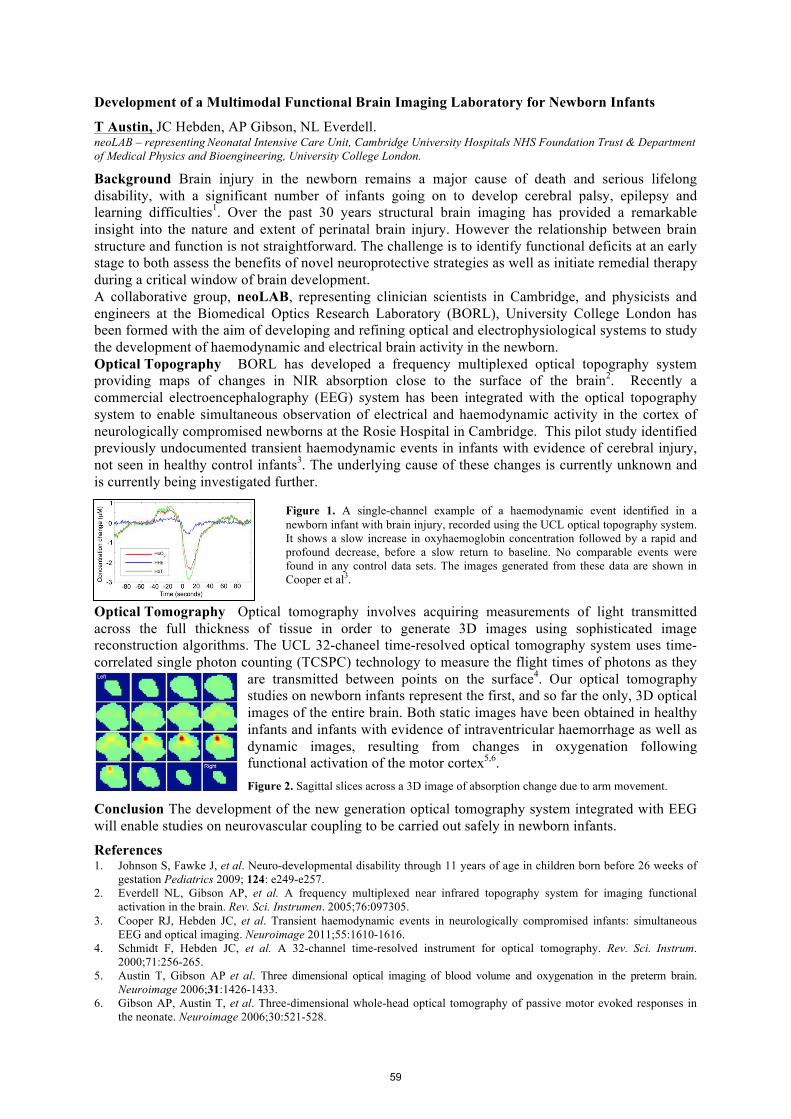
Development of a Multimodal Functional Brain Imaging Laboratory for Newborn Infants
T Austin, JC Hebden, AP Gibson, NL Everdell. neoLAB – representing Neonatal Intensive Care Unit, Cambridge University Hospitals NHS Foundation Trust & Department of Medical Physics and Bioengineering, University College London.
Background Brain injury in the newborn remains a major cause of death and serious lifelong disability, with a significant number of infants going on to develop cerebral palsy, epilepsy and learning difficulties1. Over the past 30 years structural brain imaging has provided a remarkable insight into the nature and extent of perinatal brain injury. However the relationship between brain structure and function is not straightforward. The challenge is to identify functional deficits at an early stage to both assess the benefits of novel neuroprotective strategies as well as initiate remedial therapy during a critical window of brain development. A collaborative group, neoLAB, representing clinician scientists in Cambridge, and physicists and engineers at the Biomedical Optics Research Laboratory (BORL), University College London has been formed with the aim of developing and refining optical and electrophysiological systems to study the development of haemodynamic and electrical brain activity in the newborn. Optical Topography BORL has developed a frequency multiplexed optical topography system providing maps of changes in NIR absorption close to the surface of the brain2. Recently a commercial electroencephalography (EEG) system has been integrated with the optical topography system to enable simultaneous observation of electrical and haemodynamic activity in the cortex of neurologically compromised newborns at the Rosie Hospital in Cambridge. This pilot study identified previously undocumented transient haemodynamic events in infants with evidence of cerebral injury, not seen in healthy control infants3. The underlying cause of these changes is currently unknown and is currently being investigated further.
Figure 1. A single-channel example of a haemodynamic event identified in a newborn infant with brain injury, recorded using the UCL optical topography system. It shows a slow increase in oxyhaemoglobin concentration followed by a rapid and profound decrease, before a slow return to baseline. No comparable events were found in any control data sets. The images generated from these data are shown in Cooper et al3.
Optical Tomography Optical tomography involves acquiring measurements of light transmitted across the full thickness of tissue in order to generate 3D images using sophisticated image reconstruction algorithms. The UCL 32-chaneel time-resolved optical tomography system uses time-correlated single photon counting (TCSPC) technology to measure the flight times of photons as they
are transmitted between points on the surface4. Our optical tomography studies on newborn infants represent the first, and so far the only, 3D optical images of the entire brain. Both static images have been obtained in healthy infants and infants with evidence of intraventricular haemorrhage as well as dynamic images, resulting from changes in oxygenation following functional activation of the motor cortex5,6.
Figure 2. Sagittal slices across a 3D image of absorption change due to arm movement.
Conclusion The development of the new generation optical tomography system integrated with EEG will enable studies on neurovascular coupling to be carried out safely in newborn infants.
References 1. Johnson S, Fawke J, et al. Neuro-developmental disability through 11 years of age in children born before 26 weeks of
gestation Pediatrics 2009; 124: e249-e257. 2. Everdell NL, Gibson AP, et al. A frequency multiplexed near infrared topography system for imaging functional
activation in the brain. Rev. Sci. Instrumen. 2005;76:097305. 3. Cooper RJ, Hebden JC, et al. Transient haemodynamic events in neurologically compromised infants: simultaneous
EEG and optical imaging. Neuroimage 2011;55:1610-1616. 4. Schmidt F, Hebden JC, et al. A 32-channel time-resolved instrument for optical tomography. Rev. Sci. Instrum.
2000;71:256-265. 5. Austin T, Gibson AP et al. Three dimensional optical imaging of blood volume and oxygenation in the preterm brain.
Neuroimage 2006;31:1426-1433. 6. Gibson AP, Austin T, et al. Three-dimensional whole-head optical tomography of passive motor evoked responses in
the neonate. Neuroimage 2006;30:521-528.
59

Poster Session Hardware Developments
Poster #: 1-‐17
60

A non-contact fNIRS scanner: First in-vivo tests M. Mazurenka1, L. Di Sieno2, G. Boso3, D. Contini2, A. Pifferi2,
A. Dalla Mora2, A. Tosi3, H. Wabnitz1, R. Macdonald1 1 Physikalisch-Technische Bundesanstalt, Abbestr. 2-12, 10587 Berlin, Germany 2 Dipartimento di Fisica, Politecnico di Milano, Piazza Leonardo da Vinci 32, Milano I-20133, Italy 3 Dipartimento di Elettronica e Informazione, Politecnico di Milano, Piazza Leonardo da Vinci 32,
Milano I-20133, Italy [email protected]
Introduction: Non-contact scanning could overcome some limitations of standard fNIRS equipment, in particular (i) poor lateral spatial resolution due to a source-detector separation between 2 cm and 4 cm, (ii) sensor-tissue contact problems. The major obstacle for a scanning approach with zero or small separation between source and detection spot is the huge amount of early photons that are diffusely reflected near the surface and do not carry information about changes in the brain. Recent development of a new measurement method, the Null Source-Detector Separation (NSDS) approach [1, 2], based on fast-gated Single-Photon Avalanche Diodes (SPAD) [3], makes non-contact scanning feasible. The sensitive region for NSDS is much more confined than with separation >2 cm. After proof-of-concept tests on phantoms [4], we here report on first successful in-vivo tests.
Methods: A supercontinuum laser with acousto-optical tunable filter provided ps pulses. A state-of-the-art SPAD was fast gated by a dedicated ultrafast pulser and a delay unit to cut off early arriving photons. Polarization-dependent detection in the optical path suppressed specular reflections. An area of 4x4 cm2 was scanned with 32x32 pixels at 4 mm source-detector separation. Wavelength was switched line by line between 760 nm and 860 nm. The detected photons were processed by time-correlated single photon counting. Data were analyzed to obtain 8x8 pixel images of the time course of changes in oxy- and deoxyhaemoglobin concentrations.
Results: Initial tests with venous and arterial inclusion on the arm as well as Valsalva on the forehead of healthy subjects were performed successfully. The results showed the expected behaviour. For a cognitive task (simple math), an activation was observed over the whole area on the left frontal lobe. Motor activation by finger tapping in a bald subject showed a rather localized response near C3, with good signal-to-noise ratio.
Conclusions: The feasibility of in-vivo non-contact scanning of brain activation was demonstrated. The non-contact scanning approach provides a dense, flexible grid of measurement
positions which allows one to localise brain activation with superior lateral resolution. The method is limited to application in hairless areas. References: 1. A. Pifferi, A. Torricelli, L. Spinelli, D. Contini, R. Cubeddu, F. Martelli, G. Zaccanti, A. Tosi, A. Dalla
Mora, F. Zappa, and S. Cova, "Time-resolved diffuse reflectance using small source-detector separation and fast single-photon gating," Phys. Rev. Lett 100, 138101 (2008).
2. A. Torricelli, A. Pifferi, L. Spinelli, R. Cubeddu, F. Martelli, S. Del Bianco, and G. Zaccanti, "Time-resolved reflectance at null source-detector separation: improving contrast and resolution in diffuse optical imaging," Phys. Rev. Lett 95, 078101 (2005).
3. A. Tosi, A. Dalla Mora, F. Zappa, A. Gulinatti, D. Contini, A. Pifferi, L. Spinelli, A. Torricelli, and R. Cubeddu, "Fast-gated single-photon counting technique widens dynamic range and speeds up acquisition time in time-resolved measurements," Opt. Express 19, 10735-10746 (2011).
4. M. Mazurenka, A. Jelzow, H. Wabnitz, D. Contini, L. Spinelli, A. Pifferi, R. Cubeddu, A. Dalla Mora, A. Tosi, F. Zappa, and R. Macdonald, "Non-contact time-resolved diffuse reflectance imaging at null source-detector separation," Opt. Express 20, 283-290 (2012).
Fig. 1: Optical arrangement
1
61
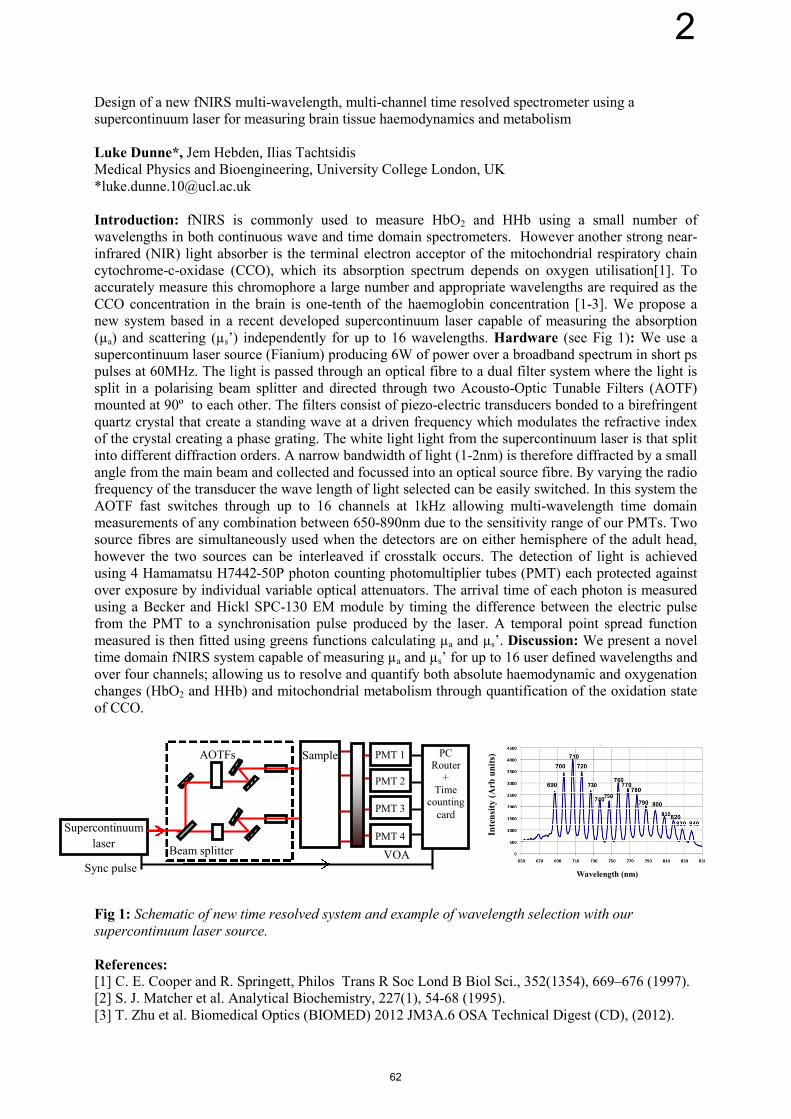
Design of a new fNIRS multi-wavelength, multi-channel time resolved spectrometer using asupercontinuum laser for measuring brain tissue haemodynamics and metabolism
Luke Dunne*, Jem Hebden, Ilias TachtsidisMedical Physics and Bioengineering, University College London, UK*[email protected]
Introduction: fNIRS is commonly used to measure HbO2 and HHb using a small number ofwavelengths in both continuous wave and time domain spectrometers. However another strong near-infrared (NIR) light absorber is the terminal electron acceptor of the mitochondrial respiratory chaincytochrome-c-oxidase (CCO), which its absorption spectrum depends on oxygen utilisation[1]. Toaccurately measure this chromophore a large number and appropriate wavelengths are required as theCCO concentration in the brain is one-tenth of the haemoglobin concentration [1-3]. We propose anew system based in a recent developed supercontinuum laser capable of measuring the absorption(µa) and scattering (µs’) independently for up to 16 wavelengths. Hardware (see Fig 1): We use asupercontinuum laser source (Fianium) producing 6W of power over a broadband spectrum in short pspulses at 60MHz. The light is passed through an optical fibre to a dual filter system where the light issplit in a polarising beam splitter and directed through two Acousto-Optic Tunable Filters (AOTF)mounted at 90º to each other. The filters consist of piezo-electric transducers bonded to a birefringentquartz crystal that create a standing wave at a driven frequency which modulates the refractive indexof the crystal creating a phase grating. The white light light from the supercontinuum laser is that splitinto different diffraction orders. A narrow bandwidth of light (1-2nm) is therefore diffracted by a smallangle from the main beam and collected and focussed into an optical source fibre. By varying the radiofrequency of the transducer the wave length of light selected can be easily switched. In this system theAOTF fast switches through up to 16 channels at 1kHz allowing multi-wavelength time domainmeasurements of any combination between 650-890nm due to the sensitivity range of our PMTs. Twosource fibres are simultaneously used when the detectors are on either hemisphere of the adult head,however the two sources can be interleaved if crosstalk occurs. The detection of light is achievedusing 4 Hamamatsu H7442-50P photon counting photomultiplier tubes (PMT) each protected againstover exposure by individual variable optical attenuators. The arrival time of each photon is measuredusing a Becker and Hickl SPC-130 EM module by timing the difference between the electric pulsefrom the PMT to a synchronisation pulse produced by the laser. A temporal point spread functionmeasured is then fitted using greens functions calculating µa and µs’. Discussion: We present a noveltime domain fNIRS system capable of measuring µa and µs’ for up to 16 user defined wavelengths andover four channels; allowing us to resolve and quantify both absolute haemodynamic and oxygenationchanges (HbO2 and HHb) and mitochondrial metabolism through quantification of the oxidation stateof CCO.
Fig 1: Schematic of new time resolved system and example of wavelength selection with oursupercontinuum laser source.
References:[1] C. E. Cooper and R. Springett, Philos Trans R Soc Lond B Biol Sci., 352(1354), 669–676 (1997).[2] S. J. Matcher et al. Analytical Biochemistry, 227(1), 54-68 (1995).[3] T. Zhu et al. Biomedical Optics (BIOMED) 2012 JM3A.6 OSA Technical Digest (CD), (2012).
Supercontinuum
laser
AOTFs
Beam splitter
Sample PMT 1
PMT 2
PMT 3
PMT 4
PCRouter
+Time
countingcard
Sync pulseVOA
Wavelength (nm)
Inte
nsi
ty(A
rbu
nit
s)
2
62

Multiple short separation measurements for removal of systemic oscillation in NIRS data
Louis Gagnon1,2, Robert J. Cooper1, Meryem A. Yücel1 and David A. Boas1,2
1-Athinoula A. Martinos Center for Biomedical Imaging, Department of Radiology, Massachusetts General Hospital, Harvard Medical School, Charlestown, MA, USA
2-Harvard-MIT Division of Health Sciences and Technology, Cambridge, MA, USA
email: [email protected]
Near-Infrared Spectroscopy (NIRS) is a non-invasive technique to measure the hemodynamic changes associated with evoked brain activity. The NIRS signal is contaminated by systemic physiology occurring both in the brain and in the superficial layers of the head. The back-reflexion geometry of the NIRS measurement makes the signal strongly contaminated by systemic physiology of superficial layers origins.
A recent technique to remove this interference has been the use of short optode separation recordings (SOSR) which are sensitive to superficial layers only, including the scalp and the skull. These SOSRs are used as regressors during the post-processing of the NIRS signal and improves the detection of evoked brain activity using NIRS. In our previous paper, we have shown that the systemic interference measured in NIRS is inhomogeneous across the surface of the scalp. Therefore, the SOSR must be located close to the standard 3 cm NIRS channel from which the brain activity is to be detected.
Since the standard 3 cm NIRS measurements integrate the signal through the entire path of the light in the tissue, it is possible that the signal contains interference from two different locations. Therefore, it was reasonable to investigate the effect of using multiple SOSRs, one located close to the source optode and one close to the detector optode, to maximize the performance of SOSR to remove systemic interference in the 3 cm channel.
In this regards, we designed a NIRS probe containing a SOSR located close to each source and each detector optode. Our simulations performed over real NIRS baseline data showed that the multi-SOSR approach results in more accurate recoveries of the evoked hemodynamic response (in terms of MSE) and lower noise in the recovered response. Functional NIRS was also recorded during a 5-sec finger tapping task. Multiple SOSR resulted in a more spatially localized hemodynamic response, lower noise in the baseline signal between individual trials as well as lower inter-trial variability.
Op.cal'probe'
Source'Small'fiber'detector'
Source'
ND'2'filter'
Detector'
1'cm' 1'cm' 1'cm'
2'cm'
3'cm'Source''
Detector''
New'probe'
Small'fiber'detector''Source'+'ND'2'filter''
(A)$
(B)$
1'cm'
3
63

A wireless, self-calibrating sensor for fNIRS studies in preterm infants. Pastewski M.1,2, Kleiser S.1,2, Metz A.1,2, Wolf M.1 1 Biomedical Optics Research Lab (BORL), Division of Neonatology, University Hospital Zurich, Switzerland 2 Institute for Biomedical Engineering, ETHZ, Zurich, Switzerland Corresponding author: M. Pastewski [email protected] Introduction: It is a common practice at Neonatal Intensive Care Units (NICUs) that both nurses and parents, if health permits, take the preterm infants out of the incubator to hug, stroke and show them fondness and care. It is assumed that the close contact with the infants increases their well-being and helps the infant overcoming health problems. But it is not known how the emotional reaction on the infant is generated. The long term aim is to investigate this by determining the concentration of oxy- and deoxyhaemoglobin ([O2Hb], [HHb]) in the brain as an indication of neuronal activation in response to handling. For this type of study it is important that the fNIRS system does not cause any discomfort, e.g. physical discomfort by cables or psychologica discomfort by a large obtrusive size (Wolf et al., 2007). The short term aim therefore was to design and build such an fNIRS instrument. Methods: The fNIRS system should feature a high time and spatial resolution and a low noise level to be able to detect small signals changes. To maximize the comfort of patients and parents, the device should be small, portable and wireless. Such an instrument called OxyPrem was designed and developed specifically for preterm and term neonates. Results: OxyPrem incorporates a self-calibrating sensor geometry, which is not sensitive to the coupling errors and thus is expected to provide a substantially higher precision. It is miniaturized and wireless fNIRS device and thus enables a higher comfort and an enhanced applicability. The OxyPrem consists of four LED emitters each of three wavelengths (760, 805 and 870 mm) and two photodetectors. A total of 24 channels (from each emitter there are two paths to the detector: a short and a long one). The time resolution is 35Hz. The instrument has been tested successfully in phantoms and adults. Conclusion: A wireless, miniaturized fNIRS instrument specifically designed for preterm infants was successfully developed. We plan to employ it to assess well-being of preterm infants.
4
64

Development of new fNIRS-EEG system for seamless whole brain studyYui Yamaguchi1, Akihiro Ishikawa2, Yoshinori Masuda2, Shumpei Yamaguchi2, Haruhide Udagwa2, Takashi Amita2, Yoshihiro Inoue2
1 Collaboration Promotion department, Analytical Systems Division, Shimadzu Corporation, Tokyo, Japan2 R&D department, Medical Systems Division, Shimadzu Corporation, Kyoto 604-8511, Japan
(E-mail: [email protected])1. Introduction
Functional near-infrared spectroscopy (fNIRS) is a versatile functional neuroimaging technology with non-invasive method of monitoring of brain activity. Recently, there is one of the hot topics to explore the wide area network in the brain such as functional connectivity or spontaneous brain activity functions. fNIRS has high potentials for such research topics according to the high temporal/spatial resolution compare to fMRI or EEG. On the other hand, some researches has been pointed out the importance of improvement of reliability of fNIRS signals such as to reduce the effects of skin blood flow[1] or improve the spatial resolution[2]. In order to achieve the research requirement we developed a new fNIRS-EEG system which allows seamless whole-brain measurement of the surface of the human brain, high spatial resolution measurement, multi-distance measurement, and high temporal resolution measurement. We evaluated the performances of the new system by a phantom and a healthy subject.2. System Description2-1. Overall System Parameters: Figure1 shows the new fNIRS system named “LABNIRS” which developed with CW system using laser diodes as light
sources and photomultiplier tubes (PMT) as detectors. LABNIRS has maximum 40 sources and 40 detectors which covers a whole brain (the maximum logical channels is 142). The data analysis relies on the Modified Beer-Lambert Law (MBLL) assuming spatially homogeneous absorption changes in extra cerebral tissues. To improve accuracy, we use three- wavelength (780, 805 and 830nm)
and bundled optical fibers for source. We controlled the irradiation with 1ms interval for each wavelength, and the maximum sampling rate is 250 Hz. 2-2. Optode Holder: We implemented double density fNIRS (and EEG) holder from flexible adjustable surface holder (FLASH)[3] (Figure2). The double density[2] needs twice arrangement of the conventional method, the other arrangement is shifted at half of the optode distance from the origin. In grillage construction, electrode holders were put in the midpoint of slides of FLASH to row direction and fNIRS optodes were put in the midpoint of slides of FLASH to column direction. The holder can be also use for multi-distance measurement according to the PMT and flexible fiber settings.3. Experiment and Results
In the experiment, we measured the fNIRS signals during a finger tapping task. We used 128 channels of fNIRS covering the whole brain with the double density method. The subject performed 5 trials which consists 20s rest, 20s task and 20s rest for one trial. Figure3 shows the topographical image of the average of the oxy-Hb change at 20s after starting of the right-finger-tapping task. The results indicated the task-related activity in oxy-Hb. Using the double density method, spatial resolution of image was improved than conventional method to focus the activation area.4. Conclusion
In this study, we developed a new fNIRS-EEG system as a non-invasive brain functional measurement system whole surface of human brain. The new fNIRS allows high performance measurement with high spatial / temporal resolution using seamless measurement techniques, double density techniques, multi-distance measurement techniques and high sampling rate system. The functional data which has highly-spatial resolution and wide field of view would contribute to improve the accuracy of the brain signals, and high temporal resolution supports functional connectivity or spontaneous brain activity function research.5. References[1] Takahashi et al. (2011) Influence of skin blood flow on near-infrared spectroscopy signals measured on theforehead during a verbal fluency task. NeuroImage, 57, 991–1002[2] Kawaguchi et al. (2007) Effect of probe arrangement on reproducibility of images by near-infrared topography evaluated by a virtual head phantom. Appl. Opt. 46, 1658-1668[3] Kohno et al. (2006) Functional near-infrared imaging of whole head with FLASH. OHBM
Figure3
Figure2
Figure1
5
65

DOCNEURO: Towards pre-commercial, clinical prototype development ofhybrid diffuse correlation spectroscopy (DCS) and frequency domain diffuse
optical spectroscopy (DOS) for bed-side neuromonitoring.
Udo Weigel, Francisco Remiro, Ruben Benet, Turgut DurduranICFO- Institut de Ciències Fotòniques, Mediterranean Technology Park,
08860 Castelldefels (Barcelona), SpainTel: +34 935542219, Fax: +34 935534000, E-mail: [email protected]
Abstract: The application of diffuse correlation spectroscopy (DCS) in non-invasivemeasurements of microvascular cerebral blood flow is a promising candidate for combi-nation with NIRS for bedside, non-invasive, continuous neuromonitoring. Since presentdevices are designed for scientific use, they pose a barrier against effective translationinto clinical use. Here we present our project (DOCNEURO) on the development ofa professional system designed according to the medical device norms and usabilitystandards.OCIS codes: 170.1610 Clinical applications;170.5280 Photon migration
Diffuse correlation spectroscopy has been used in non-invasive measurement of cerebral blood flow(CBF) in human brain, in human muscles and during cancer therapy monitoring [1, 2]. By com-bining DCS with simultaneous diffuse optical spectroscopy (DOS), cerebral blood flow (CBF),oxy-hemoglobin (HbO2) and deoxy-hemoglobin (Hb) concentrations and total hemoglobin concen-tration (THC) are accessed which enables to measure changes in cerebral metabolic rate of oxygen(CMRO2). In order to offer these parameters in a user friendly way, special attention was paid tothe graphics interface and data representation features as well as a design concept in accordanceto hospital standards (see figure).
The current version (DOCNEURO V0.5) implements the DCS con-cept and the main software back-bone. The final system will in-clude a frequency domain DOS system [3]. Furthermore, the de-vice/software can readily be interfaced with other commercial andresearch DOS systems. We will present the current status of thesystem with examples and our vision for the future.The project is funded by Fundació Cellex Barcelona, InstitucióCerca Catalunya, European Union Regional Development Fund(FEDER), Generalitat de Catalunya and Instituto de Salud CarlosIII.
References1. T Durduran, R Choe, W Baker, and A G Yodh. Diffuse optics for tissue monitoring and tomography.
Reports on Progress in Physics, 73(7):076701–076744, 2010.2. R C Mesquita, T Durduran, G Yu, E M Buckley, M N Kim,C Zhou, R Choe, U Sunar, and A G Yodh A.
Direct measurement of tissue blood flow and metabolism with diffuse optics. Philosophical Transactions of theRoyal Society A: Mathematical, Physical and Engineering Sciences, 369(1955):4390-4406, 2011
3. U M Weigel, R Revilla, N H Oliverio, A A Gonzalez, J C Cifuentes, P Zirak, R Saiz, D Mitrani, J Ninou,O Casellas, and T Durduran. A New, Modular Frequency Domain Diffuse Optical Monitor in the DigitalDomain. Biomedical Optics and 3D Imaging, OSA, 2012.
6
66
A Wearable Multi-channel NIRS Imaging System for Brain Imaging in Freely Moving Subjects
S. Piper1*, A. Krüger1, Stefan P. Koch1, J. Mehnert1, C. Habermehl1, J. Steinbrink1, H. Obrig2,3,
and C. H. Schmitz1,4
1Charité, Department of Neurology, Charitéplatz 1, 10117 Berlin, Germany 2Max Planck Institute for Human Cognitive and Brain Sciences, Stephanstr. 1a, 04103 Leipzig, Germany
3Clinic for Cognitive Neurology, University Hospital Leipzig, Liebigstr. 16, 04103 Leipzig, Germany 4NIRx Medizintechnik GmbH, Baumbachstr. 17, 13189 Berlin, Germany, [email protected]
*presenting author: [email protected]
Although (f)NIRS has often been cited as portable and suitable for unconstrained experimental settings, probably most of the NIRS setups employed in neuroscientific research still offer a restrained setting. Typically, the subject is tethered by not very flexible or lightweight fiberoptic cables to a more or less stationary instrument1.While restrained settings with a portable but stationary instrument might be well feasible for bedside monitoring, they hamper imaging in a more natural environment, e.g. during sports or physical therapy, or when imaging children. Developments towards miniaturized probe arrays or instruments have been reported before, however, usually at the cost of limited measurement channels or restricted specific portions of the head2-4. We here present a new, miniaturized, portable diffuse optical NIR tomography system that allows brain imaging in freely moving subjects. The performance of the instrument is demonstrated on N=7 subjects in a hand gripping motor paradigm on a bicycle performed during three conditions: (i) outdoor bicycle riding, (ii) indoor stationary paddling and (iii) rest.
NIRS imager and controlling notebook computer were contained in a backpack worn by the subjects. Eight sources and eight detectors were arranged in two groups around positions C3 and C4 of the extended international EEG 10-20 system to ensure coverage of the primary motor areas of both hemispheres. The paradigm during biking consisted of 10 repetitions of 20 s of self-paced (approx. 1 Hz) left-hand clamping followed by 40 s of rest.
Results show a significant relative HbR decrease over the contra lateral sensory motor cortex in each condition revealing a clear focal activation to left hand clenching. The observed time courses show the prototypical increase in HbO and decrease in HbR in response to neural activation. The HbR decrease is largest in the outdoor cycling condition and lowest at rest
To the best of our knowledge, this is the first outdoor demonstration of NIRS brain imaging on freely moving subjects. A truly portable and miniaturized NIRS technique opens new perspectives to study sensory or cognitive paradigms in realistic environments and furthermore promise clinical uses as a monitoring tool in neuro-rehabilitation and intensive care units.
Acknowledgements
Part of the work was funded by the Berlin BernsteinFocus: Neuro Technology program of the German Federal Ministry for Education and Research (BMBF).
References 1. M. H. Shalinsky, I. Kovelman, M. S. Berens, and L. A. Petitto, "Exploring Cognitive Functions in Babies,
Children & Adults with Near Infrared Spectroscopy," J Vis Exp (29)(2009). 2. H. Atsumori, M. Kiguchi, A. Obata, H. Sato, T. Katura, T. Funane, and A. Maki, "Development of
wearable optical topography system for mapping the prefrontal cortex activation," Rev Sci Instrum 80(4), 043704 (2009).
3. T. Muehlemann, D. Haensse, and M. Wolf, "Wireless miniaturized in-vivo near infrared imaging," Opt Express 16(14), 10323-10330 (2008).
4. K. Sagara, K. Kido, and K. Ozawa, "Portable single-channel NIRS-based BMI system for motor disabilities' communication tools," Conf Proc IEEE Eng Med Biol Soc 2009, 602-605 (2009).
7
67

Silicon Photomultipliers bear Potential for fNIRS Instrumentation
F. Braun,†,1 T. Achtnich,†,1 R. Zimmermann*,2,3 and M. Wolf 3
†shared first authorship; *[email protected]; 1Institute for Biomedical Engineering and 2Rehabilitation Engineering Lab, ETH Zurich, Switzerland; 3Biomedical Optics Research Lab, University Hospital
Zurich, Switzerland. To date, photomultiplier tubes (PMTs) or avalanche photodiodes (APDs) are considered the gold standard for detectors in fNIRS [1]. However, PMTs are sensitive to overexposure, operate at very high voltages, and are bulky. APDs benefit from being solid state devices, but have reduced sensitivity and also need rather high operating voltages. Silicon photomultipliers (SiPMs) are alternative detectors, essentially consisting of an array of parallel connected tiny APDs operating in Geiger mode [2]. They have a high sensitivity and gain, and operate at lower voltages, while performing comparable to PMTs [3]. Here we propose the employment of SiPMs for fNIRS instrumentation and report on experimental evidence that they bear great potential for this purpose.
METHODS: fNIRS modules (27x27 mm2 footprint) consisting of an SiPM with 3x3 mm2 active area (KETEK GmbH, Germany), two LEDs (680 and 850 nm, 5 mW optical power) and an onboard preamplifier stage were built. During periods of 10 ms, both LEDs were consecutively switched on for 3.3 ms. A digital oscilloscope (sampling at 100 kHz) was used to record the SiPM signal. Samples at fs=100 Hz were obtained by averaging the data points belonging to 50-90% of the LED-on periods and subtracting the backlight level (determined analogously). A silicone phantom emulating a human head (μa=0.1 cm-1, μs’=11 cm-1) was used to acquire 50 such samples in order to determine the signal-to-noise ratio (SNR=mean/SD). The source-detector-separation (SDS) was varied from 20 to 60 mm, and the SNR was determined 10 times each. For an SDS of 20 to 30 mm, the LED intensities were adjusted to prevent amplifier saturation. Furthermore, for 20 mm SDS, data were picked up directly at the transimpedance amplifier’s output. A measurement with an SDS of 60 mm was furthermore recorded from one of the authors forehead, with the 680 nm LED being constantly on. These raw oscilloscope data were smoothed offline with a digital 10 Hz low-pass filter.
RESULTS: For 20 to 40 mm SDS, the SNR was approx. 60 dB. For larger SDS, SNR decreased (Fig. 1A). Theoretical considerations suggested that the SNR was mainly limited by shot- and dark noise [3], as determined based on modeled values for the reflectance [4] for 850 nm and the SiPM specification (grey area in Fig. 1A). The pulsation is clearly visible for an SDS of 60 mm (Fig. 1B).
DISCUSSION: The adjustment of the LED light to prevent from detector saturation resulted in plateauing of the SNR for small distances. Assuming signal changes of approx. 1% due to altered brain activity, we considered an SNR of 50 dB a lower bound for reliable measurements. Under this constraint and at fs=100 Hz, an SDS of up to 45 mm was feasible. The usage of SiPMs in fNIRS instrumentation hence has the potential to allow for highly accurate measurements with miniaturized modules and increased SDS.
REFERENCES: [1] G. Strangman, D. A. Boas, and J.P. Sutton: Non-invasive neuroimaging using near-infrared light.
Psychiatry, 52(7): 679-93, 2002. [2] A. G. Stewart, V. Saveliev, S. J. Bellis, D. J. Herbert, P. J. Hughes, and J. C. Jackson: Perform-
ance of 1-mm2 Silicon Photomultiplier. IEEE J Quantum Electron., 44(2): 157-64, 2008. [3] SensL: Noise in Silicon Photomultipliers and Vacuum Photomultiplier Tubes, Photonics Online,
2012. [4] A. Kienle and M. S. Patterson: Improved solutions of the steady-state and the time-resolved dif-
fusion equations for reflectance from a semi-infinite turbid medium, JOSA 4(1): 246-54, 1997.
Figure 1: SNR vs. SDS. Error bars indicate SD of 10 measurements and estimated 1.5mm positioning uncertainty, respect-tively (A). Forehead pulsation (SDS: 60 mm, wavelength: 680 nm) (B).
A
B
8
68

New Techniques for Advanced Optical Topography
Masashi Kiguchi, Tsukasa Funane, Hirokazu Atsumori, Takushige Katura, Hiroki Sato, and Akiko
Obata.
Hitachi, Ltd., Central Research Laboratory
Two techniques that improve fNIRS instruments are introduced.
One is a prototype of wearable optical topography developed for observing brain activity
noninvasively including regions covered by hair [1]. An avalanche photo diode (APD) whose
sensitivity was 30 times higher than the usual Si photodiode was used because the optical
transmittance in the region covered by hair is low. The APD, high voltage DC-DC converter, and
preamplifier were placed in an electrically shielded case to be safely mounted on the head. Rubber
teeth and a glass rod were prepared to clear away hair and reach the scalp. The system will be a useful
tool for observing activation in motor, visual, and auditory cortices in daily situations, for example,
rehabilitation.
The other is a MD-ICA (multi-distance independent component analysis) technique for separating
signals in the scalp [2]. The waves observed with multi-distance probes are divided into components
by ICA. When the hemodynamic change in scalp blood is the same as that in cerebral blood, the ICA
component includes both of them. The amplitude of the component in the scalp is independent of the
source-detector (SD) distance, and the amplitude of components in the deeper region linearly increase
when the SD distance increases. Each mixing ratio of scalp signal and deeper region signal in each
component can be calculated by observing the SD distance dependency of the component amplitude.
Each ICA component was divided into two sub-components according to each mixing ratio. Then,
both of scalp and deeper region waves were reconstructed by using the sub-components. This
technique was validated by experiments with a phantom. The c-NIRS and conventional ICA technique
extract the waves whose shapes are different from the scalp ones. In contrast, MD-ICA provides the
cerebral blood volume including the systemic change because the waves are separated by depth. Also
the systemic component can be removed by reducing the scalp components. MD-ICA will be
applicable to a wide range of situations.
[1] M. Kiguchi, et al., Rev Sci Instrum. 83, 056101 (2012).
[2] T. Funane, et al., Abstract of OHBM 2012, No 770.
9
69

Development of multichannel fNIRS system with transcranial pulse oximetry function using CDMA technique
Fumio Kawaguchi , Mitsuo Ohashi Spectratech Inc. Tokyo, Japan
fNIRS data contains various kinds of physiological fluctuation. Although the fluctuation has
been thought to degrade the precision of fNIRS signal, these are expected to give subject’s
physiological information during the measurment. [1] The main fluctuation component in the
signal is heart beat pulsation which strongly reflects the physiological and psychological state. In
this study we have developed a multichannel fNIRS system which can extract and present the
pulsation component and calculate the oxygen saturation ratio (SpO2) using pulse oximeter
technique. [2]
METHODS
Developed is multichannel system with 6 irradiation (wave length: 740nm and 830nm) and 6
detection probes, which measure 16 channel NIRS signals using CDMA(Code Division Multiple
Access) modulation technique. The sampling rate is 12.3cycle/sec. Oxy and deoxy hemoglobin’s
pulsation waveform and frequency power spectrum were calculated and displayed simultaneously.
[fig1] The oscillation component originated from heart beat is assigned automatically and used for
the calculations.
RESULT
We measured volunteer’s fNIRS signal during mental tasks. Pulsation component was around
0.8-1.2 Hz and the frequency increased during the task. Although the fNIRS signal changed
during the task, calculated SpO2 ratio was stable around 90%.
Developed system can measure the change of heart beat pulsation useful for fNIRS measurement.
REFERRENCES
[1] A. Maki, et al: Med. Phys. 22: 1997-2005,1995
[2] R. Stingele, et al :Molecular & Integrative Physiology Volume 134, Issue 3, 2003
fig. 1
10
70

Head probe for combined near-infrared spectroscopy and electroencephalography
Paolo Giacometti, Solomon G. Diamond Thayer School of Engineering at Dartmouth, Hanover, New Hampshire, USA
[email protected] We present a novel head probe that integrates near-infrared spectroscopy (NIRS) and electroencephalography (EEG) to enable simultaneous measurements of neural electrophysiology and vascular hemodynamics over the whole head for research and clinical studies. The simultaneous NIRS and EEG measurements permit the observation of the temporal and spatial relationships between neural and vascular signals for studies of neurovascular coupling. The probe’s design accommodates normal head shape variations and a wide range of head sizes. The current design contains 65 electrodes and 64 optodes. A flexible linkage system (black components in figure 1) follow the primary contours of the scalp by expanding or contracting to fit the desired head size while maintaining equidistant spacing between electrodes. An elastomeric web (orange) supplies uniform pressure over the scalp and holds the probe in place. Clinically relevant scalp positions and positional accuracy is ensured by locating the corners of the probe on standard scalp fiducial positions (inion, nasion, preauricular, and central). The linkage system of the probe then mechanically follows the 10-20 coordinate system and the web holds NIRS optodes and additional electrodes on the 10-10 and some 10-5 positions.
The purpose of the present study is to evaluate the positional accuracy and precision in the sensor placement. The probe was placed 3 times on 10 subjects and then electrode locations were digitized with a 3D scanner. This was repeated for the commercial EEG cap ANT WaveGuard 321. Precision was computed as the standard
deviation of each electrode location from the mean position in mm. Accuracy was determined as the root-mean-squared error for each line segment as a percent error of the total arc-length. We are additionally evaluating the uniformity of the scalp pressure applied by the web. A force sensor is being used to measure the force of each position as it is pulled discrete distances away from the scalp.
Accuracy (0.89 ± 0.23 - NIRS-EEG and 1.47 ± 0.36 mm - ANT [mm]) and precision (0.19 ± 0.15 NIRS-EEG and 1.13 ± 1.02 - ANT [% of total arc length]) results of the sensor placement are shown in figures 2 and 3 respectively. The web force testing is currently underway.
Accuracy and precision in the sensor location is important in establishing the correspondence of the signals measured from the scalp to the underlying brain anatomy and for the interpretation of scientific or clinical results. Uniformity in the pressure exerted by the optodes on the scalp maximizes optical coupling, stabilizes the probe during head movements, and improves comfort. The NIRS-EEG probe is intended to benefit multimodal data quality, repeatability, and ease of use.
This work is supported by the United States Department of Education P116Z080112, the NIH National Institute of Aging R21AG033256, and Rogue Research Inc.
1 ANT B.V. (Advanced Neuro Technology), Enschede, Netherlands
Figure 1 - NIRS-EEG Probe
Figure 3 - Accuracy test results [% of total arc length] of NIRS-EEG probe
(left) and ANT cap (right)
0
0.5
1
1.5
2
2.5
3
3.5
4
0
0.5
1
1.5
2
2.5
3
3.5
4
0
0.5
1
1.5
2
2.5
3
3.5
4
Figure 2 - Precision test results [mm] of NIRS-EEG probe (left) and ANT cap (right)
11
71

A low cost NIRS spectrometer for monitoring global physiological hemodynamic fluctuations. Blaise Frederick, PhD([email protected])1,2,3, Lia Hocke, MS1,2,Yunjie Tong, PhD1,2 1McLean Hospital Brain Imaging Center, 2Tufts University Department of Biomedical Engineering, 3Harvard Medical School Department of Psychiatry Introduction: Low frequency hemodynamic oscillations have been shown to propagate throughout the body, and are a major confound to hemodynamic based functional imaging methods, such as fNIRS and fMRI. Global NIRS waveforms (with appropriate delay) have shown utility for characterizing and removing physiological confounds from functional imaging data [1-3]. We present a simple device to record these waveforms without requiring a high end research NIRS device. Methods: To speed development time and reduce cost, the spectrometer was constructed using primarily commodity components. The core of the device is an Olimex MOD-PULSE pulse oximeter development board (Olimex, LTD, Plovdiva Bulgaria), which implements Texas Instruments’ reference design for a Nellcor-compatible single chip pulse oximeter [4] using a TI MSP430FG437 MCU. It was attached to a Nellcor type fingertip pulse oximeter probe, which measures transmission through the fingertip at 660 and 940nm. This board displays heartrate and blood oxygenation on an LCD screen. Continuous gain and baseline offset adjustment keep the cardiac signal within a limited range to simplify heartbeat detection, which distorts the NIRS waveform in a nonlinear manner and eliminates all information below a few tenths of a Hz. In its default state, the device cannot be used to measure LFOs. However, the firmware of the ‘FG437 can be rewritten to provide new capabilities. The MOD-PULSE ADC has a two stage input amplifier. A low gain primary stage allows offset adjustment to keep the signal with a given range, and a high gain second stage boosts the high frequency signal before digitization. Rather than directly digitizing the second stage, as was done in the Olimex firmware, the ‘FG437 was reprogrammed to perform a rapid, closed loop offset adjustment of the first stage to keep the digitized signal at a target value. The 660 and 940nm signals are sampled at 512Hz each while dithering the target value. The offsets are then filtered and downsampled by a factor of 16. Through this process the ‘FG437 achieves 14 effective bits of dynamic range at 32 Hz with a flat frequency response (DC to 16Hz) with a 12-bit ADC, sufficient to digitize the all NIRS components of interest. Sample pairs are sent at 32 Hz over a serial channel to an Olimexino-STM32 (an Arduino-compatible development board with a 72 MHz ARM processor) for further signal processing and transmission over USB to a laptop (in this case a MacBook Pro). A Python process on the laptop converts raw NIRS data to oxy- (HbO), deoxy- (HbR) and total hemoglobin (tHb) waveforms, separates them into frequency bands of interest, displays them and stores the data. The total cost of components excluding the case and the probe is ~$65 ($32 for the MOD-PULSE board, $27 for the Olimexino-STM32, and $5 for cabling). Reusable Nellcor probes cost between $100-200 (although compatible probes are available for as little as $10). Unit costs including case and probe would range from ~$75 to $300. Reflashing the MOD-PULSE firmware requires a JTAG programmer, which costs ~$75; the Olimexino-STM32 can be programmed through the USB port. All software tools used in this project are open source: MSP430 development was done using the msp430-gcc toolchain; Olimexino development uses the Maple IDE, and postprocessing and display are performed in Python 2.6. Results: 700 seconds of data were simultaneously recorded from two fingers on the left hand; the new oximeter recorded from the pointer finger, while a fiberoptic optical probe on the index finger was attached to an ISS Imagent system (690 and 830nm) recording at 12.5 Hz. In both the time and frequency domain, the data from the two spectrometers are indistinguishable. Discussion: Commodity development boards can be used to build inexpensive, high quality NIRS spectrometers for specialized purposes which can be used in place of more complex, expensive instruments, and provide data of equivalent quality. 1. Tong, Y., et al., JCBFM, 2011 31(12):2352-62. 2. Cooper, R.J., et al., NeuroImage, 2011 59(4):3128-38. 3. Frederick, B.B., et al., NeuroImage, 2012. 60(3): p. 1913-23. 4. Nisarga, B. Application Report SLAA458 - Revised Pulsoximeter Design Using the MSP430. 2010.
Figure 1 – Comparison of data from homebuilt spectrometer and ISS Imagent.
12
72

Improved light injection and detection methods for fNIRS headgear for use in avionics and astronautics
Authors: Jeffrey R. Mackey1, Grigory Adamovsky2, Padetha Tin 3, Bertram M. Floyd4, Angela R. Harrivel 5
Measuring hemoglobin concentration changes in the brain with Functional Near Infrared Spectroscopy (fNIRS) is a promising technique for monitoring cognitive state and optimizing human performance during both aviation and space operations. Advances in optical instrumentation for fNIRS have been conceptualized, prototyped and integrated into several new headgear designs suitable for use by commercial or military aircraft personnel and astronauts. Despite the continuing improvement of various research laboratory-based and commercial instrumentation, hardware currently used to attach optical fibers to and couple optical signals to the scalp for fNIRS behind the hairline is bulky, uncomfortable to painful, susceptible to motion artifact and interference from the hair, not expeditiously self-applicable and not readily integrated with existing environments (for example, cockpits and pilot headsets). Reducing such difficulties consistently encountered by those in both industry and academia is a design-driven aim. The success of these efforts to produce “next generation” fNIRS headgear will bring the benefits of the fNIRS technique out of the controlled laboratory and into clinical and operational environments. The full-up instrumentation that was tested in this research includes optical, electronic, custom headgear and medical grade phantom components.
This paper addresses the optical design, analysis, characterization and testing of the light delivery and detection systems in a terrestrial laboratory and aboard the Zero-G B727 aircraft during reduced and hyper gravity segments of flight. In particular, the embedded light delivery systems included the coupling of two different wavelength (690 nm and 830 nm) fiber pigtailed diode lasers, the addition of Gradient-index (GRIN) lenses to aid the focus of light through the scalp, skull and cerebral-spinal fluid layer, and the design of custom ferrules and fiber sleeves for use with the multi-mode silica fiber encased in a 900-micrometer tight tube buffer for protection and flexibility. Optical modeling is planned to investigate the effect of the GRIN lenses on the sensitivity profile in the tissue.
The light detection optical components were also embedded into the custom headgear using several GRIN lenses at strategically placed locations along comb-shaped parts. Custom sleeves and ferrules were also used to couple scattered light into multi-mode silica fibers that were part of a 12-count fiber distribution cable. In this manner, several detection locations may be integrated to a single low light-level detector such a photomultiplier tube. The ac- and dc-signal components were measured.
The fibers and optical components were housed securely in rapid-prototyped rigid headbands. These were designed in-house at the NASA Glenn Research Center with comb shapes (LEW-18280-1) to allow efficient self-application in the field by parting the hair upon application to maximize optic-skin coupling. Overall headband design parameters to be optimized for operational use include optical throughput, mechanical stability, self-applicability, comfort, safety and manufacturability.
Headgear testing was accomplished using gray matter phantom material embedded in life-sized phantom heads. Contact loads and accelerations were measured in conjunction with fNIRS signals to determine the optical coupling efficiencies as functions of g-level, pain threshold/level, and index matching media. Motion artifacts were characterized at varying headgear tension levels.
1 Vantage Partners, LLC 2 NASA Glenn Research Center, Optical Instrumentation and NDE Branch 3 National Center for Space Exploration Research, also acknowledging Daniel Gotti 4 Sierra Lobo, Inc. 5 NASA Glenn Research Center, Bioscience and Technology Branch, [email protected]
13
73

Advances in Customized Headgear and Optode-Hair Penetration A collaboration between MRRA Inc., University of Texas at Arlington and University of Texas at Dallas developed a hair-penetrating optode producing 10x increases in SNR for fNIRS signals. Additional work by MRRA Inc. is presented utilizing rapid prototyping technology to produce custom headgear. This 3d printing method enables creation of headgear quickly and inexpensively, enabling customization at the single subject, single experiment level. www.mrrainc.com Chester Wildey, Ph.D., MRRA Inc., [email protected] Bilal Khan, University of Texas at Arlington George Alexandrakis, Ph.D., University of Texas at Arlington Duncan MacFarlane, Ph.D, University of Texas at Dallas
Figures above show brush optode for penetration through hair. Figures below show 3d printed headgear. The optode layout and design may be adjusted on a per-experiment basis.
14
74
Towards a device capable of detecting the fast optical signal and its application to
stroke rehabilitation
Authors: Felipe Orihuela-Espina1, Karla Janeth Sánchez-Pérez
1, Daniel R. Leff
2, Luis Enrique
Sucar1, Carlos G. Treviño-Palacios
1
Affiliations: 1 National Institute for Astrophysics, Optics and Electronics (INAOE),
2 Imperial College
London
Presenting author e-mail: [email protected]
Abstract:
Subsequent to a stroke, functional reorganization responsible for the recovery, proceed according to a
range of strategies [4], which are not fully understood. This reorganization can to some extent be
steered by means of therapies involving repetitive exercising. The study of therapy induced
neuroplastic changes will benefit from a neuroimaging modality moderately robust to body
movement, such as fNIRS [5]. We have very recently been granted funds to undertake this research.
The goals of the new born project include (i) the development of a 4-channel frequency-domain
fNIRS apparatus to measure the fast optical signal, and (ii) to use this apparatus to in-vivo in-situ
observe the therapy induced functional reorganization associated to a virtual reality-based motor
rehabilitation therapy [8]. A range of NIRS equipment based on different NIRS modalities is available
[1]. In our case, illumination will follow a chirped frequency comb [3]. Signal detection will be
achieved using chirp signal correlation. Initially, we plan to base our image reconstruction in
differential measurement, although reconstruction from absolute optical data [2] will be considered at
a later stage. In vivo measurement of the fast optical signal still poses many challenges [6, 7]. We
expect our approach to enhance its detection reliability. This is one of the initial efforts on fNIRS
research in Mexico, together with the incipient work with infants of the group led by Dr. Harmony
and Dr. Marroquín who have long worked with EEG.
References:
[1] Marco Ferrari, Leonardo Mottola, and Valentina Quaresima. Canadian Journal of Applied
Physiology, 29(4):463–487, 2004.
[2] Huabei Jiang, et al. Journal of the Optical Society of America A, 13(2):253–266, 1996.
[3] Koichiro Nakamura, Toshiharu Miyahara, and Hiromasa Ito. Applied Physics Letters,
72(21):2631 (3 pp.), 1998.
[4] Felipe Orihuela-Espina, et al. Accepted in Topics in Stroke Rehabilitation, page 27 pp., 2012.
[5] Felipe Orihuela-Espina, et al. Physics in Medicine and Biology, 55:3701–3724, 2010.
[6] Harsha Radhakrishnan, et al. NeuroImage, 45(2):410–419, 2009.
[7] Jens Steinbrink, et al. NeuroImage, 26:996–1008, 2005.
[8] L. Enrique Sucar, et al. In 32nd Annual International Conference of the IEEE EMBS, pages
3690 – 3693, Buenos Aires, Argentina, 31st AUG -4th SEP 2010.
15
75

Smaller, lighter, cheaper. A new fNIRS system from MRRA Inc. Hair penetrating optodes and advanced digital modulation methods enable high sensitivity fNIRS measurements using PDs in place of APDs. This significantly reduces temperature-induced drift while also decreasing system size and cost. One 48-optode system occupies 1 liter of volume (excluding battery pack) and transmits data wirelessly to a receiver PC. The advanced digital modulation method allows 50% transmit optode duty cycle and is designed to enable real-time demodulation of individual fNIRS signals. Design overview and performance measures are presented. www.mrrainc.com Chester Wildey, Ph.D., MRRA Inc., [email protected]
Figures above show 48 optode fNIRS system occupying 1 liter volume. Figure below shows results of dynamic liquid phantom testing of the system.
16
76

TechEn: Advancing fNIRS Technology for Results
TechEn is a leader in fNIRS technology development, offering the CW6 continuous-wave system.
Since 1998, we have collaborated with Dr. David Boas and his Photonics Lab at Massachusetts
General Hospital in Boston, Mass., innovating and advancing every aspect of fNIRS systems,
including instrumentation, software, head caps, custom
accessories and support services.
We offer a variety of systems to meet different research needs
and budgets. They range from small, portable systems to much
larger ones; our largest includes 96 lasers with multiple
wavelengths, 32 avalanche photodiode (APD) detectors and more
than 2,000 data measurement channels. Flexible configurations
enable partial as well as whole-head coverage.
Our latest advances include expansion of the CW6 systems for
breast imaging and other complex studies.
Other recent developments include a new head cap system
designed for localization, comfort and performance, and new optical fibers with optodes that facilitate
comfortable and consistent contact with the scalp, even through long hair – traditionally a problem
with fNIRS monitoring. The lightweight fibers and optodes are designed for use with head caps, head
bands, helmets or patches.
TechEn systems integrate seamlessly with the HOMER and HOMER2 packages, and with most other
post-processing software. In fact, Dr. Boas recently developed HOMER2 to advance CW6 and
fNIRS data analysis capabilities – incorporating a suite of new add-on modules. For example, the user
friendly software includes advanced stim mark control, group analysis and principle component
analysis.
Researchers choose CW6 systems because key advances and capabilities described herein lead to
successful results. The excellent data are made possible by the
flexible yet high-performance CW6 instrument; a comfortable
head cap and fiber optode system; and ease of use of the
HOMER2 software. Other advantages of the systems include:
Ease of use for set-up and data acquisition
Real-time display
Highest performance for signal-to-noise
Dedicated ongoing support services
Support for data analysis
Expert and friendly lab training
Finally, we are very proud of the role our CW6 system has played in pioneering multi-modal studies,
including CW6 and EEG especially in epilepsy studies, CW6 and fMRI for brain mapping, CW6 and
IMPACT software for TBI, CW6 and TMS for addiction, and CW6 and tDCS for addiction.
Arthur “Buzz” DiMartino TechEn, Inc. email: [email protected] www.nirsoptix.com Poster for fNIRS Conference at UC L
17
77

Poster Session Multi-‐Modal Monitoring
Poster #: 18-‐24
78

Multimodal investigation of neural-vascular coupling during somatosensory stimulation and resting state using concurrent MEG-NIRS and MRI-NIRS. Theodore Huppert1,2, Avniel Ghuman 3
1. University of Pittsburgh, Radiology, Pittsburgh, PA, United States 2. University of Pittsburgh, Bioengineering, Pittsburgh, PA, United States 3. University of Pittsburgh, Neurological Surgery, Pittsburgh, PA, United States
[email protected] Introduction In this study, multi-channel functional near-infrared spectroscopy (NIRS) signals were recorded from the primary and secondary somatosensory cortex during concurrent magnetoencephalography (MEG) and functional MRI. A pulsed-pair median nerve stimulus was used to probe the relationships of the neural and vascular responses. Concurrent neural and vascular data was also recorded during resting state fluctuations. Methods A total of 15 subjects were scanned on two sessions with concurrent MEG-NIRS and fMRI-NIRS at 3T. A pulsed pair median nerve stimulus was used with 7 conditions of inter-pulse intervals between 50ms-500ms were used to probe the dynamics of the neural refractory period during unilateral stimulation. Unilateral median nerve stimulation was conducted using a computer controlled GRASS S88X stimulator. A stimulating bar electrode was positioned on the right median nerve and adjusted a voltage matching the motor threshold as judged by twitching of the thumb on the stimulated hand. A functional localizer task consisting of repeated 10-second blocks of stimulation at 4Hz with a 20second inter-block rest period was administered. Five-minute scans of event-related pulsed-pair stimulation were then given. The pulsed pair condition consisted of a pair of two median nerve pulses separated by an inter-stimulus interval of 50, 100, 150, 200, 300, 400, or 500ms. The stimulus conditions were presented in randomized order with a minimum spacing of 12-18 seconds between events to avoid potential non-linearities in the hemodynamic response. A TechEn CW6 NIRS system was used to record in both concurrent MRI and MEG sessions. Session dedicated MRI or MEG fiber optics were used. Registration of the NIRS probe was done via both vitamin E markers (for MRI) and HPI positioning coils (for MEG), which were both mounted on the NIRS head cap. Results Concurrent NIRS-MEG and NIRS-MRI showed similar activation areas within S1 (Fig 1). Both MEG and MRI showed additional activations within the secondary sensory area (S2), which was below the spatial resolution of NIRS. Regions-of-interest from the area of S1 were examined as a function of the inter-pulse interval. The NIRS and MRI data both showed a U-shaped response profile indicating a minima in the response at 75-150ms corresponding to the neural refractory period (fig 2). The ratio of the amplitude of the second to first pulse measured via MEG showed a similar response profile.
Conclusion Concurrent MEG-NIRS and MRI-NIRS results show tight coupling of the neural and vascular signals.
Fig 1. Concurrent NIRS (left) and fMRI (right) recordings of median nerve stimulation showed similar spatial localization. The NIRS was only recorded on the left (contralateral) hemisphere due to the space constraints of the MEG scanner.
Fig 2. The amplitude of the NIRS, MEG, and fMRI amplitudes were extracted for the 7 pulsed pair conditions based on a region-of-interest defined by the localizer task for each modality.
18
79

-6-5.5-5-4.5-4-3.5-3-2.5-2-1.5-1-0.500.51
-60
-55
-50
-45
-40
-35
-30
-25
-20
-15
-10
-5
0
5
10
-10 0 10 20 30 40 50 60 70 80 90 100 110
Δ[o
xC
CO
](m
M)
Δ[H
bD
iff]
(μM
)
HbDiff
oxCCO
0
0.1
0.2
0.3
0.4
0.5
0.6
0.7
0.8
0.9
1
0
0.05
0.1
0.15
0.2
0.25
0.3
-10 0 10 20 30 40 50 60 70 80 90 100 110
PC
r/e
pp
&P
i/e
pp
NT
P/e
pp
Time (minutes)
NTP/epp
PCr/epp
Pi/epp
-6-5.5-5-4.5-4-3.5-3-2.5-2-1.5-1-0.500.51
-60
-55
-50
-45
-40
-35
-30
-25
-20
-15
-10
-5
0
5
10
-10 0 10 20 30 40 50 60 70 80 90 100 110Δ[o
xC
CO
](m
M)
Δ[H
bD
iff]
(μM
)
HbDiff
oxCCO
0
0.1
0.2
0.3
0.4
0.5
0.6
0.7
0.8
0.9
1
0
0.05
0.1
0.15
0.2
0.25
0.3
-10 0 10 20 30 40 50 60 70 80 90 100 110
PC
r/ep
p&
Pi/
ep
p
NT
P/e
pp
Time (minutes)
NTP/epp
PCr/epp
Pi/epp
HI HI(a) (b)
Figure 1. 31P-MRS and NIRS during HI and recovery; (a) piglet 175; (b) piglet183.
Investigation of brain tissue oxygenation, cytochrome-c-oxidase and intracellular metabolitesduring perinatal cerebral hypoxia-ischaemia
Ilias Tachtsidisa*, Alan Bainbridgeb, Stuart Faulknerc, David Priceb, Ernest Cadyb, Esther Baera, KevinBroadc, Mojgan Ezzatic, David Thomasd, Nicola J. Robertsonc, Xavier Golayd
a Dept. of Medical Physics and Bioengineering, University College London, U.K.bMedical Physics and Bioengineering, UCLH NHS Foundation Trust, U.K.cInstitute for Women’s Health, University College London, U.K.dInstitute of Neurology, University College London, U.K.
Background: Hypoxic-ischaemia (HI) neonatal encephalopathy is associated with high mortalityand morbidity rates worldwide. In this study we investigate brain oxygenation, cytochrome-c-oxidase (CCO) and energy-resource changes during transient HI and recovery using simultaneousbroadband near-infrared spectroscopy (NIRS) and phosphorus (31P) magnetic resonancespectroscopy (MRS) in the piglet.Methods: 22 healthy piglets (aged <24 hr) were anaesthetised and physiologically monitored.Transient cerebral HI (duration 20 minutes) was induced by reducing the inspired oxygenationand reversibly inflating bilateral carotid artery occluders. Using 31P MRS we measured inorganicphosphate (Pi)/epp, phosphocreatine (PCr)/epp, and nucleotide triphosphate (NTP)/epp(epp=exchangeable phosphate pool=Pi+PCr+3NTP). NIRS measured cerebral concentrationchanges of oxy-haemoglobin (HbO2) and deoxy-haemoglobin (HHb), and cytochrome-c-oxidaseoxidation state changes (Δ[oxCCO]). Results: Simultaneous 31P-MRS and NIRS results are shown in Figure 1. HI rapidly reducedbrain oxygenation as shown by changes in haemoglobin difference (Δ[Hbdiff]=Δ[HbO2]-Δ[HHb])) closely followed by a fall in Δ[oxCCO]. PCr/epp fell, and Pi/epp rose, quickly while NTP/epp was buffered initially and only declined when Δ[oxCCO] was significantly lowered. During recovery, metabolicmarkers for piglet 175 returned tobaseline (Figure 1(a)); but they didnotfor piglet 183 (Figure 1(b)).Discussion: During transient HI, CCObecomes reduced due to oxygendepletion; adenosine triphosphatelevels are initially preserved by thecreatine kinase reaction leading toPCr decline whereas energyutilisation without oxidativephosphorylation leads to increased Pi.During recovery we have observedhigh association between the NIRS measurement of Δ[oxCCO] and 31P-MRS. ComplementaryMRS and NIRS enable better understanding of the cerebral metabolic response to HI and canhelp evaluate early interventional therapies.
19
80
Multimodal correlation analysis between fNIRS, fMRI and EEG during motor tasks
Muthalib M.,1* Anwar A.R.,2* Perrey S.,1 Dat M.,3 Galka A.,2 Wolff S.,2 Deuschl G.,2 Raethjen J.,2
Heute U.,2 Muthuraman M.2
1 Montpellier-1 University, France. 2 University of Kiel, Germany. 3 AMS, the Netherlands. * Shared first authorship
Email: [email protected]
Introduction. Investigating human brain function requires a multimodal neuroimaging approach. The combination of different electrophysiological (electroencephalography, EEG) and haemodynamic (functional magnetic resonance imaging, fMRI and functional near-infrared spectroscopy, fNIRS) modalities to measure brain activity compliments each other’s limitations. EEG measures brain activity directly by placing EEG electrodes over the scalp and measuring the electrical potential at each electrode. fMRI measures brain activity indirectly via changes in the blood oxygenation level-dependent (BOLD) contrast signal, which is related to an increase in cerebral oxygen delivery subsequent to increased neuronal activity (i.e., neurovascular coupling). Similarly, fNIRS measures several physiological parameters related to cerebral oxygenation including measurements of concentration changes in oxygenated (O2Hb) and deoxygenated (HHb) hemoglobin. Unlike fMRI, EEG offers good temporal resolution but has very limited spatial resolution, while fNIRS has better temporal resolution than fMRI but lower than EEG, and lower spatial resolution than fMRI but better than EEG. Previous studies have simultaneously measured combinations of two out of the three neuroimaging modalities, but to the best of our knowledge no previous study has measured all three modalities simultaneously, which is usually due to technical limitations. Therefore the aim of the study was to determine the correlation between cortical activation measured with fNIRS, fMRI and EEG during different motor tasks. Methods. Five healthy subjects (26y) performed three different motor tasks with their right hand (finger tapping [FT], simple finger sequence [SFS], and complex finger sequence [CFS]) in a block design (10 repetitions with 30-s task and 30-s rest). The experimental setup consisted of fMRI-compatible EEG (256 channels, GEO300, EGI, USA) and fNIRS (24 channels, Oxymon MkIII, AMS, the Netherlands) systems. Four fNIRS probes were placed in the EEG cap around the contralateral motor cortex (CMC) region of the subjects scalp. Subjects were then placed in a supine position inside a 3T MRI scanner (Philips Achieva, Philips, the Netherlands). fMRI (BOLD) time series data from the CMC was extracted, and fNIRS (O2Hb and HHb) time series data from all 4 channels were down-sampled to the fMRI time series providing 240 time points for comparison. To determine the relationship between fMRI and fNIRS time series over the 10 blocks during each of the 3 motor tasks, Spearman’s correlation was calculated. Scalp EEG electrodes surrounding the CMC were chosen for analysis and their dynamical coherence with the right hand electromyography (EMG) signals was calculated with overlapping windows. This scalp coherence vector (240 time points) was used to calculate its relationship with fNIRS and fMRI time series using Spearman’s correlation. Afterwards, dynamic imaging of coherent sources analysis was used to extract the source level EEG from the CMC and then its dynamical coherence with EMG signals was also correlated against fNIRS and fMRI time series using Spearman’s correlation. Results & Discussion. fNIRS was significantly correlated with fMRI during FT (O2Hb: r=-0.22, P=0.00075; HHb: r=0.36, P=0.0001), SFS (O2Hb: r=-0.47, P=0.00001; HHb: r=0.47, P=0.0088), and CFS (O2Hb: r=-0.39, P=0.0001; HHb: r=0.15, P=0.0182). The scalp coherence vector showed a significant correlation with fNIRS (r=0.61, P=0.0001) and fMRI (r=0.59, P=0.0001) only during FT. The EEG source coherence vector showed a significant correlation with fNIRS (O2Hb: r=0.38, P=0.00001; HHb: r=0.54, P=0.0001) and fMRI (r=0.168, P=0.009) during all three motor tasks. This indicates that EEG source analysis is better than EEG scalp analysis to determine CMC activation during all three motor tasks. In conclusion, our initial findings show strong temporal correlations between fNIRS, fMRI and EEG data collected simultaneously during three motor tasks. Future effort should implement these novel approaches to increase the significance and the homogeneity of these results in the search of a more complete understanding of the dynamics and the physiology of the neurovascular coupling.
20
81

A Study of Executive Control during Intracorporeal Minimally Invasive Suturing (ICS)
K. Shetty, D.R. Leff, F. Orihuela-Espina, T.P. Cundy, A.W Darzi, G-Z. Yang.
Hamlyn Centre for Robotic Surgery, Imperial College London, United Kingdom.
(Presenting author: [email protected])
Introduction: The introduction of minimal invasive surgery (MIS) has allowed surgeons to perform
complex surgeries through smaller incisions leading to faster patient recovery. Due to the loss of
depth perception, lack of tactile feedback and the fulcrum effect MIS is more technically demanding
to perform. Of MIS maneouvres intra-corporeal suturing (ICS) and knot tying are arguably the most
challenging and limit the capability of the surgeon to perform advanced surgery1. A more detailed
appreciation of the cortical response to complex tasks such as ICS is necessary in order to determine
which sub-tasks demand most cognitive resources and therefore which episodes need focused
additional training time and /or technological assistance. We aimed to assess which aspect ICS evoked
most pre-frontal cortex (PFC) activation amongst novices. We hypothesized that the technically more
challenging aspect of ICS, namely the double throw knot would evoke the greatest PFC excitation.
Methods: 15 right-handed laparoscopically naïve medical students (mean age of 21.6±1.3 years SD)
were recruited to perform ICS. Each subject initially observed a video tutorial and later trained for
two hours on a box trainer, with guidance from a trainer. The task involved of placing three
interrupted IC sutures across an enterotomy (laceration in bowel) The ICS task was divided into three
subcomponents performed sequentially as follows: insertion of needle (task A), double throw knot
(task B) and a pair of single throw knots (task C)2. A block design experiment was conducted
involving 9 blocks, which comprised of alternate ‘rest’ (40s) and ‘task’ periods (variable time).
Primary outcome measures were relative changes in oxygenated and deoxygenated haemoglobin
(HbO2 and HHb respectively) in the PFC captured by a 24 channels Optical Topography device
(ETG-4000, Hitachi Medical Corp., Japan). Secondary outcome measures were task performance
measures (time and validated objective score) 3.
Results: 12 of 15 participants completed the task after a single training session. The remaining three
participants were invited for an additional two hours training period before undergoing the
assessment. Averaged group data across all PFC channels revealed that Task A evoked a greater
change in HbO2 (average of HbO2 task- average of HbO2 baseline) compared to Task B and C
(median values 22.48, 2.80 and 6.61 μMxcm respectively) which was found to be statistically
significant (P<0.001). The three subjects who required remedial training demonstrated a greater
change rise in HbO2 (average of HbO2 task- average of HbO2 baseline) across all stimuli than the
remaining cohort (remedial group = 29.37, 21.67 and 19.73 μMxcm for task A, B and C respectively
versus 19.26, 0.58 and 5.26 μMxcm for the residual cohort).
Discussion: The PFC is recruited when motor performance is unrefined and attention demands are
high4. Contrary to published literature
5, the current study suggests that for novice surgeons there are
aspects of intra-corporeal knot-tying that demand attention and executive control. Contrary to our
hypothesis, the most attention-demanding manoeuvre appeared to be that of needle insertion instead
of double knot-articulation. Interestingly the subjects who required remedial training recruited a
greater amount of their cognitive resources across all subtasks. In order to understand this a further
longitudinal study is required to examine the pattern of changes in brain behaviour that are associated
with improvements in technical skill and amelioration of cognitive load with learning.
References:
1. Stefanidis D et al. J Am Coll Surg. 2010 Apr; 210(4):436-40.
2. Kroeze SG et al. Eur Urol. 2009 Nov; 56(5):865-72.
3. Korndorffer JR Jr et al. J Am Coll Surg. 2005 Jul; 201(1):23-9.
4. Leff DR et al. Neuroimage. 2008 Jan 15; 39(2):805-13. 5. Ohuchida K et al. Surg Endosc. 2009 Oct; 23(10):2296-301
Funding: This work has been funded in part by the Academy of Medical Sciences and Cancer Research UK.
21
82

Simultaneous (Q)EEG and NIRS measurements during eyes open and eyes closed resting state
conditions in healthy volunteers
Anique Driessen a,b,c
, Björn Crüts b,c,d
, Ken Howells a, Paul Borm
c, Mojtaba Zarei
e, Helen Dawes
a
a. School of Life Sciences, Oxford Brookes University, Gipsy Lane, Oxford, OX3 0BP, United
Kingdom.
b. BrainMarker B.V., Molenweg 15a, 6271 JN Gulpen, the Netherlands.
c. Centre of Expertise in Life Sciences, Zuyd University, Nieuw Eyckholt 300, 6419 DJ Heerlen, the
Netherlands.
d. The Institute for Mathematical Sciences, Imperial College London, South Kensington Campus,
London, SW7 2AZ United Kingdom.
e. FMRIB Centre, University of Oxford, Nuffield Department of Clinical Neurosciences, John
Radcliffe Hospital, Headington, Oxford, OX3 9DU, United Kindom.
e-mail: [email protected]
The analysis of resting state brain activity is a common phenomenon in quantitative EEG (QEEG) and
gaining more popularity in fMRI research. In the field of NIRS it is however not common to be
interested in resting state activity. From EEG and QEEG research we know that during a resting state
condition with closed eyes alpha wave activity occurs on the occipital cortex. Upon opening the eyes
this alpha wave subsides. Moosman et al. (2003) investigated changes in the occipital EEG alpha
rhythm together with changes in fMRI and NIRS. In their study the combination of alpha and Deoxy-
Hb (N=4) resulted in a strong positive correlation at a delay of about 8 seconds. As an extension of
their work this study explored the difference in resting state activity of the occipital cortex between
eyes open and eyes closed in a sample of 38 healthy adults. Changes in alpha wave activity were
compared to changes in Oxy-Hb as well as Deoxy-Hb concentrations.
Subjects (N=38) were fitted with electrodes over the O1 and O2 position of the international 10-20
system. Over each location a transmitter and receiver were placed in order to be able to measure brain
activity from corresponding brain areas in both modalities. A continuous measurement of 5 minutes
was conducted in which subjects were asked every 30 seconds to change from eyes open to eyes
closed and vice versa. The starting condition was assigned randomly, assuring an even distribution of
the two paradigms.
Pairs were formed within each minute, containing one block of eyes open data and one block of eyes
closed data. The average alpha power and concentration of Oxy-Hb and Deoxy-Hb were calculated for
every second half of each block in order to avoid transient features and to ensure steady state values
were taken into account. After removing outlying data, paired samples t-tests were conducted.
The t-tests revealed significant differences between eyes open and eyes closed conditions for alpha
magnitude (mean difference 14.92 µV, p < 0.0001) as well as Oxy-Hb (mean difference 0.624 mmol,
p < 0.01) and Deoxy-Hb (mean difference 0.117 mmol, p < 0.05) concentrations. During eyes closed
conditions more alpha wave activity and higher Deoxy-Hb concentration is found and lower Oxy-Hb
concentration compared to eyes open conditions. Subsequently a correlation analysis was conducted in
order to establish correlations between the averaged data. This analysis did not reveal any significant
correlations leading us to believe that the relationship between resting state NIRS activity and alpha
wave activity needs to be sought in time series analysis rather than static analysis of block averages.
References:
Moosmann, M., Ritter, P., Krastel, I., Brink, A., Thees, S., Blankenburg, F., Taskin, B., Obrig, H. &
Villringer, A. (2003). Correlates of alpha rhythm in functional magnetic resonance imaging
and near infrared spectroscopy. NeuroImage,20, 145-158.
22
83
Comparison of NIRS, EEG and MEG sensitivity to spatial scale of brain activity Katherine L. Perdue* and Solomon G. Diamond
Thayer School of Engineering at Dartmouth, Hanover, New Hampshire, USA *[email protected] Introduction: Functional near-infrared spectroscopy (NIRS), electroencephalography (EEG) and magnetoencephalography (MEG) are functional brain imaging methods that require inverse solutions to localize brain activity. All three methods have spatial resolution as measured by localization error on the order of a centimeter [1, 2]. Despite these similarities, differences in how brain activity is propagated to the sensors means that the imaging methods may be sensitive to different spatial scales of brain activity. Methods: Brain activity was simulated on a realistic cortical surface reconstructed from a T1-weighted MRI using Freesurfer [3]. Different spatial scales of brain activity were generated using spatially filtered white noise on the spherical representation of the cortical surface. Forward models were calculated for all brain imaging modalities using a whole-head probe based on the 10-5 system [4] with 286 electrodes for EEG and 482 source-detector pairs with separations from 2-3 cm were used for NIRS. The Elekta VectorView 306 channel instrument was used as the sensor array for MEG. Brain activity was simulated at 9 different spatial scales, representing spatial activity scales from 0.026 cm2 to 1100 cm2 . The root-mean-square (RMS) of the simulated brain activity at each sensor was calculated over 500 sample brain activation patterns as a measure of the sensitivity to brain activity at each spatial scale. Results and Discussion:
Larger RMS indicates that the modality is more sensitive to variability in brain activity on that spatial scale. Sensitivity was normalized to the maximum RMS value for each modality. MEG was most sensitive to activity on the 30-80 cm2 spatial scale. NIRS is most sensitive to the largest spatial scale
activations. EEG is also most sensitive at large spatial scales, and its sensitivity declines more quickly as the spatial scale decreases, indicating that EEG may be less sensitive than NIRS for discerning small-scale activation patterns. Conclusion: MEG, EEG, and NIRS have different sensitivities to the spatial structure of brain activity. This finding indicates that multimodal brain imaging using these methods may measure different spatial scales of activation patterns of the brain, even if similar probe designs are used between modalities. References: [1] Liu, A. K. et al. Human Brain Mapping 2002, vol. 16 (1) pp. 47-62. [2] Cooper, R. J. et al. NeuroImage 2012, vol. 62 (3) pp. 1999-2006. [3] Dale, A. M. et al. NeuroImage 1999, vol. 9 (2) pp. 179-194. [4] Oostenveld, R, and Praamstra P. Clinical Neurophysiology 2001, vol. 112 pp. 713-719.
23
84

Effect of Visuomotor rotation in Laparoscopic Surgery on the Prefrontal Cortex (PFC)
K. Shetty, D.R. Leff, F. Orihuela-Espina, A.Koshy, K.Sriskandarajah, A.W. Darzi, G-Z. Yang.
Hamlyn Centre for Robotic Surgery, Imperial College London, United Kingdom.
(Presenting author: [email protected])
Introduction: ‘Neuroergonomics’ seeks to study the effects of technologies on the human brain and
has recently been applied to evaluate surgical instrumentation1. Laparoscopic (keyhole) surgery
accelerates recovery, improves cosmesis but is more challenging to perform due to the effects of
visuomotor rotation (VMR), loss of depth perception (projection of 3D operative field onto a 2D
screen) and lack of tactile feedback. During operative procedures VMR occurs when the laparoscope
is unintentionally rotated over its long axis resulting to disoriented images of the operative site.
Confusing spatial transformations result in misalignment between visual perception and motor
control2, degrading performance
2, 3 and theoretically increasing cognitive load. Here we evaluate the
impact of VMR on bilateral excitation across the prefrontal cortex (PFC). Given the role of the PFC in
attention to actions, visuospatial working memory and performance monitoring; critical for complex
skill acquisition 4 it was hypothesised that VMR would evoke greater PFC excitation.
Methods: Eight right-handed laparoscopically naive medical students (mean age ± SD = 20.4 ±1.6
years) were recruited to perform peg transfer task requiring peg manipulations between laparoscopic
instruments operated by either hand and placed onto a pin board. The task was performed under
normal view or with the view rotated by 90° (order randomised). A block design experiment was
conducted involving six blocks comprising alternating ‘rest’ (30s) and ‘task’ periods (variable time).
Primary outcome measures were relative changes in oxygenated and deoxygenated haemoglobin
(HbO2 and HHb respectively) in the PFC captured by a 24 channels Optical Topography device
(ETG-4000, Hitachi Medical Corp., Japan). Secondary outcome measures were task performance
measures (time and validated objective score) 3, 5
.
Results: Group average performance was better under the normal view versus the rotated view for
time (mean 138.29 s vs. 296 s, p<0.001) and objective score (mean 162.13 vs. -16.3, p<0.001). Across
all channels, for all subjects on all trials a greater change in HbO2 (average of HbO2 task- average
of HbO2 baseline) was observed under the normal view versus rotated view (p = 0.022). A greater
change in group HbO2 (normal vs rotated view) was observed in all channels overlying the right
PFC (p=0.009) and left PFC (p = 0.038). Similarly across all channels for all subjects and trials a
greater change in HHb (average of HHb task – average of HHb baseline) was observed under the
normal versus rotated view (p value <0.001).
Discussion: VMR results in poorer technical performance compared to normal view laparoscopy in
task naïve subjects. Contrary to the hypothesis normal view laparoscopy resulted in greater PFC
responses than VMR. It is conceivable that VMR is so challenging that subjects are unable to engage
an appropriate PFC dependent cognitive strategy, or cognitively disengage as a result of task
complexity7. Further longitudinal studies are required to evaluate the effects of repeated practice
under VMR on the evolution in PFC cortical haemodynamics.
References:
1. James DR et al. Surgery. 2011 Apr; 149(4):525-33
2. Zhang L et al. Appl Ergon. 2012 Nov; 43(6):993-1001.
3. Cresswell AB et al. Surg Endosc. 1999 Jun; 13(6):591-4.
4. Leff DR et al. Neuroimage. 2008 Jan 15; 39(2):805-13.
5. Peters JH, Fried GM, Swanstrom LL et al. Surgery. 2004 Jan; 135(1):21-7.
6. Fitts PM, Posner MI. Human Performance. Belmont, CA: Brooks/Cole; 1967.
7. Cheng SY et al. Advances in cognitive Engineering and Neuroergonomics. 2012 CRC Press.
Funding: This work has been funded in part by the Academy of Medical Sciences and Cancer
Research UK.
24
85

Poster Session Data Analysis Poster #: 25-‐54
86
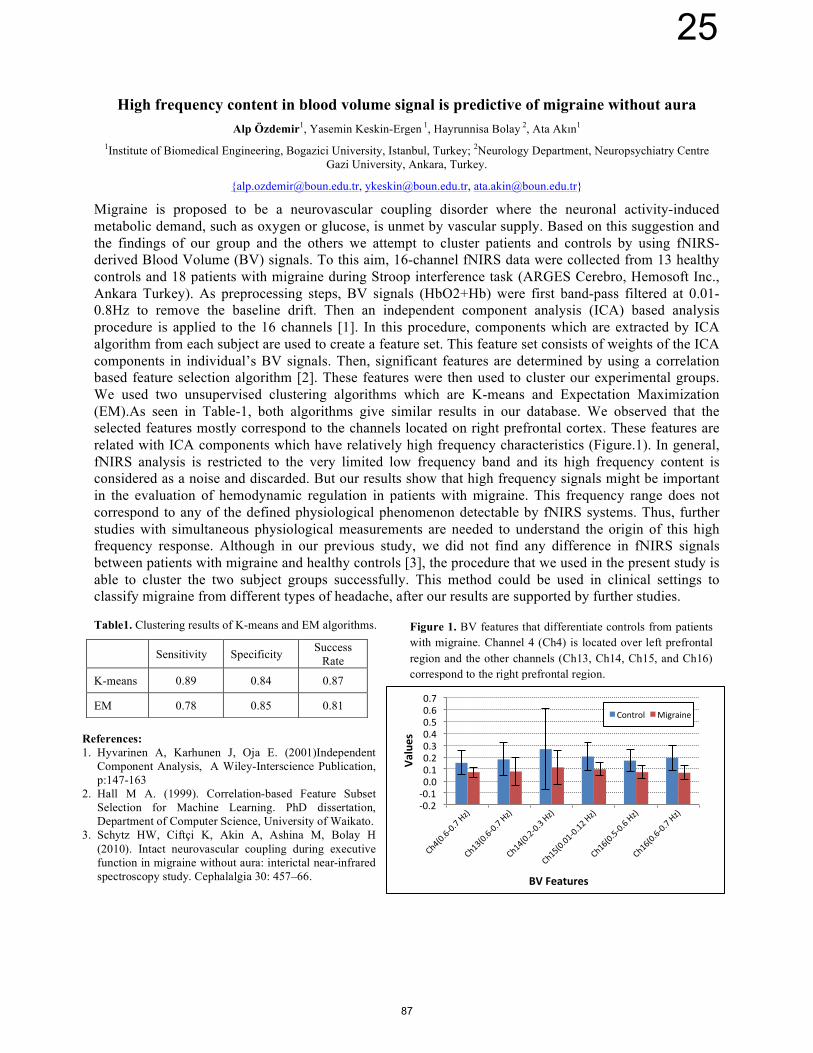
Figure 1. BV features that differentiate controls from patients with migraine. Channel 4 (Ch4) is located over left prefrontal region and the other channels (Ch13, Ch14, Ch15, and Ch16) correspond to the right prefrontal region.
References: 1. Hyvarinen A, Karhunen J, Oja E. (2001)Independent
Component Analysis, A Wiley-Interscience Publication, p:147-163
2. Hall M A. (1999). Correlation-based Feature Subset Selection for Machine Learning. PhD dissertation, Department of Computer Science, University of Waikato.
3. Schytz HW, Ciftçi K, Akin A, Ashina M, Bolay H (2010). Intact neurovascular coupling during executive function in migraine without aura: interictal near-infrared spectroscopy study. Cephalalgia 30: 457–66.
High frequency content in blood volume signal is predictive of migraine without aura Alp Özdemir1, Yasemin Keskin-Ergen 1, Hayrunnisa Bolay 2, Ata Akın1
1Institute of Biomedical Engineering, Bogazici University, Istanbul, Turkey; 2Neurology Department, Neuropsychiatry Centre Gazi University, Ankara, Turkey.
{[email protected], [email protected], [email protected]}
Migraine is proposed to be a neurovascular coupling disorder where the neuronal activity-induced metabolic demand, such as oxygen or glucose, is unmet by vascular supply. Based on this suggestion and the findings of our group and the others we attempt to cluster patients and controls by using fNIRS-derived Blood Volume (BV) signals. To this aim, 16-channel fNIRS data were collected from 13 healthy controls and 18 patients with migraine during Stroop interference task (ARGES Cerebro, Hemosoft Inc., Ankara Turkey). As preprocessing steps, BV signals (HbO2+Hb) were first band-pass filtered at 0.01-0.8Hz to remove the baseline drift. Then an independent component analysis (ICA) based analysis procedure is applied to the 16 channels [1]. In this procedure, components which are extracted by ICA algorithm from each subject are used to create a feature set. This feature set consists of weights of the ICA components in individual’s BV signals. Then, significant features are determined by using a correlation based feature selection algorithm [2]. These features were then used to cluster our experimental groups. We used two unsupervised clustering algorithms which are K-means and Expectation Maximization (EM).As seen in Table-1, both algorithms give similar results in our database. We observed that the selected features mostly correspond to the channels located on right prefrontal cortex. These features are related with ICA components which have relatively high frequency characteristics (Figure.1). In general, fNIRS analysis is restricted to the very limited low frequency band and its high frequency content is considered as a noise and discarded. But our results show that high frequency signals might be important in the evaluation of hemodynamic regulation in patients with migraine. This frequency range does not correspond to any of the defined physiological phenomenon detectable by fNIRS systems. Thus, further studies with simultaneous physiological measurements are needed to understand the origin of this high frequency response. Although in our previous study, we did not find any difference in fNIRS signals between patients with migraine and healthy controls [3], the procedure that we used in the present study is able to cluster the two subject groups successfully. This method could be used in clinical settings to classify migraine from different types of headache, after our results are supported by further studies.
Table1. Clustering results of K-means and EM algorithms.
Sensitivity Specificity Success Rate
K-means 0.89 0.84 0.87
EM 0.78 0.85 0.81
-‐0.2 -‐0.1 0.0 0.1 0.2 0.3 0.4 0.5 0.6 0.7
Values
BV Features
Control Migraine
25
87

Haemodynamic Responses to Moving Sinusoidal Gratings Uma Shahani1*, William A Simpson2 & Shobana Wijeakumar1
1Department of Vision Sciences, Glasgow Caledonian University, Cowcaddens Road, Glasgow G40BA 2School of Psychology, University of Plymouth Drake Circus, Plymouth PL4 8AA *[email protected] Purpose: To record the changes in oxy (HbO) and de-oxyhemoglobin (Hb) concentrations over the occipito-parietal and occipito-temporal cortex in response to dynamic visual stimuli using functional near infrared spectroscopy (fNIRS). Methods: Data were collected on a two-channel oximeter that used the Frequency Domain Multi-Distance (FDMD) method. Stimuli consisted of static and dynamic sinusoidal annuli presented at 90% contrast and subtending 15 degrees of arc. The spatial frequency of the sinusoidal gratings was 0.33 cpd and the temporal frequency was 0.625 Hz. The gratings alternated between moving centripetally and centrifugally for each trial. Responses to a grey field of equal mean luminance to both static and moving annuli were collected at the start of each trial for 30 seconds to ensure steady baselines levels of HbO and Hb concentration. In accordance with the local ethical committee guidelines, recordings were made from five normal participants (aged 18-32 years) over scalp locations using a modified version of the 10-20 electrode-placement system that corresponded roughly to primary visual and motion sensitive areas of cortex (01, 02, P03, P04, P07 and P08). Recordings were made in response to the grey screen for 30 seconds at each location prior to the start of each trial. Data were analysed offline applying the kernelized Distributed Lag Model (written in R). kDLM allows simultaneous measurement of the HRF and estimation of the fNIRS response waveform (the response is the convolution of the HRF and the stimulus waveform). Results: As expected, regardless of cortical location, the largest increase in HbO concentration occurred on presentation of the moving sinusoidal annuli after presentation of the grey screen. This coincided with the largest decrease in deoxygenated haemoglobin. HbO concentration fell upon presentation of static sinusoidal grating with a consequent increase in Hb. Applying DLM to the data revealed an HRF having a peak at a lag of 30 seconds, and showed that there was no difference in the responses to the expanding and contracting gratings. Conclusions: This study demonstrated that absolute concentrations of haemoglobin in the visual cortex changed with presentation of a moving stimulus. HbO rose while Hb decreased when moving sinusoidal gratings were stimulating the cortex.
26
88

A new approach to extract stimulus-evoked hemodynamic responses in fNIRS signals using Ensemble Empirical Mode Decomposition
Felix Scholkmann1*, Martin Wolf1 1Biomedical Optics Research Laboratory (BORL), Division of Neonatology, University Hospital Zurich, Frauenklinikstrasse 10, 8091 Zurich, Switzerland
Abstract: Functional near-infrared spectroscopy (fNIRS) enables the measurement of hemodynamic responses (HRs) of the brain evoked by different stimuli. The stimulus-evoked HRs are characterized by a specific change in concentrations of oxyhemoglobin ([O2Hb]), deoxyhemoglobin ([HHb]) and total hemoglobin ([tHb]) which can be non-invasively measured using fNIRS. Usually, stimulus-evoked HRs are extracted from fNIRI signals (i.e. [O2Hb], [HHb] and [tHb]) by band-pass filtering with predefined cutoff-frequencies, and subsequent averaging of all trails. Since the choosing of cutoff-frequencies and type of band-pass filter used has an influence on the detectability and characteristic of the stimulus-evoked HR extracted, the goal was to develop an approach that circumvents the need for the (subjective) choosing of cutoff-frequencies and filter-types. In the present paper we present such an approach that enables to extract the stimulus-evoked HRs using a completely data-driven method. This method comprises two main signal processing steps: (i) decomposing of the specific fNIRS signal (i.e. [O2Hb], [HHb] or [tHb]) into intrinsic mode functions (IMFs) using Ensemble Empirical Mode Decomposition (EEMD) with different added noise levels; (ii) finding all IMFs with the strongest component that is related to the stimulus-evoked HR by using a statistical test; and (iii) performing a block average over all detected HRs in the signal. At the meeting, this new method of stimulus-evoked HR extraction will be explained in detail and application examples will be given. The advantages of the proposed method in comparison to the conventional approach (i.e. completely data-driven analysis of fNIRS signals) will be discussed. In conclusion, we developed a method that improves the detection of stimulus-evoked HR by an automatically data-driven optimization of the band-pass-filtering based on EEMD. Preliminary results show that the extracted stimulus-evoked HR have higher signal-to-noise ratio than those resulting from conventional fNIRS signal processing.
27
89

Development and utilisation of computational models for tomographic fNIRS imaging and co-registration with multi-modal data
Hamid Dehghani1,2, Yuxuan Zhan1, Xue Wu1, Michael Jermyn2, Hamid Ghadyani2, Scott Davis2,
Brian Pogue2, Adam Eggebrecht3 and Joseph Culver3 1. School of Computer Science, University of Birmingham, B15 2TT, UK
2. Thayer School of Engineering, Dartmouth College, Hanover, NH-03755, USA 3. Department of Radiology, Washington University School of Medicine, MO, 63110, USA
Corresponding Author: [email protected] We have developed a set of open-source GUI driven applications (NIRFAST and Nirview [1,2]) that allow seamless generation of numerical models for utilization in model-based tomographic reconstruction in diffuse optical functional near-infrared spectroscopy (fNIRS). Using multi-modality data, such as MRI, it is possible to segment tissue types using manual and semi-automated segmentation techniques, such as simple thresholding or k-means classification followed by a random markov field refinement. Based on the segmented tissue masks it is a seamless operation to generate a multi-layered volumetric finite element model that can be used to simulate light propagation within the geometry using NIRFAST which also additionally contains easy to follow and computationally efficient reconstruction algorithms to allow tomographic imaging, Figure 1. In this paper, we will outline the key features of this set of software and demonstrate its capabilities by providing a quantitative spatial comparison of high-density diffuse optical tomography (HD-DOT) and fMRI cortical mapping [3], Figure 2. The analysis is performed within the visual cortex using matched visual stimulation protocols in a single group of subjects (n=5) during separate HD-DOT and fMRI scanning sessions. To attain the needed voxel-to-voxel co-registration between HD-DOT and fMRI image spaces, we implemented subject-specific head modeling that incorporated MRI anatomy, detailed segmentation, and alignment of source and detector positions. Comparisons of the visual responses found an average localization error between HD-DOT and fMRI of 4.4+/−1 mm, significantly less than the average distance between cortical gyri.
(a) (b) (c) (d) Figure 1. (a) A snapshot of Nirview that allows the segmentation of tissue types, (b) rendered surfaces of different tissues within a human head, (c) volumetric finite element model of the human head generated using NIRFAST and (d) multi-slice viewing capability of volumetric data in NIRFAST.
(a) (b)
Figure 2. (a) Surface rendered model outlining the location of optical sources and detectors on the visual cortex. (b) Quadrant activations for five subjects; all fNIRS quadrants are ∆HbR contrast. Note that for all subjects, there is qualitative agreement between fNIRS and fMRI activations both in location as well as extent. 1. Dehghani et al, “Near Infrared Optical Tomography using NIRFAST: Algorithms for Numerical Model and Image Reconstruction Algorithms”, DOI: 10.1002/cnm.1162 (2008) 2. Jermyn et al, “A User-Enabling Visual Workflow for Near-Infrared Light Transport Modeling in Tissue” Biomedical Optics Topical Meeting 2012 3. Eggebrecht et al, “A quantitative spatial comparison of high-density diffuse optical tomography and fMRI cortical mapping” Journal of Neuroimage j.neuroimage.2012.01.124 (2012)
28
90

Comparison of Denoising Algorithms in fNIRS
M. Dadgostar1, Z. Einalou
1, S. K. Setarehdan
2, H. Y. Keskin-Ergen
3, A. Akin
3
{[email protected], [email protected]}
1. Department Of Biomedical Engineering, Science and Research Branch, Islamic Azad University, Tehran, Iran.
2. Department of Electrical and Computer Engineering, University of Tehran, Iran. 3. Institute of Biomedical Engineering, Bogazici University, Istanbul, Turkey
In this study, we compared the effectiveness of two denoising algorithms: wavelet based and band pass
filtering. fNIRS data were collected by a continuous wave near-infrared spectroscopy device
(NIROXCOPE 301),which was built in the Neuro-Optical Imaging Laboratory of Bogazici University.
This device can sample 16 different channels on the prefrontal cortex using 10 detectors and 4 LEDs [2].
Several types of noise including systemic artifacts like blood pressure oscillations, respiration related,
cardiac pulsation, and motion artifacts are known to be included in the fNIRS signal. Systemic artifacts
generally correspond to frequencies higher than 0.08Hz while neuronal activity related signals in fNIRS
data occupy the frequency range of 0.003-0.08Hz. Data set was obtained from 12 healthy subjects during
performance of a Stroop task [1]. Two techniques were used to denoise [3] the fNIRS signal. Since the
sampling rate of our data is 1.7 Hz the available frequency range is 0 to 850 mHz, We chose a
decomposition tree for the discrete wavelet transform (DWT) with 8 levels. According to the frequency
band of interest (0.003-0.08Hz), the details at levels 1, 2, 3 and the approximation at level 8 must be zero.
As the band pass filter a 6th order butterworth filter was implemented in MATLAB
® via the use of the
built-in “butter” command with the pass band as (0.003-0.08Hz). We used signal to noise ratio (SNR) and
normalized mean-squared error (NMSE) as criteria to evaluate the performance of these two methods [3].
We found that the SNR is higher and NMSE is lower in data denoised by wavelet method in comparison
to band pass filtered data. The results of Daubechies 5 (db5) wavelet are shown in Table 1. Thus, band
pass filtering should be avoided since it might compromise the phase response within the pass band.
Wavelet algorithm seems to be a promising tool to eliminate the artifacts in fNIRS data while preserving
the temporal dynamics of the hemodynamic response. Furthermore, DWT denoising seems not to favor
any channels as observed from the coefficient of variation (COV) that is much lower for DWT. Hence
DWT based denoising should be adapted as a standard preprocessing step for fNIRS data analysis.
Table1: The comparison of results between DWT and band pass filter
Method
SNR NMSE
Method
SNR NMSE
Band Pass
Filter DWT
Band
Pass
Filter
DWT
Band
Pass
Filter
DWT
Band
Pass
Filter
DWT
Ch
an
nels
Ch.01 -2.21 4.42 0.11 -4.86
Ch
an
nels
Ch.09 -0.50 8.08 -0.48 -6.80
Ch.02 -4.05 1.53 -0.33 -3.25 Ch.10 -1.54 5.89 -0.33 -5.48
Ch.03 -2.00 5.34 0.41 -4.83 Ch.11 -1.53 5.74 0.02 -5.43
Ch.04 -1.34 5.85 -0.23 -5.51 Ch.12 -1.32 5.42 -0.27 -5.48
Ch.05 -1.58 5.79 0.10 -5.23 Ch.13 -2.66 3.98 0.47 -4.43
Ch.06 -0.68 7.01 -0.51 -6.28 Ch.14 -1.75 5.76 0.11 -5.75
Ch.07 -0.43 8.22 -0.57 -6.67 Ch.15 -1.24 5.71 -0.24 -5.07
Ch.08 -0.36 7.74 -0.67 -6.24 Ch.16 -0.99 6.39 -0.47 -5.93
Mean of the
All Channels
-1.51 ±0.94
COV= 0.62
5.80 ±1.64
COV=0.28
-0.18 ±0.35
COV=1.94
-5.45 ±0.89
COV=0.16
References:
[1] M. L. Schroeter S.Zysset, Th.Kupka, F.Kruggel,and D. Yves von Cramon, “Near-Infrared Spectroscopy Can Detect Brain Activity During
a Color–Word Matching StroopTask in an Event-Related Design”,Human Brain Mapping, vol.17, pp.61–71, 2002.
[2] S. Aydore, M. KıvancMıhcak, K. Ciftci, and A. Akın, “On Temporal Connectivity of PFC ViaGauss–Markov Modeling of fNIRS
Signals”, IEEE TRANSACTIONS ON BIOMEDICAL ENGINEERING, VOL. 57, NO. 3, pp. 761-768, 2010.
[3]B.Molavi and G.Dumont, “Wavelet-based motion artifact removal for functional near-infrared spectroscopy”, Physiol. Meas.
Vol.33.pp.259–270 , 2012.
29
91

Wavelet Cross Correlation for Identification of Interference between Systemic Physiological
Processes and Brain Haemodynamics measured by Time-Domain fNIRS during Frontal Lobe
Activation.
N. Yua*, A. Jelzowb, E. Kirilinac, A. Heinec, M. Niessingc, H. Wabnitzb, R. Macdonaldb, R. Brühlb, B.
Ittermannb, A.M. Jacobsc and I. Tachtsidisa
aUniversity College London, Dept. Med. Physics and Bioengineering, London UK;bPhysikalisch-Technische Bundesanstalt (PTB), Berlin, Germany; cFree Univ. Berlin, Germany*[email protected]
Background: fNIRS is widely used to monitor brain activation, however the measured haemodynamic
signals might not reflect the true cortical activation due to systemic signal fluctuations such as mean
blood pressure (MBP), heart rate (HR) and skin blood flow (SBF) that can occur during the activation
paradigm leading to false positive [1, 2]. In this study we utilise wavelet cross correlation (WCC)
techniques to investigate the interrelationships between fNIRS and systemic signals during frontal lobe
activation. Method: fNIRS concentration changes in oxy- and deoxy-haemoglobin (HbO, HbR) for
four channels covering the frontal lobe and systemic signals (MBP, HR, SBF) were measured
synchronously on 15 healthy subjects during continuous performance tasks. Changes in HbO and HbR
were measured using a time-resolved system (PTB) [3] and analysing (i) the integral m0, (ii) the mean
time of flight of photons m1 and (iii) the variance V of distributions of time of flight of photons [3, 4].
Results: Subjects showed significant changes in systemic variables that correlated with the
haemodynamic response and the activation. WCC demonstrated a large individual variability (see
figure); however group analysis revealed that (i) the strongest WCC was observed in the Mayer wave
band; (ii) the highest WCC was between HbO and MBP; (iii) there was a statistically significant
difference in WCC between the channels over the left (ch. 1, 2) and the right (ch. 3, 4) frontal lobe;
and (iv) the lowest WCC was observed in the fNIRS haemodynamic changes as estimated using the
variance signal. Discussion: We demonstrated using WCC that systemic changes correlate with the
fNIRS haemodynamic changes during brain activation and that this will be different between subjects,
frequency bands, channel location and fNIRS signals obtained from m0, m1, V.
References:[1] Tachtsidis, I. et al., (2009). Adv. in Exp. Med. and Biol., pp. 307-314.
[2] Kirilina, E., et al., (2012). Neuroimage 61(1), 70-81.
[3] Wabnitz, H. et al, (2005). Proc. SPIE 5859, 58590H.
[4] Jelzow, A., (2011). Proc. SPIE 8088, 808803.
Note: R wave band: 2 < scale <= 7 (0.15Hz < f < 0.4Hz); M wave band: 7 < scale <= 17 (0.06Hz <
f < 0.15Hz); Activation band: 17< scale<= 45 (0.022Hz < f < 0.06Hz).
Fig. WCC of HbO
(m0) vs. MBP for
the same forehead
position in two
representative
subjects. The colour
shows the
correlation (0 to 1).
30
92

Influence of static and dynamic physiologicalparameters on the measurement of neural
activation with functional near-infraredspectroscopy (fNIRS)
F. B. Haeussinger1,*, S. Heinzel1, T. Dresler1, A.-C. Ehlis1, A. J. Fallgatter1
1Department of Psychiatry and Psychotherapy, University of Tuebingen, Tuebingen, Germany*[email protected]
Abstract
We have conducted a simulation study in which we found a strong connection between fNIRSsensitivity and scalp-cortex distance (SCD). By simulating NIR light scattering and absorptionin human head tissue models it could be shown that a high SCD leads to a decreased volumeof light absorbing gray matter and therefore the sensitivity of fNIRS to measure hemodynamicchanges in the cortex is decreased, while it is increased in the scalp. The head circumference,an easily assessable parameter, was positively correlated with SCD. [1]
We used the simulated volumes of light absorbing scalp (Vscalp) and gray brain matter (Vgray)to examine the feasibility of fNIRS to measure low frequency oscillations usually observed withinresting state paradigms. We found the signal-to-noise ratio of fNIRS within a frequency windowof [0.01, 0.02] Hz to be significantly correlated with Vscalp and within [0.02, 0.05] to be sig-nificantly correlated with Vgray. These findings suggest that fNIRS is feasible for resting stateparadigms, but also that not the whole range of the low frequency window is accessible.
We also conducted a simultaneous fNIRS-fMRI study in which participants performed a work-ing memory paradigm. We found the SCD to decrease the amplitude of hemodynamic responsesto stimuli as measured by fNIRS. Beyond that, we observed a different impact of extracranialhemodynamics (as measured by fMRI) on fNIRS-signals. The signal that maps concentra-tion changes of oxygenated hemoglobin (oxy-signal), was severely impacted by skin blood flow,whearas the deoxy-signal was hardly affected.
By conducting a simultaneous fNIRS-fMRI session during an inter-temporal choice paradigm,we found an interesting correlation between brain activation as measured by fMRI and a per-sonality trait of the participating subjects. In contrast, this correlation could not be found withfNIRS. The influence of task-evoked extracranial signals impairing especially the oxy-signal mayhave been the limiting factor.
References
[1] F. B. Haeussinger, S. Heinzel, T. Hahn, M. Schecklmann, A.-C. Ehlis, A. J. Fallgatter,Simulation of near-infrared light absorption considering individual head and prefrontal cortexanatomy: Implications for optical neuroimaging, PLoS ONE 6 (10).
1
31
93

Contamination of NIRS functional connectivity maps by superficial vasculature symmetries
Juliette Selb1, Sabrina Brigadoi2, Sinem B. Erdogan3, Robert J. Cooper4, Louis Gagnon1, Meryem A. Yucel1, and David A. Boas1
1 [email protected], Optics Division, Martinos Center for Biomedical Imaging, Massachusetts General
Hospital, Charlestown, MA 02129, USA – 2 Dept. Developmental Psychology, University of Padova, Italy – 3Bogazici University, Biomed. Engineering Institute, Istanbul, Turkey – 4 Dept. Medical Physics and
Bioengineering, University College London, London, U.K.
Resting-state functional connectivity is a relatively novel approach to study the brain functional networks, which relies on cortical spontaneous activity at rest rather than on activation tasks. The work originated in the fMRI BOLD community [1], but a growing number of studies over the past few years have shown NIRS imaging of functional connectivity [2,3]. A major difficulty of functional connectivity studies is the contamination by physiological signals not arising from neuronal origin [4]. The issue may be even stronger with NIRS because its surface measurements are highly sensitive to extra-cerebral phy-siological fluctuations. The use of short source-detector (SD) channels has proven a useful way to regress out superficial contamination in functional NIRS. Here we try to assess the contribution of superficial signals in NIRS functional connectivity maps by looking at short and long SD correlation patterns.
We developed a large symmetrical probe of 15 sources (690 and 830 nm) and 28 detectors that covers frontal, temporal and parietal regions, and that consists of both short (8mm) and long (30mm) SD channels (Fig.1a). We recorded resting state data for 20 minutes continuously on one volunteer. Raw intensities in each channel were converted into relative changes of oxy-(HbO), deoxy-(HbR) and total (HbT) hemoglobin concentrations using the modified Beer-Lambert law. Hemoglobin time traces were then band-pass filtered between 0.009 and 0.08 Hz. To minimize the effect of systemic effects, we regressed out from each short (or long) channel a common-mode signal obtained by averaging all short (or long) SD signals. We then created correlation maps of long channels only or short channels only, using the seed approach: the cross-correlation between one seed short channel and the rest of the short channels (fig1b), and one seed long channel and the rest of the long channels (fig1c) were computed. The resulting cross-correlations are mapped on the probe geometry using a back-projection approach.
Figure 1 shows the correlation maps for HbT obtained with the short only and long only SDs with a nearby seed. The correlation maps are similar to the functional connectivity maps previously published in the NIRS literature. Interestingly, the short SD correlation map strongly resembles the maps for long SDs. In particular, homologous short channels are highly correlated, even though correlation within one hemisphere decreases with distance. We hypothesize that these strong correlations between homologous short channels result from symmetrical skin vasculature. This result suggests that NIRS-derived “functional connectivity” maps at least partly reflect superficial physiology. It further raises the issue of how to remove this contribution from the long SD correlation maps.
We will present results on more subjects and discuss the contamination of the functional connectivity maps by superficial systemic physiology, as well as possible approaches to detangle them.
[1] Biswal et al., Magn. Reson. Med. 34, 537–5 (1995); [2] White et al., NeuroImage 47, 148-156 (2009) [3] Mesquita et al., Biomed. Opt. Exp. 1(1) 324-336 (2010) ; [4] Birn, NeuroImage 49, 401-414 (2012).
Figure 1. (a) Probe geometry. (b) Correlation maps for short and (c) long SDs. The seed channel is indicated by a circle.
Source Detector
(a) (b) (c)
32
94

Kernel distributed lag model applied to fNIRS recordings from visual cortex William A. Simpson1 & Uma Shahani2 1School of Psychology, University of Plymouth [email protected] 2Vision Sciences, Glasgow Caledonian University Purpose. A standard approach for analysing fMRI time series is to convolve the stimulus on-off waveform with an assumed haemodynamic response function (HRF), and then to perform a linear regression of the observed BOLD signal against the convolved stimulus. The same approach could be used for fNIRS, but it has been shown that the functions for HbO and HbR can have peaks at different times, and that the functions vary between observers. Ideally, besides the size and significance of the response to the stimulus, we would like to measure the HRF. We used the kernel distributed lag model (kDLM) to do precisely that. Using the kDLM permitted estimates of the HRF using a few components, smoothing the resulting HRF estimate in the process, and gave estimates of the strength of the relationship between stimulus and response. Methods. Flickering bullseye gratings were presented in an on-off paradigm. The optode was placed over O1, and an ISS Oxiplex measured HbO and HbR responses. Almon (1965) proposed the original polynomial distributed lag model. We generalised this method to use kernels other than polynomials, including splines and discrete cosine transform components. The method was implemented in the statistical scripting language R. Results. The distributed lag model using several kernels was applied to the data, yielding estimates of the kernel components and the statistical significance of each, and as well giving measures of the strength and significance of the relation between stimulus and response. Estimated HRFs were in line with those in the literature, but varied according to condition, subject, and chromophore, as was expected. Conclusions. The kernel distributed lag model is a simple and effective way to simultaneously measure the HRF and the strength of association between the stimulus and fNIRS responses.
33
95

Analysis of Task-Dependent Scalp Signal Contribution in fNIRS by Use of Reciprocal Information from fMRI
Sinem Burcu Erdogan*, Turan Deniz Nevsehirli, Yasemin Keskin-Ergen, Ali Bayram, Ata Akin Institute of Biomedical Engineering, Bogazici University, Kandilli, 34684, Istanbul, TURKEY
Uskudar University, İstanbul, TURKEY {[email protected]*, [email protected]}
Introduction: We aim to explore the contribution of the scalp layer signal to surface fNIRS measurements via the use of scalp and gray matter fMRI measurements. To this end we introduce an optically weighted spatial average of the fMRI BOLD signal for characterizing the scalp signal contribution to fNIRS measurements. We present two studies where spatially weighted BOLD signal from the superficial scalp tissue and gray matter (GM) tissues are compared for two different tasks to test the task dependence of this systemic contribution that is known to modulate the hemodynamic brain response.
Method: fMRI data were collected from 20 healthy subjects during 2 different protocols involving a breath-hold (BH) and a mental arithmetic (MA) task. Given the anatomical structure of the head from MRI, photon-migration theory and Monte Carlo techniques are used to calculate the Green's function describing the optical sensitivity profile to absorption changes in the underlying structures of the head. The overlap of this optical sensitivity profile with the MR images provides a means of predicting the relative contribution of each voxel to the surface fNIRS signal. Hence, the fMRI correlate of an fNIRS signal for a source-detector pair can be calculated as a “summed” signal as follows: 𝑦! 𝑡 =𝐴!𝑠!(𝑡)! + 𝐴!"𝑔!(𝑡)! where 𝑦!(𝑡) represents the fMRI derived fNIRS signal with contributions
from the “j” scalp voxels’ fMRI BOLD signals (𝑠!(𝑡)) weighted by a fixed 𝐴! value (0.92) and “k” GM voxels’ fMRI BOLD signals (𝑔!(𝑡)) weighted by a fixed 𝐴!" value (0.08). The raw fMRI signals were first preprocessed (realignment, slice timing correction, co-registration of the segmented anatomical image to the mean functional image) using SPM8 software and then subjected to a summation operation. Data are block averaged for four consecutive BH and MA sessions.
Results and Discussion: Average of 16 GM, 16 scalp and 16 “summed” signals are shown for two different tasks (BH and MA). GM signal change is larger (at least 10 folds) for the BH task compared to MA task as expected while scalp fMRI only has about two folds of increase in favor of BH task.
Fig1. Block mean of optically weighted sum, Gray Matter and Scalp data during i) BH and ii) MA task. X-axis is the scan number with 3 seconds of interval between each scan.
Correlations between the summed, scalp and GM signals elucidate the fact that no matter what the task is, correlation between scalp and summed signal is about 80%. Lower correlation between scalp and GM signal observed during MA task (R =0.33, p<0.05) in comparison to BH task (R=0.70, p<0.05), suggests that systemic contribution to the GM signal during MA task is relatively low compared to the contribution during BH task. This finding supports the hypothesis that systemic fluctuations have a task dependent influence on the hemodynamic response measured from GM.
34
96

Using Variable Hemodynamic Response Functions to Optimize Differential Temporal Information of Hemodynamics
in Functional Near-Infrared Spectroscopy
Toshifumi Sanoa*, Daisuke Tsuzukia, Ippeita Dana, Haruka Danb, Hidenori Yokotab, Keiji Ogurob, Eiju Watanabeb
a) Functional Brain Science Laboratory, Jichi Medical University. 3311-1, Yakushiji, Shimotsuke, Tochigi 329-0498, Japan. b) Department of Neurosurgery, Jichi Medical University. 3311-1, Yakushiji, Shimotsuke, Tochigi 329-0498, Japan. *) [email protected] Abstract: It has been nearly twenty years since functional near-infrared spectroscopy (fNIRS) was first applied to assessing human brain functions. It has now become widely accepted as a common functional imaging modality with more than 100 publications of fNIRS-related scientific literature annually. However, universal analytical methods for fNIRS data have yet to be established. Although not frequently mentioned, temporal analysis of fNIRS data also poses a technical challenge: how oxygenated and deoxygenated hemoglobin (Hb) signals should be treated. With its analogy to fMRI, a general linear model (GLM) with regression to a canonical hemodynamic response function (HRF) has often been used. However, the Hb parameters do not necessarily follow the same behavior as the BOLD signal: rather, we often encounter different temporal profiles for the two Hb signals. Here we introduce adaptive methods to find the optimal HRF for temporal analysis of fNIRS data. In this study, application of the GLM with regression to temporally variable HRFs was applied to the fNIRS activation data during two different linguistic tasks: a Naming Task (NMT) and a Verbal Fluency Task (VFT). A variable HRF having the highest averaged t value was adopted as the most suitable for activation mapping. The optimal HRF revealed different temporal structures for oxy-Hb and deoxy-Hb signals, with the latter having substantial temporal delay for each linguistic task’s data. In addition, optimized HRF for VFT data reflected increased diachronic load. However, when the temporally optimized HRF was used, the variable HRF parameters yielded reasonably compatible activation patterns including activation in classical language-related areas of the left hemisphere. These results suggest the potential use of the GLM with regression to an adaptive HRF to fully utilize temporal information of both Hb parameters.
35
97

Consistency of Functional Connectivity Maps
Mehmet Ufuk Dalmış1, Yasemin Keskin-Ergen 1, Haluk Bingöl 2, Ata Akın1 1Institute of Biomedical Engineering; 2Department of Computer Engineering, Bogazici University, Istanbul, Turkey.
Network analysis and study of statistical relations between activations of different brain regions has gained a considerable popularity in the last years. Functional connectivity is the term used to refer to statistical relations between activations of different regions in brain. Mostly weighted functional connectivity maps (graphs) are the initial results of functional connectivity studies. In this study, fNIRS signals are measured from the prefrontal cortex (PFC) region of 12 healthy subjects during a Stroop interference task via a 16 channel CW-fNIRS device (ARGES Cerebro, Hemosoft Inc., Ankara Turkey). This task consists of three different stimulus conditions: Neutral (N), Congruent (C) and Incongruent (IC). Mutual Information1 (MI) between each channel is calculated for each type of stimulus to obtain the functional connectivity maps. A metric of “consistency” based on a 2D cross correlation (Equation 1) value is defined to indicate average similarity of different functional connectivity maps computed for a subject for the three conditions. It is found that average intra-subject consistency show high values (0.70 ± 0.11) while average inter-subject consistency is low (0.32 ± 0.16). This implies that the functional connectivity maps computed for subjects are characteristic per subject. In other words, each subject has their own connectivity pattern in PFC. High intra-subject consistency suggests that a fixed/stable PFC connectivity pattern exists for a Stroop task, which is substantially preserved throughout the recording session. The low inter-subject similarity (correlation) among the maps might be due to a mere different wiring patterns among subjects or systemic error since there is a lack of co-registration algorithm of probe placement on each subject.
References
1. Dongli Zhou, Wesley K. Thompson, Greg Siegle, MATLAB toolbox for functional connectivity, NeuroImage, Volume 47, Issue 4, 1 October 2009, Pages 1590-‐1607, ISSN 1053-‐8119, 10.1016/j.neuroimage.2009.05.089.
Figure 1. Functional connectivity maps of a subject who has 0.71 consistency (The maps of 16X16 channels correspond to Neutral, Congruent and Incongruent stimulus conditions respectively).
Equation 1. 2D Correlation of 2 rectangular images (FC maps). Diagonal and symmetric lower triangular entries are replaced with mean value of the upper triangle, in order to eliminate correlation bias introduced by them.
36
98

Title: Enhancement of Hemodynamic Contrast in the Cancerous Breast by Carbogen Inspiration Authors: Rabah Al abdi (SUNY Downstate Medical Center, Brooklyn, NY); Harry L. Graber (SUNY Downstate Medical Center); Christoph H. Schmitz (NIRx Medizintechnik GmbH, Berlin, [email protected]); Randall L. Barbour (SUNY Downstate Medical Center)
Hallmarks of the tumor phenotype include increased stiffness [1], enhanced angiogenesis with sluggish perfusion [2], increased vascular leakiness leading to increased interstitial pressures [3], and increased metabolic demand [2]. Separately, it is known that the vascular autoregulation mechanism normally achieves a tight coupling between the vascular supply and prevailing metabolic demand, but that the fidelity of vascular autoregulation may be attenuated in tumor tissue as a consequence of alterations in the vascular endothelium and surrounding vascular smooth muscle [2]. One consequence of this is that many tumor types operate on the brink of hypoxemia, suggesting that the otherwise enhanced supply actually is limited, perhaps as a consequence of disturbances in hydrostatic pressures caused by vascular leakiness and changes to the interstitium scaffolding [1].
Based on the preceding considerations, we hypothesized that manipulations of the oxygen supply-demand balance may produce responses that differ markedly between the tumor and surrounding healthy tissue. One approach that has recently been explored is the inspiration of carbogen [4]. While the carbogen response is tissue-specific, the most commonly seen response is vasodilation as a consequence of the effects of elevated CO2 (elevated oxygen levels per se typically cause vasoconstriction) [4]. Here we explore the response of the healthy and tumor-bearing breast to a carbogen mixture consisting of 98% O2 and 2% CO2, as a basis for producing additional modulation on the oxygen supply-demand balance.
Simultaneous bilateral breast imaging was performed using an imaging system recently described by Al abdi et al. [5], which provides for high optode-density dynamic fNIRS imaging, at rest and in response to physiological manipulations. Collection of measurements from both breasts simultaneously allows for subsequent use of paired difference analyses that cannot be considered using other fNIRS breast imaging systems. After giving informed consent and providing a brief medical history, research participants were seated and the sensing heads were adjusted to make good contact with both breasts. Following a five-minute baseline scan while room air was breathed, a facemask was applied and subjects breathed the carbogen mixture for an additional five minutes. Optical data were analyzed offline: application of a low-pass filter with a 0.2-Hz cutoff frequency was followed by use of the Normalized Difference Method to reconstruct tissue oxygen saturation (HbSat) and blood volume (HbT) images [6].
Imaging results obtained from 48 subjects (16 breast cancer, 18 benign pathology, 14 healthy control) are consistent with the hypothesis that carbogen and room air have different impact on microvasculature in healthy and tumor tissue, comparable to a previously reported effect seen when comparing pure oxygen and carbogen [4]. In particular, we have found that tumor tissue shows a larger drop in HbT and concomitant rise in HbSat in comparison to healthy tissue. Also noteworthy is the finding that image contrast is substantially improved by transforming the (HbSat,HbT) image values to a measure of the statistical extremeness (i.e., the Mahalanobis distance [7]) for each pixel. Furthermore, the preceding effect is enhanced by referencing the image-pixel data of one breast to the distribution of image values for the contralateral breast. This is a concrete demonstration of the above-mentioned utility of the simultaneous dual-breast measurement approach. Thus we have demonstrated that controlled manipulation of the tissue oxygen supply-demand balance can enhance the detectability of breast cancer by exploiting known physiological abnormalities of tumor tissue. 1 S. Kumar and V. M. Weaver, Cancer Metastasis Rev. 28, 113-127 (2009). 2 P. Vaupel et al., Cancer Res. 49, 6449-6465 (1989). 3 R.E. Hendrick, Breast MRI: Fundamentals and Technical Aspects (Springer, 2008), Chap. 8. 4 C. M. Carpenter et al., J. Biomedical Optics 15, 036026 (2010). 5 R. Al abdi et al., J. Optical Society of America A 28, 2473-2493 (2011). 6 Y. Pei et al., Applied Optics 40, 5755-5769 (2001). 7 R. De Measschalck et al., Chemometrics and Intelligent Laboratory Systems 50, 1-18 (2000).
37
99

Region-Specific Cortico-Cortical Synchronization and Desynchronization of Hemodynamic Changes
during Auditory Processing in Young Infants
Makiko Imai, Hama Watanabe, Gentaro Taga (Graduate School of Education, University of Tokyo. Email: [email protected])
Several near-infrared spectroscopy (NIRS) studies on cortical hemodynamic responses to
auditory stimuli in sleeping infants have shown that averaged signals over trials exhibit significant
responses not only in the auditory area but also in diverse cortical regions. In contrast, studies focusing
on the sleeping state of young infants have shown spontaneous fluctuations of hemodynamic changes
throughout the cortical regions even when no stimuli were presented. However, little is known about
the interactions between stimulus-induced responses and spontaneous activities.
In the current study, we measured oxy-Hb signals of 19 infants by using a 94-channel NIRS
instrument. The measurements were performed while the infants were asleep. We used a 1-s buzzer
sound as the stimulus, and it was presented 20 times. The measured signals were band-pass filtered
(0.05 – 0.1 Hz). First, the filtered time course signals were split into blocks of 25 s. By averaging the
changes in the oxy-Hb signals over the data blocks for all infants, we obtained hemodynamic
responses for each measurement channel. Second, we decomposed the hemodynamic signals into
instantaneous amplitudes and phases, and assessed phase synchronizations among cortical regions to
examine the influence of the stimulus on phase synchronization properties.
The averaged oxy-Hb signals were in agreement with those reported in previous studies that
showed increases in oxy-Hb signals in infants’ brain in response to auditory stimuli over broad regions,
including the frontal, temporal, and occipital cortices. On decomposing the signals into amplitude and
phase, we found that the amplitude of the signals increased in almost all regions, whereas phase
synchronization index increased only in some parts of the temporal and occipital regions. These results
suggest that the major determinant for the response to the auditory stimulus was an increase in the
amplitude of signals in broad regions of the infants’ cortex. Furthermore, auditory stimulus temporally
induced synchronization among diverse regions and desynchronization within frontal regions. This
result indicates that external inputs modify the resting-state cortical network for generating
spontaneous activity.
38
100

The importance of motion artifacts correction in cognitive studies
Sabrina Brigadoi1*, Robert J Cooper2, Juliette Selb3, Louis Gagnon3, David A. Boas3
1 Department of Developmental Psychology, University of Padova, Italy 2 Dept. Medical Physics and Bioengineering, University College London, London, U.K.
3 Optics Division, Martinos Center for Biomedical Imaging, Massachusetts General Hospital, Charlestown, MA 02129, USA
Motion artifacts are a significant source of noise in many fNIRS measurements, particularly when infants or patients with particular diseases (for example stroke) are under examination. Motion artifacts are also common when healthy subjects are the participants of the experiment. Motion artifacts can have different shapes and duration and their presence can compromise the quality of the signal acquired. During cognitive experiments, moreover, they can compromise the hemodynamic response estimation, leading to incorrect results. One solution would be to disregard the data around the motion artifact; however, in situation where the number of trials available is already low, its further reduction could be problematic. Many methods for motion artifact correction have been proposed in the literature during recent years, such as Kalman filtering [1], Wavelet analysis [2], spline interpolation [3], and Correlation Based Signal Improvement (CBSI) [4] but also more general methods have been used for the purpose, for example principal component analysis (PCA) [5]. Cooper et al. [6] have recently validated these motion artifact correction methods on synthetic data generated by adding a simulated hemodynamic response to real resting state NIRS data.
Here, we have applied a number of motion correction algorithms proposed in the literature to real NIRS data acquired during a cognitive study. The paradigm was an event-related change-detection task, where the participants read aloud the colour of words presented on a screen. The movement of the jaws during speech resulted in motion artifacts which were temporally correlated with the stimulation. In order to reduce motion artifacts, we applied to this dataset PCA, spline interpolation, a combined method composed of PCA followed by the spline interpolation and the CBSI algorithm. We compared the results obtained with these four methods with that obtained both without any motion correction and that obtained by rejecting all the trials where a motion artifact was found.
We will address the utility of each method and discuss whether it is generally applicable or requires a particular type of motion artifact in the data. We will quantify the standard deviation between hemodynamic responses in the computation of the group average mean hemodynamic response and show its reduction in the data where motion artifacts were corrected. We will compute parameters related to the hemodynamic response curve (e.g. AUC (area under the curve)) and show how the hemodynamic response estimated from the motion corrected data results more physiological compared to the one obtained from the data without motion correction. [1] Izzetoglu M, Chitrapu P, Bunce S, Onaral B (2010). Motion artifact cancellation in NIR
spectroscopy using discrete Kalman filtering. BioMedical Engineering OnLine, 9:16 [2] Molavi B, Dumont GA (2012). Wavelet-based motion artifact removal for functional near-infrared
spectroscopy. Physiol Meas, 33:259-270 [3] Scholkmann F, Spichtig S, Muehlemann T, Wolf M (2010). How to detect and reduce movement
artifacts in near-infrared imaging using moving standard deviation and spline interpolation. Physiol Meas, 31:649-662
[4] Cui X, Bray S, Reiss AL (2010). Functional near-infrared spectroscopy (NIRS) signal improvement based on negative correlation between oxygenated and deoxygenated hemoglobin dynamics. NeuroImage, 49(4):3039-46
[5] Zhang Y, Brooks DH, Franceschini MA, Boas DA (2005). Eigenvector-based spatial filtering for reduction of physiological interference in diffuse optical imaging. Journal of Biomedical Optics, 10(1):011014
[6] Cooper RJ, Selb J, Gagnon L, Boas DA (2012). A systematic comparison of motion artifact correction techniques for functional near-infrared spectroscopy. Submitted.
39
101

Model enhanced interpretation of NIRS signals in brain injured patients.
D. Hightona, J. Panovska-Griffithsb, C.E. Elwellb and M. Smitha,b
a - Neurocritical Care Unit, University College Hospitals, London WC1N 3BG, UK b - Medical Physics & Bioengineering, University College London, WC1E 6BT, UK
email : [email protected]
Cerebral hypoxia-ischaemia following acute brain injury is a key concern and focus for therapy in critical care. However prevention, prediction and intervention is problematic. The underlying pathophysiology that results in secondary injury is complex and neuromonitoring only measures indirect surrogates of the processes of interest. Near infrared spectroscopy (NIRS) is a non-invasive optical technique that measures surrogates of cerebral haemodynamics and metabolism and might be a valuable tool if the complexity of the physiology encoded within NIRS signals can be decoded. Previously we have applied a mathematical model [1] to aid interpretation of NIRS signals during oxygenation changes in healthy volunteers and to characterise cerebral autoregulation in brain injured patients. In this work we present a mathematical model of cerebral biomechanics, haemodynamics, oxygenation and metabolism focused on the analysis of NIRS in brain injured patients. Systemic monitoring (blood pressure, carbon dioxide, arterial oxygenation) serve as model inputs producing simulated outputs for a range of neuromonitoring: NIRS, intracranial pressure (ICP) and transcranial Doppler flow velocity in the middle cerebral artery (Vmca). Model parameters reflect pathophysiology and are modified to reproduce measured signals - hence predicting key physiological abnormalities that explain the observed data. Changes in cerebral autoregulation of blood flow, cerebral compliance and metabolic demand are frequently associated with cerebral hypoxia-ischaemia and are represented by model parameters. Figure 1 demonstrates model based interpretation of NIRS ICP and Vmca in a brain injured patient, predicting impaired autoregulation, reduced compliance and reduced metabolic demand. Further clinical examples will be presented which demonstrate a range of complex interactions between these mechanisms which are manifest in NIRS and other neuromonitoring signals. Patient specific physiological modelling has the potential to predict the key biomechanical, haemodynamic and metabolic changes following brain injury in individual patients, and might be used inform individualised treatment strategies.
Figure 1. Model based interpretation of NIRS (oxy-haemoglobin, deoxy-haemoglobin), ICP and Vmca in a brain injured patient. Cyclic slow wave activity is seen driven by mean arterial pressure changes. Model parameters suggest pathophysiological changes are required to explain the NIRS, ICP and Vmca signals: reduced autoregulation (k_aut, 7% basal), impaired cerebral compliance (elastancek_E, 355% basal) and reduced cerebral metabolic demand (u , 17% basal ). Refrences: [1] Banaji, M. et al (2008). PLoS comp biol, 4(11), e1000212.
2.390
2.395
2.400
2.405
2.410
2.415
80
90
100
110
120
130
!4
!2
0
2
4
!1.0
0.0
1.0
0 200 400 600 800 1000 1200 1400 1600 1800
10
15
20
25
30
52
56
60
64
68
0 200 400 600 800 1000 1200 1400 1600 1800
Mea
n ar
teria
l pre
ssur
em
mH
g
Oxy
-hae
mog
lobi
n!µ
mol
/LD
eoxy
-hae
mog
lobi
n!µ
mol
/L
Intr
acra
nial
Pre
ssur
em
mH
g
Vmca
c
m/s
ec
Measured signals Simulated output
CM
RO2
ml/
100g
/min
Time (sec)Time (sec)0 200 400 600 800 1000 1200 1400 1600 1800
Time (sec)
40
102

GLM based detection of fast optical signals in visual cortex Antonio Maria Chiarelli, Assunta Di Vacri, Gian Luca Romani, Arcangelo Merla Infrared Imaging Lab, ITAB – Institute for Advanced Biomedical Technologies, Foundation University G. d’Annunzio, Chieti, Italy and Department of Neurosciences and Imaging, University G. d’Annunzio, Chieti-Pescara, Italy [email protected] Fast optical signals (FOS) rely on the hypothesis that electrical activity of single neuron is accompanied by synchronous (at least on the hundred milliseconds scale) changes of NIR light scattering properties of activated neurons. By capitalizing on these changes, Gratton et al. (1995) proposed that fast optical signals - also called Event Related Optical Signals - could localize in vivo brain activity with a temporal resolution of 20 ms or less. During the last 15 years, there have been several attempts to record the evoked FOS noninvasively through the scalp and skull in human subjects (see Gratton, 2010, for a review). The results of these studies, however, have been largely controversial because of the very low SNR, which imposes large number of repeated trials for evaluating grand average responses (Steinbrink, 2005). We propose the use of a GLM approach. Since there is no previously defined Impulse Response Function (IRF) for FOS, we tested the reliability of the method by adopting an on-off square IRF, with a variable onset delay after the stimulus delivery. We first ran simulated experiments to evaluate the reliability of applying GLM to FOS. Then, we applied GLM to both FOS and standard hemoglobin signals (HS) obtained during a hemi-field visual stimulation, both kinds of signals being recorded by means of a frequency-domain optical system. Through the analysis of the simulated data, we demonstrated the feasibility of applying GLM analysis to FOS in order to properly recover the expected cortical activations. In particular, the method performed better than the grand average event-related approach for measurements characterized by typical SNR for in-vivo phase measurements and as lower as 0.07 For SNR = 0.05, GLM correlation value with the simulated activation channel scheme was as higher as 0.9. Ten healthy volunteers (age: 25-40 years, mean: 26) were enrolled in the in vivo experiments. The stimulus was a canonical reversing black and white checkerboard. We used a commercial frequency-domain 20-channels oximeter. Our experiments showed that the contralateral activation of visual cortex, easily proved by using GLM method to HS, could be also highlighted by applying GLM to FOS, pending the assumption of rectangular IRF, lasting 30 ms with 80- 100 ms delay with respect to the stimulus onset. Our FOS values reported time delays of optical signal quantitatively in agreement with previous studies on occipital cortex during visual stimulation for both order of magnitude (i.e., few picoseconds) and time delay signal peak after visual stimulation (Gratton, 2010). Application of GLM to FOS seemed to perform better than other method so far used for processing FOS, especially grand average approaches and frequency domain analysis. The method appeared reliable even in the disadvantageous conditions of low SNR, still being capable of identifying visual activation in single subject analysis. The results from our study seem to confirm that optical local properties, and particularly diffusion properties through the scattering coefficient, present variations on a temporal scale of a few tens of milliseconds, likely associated with neural activity. References -Gratton G, Corballis P.M., Cho E. Fabiani M, Hood D.C. Shades of gray matter: Noninvasive optical images of human brain responses during visual stimulation. Psychophysiology. 1995. Volume 32, Issue 5, pages 505-509. -Gratton G. and Fabiani M. Fast optical imaging of human brain function. Front Hum Neurosci. 2010 Jun 23;4:52. -Steinbrink J., Kempf. F.C.,Villringer A.,Obrig H., The fast optical signal; robust or elusive when non-invasively measured in the human adult?, Neuroimage. 2005 Jul 15;26(4):996-1008.
41
103

Continuous correction of differential path length factor in near-infrared spectroscopy Tanveer Talukdar* and Solomon G. Diamond Thayer School of Engineering at Dartmouth, Hanover, New Hampshire, USA *[email protected] In continuous wave near-infrared spectroscopy (CW-NIRS), changes in the concentration of oxyhemoglobin (∆𝐻𝑏𝑂) and deoxyhemoglobin (∆𝐻𝑏𝑅) can be calculated by solving the modified Beer-Lambert Law (MBLL) (Cope et al. 1988). Application of MBLL in CW-NIRS requires prior knowledge of the wavelength dependent differential path length factor (DPF), which rescales the geometric distance between source and detector optodes to the mean photon path length. Accurate DPF values are important if quantitative estimates of ∆𝐻𝑏𝑂and ∆𝐻𝑏𝑅 are desired. Furthermore, systematic errors in the selection of DPF can introduce crosstalk between ∆𝐻𝑏𝑂and ∆𝐻𝑏𝑅 estimates (Strangman et al. 2003). DPF values cannot be directly measured with CW-NIRS and can vary by wavelength and across subjects due to differences in anatomical structure and tissue composition of the head. In the present study, we introduce an application of the extended Kalman filter (EKF) to continuously estimate a DPF correction term in CW-NIRS. We show using simulated and experimental four-wavelength NIRS data that this approach compensates for inaccurately assumed DPF values and corrects the crosstalk that would otherwise enter ∆𝐻𝑏𝑂 and ∆𝐻𝑏𝑅 estimates. Our EKF model has state variables for ∆𝐻𝑏𝑂 and ∆𝐻𝑏𝑅 and a nonlinear DPF correction term. EKF filter parameters were tuned using simulated NIRS by minimizing the residual error between known and estimated ∆𝐻𝑏𝑂 and ∆𝐻𝑏𝑅 from correcting relative changes in DPF values (∆𝐷𝑃𝐹) at three wavelengths (690 nm, 785 nm and 830 nm) with respect to the DPF value at 808 nm. The tuned EKF
was then applied to experimental NIRS data collected from 3 human subjects. The results are compared with the solution obtained using a weighted least squares (WLSQ) technique (Huppert et al. 2009). Residuals for the EKF and WLSQ methods are compared in 3 frequency bands (0.04-0.15 Hz, 0.15-0.4 Hz and 0.4-2.0 Hz). Cross-correlation coefficients between residuals at different wavelengths are evaluated as an indication of crosstalk. We also quantify the mean percent deviation of the EKF hemodynamic signals from the WLSQ hemodynamic signals (Fig. 1), which indicates how much correction the EKF contributes in reducing cross-talk error in ∆𝐻𝑏𝑂 and ∆𝐻𝑏𝑅. Results indicate that the mean cross correlation in residuals is lower in EKF compared to WLSQ (ANOVA, p < 0.001). The average reduction in cross-talk error over all frequency bands was
4.7% for ∆𝐻𝑏𝑂 and 11.7% for ∆𝐻𝑏𝑅. The proposed EKF algorithm is able to provide more reliable estimates of hemodynamics and reduce cross-talk errors that may arise in spectroscopic calculations from using wrongly assumed differential path length factors. References Cope, M. et al., 1988. Methods of quantitating cerebral near infrared spectroscopy data. Advances in
Experimental Medicine and Biology, 222, pp.183–189. Huppert, T.J. et al., 2009. HomER: a review of time-series analysis methods for near-infrared
spectroscopy of the brain. Applied Optics, 48(10), pp.D280–D298. Strangman, G., Franceschini, M.A. & Boas, D.A., 2003. Factors affecting the accuracy of near-
infrared spectroscopy concentration calculations for focal changes in oxygenation parameters. NeuroImage, 18(4), pp.865–879.
Fig 1. Cross-talk error corrections in ∆𝐻𝑏𝑂 and ∆𝐻𝑏𝑅 from the application of the proposed EKF algorithm. Mean percent correction and standard error shown for three frequency bands.
42
104
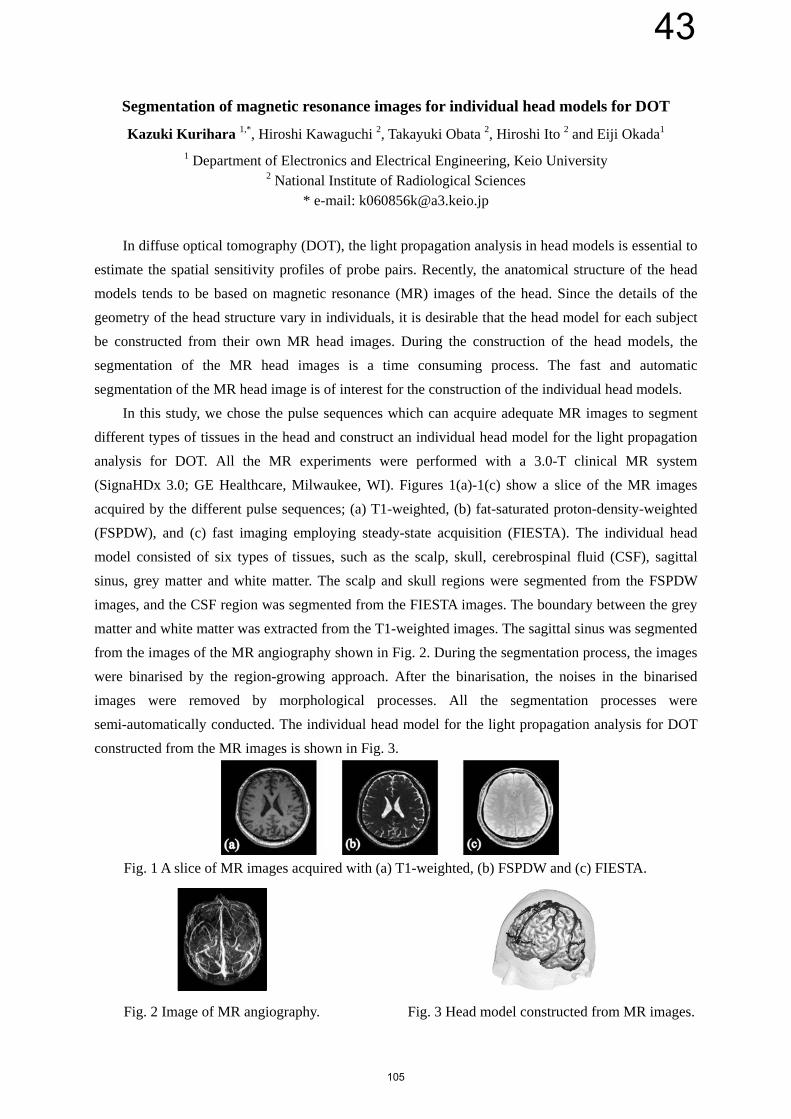
Segmentation of magnetic resonance images for individual head models for DOT
Kazuki Kurihara 1,*, Hiroshi Kawaguchi 2, Takayuki Obata 2, Hiroshi Ito 2 and Eiji Okada1 1 Department of Electronics and Electrical Engineering, Keio University
2 National Institute of Radiological Sciences * e-mail: [email protected]
In diffuse optical tomography (DOT), the light propagation analysis in head models is essential to
estimate the spatial sensitivity profiles of probe pairs. Recently, the anatomical structure of the head
models tends to be based on magnetic resonance (MR) images of the head. Since the details of the
geometry of the head structure vary in individuals, it is desirable that the head model for each subject
be constructed from their own MR head images. During the construction of the head models, the
segmentation of the MR head images is a time consuming process. The fast and automatic
segmentation of the MR head image is of interest for the construction of the individual head models.
In this study, we chose the pulse sequences which can acquire adequate MR images to segment
different types of tissues in the head and construct an individual head model for the light propagation
analysis for DOT. All the MR experiments were performed with a 3.0-T clinical MR system
(SignaHDx 3.0; GE Healthcare, Milwaukee, WI). Figures 1(a)-1(c) show a slice of the MR images
acquired by the different pulse sequences; (a) T1-weighted, (b) fat-saturated proton-density-weighted
(FSPDW), and (c) fast imaging employing steady-state acquisition (FIESTA). The individual head
model consisted of six types of tissues, such as the scalp, skull, cerebrospinal fluid (CSF), sagittal
sinus, grey matter and white matter. The scalp and skull regions were segmented from the FSPDW
images, and the CSF region was segmented from the FIESTA images. The boundary between the grey
matter and white matter was extracted from the T1-weighted images. The sagittal sinus was segmented
from the images of the MR angiography shown in Fig. 2. During the segmentation process, the images
were binarised by the region-growing approach. After the binarisation, the noises in the binarised
images were removed by morphological processes. All the segmentation processes were
semi-automatically conducted. The individual head model for the light propagation analysis for DOT
constructed from the MR images is shown in Fig. 3.
Fig. 1 A slice of MR images acquired with (a) T1-weighted, (b) FSPDW and (c) FIESTA.
Fig. 2 Image of MR angiography. Fig. 3 Head model constructed from MR images.
43
105

Development of a flexible neurofeedback system for brain-machine interface using fNIRS
L. Comandar1, T. Katura
2, M. Kiguchi
2 I. Tachtsidis
1
1. Dept of Medical Physics, Biomedical Optics Research Laboratory, UCL, London, UK
2. Hitachi, Ltd., Advanced Research Laboratory, Japan
Introduction: Brain-Machine Interface (BMI) allows users to communicate with external devices
through thought processes alone. There is an increasing interest in the use of fNIRS for BMI as a tool
to detect both brain conscious activation and enhance neurofeedback. fNIRS measures the
haemodynamic and oxygenation response secondary to brain electrical activation and as such the
signal can also be affected by brain physiological changes due to systemic physiological fluctuations
[1]. Here we present a new signal analysis method that will improve identification of activation and
provide real time feedback to the subject to enhance neurofeedback. The system is designed as a plug-
in for the Platform for Optical Topography Analysis Tools (POTATo) [2] implemented in MATLAB.
Methods: The analysis consists of two stages aimed at identifying inter-channel hemodynamic
correlation and then testing the neurofeedback performance. The first experiment identifies the desired
activation area followed by a no-task experiment aimed at measuring inter-channel correlation during
systemic changes. Using the identified channel pairing a more accurate activation signal is obtained
while accounting for systemic changes. The selected activation channels are then used for visual
feedback during training experiment. The validity of the procedure is assessed by comparing fNIRS
signals during executed movement and imagery movement.
Results: The correlation coefficient of the measured
signal during experiment trials and the measured signal
in the sensorimotor channels during executed
movement for one of the subjects is presented in the
figure. In the presented data the learning effect can be
observed with the motor imagery trials at the end of the
experiment show higher correlation with executed
movement than initial motor imagery trials.
Discussion: Off-line analysis shows task related signal
improvement in all subjects during the feedback
sessions both in terms of magnitude and correlation.
The experimental results are in agreement with previously published papers showing enhanced motor
imagery related haemodynamic cortical activation [3].
References
[1] Tachtsidis I., Leung T. S., Chopra A., Koh P. H., Reid C. B., Elwell C. E.; False Positives In
Functional Near infrared Topography Oxygen Transport to Tissue XXX Advances in Experimental
Medicine and Biology, 2009, Volume 645, 307-314
[2] http://www.hitachi.co.jp/products/ot/study/kaiseki.html
[3] Mihara, M., et al. 2012. Neurofeedback Using Real-Time Near-Infrared Spectroscopy Enhances
Motor Imagery Related Cortical Activation. PloS ONE 7(3): e32234
44
106

Artifact removal for assessment of cross-network anticorrelation with fNIRS Authors: Angela Harrivel 1, Luis Hernandez-Garcia2, Scott Peltier2, Douglas Noll2 The end goal of this project is to detect potentially hazardous resting states during attention-demanding tasks in near real time with Functional Near Infrared Spectroscopy (fNIRS) using probes placed at superficial nodes of the attentional (ATN) and default mode networks (DMN). Functionally-connected networks in the resting state have been detected with fNIRS (White, 2009; Sasai, 2012). It may be possible to detect cross-network anticorrelation as well, using only single point measurements made at network nodes. We propose that an increase in anticorrelation between the default network and the attentional network may be a powerful indicator of reduced attention to task. However, correlation measures can be compromised by motion artifact and masked by local physiological contributions. Hence, operational or ambulatory application requires the application of algorithms and filters for the removal of unwanted signal. Here we introduce a computationally simple correction method for ambient and physiological signal component reduction prior to correlation assessment. Data were collected at 6.25Hz (Imagent, ISS, Inc.) from consented subjects resting 8 minutes with eyes open. Probes were placed at the dorsolateral prefrontal cortex (dlPFC), supplementary motor area (SMA), medial frontal gyrus (MFG) and angular gyrus (AngG) using the I10-20 system for localization. The signal processing steps are as follows. First, all traces were normalized and mean centered. Second, the traces from a detector channel with no source (e.g. above in green) and their time derivatives were used to model and remove unwanted contributions to the signal of interest due to probe motion and ambient light exposure using standard linear regression (output in lowest panel above). Third, traces from a secondary source close to and in line with that probe’s detector, which only sampled superficial tissue (above in red), were used to measure physiological fluctuations. As a first-order correction, the physiological traces were subtracted (as in Zhang, 2007, eq. 5) from the hemoglobin traces of interest (above in blue). Fourth, the result was filtered to include 0.01Hz to 0.08Hz using an equiripple FIR zero-phase filter to examine frequencies corresponding to the hemodynamic response. Fifth, correlation coefficients (CC) for same-species trace pairs over the full time course were computed, and averaged over 6 subjects to identify anticorrelation. Results are presented in the table below. The CC for the oxygenated hemoglobin (HbO) trace pairs were positive for all within-network pairs, and negative for half of the between-network pairs. The deoxygenated hemoglobin (Hb) trace pairs showed in network correlation and cross-network anticorrelation for one probe on each network. CC for traces without physiological correction were all positive, showing no network-consistent patterns.
CC, N=6 DMN: rMFG, HbO
DMN: rAngG, HbO
ATN: lSMA, HbO
DMN: rMFG, Hb
DMN: rAngG, Hb
ATN: lSMA, Hb
rDMN: AngG 0.19±0.46 -0.028±0.35 lATN: SMA -0.28±0.41 -0.20±0.44 -0.204±0.33 0.128±0.45 rATN: dlPFC 0.13±0.35 -0.06±0.31 0.16±0.45 -0.082±0.41 0.186±0.30 0.270±0.42
We conclude it may be possible to detect cross-network anticorrelation, but physiological contributions to the measurements are dynamic, and static removal is not universally effective (Zhang, 2009). Thus, the implementation of an adaptive physiological filter is planned to improve state detection accuracy and network correlation measures to support this ongoing human subject study. White, B., et al., 2009. Resting-state functional connectivity in the human brain revealed with diffuse
optical tomography. NeuroImage 47(1): 148-156. Sasai, S., et al., 2012. A NIRS-fMRI study of resting state network, NeuroImage (in press) Zhang, Q., et al., 2009. Adaptive filtering to reduce global interference in non-invasive NIRS
measures of brain activation: how well and when does it work? Neuroimage 45: 788–794.
1 NASA Glenn Research Center, Bioscience and Technology Branch, [email protected] 2 University of Michigan, Biomedical Engineering, fMRI Laboratory
45
107

Title: A Computing Environment for Multimodal Integration of EEG and fNIRS Authors: Randall L. Barbour (SUNY Downstate Medical Center, Brooklyn, NY); Arne Ewald (NIRx Medizintechnik GmbH, Berlin, [email protected]); Harry L. Graber (SUNY Downstate Medical Center); J. David Nichols (Source Signal Imaging, Inc., San Diego, CA); Mark E. Pflieger (Source Signal Imaging); Alex Ossadtchi (Source Signal Imaging); Christoph H. Schmitz (NIRx Medizintechnik GmbH); Yong Xu (SUNY Downstate Medical Center)
Following the brain’s own tendency to integrate multiple sensory modalities (visual, auditory, somatosensory, etc.), multimodal integration of neuroimaging techniques has been a recurring theme in the field. Here, the combination of electroencephalography (EEG) and functional near infrared spectroscopy (fNIRS) is considered. A principal reason for the interest in EEG-fNIRS is the expectation that evaluation of neurovascular coupling can have practical utility in, e.g., studies of the alpha rhythm [1], or of epilepsy [2]. In addition, noninvasive detection of an fast optical signal (FOS), having a time course similar to an event-related potential (ERP) and resulting from changes of scattering properties in neural tissue [3], has been a topic of considerable interest [4], but also of controversy owing to its low signal-to-noise ratio [5]. However, a recent report used simultaneous ERP and fNIRS measurements to demonstrate that concurrent EEG may facilitate FOS detection [6].
A requirement for integration of EEG and fNIRS, which depend on different physical properties
(EEG – conductivities; fNIRS – absorption and scattering coefficients) of the same head tissues, is forward models that can be used for estimation of neuroelectric sources or cerebral hemodynamic states in a common anatomical space (e.g., derived from structural MRI). To address this need, we have introduced NAVI [7,8], a MATLAB-based environment that supports many of the principal data transformations common to evaluation of bioelectric and hemodynamic studies, and is geared mainly toward supporting atlas-based parametric mapping with full 3D tomographic capabilities. The package includes modules for image formation, display and analysis; an electronic ledger that automatically records metadata associated with the various data transformation resources; and a number of utilities modeled principally after strategies supported by SPM8 [9,10]: GLM-based parametric mapping of detected hemodynamic response functions; atlas-based mapping of image findings onto identified brain regions, with an automated anatomical labeling functionality; and examination of effective connectivity via strategies such as dynamic causal modeling [11]. The data analysis environment also includes the EMSE Suite (Source Signal Imaging, Inc.), which comprises software modules for integrating EEG with structural MRI [12]: spatial mapping of sensor positions and MRI co-registration; review of EEG data, with various spatial and temporal filters for treating artifacts; mapping signal-space measures topographically onto the head surface; computing and displaying solutions to the cortical current-density inverse-problem; display of MRI data, with tissue segmentation capabilities; mesh generation based on segmented MRIs; and statistical nonparametric mapping, via randomization of experimental conditions, in either signal space or source space. [1] S.P. Koch et al., NeuroImage 41, 233-242 (2008). [2] P. Pouliot et al., J Neurosci Methods (Epub Nov 25, 2011). [3] G. Gratton et al., NeuroImage 6, 168-180 (1997). [4] A.V. Medvedev et al., Brain Res 1236, 145-158 (2008). [5] J. Steinbrink et al., NeuroImage 26, 996-1008 (2005). [6] A.V. Medvedev et al., J Biomed Optics 15, 061702 (2010). [7] Y. Pei, et al., Poster No. 685 T-AM at Human Brain Mapping 2006 (Florence, Italy, June 11-15, 2006). Available at: http://otg.downstate.edu/Publication/ PeiHBM06.pdf. [9] NIRx fNIRS Analysis Environment User’s guide. Available at: http://otg.downstate.edu/Publication/NIRxPackage_03.pdf. [9] W. D. Penny et al., Statistical Parametric Mapping. Academic Press, 2006. [10] N. Tzourio-Mazoyer et al., NeuroImage 15, 273-289 (2002). [11] K. Friston, PLoS Biology 7, 0220-0225 (2009). [12] Source Signal Imaging, Inc., EMSE®Suite User Manual, Version 5.4, San Diego, 2011. Available at: ftp://ftp.sourcesignal.com/manuals/.
46
108

Group level analysis methods in NIRS Ardalan Aarabi1, Theodore Huppert1,2
1. University of Pittsburgh, Radiology, Pittsburgh, PA, United States 2. University of Pittsburgh, Bioengineering, Pittsburgh, PA, United States
[email protected] Introduction: We have developed new analysis methods for statistical inference, image reconstruction, and group level analysis for NIRS imaging. This analysis pipeline extends from methods previously introduced in the fields of fMRI and EEG/MEG analysis of functional imaging data. The key steps of our analysis pipeline are outlined in figure 1.
Data acquisition methods. • A custom data acquisition software
package was written to control the TechEn CW6, NIRS2, similar systems. This software allows management of preloaded settings (probe, sample rate, stimulus and auxiliary information) about the study.
• Real-time processing modules to allow filtering, conversion to hemoglobin, block averaging, and image reconstruction have been developed as part of data acquisition. Registration and modeling.
• NIRS registration methods based on a Polhemus isotrack 3D-digitizer are used to
register the NIRS cap to anatomical volumes. These NIRS tools make use of several existing similar tools developed for EEG and MEG registration.
• Once registered to anatomical volumes, finite element or monte carlo methods are applied to generate the optical forward model. Registration and segmentation tools from MRI and EEG/MEG from FreeSurfer and the MNE pipeline have been interfaced for NIRS analysis.
• Tools for tessellation and wavelet representation of the structural MRI are implemented as part of the image reconstruction method.
Preprocessing • New methods for motion correction based on
combined wavelet and independent component analysis (ICA) have been developed to deal with both spike and shift types of NIRS artifacts
• A new approach based on single-channel ICA analysis has been used to characterize and remove physiological noise in NIRS data.
• Data-basing tools for management of NIRS subject and study information (including multimodal data) have been developed.
• A new GUI called NIRSviewer was built to allow visualization of the NIRS data (fig 2).
Fig 1. Overview of the steps of NIRS analysis.
shots from the new NIRSviewer
Fig 2. Screen
Fig 2. Screen shot from the new NIRSviewer
47
109

Morphological modification of brain structure for optical brain activation imaging
Shunsuke Ichimura 1,*
, Hirokazu Kakuta 1, Kazuki Kurihara
1,Hiroshi Kawaguchi
2, Takayuki Obata
2,
Hiroshi Ito 2 and Eiji Okada
1
1 Department of Electronics and Electrical Engineering, Keio University
2 National Institute of Radiological Sciences
* e-mail: [email protected]
The inverse problem in optical brain activation imaging is normally ill posed and the solution is
not unique. A priori information of the anatomical structure of the head is incorporated into the inverse
problem to improve the accuracy of the image reconstruction. In this study, the adequate geometry of
the brain surface in the head model to predict the spatial sensitivity profile for the inverse problem is
investigated in order to improve the optical brain activation imaging.
Figure 1(a) shows the geometry of the brain surface segmented from the magnetic resonance
(MR) head images. The longitudinal fissure and sulcus structure are clearly observed in the brain
surface. The spatial sensitivity profile for the source-detector pair shown in Fig. 1(a) was predicted by
a Monte Carlo simulation and is shown in Fig. 2(a). The spatial sensitivity profile in the model with a
simple geometry, such as a homogeneous model, is symmetrically distributed with respect to the line
connecting the source and detector while the spatial sensitivity profile shown in Fig. 1(a) is distorted
by the uneven thickness of the superficial tissues and the geometry of the brain surface. The spatial
sensitivity significantly decreases around the sulci and the sulcus structure is clearly observed in Fig.
2(a). The measurement points in the common imaging systems are sparsely distributed and they cannot
resolve the spatial frequency of the spatial sensitivity profile including the sulcus structure. The high
frequency component may cause errors in the reconstructed images. The geometry of the brain surface
smoothed by a morphological close operation is shown in Fig. 1(b). The sulci are plugged, however,
the primary geometry of the brain surface still remains in the model. The spatial sensitivity profile
estimated from the model including the smoothed brain is shown in Fig. 2(b). The high frequency
component in the spatial sensitivity profile around the sulcus structure is removed while the distortion
caused by the anatomical structure of the head remains in the spatial sensitivity profile.
Fig. 1 Geometry of brain surface. Fig. 2 Spatial sensitivity profile obtained by
(a) precise, (b) smoothed. (a) precise model, (b) smoothed model.
48
110
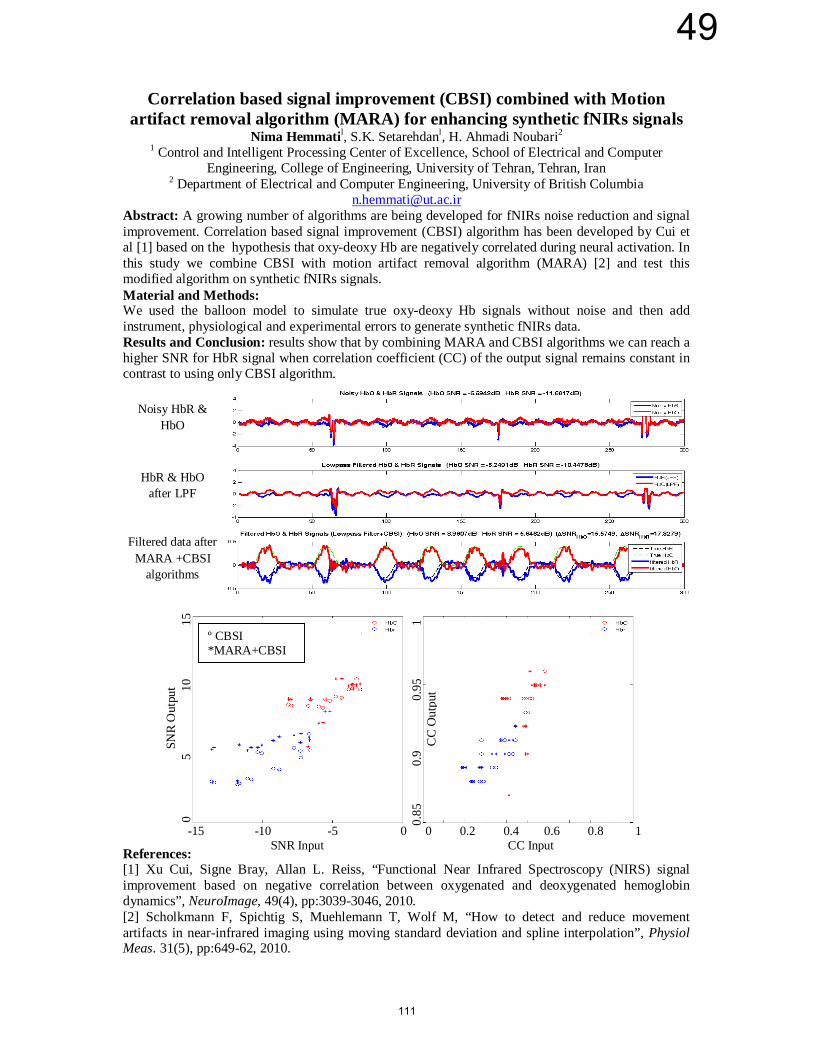
Correlation based signal improvement (CBSI) combined with Motion artifact removal algorithm (MARA) for enhancing synthetic fNIRs signals
Nima Hemmatil, S.K. Setarehdanl, H. Ahmadi Noubari2 1 Control and Intelligent Processing Center of Excellence, School of Electrical and Computer
Engineering, College of Engineering, University of Tehran, Tehran, Iran 2 Department of Electrical and Computer Engineering, University of British Columbia
[email protected] Abstract: A growing number of algorithms are being developed for fNIRs noise reduction and signal improvement. Correlation based signal improvement (CBSI) algorithm has been developed by Cui et al [1] based on the hypothesis that oxy-deoxy Hb are negatively correlated during neural activation. In this study we combine CBSI with motion artifact removal algorithm (MARA) [2] and test this modified algorithm on synthetic fNIRs signals. Material and Methods: We used the balloon model to simulate true oxy-deoxy Hb signals without noise and then add instrument, physiological and experimental errors to generate synthetic fNIRs data. Results and Conclusion: results show that by combining MARA and CBSI algorithms we can reach a higher SNR for HbR signal when correlation coefficient (CC) of the output signal remains constant in contrast to using only CBSI algorithm.
References: [1] Xu Cui, Signe Bray, Allan L. Reiss, “Functional Near Infrared Spectroscopy (NIRS) signal improvement based on negative correlation between oxygenated and deoxygenated hemoglobin dynamics”, NeuroImage, 49(4), pp:3039-3046, 2010. [2] Scholkmann F, Spichtig S, Muehlemann T, Wolf M, “How to detect and reduce movement artifacts in near-infrared imaging using moving standard deviation and spline interpolation”, Physiol Meas. 31(5), pp:649-62, 2010.
Noisy HbR & HbO
HbR & HbO after LPF
Filtered data after MARA +CBSI
algorithms
-15 -10 -5 0 0 0.2 0.4 0.6 0.8 1 SNR Input CC Input
SNR
Out
put
0
5
1
0
15
0.85
0.9
0.
95
1
CC
Out
put
º CBSI *MARA+CBSI
49
111

Quantitative indexes of artifacts for NIRS signals
Satoru Kohno, Yoko Hoshi
Integrated Neuroscience Research Project, Tokyo Metropolitan Institute of Medical Science, Tokyo, Japan
Introduction: The modified Beer-Lambert law (MBLL) is used to describe the changes in light attenuation in
scattering media. The differential form of MBLL (dMBLL) is widely used in near-infrared spectroscopy (NIRS).
By solving its simultaneous equations, NIRS signals (changes of the product of the hemoglobin concentration
and the partial path length during functional activation of the cerebral cortex) are calculated. The dMBLL is based
on some assumptions: (1) the absorbance changes are attributed to the only oxygenated and deoxygenated
hemoglobin, (2) the absorbance is linear with the concentration changes, (3) the absorption changes
homogeneously, (4) the wavelength dependence of the path length is negligible, (5) the path length is constant,
(6) the scattering loss is constant and (7) the absorbance changes caused by changes in coupling between the
fibers and the subject’s head surfaces (moving, sweat, etc.) is negligible. In the head model, however, the
multi-region activations in the multi-layer structure should be considered and these assumptions should be
investigated. In this work, we propose some quantitative indexes of artifacts for NIRS signals caused by these
assumptions.
Methods: We used a continuous NIRS imager with three wavelengths (FORE-3000, Shimadzu) and defined the
root-mean-square difference (RMSD) of NIRS signals (RMSD = √(∆𝑋𝜆1,2 − ∆𝑋𝜆2,3)2+ √(∆𝑋𝜆2,3 − ∆𝑋𝜆3,1)
2+ √(∆𝑋𝜆3,1 − ∆𝑋𝜆1,2)
2 , where ΔX
means oxygenated or deoxygenated hemoglobin changes). These indexes reflect the differences (discrepancy)
among solutions which satisfy combination of any two dMBLL simultaneous equations out of three. Firstly, we
calculated RMSD by simulating various wavelength-dependent absorbance changes due to any other causes than
hemoglobin concentration changes. Then we estimated RMSD experimentally under some conditions, such as
changing an angle of a light guide on a phantom surface, dropping oil into the space between a phantom surface
and a light guide and a subject’s head movement.
Results: RMSD calculated by simulating absorbance changes due to any other causes than hemoglobin
concentration changes changed largely, though the NIRS signals were typical for brain activation (Fig.1). In the
experiments of changing the angle of the light guide, dropping oil and the subject’s head movement, significant
changes in RMSD were observed (data not shown).
Conclusions: RMSD are useful as quantitative indexes of artifacts for NIRS signals caused by some assumptions
of the dMBLL.
Fig.1 Examples of NIRS signals and RMSD calculated by simulating absorbance changes due to (a) hemoglobin concentration changes
and (b) any other causes than them.
NIR
S s
ignal
s (m
M×cm
)
Time (s) Time (s)
Time (s) Time (s)
(a) (b)
NIR
S s
ignal
s (m
M×cm
)
RM
SD
(mM
×cm
)
RM
SD
(mM
×cm
)
Abso
rban
ce
Abso
rban
ce
780ns 780ns
805ns
830ns
805ns
830ns Time (s) Time (s)
50
112

Head phantom including multiple absorption inclusions for near infrared topography
Masaya Ohtake 1,*
, Hirokazu Kakuta 1, Hiroshi Kawaguchi
2 and Eiji Okada
1
1 Department of Electronics and Electrical Engineering, Keio University
2 National Institute of Radiological Sciences
* e-mail: [email protected]
Head phantoms are important in order to estimate the nonuniform spatial sensitivity of
near-infrared (NIR) topography, to optimise the probe arrangements and to evaluate the image
reconstruction algorithm. The peak value and spatial extent of the absorption change in the
topographic images depend on the relative position between the absorption inclusion and
source-detector pairs. In this study, multiple absorption inclusions in the head phantom were imaged
by NIR topography to evaluate the influence of the nonuniform spatial sensitivity on the topographic
image of the absorption change.
A picture of the head phantom is shown in Fig. 1. The phantom is a water tank filled with an
intralipid solution and green ink mimicking brain tissue. The bottom wall consists of two layers
mimicking superficial tissue (scalp and skull) and cerebrospinal fluid (CSF). Multiple absorption rods
are able to be inserted in the intralipid solution to realise the absorption change caused by the brain
activation. The source and detector probes were attached to the bottom of the tank to detect the change
in intensity caused by the absorption rods. Figure 2(a) shows the measurement points, which are the
midpoint of the source-detector pair, and the positions of the absorption inclusions. The distance
between the source and detector for all the source-detector pairs was 30 mm. The change in intensity
detected by each probe pairs caused by the absorption inclusions was mapped at the corresponding
measurement point and is spatially interpolated to obtain the topographic images. The topographic
images of the two inclusions are shown in Fig. 2(b). The solid lines in the images indicate the position
of the absorption inclusions. The diameter of the absorption inclusion at position (A) is 15 mm while
that at position (B) is 10 mm (b1) or 20 mm (b2). The absorption coefficient of the inclusions at
positions (A) and (B) are the same. Although the absorption coefficient of the inclusion is the same,
the peak values of the absorption changes in the image obviously varied with the size of the absorption
inclusion. This result indicated that the change in the size of the absorption inclusion at (B) rather
more affects the peak value than the spatial extent of the absorption change in the topographic image
calculated by the simple mapping method.
Fig. 1 The head phantom. Fig. 2 (a) Measurement points of NIR topography.
(b) Topographic images of absorption inclusions.
51
113

Depth-compensated tomography (DC-Tomo) based on standard brain atlas
Fenghua Tian, Venkaiah C. Kavuri and Hanli Liu
Department of Bioengineering, the University of Texas at Arlington, Arlington, TX, USA
Email: [email protected]
Introduction: In diffuse optical tomography (DOT), researchers often face challenges to accurately
recover the depth and size of the reconstructed objects. Recently we developed a depth compensation
algorithm (DCA) to improve the depth specificity in DOT [1,2]. We also demonstrated that DCA could be
combined with L1-norm regularization to solve the over-smoothing problem that degrades the spatial
resolution [3]. However, all of these studies were based on a semi-infinite, homogeneous brain model
which deviated from the realistic human brain anatomy. In the present work, we have implemented the
depth-compensated tomography (DC-Tomo) onto a standard brain atlas and further investigated how
reconstructed images are affected by (1) heterogeneity of the brain, (2) sparsity of the optode geometry,
and (3) selectivity of source-detector distances. Computer simulations and human experiments were
conducted to evaluate the brain atlas-based DC-Tomo. At last, the tomographic images were also
compared with the topographic images generated by a toolbox that we developed recently (“EasyTopo”).
Methods: Two-layer finite element mesh of a standard brain atlas (ICBM 152) was generated using the
iso2mesh toolbox. Then DC-Tomo was implemented using the following procedures: (1) probabilistic
registration to localize DOT measurements on the brain mesh by digitizing the coordinates of optodes
along with five cranial landmarks; (2) NIRFAST, which is based on the diffusion approximation to solve
the forward problem; (3) DCA to compensate the node-wise sensitivity along depth; (4) regularized
inversion to reconstruct the 3D tomographic images; and (5) node-wise statistical analysis based on the
general linear model (GLM). Human motor activation by a finger tapping task was acquired using high-
density optode geometry. To investigate how the sparsity of the optode geometry affects the image quality,
this high-density geometry was converted to a sparse geometry by removing part of source-detector pairs.
Results: The heterogeneity of the brain does not affect DC-Tomo significantly. DC-Tomo can recover the
correct depth of an imaged object (e.g., an embedded absorber or activated motor cortex) using either
high-density or sparse geometry. Including the 1st nearest source-detector neighbors (~1.6 cm) appears to
degrade the spatial resolution. Figure 1 shows the results of human motor activation by using high-
density geometry (with 2nd
nearest source-detector neighbors only). Node-wise GLM analysis provides
regions of interest (ROIs) consistent with those in reconstructed hemodynamic (or oxy-hemoglobin)
images. Moreover, the tomographic images agree with the topographic images generated by EasyTopo,
while the former is always better (see Fig. 2).
Future work: We will combine DC-Tomo with L1-norm regularization to improve the spatial resolution.
References: 1. F Tian, H Niu, ZJ Lin and H Liu. Optics Letters 35(3), 429-431, (2010).
2. F Tian, H Niu, S Khadka, ZJ Lin, and H Liu. Biomed. Opt. Express 1, 441-452 (2010).
3. VC Kavuri, ZJ Lin, F Tian, and H Liu. Biomed. Opt. Express 3(5), 943-957 (2012).
Fig 2. (a) Tomographic HbO2 image; (b)
Topographic HbO2 image.
Fig 1. (a) Brain mesh and optode geometry; (b) reconstructed
HbO2 image; (c) t-value image attained from node-wise GLM.
52
114

fNIRS data analysis by Slope: an alternative method to distinguish the level of cortical activation
pattern during functional tasks.
Kevin Mandrick1,2, Gérard Derosière2, Gérard Dray2, Denis Coulon1, Jean-Paul Micallef2 and Stéphane Perrey2
1Bodysens company, Nîmes, France, 2Movement to Health (M2H) laboratory, Euromov, Montpellier-1 University, France
Corresponding. Email: [email protected] Keywords: fNIRS, data analysis, quantitative method, linear regression.
More and more investigations in the field of Life Sciences are issues from growing interest for the functional near-infrared spectroscopy (fNIRS) application. A large fNIRS literature seeks (i) to assess the level of brain involvement in daily human movement and (ii) to depict fNIRS real-time signal biomarkers. While the fNIRS signals are strongly well-known to reflect several hemodynamic processes (i.e., changes in blood volume and in the hemoglobin oxygenation state), no real consensus does still exist on how to perform the fNIRS data analyzes for obtaining a suitable assessment of cortical activation. Different fNIRS analysis methods have been proposed to estimate the largeness of the amplitude on the cortical activation pattern. Commonly, the significance of data changes (i.e., pre-stimulation vs. stimulation) is based on the magnitude of the activation level. Currently, the variables of interest calculated to depict the fNIRS activation pattern are the: differential signals change (i.e., the difference of oxy-Hb and deoxy-Hb so-called diff-Hb); additive signals change (i.e., the sum of oxy-Hb and deoxy-Hb so-called tot-Hb); area under the curve (AUC); Z-score; time-to-peak (TTP, i.e., temporal mismatch to achieve the maximum positive or negative values in oxy- and deoxy-Hb, respectively); amplitude response for oxy-Hb; etc. But such approaches introduce difficulties to discriminate a low response of activation. Therefore, we propose a new fNIRS analysis routine aiming to investigate the degree of cortical activation pattern. In the present study we adopted a simple approach based on the use of a linear regression technique over a sufficient time window of stimulation and the calculation of the slope coefficient (Figure below). Although the data (activation period + plateau period) cannot be fitted perfectly by linear regression it is clear that the slope discriminates the cortical activation pattern with respect to some aforementioned methods.
Fig. Current methods and Slope approach using linear regression to analyze the typical fNIRS
hemodynamic changes response during functional task.
53
115
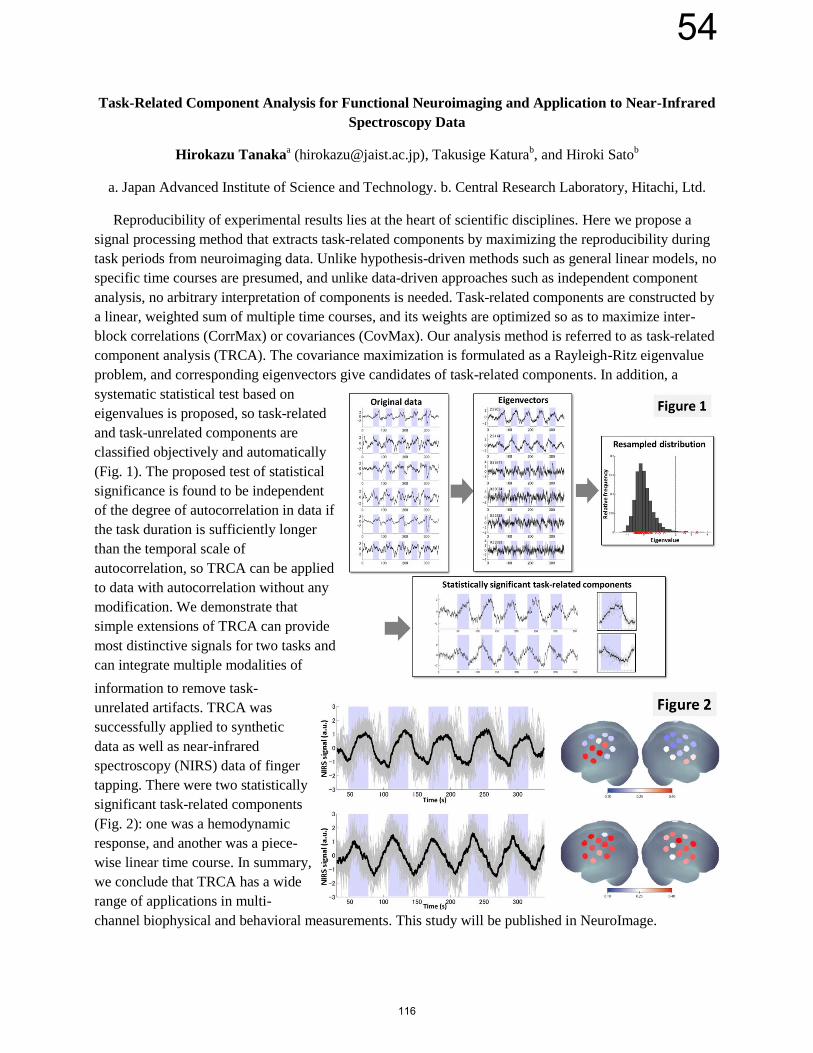
Task-Related Component Analysis for Functional Neuroimaging and Application to Near-Infrared
Spectroscopy Data
Hirokazu Tanakaa ([email protected]), Takusige Katura
b, and Hiroki Sato
b
a. Japan Advanced Institute of Science and Technology. b. Central Research Laboratory, Hitachi, Ltd.
Reproducibility of experimental results lies at the heart of scientific disciplines. Here we propose a
signal processing method that extracts task-related components by maximizing the reproducibility during
task periods from neuroimaging data. Unlike hypothesis-driven methods such as general linear models, no
specific time courses are presumed, and unlike data-driven approaches such as independent component
analysis, no arbitrary interpretation of components is needed. Task-related components are constructed by
a linear, weighted sum of multiple time courses, and its weights are optimized so as to maximize inter-
block correlations (CorrMax) or covariances (CovMax). Our analysis method is referred to as task-related
component analysis (TRCA). The covariance maximization is formulated as a Rayleigh-Ritz eigenvalue
problem, and corresponding eigenvectors give candidates of task-related components. In addition, a
systematic statistical test based on
eigenvalues is proposed, so task-related
and task-unrelated components are
classified objectively and automatically
(Fig. 1). The proposed test of statistical
significance is found to be independent
of the degree of autocorrelation in data if
the task duration is sufficiently longer
than the temporal scale of
autocorrelation, so TRCA can be applied
to data with autocorrelation without any
modification. We demonstrate that
simple extensions of TRCA can provide
most distinctive signals for two tasks and
can integrate multiple modalities of
information to remove task-
unrelated artifacts. TRCA was
successfully applied to synthetic
data as well as near-infrared
spectroscopy (NIRS) data of finger
tapping. There were two statistically
significant task-related components
(Fig. 2): one was a hemodynamic
response, and another was a piece-
wise linear time course. In summary,
we conclude that TRCA has a wide
range of applications in multi-
channel biophysical and behavioral measurements. This study will be published in NeuroImage.
54
116

Poster Session Neurodevelopment (I) and (II)
Poster #: 55-‐70
117

Fronto-posterior connectivity during phonological processing in the infant brain Fumitaka Homae1, Hama Watanabe2, Gentaro Taga2
1 Tokyo Metropolitan University, 2 University of Tokyo; e-mail: [email protected] (F.H.) Infants produce language-specific speech sounds at approximately 10 months of age but can
discriminate phonological contrasts from birth. The neural foundation of the linkage between
perceiving and producing speech sounds is unclear in the infant brain. We investigated whether
the cortical regions related to speech production in infants show functional connectivity with the
posterior temporal and parietal regions when processing speech sounds; 25 three-month-old
infants (age range, 104-119 days) were assessed during natural sleep. We used 94-channel
near-infrared spectroscopy (ETG-7000, Hitachi Medical Corporation) to examine cortical
activation on perceiving speech sounds for the repetition (/ban/-/ban/), consonant change
(/ban/-/pan/), and pitch change (/ban/ for standard pitch and /ban/ for higher pitch) conditions.
We evaluated changes in oxygenated hemoglobin (oxy-Hb) and deoxygenated hemoglobin
(deoxy-Hb) signals for each measurement channel. Furthermore, we calculated the temporal
correlations between the oxy-Hb signals by using all of the continuous data [1]. Analysis of
variance of oxy-Hb signal data for all 3 conditions indicated that the anterior temporal regions
on both sides and the precentral regions of the left hemisphere showed greater activation under
the consonant-change condition than under the other conditions. Correlation analyses revealed
that the correlation between the oxy-Hb signals of the precentral regions and the oxy-Hb signals
of the posterior temporal and parietal regions in the left hemisphere was higher than the
correlation between the oxy-Hb signals of the anterior temporal regions and the posterior
regions. Analyses of phase synchronization [2] confirmed this tendency. Our results show that
phonological processing in infants is subserved by the temporal regions and the precentral
regions. The fronto-posterior connectivity in the left hemisphere may be the basis of the dorsal
stream connecting the perceptual and articulatory networks during speech processing in infants.
[1] Homae F, Watanabe H, Nakano T, Taga G (2011) Large-scale networks underlying
language acquisition in early infancy. Front Psychol 2:93.
[2] Taga G, Watanabe H, Homae F (2011) Spatiotemporal properties of cortical hemodynamic
response to auditory stimuli in sleeping infants revealed by multi-channel NIRS. Phil Trans R
Soc A 369:4495-4511.
55
118

PRELEXICAL CUES IN FIRST LANGUAGE ACQUISITION: TRAINING INDUCED CHANGES IN THE
PROCESSING OF PHONOTACTICALLY LEGAL AND ILLEGAL CONSONANT CLUSTERS.
Hellmuth Obrig1,2,3
, Maria Richter1,2
, Micol Vignotto1,2
, Sonja Rossi1,2
1 University of Leipzig, Medical Faculty, Clinic for Cognitive Neurology, Leipzig,
2 Max Planck Institute
for Human Cognitive and Brain Sciences, Leipzig, Germany, 3
Optical Imaging Group Dept. Neurology,
Charité, University Medicine Berlin, Germany; Correspondence: [email protected]
Background: Speech comprehension requires the rapid mapping of an incoming auditory signal onto
meaningful mental representations. Since natural connected speech does not provide bottom-up auditory
cues (e.g., pauses) to indicate word boundaries segmentation of the auditory stream must rely on top-down
linguistic knowledge. Prelexical regularities, such as phonotactics, support this task. For example in
English (and German) the succession of the two phonemes /t/ and /k/ signals a boundary between two
words, particles, or syllables because no existing word in these languages starts or ends with this
consonant cluster. The combinatorial rules in a given language constrain ‘legal’ clusters at the onset,
within, and at the coda of words. Phonotactic rules are language specific and must be acquired during first
language acquisition or modified, when learning a second language later in life. In a number of
experiments we inquired into the neuronal mechanisms underlying the processing of phonotactic
properties. We could show that even in the absence of any semantic information the adult brain
differentially processes pseudowords with legal compared to illegal onset clusters (Rossi et al., 2011).
Moreover a short 3 day training scheme can modulate the response to ‘illegal’ pseudowords (Rossi et al.,
subm.). Using a cross sectional approach in infants we find evidence for a relatively early sensitivity to
phonotactic rules at 3 months. Our data support the notion that an initially bilateral response to familiar
versus unfamiliar onset clusters evolves into a more linguistic processing with a left lateralized response in
adults. The ongoing project presented here goes one step further and addresses the question how a short
intervention alters the processing of phonotactically legal vs. illegal
pseudowords. Methods: Infants of different age groups (6 & 18 months)
undergo a 3 day training scheme. During training they are exposed to legal
(e.g., /BROP/) and illegal (e.g., /BZOP/) pseudowords. Changes in neuronal
processing are assessed prior to and after training using simultaneous EEG
and fNIRS. 3 different training schemes are tested: (i) passive familiarization,
(ii) statistical learning of pairings between pseudowords and real objects and
(iii) statistical learning using pseudoobjects. Results: in 38 6-month-olds the
complete 3-day training using statistical learning with real objects (upper
fig.) was performed. EEG data suggest a training induced modulation of legal
and illegal pseudowords while preliminary fNIRS results seem to confirm a
differential processing of legal and illegal pseudowords but analysis of
training induced modulations needs to be finalized in order to get a clearer picture. Conclusion and
Perspective: This study on a longitudinal 3-day training in infants demonstrates that combined EEG-
fNIRS assessment of plasticity in response to an intervention can be investigated in very young infants.
For the case of prelexical properties of speech the project taps into the more general question how
plasticity changes during development are related to the emerging linguistic competence (lower fig).
ROSSI, S., HARTMÜLLER, T., VIGNOTTO, M. & OBRIG, H. submitted. Modulation of lexical processing by repetitive exposure to foreign phonotactic rules. ROSSI, S., JURGENSON, I. B., HANULIKOVA, A., TELKEMEYER, S., WARTENBURGER, I. & OBRIG, H. 2011. Implicit processing of phonotactic cues: evidence from electrophysiological and vascular responses. J Cogn Neurosci, 23, 1752-64.
56
119

Classifying Hemodynamic Responses to Auditory Input in Preverbal Infants
Eswen Fava1, Rachel Hull2, & Heather Bortfeld3 1 University of Massachusetts, Amherst; 2 Texas A&M University; 3University of Connecticut
Numerous studies have provided clues about the ontogeny of lateralization of auditory processing in humans, but most have employed specific subtypes of stimuli and/or have assessed responses in discrete temporal windows. The present study used near-infrared spectroscopy (NIRS) to establish changes in hemodynamic activity in the neocortex of preverbal infants (aged 4-11 months) while they were exposed to two distinct types of complex auditory stimuli (full sentences and musical phrases). Measurements were taken from bilateral temporal regions, including both anterior and posterior superior temporal gyri/sulci. When the infant sample was treated as a homogenous group, no significant effects emerged, nor were any effects detected when infants were subgrouped by age. However, when infants’ hemodynamic responses were categorized according to their overall changes in volume, two very clear neurophysiological patterns emerged. Infants with high-volume hemodynamic responses (the high responder group) showed a pattern of early and increasing activation, primarily in the left hemisphere, similar to that observed in comparable studies with adults. In contrast, infants with low-volume hemodynamic responses (the low responder group) showed a pattern of gradually decreases in activation over time. These differences (focusing on HbO2) are highlighted in the two figures below. Notably, no significant differences emerged for type of auditory input (speech versus music), suggesting that the high versus low responder characterization generalizes across classes of auditory stimuli. These results highlight a new way to conceptualize the variability frequently observed across infant participants, with hemodynamic response volumes potentially serving as an early indicator of developmental changes in auditory sensitivity. We are currently examining the relationship between hemodynamic response volume/direction and infants’ performance on a battery of standardized perceptual measures.
57
120

Six-month-olds’ brains respond more to highly frequent vowels
Sho Tsuji1,2*, Alejandrina Cristia3, Paula Fikkert1, Yasuyo Minagawa-Kawai4, Peter Hagoort3, Amanda Seidl5, & Emmanuel Dupoux6
1Radboud University Nijmegen, Netherlands, 2International Max Planck Research School for Language Sciences,3Max Planck Institute for Psycholinguistics, Nijmegen, Netherlands, 4Keio University, Tokyo, Japan, 5Purdue University, West Lafayette, USA, 6Ecole des Hautes
Etudes en Sciences Sociales, Paris, France * [email protected]
Functional Near InfraRed Spectroscopy (fNIRS) has provided unprecedented insight into the emergence of language networks in the infant brain. A number of studies have shown that, in infants 6-20 months, discrimination of vowels that are present in the native language evokes larger and/or more left-lateralized responses than discrimination of comparable stimuli which are absent from the infants’ ambient language (Minagawa -Kawai et al, 2007). The relative contributions of maturation and exposure in the emergence of networks specialized in the ambient language is, however, poorly understood. Previous evidence suggests that maturation is a necessary precondition for some linguistic abilities (Pena et al., 2010). But is maturation sufficient, or must infants further have sufficient exposure to a given sound contrast in order to display language-specific responses to it? To answer this question, we assessed 5-7 month old Dutch infants’ brain responses to contrasts between a pair of highly frequent (/I/ - /eI/) and a pair of highly infrequent (/ʏ/ - /ø/) native vowels. Both of the vowel contrasts were native to the infants and additionally matched on acoustic and perceptual characteristics. However, they differed markedly in their frequency of occurrence in Dutch. As a result, at any given age, infants will have had greater exposure to the high frequency than the low frequency vowels. A difference in processing of the two contrasts would indicate that exposure plays a role beyond maturation. Standard artifact detection and detrending were applied, followed by GLM analyses on oxygenated hemoglobin. A ROI was defined by 5 channels above perisylvian regions, which were activated (p uncorr < .05) at one or both conditions, in the left or right hemispheres (see Fig. 1). The resulting average ß for the ROI was entered into an ANOVA with Condition (high Frequency, low Frequency) and Hemisphere (left, right) as factors. Results revealed a main effect of frequency [F(1,21) = 3.94, p = .06] with a higher ß for the frequent compared to the infrequent contrast (Fig. 2), with no main effect of hemisphere and no interaction between the factors. These results strongly suggest that frequency of exposure modulates brain responses to native language contrasts at around six months of age. Such a finding is most compatible within an interactional view of the emergence of language networks in the human brain, according to which such specialized responses rely crucially on both maturation and experience.
Figure 1: Channels constituting ROI Figure 2: HRF over ROI channels
58
121

Vowels and Consonants at Birth: a NIRS study Camillia Bouchon1, 2 ([email protected]), Judit Gervain1, 2 & Thierry Nazzi1, 2
1 Laboratoire de Psychologie de la Perception, UMR 8158, Universite Paris Descartes - 2 CNRS
Our main goal is to investigate the perception of Vowels (Vs) and Consonants (Cs) in newborns. Cs and Vs are functionally asymmetric: Cs weigh more in lexical tasks, whereas Vs carry more information at the structural levels: prosody, morphology and syntax (consonantal & vocalic biases respectively, Nespor, Peña, & Mehler, 2003). Both biases have been observed in adults, infants, and recently before 12 months (Hochmann et al., 2011, Nishibayashi & Nazzi, 2012). If this “division of labor” started at birth, it would constitute a significant learning bias towards the acquisition of lexical and structural levels of language. However a certain amount of exposure to speech may be necessary before infants use this Cs/Vs functional asymmetry. For instance in a lexical task 6-month-olds exhibit a bias for Vs (Hochmann, 2010) contradicting Nespor et al. (2003)’s predictions. In order to directly investigate the starting point of the C/V functional asymmetry, the current study measured the responses of the newborn brain using NIRS, to speech signals which according to the division of labor hypothesis, should elicit a vocalic bias under one experimental condition (extraction of regularity), and a consonantal bias under another (item-based learning). Gervain et al. (2008) found a differential response in temporal and left frontal areas between ABB and ABC in CVCVCV sequences (e.g. “mubaba” vs. “mubage”, respectively). This extraction of a repetition rule over syllables is important for acquiring linguistic structures (Marcus et al., 1999). The current study uses Gervain et al. (2008)’s paradigm, with 3 different patterns: the ABC rule (e.g. “mulevi”) and two different ABB rules: ABBc with repetition of Cs, e.g. “muleli”, and ABBv with repetition of Vs, e.g. “muleve”. The 3 patterns are presented in 2 block designs: - Exp. 1 extraction of regularity: heterogeneous blocks of 6 different items; - Exp. 2 item-based learning: homogeneous blocks of 6 repetitions of the same word; The “division of labor” hypothesis predicts that Exp. 1 encouraging rule detection, should favor the ABBv over ABBc sequences; whereas, Exp. 2 encouraging identification of a repeated unit, this resembles ‘lexical’ processing that should favor ABBc over ABBv sequences. Both experiments used the same material: 36 CVCVCV synthesized with MBROLA, with minimized acoustic differences between Cs and Vs.
So far 16 newborns have been kept for the analysis in Exp.1 (cf. Fig.1). Comparing ABC and ABBv yielded à significantly greater activation for ABC in channels 2 (P = .01) and 5 (P = .02) (paired sample t-test, p values are uncorrected) indicating that ABC and ABBv are distinguished in the left frontal area. Comparing ABBc and ABBv yielded a significantly greater activation for ABBc in channel 4 (P = .03), indicating that ABBc and ABBv are distinguished in the left temporal area. Comparing ABC and ABBc yielded no significant differences. Overall these preliminary results suggest, first, a stronger involvement of the LH for all 3 patterns; and secondly, a repetition suppression effect occurring for the ABBv pattern. This confirms the predicted vocalic bias in bias in a context favoring the extraction of regularity.
Testing of Exp. 1 & 2 will be completed before the conference.
Figure 1. Grand average oxyHb
changes evoked by ABC, ABBc & ABBv
in Exp. 1. The x-axis represents time in
seconds; the y-axis shows concentration in
mmol-mm. The rectangle along the x-axis indicates time of
stimulation.
59
122

Experience-Dependent Changes in Infant Brain and Behavior: The Case of Color Priming Teresa Wilcox, Texas A&M University ([email protected])
One notable property of the immature brain is the remarkable capacity for experience-dependent changes in structure and function. Most research has focused on the extent to which repeated and extensive experience helps shape the development of our perceptual and cognitive systems. The current research explores the extent to which limited and selective experience can alter brain and behavior in the infant. Previous behavioral studies have revealed that prior to 11.5 months infants do not spontaneously use color information to individuate objects. However, select experiences can prime younger infants to do so (Wilcox & Chapa, 2004). For example, if 9.5-month-olds are first shown events in which color predicts object function (Fig.1a) they showed prolonged looking to a green ball-red ball test event (Fig. 2). This is taken as evidence that infants individuated the objects (they interpreted the event as involving two objects and recognized that both objects could not fit behind the narrow screen). Infants aged 9.5 months do not typically individuate-by-color (do not show prolonged looking to the this event). If the pretest events involve distinct motions but the motions are not functionally relevant (Fig.1b) priming is not observed. It is the linking of color to an object property to which infant are already sensitive – object function – that leads to increased sensitivity to color information, which is then carried forward to the subsequent test event. The current research investigated whether experience-dependent changes in object processing are accompanied by changes in patterns of neural activation. That is, does color priming alter functional activation of the infant cortex? Method: Infants first viewed either a function or motion event (Fig. 1). Next, infants' capacity to individuate-by-color was assessed using the narrow-screen test event (Fig. 2). Infants saw 4 20 s test trials. Each trial was preceded by a 10 s baseline event in which a curtain was lowered over the front of the apparatus and infants were given no auditory or visual stimulation. NIRS data were collected at 9 channels localized over four cortical areas (Fig 3): anterior temporal (T3), posterior temporal (T5), posterior parietal (P3), and primary visual (O1) cortex. Changes in HbO, compared to baseline, were averaged over trials and participants to obtain a grand average for each group. Previous research implicates neural activation at T3 as important to individuation-by-feature in the infant (Wilcox et al., 2011). Looking time data were collected and averaged. Results: The infants in the function but not the motion condition showed prolonged looking to the narrow-screen test event, indicating that only the former group individuated-by-color. This is consistent with previous reports that viewing function but not motion events leads to increased sensitivity to color information in a subsequent individuation task. Different patterns of activation were also obtained in response to the function and motion events. Whereas both groups showed activation at V1 and T5, only the function group showed activation at T3. An additional group of infants saw the test event without first seeing pretest events: they showed behavioral and neural responses similar to those of the infants in the motion group. These results reveal experience-dependent changes in cortical activation in infants after limited and selective exposure to pretest events. The neural mechanisms that support such plasticity in the immature brain are speculated upon.
Fig. 1a. Function Event Fig. 1b. Motion Event
Fig. 2. Narrow-‐screen test event
Fig. 3. Placement of sources (red circles) and detectors (black squares) and the corresponding nine channels.
60
123

Randomized, double blind, placebo controlled, crossover design to evaluate MPH effect in ADHD
children using fNIRS monitoring during Go/NoGo task
Yukifumi Monden1,4, Ippeita Dan3, Masako Nagashima1, Takanori Yamagata1, Eiju Watanabe2,
Mariko Y Momoi1 1Departmet of Pediatrics, Jichi Medical University 2Departmet of Neurosurgery, Jichi Medical University 3Functional Brain Science Laboratory, Jichi Medical University 4Departmet of Pediatrics, International University of Health and Welfare Hospital
e-mail address: ① [email protected] ② [email protected]
【Objective】
Functional neuroimaging data on ADHD in children is sparse compared to those of adults, whose less
activation was revealed at prefrontal cortex (PFC) during attention and inhibition tasks. Developing
feasible test to assess the brain dysfunction of ADHD in children is of value for the early and objective
diagnosis and the evaluation of the treatment. We applied fNIRS to assess the activity of PFC and the
effect of methylphenidate (MPH) during Go/NoGo tasks for ADHD in children.
【Methods】
Sixteen patients (12 boys, 4 girls; mean age, 8.6 years; range, 6-13 years) with ADHD fulfilling
DSM-IV criteria were enrolled after obtaining informed consent from the parents. All patients were
right-handed with IQ>70. As controls, 16 healthy children were recruited. Sixteen ADHD and control
subjects were matched in gender and age. Randomized, double blind, placebo-controlled, crossover
design was conducted to evaluate MPH effect in ADHD children using fNIRS monitoring during
Go/NoGo task. After the first examination, patients took MPH (18-45 mg) or placebo, and repeated
the similar measurement 1.5 h after medication. The control subjects undertook fNIRS measurement
only once without taking medication.
【Results】
Before MPH administration, patients showed no significant activation in the right ventrolateral PFC
(R-VLPFC) (p<0.05) compared with controls. MPH significantly increased brain activation in the
R-VLPFC compared to the placebo (p<0.05). The degree of brain activation after the administration
of MPH was comparable to that in controls.
【Conclusion】
This fNIRS-based research presents the first neuropharmachological evidence of the MPH effect in
ADHD children. Attention and inhibition control in ADHD was related to the R-VLPFC. fNIRS
effectively showed the biological effects of MPH.
61
124

Different Patterns of Activation in Temporal Cortex to Function vs. Non-Function Events Teresa Wilcox, Amy Hirshkowitz, Laura Hawkins
Texas A&M University
Over the last several decades a great deal of research has been conducted to explore the neural basis of object motion processing in the human. Existent literature suggests that human infants use motion-carried information to distinguish between broad categories of objects (e.g., biological vs. non-biological; artifacts vs. natural kinds) and events (function vs. non-function; goal directed vs. non-goal directed). In addition, the adult cortex contains specialized systems for processing these broad categories. For example, distinct cortical areas involved in processing of biological vs. non-biological motion (Pelphrey et al., 2003; Peuskens et al., 2005) and different patterns of activation are observed in response to social vs. mechanical events (Chao et al., 1999; Moore & Price, 1999; Martin & Weisberg, 2003). However, little is known about the origins and development of these specialized systems. One common finding is that the superior temporal sulcus (STS) is involved in processing of meaningful and/or biologically relevant object motion. There is some evidence that the infant cortex may be organized in ways similar to that of the adult (Lloyd-Fox et al., 2011; Shimada & Hiraki 2006), which suggests early developmental specialization. The present research explored the extent to which category-specific differences are observed in neural response to function verses non-function events. Infants mean age 9.5 months viewed one of two events live in a puppet-stage apparatus: function (n=21) or non-function (n=19). In the function event, infants saw a green or red object either pound a nail or scoop and pour salt, respectively, on alternating trials (Fig. 1). In the non-function event, the objects underwent similar motions but to the side of the nail-box or salt-box. Hence, the function and non-function events were perceptually similar but differed in whether the actions were functionally relevant. Each trial was 30 s in duration and preceded (and followed) by a 10 s baseline event in which a curtain was lowered over the front of the apparatus, without auditory or visual stimulation. Optical imaging (fNIRS) data using a NIRS 8x8 (TechEn) were collected at 9 channels localized over four cortical areas (Fig 2): visual anterior temporal cortex (1,2,3), posterior temporal cortex (4,5), posterior parietal cortex (6,7) and visual cortex (8,9) (Figure 2). Changes in HbO, compared to baseline, were averaged over 4 test trials and participants in each group. Different patterns of activation were obtained in response to the function and non-function events (Fig 3). Most importantly, activation was obtained in anterior temporal cortex in response to the function events and in posterior temporal cortex in response to the non-function events. These results reveal that some of the same category-specific patterns of activation that have been observed in adults are also observed in infants.
62
125

Corresponding Author: [email protected]
Hemodynamic Correlates of Ratio-Based Numerical Discrimination in Infancy: An fNIRS Study Laura A. Edwards1,3, Jennifer B. Wagner 2,3, Daniel C. Hyde4, & Charles A. Nelson1,2,3
1Harvard Graduate School of Education, 2Harvard Medical School, 3Boston Children’s Hospital, 4University of Illinois at Urbana-Champaign Studies on pre-verbal infants and non-human primates have demonstrated evidence of an early nonverbal cognitive system for representing number (see Carey, 2009; Dehaene, 1997; Feigenson, Dehaene, & Spelke, 2004; Gallistel, 1993 for reviews). One key behavioral signature seen across populations and species is sensitivity to the ratio between two numerical quantities to be compared (see Feigenson et al., 2004 for a review). That is, the ability to discriminate between any two numerical quantities seems to be a function of the ratio between them, with discrimination becoming harder as the ratio approaches 1. The behavioral observance of the ratio signature suggests that this system is present from birth, and shared with a variety of non-human animals. Furthermore, recent work suggests that this primitive number system may form the basis for the later acquisition of symbolic and mathematical concepts (e.g. Halberda et al., 2008; Gilmore et al., 2010). Despite its importance, relatively little is known about the neural basis of this system early in development. Several studies using event-related potentials (ERPs) suggest that infants and adults show common functional brain signatures to ratio-based numerical changes. However, the functional neuroanatomy of these signals cannot be confidently determined through these methods (Hyde & Spelke, 2011; Izard et al., 2008; Libertus et al., 2010). One previous study has employed fNIRS to study the mechanisms of numerical processing in infancy (Hyde et al., 2010). While this study reports sensitivity and selectivity for number changes in the right parietal lobe, its findings are limited given the small number of parietal and occipital sites from which the researchers where able to record. The current study aimed to expand on previous fNIRS work on numerical processing in infancy by estimating the hemodynamic response using NIRS over a wider range of posterior scalp sites, and by employing a potentially more powerful number alternation block design. Specifically, using a Hitachi ETG-4000 NIRS system, we presented 6-month-old infants with dot arrays either differing in a 1:2 ratio or showing no change (1:1 ratio). Two 3 x 3 chevron arrays of emitter and detector optical probes were placed over occipital and parietal regions of both hemispheres. Changes in oxy- and deoxyhemoglobin were monitored as infants passively viewed up to 20 blocks of quantity stimuli. Each block contained 10 stimulus images which remained onscreen for 500ms each. The first block (and all subsequent odd-numbered blocks) contained a series of 10 unique arrays of 8 dots; the second block (and all subsequent even-numbered blocks) contained a series of alternating arrays of 8 dots and 16 dots. Fifteen infants with at least three useable blocks of each type were included in subsequent analyses. We observed a significant difference in the concentration of oxyhemoglobin to the left parietal region during viewing of alternating displays of 8 and 16 dots, compared to viewing only 8 dot displays (p = 0.05). This finding is consistent with previous work using fMRI to examine numerical processing in school-aged children and adults (Ansari & Dhital, 2006; Isaacs et al., 2001), though it is in contrast to Hyde et al. (2010), who observed only a right parietal response to number changes using an adaptation design with infants. The employment of additional parietal recording sites and a different experimental design may have allowed us to detect left parietal sensitivity where others found none in infants. Nevertheless, these findings taken together suggest that infants show neural sensitivity to viewing numerical changes despite the absence of spoken language or number words. Continued work will further elucidate the neural mechanisms for numerical processing in pre-verbal infants, how these mechanisms change over development, and how these changes relate to conceptual numerical development.
63
126

DBIfNIRS: A community-augmented online DataBase of Infant functional Near InfraRed Spectroscopy studies
Alejandrina Cristia,1,* Emmanuel Dupoux,2 Yoko Hakuno,3 Sarah Lloyd-Fox,4 José Kivits,1 Manuela Schuetze,1 Tomas Bergvelt,1 Marjolijn van Gelder,1 and Yasuyo Minagawa-Kawai3
1Neurobiology of Language, Max Planck Institute for Psycholinguistics, Nijmegen, Netherlands, 2Ecole des Hautes Etudes en Sciences Sociales, 3 Keio University, 4Birbeck University
* [email protected] Until recently, neuroimaging the infant brain was extremely challenging. However, this seemed to change with the advent of fNIRS, a technique that is becoming increasingly common in the study of infant motor, perceptual, and cognitive development. In such an emergent field, it is particularly important to share methodological knowledge that will allow replicable and robust results. We present DBIfNIRS, a community-augmented database that facilitates precisely this exchange. We tabulated 76 articles and theses published between 1998 and 2012 reporting 109 experiments on infants below 3 years of age along several methodological dimensions. The resulting spreadsheet was uploaded in a format allowing individuals to both continue to contribute their new results, and download the most recent version from the nucleating website, https://sites.google.com/site/dbifnirs/. We illustrate the usefulness of the database by revealing a number of factors affecting 2 key variables: infant attrition, and the reliability of oxygenated and deoxygenated responses. For example, we find that attrition rates vary nonlinearly with infant age within the first year (~ 20% at 0-2 months, >50% at 4-3 months and over 9 months, ~35% at 5-8 months); and attrition rates increase with the number of optodes on the headgear (see Figure 1). Finally, we summarize general strengths and weaknesses of the DBIfNIRS, and outline future developments.
Figure 1: Proportion of infants excluded as a function of number of optodes. Number of optodes is totaled over sources and detectors. Each letter indicates an entry, coding for the system: “i" stands for Hitachi, “a” for Hamamatsu, and “x” for all other systems. The boxplot on the right bottom panel represents the exact same data, collapsing into two categories: less than 20 optodes, and more than 20 optodes.
64
127

Perception of rhythmic grouping: An optical imaging study
Nawal ABBOUB1, Thierry NAZZI1,2 & Judit GERVAIN1,2 1Université Paris Descartes, 2CNRS
[email protected], [email protected]
The goal of the present study was to test whether neonates’ early brain specialization for language is driven exclusively by a universal preparation for language, or whether there is influence from prenatal language experience. To do so, we tested the perception of the iambic/trochaic law (ITL) in newborns. The ITL claims that elements contrasting in duration naturally form rhythmic groupings with final prominence (Short-Long), whereas elements contrasting in intensity/pitch form groupings with initial prominence (Strong/High-Weak/Low) (Woodrow, 1909; Hayes, 1995; Nespor et al., 2008). It has been hypothesized that ITL can be modulated by language experience in adults and infants (Yoshida et al 2010, Bion et al 2011, Iversen et al 2008, Bhatara et al 2012). These findings are in opposition to Hay and Diehl (2007), who found that linguistic rhythm perception relies on general auditory mechanisms rather than being influenced by the linguistic environment, and thus perceptual grouping would not be culturally dependent. Languages differ in their typical stress patterns. According to the ITL, languages that are predominantly iambic would rely on durational contrasts and predominantly trochaic languages would rely mainly on pitch and intensity contrasts, both at the levels of words and phonological phrases. Young infants develop preferences for particular stress patterns in speech depending on the stress pattern of their native language (Höhle, Bijeljac-Babic, Herold, Weissenborn, & Nazzi, 2009; Jusczyk, Cutler, & Redanz, 1993) . When does this sensitivity to prosodic prominence/grouping first emerge and is it influenced by early, possibly even prenatal, experience? To answer this question, we used near-infrared spectroscopy (NIRS) to measure neonates’ brain responses to tone sequences that varied in duration or pitch. These stimuli followed the ITL-predicted grouping patterns (short-long or high-low) or the non-predicted grouping pattern (long-short or low-high) or did not provide any grouping cues (equal duration and pitch). We conducted two experiments: one where tones sequences varied only in duration (Experiment 1) or in pitch (Experiment 2). In each experiment, we compared neural responses to iambic sequences (short-long or low-high), trochaic sequences (long- short or high-low) and neutral ones (short-short/long-long or low-low/high-high).
Results from Experiment 1 (n= 10) showed that healthy, full-term newborns (exposed to French in utero) had significantly greater brain response to the iambic sequences (short-long) than to the trochaic sequences (long-short), in particular in the auditory areas of the left hemisphere.
Experiment 2 is ongoing.
Experiment 1 thus suggests that the ITL might be in place very early on, possibly at birth. However, Experiment 2 will provide crucial evidence, as the newborns tested in Exp 1 were mostly exposed to French, an iambic language. Therefore, only Exp 2, using a contrast not present in the infants’ prenatal experience, can provide definitely conclusions.
65
128

Shape Difference
Control Speed Discontinuity
Age-related Changes in the Functional Organization of Object Processing Pathways Teresa Wilcox, Amy Hirshkowitz, and Laura Hawkins
Texas A&M University
Previous studies conducted in our lab suggest that different patterns of neural activation are obtained when infants individuate-by-feature than when they fail to do so. Furthermore, there are age-related changes in patterns of neural activation obtained during individuation-by-feature. The goal of the current research was to identify when this re-organization occurs and the extent to which it is seen when infants individuate-by-spatiotemporal information. We investigated age-related changes in functional activation to a shape-difference and a speed-discontinuity occlusion event. Behavioral studies have demonstrated that 4.5- and 11.5-month-olds interpret the shape-difference event as involving two objects. Infants aged 4.5 months (11.5-month-olds have not yet been tested) interpret a speed-discontinuity event as involving two objects. Method: Infants aged 4.5, 7.5, and 11.5 months viewed one of three events on a puppet-stage apparatus (Fig. 1). Infants saw the event appropriate for their condition on four consecutive 24 s trials. Each trial was preceded (and followed) by a 10 s baseline (the curtain was closed over the front of the apparatus). NIRS data were collected at 9 channels localized over four cortical areas (Fig 2): anterior temporal (T3), posterior temporal (T5), posterior parietal (P3), and primary visual (O1) cortex. Changes in HbO, compared to baseline, were averaged over trials and participants to obtain a grand average for each group. Previous research implicates neural activation at T3 as important to individuation-by-feature (Wilcox et al., 2011). Results: Patterns of activation at each of the nine channels, for each of the three age groups are displayed in Fig 3. Three main findings emerged. First, at all three ages activation was observed at V1, T5, and T3 in response to the shape difference event. However, the younger infants also showed activation in P3, indicating that analysis of shape differences in young infants draws on the dorsal system. Furthermore, patterns of activation observed at T5 were less robust in the 7.5- and 11.5month-olds (and did not differ significantly from control). Second, at all three ages activation was observed at V1 and P3 in response to the speed-discontinuity event. However, only the 4.5- and 7.5-month-olds also evidence activation in T5 and T3. This suggests that all three ages detected the speed discontinuity, but only the two younger groups used the speed discontinuity to individuate the objects. Looking time data supports this conclusion: only the two younger groups found the speed-discontinuity event surprising. Finally, the 7.5- and 11.5-month-olds showed less activation in V1 and T3 to the control event. Overall, these results suggest paring down of pathways and/or structures involved in object processing during the first year of life, starting at least by 7.5 months.
Fig. 2. Placement of sources (red circles) and detectors (black squares) and the corresponding nine channels.
Fig. 1. Test events
66
129

Multimodal EEG-NIRS studies of noxious and sensory stimulation in newborn infants
Madeleine Verriotis1; Amy Lee1; Lorenzo Fabrizi1; Rebeccah Slater1,2; Stewart Boyd4; Alan Worley4; Maria Fitzgerald1; Judith Meek3 1Dept. Neuroscience, Physiology and Pharmacology, UCL. 2Nuffield Dept. of Anaesthetics, University of Oxford. 3EGA Obstetric Wing, UCLH. 4Dept. Clinical Neurophysiology, GOSH. Correspondence: [email protected]
Aim: To simultaneously measure electrophysiological and haemodynamic responses to innocuous and noxious sensory stimuli in newborn infants.
Introduction: Previous EEG studies1 have shown a changing pattern of cortical responses to pain and touch in early development, with a transition from a temporal to central location at approx. 35-37 weeks gestational age (GA). The purpose of this study was to measure haemodynamic correlates to this electrophysiological activity.
Methods: Participants were healthy infants (34 – 41 weeks GA) studied at 0 – 3 days of age (n=10).
Noxious stimulation was a clinically required heel lance. Group 1 received the heel lance, a sham (the auditory and tactile components without the lance), and an auditory click stimulus. Group 2 received calibrated touch to the heel with a customised tendon hammer.
Brain activity was monitored with simultaneous and synchronised EEG and NIRS recordings. EEG electrodes were placed according to the international 10:20 system. Haemodynamic responses (concentration changes in µmol/L) were obtained at contralateral central (C3/C4) regions, as described previously2, and in temporal (T3/T4) regions using the NIRO-200NX (Hamamatsu Photonics K.K.).
Results: To date we have successfully obtained data from 10 infants; 5 heel lance studies and 5 innocuous stimulation studies.
Table 1: Mean (range) concentration change (µmol/L) per stimulus type and optode location.
C3/C4 Optode T3/T4 Optode HbO HHb HbT HbO HHb HbT
Lance 5.0 (1.4-8.5) 2.5 (1.5-4.4) 5.2 (2.3-9.3) 1.9 (0.1-5.0) 3.5 (.1-10.1) 3.2 (0.0-9.1) Sham 2.2 (1.7-2.5) 2.6 (1.7-3.3) 2.6 (1.1-4.3) 2.0 (1.5-2.9) 0.7 (0.2-0.9) 1.8 (1.4-2.5)
Auditory 3.4 (1.1-6.6) 2.2 (0.4-4.6) 4.0 (1.0-8.0) 3.9 (1.2-6.2) 0.5 (0.1-1.0) 4.0 (1.2-5.9) Touch 0.9 (-.1-2.0) 0.6 (0.2-1.1) 1.0 (-.5-2.3) 0.9 (0.2-1.4) 0.3 (0.0-0.6) 0.8 (-.5-1.5)
Concurrent EEG measurements were consistent with previous work which differentiated noxious and touch components1.
Conclusion: We have demonstrated that it is possible to measure simultaneously electrophysiological and haemodynamic responses from both central and temporal regions in newborn infants.
References: 1. Fabrizi et al. (2011). A shift in sensory processing that enables the developing human brain to
discriminate touch from pain. Curr Biol, 21: 1552-1558. 2. Slater et al. (2006). Cortical pain responses in human infants. J Neurosci, 26: 3662-3666.
67
130

Integrating Behavioral and Neural Dynamics over Development in the Dimensional Change Card Sort (DCCS) Task Aaron T. Buss & John P. Spencer University of Iowa, Department of Psychology, Delta Center
We use fNIRS to test a hemodynamic prediction of Dynamic Field Theory (DFT) with 3-
and 4-year-olds in the Dimensional Change Card Sort (DCCS) task. The DCCS requires children
to switch between shape and color rules when sorting cards. Three-year-olds typically
perseverate, while 4-year-olds switch rules. Between these ages, frontal activation also becomes
stronger, suggesting that frontal activation is necessary for rule-switching. However, 3-year-olds
can reliably switch rules when visual conflict is absent (No-Conflict version) during the pre-
switch phase. If frontal activation is necessary for rule switching, then how are 3-year-olds with
an immature frontal cortex able to switch rules at all?
In previous work, we used DFT to capture children’s behavioral performance in the
DCCS task in quantitative detail. Here, we examined whether we could use this neuro-dynamic
model to generate hemodynamic predictions which we could test using fNIRS. Model
simulations predict that 3-year-olds who perseverate in the standard task should show stronger
frontal activation when they switch rules in a No-Conflict version. This is driven by the fronto-
parietal connectivity in the model. When no-conflict test cards are used during the pre-switch
phase, memories about the task and the current inputs for the posterior system spatially overlap.
This overlap sends strong inputs to the frontal cortex, which increases frontal activation via
reciprocal fronto-parietal loops. We successfully tested this prediction using fNIRS with 3- and
4-year-olds: Perseverators showed stronger frontal activation when switching in the No-Conflict
version of the task compared to when they perseverated in the standard task.
68
131

Neural responses to point-light displays of biological motion in the first year of life: a
functional near-infrared study
Anderson, L.C., Bennett, R.H., Bolling, D.Z., Pelphrey, K.A., Kaiser, M.D.
From birth, human infants preferentially attend to point-light displays (PLDs) of
biological motion over scrambled motion (Simion, Regolin, & Bulf, 2008). The posterior
superior temporal sulcus is involved in biological motion processing in typical children and
adults (Kaiser et al., 2010). Yet, the early development of brain mechanisms for biological
motion processing is not well understood. Functional near-infrared spectroscopy (fNIRS), which
measures of oxygenated (oxy-Hb) and deoxygenated hemoglobin concentrations in cortical brain
regions, is ideally suited to measure correlates of brain activity in awake infants.
fNIRS studies of biological motion processing in infants have been limited to a narrow
age range (Lloyd-Fox et al., 2009, 2011) and have not included PLDs of full body motion
(Ichikawa et al., 2010). Thus, the purpose of the current study was to track the typical
development of the neural underpinnings of biological motion processing, per se, across the first
year of life. We monitored regional cerebral blood volume changes using a 24-channel NIRS
apparatus over bilateral temporal regions to measure brain activity while infants viewed 10s
video clips of PLDs of biological and scrambled motion for 7 minutes.
To date, we have data from 6 infants ranging from 3.5-13.2 months (M = 9.5, SD = 3.8).
We calculated changes in oxy-Hb in each channel for integrated blocks of biological and
scrambled trials. We then examined average oxy-Hb levels within a time window of 5-12s post-
stimulus onset and identified channels with a differential response to biological and scrambled
motion greater than 0.1 m[mmol/l]*mm. Three contiguous channels in the left posterior temporal
region met this criterion. Within this region, oxy-Hb concentration changes to biological motion
stimuli trended towards being greater than those to scrambled motion stimuli. As a control, we
performed the same analysis within a 3-channel region in the left anterior temporal region. Here,
we found equivalent oxy-Hb values for biological and scrambled motion. We expect this pattern
to reach significance with a larger sample. We identified a left posterior temporal response to PLDs of biological motion in 6
infants, consistent with several fMRI studies that have found posterior temporal lobe
involvement in typical children and adults. This suggests that within the first year of life, this
region already plays a role in this type of processing. Future work will include a larger sample,
assessed longitudinally, with the goal of charting the development of brain systems involved in
biological motion processing in both typical infants and in those at risk for developing autism.
69
132

Location, Location, Location – Where Are We in the Brain? Authors: Maria M. Arredondo*1, Phoebe Gaston2, Ka I Ip1, 3, & Ioulia Kovelman1,3 1 Department of Psychology, University of Michigan. 2 Department of Linguistics, Yale University. 3 Center for Human Growth and Development, University of Michigan. Functional Near Infrared Spectroscopy (fNIRS) exhibits many advantages over other neuroimaging technologies: it is child-friendly, quiet, and easily compatible with other imaging methods and medical devices. Precise spatial localization of brain activation, within approximately 3 cm., is one of its most important capabilities. However this spatial precision may be called into question by the fact that, unlike fMRI, fNIRS does not allow researchers to see brain anatomy beneath the skull. Furthermore, unlike ERP, its probe distances are inflexible and caps of different sizes may then situate the probes atop different spatial locations within the brain. Traditional solutions to the fNIRS spatial localization dilemma have involved co-registration with the ERP 10-20 coordinate system using fMRI scans with vitamin-E probes, and 3D tracking devices. Here we propose the importance of an additional solution: functional localizers. fMRI researchers frequently use these “functional localizer” tasks to more accurately define within individual subjects the region specific to the relevant brain function, since the exact location of this functional specificity may vary (see Saxe, Brett & Kanwisher, 2006). We propose that the use of functional localizers is an important step towards improving the fNIRS research method. In our study we explore different functional localizer tasks for use in the study of various language functions (phonology, semantics, and grammar), and will present the efficacy of these tasks in localizing brain regions specific to language function, using fNIRS. The goal of the present work is to improve the fNIRS imaging method and to foster a forum for creating and standardizing functional localizer tasks for various aspects of cognition and perception in various age groups. Reference: Saxe, R., Brett, M., & Kanwisher, N. (2006). Divide and conquer: A defense of functional
localizers. NeuroImage, 30, 1088-1096. *Presenting author’s email address: [email protected]
70
133

Poster Session Applications: Adult (I)
Poster #: 71-‐83
134

Assessment of hemodynamic activity modulations: investigating visual short-term
memory mechanisms through fNIRS and EEG
F. Scarpa*, S. Brigadoi, S. Cutini, P. Scatturin, R. Dell’Acqua, G. Sparacino
University of Padova, Padova, Italy *[email protected]
Introduction:
Functional near-infrared spectroscopy (fNIRS) is a neuroimaging technique capable of monitoring
hemodynamic activity within human head in a low cost and noninvasive manner. A proper analysis of
the so-called stimulus-evoked hemodynamic response (HR) is crucial to interpret the functional
activity of the brain. Unfortunately, the estimation of HR from fNIRS signal is difficult because of the
presence of random noise and some other physiological components. The assessment of HR is
challenging above all in event-related paradigms, in which the HR elicited by a single briefly
presented stimulus is completely hidden by noisy components. However, event-related paradigms are
essential in the studies of cognitive mechanisms, as in the investigation of visual short-term memory
(VSTM). The hypothesis that the bilateral increase of BOLD response in the parietal cortex found in
functional magnetic resonance imaging (fMRI) studies [Robitaille et al., Neuroimage, 2010], and
contralateral parietal increases in event-related negativity, found in electrophysiological works [Luria
et al., Journal of Cognitive Neuroscience, 2010], might be different reflections of the same underlying
neural/functional processing is here investigated in a synchronous recording of event-related potential
(ERP) and fNIRS signals. Given the lack of a standard method for fNIRS signal processing, a new
method to estimate stimulus-evoked HR from fNIRS measurements within an event-related paradigm
is proposed.
Material and Methods:
The signal is acquired in EEG-fNIRS co-registration sessions from three subjects performing a
variant of the change-detection task proposed in a previous study [Cutini et al., Neuropsychologia,
2011], which was based only on fNIRS recordings. A new filtering technique for HR estimation is
developed, based on the exploitation of a “reference” channel characterized by a source-detector
distance less than 1 cm. Signal from the reference-channel is exploited to estimate a parametric model
of the physiological noise, which is then used to correct the recordings from the remnant “standard”
channels (with source-detector distance of 3 cm). Then residual random noise is reduced by adopting a
Bayesian filtering approach, designed on a single-trial basis [Scarpa et al., Optics Express, 2010].
Results and Conclusions:
As expected, results from EEG data show that maintenance of unilaterally encoded objects elicits
unilateral (contralateral) an increase in event-related negativity in parietal cortex which is proportional
to the number of objects retained in visual short-term memory. Results from fNIRS data show that
maintenance of bilaterally encoded objects elicits bilateral increases of hemodynamic activation in
IPS-IOS cortex, proportional to the number of objects retained in visual short-term memory, with
increased hemodynamic activity in the contralateral IPS–IOS relative to the ipsilateral condition. The
present findings suggest that EEG and fMRI/fNIRS techniques reveal distinct neural signatures of the
mechanisms supporting visual short-term memory.
fNIRS results are obtained with the previously described filtering technique and are in agreement
with recent findings [Cutini et al., Neuropsychologia, 2011]. On the contrary, results obtained with the
standard block-average technique do not show an increased hemodynamic activity proportional to the
number of objects retained in visual short-term memory, whereas such increase is instead found in
fMRI studies [Robitaille et al., Neuroimage, 2010]. This suggests that the proposed filtering technique
leads to a more correct estimation of the hemodynamic response with respect to standard methods.
71
135

Measurements of Hemoglobin Concentration of the Deep Brain Tissue Using Near-Infrared Time-Resolved Spectroscopy
Hiroaki Suzuki, Motoki Oda, Etsuko Yamaki, Toshihiko Suzuki, Daisuke Yamashita, Kenji Yoshimoto and Yutaka Yamashita
Central Research Laboratory, Hamamatsu Photonics K.K., 5000 Hirakuchi, Hamakita, Hamamatsu, Shizuoka 434-8601, Japan
E-mail: [email protected] 1. Objective In near-infrared time-resolved spectroscopy (NIR-TRS), we found that an optical pulse irradiated to an ear canal could be detected safely at the other ear canal by the means of a highly sensitive photon counting technique. The temporal profiles could also be obtained by a time-correlated single photon counting (TCSPC) method. It is expected that these profiles contain the hemodynamic information of the deep brain area including the brain stem which is responsible for human life-sustaining. Using a highly sensitive TRS system, improved version of TRS-10 [1], we have tested fifty healthy adult volunteers to estimate the hemoglobin information of the deep brain based on photon diffusion theory. 2. Method We developed a highly sensitive TRS system with high-power light source called “Nanosecond Light Pulsers (NLPs)”. NLPs emit light pulses at 760nm, 800nm and 830nm, with a total average power of 3mW. We also employed a detection fiber which raised photon collection efficiency (numerical aperture was 0.56) and a highly-sensitive photomultiplier tube with a GaAs photocathode. Fifty adult volunteers (mean age 40.2±11.4years, range: 23 to 61 years old; 41 men and 9 women) were studied. To measure the hemodynamics of the deep brain in the resting state, the NIR pulsed light was irradiated to the right ear canal and the photons that passed through the brain tissue were collected at the left ear canal. The subjects themselves adjusted the position and the direction of the fiber so that the signal intensity was maximized. 3. Results Optical signals with sufficient intensity were successfully obtained from 46 persons of the fifty volunteers. The mean of the optical path-length was 40.8±3.9cm at 800nm. The theoretical curves derived from the photon diffusion equation [2] were fitted to the measured temporal profiles in order to determine the reduced scattering and absorption coefficients at each wavelength. Then oxyhemoglobin (HbO2), deoxyhemoglobin (Hb), total hemoglobin (tHb) and tissue oxygen saturation (SO2) were calculated. The average values of HbO2, Hb, tHb and SO2 were 26.3±5.0μM, 18.8±2.2μM, 45.1±6.8μM and 58.0±3.5%, respectively. SO2 values of the deep brain were on average 10.1±2.4% lower in contrast to the results at the forehead (correlation coefficient: r=0.73). Moreover, tHb values of the deep brain were always lower than the forehead results. 4. Conclusion We have developed a highly sensitive TRS system and performed hemodynamic measurements of the deep brain area in fifty adult volunteers. The results demonstrated a potential applicability of this system to examine deep inside the brain. References [1] Ohmae E, Oda M et. al., J. Biomed. Opt, 2007, 12: 062112. [2] Patterson MS, Chance B et. al., Appl Opt, 1989, 28: 2331-2336.
72
136
Brain Response to Painful versus Non-Painful Electrical Stimuli
Meryem A. Yücel1, Robert J. Cooper
1, David A. Boas
1, David Borsook
2, Lino Becerra
2
1 Athinoula A. Martinos Center for Biomedical Imaging, Department of Radiology, Massachusetts
General Hospital, Harvard Medical School, Charlestown, MA, USA
2 Pain and Analgesia Imaging Neuroscience (P.A.I.N.) Group, McLean Hospital, Belmont, MA, USA
Awareness under general anesthesia can have significant consequences including the
development of posttraumatic stress disorder. Inadequate surgical anesthesia leading to chronic
pain is a common and late sequelae of surgical incisions affecting approximately 30% of all
surgical patients. Therefore, there is a need for a robust and objective measure of pain sensation
to guide surgical anesthesia to reduce the occurrence of post-operative sequelae. Previous studies
using noxious and innocuous heat stimulation show that it is possible to discern painful stimuli
from non-painful stimuli based on the temporal and spatial characteristics of the response in
somatosensory cortex and frontal brain areas. Based on these studies, noxious stimuli produce a
prolonged or biphasic response whereas innocuous stimuli produce a response similar to other
evoked hemodynamic response. In this study, we sought to detect the hemodynamic response in
somatosensory cortex and in frontal brain areas to innocuous and noxious electrical stimulation
using diffuse optical tomography (DOT) in healthy volunteers. We wanted to see whether the
noxious electrical stimulus also produces a biphasic response similar to noxious thermal
stimulus. We have integrated in the optical fibers into an elastic cap from EasyCap using custom
designed optode ring holders that greatly facilitates placement of the fibers on the head and
adjustment of any hair obscuring the optical signal. Moreover, to filter out the global
physiological changes, we included a short separation detector next to each source in addition to
the long distance detectors. We performed measurements at 690 and 830 nm to obtain sensitivity
to changes in oxygenated, deoxygenated hemoglobin and total blood volume changes on 5
healthy volunteers. Our results show that the response to noxious electrical stimuli is highly
subject dependent, however it is clearly more pronounced compared to innocuous stimuli. The
addition of short separation detectors helped improve the localization of the response.
73
137
An exploratory fNIRS study with immersive virtual reality
Simone Cutini1, Bruno Seraglia1, Luciano Gamberini1, MassimilianoMartinelli1, Konstantinos Priftis1,3
1 Department of General Psychology, University of Padova, Padova, Italy
2 Department of Developmental Psychology and Socialization, University of Padova, Padova, Italy
3 Laboratory of Neuropsychology, IRCCS San Camillo Hospital, Lido-Venice, Italy
Introduction. Virtual Reality (VR) is a useful instrument in several fields and has reached a considerable value in medical, psychological, and neuropsychological treatments (e.g., Tomikawa et al., 2010). Nevertheless, neuroimaging techniques might be very helpful in supporting the VR usefulness in these research fields. Nowadays, functional magnetic resonance imaging (fMRI) is the most commonly used brain imaging technique; fMRI monitors brain activity by using blood oxygen level dependent (BOLD) responses. A major obstacle with fMRI to study the neural correlates of VR experiences regards the “immersion” within the artificial environment. Huge machinery dimensions, disturbing noise, the horizontal and unnatural position of the participant during brain scan, constitute some of the most limiting factors in the use of fMRI with VR. Crucially, functional near-infrared spectroscopy (fNIRS) is cheap, portable and allows the easy use of an adapted Head Mounted Display (HMD) to grant a full immersion into the virtual environment. In the present study we investigated the possibility to implement fNIRS while participants experienced immersive VR. The aim of the study was to investigate whether a modified HMD helmet is suitable for correct signal acquisition with fNIRS in an immersive environment during a visuo-spatial task, such as line bisection. Method. Eight right-handed participants (7 males; 27.6 years: 24–36) participated in the experiment after providing their informed consent. Bilateral hemodynamic activity of the parieto-occipital was recorded with a multi-channel frequency-domain fNIRS (ISS Imagent™, Champaign, IL), equipped with 32 laser diodes (16 emitting light at 690 nm, and 16 at 830nm) modulated at 110MHz, and 4 detectors. Optodes were placed using a recent probe placement method (Cutini et al., 2011). Participants viewed the virtual environment through an adapted V8 Research HMD attached to a modified bike helmet (provided of an intersense tracker) and an fNIRS holder, in order to reach brain areas from the fNIRS optical fibers. The virtual environment was created using 3DStudioMax 8.0 (for the development of three-dimensional objects) and Virtools 3.5 (for the interaction with them). A virtual room was created with a “wooden” table in the center: above and aligned with the table’s center, there was a white panel (50×50 cm) for displaying horizontal lines. There were two viewer-line distances: 60 cm and 120 cm. The lines to be bisected were 4–8 cm-long at the distance of 60 cm, and 8–16 cm-long at the distance of 120cm. Participants bisected the lines using a Nintendo Wiimote® controller (simulating a laser pointer). The Wiimote moved a 2.5mm red dot as a simulation of the same one represented by a real laser pointer. The ‘A’ button on the Wiimote served to memorize the response (i.e., the last point of contact over the line) and to switch to another line and/or distance. Results. We observed statistically significant oxygenated hemoglobin (HbO) activity in most of the occipital and parietal channels. In particular, a pronounced HbO activation was observed in a right parietal channel (PR1) during virtual line bisection. To provide a solid proof in regard to the reliability of the hemodynamic response observed in channel PR1, we compared its activity with that of the symmetrical channel on the left hemisphere (PL1). Interestingly, we observed a marginally significant difference between PR1and PL1 activities (p = .077, t(6) = 1.628, one tailed t-test). Discussion. Results indicated the involvement of the parietal and occipital lobes during line bisection, with a predominance of the right parietal cortex. These results are consistent with previous investigations, which have found parietal activation right hemisphere predominance during attention, space perception and visuo-spatial tasks, such as line bisection (e.g., Fink et al., 2000). In conclusion, the present findings provide solid evidence that fNIRS can be efficiently used during the exploration of virtual immersive environments and can provide a valuable support to VR applications.
References. Cutini, S. et al., 2011. NeuroImage. 54, 919-927. Fink, G.R. et al., 2000. Neurology. 54, 1324–1331. Tomikawa, M. et al., 2010. J.Am. Coll. Surg. 210, 927–933. Acknowledgments . This research was supported by the European Project CEEDS (Number: 258749; Call: ICT 2009.8.4 Human-Computer Confluence).
74
138

Examining Resting State Functional Activity in the Medial Prefrontal Cortex Using fNIRS:
A “Proof-of-Concept” Study
Marie C. McGrath, Ph.D.1 (email: [email protected]); Farzin Irani, Ph.D.
1; Anna C.
Rodriguez Merzagora, Ph.D.2; Danielle Brinckman, B.S.
3; Maria T. Schultheis, Ph.D.
2,3
1Department of Graduate Psychology, Immaculata University, Immaculata, PA
2School of Biomedical Engineering, Science and Health Systems, Drexel University,
Philadelphia, PA 3Department of Psychology, Drexel University, Philadelphia, PA
ABSTRACT
The use of functional near-infrared spectroscopy (fNIRS) to examine functional connectivity
among cortical regions has become a focus of recent fNIRS research (e.g., Medvedev et al., 2011;
Sasai et al., 2011; Sasai et al., 2012). The proposed poster will present the results of a “proof-of-
concept” analysis of the feasibility of using fNIRS to conduct resting state functional
connectivity analyses in the prefrontal cortex. Specifically, the results of an analysis of resting
state connectivity of medial prefrontal cortical areas across hemispheres will be presented.
Data obtained from a study using fNIRS to examine characteristics of diurnal cerebral blood flow
during routine daily activities (Brinckman et al., manuscript in preparation) were analyzed to
determine whether patterns of functional connectivity could be detected during the resting state.
In the original study, changes in oxygenated hemoglobin (oxy-Hb) and deoxygenated
hemoglobin (deoxy-Hb) concentrations during alternating 5-minute rest and 25-minute low
cognitive demand activity periods were observed over the course of an eight-hour day. A 16-
channel continuous wave NIRS system, provided by the Optical Brain Imaging Group of the
School of Biomedical Engineering at Drexel University, was used to measure the time course of
hemoglobin concentration change within and across study conditions. Data obtained from four
healthy, non-smoking, English-speaking, right-handed female participants during rest were
analyzed in the current study. Rest sessions in which at least three of four prefrontal medial
voxels in each hemisphere (voxels 5-8 in the left hemisphere and 9-12 in the right) yielded
interpretable signals were chosen for analysis. Average bivariate correlation coefficients for both
oxy-Hb and deoxy-Hb within and across hemispheric voxel groups were calculated in order to
examine both intra- and interhemispheric connectivity. Strong average intercorrelations (r=0.72-
0.80) were found for oxy-Hb, both within each hemisphere and across hemispheres; similarly,
moderate to strong average intercorrelations (r=0.41-0.59) were found for deoxy-Hb within each
hemisphere and across hemispheres. Limitations and directions for future research will be
discussed in the proposed poster presentation.
75
139

Driving errors and cerebral hemodynamics during simulated driving with and without hands-free
telecommunication: It’s not about where your hands are, it’s about where your mind is
Mayank Rehani & Yagesh Bhambhani
Faculty of Rehabilitation Medicine, University of Alberta, Edmonton, Alberta, Canada
Background: Technological advancements during the last two decades have led to a tremendous
increase in the use of hands-free telecommunication devices during automobile use. Handling
distractions while driving increases the cognitive load which is evident by an increase in neuronal
activation in the prefrontal cortex. Near infrared Spectroscopy (NIRS) directly measures neuronal
activation, which is evident by an increase in the concentration of oxy- hemoglobin (HbO2) and a
concomitant decrease in the concentration of deoxy-hemoglobin (HHb). Purpose: In order to gain a
better understanding of neural mechanisms during distracted driving, the changes in the acute cerebral
hemodynamics need to be investigated. The aims of the study were to examine the: (1) behavioral
effects of hands-free telecommunication use during simulated driving, (2) reliability of cerebral NIRS
variables during this task, and (3) relationship between the number of driving related errors during
distracted driving with the changes in the NIRS variables. Methods: 26 male participants drove in a
simulated urban scenario (VS500M, Virage Simulation, Canada), without (4 minutes) and with (2
minutes) naturalistic conversation using a hands-free earpiece on two separate occasions. The cerebral
hemodynamic responses were recorded by dual-wave NIRS from the left prefrontal lobe using a dual
wave instrument (Oxymon Mk III, Artinis Medical Systems, The Netherlands). Driving errors were
counted under both conditions and the delta values of the NIRS data were computed. Results: Driving
with hands-free telecommunication led to a 175% increase in driving errors. During the
telecommunication conversation, two distinct trends were observed in the NIRS responses: (1)
increased neuronal activation as evidenced by a systematic increase in HbO2 with a concomitant
decrease in HHb in 64% of the participants, and (2) decreased neuronal activiation (ie. deactivation) as
evidenced by a significant decline in HbO2 with a concomitant increase in HHb in 12% of the
participants. Driving related errors, NIRS variables, between the two trials were highly reproducible
(ICC between 0.44 and 0.64). There were no significant correlations (‘r’ values between -0.24 and
0.33) between the incidence of driving responses and the changes in the NIRS variables. Conclusions:
NIRS is a suitable technique to reliably measure the acute changes in the cerebral hemodynamic
responses during functional tasks. The increased incidence of errors during hands free
telecommunication under simulated driving conditions does not seem to be associated with specific
changes in the cerebral hemodynamics due to the large inter-individual variability amongst the
participants.
76
140

The Neural Correlates of the Face Attractiveness Aftereffect: A Functional Near-infrared Spectroscopy (fNIRS) Study
Cathy Mondloch1, Genyue Fu2, Xiaopan Ding3, Lindsey Short1, Liping Sun2, Kang Lee4
1. Brock University, Canada; 2. Zhejiang Normal University, China; 3. East China Normal University, China; 4. University of Toronto, Canada
Adults’ expertise in recognizing individual faces has been attributed to norm-based coding, a process by which individual faces are compared to a prototypical face that represents the average of all faces previously encountered. Extensive behavioral evidence shows that our internal representation of faces, or face prototype, can be dynamically updated by immediate experience. This is illustrated by the robust attractiveness aftereffect phenomenon whereby originally unattractive faces (e.g., faces with compressed features) become attractive after we are exposed to a set of similarly unattractive faces. Although behavioral evidence suggests this effect to have a strong neural basis, little neuroimaging evidence in fact exists. Here we used functional near-infrared spectroscopy methodology (fNIRS) to bridge this gap. In the pre-test, participants rated the attractiveness of three sets of faces: normal and undistorted faces, compressed faces (the internal features and the distances between them were compressed), and expanded faces (the internal features and the distances between them were expanded). We then showed participants a new set of compressed faces for 5 minutes, a process called adaptation, after which participants judged the same three sets of faces in the post-test. After adaptation, participants rated compressed faces as more attractive and both undistorted and expanded faces as less attractive, replicating the robust adaption aftereffect. fNIRS results showed that short-term exposure to compressed faces led to significant decreases in [oxy-Hb] activities to undistorted faces in the extended network of cortical regions in the frontal and occipital cortexes. In contrast, significant decreases in [oxy-Hb] activities were only observed in the right middle frontal gyrus to the compressed faces and the left middle frontal gyrus to the expanded faces. These differential responses to the three sets of faces suggest that the attractiveness face adaption effect for the three sets of faces may have different neural bases. The greater involvement of cortical regions in the adaptation of the undistorted faces suggests that adaption may have the greatest impact on the normative face prototype. Functional connectivity analyses further revealed that in response to the undistorted faces, changes in [oxy-Hb] activities to the undistorted faces in the right inferior frontal regions were bi-directional and mutually affecting each other. Taking together, the present findings suggest that the face attractiveness aftereffect mainly reflects the neural representation of the face prototype in response to recent exposures to new face exemplars. Address of presenting adults: [email protected]
77
141

Cerebral & Muscle Hemodynamics during Unilateral Knee Extensions at Different Loads &Velocities
Yagesh N. Bhambhania, Marta Inez R. Pereira
b, Paulo Sergio C. Gomes
b
a Department of Occupational Therapy, Faculty of Rehabilitation Medicine, University of Alberta; E-mail:
b Centro de Pesquisas Interdisciplinares em Saúde & Programa de Pós-graduação em Educação Física,
Universidade Gama Filho, Rua Manoel Vitorino 625, Piedade, Rio de Janeiro, RJ, 20748-900, Brazil
Background: Muscle fatigue is a transient phenomenon which is task dependent and can originate centrally
and/or peripherally (Gandevia et al., 2001). Currently the physiological factors implicated in fatigue during
resistance exercise are poorly understood. Near infrared spectroscopy (NIRS) is a valid and reliable non-
invasive optical technique that is used to measure central neuronal activation (Huppert et al., 2006) and
muscle oxygen extraction (Mancini et al., 1994) during exercise. Purpose: The current study used NIRS to
examine the relationship between fatigue during dominant knee extensions (KE) at two different loads (60%
and 80% of predetermined 1RM) and velocities (25°•s-1
and 80°•s-1
) and the alterations in cerebral and muscle
oxygenation (Cox, Mox) and blood volume (Cbv, Mbv) in healthy volunteers. Methods: Six males and 3
females (35.8±10.8 yrs; 74.2±16.7 kg; 171.0±10.0 cm) completed one set of KE to task failure with the
dominant leg at each load and velocity in random order in one testing session. NIRS measurements were
recorded simultaneously from the contralateral prefrontal lobe and dominant vastus lateralis during 2 min rest,
KE to fatigue, and 3 min recovery as previously described (Gomes et al., 2012). Delta and Range in Cox, Cbv,
Mox and Mbv were computed for each load and velocity. Results: Total work index (TWi, calculated as the
product of load and number of repetitions) was significantly greater at 25°•s-1
compared to 80°•s-1
for each
load. During the contractions, Cox and Cbv increased systematically until task failure with no signs of
attenuation or plateau. In contrast, Mox and Mbv demonstrated a rapid decline followed by a plateau or slight
increase until task failure. No significant (P > .05) correlations were observed between TWi and Delta Cbv or
Mbv when the loads and velocities pooled (N = 18). The correlation coefficients between TWi and
Delta Cox and Delta Mox for the pooled data are summarized below.
Method Delta Cox Probability Delta Mox Probability
Loads pooled at 25°·s-1
0.48 > .05 0.55 < .05
Loads pooled at 80°·s-1
0.52 > .05 0.63 < .05
Velocities Pooled at 60% 1RM 0.42 > .05 0.39 > .05
Velocities pooled at 80% 1RM 0.41 > .05 0.59 < .05
Conclusions: These findings suggest that fatigue during unilateral KE is more closely correlated with the
decline in muscle oxygen utilization and not by a reduction in central neuronal activation. The decline in Mox
is attributed to the decrease in Mbv (an indirect measure of blood flow) to the exercising muscle which results
in a reduction in oxygen availability and utilization.
78
142

Verbal and visual working memory investigated by multi-channel time-resolved functional near-infrared spectroscopy
S. Basso Moro1, S. Cutini2, S. Bisconti1, M. Caffini1, M. Ferrari1, V. Quaresima1, D. Contini3, R. Re3, L. Zucchelli3, L. Spinelli4, A. Torricelli3
1Dip. Medicina Clinica, Sanità Pubblica, Scienze della Vita e dell'Ambiente, Università di L'Aquila - Italy; 2Dip. Psicologia Generale, Università di Padova - Italy; 3Dip. Fisica, Politecnico di Milano - Italy;
4Consiglio Nazionale delle Ricerche–Istituto di Fotonica e Nanotecnologie, Milano –Italy. [email protected]
Introduction. Working memory (WM) is a core component of human cognition and it is fundamental for a number of different cognitive processes. WM allows the short-term maintenance and manipulation of the information selected by attentional processes. Some of the most common neuropsychological tests for evaluating the WM abilities are the forward and backward digit span (DF and DB, respectively), and the symbol span (SS) tasks [1]. In DF the maintenance of the verbal information entering the phonological loop is demanded, whereas DB requires the manipulation of the information contained in verbal WM [2]. Brain imaging studies suggested that the neural substrates of WM reside in the prefrontal cortex (PFC) [3, 4]. More specifically, the ventrolateral PFC (VLPFC) (Brodmann Areas, BA: 44/45/47) and the dorsolateral PFC (DLPFC) (BA: 9/46) are believed to be involved in active manipulation of information while the BA10 and 11 are thought to be responsible for the maintenance of information. Indeed, an fMRI investigation of WM revealed a greater right activation of BA10 during the DF, and a greater activation of BA 9/46 during the DB [5]. Similarly, in a study performed with time-resolved fNIRS, a strong activation of DLPFC (i.e., increase of oxy-haemoglobin, O2Hb) was observed during the DB [3]. Aim. The goal of this study was to examine by time-resolved fNIRS the neural correlates of the verbal and visual WM during DF, DB and SS tasks. A neural dissociation was hypothesised between maintenance and manipulation processes. In particular, a DLPFC/VLPFC recruitment was expected during the DB task, whilst a lateralised involvement of BA10 was expected during the execution of the DF task. Methods. Thirteen subjects were monitored by an 18-channel, dual wavelength (690 and 829 nm) time-resolved fNIRS system (sampling time: 1 Hz) developed at Politecnico di Milano [6]. The optodes were positioned according to the international 10-10 system. The experiment included three blocks (one for each task: DF, DB and SS) counterbalanced across participants. The DB and DF protocols lasted 3 min, while the SS protocol 4 min. During the DF or DB task, participants repeated a series of digits in the same or reverse order of presentation. The digit sequences started with a span of 3 (for DF) or 2 digits (for DB), and increased in steps of 1 digit until the participants failed 2 sequences within the same span level. During the SS task, the participants memorized a series of stylized and uncommon images of increasing number (from 3 to 7 images) until they failed 2 series within the same span level. The participants’ memory span (calculated for each task) corresponded to the highest level in which at least one sequence out of two was correctly reproduced. Results. The mean span level for DF, DB and SS was 6±1.1, 6 ±1.3 and 5±1.3 elements, respectively. No correlation was found between the span level and the heart rate data (monitored by pulse oximetry). As expected, DB elicited a broad activated area (measured as O2Hb increase) in the bilateral VLPFC and the right DLPFC, whereas a more localized activation was observed over the right hemisphere during either DF (BA10) or SS (BA10 and BA44). Discussion. The results of the present study confirm those of previous studies in which right DLPFC was found particularly activated during DB [3, 5]. The activation of the PFC in the 3 tasks is related to cognitive processing and maintenance of the information. The robust involvement of the DLPFC during DB, compared to DF, is compatible with previous findings [3-5, 7] and with the key role of the central executive in manipulating processes. References. 1) Wechsler D. (2008) Wechsler Adult Intelligence Scale. Pearson: San Antonio, USA; 2) Baddeley A. et al. (1974) Adv. Res. and Theory 8:47–89; 3) Hoshi Y. et al. (2000) Cogn. Brain Res. 9:339-42; 4) Gerton B.K. et al. (2004) Neuropsychologia. 42:1781-7; 5) Tsukiura T. et al. (2001) Cogn. Brain Res. 11:13-21; 6) Contini D. et al. (2006) Opt Express 14:5418-32; 7) Sun X. et al. (2005) Neuroimage. 26:36-47.
79
143

Being social: a NIRS study on the Social Simon effect
Francesca Ferri1, Assunta Di Vacri2, Antonio Maria Chiarelli2, Marcello Costantini2 , Gian Luca Romani2 & Arcangelo Merla2
1Department of Neuroscience, Section of Physiology, University of Parma, Parma, Italy. Email: [email protected] 2Department of Neuroscience and Imaging, University “G. d’Annunzio”, Chieti, Italy & ITAB -Institute for Advanced Biomedical Technologies, Foundation University “G. d’Annunzio”, Chieti, Italy.
Cognitive neuroscientists have predominantly studied individual brains in isolation. Recently,
however, it has been argued for the need of taking a social perspective on cognitive activities. The aim
of the present study is to investigate the neuronal underpinnings of sharing a task in a proper social
context.
We recorded cortical activity by means of near-infrared spectroscopy, while participants performed a
joint Simon task. At the behavioural level, we found faster RTs to compatible as compared to
incompatible trials, albeit each participant was actually performing a go/no-go task. This result
suggests participants integrated the potential action of their co-actor in their own action. Regarding the
neural activity, we found higher activation in the left ventral premotor cortex and left inferior parietal
lobule while processing incompatible as compared to compatible trials referring to one’s own action
alternative. Strikingly, when participant was not responding, because it was the turn of the other
member of the pair, the same inferior parietal activation was stronger to incompatible as compared to
compatible trials while the left ventral premotor cortex was not activated. These findings suggest that
the joint Simon effect relies more on shared attentional mechanisms rather than a proper mapping of
the other’s motor response.
80
144

Cerebral hemodynamic responses during carbon dioxide rebreathing, aerobic exercise and cognitive activity
Hercules Grant, Mayank Rehani and Yagesh Bhambhani. Work Physiology Research Lab, Faculty of Rehabilitation Medicine, University of Alberta, Edmonton, AB., Canada
Cerebrovascular reactivity to C02 (CvC02) is the dilatory response of brain circulation to the C02 stimulus. It may represent a marker of individual response to physical and cognitive load. CvC02 at different levels of activity and fitness has not been studied. Neither has there been a consistent indication of the relationship between cognitive function and CvC02. Further, no studies to date have directly investigated the relationship between cerebral hemodynamic changes in response to rebreathing C02, cognitive activity and varying fitness levels. Knowledge of the nature of these relationships may clarify how these various aspects of cerebral hemodynamic function operate at various stages of health and disease.
Purpose: This study investigated changes in concentration of oxyhemoglobin [02Hb], deoxyhemoglobin [HHb] and total hemoglobin [tHb] during C02 rebreathing, aerobic exercise and cognitive testing in healthy males. It was hypothesized that the changes in [tHb] and [02Hb] during C02 rebreathing will be positively correlated with these same hemodynamic measures obtained during tasks of attention and memory, and sub maximal aerobic exercise.
Methods: Informed consent was obtained from eleven males (20-58yrs, predicted V02max = 35.06±8.5ml/kg/min; BMI=22.10 – 28.73) with high school to university graduate level education. Participants performed three procedures in random order up to two weeks apart. The procedures included rebreathing 5%C02 for up to 90 seconds in an upright seated position, seated cycling at a sub maximal level for 6 – 8 minutes on an electronically-braked cycle ergometer, and completing a digit span test (a three part test of working short term memory). Single channel near infrared spectroscopy (NIRS) was used to measure hemodynamic responses over the left prefrontal lobe (PFC) during the three procedures. Delta (peak minus baseline) values of [tHb], [02Hb] and [HHb] were used for statistical analysis.
Results: NIRS trends for all three test conditions demonstrated hemodynamic changes that were indicative of enhanced neuronal activation: increase in [02Hb] with a concomitant decrease in [HHb]. Delta values of [02Hb], [HHb], and [tHb], measured during C02 rebreathing and sub maximal cycling, were not significantly correlated (P>.05). For Delta [02Hb], there was a significant negative correlation (P<.05) between C02 rebreathing and two portions of cognitive testing; namely, digit span forward (r = -0.555) and digit span sequencing (r = -0.770). There were also significant negative correlations between sub maximal cycling and these two cognitive measures for Delta [02Hb]. Delta [tHb] was significantly negatively correlated for cycling and digit span forward (r = -0.788). Additionally, significant correlations were noted on measures of Delta [HHb] for sub maximal cycling and digit span forward (r = 0.641) and digit span sequencing (r = 0.701).
Conclusion: The significant negative correlations between Delta [02Hb] during C02 rebreathing and parts of digit span testing were inconsistent with our hypothesis. This was also the case for hemodynamic changes in C02 rebreathing and cycling. Negative correlations between cycling and cognitive testing, along with positive correlations with [HHb], suggest that oxygenation changes during these three experimental conditions may be operating under different physiological mechanisms. The use of a single channel NIRS procedure and a heterogeneous sample are notable limitations associated with this study.
E-mail correspondence: [email protected]
81
145

Prefrontal cortex is not activated by observation of disgusting and pleasant pictures:
a multi-channel time-resolved functional near-infrared spectroscopy study in healthy subjects
S. Bisconti1, S. Cutini
2, M. Caffini
1, M. Ferrari
1, V. Quaresima
1, D. Contini
3, L. Zucchelli
3,
L. Spinelli4, A. Torricelli
3
1Dip. Medicina Clinica, Sanità Pubblica, Scienze della Vita e dell'Ambiente, Università di L'Aquila - Italy;
2Dip. Psicologia Generale, Università di Padova - Italy;
3Dip. Fisica, Politecnico di Milano - Italy;
4Consiglio Nazionale delle Ricerche–Istituto di Fotonica e Nanotecnologie, Milano –Italy.
Introduction. The disgust is one of the basic emotions with a central role not only in the social
environment, but also in the manifestation of psychiatric disorders. The DSM IV [1] includes the
horror in the diagnostic criteria of the Post-Traumatic Stress Disorder (PTSD) defining it as one of the
feelings that occur following to a traumatic event (such as the earthquake that occurred in 2009 at
L’Aquila town - Italy). Although disgust perception has been mainly investigated in patients by
passive viewing of emotional pictures related to trauma or disorder [2], a limited number of studies
has investigated the neural circuits involved in healthy individuals. An important role in the cognitive
control of affective responses is played by the prefrontal cortex (PFC) [3]. Although there is evidence
that the PFC is activated in response to emotional visual stimuli [4], few studies have confirmed the
role of the PFC in the disgust perception [5]. So far, only few fNIRS studies have investigated the
brain activation of healthy subjects during the perception and the imagery of neutral, happy, and
disgusting stimuli. However, these studies examined the occipital and parietal cortex only [6, 7].
Aim. The goal of this study was to evaluate by fNIRS the role of the PFC in the disgust perception of
healthy subjects during the exposure to disgusting, pleasant and neutral stimuli. A different activation
pattern over the PFC is expected in response to the three conditions.
Methods. Nineteen healthy males subjects (29.7±4.1 y.o.; high level of education) were monitored by
an 18-channel, dual-wavelength (690 and 829 nm) time-resolved fNIRS (sampling time: 1 Hz)
developed at the “Politecnico di Milano”. The optodes were positioned over the frontal cortex
according to the international 10-10 system. The heart rate was monitored by a pulse oximeter. The
stimuli were divided into six blocks of five disgusting, pleasant or neutral images (two blocks for each
condition). The 30 different images were taken from International Affective Picture System (IAPS) [8]
and presented in a random order. Each block was presented for 30-sec and was separated by the others
by a 1-min inter-block interval. Optical recording started 2-min before the onset of the first picture and
ended 1-min after the offset of the last picture (protocol duration: 11-min). At the end of the study the
subjects were administered with a questionnaire regarding the perception of the images. The
participants rated each image on a scale from 1 to 7 (where 1 indicated a high level of repulsion
toward the stimulus, 4 indicated indifference toward the stimulus, and 7 indicated high level of
attraction toward the stimulus).
Results. The mean values attributed to the disgusting, neutral and pleasant images were: 2.2±0.7;
4.2±0.2; 5.6±0.4, respectively. In contrast with the behavioural data, the different emotional valence of
the images did not significantly affect the haemodynamic response patterns observed in the PFC.
Finally, the heart rate did not change significantly between the baseline and task period.
Conclusions. Although the images were perceived as disgusting, neutral and pleasant, no PFC
modulation in response to the different images was found by time-resolved fNIRS on healthy subjects.
Despite the lack of positive results, a PFC activation during passive viewing of disgusting images
cannot be excluded in PTSD patients or in those affected by other psychiatric disorders.
References. 1) American Psychiatric Association (2000) Washington, DC; 2) Phan K.L. et al. (2002)
Neuroimage, 16:331-48; 3) Ray R. et al. (2012) Neurosci and Biobehav Rev, 36:479-501; 4) Davidson
R.J., et al. (1999) Trends Cogn Sci, 3:11-21; 5) Stark R. et al. (2004) Neuropsychobiology, 50:108-18;
6) Köchel A. et al. (2011) Int J Psychophysi., 80:192-97; 7) Minati L. et al. (2009) Neuroreport,
20:1344-50; 8) Lang P.J et al. (2008) Technical Report A-8. University of Florida, Gainesville, FL.
82
146

Quantification of Cerebral Hemoglobin in Adult Brain Using Near-Infrared Spectroscopy Erica Westwood1,2, Jeff F. Dunn1,2,3
1Department of Radiology, 2Experimental Imaging Centre, 3Hotchkiss Brain Institute, University of Calgary, Calgary, AB, Canada
INTRODUCTION
Historically quantification of total hemoglobin (tHb) has been a challenge for near-infrared spectroscopy (NIRS), however success in quantification would allow us to compare between subjects for parameters such as tissue saturation and microvascular oxygenation1. This would be widely applicable in for monitoring brain hypoxia in conditions such as stroke or diseases of aging.
Quantification is possible using frequency-domain NIRS systems2. Our objective was to determine if consistent quantified levels of cerebral hemoglobin can be measured with NIRS.
METHODS
Measurements were taken using the OxiplexTs (ISS), a frequency domain NIR system, which measures absolute tissue oxygen saturation (StO2) as well as THb, oxyhemoglobin (OHb) and deoxyhemoglobin (HHb) concentrations. Each optode has one light detector and eight emitters, four emitting light at 834nm and four emitting light at 692nm at varying distances between the source detectors.
Seven subjects were included (2 male, 5 females; age 37.9± 13.2 years, mean±SD). This study used a repeated measures design. Each participant was required to undergo six study sessions on six different days. Frontal lobe measurements were taken for one minute on each hemisphere, under quiet and dark conditions. Analysis included descriptive statistics, between-subjects one-way ANOVAs and paired t-tests to compare between hemispheres.
RESULTS and DISCUSSION
The average between-subject coefficient of variation for the right frontal lobe was 1.42% for StO2, 1.13% for tHb, 2.3% for OHb and 1.88% for HHb. Slightly greater variation was found for the left frontal lobe. The dataset includes variations when measuring the same subject over time, and when comparing a normal patient population.
These results show that very consistent values can be obtained both between subjects and when comparing the same subject over time when quantifying using the Oxyplex, time domain system. Such a system allows for applications such as determining if an acute stroke patient differs in saturation from that of an age matched control population.
Table 1. Values indicate overall average values for each parameter, with data from all subjects combined. Results are comparable with values reported in the literature by one different study using similar methodology2. Measurements were also take for OHb and HHB but are not presented here.
REFERENCES 1 Matcher, S. J. et al., Proc. SPIE 2389, 486 (1995). 2 Gatto, R. et al., J Neurosci Methods 157 (2), 274 (2006); Fantini, S. et al., Phys Med Biol 44
(6), 1543 (1999)
Right Frontal Lobe Left Frontal Lobe
StO2 (% ±SD)
tHb (µM ±SD)
OHb (µM ±SD)
HHb (µM ±SD)
StO2 (% ±SD)
tHb (µM ±SD)
OHb (µM ±SD)
HHb (µM ±SD)
63.3 ±0.9 41.2 ±0.5 26.2 ± 0.6 15.0 ± 0.3 63.5 ±1.0 38.0 ±0.6 24.2 ± 0.7 13.7 ± 0.3
83
147

Poster Session Applications: Adult (II)
Poster #: 84-‐103
148
Cerebral Hemodynamics at Altitude: Effects of Hyperventilation and Acclimatization on Cerebral Blood Flow and Oxygenation
Meeri N. Kim1, Matthew R. Sanborn2,3, Mark E. Edsell3,4, Rickson C. Mesquita1, Mary E. Putt6, Chris
Imray3,5, Heng Yow3, Mark Wilson3, Daniel S. Martin3, Mike Grocott3, Arjun G. Yodh1
Departments of 1Physics and Astronomy, 2Neurosurgery and 6Biostatistics and Epidemiology, University of Pennsylvania, Phila., PA, USA; 3Centre for Altitude, Space and Extreme Environment
Medicine, University College London, London, UK; 4St George’s Hospital, London, UK; 5University Hospitals Coventry and Warwickshire NHS Trust, Warwick Medical School, Coventry, UK
Presenting Author Email: [email protected]
Introduction: High altitude has profound cerebrovascular effects on those that work, live, or are stationed at greater than 2400 m. For them, high altitude cerebral edema is a common cause of death, and the only currently used treatment is immediate descent. We hypothesize that we can use methods proven to successfully treat brain-injured patients to help those with altitude illness without having to descend. The simplest example is hyperventilation, which can be used to decrease cerebral blood flow and, therefore, intracranial pressure. Diffuse correlation spectroscopy (DCS) could provide a non-bulky, fairly lightweight instrument to probe changes in blood flow at altitude. The aim of this study is to test the feasibility of using DCS as a monitor of relative cerebral blood flow (rCBF) at high altitude during hyperventilation. Materials and Methods: We used a house-built, two-channel DCS module. Source-detector separation used was 2.5 cm, with relative cerebral blood flow (rCBF) data being taken every 3 seconds. A commercial near-infrared spectroscopy (NIRS) device, the Fore-sight Absolute Cerebral Oximeter, measured cerebral tissue oxygen saturation (StO2). A transcranial Doppler ultrasound (TCD) instrument to measure peak systolic velocity (PSV) and a capnograph for end-tidal CO2 were also used. The twelve otherwise healthy subjects ranged in age from 22 to 80. None had travelled to altitude during the previous three months, nor had any history of cardiovascular, respiratory or neurological disease. A hyperventilation protocol was repeated on the same subjects at three different time-points: 1) 75 m above sea level, 2) 4559 m above sea-level after 2 days of being at altitude, 3) 4559 m above sea-level after 7 days of being at altitude. Subjects ascended to the Capanna Regina Margherita in the Italian Alps by cable car and on foot, with 2 days spent acclimatizing at 3611 m. Subjects were positioned supine, and probes for DCS, TCD, and NIRS were attached to their forehead. Baseline data were taken for 5 minutes. Then subjects were asked to hyperventilate to 50% of their baseline end-tidal CO2, and asked to maintain this level for 3 minutes. A mixed effects model was used to test relevant hypotheses. Results: Out of 12 initial subjects, data were collected on 9 after two days at altitude, and on 7 after seven days at altitude. Subjects dropped out for reasons such as altitude mountain sickness. DCS revealed a decrease in rCBF of -20.9% (95% CI, -31.3, -10.3) following hyperventilation at sea level, -24.5% (-36.7, -12.4) following hyperventilation after 2 days at altitude and -37.6% (-51.3, -23.8) following 7 days at altitude. There was a trend towards more pronounced decreases in CBF with hyperventilation with increasing time at altitude that approached, but did not reach, statistical significance (p = 0.051 between sea-level and altitude day 7). PSV also decreased with hyperventilation at all three time-points (p < 0.001) StO2 decreased with hyperventilation at sea level (p < 0.001), but increased after 2 days at altitude (p = 0.001). After 7 days, there was no significant difference with hyperventilation. Conclusion: Hyperventilation induced lowered rCBF and PSV both at sea-level and at altitude. DCS was shown to be a promising technology with the potential to increase our understanding of changes in cerebral blood flow at altitude. Larger studies and further refinements in technique are necessary to reduce inter-subject variability.
84
149

Reduction of Cytochrome c Oxidase During Vasovagal Hypoxia-Ischaemia in Human Adult Brain: a Case Study A. Ghosha, C. Kolyvab, I. Tachtsidisb, D. Hightona, C.E. Elwellb and M. Smitha,b
a - Neurocritical Care Unit, University College Hospitals, London WC1N 3BG, UK b - Medical Physics & Bioengineering, University College London, WC1E 6BT, UK e-mail correspondence to: [email protected]
Near infrared spectroscopy (NIRS)-derived measurement of oxidised cytochrome c oxidase concentration ([oxCCO]) has been used as an assessment of the adequacy of cerebral oxygen delivery. We report a case in which changes in conscious level were associated with changes in [oxCCO].
Hypoxaemia was induced in a 31 year-old, healthy male subject by delivery of a hypoxic inspired gas mix; this was part of an on-going clinical study. NIRS monitoring was performed with the hybrid optical spectrometer (pHOS), which comprises multidistance broadband and frequency domain spectrometers and is described elsewhere1
. The pHOS measured changes in [oxCCO], oxyhaemoglobin and deoxyhaemoglobin ([HbO2] and [HHb], respectively) at four different source-detector separations (35/30/25/20mm) and optical scattering at four discrete wavelengths (690/750/790/850nm). The haemoglobin difference ([HbDiff] = [HbO2] – [HHb]), was calculated. Other monitoring included transcranial Doppler ultrasound measurement of ipsilateral middle cerebral artery flow velocity (Vmca), pulse oximetry to measure arterial oxygen saturation (SpO2), and continuous non-invasive arterial blood pressure (ABP); the latter two variables were used to calculate estimated changes in cerebral oxygen delivery (∆ecDO2 = ∆SpO2 x ∆Vmca)2.
Midway through the hypoxaemic challenge, the subject experienced an unexpected vasovagal event with bradycardia, hypotension and reduction in cerebral blood flow and ecDO2 (Figure 1). An associated decrease in [oxCCO] was observed at 35mm (-1.6 µM), but only minimal change (-0.1 µM) at 20mm source-detector separation (Figure 2). A change in in optical scattering was observed, but pathlength remained unchanged. This unexpected physiological event provides an unusual example of a severe reduction in cerebral oxygen delivery and is the first report correlating change in clinical status with changes in [oxCCO].
Figure 1: change in ABP, SpO2 and consequent reductions in Vmca and ecDO2 observed during vasovagal event.
Figure 2: changes in [oxCCO] and [HbDiff] observed at four source-detector separations during vasovagal event.
References: 1. Tachtsidis et al (2010) BIOMED BTuB7 OSA Technical Digest (CD) 2. Tisdall et al (2007). J Biomed Opt 12: 024002
∆ecDO2VmcaSpO2ABP
60
70
80
90
100
SpO2 (%
)
Bloo
d Pr
essu
re (m
m H
g)
20
40
60
80
100
Vmca
(cm
.s-1
)/ecD
O2 (
%)
40
60
80
100
Time (s)0 200 400 600 800 1000
3.5cm 3.0cm
2.5cm 2.0cm
∆[oxCCO]∆[HbDiff]
−1.5
−1.0
−0.5
0
0.5
∆oxCCO (µM
)∆oxCCO
(µM)
−1.5
−1.0
−0.5
0
0.5
∆[Hb
Diff]
(µM
)
−15
−10
−5
0
5
∆[Hb
Diff]
(µM
)
−15
−10
−5
0
5
Time (s)0 200 400 600 800 1000
Time (s)0 200 400 600 800 1000
85
150

Longitudinal fNIRS Stroop Study of Adult Traumatic Brain Injured Patients in Post-Acute Treatment
Matthew Cloud +,± ([email protected]); Jana Downum +; Hanli Liu ±; Patrick M. Plenger + +Pate Rehabilitation Endeavors Inc.;
±The University of Texas at Arlington
Traumatic brain injury (TBI) and stroke are the leading causes of adult disability and death
worldwide1. The Stroop test is used to determine the selective attention of subjects. TBI patients, one
year post injury, undergoing Stroop studies with functional Magnetic Resonance Imaging (fMRI)
show increased activation of left dorsolateral prefrontal (DLPFC) and left posterior parietal cortices2.
Also functional Near-Infrared Spectroscopy (fNIRS) of healthy subjects after exercise in comparison
to control groups for interference tasks shows significant left DLPFC activity3. To determine the
effects of TBI on the inhibitory response to distraction within one year of injury, a two part Stroop
task was performed by patients receiving multidisciplinary therapy at a post-acute treatment facility.
A Hitachi ETG-4000 fNIRS system with a 3x11 array was used to image the frontal cortex of 16
patients and 14 controls. For Task A the subject spoke the color of a presented dot. For Task B the
subject spoke the font color of an incongruent word. Each run started with a 10 s rest followed by an
ABBABA task pattern with 25 images per block at a rate of 1 image/s, and a rest period of 30 s.
Subjects repeated the run two weeks, and four weeks after the original run.
NIRS-SPM version 4 with wavelet-MDL and hemodynamic response functions were used for
analysis. Individual false positives improved with Euler characteristics4, but group analysis with no
correction limited false negatives. Figure 1 shows subtraction of Task B from A to reveal activity
which is specific to interference task. Over a one month period, the control group shows a decrease in
frontopolar cortex activity while the patient group shows an increase in left DLPFC activity. The lack
of significant activity shown in patient group run 1 is possibly a result of saturation during Task A for
patients with significant dispersed activity and may indicate a lack of inhibitory response. Run 3 is
consistent with patient studies one year after injury. Therefore, left DLPFC increased activity may be
an indicator of gradual return to normal brain function from receiving multidisciplinary therapy.
Fig 1) Interference task minus simple task (B-A) p-value=0.05, no correction;
Control Group (n=14, 13, 13); Patient Group (n=16, 14, 16)
1U.S. Centers for Disease Control and Prevention
2Soeda, A, et al, “Cognitive Impairment After Traumatic Brian Injury: a Functional Magnetic
Resonance Imaging study using the Stroop Task,” Neuroradiology 47:501-506, 2005. 3Yanagisawa, H, et al, “Acute Moderate Exercise Elicits Increased Dorsolateral Prefrontal Activation
and Improves Cognitive Performance with Stroop Test,” NeuroImage 50:1702-1710, 2010. 4Li, H., et al., “Lipschitz Killing curvature based expected Euler characteristics for p-value correction
in fNIRS,” J. Neurosci. Meth. 204, 61-67, 2012.
Contr
ol
Gro
up
P
atie
nt
Gro
up
Run 1 Run 2 Run 3
Run 1 Run 2 Run 3
86
151

Presurgical diagnosis of the epileptogenic focus using near-infrared spectroscopy mapping
Eiju Watanabe, Hidenori Yokota H, Keiji Oguro, Edmi Edison, Ippeita Dann
Department of Neurosurgery, Jichi Medical University, Tochigi-Ken, Japan
Purpose: An accurate diagnosis of the epileptogenic focus is inevitable in order to get good
outcome in a surgical intervention for drug resistant epilepsy. The purpose of our study is to
investigate the feasibility of ictal near-infrared spectroscopy (NIRS) recording.
Method: We used 48-channel NIRS system in a conventional mode and also in a double density
mode. Thirty three patients with drug resistant epilepsy admitted for the presurgical evaluation
of epilepsy surgery were enrolled in this study. Ictal recording using NIRS has been applied
simultaneously with long term scalp video-EEG monitoring. Inter-ictal IMZ SPECT and
FDG-PET were also applied.
Results: Ictal NIRS showed increase of regional blood flow in the focus area at the beginning of
epilepsy seizures. We utilized this phenomenon to identify the focus location. Ictal NIRS
diagnosed laterality of the epileptogenic focus correctly in 80% of patients which was superior
to IMZ SPECT (diagnostic in 47.8%) and FDG PET (diagnostic in 50%). Ictal NIRS showed
also higher specificity than that of IMZ SPECT (80% and 47.8% respectively), and higher
sensitivity than that of FDG PET (80% and 50% respectively). These results were much more
prominent in patients with neocortical epilepsy, as ictal NIRS diagnosed laterality of the
epileptogenic focus correctly in all patients (100%) with a specificity and sensitivity of 100%,
while IMZ SPECT was diagnostic in 50% of patients with a specificity of 50%, and FDG PET
was diagnostic in 33.3% of patients with a sensitivity of 33.3%. Ictal NIRS has been shown also
to be superior to IMZ SPECT and FDG PET in the diagnosis of laterality of the epileptogenic
focus in patients with normal MRI results (non-lesional epilepsy), as they were diagnostic in
100%, 44.4% and 40% respectively.
Conclusion: These results augment our previous results that ictal NIRS is a valuable and reliable
method to diagnose laterality of the epileptogenic focus especially in patients with neocortical
epilepsy and patients with non-lesional epilepsy.
87
152

Title: Enhancement of Hemodynamic Contrast in the Cancerous Breast by a Controlled Articulation Authors: Rabah Al abdi (SUNY Downstate Medical Center, Brooklyn, NY); Harry L. Graber (SUNY Downstate Medical Center); Christoph H. Schmitz (NIRx Medizintechnik GmbH, Berlin, [email protected]); Randall L. Barbour (SUNY Downstate Medical Center)
Details of blood delivery to tissue and bulk fluid redistribution among the various tissue compartments frequently are impacted by disease or trauma. For example, derangements in hemodynamic states, accompanied by increased tissue stiffness and local edema, is a common breast cancer phenotype [1]. Accordingly, we have hypothesized that externally applied mechanical forces can produce distinct dynamic responses between diseased and healthy tissue fractions, thereby enhancing diagnostic image contrast. Additional evidence for this sort of contrast-enhancing effect comes from recently reported correspondences that we have observed, between fNIRS-based hemodynamic image data and results of computed estimates of internal mechanical stress and pressure distributions, as a function of various applied articulation maneuvers [2]. The reported concurrences suggest that spatial distributions of hemodynamic variables in the fNIRS images represent redistributions of blood in response to changes in the internal stress.
To evaluate the hypothesis that image contrast between breast tumors and surrounding healthy
tissue may be enhanced via controlled articulation maneuvers, we have conducted a pre-clinical study using a recently developed an fNIRS-based breast imaging system [3]. A principal technological element of the imager is concurrent bilateral measurements of the viscoelastic and hemodynamic properties of the breast, in response to a wide range of controlled articulation maneuvers. After giving informed consent and providing a brief medical history, research participants were seated and the sensing heads were adjusted to make good contact with both breasts. Following a five-minute baseline scan, the skin-optode contact pressure was rapidly (~2 s) increased to a level of either 4.4 N or 7.1 N, and data collection continued during the subsequent period of stress relaxation (60-120 s). Optical data were analyzed offline: application of a low-pass filter with a 0.2-Hz cutoff frequency was followed by use of the Normalized Difference Method to reconstruct images of oxygenated and deoxygenated hemoglobin (HbO, HbD), tissue oxygen saturation (HbSat), and blood volume (HbT) [4].
Imaging results obtained from 61 subjects (17 breast cancer, 21 benign pathology, 23 healthy
control) are consistent with the hypothesis that the articulation maneuvers enhance the contrast between tumor and healthy tissue. Also noteworthy is the finding that image contrast is further improved by transforming pairs of co-varying image-values [i.e., (HbD,HbSat), (HbD,HbT), or (HbSat,HbT)] to measures of the statistical extremeness (i.e., the Mahalanobis distance [5]) for each pixel. The magnitude of the preceding effect is maximized by referencing the image-pixel data of one breast to the distribution of image values for the contralateral breast. In the final analysis, the paired difference between the numbers of image pixels identified as abnormal is greater for subjects with breast cancer than for either of the other sub-groups, by a statistically highly significant amount (p ≤ 0.007, unequal variance t-test). In addition, diagnostic accuracies for breast cancer of 80-90% (ROC analysis [6]) are achieved. This is a concrete demonstration of the utility of the simultaneous dual-breast measurement approach; of the fNIRS-based breast imagers reported to date, to our knowledge this strategy has been implemented only in the instrument described in Ref. 3. Thus we have demonstrated that controlled manipulation of the internal force distribution of breast tissue can enhance the detectability of cancer, by exploiting a known tumor phenotype. 1 P. Vaupel, in Tumor Blood Flow (Springer, 2000), 41-45. 2 R. Al abdi et al., Poster BSu3A.92 at Biomedical Optics and Digital Holography and Three-Dimensional Imaging (Miami, FL, April 29 - May 2, 2012). 3 R. Al abdi et al., J. Optical Society of America A 28, 2473-2493 (2011). 4 Y. Pei et al., Applied Optics 40, 5755-5769 (2001). 5 R. De Measschalck et al., Chemometrics and Intelligent Laboratory Systems 50, 1-18 (2000). 6 C.E. Metz, Seminars in Nuclear Medicine 8, 283-298 (1978)
88
153
Validation of the time-resolved optical measurement combined with ICG-bolus tracking in assessment of brain perfusion in posttraumatic brain injury patients A.Liebert1, D.Milej1, W.Weigl2, A.Gerega1, M.Kacprzak1, P.Sawosz1, R.Maniewski1
1Nalecz Institute of Biocybernetics and Biomedical Engineering Polish Academy of Sciences Trojdena 4, 02-109 Warsaw, Poland; Tel.: +48226599143; Fax: +48226597030 Email: [email protected] 2Department of Intensive Care and Anesthesiology, Warsaw Praski Hospital, Solidarnosci 67, 03-401 Warsaw, Poland; Tel.: +48226194092 It was reported recently, that monitoring of time-resolved diffuse reflectance and fluorescence on the surface of the head during indocyanine green (ICG) bolus injection may be useful in assessment of brain perfusion (Liebert, Wabnitz et al. 2005; Liebert, Wabnitz et al. 2006; Steinkellner, Gruber et al. 2010; Gerega, Milej et al. 2012; Jelzow, Wabnitz et al. 2012). We will show results of time-resolved measurements carried out in patients after posttraumatic brain injuries and comparison of this data with results obtained in healthy subjects. The measurements were carried out with an in-home build instrument allowing for simultaneous multichannel acquisition of distributions of times of flight of diffusely reflected photons (DTOFs) and distributions of times of arrival (DTAs) of fluorescence photons excited in the dye circulating in the brain. Data analysis algorithms were developed for evaluation of brain perfusion disorders in patients treated in Intensive Care Unit after brain hemorrhage or brain edema resulting from traumatic brain injury. Analysis of optical signals recorded during inflow and washout of optical contrast agent ICG was carried out in order to determine delays in arrival of ICG bolus in the investigated tissues and to compare usefulness of DTOFs and DTAs in such analysis. The assumptions of the proposed methodology are based on our observations of large time shifts between the signals of statistical moments of DTOFs and DTAs (number of photons, mean time of flight/arrival, and variance of DTOF or DTA) measured in healthy volunteers and much smaller time shifts observed in posttraumatic brain injury patients. Statistical analysis of the time shifts of bolus arrival related to the signals of different moments of the DTOFs and DTAs obtained in healthy volunteers and groups of patients was carried out. Results of this analysis showed that the most useful parameter for differentiation of the studied groups is the delay between bolus appearance obtained from signals of variance of the DTOFs and signals of number of diffusely reflected photons. It was also found that the absolute amplitude of change in variance of the DTOF is significantly lower in healthy subjects than in patients with severe posttraumatic disorders. It was confirmed that the method based on ICG injection and time-resolved optical monitoring of inflow of the dye provides information on blood perfusion of the brain. Temporal parameters of the time-resolved signals obtained in patients with blood perfusion reduced by brain edema and in patients with cessation of cerebral blood flow showed statistically significant difference in comparison to the parameters obtained in healthy volunteers. Gerega, A., et al. (2012). "Multi-wavelength time-resolved detection of fluorescence during the inflow of
indocyanine green into the adult’s brain." Journal of Biomedical Optics 17(8): 087001. Jelzow, A., et al. (2012). "Separation of indocyanine green boluses in the human brain and scalp based on time-
resolved in-vivo fluorescence measurements." J Biomed Opt 17(5): 057003. Liebert, A., et al (2006). "Non-invasive detection of fluorescence from exogenous chromophores in the adult
human brain." Neuroimage 31(2): 600-608. Liebert, A., et al. (2005). "Bed-side assessment of cerebral perfusion in stroke patients based on optical
monitoring of a dye bolus by time-resolved diffuse reflectance." Neuroimage 24(2): 426-435. Steinkellner, O., et al. (2010). "Optical bedside monitoring of cerebral perfusion: technological and
methodological advances applied in a study on acute ischemic stroke." J Biomed Opt 15(6): 061708.
89
154

Differential cortical mechanisms of tool use related gesture production Ingo Helmich1, Robert Rein1, Henning Holle2, Hedda Lausberg1
1Department of Neurology, Psychosomatic Medicine and Psychiatry, Institute of Health Promotion and Clinical Movement Science, German Sport University Cologne, Germany, [email protected] 2Department of Psychology, University of Hull, UK Introduction: Studies of patients with left hemispheric damage or callosal disconnection suggest that both hemispheres are competent to perform tool use demonstrations, while only the left hemisphere is specialized for pantomiming tool use [1,2]. De Renzi et al. (1982) also reported opposite findings of patients with a preserved pantomime but an impaired tool demonstration [3]. Furthermore, split-brain patients, who had a left hand apraxia for pantomimes, were able to perform body-part-as-object (BPO) demonstrations with the left hand [2]. Accordingly, in an fMRI differences in hemispheric activation were found for BPO as compared to pantomime [4]. To solve this controversy, in the present study we investigate if the cerebral hemodynamic response patterns of tool use demonstration, tool use pantomime, and BPO of tool use differ between the left and right hemisphere. Methods: A randomized block design was developed including tool use demonstration, pantomime of tool use, and BPO of tool use. Each condition was executed with the right and left hand. Cerebral oxygenation changes were recorded by Near-Infrared Spectroscopy (Device: DYNOT Imaging System, NIRx Tech.). 30 optodes were placed over the Primary, Pre- and Supplementary Motor Cortex and the Somatosensory Cortex above each hemisphere resulting in 60 channels of measurement. Data were analyzed using the NIRS-SPM toolbox. Results: First results show significant interaction effects of condition*hand*hemisphere (F(2,177)=4.287, p<0.05). Post hoc pairwise comparisons reveal highest changes of oxygenation during pantomime of tool use. Tool use demonstration and pantomime of tool use show a left lateralized hemodynamic response for either hand whereas BPO activates contralateral cortices only. Discussion: This is the first fNIRS study to provide evidence for different oxygenation changes of tool use related gesture production. Pantomiming tool use seems to demand a wide range of cortical networks leading to greatest oxygenation changes among the three conditions. This finding is line with the proposition that performing the pantomime of tool use without having the tool in hand or integrated (BPO) requires abstract thinking and higher cognitive abilities [2]. The present data further support previous findings demonstrating a left hemispheric specialization for tool use demonstration and tool use pantomime. However, contrary to previous studies, our study suggests that the competence to perform BPO of tool use is represented in both hemispheres. [1] Liepmann, H., Maas, O. (1907). Fall von linksseitiger Agraphie und Apraxie bei rechtsseitiger Lähmung. Journal für Psychologie und Neurologie 10, 214-27. [2] Lausberg, H., Cruz, R.F., Kita, S., Zaidel, E., Ptito, A. (2003). Pantomime to visual presentation of objects: left hand dyspraxia in patients with complete callosotomy. Brain 126, 343-60. [3] De Renzi E, Faglioni P, Sorgato P. (1982). Modality-specific and supramodal mechanisms of apraxia. Brain. 105(Pt 2):301-12. [4] Ohgami, Y., Matsuo, K., Uchida, N., Nakai, T. (2004). An fMRI study of tool-use gestures: body part as object and pantomime. Neuroreport 15(12), 1903-6.
90
155
Anouk Vermeij1,2, Aisha S.S. van den Abeelen2, Roy P.C. Kessels1,2,3, Arenda H.E.A. van Beek2, Jurgen A.H.R. Claassen1,2 1 Radboud University Nijmegen, Donders Institute for Brain, Cognition and Behaviour, The Netherlands 2 Radboud University Nijmegen Medical Centre, Department of Geriatric Medicine, The Netherlands 3 Radboud University Nijmegen Medical Centre, Department of Medical Psychology, The Netherlands
Very-low-frequency oscillations of cerebral hemodynamics and blood pressure are influenced by aging and cognitive activation
Objectives: The origin of spontaneous slow oscillations in cerebral hemodynamics is controversial, but they may represent autoregulatory processes. Very-low-frequency oscillations (VLFOs, 0.02-0.07 Hz) are hypothesized to result from neurogenic activity, whereas low-frequency oscillations (LFOs, 0.07-0.20 Hz) are possibly caused by activity in microvascular smooth muscle cells. High-frequency oscillations (HFOs, 0.20-0.35 Hz) are due to respiratory activity. The influence of blood pressure oscillations is however frequently neglected. Evidence exists that aging is accompanied by a degeneration of the vascular system and changes in neurovascular coupling, which may have consequences for regional cerebral blood flow and cognitive performance. Therefore, we aimed to establish the dependency of slow oscillations in cerebral hemodynamics and blood pressure on the factors age and cognitive activation, by using functional Near-Infrared Spectroscopy.
Methods: In this study, 14 healthy young (23-32 years) and 14 older adults (64-78 years, MMSE=29.1±0.9) performed a verbal n-back working-memory task. Oxygenated ([O2Hb]) and deoxygenated hemoglobin ([HHb]) concentration changes, as indices of brain activation, were registered by two fNIRS channels located over left and right prefrontal cortex. Concentration changes in total hemoglobin ([tHb]) are used as an indicator of alterations in total blood volume. Blood pressure (BP) was measured in the finger by photoplethysmography (Finapres).
Results: [O2Hb] increased in both groups under influence of cognitive activation. In comparison to baseline measurements, BP increased slightly under high working-memory load (2-back) in young (4.3±4.4 mmHg) and older adults (5.9±5.0 mmHg), but the increase did not differ between groups. Power spectral density analysis showed that VLFOs of BP, [O2Hb], and [tHb] are influenced by both age and working-memory load. In the control condition (0-back), VLFOs of BP were equal in power for young and older adults. However, high working-memory load resulted in declined VLFOs of BP (-24.0%) in young adults, while in older adults the VLFOs did not change. VLFOs of [O2Hb] and [tHb] were stronger in young adults in comparison to older adults during the control condition. However, under high working-memory load, in young adults the VLFOs of [O2Hb] (-23.4%) and [tHb] (-22.5%) were reduced and became similar to those in older adults. LFOs and HFOs of [O2Hb], [HHb], [tHb], and LFOs of BP were not influenced by working-memory load, but declined with age. Transfer function analysis indicated that the relationship between BP and [O2Hb] oscillations does not change under influence of age and cognitive activation. Conclusions: Our study shows that VLFOs, LFOs and HFOs in cerebral hemodynamics decline with age. VLFOs are influenced by intensity of cognitive activation, but only in young adults. This age-dependency may indicate age-related changes in neurovascular coupling. Moreover, our results on BP oscillations show that not only local vasoregulatory processes, but also systemic processes influence the cerebral hemodynamic signals. To conclude, the effects of age and BP should be taken into account in the interpretation of neuroimaging studies that rely on blood oxygen levels.
Correspondence: [email protected]
91
156

*
*
Functional Near-‐Infrared Spectroscopy shows altered functional connectivity in the brain of patients with multiple sclerosis
*Jeff F. Dunn1,2,4, Jon Jozef Jimenez1,2, Vishal P. Varshney1,2, Runze Yang1,2, Natalia Liapounova1,2, Ali-‐Mohammad Golestani3,5, Luanne Metz4, Bradley Goodyear1,3,4
1Department of Radiology, 2Experimental Imaging Centre, 3Seaman Family MR Research Centre, 4Hotchkiss Brain Institute, 5Department of Electrical & Computer Engineering, University of Calgary, Calgary, AB, Canada,
[email protected] INTRODUCTION
Multiple sclerosis (MS) is associated with demyelination of white matter tracts1, which is likely to be a major factor in the reduction of brain function in MS. Functional near-infrared (NIR) spectroscopy based optical imaging or fNIRS can be used to measure the changes in oxygenated and deoxygenated microvascular hemoglobin, markers of brain activation2.
Coherence analysis coupled with fNIRS technology may be able to establish a metric with which to determine disease progression3. The corpus callosum is a large white matter tract that connects the two brain hemispheres, and reduction in size occurs in MS 4. We hypothesized that changes in coherence will provide a quantitative index of white matter degeneration in MS. METHODS
Control subjects (6 male, 2 females; age 42.5± 12.6 years, mean±SD) and MS patients (5 male, 3 female; age 53.7 ± 8.1years, mean ± SD) were studied. MS patients were recruited through the MS Clinic at Foothills Medical Centre (Calgary, Alberta, Canada).
We used a continuous wave (CW) optical mapping system (CW5, TechEn, MA, USA) 5. There were 4 transmitters and 8 detectors in each of 2 pads, with the sources operating at 690 nm and 830 nm. The area imaged on each motor cortex was 5.6 x 6.0 cm2. Baseline was recorded for 300 seconds. The motor function consisted of 15s of tapping, followed by 30s of rest, repeated for 7 rest and 6 tapping periods. Coherence maps were generated by an in-house program using MATLAB.
Fig. 1. Coherence values between left and right motor cortex. Resting state coherence is not significantly different between controls and MS patients. The coherence values were reduced in the MS patients during finger tapping compared with controls (p = 0.035, mean±S.D. ). RESULTS and DISCUSSION The coherence in the contralateral motor cortex of MS patients was significantly lower compared to controls when measured during finger tapping, which may be due to reduced function of white matter tracks. When studying coherence, it may be that further differentiation of some disorders can be achieved by differentiating the resting state from functional state. This work shows that fNIRS detects dysfunction in MS patients. 1 McCreary, C. R. et al., Neuroimage 45 (4), 1173 (2009). 2 Mesquita, R. C., Franceschini, M. A., and Boas, D. A., Biomed Opt Express 1 (1), 324 (2010). 3 Sasai, S., Homae, F., Watanabe, H., and Taga, G., Neuroimage 56 (1), 252 (2011). 4 Gean-‐Marton, A. D. et al., Radiology 180 (1), 215 (1991). 5 Franceschini, M. A. et al., Psychophysiology 40 (4), 548 (2003).
92
157

Cortical response during motor task in adult volunteers and epileptic patients with movement
disorders: a multimodality fNIRS-EEG, fMRI-EEG and TMS clinical study
A.Torricelli1, L.Spinelli
2, D.Contini
1, M.Caffini
1,3, L.Zucchelli
1, R.Cubeddu
1,
E.Molteni4, A.M.Bianchi
4, G.Baselli
4, S.Cerutti
4,
E.Visani5, I.Gilioli
5, D.Rossi Sebastiano
5, E.Schiaffi
5, F.Panzica
5, S. Franceschetti
5
1Dipartimento di Fisica, Politecnico di Milano, Milan, Italy;
2Istituto di Fotonica e Nanotecnologie,
CNR, Milan, Italy; 3
Dip. Medicina Clinica, Sanità Pubblica, Scienze della Vita e dell'Ambiente, Università di L'Aquila, Italy;
4Dipartimento di Bioingegneria, Politecnico di Milano, Milan, Italy;
5UO Neurofisiopatologia ed Epilettologia diagnostica, Fondazione IRCCS Istituto Neurologico Carlo
Besta, Milan, Italy [email protected]
Integration of functional magnetic resonance imaging (fMRI) or functional near infrared spectroscopy
(fNIRS) with electroencephalography (EEG) has the potentiality to monitor neuronal and vascular
response [1-3]. Recently, also transcranial magnetic stimulation (TMS) has been used to study the
motor system and higher brain functions in healthy and diseased states (e.g. multiple sclerosis, motor
neuron disease, stroke, epilepsy, and movement disorders) [4]. In this work we present a
multimodality approach based on fNIRS-EEG, fMRI-EEG and TMS on adult volunteers and epileptic
patients with movement disorders during motor task. The work is performed within the European
project nEUROPt [5] aiming at assessing the potentiality of time domain fNIRS for noninvasive
imaging of brain function and disease by pulsed light.
fNIRS-EEG and fMRI-EEG data were recorded in two successive experiments from 14 volunteers and
11 patients (Unverricht-Lundborg disease genetically assessed) performing a motor task (clutching a
soft ball at 2Hz; 40s initial rest period, 10 trials alternating 20s task and 20s rest, then 50s recovery; 3
paradigms: right hand vs. rest, left hand vs. rest, left hand vs. right hand; total duration 24 minutes). A
multi-channel dual-wavelength medical device for time domain fNIRS [6] measured oxy- and
deoxygenated hemoglobin (O2Hb, HHb) changes in the cortical region at 1Hz from 30 independent
channels centered on C3 and C4. Activation maps were estimated by the NIRS-SPM software [7]. MR
images were acquired with a 1.5T MR scanner and fMRI data were analyzed using the SPM8 software
[8] to calculate activation maps. From EEG data Event-Related Desynchronization/Synchronization
(ERD/ERS) analysis (time course and scalp topography) was performed. Single subject and group
analysis was carried out for all imaging modalities. Finally TMS-based mapping of primary motor
cortex of the hand, associated to real-time frameless neuronavigation system, was performed.
Calculation of center of gravity of the TMS motor maps for each hemisphere was used as the most
accurate estimation of the location of the represented muscle in the motor cortex.
As general outcome results of individual and group analyses on volunteers agree with literature.
Functional activation was detected by fNIRS as an increase in O2Hb and a corresponding non
symmetrical decrease in HHb in the contralateral hemisphere in channels closely located to C3 (or
C4). fMRI maps revealed activation in the primary motor area contralateral to the movement and in
the supplementary motor area. EEG measurements revealed α-ERD and β-ERD in central areas during
movement execution (more evident in contralateral area), β-ERS in contralateral area immediately
after the movement offset. Results are confirmed in group analysis. All centers of gravity lie around
C3 and C4 positions, but differences in center of gravity location was observed among subjects. In
most of the cases maps obtained by TMS show good correlation with fMRI, EEG and NIRS data. The
elicited fNIRS response in patients is generally more limited than in volunteers, both in terms of
spatial extension and of intensity of hemodynamic changes. Concerning location of the activation,
fNIRS results in patients are however consistent with fMRI and TMS responses. Overall the fMRI and
TMS activation maps show no significant difference with volunteers. The ERD/ERS analysis on
patients confirmed the absence or reduction of post movement synchronization in band [9].
[1] J.Steinbrink et al. MagnResonImag 24:495-505 (2006); [2] T.J.Huppert et al. Neuroimage 29:368-
382 (2006); [3] X.Cui et al. Neuroimage. 54:2808-21 (2011); [4] A.Inuggi et al. Brain Res 1308:68-78
(2010); [5] http://www.neuropt.eu (FP7/2007-2013 grant n.201076); [6] D.Contini et al. OptExpr
14:5418-5432 (2006); [7] J.C.Ye et al. Neuroimage 44:428-447 (2009); [8]
http://www.fil.ion.ucl.ac.uk/spm/doc/; [9] E.Visani et al. Neuroimage 33:161–168 (2006).
93
158

Methylphenidate-‐mediated reduction in prefrontal hemodynamic responses to working memory task: A functional near-‐infrared spectroscopy study
Rajamannar Ramasubbu1, Harinder Singh2, Haifeng Zhu3, *Jeff F. Dunn4,
1Department of Psychiatry and Clinical Neurosciences, 2Department of Clinical Neurosciences, Residency Program, 3Department of Psychiatry, 4Department of Radiology, Pharmacology and Clinical Neurosciences, University of Calgary, Hotchkiss Brain Institute, Calgary, Alberta, Canada, [email protected] INTRODUCTION Methylphenidate (MP) is a piperidine-derived central nervous system stimulant that acts as a dopamine/norepinephrine agonist by binding to the monamine transporters in the presynaptic membrane and blocking reuptake1. It is used in the treatment of attention deficit hyperactive disorder (ADHD), narcolepsy 2, depression, and co-morbid depression in the medically ill 3. Functional near infrared spectroscopy (fNIRS) is a non-invasive optical technique for bedside evaluation of cerebral metabolism that has clinical potential for monitoring the efficacy of pharmacological treatment. In this pilot study, we investigated the cognitive effects of methylphenidate (MP) on prefrontal function using fNIRS in healthy subjects. METHODS Thirteen right-handed healthy subjects underwent working memory tasks (0-back, 2-back) after a single oral dose of MP (20 mg) or placebo administered in a double-blind crossover design on two different days separated by 1-3 days. We measured changes in oxyhemoglobin (oxy-Hb) and deoxyhemoglobin (deoxy-Hb) concentrations during the tasks in bilateral prefrontal regions after MP or placebo administration using 2-channel NIRO-200. RESULTS AND DISCUSSION There were significantly more correct responses and fewer missed responses during the 2-back task performance after MP treatment as compared with placebo. Baseline-corrected increase in oxy-Hb was reduced after MP treatment compared with the placebo in the 2-back task in right frontal region, but was not different in the 0-back task. Baseline-corrected deoxy-Hb and total-Hb concentrations were not significant between MP and placebo conditions in either of the cognitive tasks. This data is consistent with previous PET findings of MP-mediated reduction in lateral prefrontal activity 4 accompanied by improved cognitive performance and shows that fNIRS may be useful in assessing responses of brain to cognition altering drugs. REFERENCES
1 Kuczenski, R. and Segal, D. S., J Neurochem 68 (5), 2032 (1997). 2 Swanson, J. M. et al., J Learn Disabil 24 (4), 219 (1991); Hirai, N. and Nishino, S.,
Curr Treat Options Neurol 13 (5), 437 (2011); Takon, I., Ann Gen Psychiatry 10, 25 (2011).
3 Challman, T. D. and Lipsky, J. J., Mayo Clin Proc 75 (7), 711 (2000); Rozans, M., Dreisbach, A., Lertora, J. J., and Kahn, M. J., J Clin Oncol 20 (1), 335 (2002).
4 Volkow, N. D. et al., PLoS One 3 (4), e2017 (2008); Mehta, M. A. et al., J Neurosci 20 (6), RC65 (2000); Schweitzer, J. B. et al., Biol Psychiatry 56 (8), 597 (2004).
94
159

Analysis of frequency components in optical signals measured by time-resolved near infrared spectroscopy on adults head: preliminary study Michal Kacprzak1, Piotr Sawosz1, Anna Gerega1, Daniel Milej1, Wojciech Weigl2, Roman Maniewski1 and Adam Liebert1 1Nalecz Institute of Biocybernetics and Biomedical Engineering Polish Academy of Sciences Trojdena 4, 02-109 Warsaw, Poland; Tel.: +48226599143; Fax: +48226597030 Email: [email protected] 2Department of Intensive Care and Anesthesiology, Warsaw Praski Hospital, Solidarnosci 67, 03-401 Warsaw , Poland; Tel.: +48226194092 The aim of the study was to develop a method for assessment of the autoregulation of blood microcirculation in the cerebral cortex in human adults. Hemodynamic of cerebral circulation will be monitored noninvasively at the bedside with the use of the time resolved near-infrared spectroscopy. Frequency analysis methods will be combined with the modern time-resolved optoelectronic measurements in order to analyze components of the signals related to the respiration, as well as heart and vascular activity. It was shown that time-resolved near-infrared spectroscopy allows for separation of changes in hemoglobins concentration in intracerebral tissue from changes related to extracerebral compartments (like a skin, bones of the skull) (Steinbrink, Wabnitz et al. 2001; Liebert, Wabnitz et al. 2004; Kacprzak, Liebert et al. 2010; Kacprzak, Liebert et al. 2012). Proposed methodology may allow for the evaluation of cerebral blood flow autoregulation by frequency analysis of the optical signals and will be applied in the control group of healthy volunteers and in the patients with cerebral blood flow disorders caused by traumatic brain injuries. The optical signals were acquired in 22 in healthy volunteers during 10 minutes long measurement. The subjects were investigated in rest conditions in supine position with the use of in-home build time-resolved setup which was previously presented in detail (Kacprzak, 2007). The instrument is based on semiconductor lasers, photomultipliers and time-correlated single photon counting electronics. The results of frequency analysis of the time-resolved signals showed that in most of the subjects all the statistical moments of the measured distributions of times of flight of photons (number of photons, mean time of flight and variance of the distribution) the components from the pulse and breathing can be observed. This observation suggests that the analysis of these frequency components in the time-resolved optical signals can be used to study tissue saturation and in combination with the beat-to-beat pressure measurement the methodology may be used for investigation of brain autoregulation. Furthermore, analysis of respiratory and pulsatile components of the optical signals may be used in estimation of arterial, venous and tissue oxygenation specific for the brain tissue compartment in adult humans. Kacprzak, M., A. Liebert, et al. (2007). "Time-Resolved Optical Imager for Assessment of Cerebral
Oxygenation." J Biomed Opt 12: 0340191.
Kacprzak, M., A. Liebert, et al. (2012). "Application of a time-resolved optical brain imager for
monitoring cerebral oxygenation during carotid surgery." J Biomed Opt 17(1): 016002.
Liebert, A., H. Wabnitz, et al. (2004). "Time-resolved multidistance near-infrared spectroscopy of the
adult head: intracerebral and extracerebral absorption changes from moments of
distribution of times of flight of photons." Applied Optics 43(15): 3037-3047.
Steinbrink, J., H. Wabnitz, et al. (2001). "Determining changes in NIR absorption using a layered
model of the human head." Phys Med Biol 46(3): 879-896.
95
160

Cerebral vasoreactivity to carbon dioxide and neural activation in schizophrenia: a study with near-infrared time resolved spectroscopy
Yoko Hoshi1, Ikuhiro Kida1*, Yoshinobu Iguchi1, Masanari Itokawa2, Satoru Kohno1
1Integrated Neuroscience Research Project, 2Schizophrenia and Depression Project, Tokyo
Metropolitan Institute of Medical Science, *present affiliation: National Institute of Information and
Communications Technology, Center for Information and Neural Networks
OBJECTIVE: Hypofrontality has been a major finding obtained from functional neuroimaging
studies on schizophrenia. Our previous study1 has suggested that resting hypofrontality is a
chronically developed feature of schizophrenia, and this does not necessarily represent
frontal dysfunction, but may anatomical and/or functional changes in frontal microcirculation.
To test this possibility, we investigated the cerebral vasoreactivity to carbon dioxide (CO2) and
neural activation in schizophrenia.
METHODS: Thirteen schizophrenic patients with no brain anatomical abnormalities (7 males,
29-68 years) and 11 healthy volunteers (5 males, 23-49 years) participated in this study. A
two-channel time-resolved spectroscopy instrument (TRS-20, Hamamatsu) was used to
measure Hb concentrations during the performance of a random number generation (RNG)
task, hyperventilation (HV) and breathing into a paper bag (PB). The incident and detecting
light guides were bilaterally placed on the forehead adjacent to Brodmann area 10. Subjects
sat on a chair and were first asked to recite a sequence of random digits between 0 and 9 to a
1-Hz pacing tone. As the control task, they were asked to repeatedly count out softly in order
from 0 to 9. They performed each task until a total number of 100 digits were recited. After the
cognitive tasks, PB were performed for 2 minutes, which was followed by 2-minute-long HV
with an interval of a couple minutes. During the HV and PB tests, end-tidal CO2 (ETCO2) was
monitored (Gas Analyzer, AD Instruments). BP, pulse rate and SpO2 were also monitored
continuously. This study was approved by the Ethical Committee of Tokyo Metropolitan
Institute of Medical Science.
RESULTS: RNG-related increases in oxy-Hb were bilaterally observed in eight patients and
10 control subjects, while four patients and one control subject showed increases in oxy-Hb
only on the right side of forehead. The relationship between ΔETCO2/ETCO2 and
Δoxy-Hb/oxy-Hb in patients was almost the same as that in controls. ΔCMRO2/CMRO2 was
more tightly correlated to ΔCBF/CBF during the RNG task than during HV and PB. There were no significant differences in these correlations between patients and control subjects.
CONCLUSIONS: These results suggest the possibility that neurovascular coupling and
reactivity to CO2 are not primarily impaired in schizophrenia.
Reference 1. Hoshi et al. Schizoph Res 84 (2006) 411-420
96
161

Abstract for “fNIRS Meeting”, London, October 26th-28th, 2012 see http://www.fNIRS.org/fNIRS2012.html
Multi-channel and multi-distance NIRS during neuroangiography: Feasibility and technical aspects
Christian Rummel1*, Arto Nirkko2, Martinus Hauf1, Reto Basiani3, Robert Andres4,
Jan Gralla1 and Gerhard Schroth1
1University Institute for Diagnostic and Interventional Neuroradiology
2Department of Neurology 3Department of Anaesthesiology and Pain Medicine
4Department of Neurosurgery Inselspital, University of Bern, Bern, Switzerland
*[email protected] Introduction Digital Subtraction Angiography (DSA) by its high spatial and temporal resolution is the gold standard in brain vessel imaging. The inherent methodological limitations of DSA are: a) long-time monitoring is impossible because of the limited applicability of X-rays and contrast media, and b) assessment of the hemodynamic state of the brain is restricted to imaging of large vessel collaterals. Non-invasive monitoring of concentration changes of oxygenated and deoxygenated hemoglobin within the outmost millimeters of the brain is possible by NIRS. Methods Multi-channel NIRS was measured during DSA examinations and interventions using the FOIRE-3000 system (Shimadzu, Japan). Absorbance of near infrared light was recorded at three wavelengths (780, 805 and 830nm) and changes of oxygenated and deoxygenated hemoglobin were calculated. The number of channels varied between 4 and 56. Transmitters and receivers were placed on the scalp at 30 and 42mm distance. Results I) Fibre holders and fibre holder caps of the FOIRE-3000 did not significantly interfere with radiography. But the glass fibres of near infrared transmitters and receivers have high X-ray opacity. Adaption of the positioning of the transmitters and receivers nevertheless allowed simultaneous DSA and multi-channel NIRS measurement. II) The first pass of the contrast agent bolus could be recorded by NIRS and corresponded to the injection site. III) Compared with the channels spaced at 30mm, the channels at 42mm yield a lower signal-to-noise ratio (SNR) of the raw NIRS signal. Despite this, their SNR was higher for the NIRS response to bolus injections into brain specific vessels, because these channels cover a higher proportion of brain tissue. Repeated measurements from the same site could be used for further improvement of SNR. Conclusions NIRS monitoring during DSA is feasible with the FOIRE-3000 and may provide complimentary information specific to vascular territories. Due to their high X-ray opacity the glass fibres must be placed adequately to avoid restriction of the field of view of the angiographer. Signals measured at optode distance 42mm have larger brain contribution and redundant measurements allow noise reduction.
97
162

Prefrontal cortex activity and H-reflex variability during dual and single task treadmill walking in
healthy subjects.
Daan Meester1, Emad El-Yahya
1,2, Helen Dawes
1, Penny Martin-Fagg
1
1 Movement Science Group, School of Life Sciences, Oxford Brookes University, Headington,
Oxford OX3 0BP, UK
2 Faculty of Rehabilitation Sciences, The University of Jordan Amman, Jordan
Introduction
Walking has been shown to be affected under dual task conditions. The prefrontal cortex is known to
be more active during dual tasking, however there has been no research reported on the impact of
dual tasking on peripheral reflex responses. Gaining a better understanding of both peripheral and
central mechanisms during different walking conditions could increase knowledge and inform the
development of more targeted training programs. This study set out to explore prefrontal cortex
activity and peripheral reflexes during dual task conditions.
Methods
17 Healthy subjects (7 males, 10 females), aged 22-44, were measured with functional Near-Infrared
Spectroscopy (fNIRS) and H-reflex while walking at self selected walking speed (SSWS) and at 20%
faster than SSWS. Measurements were taken during treadmill walking (single task) and treadmill
walking whilst performing a cognitive distracter task (dual task). NIRS optodes were placed over the
prefrontal cortex. H-reflexes were elicited in the right soleus during mid-stance (30% of gait cycle).
Subjects were instructed to count backwards in steps of 7 during the cognitive distracter task.
Results
The average walking speed of participants during both dual and single task treadmill walking was
1.22ms-1
± 0.24sd for SSWS and 1.48ms-1
± 0.26sd for 20% faster than SSWS. fNIRS results showed
a significant higher concentration of oxy haemoglobin in the right prefrontal cortex and a trend
towards significance in the left prefrontal cortex during dual task walking compared to single task
treadmill walking during both speeds (p = 0.049; p = 0.069). Deoxy haemoglobin concentrations did
show a trend towards a significant lower concentration in the left prefrontal cortex during dual task
treadmill walking compared to single task treadmill walking for both speeds (p = 0.085).
A trend was observed in the variability of the amplitude of the H-reflex, measured with the coefficient
of variation, during dual task walking compared to single task walking (p = 0.088).
Conclusion
The increased concentration of oxy haemoglobin in the prefrontal areas suggest that those areas were
more active during dual than single task conditions. This could indicate that the prefrontal cortex was
more involved in coordinating the walking movement when the subject was dual tasking. The trend
towards an increased variability of the H-reflex suggests that peripheral reflexes may also be affected
by dual task conditions. This data may provide more insight in different ways to look at walking
control which in future could contribute to specific rehabilitation training programs for neurological
populations.
Email address presenting author: [email protected]
98
163

fNIRS of auditory, visual and somatosensory responses in normal-hearing individuals
R.S. Dewey1,2
and D.E.H. Hartley1,2,3
1Division of Otorhinolaryngology, University of Nottingham, UK,
2NIHR Nottingham Hearing
Biomedical Research Unit, Nottingham, UK, 3MRC Institute of Hearing Research, Nottingham, UK
Introduction: The auditory cortex becomes more sensitive to visual and somatosensory stimulation
following deafness [1]. Preliminary evidence suggests that this ‘cross-modal’ brain reorganisation may
predict outcome of cochlear implant use, as evidenced by electrophysiology and fMRI studies [2].
However, these measures are poorly suited for use with cochlear implant recipients, due to the nature
of the implanted device. A recent study by Sevy and colleagues suggests near infra-red spectroscopy is
unaffected by the presence of a cochlear implant [3]. Specifically, they measured cortical responses to
sounds in cochlear implant recipients. We used NIRS to measure cortical responses to visual,
somatosensory and auditory stimulation in normal-hearing adult participants.
Methods: Auditory stimuli were presented from a loudspeaker at 80dB SPL. They consisted of
sinusoidal amplitude-modulated (10Hz; 100% modulated) or un-modulated broadband noise bursts.
Visual stimuli consisted of 1000 white dots on a black background that were randomly flashing or
moving coherently. Somatosensory stimuli were low frequency tones at 20Hz or 10Hz, presented
using a loudspeaker and propagated across a thin plastic plate. Participants placed the palms of both
hands on the plastic plate for the duration of the experiment. Auditory, visual and somatosensory
stimuli were all 20s in duration, and repeated five times in a pseudo-random order. Each stimulus was
interleaved with a 20s rest period. Deoxy- (HbR), oxy- (HbO) and total (HbT) haemoglobin NIRS
responses were acquired using a 24 channel Hitachi ETG4000 system. Optodes were bilaterally
applied to the scalp in 3×3 grids over the temporal lobes during auditory stimulation and over the post-
central gyrus during somatosensory stimulation. A single 3×5 grid covered the occipital lobe during
visual stimulation. NIRS channel positions were obtained using a 3D digitiser. NIRS functional data
were pre-processed using wavelet-MDL detrending and a Gaussian low-pass filter with a FWHM of
4s, and statistically analysed with the NIRS-SPM software suite using a GLM of the block design.
Results & Discussion: 10 participants (age=33±9 years, n=6 female) were recruited to the pilot study.
Cortical responses were successfully recorded in auditory (n=8), visual (n=9) and somatosensory
(n=6) modalities. HbT changes in the temporal lobe, occipital lobe and post-central gyrus from a
representative subject are shown in Figure 1. Most subjects exhibited areas with significantly greater
HbT responses (p < 0.05; Expected EC correction) to (A) modulated compared with unmodulated
noise (6/8 participants), (B) coherent-moving compared with random-flashing dots (6/9 participants),
while (C) 20 Hz vibration compared with 10 Hz produced significant differences in half the (3/6)
participants. In future studies we will use identical techniques to measure and compare cross-modal
activation within the auditory cortex of profoundly deaf subjects with and without a cochlear implant.
Acknowledgements: Supported by the MRC and NIHR. References: [1] Lomber S.G. et al., 2010.
Nat Neurosci. 13(11)1421-1429. [2] Rouger J., et al., 2011. Hum Brain Mapp. [Ahead of print]. [3]
Sevy A.B.G., et al., 2010. Hear Res. 270:39-47. Author’s e-mail: [email protected]
Figure 1: HbT changes in the temporal (A) and occipital (B) lobes and in the post-central gyrus (C) in response to auditory
(AM noise > noise), visual (coherent > randomly moving dots) and vibrotactile (20 Hz > 10 Hz) stimuli respectively, in the
same representative subject.
99
164

Abstract for “fNIRS Meeting”, London, October 26th-28th, 2012 see http://www.fNIRS.org/fNIRS2012.html
NIRS during neuroangiography: First results and potential added value
Christian Rummel1*, Arto Nirkko2, Martinus Hauf1, Reto Basiani3, Robert Andres4, Jan Gralla1 and Gerhard Schroth1
1University Institute for Diagnostic and Interventional Neuroradiology
2Department of Neurology 3Department of Anaesthesiology and Pain Medicine
4Department of Neurosurgery Inselspital, University of Bern, Bern, Switzerland
*[email protected] Introduction A prerequisite for planning neuro-vascular interventions such as recanalization therapy in acute stroke is Digital Subtraction Angiography (DSA), which enables imaging of large vessel collaterals. NIRS may monitor non-invasively the hemodynamic changes within the outmost millimeters of the brain and might qualify as tool providing complementary information. Methods Temporal changes in oxygenated and deoxygenated hemoglobin concentrations during DSA examinations and interventions were measured using the multi-channel NIRS system FOIRE-3000 (Shimadzu, Japan) with 4 to 56 channels. Recording time varied between 6 and 120 minutes. Results I) During unilateral temporary balloon occlusion of the internal carotid artery (ICA) the territory of the ipsilateral middle cerebral artery (MCA) and the watershed areas showed measurable changes in oxygenation. II) In patients with unilateral high grade stenosis of the ICA the effect of the pulsatile heart rate on the variance of the NIRS signal allowed lateralization of the stenosis. III) Brain hyperperfusion due to CO2 increase during apnea is detectable by NIRS. Conclusions NIRS measurement might offer a non-invasive instrument to monitor the treatment effects of revascularisation threapy and provide additional insights on hemodynamic compromise of the outmost brain layers during DSA. In particular, a compromise of some watershed areas was detectable.
100
165

Abnormal Activation Pattern of Schizophrenia in Performing Tower of London Test
Xin Zhang*, Hesheng Wang, Huiling Wang, Yong Fan
Function near-infrared spectroscopy (fNIRS) is a recently developed optical method, which
characterizes noninvasive in vivo measurements of changes of concentrations of oxygenated (HbO2),
deoxygenated (HbR) and total hemoglobin (HbT) in brain outer cortex. The hemoglobin oxygenation
state is intimately associated with the neuronal activity[1]. So the fNIRS facilitates neuroscientists to
explore neuronal activity of subjects. Here we utilized it to recognize abnormal activation pattern of
schizophrenia during taking the same test as normal controls, instead of measuring the difference of
mean concentrations[2].
We located 28 fNIRS channels on the frontal lobe of subjects, seven normal controls and ten
schizophrenia patients. They followed instructions and then performed the Tower of London test of
three levels, demanding one, two and three steps to approach targets. Results of concentrations of
channels and activation pattern are shown in Fig. 1 and Fig. 2, respectively.
(a) (b) (c) (d)
Fig. 1 Concentrations of HbO2 and HbR at channel 5 and 19 of normal (a, b) and patients (c, d).
There were 28 channels to record concentrations of HbO2, HbR and HbT at different positions over
frontal lobe. Fig. 1 shows two channels, No. 5 and 19 to present variations of HbO2 and HbR as well as
the difference of the same recording position between normal control and schizophrenia patients.
Fig. 2 Reconstruction images of subjects during TOL test. The first row shows HbO2, HbR and HbT
from normal control, while the second row from patients.
Referring to these results, HbO2 apparently is more sensitive to brain activities. Schizophrenia patients
have less concentration changes from resting state and their frontal lobe is less activated than normal,
especially in the medial prefrontal part.
[1] D. A. Leopold and A. Maier, "Ongoing physiological processes in the cerebral cortex," Neuroimage, vol. 62,
pp. 2190-2200, 2012.
[2] Y. Zhu, et al., "Reduced prefrontal activation during Tower of London in first-episode schizophrenia: A
multi-channel near-infrared spectroscopy study," Neuroscience Letters, vol. 478, pp. 136-140, 2010.
101
166

Title: The rate of deoxy-Hb changes can be used as a neuromarker to detect the emergence from deep to light anesthesia.
Authors: Jose Leon-‐Carrion(1, 2) Kurtulus Izzetoglu (4) Umberto Leon-‐Dominguez (2) Francisco Jose Garcia Torrado (3) Meltem Izzetoglu (4) Juan Luis Lopez Romero (3) Banu Onaral (4)
(1) Center for Brain Injury Rehabilitation (CRECER), Seville, Spain (2) University of Seville, Spain (3) Virgen del Rocio University Hospital, Seville, Spain (4) School of Biomedical Engineering, Science & Health Systems, Drexel University, Philadelphia, USA
Abstract
This presentation focuses on awareness and suppression of consciousness an on the neurophysiological processes mediating consciousness and the memory process involved in loss of consciousness (LOC). Our study involved a group of patients who underwent general anesthesia during surgery. The anesthetics administered were mainly Propofol and Sevoflorane. To monitor depth of anesthesia, we used two systems simultaneously: the BIS® monitor (Aspect Medical Systems, Norwood, MA) and the functional near-infrared (fNIR) system (fNIR Devices LLC, Potomac, MD). The BIS utilizes an algorithm combining measurement of patient movements with amplitude and phase information from Fourier-transformed electroencephalogram epochs between 0 and 100, with 40-60 indicating the target for awareness prevention. The fNIR is a non-invasive, minimally intrusive, safe medical device which detects the hemodynamic response of brain cortex to cognitive activation. Depth of consciousness was monitored every 8 seconds during induction by using the modified Observer’s Assessment of Alertness/Sedation Scales (OAA/S) as the patient transitioned to deep anesthesia. Averaged 15-second deoxygenated hemoglobin (deoxy-Hb) data prior to each marker following wound closure is compared to BIS measurements until each patient’s eye opening. Change in deoxy-Hb and BIS measurements are obtained according to wound closure marker point, i.e., deep anesthesia phase for each marker point until eye opening which is marked as light anesthesia phase. Our data shows that there is a significant negative correlation between deoxy-Hb and BIS values (r=-0.85). As BIS values increase from deep to light anesthesia, deoxy-Hb values decline to the baseline condition of emergence from deep anesthesia to light anesthesia. Hence, a negative correlation is expected. Working memory and attention are the main cognitive processes involved in consciousness and awareness. Further technical and theoretical implications for operating rooms and hospitals are discussed.
102
167

Uncomfortable visual stimulation and the shape of the haemodynamic response. Sarah Haigh and Arnold Wilkins University of Essex The amplitude of the haemodynamic response measured using NIRS during presentation of a visual grating stimulus varies with the brightness contrast, colour contrast and motion of the component bars of the grating. In general, the grating parameters that increase the amplitude increase the aversiveness of the grating. When discomfort is extreme, as it is when the grating drifts or vibrates at 10Hz, the haemodynamic response is shorter and the response may briefly end below baseline. Recently abnormalities in the haemodynamic response have been observed in patients with migraine. The change in the size and shape of the waveform with increasing aversion provides an interpretation of the abnormalities in migraine as reflecting the greater discomfort experienced by migraineurs. Strong uncomfortable visual stimuli appear to elicit a high-amplitude but relatively brief haemodynamic response.
103
168

Poster Session Applications: Neonatal and Paediatric
Poster #: 104-‐106
169

Investigation of resting state and visual evoked functional activity in neonates during concurrent NIRS and MRI. Theodore Huppert1,2, Ardalan Aarabi1, Laura Dempsey2, Ashok Panigraphy 1
1. University of Pittsburgh, Radiology, Pittsburgh, PA, United States 2. University of Pittsburgh, Bioengineering, Pittsburgh, PA, United States
[email protected] Introduction: Approximately 12.1% of all births in the United States are preterm (i.e., occurring before 37 weeks gestational age). Within this group, nearly half of the infants with birth weights <1500 g will later exhibit cognitive and behavioral deficits, including cognitive visual impairment (CVI), necessitating special educational and rehabilitative (physical, occupational, visual and speech) services. Early intervention is optimal for ameliorating cognitive and behavioral deficits, especially CVI, because it maximizes the timing of intervention against critical periods for development and minimizes the impact of these deficits on later academic skills (e.g., reading, mathematics). However, diagnosis of CVI in a neonate is challenging due to the limited number of visual behaviors that may be assessed clinically in an awake infant. In this study, we preformed concurrent frequency-domain NIRS imaging during 3T MRI scanning in neonates in order to compare baseline physiological values (oxygenation and blood volume), resting state fluctuations in brain activity, and functional activation between the optical and MRI modalities.
Methods: A frequency-domain NIRS system (ISS Imagent) was used to record baseline and functional optical signals. A custom built MRI compatible probe with multi-distance overlapping (tomographic) measurements was used (shown left). MRI scanning was done at 3T using a Siemens TRIO scanner with a 12-channel adult head coil (in order to accommodate the NIRS probe). Vitamin E markers on the probe were used for registration in the MRI structural image. A custom built LED-based lighting system that was mounted on the inside of the MRI bore was used for visual stimulus. Six LED positions (at about 15o spacing) were illuminated under computer control and programmed to flash in unison (at 2Hz) or to sweep sequentially from side to side to produce a moving visual stimulation
Results: Figure 2 shows the NIRS and MRI time courses from a 43week infant. Strong correlation between the NIRS and fMRI (R=0.86) was observed in the occipital cortex during the resting state scan Conclusions: This study remains ongoing, but our initial data indicate strong correspondence between MRI and NIRS data. This suggests the possibility of using NIRS as a stand-alone (bedside) modality in future studies.
Fig 1. NIRS instrument (right) and MRI-insert head cap for NIRS recordings (left/bottom).
Fig 2. Concurrent fNIRS-fMRI data was recorded during the resting state in a term infant at 43weeks. The images above show strong (R=0.86 and 0.39) correlations between the fNIRS and BOLD signal for signals from left and right hemispheres. The MRI image shows the effective connectivity map generated from a seed region within the left region-of-interest (occipital).
104
170

THE IMPACT OF NEONATAL INTRAVENTRICULAR HEMORRHAGE ON
AUDITORY HEMODYNAMIC RESPONSE
M. Mahmoudzadeh(1), M. Fournier(1), G. Dehaene-Lambertz(2),G. Kongolo(1), S. Goudjil(1),
R. Grebe(1), F. Wallois(1)
(1) GRAMFC, EA4293, Université de Picardie, CHU Nord, Amiens, France, (2) 3IFR49,
Neurospin, 91191 Gif/Yvette, France
Objective
Children with delays in language and speech development are at high risk for later disorders in
reading, spelling, and writing, academic skills which are highly dependent on language abilities.
Brain injuries have been found to be associated with language and speech outcomes among
children born prematurely. Severe grades of intraventricular hemorrhage (IVH) are risk factors
for adverse neurodevelopmental outcomes, including cognitive impairment and cerebral palsy.
Method
Eight healthy and five ill preterm neonates (IVH grade III and IV) (GA:28-32 weeks) participated
in an optical topography study designed to assess the specific characteristic of neurovascular
coupling to auditory syllabic stimuli in healthy and ill neonate brains. Auditory stimuli consist of
two digitized syllables /ba/ and /ga/, naturally produced by a male and a female speaker. Neonates
were tested while they slept. We used 16-channel Near-Infra Red Spectroscopy (NIRS) device to
assess changes in the concentration of deoxyhemoglobin (HBR) and oxyhemoglobin (HBO) in
response to auditory syllabic stimuli in the right and left hemispheres.
Result
We found that temporal areas of healthy neonates showed significantly more activation (increase
in [HBO], decrease in [HBR] than ill neonates when were exposed to auditory stimuli.
Conclusion
The present data confirm the existence of neurovascular coupling in healthy premature brain. It
also shows that ill premature neonates are unable to process syllabic stimuli, a step for language
acquisition ability. The results are in accordance with what we previously described concerning
abnormalities of spontaneous neurovascular coupling in pathological EEG discontinuity in ill
premature neonates. This inability of pathological brain to adapt to either endogenous or
exogenous stimuli by an increase in blood flow can represent a mechanism by which the
pathological brain enters in a deleterious pathological loop. This might explain cerebral
disabilities observed latter in acquisitions throughout the neurodevelopment.
105
171

Concurrent Functional Near-Infrared Spectroscopy and Motion Tracking to Assess Functional Improvement of Children with Cerebral Palsy After Constrained Induced Motion Therapy Bilal Khan, Nathan Hervey, Fenghua Tian, Hanli Liu, George Alexandrakis Bioengineering Department, University of Texas at Arlington, 500 UTA Boulevard, Arlington, TX, 76010 Linsley Smith, Nancy J. Clegg, Mauricio R. Delgado Texas Scottish Rite Hospital for Children, Department of Neurology, 2222 Welborn Street, Dallas, Texas, 75219 Laura Shagman and Duncan L. MacFarlane The University of Texas at Dallas, Department of Electrical Engineering, Richardson, TX 75080 A special interest in functional neuroimaging is to quantify brain plasticity as identified by changes in cortical activation patterns after therapy. In this work we will image cortical plasticity in children with cerebral palsy (CP) after they have undergone occupational therapy. In recent studies1 we have demonstrated that functional near-infrared (fNIR) imaging is a viable and sensitive method for mapping motor cortex activities in children with CP. FNIR imaging metrics such as Time-to-Peak (TtP), Duration, Laterality Index (LI), and Area of Activation (AoA) were found to be significantly different between CP and age-matched healthy children. In addition to fNIR imaging, quantitative information about the actions performed during imaging can be used to correlate the child's physical improvement to the changes seen in cortical activity. Thus in this study, fNIR imaging and measurements of the movement will be performed concurrently. Additionally, the fNIR imaging field of view will be expanded to include the secondary motor areas (premotor cortex and supplementary motor area), and both tapping and sequential tapping will be performed by the children during the imaging. Both types of tapping will be tracked by a 6-camera motion tracking system which will determine the three dimensional positions of retro-reflective targets placed on the fingers, wrists, and arms of the children. These measurements will be done on four children with CP before and immediately after two weeks of constrained induced motion therapy (CIMT), and on 5 age-matched healthy controls. Improvements in motor performance will then be determined by the changes in motion tracking metrics before and after therapy and these will be correlated to the spatio-temporal changes in cortical activity patterns. 1. B. Khan, F. Tian, K. Behbehani, M.I. Romero-Ortega, M.R. Delgado, N. Clegg, L. Smith, D.
Reid, H. Liu, G. Alexandrakis, “Identification of abnormal motor cortex activation patterns in children with cerebral palsy by functional near infrared spectroscopy,” J. Biomed. Opt. 15(3) 036008-1 – 14, (2010).
E-mail address for presenting author: [email protected] Keywords: functional imaging, near-infrared, cortical activation, motion tracking, cerebral palsy
106
172

Poster Session Other
Poster #: 107-‐115
173

-4
-3
-2
-1
0
1
2
3
4
-20
-15
-10
-5
0
5
10
15
20
0 50 100 150 200 250 300 350
HHb (120)
HbO2 (120)
CCO (120)
-0.6
-0.4
-0.2
0
0.2
0.4
0.6
0 50 100 150 200 250 300 350
CCO (3)
CCO (8)
Err
or
Dif
fere
nce
(M
)
oxC
CO
(M
)
Time (min)
HI
(a)
(b)
Haem
og
lob
in(
M)
Fig 1. (a) Concentration changes in apiglet study during HI as estimatedusing broadband (120 wavelengths)NIRS data resolving from 780-900nm(“gold standard”); (b) Absolutedifference in M of oxCCOconcentration changes versus the “goldstandard” when resolve for theoptimised 3 (790,834,886nm), 8(784,800,819,842,855,870,879,894nm)wavelengths.
Optimal Wavelength Combinations for Resolving in-vivo Concentration Changes of Haemoglobinand Cytochrome-c-Oxidase with fNIRS.
T. Madaan1, T. Zhu1*, A. Bainbridge2, E. Baer1, S. Faulkner3, D. Price2, D. Thomas4, E. Cady2, N.Robertson3, X. Golay4, I. Tachtsidis1
1 Dept of Medical Physics & Bioengineering, University College London, UK ; 2Medical Physics andBioengineering, University College London Hospitals, UK; 3Institute for Women's Health, University CollegeLondon, UK; 4Institute of Neurology, University College London, UK *[email protected]
Introduction: In continuous-wave fNIRS we employ a linear algorithm that relates the changes in opticalattenuation (measured in discrete near-infrared wavelengths) with the changes in concentrations of thetissue chromophores of interest - oxy-, deoxy- haemoglobin (HbO2, HHb) and oxidised cytochrome-c-oxidase (oxCCO) - scaled with their optical absorption characteristics and the total pathlength of light.This spectroscopic approach has the potential to cause crosstalk between the concentration measurementsof the three chromophores. It has been suggested that this can be minimised by utilising a large number ofoptical wavelengths[1]. Here we investigate the issue of wavelength number versus wavelengthcombination. Methods: We use changes in attenuation measured between 780-900nm with 1nmresolution from the piglet brain with broadband spectrometer during hypoxic-ischaemia (HI) when thehaemoglobin and oxCCO changes are large[2]. We then continued to investigate the optimal number andcombination of 3, 4, 5, 6, 8 NIR wavelengths out of the 120 that can produce similar estimations for thethree chromophores. We chose that wavelength range due to greater availability of discrete laser sourcesin that range. The possible combinations in that range for example for eight wavelengths out of the 120wavelengths are 899,749,479,915. Resolving these combinations is computationally unrealistic. Totackle the issue we estimate a normalised root mean square residual for all three chromophores. We thenimplement a minimisation function based on the use the genetic algorithm (GA); we modified the Matlabbuilt-in function for GA provided in the Global Optimization Toolbox (MathsWork Inc.). GA is a
technique that uses heuristic search to solve for solutions tooptimisation problems using natural evolution such asselection of population, mutation and crossover.Results: Figure 1(a) shows an example from an animal thatexperienced a severed insult without recovery and Figure1(b) the difference that wavelength numbers have to theconcentration of oxCCO. Using data from 10 animal studiesduring HI we have identified the optimum wavelengthnumber to be 8 and wavelength combination for these 8wavelengths to be 1=784, 2=799-804, 3=815-819,4=829-833, 5=855-859, 6=869-873, 7=878-881 and8=894-895nm. Discussion: Broadband NIRS providesthe optimum solution for resolving the changes in theHbO2, HHb and oxCCO however these systems areexpensive and not commercially available for medicaluse. A NIRS system with a discrete number of wavelengthscan be a cheaper solution but careful selection of thewavelength combination is needed to minimise any crosstalkeffects. Here we suggest possible wavelength combinationsbased on experimental data and using our novel GAoptimisation tool.References: [1] S. J. Matcher, et al. AnalyticalBiochemistry, 227(1), 54-68 (May 1995).[2] I. Tachtsidis, et al. Biomedical Optics (BIOMED) 2012JM3A.27 OSA Technical Digest (CD), (2012).
107
174

Performance assessment of time-domain fNIRS instruments in the “nEUROPt” project
H. Wabnitz1, A. Jelzow1, M. Mazurenka1, O. Steinkellner1, D. R. Taubert1, R. Macdonald1, A. Pifferi2,3, A. Torricelli2, D. Contini2, L. Zucchelli2, L. Spinelli3, R. Cubeddu2,3, D. Milej4, N. Żołek4, M. Kacprzak4, A. Liebert4, S. Magazov5, J. Hebden5, F. Martelli6, P. Di Ninni6, G. Zaccanti6 1 PTB, Physikalisch-Technische Bundesanstalt, Berlin, Germany 2 PoliMi, Politecnico di Milano–Dipartimento di Fisica, Milano, Italy 3 CNR-IFN, Consiglio Nazionale delle Ricerche–Istituto di Fotonica e Nanotecnologie, Milano, Italy 4 IBIB, Institute of Biocybernetics and Biomedical Engineering, Warsaw, Poland 5 UCL, Department of Medical Physics and Bioengineering, University College London, UK 6 UniFi, Dipartimento di Fisica e Astronomia dell’Università degli Studi di Firenze, Italy
Introduction: The European project “nEUROPt” (FP7-HEALTH-2007-201076) was devoted to developments in technology and data analysis for time-domain optical brain imaging and their application in clinical pilot studies. To assess and compare the performance of instruments as well as methods of data analysis, standardized protocols were developed and applied. While the previous “MEDPHOT” protocol [1] was employed to assess photon-migration instruments with respect to their ability to measure the optical properties of homogeneous media, specific tests for optical brain imagers were covered with two new protocols. The “Basic instrumental performance” (BIP) protocol [2] is related to relevant, solely instrumental characteristics. The “nEUROPt” protocol [3] addresses sensitivity, spatial resolution and quantification of absorption changes in the brain by measurements on specific inhomogeneous phantoms.
Methods: As part of the BIP protocol, a novel test measures the responsivity of the detection system, i.e. the overall efficiency to collect and detect light emerging from tissue. For this test dedicated, spectrally characterized solid slab phantoms were used. The “nEUROPt” protocol was implemented with liquid phantoms based on Intralipid [4] and ink [5], with black inclusions and, alternatively, in two-layered geometry. Small black cylinders of various sizes were used to mimic small localized variations of the absorption coefficient. Their position was varied in z (depth) and x-y direction to measure contrast and spatial resolution. Two-layered liquid phantoms were used, in particular, to determine depth selectivity, i.e. the ratio of contrasts due to a deep and superficial absorption change of the same magnitude. Measurements were analyzed by methods based on time windows and moments of time-of-flight distributions.
Results: Four groups in the “nEUROPt” consortium applied the protocols together with guidelines for their implementation to characterize their time-domain optical brain imagers. Several synthetic descriptors, e.g. for contrast, contrast-to-noise ratio, depth selectivity, were employed to quantitatively compare the various instruments and approaches of data analysis.
Conclusions: Most of the tests are not restricted to time-domain methods but are applicable to fNIRS instrumentation in general. With some modification, part of the phantom tests can be adopted for verification purposes in a future fNIRS standard.
References: 1. Pifferi A et al., “Performance assessment of photon migration instruments: the MEDPHOT protocol,” Appl.
Opt. 44(2005) 2104-14. 2. Wabnitz H et al. “Assessment of basic instrumental performance of time-domain optical brain imagers,”
Proc. SPIE 7896 (2011), 789602. 3. Wabnitz H et al. “Performance Assessment of Time-Domain Optical Brain Imagers: The nEUROPt
Protocol,” OSA BIOMED 2012, BSu2A.4. 4. Di Ninni P, Martelli F, Zaccanti G,“Intralipid: towards a diffusive reference standard for optical tissue
phantoms,” Phys. Med. Biol. 56 (2011), N21-8. 5. Di Ninni P, Martelli F, Zaccanti G, “The use of India ink in tissue-simulating phantoms.” Opt. Express 18
(2010), 26854-65.
108
175

Near infrared spectroscopy of the bladder to monitor physiologic function in health and disease.
Andrew Macnab, Babak Shadgan, Lynn Stothers. NIRS study group University of British Columbia, Dept. of Urology, UBC Hospital Bladder Care Centre, Vancouver, Canada. [email protected]
NIRS applications for bladder studies are recent. The bladder is uniquely vascularised so that the microcirculation can maintain perfusion as the organ contracts and then fills. Various diseases compromise the ability of the microcirculation to maintain perfusion during the spatial changes that occur during filling and emptying, and/or affect the mechanics and physiology of detrusor muscle contraction. As the bladder empties contraction of the detrusor muscle generates changes in oxygenated and deoxygenated haemoglobin concentration which allow variations in the organ’s hemodynamics and oxygen supply and demand to be inferred. This information is not available to urologists by other means and their current ‘gold standard’ test (UDS) used to evaluate all forms of voiding dysfunction is invasive and only measures bladder pressure and urine flow. Consequently non-invasive transcutaneous optical monitoring of the bladder is both relevant and clinically desirable.
The feasibility of various devices has been demonstrated: continuous wave with lasers, single and multi-channel, emitter/detector grid configuration for fNIRS mapping, and a miniaturized self-contained wireless instrument with light emitting diodes (LED) and spatially resolved emitter/detector geometry.
Different trends and patterns of chromophore change are evident from monitoring the voiding cycle in patients in health and disease (figure). Such patterns ‘match’ NIRS data from other tissues where altered hemodynamics and impaired oxygen supply and demand occur, and hence provide novel insights into the underlying causes of voiding dysfunction, and choice of potential therapeutic interventions. Three different diagnostic algorithms have also been studied; all incorporate elements of bladder NIRS data reflecting differences in detrusor hemodynamics and have comparable discriminant ability, good specificity and sensitivity, and concordance (89%) with ‘gold standard’ UDS pressure flow data in the diagnosis of bladder outlet obstruction due to prostatic hyperplasia in independent studies.
Confidence that bladder NIRS measures physiologic changes in the detrusor comes from: the physics of penetration, scattering and chromophore absorption of NIR photons; the consistent anatomic position of the bladder and ultrasound evidence that the anterior wall maintains its spatial geometry with a NIRS device on the lower abdominal skin during voiding; and because the changes only occur over the bladder (not control emitter/detectors elsewhere on the abdomen) and in relation to events in the voiding cycle.
The evolution of wireless NIRS methodology for bladder studies is an example of effective clinician researcher collaboration; miniature self-contained devices with LEDs and ‘oxygen saturation’ capability make monitoring in ambulant subjects straightforward, and studies possible in special populations such as children and patients with spinal cord injury.
Hence, bladder NIRS is an advance of relevance in urology, and wireless devices offer an avenue to expand research and clinical monitoring in this field and a new opportunity to progress further with translation of NIRS into other relevant clinical arenas.
109
176

In vivo Time-resolved DOT images of human forearm under exercises
Yukari Tanikawa1,2, Feng Gao3, Michio Miyakawa4, Toru Kiryu4, Tomohiro Kizuka5, Shinpei Okawa6, and Yukio Yamada2
1National Institute of Advanced Industrial Science and Technology (AIST), Japan, 2University of Electro-Communications, Japan, 3Tianjing University, R. P. China, 4Niigata University,
Japan, 5University of Tsukuba, Japan, 6National Defense Medical College, Japan. [email protected]
1. Introduction During the forearm exercise, it is generally understood that the inner muscles work for the task, and the outer muscles work to fix the joints for efficient work of the inner muscles.
Time-resolved diffuse optical tomography (TR-DOT) can provide cross-sectional images of the change in the oxygenation state inside human forearm. In vivo measurements using a TR-DOT system were performed for human forearms under the handgrip exercises. The tomographic images of the oxygenation state were reconstructed using the algorithm based on the modified generalized pulsed spectrum technique[1]. 2. Methods
A 16-channel TR-DOT measurement system was used for the measurements. Total 16 fiber probes were fixed around the forearms of subjects through a circular fiber holder with an equal spacing. One fiber probe working as a source illuminated the forearms with pulsed light, and the other fiber probes detected light transmitted through the forearms. Repeating the measurements by changing the source probe, we acquired a dataset for image reconstruction. Data acquisition time for one DOT image was about 150 sec. Reference data were firstly acquired before exercise. Soon after the reference measurement, the subject was asked to start the handgrip exercise. 30 sec after the start of the exercise, another measurement was performed without changing the system conditions. Modified generalized pulse spectrum technique (mGPST) was used for the image reconstruction. It is a Newton-Raphson method based technique, which minimizes, in the least-square sense, the error between the featured data and the forward solution of the Laplace-transformed photon diffusion equation by updating the distributions of the optical properties iteratively. The finite element method was employed to solve the photon diffusion equation.
3. Results and Summary Figure 1(a) shows the reconstructed DOT
images of the changes in the concentrations of the oxy-Hb&Mb, deoxy-Hb&Mb and total-Hb&Mb by the handgrip exercise when the forearm was placed horizontally on an arm holder. These images are the differential images between the task and reference states. By comparing with the MR-image, the large oxygenation changes appearing inside the forearm are believed to show the activities of the inner muscles.
Figure 1(b) shows the reconstructed DOT images when the forearm was hung vertically without an arm holder. Large oxygenation changes also appear inside the forearm. The area of the large oxygenation changes is smaller than in the case of Fig. 1(a). The difference in the images between the cases of horizontal placement and vertical hanging of the forearms may be due to the difference in the types of the active inner/outer muscles. 4. Acknowledgement
This work was supported by KAKENHI (22300151). 5. Reference [1] Gao, F. et. al, IEICE Trans. on Info. & Sys.,
E85-D-1, 133-142, (2002).
Figs. 1 Reconstructed Hb&Mb images generated from TR-DOT measurement for handgrip exercises with the two attitudes.
(a) Forearm was placed horizontally. (b) Forearm was hung vertically.
110
177

Helmet Karim1, Joseph Furman2,3, Theodore Huppert1,3
1. University of Pittsburgh, Radiology, Pittsburgh, PA, United States 2. University of Pittsburgh, Otolaryngology, Pittsburgh, PA, United States 3. University of Pittsburgh, Bioengineering, Pittsburgh, PA, United States
[email protected] Introduction Functional near-infrared spectroscopy (fNIRS) is a non-invasive brain imaging method that uses light to record regional changes in cerebral blood oxygenation during functional tasks. In a set of experiments, we have applied fNIRS to study cortical brain activations during vestibular and posturography testing. Methods A 32-channel device was used to record brain activation during a series of vestibular experiments. Caloric stimulation. A bilateral fNIRS probe was used to record brain activity from the frontal and temporal regions of 20 healthy persons: (N=10 young; N=10 older). Brain responses were recorded during warm (44oC) and cool (30oC) caloric irrigations. The older group showed increased bilateral activations of the superior temporal gyrus (STG) compared to the younger population. Dynamic Posturography. FNIRS was recorded during sensory organization testing (SOT) on an EquitestTM platform in ten young healthy volunteers. Brain areas in STG and frontal cortex (FC) were activated during the SOT conditions. Rotational testing. A 4-channel wireless fNIRS system was built to allow measurements in STG during earth-vertical axis rotational testing. Bilateral STG/SMG activation was recorded from twenty healthy volunteers (N=10 young; N=10 older) during sinusoidal rotation (0.1 Hz, 60 deg/sec) in the dark. Results In each of these experiments, significant changes in the superior temporal gyrus were recorded using fNIRS. This finding is consistent with the role of this part of the brain in cortical processing of secondary vestibular information. Conclusions These experiments demonstrate the feasibility of using fNIRS imaging for studying cortical activity during vestibulo-ocular and postural challenges.
111
178

Exploring the effects of Nilvadipine on blood pressure, cerebral blood flow and cerebral
autoregulation in patients with mild to moderate Alzheimer’s Disease: a NILVAD add-on study
Kastenberg-van Spijker, Gerrita1,2
; Meulenbroek, Olga1,2
; Claassen, Jurgen1,2
; Olde Rikkert,
Marcel1,2
1 Department of Geriatric Medicine, Radboud University Nijmegen Medical Centre, Nijmegen, The Netherlands;
(e-mail address of the presenting author: [email protected]) 2 Radboud Alzheimer Centre, Radboud University Nijmegen Medical Centre, Nijmegen, The Netherlands
Introduction: Nilvadipine is a dihydropyridine calcium channel blocker with putative neuroprotective
properties. For instance, in comparison with amlodipine, nilvadipine showed favourable effects on
cognitive function with stabilization of cognitive decline and reduced conversion to AD in
hypertensive patients with mild cognitive impairment (Hanyu et al. 2007). It has a selective effect on
the cerebral artery contrary to other calcium channel blockers and it easily penetrates the central
nervous system through the blood-brain barrier. In a European phase III trial (the NILVAD study), the
efficacy and safety of nilvadipine as a disease course modifying treatment in mild to moderate AD will
be investigated, focussing on changes in cognitive function.
As an add-on study to NILVAD, we will investigate the physiological effects of nilvadipine on blood
pressure, cerebral autoregulation, cerebral blood flow, and Alzheimer-related cerebral damage in 40
patients who participate in the NILVAD study in Nijmegen (the Netherlands).
Methods: In this double-blind randomised controlled study a total of 40 mild to moderate AD patients
(MMSE 12 and ≤ 26) will be enrolled. For 18 months, they will take either nilvadipine (8 mg) or a
placebo daily. At baseline, after 24 weeks and 72 weeks participants visit our clinic for measurements.
In the week prior to the visits home-based blood pressure will be measured daily, to ensure reliable
values on blood pressure and blood pressure variability. The measurements during visits consist of: 1)
continuous NIRS measurements (frontal cortical oxygenation); 2) simultaneous Transcranial Doppler
and continuous blood pressure monitoring to provide (together with NIRS) insight in the pressure-flow
relationship (cerebral autoregulation); and 3) Arterial Spin Labeling MRI, providing information on
regional cerebral blood flow. Main outcomes are the changes from baseline to week 24 (and week 72)
in these parameters.
Results: The enrolment for this study is planned to start in October 2012. Results of baseline
measurements are expected in 2014, and completion of the data collection in 2016.
Hypothesis: We hypothesize that treatment with nilvadipine will improve blood pressure stability and
cerebral perfusion in patients with AD, and that these effects will constitute the basis of the
hypothesized beneficial effects of nilvadipine on cognition. Due to cortical atrophy and affected
microvessels in patients with AD, cerebral perfusion is declined. Among others, improvement of
cerebral perfusion by nilvadipine can be reflected in oxygenation levels measured with NIRS
(Claassen and Zhang, 2011; van Beek et al. 2010; van Beek et al. 2012).
Reference:
Claassen JA, Zhang R. Cerebral autoregulation in Alzheimer's disease. J Cereb Blood Flow Metab. 2011 Jul;31(7):1572-7.
Hanyu H, Hirao K, Shimizu S, Sato T, Kiuchi A, Iwamoto T. Nilvadipine prevents cognitive decline in patients with mild
cognitive impairment. Int J Geriatr Psychiatry. 2007 Dec;22(12):1264-6
van Beek AH, Lagro J, Olde-Rikkert MG, Zhang R, Claassen JA. Oscillations in cerebral blood flow and cortical
oxygenation in Alzheimer's disease. Neurobiol Aging. 2012 Feb;33(2):428.e21-31.
van Beek AH, Sijbesma JC, Jansen RW, Rikkert MG, Claassen JA. Cortical oxygen supply during postural hypotension is
further decreased in Alzheimer's disease, but unrelated to cholinesterase-inhibitor use. J Alzheimers Dis.2010;21(2):519-26.
112
179

Hemodynamic cerebral response as a function of the neurovascular coupling to brain activation: NIRS signal changes
Kevin Mandrick1,2, Denis Coulon1, Stéphane Perrey2 and Jean-Paul Micallef2 1Bodysens company, Nîmes, France, 2Movement to Health (M2H) laboratory, Euromov, Montpellier-1
University, France Corresponding. Email: [email protected]
Keywords: physiological modeling, NIRS signal, neurovascular coupling
In the brain, coupling of neuronal activity and metabolism with regional blood flow and cerebral blood oxygenation is tight (i.e., the so-called neurovascular coupling). Precisely, it is the mechanism by which focal neuronal activity produces an undue increase of local blood flow in the microvasculature after brain activation. This excessive influx of blood termed “functional hyperemia” was described first by Roy and Sherrington (1890) who postulated that chemical by-products of metabolism (vasoactive substances) affected the vessel wall, altering the arteriole and capillary caliber. It is often assumed that hyperemia serves to sustain neuronal tissue metabolism by adjusting the blood flow to meet energy needs (glucose and oxygen supply). Assessing neuronal activity by non-invasive techniques of functional brain imaging, which are based on the hemodynamic responses, depends totally on the physiological cascade of metabolism and blood flow. At present, blood-oxygen-level dependent functional MRI (BOLD-fMRI) and functional NIRS (fNIRS) are widely used in cognitive neuroscience to depict the hemodynamic response as a function of the neurovascular coupling to brain activation. Due to the high temporal resolution, the NIRS measurement has advantages over BOLD-fMRI in that it is possible to characterize more accurately the transient response of blood volume and oxygenation time courses. However, the lack of a detailed understanding of the underlying physiology did not hinder to interpret correctly the NIRS signal changes. Knowledge of how neurovascular coupling is extracted from NIRS data is crucial for understanding, analyzing and interpreting various NIRS pattern responses in healthy and disease people. Indeed, the output NIRS signals during functional brain activity depend upon many hemodynamic and physiological interrelated parameters like regional cerebral blood flow (rCBF), volume (rCBV), cerebral metabolic rate of oxygen (CMRO2), cerebral metabolic rate of glucose (CMRGluc), oxy- and deoxy-hemoglobin concentration changes (∆[HbO2] and ∆[HHb], respectively). We have investigated, reviewed and integrated several recent findings, models and knowledge to provide an original schematic illustration of time courses of ∆[HbO2] and ∆[HHb] and hemodynamic variables as a function of the neurovascular coupling during brain activation. Accordingly, since the most notable NIRS pattern found in the literature is a localized increase in ∆[HbO2] with a concomitant drop in ∆[HHb] over an activated brain area, we proposed below this illustration for short (2 s) or long (60 s) functional stimulus application (Figure).
Fig. The typical NIRS signal changes observed during and after short (at the left) or long (at the right)
functional stimulation.
113
180

Analysis of Stroop Test fNIRS data by use of Singular Value Decomposition
Serdar Aslan, Ata Akin Institute of Biomedical Engineering, Bogazici University, Kandilli, 34684, Istanbul, TURKEY
{[email protected], [email protected]}
Introduction: The prefrontal region of brain is composed billions of neurons working in a connected manner. Through fNIRS measurements we can observe only groups of these neurons due to finite resolution of the technique. In this work AR(1) model is used to obtain the connectivity pattern of the prefrontal brain region. An SVD based scheme is exploited to suppress the common mode network and highlight the single channel pairs that are strongly connected. Method: fNIRS data were collected from 12 healthy subjects during Stroop Test. This test is composed of three different question types: neutral, congruent and incongruent (N, C, IC). Subjects respond to 30 questions of each type that are clustered into 5 blocks. The blocks are randomly interchanged for each subject. After each question block there is a 20 second rest. The data is preprocessed by a Hampel filter to eliminate the outliers and band-pass filtered in the interval (0.003-
0.08 Hz). The AR(1) model is given as where Yj is the time series of the 16 channel fNIRS measurements at “jth” time interval and A is the AR(1) connectivity matrix. A matrices are calculated for each question block by use of maximum likelihood estimate and averaged over blocks to obtain the representative A matrices for each question type for each subject. The connectivity A matrix is modeled as 𝐴 = 𝐴!" + 𝐴!,!,!" + 𝐴!" and decomposed via SVD method where the lower valued eigenvalues stand for the random network (noise) part ARN, higher eigenvalues stand for the common mode Stroop activity related network ACN, while the middle part stands for true Stroop test related connectivity: AN,C,IC.
Results and Discussion: ANOVA is applied to 12 subjects for the three question types. p<0.05 values are thresholded. As a result 13 entries are found to be significant in the Stroop test: (1,14) (2,11) (3,7) (6,13) (6,15) (9,11) (10,11) (11,9) (12,9) (12,11) (12,14) (14,3) (15,1). The second entry means that it exerts influence to the first entry. For example 1,14 means: 14th region influences the 1st region.
(a)
(b)
Fig1. (a) Locations of the channels on the forehead and the approximate corresponding PFC sampling area (channels in red) (b) Statisticall significant entries in the A matrix ( the right bar is the p value)
Conclusion: Channels 11 and 14 on the right middle PFC seem to influence the rest of the channels with a stronger influence suggesting a right dominance during the stroop activity while Ch 11 seems to be the most influenced. Hence Ch 11 can be a hub for the Stroop activity.
2 4 6 8 10 12 14 16
2
4
6
8
10
12
14
160.005
0.01
0.015
0.02
0.025
0.03
0.035
0.04
0.045
114
181

Cerebral oxygenation measurement with acousto-optics: a simulation study
Terence S. Leung1* and Samuel Powell1
1Department of Medical Physics and Bioengineering, University College London, UK
In functional near infrared spectroscopy (fNIRS), a widely adopted kind of optical probe consists of a single optical source and a single detector, which measure optical attenuation reflected back from the cortex. The sensitivity profile of this optical probe has a “banana” shape [1]. An example of the sensitivity profile is shown in Figure 1. It is noted that the most sensitivity region is in fact near to the skin, rather than in the brain. This is the reason why in many fNIRS studies, the systemic response, which also manifests itself in the skin, greatly affects the cerebral oxy- and deoxy-hemoglobin signals leading to a high number of false positives [2]. In this work, we consider a new design of optical probe which incorporates focused ultrasound with fNIRS, a technique known as acousto-optics. When diffused photons pass through an ultrasound field, their optical phases are modulated by the ultrasound. The focused ultrasound therefore acts like it were “tagging” the photons. Although ultrasound is highly attenuated by the skull, this technique only requires ultrasound to go one way into the brain (rather than two-ways as in the case of ultrasound imaging), which makes the focusing of ultrasound in the brain feasible. We have been developing computational models for acousto-optics including Monte Carlo simulations [3, 4] and finite element method (FEM) models. Figures 1 and 2 depict our recent FEM results for an optical probe and an acousto-optic probe. It can be seen that the sensitivity profile of the acousto-optic probe has much higher sensitivity values inside the head model, in comparison to that of the optical probe. These simulations were based on a simple homogenous, circular geometry. In the conference, simulation results based on anatomical head geometries will be presented. This work explores the feasibility of applying acousto-optics to fNIRS which may one day offer a better solution to improve the accuracy of fNIRS studies.
Figure 1 Sensitivity profile of an optical probe (note: red corresponds to higher values)
Figure 2 Sensitivity profile of an acousto-optic probe (note: red corresponds to higher values)
[1] D. A. Boas and A. M. Dale, "Simulation study of magnetic resonance imaging-guided cortically constrained diffuse optical tomography of human brain function," Appl Opt, 44, pp. 1957-1968, 2005.
[2] I. Tachtsidis, T. S. Leung, A. Chopra, P. H. Koh, C. B. Reid, and C. E. Elwell, "False Positives in Functional near-Infrared Topography," Oxygen Transport to Tissue Xxx, vol. 645, pp. 307-314, 2009.
[3] T. S. Leung and S. Powell, "Fast Monte Carlo simulations of ultrasound-modulated light using a graphics processing unit," Journal of Biomedical Optics, vol. 15, p. 055007, 2010.
[4] S. Powell and T. S. Leung, "Highly parallel Monte-Carlo simulations of the acousto-optic effect in heterogeneous turbid media," Journal of Biomedical Optics, vol. 17, p. 045002, 2012.
Focused ultrasound
Ultrasound transducer Optical source Optical detector
115
182