Evaluation of the recovery of microbial functions during soil restoration using near-infrared...
10
Author's personal copy Evaluation of the recovery of microbial functions during soil restoration using near-infrared spectroscopy Heidy Schimann a, *, Richard Joffre b , Jean-Christophe Roggy a , Robert Lensi b , Anne-Marie Domenach a a UMR EcoFoG, campus agronomique, BP 709, 97387 Kourou, French Guiana b CEFE, 1919 routes de Mende, 34000 Montpellier, France 1. Introduction Soil governs plant productivity in terrestrial ecosystems and acts to maintain the equilibrium of biogeochemical cycles through biotransformations (or functions) mediated by living organisms. It has been recognized for many years that microbes are responsible for 80–90% of these functions (Nannipieri et al., 2003). It is thus of great interest for the sustainability of our environment to assess if the procedures of restoration of sites applied soil ecology 37 (2007) 223–232 article info Article history: Received 2 July 2007 Received in revised form 2 July 2007 Accepted 3 July 2007 Keywords: NIRS Microbial activities Respiration Denitrification Carbon Nitrogen Soil functioning Restoration abstract Microbial-based indicators, such as C and N contents or microbial functions involved in C and N cycles, are currently used to describe the status of soils in disturbed areas. Microbial functions are more accurate indicators but their measurement for studies at the ecosystem level remains problematical because of the huge spatial variability of these processes and, consequently, of the large number of soil samples which must be analyzed. Our goal was to test the capacity of near-infrared reflectance spectroscopy (NIRS) to predict respiration and denitrification but also carbon and nitrogen contents of soils submitted to various proce- dures of restoration. To achieve this objective, we took advantage of an experiment conducted on a reforestation system established after open-cast gold mining in French Guiana. In this experimental station, plantations of various ages and various soil textures were at our disposal. Our results showed that both plantations and soil texture had a strong impact on the recovery of soil functioning: carbon and nitrogen contents, respiration and denitrification increased with age of plantation and clay content. Calibrations were per- formed between spectral data and microbial-based indicators using partial least squares regression (PLS). The results showed that C and N contents were accurately predicted. Microbial functions were less precisely predicted with results more accurate on clayey soils than on sandy soils. In clayey soils, perturbed or restored soils and the year of plantation were discriminated very efficiently through principal component analyses of spectral signatures (over 80% of variance explained on the first two axes). Near-infrared spectroscopy may thus be extended to the prediction of functional soil parameters, but the capacity of this method must be strengthened by expending the databases with other soils in other contexts. The possibility of using NIRS provides many opportunities for understanding both the temporal dynamics and the spatial variability of the recovery of key microbial functions during soil restoration. # 2007 Elsevier B.V. All rights reserved. * Corresponding author. E-mail address: [email protected] (H. Schimann). available at www.sciencedirect.com journal homepage: www.elsevier.com/locate/apsoil 0929-1393/$ – see front matter # 2007 Elsevier B.V. All rights reserved. doi:10.1016/j.apsoil.2007.07.001
-
Upload
agroparistech -
Category
Documents
-
view
1 -
download
0
Transcript of Evaluation of the recovery of microbial functions during soil restoration using near-infrared...

Author's personal copy
Evaluation of the recovery of microbial functions duringsoil restoration using near-infrared spectroscopy
Heidy Schimann a,*, Richard Joffre b, Jean-Christophe Roggy a, Robert Lensi b,Anne-Marie Domenach a
aUMR EcoFoG, campus agronomique, BP 709, 97387 Kourou, French GuianabCEFE, 1919 routes de Mende, 34000 Montpellier, France
1. Introduction
Soil governs plant productivity in terrestrial ecosystems and
acts to maintain the equilibrium of biogeochemical cycles
through biotransformations (or functions) mediated by living
organisms. It has been recognized for many years that
microbes are responsible for 80–90% of these functions
(Nannipieri et al., 2003).
It is thus of great interest for the sustainability of our
environment to assess if the procedures of restoration of sites
a p p l i e d s o i l e c o l o g y 3 7 ( 2 0 0 7 ) 2 2 3 – 2 3 2
a r t i c l e i n f o
Article history:
Received 2 July 2007
Received in revised form
2 July 2007
Accepted 3 July 2007
Keywords:
NIRS
Microbial activities
Respiration
Denitrification
Carbon
Nitrogen
Soil functioning
Restoration
a b s t r a c t
Microbial-based indicators, such as C and N contents or microbial functions involved in C
and N cycles, are currently used to describe the status of soils in disturbed areas. Microbial
functions are more accurate indicators but their measurement for studies at the ecosystem
level remains problematical because of the huge spatial variability of these processes and,
consequently, of the large number of soil samples which must be analyzed. Our goal was to
test the capacity of near-infrared reflectance spectroscopy (NIRS) to predict respiration and
denitrification but also carbon and nitrogen contents of soils submitted to various proce-
dures of restoration. To achieve this objective, we took advantage of an experiment
conducted on a reforestation system established after open-cast gold mining in French
Guiana. In this experimental station, plantations of various ages and various soil textures
were at our disposal. Our results showed that both plantations and soil texture had a strong
impact on the recovery of soil functioning: carbon and nitrogen contents, respiration and
denitrification increased with age of plantation and clay content. Calibrations were per-
formed between spectral data and microbial-based indicators using partial least squares
regression (PLS). The results showed that C and N contents were accurately predicted.
Microbial functions were less precisely predicted with results more accurate on clayey soils
than on sandy soils. In clayey soils, perturbed or restored soils and the year of plantation
were discriminated very efficiently through principal component analyses of spectral
signatures (over 80% of variance explained on the first two axes). Near-infrared spectroscopy
may thus be extended to the prediction of functional soil parameters, but the capacity of this
method must be strengthened by expending the databases with other soils in other
contexts. The possibility of using NIRS provides many opportunities for understanding
both the temporal dynamics and the spatial variability of the recovery of key microbial
functions during soil restoration.
# 2007 Elsevier B.V. All rights reserved.
* Corresponding author.E-mail address: [email protected] (H. Schimann).
avai lab le at www.sc iencedi rec t .com
journal homepage: www.elsev ier .com/ locate /apsoi l
0929-1393/$ – see front matter # 2007 Elsevier B.V. All rights reserved.doi:10.1016/j.apsoil.2007.07.001
Author's personal copy
degraded by changes of land-use may allow the soil to partially
or totally recover its microbial functions. Microbial-based
indicators such as changes in total biomass or in the structure
of the total microbial community or of a given group of
microorganisms have been often used to describe the soil
quality. As an example, dynamics of microbial soil quality along
a temporal sequence of restoration have been assessed using
these types of indicators (Carter et al., 1997; Schloter et al., 2003).
Nevertheless, there is also – and may be overall – a need for
microbial-based indicators which could directly account for the
functional status of the soil (Dighton and Pierce, 1997;
Anderson, 2003). Nevertheless, few studies aiming at evaluating
the extent to which the soil has been affected by human
activities and/or how it recovered its initial characteristics were
based on the assessment of the recovery of soil microbial
functions. For example, Carter et al. (1997) and Schloter et al.
(2003) described the recovery of soil quality using variables such
as C and N mineralization. Even in this case, there is often a lack
of clear distinction between ‘‘real’’ function (i.e. the actual
fluxes generated by the function at a given moment) and
‘‘potential’’ function (i.e. the maximal capacity of the soil to
express a given function), these two types of variables leading
different ways of interpretations. The first step of such
approaches is to select appropriate microbial functions as
relevant indicators of soil functioning. Nevertheless, one of the
major limitations is that measurements of microbial functions
are often time consuming and require a large number of
analysis of soil samples to be representative of a given situation.
Near-infrared or visible–near infrared spectroscopy has
been successfully used to predict soil or litter chemical
properties with the aim to reduce time and cost in comparison
with traditional analytical methods. As examples, these
methods have been applied for the prediction of organic
matter content (Ben-Dor and Banin, 1995; Couillard et al.,
1997), total C and N contents (Chang and Laird, 2002), leaf litter
quality (Joffre et al., 2001), litter mass remaining during
decomposition stages (Gillon and Joffre, 1993), or microbial
biomass (Chodak et al., 2002). On the contrary, there is little
information about the capacity of NIRS spectra to predict more
functional variables such as C and N mineralization of soils
submitted to various disturbances (Ludwig et al., 2002), rates of
C mineralization in different size classes of aggregates
obtained by physical fractionation of two tropical soils in
Kenya (Mutuo et al., 2006), or microbial respiration in soil
structures resulting from animals activities (Hedde et al.,
2005). Nevertheless, preliminary studies showed that the
information contained in a single spectrum enables many
different soil variables to be characterized simultaneously
(Odlare et al., 2005). For instance, Velasquez et al. (2005)
showed that NIRS was able to rank a soil submitted to different
land-uses along two axis of PCA, according to physico-
chemical characteristics (organic matter, nutrients contents,
Al3+ saturation and total-P concentration).
Using a soil strongly altered by gold mining activity and
subjected to different modes of restoration (reforestation), our
objective was to assess the capacity of NIRS to simultaneously
describe and predict the evolution of physical (soil texture),
chemical (C and N contents) and functional (microbial
functions: respiration and denitrification) characteristics.
Gold-mining results in drastic modifications of the system
and among others, a strong decrease in organic matter content
and the creation of patches of contrasted soil granulometry.
Therefore, areas predominantly sandy or clayey and sub-
mitted to the same reforestation treatments were at our
disposal to assess the relationships between recovery of
microbial functions and evolution of NIRS spectra.
Potentials of respiration and denitrification were chosen as
the model functions because (1) they can be measured with
accuracy, (2) both are performed by an abundant and
diversified microflora and (3) they are considered as key-
functions for the functioning of ecosystems and for the quality
of our environment (both functions being involved in the
exchange of gas-trace between soil and atmosphere).
2. Materials and methods
2.1. Experimental site
The experimental site was an open-cast gold mine (Mine
Boulanger); located in the east of French Guiana, on the Coralie
track (4830N, 52820W). This mine is part of an experimental
reforestation project led by the Forest National Office (ONF)
since 1996. The objectives of this project were to limit soil
erosion and to recover environmental conditions favorable to
plant regeneration in order to re-establish the forest cover.
Two chronosequences corresponding to two areas differing in
texture were studied (high sand or high clay contents, Table 1).
For each chronosequence, plots of 1000 m2 in average were
designed. The fast-growing N-fixing Acacia mangium Willd
(Mimosaceae) was chosen to facilitate the recovery process
because of its exceptional rusticity and because its broad
crown could rapidly cover the soil. These plots were planted
with 3-month-old seedlings of A. mangium at different
densities (1250, 1100 and 400 individuals ha�1) – and/or
different times (1996 and 1999) – Table 1). This result in four
treatments: 5S–8S for 5 years old (5S) and 8 years old (8S)
plantation on sandy soil, respectively, and 5C–8C for 5 years
old (5S) and 8 years old (8S) plantation on clayey soil,
respectively. As well, three control plots were sampled: (i)
one which was not included on the restoration procedure on
the sequence with high sand content (CS), (ii) one which was
not included on the restoration procedure on the sequence
with high clay content (CC), and (iii) one in the natural forest
sandy soil near the mining zone (NF, Table 1).
2.2. Soil sampling strategy
Fifteen soil cores (10 cm � 10 cm � 10 cm and 10 cm depth
from the surface) were randomly harvested in each plot in
order to be representative of all the surface of one plot. We
chose to sample only in the first 10 cm because in tropical
forest soils, the majority of the microbial activity stand in the
first 10 cm. Samples were air-dried, crushed and sieved at
2 mm, thoroughly homogenized and stored at room tempera-
ture (25 8C) until analyses. As sample drying and storage could
weakly modify enzymatic activities, it has been verified that
these modifications affect soil sample similarly and that,
consequently, the relative range of values was not expected to
be changed.
a p p l i e d s o i l e c o l o g y 3 7 ( 2 0 0 7 ) 2 2 3 – 2 3 2224

Author's personal copy
2.3. Soil physico-chemical characteristics
Five samples by plots among the whole soil samples (i.e. 15 all
in all) were randomly chosen to determine texture and carbon
and nitrogen content. Soil texture was determined by the
hydrometer method (Gee and Bauder, 1986). Carbon and
nitrogen contents were determined with a Perkin-Elmer
elemental analyzer (PE 2400 CHN) on 91 milled soil samples.
2.4. Denitrifying enzyme activity and substrate inducedrespiration measurements
Denitrifying enzyme activities of soil (DEA) were measured by
the methods of Tiedje (1984) and Lensi et al. (1985). For each
sample, 10 g of sieved and air-dried soil were placed in a 150 ml
plasma-flask and sealed with rubber stoppers. In each flask,
air was removed with a vacuum-pump and replaced by 90% of
helium and 10% of acetylene to inhibit the N2O-reductase. Six
milliliters of a solution (quantity ensuring of 100% saturation
of the soil) containing 100 mg of N (from KNO3), 2 mg of C
(glucose and glutamic acid) per g of soil was added. These C
and N addition were considered as non-limiting for denitrify-
ing enzyme functioning. The flasks were incubated 4 h at
28 8C. This short incubation time was used in order to avoid
any de novo enzymatic synthesis or cellular growth. Two
hundred microliters of gas sample were analyzed for N2O on a
gas chromatograph equipped with an electron capture
detector (VARIAN 3800-CP, Les Ulis, France).
Substrate induced respiration (SIR) was measured using a
method from Anderson and Domsch (1978) which we modified
as follows. For each sample, 10 g of sieved and air-dried soil
were placed into a 150 ml plasma-flask. A solution containing
2 mg of C (glucose) per g of soil was added to ensure 80% of the
water holding capacity of the soil. The flasks were incubated
4 h at 28 8C. Two hundred microliters of gas sample were
analyzed for CO2 using a gas chromatograph equipped with a
microcatharometer (VARIAN 4900-GC, Les Ulis, France).
2.5. Spectroscopic measurements
All soil samples were scanned with a NIRSystem 6500
spectrophotometer (NIRSystems Inc., Silver Spring, MD,
USA). Each sample was packed into a sample cell with a
quartz-glass cover and measured. The spectrophotometer has
a spectral range of 400–2500 nm, with 2-nm sampling
intervals, a band width of 10 nm and a wavelength accuracy
�0.5 nm. For each measurement, 32 scans were made to
produce a mean spectrum with 1050 data points. The
spectrum of apparent reflectance R is evaluated by internal
software relative to a ceramic standard. The recorded spectral
data were processed and stored as absorbance units (A, equal
to log(1/R)). Data analysis was conducted using the ISI software
system (Shenk and Westerhaus, 1991).
2.6. Spectral data analysis
Spectral data were processed using several pretreatments and
transformations and considering different spectral regions.
The three pretreatments corresponded to no pre-treatment,
MSC (multiplicative scatter correction) and SNVD (standard
Ta
ble
1–
So
ilp
rop
ert
ies
an
dv
eg
eta
tio
nch
ara
cteri
stic
s
Desc
rip
tio
nC
on
tro
lsa
nd
(CS
)5
yea
rssa
nd
(5S
)8
yea
rssa
nd
(8S
)C
on
tro
lcl
ay
(CC
)5
yea
rscl
ay
(5C
)8
yea
rscl
ay
(8C
)N
F
No
pla
nta
tio
nP
lan
tati
on
ofAcacia
mangium
1999
Pla
nta
tio
no
fA.mangium
1996
No
pla
nta
tio
nP
lan
tati
on
of
A.mangium
1999
Pla
nta
tio
nof
A.mangium
1996
Na
tura
lfo
rest
Pla
nta
tio
no
f
A.mangium
Den
sity
(in
div
idu
als
ha�
1)
01100
1250
0400
1250
–
Heig
ht
(m)
012
(0.5
)21.5
(0.7
)0
8.5
(0.4
)20
(0.9
2)
–
Mea
nD
BH
(cm
)a0
nd
21.4
(1.0
4)
0n
d21.6
(1.3
)–
Vegeta
tio
nco
ver
25%
65%
97%
10%
60%
98%
–
Age
(yea
rs)
05
80
58
–
So
ilte
xtu
re(%
)C
lay
19.8�
1.7
b9.0�
2.2
b11.0�
2.4
b51.7�
1.4
a40.9�
0.9
a44.9�
1.5
a25.8�
1.4
b
Lo
am
16.2�
0.9
b18.9�
5.4
b18.9�
2.7
b15.5�
0.9
b23.2�
0.6
c19.7�
1.5
b5.7�
0.6
a
Sa
nd
64�
2.7
b72.1�
7.3
b70.1�
5.1
b32.7�
1.8
a35.9�
1.6
a35.4�
0.8
a68.5�
1.5
b
%N
0.0
2�
0.0
2a
0.0
6�
0.0
5b
0.1
2�
0.1
4c
0.0
3�
0.0
1a
0.0
4�
0.0
2a
,b0.2
3�
0.0
2d
0.1
8�
0.0
9d
%C
0.3
2�
0.0
02
a0.8
7�
0.0
04
b1.8
1�
0.0
1c
0.3
6�
0.0
01
a0.5
1�
0.0
1a
,b3.3
5�
0.0
13
d2.6
7�
0.0
05
d
C:N
11.9�
0.4
a15�
1.5
c15.6�
1.9
c13.2�
0.9
b,c
12.1�
0.5
a,b
14.5�
1.2
c14.6�
1.2
c
Fo
rso
ilte
xtu
re,v
alu
es
for
cla
y,s
an
d,l
oa
m,%
N,%
Ca
nd
C-t
o-N
rati
os
are
mea
ns�
sta
nd
ard
err
or
(n=
5),
foll
ow
ed
wit
hd
iffe
ren
tle
tters
ifsi
gn
ifica
ntl
yd
iffe
ren
t(o
ne-w
ay
AN
OV
A,u
neq
ua
ln
HS
Dte
sto
f
Tu
key
,a
tp<
0.0
5)
CS
:co
ntr
ol
on
san
dy
soil
;5S
:5
yea
rso
ldp
lan
tati
on
on
san
dy
soil
;8S
:8
yea
rso
ldp
lan
tati
on
on
san
dy
soil
;C
C:
con
tro
lo
ncl
ay
ey
soil
;5C
:5
yea
rso
ldp
lan
tati
on
on
cla
yey
soil
;8C
:8
yea
rso
ldp
lan
tati
on
on
cla
yey
soil
;N
F:
na
tura
lfo
rest
soil
.a
Dia
mete
ra
tb
rea
sth
eig
ht.
a p p l i e d s o i l e c o l o g y 3 7 ( 2 0 0 7 ) 2 2 3 – 2 3 2 225
Author's personal copy
normal variate and de-trending transformation) (Barnes et al.,
1989). The two transformations which we applied correspond
to raw absorbance data and second order derivative. Three
spectral regions were considered, the first one with the entire
spectrum (VIS–NIR region from 400 to 2500 nm), the second
one with the near-infrared region (NIR region from 1100 to
2500 nm), and the third one with the visible and near near-
infrared region (VIS region from 400 to 1100 nm). For each
analyze, we selected here the combination of pre-treatment,
transformation and spectral region that gave the best results.
Spectral data were first used to discriminate the soils
according to their place in the restoration sequence. Principal
component analyses (PCA) were carried out on the spectral
data of all soils, clayed soils and sandy soils. For each sample
set, 18 PCA were performed considering the three pretreat-
ments, two transformations and three spectral regions. The
second set of spectral data analyses correspond to the process
of calibration. The calibration procedure involved search for
predictive relationships between spectral data and reference
values. Calibration equations are mathematical transfer
functions built using reference and spectral values of the
calibration sample set and used to predict an unknown
quantitative value Y from available spectroscopic measure-
ments X (Martens and Naes, 1989). Calibrations equations
were built for carbon and nitrogen content, as well as
substrate induced respiration and denitrifying enzyme activ-
ity using partial least squares regression (PLS) method
(Martens and Jensen, 1982; Shenk and Westerhaus, 1991).
The PLS method is a multivariate linear calibration technique
that reduces large sets of raw data into small numbers of
orthogonal (non-correlated) factors in order to minimize the
error sum of squares among the values to be predicted.
Furthermore, PLS avoids problems of overfitting and colli-
nearity (Martens and Naes, 1989).
The PLS models were validated using internal cross-
validation which helps to estimate the optimal number of
terms without causing overfitting. This consists of selecting
three-quarters of the samples to develop the model and one-
quarter for the prediction. The algorithm is repeated four
times and all the residuals of the four predictions are pooled to
provide a standard error of cross-validation (SECV) on
independent samples. The minimum SECV determines the
number of terms to be used. The final model is then
recalculated with all the samples to obtain the standard error
of calibration (SEC). Calibrations were calculated over the
entire set of soil samples and separately for clayey and sandy
soils.
3. Results
3.1. Reconstitution of soil and vegetation
Plantation of the legume A. mangium allowed a very rapid
reconstitution of vegetation with a vegetation cover reaching
60% after 5 years and around 100% after 8 years whatever the
soil texture. At the same time, vegetation recovery of the
control plots of the chronosequences (CC and CS) remained
very weak with values lesser than 25% in the sandy soils and
10% in the clayey soils (Table 1). In both sequences (i.e. CS, 5S,
8S or CC, 5C, 8C, Table 1), soil C and N increased with time with
the maximal value in the oldest plot and greater values in
clayey soils than in sandy soils. Eight years after the
plantation, soil C and N contents reached values slightly
higher in the clayey soil compared to natural forest (2.67% and
0.18%, respectively). In contrast, dynamics of C and N contents
of sandy soils were slower than in clayey soils with values
corresponding to around 65% of the soil of natural forest
established on the same texture. C-to-N ratios increased
significantly in sandy soil with values varying between 11.9
and 15.6, but not significantly in clayey soil where values were
similar and varied between 12.1 and 14.6.
3.2. Microbial activities
As indicated by the values of confidence intervals, substrate
induced respiration (SIR) displayed a high heterogeneity
within each plot, with the lowest values in the two control
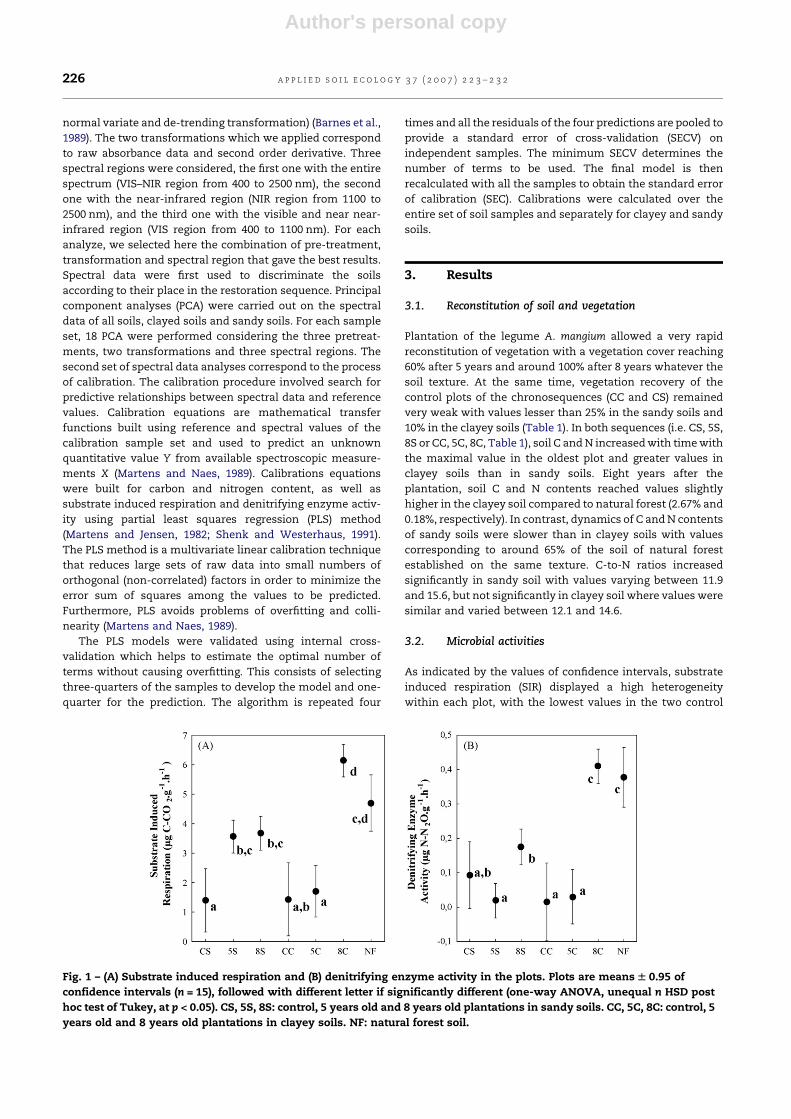
Fig. 1 – (A) Substrate induced respiration and (B) denitrifying enzyme activity in the plots. Plots are means W 0.95 of
confidence intervals (n = 15), followed with different letter if significantly different (one-way ANOVA, unequal n HSD post
hoc test of Tukey, at p < 0.05). CS, 5S, 8S: control, 5 years old and 8 years old plantations in sandy soils. CC, 5C, 8C: control, 5
years old and 8 years old plantations in clayey soils. NF: natural forest soil.
a p p l i e d s o i l e c o l o g y 3 7 ( 2 0 0 7 ) 2 2 3 – 2 3 2226

Author's personal copy
plots (CC and CS, Fig. 1A). In the sandy soil plots (CS, 5S, 8S), SIR
was significantly higher in 5S and 8S compared to CC, but with
no significant difference between them. In the clayey soil plots
(CC, 5C, 8C), SIR was similar in 5C plot and significantly higher
in the 8C plot compared to the control, reaching a value close
to the natural forest control (NF). Denitrifying enzyme activity
(DEA, Fig. 1B) was low in most of the plots except in 8C which
showed similar average values for DEA as in NF. In the sandy
soil plots, there was a slight but not significant increase in DEA
between CS and 8S, 5S displaying a value slightly inferior to CS,
whereas in the clayey soil plots, only treatment 8C was
significantly different from the others treatments.
3.3. Discrimination of soils with NIRS spectra
Principal component analyses were performed on the spectral
data of all soils, clayey soils and sandy soils (Fig. 2). For each
sample set (all soils, clayey soils and sandy soils), the highest
proportion of total variance explained by the first two
components was obtained using SNV pre-treatment on second
derivative of the full VIS–NIR spectral region (1100–2500 nm).
In all cases, the first two components explained more than 85%
of the total variance.
When considering the entire sample set, factors 1 and 2
explained 89.2% of the variance and separated soils by age and
texture (Fig. 2A). In each group of determined age and texture,
factor 1 ordinated samples showing the large intravariance of
each group except for the natural forest samples more
grouped at the left (Fig. 2A). When considering the sandy
soils (Fig. 2B), the situation was clearer with a stronger effect of
the first and second factors (90.09% of the variance) dis-
criminating the four plots CS, 5S, 8S and NF. In particular the
8S and NF plots are clustered in the 2nd factor but not in the
first one. In the clayey soils (CC, 5C and 8C, Fig. 2C), the two first
factors of the PCA (96.58% of the variance) separated the three
plots with a gradient between the control plot extremely
degraded (CC), the 5 years old plantation plot and the 8 years
old plantation ones.
Wavelengths whose loading were high in the PCA are
shown in Table 2. Whatever the sub-sample, it is noteworthy
that visible region added information. As expected, wave-
lengths associated with carbon and nitrogen compounds as
cellulose and protein played an important role in discrimina-
tion of soils in the factorial maps.
3.4. Spectroscopic calibration and measurements
Results are resumed in Table 3, Figs. 3 and 4. Whatever the
sample set (all plots or clayey plots), carbon and nitrogen
equations were precise with r2 varying from 0.94 to 0.98 (Figs. 3
Fig. 2 – Principal component analysis (PC1 T PC2) plots generated from the NIRS spectra data with all soil samples (A); samples
containing low clay content (B); samples containing high clay content (C). CS: control sand; CC: control clay; 5S and 8S: 5 and 8
years old plantations in sandy soils; 5C and 8C: 5 and 8 years old plantations in clayey soils; NF: natural forest soil.
a p p l i e d s o i l e c o l o g y 3 7 ( 2 0 0 7 ) 2 2 3 – 2 3 2 227

Author's personal copy
and 4). The SECV values for C and N were three to four times
lower than those of the S.D. of the measured values with better
results from the clayey soils. In the sample set including all
soils, residual prediction deviation (RPD = S.D./SECV) reached
3.1 for both C and N contents and were increased and reached
4 (4.1 and 4.5 for N and C, respectively) when considering the
clayey soils (Table 3).
Calibration statistics for microbial activities (SIR and DEA)
were on the whole less accurate than those of carbon and
nitrogen (Table 3, Figs. 3 and 4). Moreover, they varied when
Table 2 – Wavelengths with high value loadings on axis 1 and 2 of principal component analyses for all soils, clayey soilsand sandy soils
Axis 1 Axis 2
Wavelengths with highvalues of loadings
Associated to Wavelengths with highvalues of loadings
Associated to
All soils 580 Yellow 450 Blue
550 Green
2100 C–O–O stretch cellulose 1420, 1450 CH aromatic
2180 N–H bend and C–H stretch protein 1890 C O stretch
2130, 2200 and 2380 C–H stretch 2130, 2180 C–H stretch
2350 Cellulose 2300 C–H bend
Clayey soils 430–580 Blue–yellow 460–500 Blue
530–580 Green–yellow
630–670 Orange–red
1450 C–H aromatic 1450 C–H aromatic
2100 C–O–O stretch cellulose 2140, 2200 and 2320 C–H stretch
2180 N–H bend and C–H stretch protein
2350 CH2 bend cellulose
2380 C–H stretch
Sandy soils 540–560 Green
1450 C–H aromatic
1896 C O stretch
2100 C–O–O stretch cellulose 2136 and 2320 C–H stretch
2140 C–H stretch
2180 and 2296 N–H bend and C–H stretch protein 2272 O–H stretch and cellulose
2350 CH2 bend cellulose
Table 3 – Calibration statistics for the constituents in this study
Constituent n Mean S.D. SEC RSQ SECV RPD Math Numberof terms
All plots
N content (mg g�1 soil) 91 0.09 0.08 0.02 0.94 0.02 3.1 2 5 5 8
C content (mg g�1 soil) 89 1.24 1.14 0.24 0.96 0.32 3.14 2 10 10 8
SIR (mg C-CO2 g�1 soil h�1) 85 3.59 2.41 1.26 0.73 1.39 1.73 2 10 10 4
DEA (ng N-N2O g�1 soil h�1) 125 122.97 156.19 59.66 0.85 72.13 2.15 2 10 10 7
Plots with high clay content (CC–5C–8C)
N content (mg g�1 soil) 63 0.09 0.09 0.01 0.97 0.02 4.14 2 5 5 6
C content (mg g�1 soil) 62 1.20 1.31 0.20 0.97 0.29 4.51 2 5 5 6
SIR (mg C-CO2 g�1 soil h�1) 42 4.28 3.24 1.03 0.89 1.45 2.23 2 5 5 4
DEA (ng N-N2O g�1 soil h�1) 73 181.34 205.74 81.77 0.84 100.04 2.05 2 5 5 4
Plots with low clay content (CS–5S–8S–NF)
SIR (mg C-CO2 g�1 soil h�1) 44 3.09 1.41 1.17 0.31 1.27 1.10 2 10 10 2
DEA (ng N-N2O g�1 soil h�1) 43 89.14 86.01 30.97 0.87 42.44 2.02 2 5 5 4
The values given in the columns refer to number of samples (n), the mean of measured values (mean), standard deviation of measured values
(S.D.), standard error of calibration (SEC), R squared (RSQ), standard error of cross-validation (SECV) of a linear regression (measured against
predicted values); residual prediction deviation (RPD = S.D./SECV). Math: mathematical treatment of the spectral data: the first number is the
order of the derivative function, the second is the segment length data points over which the derivative was taken and the third is the segment
length over which the function was smoothed; number of terms: number of terms of the PLS models. All plots: equation obtained with all
points of the seven plots of sampling. Plots with high clay contents: equations with only the points of CC (control clay), 5C (5 years old
plantation with high clay content) and 8C (8 years old plantation with high clay content). Plots with low clay content: equations with only the
points of CS (control sand), 5S and 8S (5 and 8 years old plantations with high sand contents) and NF (natural forest soil). SIR: substrate induced
respiration in mg C-CO2 g�1 soil h�1; DEA: denitrifying enzyme activity in ng N-N2O g�1 soil h�1; N and C content in mg g�1 of soil.
a p p l i e d s o i l e c o l o g y 3 7 ( 2 0 0 7 ) 2 2 3 – 2 3 2228
Author's personal copy
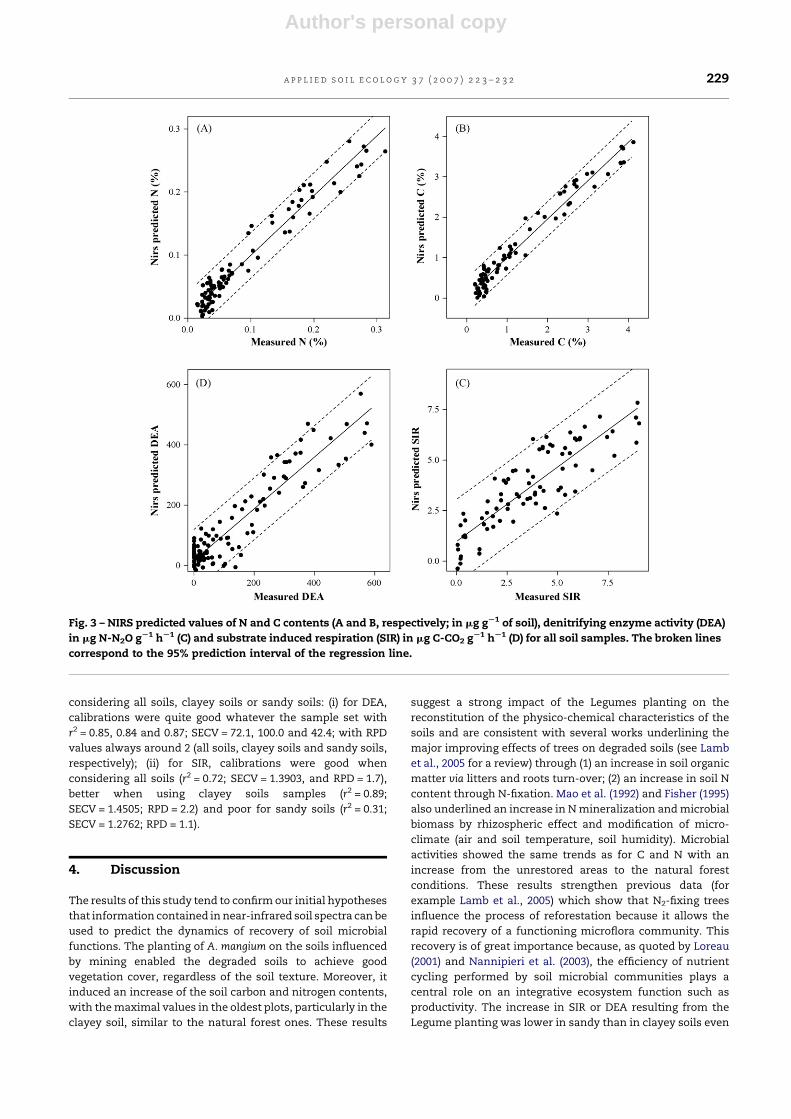
considering all soils, clayey soils or sandy soils: (i) for DEA,
calibrations were quite good whatever the sample set with
r2 = 0.85, 0.84 and 0.87; SECV = 72.1, 100.0 and 42.4; with RPD
values always around 2 (all soils, clayey soils and sandy soils,
respectively); (ii) for SIR, calibrations were good when
considering all soils (r2 = 0.72; SECV = 1.3903, and RPD = 1.7),
better when using clayey soils samples (r2 = 0.89;
SECV = 1.4505; RPD = 2.2) and poor for sandy soils (r2 = 0.31;
SECV = 1.2762; RPD = 1.1).
4. Discussion
The results of this study tend to confirm our initial hypotheses
that information contained in near-infrared soil spectra can be
used to predict the dynamics of recovery of soil microbial
functions. The planting of A. mangium on the soils influenced
by mining enabled the degraded soils to achieve good
vegetation cover, regardless of the soil texture. Moreover, it
induced an increase of the soil carbon and nitrogen contents,
with the maximal values in the oldest plots, particularly in the
clayey soil, similar to the natural forest ones. These results
suggest a strong impact of the Legumes planting on the
reconstitution of the physico-chemical characteristics of the
soils and are consistent with several works underlining the
major improving effects of trees on degraded soils (see Lamb
et al., 2005 for a review) through (1) an increase in soil organic
matter via litters and roots turn-over; (2) an increase in soil N
content through N-fixation. Mao et al. (1992) and Fisher (1995)
also underlined an increase in N mineralization and microbial
biomass by rhizospheric effect and modification of micro-
climate (air and soil temperature, soil humidity). Microbial
activities showed the same trends as for C and N with an
increase from the unrestored areas to the natural forest
conditions. These results strengthen previous data (for
example Lamb et al., 2005) which show that N2-fixing trees
influence the process of reforestation because it allows the
rapid recovery of a functioning microflora community. This
recovery is of great importance because, as quoted by Loreau
(2001) and Nannipieri et al. (2003), the efficiency of nutrient
cycling performed by soil microbial communities plays a
central role on an integrative ecosystem function such as
productivity. The increase in SIR or DEA resulting from the
Legume planting was lower in sandy than in clayey soils even
Fig. 3 – NIRS predicted values of N and C contents (A and B, respectively; in mg gS1 of soil), denitrifying enzyme activity (DEA)
in mg N-N2O gS1 hS1 (C) and substrate induced respiration (SIR) in mg C-CO2 gS1 hS1 (D) for all soil samples. The broken lines
correspond to the 95% prediction interval of the regression line.
a p p l i e d s o i l e c o l o g y 3 7 ( 2 0 0 7 ) 2 2 3 – 2 3 2 229

Author's personal copy
after 8 years of plantation. Indeed, in clayey soil Legumes
induced a stronger effect, with microbial activities similar to
those of the sandy soil of the natural forest. These results are
consistent with those from Muller and Hoper (2004) who
showed significant positive correlations between soil basic
respiration and soil clay content in forest and grassland soils.
Surprisingly, only slight differences in C-to-N ratios were
observed between the plots supporting very contrasted
vegetation types (few grasses, Legumes or natural forest):
for instance, after 8 years, the C-to-N values of natural forest,
clayey and sandy soils were roughly similar (Table 1). High clay
content can optimize the short-term turn-over of organic
substrates (Saggar et al., 1999), even if C-to-N values observed
(Table 1) suggest that a rapid turn-over of organic substrate is
possible in all plots. Indeed, the C-to-N ratios found in our
work are similar to ones published elsewhere and showing an
easy mineralization of organic matter (Hodge et al., 2000).
Principal component analyses of NIRS spectra were performed
on the three groups of soil samples. More than 85% of the
variance was explained by the first two factors in the three
analyses; and the discrimination of soils in the factorial maps
was based on C and N components as shown by the
wavelengths associated with carbon compounds as cellulose
and protein (Table 2). Grouping by age was observed on the
factorial maps (Fig. 2) whatever the texture. Within each class
of age, dispersion of the samples reflected the strong spatial
heterogeneity of soil conditions. These results are consistent
with those of Odlare et al. (2005) who showed that factor 1 of
NIR spectra accurately described soil spatial variation. In our
study, the influence of the planted Legumes (i.e. age of
plantation) as well as the texture of soil (i.e. clay content) was
reflected in the NIR spectra, more precisely in the first two
factors of the PCA. Scanning a large set of soil samples
resulting from a systematic sampling scheme could provide a
very rapid and objective method to document spatial
variability of initial soil after perturbations as mining
activities. In the same manner, NIRS could quantify rapidly
the spatial variability of soil properties after restoration
procedures. Our NIR-PLSR calibration results show that C
and N contents can be predicted reliably, which confirms
others works (Ben-Dor and Banin, 1995; Couillard et al., 1997;
Chang and Laird, 2002; Ludwig et al., 2002). Moreover, our
results confirmed that functional variables as SIR or DEA can
be satisfactorily predicted by NIRS (Chodak et al., 2002;
Palmborg and Nordgren, 1993). However, such predictions
exhibit different accuracies according to the soil texture.
Fig. 4 – NIRS predicted values of N and C contents (A and B, respectively; in mg gS1 of soil), denitrifying enzyme activity (DEA)
in mg N-N2O gS1 hS1 (C) and substrate induced respiration (SIR) in mg C-CO2 gS1 hS1 (D) of the clayey soils samples. The
broken lines correspond to the 95% prediction interval of the regression line.
a p p l i e d s o i l e c o l o g y 3 7 ( 2 0 0 7 ) 2 2 3 – 2 3 2230

Author's personal copy
Indeed, at least SIR is better predicted in clayey than in sandy
soils, whereas DEA is equally predicted in the different
treatments. Our results indicate that biological variations in
soils can be revealed by near-infrared spectral information
(Fritze et al., 1994; Viscarra Rossel et al., 2006). Van Waes et al.
(2005) have shown the improvement of NIRS to predict soil
organic carbon, when dividing samples in texture groups (silt,
sand, clay). In our case, only a slight increase in calibration
results was obtained for carbon and nitrogen contents when
analyzing the clayey sample set instead of the total sample set.
Results are less clear when analyzing microbial activities
calibrations because the size of samples between textural
groupswas not equivalentand because the results ofcalibration
for SIR in sandy soils are poor. For instance, RPD values were
slightly increased for respiration and equivalent for denitrifica-
tion when analyzing the clayey soils. Literature gives several
concepts considering the residual prediction deviation values:
Chang et al. (2001) considered that an acceptable RPD could be
>2 for soil analysis; but others authors (Williams, 2001; Fearn,
2002) stated that RPD >3 are adequate for analytical purposes.
Nevertheless, our results clearly showed the potential of this
method to predict soil microbial activities with some accuracy,
and are consistent with results of Pietikaınen and Fritze (1995)
or Fritze et al. (1994) who managed to explain over 80% of the
variation in soil basal respiration by near-infrared spectro-
scopy; or those of Reeves et al. (2000) showing the capacity of
NIR spectroscopy to determine biological activities (dehydro-
genase, phosphatise or nitrification potential) to some degrees.
Our results showed the capacity of NIRS to establish
diagnosis of soil quality in a context of ecosystem restoration.
Moreover, it is well known that microbial processes (such as
denitrification) generally shows high spatial variability at
different scales (Dendooven et al., 1996; Parry et al., 1999). In
this context, the capacity of NIR spectroscopy to predict soil
microbial activities allows the elaboration of large database
establishing metabolic fingerprinting of soils at larger scales.
Using these databases, informations about the spatial varia-
bility of the soil processes will be assessed with lower cost and
time on a larger number of samples.
5. Conclusion
NIRS spectroscopy is an accurate method that enables
different parameters of soils to be predicted. Our main results
are successful calibrations of NIRS spectra with parameters
like respiration and denitrification and, consequently to
extend the usefulness of NIR spectroscopy for the prediction
of functional soil parameters. The capacity of this method
must be strengthen by increasing the databases with other
soils in other contexts. This will allow, for further questioning
aiming to understand the role of microbial key-functions at an
ecosystemic level (which systematically involve studies on
spatial variability), to have at our disposal a very useful tool.
Acknowledgement
This work was supported by a grant from the French
‘‘Ministere de la Recherche et de l’Education Superieure’’.
r e f e r e n c e s
Anderson, T.H., 2003. Microbial eco-physiological indicators toasses soil quality. Agr. Ecosyst. Environ. 98, 285–293.
Anderson, J.P.E., Domsch, K.H., 1978. A physiological method forthe quantitative measurement of microbial biomass insoils. Soil Biol. Biochem. 10, 215–221.
Barnes, R.J., Dhanoa, M.S., Lister, S.J., 1989. Standard normalvariate transformation and detrending of NIR spectra. Appl.Spectrosc. 43, 772–777.
Ben-Dor, E., Banin, A., 1995. Near-infrared analysis as a rapidmethod to simultaneously evaluate several soil properties.Soil Sci. Soc. Am. J. 59, 364–372.
Carter, M.R., Gregorich, E.G., Anderson, E.W., Doran, J.W.,Janzen, H.H., Pierce, F.J., 1997. Concepts of soil quality andtheir significance. In: Gregorich, E.G., Carter, M.R. (Eds.), SoilQuality for Crop Production and Ecosystem Health. Elsevier,Amsterdam, pp. 1–19.
Chang, C.W., Laird, D.A., 2002. Near-infrared reflectancespectroscopic analysis of soil C and N. Soil Sci. 167, 110–116.
Chang, C.W., Laird, D.A., Mausbach, M.J., Hurburgh Jr., C.R.,2001. Near-infrared reflectance of soil properties. Soil Sci.Soc. Am. J. 65, 480–490.
Chodak, M., Ludwig, B., Khanna, P., Beese, F., 2002. Use of nearinfrared spectroscopy to determine biological and chemicalcharacteristics of organic layers under spruce and beechstands. J. Plant Nutr. Soil Sci. 165, 27–33.
Couillard, A., Turgeon, A.J., Shenk, J.S., Westerhaus, M.O., 1997.Near infrared reflectance spectroscopy for analysis of turfsoil profiles. Crop Sci. 37, 1554–1559.
Dendooven, L., Pemberton, E., Anderson, J.M., 1996.Denitrification potential and reduction enzymesdynamics in a Norway spruce plantation. Soil Biol. Biochem.28, 151–157.
Dighton, J., Pierce, F., 1997. Is it possible to develop microbialtest systems to evaluate pollution effects on soil nutrientcycling? In: van Straalen, N.M., Lokke, H. (Eds.), EcologicalRisk Assessment of Contaminants in Soil. Chapman andHall, London, pp. 51–69.
Fearn, T., 2002. Assessing calibrations: SEP, RPD, RER and R2. NIRNews 13, 12–14.
Fisher, R.F., 1995. Amelioration of degraded rain forests soils byplantations of native trees. Soil Sci. Soc. Am. J. 59, 544–549.
Fritze, H., Petri, J., Risto, H., 1994. Near-infrared characteristicsof forest humus are correlated with soil respiration andmicrobial biomass in burnt soil. Biol. Fert. Soils 18, 80–82.
Gee, G.W., Bauder, J.W., 1986. Particle size analysis. In: Klute, A.(Ed.), Methods of Soil Analysis: Part I. 2nd ed. AgronomyMonograph, vol. 9. ASA and SSSA, Madison, WI, USA, pp.383–411.
Gillon, D., Joffre, R., 1993. Predicting the stage of decay ofdecomposing leaves by near infrared reflectancespectroscopy. Can. J. Forest Res. 23, 2552–2559.
Hedde, M., Lavelle, P., Joffre, R., Jimenez, J.J., Decaens, T., 2005.Specific functional signature in soil macro-invertebratebiostructures. Funct. Ecol. 19, 785–793.
Hodge, A., Robinson, D., Fitter, A., 2000. Are microorganismsmore effective than plants at competing for nitrogen?Trends Plant Sci. 5, 304–308.
Joffre, R., Agren, G.I., Gillon, D., Bosatta, E., 2001. Organic matterquality in ecological studies: theory meets experiment.Oıkos 93, 451–458.
Lamb, D., Erskine, P.D., Parrotta, J.A., 2005. Restoration ofdegraded tropical forests landscapes. Science 310, 1628–1632.
Lensi, R., Gourbiere, F., Josserand, A., 1985. Measurement ofsmall amounts of nitrate in an acid soil by N2O production.Soil Biol. Biochem. 17, 733–734.
a p p l i e d s o i l e c o l o g y 3 7 ( 2 0 0 7 ) 2 2 3 – 2 3 2 231

Author's personal copy
Loreau, M., 2001. Microbial diversity, producer–decomposerinteractions and ecosystem processes: a theoretical model.Proc. Roy. Soc. B-Biol. Sci. 268, 303–309.
Ludwig, B., Khanna, P.K., Bauhus, J., Hopmans, P., 2002. Nearinfrared spectroscopy of forest soils to determine chemicaland biological properties related to soil sustainability. For.Ecol. Manage. 171, 121–132.
Mao, D.M., Min, Y.W., Yu, L., Martens, R., Insam, H., 1992. Affectof afforestation on microbial biomass and activity in soils oftropical China. Soil Biol. Biochem. 24, 865–872.
Martens, H., Jensen, S.A., 1982. Partial least squares regression: anew two-stage NIR calibration methods. In: Holas,Kratochvil,(Eds.), Proceedings of the World Cereal and Bread Congress,Prague, June 1982. Elsevier, Amsterdam, pp. 607–647.
Martens, H., Naes, T., 1989. Multivariate Calibration. John Wiley& Sons.
Muller, T., Hoper, H., 2004. Soil organic matter turnover as afunction of the soil clay content: consequences for modelapplication. Soil Biol. Biochem. 36, 877–888.
Mutuo, P.K., Shepherd, K.D., Albrecht, A., Cadisch, G., 2006.Prediction of carbon mineralization rates from different soilphysical fractions using diffuse reflectance spectroscopy.Soil Biol. Biochem. 38, 1658–1664.
Nannipieri, P., Ascher, J., Ceccherini, M.T., Landi, L.,Pietramellara, G., Renella, G., 2003. Microbial diversity andsoil functions. Eur. J. Soil Sci. 54, 655–670.
Odlare, M., Svensson, K., Pell, M., 2005. Near infrared reflectancespectroscopy for assessment of spatial soil variation in anagricultural field. Geoderma 126, 193–202.
Palmborg, C., Nordgren, A., 1993. Modelling microbial activityand biomass in forest soil with substrate quality measuredusing near infrared reflectance spectroscopy. Soil Biol.Biochem. 25, 1713–1718.
Parry, S., Renault, P., Chenu, C., Lensi, R., 1999. Denitrification inpasture and cropped soil clods as affected by pore spacestructure. Soil Biol. Biochem. 31, 493–501.
Pietikaınen, J., Fritze, H., 1995. Clear-cutting and prescribedburning in coniferous forest: comparison of effects on soil
fungal and total microbial biomass, respiration activity andnitrification. Soil Biol. Biochem. 27, 101–109.
Reeves III., J.B., McCarty, G.W., Meisinger, J.J., 2000. Near-infrared spectroscopy for the determination of biologicalactivity in agricultural soils. J. Near Infrared Spectrosc. 8,161–170.
Saggar, S., Parshotam, A., Hedley, C., Salt, G., 1999. C-14-labelledglucose turnover in New Zealand soils. Soil Biol. Biochem.31, 2025–2037.
Schloter, M., Bach, H.-J., Metz, S., Sehy, U., Munch, J.C., 2003.Influence of precision farming on the microbial communitystructure and functions in nitrogen turnover. Agr. Ecosyst.Environ. 98 (1–3), 295–304.
Shenk, J.S., Westerhaus, M.O., 1991. ISI NIRS-2. Software forNear-infrared Instrument. Silverspring.
Tiedje, J.M., 1984. Denitrification. In: Page, L.A., Miller, R.H.,Keeney, D.R. (Eds.), Methods of Soil Analysis. Part 2.Chemical and Microbiological Properties. 2nd ed. Am. Soc.of Agr. Inc. (ASA); Soil Sci. Soc. Am. Inc. (SSSA), Madison,pp. 1011–1026.
Van Waes, C., Mestdagh, I., Lootens, P., Carlier, L., 2005.Possibilities of near infrared reflectance spectroscopy forthe prediction of organic carbon concentrations ingrassland soils. J. Agr. Sci. 143, 487–492.
Velasquez, E., Lavelle, P., Barrio, E., Joffre, R., Reversat, F., 2005.Evaluating soil quality in tropical agroecosystemsof Colombia using NIRS. Soil Biol. Biochem. 37,889–898.
Viscarra Rossel, R.A., Walvoort, D.J.J., McBratney, A.B., Janik, L.J.,Skjemstad, J.O., 2006. Visible, near infrared, mid infrared orcombined diffuse reflectance spectroscopy forsimultaneous assessment of various soil properties.Geoderma 131 (1/2), 59–75.
Williams, P.C., 2001. Implementation of near-infraredtechnology. In: William, P., Norris, K.H. (Eds.), Near-infraredTechnology in the Agricultural and Food Industries.American Association of Cereal Chemist, St Paul,Minnesota, USA, pp. 145–169.
a p p l i e d s o i l e c o l o g y 3 7 ( 2 0 0 7 ) 2 2 3 – 2 3 2232