Dielectric properties of microwave ceramics investigated by infrared and submillimetre spectroscopy
Upload
khangminh22Category
view
3download
0
Use of near-infrared spectroscopy to
identify trends in regional cerebral
oxygen saturation in horses
By
Emma Jane McConnell
Submitted in partial fulfillment for the degree of MMedVet (Equine Medicine)
in the Faculty of Veterinary Science, University of Pretoria, South Africa
2013
©© UUnniivveerrssiittyy ooff PPrreettoorriiaa

vi
Table of Contents
Dedication ............................................................................................................. v
Acknowledgements ............................................................................................. vi
List of Abbreviations ......................................................................................... vii
List of Figures ...................................................................................................... x
List of Tables ....................................................................................................... xi
List of Appendices ............................................................................................. xii
Summary ........................................................................................................... xiii
Chapter 1 General Introduction ...................................................................... 1
Chapter 2 Literature Review ........................................................................... 3
2.1 GENERAL ANAESTHESIA OF HORSES .................................... 3
2.1.1 Mortality associated with general anaesthesia ....................... 3
2.1.2 Recovery from general anaesthesia ........................................ 4
2.1.3 Hypoxaemia during general anaesthesia ................................ 5
2.2 CEREBRAL PERFUSION AND AUTOREGULATION ............... 6
2.2.1 Effects of hypercapnoea on cerebral perfusion and
autoregulation ......................................................................... 6
2.2.2 Effects of hypocapnoea on cerebral perfusion and
autoregulation ......................................................................... 7
2.2.3 Effects of isoflurane on cerebral autoregulation .................... 7
©© UUnniivveerrssiittyy ooff PPrreettoorriiaa

2.3 NEUROMONITORING ................................................................... 8
2.3.1 Importance of neuromonitoring during general anaesthesia .. 8
2.3.2 Types of neuromonitoring ...................................................... 9
2.3.2.1 Invasive neuromonitoring ................................ 10
2.3.2.2 Non-invasive neuromonitoring ........................ 12
2.4 NEAR-INFRARED SPECTROSCOPY ........................................ 13
2.4.1 General introduction ............................................................. 13
2.4.2 INVOS® 5100C Cerebral/Somatic Oximeter ...................... 13
2.4.3 Potential role for near-infrared spectroscopy in equine
general anaesthesia .............................................................. 14
2.5 THE VENOUS DRAINAGE SYSTEM OF THE BRAIN ............ 15
Chapter 3 Use of near-infrared spectroscopy to identify trends in regional
cerebral oxygen saturation in horses ............................................................... 17
3.1 INTRODUCTION .......................................................................... 17
3.2 OBJECTIVES ................................................................................. 18
3.3 HYPOTHESES ............................................................................... 18
3.4 MATERIALS AND METHODS ................................................... 19
3.4.1 Horses ................................................................................... 19
3.4.2 Blood sample collection and analyses .................................. 19
3.4.3 rSO2 measurements .............................................................. 20
3.4.4 General anaesthesia .............................................................. 20
3.4.5 Experimental procedures ...................................................... 21
©© UUnniivveerrssiittyy ooff PPrreettoorriiaa

vi
3.4.6 Data Analysis ....................................................................... 22
3.5 RESULTS ....................................................................................... 23
3.6 DISCUSSION ................................................................................. 24
3.7 CONCLUSION............................................................................... 33
Figures and Tables ............................................................................................ 34
References .......................................................................................................... 53
Appendices ......................................................................................................... 62
Scientific proceedings associated with this dissertation ................................ 66
©© UUnniivveerrssiittyy ooff PPrreettoorriiaa

v
Dedication
To my parents, who each in their own way have given me unwavering support and helped to
make my dream a reality. To my mum especially; for always being there, for always “making
a plan” and for always believing in me.
“Give a girl the right shoes and she can conquer the world”
Bette Midler
©© UUnniivveerrssiittyy ooff PPrreettoorriiaa

vi
Acknowledgements
I would like to thank the following:
Professor Montague N. Saulez, project promoter, for his guidance, motivation and constant
support throughout.
Drs Lynette Bester, Eva Rioja, Macarena Sanz and Russell Raath; and
Professor Geoffrey Fosgate for their assistance, valuable input and continued support.
Covidien, South Africa for providing the INVOS® 5100C Cerebral/Somatic Oximeter.
Onderstepoort Teaching Academic Unit, for allowing the use of their ponies for the purpose
of our research project.
Dr Annie Kulmann, for her friendship and assistance with sample collection.
Dr Marius Hornsveld, for providing valuable anatomical information.
All students from the Faculty of Veterinary Science, University of Pretoria, for their
assistance with sample collection.
Funding for this research project was provided by the Faculty of Veterinary Science,
University of Pretoria.
©© UUnniivveerrssiittyy ooff PPrreettoorriiaa

vii
List of Abbreviations
ABG arterial blood gas
CA cerebral autoregulation
CBF cerebral blood flow
CNS central nervous system
CO cardiac output
CO2 carbon dioxide
CPP cerebral perfusion pressure
CRT capillary refill time
CVR cerebrovascular resistance
deoxyHb deoxygenated haemoglobin
DSS dorsal sagittal sinus
EEG electroencephalography
Hb haemoglobin
HR heart rate
ICP intracranial pressure
LAC lactate
LED light emitting diode
©© UUnniivveerrssiittyy ooff PPrreettoorriiaa

viii
LPS lipopolysaccharide
MAC minimum alveolar concentration
MAP mean arterial pressure
mm mucous membranes
MD microdialysis
NIRS near-infrared spectroscopy
O2 oxygen
OTAU Onderstepoort Teaching Animal Unit
oxyHb oxygenated Hb
PaCO2 arterial partial pressure of carbon dioxide
PaO2 arterial partial pressure of oxygen
PbtO2 brain tissue oxygen tension
POCD post operative cognitive decline
PvCO2 venous partial pressure of carbon dioxide
PvO2 venous partial pressure of oxygen
RP recording period
RR respiratory rate
rSO2 regional cerebral oxygen saturation
SaO2 arterial oxygen saturation
©© UUnniivveerrssiittyy ooff PPrreettoorriiaa

ix
SavO2 arteriovenous oxygen saturation
s.d. standard deviation
s.e. standard error
SjO2 jugular bulb venous oxygen saturation
T rectal temperature
TCD transcranial doppler
VBG venous blood gas
©© UUnniivveerrssiittyy ooff PPrreettoorriiaa

x
List of Figures
Figure 1 INVOS® 5100C Cerebral/Somatic Oximeter disposable sensor. .................... 35
Figure 2 INVOS® 5100C Cerebral/Somatic Oximeter system. ...................................... 36
Figure 3 INVOS® 5100C Cerebral/Somatic Oximeter monitor ..................................... 37
Figure 4 Location of the dorsal venous sinus system within the equine cranium. ......... 38
Figure 5 Anatomy of the equine dorsal venous sinus system. ....................................... 39
Figure 6 Positioning of the INVOS® 5100C Cerebral/Somatic Oximeter sensor on a
standing horse .......................................................................................................................... 40
Figure 7 INVOS® 5100C Cerebral/Somatic Oximeter being used on a horse under
general anaesthesia ................................................................................................................... 41
Figure 8 Mean ± s.e. values for regional cerebral oxygen saturation, arterial and venous
oxygen tensions and arteriovenous oxygen saturations ........................................................... 42
Figure 9 Scatter plot of PaO2 versus rSO2 ...................................................................... 43
Figure 10 Scatter plot of PvO2 versus rSO2 ...................................................................... 44
Figure 11 Scatter plot of SavO2 versus rSO2 .................................................................... 45
Figure 12 Scatter plot of PaCO2 versus rSO2 ................................................................... 46
Figure 13 Scatter plot of PvCO2 versus rSO2 ................................................................... 47
Figure 14 Scatter plot of [LAC] versus rSO2 ................................................................... 48
©© UUnniivveerrssiittyy ooff PPrreettoorriiaa

xi
List of Tables
Table 1 Description of the eight recordings periods……….………………………….49
Table 2 Mean ± s.d. values for regional cerebral oxygen saturation, recorded from each
of the 6 horses during the 8 recording periods……….……………………….50
Table 3 Mean ± s.d. values for regional cerebral oxygen saturation, arterial and venous
oxygen and carbon dioxide tensions, arteriovenous oxygen saturations and
mean arterial pressure recorded during the 8 recording periods.………….….51
Table 4 Mean ± s.d. values for temperature-corrected and non-corrected arterial and
venous oxygen and carbon dioxide tensions…………………………….....…52
©© UUnniivveerrssiittyy ooff PPrreettoorriiaa

xii
List of Appendices
Appendix 1 Recording form used for data collection.………………………………….….63
Appendix 2 Average temperatures recorded for each of the six horses during the
eight recording periods.…...…………………………………………………..64
Appendix 3 List of manufacturers.………………………………………………………...65
©© UUnniivveerrssiittyy ooff PPrreettoorriiaa

xiii
Summary
USE OF NEAR-INFRARED SPECTROSCOPY TO IDENTIFY TRENDS IN REGIONAL
CEREBRAL OXYGEN SATURATION IN HORSES
By
Emma J. McConnell
Supervisor: Montague N. Saulez
Department: Companion Animal Clinical Studies
Degree: MMedVet (Equine Medicine)
This dissertation focuses on the use of near-infrared spectroscopy (NIRS) to identify trends in
regional cerebral oxygen saturation (rSO2) in both conscious and anaesthetised healthy horses.
A cerebral/somatic oximeter sensor recorded rSO2 from the dorsal sagittal sinus of 6 healthy
horses. Values for rSO2, arterial and venous oxygen and carbon dioxide tensions (PaO2, PvO2,
PaCO2 and PvCO2 respectively), along with arteriovenous oxygen saturations (SavO2) were
recorded in unsedated (recording period [RP] 1), sedated (RP2), and anaesthetised horses
(RP3-5); and during recovery (RP6-8). During anaesthesia, horses were ventilated to achieve
states of normo- (RP3), hyper- (RP4) and hypocapnoea (RP5).
Overall mean ± s.d. values for rSO2, PaO2, PvO2, PaCO2, SavO2 and mean arterial pressure
(MAP) varied significantly by RP. Significant decreases in rSO2 were identified between RP1
©© UUnniivveerrssiittyy ooff PPrreettoorriiaa

xiv
and the post-anaesthetic periods however no significant differences in rSO2 values were
identified between RP1 and the intra-anaesthesia periods. Regional cerebral oxygen saturation
was significantly correlated with PaO2, PvO2 and SavO2. No correlation was identified
between rSO2 and lactate concentration.
This is the first study to identify trends in rSO2 in horses using NIRS. A significant positive
correlation was identified between rSO2 and PvO2, suggesting that alterations in cerebral
oxygenation may be reflected in jugular PvO2. Results of this study demonstrate that NIRS
can be used during general anaesthesia to monitor trends in rSO2 in healthy horses, and has
the potential to alert clinicians to cerebral desaturation events when used in a clinical setting.
Keywords: anaesthesia, cerebral oximeter, horse, hypercapnoea, near-infrared
spectroscopy, neuromonitoring
©© UUnniivveerrssiittyy ooff PPrreettoorriiaa

1
Chapter 1: General Introduction
Equine anaesthesia carries a high risk of mortality or serious morbidity, with the recovery
period being a time of particular concern1-6. Recently, a UK-based enquiry into perioperative
equine fatalities identified a mortality rate, defined as death within seven days of general
anaesthesia, of 1.9%3; a significantly higher rate than that which is reported in humans
(0.008%)5 or dogs and cats (0.2%)6. Recovery from equine general anaesthesia is considered
precarious and injuries sustained during this period account for 25-50% of anaesthetic-
associated deaths7. Numerous factors are recognised as contributing to the quality of recovery
including the duration of anaesthesia, type of anaesthetic agent used, temperament of the
horse and degree of intraoperative hypotension7.
Post-operative neurological complications are commonly encountered in human patients,
particularly following cardiovascular surgery, and are an important cause of post-operative
morbidity8,9. In children, neurologic outcome has surpassed mortality as the primary
distinguishing feature of paediatric cardiac surgery, with long-term neurodevelopment
impairment occurring in 21 to 69% of such patients10,11. These complications are thought to
develop due to cerebral ischaemic hypoperfusion caused by reduced blood flow or
haemodynamic impairment, thromboembolic events within the brain, or as a result of
systemic inflammatory response syndrome8,10,11.
In human medicine an association between intra-operative cerebral oxygen desaturation and
adverse neurological outcomes, including delirium, disorientation and prolonged recoveries,
has been identified8,10,11,12. As a result NIRS, a non-invasive neuromonitoring technique
©© UUnniivveerrssiittyy ooff PPrreettoorriiaa

2
which identifies trends in rSO2, is being increasingly utilised to facilitate the early detection
of haemodynamic abnormalities during general anaesthesia12,13.
Currently, neuromonitoring techniques in equine medicine are vastly limited. Although the
direct measurement of intracranial pressure has been reported in horses14, the invasiveness of
this procedure prohibits its use as a routine neuromonitoring tool. As alterations in cerebral
haemodynamics may be a contributing factor to the complications associated with post-
anaesthetic recovery in horses, use of a non-invasive neuromonitoring tool such as NIRS may
prove to be beneficial.
The aims of this study were to determine whether NIRS can be used to measure rSO2 in
horses; detect changes in rSO2 during periods of induced hypo- or hypercapnoea; and
determine whether correlations exist between rSO2 and PaO2 and rSO2 and PvO2.
©© UUnniivveerrssiittyy ooff PPrreettoorriiaa

3
Chapter 2: Literature Review
2.1 GENERAL ANAESTHESIA OF HORSES
2.1.1 Mortality associated with general anaesthesia:
Equine general anaesthesia carries a high risk of mortality or serious morbidity, with the
recovery period being a time of particular concern1-6. In an attempt to identify factors that
may be associated with an increased risk of death during and within 7 days of general
anaesthesia, a large-scale prospective epidemiological study investigating mortality associated
with equine general anaesthesia was conducted3. The study involved 41, 824 cases of equine
general anaesthesia from 62 veterinary centres in the United Kingdom over a 6-year period,
and identified an overall perioperative mortality rate of 1.9%3; a significantly higher rate than
that which is reported in humans (0.008%)5 or small animals (0.2%)6. The most common
cause of equine death reported during this enquiry was cardiac arrest (including post-
operative cardiovascular collapse), accounting for 33% of all perioperative fatalities3. Limb
fractures, myopathies, post-operative haemorrhage and respiratory complications were also
recognised as causes of death occurring within the perioperative period3.
In the study discussed above, central nervous system disturbances were responsible for 5.5%
of fatalities3; the specific neurological conditions observed in affected horses however were
not reported. In the equine veterinary literature, reports of neurological complications
associated with the anaesthetic period are predominantly limited to case studies, the majority
of which describe spinal cord pathology. To date, fracture of the cervical vertebra15, spinal
©© UUnniivveerrssiittyy ooff PPrreettoorriiaa

4
cord myelomalacia16 and cerebral necrosis17,18 have all been reported as causes of mortality
associated with general anaesthesia.
Over the past twenty years numerous risk factors have been identified as contributing to this
increased incidence of equine perioperative fatalities. In adult horses an association between
increasing age and risk of perioperative mortality has been reported, with horses older than 14
years being at the most risk2-4. The type of surgical procedure has also been shown to
correlate with the likelihood of dying; with fracture repair, emergency exploratory laparotomy
and caesarian-section carrying the highest risk2-4. Johnston et al. (1995) reported a significant
positive association between surgical time and the likelihood of perioperative death2; most
likely attributable to the cumulative effects of inadequate perfusion, hypoxaemia and acid-
base derangements that are frequently encountered during prolonged periods of general
anaesthesia3.
2.1.2 Recovery from general anaesthesia:
Unlike humans and small animals, recovery from equine general anaesthesia necessitates
standing which, in combination with the horses’ natural flight instinct, makes this period a
particularly precarious one. Injuries sustained during the recovery phase account for 25-50%
of anaesthetic-associated deaths and can be attributed to horses attempting to rise before
musculoskeletal coordination is adequate7,19. The aim of an ideal recovery is to achieve a slow
and controlled return to consciousness so that appropriate and deliberate attempts to stand are
made19. Young et al. (1993) found that recovery times had a strong influence on the type of
recovery, in that the longer a horse took to stand, the better the quality of recovery1.
Prolonged recoveries should be avoided however, as lengthy periods of recumbency will
©© UUnniivveerrssiittyy ooff PPrreettoorriiaa

5
increase the risk of developing postoperative complications such as myopathies and
neuropathies which can further exacerbate a poor recovery19.
Numerous factors are recognised as contributing to the quality of recovery including the
duration of anaesthesia, temperament of the horse, degree of postoperative pain and type of
anaesthetic agent used7,19-21. Isoflurane, a halogenated hydrocarbon commonly used to
maintain general anaesthesia has been associated with a higher incidence (51%) of recovery
delirium in adult humans when compared to halothane7. Comparative studies performed in
horses however have shown no significant difference between isoflurane and halothane with
regards to the quality of recovery, although a shorter time to sternal recumbency has been
noted in isoflurane-anaesthetised horses7,20,21.
2.1.3 Hypoxaemia during general anaesthesia:
Despite the delivery of a high inspired oxygen (O2) concentration during general anaesthesia,
hypoxaemia (PaO2 < 60 mmHg), is frequently reported22. The positioning of horses in either
dorsal or lateral recumbency results in the development of atelectasis in the dependant lung
regions, leading to inequalities between ventilation and perfusion, and consequently impaired
arterial oxygenation22-24. As PaO2 is one of the main determinants of oxygen delivery to the
tissues18, the development of hypoxaemia during anaesthesia will ultimately result in
generalised tissue hypoxia and an increased risk of complications within the perioperative
period.
©© UUnniivveerrssiittyy ooff PPrreettoorriiaa

6
2.2 CEREBRAL PERFUSION AND AUTOREGULATION
Cerebral autoregulation (CA) is a sensitive homeostatic mechanism which acts to maintain a
near constant cerebral blood flow (CBF) despite alterations in cerebral perfusion pressure
(CPP), through the control of cerebrovascular resistance (CVR)25-27. By doing so, this
mechanism serves to appropriately match blood flow and oxygen delivery with the metabolic
demands of the central nervous system (CNS)28. Cerebral perfusion pressure is defined as the
difference between MAP at the level of the arterial circle of the brain and intracranial pressure
(ICP), and is determined by CBF and CVR. Consequently, any increase in ICP will result in a
decrease in CBF, unless accompanied by a compensatory increase in MAP or decrease in
CVR28.
2.2.1 Effects of hypercapnoea on cerebral perfusion and autoregulation:
Hypercapnoea (PaCO2 > 50 mmHg) is frequently encountered during equine general
anaesthesia, predominantly due to the respiratory depression and subsequent hypoventilation
caused by the inhalation agents used for maintenance. Studies conducted in both humans and
dogs have shown that exposure to moderate hypercapnia (PaCO2 = 60-75 mmHg) results in
enhanced cardiovascular performance, as determined by an increase in cardiac output (CO)
and arterial blood pressure, thought to be caused by an increased stimulation of the
sympathetic nervous system29. A similar response has been reported in horses anaesthetised
with halothane, whereby exposure to moderate and severe levels of hypercapnia (PaCO2 =
82.6 mmHg and 110 mmHg respectively) resulted in a marked degree of haemodynamic
stimulation19.
©© UUnniivveerrssiittyy ooff PPrreettoorriiaa

7
Hypercapnoea however, has frequently been associated with the impairment of CA,
attributable to the potent vasodilatory effects of CO2 on the cerebral vasculature25.
McCullouch et al. (2000) reported that CA was readily impaired at clinically relevant levels
of hypercapnoea (PaCO2 > 50 mmHg) in anaesthetised healthy humans; the extent of
impairment however was dependant on the anaesthetic maintenance agent used25.
2.2.2 Effects of hypocapnoea on cerebral perfusion and autoregulation:
Induction of hypocapnoea through hyperventilation was widely used in humans with acute
brain injury as a means of reducing ICP30 and has been reported to restore cerebral
autoregulatory function26. Recently however, several deleterious effects associated with
hypocapnoea have been highlighted; the most prominent being cerebral hypoperfusion30. Not
only does hypocapnoea result in a respiratory alkalosis, leading to arterial vasoconstriction
and a subsequent decrease in CBF, it also increases the cerebral metabolic requirement for
oxygen, ultimately resulting in regional cerebral ischaemia30. Even short exposure (20
minutes) to moderate hypocapnia (PaCO2 = 27-32 mmHg) has been reported to produce
critical reductions in regional brain tissue oxygenation and has been associated with impaired
psychomotor function and long-term neurologic abnormalities30.
2.2.3 Effect of isoflurane on cerebral autoregulation:
Regardless of the concentration, the use of inhalation agents will decrease CO and mean
arterial pressure (MAP), resulting in systemic hypotension which may interfere with the
cardiovascular reflexes responsible for maintaining CPP28. McPherson et al. (1988) reported
that the cerebral autoregulatory response to decreased CPP in dogs was preserved at the
©© UUnniivveerrssiittyy ooff PPrreettoorriiaa

8
minimum alveolar concentration (MAC) of isoflurane (1.3%) however was abolished at twice
the MAC31. In the presence of diminished CA and inappropriate CPP, cerebral ischaemia is
likely and may therefore be associated with an increased risk of perioperative complications.
2.3 NEUROMONITORING
2.3.1 The importance of neuromonitoring during general anaesthesia:
Over the past decade numerous studies have demonstrated an association between intra-
operative cerebral oxygen desaturation and adverse neurological outcomes, including post-
operative cognitive decline (POCD) or dysfunction, delirium, disorientation and prolonged
recoveries8,12. It has also been reported that low cerebral oxygen saturation during surgery
leads to prolonged ICU and hospital stays8,32,33. Consequently, non-invasive techniques to
monitor brain and cerebral circulation are being increasingly utilised to facilitate early
detection of electrophysical or haemodynamic abnormalities and thus aid in reducing the
incidence of post-operative neurological complications.
Post-anaesthetic cerebral necrosis has been described in horses and although rare, should be
considered an important cause of perioperative mortality17,18. In all reported cases,
neurological signs developed within 7 days of anaesthesia; and included ataxia, hypermetria,
central blindness, head pressing, recumbency and seizures17,18. All horses were subsequently
euthanised due to the severity of clinical signs17,18. Histopathological examination identified
diffuse acute necrosis of the cerebral cortices, type II Alzheimer astrocytosis, and neuronal
necrosis consistent with ischaemia17,18. The anatomical distribution of the lesions, in
association with their histopathological characteristics was consistent with global cerebral
©© UUnniivveerrssiittyy ooff PPrreettoorriiaa

9
hypoxia, and the severe neurological signs observed in the post-anaesthetic phase correlated
well with the pathological findings17. In the case series reported by McKay et al. (2002),
anaesthesia records were available for 4 of the 5 cases. All 4 of those cases encountered
variable periods of hypoxaemia and hypercapnoea during general anaesthesia, leading the
authors to postulate that the cerebral neuronal ischaemic damage was attributable to episodes
of hypotension, hypoxaemia, hypercapnoea or reduced cardiac output18. Alternatively, in the
case described by Spadavecchia et al. (2001), PaO2 was maintained above 70 mmHg and
PaCO2 < 60 mmHg, thereby suggesting hypoxaemia and hypercapnoea did not play a role in
the development of cerebral ischaemia17. In man, neurological complications observed in
relation to general anaesthesia are often associated with concurrent brain pathology34, thus it
was proposed that the affected pony may have had a pre-existing, but clinically silent,
microscopic brain lesion17. Although the precise mechanism for the development of post-
anaesthetic cerebral necrosis in horses remains unknown, it is likely attributable to alterations
in cerebral blood flow and perfusion. Consequently, adopting a neuromonitoring protocol for
horses undergoing general anaesthesia may provide important information regarding cerebral
oxygenation and reduce the risk of developing neurological sequelae.
2.3.2 Types of neuromonitoring:
The ideal neurophysiological monitor should be non-invasive and provide real-time,
continuous, objective and rapid assessment of cerebral perfusion and function12,35,36.
Neuromonitoring should allow early detection of problems associated with cerebral blood
flow and neuronal function, thus facilitating appropriate interventions and correction of the
neurophysiological imbalance, before the effects become irreversible12,13,37. By doing so the
overall duration of hospitalisation may be reduced, and clinical outcomes improved8,9,38.
©© UUnniivveerrssiittyy ooff PPrreettoorriiaa

10
When periods of cerebral desaturation are encountered, the primary therapeutic aim is to
improve cerebral oxygenation. In human cases this is generally achieved by: 1) increasing
arterial blood pressure and improving cardiac output; 2) inducing hypercapnoea; 3) the
administration of blood products, particularly if Hb concentration is inadequate; and 4)
increasing the final inspired O2 concentration39. If resolution of cerebral desaturation fails to
occur in response to these initial interventions, reduction of cerebral metabolic requirement
for O2 is attempted through the administration of propofol, a potent suppressor of neuronal
metabolism40.
2.3.2.1 Invasive neuromonitoring:
Multimodal invasive neuromonitoring, including the measurements of ICP, CBF and brain
tissue oxygen tensions (PbtO2), along with the use of cerebral microdialysis, is becoming
increasingly popular in human intensive care units, particularly in cases of traumatic brain
injury (TBI)41,42.
Invasive monitoring of ICP via the placement of an external ventricular drain is considered to
be the “gold-standard” neuromonitoring technique for human patients with TBI41,43,44. Not
only does this method facilitate the continuous and accurate measurement of ICP, it has the
additional advantage of enabling drainage of CSF if deemed necessary43,44. A number of other
ICP monitoring devices are currently available for use in human medicine including fibre
optic devices, strain gauge devices and pneumatic sensors, all of which can be positioned
within different intracranial anatomical locations43,44.
©© UUnniivveerrssiittyy ooff PPrreettoorriiaa

11
Monitoring CBF plays an important role in human neurosurgical practice by providing an
opportunity to identify significant flow alterations before they result in potentially irreversible
consequences45. Following implantation of a specialised microprobe within the brain
parenchyma or vasculature, thermal diffusion can then be used to continuously and
quantitatively monitor regional CBF46,47. The direct monitoring of PbtO2 involves placement
of a microcatheter or probe into the cerebral white matter, and is used extensively to predict
cerebral ischaemia in human adults with severe TBI48,49.
Cerebral microdialysis has been used to monitor human patients suffering from TBI for over a
decade, providing valuable information regarding brain metabolism and local brain
chemistry42,50. The technique involves surgical placement of a microdialysis catheter into the
cortical surface, usually within the area of injury, via a 1 mm corticectomy42. Sterile artificial
cerebrospinal fluid (CSF) is then perfused at a rate of 0.3µl/min and samples collected on an
hourly basis, facilitating the monitoring of short-term metabolic changes and long-term
trends42,50.
The use of these neuromonitoring techniques provide direct assessment of cerebral
haemodynamic parameters and have been associated with improved outcomes in human
patients following severe head injury48. Given the requirement for surgical placement of
monitoring probes within different anatomical regions of the central nervous system however,
the clinical use of such invasive neuromonitoring devices in horses is considered unfeasible.
©© UUnniivveerrssiittyy ooff PPrreettoorriiaa
12
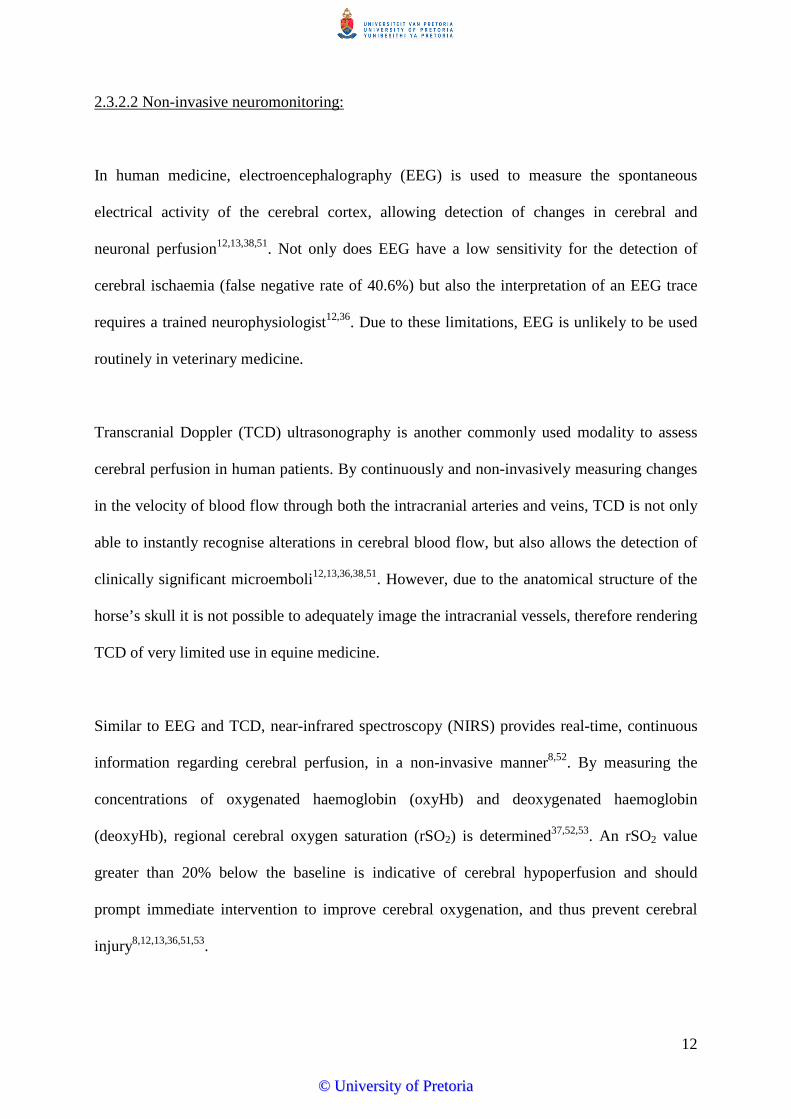
2.3.2.2 Non-invasive neuromonitoring:
In human medicine, electroencephalography (EEG) is used to measure the spontaneous
electrical activity of the cerebral cortex, allowing detection of changes in cerebral and
neuronal perfusion12,13,38,51. Not only does EEG have a low sensitivity for the detection of
cerebral ischaemia (false negative rate of 40.6%) but also the interpretation of an EEG trace
requires a trained neurophysiologist12,36. Due to these limitations, EEG is unlikely to be used
routinely in veterinary medicine.
Transcranial Doppler (TCD) ultrasonography is another commonly used modality to assess
cerebral perfusion in human patients. By continuously and non-invasively measuring changes
in the velocity of blood flow through both the intracranial arteries and veins, TCD is not only
able to instantly recognise alterations in cerebral blood flow, but also allows the detection of
clinically significant microemboli12,13,36,38,51. However, due to the anatomical structure of the
horse’s skull it is not possible to adequately image the intracranial vessels, therefore rendering
TCD of very limited use in equine medicine.
Similar to EEG and TCD, near-infrared spectroscopy (NIRS) provides real-time, continuous
information regarding cerebral perfusion, in a non-invasive manner8,52. By measuring the
concentrations of oxygenated haemoglobin (oxyHb) and deoxygenated haemoglobin
(deoxyHb), regional cerebral oxygen saturation (rSO2) is determined37,52,53. An rSO2 value
greater than 20% below the baseline is indicative of cerebral hypoperfusion and should
prompt immediate intervention to improve cerebral oxygenation, and thus prevent cerebral
injury8,12,13,36,51,53.
©© UUnniivveerrssiittyy ooff PPrreettoorriiaa
13
2.4 NEAR-INFRARED SPECTROSCOPY
2.4.1 General introduction:
Near-infrared spectroscopy was first introduced in 1977 as a means of monitoring tissue
oxygenation, and was first reported for use as a neuromonitoring tool during congenital heart
surgery in 199110,54. There are three main principles on which NIRS relies in order to derive
an rSO2 value: 1) most living tissues, with the exception of haemoglobin (Hb) and
cytochrome oxidase, are relatively transparent to infrared light in the range close to the visual
spectrum (700-1000 nm); 2) the absorbance spectrum of Hb is dependant on it’s oxygenation
status (deoxyHb absorbs less infrared light than oxyHb)55,56; and 3) the Beer-Lambert law,
which states “the transmission of light through a solution is a logarithmic function of the
density or concentration of the absorbing molecules in the solution, the path length of light
through the solution and the specific extinction coefficient for the material at a given
wavelength”10,55-57. Therefore, by applying the principles of light transmission (where the
degree of change in light absorption is related to the change in concentration of the
chromophore within the tissue illuminated), a ratio of oxyHb to total Hb can be calculated.
This ratio is shown as a percentage value and is reflective of rSO210,56.
2.4.2 INVOS® 5100C Cerebral/Somatic Oximeter:
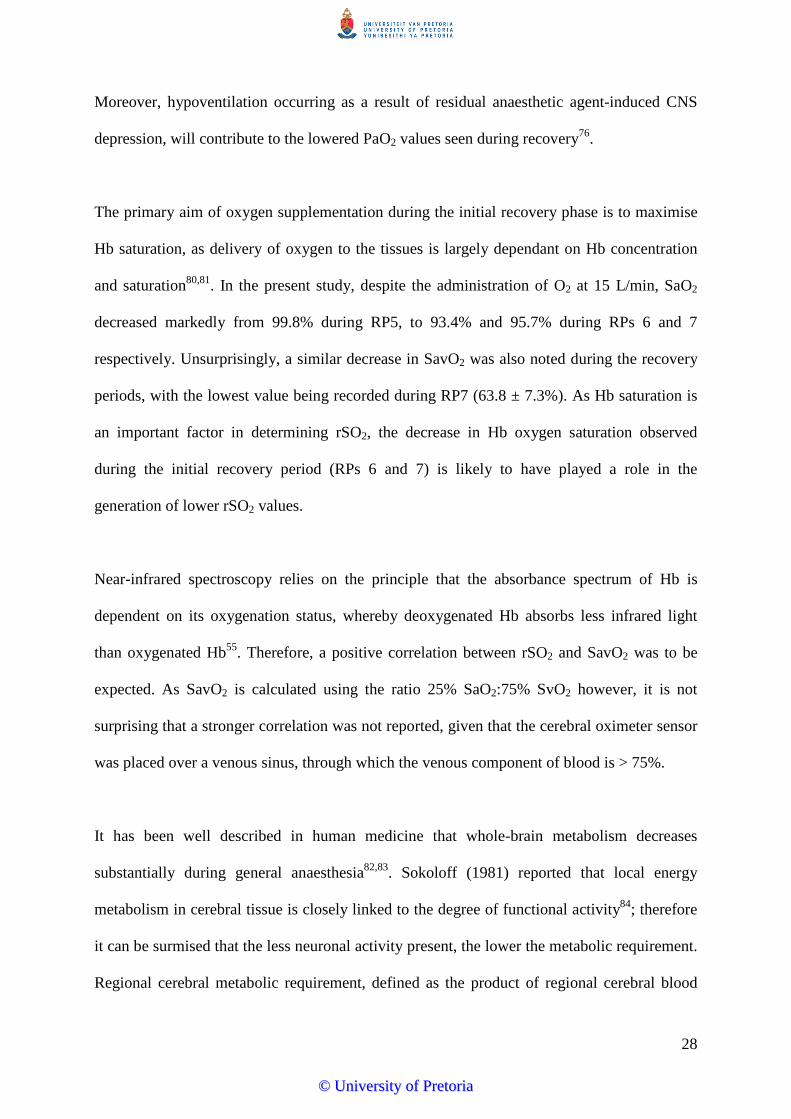
The INVOS® 5100C Cerebral/Somatic Oximeter utilises a disposable sensor which
incorporates a light emitting diode (LED) and two light-collecting optodes (Figure 1)55,58.
These optodes are set at fixed distances from the LED: the proximal detector, set at 3 cm,
receives a reading from the extracerebral tissue whereas the distal detector, set at 4 cm,
©© UUnniivveerrssiittyy ooff PPrreettoorriiaa

14
receives a reading from the cortical and intracerebral structures51,55. Measurement of the
absorption ratios at two different sites allows for the removal of the extracranial contribution
via a subtraction algorithm, thus giving a mean value for cerebral saturation10,52,54,55. In order
to generate an rSO2 value, cerebral oximetry makes several assumptions. Not only is it
assumed that 75% of the cerebral blood flow is venous (25% arterial) and that this ratio is
unchanging,8,59 but also that the degree of light scatter is constant throughout the
measurement period and therefore can effectively be ignored55.
Light absorption data is collected continuously fifteen times per second for a total of fifty
samples (3.3 sec). These values are averaged to determine the new rSO2 value and this
number is then displayed on the monitor (Figures 2 and 3)45. Due to the significant intra-
individual variability and the assumptions made by the cerebral oximeter, NIRS is deemed
more reliable when monitoring trends of oxygen saturation, rather than absolute values12,55,59.
An rSO2 value < 50% or a decrease of ≥ 20% compared to the baseline value has been shown
to be consistent with cerebral hypoperfusion, and indicates the need for intervention12,13.
2.4.3 Potential role for near-infrared spectroscopy in equine general anaesthesia:
Traditionally, neuromonitoring has been primarily used in human patients undergoing
cardiothoracic surgeries, those suffering from traumatic head injury or for bedside monitoring
of critically ill preterm infants10,13,39. More recently however, the use of NIRS has been
advocated in patients undergoing non-cardiac abdominal surgery on the basis that all general
anaesthetics will produce cardiovascular depression, thereby potentially exposing patients to
inadequate cerebral perfusion39. Undoubtedly cardiothoracic surgeries are rarely performed in
©© UUnniivveerrssiittyy ooff PPrreettoorriiaa

15
horses; exploratory abdominal surgery however is common, and it is in this regard that NIRS
may be beneficial in equine patients.
Endotoxaemia is encountered in approximately 29% of horses presenting with acute intestinal
disease, and the likelihood of this complication is increased in horses undergoing an
exploratory laparotomy60. Cerebral hypoperfusion has been reported in response to
administration of lipopolysaccharide (LPS) and is attributable to a transient decrease in CBF
and endothelial dysfunction61. In young lambs, administration of LPS resulted in a 30%
reduction in CBF, in the absence of hypoxaemia and hypercapnoea, and is thought to be
associated with cerebral vasoconstriction mediated by tumour necrosis factor alpha61.
Vasodilation of the systemic vasculature also occurs following the release of endotoxin,
resulting in a decrease in mean arterial pressure and systemic vascular resistance. This
hypotension is frequently exacerbated by hypovolaemia and dehydration, resulting in a
decrease in CPP62. In addition, exposure to endotoxin can cause significant impairment of
cerebral autoregulation leading to a profound reduction in CBF, particularly in the presence of
inappropriate CPP63. Therefore, the use of NIRS should be considered in horses with
endotoxaemia as they are potentially at an increased risk of cerebral desaturation during
general anaesthesia.
2.5 THE VENOUS DRAINAGE SYSTEM OF THE BRAIN
The anatomy and haemodynamics of the equine brain lends itself to the possibility of using
near-infrared spectroscopy to determine rSO2. The venous drainage system involves a number
of endothelial-lined sinuses enclosed within the dura mater and are divided into dorsal and
ventral systems64. The dorsal system includes the dorsal sagittal sinus (DSS), rectus sinus,
©© UUnniivveerrssiittyy ooff PPrreettoorriiaa

16
transverse sinus, dorsal petrosal sinus and temporal sinus (Figures 4 and 5). The dorsal
sagittal sinus lies within the falx cerebri and receives numerous veins directly from the
cerebral hemispheres65. As it runs caudally, it joins the rectus sinus which is formed from
corporis callosi major and the cerebri magna veins, before terminating and splitting into the
transverse sinus64. The transverse sinus lies in a transverse plane and joins the dorsal petrosal
sinus before entering the temporal meatus and joining the temporal sinus64. The dorsal venous
sinus system then exits the cranial cavity via the emissaria foramen retroarticularis vein
which ultimately communicates with the external jugular vein64,66.
©© UUnniivveerrssiittyy ooff PPrreettoorriiaa

17
Chapter 3: Use of Near-infrared Spectroscopy to Identify
Trends in Regional Cerebral Oxygen Saturation in Horses
3.1 INTRODUCTION
It is widely accepted that equine general anaesthesia carries a high risk of mortality or serious
morbidity, with the recovery period being a time of particular concern1-6. A UK-based
epidemiological multicentre study of perioperative equine fatalities identified an overall
mortality rate of 1.9%3; a significantly higher rate than what is reported in small animals
(0.2%)6. Unlike humans and small animals, recovery from equine general anesthesia
necessitates standing, making this period particularly precarious. Although there is currently
no evidence supporting hypoxaemia as a risk factor for equine peri-anaesthetic mortality3, it is
possible that alterations in cerebral haemodynamics may contribute to the degree of
disorientation and incoordination experienced during recovery. Hence the use of non-invasive
neuromonitoring tools may be beneficial.
Post-operative neurological complications are commonly encountered in human patients8,32,38.
Over the past decade, numerous human studies have demonstrated an association between
intra-operative cerebral oxygen (O2) desaturation and adverse neurological outcomes12,38.
Consequently, techniques to monitor cerebral circulation are being increasingly utilised to
facilitate early detection of haemodynamic alterations.
Near-infrared spectroscopy (NIRS) is frequently used intra-operatively in human patients, and
provides real-time, continuous data regarding cerebral perfusion32. By using light optical
spectroscopy to measure the concentrations of oxygenated and deoxygenated haemoglobin
©© UUnniivveerrssiittyy ooff PPrreettoorriiaa

18
(Hb) within the cerebral vascular bed, regional cerebral oxygen saturation (rSO2) can be
determined12,52.
Currently, neuromonitoring techniques available for use in equine medicine are limited. The
direct measurement of intracranial pressure has been reported14; however the invasiveness of
this procedure prohibits its use as a routine neuromonitoring tool in horses.
3.2 OBJECTIVES
The objectives of this study were to determine whether NIRS could be used to: 1) assess
trends in rSO2 in clinically healthy conscious and anaesthetised horses; 2) detect changes in
rSO2 during periods of induced hypo- or hypercapnoea; and 3) determine whether a
correlation exists between rSO2 and venous oxygen tensions (PvO2).
3.3 HYPOTHESES
We hypothesised that NIRS would be able to detect trends in rSO2 in conscious and
anaesthetised horses; detect changes in rSO2 during periods of induced hypo- or
hypercapnoea, and that there would be a positive correlation between rSO2 and PvO2.
©© UUnniivveerrssiittyy ooff PPrreettoorriiaa

19
3.4 MATERIALS AND METHODS
3.4.1 Horses:
Six healthy adult Nooitgedacht mares (age range 12-16 years, median 13 years; weight range
400-486 kg, median 432.5 kg) were selected from the Onderstepoort University Teaching
Animal Unit (OTAU) for inclusion in this study. To eliminate any potential confounding
associated with age, middle-aged mares were selected for this study. The researchers did not
individually select the mares; rather appropriately aged mares were allocated to the study by
OTAU based on their availability for the data collection period.
During hospitalisation mares had free access to hay with the exception of the 12 h period
preceding general anaesthesia, and water was offered ad libitum. The study was approved by
the Animal Use and Care Committee of the Faculty of Veterinary Science, University of
Pretoria.
3.4.2 Blood sample collection and analyses:
Horses were sedated with xylazinea (0.2 mg/kg bwt, IV) and an 18 G over-the-wire arterial
catheterb was placed in the left carotid artery under ultrasonographic guidance. Retrograde
catheterisation of the left external jugular vein was performed using a 14 G, 13 cm catheterc
placed with the tip positioned close to the bifurcation of the vein, at the angle of the mandible.
Blood was collected and stored in heparinised blood gas syringesd at room temperature, for
arterial and venous blood gas analysese (ABG and VBG respectively). Analyses were
corrected for body temperature and performed within 15 minutes of collection. Plasma lactate
©© UUnniivveerrssiittyy ooff PPrreettoorriiaa

20
concentrations ([LAC]) were measured from blood samples collected into sodium
fluoride/potassium oxalate tubes, using a hand-held lactate monitore.
3.4.3 rSO2 measurements:
Cerebral rSO2 values were obtained using the INVOS® 5100C Cerebral/Somatic Oximeterf
which utilises a disposable, self-adhesive sensorg. A dedicated sensor was used for each of the
6 horses and disposed of following completion of data collection. To obtain cerebral rSO2
values the sensor was placed directly onto clean, shaved pigmented skin, and positioned on
midline, over the region of the DSS (Figure 6). A 12 x 8 cm rectangle of black duct tape was
placed over the sensor to prevent external light interference.
The INVOS® 5100C automatically collected light absorption data fifteen times per second,
for a total of fifty samples, before averaging them to determine the new rSO2 value. This
result was then displayed on the monitor and updated every 3.3 sec. (Figure 7)
3.4.4 General anaesthesia:
All horses were premedicated with romifidineh (50 µg/kg, IV). General anaesthesia was
induced using ketaminei (2.2 mg/kg, IV) and diazepamj (10 mg/horse, IV), and the horses
were positioned in right lateral recumbency. A 26 mm internal diameter silicone tube was
used for endotracheal intubation, connected to a large animal circle circuit. Anaesthesia was
maintained using inhalant isofluranek delivered in 5 L/kg/min O2, at an expired concentration
close to the minimum alveolar concentration (MAC) value of 1.2 reported for horses68.
Positive pressure ventilationl was initiated using a constant peak inspiratory pressure of 20 cm
©© UUnniivveerrssiittyy ooff PPrreettoorriiaa

21
H2O and varying respiratory rate (RR) to obtain states of normo- (PaCO2 = 40-50 mmHg),
hyper- (PaCO2 = 50-60 mmHg) and hypocapnoea (PaCO2 = 25-35 mmHg) as determined by
capnography and confirmed by ABG analysis. Direct arterial blood pressurem,
electrocardiogramm and heart rate (HR) were measured and displayed continuously
throughout the anaesthetic period, along with the expired isoflurane concentrationm and the
expired CO2 tensionm. Intravenous isotonic crystalloid fluidsn were administered at a rate of 5
ml/kg/h, along with a dobutaminei constant rate infusion (1 µg/kg/min, IV) if the MAP
dropped below 60 mmHg.
In preparation for recovery, mechanical ventilation and isoflurane were discontinued, and
horses were allowed to breathe spontaneously. Romifidineg (0.01 mg/kg bwt, IV) was
administered as soon as nystagmus was noted. Oxygen was administered via the endotracheal
tube (15 L/min) until attempts to sternal recumbency were made. Horses recovered without
assistance and were extubated once standing.
3.4.5 Experimental procedures:
Horses were assigned to either Group A or B (n = 3, respectively), based on predetermined
blinded randomisation conducted by the principal investigator. Whilst under general
anaesthesia, those horses in Group A were hypoventilated first, followed by a period of
hyperventilation; whereas those in Group B were hyperventilated first.
The study consisted of 8 recording periods (RPs), each of 10 minutes duration (Table 1).
Physical examinations were performed at the beginning (t = 1 min) and end (t = 10 min) of
each recording period, and HR, pulse quality, capillary refill time, mucous membrane colour,
©© UUnniivveerrssiittyy ooff PPrreettoorriiaa

22
RR and temperature were recorded (Appendix 1). Venous and arterial blood samples were
collected at t = 1, 5 and 10 min for both VBG and ABG analyses, and at t = 1 min for
measurement of [LAC]. Cerebral rSO2 values were automatically recorded by the cerebral
oximeter once every 5-6 sec, for the duration of each RP.
The cerebral oximeter was equilibrated for up to 5 min prior to each recording period,
whereby rSO2 values were displayed but not recorded, to ensure adequate signal strength was
achieved and maintained.
3.4.6 Data analysis:
Data were assessed for normality using descriptive statistics, histograms and the Anderson-
Darling test for normality. Normally distributed data were presented as mean ± standard
deviation (s.d.). Mean rSO2 values were calculated over the 30 second period in which blood
was collected for VBG and ABG evaluation, to use for statistical analysis. Linear mixed
effects models were used to estimate the effects of RP and time for rSO2, PaO2, PvO2, PaCO2,
PvCO2, SavO2 and MAP. The horse was included as a random effect and fixed effects
included RP, dobutamine administration and the interaction between RP and dobutamine
administration. Bonferroni correction was used for post hoc pairwise comparisons. Variance
components analysis was used to estimate the influence of dobutamine administration on rSO2
values, and to evaluate the repeatability of rSO2 measurements. Correlations between rSO2
and PaO2; rSO2 and PvO2; rSO2 and PaCO2; rSO2 and PvCO2; rSO2 and SavO2; as well as
between rSO2 and [LAC] were assessed using the Pearson’s correlation coefficient. All
statistical analyses were performed using commercially available statistical softwareo,p.
Statistical significance was set at P < 0.05.
©© UUnniivveerrssiittyy ooff PPrreettoorriiaa

23
3.5 RESULTS
The mean rSO2 values recorded for each horse during RP1-8 is shown in Table 2. The highest
overall mean rSO2 value was recorded during RP4 (60.0 ± 6.9%), whereas the lowest was
recorded during RP7 (40.7 ± 6.8%) (Figure 8). Similarly, the highest overall mean PvO2 value
was recorded during RP4 (64.7 ± 12.0 mmHg), and the lowest was recorded during RP7 (27.7
± 3.6 mmHg).
Overall means for rSO2, PaO2, PvO2, PaCO2, SavO2 and MAP varied significantly by RP
(P < 0.001) (Table 3). Significant differences in rSO2 were identified between RP1 and the
post-anaesthetic periods (RP6-8) (P < 0.001). No significant differences in rSO2 values were
identified between periods of normo- (RP3), hyper- (RP4) and hypocapnoea (RP5); or
between RP1 and RP3, RP4 and RP5. Both PaO2 and PvO2 were significantly increased
during RP3, RP4 and RP5 (P < 0.001), with PaO2 values differing significantly between those
periods (P < 0.05). Compared to the standing horse (RP1), SavO2 increased significantly
during the anaesthetic periods (RP3-5) (P < 0.001), and significantly decreased during RP7
(P < 0.05). Mean PaCO2 and PvCO2 values recorded during periods of hyper- and
hypocapnoea (RP4 and RP5) differed significantly from RP1 as well as from those recorded
following recovery (RP7 and RP8) (P < 0.001). Mean arterial pressures were significantly
lower during general anaesthesia compared to RP1 and RP2 (P < 0.001).
All horses received dobutamine, for a period of time ranging between 15-60 min during
general anaesthesia. Dobutamine administration had a significant effect on MAP values
(P < 0.01) whilst the interaction between RP and dobutamine administration was significant
for rSO2 (P < 0.01), PaO2 (P < 0.001) and PvO2 (P < 0.001).
©© UUnniivveerrssiittyy ooff PPrreettoorriiaa
24
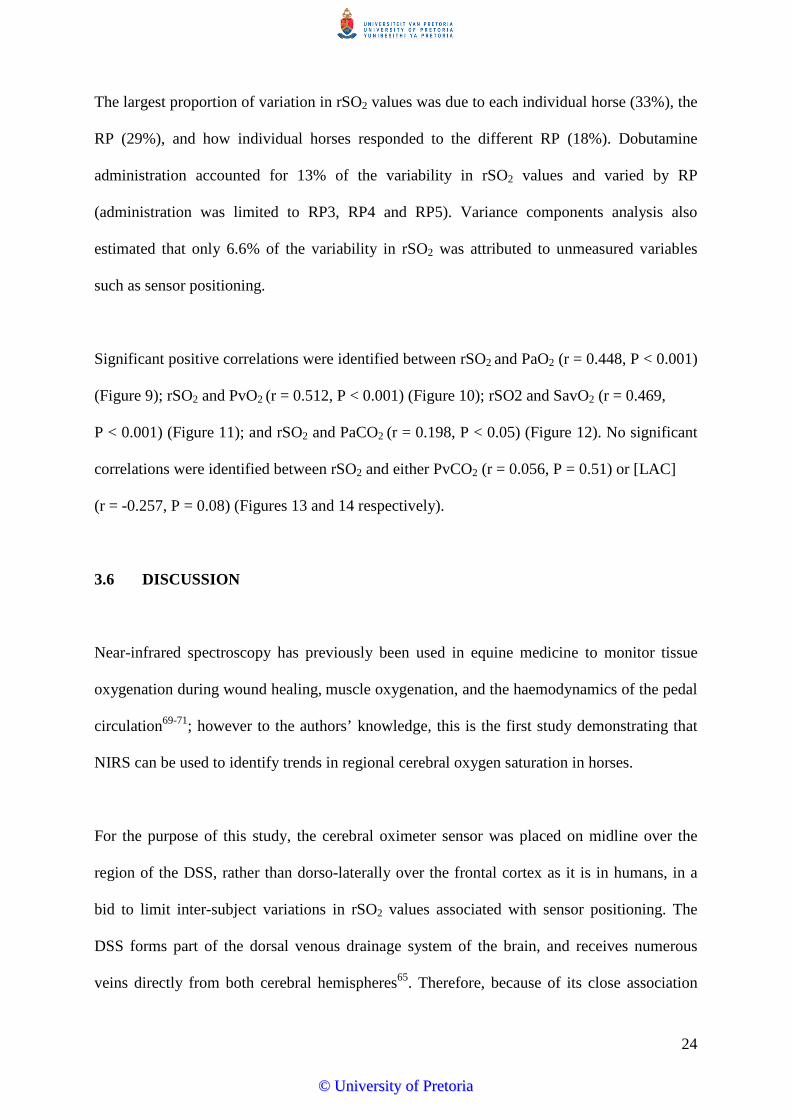
The largest proportion of variation in rSO2 values was due to each individual horse (33%), the
RP (29%), and how individual horses responded to the different RP (18%). Dobutamine
administration accounted for 13% of the variability in rSO2 values and varied by RP
(administration was limited to RP3, RP4 and RP5). Variance components analysis also
estimated that only 6.6% of the variability in rSO2 was attributed to unmeasured variables
such as sensor positioning.
Significant positive correlations were identified between rSO2 and PaO2 (r = 0.448, P < 0.001)
(Figure 9); rSO2 and PvO2 (r = 0.512, P < 0.001) (Figure 10); rSO2 and SavO2 (r = 0.469,
P < 0.001) (Figure 11); and rSO2 and PaCO2 (r = 0.198, P < 0.05) (Figure 12). No significant
correlations were identified between rSO2 and either PvCO2 (r = 0.056, P = 0.51) or [LAC]
(r = -0.257, P = 0.08) (Figures 13 and 14 respectively).
3.6 DISCUSSION
Near-infrared spectroscopy has previously been used in equine medicine to monitor tissue
oxygenation during wound healing, muscle oxygenation, and the haemodynamics of the pedal
circulation69-71; however to the authors’ knowledge, this is the first study demonstrating that
NIRS can be used to identify trends in regional cerebral oxygen saturation in horses.
For the purpose of this study, the cerebral oximeter sensor was placed on midline over the
region of the DSS, rather than dorso-laterally over the frontal cortex as it is in humans, in a
bid to limit inter-subject variations in rSO2 values associated with sensor positioning. The
DSS forms part of the dorsal venous drainage system of the brain, and receives numerous
veins directly from both cerebral hemispheres65. Therefore, because of its close association
©© UUnniivveerrssiittyy ooff PPrreettoorriiaa

25
with the cerebrum, as well as its proximity to an easily accessible region of the skull, the DSS
was considered an appropriate anatomical location from which to try and record rSO2 values.
A normal baseline rSO2 value in an adult human is considered to be approximately 70%,
which is considerably higher than those recorded in 4 out of 6 horses in this study (Table 2);
however values ranging from 45-90% have been reported in human patients51,59. The reason
for the lower rSO2 values observed in the majority of horses may be attributable to the fact
that horses have an increased skin and skull thickness compared to humans, as these factors
have been shown to have a major effect on the intensity of infra-red light detected, and hence
the calculated rSO2 value72.
The influence of pigmented skin on NIRS recordings should also be considered, despite
receiving little attention in the medical literature. Near-infrared spectroscopy relies on the
principle that light, at a wavelength 650 – 1000 nm, passes readily through skin and
subcutaneous tissue however is absorbed by chromophores such as Hb, cytochrome oxidase
and melanin73. Given this phenomenon, it would seem that the degree of skin pigmentation
would have a significant effect on the reported rSO2 value, in that the darker and more
pigmented the skin, the more the NIRS signal would be impeded. Wassenaar et al. (2005)
reported a loss of signal when using NIRS on human patients with very dark skin; however
the sample size was deemed too small to quantify the effect73. Alternatively, in a study
performed on calf skulls, no significant difference in NIRS signal was observed when the
probe was placed over black or white skin, nor was there a detectable difference in rSO2
values when the skin was removed from the skull74. In the present study, NIRS was used to
identify trends in rSO2, rather than absolute values. Consequently, each mare acted as her own
©© UUnniivveerrssiittyy ooff PPrreettoorriiaa

26
control, thereby eliminating any potentially confounding effect caused by differences in skin
pigmentation.
An rSO2 value less than 50% or a relative decrease of ≥ 20% compared to pre-induction
baseline values is considered clinically significant, and has been associated with focal cerebral
ischaemia in human patients12,36,51. Decreasing rSO2 values are thought to reflect shifts in the
delicate balance between cerebral O2 supply and demand, suggestive of cerebral hypoxia; and
indicate the need for interventions aimed at improving cerebral perfusion33,53. Similarly,
keeping rSO2 values ≥ 75% of the pre-induction baseline value has been associated with a
decreased incidence of post-operative neurological outcomes and shorter hospital stays12,33.
In the present study, 4 out of 6 horses had pre-induction baseline rSO2 values < 50%, and all
horses except for Horse 6 had a ≥ 20% decrease in baseline rSO2 during the period
immediately post-recovery (RP7) (Table 2). Despite this, each horse recovered uneventfully,
taking a minimum of 1 attempt (Horses 1, 2, 4, 5 and 6) and a maximum of 3 attempts to
stand (Horse 3). Obvious neurological deficits were not observed in any horse during the
immediate post-anaesthetic period, or the 24 h following recovery which could suggest that
horses are able to tolerate lower levels of cerebral oxygen saturation without gross deleterious
consequences. It is currently unknown at which rSO2 value cerebral oxygen desaturation
occurs in horses, hence there are no guidelines to indicate a need for intervention as there is in
human medicine. Correlating recovery scores and post-anaesthetic neurological status with
intra-operative and recovery rSO2 values was beyond the scope of this study, however should
be considered in the future to provide information that may be used to devise equine-
appropriate intervention protocols.
©© UUnniivveerrssiittyy ooff PPrreettoorriiaa

27
The significant differences identified between baseline and post-anaesthetic rSO2 values are
most likely attributable to a combination of three key factors: 1) impairment of pulmonary gas
exchange occurring as a result of general anaesthesia and lateral recumbency; 2) differences
in the oxygen saturation of Hb (SaO2) during those recording periods; and 3) an increase in
tissue metabolic rate during the recovery period.
It is widely accepted that general anaesthesia and recumbency results in ventilatory
compromise in horses, predominantly due to ventilation/perfusion (V/Q) mismatch; however
anaesthetic agent-induced respiratory depression, restricted thoracic expansion of the
dependant lung region and a decrease in functional residual lung capacity are also
contributing factors24,75-77. In recumbent horses the non-dependant lung is preferentially
ventilated, resulting in maldistribution of inspired gas, whereas the dependant lung is more
adequately perfused, even if intermittent positive pressure ventilation is used in combination
with oxygen-rich gas76-78. Consequently, inappropriate perfusion of ventilated alveoli occurs,
along with increasing differences in alveolar-arterial oxygen partial pressure gradients and
subsequent right-to-left intrapulmonary shunting75-77.
In this study, despite being positioned in lateral recumbency, arterial oxygen tensions and Hb
oxygen saturations remained above 200mmHg and 99% respectively, for the duration of the
anaesthetic period, mostly likely due to the administration of 100% oxygen. Following
discontinuation of mechanical ventilation and endotracheal administration of 100% oxygen
however, mean PaO2 values were observed to decrease from 340.8 ± 76.0 mmHg to 62.3 ±
22.2 mmHg (Table 1). Hypoxaemia (PaO2 < 60 mmHg) occurs frequently in the immediate
post-anaesthetic period regardless of body position or PaO2 recorded during anaesthesia, as a
result of the abrupt change in fraction of inspired oxygen (FiO2), from 1 to 0.2176,79.
©© UUnniivveerrssiittyy ooff PPrreettoorriiaa
28
Moreover, hypoventilation occurring as a result of residual anaesthetic agent-induced CNS
depression, will contribute to the lowered PaO2 values seen during recovery76.
The primary aim of oxygen supplementation during the initial recovery phase is to maximise
Hb saturation, as delivery of oxygen to the tissues is largely dependant on Hb concentration
and saturation80,81. In the present study, despite the administration of O2 at 15 L/min, SaO2
decreased markedly from 99.8% during RP5, to 93.4% and 95.7% during RPs 6 and 7
respectively. Unsurprisingly, a similar decrease in SavO2 was also noted during the recovery
periods, with the lowest value being recorded during RP7 (63.8 ± 7.3%). As Hb saturation is
an important factor in determining rSO2, the decrease in Hb oxygen saturation observed
during the initial recovery period (RPs 6 and 7) is likely to have played a role in the
generation of lower rSO2 values.
Near-infrared spectroscopy relies on the principle that the absorbance spectrum of Hb is
dependent on its oxygenation status, whereby deoxygenated Hb absorbs less infrared light
than oxygenated Hb55. Therefore, a positive correlation between rSO2 and SavO2 was to be
expected. As SavO2 is calculated using the ratio 25% SaO2:75% SvO2 however, it is not
surprising that a stronger correlation was not reported, given that the cerebral oximeter sensor
was placed over a venous sinus, through which the venous component of blood is > 75%.
It has been well described in human medicine that whole-brain metabolism decreases
substantially during general anaesthesia82,83. Sokoloff (1981) reported that local energy
metabolism in cerebral tissue is closely linked to the degree of functional activity84; therefore
it can be surmised that the less neuronal activity present, the lower the metabolic requirement.
Regional cerebral metabolic requirement, defined as the product of regional cerebral blood
©© UUnniivveerrssiittyy ooff PPrreettoorriiaa

29
flow and cerebral arterio-venous oxygen content difference, has been reported to decrease by
up to 51% during isoflurane anaesthesia83. As a consequence of reduced cerebral metabolism,
regional oxygen extraction will decrease proportionately, resulting in increased PvO2, SavO2
and subsequently rSO2 values, as was demonstrated during RPs 3, 4 and 5 (Figure 1).
Alternatively, during recovery from general anaesthesia the metabolic rate of tissues, along
with oxygen extraction at the tissue level increases76, which is likely to have contributed to
the decrease in PvO2 and rSO2 values observed during RPs 6 and 7 (Figure 1).
Cerebral autoregulation is an important homeostatic mechanism which acts to minimise
alterations in CBF following changes in CPP, through vasomotor effectors that control
cerebrovascular resistance25. As a result, this regulatory function ensures that blood flow and
oxygen delivery are adequately matched with the metabolic demands of the cerebral tissue28.
Both hypercapnoea and the use of inhaled anesthetic agents, including isoflurane, are reported
to have a direct, dose-dependant dilatory effect on the cerebral vasculature resulting in an
increase in CBF yet impaired CA25,85. Interestingly however, in a study performed on healthy
horses, Brosnan et al. 2011 demonstrated that CA was preserved during isoflurane
anaesthesia, suggesting that inhalation anaesthetic dose effects on CA are considerably
different to those previously reported in humans28. This preservation of CA may therefore
explain why no significant differences were observed between baseline (RP1) rSO2 values
and those recorded during general anaesthesia (RPs 3, 4 and 5).
Hypercapnoea (PaCO2 > 50 mmHg) is frequently encountered during equine general
anaesthesia, predominantly due to the respiratory depression and subsequent hypoventilation
caused by inhalation agents used for maintenance86. Although originally thought to be
©© UUnniivveerrssiittyy ooff PPrreettoorriiaa

30
detrimental, mild to moderate hypercapnoea (PaCO2 = 50-65 mmHg) has been shown to
improve arterial blood pressure and cardiac output due to an increased CO2-induced
sympatho-adrenal response29,68,86. Khanna et al. (1995) also reported a significant increase in
both Hb and haematocrit during periods of moderate and severe hypercapnoea (PaCO2 = 75 -
85 mmHg and > 95 mmHg respectively), in response to increased sympathetic nervous
system activity29, which may result in improved O2 delivery to tissues. As expected, during
the period of induced hypercapnoea (RP4) a trend of increasing rSO2 values was observed,
compared to those measured in the awake, standing horse (RP1). However, this increase did
not reach statistical significance, most likely due to the fact that only a mild state of
hypercapnoea was achieved (mean 55.5 ± 3.3 mmHg), as well as the small study population.
Rectal temperatures were measured during each recording period at the same time in which
blood was collected for arterial and venous blood gas analyses to allow for temperature
correction. During RP1, 2 and 8 the rectal temperatures of all 6 horses were within the range
of 36.5 - 38.1°C. During the anaesthetic periods (RP3-5) recorded rectal temperatures ranged
from 35.6 - 37.5°C; and from 35.1 - 36.6°C during the recovery periods (RP6-7) (Appendix
2).
A decrease in body temperature causes a shift of the oxygen-haemoglobin dissociation curve
to the left, resulting in decreased release of oxygen bound to haemoglobin and a subsequent
decrease in oxygen delivery to the tissues86. Haemoglobin-oxygen saturation remains high
however, despite a decrease in PO286. Calculated values for SavO2 are therefore not affected
by temperature, however, temperature-corrected values for PaO2, PvO2, PaCO2 and PvCO2
will differ slightly compared to those reported at 37°C, as was observed in the current study
(Table 4).
©© UUnniivveerrssiittyy ooff PPrreettoorriiaa

31
In dogs, severe hypothermia (T = 29.08°C) has been shown to result in marked decreases in
CBF, MAP, and cerebral metabolic rate of O2, along with an increase in CVR87; all of which
will affect calculated rSO2 values. In the present study only mild hypothermia was observed,
with a minimum rectal temperature of 35.1°C being recorded during the recovery period. It is
possible however, that even this small decrease in temperature may have contributed to the
lower rSO2 values recorded during this time, as a consequence of altered CBF and CVR.
Results of this study are in agreement with what is reported in humans, whereby rSO2 values
are significantly correlated with venous oxygen tensions88. In human medicine it is generally
accepted that the venous portion of blood predominates in the cerebral tissue and as a result
rSO2 values are largely reflective of venous oxygenation8,38,59. Jugular bulb venous oxygen
saturations (SjO2) have been used to provide global estimates of cerebral oxygen extraction in
human medicine, and a significant correlation between SjO2 and rSO2 values was identified in
children with congenital cardiac abnormalities89. Similarly, significant correlations between
central venous oxygen saturations, obtained from the right atria or superior vena cava, and
rSO2 have also been reported90. As jugular venous oxygen tensions and rSO2 values are
measurements of regionally different entities, close agreement between the 2 parameters is not
necessarily expected. Given their relationship however, it is feasible to expect that a change in
jugular PvO2 will be paralleled by a change in rSO2, as was observed in the present study
(Figure 8).
All horses included in the study received the positive inotropic agent dobutamine, for a period
of time ranging between 15-60 min during general anaesthesia, in order to maintain MAP
above 60 mmHg; however despite this, MAP values measured during RPs 3, 4 and 5 were
significantly lower than those recorded during RPs 1 and 2 (Table 1). This can be explained
©© UUnniivveerrssiittyy ooff PPrreettoorriiaa

32
through the dose-dependant hypotension secondary to peripheral vasodilation, and decrease in
cardiac output, caused by the administration of isoflurane29,68. The administration of
dobutamine, a β1-adrenoreceptor agonist, has been shown to have little direct effect on
cerebral haemodynamics; however increasing MAP through the use of a β-sympathomimetic
will result in an increase in CPP91. As demonstrated by Brosnan et al. (2011), CA is preserved
in horses during isoflurane-anaesthetic thus CBF remains constant, despite an increase in
CPP28. Therefore, it is unlikely that the administration of dobutamine will influence rSO2
values recorded during general anaesthesia.
The presented results of this study should be evaluated in light of a number of potential
limitations. Firstly, there is no “gold-standard” for the validation of rSO2 values. In human
medicine there is also a lack of a “gold-standard”; instead, measurements of jugular bulb
oxygen saturations have been used as a means of assessing global cerebral oxygenation, and
to compare with rSO2 values for the purpose of cerebral oximeter validation89,92. Attempts to
recreate this method were made in the present study by catheterising the external jugular vein
in a retrograde manner, in order to sample venous blood from as close to the brain as possible.
Secondly, the subtraction algorithm used by the cerebral oximeter to calculate rSO2 was
designed for human patients and is based on the assumption that 75% of cerebral blood flow
is venous8,89. In the present study the sensor was placed over the region of the DSS through
which venous blood flow is greater than 75%, potentially invalidating the algorithm.
It is generally accepted that the thickness of a horse’s skin and skull is greater than that of a
human. Okada and Delpy (2003) reported that superficial tissue (skin and skull) and
cerebrospinal fluid thickness had a significant effect on the intensity of light detected by the
©© UUnniivveerrssiittyy ooff PPrreettoorriiaa

33
spectrophotometer; that is, the thicker the skull the less near-infrared light detected and the
lower the calculated rSO2 value72. Therefore, if the horses’ skull is thicker than that of a
human at the level of the sensor, increased extracerebral attenuation of near-infrared light may
occur, resulting in the recording of lower rSO2 values.
The small sample size used in this study is also considered to be a limitation. However, a 2-
sample t test performed post hoc demonstrated that a sample size of 6 was adequate to detect
a difference of at least 10% in rSO2 values between recording periods, for a statistical test
with a minimum of 80% power. Also, in a number of other reports describing the use of NIRS
in horses, a sample size of no more than 6 was used69-71.
3.7 CONCLUSION
In conclusion, this study demonstrates that near-infrared spectroscopy can be used to identify
trends in regional oxygen saturation in horses. A positive correlation between rSO2 and PvO2
was also identified, suggesting that changes in regional cerebral oxygenation may be reflected
in PvO2 obtained from the jugular vein. Future studies involving larger numbers of horses
need to be performed, to determine: 1) the usefulness of NIRS as a neuromonitoring tool in
horses and 2) whether rSO2 values recorded during general anaesthesia influences a horse’s
recovery.
©© UUnniivveerrssiittyy ooff PPrreettoorriiaa

34
Figures and Tables
©© UUnniivveerrssiittyy ooff PPrreettoorriiaa
35
Figure 1: The INVOS® 5100C Cerebral/Somatic Oximeter disposable sensor
incorporates a light-emitting diode (white arrow) and two light-collecting optodes (black
arrows). The optodes are set at a fixed distance of 3 cm and 4 cm from the light-emitting
diode in order to collect readings from the extracerebral tissue, as well as the cortical
and intracerebral structures respectively.
©© UUnniivveerrssiittyy ooff PPrreettoorriiaa

36
Figure 2: The INVOS® 5100C Cerebral/Somatic Oximeter system consists of a display
monitor, 2- or 4-channel preamplifier, sensor cables and disposable sensors. The
monitor is capable of displaying rSO2 values (arrows) obtained from a maximum of 4
sensors at any one time. Generally 2 cerebral sensors are utilised in human patients,
positioned to receive readings from the left and right cerebral cortices (inset); with the
somatic (S) sensors being used concurrently if required.
1) INVOS® 5100C Cerebral/Somatic Oximeter monitor
2) 4-channel pre-amplifier
3) Sensor cables
4) Disposable adult sensors
www.ebme.co.uk
www.vitalsguy.com
©© UUnniivveerrssiittyy ooff PPrreettoorriiaa

37
Figure 3: The 2-channel INVOS® 5100C Cerebral/Somatic Oximeter monitor displaying
both the updated rSO2 value (white block arrow) and baseline rSO2 value (black arrow).
The monitor also displays the trend in recorded rSO2 (blue arrow) and the near-
infrared signal strength (white arrow).
©© UUnniivveerrssiittyy ooff PPrreettoorriiaa

38
Figure 4: An equine cadaver skull demonstrating the anatomical location of the dorsal
venous sinuses of the dura mater (black box) along with their subsequent
communication with the veins of the head. The frontal bone, zygomatic process, body of
the maxilla and the brain have been removed to allow visualisation of the vascular
structures.
©© UUnniivveerrssiittyy ooff PPrreettoorriiaa
39
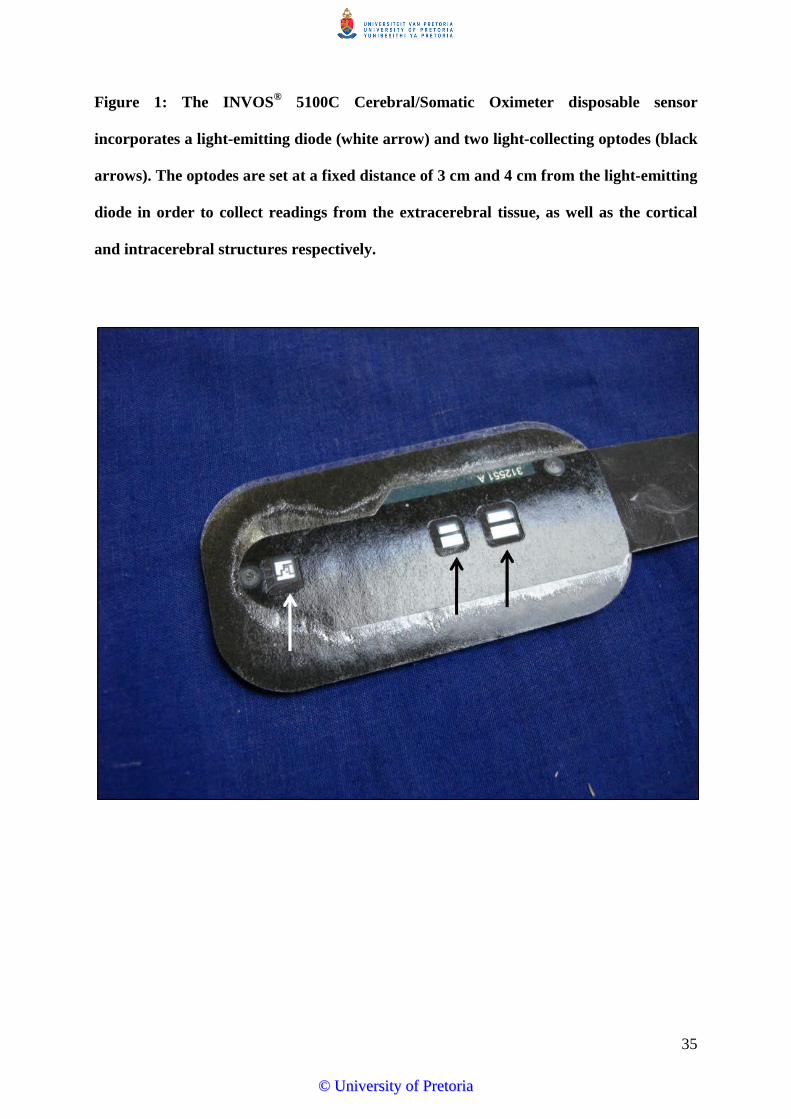
Figure 5: Close-up photograph of the area outlined in Figure 4 demonstrating the
anatomy of the dorsal venous sinuses of the dura mater. As the dorsal sagittal sinus runs
caudally, it joins the rectus sinus before terminating and splitting into the transverse
sinus. The transverse sinus lies in a transverse plane and joins the dorsal petrosal sinus
before entering the temporal meatus and joining the temporal sinus.
1) Dorsal sagittal sinus
2) Rectus sinus
3) Transverse sinus
4) Dorsal petrosal sinus
5) Temporal sinus
©© UUnniivveerrssiittyy ooff PPrreettoorriiaa

38
Figure 6: Positioning of the INVOS® 5100C Cerebral/Somatic Oximeter sensor on a standing horse in relation to the dorsal sagittal
sinus. a) The sensor is placed on midline, 1cm above the zygomatic process (red solid line). The red dashed lines demonstrate the position
of the 2 light-collecting optodes (inset, arrow), which receive absorption data from the cerebral and extra-cerebral tissue. b) Anatomy of
the dorsal venous sinus system of the brain. The solid orange line indicates the position of the oximeter sensor. Modified from Kramer et
al. (2007)46 © 2007 by The American College of Veterinary Surgeons.
40
©© UUnniivveerrssiittyy ooff PPrreettoorriiaa
41
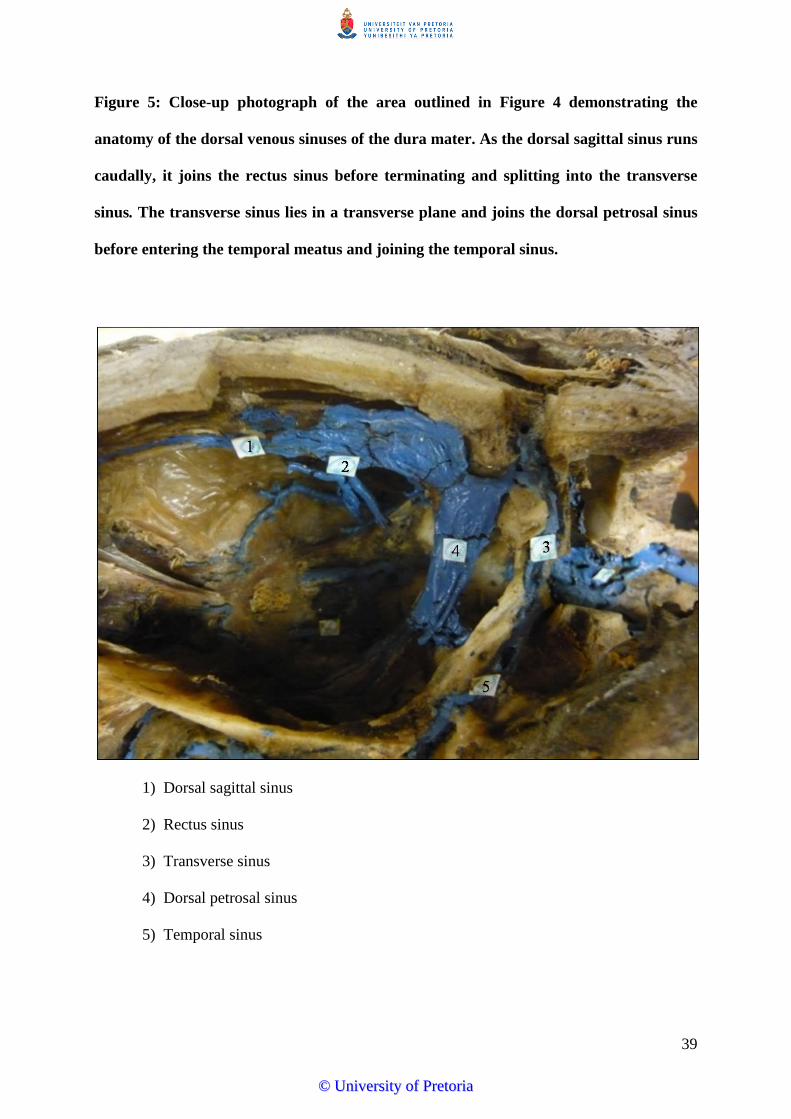
Figure 7: The INVOS® 5100C Cerebral/Somatic Oximeter being used in a horse under
general anaesthesia. The 2-channel oximeter monitor allows for the concurrent use of
cerebral (C) and somatic (S) sensors however for the purpose of this study, only the
cerebral sensor was used. The updated rSO2 values are displayed on the upper half of
the monitor, corresponding with the cerebral sensor (C) channel. Note how the sensor
has been covered with black duct tape to limit external light interference.
©© UUnniivveerrssiittyy ooff PPrreettoorriiaa

42
Figure 8: Mean ± s.e. values for regional cerebral oxygen saturation (rSO2), arterial and
venous oxygen tensions (PaO2 and PvO2) and arteriovenous oxygen saturations (SavO2).
Cerebral rSO2 and SavO2 values are reported as % (left y-axis), whilst PaO2 and PvO2
values are recorded in mmHg (right y-axis).
©© UUnniivveerrssiittyy ooff PPrreettoorriiaa

43
Figure 9: Scatter plot of PaO2 versus rSO2 values recorded from each of the 6 horse
during the 8 recording periods. A significant moderate positive correlation was
identified (r = 0.448, P < 0.001).
©© UUnniivveerrssiittyy ooff PPrreettoorriiaa

44
Figure 10: Scatter plot of PvO2 versus rSO2 values recorded from each of the 6 horses
during the 8 recording periods. A significant moderate positive correlation was
identified (r = 0.512, P < 0.001).
©© UUnniivveerrssiittyy ooff PPrreettoorriiaa

45
Figure 11: Scatter plot of SavO2 versus rSO2 values recorded from each of the 6 horses
during the 8 recording periods. A significant moderate positive correlation was
identified (r = 0.469, P < 0.001).
©© UUnniivveerrssiittyy ooff PPrreettoorriiaa

46
Figure 12: Scatter plot of PaCO2 versus rSO2 values recorded from each of the 6 horses
during the 8 recording periods. A significant weak positive correlation was identified
(r = 0.198, P < 0.05).
©© UUnniivveerrssiittyy ooff PPrreettoorriiaa

47
Figure 13: Scatter plot of PvCO2 versus rSO2 values recorded from each of the 6 horses
during the 8 recording periods. No significant correlation was identified (r = 0.056,
P = 0.51).
©© UUnniivveerrssiittyy ooff PPrreettoorriiaa

48
Figure 14: Scatter plot of [LAC] versus rSO2 values recorded from each of the 6 horses
during the 8 recording periods. No significant correlation was identified (r = -0.257,
P = 0.08).
©© UUnniivveerrssiittyy ooff PPrreettoorriiaa

49
Table 1: Description of each recording period (RP) conducted.
RP Description
1 Normal standing horse, 60 min following sedation with xylazinea
2 Standing sedated horse, 5 min following sedation with romifidinej
3 General anaesthesia: normocapnoea, following 5 min stabilisation at
PaCO2 = 40-50 mmHg
4 General anaesthesia: hypercapnoea, following 5 min stabilisation at
PaCO2 = 50-60 mmHg
5 General anaesthesia: hypocapnoea, following 5 min stabilisation at
PaCO2 = 25-35 mmHg
6 Following disconnection from isoflurane/O2 and sedation with romifidinej,
breathing a combination of 100% O2 and room air
7 5 min post-recovery
8 2 h post-recovery
PaCO2 = arterial carbon dioxide tension
©© UUnniivveerrssiittyy ooff PPrreettoorriiaa

Table 2: Mean ± s.d. values for regional cerebral oxygen saturation (%), recorded from each of the 6 horses during each recording
period (RP).
Horse RP1 RP2 RP3 RP4 RP5 RP6 RP7 RP8
1 70.5 ± 7.24 61.3 ± 14.3 58.3 ± 0.58 58.6 ± 0.53 57.7 ± 0.58 46.3 ± 3.21* 50.7 ± 7.96* 47.1 ± 1.6*
2 43.9 ± 2.34 35.3 ± 0.99 51.0 ± 1.73 53.2 ± 1.4 60.4 ± 10.8 35.3 ± 1.8 34.1 ± 0.42* 37.7 ± 0.12
3 47.5 ± 0.76 39.3 ± 0.42 62.5 ± 0.42 61.1 ± 1.21 57.9 ± 1.7 34.7 ± 9.47* 35.6 ± 0.87* 44.8 ± 3.61
4 70.3 ± 0.7 68.1 ± 1.75 66.5 ± 2.5 73.6 ± 0.2 66.2 ± 1.06 50.3 ± 1.45* 42.4 ± 1.06* 58.1 ± 0.76
5 48.1 ± 0.42 52.7 ± 1.7 55.2 ± 0.35 55.4 ± 3.98 51.4 ± 0.4 49.2 ± 3.65 36.1 ± 0.81* 48 ± 1.91
6 46.3 ± 0.42 46.4 ± 0.4 50.5 ± 2.1 58.3 ± 0.7 53.7 ± 0.5 40.9 ± 1.1 45.4 ± 0.35 42.5 ± 0.42
RP1-8 as described in Table 1; * denotes ≥ 20% decrease compared to baseline rSO2 values recorded during RP1.
50
©© UUnniivveerrssiittyy ooff PPrreettoorriiaa

51
Table 3: Mean ± s.d. values for regional cerebral oxygen saturation (rSO2) (%), arterial and venous oxygen and carbon dioxide tensions
(PaO2, PvO2, PaCO2 and PvCO2) (mmHg), arteriovenous oxygen saturations (SavO2) (%) and mean arterial pressure (MAP) (mmHg)
recorded during each recording period (RP). Mean arterial pressures were not recorded during RP6-8.
RP rSO2 PaO2 PvO2 PaCO2 PvCO2 SavO2 MAP
1 54.44 ± 12.0ac 84.41 ± 5.22a 32.44 ± 5.08a 40.27 ± 2.66ae 44.66 ± 2.75a 69.87 ± 8.24a 110.50 ± 15.8a
2 50.52 ± 12.9ad 78.01 ± 6.34a 30.59 ± 3.85ac 41.05 ± 2.63ae 47.56 ± 2.14ab 65.56 ± 6.42ac 106.67 ± 12.8a
3 57.35 ± 6.13ae 295.53 ± 83.3b 58.23 ± 12.3bd 47.40 ± 3.04b 49.46 ± 3.23b 91.44 ± 4.30b 72.33 ± 6.13b
4 60.03 ± 6.92ce 242.78 ± 75.8c 62.41 ± 12.6b 53.78 ± 2.86c 56.82 ± 3.20c 92.55 ± 3.79b 76.17 ± 8.89b
5 57.88 ± 6.17ce 340.79 ± 76.0d 53.52 ± 11.02d 28.87 ± 1.95d 32.58 ± 2.06d 93.44 ± 3.51b 70.29 ± 7.11b
6 42.76 ± 7.46b 62.25 ± 22.2a 30.02 ± 4.95ac 39.11 ± 4.65a 47.44 ± 6.11ab 69.51 ± 7.83a -
7 40.73 ± 6.77b 70.12 ± 8.07a 25.39 ± 3.82c 41.49 ± 2.32ae 46.84 ± 4.01ab 63.78 ± 7.25c -
8 46.36 ± 6.62bd 76.21 ± 5.85a 27.87 ± 2.83ac 42.40 ± 2.22e 47.91 ± 3.55ab 65.61 ± 5.10ac -
RP1-8 as described in Table 1; differing superscript letters denote significant difference between pairs within each category (P < 0.05).
©© UUnniivveerrssiittyy ooff PPrreettoorriiaa

Table 4: Temperature-corrected and non temperature-corrected mean ± s.d. values for arterial and venous oxygen and carbon dioxide
tensions (PaO2, PvO2, PaCO2 and PvCO2) (mmHg) recorded during each recording period (RP).
RP tcPaO2 PaO2 tcPvO2 PvO2 tcPaCO2 PaCO2 tcPvCO2 PvCO2
1 84.41 ± 5.22 81.43 ± 4.44 32.44 ± 5.08 31.23 ± 5.15 40.27 ± 2.66 39.33 ± 2.58 44.66 ± 2.75 43.67 ± 2.34
2 78.01 ± 6.34 74.12 ± 6.08 30.59 ± 3.85 29.22 ± 2.98 41.05 ± 2.63 41.03 ± 3.87 47.56 ± 2.14 45.99 ± 2.29
3 295.53 ± 83.3 293.05 ± 83.0 58.23 ± 12.3 58.62 ± 13.6 47.40 ± 3.04 48.01 ± 2.89 49.46 ± 3.23 50.13 ± 3.20
4 242.78 ± 75.8 246.48 ± 74.0 62.41 ± 12.6 64.71 ± 12.0 53.78 ± 2.86 55.52 ± 3.27 56.82 ± 3.20 56.83 ± 4.29
5 340.79 ± 76.0 344.80 ± 76.2 53.52 ± 11.0 58.59 ± 12.8 28.87 ± 1.95 30.58 ± 2.57 32.58 ± 2.06 33.79 ± 2.07
6 62.25 ± 22.2 68.70 ± 19.0 30.02 ± 4.95 33.51 ± 6.95 39.11 ± 4.65 40.88 ± 5.08 47.44 ± 6.11 49.83 ± 6.77
7 70.12 ± 8.07 75.80 ± 9.32 25.39 ± 3.82 27.67 ± 3.64 41.49 ± 2.32 43.67 ± 2.45 46.84 ± 4.01 49.36 ± 3.14
8 76.21 ± 5.85 76.54 ± 5.47 27.87 ± 2.83 27.97 ± 2.40 42.40 ± 2.22 42.56 ± 2.73 47.91 ± 3.55 48.42 ± 3.56
RP1-8 as described in Table 1; tc = temperature-corrected
52
©© UUnniivveerrssiittyy ooff PPrreettoorriiaa

53
References
1. YOUNG, S.S., TAYLOR, P.M. Factors influencing the outcome of equine anaesthesia: a
review of 1,314 cases. Equine Veterinary Journal 1993; 25: 147-151.
2. JOHNSTON, G.M., TAYLOR, P.M., HOLMES, M.A., WOOD, J.L.N. Confidential
enquiry into perioperative equine fatalities (CEPEF-1): preliminary results. Equine
Veterinary Journal 1995; 27: 193-200.
3. JOHNSTON, G.M., EASTMENT, J.K., WOOD, J.L.N., TAYLOR, P.M. The confidential
enquiry into perioperative equine fatalities (CEPEF): mortality results of Phases 1 and 2.
Veterinary Anaesthesia and Analgesia 2002; 29: 159-170.
4. PROUDMAN, C.J., DUGDALE, A.H.A., SENIOR, J.M., EDWARDS, G.B., SMITH,
J.E., LEUWER, M.L., FRENCH, N.P. Pre-operative and anaesthesia-related risk factors
for mortality in equine colic cases. The Veterinary Journal 2006; 171: 89-97.
5. BIDWELL, L.A., BRAMLAGE, L.R., ROOD, W.A. Equine perioperative fatalities
associated with general anaesthesia at a private practice – a retrospective case series.
Veterinary Anaesthesia and Analgesia 2007; 34: 23-30.
6. BRODBELT, D. Perioperative mortality in small animal anaesthesia. The Veterinary
Journal 2009; 182: 152-161.
7. DONALDSON, L.L., DUNLOP, G.S., HOLLAND, M.S., BURTON, B.A. The recovery
of horses from inhalant anesthesia: a comparison of halothane and isoflurane. Veterinary
Surgery 2000; 29: 92-101.
8. HONG, S.W., SHIM, S.W., CHOI, Y.S., KIM, D.H., CHANG, B.C., KWAK, Y.L.
Prediction of cognitive dysfunction and patients’ outcome following valvular heart
surgery and the role of cerebral oximetry. European Journal of Cardiothoracic Surgery
2008; 33: 560-565.
9. MURKIN, J.M. Applied neuromonitoring and improving CNS outcomes. Seminars in
Cardiothoracic and Vascular Anesthesia. 2005; 9: 139-142.
10. CHAKRAVARTI, S., SRIVASTAVA, S., MITTNACHT, A. Near infra-red spectroscopy
(NIRS) in children. Seminars in Cardiothoracic and Vascular Anesthesia 2008; 12: 70-79.
11. NELSON, D., ANDROPOULOS, D., FRASER, C. Jr. Perioperative neuroprotective
strategies. Seminars in Thoracic and Cardiovascular Surgery: Pediatric Cardiac Surgery
Annual 2008; 49-56. Review.
©© UUnniivveerrssiittyy ooff PPrreettoorriiaa

54
12. GUARRANCINO, F. Cerebral monitoring during cardiovascular surgery. Current
Opinions in Anesthesiology 2008; 21: 50-54.
13. EDMONDS, H.L. Jr. Protective effect of neuromonitoring during cardiac surgery. Annals
of the New York Academy of Sciences 2005; 1053: 12-19.
14. BROSNAN R.J., LECOUTEUR, R. A., STEFFEY, E. P., IMAI, A., KORTZ, G. Direct
measurement of intracranial pressure in horses. American Journal of Veterinary Research
2002; 63: 1252-1256.
15. CARY, J.A., HELLYER, P.W. Anesthesia case of the month. Evaluation and treatment of
suspected squamous cell carcinoma of the third eyelid. Journal of the American
Veterinary Medical Association 2002; 221: 790-792.
16. JOUBERT, K.E., DUNCAN, N., MURRAY, S.E. Post-anaesthetic myelomalacia in a
horse Journal of the South African Veterinary Association 2005; 76: 36-39.
17. SPADAVECCHIA, C., JAGGY, A., FATZER, R., SCHATZMANN, U. Postanaesthetic
cerebral necrosis in a horse. Equine Veterinary Journal 2001; 33: 621-624.
18. MCKAY, J.S., FOREST, T.W., SENIOR, M., KELLY, D.F., JONES, R.S., DE
LAHUNTA, A., SUMMERS, B.A. Postanaesthetic cerebral necrosis in five horses. The
Veterinary Record 2002; 150: 70-74.
19. AUCKBURALLY, A., FLAHERTY, D. Recovery from anaesthesia in horses 1. What can
go wrong? In Practice 2009; 31: 340-347.
20. WHITEHAIR, K.J., STEFFEY, E.P., WILLITS, N.H., WOLINER, M.J. Recovery of
horses from inhalation anesthesia. American Journal of Veterinary Research 1993; 54:
1693-1702.
21. MATTHEWS, N.S., MILLER, S.M., HARTSFIELD, S.M., SLATER, M.R. Comparison
of recoveries from halothane vs isoflurane anesthesia in horses. Journal of the American
Veterinary Medical Association 1992; 201: 559-563.
22. ROBERTSON, S.A., BAILEY, J.E. Aerosolized salbutamol (albuterol) improves PaO2 in
hypoxaemic anaesthetized horses - a prospective clinical trial in 81 horses. Veterinary
Anaesthesia and Analgesia 2002; 29: 212-218.
23. NYMAN, G., FUNKQUIST, B., KVART, C., FROSTELL, C., TOKICS, L.,
STRANDBERG, A., LUNDQUIST, H., LUNDH, B., BRISMAR, B., HEDENSTIERNA,
G. Atelectasis causes gas exchange impairment in the anaesthetised horse. Equine
Veterinary Journal 1990; 22: 317-324.
©© UUnniivveerrssiittyy ooff PPrreettoorriiaa

55
24. WETTSTEIN, D., MOENS, Y., JAEGGIN-SCHMUCKER, N., BÖHM, S.H., ROTHEN,
H.U., MOSING, M., KASTNER, S.B.R., SCHATZMANN, U. Effects of an alveolar
recruitment manoeuvre on cardiovascular and respiratory parameters during total
intravenous anesthesia in ponies. American Journal of Veterinary Research 2006; 67:
152-159.
25. MCCULLOUGH, T.J., VISCO, E., LAM, A.M. Graded hypercapnia and cerebral
autoregulation during sevoflurane or propofol anesthesia. Anesthesiology 2000; 93: 1205-
1209.
26. AASLID, R., LINDEGAARD, K.F., SORTEBERG, W., NORNES, H. Cerebral
autoregulation dynamics in humans. Stroke 1989; 20: 45-52.
27. MCCULLOUGH, T.J., BOESEL, T.W., LAM, A.M. The effect of hypocapnia on the
autoregulation of cerebral blood flow during administration of isoflurane. Anesthesia and
Analgesia 2005; 100: 1463-1467.
28. BROSNAN, R.J., STEFFEY, E.P., LECOUTEUR, R.A., ESTELLER-VICO, A.,
VAUGHAN, B., LIU, I.K. Effects of isoflurane anesthesia on cerebrovascular
autoregulation in horses. American Journal of Veterinary Research 2011; 72: 18-24.
29. KHANNA, A.K., MCDONNEL, W.N., DYSON, D.H., TAYLOR, P.M. Cardiopulmonary
effects of hypercapnia during controlled intermittent positive pressure ventilation in the
horse. Canadian Journal of Veterinary Research 1995; 59: 213-221.
30. CURLEY, G., KAVANAGH, B., LAFFEY, J. Hypocapnia and the injured brain: More
harm than benefit. Critical Care Medicine 2010; 38: 1348-1359.
31. MCPHERSON, R.W., TRAYSTMAN, R.J. Effects of isoflurane on cerebral
autoregulation in dogs. Anesthesiology 1988; 69: 493-499.
32. EDMONDS, H., WIDMAN, R. Explaining “false positive” desaturation periods during
surgery. INVOS® Cerebral Oximeter Clinical White Paper Series 2004; 311: 1-4.
33. YAO, F.S., LEVIN, S.K., WU, D., ILLNER, P., YU, J., HUANG, S.W., TSENG, C.C.
Maintaining cerebral oxygen saturation during cardiac surgery shortened ICU and hospital
stays. Anesthesia and Analgesia 2001; 92: SCA86.
34. PEDERSEN, T., JENSEN, J.S., RISBO, A., HENRIKSEN, E. Prediction of severe
postoperative complications in patients admitted to neuroanaesthesia. Acta
Anaesthesiologica Scandinavica 1988; 32: 681-685.
35. MONK, T.G., RENO, K.A., OLSEN, D.C., KONEY-LARYEA, D. Postoperative
cognitive dysfunction is associated with cerebral oxygen desaturation. Anesthesiology
2000; 93: A167.
©© UUnniivveerrssiittyy ooff PPrreettoorriiaa

56
36. WILLIAMS, G., RAMAMOORTHY, C. Brain monitoring and protection during pediatric
cardiac surgery. Seminars in Cardiothoracic and Vascular Anesthesia 2007; 11: 23-33.
37. JOHNSON, B., CHANG, A. Near-infrared spectroscopy and tissue oxygenation: the
unremitting request for the holy grail. Pediatric Critical Care Medicine 2008; 9: 123-124.
38. SLOAN, M.A. Prevention of ischaemic neurological injury with intraoperative monitoring
of selected cardiovascular and cerebrovascular procedures: roles of
electroencephalography, somatosensory evoked potentials, transcranial Doppler and near-
infrared spectroscopy. Neurology Clinics 2006; 24: 631-645.
39. CASATI, A., FANELLI, G., PIETROPAOLI, P., PROIETTI, R., TUFANO, R.,
DANELLI, G., FIERRO, G., DE COSMO, G., SERVILLO, G. Continuous monitoring of
cerebral oxygen saturation in elderly patients undergoing major abdominal surgery
minimizes brain exposure to potential hypoxia. Anesthesia and Analgesia 2005; 101: 740-
747.
40. KAISTI, K.K., LÄNGSJÖ, J.W., AALTO, S., OIKONEN, V., SIPILÄ, H., TERÄS, M.,
HINKKA, S., METSÄHONKALA, L., SCHEININ, H. Effects of sevoflurane, propofol,
and adjunct nitrous oxide on regional cerebral blood flow, oxygen consumption and blood
volume in humans. Anesthesiology 2003; 99: 603-613.
41. FIGAJI, A.A., ZWANE, E., THOMPSON, C., FIEGGEN, A.G., ARGENT, A.C., LE
ROUX, P.D., PETER, J.C. Brain tissue oxygen tension monitoring in pediatric severe
traumatic brain injury. Childs Nervous System 2009; 25: 1335-1343.
42. CHEN, J.W., ROGERS, S.L., GOMBART, Z.J., ADLER, D.E., CECIL, S.
Implementation of cerebral microdialysis at a community-based hospital: A 5-year
retrospective analysis. Surgical Neurology International 2012; 3: 57.
43. PADAYACHY, L.C., FIGAJI, A.A., BULLOCK, M.R. Intracranial pressure monitoring
for traumatic brain injury in the modern era. Childs Nervous System 2010; 26: 441-452.
44. RABOEL, P.H., BARTEK, J., ANDRESEN, M., BELLANDER, B.M., ROMNER, B.
Intracranial pressure monitoring: Invasive versus non-invasive methods – A review.
Critical Care Research and Practice 2012 (2012).
45. LI, C., WU, P., WU, Z., AHN, C.H., HARTINGS, J.A., NARAYAN, R.K. Smart
catheter flow sensor for continuous regional cerebral blood flow monitoring. Sensors
2011; IEEE Conference Proceedings: 1417-1420.
46. VAJKOCZY, P., HORN, P., THOMÉ, C., MUNCH, E., SCHMIEDEK, P. Regional
cerebral blood flow monitoring in the diagnosis of delayed ischemia following aneurismal
subarachnoid hemorrhage. Journal of Neurosurgery 2003; 98: 1227-1234.
©© UUnniivveerrssiittyy ooff PPrreettoorriiaa

57
47. VAJKOCZY, P., ROTH, H., HORN, P., LUCKE, T., THOMÉ, C., HUBNER, U.,
MARTIN, G.T., ZAPPLETAL, C., KLAR, E., SCHILLING, L., SCHMIEDEK, P.
Continuous monitoring of regional cerebral blood flow: experimental and clinical
validation of a novel thermal diffusion microprobe. Journal of Neurosurgery 2000; 93:
265-274.
48. ALLEN, B.B., HOFFMAN, C.E., TRAUBE, C.S., WEINSTEIN, S.L., GREENFIELD,
J.P. Continuous brain tissue oxygenation monitoring in the management of pediatric
stroke. Neurocritical Care 2011; 15: 529-536.
49. KIENING, K.L., UNTERBERG, A.W., BARDT, T.F., SCHNEIDER, G., LANKSCH,
W.R. Monitoring of cerebral oxygenation in patients with severe head injuries: brain
tissue PO2 versus jugular vein oxygen saturation. Journal of Neurosurgery 1996; 85: 751-
757.
50. NELSON, D.W., THORNQUIST, B., MACCULLUM, R.M., NYSTRÖM, H., HOLST,
A., RUDEHILL, A., WANECEK, M., BALLANDER, B., WEITZBERG, E. Analysis of
cerebral microdialysis in patients with traumatic brain injury: relations to intracranial
pressure, cerebral perfusion pressure and catheter placement. BMC Medicine 2011; 9: 21.
51. FENTON, K., FREEMAN, K., GLOGOWSKI, K., FOGG, S., DUNCAN, K. The
significance of baseline cerebral oxygen saturation in children undergoing congenital
heart surgery. American Journal of Surgery 2005; 190: 260-263.
52. YOSHITANI K., KAWAGUCHI, M., MIURA, N., OKUNO, T., KANODA, T.,
OHNISHI, Y., KURO, M. Effects of haemoglobin concentration, skull thickness and the
area of cerebrospinal fluid layer on near-infrared spectroscopy measurements.
Anesthesiology 2007; 106: 458-462.
53. RICCI, M., LOMBARDI, P., SCHULTZ, S., GALLINDO, A., COSCARELLA, E.,
VASQUEZ, A., ROSENKRANZ, E. Near-infrared spectroscopy to monitor cerebral
oxygen saturation in single-ventricle physiology. Journal of Thoracic and Cardiovascular
Surgery 2006; 131: 395-402.
54. VAVILALA, M. Cerebral oximetry: patience is a virtue but not a virtue for the patient,
yet? Pediatric Critical Care Medicine 2007; 8: 192-193.
55. THAVASOTHY, M., BROADHEAD, M., ELWELL, P., SMITH, M. A comparison of
cerebral oxygenation as measured by the NIRO 300 and INVOS 5100 near-infrared
spectrophotometers. Anaesthesia 2002; 57: 999-1006.
©© UUnniivveerrssiittyy ooff PPrreettoorriiaa

58
56. TOBIAS, J. Cerebral oximetry monitoring provides early warning of hypercyanotic spells
in an infant with tetralogy of fallot. Journal of Intensive Care Medicine 2007; 22: 118-
120.
57. COHN, S. Near-infrared spectroscopy: Potential clinical benefits in surgery. Journal of
the American College of Surgeons 2007; 205: 322-332.
58. JAYAKAR, A., DUNOYER, C., REY, G., YAYLALI, I., JAYAKAR, P. Near-infrared
spectroscopy to define cognitive frontal lobe functions. Journal of Clinical
Neurophysiology 2005; 22: 415-417.
59. DULLENKOPF, A., WEISS, M., SCMID, E. Cerebral near-infrared spectroscopy in adult
patients after cardiac surgery is not useful for monitoring absolute values but may reflect
trends in venous oxygenation under clinical conditions. Journal of Cardiothoracic and
Vascular Anesthesia 2007; 21: 535-539.
60. SENIOR, J.M., PROUDMAN, C.J., LEUWER, M., CARTER, S.D. Plasma endotoxin in
horses presented to an equine referral hospital: Correlation to selected clinical parameters
and outcomes. Equine Veterinary Journal 2011; 43: 585-591.
61. FENG, S.Y.S., SAMARASINGHE, T., PHILLIPS, D.J., ALEXIOU, T., HOLLIS, J.H.,
YU, V.Y.H., WALKER, A.M. Acute and chronic effects of endotoxin on cerebral
circulation in lambs. American Journal of Physiology – Regulatory, Integrative and
Comparative Physiology 2010; 298: 760-766.
62. TUREEN, J.H., TAUBER M.G., SANDE, M.A. Effect of hydration status on cerebral
blood flow and cerebrospinal fluid lactic acidosis in rabbits with experimental meningitis.
Journal of Clinical Investigation 1992; 89: 947-953.
63. BURKHART, C.S., SIEGEMUND, M., STEINER, L.A. Cerebral perfusion in sepsis.
Critical Care 2010; 14: 215-219.
64. LE ROUX, J., SMUTS, M. Anatomy of the Domestic Animals – A study and dissection
guide: Part 3: Blood vessels and nerves 2nd Edition. Department of Anatomy, Faculty of
Veterinary Science, Onderstepoort 1992; 221-223.
65. DYCE, K., SACK, W., WENSING, C. Textbook of Veterinary Anatomy 2nd Edition.
Saunders, London 1996; 305-306.
66. NICKEL, R., SCHUMMER, A., SEIFERLE, E. Lehrbuch der Anatomie der Haustiere
Band 4: Nervensystem, Sinnesorgane, Endokrine Drüsen. Verlag Paul Parey, Berlin.
1984; 183-188.
©© UUnniivveerrssiittyy ooff PPrreettoorriiaa

59
67. KRAMER, J., COATES, J.R., HOFFMAN, A.G., FRAPPIER, B.L. Preliminary anatomic
investigation of three approaches to the equine cranium and brain for limited craniectomy
procedures. Veterinary Surgery 2007; 36: 500-508.
68. TAYLOR, P., CLARKE, K. Handbook of Equine Anaesthesia 2nd Edition. Saunders
Elsevier, London 2007; 24-30.
69. CELESTE, C.J., DESCHENE, K., RILEY, C.B., THEORET, C.L. Regional differences in
wound oxygenation during normal healing in an equine model of cutaneous
fibroproliferative disorder. Wound Repair and Regeneration 2011; 19: 89-97.
70. PRINGLE, J., ROBERTS, C., ART, T., LEKEUX, P. Assessment of muscle oxygenation
in the horse by near-infrared spectroscopy. Equine Veterinary Journal 2000; 32: 59-64.
71. HINCKLEY, K.A., FEARN, S., HOWARD, B.R., HENDERSON, I.W. Near-infrared
spectroscopy of pedal haemodynamics and oxygenation in normal and laminitic horses.
Equine Veterinary Journal 1995; 27: 465-470.
72. OKADA, E., DELPY, D.T. Near-infrared light propogation in an adult head model: II.
Effect of superficial tissue thickness on the sensitivity of the near-infrared spectroscopy
signal. Applied Optics 2003; 42: 2915-2922.
73. WASSENAAR, E.B., VAN DEN BRAND, J.G.H. Reliability of near-infrared
spectroscopy in people with dark skin pigmentation. Journal of Clinical Monitoring and
Computing 2005; 19: 195-199.
74. PRINGLE, J., ART, T., LEKEUX, P. Near infrared spectroscopy for non-invasive
assessment of intracranial haemoglobin oxygenation in an in vitro model of the calf head.
Research in Veterinary Science 1998; 65: 103-109.
75. HORNOF, W.J., DUNLOP, C.I., PRESTAGE, R., AMIS, T.C. Effects of lateral
recumbency on regional lung function in anesthetized horses. American Journal of
Veterinary Research 1986; 47: 277-282.
76. MASON, D.E., MUIR, W.W., WADE, A. Arterial blood gas tensions in the horse during
recovery from anesthesia. Journal of the American Veterinary Medical Association 1987;
190: 989-994.
77. MOENS, Y., LAGERWEIJ, E., GOOTJES, P., POORTMAN, J. Influence of tidal volume
and positive end-expiratory pressure on inspiratory gas distribution and gas exchange
during mechanical ventilation in horses positioned in lateral recumbency. American
Journal of Veterinary Research. 1998; 59: 307-312.
©© UUnniivveerrssiittyy ooff PPrreettoorriiaa

60
78. HOPSTER, K., KÄSTNER, S.B., ROHN, K., OHNESORGE, B. Intermittent positive
pressure ventilation with constant positive-end expiratory pressure and alveolar
recruitment manoeuvre during inhalation anaesthesia in horses undergoing surgery for
colic, and its influence on the early recovery period. Veterinary Anaesthesia and
Analgesia. 2011; 38: 169-177.
79. MCMURPHY, R.M., CRIBB, P.H. Alleviation of postanaesthetic hypoxemia in the horse.
Canadian Veterinary Journal 1989; 30: 37-41.
80. MCCOY, A.M., HACKETT, E.S., WAGNER, A.E., MAMA, K.R., HENDRICKSON,
D.A. Pulmonary gas exchange and plasma lactate in horses with gastrointestinal disease
undergoing emergency exploratory laparotomy: A comparison with an elective surgery
horse population. Veterinary Surgery 2011; 40: 601-609.
81. WILSON, D.V., SCHOTT II, H.C., ROBINSON, N.E., BERNEY, C.E., EBERHART,
S.W. Response to nasopharyngeal oxygen administration in horses with lung disease.
Equine Veterinary Journal 2006; 38: 219-223.
82. ALKIRE, M.T., HALER, R.J., SHAH, N.K., ANDERSON, C.T. Positron emission
tomography study of regional cerebral metabolism in humans during isoflurane
anesthesia. Anesthesiology 1997; 86: 549-557.
83. OLSEN, K.S., HENRIKSEN, L., DIGE-PETERSEN, H., CHRAEMMER-JØRGENSEN,
B., ROSENØRN, J. Effect of ketanserin on global cerebral blood flow and cerebral
oxygen metabolism during midazolam-fentanyl or isoflurane anaesthesia. British Journal
of Anaesthesia 1992; 69: 263-268.
84. SOKOLOFF, L. Relationships among local functional activity, energy metabolism, and
blood flow in the central nervous system. Federation Proceedings 1981; 40: 2311-2316.
85. MATTA, F., MAYBERG, T.S., LAM, A.M. Direct cerebrovasodilatory effects of
halothane, isoflurane, and desflurane during propofol-induced isoelectric
electroencephalogram in humans. Anesthesiology 1995; 83: 980-985.
86. GRUBB, T.L., MUIR, W.W. Anaesthetic emergencies and complications – Part 1. Equine
Veterinary Education 1998; 10: 98-109.
87. TRIM, C.M., WAN, P.Y. Hypoxemia during anaesthesia in seven horses with colic.
Journal of the Association of Veterinary Anaesthesia 1990; 17: 45-49.
88. SHACKLEFORD, R.T., HEGEDUS, S.A. Factors affecting cerebral blood flow –
Experimental review: Sympathectomy, hypothermia, CO2 inhalation and pavarine. Annals
of Surgery 1966: 163: 771-775.
©© UUnniivveerrssiittyy ooff PPrreettoorriiaa
61
89. DAUBENEY, P.E.F., PILKINGTON, S.N., JANKE, E., CHARLTON, G.A., SMITH,
D.C., WEBBER, S.A. Cerebral oxygenation measured by near-infrared spectroscopy:
Comparison with jugular bulb oximetry. Annals of Thoracic Surgery 1996; 61: 930-934.
90. BHUTTA, A.T., FORD, J.W., PARKER, J.G., PRODHAN, P., FONTENOT, E.E., SEIB,
P.M., STROOPE, B.I., FRAZIER, E.A., SCHMITZ, M.L., DRUMMOND-WEBB, J.J.,
MORROW, W.R. Noninvasive cerebral oximeter as a surrogate for mixed venous
saturation in children. Pediatric Cardiology 2007; 28: 34-41.
91. MOPPETT, I.K., WILD, M.J., SHERMAN, R.W., LATTER, J.A., MILLER, K.,
MAHAJAN, R.P. Effects of ephedrine, dobutamine and dopexamine on cerebral
haemodynamics: transcranial Doppler studies in healthy volunteers. British Journal of
Anaesthesia 2004; 92: 39-44.
92. POLLARD, V., PROUGH, D.S., DEMELO, E., DEYO, D.J., UCHIDA, T., STODDART,
H.F. Validation in volunteers of a near-infrared spectroscope for monitoring brain
oxygenation in vivo. Anesthesia and Analgesia 1996; 82: 269-277.
©© UUnniivveerrssiittyy ooff PPrreettoorriiaa

62
Appendices
©© UUnniivveerrssiittyy ooff PPrreettoorriiaa

Department of Companion Animal Clinical Studies
63
Horse number: _________ Drug Administration: ___________
Date: _________________ Dose: _____________
Recording period: _______ Time: _____________
Time (min)
1
2
3
4
5
6
7
8
9
10
rSO2
MAP
VBG
ABG
Lactate
HR
Pulse
CRT
Mm
RR
T
Appendix 1: Recording form used for data collection
©© UUnniivveerrssiittyy ooff PPrreettoorriiaa

64
Appendix 2: Range of rectal temperatures (°C) recorded for each of the 6 horses during
each recording period (RP).
RP Horse 1 Horse 2 Horse 3 Horse 4 Horse 5 Horse 6
1 38.0 - 38.1 37.2 - 37.6 37.4 - 37.6 37.5 - 37.8 37.2 - 37.4 37.6 - 37.7
2 37.8 - 38.1 38.0 37.5 - 37.7 37.8 37.3 - 37.7 37.6 - 37.7
3 37.1 - 37.5 36.1 - 37.2 35.8 - 35.9 37.0 - 37.5 36.7 - 37.3 36.7 - 36.8
4 36.3 - 36.6 36.9 - 37.1 35.7 - 35.9 36.6 - 36.8 35.7 - 36.0 36.0 - 36.1
5 35.9 - 36.0 36.6 - 36.8 36.0 - 36.4 36.3 - 36.4 35.9 - 36.5 36.0 - 36.3
6 35.7 - 36.0 36.2 - 36.6 35.8 36.2 35.2 - 35.4 35.2 - 35.9
7 35.5 - 35.9 36.1 - 36.3 35.1 - 35.6 36.0 - 36.2 35.1 - 35.4 36.4 - 36.6
8 37.1 - 37.2 36.9 - 37.7 36.7 36.5 - 36.6 36.5 - 36.6 37.3 - 37.4
©© UUnniivveerrssiittyy ooff PPrreettoorriiaa

65
Appendix 3: Manufacturers addresses
a Bayer Health Care, Isando, SA
b Arrow International, Reading, Philadelphia, USA
c Mila International Inc, Erlanger, Kentucky, USA
d Radiometer South Africa (Pty) Ltd, Midrand, Gauteng, SA
e Siemens Healthcare Diagnostics, Deerfield, Illinois, USA
f Covidien, Midrand, Gauteng, SA
g Ingelheim Pharmaceuticals, Randburg, Gauteng, SA
h Fresenius Kabi, Port Elizabeth, SA
i Micro Health Care Pty Ltd, Bethlehem, Free State, SA
jAbbott Laboraties Pty Ltd, Johannesburg, Gauteng, SA
k Surgivet DHV 1000 Large Animal Ventilator, Waukesha, Wisconsin, USA
l GE Healthcare, Little Chalfont, Buckinghamshire, UK
m Adcock Ingrim Critical Care Ltd, Johannesburg, Gauteng, SA
n SPSS version 17.0 for Windows, SPSS Inc, Chicago, Illinois, USA
o MINITAB Statistical Software, Release 13.32, Minitab Inc, Pennsylvania, USA
©© UUnniivveerrssiittyy ooff PPrreettoorriiaa

66
Scientific Proceedings Associated with this Dissertation
MCCONNELL, E., SAULEZ, M., BESTER, L., FOSGATE, G., SANZ, M., RIOJA, E.,
RAATH, R. Use of near-infrared spectroscopy to identify trends in regional cerebral oxygen
saturation in horses. Journal of Veterinary Emergency and Critical Care 2011; 21:S16.
MCCONNELL, E.J., SAULEZ, M.N., BESTER, L., RIOJA, E., SANZ, M.G., RAATH, R.P.,
FOSGATE, G. Use of near-infrared spectroscopy to identify trends in regional cerebral
oxygen saturation in horses. Faculty Day 2012; 21, Onderstepoort, SA.
MCCONNELL, E.J., RIOJA, E., BESTER, L., SANZ, M., FOSGATE, G., SAULEZ, M.N.
Use of near-infrared spectroscopy to identify trends in regional cerebral oxygen saturation in
horses. Equine Veterinary Journal 2013; 45: 470-475.
©© UUnniivveerrssiittyy ooff PPrreettoorriiaa
Copyright © 2022 FDOKUMEN