An Atlas of the Circumnuclear Regions of 75 Seyfert Galaxies in the Near-Ultraviolet with the Hubble...
58
arXiv:0704.3617v1 [astro-ph] 26 Apr 2007 An Atlas of the circumnuclear regions of 75 Seyfert galaxies in the near-UV with HST Advanced Camera for Surveys. V´ ıctor M. Mu˜ noz Mar´ ın 1 , Rosa M. Gonz´alez Delgado 1 , Henrique R. Schmitt 2 , Roberto Cid Fernandes 3 , Enrique P´ erez 1 , Thaisa Storchi-Bergmann 4 , Tim Heckman 5 , Claus Leitherer 6 (1) Instituto de Astrof´ ısica de Andaluc´ ıa (CSIC), P.O. Box 3004, 18080 Granada, Spain ([email protected]; [email protected]) (2) Remote Sensing Division, Naval Research Laboratory, Washington, DC; and Interferometrics, Inc., Herdon, VA 20171; [email protected]. (3) Depto. de F´ ısica-CFM, Universidade Federal de Santa Catarina, C.P. 476, 88040-900, Florian´opolis, SC, Brazil; [email protected]. (4) Instituto de F´ ısica, Universidade Federal do Rio Grande do Sul, C.P. 15001, 91501-970, Porto Alegre, RS, Brazil; [email protected]. (5) Department of Physics and Astronomy, Johns Hopkins University, Baltimore, MD 21218. (6) Space Telescope Science Institute, 3700 San Martin Drive, Baltimore, MD 21218. ABSTRACT We present an atlas of the central regions of 75 Seyfert galaxies imaged in the near-UV with the Advanced Camera for Surveys of the Hubble Space Tele- scope at an average resolution of ∼10 pc. These data complement archival high resolution data from the Space Telescope at optical and near-IR wavelengths, creating an extremely valuable dataset for astronomers with a broad range of scientific interests. Our goal is to investigate the nature of the near-UV light in these objects, its relation to the circumnuclear starburst phenomenon, and the connection of this to the evolution and growth of the galaxy bulge and central black hole. In this paper, we describe the near-UV morphology of the objects and characterize the near-UV emission. We estimate the size and the luminosity of the emitting regions and extract the luminosity profile. We also determine the presence of unresolved compact nuclei. In addition, the circumnuclear stellar cluster population is identified, and the contribution of the stellar clusters to the total light, at this wavelength, is estimated. The size of the sample allows us to draw robust statistical conclusions. We find that Seyfert 1 galaxies are
-
Upload
independent -
Category
Documents
-
view
5 -
download
0
Transcript of An Atlas of the Circumnuclear Regions of 75 Seyfert Galaxies in the Near-Ultraviolet with the Hubble...

arX
iv:0
704.
3617
v1 [
astr
o-ph
] 2
6 A
pr 2
007
An Atlas of the circumnuclear regions of 75 Seyfert galaxies in
the near-UV with HST Advanced Camera for Surveys.
Vıctor M. Munoz Marın1, Rosa M. Gonzalez Delgado1, Henrique R. Schmitt2, Roberto Cid
Fernandes3, Enrique Perez1, Thaisa Storchi-Bergmann4, Tim Heckman5, Claus Leitherer6
(1) Instituto de Astrofısica de Andalucıa (CSIC), P.O. Box 3004, 18080 Granada, Spain
([email protected]; [email protected])
(2) Remote Sensing Division, Naval Research Laboratory, Washington, DC; and
Interferometrics, Inc., Herdon, VA 20171; [email protected].
(3) Depto. de Fısica-CFM, Universidade Federal de Santa Catarina, C.P. 476, 88040-900,
Florianopolis, SC, Brazil; [email protected].
(4) Instituto de Fısica, Universidade Federal do Rio Grande do Sul, C.P. 15001, 91501-970,
Porto Alegre, RS, Brazil; [email protected].
(5) Department of Physics and Astronomy, Johns Hopkins University, Baltimore, MD
21218.
(6) Space Telescope Science Institute, 3700 San Martin Drive, Baltimore, MD 21218.
ABSTRACT
We present an atlas of the central regions of 75 Seyfert galaxies imaged in
the near-UV with the Advanced Camera for Surveys of the Hubble Space Tele-
scope at an average resolution of ∼10 pc. These data complement archival high
resolution data from the Space Telescope at optical and near-IR wavelengths,
creating an extremely valuable dataset for astronomers with a broad range of
scientific interests. Our goal is to investigate the nature of the near-UV light in
these objects, its relation to the circumnuclear starburst phenomenon, and the
connection of this to the evolution and growth of the galaxy bulge and central
black hole. In this paper, we describe the near-UV morphology of the objects
and characterize the near-UV emission. We estimate the size and the luminosity
of the emitting regions and extract the luminosity profile. We also determine
the presence of unresolved compact nuclei. In addition, the circumnuclear stellar
cluster population is identified, and the contribution of the stellar clusters to
the total light, at this wavelength, is estimated. The size of the sample allows
us to draw robust statistical conclusions. We find that Seyfert 1 galaxies are

– 2 –
completely dominated by its bright and compact nucleus, that remains point-
like at this resolution, while we find almost no unresolved nucleus in Seyfert 2.
The Seyfert types 1 and 2 are quite segregated in an asymmetry vs compactness
plot. Stellar clusters are found somewhat more frequently in Sy2 (in ∼70% of
the galaxies) than in Sy1 (∼57%), and contribute more to the total light in Sy2,
but this two differences seem to be mostly due to the large contribution of the
compact nucleus in Sy1, as the luminosity distribution of the clusters is similar
in both Sy types.
Subject headings: atlases – galaxies:Seyfert – galaxies:nuclei – galaxies:star clus-
ters – galaxies:starburst
1. INTRODUCTION
The origin of the near-UV continuum in Seyfert 2 nuclei has been a matter of debate for
the last decade. In the framework of the unified model (Antonucci 1993), it was first thought
that this blue continuum was scattered light from the hidden Seyfert 1 nucleus. Evidence
for this picture came mainly from the discovery of broad emission lines in polarized light of
Seyfert 2 nuclei (Antonucci & Miller 1985; Miller & Goodrich 1990), and high excitation gas
extending out from the nucleus with conical or bi-conical morphology (e.g. Wilson, Ward
& Haniff 1988; Tadhunter & Tsvetanov 1989; Perez et al. 1989). However, other optical
spectropolarimetry studies (Tran 1995) showed that the polarization of the continuum is
lower than that of the broad emission lines, even after the subtraction of an old stellar
population typical of the bulge of early type disk galaxies. This result is well understood
only if the blue continuum is dominated by another source rather than scattered AGN
light. Terlevich, Dıaz & Terlevich (1990) proposed a stellar origin for this continuum, and
Cid Fernandes & Terlevich (1995) proposed that a heavily-reddened starburst provides this
emission.
The starburst origin for the blue continuum is strongly supported by HST observations.
Direct observational evidence that only a small fraction of the total UV light detected in
Seyfert 2 galaxies is emitted by a hidden nucleus comes from high resolution UV images
of these objects (Heckman et al 1997; Colina et al. 1997; Gonzalez Delgado et al. 1998).
Powerful circumnuclear starbursts have been unambiguously identified in 40% of nearby
Seyfert 2 galaxies (Gonzalez Delgado et al. 2001; Cid Fernandes et al. 2001, 2004). These
starbursts were originally detected by means of either UV or optical spectroscopy of the
central few 100 pc. Stellar wind absorption lines in the UV spectra (Heckman et al. 1997;
Gonzalez Delgado et al. 1998) and/or high-order Balmer lines of H and HeI, and in some

– 3 –
cases Wolf-Rayet features (Gonzalez Delgado et al. 1998, 2001; Storchi-Bergmann et al. 2000)
show that young and intermediate age stellar population are significant, if not dominant, in
the nuclear region (∼100 pc) of many Seyfert 2.
On the other hand, it is widely believed that the center of every galaxy contains a
super massive black hole (Magorrian et al. 1998), hereafter referred to as SMBH. Strong
observational correlations have been observed between the black hole mass and the velocity
dispersion of the host bulge (Gebhardt et al. 2000; Ferrarese & Merritt 2000), suggesting that
the formation and growth of the SMBH must be closely linked to the evolution of the bulge
itself. In the past, the AGN phenomenon must have coexisted with violent star-formation,
but to what extent this is happening today and whether there is a causal connection between
them is something that needs to be better understood. The circumnuclear star clusters are
very good tracers of this process. This is because the occurrence of star clusters is a common
phenomenon in star forming environments as starburst galaxies (Meurer et al. 1995) or at the
nuclei of spiral galaxies (Carollo et al. 2002; Boker et al. 2002). The nuclear star clusters, also
known as stellar nuclei, have been studied spectroscopically in spiral galaxies by Walcher et
al. (2006) and Rossa et al. (2006). These are massive compact star clusters whose mass seem
to be correlated with the luminosity of the host bulge following the same slope than that for
SMBH. They are thus intimately linked to the evolution of the galactic bulge. Recent results
support the view that SMBH and stellar nuclei have close similarities in their formation and
evolution histories (Ferrarese et al. 2006).
The determination of the properties of the nuclear and circumnuclear star cluster pop-
ulation is critical in order to understand the past and present evolution of the bulge and
SMBH environment. High resolution imaging combined with a high sensitivity is needed
in order to resolve the nuclear star cluster population and disentangle the distribution of
extended emission related to the active nucleus and the star forming-regions. In order to
do that, we have performed a snapshot survey of a sample of Seyfert galaxies with the Ad-
vanced Camera for Surveys (ACS) of the HST in its High Resolution Configuration, with the
filter F330W (near UV). This configuration is optimal to detect faint young and middle-aged
star-forming regions around these nuclei, and separate their light from the underlying bulge
emission. These images complement optical and near-IR images available in the HST archive
providing a panchromatic atlas of the inner regions of these objects. These data will allow
us to determine the frequency of circumnuclear starbursts, down to levels that cannot be
observed from the ground; characterize the properties of these clusters, such as flux, color,
size, mass, age, etc.; to study the luminosity function of star clusters and their survival rate
close to the AGN; to address questions about the relation between AGNs and starbursts, like
the possible connections between the masses of black holes and luminosities of starbursts,
and the implications for the evolution of the black holes and their host galaxy bulges.

– 4 –
In this paper we present the Atlas of the observed sample. We have performed a photo-
metric analysis, studied the presence of unresolved nuclei, and carried out a morphological
analysis through structure parameters (asymmetry and compactness). We have also esti-
mated the fraction of light coming from star clusters and compact emitting regions. In
Section 2 we present the sample, and explain the observations and the data reduction. In
Section 3 we explain the analysis process and the results. In Section 4 we present the
conclusions of this work. We have included an appendix with a description of the main
characteristics of each object.
2. CATALOGUE, OBSERVATIONS AND DATA REDUCTION
2.1. Sample Selection
We have selected all the Seyfert (Sy) galaxies in the HST archive that had images
in these three bands: near ultraviolet with ACS/HRC F330W, near infrared with NICMOS
F160W and optical WFPC2 F606W (in most cases, but also F555W or F547M). In this paper
we present an atlas of the near ultraviolet images (ACS/HST F330W) as well as parameters
obtained from the analysis of these images. The sample is composed by the galaxies imaged
as part of our proposal ID 9379 (P.I. Schmitt), which is an HST cycle 11 ACS snapshot, plus
NGC7212 and NGC5728 from the proposal ID 9681 (P.I. Kraemer). These two galaxies
have not been imaged with NICMOS, but are included in this paper because they improve
our UV study of Seyfert nuclei with their F330W images. The instrumental configuration of
the observations is described in more detail in section 2.3.
The list of objects for proposal ID 9379 was constructed from the sample presented in
Quillen et al. (2001), consisting in all the Sy observed with NICMOS F160W. Only objects
with also WFPC2, most of them in F606W (Malkan et al. 1998), were included in the
proposal list. From the original list of 101 objects, 73 were observed during the snapshot,
making a total of 75, that will allow us to carry out a statistical study for different types of
Sy. From the final sample of 75 objects, 47 (63%) are classified as Seyfert 2 (Sy2), 14 (∼
19%) as intermediate types Sy1.8-1.9, and 14 (∼ 19%) as Seyfert 1 and Sy1.2-1.5, hereafter
refered to as Sy1.

– 5 –
2.2. Sample Properties
In Table 1 we list the basic properties of the whole sample extracted from NED1. For the
calculation of the distance we have used the Hubble law with H0 =75 kms−1, and the radial
velocity data from NED, with the exception of objects with radial velocity Vr ≤1200 km s−1.
For those, we used value of the literature, which are: M81 (NGC3031) 3.6 Mpc (Freedman
1994); Circinus, 4 Mpc (Freeman 1977) and for the objects: NGC3486 (7.4 Mpc), NGC4395
(3.6 Mpc), NGC3982 (17 Mpc), NGC4258 (6.8 Mpc), NGC5005 (21.3 Mpc), NGC5033
(18.7 Mpc), NGC5194 (7.7 Mpc), NGC5273 (21.3 Mpc) and NGC6300 (14.3 Mpc) we used
the values from Tully (1988).
1The NASA/IPAC Extragalactic Database operated by NASA/IPAC, Caltech.
(http://nedwww.ipac.caltech.edu/)

–6
–
Table 1. Sample Properties
Galaxy Alternative Spectral Hubble vel. Scale B T E(B–V) axial L[OIII] Ref. FIR IRAS IRAS
Name Name Class Type [km s−1] pc/′′ [mag] [mag] ratio (b/a) [10e11 L⊙] F12/F25 F25/F60
(1) (2) (3) (4) (5) (6) (7) (8) (9) (10) (11) (12) (13) (14)
CGCG 164-019 Sy2 Sa 8963 579 15.3 0.026 0.875 41.4 dG92 <0.672 0.735 0.436
Circinus ESO97-G13 Sy2 SA(s)b 449 19 12.1 1.455 0.435 40.21 ol94 0.135 0.275 0.275
ESO 103-G35 Sy2 SA0 3983 257 14.7 0.076 0.364 40.75 mw88 0.428 0.246 1.04
ESO 137-G34 Sy2 SAB(s)0/a?. 2747 178 12.21 0.335 0.786 41.35 fe00 <0.2597 0.392 0.325
ESO 138-G1 Sy2 E-S0 2740 177 14.7 0.2 0.5 40.12 li88 <0.186 0.273 0.664
ESO 362-G8 Sy2 Sa 4785 309 13.6 0.032 0.5 41.22 mu96 <0.156 <0.316 0.297
Fairall49 IRAS 18325-5926 Sy2 Sa 6065 392 13.2 0.065 – 41.25 dG92 1.006 0.431 0.427
IC 2560 ESO375-G4 Sy2 SB(r)bc 2925 189 12.53 0.095 0.625 40.51 gu06 0.2097 0.437 0.246
IC 4870 ESO105-IG11 Sy2-HII Pec 889 57 13.89 0.113 0.563 –a <0.0073 – <0.391
IC 5063 ESO187-G23 Sy2 SA(s)0+ 3402 220 12.89 0.061 0.667 41.28 sc03 0.6409 0.302 0.642
Mrk 6 IC 450 Sy1.5 SAB0+ 5640 365 15.0 0.136 0.625 42.10 wh92 <0.3635 <0.456 0.607
Mrk 40 Arp151 Sy1 S0-pec 6323 409 16.8 0.014 0.429 41.18 wh92 – – –
Mrk 42 UGC8058 Sy1 SBb 7385 477 15.28 0.029 0.983 40.55 wh92 – – –
Mrk 231 Sy1 SA(rs)c?-pec 12642 817 14.41 0.010 0.769 41.91 da88 29.716 0.212 0.254
Mrk 334 UGC6 Sy1.8-HII Pec 6582 425 14.38 0.047 0.7 40.254 li88 <1.05 <0.238 0.246
Mrk 461 UGC8718 Sy2 S 4856 314 14.61 0.024 0.714 40.327 cg94 – – –
Mrk 471 UGC9214 Sy1.8 SBa 10263 663 14.54 0.010 0.667 40.66 da88 <0.935 – <0.500
Mrk 477 Sy2 Compact 11310 731 15.2 0.011 0.709 43.02 wh92 <1.47 <0.463 0.4
Mrk 493 UGC10120 Sy1 SB(r)b 9392 607 14.6 0.025 0.714 40.595 li88 <0.684 <0.926 0.422
Mrk 516 Sy1.8 Sc 8519 551 15.3 0.060 0.833 39.91 os81 <0.915 – 0.221
Mrk 915 Sy1 Sb 7228 467 14.82 0.063 0.833 42.07 wh92 <0.569 1.625 0.711
Mrk 1210 UGC4203 Sy2 Sa; 4046 262 14.34 0.030 1.0 42.58 fa98 0.401 0.263 1.136
NGC449 Mrk 1 Sy2 (R’)S? 4780 309 15.01 0.060 0.625 41.85 wh92 <9.727 <2.24 0.348
NGC1144 Sy2 S-pec 8648 559 13.78 0.072 0.636 40.256 li88 2.426 0.371 0.132
NGC1320 Mrk 607 Sy2 Sa: sp 2663 172 13.32 0.047 0.316 40.71 wh92 <0.135 0.306 0.458
NGC1672 Sy2 (R’ 1:)SB(r)bc 1331 86 10.28 0.023 0.833 38.53 gu06 0.5334 0.365 0.116
NGC2639 Sy1.9 (R)SA(r)a: 3336 216 12.56 0.024 0.611 39.45 ho97 <0.212 – <0.195
NGC3031 M 81 Sy1.8-L SA(s)ab -34 17 7.89 0.080 – 39.306 li88 0.0041 0.878 0.106
NGC3081 Sy2 (R 1)SAB(r)0/a 2385 154 12.85 0.055 0.762 41.58 wh92 – – –
NGC3227 Sy1.5 SAB(s)-pec . 1157 75 11.1 0.023 0.667 40.84 wh92 0.0755 0.385 0.218
NGC3362 Sy2 SABc 8290 536 13.48 0.031 0.898 41.38 wh92 – – –
NGC3393 Sy2 (R’)SB(s)ab 3750 242 13.09 0.075 0.909 41.98 sc03 <0.2398 <0.352 0.298
NGC3486 Sy2 SAB(r)c 681 36 11.05 0.022 0.732 37.96 ho97 <0.0096 <1.115 0.0568
NGC3516 Sy1.5 (R)SB(s)0 2649 171 12.5 0.042 0.765 41.35 wh92 0.1223 0.489 0.529
NGC3786 Mrk 744 Sy1.8 (R’)SAB(r)a-pec 2678 173 13.50 0.024 0.591 40.59 wh92 – – –
NGC3982 Sy2 SAB(r)b 1109 82 11.78 0.014 0.882 40.06 wh92 0.0719 0.571 0.1214
NGC4253 Mrk 766 Sy1.5 (R’)SB(s)a: 3786 245 13.70 0.020 0.8 41.77 wh92 0.3934 0.297 0.340
NGC4258 M 106 Sy1.9-L SAB(s)bc 448 33 9.10 0.016 0.387 41.02 ho97 – – –
NGC4303 M 61 Sy2-HII SAB(rs)bc 1566 101 10.18 0.022 0.892 40.24 li88 <0.3227 – <0.0259
NGC4395 Sy1.8-L SA(s)m 319 17 10.64 0.017 0.833 39.47 ho97 – – –
NGC4565 Sy1.9 SA(s)b? sp 1230 80 10.42 0.015 0.116 38.71 ho97 <0.848 <1.89 0.0778
NGC4593 Mrk 1330 Sy1 (R)SB(rs)b 2698 174 11.67 0.025 0.744 40.82 wh92 0.1637 – <0.327
NGC4725 Sy2 SAB(r)ab pec 1206 78 10.11 0.012 0.710 38.76 ho97 <0.214 – <0.284
NGC4939 Sy2 SA(s)bc 3110 201 11.9 0.041 0.509 41.847 li88 <0.183 – <0.253
NGC4941 Sy2 (R)SAB(r)ab: 1108 72 12.43 0.036 0.528 40.17 wh92 <0.0172 – <0.425
NGC5005 Sy2-L SAB(rs)bc 946 103 10.61 0.014 0.483 39.42 ho97 0.31 0.602 0.0576
NGC5033 Sy1.9 SA(s)c 875 91 10.75 0.011 0.467 39.36 ho97 0.1878 0.733 0.0789
NGC5135 Sy2 SB(l)ab 4112 266 12.88 0.060 0.692 41.28 wh92 1.599 0.270 0.153
NGC5194 M 51 Sy2-HII SA(s)bc pec 463 37 8.96 0.035 0.616 39.14 wh92 0.0787 0.571 0.0744

– 7 –
In order to understand the possible biases of our sample we compare the general prop-
erties of our galaxies with those in two bona-fide samples of Sy galaxies in the literature, the
CfA and RSA Seyfert subsamples. From the 48 Sy galaxies in the CfA catalogue presented
in Huchra & Burg (1992) (see also McLeod & Rieke 1995), 24 are in our sample as well. On
the other hand, 38 out of 75 of our galaxies belong to the extended RSA Sy sample compiled
by Maiolino & Rieke (1995) (sample D in their work). We thus explore 50% of CfA and 42%
of RSA, with only 10 of our galaxies occurring in both of them. As CfA has been shown
to lack some bright Seyferts, some of which are in our sample, we have used instead the
extension to the CfA sample presented in Alonso-Herrero et al. (1993), in which they add
a total of nine galaxies previously classified as LINER. From now on we will name these
subsamples CfA and RSA respectively. The mean distance, d, of our sample is in between
both comparison ones, as <dRSA >= 34 Mpc and <dCfA > is three times larger than this
(Maiolino & Rieke 1995), while the mean distance of our sample is <d>= 57 Mpc. As in
most of the Sy samples in the literature, in our sample Sy1 are, on average, more distant
than Sy2. The origin of this bias is that the luminosity of the nucleus compared to the
host bulge luminosity is smaller in Sy2 than in Sy1 AGNs. Still, the distance distribution
of the galaxies looks homogeneus up to 100 Mpc (Fig. 1). The standard deviation of the
distribution is 41 Mpc, indicating that the range of distances is quite large. With ACS we
are able to achieve a much better resolution than any ground-based study. The scale of our
images ranges from less than 1 pc pixel−1 for the nearest objects to about 20 pc pixel−1 for
the furthest, with a mean value of 6 pc pixel−1.
We have checked for possible bias in the distribution of Hubble types among different
types of Sy. This is plotted in Fig. 2. Peculiar galaxies and those classified as uncertain,
are excluded. As it is widely known, Seyfert nuclei are found mostly in spiral galaxies, with
preference for early types (see e.g. Moles, Marquez & Perez 1995, and references therein).
The histograms do not seem to differ much. In Figs. 3 and 4 we have plotted a comparison of
CfA and RSA samples, finding a good agreement between our sample and the ones we have
used for comparison. In order to quantify both statements above, we used the de Vaucouleurs
classification from RC3 catalogue (T), that is S0= −1, S0a= 0, Sa= 1, Sab= 2, etc. The
resulting mean, median and standard deviation of the spiral types for our sample and the
comparison ones are summarised in Table 2. Our three subsamples of Seyfert activity show
quite similar values of mean and median T. This is enough to ensure that the differences we
find among groups of activity type do not arise from differences in the Hubble morphology.
Applying the same classification to the other samples we get a good matching with our own
sample, although CfA galaxies tend to be of a bit earlier type.
Finally, we have obtained the distribution of the axial ratio, that is, the minor over the
major axis of the galaxy (b/a). This gives an idea of the inclination angle of the galaxy,

–8
–
Table 1—Continued
Galaxy Alternative Spectral Hubble vel. Scale B T E(B–V) axial L[OIII] Ref. FIR IRAS IRAS
Name Name Class Type [km s−1] pc/′′ [mag] [mag] ratio (b/a) [10e11 L⊙] F12/F25 F25/F60
(1) (2) (3) (4) (5) (6) (7) (8) (9) (10) (11) (12) (13) (14)
NGC5256 Mrk 266 Sy2 Pec 8353 540 14.00 0.013 – 41.08 wh92 <2.987 <0.471 0.140
NGC5273 Sy1.9 SA(s)0 1064 103 12..4 0.010 0.893 39.48 wh92 <0.0272 – <0.417
NGC5283 Mrk 270 Sy2 S0? 3119 202 14.20 0.020 0.909 41.22 wh92 – – –
NGC5347 Sy2 (R’)SB(rs)ab 2335 151 13.4 0.021 0.765 39.96 sc03 0.8233 0.315 0.639
NGC5548 Sy1.5 (R’)SA(s)0/a 5149 333 13.3 0.020 0.929 41.91 wh92 0.35 0.474 0.731
NGC5674 Sy1.9 SABc 7474 483 13.70 0.036 0.909 41.27 gu06 <0.704 – <0.24
NGC5695 Mrk 686 Sy2 SBb 4225 273 13.58 0.017 0.715 41.09 wh92 <0.152 – <0.525
NGC5728 Sy2 (R 1)SAB(r)a 2788 180 12.81 0.101 0.581 41.526 li88 <0.352 <0.395 0.096
NGC5940 Sy1 SBab 10172 658 14.32 0.041 1.0 41.30 wh92 <0.88 – <0.316
NGC6300 Sy2 SB(rs)b 1109 69 10.98 0.097 0.667 39.84 sp89 0.1112 0.344 0.153
NGC6814 Sy1.5 SAB(rs)bc 1563 101 12.06 0.183 0.933 40.26 wh92 0.0985 0.559 0.104
NGC6951 Sy2-L SAB(rs)bc 1424 92 11.64 0.366 0.564 38.99 ho97 0.170 0.385 0.0867
NGC7130 IC5135 Sy2-L Sa pec 4842 313 12.98 0.029 0.933 41.27 sp90 2.083 0.294 0.128
NGC7212 Sy2 Sab 7984 516 14.78 0.072 – 42.34 wh92 <1.35 <0.466 0.245
NGC7319 Sy2 SB(s)bc pec 6747 436 14.11 0.079 0.765 41.17 wh92 – – –
NGC7469 Sy1.2 (R’)SAB(rs)a 4892 316 13.0 0.069 0.733 41.84 wh92 3.599 0.237 0.203
NGC7479 Sy2-L SB(s)c 2381 154 11.60 0.112 0.756 38.44 dG92 0.474 0.226 0.274
NGC7496 Sy2 (R’)SB(rs)bc 1649 107 11.91 0.010 0.909 39.60 gu06 0.134 0.178 0.178
NGC7674 Mrk 533 Sy2-HII SA(r)bc pec 8671 560 13.92 0.059 0.909 42.26 wh92 3.188 0.375 0.345
NGC7743 Sy2 (R)SB(s)0+ 1710 111 12.38 0.070 0.867 39.60 ho97 <0.031 – <0.433
UGC1214 Mrk 573 Sy2 (R)SAB(rs)0+ 5174 334 13.68 0.023 1.0 42.30 wh92 <0.3358 <0.363 0.630
UGC1395 Sy1.9 SA(rs)b 5208 337 14.18 0.075 0.769 40.89 wh92 <0.308 – <1.8
UGC2456 Mrk 1066 Sy2 (R)SB(s)0+ 3605 233 13.64 0.132 0.588 41.20 wh92 0.763 0.216 0.221
UGC6100 Sy2 Sa? 8844 572 14.30 0.012 0.617 41.53 sc03 <0.623 – <0.426
UGC12138 Sy1.8 SBa 7487 484 14.24 0.085 0.875 41.40 sc03 <0.633 – 0.477
UM625 Sy2 S0 7492 484 17.43 0.062 0.848 41.48 Te91 – – –
Note. — Col. (1): Galaxy name. Col. (2): Alternative name. Col. (3): Spectral class. (LINER = L). Col. (4): Hubble type. Col. (5): Radial velocity. Col. (6): Angular scale calculated
from the distance. Col. (7): Total asymptotic magnitude in B, B T, from RC3 catalogue. Col. (8): Reddening, E(B-V). Col. (9): Axial ratio (b/a). (All these quantities, but the scale,
were extracted from NED.) Col. (10): Logarithm of [OIII]λ5007 luminosity in units erg/s. Col. (11): References for column (10); cg94: Cruz-Gonzalez et al. (1994); da88: Dahari & De
Robertis (1998); dG92: de Grijp et al. (1992); fa98: Falcke, Wilson, & Simpson (1998); fe00: Ferruit, Wilson, & Mulchaey (2000); gu06: Gu et al. (2006); ho97: Ho, Filippenko & Sargent
(1997); li88: Lipovetsky, Neizvestny, & Neizvestnaya (1988); mw88: Morris & Wald (1988); mu96: Mulchaey, Wilson, & Tsvetanov (1996); ol94: Oliva et al. (1994); os81: Osterbrock
(1981); sc03: Schmitt et al. (2003); sp89: Storchi-Bergmann & Pastoriza (1989); st90: Storchi-Bergmann, Bica, & Pastoriza (1990); te91: Terlevich et al. (1991). wh92: Whittle (1992);
Col. (12): IR luminosity from IRAS fluxes calculated with the formula from Sanders & Mirabel (1996). Col. (13) and (14): IRAS flux ratios, F12/F25 and F25/F60 .
aIC4870 is a Wolf-Rayet galaxy

– 9 –
Fig. 1.— The upper, middle and lower panel show the distribution of the distance for the
Sy2, Sy1.8-1.9, and Sy1 galaxies, respectively.

– 10 –
Table 2. Statistics of Hubble Type.
Sample RSA CfA
mean median σ mean median σ mean median σ
Sy1 1.6 2 2.3 2.0 2 2.0 1.3 1 1.9
Sy1.8-1.9 2.8 3 2.6 2.8 3 2.6 2.2 1 3.3
Sy2 2.4 2 2.3 2.0 2 2.2 2.1 3 2.0
Note. — The table shows the mean, median and standard deviation of Hubble type
for each subsample, following a de Vaucouleurs classification. All the subsamples are
represented, on the mean, by early type spirals (Sa=1, Sab=2, Sb=3, etc.)
Fig. 2.— Distribution of Hubble types for the different subsamples of Sy activity class. The
de Vaucouleurs classification (T) is used: e.g. S0=–1, S0a=0, Sa=1, Sab=2, Sb=3, etc. The
T < –1 stand for ellipticals. The three subsamples are equivalent on average and median
values.

– 11 –
Fig. 3.— Comparison between the distribution of morphological types of our sample (full
lines) and the RSA sample (dashed lines). The histograms do not differ much. On average
both samples are equivalent (see discussion in text).

– 12 –
Fig. 4.— Same comparison as in Fig. 3 for our sample (full lines) and CfA (dashed). The
two distributions are very similar as well.

– 13 –
with high values for objects seen nearly face-on, and low values for edge-on ones. Due to
internal galactic absorption more objects with high b/a are expected, leading to a power law
distribution for a magnitude-limited sample (Maiolino & Rieke 1995). Thus, most samples,
including ours, are biased against edge-on galaxies. In Fig. 5 we plot the distribution of the
axial ratio for the three samples. Ours is in between the less biased RSA and the CfA (more
affected by this effect). This happens naturally because our sample has a mean distance in
between the other two. Maiolino & Rieke (1995) find that Sy1 tend to occur more often in
face-on than the intermediate type Sy. Within our data also a slight trend in the distribution
of Seyfert activity with inclination is observed (Fig. 6). This effect is not very severe, as
the median value of b/a does not change much among groups, with 0.85 for Sy1, 0.75 for
Sy1.8-1.9 and 0.75 for Sy2 galaxies.
2.3. Observations and Data Reduction
The sample was imaged with the Advanced Camera for Surveys (ACS) in its high
resolution configuration (HRC), which provides a pixel size of 0.027 arcsec. The filter chosen
is F330W, that from the UV filters of ACS, has the highest throughput, negligible red leak
and minimal contamination by line emission. A higher red leak, as that from F220W, would
result in a higher background level with lower S/N detection for young star clusters. The
filter F330W has a bandwidth of ∼ 400 A centred around 3300 A, therefore the only strong
emission lines contributing to this filter are [NeV]λλ3346,3426. This type of emission will
be normally extended, thus is not a problem for measuring compact objects such as clusters
(see section 4).
To allow an easier removal of cosmic rays (CRs) two exposures of 10 min each where
made for a total of 1200 s. For 19 of the brightest galaxies the exposure was further split
in 1140 s and 60 s exposures, in order to be able to study the possible saturated core. In
these cases we have worked with the longest exposure when possible. The only exceptions
are NGC7212 and NGC5728, that have 2550 s exposure.
We downloaded the images from the HST archive2 with the calibration ‘on the fly’
option, that corrects the images from bias, dark and flat-field subtraction with the most up-
to-date ACS reference files and bad pixel tables. Also CRs are rejected and the exposures
combined in a single image. The ACS field of view is heavily distorted, due to the design with
a minimum number of components and a significant tilt of the detector. When projected in
the sky plane the square detector becomes rhombus-shaped. One of the automatic tasks of
2http://archive.stsci.edu/hst/

– 14 –
Fig. 5.— Compared histogram of the axial ratio (b/a) of the galaxies of the three different
samples. Numbers are relative to the total number of objects in each sample. Our sample
seems to lay in between the CfA and the RSA, and it is less biased against edge-on galaxies
than CfA.

– 15 –
Fig. 6.— Distribution of the axial ratio (b/a) for the three activity classes. The typical
trend of less objects at low inclinations is seen for this sample, although no clear trend with
Sy type is observed.

– 16 –
the ACS pipeline performs the necessary distortion correction. The final products are both
astrometrically and photometrically accurate.
The pipeline CRs removal task uses very mild values for the parameters, avoiding to
remove by mistake the centre of bright stars or galactic nuclei. We found that many of the
images had conspicuous artifacts, such as CRs that were not removed by the pipeline. We
tried out several IRAF tasks for the identification and removal of the CRs. Due to the small
FWHM of the PSF (1.8 pix) and the low S/N in some of the images we could not get a
satisfactory result with these routines. Finally we had to remove the artifacts by hand from
the region of interest, after comparing the images with those from WFPC2 to help us to
discern the CRs from small star clusters.
The background for every object was determined with the IRAF3 task FITSKY. The
mean value and the standard deviation of the background (σs) was measured from several
apertures in the outer regions of the image. The values of σs have a very low scatter (0.004-
0.005 counts s−1) due to the constant instrumental configuration and the similar exposure
time in different images. The larger scatter of the background values (from 0.0015 to 0.005
counts s−1, equivalent to 21–22.5 mag/arcsec2) suggests that in some cases this is not a real
sky determination, but background light from the galaxy itself. As an example of this there
are some cases in which the galaxy fills the field of view (e.g. M81).
When imaging very bright objects, as some Seyfert nuclei, the possible effects of satura-
tion have to be accounted for. The detector can reach physical saturation when more charge
is released in a single pixel than what it can accumulate, resulting in charge being spilled to
adjacent pixels and some flux getting lost. In particular, the default gain value of the HRC
chip falls short of sampling the full well depth (∼165,000 e−) by some 22%. There are 11
objects that overcome this threshold. The core-saturated objects are: Mrk 231, NGC3227,
NGC3516, NGC4593, NGC5548, NGC7469, UGC12138 (with a 60s image), and Mrk 493,
Mrk 915, NGC5273, NGC6814 (without a 60s image). In the case of the objects with a 60s
image the correction to be made can be calculated by comparing the photometry between
the long and short exposures. See below for further discussion.
3IRAF (Image Reduction and Analysis Facility) is distributed by the National Optical Astronomy Ob-
servatories, which are operated by AURA, Inc., under cooperative agreement with the National Science
Foundation.

– 17 –
3. RESULTS
Figs. 7.1–7.75 show the central emission of all the galaxies in the sample. We have chosen
the field of view and scaling in order to enhance the most interesting features4. In addition,
for some galaxies we show a nuclear close-up in Figs. 8.1–8.12. We have divided the objects
in Seyfert types, in order to better appreciate the common characteristics of each type. In
the Appendix we describe the main morphological components of these galaxies, and also we
show figures of all the objects showing the whole HRC field of view. The morphology of the
objects is as irregular as varied. There are many different features within the sample: star-
forming rings, spirals, clumpy diffuse light emission, plain PSF-dominated objects, complete
lack of compact nucleus, etc. From Figs. 7.1–7.14 it can be seen that every Sy1-1.5 possess a
bright star-like nucleus, which precludes the observation of the inner morphology. In several
cases regions of star-formation and rings can be seen in the images as well. The morphology of
intermediate type Sy (Figs. 7.15–7.28) is more varied. Some objects have a compact nucleus.
The morphology can be clumpy or diffuse, and some objects show dust absorption features
or ionization cones. For the Sy2 galaxies (Figs. 7.29–7.75) the morphology is mostly clumpy,
with frequent star-formation regions. These are often arranged in rings or spiral arms. There
are some objects showing instead a biconical or symmetrical structure as ionization cones.
When a very bright nucleus is present, as in the images of galaxies from Sy1 to Sy1.9, some
artifacts may appear, such as inner rings or clumps very close to the nucleus. These are
caused by the instrumental PSF, that shows not only the diffraction spikes, but also clumpy
ring-like wings that can be confused with actual star-forming rings (e.g. see image of Mrk 42,
Mrk 493 or Mrk 915).
3.1. Profiles
Due to the irregularity of the isophotes, the common method of elliptical isophotal
fitting was ruled out. Instead, we performed a photometric analysis using circular apertures.
Aperture photometry was carried out with IRAF task PHOT in order to determine the
surface brightness profile and the luminosity and magnitude curves of growth. The surface
brightness profile was computed by measuring the mean number of counts in circular annuli.
First of all, an accurate position of the nucleus was computed when a compact source was
clearly detected in the images. All the apertures were centered in the position determined
by the centroid of the compact nuclear source. In the cases in which the nucleus was too
4All the figures in figure sets 7, 8, 9, and 20, can be downloaded in EPS file format in the URL:
http://www.iaa.es/∼manuel/publications/paper01.html

– 18 –
Fig. 7.— Example of a near-UV ACS image. The complete set of images for the whole
sample are available in the electronic version of the Journal. The field of view and contrast
is chosen to show the most interesting parts and structure of each object. North is up, east
to the left.

– 19 –
Fig. 8.— Close-up of some galaxies with interesting nuclear structure or a large luminosity
range within the image. The complete set of 12 panels is available in the electronic edition
of the Journal.

– 20 –
obscured an approximate position was estimated by taking as a reference the nuclear position
in the WFPC2 optical images (F606W and F814W), as these wavelengths are less affected by
dust extinction, and using the galaxy features visible in both bands to align them. For these
objects (Circinus, ESO137-G34, ESO362-G8, NGC1672, NGC2639, NGC5194, NGC5256,
NGC5728, NGC6300 and NGC6951) a precision of a few ACS pixels was achieved and that
was enough for the rest of the analysis, so the inner regions are qualitatively described by
the profiles.
The Point Spread Function (PSF) of the instrumental configuration was computed with
the software TinyTim5. The resulting PSF was compared with the radial profiles of several
isolated stars in some images, showing a very good agreement. We then compared the
PSF with the surface brightness profiles in order to determine whether or not the galaxies
show a compact resolved nucleus. The PSF of the ACS-HRC at this wavelength has 1.8
pixels full-width at half maximum (FWHM), so a compact source with a FWHM larger
than 0.05′′ should be seen slightly extended. The occurrence of a nuclear point source was
determined by eye inspection of the radial profiles over-plotted, in a logarithmic scale, to the
PSF profile and normalized to the same peak value. The results are summarized in Table 3.
This table shows the number of objects of each Sy type for which the ACS-HRC shows a
compact and unresolved nucleus. We have not found resolved nuclei in any galaxy from
Sy1 to Sy1.5 type. On the other hand, most Sy2 nuclei appear resolved or absent (heavily
obscured). For the intermediate types 1.8–1.9 the situation is something in between, with
approximately one third of the nuclei resolved, one third remaining point-like, and the rest
being difficult to discern. The objects with nucleus at the limit of resolution are Mrk 516,
Mrk 334, NGC4565, UGC1395, and the Sy2 CGCG 164-019. This result is similar to that
obtained at other wavelengths; for example, Nelson et al. (1996) show that in the red, Sy2 in
general lack a compact nucleus while Sy1-1.5 are dominated by a bright unresolved nuclear
source.
The computed profiles are shown in Figs. 9.1-9.75. By inspection of these plots we have
classified the surface brightness profiles in one of these three categories:
• Exponential: The differential flux has an exponential dependence with the radius,
so the dependence of the surface brightness (µ) is linear with r. This is the classical
model to fit well the surface brightness profile of some dwarf ellipticals and disks of
spiral galaxies (Freeman, 1970).
• de Vaucouleurs profile: It is an r1/4 profile. This is a good approximation to the
5http://www.stsci.edu/software/tinytim/tinytim.html

– 21 –
large scale profiles of bright ellipticals and bulge of spirals.
• Nuker law: This is a five parameter model proposed by Lauer et al. (1995) which is
a blend of two power-laws. The Nuker law is used to fit the inner parts of the galactic
profiles.
Some of the galaxies are a clear example of a particular profile: e.g. NGC5283, follows a
perfect de Vaucouleurs law; ESO362-G8 matches a Nuker law; and NGC4725 shows a Nuker
law within the inner 2′′ and a clear exponential in the outer regions. However, less than half
of the objects show a correspondence with these profiles. More complex profiles are due to
the effects of dust obscuration, occurrence of star-forming regions, or the presence of a bright
nucleus, which can dominate the profile up to 2′′. NGC5194 is an example of central dust
obscuration, while NGC5135 shows an irregular profile due to its nuclear starburst. The
profiles can show as well the presence of a ring-like structure, as in NGC4303 or NGC7496.
The objects whose nucleus is obscured in the UV images show a very irregular profile. The
classification of the profiles is shown in the last column of Table 4.
3.2. Photometry
The differential surface brightness were obtained by calculating the flux within a very
narrow circular annulus, dividing it by the area of the region, and then calculating the
magnitude. From the luminosity profiles and the background, we can define the maximum
radius (Rmax) as the distance from the centre at which the differential surface brightness
equals the background value plus 1σ. We consider that this criterion limits the region in
which the flux can be calculated with enough S/N, and thus it gives an idea of the extension
of the object. We have calculated the magnitude inside apertures of radii Rmax, 1′′ and
0.3′′. The last two enclose respectively 94% and 86% of the total flux for a point-like source.
Also, we have calculated the absolute magnitudes inside appertures of projected radii equal
to 100 pc and 300 pc. All the magnitudes are calculated in the STMAG system, with the
formula
m = −2.5 · log(counts/s · PHOTFLAM) − 21.1,
where PHOTFLAM is the inverse sensitivity (see Pavlovsky et al. 2004, for an explanation
of the STMAG system and the calculation of the zero point).
For some objects that are too extended, Rmax is larger than the distance from the
nucleus to the border of the image, and thus it could not be calculated with the standard
procedure. We then take an alternative maximum radius that fitted inside the field of view
but did not include the borders of the image, where the data do not have enough quality.

– 22 –
Table 3. Frequency of point-like nuclei
Sy type No nucleus or resolved Unresolved At resolution limit Total
Sy 2 43 (91.5%) 3 (6.4%) 1 (2.1%) 47
Sy 1.8–1.9 5 (35.7%) 5 (35.7%) 4 (28.6%) 14
Sy 1–1.5 0 14 (100%) 0 14
Total 48 22 5 75
Note. — The table shows the number of objects of each type for which we resolve the
nucleus. The numbers in brackets are the equivalent percentages relative to the total number
of objects of each type. Note that no Sy1 nucleus is resolved.
Fig. 9.— Surface brightness profiles are plotted for all the galaxies in the sample. From
left to right, the abscissae are scaled linearly, with r1/4, and logarithmic, in order to show
the type of profile dominating in each galaxy (exponential, de Vaucouleurs or Nuker law).
Theoretical PSF profiles are overplotted in dashed line, for comparison with each object.
(The whole set of figures is available in the electronic edition of the Journal.)

– 23 –
This is the case of NGC3031, NGC5941 and NGC5005, in which Rmax becomes a lower
limit and thus it affects too, the other measurements of size and magnitude. Note also, that
as Rmax is calculated doing an azimuthal average some emitting features or isolated star
forming regions may fall outside the region we are studying.
We also calculate the differential surface brightness at 0.3′′ and 1′′ (µ0.3′′ , µ1′′), as well as
at the half-light radius (radius enclosing half of the total flux, or µ50) , and the radii enclosing
80%, 50%, and 20% of the total flux (R80, R50, and R20). We have obtained that for several
objects half or more of the flux is enclosed within a radius of one pixel. For these objects (all
the Sy1 and some intermediate type Sy), which exhibit a bright point-like nucleus, we only
can set an upper limit for R50 and R20. All the magnitudes are then corrected for galactic
reddening using the extintion coefficients given in Siriani et al. (2005), which are calculated
using the extintion law of Cardelli et al. (1989). The correction for a particular filter depends
on the shape of the continuum. We have used A(F330W)/E(B–V)=5.054, that is an average
of the values given for Sc and elliptical galaxies in Siriani et al. (2005). The photometry
results are given in Table 4.

–24
–
Table 4. Measurements and results
Galaxy m(0.3′′) m(1′′) m(Rmax) M(100 pc)a M(300 pc)a µ(0.3′′) µ(1′′) µ50 Rmax R80 R50 R20 Profile
Name pc (′′) pc (′′) pc (′′) pc (′′)
(1) (2) (3) (4) (5) (6) (7) (8) (9) (10) (11) (12) (13) (14)
CGCG 164-019 17.66 17.05 16.47 -17.50 -17.96 17.98 19.48 19.39 1586 (2.74) 1013 (1.75) (439) 0.76 52 (0.09) v
Circinus 14.12 11.88 9.71 – – 12.93 13.29 13.43 62 (3.23) 53 (2.77) (40) 2.12 24 (1.27) 0
ESO103-G35 19.79 18.06 17.01 -14.20 -15.79 18.93 19.69 19.92 578 (2.25) 475 (1.85) (315) 1.23 157 (0.61) n
ESO137-G34 19.83 17.21 16.11 -14.55 -16.47 18.36 18.77 18.82 354 (1.99) 299 (1.68) (221) 1.24 123 (0.69) 0
ESO138-G1 16.4 15.43 15.09 -17.00 -17.62 15.56 18.11 16.92 390 (2.20) 216 (1.22) (95) 0.54 37 (0.21) np
ESO362-G8 17.66 15.85 14.34 -16.50 -18.13 16.51 17.70 18.97 1906 (6.17) 1307 (4.23) (659) 2.13 256 (0.83) n
fairall49 18.03 16.75 15.98 -16.38 -17.49 17.66 18.73 18.74 930 (2.37) 604 (1.54) (398) 1.01 165 (0.42) er
IC 2560 16.91 16.36 16.02 -16.33 -16.81 16.75 19.28 17.32 409 (2.16) 231 (1.22) (72) 0.38 21 (0.11) 0
IC 4870 15.54 15.34 14.48 -15.23 – 17.2 18.84 19.05 283 (4.96) 192 (3.37) (78) 1.37 <3 (0.05) enp
IC 5063 19.23 17.9 15.81 -14.47 -15.85 18.74 19.66 19.92 876 (3.98) 722 (3.28) (507) 2.30 277 (1.26) e
Mrk 6 14.85 14.67 14.57 -19.53 -19.68 16.31 18.79 11.32 732 (2.00) 139 (0.38) <(24) 0.07 <11 (0.03) np
Mrk 40 16.99 16.72 16.58 -17.61 -17.83 18.22 20.30 14.52 691 (1.69) 274 (0.67) (38) 0.09 <12 (0.03) np
Mrk 42 15.92 15.67 15.55 -19.01 -19.14 17.8 18.57 12.35 796 (1.67) 348 (0.73) <(32) 0.07 <14 (0.03) 0pr
Mrk 231 14.54 14.43 14.18 -21.44 -21.61 16.57 18.88 11.02 3749 (4.59) 931 (1.14) <(55) 0.07 <25 (0.03) vp
Mrk 334 17.05 16.31 15.32 -17.59 -18.19 17.61 18.96 19.91 1760 (4.14) 1309 (3.08) (700) 1.65 119 (0.28) 0
Mrk 461 15.88 15.58 15.13 -18.24 -18.51 16.5 19.16 16.47 1133 (4.32) 590 (2.25) (77) 0.30 21 (0.08) 0r
Mrk 471 19.58 18.49 16.28 -15.76 -16.39 19.57 20.07 20.75 2758 (4.16) 2400 (3.62) (1741) 2.63 922 (1.39) 0p
Mrk 477 16.5 16.03 15.44 -19.42 -19.84 16.61 19.13 18.32 1080 (3.44) 703 (2.24) (203) 0.64 41 (0.13) 0
Mrk 493 14.71 14.5 14.43 -20.50 -20.66 16.58 18.55 11.49 1153 (1.90) 261 (0.43) <(44) 0.07 <18 (0.03) 0pr
Mrk 516 18.54 17.83 17.14 -16.07 -17.11 17.7 20.23 20.17 1185 (2.15) 865 (1.57) (509) 0.92 127 (0.23) 0
Mrk 915 15.11 14.94 14.79 -19.71 -19.85 16.89 18.81 11.57 1137 (2.43) 262 (0.56) <(30) 0.06 <14 (0.03) 0p
Mrk 1210 16.54 16.11 15.4 -16.76 -17.24 16.94 19.20 19.04 2866 (3.92) 2047 (2.80) (667) 0.91 73 (0.10) 0r
NGC449 17.45 16.95 16.51 -16.63 -17.06 17.31 20.02 18.33 699 (2.26) 467 (1.51) (133) 0.43 34 (0.11) 0
NGC1144 19.81 18.22 16.26 -14.87 -16.29 18.91 20.07 21.67 2851 (5.10) 2622 (4.69) (2029) 3.63 688 (1.23) 0
NGC1320 17.64 16.92 15.39 -15.48 -16.30 17.61 19.24 20.14 893 (5.19) 702 (4.08) (419) 2.43 127 (0.74) v
NGC1672 18.78 16.42 12.39 -15.08 -17.28 17.41 17.92 17.69 875 (10.18) 587 (6.83) (423) 4.92 280 (3.25) 0
NGC2639 19.32 17.47 15.04 -14.70 -16.21 18.06 19.28 20.19 1326 (6.14) 1084 (5.02) (705) 3.26 352 (1.63) n
NGC3031b,c 15.79 15.07 17.48 -14.90 – 16.34 17.23 18.54 >185 (10.85) 145 (8.52) (93) 5.45 43 (2.52) ep
NGC3081 17.76 16.58 14.71 -15.33 -16.54 17.41 18.50 20.34 979 (6.36) 788 (5.12) (489) 3.17 174 (1.13) 0
NGC3227 14.46 14.27 14.05 -16.74 – 15.85 18.16 12.11 283 (3.79) 65 (0.87) (8) 0.10 <2 (0.03) 0p
NGC3362 19.22 18.35 16.52 -15.64 -16.45 19.01 20.77 21.79 2615 (4.88) 2385 (4.45) (1781) 3.32 600 (1.12) nr
NGC3393 18.67 16.75 14.95 -15.35 -17.08 17.46 18.30 18.66 1135 (4.69) 784 (3.24) (466) 1.93 249 (1.03) n
NGC3486 18.05 17.14 15.7 -13.25 – 17.95 19.31 19.95 148 (4.12) 116 (3.23) (72) 1.99 26 (0.71) e
NGC3516 13.67 13.51 13.11 -19.15 -19.35 15.54 17.39 12.04 1014 (5.93) 347 (2.03) (20) 0.11 <5 (0.03) np
NGC3786 17.07 16.37 15.96 -16.03 -16.70 17.32 18.60 18.33 381 (2.20) 220 (1.27) (104) 0.60 14 (0.08) 0
NGC3982 18.44 17.44 15.38 -13.94 -15.14 18.75 19.35 20.61 524 (6.39) 436 (5.32) (263) 3.21 107 (1.30) 0
NGC4253 15.61 15.3 14.75 -17.98 -18.27 16.41 18.69 17.31 1199 (4.89) 684 (2.79) (115) 0.47 15 (0.06) np
NGC4258 17.86 15.92 13.2 -15.02 – 16.78 17.49 18.38 205 (6.20) 163 (4.93) (112) 3.39 59 (1.79) en
NGC4303 16.19 15.56 13.54 -16.03 -17.50 16.61 18.02 17.60 558 (5.52) 361 (3.57) (277) 2.74 141 (1.40) 0pr
NGC4395 16.77 16.57 16.5 – – 17.43 20.78 14.40 22 (1.43) 5 (0.32) (2) 0.10 <1 (0.04) 0
NGC4565 19.91 18.27 17.16 -13.18 – 19.14 19.86 20.00 181 (2.26) 144 (1.80) (100) 1.25 52 (0.65) 0
NGC4593 13.33 13.22 13.03 -19.51 -19.63 15.35 17.64 9.64 813 (4.67) 87 (0.50) <(11) 0.06 <5 (0.03) 0p
NGC4725 18.26 16.58 14 -14.80 -16.23 17.31 18.29 19.64 651 (8.35) 496 (6.36) (313) 4.02 144 (1.84) e
NGC4939 18.98 17.08 16.27 -14.99 -16.33 18.06 19.21 19.44 553 (2.75) 410 (2.04) (215) 1.07 103 (0.51) v
NGC4941 18.02 16.93 15.58 -14.26 – 17.26 18.95 19.60 279 (3.87) 211 (2.93) (128) 1.78 48 (0.67) e
NGC5005b 18.15 16.38 22.32 -15.22 -16.54 17.06 18.11 20.00 >1252 (12.15) 1049 (10.18) (730) 7.09 333 (3.23) ev
NGC5033 16 15.64 13.65 -15.77 -16.45 17.04 18.58 20.14 1060 (11.64) 844 (9.27) (520) 5.72 148 (1.63) np
NGC5135 16.49 15.4 13.59 -17.39 -18.52 16.08 17.47 17.44 1721 (6.47) 1064 (4.00) (470) 1.77 277 (1.04) 0

– 25 –
As explained above, saturation might affect the flux in some nuclei. This effect can
be corrected straightforwardly for the objects overcoming the saturation threshold which
have also short exposure images. First we checked that from a radius of 0.1′′ outwards, the
surface brightness profiles calculated from both images were coincident. Then the inner 8
pixels of the saturated and high S/N image were replaced by the data from the unsaturated
image. The final analysis was carried out on this corrected profile. For the saturated objects
with just one image we performed a χ2 fit of a Tinytim-generated PSF to the wings of the
nuclear PSF. The fit was done in the range of 5–12 pixels (0.13′′–0.32′′), range in which the
pixels are not severely affected by the saturation and the S/N is still high. We considered
possible focus changes by allowing the PSF to be broadened up to a 10%, choosing the best
fit from the whole set of different broadenings. The inner 0.2′′ of the galaxy was replaced
by the fitted PSF. We checked this method with those core-saturated galaxies which have
additional non-saturated exposures, obtaining a good agreement with the fluxes calculated
from the combined profiles. Fig. 10 show the fitted PSF for these four nuclei. The resulting
corrections calculated range from 0.06 mag (Mrk 915) to 0.36 mag (NGC5273). The nucleus
of NGC5940 does not reach the saturation threshold, but it is close to it. It has only a long
exposure image, in which it does not seem to be affected by saturation. The correction that
we expect for this object should be smaller than that for Mrk 493 or Mrk 915, which have
brighter nuclei.
The magnitudes given in Table 4 depend on the determination of Rmax, so one has to take
this into account when using these fluxes. In order to illustrate this we have compared the
total fluxes of some of our galaxies with the fluxes presented in Storchi-Bergmann et al. (1995)
and Kinney et al. (1993). The compared subsamples are: NGC3982, NGC4258, NGC5005,
NGC5256, NGC5674 and Mrk 477, that have been studied by Kinney et al. (1993) and
have published fluxes at ∼2700A and spectral slopes (β); and the subsample NGC3081,
NGC3393, NGC5135, NGC5728, NGC1672, NGC7130 and NGC7496, that have been
studied as well by Storchi-Bergmann et al. (1995), giving fluxes at 2900 and 3500A. Fig. 11
shows the comparison between their measurements and ours. A good general agreement
is found. When comparing the fluxes several issues have to be taken into account, the
different instrumental set-up being the most determining. In order to have a good S/N
we have measured inside a radius Rmax, while they used the aperture of the IUE slit, that
is 10′′×20′′. This is equivalent in surface to a circular aperture of 8′′, although the flux
depends on the light distribution of the object and the orientation of the slit. Thus, when
we use apertures of 8′′ the agreement is very good, except for NGC4258 and NGC5005, for
which we measure a flux 1.9 and 2.5 times higher respectively. In these cases the isophotes
are clearly elongated, so the flux is expected to vary significantly with the slit orientation.
Moreover, because the calculation of Rmax implies an azimuthal average then some bright

–26
–
Table 4—Continued
Galaxy m(0.3′′) m(1′′) m(Rmax) M(100 pc)a M(300 pc)a µ(0.3′′) µ(1′′) µ50 Rmax R80 R50 R20 Profile
Name pc (′′) pc (′′) pc (′′) pc (′′)
(1) (2) (3) (4) (5) (6) (7) (8) (9) (10) (11) (12) (13) (14)
NGC5194b,c 17.73 15.34 13.44 -14.74 -15.83 16.09 17.56 19.73 >340 (9.18) 277 (7.48) (173) 4.67 38 (1.03) 0
NGC5256 17.07 16.54 16.11 -17.81 -18.51 16.86 19.79 17.42 1468 (2.72) 896 (1.66) (223) 0.41 70 (0.13) 0
NGC5273 15.29 15.02 14.65 -16.32 -16.71 16.83 18.41 17.19 388 (3.76) 162 (1.57) (43) 0.41 <3 (0.03) np
NGC5283 18.24 16.92 16 -15.45 -16.57 17.34 18.96 19.13 582 (2.88) 418 (2.07) (237) 1.18 91 (0.45) v
NGC5347 18.13 17.15 16.88 -15.00 – 17.79 19.80 18.51 267 (1.76) 159 (1.05) (83) 0.55 24 (0.16) 0
NGC5548 14.31 14.17 13.98 -19.87 -20.00 15.93 18.35 10.84 1213 (3.65) 216 (0.65) <(22) 0.07 <10 (0.03) 0p
NGC5674 18.05 16.97 16.61 -16.65 -17.65 17.63 19.67 18.32 966 (2.00) 599 (1.24) (292) 0.60 97 (0.20) 0
NGC5695 19.11 17.6 16.6 -14.90 -16.26 18.18 19.48 19.94 767 (2.81) 584 (2.14) (344) 1.26 147 (0.54) v
NGC5728 21.1 17.52 14.42 -13.67 -16.35 19.48 18.69 19.22 1148 (6.38) 846 (4.70) (656) 3.64 369 (2.05) 0r
NGC5940 15.43 15.31 15.26 -20.12 -20.28 17.36 19.74 11.63 1042 (1.59) 118 (0.18) <(40) 0.06 <20 (0.03) 0p
NGC6300 21.1 18.62 17.62 -12.81 – 19.6 19.99 20.00 123 (1.77) 106 (1.53) (78) 1.13 46 (0.67) 0
NGC6814 13.25 13.13 13.02 -18.27 – 15.26 17.47 9.93 279 (2.79) 25 (0.25) <(7) 0.07 <3 (0.03) 0p
NGC6951 18.23 16.9 13.74 -14.60 -16.55 17.25 18.73 18.64 474 (5.15) 417 (4.53) (344) 3.74 222 (2.41) 0r
NGC7130 15.98 15.17 13.47 -18.13 -18.87 15.53 18.64 20.04 3333 (10.65) 2601 (8.31) (1908) 6.09 266 (0.85) 0
NGC7212 18.03 17.19 16.43 -16.47 -17.59 17.2 19.53 19.54 1310 (2.54) 980 (1.90) (518) 1.00 134 (0.26) 0
NGC7319 20.51 18.91 18.91 -14.05 -15.41 20.15 20.86 19.84 441 (1.01) 349 (0.80) (247) 0.57 109 (0.25) 0
NGC7469 13.22 13.08 12.65 -20.85 -20.98 15.14 16.85 11.83 1376 (4.35) 506 (1.60) (39) 0.12 <9 (0.03) 0pr
NGC7479 19.56 18 16.89 -14.01 -15.34 18.49 19.91 20.05 367 (2.38) 310 (2.01) (205) 1.33 89 (0.58) 0
NGC7496 16.48 15.43 14.35 -16.23 -17.18 15.75 17.55 17.40 538 (5.02) 272 (2.54) (143) 1.33 45 (0.42) 0
NGC7674 16.47 15.89 15.69 -18.52 -19.16 16.4 18.89 16.48 1082 (1.93) 510 (0.91) (177) 0.32 50 (0.09) n
NGC7743 17.22 16.01 15.04 -15.71 -16.48 16.38 18.41 18.90 463 (4.18) 316 (2.85) (152) 1.37 48 (0.43) n
UGC1214 17.44 16.51 15.41 -16.75 -17.60 16.85 18.87 19.43 1333 (3.99) 945 (2.83) (522) 1.56 137 (0.41) n
UGC1395 18.52 17.35 17.26 -15.69 -16.79 18.4 20.06 18.46 381 (1.23) 270 (0.80) (177) 0.52 40 (0.12) 0
UGC2456 16.53 15.85 15.36 -17.11 -17.76 15.84 18.31 17.75 598 (2.57) 333 (1.43) (143) 0.61 44 (0.19) 0
UGC6100 18.84 17.84 16.63 -15.94 -16.99 18.28 20.11 21.03 2219 (3.88) 1830 (3.20) (1022) 1.79 297 (0.52) n
UGC12138 14.96 14.73 14.62 -19.98 -20.19 16.38 18.88 11.64 1054 (2.18) 232 (0.48) <(34) 0.07 <15 (0.03) np
UM625 17.44 16.35 16.15 -17.39 -18.29 17.53 19.39 17.37 887 (1.83) 436 (0.90) (252) 0.52 53 (0.11) 0
Note. — Col. (1): Galaxy name; Col. (2): Magnitude within 0.3′′ radius. Col. (3): Magnitude within 1′′ radius. Col. (4): Magnitude within the maximum radius. Col. (5): Absolute
magnitude within a projected radius of 100 pc. Col. (6): Absolute magnitude within 300 pc. Col. (7) & (8): Differential surface brightness at 0.3′′ and 1′′ respectively. Col. (9):
Differential surface brightness at the half-light radius. Col. (10): Computed maximum radius in pc and arcsec in brackets. Col. (11), (12) & (13): Radius enclosing 80%, 50% and 20% of
the flux within Rmax, in pc (same in arcsec in brackets). Col. (14): Classification of the profiles from Figs. 9.1-9.75. The type of profile is coded with the letters: ‘e’ for an exponential
profile, ‘v’ for a de Vaucouleurs law, ‘n’ when a Nuker law is seen, and ‘0’ if the profile does not fall in any of the former categories. A letter ‘p’ is added when there is a point-like
nucleus present, and an ‘r’ if there is a ring visible in the image.
All the magnitudes are calculated in the STMAG system and corrected for galactic extinction.
aIn the cases in which Rmax is less than 100 pc, the absolute magnitude (M) within 300 pc or 100 pc is not calculated. If Rmax is less than 300 pc but greater than 100 pc, then M
within 300 pc is computed, but not M within 100 pc.
bIn these cases Rmax is limited by the border of the field of view and not by the integration.
cOcculting finger of the HRC limits the radius for which the asymmetry parameter (see text) is computed (smaller than Rmax).

– 27 –
Fig. 10.— PSF fit to the nucleus for the saturated objects with two images. The fitted PSF
is the red dashed line, that is overplotted to the surface brightness curve (black line and
triangles), for each object. The most affected nucleus is NGC6814, while Mrk 915 has barely
lost flux in the saturated image.

– 28 –
features can lie out of this region. One example of this is NGC5674, that has an external
ring-like structure which is outside of Rmax, but fits in a 8′′ aperture. The fluxes at 3300A
have been interpolated between the fluxes at 2900A and 3500A given by Storchi-Bergmann
et al. (1995), or corrected from the fluxes at 2700A given by Kinney et al. (1993) using the
value of β that they calculate. In Table 5 we list the calculated photometric values for these
objects.
Fig. 12 presents comparative histograms of the values of the magnitudes measured within
0.3′′, 1′′, Rmax, and the magnitude in a circular ring between 0.3′′ and 1′′. It is shown that Sy1
nuclei are brighter at small radii. However this trend is not observed when the contribution
of the inner 0.3′′ is subtracted, indicating that the light in Sy1 is dominated by the compact
nucleus, and the difference of the subsamples in terms of magnitude is not large. The bright
outlier object in the plots is Circinus galaxy, that due to its low galactic latitude has a large
extinction correction that makes it even brighter than the Messier objects of the sample.
In Fig. 13 we plot the surface brightness µ at 0.3′′ and 1′′. The calculation of the surface
brightness at 1′′ is practically unaffected by the Sy1 nuclei, what causes the dissimilarity
between the panels of Fig. 13. This indicates no significant difference among the host of Sy1
and Sy2, in terms of surface brightness. The difference would be due just to the presence of
the nuclear source in Sy1.
3.3. Compactness and Asymmetry
The morphology of extended objects can be quantified with the concentration or com-
pactness (C) and asymmetry (A) parameters. Due to the irregular distribution of light
at λ3300, these parameters give a better description of the morphology than the classical
bulge-disk decomposition. They also reflect the contribution of clumpy structure, such as
star clusters and star-forming regions.
The definition of C is based in the curve of growth and depends on the ratio of two radii
enclosing some fraction of the total flux. We have used the formula from Bershady, Jangren
& Conselice (2000),
C = 5 log(r80/r20),
where r80 and r20 are the radii enclosing 80% and 20% of the total flux within Rmax. Fig. 14
shows the distribution of C for the different types of Sy galaxies. The distribution of Sy2
and Sy1 are clearly different, being the Sy1 far more compact. The intermediate types show
a behaviour in between the other two subsamples. We find that the values of C for Sy2 are
similar to those of local normal galaxies studied in the B band by Bershady et al. (2000).
However, our Sy1 have on average much higher values of C. The occurrence of a compact

– 29 –
Fig. 11.— Comparison of the fluxes that we have measured with data from the literature.
Triangles represent fluxes from Kinney et al. (1993), while crosses represent fluxes from
Storchi-Bergmann et al. (1995). The two triangles that fall over the unity line are NGC4258
and NGC5005 (see discussion in text).

– 30 –
Table 5. Comparison of flux measurements.
Name Rmax F3300 (Rmax) F3300 (8′′) F3300 (10×20′′)
(′′)
Mrk477a 3.4 2.3 2.8 2.4
NGC1672 10.2 36.2 32.5 31.0
NGC3081 6.4 3.7 4.3 3.5
NGC3393 4.7 2.7 3.6 3.3
NGC3982a 6.4 3.1 4.9 4.0
NGC4258a 6.2 13.0 21.7 11.2
NGC5005a 12.2 17.0 10.1 4.0
NGC5135 6.5 10.0 10.8 10.4
NGC5256a 2.7 1.2 2.5 2.5
NGC5674a 2.0 0.7 2.1 2.1
NGC5728 6.4 3.5 3.7 4.2
NGC7130 10.7 13.0 9.8 8.0
NGC7496 5.0 6.3 7.4 8.0
Note. — This table shows the comparison between our measurements
and the values published by Kinney et al. (1993) and Storchi-Bergmann
et al. (1995).
Col. (1): galaxy name; Col. (2): maximum radius; Col. (3): UV flux
measured at maximum radius; Col. (4): UV flux measured at 8′′ radius;
Col. (5): UV flux from literature at 3300A. Units of Col. (3) – (5) are
10−15 erg/s/cm2/A.
aFluxes in Col. (5) have been calculated using the spectral slope given
in Kinney et al. (1993) for these galaxies.
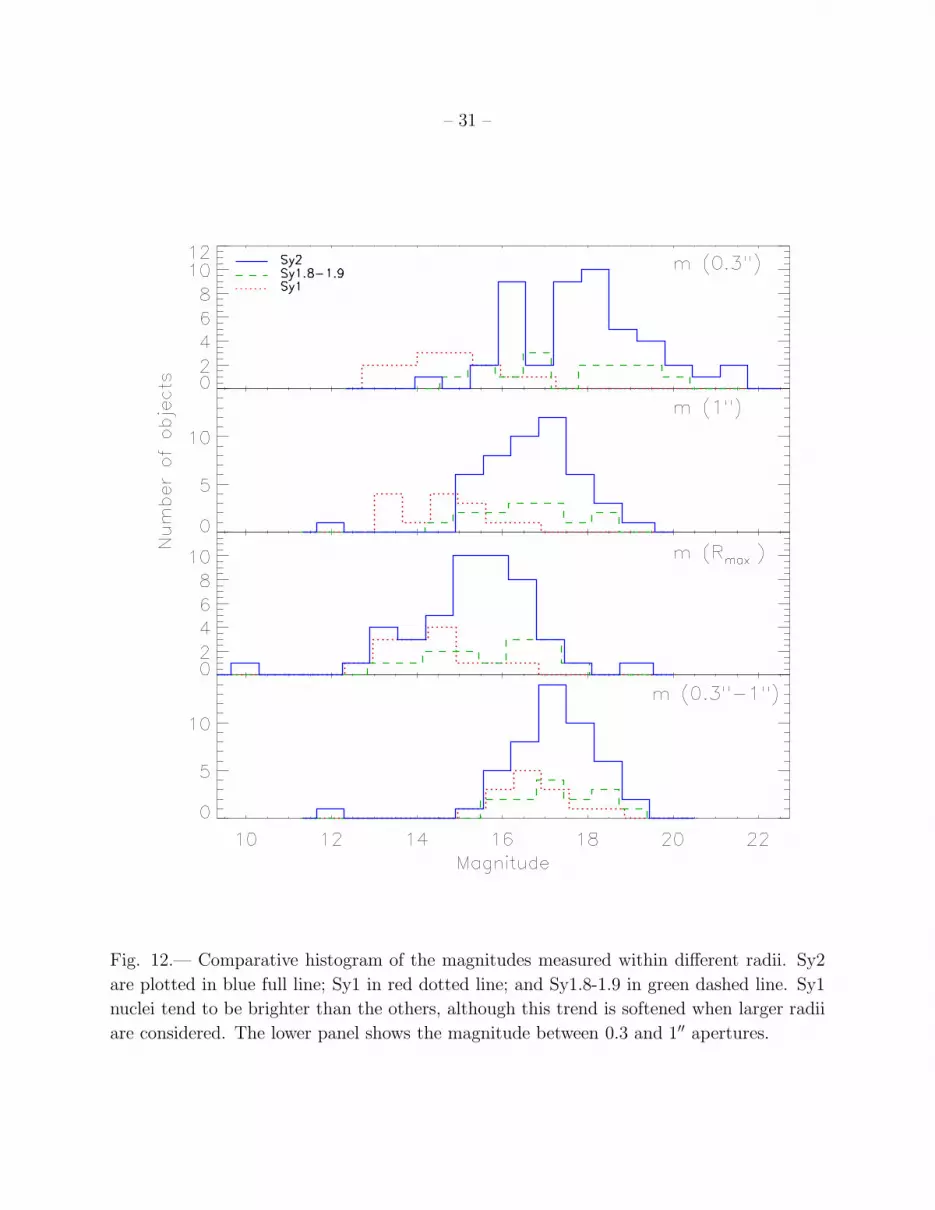
– 31 –
Fig. 12.— Comparative histogram of the magnitudes measured within different radii. Sy2
are plotted in blue full line; Sy1 in red dotted line; and Sy1.8-1.9 in green dashed line. Sy1
nuclei tend to be brighter than the others, although this trend is softened when larger radii
are considered. The lower panel shows the magnitude between 0.3 and 1′′ apertures.

– 32 –
Fig. 13.— Comparative histogram of the values of the surface brightness measured at two
different radii. At 0.3′′ Sy1 nuclei are brighter than those from other types. At 1′′, however,
there is no difference in the distribution of µ. Colors and type of line are as in previous
figure.

– 33 –
nucleus in the near-UV is determinant for a high value of C to be measured.
The asymmetry of a particular galaxy is calculated by subtracting a 180◦ rotated image
from the original one. The residuals in this image are summed up and then normalized
dividing by the total flux in the original image. The sum can be quadratic or in absolute
value. The rotation center is the nucleus of the galaxy. The formula that summarizes the
process is (Conselice 1997)
A2
rms =
∑(Fij − Fji)
2
2∑
Fij2
,
where Fji is the rotated original image (Fij). A is calculated only taking into account the
region inside Rmax, otherwise the contribution of the noise would become important. In the
case of M81, and M51 we have measured only to a radius smaller than Rmax (5.67′′ for M81
and 6.91′′ for M51), just enough to prevent the occulting ’finger’ of the ACS to enter in the
region studied, which would introduce a big systematic uncertainty in the asymmetry deter-
mination (although is unimportant for the photometry). We decided to use this definition
of Arms after trying out as well an absolute value sum (Aabs). In general, Arms weighs more
the bright features, such as star forming regions, and should be less sensitive to the noise.
We have checked that the choice of the exact formula does not change the general results,
as well as measuring within a half-light radius does not change the general distribution of
the points. Figs. 15 and 16 show the histogram of Arms values and a Arms vs C plot. The
values of Arms for Sy2 are systematically higher, covering a wide range of values, while Sy1
show a very small scatter around Arms=0.2. We calculated the asymmetry of some isolated
point-like sources leading to a value close to 0.2, so this seems to be a lower limit for the
asymmetry calculated by this method. This is a combination of the contribution of the noise
and subsampling effects due to the value of the PSF FWHM. Thus, Arms is dominated by
the nuclear PSF in Sy1, while extended emission and star-forming regions, together with a
smaller nuclear contribution, determines the higher values in Sy2. In Fig. 16 it is clearly
seen how Sy1.8–1.9 reproduce characteristics of both Sy types 1 and 2. In the plot Arms vs
C there is a clear trend that Arms decreases with increasing C, as had been observed before
for normal galaxies (see e.g. Bershady et al. 2000). In this plot the correlation saturates
when we explore high values of C, due to the limit in Arms. Results of the calculation of C
and A are summarized in Table 6.

– 34 –
Fig. 14.— Histogram of compactness for Sy subsamples. Type of line and colors codify the
Sy type in the same way as in previous figures.

– 35 –
Table 6. Results from the shape and stellar clusters analysis.
Galaxy C Arms fclus log(Fclus)
Name erg/cm2/s/A
(1) (2) (3) (4) (5)
CGCG164-019 6.42 0.17 0.022 -16.69
Circinus 1.7 0.79 0.016 -14.12
ESO103-G35 2.41 0.55 0 –
ESO137-G34 1.93 0.85 0.0058 -17.12
ESO138-G1 3.84 0.56 0 –
ESO362-G8 3.53 0.44 0 –
fairall49 2.84 0.72 0.033 -16.31
IC2560 5.19 0.47 0 –
IC4870a >9.22 0.21 0.033 -15.71
IC5063 2.07 0.77 0.014 -16.62
Mrk 6a >5.72 0.13 0 –
Mrk 40a >6.97 0.17 0 –
Mrk 42a >7.17 0.21 0.038 -16.08
Mrk 231a >8.12 0.17 0.009 -16.16
Mrk 334 5.17 0.28 0.13 -15.45
Mrk 461 7.3 0.19 0.0081 -16.58
Mrk 471 2.07 0.71 0.032 -16.45
Mrk 477 6.24 0.16 0 –
Mrk 493a >6.03 0.30 0.034 -15.68
Mrk 516 4.18 0.59 0.033 -16.78
Mrk 915a >6.58 0.11 0 –
Mrk 1210 7.22 0.29 0.016 -16.40
NGC449 5.78 0.47 0.017 -16.81
NGC1144 2.91 0.88 0.032 -16.44
NGC1320 3.72 0.36 0 –
NGC1672 1.61 0.94 0.13 -14.28
NGC2639 2.44 0.54 0.0027 -17.02
NGC3031b,c 2.64 0.15 0 –
NGC3081 3.28 0.68 0.078 -15.43
NGC3227a >7.53 0.15 0.003 -16.58
NGC3362 2.99 0.58 0.04 -16.45
NGC3393 2.48 0.43 0 –
NGC3486 3.29 0.22 0 –
NGC3516a >9.38 0.24 0 –
NGC3786 5.88 0.22 0.012 -16.74
NGC3982 3.06 0.40 0.031 -16.10
NGC4253 8.46 0.22 0.02 -16.04
NGC4258 2.2 0.45 0.035 -15.18
NGC4303 2.03 0.29 0.13 -14.74
NGC4395a >4.35 0.15 0.0093 -17.07
NGC4565 2.21 0.60 0 –
NGC4593a >6.34 0.50 0.0023 -16.29
NGC4725 2.69 0.57 0 –
NGC4939 3 0.56 0.01 -16.95
NGC4941 3.2 0.39 0.0087 -16.73
NGC5005b 2.5 0.85 0.021 -19.05
NGC5033 3.78 0.23 0.007 -16.05
NGC5135 2.92 0.80 0.3 -14.40
NGC5194b,c 4.31 0.34 0.145 -14.65
NGC5256 5.61 0.52 0.045 -16.23
NGC5273a >8.82 0.18 0.0056 -16.55
NGC5283 3.3 0.33 0.063 -16.04
NGC5347 4.05 0.48 0 –
NGC5548a >6.92 0.18 0.0055 -16.29
NGC5674 3.95 0.31 0.11 -16.04
NGC5695 2.99 0.44 0.039 -16.49
NGC5728 1.8 0.76 0.04 -15.61
NGC5940a >4.11 0.09 0 –
NGC6300 1.78 0.86 0 –
NGC6814a >4.79 0.13 0 –
NGC6951 1.37 0.88 0.13 -14.82
NGC7130 4.96 0.70 0.25 -14.43
NGC7212 4.29 0.51 0.07 -16.17
NGC7319 2.53 0.65 0.023 -17.64
NGC7469a >8.86 0.43 0.115 -14.44

– 36 –
Table 6—Continued
Galaxy C Arms fclus log(Fclus)
Name erg/cm2/s/A
(1) (2) (3) (4) (5)
NGC7479 2.69 0.77 0.01 -17.20
NGC7496 3.9 0.45 0.38 -14.60
NGC7674 5.06 0.47 0.11 -15.67
NGC7743 4.13 0.33 0 –
UGC1214 4.18 0.51 0 –
UGC1395 4.1 0.26 0 –
UGC2456 4.34 0.79 0.3 -15.11
UGC6100 3.95 0.77 0 –
UGC12138a >6.26 0.10 0 –
UM625 4.5 0.33 0.1 -15.90
Note. — Col. (1): Galaxy name; Col. (2): Compactness.
Col. (3): Asymmetry. Col. (4): Fraction of light in stellar
clusters. Col. (5): Logarithm of the total flux of light in clus-
ters in erg/s/cm2/A.
aThese objects posses a very bright compact nucleus that
affects the determination of R20 (see text). In these cases we
can only set a lower limit for the compactness parameter.
bIn these cases Rmax is limited by the border of the field of
view and not by the integration. Compactness and asymmetry
are computed based on this smaller Rmax.
cOcculting finger of the HRC limits the radius for which
the asymmetry parameter (see text) is computed (smaller than
Rmax).

– 37 –
Fig. 15.— Histogram of asymmetry for Sy subsamples. The symbols are the same as in
previous figures.

– 38 –
Fig. 16.— Asymmetry vs compactness plot for the galaxies in the sample. Blue crosses
stand for Sy2 galaxies, while green triangles represent intermediate types. Sy1 are plotted
with red squares.

– 39 –
3.4. The Fraction of Light in Clusters
In order to determine how important is the contribution of the star formation to the
total UV flux we have estimated which fraction of the total flux comes from stellar clusters
or very compact light emission (fclus), not including the compact Sy1 nuclei. Several software
packages were used to detect the clusters. We found that in many cases the highly varying
background, and the large dynamical range in some of the images, were a problem for these
algorithms to give a satisfying result. Also, the varied morphology became a problem for
deciding an homogeneous and unbiased way to perform the analysis automatically. We
obtained sometimes good results with IRAF task DAOFIND, but it did not work well in
crowded regions or with a highly varying background. Often we had to crop the resulting lists
by hand and add some other objects. We thus decided to select the objects by eye inspection.
To be sure that we did selections that were complete enough, we checked using linear and
logarithmic displays, compared with the optical images in unclear cases, and compared with
DAOFIND results. The selections were restricted to the region inside Rmax, in which the
total flux was measured, although sometimes there were obvious star clusters outside this
region. See Fig. 17, in the electronic edition of the Journal, as an illustrative example. Note
that not every clump was added, but only the ones which seemed compact enough to be
considered individual clusters or tight aggregations of them. Selecting the clusters by hand
proved to be effective, although the limiting magnitude cannot be determined due to the
varying background. The completeness of the selection is not critical for this work. Instead,
we were interested in checking how robust the estimation of the flux in clusters was with
respect to different star cluster selections. Wilson, Harris & Longden (2005) study the star
cluster population in Arp220 with the ACS, finding the same problems. The manual cluster
selection also proved to be efficient for them.
The flux determination was done with IRAF task PHOT. We measured the flux within
very small apertures, and then we applied aperture corrections from the enclosed energy
curves of Sirianni et al. (1995). Using different apertures led to different results for fclus, in
part due to the use of a correction for point-like objects, when the star clusters may show
a resolved structure, at least for large objects in nearby galaxies. However, in most objects,
the variation of fclus when considering different apertures (as 3, 4, 5 or 6 pixels radius) was
higher than the variation when using different selection methods. We therefore estimate
that the main uncertainty source is the clustering of the objects and the highly varying
background. Finally we decided to use an aperture radius of 4 pixels, as a compromise
between the sampling effects of a smaller aperture and the possible aperture overlapping of
a larger one, what would also introduce a larger uncertainty in the background subtraction.
The background was calculated by measuring in an annulus of 6 pixel of inner radius and
2 pixel width in a median filtered image with a 15×15 pixel box. The fraction fclus was

– 40 –
Fig. 17.— An example of the cluster selection for NGC5135. Stellar clusters were identified
combining a linear display to disentangle the brightest crowded regions (red circles), and
then using a logarithmic display, in order to identify the faint population (blue circles). A
close-up of the central region is shown in the lower left box.

– 41 –
then determined summing up the total flux in all the objects detected inside Rmax, local
background subtracted and aperture corrected, and divided between the total flux within
Rmax. In Table 6 we give fclus, as well as the logarithm of the total flux in star clusters.
In some galaxies we could not detect any star cluster inside the Rmax aperture. This
happens more often for Sy1 (6 out of 14 galaxies; or 43%) than in Sy2 (14/47; 30%) or
intermediate types (5/14; 36%). Fig. 18 shows a histogram of the distribution of fclus for
the galaxies with detected clusters. Except for Mrk 231, no Sy1 show stellar clusters or
star-forming regions contributing more than 5% to the total flux, while there are 13 (∼ 28%)
of the Sy2 that overcome this value. This confirms that Sy1 galaxies are core dominated
objects, while clusters and star-formation account for a significant fraction of the light in
Sy2. This fraction is smaller than that calculated for UV-selected starburst galaxies, in which
light from clumpy structure is, on average, of the order of 20% of the total flux (Meurer et
al. 1995), although these results are for a different UV filter, at 2200 A.
In order to directly compare the flux coming from clusters among the different subsam-
ples, we plot in Fig. 19 a comparative histogram of the total luminosity from stellar clusters.
Despite the small number of Sy1 and intermediate type galaxies involved, this Figure shows
these sources have a similar distribution of values to that of Sy2. This suggests that these
sources have similar amounts of recent star formation, confirming that most of the differ-
ences seen in Fig. 18 were due to the strong contribution from the nuclear point source in
the former.
We have shown that, in spite of the very high resolving power of HST, the bright Sy1
nuclei dominate the emission of the very inner near-UV morphology in this kind of galaxies.
In order to unmask possible underlying star-forming regions a very careful PSF-subtracting
for Sy1 nuclei is needed. Our team is currently working on this matter, and the results will
be presented in a forthcoming paper (Spinelli et al.; in prep.).
4. CONCLUSIONS
Using the high resolution of the Advanced Camera for Surveys onboard HST we per-
formed a snapshot survey of a sample of 75 nearby Seyfert galaxies in the near-UV. These
observations complete a very useful multi-wavelength database for these AGN, which have
also optical and near-IR images available in the HST archive. We have carried out a general
analysis of the near-UV images of this sample, consisting in the identification of unresolved
compact nuclear sources, extraction of surface brightness profiles, photometry, determination
of compactness and asymmetry parameters and identification of the star cluster population.

– 42 –
Fig. 18.— Histogram of fclus for different Sy types. Only galaxies with detected star clusters
have been included.

– 43 –
Fig. 19.— Histogram of the total Luminosity coming from star clusters. The three distribu-
tions look quite similar.

– 44 –
The size of the sample allows us to compare the results of the analysis among different Sy
types: Sy1 (including Sy1.2-1.5), Sy2 and intermediate types (Sy1.8-1.9).
The main conclusions from the photometric and morphological study are:
- In general, the morphology in the UV is very irregular, with clumpy and compact
structure in most cases.
- Sy1 are completely PSF dominated objects in their inner regions, but Nuker law profiles
are detected for some of the galaxies. Inspecting the surface brightness profiles we find 3/14
Sy1 galaxies, and 6/47 Sy2, which posses a star-forming ring. On the contrary, no star-
forming rings are found within the intermediate Sy type subsample. Sy2 galaxies present
the most varied and irregular profiles. Some profiles follow an exponential, de Vaucouleurs
or Nuker law, but most of them cannot be easily classified.
- No nucleus is resolved for any of the Sy1 objects, while on the other hand, almost all
Sy2 have the nucleus resolved. At least 5/14 Sy1.8-1.9 galaxies show an unresolved compact
nucleus.
- In terms of surface brightness at 1′′, and also from the calculation of the integrated
magnitude between 0.3′′ and 1′′, we find no significant difference between the host galaxies
of Sy1 and Sy2 nuclei. The difference would arise solely due to the presence of the nuclear
source in Sy1.
- Sy1 are very compact and have low values of asymmetry, while Sy2 show a very wide
range of compactness and asymmetry values.
From the study of the fraction of light in clusters we conclude that:
- Bright star clusters are slightly more often seen in Sy2 (∼70%) than in Sy1 (∼57%),
or in intermediate Sy types (∼64%). However, we have shown that this difference may be
due to the masking of the inner regions by the contribution of the bright Seyfert 1 nucleus.
- The distribution of the luminosity in star clusters does not change much among dif-
ferent Sy types, when considering only galaxies with detected clusters.
- The contribution of the clusters to the total flux is much more important in Sy2 (where
it reaches up to 30%) than in the other Sy types, but this is at least partially due to the
large contribution of the nuclear source in the Sy1 and intermediate Sy types.
VMMM research is funded by the Spanish Research Council (CSIC) under the I3P grant
program. This work was supported in part by the Spanish Ministerio de Educacion y Ciencia
under grant AYA2004-02703.

– 45 –
All the figures published only in the electronic edition of the Astronomical Journal will
be available to download as EPS files in the URL:
http://www.iaa.es/∼manuel/publications/paper01.html
A. ATLAS OF THE SAMPLE
Brief description and notes on individual objects. The descriptions refer to the F330W
images unless it is said otherwise.
A.1. Sy1,1.2 & 1.5
• Mrk 6 (Figs. 7.1, 9.1, 20.1): This object is a Sy1.5 with a very bright saturated
core with some extended emission around.
• Mrk 40 (Figs. 7.2, 9.2, 20.2): This galaxy shows just a plain point-like bright
source.
• Mrk 42 (Figs. 7.3, 9.3, 20.3): A very bright compact nucleus with a very tight
wound spiral of star formation of ∼300 pc of radius. Many stellar clusters are individ-
ually resolved.
• Mrk 231 (Figs. 7.4, 9.4, 20.4): This is a very powerful galaxy with a bright nucleus
and some diffuse circumnuclear emission. There is an arc of star formation about 2
Kpc to the south. This object falls next to the limit of its classification as a Quasar,
and is also an IRAS galaxy, very luminous in the FIR (e.g. Soifer, Neugebauer &
Houck, 1987). It shows as well a powerful megamaser emission first detected by Baan
(1985).
• Mrk 493 (Figs. 7.5, 9.5, 20.5): Its morphology resembles that of Mrk 42, with a very
bright nucleus and a tight wound spiral of star formation. However, the distance to
this object is 50% higher than the distance to Mrk 42, so the individual stellar clusters
are poorly resolved.
• Mrk 915 (Figs. 7.6, 9.6, 20.6): This galaxy is a prototypical Sy1, with a very bright
nucleus surrounded by diffuse emission.
• NGC3227 (Figs. 7.7, 8.1, 9.7, 20.7): This Sy1.5 shows a bright saturated nucleus
and an off-centered bar of star forming regions, which is misaligned with the main
galactic bar. This feature is probably caused by a close interaction with the dwarf

– 46 –
elliptical NGC3226. There is a star forming region 100 pc to the north that is also
visible in [OIII] images (Schmitt & Kinney, 1996). X-ray variability from its nuclear
source has also been reported (Gondoin, 2004).
• NGC3516 (Figs. 7.8, 9.8, 20.8): There is diffuse light surrounding the bright
nucleus of this galaxy up to several hundred pc away. There is also evidence of ob-
scuration by dust to the south and to the north of the nucleus. The northern dusty
patches trace a spiral pattern.
• NGC4253 (Figs. 7.9, 9.9, 20.9): This is a barred spiral with several bright star-
forming knots and star clusters. An important part of the star formation seems to be
associated to the east part of the bar. The bar itself is visible in the UV image.
• NGC4593 (Figs. 7.10, 9.10, 20.10): Apart of the bright nucleus, there is a spiral
structure of 1 Kpc width with many individually resolved star clusters.
• NGC5548 (Figs. 7.11, 9.11, 20.11): This is a face-on spiral with a very bright
nucleus. Several hundred parsecs to the north of the nucleus there is an arc of star
formation, plus several scattered and relatively isolated stellar clusters still further
away.
• NGC5940 (Figs. 7.12, 9.12, 20.12): This is a face-on barred spiral with many
star clusters and star forming regions tracing the bar and spiral arms. Due to the
combination of size and distance, most of this structure is included in the ACS-HRC
field of view.
• NGC6814 (Figs. 7.13, 9.13, 20.13): In this image there is not much visible apart
of the plain PSF of the nucleus and some faint structure of the outer face-on spiral.
• NGC7469 (Figs. 7.14, 9.14, 20.14): This is very interesting object, with a faint
spiral that becomes a conspicuous ring of star formation in the inner some hundred
pc. Many stellar clusters are individually resolved within this region.
A.2. Sy1.8 & 1.9
• Mrk 334 (Figs. 7.15, 9.15, 20.15): This is a peculiar-HII galaxy with irregular
nuclear structure, and strong star formation. It is also a strong IR source.
• Mrk 471 (Figs. 7.16, 9.16, 20.16): It is very obscured by dust. The UV image shows
only a point-like nucleus and many scattered star-forming blobs and star clusters. In

– 47 –
the optical image the barred spiral structure is better distinguished, with many dust
lanes tracing the bar.
• Mrk 516 (Figs. 7.17, 8.2, 9.17, 20.17): This galaxy is classified as a Sc. Although
it looks quite regular in the IR, at the U band is clearly asymmetric, with a star-
forming arm to the south that has not counterpart to the north. The nucleus, that
looks double in WFPC2 image, is at the limit of the resolution and clearly separated
from a bright blob right next to the north (∼100 pc).
• NGC2639 (Figs. 7.18, 9.18, 20.18): The nucleus is heavily obscured and no com-
pact source is seen in the images. However, the main spiral structure is visible, with
many stellar clusters in the outer region (several Kpc away from the centre).
• NGC3031 (M81; Figs. 7.19, 9.19, 20.19): This is the largest galaxy of one of the
nearest groups. It is a typical Sa, with a big bulge that fills the whole field of view
of the camera. Some dust lanes are seen in the inner region, although no young star
clusters are clearly visible in the UV image. Ho, Filippenko & Sargent (1995) describe
it as a LINER.
• NGC3786 (Figs. 7.20, 9.20, 20.20): This galaxy shows a nuclear ring of a few
hundred pc radius in HST optical images that is incomplete in the UV. An ionization
cone coming from the compact nucleus, to the southeast, is clearly detected.
• NGC4258 (M106; Figs. 7.21, 9.21, 20.21): The compact nucleus is resolved in
our observation. There are many stellar clusters that can be studied individually, and
there is a vast amount of absorption by dust in the southwest half of the image. This
galaxy hosts a water masing disk that led to the second best determination of the
mass of a super-massive black hole (SBH), after the one in the Milky Way (Miyoshi et
al. 1995).
• NGC4395 (Figs. 7.22, 9.22, 20.22): This is one of those objects for which the
nucleus is at the limit of resolution. It is the object of the latest Hubble type in our
sample (Sm). With such a small contribution of the bulge, only several scattered stellar
clusters are seen apart from the nucleus and a region of diffuse light 10-20 pc to the
west of it.
• NGC4565 (Figs. 7.23, 9.23, 20.23): This is a nearby edge-on galaxy. The nuclear
region is thus very obscured at this wavelength with neat dust absorption. The nucleus
appears partially resolved.

– 48 –
• NGC5033 (Figs. 7.24, 9.24, 20.24): The galaxy shows an unresolved nucleus
together with an ionization cone open to the east (see Mediavilla et al. 2005). Heavy
absorption to the west may be responsible for this asymmetry. There is an interesting
feature consisting in a bright bar of light coming from the nucleus and extending
2 arcsec to the north. This might be scattered light from the AGN or part of the
Extended Narrow Line Region.
• NGC5273 (Figs. 7.25, 9.25, 20.25): This is a lenticular galaxy with the typical
morphology of an early type galaxy. It shows a point-like nucleus with extended light
emission within the central 100 pc. There are some bright areas and dark lanes. The
morphology seen with F606W is very similar, suggesting that the dark lanes are caused
by thick dust clouds.
• NGC5674 (Figs. 7.26, 8.3, 9.26, 20.26): Although classified as barred spiral in the
RC3 catalog, this galaxy clearly shows a ring in UV light. The nuclear morphology is
very interesting, with several clumps and stellar clusters embedded in a diffuse emission
in the central few hundred pc.
• UGC 1395 (Figs. 7.27, 9.27, 20.27): This object shows a partially resolved nucleus
and a circular shell of ∼200 pc radius.
• UGC 12138 (Figs. 7.28, 9.28, 20.28): It shows a bright point-like nucleus and
diffuse emission adjacent to the north. To larger scales (several Kpc) it shows a faint
filamentary structure.
A.3. Sy2
• CGCG 164-019 (Figs. 7.29, 9.29, 20.29): This Sy2 galaxy shows a bright nucleus
and a wide open spiral pattern. Some star clusters and knots are visible within the
inner Kpc region, as well as diffuse light that might come from an unresolved stellar
component.
• Circinus (Figs. 7.30, 9.30, 20.30): This is a nearby spiral with a heavily obscured
nucleus. The most prominent feature is a central ring of diffuse light and a star-forming
blob 200 pc to the south. The galactic latitude of this object is very low, so the image
may suffer from foreground stars contamination. This galaxy is known to host a nuclear
water masing disk in a sub-parsec scale (Greenhill et al. 2003) and to have a kiloparsec
scale ionization cone (Marconi et .al. 1994).
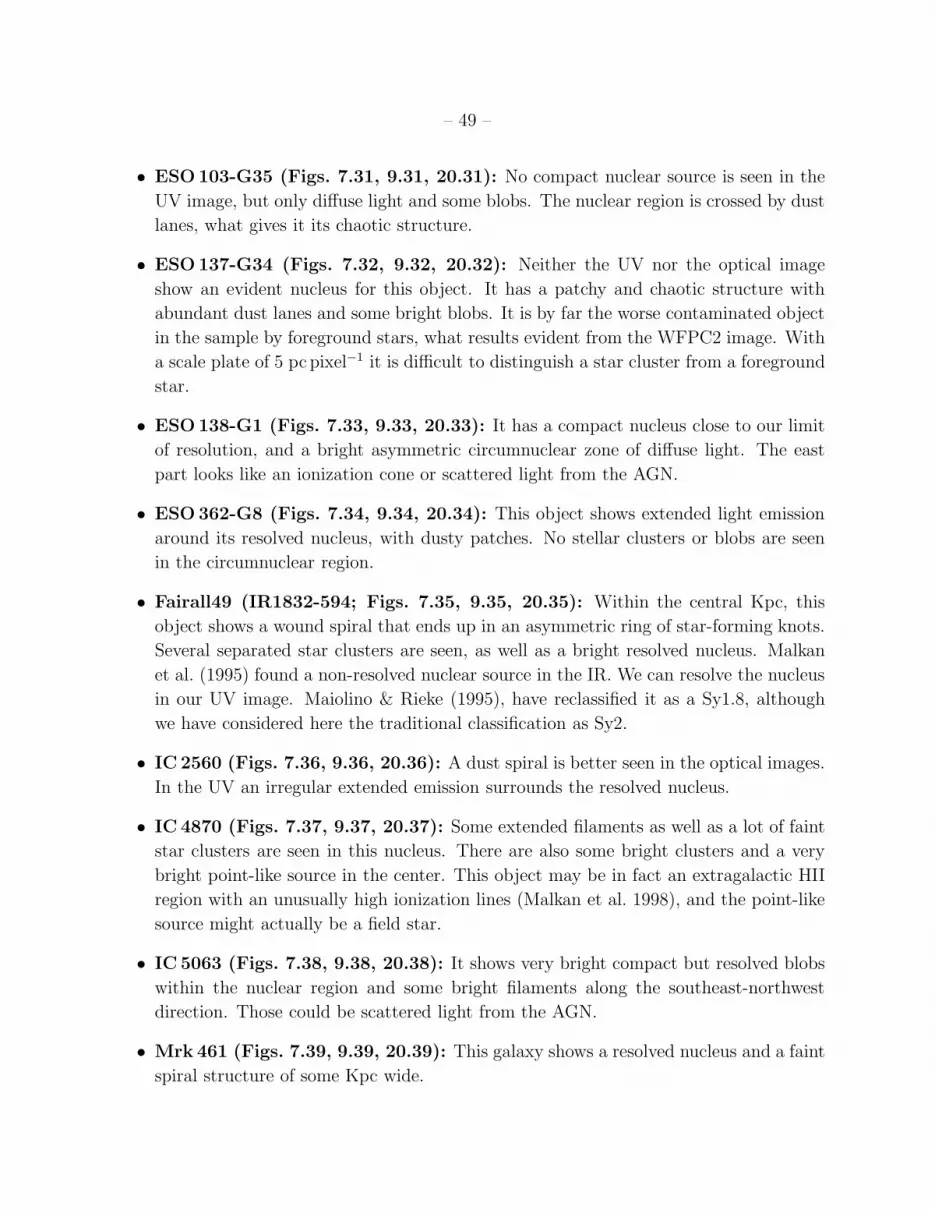
– 49 –
• ESO 103-G35 (Figs. 7.31, 9.31, 20.31): No compact nuclear source is seen in the
UV image, but only diffuse light and some blobs. The nuclear region is crossed by dust
lanes, what gives it its chaotic structure.
• ESO 137-G34 (Figs. 7.32, 9.32, 20.32): Neither the UV nor the optical image
show an evident nucleus for this object. It has a patchy and chaotic structure with
abundant dust lanes and some bright blobs. It is by far the worse contaminated object
in the sample by foreground stars, what results evident from the WFPC2 image. With
a scale plate of 5 pc pixel−1 it is difficult to distinguish a star cluster from a foreground
star.
• ESO 138-G1 (Figs. 7.33, 9.33, 20.33): It has a compact nucleus close to our limit
of resolution, and a bright asymmetric circumnuclear zone of diffuse light. The east
part looks like an ionization cone or scattered light from the AGN.
• ESO 362-G8 (Figs. 7.34, 9.34, 20.34): This object shows extended light emission
around its resolved nucleus, with dusty patches. No stellar clusters or blobs are seen
in the circumnuclear region.
• Fairall49 (IR1832-594; Figs. 7.35, 9.35, 20.35): Within the central Kpc, this
object shows a wound spiral that ends up in an asymmetric ring of star-forming knots.
Several separated star clusters are seen, as well as a bright resolved nucleus. Malkan
et al. (1995) found a non-resolved nuclear source in the IR. We can resolve the nucleus
in our UV image. Maiolino & Rieke (1995), have reclassified it as a Sy1.8, although
we have considered here the traditional classification as Sy2.
• IC 2560 (Figs. 7.36, 9.36, 20.36): A dust spiral is better seen in the optical images.
In the UV an irregular extended emission surrounds the resolved nucleus.
• IC 4870 (Figs. 7.37, 9.37, 20.37): Some extended filaments as well as a lot of faint
star clusters are seen in this nucleus. There are also some bright clusters and a very
bright point-like source in the center. This object may be in fact an extragalactic HII
region with an unusually high ionization lines (Malkan et al. 1998), and the point-like
source might actually be a field star.
• IC 5063 (Figs. 7.38, 9.38, 20.38): It shows very bright compact but resolved blobs
within the nuclear region and some bright filaments along the southeast-northwest
direction. Those could be scattered light from the AGN.
• Mrk 461 (Figs. 7.39, 9.39, 20.39): This galaxy shows a resolved nucleus and a faint
spiral structure of some Kpc wide.

– 50 –
• Mrk 477 (Figs. 7.40, 9.40, 20.40): This compact galaxy hosts a very luminous Sy2
nucleus that has been proved by spectropolarimetry to have a hidden Sy1 (Tran, Miller
& Kay, 1992). Heckman et al. (1997) have shown that it hosts a very compact nuclear
starburst. The galaxy is interacting with a companion 50 arcsec to the north. The
nucleus is extended and it shows a bright blob close to the northeast. There is as well
an arc of star formation further, in the same direction.
• Mrk 1210 (Figs. 7.41, 8.4, 9.41, 20.41): This is a compact face-on spiral. The
tight wound spiral structure is visible in our image more like a ring, as traced by star
forming regions. The bright nucleus appears double at close inspection. Tran, Miller
& Kay (1992) showed, by spectropolarimetry, the presence of a hidden BLR.
• NGC449 (Figs. 7.42, 8.5, 9.42, 20.42): This object shows a bright resolved nucleus
and several stellar cluster and knots. Star forming regions and dust lanes trace a highly
inclined spiral.
• NGC1144 (Figs. 7.43, 9.43, 20.43): It belongs to an interacting pair of galaxies
(NGC1143-1144). It shows a very distorted spiral structure with a circumnuclear ring
traced out by dust lanes and bright regions. The nucleus is crossed by dark patches of
dust.
• NGC1320 (Figs. 7.44, 9.44, 20.44): Although resolved, it possesses a bright com-
pact nucleus. Most of the light is confined to a region of less than 100 pc wide. There
is also a remarkable bright and narrow filament extending to the north-west. Dust
lanes and extended emission trace a tight spiral patter, although no stellar clusters are
clearly detected in our image.
• NGC1672 (Figs. 7.45, 9.45, 20.45): This barred spiral harbors a very intense
starburst within the inner Kpc. Many bright stellar clusters are individually resolved
in the near-UV image. The star formation is mostly arranged in a ring, inside which
there is also an extended diffuse emission. The dust distribution seems completely
asymmetrical, with heavy absorption to the north-east half of the nuclear region.
• NGC3081 (Figs. 7.46, 8.5, 9.46, 20.46): This is a peculiar ringed-galaxy, with
two nested rings, the smaller of which is shown in our F330W image. It has a bright
resolved compact nucleus, with a bright ionization cone extending to the north. There
is as well an important star forming region ∼300 pc to the south-east of the nucleus.
• NGC3362 (Figs. 7.47, 9.47, 20.47): Many stellar clusters and star forming regions
trace out a wide open spiral pattern. The nucleus is resolved, elongated and have an
extension to the west in the form of a bright filament.

– 51 –
• NGC3393 (Figs. 7.48, 9.48, 20.48): Kondratko et al. (2006) have recently detected
signatures of a water masing disk in the sub-parsec scale, around the central SMBH.
The image shows an s-shaped bright symmetric filament, what seems to be an ionization
cone from the central engine.
• NGC3486 (Figs. 7.49, 9.49, 20.49): This is a border-line object between Seyfert
and LINER, classified as Sy2 by Ho et al. (1997). It has a bright nucleus and an
extended emission with dust patches spiraling inwards.
• NGC3982 (Figs. 7.50, 9.50, 20.50): Although this galaxy was classified as ringed
in the RC3 catalog, in our Hubble images this feature results clearly identified as a
spiral of star-forming regions, star clusters and dust lanes.
• NGC4303 (M61; Figs. 7.51, 9.51, 20.51): It has been reclassified as a Low
Luminosity AGN, although in the original proposal was included as Sy2. The nucleus
is known to host a compact star cluster as the main source of ionizing radiation (Colina
et al. 2002). This nucleus is unresolved in our F330W image. It posses a conspicuous
star-forming ring at ∼250 pc radius, with many clusters individually resolved.
• NGC4725 (Figs. 7.52, 9.52, 20.52): The nuclear morphology of this early type
spiral shows not many features apart of the bright resolved nucleus surrounded by an
extended emission with a clear exponential profile.
• NGC4939 (Figs. 7.53, 9.53, 20.53): The most noticeable feature of this nucleus
is a biconical ionization structure coming out from the central source.
• NGC4941 (Figs. 7.54, 9.54, 20.54): It shows an extended emission crossed by
dark dust lanes. The nucleus has a compact clumpy structure with a bright compact
core.
• NGC5005 (Figs. 7.55, 9.55, 20.55): The nucleus has both clumpy and diffuse
emission, with a very broad dust lane obscuring the north part of the image. An spiral
arm is visible to the south with several isolated star clusters and richer star-forming
regions.
• NGC5135 (Figs. 7.56, 8.7, 9.56, 20.56): This is a nice example of a very strong
nuclear starburst, with many bright star clusters individually resolved and two wide
open spiral arms, traced by star-forming regions.
• NGC5194 (M51; Figs. 7.57, 8.8, 9.57, 20.57): The nucleus is completely obscured
and surrounded by a bright extended emission and crossed by dark dust lanes. The

– 52 –
inner several hundred parsecs show some few isolated star clusters, while the outer
regions are richly crowded with clusters and star-forming regions.
• NGC5256 (Figs. 7.58, 9.58, 20.58): This object is in fact a merging system
with a double nucleus separated by ∼5 pc. We have studied the northeastern nucleus,
that is outstandingly brighter in our near-UV image than its southwestern companion.
Actually, this nucleus has been classified as a LINER in the literature (Osterbrock &
Dahari, 1983). The structure of the nucleus is compact, clumpy and irregular.
• NGC5283 (Figs. 7.59, 9.59, 20.59): The nucleus is bright and clumpy, with several
almost adjacent objects. It shows filamentary structure of gas extending from the
nucleus to the northeast.
• NGC5347 (Figs. 7.60, 9.60, 20.60): This is a ringed and barred spiral, although
in our image only the inner 100 pc are distinguishable. The nucleus is very bright and
conical opening to the northeast. There is also an extended and quite homogeneous
emission more obvious to the north side of the nucleus.
• NGC5695 (Figs. 7.61, 9.61, 20.61): The nucleus is compact but resolved, with a
blob 0.2 arcsec to the north. There is a faint diffuse emission around it that follows a
de Vaucouleurs profile.
• NGC5728 (Figs. 7.62, 9.62, 20.62): This is peculiar galaxy with a neatly distorted
ring of star-forming regions. The nucleus is completely obscured and it shows an
obvious ionization cone opening to the east.
• NGC6300 (Figs. 7.63, 9.63, 20.63): This galaxy is heavily obscured, so only a
faint diffuse emission can be appreciated in our image.
• NGC6951 (Figs. 7.64, 9.64, 20.64): This object shows a very regular ring of star-
forming regions and stellar clusters. Inside the ring the surface brightness remains
constant. The nucleus is diffuse and extended, with a couple of brighter blobs.
• NGC7130 (Figs. 7.65, 8.9, 9.65, 20.65): It shows an interesting morphology, with
a ring and an inner bar. It is very rich in star-forming knots and stellar clusters, with
a very bright region that is off-center the ring. We have chosen as the galaxy center
the centroid of the brightest of these blobs. The morphology of the center in F330W
coincides with that of F210M presented in Gonzalez Delgado et al. (1998).
• NGC7212 (Figs. 7.66, 9.66, 20.66): This galaxy belongs to a compact group of
interacting galaxies. Spectropolarimetric studies have shown the presence of a hidden

– 53 –
BLR (Tran, Miller & Kay, 1992). It shows a clumpy nuclear morphology and irregular
diffuse emission.
• NGC7319 (Figs. 7.67, 9.67, 20.67): This object has the lowest measured UV flux
in the sample. The nucleus is faint and shows an ionization cone opening to the north.
• NGC7479 (Figs. 7.68, 9.68, 20.68): The nucleus is small and resolved and there
are some scattered star clusters throughout the field of view. It is remarkable a chain of
bright clusters 5 arcsec to the south of the nucleus, that has a north-south alignment.
• NGC7496 (Figs. 7.69, 9.69, 20.69): This barred spiral hosts a very powerful
starburst in its center. In the image many star clusters can be seen embedded in a
diffuse emission. The center has been chosen as the brightest object in the field.
• NGC7674 (Figs. 7.70, 8.10, 9.70, 20.70): An obvious spiral structure with many
star-forming regions. The nucleus is very bright and embedded in a extended diffuse
emission and surrounded by an arc of star formation.
• NGC7743 (Figs. 7.71, 9.71, 20.71): This galaxy is classified as an SB, although
in our near-UV image no signs of the spiral structure can be detected. The nucleus is
bright and it is surrounded by a diffuse emission that appears brighter to the south.
• UGC 1214 (Figs. 7.72, 8.11, 9.72, 20.72): The nucleus is very bright and is is
surrounded by a Kpc-scale symmetrical structure that seems to be an ionization cone.
• UGC 2456 (Figs. 7.73, 8.12, 9.73, 20.73): It has a bright clumpy nucleus and
S-shaped extended emission with three bright stellar clusters in it.
• UGC 6100 (Figs. 7.74, 9.74, 20.74): Although the SNR in the image is low, a
spiral pattern with several star-forming regions is detected. The nucleus is extended
and diffuse.
• UM 625 (Figs. 7.75, 9.75, 20.75): This galaxy has a very bright compact nucleus
that is partially resolved in our image. It also possesses a bright star cluster ∼150 pc
directly to the west. Apart from this, the emission is diffuse and compact, as most of
the light is enclosed within 1 arcsec from the nucleus.
A.4. Visual Catalogue
An image-atlas of all the objects is presented. We show the whole field of view of
the near-UV images in Figs. 20.1–20.75. In most cases these figures show additional and

– 54 –
complementary information to that of Figs. 7 and 8.
REFERENCES
Alonso-Herrero, A., Quillen, A. C., Rieke, G. H., Ivanov, V. D., & Efstathiou, A. 2003, AJ,
126, 81
Antonucci, R. 1993, ARA&A, 31, 473
Antonucci, R. R. J., & Miller, J. S. 1985, ApJ, 297, 621
Baan, W. A. 1985, Nature, 315, 26
Bershady, M. A., Jangren, A., & Conselice, C. J. 2000, AJ, 119, 2645
Boker, T., Laine, S., van der Marel, R. P., Sarzi, M., Rix, H.-W., Ho, L. C., & Shields, J. C.
2002, AJ, 123, 1389
Cardelli, J. A., Clayton, G. C., & Mathis, J. S. 1989, ApJ, 345, 245
Carollo, C. M., Stiavelli, M., Seigar, M., de Zeeuw, P. T., & Dejonghe, H. 2002, AJ, 123, 159
Cid Fernandes, R., Gu, Q., Melnick, J., Terlevich, E., Terlevich, R., Kunth, D., Rodrigues
Lacerda, R., & Joguet, B. 2004, MNRAS, 355, 273
Cid Fernandes, R., Heckman, T., Schmitt, H., Delgado, R. M. G., & Storchi-Bergmann, T.
2001, ApJ, 558, 81
Cid Fernandes, R. J., & Terlevich, R. 1995, MNRAS, 272, 423
Colina, L., Gonzalez Delgado, R., Mas-Hesse, J. M., & Leitherer, C. 2002, ApJ, 579, 545
Colina, L., Garcıa Vargas, M. L., Mas-Hesse, J. M., Alberdi, A., & Krabbe, A. 1997, ApJ,
484, L41
Conselice, C. J. 1997, PASP, 109, 1251
Cruz-Gonzalez, I., Carrasco, L., Serrano, A., Guichard, J., Dultzin-Hacyan, D., & Bisiacchi,
G. F., 1994, ApJS, 94, 47
Dahari, O., & de Robertis, M. M. 1988, ApJS, 67, 249
de Grijp, M. H. K., Keel, W. C.; Miley, G. K., Goudfrooij, P., & Lub, J, A&AS, 96, 389
Elitzur, M., & Shlosman, I. 2006, ApJ, 648, L101
Elvis, M. 2000, ApJ, 545, 63
Falcke, H., Wilson, A. S. & Simpson, C. 1998, ApJ, 502, 199
Ferrarese, L., & Merritt, D. 2000, ApJ, 539, L9

– 55 –
Fig. 20.— ACS example image showing the field of view (FOV) of NGC5135. The whole
set of FOV images for all the objects in the sample is available in the electronic edition of
the Journal. North is up, east to the left.

– 56 –
Ferrarese, L., et al. 2006, ApJ, 644, L21
Ferruit, P. Wilson, A. S. & Mulchaey, J. S. 2000, ApJS, 128, 139
Freedman, W. L., Hughes, S. M., Madore, B. F., Mould, J. R. et al. 1994, ApJ, 427, 628
Freeman K. C. 1970, ApJ, 160, 811
Freeman K. C., Karlsson B., Lynga G., et al. 1977, A&A, 55, 445
Gebhardt, K., et al. 2000, ApJ, 539, L13
Gondoin, P. 2004, Nuclear Physics B Proceedings Supplements, 132, 181
Gonzaga, S., et al., 2005, “ACS Instrument Handbook”, Version 6.0, (Baltimore: STScI).
Gonzalez Delgado, R. M., Heckman, T., & Leitherer, C. 2001, ApJ, 546, 845
Gonzalez Delgado, R. M., Heckman, T., Leitherer, C., Meurer, G., Krolik, J., Wilson, A. S.,
Kinney, A., & Koratkar, A. 1998, ApJ, 505, 174
Greenhill, L. J., Booth, R. S., Ellingsen, S. P., Herrnstein, J. R. et al. 2003, ApJ, 590, 162
Gu, Q., Melnick, J., Cid Fernandes, R., Kunth, D., Terlevich, E., Terlevich, R. 2006, MN-
RAS, 366, 480
Heckman, T. M., Gonzalez-Delgado, R., Leitherer, C., Meurer, G. R., Krolik, J., Wilson,
A. S., Koratkar, A., & Kinney, A. 1997, ApJ, 482, 114
Ho, L. C., Filippenko, A. V., & Sargent, W. L. 1995, ApJS, 98, 477
Ho, L. C., Filippenko, A. V., & Sargent, W. L. W. 1997, ApJS, 112, 315
Huchra, J., & Burg, R. 1992, ApJ, 393, 90
Kinney, A. L., Bohlin, R. C., Calzetti, D., Panagia, N., & Wyse, R. F. G. 1993, ApJS, 86, 5
Kondratko, P. T., Greenhill, L. J., Moran, J. M., Lovell, J. E. J. et al. 2006, ApJ, 638, 100
Lauer, T. R., Ajhar, E. A., Byun, Y. I., Dressler, A., et al. 1995, AJ, 110, 2622
Lipovetsky, V. A., Neizvestny, S. I., & Neizvestnaya, O. M. 1988, Soobshcheniya Spetsial’noj
Astrofizicheskoj Observatorii, 55, 5
McLeod, K. K., & Rieke, G. H. 1995, ApJ, 441, 96
Magorrian, J., et al. 1998, AJ, 115, 2285
Maiolino, R., & Rieke, G. H. 1995, ApJ, 454, 95
Malkan, M. A., Gorjian, V., & Tam, R. 1998, ApJ, 117, 25
Marconi, A., Moorwood, A. F. M., Origlia, L., & Oliva, E. 1994, The Messenger, 78, 20
Mediavilla, E., Guijarro, A., Castillo-Morales, A., Jimenez-Vicente, J., Florido, E., Arribas,
S., Garcıa-Lorenzo, B., Battaner, E., 2005, A&A, 433, 79

– 57 –
Meurer, G. R., Heckman, T. M., Leitherer, C., Kinney, A., Robert, C., & Garnett, D. R.
1995, AJ, 110, 2665
Miller, J. S., & Goodrich, R. W. 1990, ApJ, 355, 456
Miyoshi, M., Moran, J., Herrnstein, J., Greenhill, L., Nakai, N., Diamond, P., & Inoue, M.
1995, Nature, 373, 127
Mobasher, B., Shardha, J., Dahlen, T., de Mello, D., Lucas, R. A., Conselice, C. J., Grogin,
N. A., & Livio, M. 2004, ApJ, 600, L143
Moles, M., Marquez, I., & Perez, E. 1995,ApJ, 438, 604
Morris, S. L. & Ward, M. J. 1988, MNRAS, 230, 639
Mulchaey, J. S., Wilson, A. S. & Tsvetanov, Z. 1996, ApJS, 102, 309
Nelson, C. H., MacKenty, J. W., Simkin, S. M. & Griffiths, R. E. 1996, ApJ, 466, 713
Oliva, E., Salvati, M., Moorwood, A. F. M., & Marconi, A. 1994, A&A, 288, 457
Osterbrock, D. E. 1981, ApJ, 249, 462
Osterbrock, D. E., & Dahari, O. 1983, ApJ, 273, 478
Pavlovsky, C., et al. 2004, ”ACS Data Handbook”, Version 3.0, (Baltimore STScI).
Perez, E., Gonzalez-Delgado, R., Tadhunter, C., & Tsvetanov, Z. 1989, MNRAS, 241, 31P
Quillen, A. C., McDonald, C., Alonso-Herrero, A., Lee, A., Shaked, S., Rieke, M. J. & Rieke,
G. H. 2001, ApJ, 547, 129
Rossa, J., van der Marel, R. P., Boker, T., Gerssen, J., Ho, L. C., Rix, H.-W., Shields, J. C.,
& Walcher, C.-J. 2006, AJ, 132, 1074
Sanders, D. B., & Mirabel, I. F. 1996, ARA&A, 34, 749
Schmitt, H. R., Donley, J. L., Antonucci, R. R. J, Hutchings, J. B., & Kinney, A. L. 2003,
ApJS, 148, 327
Schmitt, H. R., & Kinney, A. L. 1996, ApJ, 463, 498
Sirianni, M., Jee, M. J., Benıtez, N., Blakeslee, J. P., et al. 2005, PASP, 117, 1049
Soifer, B. T., Neugebauer, G., & Houck, J. R. 1987, ARA&A, 25, 187
Storchi-Bergmann, T., Bica, E. & Pastoriza, M. G. 1990, MNRAS, 245, 749
Storchi-Bergmann, T., Kinney, A. L., & Challis, P. 1995, ApJS, 98, 103
Storchi-Bergmann, T. & Pastoriza, M. G. 1989, ApJ, 347, 195
Storchi-Bergmann, T., Raimann, D., Bica, E. L. D., & Fraquelli, H. A. 2000, ApJ, 544, 747
Tadhunter, C., & Tsvetanov, Z. 1989, Nature, 341, 422

– 58 –
Terlevich, E., Dıaz, A. I., & Terlevich, R. 1990, Revista Mexicana de Astronomıa y As-
trofısica, vol. 21, 21, 218
Terlevich, R., Melnick, J., Masegosa, J., Moles, M., & Copetti, M. V. F. 1991, A&AS, 91,
285
Tran, H. D. 1995, ApJ, 440, 597
Tran, H. D., Miller, J. S., & Kay, L. E. 1992, ApJ, 397, 452
Tully, R.B., 1988, Nearby Galaxies Catalogue, Cambridge University Press
Walcher, C. J., Boker, T., Charlot, S., Ho, L. C., Rix, H.-W., Rossa, J., Shields, J. C., &
van der Marel, R. P. 2006, ApJ, 649, 692
Whittle, M. 1992, ApJS, 79, 49
Wilson, A. S., Ward, M. J., & Haniff, C. A. 1988, ApJ, 334, 121
Wilson, C. D., Harris, W. E., Longden, R. & Scoville, N. Z. 2006, ApJ, 641, 763
This preprint was prepared with the AAS LATEX macros v5.2.


![ITAL]Hubble Space Telescope[/ITAL] Proper Motion Confirms the Optical Identification of the Nearby Pulsar PSR 1929+10](https://static.fdokumen.com/doc/165x107/6322a090078ed8e56c0a7f38/italhubble-space-telescopeital-proper-motion-confirms-the-optical-identification.jpg)