OASIS integral-field spectroscopy of the central kpc in 11 Seyfert 2 galaxies
40
Astronomy & Astrophysics manuscript no. Stoklasova c ESO 2009 May 20, 2009 OASIS integral-field spectroscopy of the central kpc in 11 Seyfert 2 galaxies Ivana Stoklasov´ a 1,2 , Pierre Ferruit 3 , Eric Emsellem 3 , Bruno Jungwiert 1 , Emmanuel P´ econtal 3 , Sebastian F. S´ anchez 4 1 Astronomical Institute of the Academy of Sciences of the Czech Republic, v.v.i., Boˇ cn´ ı II 1401, CZ-14131 Prague, Czech Republic 2 Faculty of Mathematics and Physics, Charles University in Prague, Ke Karlovu 3, CZ-12161 Prague, Czech Republic 3 Universit´ e de Lyon, France; Universit´ e Lyon 1, F-69007; CRAL, Observatoire de Lyon, F-69230 Saint-Genis-Laval; CNRS, UMR 5574; ENS de Lyon, France 4 Centro Astron ´ omico Hispano Alem´ an, Calar Alto, CSIC-MPG, C/Jes´ us Durb´ an Rem ´ on 2-2, 04004 Almer´ ıa, Spain Received 27 October 2008 / Accepted 15 January 2009 ABSTRACT Aims. We examine the physical conditions of ionised gas in the central kiloparsec(s) of nearby Seyfert galaxies. Our aim is a detailed two-dimensional mapping of optical spectroscopic properties, searching for features in the emission structure and in gas kinematics which would be common to all the active galactic nuclei (AGN) or their class, and which would help us to understand the origin and nature of the circumnuclear gas, and its role in the AGN. Methods. We map narrow-line regions (NLRs) of 11 nearby Seyfert2 galaxies with the optical integral-field spectrograph OASIS mounted at CFHT. We model emission-line profiles of 5 forbidden-line doublets and 2 Balmer lines, correcting for the underlying stellar absorption by reconstructing stellar spectra with synthetic evolutionary stellar population models. Results. For each of the 11 targets, we present 2D maps of surface brightness in the observed emission lines, diagnostic line intensity ratios, gas kinematics (mean line-of-sight velocity and velocity dispersion), electron density, and interstellar reddening, and we plot spatially resolved spectral-diagnostic diagrams. The stellar data are represented by maps of mean line-of-sight (LOS) velocities and of the relative mass fractions of the young stellar populations. The gas velocity fields in 80% of the sample exhibit twisted S- shaped isovelocity contours, which are signatures of non-circular orbits and indicate non-axisymmetric gravitational potentials, gas motions out of the galactic plane, or possible outflows and inflows. Based on the kinematic measurements, we identified a possible nuclear ring or radial gas flow in NGC 262 (Mrk 348), not reported before. Eight of the eleven observed objects exhibit strongly asymmetric or multi-component emission-line profiles, in most cases confined to an elongated region passing through the galactic centre, perpendicular to the major axis of emission. Key words. galaxies: active; galaxies: Seyfert; galaxies: kinematics and dynamics; methods: observational; methods: data analysis; techniques: spectroscopic 1. Introduction In the search for the fuelling mechanism of active galactic nuclei (AGN) and its trigger, no significant differences have been found between the host galaxies of AGN and their quiescent counter- parts. Among others, no excess of galactic bars has been con- firmed in active galaxies (Martini et al. 2003; Laurikainen et al. 2004). On the other hand, recent studies of galactic centres have reported an excess of infrared isophotal twists (Hunt & Malkan 2004) and of twisted isovelocity contours in gas (Dumas et al. 2007), which may imply presence of non-axisymmetric poten- tials (Schinnerer et al. 2000). Focus on gas kinematics in the nu- clear regions thus seems to be the key to understanding the inter- play between the host galaxy and the active nucleus, even though interpretation of the phenomena on very different spatial scales needs to be done with extreme care. Detailed spatially resolved spectroscopic observations of the nuclear regions in large sam- ples of galaxies, followed by proper modelling are hence neces- sary. The Narrow-Line Regions (NLR) represent low-density gas ionised by the central AGN (e.g., Morse et al. 1996; Evans et al. 1999) and extending beyond the central dusty torus. The clas- Send offprint requests to: I. Stoklasov´ a e-mail: [email protected] sical NLRs lie within 10 - 100 pc scales and their kinemat- ics is often perturbed by energy injection from the AGN while gas motions in the so-called extended NLRs (ENLRs), reach- ing to kpc and 10 kpc scales, are thought to be predominantly gravitational. The ENLRs are convenient observational targets for spatially resolved imaging and spectroscopy, especially in nearby Seyfert galaxies. They play a crucial role in attempts to understand the AGN structure and evolution, and in testing of the Unified Models of AGN (Antonucci 1993; Urry & Padovani 1995). By completing narrow-band imaging and aperture spec- troscopy observations of large samples of Seyfert galaxies, ro- bust statistical analyses of NLR properties have been achieved (Mulchaey et al. 1996a; Ho et al. 1997; Schmitt et al. 2003a). Similar surveys with modern spatially resolved spectroscopic techniques are necessary to obtain more complex information and achieve a qualitatively new level of conclusions. As an ex- ample, we mention the controversy in optical imaging studies by Mulchaey et al. (1996a); and Schmitt et al. (2003a), who tested predictions of the Unified Model with respect to the NLR size and morphology, and obtained results that cast doubts on the simple model of ionisation of ambient gas by a cone of radia- tion. However, both studies are affected by the limitations typi- cal of pure imaging: these include the survey sensitivity or con- arXiv:0905.3349v1 [astro-ph.CO] 20 May 2009
-
Upload
univ-lyon1 -
Category
Documents
-
view
6 -
download
0
Transcript of OASIS integral-field spectroscopy of the central kpc in 11 Seyfert 2 galaxies
Astronomy & Astrophysics manuscript no. Stoklasova c© ESO 2009May 20, 2009
OASIS integral-field spectroscopy of the central kpc in 11 Seyfert 2galaxies
Ivana Stoklasova1,2, Pierre Ferruit3, Eric Emsellem3, Bruno Jungwiert1, Emmanuel Pecontal3, Sebastian F. Sanchez4
1 Astronomical Institute of the Academy of Sciences of the Czech Republic, v.v.i., Bocnı II 1401, CZ-14131 Prague, Czech Republic2 Faculty of Mathematics and Physics, Charles University in Prague, Ke Karlovu 3, CZ-12161 Prague, Czech Republic3 Universite de Lyon, France; Universite Lyon 1, F-69007; CRAL, Observatoire de Lyon, F-69230 Saint-Genis-Laval;
CNRS, UMR 5574; ENS de Lyon, France4 Centro Astronomico Hispano Aleman, Calar Alto, CSIC-MPG, C/Jesus Durban Remon 2-2, 04004 Almerıa, Spain
Received 27 October 2008 / Accepted 15 January 2009
ABSTRACT
Aims. We examine the physical conditions of ionised gas in the central kiloparsec(s) of nearby Seyfert galaxies. Our aim is a detailedtwo-dimensional mapping of optical spectroscopic properties, searching for features in the emission structure and in gas kinematicswhich would be common to all the active galactic nuclei (AGN) or their class, and which would help us to understand the origin andnature of the circumnuclear gas, and its role in the AGN.Methods. We map narrow-line regions (NLRs) of 11 nearby Seyfert 2 galaxies with the optical integral-field spectrograph OASISmounted at CFHT. We model emission-line profiles of 5 forbidden-line doublets and 2 Balmer lines, correcting for the underlyingstellar absorption by reconstructing stellar spectra with synthetic evolutionary stellar population models.Results. For each of the 11 targets, we present 2D maps of surface brightness in the observed emission lines, diagnostic line intensityratios, gas kinematics (mean line-of-sight velocity and velocity dispersion), electron density, and interstellar reddening, and we plotspatially resolved spectral-diagnostic diagrams. The stellar data are represented by maps of mean line-of-sight (LOS) velocitiesand of the relative mass fractions of the young stellar populations. The gas velocity fields in 80% of the sample exhibit twisted S-shaped isovelocity contours, which are signatures of non-circular orbits and indicate non-axisymmetric gravitational potentials, gasmotions out of the galactic plane, or possible outflows and inflows. Based on the kinematic measurements, we identified a possiblenuclear ring or radial gas flow in NGC 262 (Mrk 348), not reported before. Eight of the eleven observed objects exhibit stronglyasymmetric or multi-component emission-line profiles, in most cases confined to an elongated region passing through the galacticcentre, perpendicular to the major axis of emission.
Key words. galaxies: active; galaxies: Seyfert; galaxies: kinematics and dynamics; methods: observational; methods: data analysis;techniques: spectroscopic
1. Introduction
In the search for the fuelling mechanism of active galactic nuclei(AGN) and its trigger, no significant differences have been foundbetween the host galaxies of AGN and their quiescent counter-parts. Among others, no excess of galactic bars has been con-firmed in active galaxies (Martini et al. 2003; Laurikainen et al.2004). On the other hand, recent studies of galactic centres havereported an excess of infrared isophotal twists (Hunt & Malkan2004) and of twisted isovelocity contours in gas (Dumas et al.2007), which may imply presence of non-axisymmetric poten-tials (Schinnerer et al. 2000). Focus on gas kinematics in the nu-clear regions thus seems to be the key to understanding the inter-play between the host galaxy and the active nucleus, even thoughinterpretation of the phenomena on very different spatial scalesneeds to be done with extreme care. Detailed spatially resolvedspectroscopic observations of the nuclear regions in large sam-ples of galaxies, followed by proper modelling are hence neces-sary.
The Narrow-Line Regions (NLR) represent low-density gasionised by the central AGN (e.g., Morse et al. 1996; Evans et al.1999) and extending beyond the central dusty torus. The clas-
Send offprint requests to: I. Stoklasovae-mail: [email protected]
sical NLRs lie within 10 − 100 pc scales and their kinemat-ics is often perturbed by energy injection from the AGN whilegas motions in the so-called extended NLRs (ENLRs), reach-ing to kpc and 10 kpc scales, are thought to be predominantlygravitational. The ENLRs are convenient observational targetsfor spatially resolved imaging and spectroscopy, especially innearby Seyfert galaxies. They play a crucial role in attempts tounderstand the AGN structure and evolution, and in testing ofthe Unified Models of AGN (Antonucci 1993; Urry & Padovani1995).
By completing narrow-band imaging and aperture spec-troscopy observations of large samples of Seyfert galaxies, ro-bust statistical analyses of NLR properties have been achieved(Mulchaey et al. 1996a; Ho et al. 1997; Schmitt et al. 2003a).Similar surveys with modern spatially resolved spectroscopictechniques are necessary to obtain more complex informationand achieve a qualitatively new level of conclusions. As an ex-ample, we mention the controversy in optical imaging studies byMulchaey et al. (1996a); and Schmitt et al. (2003a), who testedpredictions of the Unified Model with respect to the NLR sizeand morphology, and obtained results that cast doubts on thesimple model of ionisation of ambient gas by a cone of radia-tion. However, both studies are affected by the limitations typi-cal of pure imaging: these include the survey sensitivity or con-
arX
iv:0
905.
3349
v1 [
astr
o-ph
.CO
] 2
0 M
ay 2
009
2 Stoklasova et al.: OASIS integral-field spectroscopy of the central kpc in 11 Seyfert 2 galaxies
tamination by other emission sources, the most important be-ing gas ionised by young, massive stars that have been found incentres of many Seyfert galaxies (e.g., Schmitt et al. 1999; CidFernandes et al. 2004; Boisson et al. 2004).
Spatially resolved spectroscopy overcomes many of thesedifficulties: ratios of forbidden and permitted emission-line in-tensities at different locations help us to discriminate betweenthe ionisation sources and to establish a boundary of the AGN-ionised NLR, using ionisation models (see e.g., Bennert et al.2006a, for a discussion and application). Also, spatially resolvedkinematics derived from the emission lines provides an impor-tant insight into the three-dimensional structure and dynamicsof the central emitting regions. The wealth of information con-tained in such spectroscopic data thus allows us to address anumber of questions related to the NLRs, which are importantfor reconstructing the global picture of AGN. An efficient wayof acquiring simultaneously the spatially resolved optical or in-frared (IR) spectroscopic data is provided by the integral-fieldspectroscopy (IFS). Integral-field units (IFUs) are becoming astandard type of equipment at large telescopes, available witha wide variety of technical parameters, such as spectral range,spectral and spatial resolution, and field of view.
We present our mapping of the central ∼ kiloparsec(s) of11 nearby Seyfert 2 galaxies observed with the optical integral-field spectrograph OASIS mounted at the 3.6 m Canada–France–Hawaii Telescope (CFHT). Now mounted at William HerschelTelescope (WHT), OASIS is an IFU well-suited to high-resolution observations over a restricted field of view (FOV), fora wide range of spectral modes. Its use for detailed spectroscopicmapping of the NLRs and the central parts of the ENLRs is thusadvantageous for understanding the complex spatial variationsin the physical properties of the circumnuclear ionised gas, andthe implications for the AGN model.
For the observed emission regions, we plot maps of derivedquantities such as the surface brightness in two Balmer linesand five doublets of forbidden emission lines, the computed linespectral-diagnostic ratios, the kinematic properties, the electrondensities, and the interstellar reddening. We plot spatially re-solved spectral-diagnostic diagrams for each object where pos-sible. We provide details of the individual Seyfert 2 nuclei inSect. 4, confronting our observations with results found in theliterature. The complete sample is discussed in Sect. 5, where wedraw conclusions about various structural and kinematic results.
2. Observations and data reduction
2.1. Observations
The selected 11 targets (Table 1) correspond to well-knownSeyfert galaxies with previously published photometric and/orspectroscopic data. Their redshifts are in the range 0.006 <z < 0.051 , corresponding to distances of 17 Mpc – 220 Mpc.Observations were performed in the years 2000− 2002, with thelenslet-array OASIS spectrograph constructed at the Centre deRecherche Astrophysique de Lyon (CRAL), France, mountedat CFHT (Mauna Kea) in the F/8 Cassegrain focus. Two spec-tral domains were explored, with either high (0.27′′) or low(0.41′′) spatial sampling, and corresponding fields of view of10′′×8′′ and 15′′×12′′, respectively. Each of the modes providedapproximately a thousand spectra per object per spectral do-main. The two spectral modes covered the wavelength ranges of4760 Å−5558 Å with 2.15 Å dispersion (“MR1” spectral mode),
and 6210 Å − 7008 Å with 2.17 Å dispersion (“MR2” spectralmode).
Table 2 specifies the spectral and spatial configurations usedfor each member of the entire observed set. An overview of allthe configurations of OASIS is available at the dedicated webpages of the instrument and at the CFHT pages. Details of theinstrumental concept are to be found in Bacon et al. (1995),which describes the TIGER spectrograph, a direct predecessorof OASIS.
2.2. Data reduction
The data were reduced with the dedicated XOasis software(Pecontal-Rousset et al. 2004a,b). The standard reduction pro-cedure includes bias and dark subtraction (CCD), extraction ofthe spectra using a fitted mask model, wavelength calibration,low-frequency flat-fielding, spectro-spatial flat-fielding, cosmic-ray removal, homogenisation of the spectral resolution over thefield, sky subtraction, and flux calibration using observations ofthe photometric standard stars. Multiple exposures were mergedand mosaiced, truncating the wavelength domain to a commonrange in the different fields, and combining the spectra (both sig-nal and noise) with optimal weights and renormalisation. Thedata cubes were resampled to a common spatial scale on a rect-angular grid (from the original array of hexagonal lenses) witheither 0.25′′ or 0.4′′ spacing depending on the adopted spatialsampling. Orientation was defined to be north up, east to the left.
3. Data analysis
The results presented in this paper were obtained by a two-stageanalysis procedure: stellar-population modelling and emission-line modelling. The OASIS survey that we present was designedpreferentially for the study of the gas dynamics, and the signal-to-noise ratio (S/N) of the acquired data was therefore calculatedfor optimal results in the gas emission lines. A simplified stellar-population modelling, with the primary goal of correcting theBalmer lines of hydrogen for underlying stellar absorption, per-mitted us to investigate both the stellar kinematics and the ageof stellar populations.
Methods for the simultaneous fitting of stellar and emissiongas spectra were recently developed by the SAURON consor-tium (see e.g., Sarzi et al. 2006; McDermid et al. 2006) and oth-ers (e.g., Sanchez et al. 2007). We briefly tested this software onour data and found that the low S/N in our stellar lines preventedus from judging reliably which method was more suitable forour data. In addition, the two-stage spectral analysis, with theindependent treatment of the stellar and gaseous components,is advantageous for detailed studies of complex emission-lineprofiles: the stellar component removed, different emission-linemodels with an increasing degree of precision can gradually beapplied, as needed.
For each of the data-analysis steps, the large volumes of datarequire to a large extent automatic treatment, with a subsequentcheck of the results, and detailed modelling applied only to se-lected spectra. The current paper presents our first-order results,while detailed analysis and interpretation of selected objects ispostponed to future papers dedicated to individual objects in thesample.

Stoklasova et al.: OASIS integral-field spectroscopy of the central kpc in 11 Seyfert 2 galaxies 3
Table 1. List of observed Seyfert galaxies – basic data
Object Alternative RA DEC Hubble Redshift z Velocity cz DL Ang.scalename [h m s] [d m s] type [km s−1] [Mpc] [pc/′′]
Mrk 34 MCG +10-15-104 10 34 08.6 +60 01 52 Spiral 0.0505 15 140 ± 90 218 956Mrk 622 UGC 04229 08 07 41.0 +39 00 15 S0 0.0232 6964 ± 11 99.6 461Mrk 1066 UGC 02456 02 59 58.6 +36 49 14 (R)SB(s)0+ 0.0120 3605 ± 22 47.3 224NGC 262 Mrk 348 00 48 47.1 +31 57 25 SA(s)0/a 0.0150 4507 ± 4 58.2 274NGC 449 Mrk 1 01 16 07.2 +33 05 22 (R’)S? 0.0159 4780 ± 2 62.3 293NGC 2273 Mrk 620 06 50 08.6 +60 50 45 SB(r)a: 0.0061 1840 ± 4 25.8 124NGC 2992 MCG -02-25-014 09 45 42.0 −14 19 35 Sa pec 0.0077 2311 ± 4 36.6 175NGC 3081 IC 2529 09 59 29.5 −22 49 35 (R1)SAB(r)0/a 0.0080 2391 ± 3 37.7 180NGC 4388 UGC 07520 12 25 46.7 +12 39 44 SA(s)b: sp 0.0084 2524 ± 1 16.7(∗) 81(∗)
NGC 5728 MCG -03-37-005 14 42 23.9 −17 15 11 (R1)SAB(r)a 0.0094 2804 ± 20 41.9 199NGC 5929 UGC 09851 15 26 06.1 +41 40 14 Sab: pec 0.0083 2492 ± 8 35.7 170
Adopted from the NASA/IPAC Extragalactic Database (NED). The cosmological scales assume H0 = 73 km s−1 Mpc−1, ΩM = 0.27, ΩΛ = 0.73 .DL: luminosity distance; Ang.scale: angular scale. (*) Values from Yasuda et al. (1997), with NGC 4388 considered inside the Virgo cluster.
Table 2. List of observed Seyfert galaxies – observational parameters.
Object Observation Integration time Integration time Spatial sampling Spatial samplingdate in MR1 [s] in MR2 [s] MR1 MR2
Mrk 34 14-15/03/2001 1 × 2700 2 × 2700 HR LRMrk 622 24/11/2000 2 × 1800 2 × 1800 HR HRMrk 1066 22/11/2000 3 × 1800 + 1 × 1200 2 × 1800 HR HRNGC 262 25/11/2000 2 × 1800 2 × 1800 HR HRNGC 449 24/11/2000 3 fields × 2 × 1800 3 fields × 2 × 1800 HR HRNGC 2273 24/11/2000 2 × 1800 — LR —NGC 2992 16-17/03/2001 1 × 1800 + 1 × 2700 2 × 1800 LR HRNGC 3081 17/01/2002 2 × 3600 — LR —NGC 4388 17/01/2002 3 × 3300 — LR —NGC 5728 15/03/2001 2 × 1800 1 × 1800 + 1 × 2700 LR LRNGC 5929 16/03/2001 2 × 2700 — LR —
The abbreviations used: MR1: spectral mode of wavelength range (4760, 5558) Å, dispersion 2.15 Å/pixel, resolving power 1210; MR2: spectralmode of wavelength range (6210, 7008) Å, dispersion 2.17 Å/pixel, resolving power 1525; HR: high spatial resolution mode with sky sampling0.27′′, field of view 10.4′′ × 8.3′′; LR: low spatial resolution mode, sky sampling 0.41′′, field of view 15′′ × 12′′.
3.1. Stellar populations
We modelled the stellar component of spectra using syntheticevolutionary models from the GALAXEV library of Bruzual &Charlot (2003). Understanding the stellar populations in Seyfertgalaxies has always been a challenging problem (see e.g., CidFernandes et al. 2005; Raimann et al. 2003), due to the presenceof strong gas emission lines, which contaminate the stellar spec-tra. A fairly standard approach has been to correct emission linesfor stellar absorption by assuming that the nuclear stellar popu-lations are identical to those in the outer parts of the host galaxy(e.g., Ho et al. 1997; Bennert et al. 2006a). However, evidence ofyoung stars in the centres of Seyferts has been presented by e.g.,Heckman et al. (1997); Gonzalez Delgado et al. (1998); Joguetet al. (2001); Raimann et al. (2003); and Cid Fernandes et al.(2004), and therefore the use of purely old stellar populationshas been shown to be insufficient even for detailed gas-emissionstudies, because of the need to correct reliably for the effects ofstellar absorption.
Stellar-population modelling searches for a combination oftemplate spectra from a theoretical or experimental library whichreproduces best the observed galactic spectrum. As a typical in-verse problem, the stellar spectrum reconstruction has a number
of free parameters (such as the ages and metallicities of the indi-vidual populations, and their mass fractions), which may not bepossible to constrain to form a unique solution. Intrinsic degen-eracies exist between age and metallicity, and they are furtherenhanced by measurement uncertainties and noise, which washaway the differences between spectrally similar components, asdemonstrated by Cid Fernandes et al. (2004). These authorsshowed for artificial data that even an accurately fitting templatedoes not ensure a correct physical interpretation. Nevertheless,a most robust determination of population fractions is possibleif larger stellar-age bins are used (defined coarsely as young< 100 Myr, intermediate 100 Myr – 1.4 Gyr, and old > 1.4 Gyrin their study).
We adapted the stellar population study to our data quality.We were limited by the S/N in stellar absorption lines, the rela-tively short wavelength ranges with only a few prominent ab-sorption lines, and contamination by gas emission lines. Thefitting of the stellar was only possible in one of the two ob-served spectral regions, i.e., the MR1 domain (see Sect. 2.1),which contains the Mg i b complex at about 5170 Å, and ironlines Fe 5015 Å, Fe 5270 Å. Other constraints to the models wereprovided by the absorption-line wings of Hβ. No such features
4 Stoklasova et al.: OASIS integral-field spectroscopy of the central kpc in 11 Seyfert 2 galaxies
were detected in the MR2 domain, and therefore the stellar com-ponent of spectra in this domain was inferred by extrapolatingthe models fitted to MR1.
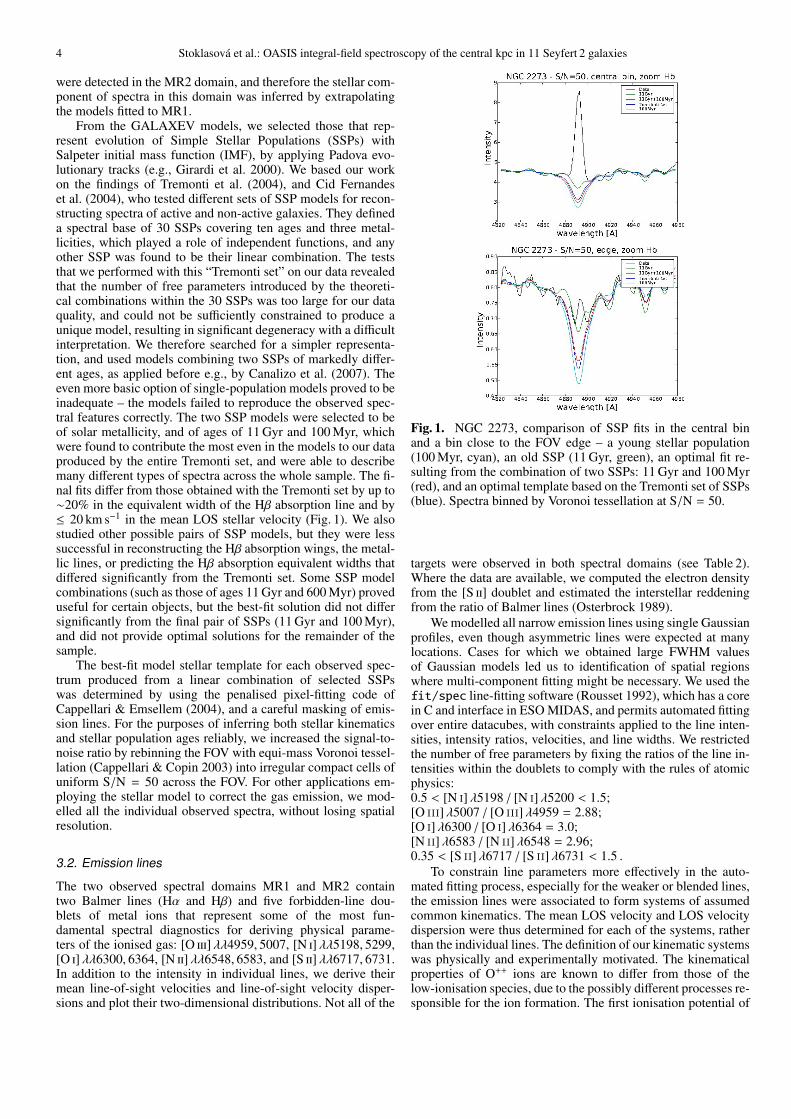
From the GALAXEV models, we selected those that rep-resent evolution of Simple Stellar Populations (SSPs) withSalpeter initial mass function (IMF), by applying Padova evo-lutionary tracks (e.g., Girardi et al. 2000). We based our workon the findings of Tremonti et al. (2004), and Cid Fernandeset al. (2004), who tested different sets of SSP models for recon-structing spectra of active and non-active galaxies. They defineda spectral base of 30 SSPs covering ten ages and three metal-licities, which played a role of independent functions, and anyother SSP was found to be their linear combination. The teststhat we performed with this “Tremonti set” on our data revealedthat the number of free parameters introduced by the theoreti-cal combinations within the 30 SSPs was too large for our dataquality, and could not be sufficiently constrained to produce aunique model, resulting in significant degeneracy with a difficultinterpretation. We therefore searched for a simpler representa-tion, and used models combining two SSPs of markedly differ-ent ages, as applied before e.g., by Canalizo et al. (2007). Theeven more basic option of single-population models proved to beinadequate – the models failed to reproduce the observed spec-tral features correctly. The two SSP models were selected to beof solar metallicity, and of ages of 11 Gyr and 100 Myr, whichwere found to contribute the most even in the models to our dataproduced by the entire Tremonti set, and were able to describemany different types of spectra across the whole sample. The fi-nal fits differ from those obtained with the Tremonti set by up to∼20% in the equivalent width of the Hβ absorption line and by≤ 20 km s−1 in the mean LOS stellar velocity (Fig. 1). We alsostudied other possible pairs of SSP models, but they were lesssuccessful in reconstructing the Hβ absorption wings, the metal-lic lines, or predicting the Hβ absorption equivalent widths thatdiffered significantly from the Tremonti set. Some SSP modelcombinations (such as those of ages 11 Gyr and 600 Myr) proveduseful for certain objects, but the best-fit solution did not differsignificantly from the final pair of SSPs (11 Gyr and 100 Myr),and did not provide optimal solutions for the remainder of thesample.
The best-fit model stellar template for each observed spec-trum produced from a linear combination of selected SSPswas determined by using the penalised pixel-fitting code ofCappellari & Emsellem (2004), and a careful masking of emis-sion lines. For the purposes of inferring both stellar kinematicsand stellar population ages reliably, we increased the signal-to-noise ratio by rebinning the FOV with equi-mass Voronoi tessel-lation (Cappellari & Copin 2003) into irregular compact cells ofuniform S/N = 50 across the FOV. For other applications em-ploying the stellar model to correct the gas emission, we mod-elled all the individual observed spectra, without losing spatialresolution.
3.2. Emission lines
The two observed spectral domains MR1 and MR2 containtwo Balmer lines (Hα and Hβ) and five forbidden-line dou-blets of metal ions that represent some of the most fun-damental spectral diagnostics for deriving physical parame-ters of the ionised gas: [O iii] λλ4959, 5007, [N i] λλ5198, 5299,[O i] λλ6300, 6364, [N ii] λλ6548, 6583, and [S ii] λλ6717, 6731.In addition to the intensity in individual lines, we derive theirmean line-of-sight velocities and line-of-sight velocity disper-sions and plot their two-dimensional distributions. Not all of the
Fig. 1. NGC 2273, comparison of SSP fits in the central binand a bin close to the FOV edge – a young stellar population(100 Myr, cyan), an old SSP (11 Gyr, green), an optimal fit re-sulting from the combination of two SSPs: 11 Gyr and 100 Myr(red), and an optimal template based on the Tremonti set of SSPs(blue). Spectra binned by Voronoi tessellation at S/N = 50.
targets were observed in both spectral domains (see Table 2).Where the data are available, we computed the electron densityfrom the [S ii] doublet and estimated the interstellar reddeningfrom the ratio of Balmer lines (Osterbrock 1989).
We modelled all narrow emission lines using single Gaussianprofiles, even though asymmetric lines were expected at manylocations. Cases for which we obtained large FWHM valuesof Gaussian models led us to identification of spatial regionswhere multi-component fitting might be necessary. We used thefit/spec line-fitting software (Rousset 1992), which has a corein C and interface in ESO MIDAS, and permits automated fittingover entire datacubes, with constraints applied to the line inten-sities, intensity ratios, velocities, and line widths. We restrictedthe number of free parameters by fixing the ratios of the line in-tensities within the doublets to comply with the rules of atomicphysics:0.5 < [N i] λ5198 / [N i] λ5200 < 1.5;[O iii] λ5007 / [O iii] λ4959 = 2.88;[O i] λ6300 / [O i] λ6364 = 3.0;[N ii] λ6583 / [N ii] λ6548 = 2.96;0.35 < [S ii] λ6717 / [S ii] λ6731 < 1.5 .
To constrain line parameters more effectively in the auto-mated fitting process, especially for the weaker or blended lines,the emission lines were associated to form systems of assumedcommon kinematics. The mean LOS velocity and LOS velocitydispersion were thus determined for each of the systems, ratherthan the individual lines. The definition of our kinematic systemswas physically and experimentally motivated. The kinematicalproperties of O++ ions are known to differ from those of thelow-ionisation species, due to the possibly different processes re-sponsible for the ion formation. The first ionisation potential of

Stoklasova et al.: OASIS integral-field spectroscopy of the central kpc in 11 Seyfert 2 galaxies 5
elements such as oxygen, nitrogen, and sulphur is almost iden-tical to that of hydrogen, and the ions can therefore be formedin the same conditions. And indeed, the observations show thatkinematic properties of the neutral and low-ionisation speciesare usually similar to those of hydrogen. With this justification,we associated the weak and blended [N i] doublet with Hβ inthe same system, while [O iii] was treated independently. All ofthe MR2 lines (Hα, [O i], [N ii], and [S ii]) were considered ina common system (where possible) to assure a good quality fitto lines that are rather weak (mainly [N i], [O i], and [S ii]) orblended ([S ii] doublet lines, [N ii] with Hα).
We corrected the measured FWHM for the instrumentaldispersion, which was estimated by fitting telluric lines to be(7 ± 0.5) Å. A Gaussian approximation to the line profiles wasused, hence with a quadratic subtraction of the measured totaland instrumental dispersions. The resulting dispersion containsan error of 0.6 Å due to wavelength calibration. The differencesencountered between the resultant velocity dispersion measuredin Hα and in Hβ can be almost entirely attributed to their differ-ent data quality, far higher for Hα. Where available, Hα resultsshould therefore be considered more reliable.
3.3. Error computation
Uncertainties in the measurements of the mean LOS velocity,which are a function of the signal-to-noise ratio, were studiedfor OASIS data in detail by Ferruit et al. (2004), who fitted re-peatedly artificial emission-line spectra with added noise in 500Monte Carlo realisations for each S/N value (see also McDermidet al. 2006). Their results were applied in the way recommendedby the authors in the present paper. We show the correspondingerror bars in one-dimensional plots of mean LOS velocities inFigs. 3 – 25. The effects of fitting single Gaussian functions, andof observed line-profile asymmetries were not included in thistreatment. Equally, errors introduced by the subtraction of thestellar component, especially in the hydrogen lines, were not in-cluded in the error bars. An error of 16 km s−1 due to calibrationwas added to the computed error in the mean LOS velocity.
The random errors in line flux determination were estimatedwith the assumption of Gaussian line profiles, and were com-puted as the product of noise in the vicinity of the lines, and theline FWHM. This procedure does not include possible system-atic errors due to the stellar template determination, which aredifficult to quantify, as discussed in Appendix B3 of Emsellemet al. (2004). We plot error bars in the scatter plots of the derivedquantities such as the line ratios and the one-dimensional cuts ofelectron densities, for all of which Gaussian error propagationwas applied. For electron densities, the errors were computedassuming further that the [S ii] line shifts and FWHMs corre-sponded to those of Hα, i.e., we did not consider the effects ofline blending.
4. Results for individual objects
4.1. General comments
We present colour-coded maps of the line emission intensity, themean line-of-sight velocity, and the LOS velocity dispersion inthe detected emission lines for each of the Seyfert 2 galaxies inour sample. Thanks to our stellar-population modelling, the gasvelocity maps can be compared with those of stars in the objectswhere the stellar data quality was sufficient for reliable mod-elling of the absorption-line profiles. The stellar modelling also
yielded maps of the mass fractions of the young and old stellarpopulations.
Further information about the objects can be inferred fromthe ratios of the emission-line intensities. We derive electrondensity from the [S ii] line ratio, as described in Osterbrock(1989), by assuming a temperature of 10 000 K (our data do notcontain a direct temperature diagnostic). We estimate the dustdistribution from the Balmer line ratio. The Hα/Hβ should havea fixed intrinsic value depending on the physical conditions inthe environment where the recombination lines are formed. Weassumed the intrinsic value of 3.1, which is typical of NLRs(Osterbrock 1989). By assuming any excess of the measured ra-tios to be due to dust along the line of sight, we computed theinterstellar reddening E(B − V).
The ratios of forbidden-line to recombination-line intensitiesare a measure of the ionisation and excitation state of the gas, ofits density, temperature and metallicity, as well as the nature ofthe ionizing source. We plot maps for each of the standard diag-nostic ratios [O iii]λ5007/Hβ (excitation map), [O i]λ6300/Hα,[N ii]λ6583/Hα, and ([S ii]λ6717+[S ii]λ6731)/Hα. More infor-mation is conveyed by the spectral-diagnostic diagrams definedby Baldwin et al. (1981); and Veilleux & Osterbrock (1987), butin our case, these diagrams are plotted for spatially resolved datafor each observed galaxy. The diagrams provide further possi-bilities for future detailed modelling of the ionisation structure,similar to that performed e.g., by Bennert et al. (2006b), or Allenet al. (1999) for long-slit spectroscopic data.
In our diagnostic diagrams, we compare the different existingclassification schemes for emission objects commonly used inthe literature, including the recent development (Kewley et al.2001; Kauffmann et al. 2003; Stasinska et al. 2006; Kewley et al.2006), as well as the traditional schemes, some of which werebased on a single pair of lines and were reviewed by Ho et al.(1997). However, we note that the models correspond to globalspectra, and one must be careful when interpreting the spatiallyresolved diagrams (see Stasinska 2009), which require detailedionisation modelling for a proper understanding. Therefore, theplotted curves that correspond to the afore mentioned modelsplay an informative role only.
All the plots presented in Figs. 2 – 25 show the results ofsingle-Gaussian modelling of the emission lines. This simpli-fication is clearly insufficient for a precise reconstruction ofmany spectra, where two or more components are present ineach emission line, as specified below for the individual objects.The single-component fitting obviously limits the interpretationof the presented data, although the results provide a guide tothe location of important structural and kinematic features inthe objects. The applied modelling approach simulates the ef-fects of lower resolution spectral data with unresolved multi-ple components. The resulting intensity in the lines correspondsto the integrated intensity of all components or to the inten-sity in the strongest component, depending on the line shapeand the fit. Similarly, the fitted line-of-sight velocities trace ei-ther the motion of the strongest component at a given loca-tion or a “weighted average” of the components. The velocity-dispersion maps serve as efficient indicators of locations of themulti-component spectra. While it would be impossible to in-spect all spectra individually due to the enormous amounts ofdata, the large-dispersion areas of the FWHM maps trace theregions of complex emission-line profiles, often in unexpectedlocations, not necessarily at the galactic centres.
We display profiles of the mean LOS velocity and electrondensity along the major axes of emission, and scatter plots of ra-dial variations in the diagnostic line ratios as complementary in-

6 Stoklasova et al.: OASIS integral-field spectroscopy of the central kpc in 11 Seyfert 2 galaxies
formation. Most of the data presented were clipped at S/N = 5,with the exception of the weak lines [N i] and [O i], for whichonly at a few spatial pixels in the centre the signal-to-noise ratioexceeded the value of two, and therefore we applied clipping atS/N = 1 to plot the two-dimensional maps. The surface bright-ness is in the units of 10−19 J s−1 arcsec−2 m−2, the mean LOS ve-locities, and LOS velocity dispersions in km s−1. The velocitieswere corrected for heliocentric motion using the rvcor routineof IRAF, and plotted relative to the systemic velocity of eachgalaxy, which was taken from NED (see Table 1).
We compared the measured fluxes of emission lines withthose determined by Falcke et al. (1998). The authors provide thefluxes in [O iii] and Hα+[N ii] obtained from HST observationsof Mrk 34, Mrk 348, and NGC 4388, using circular apertures oftwo different sizes for each object. We simulated the apertures bysumming the spectra over circular regions centred on [0′′, 0′′]and of the same radii as in the cited paper. The emission-linefluxes were measured for spectra that had a stellar componentmodelled by a combination of two SSPs (11 Gyr and 100 Myr)from Bruzual & Charlot (2003), as described in Sect. 3.1, andwith no emission-line model applied (to avoid introducing fur-ther sources of error). Results of the comparison are summarisedin Table 3.
Agreement between the two data sets is closer for largerapertures, as expected. The flux that we measure in regions ofradii smaller than 1′′ is affected too much by the spatial PSF(dominated by ∼ 1′′ seeing), which is an order of magnitudehigher than that in the HST observations and redistributes muchof the observed flux outside the selected area. Most of the fluxesthat we obtained for apertures of sizes ≥ 1′′ are 10% − 25%lower than previously published values. Possible reasons for thediscrepancy include flux-calibration errors, errors acquired dur-ing data reduction or due to an imprecise determination of thestellar-continuum level. However, it is impossible to draw con-clusions about systematic differences based on only three cases.
Table 3. Comparison of our emission fluxes with those of Falckeet al. (1998). OASIS values correspond to fluxes corrected for absorp-tion using a combination of SSPs as described in Sect. 3.1. Units are10−19 W m−2.
Galaxy Aperture OASIS data Falcke et al. (1998)radius [O iii] Hα+[N ii] [O iii] Hα+[N ii]
Mrk 34 2′′ 4 800 3 400 6 100 3 6000.5′′ 500 300 1 300 700
Mrk 348 1.5′′ 3 000 2 500 4 100 2 0000.4′′ 1 500 1 000 3 200 1 500
NGC 4388 6′′ 9 800 — 11 700 —1′′ 3 200 — 3 900 —
The following subsections are devoted to the description ofthe individual objects, the observed features, set into the largermulti-wavelength context found in the literature. We note thatwe will not be restating the wavelengths of the emission linesthat were listed in Sect. 3.2, except the cases where confusionwould be possible.
4.2. Individual objects
Mrk 34
Mrk 34 is known to be a luminous FIR source with a power-ful water maser (Henkel et al. 2005). Optical line emission wasfound to be spatially correlated with radio continuum emission,PA ∼ 150 − 165 (Nagar & Wilson 1999; Falcke et al. 1998;Ulvestad & Wilson 1984a).
Mrk 34 is the most distant object in our OASIS sampleand in this case our FOV corresponds to the central ∼ 5 kpc.Because of the high redshift of the galaxy, the [S ii] doublet islocated outside the observed spectral range, and we are there-fore unable to infer all of the spectral-diagnostic ratios, and theelectron density. The observed emission in all of the observedlines has a similar morphology, extended along the direction ofPA ∼ 140 − 150 (Fig. 2). The excitation map [O iii]/Hβ has thesame major axis as the [O iii] emission, and more of a cone-likeshape. The other diagnostic line ratios, however, have low valuesin the direction of the cones, while the maximum values are dis-tributed along the minor axis (Fig. 2). Reddening computed fromthe Hα/Hβ ratio possesses a maximum in the southern part of theFOV, ∼2 kpc from the central maximum. The spatially resolveddiagnostic diagrams indicate that the emission corresponds to astrong Seyfert regime.
The map of the mean LOS velocities in Hα (Fig. 3) providesan example of twisted S-shape isocontours. They are not evi-dent in [O iii] and Hβ, which may partially be caused by thesmaller FOV in MR1. No galactic bar or other signature of non-axisymmetric potential has been reported so far, and the S-shapemight be the first piece of kinematical evidence of departuresfrom axial symmetry. The low quality of the stellar data did notallow comparison of the stellar and gas velocities. The objectis characterised by multi-component emission-line profiles in aregion of elongated shape perpendicular to the emission majoraxis, as visible in the velocity dispersion map.
Mrk 622
The radio emission in this galaxy at the 20 cm wavelength isextended along PA = 0 (Nagar et al. 1999). No prominent axisin either the optical emission or the excitation map was detectedon the scale of 5′′ by Mulchaey et al. (1996a), while Schmittet al. (2003a) reported elongation in [O iii] emission at PA =55 in the inner 1′′, perpendicular to the host-galaxy major axis.Shuder & Osterbrock (1981) discovered multi-component [O iii]profiles of total FWHM = (1050 ± 50) km s−1, in contrast tothe nearly-Gaussian shapes of the Hα, [N ii], and [O ii] lines ofFWHM = 350 ± 75 km s−1. They concluded that two emission-line regions of different ionisation are present, with estimatedtemperatures of ∼11 000 K in [O iii] and ∼ 6000 K in Hα, [N ii],and [O ii].
The galaxy is among the most distant in our sample, whichhas an effect on the spatial resolution that we attain. The mapsof line emission intensities do not show any particular direction-ality, except for the Hα and [N ii] emission, which has hints ofextending both to the east and the south (Fig. 4), in agreementwith the optical and radio observations of Schmitt et al. (2003a);and Nagar et al. (1999). The [O iii] lines are highly asymmet-ric and their multiple components are detected throughout thefield of view (Fig. 6), with a separation between the componentsas large as 600 km s−1, not present in the other lines, confirm-ing the results of Shuder & Osterbrock (1981). Single-Gaussian
Stoklasova et al.: OASIS integral-field spectroscopy of the central kpc in 11 Seyfert 2 galaxies 7
modelling of [O iii] thus results in large-FWHM fits, as seen inFig. 5.
The one-component fits have a strong impact on the interpre-tation of the velocity field of this object. The relative intensity ofthe two line components in [O iii] varies across the FOV, with theblue component becoming stronger in the east and the red com-ponent in the west. The fitted one-component Gaussian modelof the line profile is always biased towards the stronger compo-nent. As a result, our velocity map in [O iii] is not a good ap-proximation of the true motion and a detailed multi-componentmodelling of line profiles is necessary. We assume that this isthe major reason for the dissimilarities between the hydrogenand [O iii] kinematics presented in Fig. 5. While the apparentkinematic axis of [O iii] lies along PA ∼ 90, that of Hα (to-gether with the low-ionisation lines) is perpendicular to it, atPA ∼ 180, measured in the outer parts of the Hα map, the cen-tral regions being characterised by S-shape isovelocity contours.The stellar velocity field, as far as can be deduced from our data,has a kinematic axis at PA ∼ 120, and it is impossible to de-cide whether the twisted contours are present due to the low dataquality.
The Hβ data are of low quality and their derived velocities donot agree with those measured from Hα. We note that velocitycolour scales in Fig. 5 were not homogenised to the same lim-its, due to the problematic fitting results. Two-component lineprofile modelling is necessary for [O iii] lines, as the ambiguousinterpretation of present results demonstrates.
The electron density, the interstellar reddening, and the gasexcitation all reach their maximum values at the galactic centre.In contrast, the diagnostic ratios of line intensities, except for[O iii]/Hβ, reach their minima in the central region. Interestingly,the spatially resolved diagnostic diagrams indicate low excita-tion across the entire FOV (Fig. 4). The observed spectra pos-sess strong Hβ absorption wings, which affect both the selectionof the stellar population model and the predicted absorption inHβ, which may be overestimated.
Mrk 1066
While being classified as a marginal Seyfert by Osterbrock &Dahari (1983), a high-excitation component of the spectral lineswas found by Bower et al. (1995). Radio emission was observedat PA ∼ 135 by Haniff et al. (1988); and Ulvestad & Wilson(1989), and the narrow-band images indicated an alignment ofthe optical [O iii] emission with the radio jet (Bower et al. 1995;Mulchaey et al. 1996a). The direction of both types of emissionthen agrees approximately with the orientation of the galacticbar of PA ∼ 143 (Mazzarella & Boroson 1993; Bower et al.1995). According to Bower et al. (1995), the velocities in Hα +[N ii] are consistent with rotation, probably in the galactic disc,while [O iii] shows little or no rotation, which they interpret asan outflow. No signs of hidden BLR were inferred from spec-tropolarimetry (Miller & Goodrich 1990). No central dust lanein high-resolution HST images, nor other evidence of a torus(such as excess reddening at the centre) was found by Boweret al. (1995). Zhang & Wang (2006) attributed the non-detectionof a hidden BLR to orientation effects and/or the low mass of thecentral black hole.
The emission that we observe in all the lines is slightly ex-tended along PA ∼ 130 − 140, i.e., parallel to the galactic bar.A prominent emission feature located in the east is seen in thehydrogen lines and partially in [N ii] and [S ii], while absent in[O iii], and is associated with high interstellar reddening, low ex-
citation, and a small velocity dispersion (Figs. 7 and 8). We con-clude that it is probably a region that has not been ionised by theAGN. Excitation is highest in the central parts and extends asym-metrically to the north-west side along the major axis of [O iii]emission, as well as along the minor axis to both sides fromthe centre. Interestingly, the interstellar reddening extends asym-metrically along the major axis in the opposite direction, to thesouth-east (Fig. 7). The maps of diagnostic ratios [O i]/Hα and[N ii]/Hα exhibit surprising distributions of high values withinan extended region along the minor axis (Fig. 7). The diagnosticdiagrams are consistent with the interpretation of the object as amarginal Seyfert (Fig. 7). With a few exceptions, all of the spec-tra are characterised by an [O iii]/Hβ intensity ratio that is belowthe empirical Seyfert limit, including the central parts. However,a proper disentangling of the asymmetric lines may confirm thehigh-excitation component ((Bower et al. 1995)). The electrondensity reaches peak in the central region, the maximum beingoff-centred by ∼200 pc (Figs. 8 and 9).
The Hα velocity map (Fig. 8) displays a clear S-shaped pat-tern. Velocities in [O iii] exhibit important differences from thehydrogen data, seen mainly in the one-dimensional cuts. Wefound no multi-component line profiles for this object (Fig. 9),even though we observe a large-FWHM region extending alongthe minor axis, which is usually associated with line splits inother objects of the sample. On the other hand, most lines haveblue wings across the entire FOV.
NGC 262 (Mrk 348)
The host-galaxy is orientated almost face-on and has a closecompanion, NGC 266. The nuclear region has been a populartarget of observations across the entire electromagnetic spec-trum, because of the difficulties to interpret orientations of in-dividual components observed in the different spectral regionswithin a simple model (Anton et al. 2002). Capetti et al. (1996)reported a prominent central dust lane of scale height 50 pc,perpendicular to the optical [O iii] emission in an HST image.Evidence of a torus or related structure was found in IR im-ages by Simpson et al. (1996). A polarised broad Hα component(Miller & Goodrich 1990) and a hard X-ray emission (Awakiet al. 1991) inferred a hidden Seyfert 1 nucleus. The radio emis-sion is in the form of a triple radio source of spatial extent 0.2′′along PA = 168 (Neff & de Bruyn 1983), variable on thescale of months. Megamaser emission detected in the central fewmilliarcseconds (Falcke et al. 2000; Xanthopoulos & Richards2001; Peck et al. 2003) was interpreted as an interaction be-tween the radio jet (situated close to the plane of the sky) anda molecular cloud. Optical [O iii] emission is well aligned withthe radio on sub-arcsecond scales (Falcke et al. 1998; Schmittet al. 2003a), while on the arcsecond scales it is extended alongPA ∼ 185 (Schmitt et al. 2003a), with a secondary blob of emis-sion ∼0.9′′ south of the nucleus. A hint of ionisation cones wasfound by Simpson et al. (1996); and Mulchaey et al. (1996a)in the ionisation map, but the evidence is marginal according toAnton et al. (2002). NIR emission map obtained with an IFU bySosa-Brito et al. (2001) does not have any prominent directionon the scale of 3′′, although contours in the inner parts seem tohave a slight directionality along PA ∼ 10 and PA ∼ 90.A ringof H ii emission on the scale of ∼1 kpc was reported by Antonet al. (2002); and Mulchaey et al. (1996a). The galaxy possessesa giant H i envelope on the scales of hundreds of kpc (Heckmanet al. 1982).
8 Stoklasova et al.: OASIS integral-field spectroscopy of the central kpc in 11 Seyfert 2 galaxies
The face-on orientation of the galaxy is confirmed in our databy the low stellar LOS velocities (Fig. 11), the minimum andmaximum values that we obtained from our fits are separatedby 70 km s−1 only. We estimate the kinematic stellar axis to beat PA ∼ 70. This Seyfert galaxy has one of the lowest contri-butions from young stars of the entire sample. Mass fractionsof young stars above several percent have been identified in thecentral ∼250 pc only.
The emission maps of most of the emission lines are slightlyextended along PA ∼ 10 (Fig. 10), which is consistent withSosa-Brito et al. (2001), and differs by approximately 20 fromthe radio jet reported in the literature. We partially resolve thesecondary emission maximum known from the literature, ∼1′′south-west of the centre. The gas excitation is high, and all theregions are high in the Seyfert regime according to the spa-tially resolved diagnostic diagram (Fig. 10). The regions of high-est excitation are situated along the major axis of emission,within a PA range of ∼ 5 − 30 . The [O iii]/Hβ ratio decreasessteeply with radial distance, as seen in the corresponding graphof Fig. 11. We note that the ratios of low-ionisation lines to Hαshow prominent minima south-west of the galactic centre, in theregion of the receding velocity maximum (see paragraph below).In addition, [S ii]/Hα has a minimum at the centre, surroundedby a patchy ring of high [S ii]/Hα on scales of ∼600 pc, whichcorresponds to a ring of low electron densities derived from the[S ii] ratio (Figs. 10 and 11).
The gas velocities (Fig. 11) are the most surprising detec-tion. We observe two spots of velocity maxima of opposite sign,aligned at PA ∼ 25, i.e., approximately parallel to the majoraxis of optical emission. The two spots of > 100 km s−1, presentin [O iii] as well as in low-ionisation lines, about 200 pc in size,are placed symmetrically ∼300 pc from the emission maximum.We assume that the observation corresponds to a rotating ring,inclined with respect to the galactic disc. However, there is aclear asymmetry in the radial profile of the two velocity peaks(Fig. 11).
The maxima of the LOS velocity dispersion in Hα are lo-cated at the positions of the velocity peaks, which is not the casefor [O iii]. The low-ionisation emission lines also have signifi-cantly asymmetric profiles across the FOV, unlike [O iii] wheremostly blue wings are present (Fig. 12). The low-ionisation linesare characterised by prominent blueshifted and redshifted com-ponents shifted by 300 − 400 km s−1 from the main component.The red asymmetries were found mainly in the southern part ofthe FOV. The vicinity of the south-western spot of maximal ve-locities is characterised by rapid spatial variations in the lineshapes and switching between red and blue additional compo-nents. A careful disentangling of the line profiles is necessarybefore further conclusions can be made.
We detect another systematic motion in [O iii], at the edge ofthe FOV, of radii ∼1 kpc, where we observe velocities with a po-larity that is reversed with respect to the nuclear ring. We verifiedthat it is not the effect of noise and suggest that it might corre-spond to the ring identified by Anton et al. (2002); and Mulchaeyet al. (1996a).
NGC 449 (Mrk 1)
The galaxy is well known to possess a prominent water maserin its nucleus (Braatz et al. 1994). No evidence of a hiddenSeyfert 1 nucleus was found, in either polarised light (Kay 1994)or in the infrared (Veilleux et al. 1997). Mulchaey et al. (1996a)reported [O iii] emission extending to ∼ 3 kpc, co-aligned withboth the galaxy major axis, PA = 83 and 20 cm radio emission
on the scale of ∼30 pc (Kukula et al. 1999). Stellar-populationsynthesis modelling of long-slit data of 3 Å resolution performedby Raimann et al. (2003) revealed mostly intermediate-age stel-lar populations (∼1 Gyr) in the central kpc and an increasinglydominant old population (∼10 Gyr) outside this radius.
Our OASIS data for this object were obtained as a mosaicof three partially overlapping fields. We confirm strongly colli-mated emission in [O iii], H ii, and [N ii] extending to radii of atleast ∼3 kpc (Fig. 13). In the other observed lines, the S/N is in-sufficient to obtain reliable data to these distances. We found amisalignment between the emission in [O iii] (PA ∼ 65) and thelow-ionisation species (PA ∼ 85). The velocity map in Hα sug-gests circular rotation. As in most of the targets of the OASISsample, we found a region of large FWHM, stretching alongthe minor axis (Fig. 14). The region is characterised by multi-component line profiles, usually in the form of red or blue wingsin [O iii] and split line profiles in low-ionisation species (Fig. 15).Outside the central ∼600 pc, the emission lines are narrow.
Our stellar data were not of a high quality for this object. Themaximum contribution of young stars was fitted in the nuclearregion. The map of stellar velocities could not be interpreted re-liably.
NGC 2273 (Mrk 620)
NGC 2273 is a barred galaxy (van Driel & Buta 1991), witha star-forming nuclear ring (Ferruit et al. 2000). Deviationsfrom axial symmetry were confirmed by GMOS IFU observa-tion of the stellar kinematics in the central regions (Barbosaet al. 2006). Radio emission extends along PA ∼ 20 at the20 cm wavelength, and two components along PA ∼ 90 areevident at the 6 cm wavelength in the central 1′′ (Ulvestad &Wilson 1984b; Ho & Ulvestad 2001). HST observations resolveda jet-like [O iii] structure extending 2′′ east of the nucleus, atPA ∼ 90, aligned with the double radio source (Ferruit et al.2000). Mulchaey et al. (1996a) reported extended [O iii] emis-sion reaching to ∼6.5′′ at PA = 134±10. Moiseev et al. (2004)identified important differences between the velocities in [O iii]and the Balmer lines.
Our data for this object are limited to a single spectral do-main (MR1). While the [O iii] emission does not exhibit anyprominent axis (only a slight elongation is visible along PA ∼95), Hβ emission seems to follow the direction of PA ∼ 20.These differences in behaviour are emphasised in the [O iii]/Hβmap, where extended cone-like features appear along PA ∼ 100(Fig. 16). The velocity field in [O iii] lines shows S-shaped iso-contours (Fig. 16), which might indicate deviations of the grav-itational potential from axisymmetry. The data quality in Hβ isinsufficient to confirm or exclude a similar velocity pattern inhydrogen. However, one-dimensional cuts of the velocity fieldsshow important systematic differences between LOS velocitiesin [O iii] and Hβ. The stellar velocity field is well measured forthis galaxy and shows rotation in a direction similar to gas, withthe kinematic axis at the outer parts of the FOV approximatelyparallel to the Hβ photometric major axis. No asymmetric ormulti-component emission-line profiles have been found, apartfrom weak, blue wings (Fig. 16).
NGC 2992
The host galaxy disc is highly inclined at i ∼ 70,which makes itsuitable for extraplanar emission studies. The galaxy has a com-
Stoklasova et al.: OASIS integral-field spectroscopy of the central kpc in 11 Seyfert 2 galaxies 9
panion NGC 2993, which is located ∼3′ south-east, connectedwith a tidal bridge, and whose tidal forces might have an im-portant effect on the kinematics. Radio observations at 20 cmfound a 25′′ structure along the major axis of the galaxy, anda 90′′ one-sided extension at PA ∼ 100 − 130, close to thegalaxy minor axis (Ward et al. 1980). The 6 cm radio emission isconcentrated in the central parts, forming a “figure-eight” struc-ture at PA = 160 (Ulvestad & Wilson 1984b; Wehrle & Morris1988). Soft X-rays are detected up to scales of 35′′ − 45′′ alongthe galaxy’s minor axis, and are co-spatial with the 20 cm radioemission. The [O iii] emission forms two sharp-cut cones with aprojected opening angle of 120 (Marquez et al. 1998), their axesaligned with the galactic minor axis (PA = 120) and approxi-mately with the radio structure. A disturbed dust lane was iden-tified at PA = 15 by Marquez et al. (1998) and at PA = 30 byVeilleux et al. (2001). Multi-component optical emission lineswere detected, and the velocity field was suggested to be a super-position of rotation and an outflow (Marquez et al. 1998; Allenet al. 1999; Veilleux et al. 2001).
The FOV in OASIS observations enables only one of theemission cones to be imaged, located south-east of the dust lane.The emission structure that we observe (Fig. 17) is elongated atPA ∼ 30 in all of the available emission lines, parallel to thedust lane observed by Veilleux et al. (2001). The emission bendsin the southern part towards PA ∼ 210, especially in [O iii], andto PA ∼ 45 in the north of the FOV. [O iii] has a significantemission extension in the eastern part of the FOV, associatedwith high receding velocities, while the low-ionisation lines ex-hibit a blob of emission to the south-west, associated with highextinction.
The maximum of the emission in all lines coincides with themaxima in the electron density, the interstellar reddening, andthe velocity dispersion (with the exception of [O iii] where theFWHM maximum is shifted by ∼1′′ to the east, see Fig. 18). Atthe same time, the maximum emission region is characterised bylocal minima of diagnostic line ratios (Fig. 17).
The LOS velocity fields (Fig. 18) obtained from differentemission lines are similar, characterised by receding motionsin the northern part and approaching in the south and east ofthe FOV. Comparison with the stellar velocities (with their kine-matic axis in the NE-SW direction) suggests that the gas has arotational component aligned approximately with stars. Despitethe apparent kinematic similarities, the MR2 spectra had to beconsidered to correspond to two kinematic systems, by fittingthe [S ii] and [O i] kinematics independently of Hα and [N ii],while the unified fit was impossible. The grouping of the emis-sion lines into the two systems was a compromise between thewell-determined positions of lines and the number of parame-ters needed to place enough constraints on the weak lines andthe blended lines. We illustrate the blending of the Hα and [N ii]lines in the spectra of Fig. 19. Outside the central ∼2′′ (350 pc),all emission lines are however narrow and non-blended. The dif-ferences in the motion of the individual ionic species are de-picted in the one-dimensional cut along the major axis (Fig. 18):the velocity curve in [O i] and [S ii] is shallower (by ∼100 km s−1)than in the other lines, whereas the most prominent velocities areobserved in [O iii], especially in the northern part. The velocitycurves that we obtained by one-dimensional cuts along differentaxes are consistent with long-slit spectroscopy by Marquez et al.(1998).
We detect double-component profiles of emission lines, par-ticularly for [O iii] and Hβ, while the other lines are too affectedby either blending or noise. We show the asymmetric MR1 pro-
files in Fig. 19, in a combined plot of spectra from three loca-tions. Broad wings of Balmer emission lines were detected in thecentral ∼2′′ (∼350 pc). However, their relation to BLR emission(already suggested e.g., by Ward et al. 1980; Boisson & Durret1986) can only be confirmed after a careful disentangling of allthe line components.
Our stellar population modelling revealed spatial variationsin the contribution of young stars, which is highest in thestrongly emitting region close to the dust lane, while mostly oldpopulations are present in the rest of the FOV (eastern part).
NGC 3081
The host galaxy is an early-type spiral with a weak large-scalebar and a nuclear bar (Buta 1990), and four well-defined reso-nance rings: nuclear, inner and two outer ones (Buta & Purcell1998). The brightest emission-line region inside 2′′ has a linearmorphology, well aligned with the radio emission (Nagar et al.1999). Slitless spectroscopy by Ruiz et al. (2005) revealed twomajor kinematic components in the [O iii] line at ∼−250 km s−1
and + 50 km s−1.
We observed the object in one spectral domain (MR1) only.The photometric axis in both [O iii] and Hβ stretches along thePA ∼ 155 − 165, even though it is less pronounced in [O iii](Fig. 20). Unlike in [O iii], the emission in Hβ is elongated asym-metrically to the south-east.
The mean LOS velocity fields of [O iii] and Hβ (Fig. 20)show similar structures, forming an S-shape in [O iii]. However,important differences between [O iii] and Hβ velocities are en-countered in one-dimensional cuts of the velocity maps. The S-shape is not reproduced in the stellar velocities, derived fromhigh-quality absorption-line data in this object, which have a ro-tational pattern with a kinematic axis PA ∼ 90. The anomalousvalues of stellar velocities detected in several bins of the map inFig. 20 do not correspond to true velocities, and are results ofpoor fits in these particular positions. Interestingly, the northernregion of receding [O iii] velocities is characterised by minimumvalues of the line width. We found no prominent asymmetries inemission line profiles (Fig. 20).
Our stellar population modelling revealed low contributionsfrom young stars, compared to the other Seyfert nuclei in thestudied sample (Fig. 20). Nevertheless, the SSP ages form a clearspatial structure with a boundary at ∼ 800 pc separating olderpopulations inside this radius and younger outside.
NGC 4388
The galaxy belongs to the Virgo cluster (Phillips & Malin 1982;Yasuda et al. 1997). The galactic disc of PA ∼ 90 is inclined ati ∼ 78 (Veilleux et al. 1999a), with the north rim on the nearside. The nucleus is a strong X-ray source (e.g., Hanson et al.1990; Takano & Koyama 1991; Lebrun et al. 1992; Iwasawaet al. 1997). Radio-emission morphology suggests a collimatedAGN-driven outflow reaching ∼ 200 pc south of the nucleus(e.g., Stone et al. 1988; Falcke et al. 1998). Weak broad Hα emis-sion implies that a hidden type-1 nucleus is present (Filippenko& Sargent 1985). Extended optical emission has two compo-nents of different excitation, one associated with the galacticdisc and another reaching 50′′ (4 kpc) above the galactic planein the form of two opposite cones (e.g., Pogge 1988; Corbinet al. 1988; Falcke et al. 1998; Veilleux et al. 1999b). WhileRubin et al. (1997) argued that anomalous kinematics in thecentral parts of the galactic disc were indicative of presence of
10 Stoklasova et al.: OASIS integral-field spectroscopy of the central kpc in 11 Seyfert 2 galaxies
a discrete, rapidly rotating circumnuclear disc, Veilleux et al.(1999a,b) found that the gas kinematics were consistent with el-liptical streaming in the bar potential, plus a bipolar outflow ex-tending out of the galactic plane (and excluded other models forthe extragalactic component). They argued that the bar-inducednon-circular motions may account for the emission-line splittingof the maximum amplitude of ∼150 km s−1 detected symmetri-cally out to radii of ∼10′′ (∼1 kpc) along the disc, i.e., close tothe end of the bar.
In the case of this nearby galaxy, our FOV is restrained andcovers the central ∼400 pc only, which is insufficient for inter-preting the large-scale structures known from e.g., Veilleux et al.(1999b), but we sample the central region with the spatial scaleof ∼ 80 pc, obtaining thus a highly detailed picture. The maxi-mum of emission within our FOV is located in the south-west(Fig. 21), and the emission intensity isocontours have stronglyirregular forms, pointing to the north-east PA ∼ 30 − 45, i.e.,a direction consistent with the extragalactic component reportedby Veilleux et al. (1999b). The Hβ morphology differs slightlyfrom [O iii] in the norther part of the FOV, where it bends by∼ 90 at ∼200 pc. The map of [O iii]/Hβ ratio reveals high ioni-sation in the region of maximum [O iii] emission extending alongPA ∼ 45 (Fig. 21).
Due to good-quality stellar data in this object, our mapof mean LOS stellar velocities exhibits a clear pattern, whichis similar to that observed in Hα emission by Veilleux et al.(1999b). Because of the large FOV covered by the Fabry-Perotinterferometer observations, they were able to identify a stronglyS-shaped form in the isovelocity contours in the galactic disc.For the gas velocities that we observe, our limited FOV only al-lows us to identify agreement between the general orientationsof the central velocity features in our data and those of Veilleuxet al. (1999b).
We detect two regions of high velocity dispersion, especiallyin [O iii] maps: in the south close to the peak emission, and inthe north of the FOV. These regions are characterised by anoma-lous emission-line profiles, the former with weak red wings, thelatter with a marked additional blueshifted component separatedby ∼ 800 − 900 km s−1 from the main emission component bothin [O iii] and Hβ (which is significantly higher than reportedby Veilleux et al. 1999b). Examples of spectra and their one-component fits are presented in Fig. 21, from which it is clearthat the velocity maps follow the strongest component of thelines. The additional redshifted and blueshifted components arerestricted to the two regions and never outshine the main com-ponent.
The stellar population modelling shows the largest contribu-tion of young stars (∼ 10% of mass) close to the point of in-version of the stellar velocities. The observed field is otherwisedominated by old stars, consistent with the findings of Storchi-Bergmann et al. (1990).
NGC 5728
The host galaxy has a bar along PA = 33, a nuclear bar at PA ∼86 −90 (Wozniak et al. 1995; Emsellem et al. 2001), and threerings. The nuclear ring has dimensions 9′′ × 7′′, and the majoraxis at PA = 20 . The Seyfert core is known as one of the mostspectacular examples of the biconical emission-line structure inoptical observations, with the north-west cone at PA = 304 andthe south-east cone at PA = 118, and opening angles ∼ 55 −65 (Pogge 1989; Wilson et al. 1993). The emission maxima in
both Hα+[N ii] and [O iii] are located ∼1′′ from the cones’ apex(Wilson et al. 1993).
The kinematics of NGC 5728 has been characterised by con-troversial conclusions, and so far none of the proposed models(radial outflow, inflow or non-axisymmetric rotation in a barredpotential) has managed to account fully for all the observationalresults. The inflow model is supported by the observed asym-metry in the line-emission distribution and the degree of ioni-sation (Schommer et al. 1988; Wilson et al. 1993; Riffel et al.2008): the shorter and less ionised north-west cone can be ex-plained by obscuration and interaction with the galactic disc ifthe north-west is the far side (see Figs. 22 and 23 for a betterunderstanding). On the other hand, HST observations revealed asharp apex to the north-west cone, whereas the south-east coneterminates with a blunt end 0.5′′ from the core, suggesting ob-scuration by foreground material (Wilson et al. 1993). Togetherwith an excellent alignment with the radio emission, this mightbe considered evidence of an outflow (Schommer et al. 1988).
Observed with the use of the Fabry-Perot spectrometer bySchommer et al. (1988), strongly S-shaped Hα isovelocity con-tours in the central 10′′ (2 kpc) suggested that these features orig-inated in the bar potential. On the other hand, the bar is in a po-sition for which models by Roberts et al. (1979) do not predictvelocity field distortions, therefore Schommer et al. (1988) drewno conclusions about the importance of the bar. SPH simulationsby Perez et al. (2004), which included a bar, failed to reproducethe observed velocity field and the authors proposed that eitheran additional nuclear bar or radial flows are present.
The major axes of the emission structures determined fromour OASIS data are aligned at PA ∼ 125 (as measured from theouter contours). The emission is asymmetric in the two lobes, asreported before in the literature (see above). The north-west lobeshows an elongation at PA ∼ −40 in the inner 4′′ (∼800 pc),consistent with the HST observations of Wilson et al. (1993),while the more prominent south-west lobe bends towards PA ∼115.We partially resolved the secondary maximum of emissionlocated ∼ 2′′ north-west of the maximum, which was reportede.g., by Wilson et al. (1993). The hydrogen emission maps showa prominent arc perpendicular to the lobes, at a distance of ∼5′′(1 kpc) north-west of the centre. We interpret this as part ofthe ring reported e.g., by Wilson et al. (1993).
The gas velocity maps and their one-dimensional cuts(Fig. 23) show a strong gradient of LOS velocities along the ma-jor axis of emission, in the vicinity of the dynamic centre of thegalaxy. The velocity maxima of opposite signs (approximately±300 km s−1) are separated by only 400 pc and are located at theprimary and secondary maxima of emission intensity. A compar-ison with the Fabry-Perot observations (Schommer et al. 1988)provides a different view of the velocity maps across a widerfield, providing thus a larger context which is inaccessible withour limited FOV: a strong S-shape is found, which must be takeninto account in the interpretation (in a future paper). The hydro-gen velocity field of the outer parts of our FOV (outside the cen-tral 500 pc) has an orientation corresponding to the stellar mo-tions that we measured. We suppose that the interpretation of thekinematic structure of NGC 5728 will be aided by rigorous dis-entangling of multiple-component emission lines that we foundto be distributed within an elongated region approximately per-pendicular to the photometric major axis (PA ∼ 45 in [O iii] andPA ∼ 60 in Hα) and passing through the dynamic centre. Withinour single-Gaussian model of emission profiles, the spatial re-gion of asymmetric lines is represented by the large-FWHM areaof the map (Fig. 23). We illustrate the multi-component emission
Stoklasova et al.: OASIS integral-field spectroscopy of the central kpc in 11 Seyfert 2 galaxies 11
profiles with the varying importance of the individual compo-nents in Fig. 24.
Another interesting result is that for the dust distribution.The map of interstellar reddening plotted in Fig. 22 shows max-imum extinction in the regions of emission maxima and thestar-forming H ii ring. The obscuration of the ionisation conesis also asymmetric and supports the interpretation of the north-west cone interacting with the galactic disc, and the south-eastcone situated above the disc.
The stellar population ages resulting from our SSP modellingshow a clear systematic distribution, with significant contribu-tions (more than a few percent) from young stars only outsidethe central ∼600 pc.
NGC 5929
NGC 5929 forms an interacting pair with NGC 5930 (e.g.,Bower et al. 1994). The galaxy hosts a linear radio source withtwo lobes separated by 1′′ along PA = 60 (Whittle et al. 1986;Ulvestad & Wilson 1984b), close to the galaxy major axis atPA = 45 (Schmitt et al. 1997). Optical emission in [O iii] andHα + [N ii] is in the form of cones co-aligned with the radiosource, characterised by the opening angle of 80 and an ex-tent of 150 − 175 pc, and separated by a perpendicular dust lane(Bower et al. 1994; Schmitt & Kinney 1996). Ferruit et al. (1997)performed IFU observations in Hα, [N ii], and [S ii] with theTIGER spectrograph, and tested several models to account forthe optical and radio emission. They place constraints on the in-teraction of the radio ejecta with the ambient gas, i.e., jet/cloudinteraction, jet/ISM interaction, plasmon expansion, and the bowshock. None of the models were able to interpret the data satis-factorily.
Our observations were completed in one spectral domain(MR1) only. We found differences between the major axes ofemission in [O iii] (PA ∼ 90) and in Hβ (PA ∼ 75), see Fig. 25.A similar discrepancy was seen in the zero-velocity curve orien-tation (approximately perpendicular to the emission major axes)in the maps of mean LOS velocities. However, the main featuresof the velocity fields, as well as their one-dimensional cuts, wereconsistent for both ions.
Our map of stellar velocities showed strong misalignmentwith the gas velocities: the stellar kinematic axis (PA ∼ 30) wasalmost perpendicular to the symmetry axis of the gas. Moreover,the polarity of the stellar velocity field was reversed with respectto gas: in the north-east region, stars had receding motion, whilethe gas was approaching.
The LOS velocity dispersion maps show a stripe of max-imum dispersion at PA ∼ 160 through the optical nucleus,approximately perpendicular to the photometric axis of Hβ(Fig. 25). The large-FWHM region is associated with asymmet-ric line profiles (Fig. 25), with a separation of ∼900 km s−1 be-tween the line components.
The [O iii]/Hβ intensity ratio distribution follows the mor-phology of [O iii] emission, with maxima at both the nucleusand off the nucleus at 2′′ east, 2′′ west, and 4′′ west. The stellarpopulations show a clear pattern with a growing contribution ofyoung populations toward the edges of the observed field.
5. Discussion
Despite the advances in 3D spectroscopic techniques, opticaldatacubes obtained with the resolution that we present in this pa-per remain rare. We have shown the wealth of information that
the OASIS IFU data can provide, making it possible to addressseveral important problems concerning AGN, while opening aperspective of promising innovative, detailed modelling. The rel-atively large number of emission lines contained in the data notonly allow comparisons of NLR morphologies and kinematicsfor different ionic species, but also provide diagnostics for prob-ing the physical conditions of the gas, based on the line intensityratios. We have been able to estimate directly from the measuredratios both the electron density (the [S ii] doublet ratio) and theinterstellar reddening due to dust (the Balmer line ratio). Thedetermination of other characteristics such as the ionisation pa-rameter, metallicity, or temperature will require future modellingusing spatially resolved diagnostic diagrams presented in this pa-per.
The emission data results have been compared with the stel-lar data, the kinematics in particular. We have also modelledthe contributions of stellar populations of different ages andtheir variations across the observed field. This simultaneously-acquired, rich information allows a more complex understandingof the structure and conditions in each of the observed Seyfertgalaxies. In addition to studying each of the targets individu-ally, we take advantage of having a uniform data set of Seyfert 2galaxies and search for general trends in the physical properties.In this section, we summarise and discuss the obtained results inthe context of the entire sample.
5.1. Non-axisymmetric potentials
One of the major goals has been to map the gas velocity fields indetail for different emission lines, and compare them with stellarvelocities if possible, to understand more clearly the emissionmorphologies, the dominant dynamic processes at the galacticcentre, and eventually the origin of the NLR gas. A number ofscenarios have been proposed for NLRs that can be tested byspectroscopic studies. One of them concerns departures from theaxial symmetry of the gravitational potential, which might berelated to the nuclear activity and the gas transport across largedistances toward the central galactic regions (e.g., Dumas et al.2007; Schinnerer et al. 2000). On the other hand, signs of gasmotion in non-coplanar orbits with the host galaxy may implyan external origin of the NLR gas, emphasising the role of merg-ers (e.g., Morse et al. 1998; Hunt & Malkan 2004). Streamingmotions toward the galactic centre might indicate a connectionwith AGN fuelling, and outflow motions are tested for their re-lation to the radio jets (e.g., Bicknell et al. 1998), or to the pre-dicted thermal wind produced by the central torus (e.g., Krolik& Begelman 1986; Balsara & Krolik 1993).
Only one of the gas velocity fields obtained from our ob-servations seems to be consistent with circular rotation in thecentral kiloparsec – NGC 449 (Mrk 1) – as far as our field-of-view allows us to judge. The mean LOS velocities of the ionisedgas in seven of the eleven studied Seyfert 2 galaxies are charac-terised by S-shaped isovelocity contours in the central regions.This result supports the findings of Dumas et al. (2007), who re-ported velocity contour twists to be more common in the Seyfertgalaxies than in quiescent ones. The S-shapes are in general sig-natures of non-axisymmetric galactic potentials containing bars,warps, or nuclear spirals (Roberts et al. 1979), and were success-fully reproduced by these models in the case of several Seyfertgalaxies e.g., by Veilleux et al. (1999a); Schinnerer et al. (2000);and Emsellem et al. (2006). Their interpretation of the veloc-ity fields by motions in non-axisymmetric potentials thus pro-vides an alternative to the radial flows often invoked to accountfor deviations from circular velocities. Degeneracies in the inter-
12 Stoklasova et al.: OASIS integral-field spectroscopy of the central kpc in 11 Seyfert 2 galaxies
pretation of non-circular motions were addressed analytically byWong et al. (2004), who derived prescriptions of how to discrim-inate between bars, warps, and radial flows by means of Fourieranalysis.
Beside the S-shaped velocity fields, another type of a non-axisymmetric velocity pattern has been represented in our datain the case of NGC 262 (Mrk 348): two striking spots in the meanvelocity map, suggesting a rotating disc/ring (∼300 pc in radius)that is non-coplanar with the host-galaxy disc. Concerning out-flows, we cannot provide direct evidence, even though at leasttwo of the objects in our sample (NGC 4388, NGC 2992) havehad an outflow component confirmed by several authors (e.g.,Veilleux et al. 1999b; Marquez et al. 1998; Allen et al. 1999;Veilleux et al. 2001). We are partially limited by the small FOV,but a clearer understanding is expected from our future detailedkinematic modelling.
Except for one case (NGC 4388), the non-circular motions ofgas do not have evident counterparts in the stellar velocity fields.This is unsurprising since gas, even in the absence of an AGN-driven outflow, is in general not expected to follow the sameorbits as stars, due to its dissipative nature resulting in lower ve-locity dispersion, its higher responsiveness to non-axisymmetricperturbations, possible ring formation, and a phase shift with re-spect to axes of stellar orbital families. A counter-rotation or tiltwith respect to the plane of the stellar disc are also plausible inthe case of gas having an external origin (e.g., as a result of aminor merger). Observed misalignments between the kinematicaxes of the stellar and gaseous components in active and non-active galaxies were discussed in detail by Dumas et al. (2007),who concluded that departures are both more frequent and sig-nificant in galaxies hosting an AGN. They also found that theclosely aligned axes and a lack of isovelocity contour twists ingas were correlated with low-accretion rate AGN. Their resultssuggested a close relation between the AGN and the dynamicsof the host.
5.2. Nuclear rings
Further type of evidence of a non-axisymmetric potential is thepresence of nuclear rings. A small fraction of observed ringsmay be due to collisions or mergers of galaxies (e.g., Knapenet al. 2004), or to accretion of intergalactic gas, although the vastmajority are probably resonance phenomena (Buta & Combes1996). Nuclear rings have been identified in approximately 20%of spiral galaxies (Knapen 2005). Our sample of Seyfert 2 galax-ies possesses at least one object with a nuclear ring, reportedpreviously (Wilson et al. 1993) and confirmed in our data:NGC 5728. We detect the ring in the surface brightness mapsof the Balmer lines and low-ionisation lines of metals, whileit is missing in [O iii]. We have found it to be associated withhigh interstellar extinction, which suggests that it contains largeamounts of dust.
Evidence of other rings might originate in the kinematicmeasurements, as was the case for NGC 5252 in Morse et al.(1998), and will be tested in future modelling. The strongestcandidate to contain a ring is NGC 262 (Mrk 348) with the strik-ing velocity pattern described in Sect. 5.1, not reported so farelsewhere. As suggested by Mulchaey et al. (1996a), NGC 262possibly hosts another ring at ∼1 kpc. Marginal evidence of itsdetection was also found in our data, in the mean LOS velocitymap of [O iii], which displays systematic velocity pattern at theedges of our FOV that is qualitatively consistent with rotation inan opposite sense to that of the nuclear ring.
5.3. NLR morphologies, cones
The morphologies that we have obtained from analysis of dif-ferent individual lines are not always identical or even alignedalong the same axis. The misalignments between emission in[O iii] and low-ionisation lines (e.g., NGC 449, NGC 5929)provide evidence of additional dynamic processes affecting thehigh-ionisation components of the gas, such as the radio jets thataccelerate and/or ionise the gas.
Two of the galaxies (Mrk 1066, NGC 5728) show prominentregions detectable only in hydrogen and low-ionisation lines,which are virtually missing in [O iii]: a nuclear ring in NGC 5728(reported before e.g., by Wilson et al. 1993), and an off-centreregion of diameter ∼ 500 pc in Mrk 1066. The regions are char-acterised by a ratio [O iii]/Hβmarkedly lower than in the remain-der of the observed field, and have therefore probably not beenionised by the AGN radiation. They are also associated with highinterstellar reddening, which indicates a high amount of dust andpossibly star formation, and hence an ionisation by young mas-sive stars. Marginal support of this interpretation comes fromthe maps of stellar ages, which show relatively large contribu-tions from young stars in the specified locations compared tothe neighbouring regions. Ionisation by sources other than theactive nucleus thus definitely play a role in the observed NLRmorphology.
Directly related to the Unified Model of AGN (and the ex-istence of the nuclear torus), the major puzzles about NLRsare their extent, the existence of ionisation cones, and the in-trinsic geometry of the gas distribution. Significant evidence ofcones was found in ground-based and HST images (e.g., Wilsonet al. 1993; Falcke et al. 1998). The NLR structure parameterswere analysed statistically for large samples by Mulchaey et al.(1996a); and Schmitt et al. (2003a), who both concluded that asurprisingly low number (with respect to the predictions of theUnified Model) of NLRs in Seyfert 2 nuclei have a major axisthat is significantly longer than their minor axis. We reached thesame conclusion, with the caveat that our results are influencedby both the small FOV and spatial resolution, mostly determinedby the seeing conditions (∼1′′).
Mulchaey et al. (1996b) made predictions of NLR extentsand morphologies for different observer viewing angles, and alsofor different intrinsic gas distributions ionised by the conical ra-diation field from the AGN. They considered two basic geome-tries of the gaseous region, a sphere and a disc, and tested theirmodel predictions with data from a large imaging survey. In thiscontext, our kinematic measurements clearly show that the ob-served NLRs are characterised by mostly rotational (althoughprobably non-circular) motions, and are thus non-spherical.
5.4. Alignment with radio emission
Where detected, the elongated optical emission structures havebeen found to be aligned with radio emission data published inthe literature, to within the measurement errors. This alignmentinfers an alignment between the torus and accretion-disc axesand/or an influence of the radio jet on the NLR gas dynam-ics and ionisation (Schmitt et al. 2003b). Our result confirmsprevious studies of the alignment between the two wavelengthbands, demonstrated e.g., by Wilson & Tsvetanov (1994); Nagar& Wilson (1999); Falcke et al. (1998); Capetti et al. (1996); andSchmitt et al. (2003b).
As discussed above, NGC 449 and NGC 5929 of our Seyfertsample have different orientations of photometric axes in thehigh-ionisation and low-ionisation emission lines. The radio-jet
Stoklasova et al.: OASIS integral-field spectroscopy of the central kpc in 11 Seyfert 2 galaxies 13
axis is consistent with [O iii] emission in NGC 449, and with Hβemission in NGC 5929. Conclusions are ambiguous for NGC2273, which exhibits different shapes in its radio continuumemission at 20 cm and 6 cm wavelengths (Ulvestad & Wilson1984b). The Hβ emission appears to agree with the former and[O iii] with the latter.
5.5. Emission-line profiles
We detect prominent splitting of emission lines in eight of theobserved NLRs, usually limited to only part of the FOV, iden-tified as a large-FWHM region in the maps produced by oursingle-Gaussian line-profile modelling. In seven of the galax-ies the region is of elongated shape approximately perpendicularto the NLR major axis and passes through the dynamic centre.Multi-component emission-line profiles have been reported innumerous NLR spectroscopic studies, but the integral-field spec-troscopy permits us to map in detail the spatial variations in eachcomponent and to use the information in modelling the NLRstructure and kinematics. The origin of the line splitting found inour data is unclear and will be addressed in future modelling ofthe observed objects. The most common interpretations includesuperposition of several kinematic components (e.g., Schommeret al. 1988), or expanding outflows (e.g., Capetti et al. 1999),rapidly rotating circumnuclear discs (e.g., Rubin et al. 1997), andalso bar-induced non-circular motions (e.g., Veilleux et al. 2001;Bureau & Athanassoula 1999; Kuijken & Merrifield 1995).
5.6. Electron densities
We have estimated electron densities from the [S ii] doublet insix galaxies of our sample for which data are available. In allcases, a non-uniform density distribution with a central peak hasbeen found, the peak values ranging between ∼ 600 cm−3 and∼1500 cm−3, and declining to ∼ 200 cm−3 outside the central ∼500 pc. The derived inhomogeneous gas distributions may havea strong effect on the estimates of global quantities, such as theNLR mass and the Stromgren radius.
The distributions are asymmetric and the aforementionedvalues are thus direction-dependent, although the overall resultsare consistent with long-slit observations (e.g., Bennert et al.2006a; Fraquelli et al. 2003). More precise modelling is nec-essary to decide which of the values in the outer parts of theFOV (which are often relatively high) estimate reliably the in-trinsic densities and which are an effect of measurement er-rors, to which the derived density values are highly sensitive.We also note that both the density values and the radial pro-files are influenced by the method of derivation. The [S ii] ratiois density-sensitive only within a limited range of values, andprovides a density measure only in regions where these sulphurions are present. The effects of observational errors are also non-negligible. We have also derived the densities based on the as-sumption of an electron temperature of T = 10 000 K, and dif-ferent temperatures in different regions may therefore modifythe absolute values and the spatial distribution of the computeddensities (see e.g., Osterbrock 1989).
5.7. Interstellar reddening
The dust distribution may contribute significantly to the recon-struction of the galactic structure and the orientation of the ob-served nuclear emission regions with respect to the host galaxy,such as emission cones above or underneath the galactic disc.
We have been able to estimate the dust distribution from the ra-tio of Balmer lines in 7 objects. The maximum extinction is usu-ally connected with regions of maximum emission. Distinct off-nuclear regions of high extinction have been found in NGC 262(Mrk 348) and NGC 5728, consistent with low-ionisation re-gions such as the star-forming ring in NGC 5728. The dust dis-tribution in NGC 5728 is an excellent example of asymmetry:the obscuration is much higher in the north-west emission conethan in the south-east part (see Fig. 22), which is consistent withthe interpretation of Schommer et al. (1988), and Wilson et al.(1993), who predict the north-east cone to be interacting with thegalactic disc.
The values of E(B − V) that we have derived were based onthe assumption that the intrinsic Hα/Hβ ratio value equals 3.1, asis standard for AGN-excited gas due to hard radiation causing arelatively large transition zone (Osterbrock 1989). However, notall of the observed spectra necessarily originate in AGN-excitedlocations with an overabundance of high-energy photons com-pared with stellar spectra, and the intrinsic value of 2.86 wouldhave been more appropriate. Therefore, reddening is underesti-mated in these locations.
The E(B−V) that we have obtained is strongly dependent onthe stellar population model applied to correct the Balmer emis-sion lines for underlying absorption. The computed E(B−V) val-ues are significantly higher than those published e.g., by Bennertet al. (2006a); Raimann et al. (2003); Fraquelli et al. (2003); andHo et al. (1997). The values that are common in the literature areof below one magnitude, in many cases determined by methodsthat differ from that of the Balmer decrement, and are thus in-dependent of the stellar absorption models. We have tested theinfluence of the SSP models on the spatial distribution of dust,and on the E(B−V) values. We have found that the spatial distri-butions remain unchanged qualitatively after applying the “min-imum absorption correction” and using an old SSP as a stellartemplate. In contrast, the distribution differed when we did notcorrect for absorption and subtracted only the smooth contin-uum. We considered the no-absorption case to be non-realistic,and therefore conclude that our maps of E(B−V) reflect the truecharacter of the dust distribution. At the same time, the prob-lem of the high reddening values was not solved by applying adifferent stellar model.
5.8. Diagnostic line ratios
The maps of diagnostic line ratios trace the spatial distributionof the gas physical characteristics and the properties of the ioni-sation source. The [O iii]/Hβ ratio provides the most straightfor-ward interpretation by tracing the gaseous media ionised by dif-ferent sources projected along the line of sight. An outstandingexample is NGC 4388 in Veilleux et al. (1999b), where [O iii]/Hβhelps to separate between the gas in the galactic disc and the ex-traplanar material. An impact of the ionisation maps has beendemonstrated in the case of NGC 5728, where the higher ioni-sation in one of the lobes has been used to advocate the inflowinterpretation of the observed velocity field due to the positionof the ionisation cones in relation to the galactic disc (Schommeret al. 1988).
In the objects that we have studied, maximum ionisation oc-curs in the vicinity of the galactic nucleus, and is consistentwith a model of ionisation by AGN radiation. The isocontourstraced by the [O iii]/Hβ are not identical to those of the [O iii]emission, and in approximately half of the sample the symme-try changes, which implies a contamination by other emissionsources. The ionisation maps in general show more clearly de-
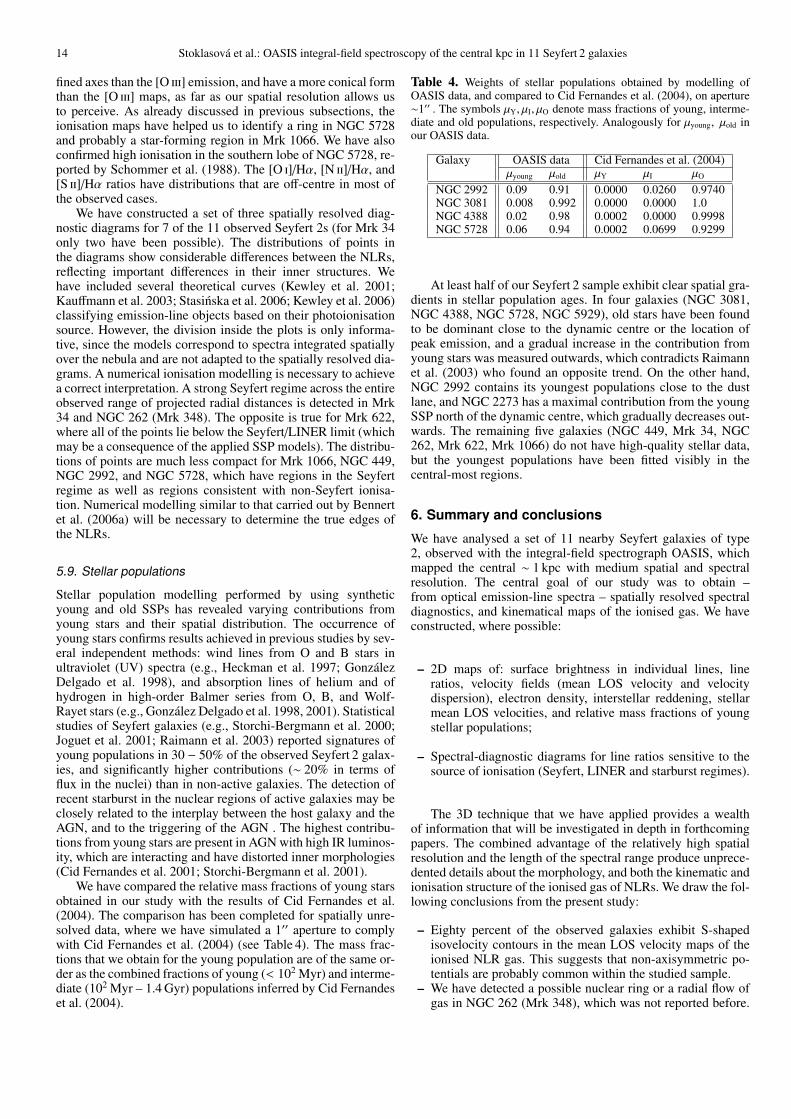
14 Stoklasova et al.: OASIS integral-field spectroscopy of the central kpc in 11 Seyfert 2 galaxies
fined axes than the [O iii] emission, and have a more conical formthan the [O iii] maps, as far as our spatial resolution allows usto perceive. As already discussed in previous subsections, theionisation maps have helped us to identify a ring in NGC 5728and probably a star-forming region in Mrk 1066. We have alsoconfirmed high ionisation in the southern lobe of NGC 5728, re-ported by Schommer et al. (1988). The [O i]/Hα, [N ii]/Hα, and[S ii]/Hα ratios have distributions that are off-centre in most ofthe observed cases.
We have constructed a set of three spatially resolved diag-nostic diagrams for 7 of the 11 observed Seyfert 2s (for Mrk 34only two have been possible). The distributions of points inthe diagrams show considerable differences between the NLRs,reflecting important differences in their inner structures. Wehave included several theoretical curves (Kewley et al. 2001;Kauffmann et al. 2003; Stasinska et al. 2006; Kewley et al. 2006)classifying emission-line objects based on their photoionisationsource. However, the division inside the plots is only informa-tive, since the models correspond to spectra integrated spatiallyover the nebula and are not adapted to the spatially resolved dia-grams. A numerical ionisation modelling is necessary to achievea correct interpretation. A strong Seyfert regime across the entireobserved range of projected radial distances is detected in Mrk34 and NGC 262 (Mrk 348). The opposite is true for Mrk 622,where all of the points lie below the Seyfert/LINER limit (whichmay be a consequence of the applied SSP models). The distribu-tions of points are much less compact for Mrk 1066, NGC 449,NGC 2992, and NGC 5728, which have regions in the Seyfertregime as well as regions consistent with non-Seyfert ionisa-tion. Numerical modelling similar to that carried out by Bennertet al. (2006a) will be necessary to determine the true edges ofthe NLRs.
5.9. Stellar populations
Stellar population modelling performed by using syntheticyoung and old SSPs has revealed varying contributions fromyoung stars and their spatial distribution. The occurrence ofyoung stars confirms results achieved in previous studies by sev-eral independent methods: wind lines from O and B stars inultraviolet (UV) spectra (e.g., Heckman et al. 1997; GonzalezDelgado et al. 1998), and absorption lines of helium and ofhydrogen in high-order Balmer series from O, B, and Wolf-Rayet stars (e.g., Gonzalez Delgado et al. 1998, 2001). Statisticalstudies of Seyfert galaxies (e.g., Storchi-Bergmann et al. 2000;Joguet et al. 2001; Raimann et al. 2003) reported signatures ofyoung populations in 30 − 50% of the observed Seyfert 2 galax-ies, and significantly higher contributions (∼ 20% in terms offlux in the nuclei) than in non-active galaxies. The detection ofrecent starburst in the nuclear regions of active galaxies may beclosely related to the interplay between the host galaxy and theAGN, and to the triggering of the AGN . The highest contribu-tions from young stars are present in AGN with high IR luminos-ity, which are interacting and have distorted inner morphologies(Cid Fernandes et al. 2001; Storchi-Bergmann et al. 2001).
We have compared the relative mass fractions of young starsobtained in our study with the results of Cid Fernandes et al.(2004). The comparison has been completed for spatially unre-solved data, where we have simulated a 1′′ aperture to complywith Cid Fernandes et al. (2004) (see Table 4). The mass frac-tions that we obtain for the young population are of the same or-der as the combined fractions of young (< 102 Myr) and interme-diate (102 Myr – 1.4 Gyr) populations inferred by Cid Fernandeset al. (2004).
Table 4. Weights of stellar populations obtained by modelling ofOASIS data, and compared to Cid Fernandes et al. (2004), on aperture∼1′′ . The symbols µY, µI, µO denote mass fractions of young, interme-diate and old populations, respectively. Analogously for µyoung, µold inour OASIS data.
Galaxy OASIS data Cid Fernandes et al. (2004)µyoung µold µY µI µO
NGC 2992 0.09 0.91 0.0000 0.0260 0.9740NGC 3081 0.008 0.992 0.0000 0.0000 1.0NGC 4388 0.02 0.98 0.0002 0.0000 0.9998NGC 5728 0.06 0.94 0.0002 0.0699 0.9299
At least half of our Seyfert 2 sample exhibit clear spatial gra-dients in stellar population ages. In four galaxies (NGC 3081,NGC 4388, NGC 5728, NGC 5929), old stars have been foundto be dominant close to the dynamic centre or the location ofpeak emission, and a gradual increase in the contribution fromyoung stars was measured outwards, which contradicts Raimannet al. (2003) who found an opposite trend. On the other hand,NGC 2992 contains its youngest populations close to the dustlane, and NGC 2273 has a maximal contribution from the youngSSP north of the dynamic centre, which gradually decreases out-wards. The remaining five galaxies (NGC 449, Mrk 34, NGC262, Mrk 622, Mrk 1066) do not have high-quality stellar data,but the youngest populations have been fitted visibly in thecentral-most regions.
6. Summary and conclusions
We have analysed a set of 11 nearby Seyfert galaxies of type2, observed with the integral-field spectrograph OASIS, whichmapped the central ∼ 1 kpc with medium spatial and spectralresolution. The central goal of our study was to obtain –from optical emission-line spectra – spatially resolved spectraldiagnostics, and kinematical maps of the ionised gas. We haveconstructed, where possible:
– 2D maps of: surface brightness in individual lines, lineratios, velocity fields (mean LOS velocity and velocitydispersion), electron density, interstellar reddening, stellarmean LOS velocities, and relative mass fractions of youngstellar populations;
– Spectral-diagnostic diagrams for line ratios sensitive to thesource of ionisation (Seyfert, LINER and starburst regimes).
The 3D technique that we have applied provides a wealthof information that will be investigated in depth in forthcomingpapers. The combined advantage of the relatively high spatialresolution and the length of the spectral range produce unprece-dented details about the morphology, and both the kinematic andionisation structure of the ionised gas of NLRs. We draw the fol-lowing conclusions from the present study:
– Eighty percent of the observed galaxies exhibit S-shapedisovelocity contours in the mean LOS velocity maps of theionised NLR gas. This suggests that non-axisymmetric po-tentials are probably common within the studied sample.
– We have detected a possible nuclear ring or a radial flow ofgas in NGC 262 (Mrk 348), which was not reported before.
Stoklasova et al.: OASIS integral-field spectroscopy of the central kpc in 11 Seyfert 2 galaxies 15
It has been identified based on the mean LOS velocity mapsderived from the observed emission lines.
– Electron densities usually reach their maximum values of ∼1000 cm−3 at the galactic nucleus, and decrease outwards.
– Dust is distributed unevenly in the central regions and willhave to be included in a future detailed study of conditionsin NLRs.
– Emission-line splitting has been identified in 8 out of 11 ob-jects, confined to a clearly defined spatial region at the galac-tic centre, and in most cases elongated perpendicular to themajor axis of emission.
– Our spatially resolved diagnostic diagrams show radial evo-lution from the Seyfert-like regime in the central regions toother regimes at larger distances.
– We find spatial gradients in stellar population ages, and con-firm the presence of young stars.
Acknowledgements. We would like to thank the anonymous referee for com-ments and suggestions. The work has been supported by the Centre forTheoretical Astrophysics (LC06014) of the Ministry of Education of theCzech Republic, by the Institutional Research Plan No. AV0Z10030501of the Academy of Sciences of the Czech Republic, by the grant No.205/03/H144/2003/02 of the Czech Science Foundation and by a PhD fellow-ship provided by the French government for I.S. The research has made useof the NASA ADS database, HyperLeda database (http://leda.univ-lyon1.fr),and NASA/IPAC Extragalactic Database (NED) which is operated by the JetPropulsion Laboratory, California Institute of Technology, under contract withthe National Aeronautics and Space Administration. We have made use of soft-ware packages for penalised pixel fitting and Voronoi tessellation developed bythe SAURON consortium. Reduction software packages of ESO MIDAS (ver-sion 04SEPpl1.0) and IRAF have been used. IRAF is distributed by the NationalOptical Astronomy Observatories, which are operated by the Association ofUniversities for Research in Astronomy, Inc., under cooperative agreement withthe National Science Foundation.
ReferencesAllen, M. G., Dopita, M. A., Tsvetanov, Z. I., & Sutherland, R. S. 1999, ApJ,
511, 686Anton, S., Thean, A. H. C., Pedlar, A., & Browne, I. W. A. 2002, MNRAS, 336,
319Antonucci, R. 1993, ARA&A, 31, 473Awaki, H., Koyama, K., Inoue, H., & Halpern, J. P. 1991, PASJ, 43, 195Bacon, R., Adam, G., Baranne, A., et al. 1995, A&AS, 113, 347Baldwin, J. A., Phillips, M. M., & Terlevich, R. 1981, PASP, 93, 5Balsara, D. S. & Krolik, J. H. 1993, ApJ, 402, 109Barbosa, F. K. B., Storchi-Bergmann, T., Cid Fernandes, R., Winge, C., &
Schmitt, H. 2006, MNRAS, 371, 170Bennert, N., Jungwiert, B., Komossa, S., Haas, M., & Chini, R. 2006a, A&A,
456, 953Bennert, N., Jungwiert, B., Komossa, S., Haas, M., & Chini, R. 2006b, A&A,
446, 919Bicknell, G. V., Dopita, M. A., Tsvetanov, Z. I., & Sutherland, R. S. 1998, ApJ,
495, 680Boisson, C. & Durret, F. 1986, A&A, 168, 32Boisson, C., Joly, M., Pelat, D., & Ward, M. J. 2004, A&A, 428, 373Bower, G., Wilson, A., Morse, J. A., et al. 1995, ApJ, 454, 106Bower, G. A., Wilson, A. S., Mulchaey, J. S., et al. 1994, AJ, 107, 1686Braatz, J. A., Wilson, A. S., & Henkel, C. 1994, ApJ, 437, L99Bruzual, G. & Charlot, S. 2003, MNRAS, 344, 1000Bureau, M. & Athanassoula, E. 1999, ApJ, 522, 686Buta, R. 1990, ApJ, 351, 62Buta, R. & Combes, F. 1996, Fundamentals of Cosmic Physics, 17, 95Buta, R. & Purcell, G. B. 1998, AJ, 115, 484Canalizo, G., Bennert, N., Jungwiert, B., et al. 2007, ApJ, 669, 801Capetti, A., Axon, D. J., Macchetto, F., Sparks, W. B., & Boksenberg, A. 1996,
ApJ, 469, 554Capetti, A., Axon, D. J., Macchetto, F. D., Marconi, A., & Winge, C. 1999, ApJ,
516, 187Cappellari, M. & Copin, Y. 2003, MNRAS, 342, 345Cappellari, M. & Emsellem, E. 2004, PASP, 116, 138Cid Fernandes, R., Gu, Q., Melnick, J., et al. 2004, MNRAS, 355, 273Cid Fernandes, R., Heckman, T., Schmitt, H., Delgado, R. M. G., & Storchi-
Bergmann, T. 2001, ApJ, 558, 81
Cid Fernandes, R., Mateus, A., Sodre, L., Stasinska, G., & Gomes, J. M. 2005,MNRAS, 358, 363
Corbin, M. R., Baldwin, J. A., & Wilson, A. S. 1988, ApJ, 334, 584Dumas, G., Mundell, C. G., Emsellem, E., & Nagar, N. M. 2007, MNRAS, 379,
1249Emsellem, E., Cappellari, M., Peletier, R. F., et al. 2004, MNRAS, 352, 721Emsellem, E., Fathi, K., Wozniak, H., et al. 2006, MNRAS, 365, 367Emsellem, E., Greusard, D., Combes, F., et al. 2001, A&A, 368, 52Evans, I., Koratkar, A., Allen, M., Dopita, M., & Tsvetanov, Z. 1999, ApJ, 521,
531Falcke, H., Henkel, C., Peck, A. B., et al. 2000, A&A, 358, L17Falcke, H., Wilson, A. S., & Simpson, C. 1998, ApJ, 502, 199Ferruit, P., Mundell, C. G., Nagar, N. M., et al. 2004, MNRAS, 352, 1180Ferruit, P., Pecontal, E., Wilson, A. S., & Binette, L. 1997, A&A, 328, 493Ferruit, P., Wilson, A. S., & Mulchaey, J. 2000, ApJS, 128, 139Filippenko, A. V. & Sargent, W. L. W. 1985, ApJS, 57, 503Fraquelli, H. A., Storchi-Bergmann, T., & Levenson, N. A. 2003, MNRAS, 341,
449Girardi, L., Bressan, A., Bertelli, G., & Chiosi, C. 2000, A&AS, 141, 371Gonzalez Delgado, R. M., Heckman, T., & Leitherer, C. 2001, ApJ, 546, 845Gonzalez Delgado, R. M., Heckman, T., Leitherer, C., et al. 1998, ApJ, 505, 174Haniff, C. A., Wilson, A. S., & Ward, M. J. 1988, ApJ, 334, 104Hanson, C. G., Skinner, G. K., Eyles, C. J., & Willmore, A. P. 1990, MNRAS,
242, 262Heckman, T. M., Gonzalez-Delgado, R., Leitherer, C., et al. 1997, ApJ, 482, 114Heckman, T. M., Sancisi, R., Balick, B., & Sullivan, III, W. T. 1982, MNRAS,
199, 425Henkel, C., Peck, A. B., Tarchi, A., et al. 2005, A&A, 436, 75Ho, L. C., Filippenko, A. V., & Sargent, W. L. W. 1997, ApJS, 112, 315Ho, L. C. & Ulvestad, J. S. 2001, ApJS, 133, 77Hunt, L. K. & Malkan, M. A. 2004, ApJ, 616, 707Iwasawa, K., Fabian, A. C., Ueno, S., et al. 1997, MNRAS, 285, 683Joguet, B., Kunth, D., Melnick, J., Terlevich, R., & Terlevich, E. 2001, A&A,
380, 19Kauffmann, G., Heckman, T. M., Tremonti, C., et al. 2003, MNRAS, 346, 1055Kay, L. E. 1994, ApJ, 430, 196Kewley, L. J., Dopita, M. A., Sutherland, R. S., Heisler, C. A., & Trevena, J.
2001, ApJ, 556, 121Kewley, L. J., Groves, B., Kauffmann, G., & Heckman, T. 2006, MNRAS, 372,
961Knapen, J. H. 2005, A&A, 429, 141Knapen, J. H., Whyte, L. F., de Blok, W. J. G., & van der Hulst, J. M. 2004,
A&A, 423, 481Krolik, J. H. & Begelman, M. C. 1986, ApJ, 308, L55Kuijken, K. & Merrifield, M. R. 1995, ApJ, 443, L13Kukula, M. J., Ghosh, T., Pedlar, A., & Schilizzi, R. T. 1999, ApJ, 518, 117Laurikainen, E., Salo, H., & Buta, R. 2004, ApJ, 607, 103Lebrun, F., Ballet, J., Paul, J., et al. 1992, A&A, 264, 22Marquez, I., Boisson, C., Durret, F., & Petitjean, P. 1998, A&A, 333, 459Martini, P., Regan, M. W., Mulchaey, J. S., & Pogge, R. W. 2003, ApJ, 589, 774Mazzarella, J. M. & Boroson, T. A. 1993, ApJS, 85, 27McDermid, R. M., Emsellem, E., Shapiro, K. L., et al. 2006, MNRAS, 373, 906Miller, J. S. & Goodrich, R. W. 1990, ApJ, 355, 456Moiseev, A. V., Valdes, J. R., & Chavushyan, V. H. 2004, A&A, 421, 433Morse, J. A., Cecil, G., Wilson, A. S., & Tsvetanov, Z. I. 1998, ApJ, 505, 159Morse, J. A., Raymond, J. C., & Wilson, A. S. 1996, PASP, 108, 426Mulchaey, J. S., Wilson, A. S., & Tsvetanov, Z. 1996a, ApJS, 102, 309Mulchaey, J. S., Wilson, A. S., & Tsvetanov, Z. 1996b, ApJ, 467, 197Nagar, N. M. & Wilson, A. S. 1999, ApJ, 516, 97Nagar, N. M., Wilson, A. S., Mulchaey, J. S., & Gallimore, J. F. 1999, ApJS,
120, 209Neff, S. G. & de Bruyn, A. G. 1983, A&A, 128, 318Osterbrock, D. E. 1989, Astrophysics of gaseous nebulae and active galactic
nuclei (University of Minnesota, Mill Valley, CA, University Science Books)Osterbrock, D. E. & Dahari, O. 1983, ApJ, 273, 478Peck, A. B., Henkel, C., Ulvestad, J. S., et al. 2003, ApJ, 590, 149Pecontal-Rousset, A., Bacon, R., Copin, Y., et al. 2004a, in Astronomical Society
of the Pacific Conference Series, Vol. 314, Astronomical Data AnalysisSoftware and Systems (ADASS) XIII, ed. F. Ochsenbein, M. G. Allen, &D. Egret, 491
Pecontal-Rousset, A., Copin, Y., & Ferruit, P. 2004b, AN, 325, 163Perez, I., Fux, R., & Freeman, K. 2004, A&A, 424, 799Phillips, M. M. & Malin, D. F. 1982, MNRAS, 199, 905Pogge, R. W. 1988, ApJ, 332, 702Pogge, R. W. 1989, ApJ, 345, 730Raimann, D., Storchi-Bergmann, T., Gonzalez Delgado, R. M., et al. 2003,
MNRAS, 339, 772Riffel, R. A., Storchi-Bergmann, T., Winge, C., et al. 2008, MNRAS, 385, 1129
16 Stoklasova et al.: OASIS integral-field spectroscopy of the central kpc in 11 Seyfert 2 galaxies
Roberts, Jr., W. W., Huntley, J. M., & van Albada, G. D. 1979, ApJ, 233, 67Rousset, A. 1992, PhD thesis, PhD Thesis, Univ. J.Monnet de Saint-Etienne.,
(1992)Rubin, V. C., Kenney, J. D. P., & Young, J. S. 1997, AJ, 113, 1250Ruiz, J. R., Crenshaw, D. M., Kraemer, S. B., et al. 2005, AJ, 129, 73Sanchez, S. F., Cardiel, N., Verheijen, M. A. W., et al. 2007, A&A, 465, 207Sarzi, M., Falcon-Barroso, J., Davies, R. L., et al. 2006, MNRAS, 366, 1151Schinnerer, E., Eckart, A., Tacconi, L. J., Genzel, R., & Downes, D. 2000, ApJ,
533, 850Schmitt, H. R., Donley, J. L., Antonucci, R. R. J., Hutchings, J. B., & Kinney,
A. L. 2003a, ApJS, 148, 327Schmitt, H. R., Donley, J. L., Antonucci, R. R. J., et al. 2003b, ApJ, 597, 768Schmitt, H. R. & Kinney, A. L. 1996, ApJ, 463, 498Schmitt, H. R., Kinney, A. L., Storchi-Bergmann, T., & Antonucci, R. 1997,
ApJ, 477, 623Schmitt, H. R., Storchi-Bergmann, T., & Fernandes, R. C. 1999, MNRAS, 303,
173Schommer, R. A., Caldwell, N., Wilson, A. S., et al. 1988, ApJ, 324, 154Shuder, J. M. & Osterbrock, D. E. 1981, ApJ, 250, 55Simpson, C., Mulchaey, J. S., Wilson, A. S., Ward, M. J., & Alonso-Herrero, A.
1996, ApJ, 457, L19Sosa-Brito, R. M., Tacconi-Garman, L. E., Lehnert, M. D., & Gallimore, J. F.
2001, ApJS, 136, 61Stasinska, G. 2009, in The Emission Line Universe, ed. J. Cepa, 1–40Stasinska, G., Cid Fernandes, R., Mateus, A., Sodre, L., & Asari, N. V. 2006,
MNRAS, 371, 972Stone, Jr., J. L., Wilson, A. S., & Ward, M. J. 1988, ApJ, 330, 105Storchi-Bergmann, T., Bica, E., & Pastoriza, M. G. 1990, MNRAS, 245, 749Storchi-Bergmann, T., Gonzalez Delgado, R. M., Schmitt, H. R., Cid Fernandes,
R., & Heckman, T. 2001, ApJ, 559, 147Storchi-Bergmann, T., Raimann, D., Bica, E. L. D., & Fraquelli, H. A. 2000,
ApJ, 544, 747Takano, S. & Koyama, K. 1991, PASJ, 43, 1Tremonti, C. A., Heckman, T. M., Kauffmann, G., et al. 2004, ApJ, 613, 898Ulvestad, J. S. & Wilson, A. S. 1984a, ApJ, 278, 544Ulvestad, J. S. & Wilson, A. S. 1984b, ApJ, 285, 439Ulvestad, J. S. & Wilson, A. S. 1989, ApJ, 343, 659Urry, C. M. & Padovani, P. 1995, PASP, 107, 803van Driel, W. & Buta, R. J. 1991, A&A, 245, 7Veilleux, S., Bland-Hawthorn, J., & Cecil, G. 1999a, AJ, 118, 2108Veilleux, S., Bland-Hawthorn, J., Cecil, G., Tully, R. B., & Miller, S. T. 1999b,
ApJ, 520, 111Veilleux, S., Goodrich, R. W., & Hill, G. J. 1997, ApJ, 477, 631Veilleux, S. & Osterbrock, D. E. 1987, ApJS, 63, 295Veilleux, S., Shopbell, P. L., & Miller, S. T. 2001, AJ, 121, 198Ward, M., Penston, M. V., Blades, J. C., & Turtle, A. J. 1980, MNRASWehrle, A. E. & Morris, M. 1988, AJ, 95, 1689Whittle, M., Haniff, C. A., Ward, M. J., et al. 1986, MNRAS, 222, 189Wilson, A. S., Braatz, J. A., Heckman, T. M., Krolik, J. H., & Miley, G. K. 1993,
ApJ, 419, L61Wilson, A. S. & Tsvetanov, Z. I. 1994, AJ, 107, 1227Wong, T., Blitz, L., & Bosma, A. 2004, ApJ, 605, 183Wozniak, H., Friedli, D., Martinet, L., Martin, P., & Bratschi, P. 1995, A&AS,
111, 115Xanthopoulos, E. & Richards, A. M. S. 2001, MNRAS, 326, L37Yasuda, N., Fukugita, M., & Okamura, S. 1997, ApJS, 108, 417Zhang, E.-P. & Wang, J.-M. 2006, ApJ, 653, 137
Caption to Figs. 2-25
Figures 2-25 contain (where available and relevant to thedescription of results and discussion, depending on individualgalaxies):
a) 2D maps of surface brightness in emission lines ofHα, Hβ, [O iii], [N i], [O i], [N ii], and [S ii] (in units of10−19 J s−1 arcsec−2 m−2), mean LOS velocity (in km s−1),
velocity dispersion (FWHM, in km s−1), line intensity ratios[O iii]/Hβ, [N ii]/Hα, [S ii]/Hα, [O i]/Hα, reddening E(B − V),and electron density;
b) Spatially resolved spectral-diagnostic diagrams;
c) Selected emission-line ratios as functions of projectedgalactocentric distance;
d) 1D cuts through mean LOS velocity and electron densityalong specific position angles;
e) Spectra – for selected individual spaxels, and/or integratedover circular apertures or the entire FOV – and their fits.
In the maps, north is up, east to the left. The black contoursrepresent the surface brightness in the corresponding emissionline for each of the derived quantities: in the case of mapped lineratios, the contours correspond to the forbidden line included inthe ratio; for the electron density, they represent the sum of thetwo sulphur lines; and for the maps of interstellar reddening, theydepict the surface brightness in Hα. Any discrepancies betweencontours of the same species in different maps result from theirre-computation for the new grid, where points of low S/N in theother relevant line(s) were removed.
In the one-dimensional cuts, the projected radial-distance co-ordinates have been defined as increasing from east to west.Error bars in diagnostic diagrams and the emission-line ratioscatter plots have not been assigned to individual points, forclarity. Instead, median and maximum errors have been plot-ted for each of the defined spatial regions, in the correspond-ing colours. The spatially resolved spectral-diagnostic diagramscompare several classification schemes commonly applied toemission objects (originally with spatially non-resolved spec-tra). The two parallel lines for [O i]/Hα correspond to the valuesprovided by Ho et al. (1997), log([O i]/Hα) ≥ −1.1 for Seyfertgalaxies, and log([O i]/Hα) ≥ −0.77 for LINERs.
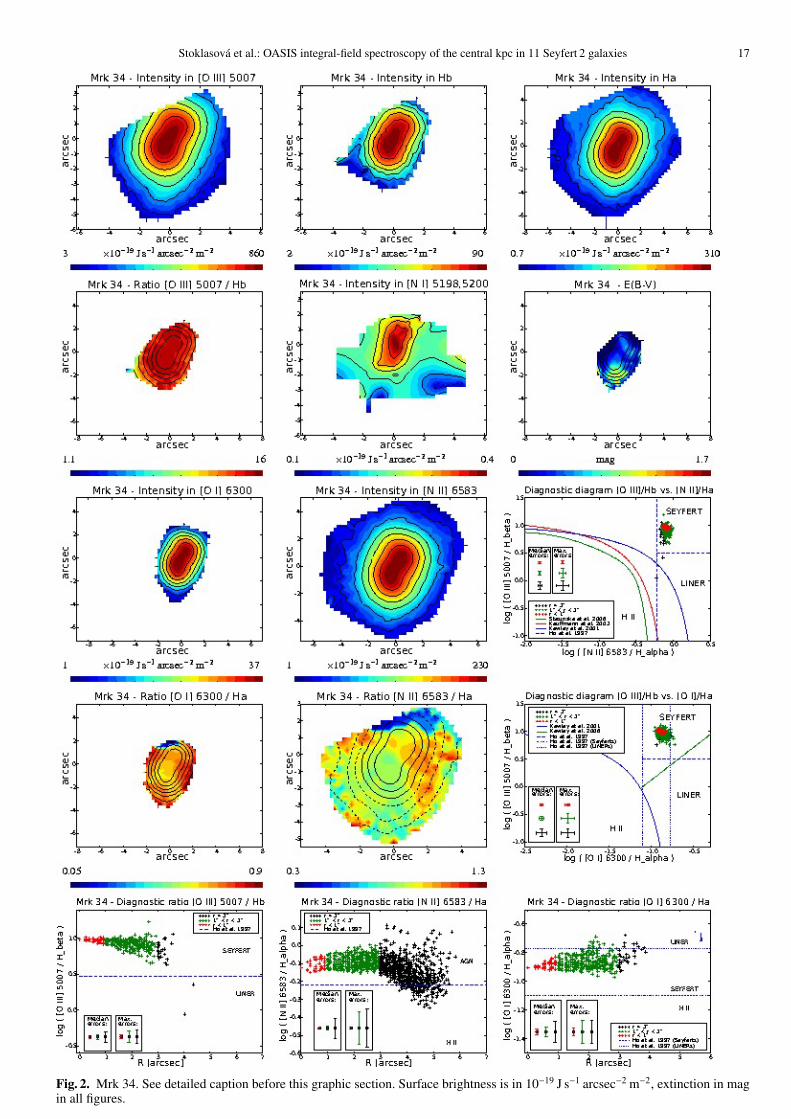
Stoklasova et al.: OASIS integral-field spectroscopy of the central kpc in 11 Seyfert 2 galaxies 17
Fig. 2. Mrk 34. See detailed caption before this graphic section. Surface brightness is in 10−19 J s−1 arcsec−2 m−2, extinction in magin all figures.

18 Stoklasova et al.: OASIS integral-field spectroscopy of the central kpc in 11 Seyfert 2 galaxies
Fig. 3. Mrk 34. Mean LOS velocities and FWHM are in unites of km s−1 in all subsequent figures.
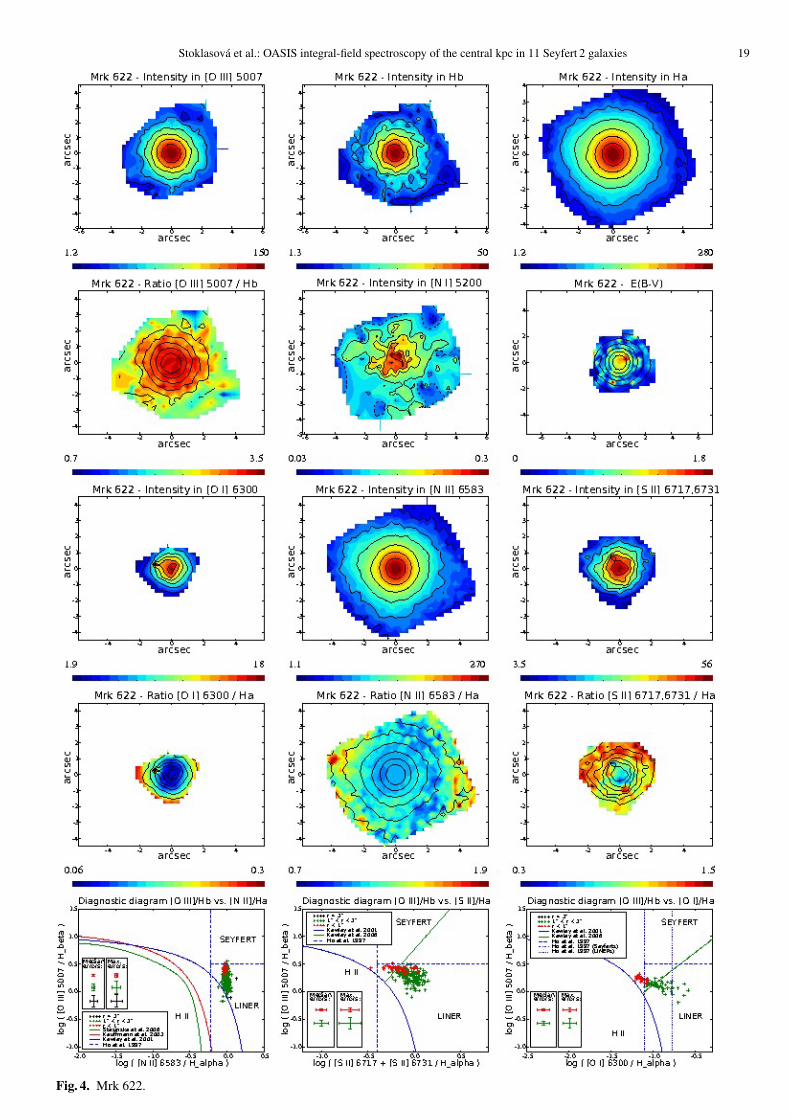
Stoklasova et al.: OASIS integral-field spectroscopy of the central kpc in 11 Seyfert 2 galaxies 19
Fig. 4. Mrk 622.
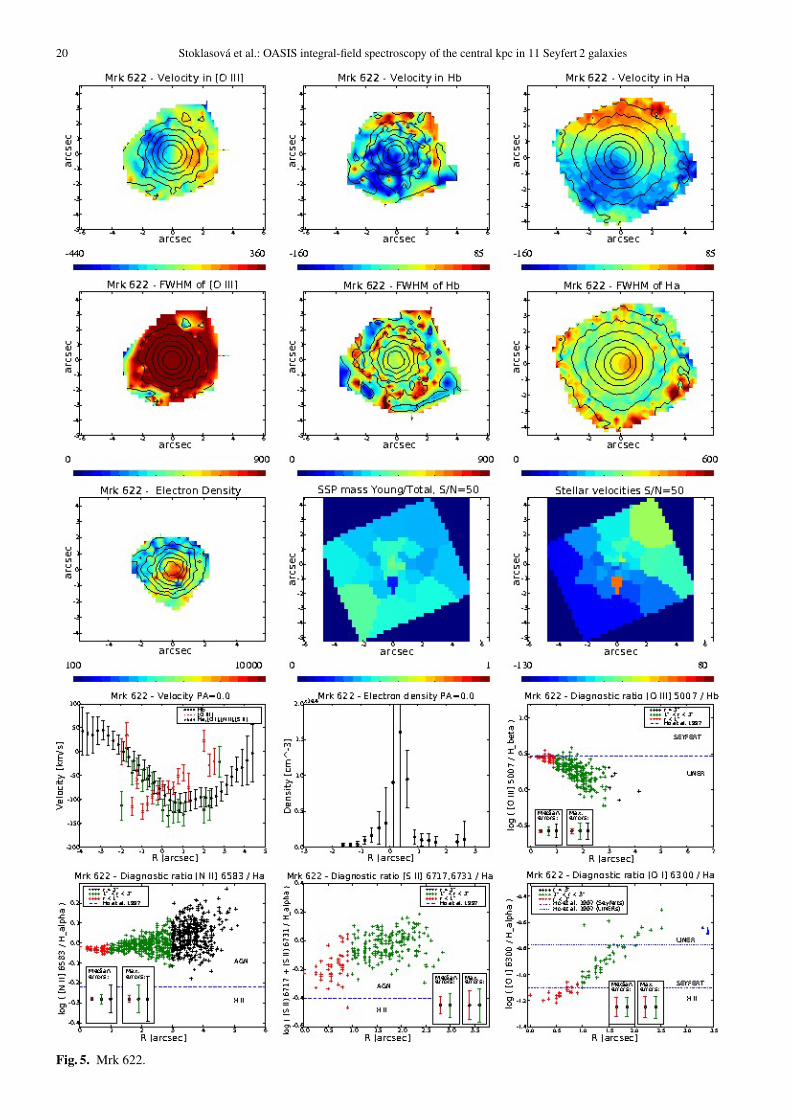
20 Stoklasova et al.: OASIS integral-field spectroscopy of the central kpc in 11 Seyfert 2 galaxies
Fig. 5. Mrk 622.
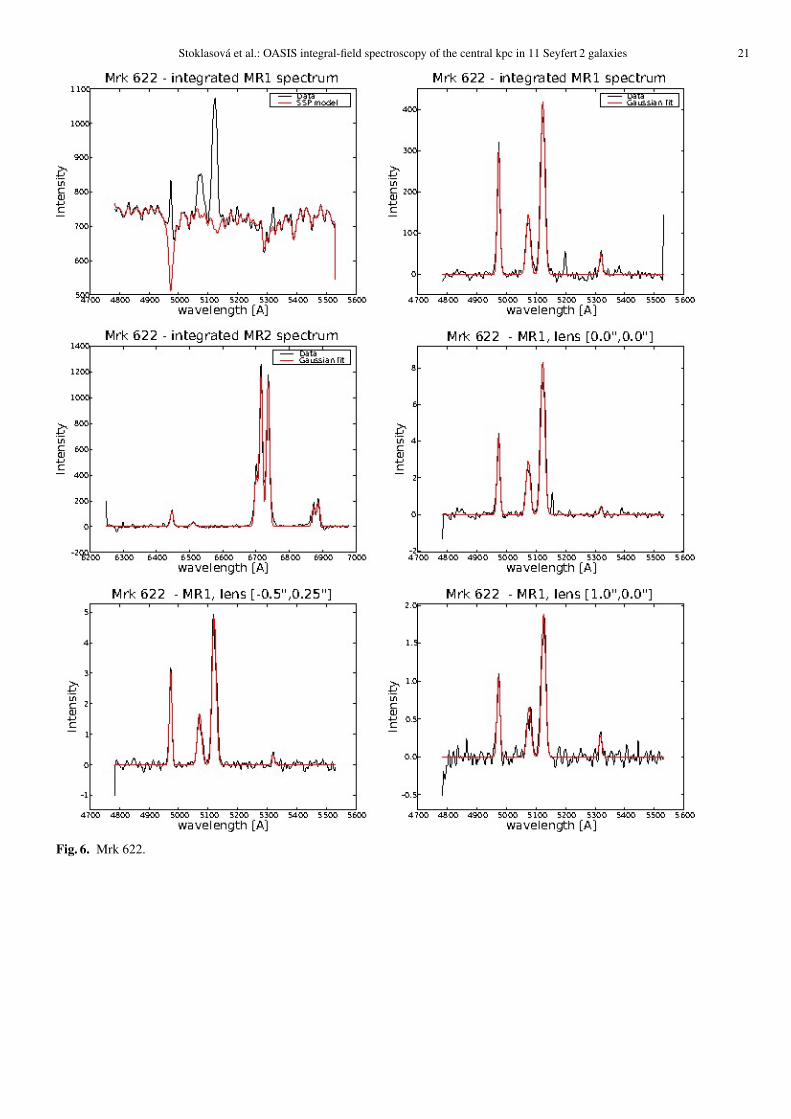
Stoklasova et al.: OASIS integral-field spectroscopy of the central kpc in 11 Seyfert 2 galaxies 21
Fig. 6. Mrk 622.
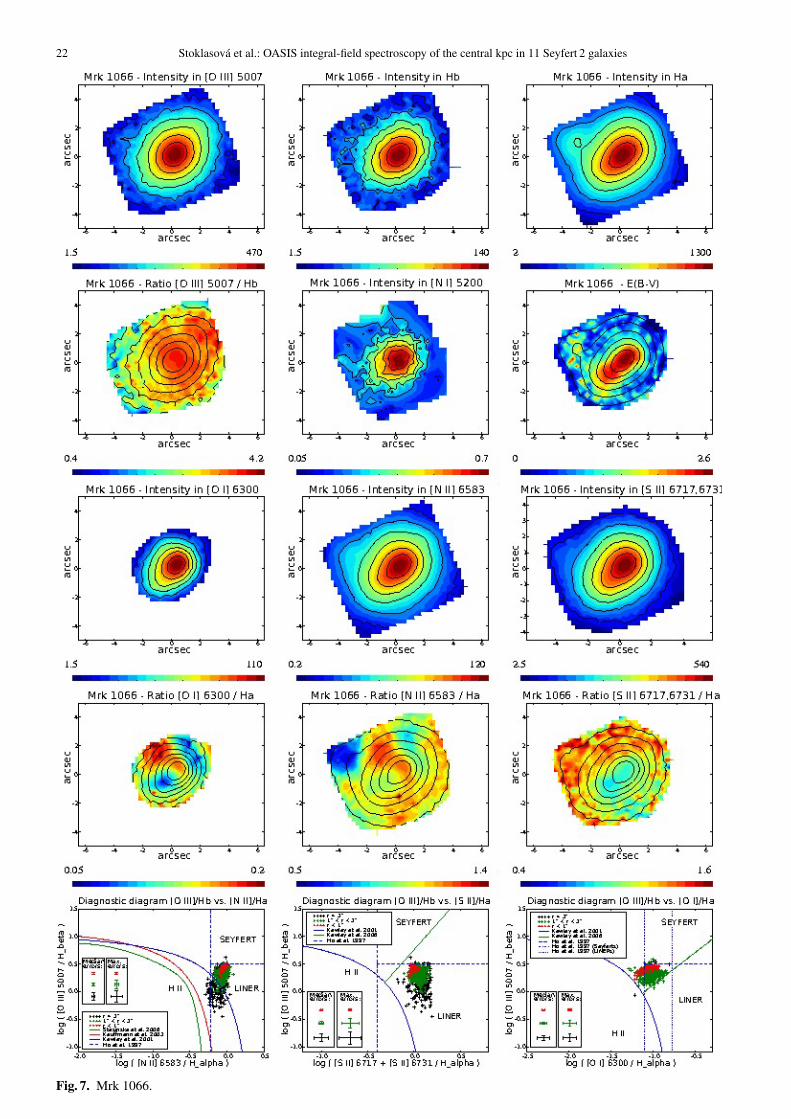
22 Stoklasova et al.: OASIS integral-field spectroscopy of the central kpc in 11 Seyfert 2 galaxies
Fig. 7. Mrk 1066.
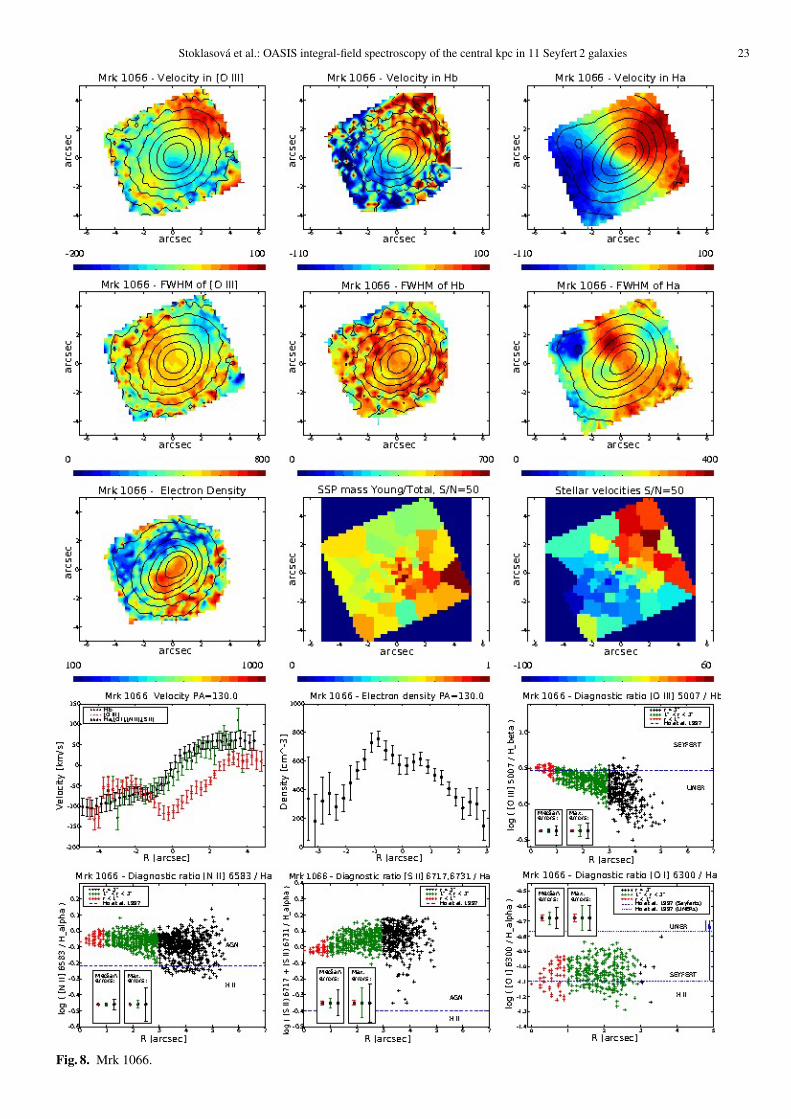
Stoklasova et al.: OASIS integral-field spectroscopy of the central kpc in 11 Seyfert 2 galaxies 23
Fig. 8. Mrk 1066.
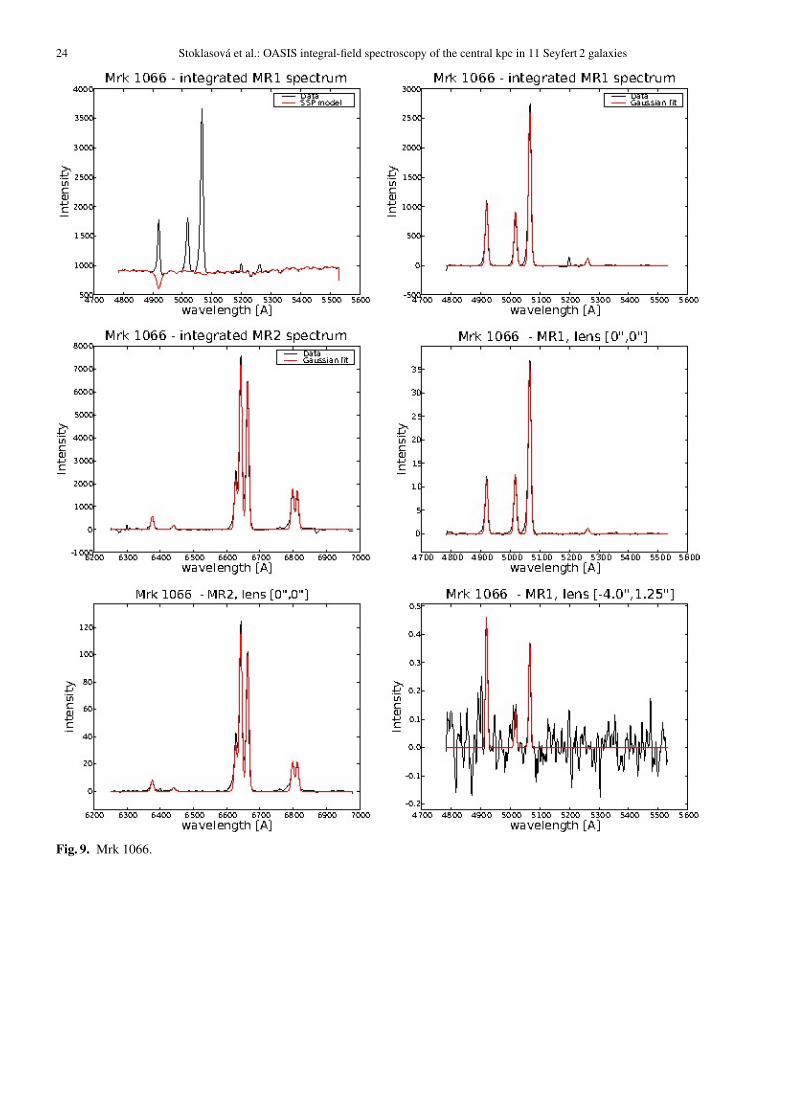
24 Stoklasova et al.: OASIS integral-field spectroscopy of the central kpc in 11 Seyfert 2 galaxies
Fig. 9. Mrk 1066.

Stoklasova et al.: OASIS integral-field spectroscopy of the central kpc in 11 Seyfert 2 galaxies 25
Fig. 10. NGC 262 (Mrk 348).
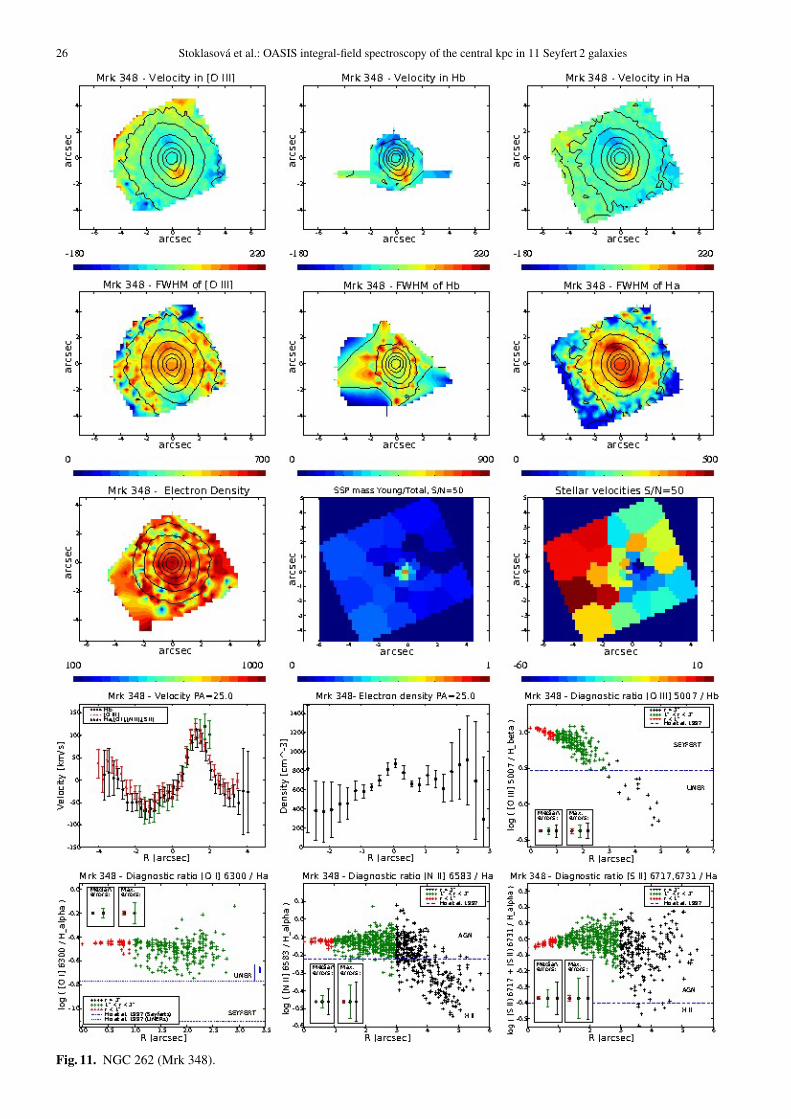
26 Stoklasova et al.: OASIS integral-field spectroscopy of the central kpc in 11 Seyfert 2 galaxies
Fig. 11. NGC 262 (Mrk 348).
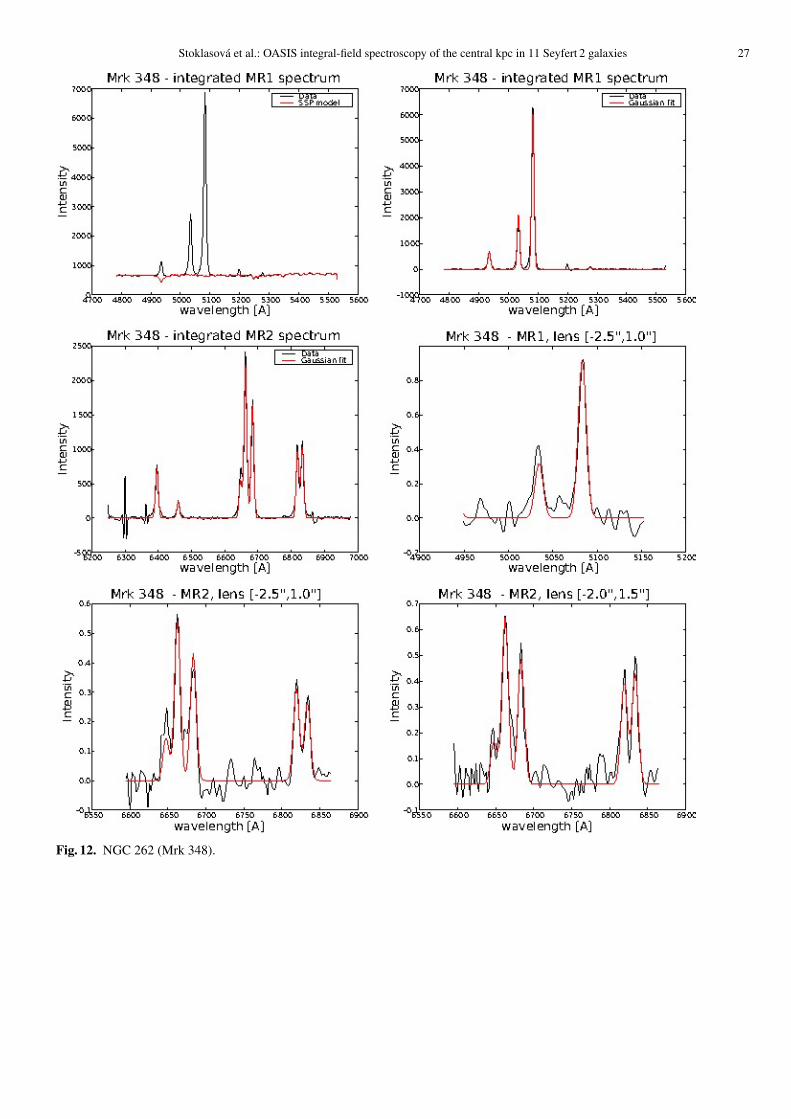
Stoklasova et al.: OASIS integral-field spectroscopy of the central kpc in 11 Seyfert 2 galaxies 27
Fig. 12. NGC 262 (Mrk 348).
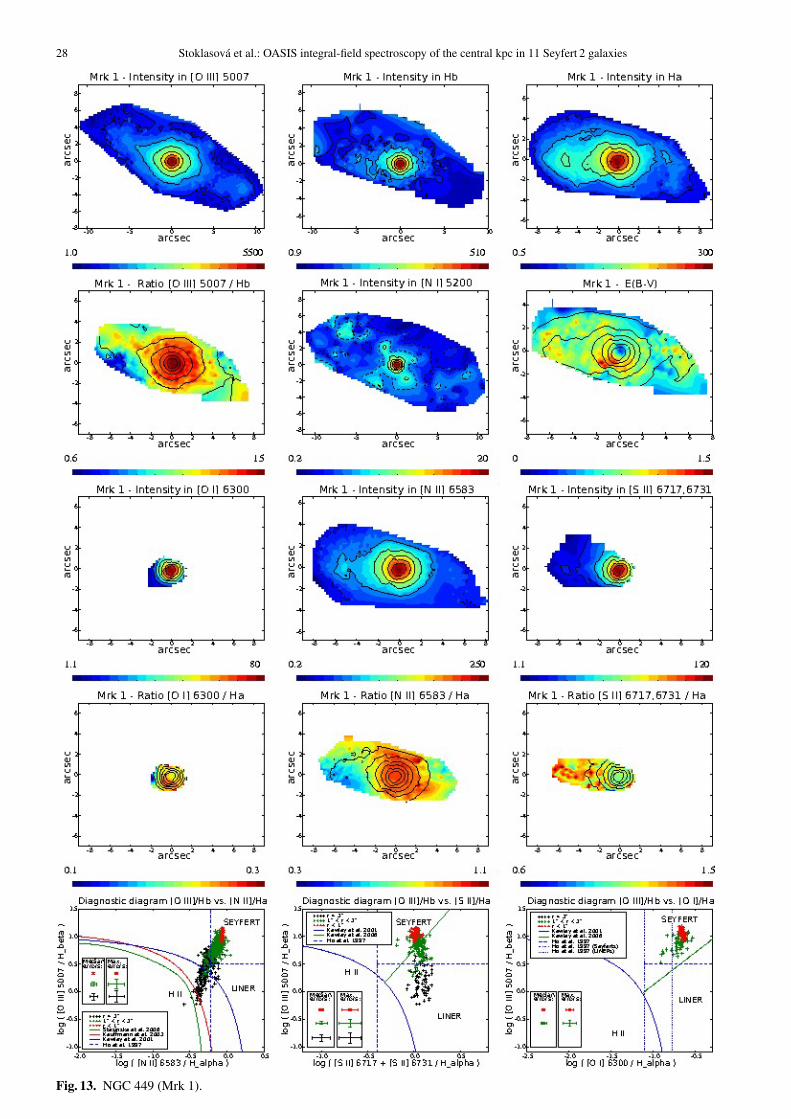
28 Stoklasova et al.: OASIS integral-field spectroscopy of the central kpc in 11 Seyfert 2 galaxies
Fig. 13. NGC 449 (Mrk 1).
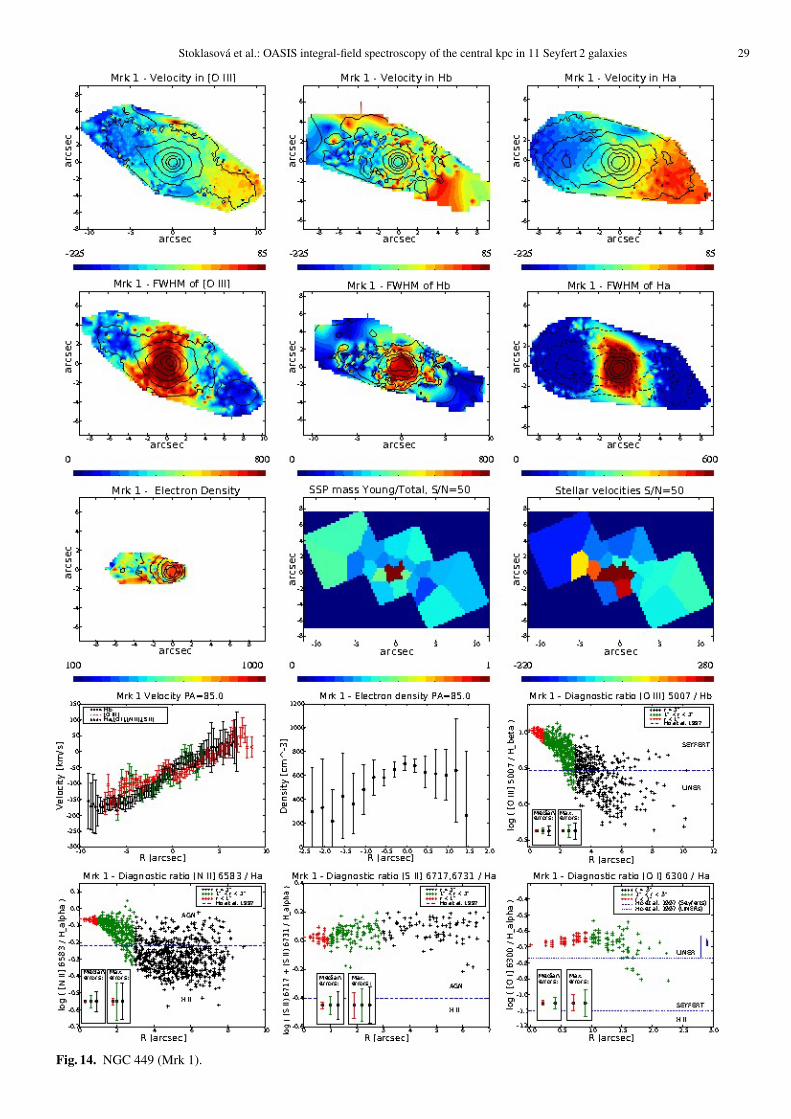
Stoklasova et al.: OASIS integral-field spectroscopy of the central kpc in 11 Seyfert 2 galaxies 29
Fig. 14. NGC 449 (Mrk 1).
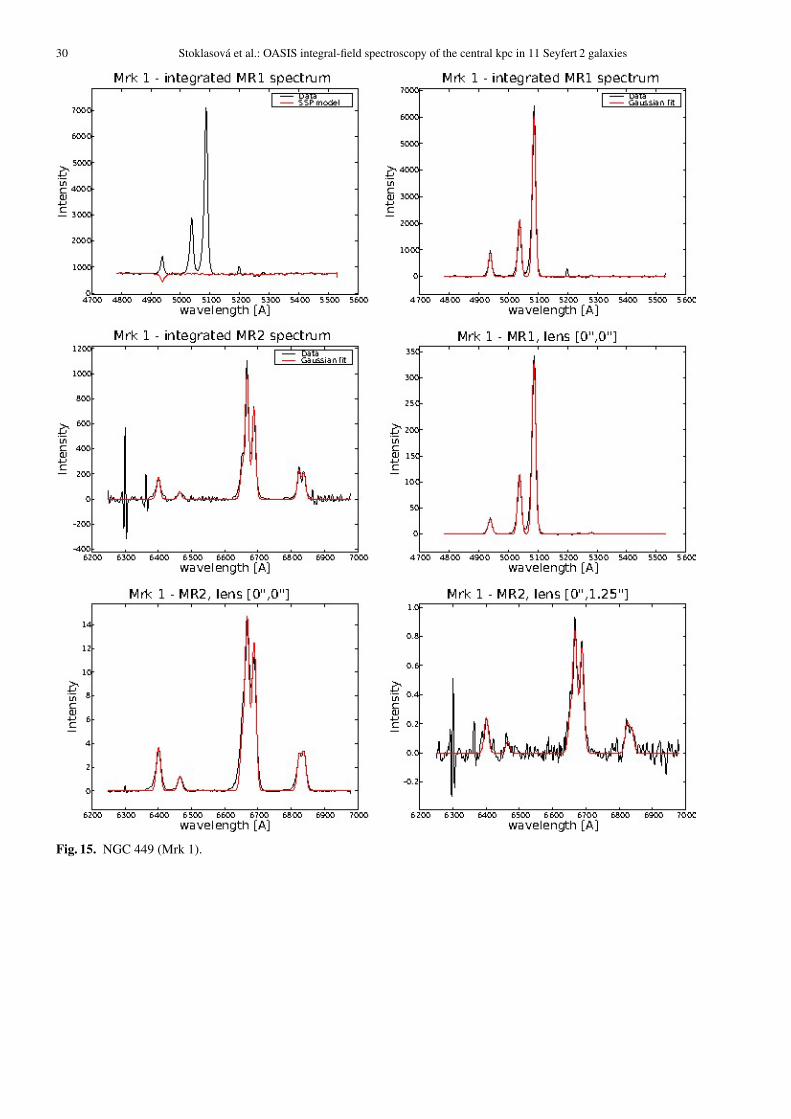
30 Stoklasova et al.: OASIS integral-field spectroscopy of the central kpc in 11 Seyfert 2 galaxies
Fig. 15. NGC 449 (Mrk 1).
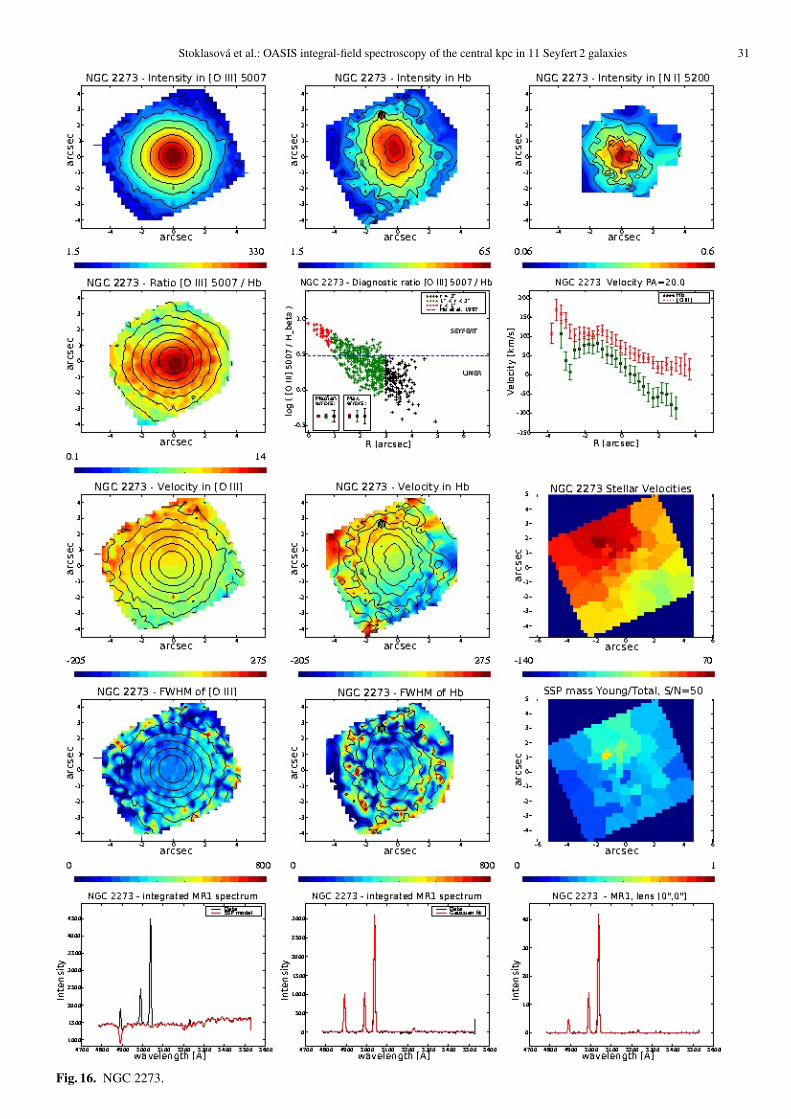
Stoklasova et al.: OASIS integral-field spectroscopy of the central kpc in 11 Seyfert 2 galaxies 31
Fig. 16. NGC 2273.
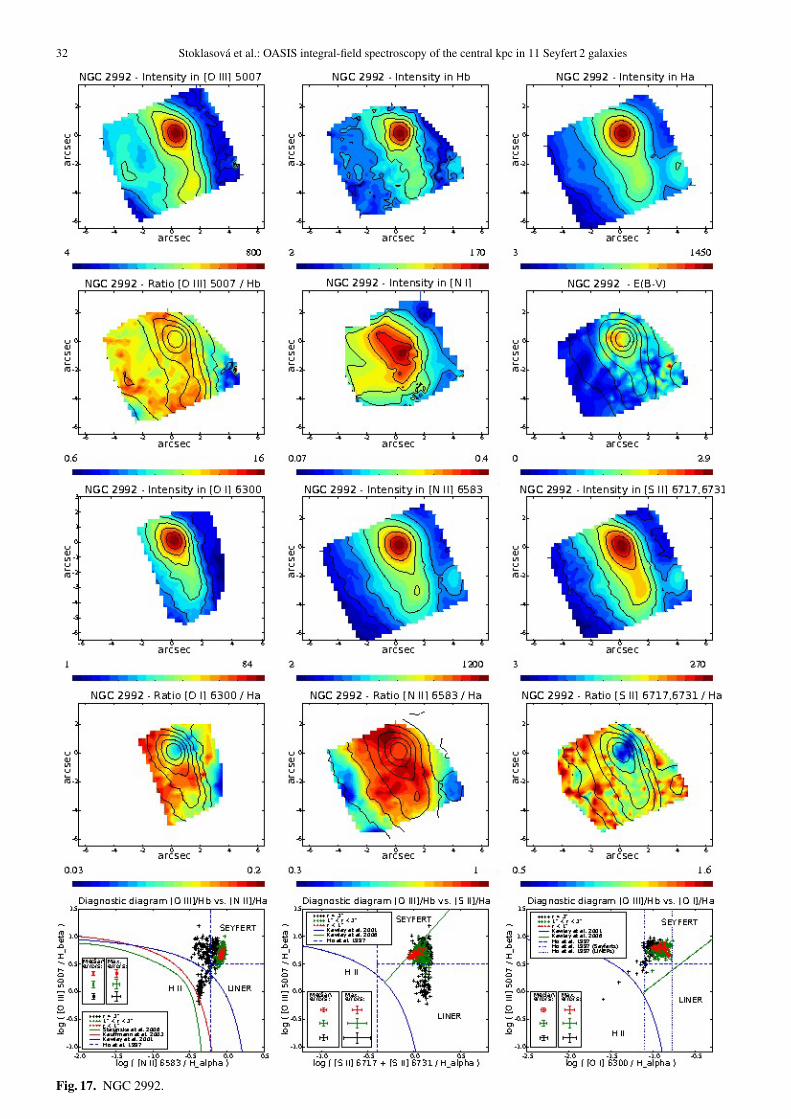
32 Stoklasova et al.: OASIS integral-field spectroscopy of the central kpc in 11 Seyfert 2 galaxies
Fig. 17. NGC 2992.
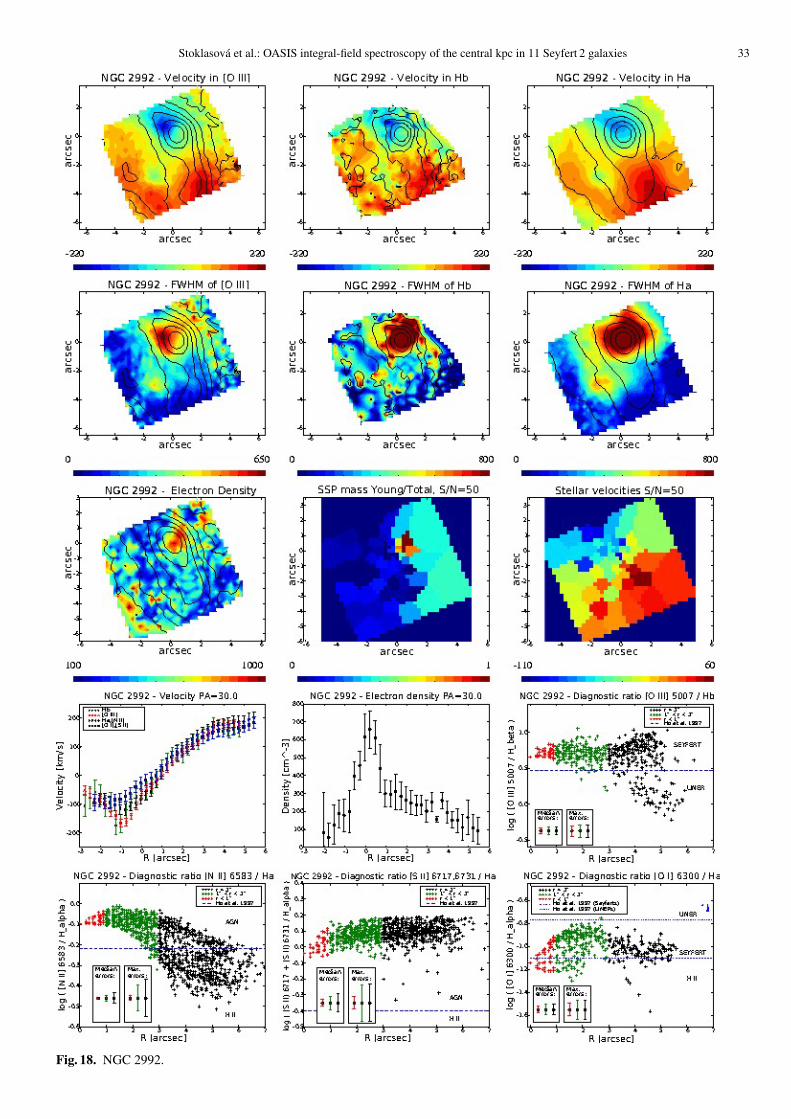
Stoklasova et al.: OASIS integral-field spectroscopy of the central kpc in 11 Seyfert 2 galaxies 33
Fig. 18. NGC 2992.
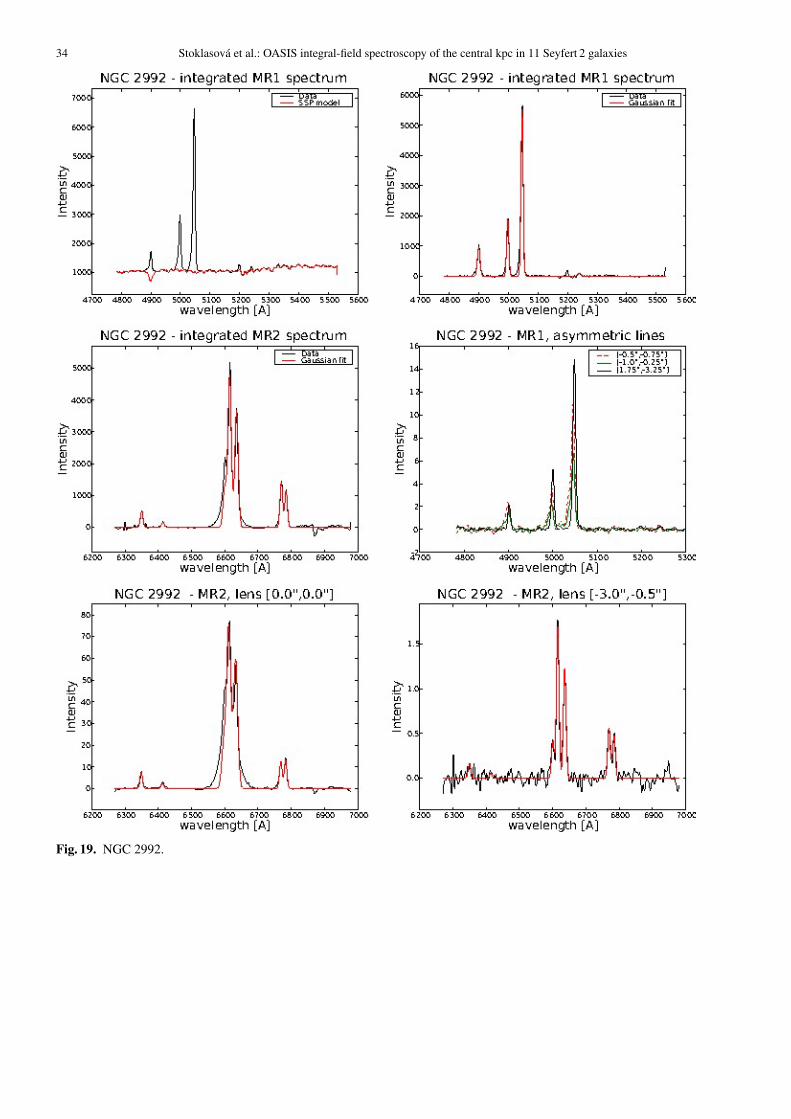
34 Stoklasova et al.: OASIS integral-field spectroscopy of the central kpc in 11 Seyfert 2 galaxies
Fig. 19. NGC 2992.
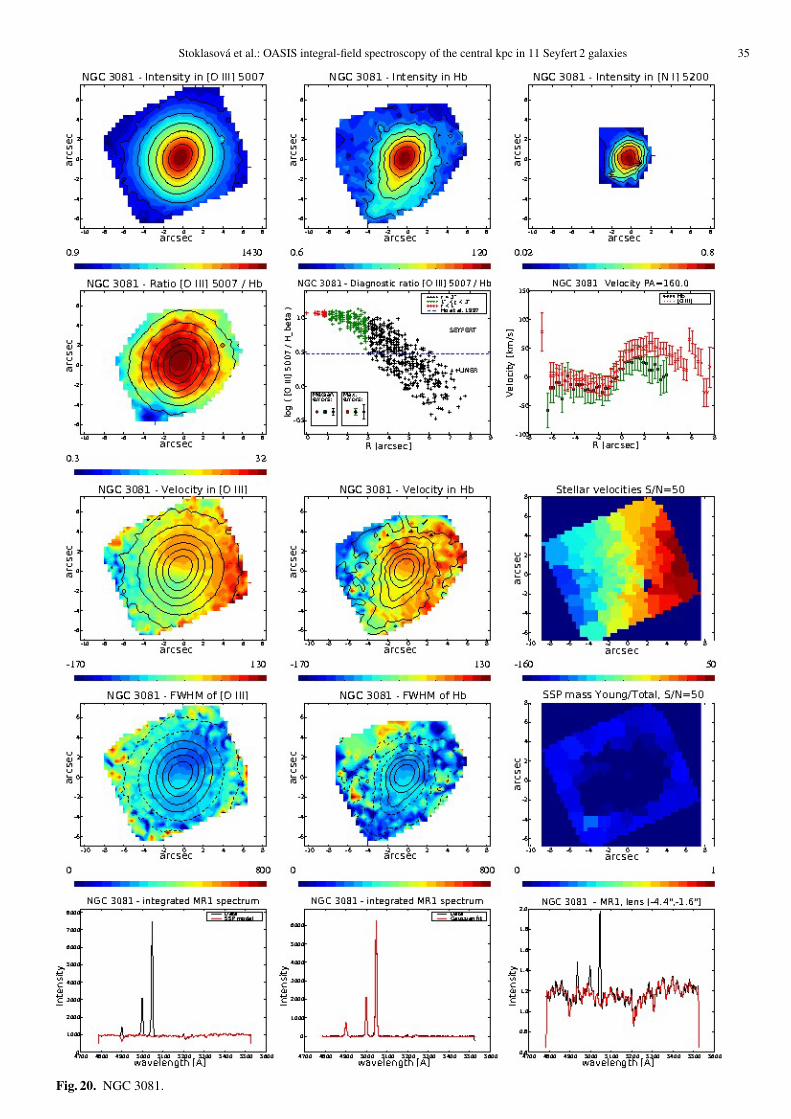
Stoklasova et al.: OASIS integral-field spectroscopy of the central kpc in 11 Seyfert 2 galaxies 35
Fig. 20. NGC 3081.
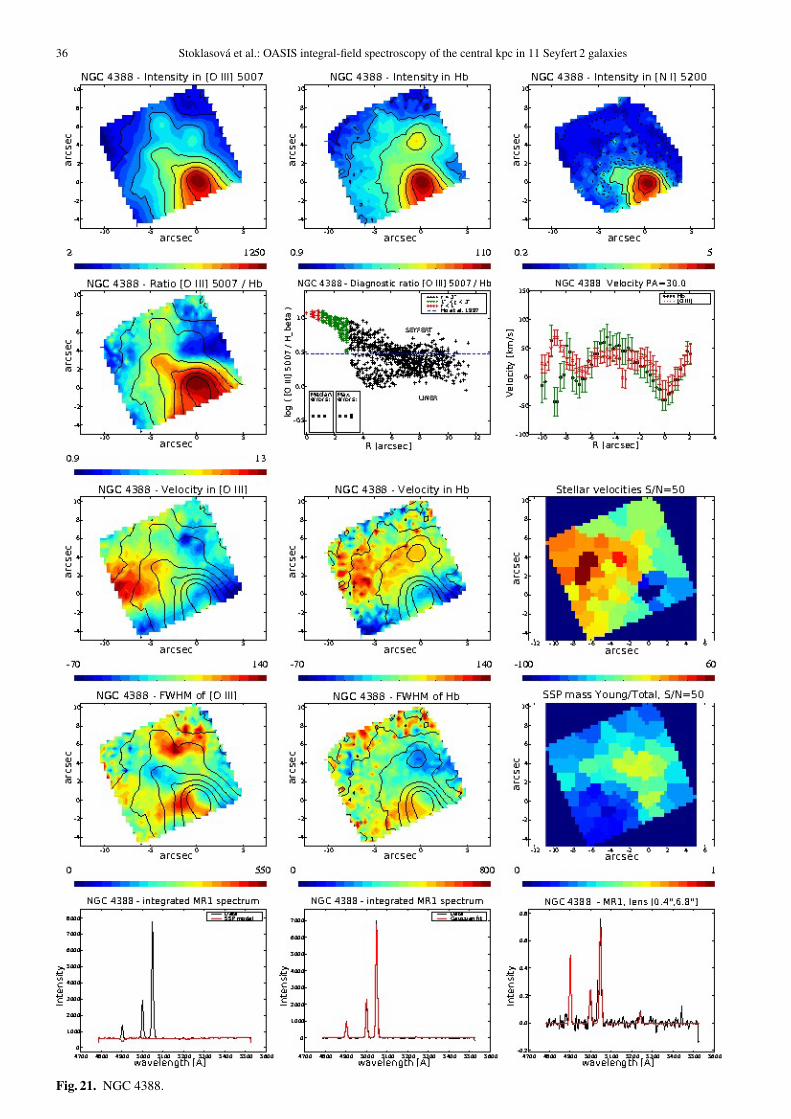
36 Stoklasova et al.: OASIS integral-field spectroscopy of the central kpc in 11 Seyfert 2 galaxies
Fig. 21. NGC 4388.
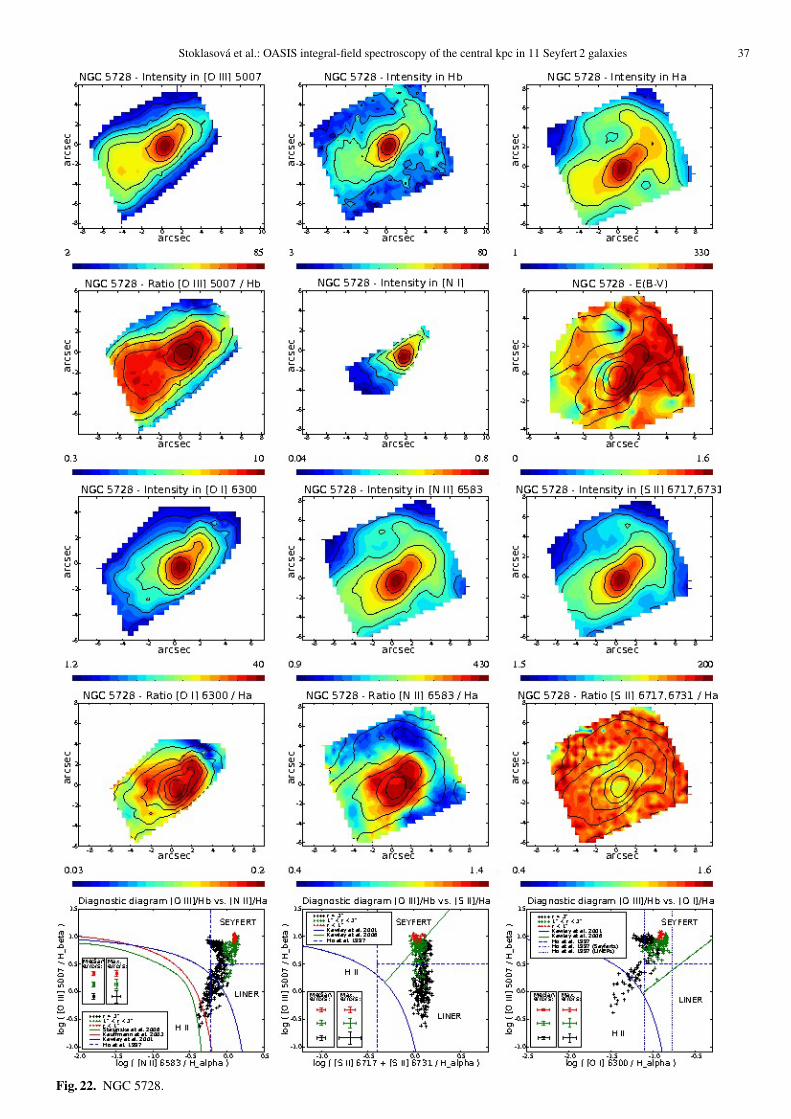
Stoklasova et al.: OASIS integral-field spectroscopy of the central kpc in 11 Seyfert 2 galaxies 37
Fig. 22. NGC 5728.

38 Stoklasova et al.: OASIS integral-field spectroscopy of the central kpc in 11 Seyfert 2 galaxies
Fig. 23. NGC 5728.

Stoklasova et al.: OASIS integral-field spectroscopy of the central kpc in 11 Seyfert 2 galaxies 39
Fig. 24. NGC 5728.
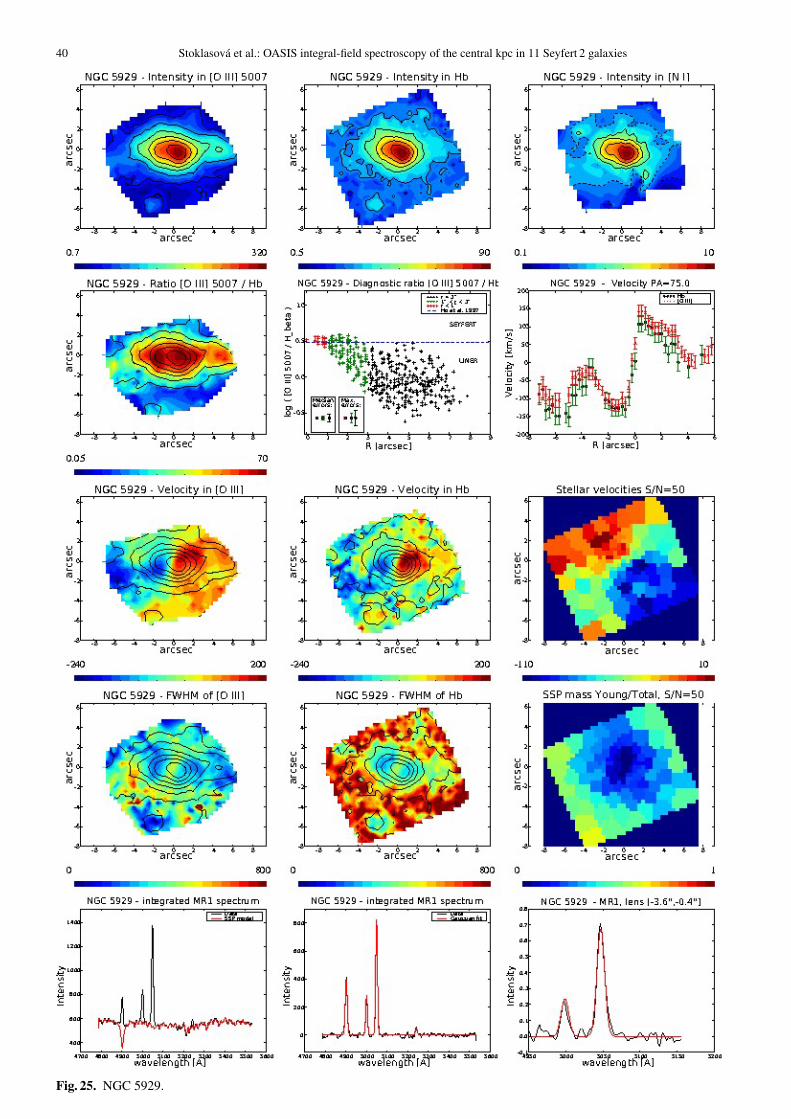
40 Stoklasova et al.: OASIS integral-field spectroscopy of the central kpc in 11 Seyfert 2 galaxies
Fig. 25. NGC 5929.