Distant radio galaxies and their environments - Springer LINK
78
Astron Astrophys Rev (2008) 15:67–144 DOI 10.1007/s00159-007-0008-z REVIEW ARTICLE Distant radio galaxies and their environments George Miley · Carlos De Breuck Received: 19 October 2007 / Published online: 29 January 2008 © The Author(s) 2008 Abstract We review the properties and nature of luminous high-redshift radio galaxies (HzRGs, z > 2) and the environments in which they are located. HzRGs have several distinct constituents which interact with each other—relativistic plasma, gas in various forms, dust, stars and an active galactic nucleus (AGN). These building blocks provide unique diagnostics about conditions in the early Universe. We dis- cuss the properties of each constituent. Evidence is presented that HzRGs are massive forming galaxies and the progenitors of brightest cluster galaxies in the local Universe. HzRGs are located in overdense regions in the early Universe and are frequently sur- rounded by protoclusters. We review the properties and nature of these radio-selected protoclusters. Finally we consider the potential for future progress in the field during the next few decades. A compendium of known HzRGs is given in an appendix. Keywords Radio galaxies · High-redshift · Massive galaxies · Clusters Contents 1 Introduction ............................................. 68 1.1 Scope of this article—HzRGs .................................. 69 1.2 History .............................................. 69 1.3 Hunting for HzRGs ....................................... 70 1.4 Redshift distribution of HzRGs ................................. 72 G. Miley (B ) Sterrewacht, Leiden University, Postbus 9513, 2300RA Leiden, The Netherlands e-mail: [email protected] C. De Breuck European Southern Observatory, Karl-Schwarzschild-Strasse 2, 85748 Garching, Germany e-mail: [email protected] 123
-
Upload
khangminh22 -
Category
Documents
-
view
0 -
download
0
Transcript of Distant radio galaxies and their environments - Springer LINK
Astron Astrophys Rev (2008) 15:67–144DOI 10.1007/s00159-007-0008-z
REVIEW ARTICLE
Distant radio galaxies and their environments
George Miley · Carlos De Breuck
Received: 19 October 2007 / Published online: 29 January 2008© The Author(s) 2008
Abstract We review the properties and nature of luminous high-redshift radiogalaxies (HzRGs, z > 2) and the environments in which they are located. HzRGshave several distinct constituents which interact with each other—relativistic plasma,gas in various forms, dust, stars and an active galactic nucleus (AGN). These buildingblocks provide unique diagnostics about conditions in the early Universe. We dis-cuss the properties of each constituent. Evidence is presented that HzRGs are massiveforming galaxies and the progenitors of brightest cluster galaxies in the local Universe.HzRGs are located in overdense regions in the early Universe and are frequently sur-rounded by protoclusters. We review the properties and nature of these radio-selectedprotoclusters. Finally we consider the potential for future progress in the field duringthe next few decades. A compendium of known HzRGs is given in an appendix.
Keywords Radio galaxies · High-redshift · Massive galaxies · Clusters
Contents
1 Introduction . . . . . . . . . . . . . . . . . . . . . . . . . . . . . . . . . . . . . . . . . . . . . 681.1 Scope of this article—HzRGs . . . . . . . . . . . . . . . . . . . . . . . . . . . . . . . . . . 691.2 History . . . . . . . . . . . . . . . . . . . . . . . . . . . . . . . . . . . . . . . . . . . . . . 691.3 Hunting for HzRGs . . . . . . . . . . . . . . . . . . . . . . . . . . . . . . . . . . . . . . . 701.4 Redshift distribution of HzRGs . . . . . . . . . . . . . . . . . . . . . . . . . . . . . . . . . 72
G. Miley (B)Sterrewacht, Leiden University, Postbus 9513, 2300RA Leiden, The Netherlandse-mail: [email protected]
C. De BreuckEuropean Southern Observatory, Karl-Schwarzschild-Strasse 2, 85748 Garching, Germanye-mail: [email protected]
123

68 G. Miley, C. De Breuck
1.5 Constituents of HzRGs . . . . . . . . . . . . . . . . . . . . . . . . . . . . . . . . . . . . . 722 Relativistic plasma . . . . . . . . . . . . . . . . . . . . . . . . . . . . . . . . . . . . . . . . . . 74
2.1 HzRGS and low-redshift radio galaxies . . . . . . . . . . . . . . . . . . . . . . . . . . . . . 752.2 Radio sizes and morphologies: size as an evolutionary clock . . . . . . . . . . . . . . . . . 752.3 Radio size vs redshift correlation . . . . . . . . . . . . . . . . . . . . . . . . . . . . . . . . 772.4 Radio spectral index vs redshift correlation . . . . . . . . . . . . . . . . . . . . . . . . . . . 772.5 Non-thermal X-ray emission . . . . . . . . . . . . . . . . . . . . . . . . . . . . . . . . . . 79
3 Gas and dust . . . . . . . . . . . . . . . . . . . . . . . . . . . . . . . . . . . . . . . . . . . . . 803.1 Hot ionised gas—radio depolarisation . . . . . . . . . . . . . . . . . . . . . . . . . . . . . 803.2 Warm ionised gas . . . . . . . . . . . . . . . . . . . . . . . . . . . . . . . . . . . . . . . . 823.3 Neutral gas . . . . . . . . . . . . . . . . . . . . . . . . . . . . . . . . . . . . . . . . . . . 883.4 Molecular gas . . . . . . . . . . . . . . . . . . . . . . . . . . . . . . . . . . . . . . . . . . 903.5 Dust . . . . . . . . . . . . . . . . . . . . . . . . . . . . . . . . . . . . . . . . . . . . . . . 93
4 STARS . . . . . . . . . . . . . . . . . . . . . . . . . . . . . . . . . . . . . . . . . . . . . . . . 964.1 Old stars: HzRGs as the most massive galaxies . . . . . . . . . . . . . . . . . . . . . . . . . 974.2 Young stars—UV absorption lines . . . . . . . . . . . . . . . . . . . . . . . . . . . . . . . 994.3 The alignment effect—jet-induced star formation . . . . . . . . . . . . . . . . . . . . . . . 99
5 Active galactic nucleus (AGN) . . . . . . . . . . . . . . . . . . . . . . . . . . . . . . . . . . . . 1015.1 Hidden or dormant quasar—The Unification Church . . . . . . . . . . . . . . . . . . . . . . 1025.2 Supermassive black hole—powerhouse of the AGN . . . . . . . . . . . . . . . . . . . . . . 1035.3 Extinction of the “dinosaurs” . . . . . . . . . . . . . . . . . . . . . . . . . . . . . . . . . . 104
6 Nature of HzRG hosts—massive forming galaxies . . . . . . . . . . . . . . . . . . . . . . . . . 1046.1 The Spiderweb Galaxy—a case study . . . . . . . . . . . . . . . . . . . . . . . . . . . . . 106
7 Environment of HzRGS—protoclusters . . . . . . . . . . . . . . . . . . . . . . . . . . . . . . . 1077.1 Finding protoclusters using HzRGs . . . . . . . . . . . . . . . . . . . . . . . . . . . . . . . 1087.2 Properties of radio-selected protoclusters . . . . . . . . . . . . . . . . . . . . . . . . . . . . 1097.3 Are radio-selected protoclusters typical? . . . . . . . . . . . . . . . . . . . . . . . . . . . . 1127.4 Protocluster evolution . . . . . . . . . . . . . . . . . . . . . . . . . . . . . . . . . . . . . . 113
8 Conclusions and future . . . . . . . . . . . . . . . . . . . . . . . . . . . . . . . . . . . . . . . . 115Appendix: Known HZRGs . . . . . . . . . . . . . . . . . . . . . . . . . . . . . . . . . . . . . . . 117
1 Introduction
Martin Harwit. ”Yes. I think that if there were less requirement for theoretical justifi-cation for building a instrument that is very powerful, you would then have a betterchance of making a discovery.”Bernard Burke. ”The record of radio astronomy is clear. Quasars were not found bythe desire to find black holes or by the need to find long-distance cosmological probes.”
Proceedings of Greenbank Workshop on Serendipitous Discovery in Radio Astron-omy, 1983
Distant radio galaxies are among the largest, most luminous, most massive and mostbeautiful objects in the Universe. They are energetic sources of radiation throughoutmost of the electromagnetic spectrum. The radio sources are believed to be powered byaccretion of matter onto supermassive black holes in the nuclei of their host galaxies.Not only are distant radio galaxies fascinating objects in their own right, but they alsohave several properties that make them unique probes of the early Universe.
123
Distant radio galaxies and their environments 69
1.1 Scope of this article—HzRGs
Our review will be restricted to galaxies that have redshifts, z > 2 and radio lumi-nosities at 500 MHz (rest frame) L500(rest) > 1027 W Hz−1. Radio emission from suchobjects has a steep non-thermal spectrum, is collimated and is usually extended bytens of kiloparsecs. There are very few known z > 2 radio galaxies associated withcompact flat-spectrum radio sources.
This definition is somewhat arbitrary. Luminous distant radio galaxies have prop-erties that are different from less powerful radio galaxies at low redshifts and theproperties of radio galaxies change gradually with luminosity and redshift. Likewise,z > 2 quasars that are associated with steep-spectrum extended radio emission havemany similar properties to our distant radio galaxies (see Sect. 5.1) and are locatedin similar environments. However, without some restriction, our task would not havebeen tractable.
For conciseness, we shall frequently refer to such high-redshift radio galaxies as“HzRGs”. McCarthy (1993) gave an extensive review of this topic in 1993. Since thenthere have been several workshops on high-redshift radio galaxies, whose proceedingshave been published, including Amsterdam (Röttgering et al. 1999b), Leiden (Jarvisand Röttgering 2003) and Granada (Villar-Martín et al. 2006a,b). Thousands of refer-eed papers dealing with distant radio galaxies and related topics have been publishedduring the last fifteen years. Although our goal is to be comprehensive, some personalbias will inevitably have entered in selecting the topics and literature. Our apologiesfor this.
The structure of this review is as follows. We shall first set the scene by reviewingthe history of the field. Then we shall describe techniques used for finding HzRGs anddiscuss how HzRGs are distributed in redshift. Following an overview of the diverseconstituents of HzRGs, we shall discuss each HzRG component in detail. The natureof HzRGs and their role in the general evolution of galaxies will then be covered. Weshall present evidence that HzRGs are the massive progenitors of dominant clustergalaxies in the local Universe and that they are located in forming galaxy clusters.The properties of these radio-selected protoclusters are then reviewed. Finally, weshall discuss some of the exciting prospects for future HzRG research. An appendixincludes a list of known HzRGs at the time of writing (October 2007).
1.2 History
The study of distant radio galaxies has progressed in several phases:
(i) Infancy. Mid-1940s to mid-1960s: After the discovery that Cygnus A is associatedwith a faint distant galaxy (Baade and Minkowski 1954), radio astronomy became oneof the most important tools of observational cosmology. Redshifts of up to z = 0.45were measured for galaxies associated with radio sources (Minkowski 1960). Twofundamental breakthroughs were made towards the end of this period. First, quasi-stellar radio sources or “quasars” were discovered, with much larger redshifts eventhan radio galaxies. Second, it was demonstrated that the space density of radio sources
123

70 G. Miley, C. De Breuck
varies with cosmic epoch, an observation that sounded the death knell for the SteadyState cosmology
(ii) Childhood. Mid-1960s to mid-1980s: This can be termed the “Spinrad era”. HySpinrad devoted a considerable amount of his time, and that of the 120-inch tele-scope at Lick, to measuring the redshifts of faint radio galaxies by means of longphotographic exposures. With considerable effort, he pushed the highest radio gal-axy redshift out to z ∼ 1 (Spinrad 1976; Spinrad et al. 1977; Smith and Spinrad1980). At that time, it was not realised that radio sources interact with their opticalhosts and the different wavelength regimes were usually studied in isolation from oneanother. Radio sources were regarded as interesting high-energy exotica that were use-ful for pinpointing distant elliptical galaxies. They were not believed to play an impor-tant role in the general scheme of galaxy evolution. During this period the paradigmthat radio sources are powered by accretion of matter onto rotating black holes wasdeveloped.
(iii) Teens. Mid-1980s to mid-1990s: The replacement of photographic techniquesby CCDs revolutionised optical astronomy. Large numbers of very distant radio gal-axies were discovered with redshifts out to z ∼ 5 (HzRGs). The surprising discoverythat the radio sources and the optical host galaxies are aligned showed that there mustbe considerable interaction between the radio sources and their host galaxies. The rolethat orientation could have in determining observed properties was realised. “Orien-tation unification” that explained differences in the observed types of active galaxiesas merely due to the viewing angle of the observer became a popular interpretative“do-it-all”.
(iv) Maturity. Mid-1990s to the present: New efficient techniques for finding distantgalaxies were developed. These included photometric searches for “dropout” objectswith redshifted Lyman break features and narrow-band searches for objects with excessredshifted Lyman α fluxes. The advent of these new techniques placed the cosmologi-cal use of radio galaxies in a new perspective. Although radio astronomy lost its primeposition as a technique for finding the most distant galaxies, it became clear that lumi-nous radio galaxies play a highly important role in the evolution of galaxies and theemergence of large scale structure. The discovery of a relation between the masses ofelliptical galaxies and the inferred masses of nuclear black holes led to the conclusionthat all galaxies may have undergone nuclear activity at some time in their histories.This brought nuclear activity into the mainstream of galaxy evolution studies.
1.3 Hunting for HzRGs
Appendix A contains a compendium of 178 radio galaxies with z > 2 known to theauthors. This list is the result of more than two decades of hard work. The relativelysmall number of known HzRGs illustrates both their rarity and the difficulty of detect-ing them.
Finding distant radio galaxies involves a multistage process.
123
Distant radio galaxies and their environments 71
• The first step (e.g. Röttgering et al. 1994; Blundell et al. 1998; De Breuck et al.2000b, 2004b) is to filter out probable HzRGs from the huge number of radiosources contained in low-frequency radio surveys (e.g. Condon et al. 1998). Theusual criteria used for filtering likely candidates are (i) radio colours—extremelysteep spectra (Sect. 2.4) and (ii) small angular sizes (Sect. 2.3).
• In the second step, relatively bright nearby objects are discarded, by comparing theradio positions with existing wide-field shallow surveys at optical and near-infraredwavelengths.
• The third step is to refine the positions of the remaining radio sources to arc-second accuracy, thereby facilitating their identification with faint galaxies.Until the 1990s, radio identifications were made using optical CCD data (e.g.Röttgering et al. 1995; McCarthy et al. 1996). However, after sensitive near-IRdetectors became available, the near-IR K -band was found to be more efficientfor identifying distant radio sources (e.g. Jarvis et al. 2001a,b, 2004; De Breucket al. 2002, 2004b; Cruz et al. 2006). More than 94% of bright radio sources areidentified down to K = 22. Furthermore, the K -band magnitude of an HzRGprovides a first indication of its redshift, by means of the K − z relationship (seeSect. 4.1).
• The fourth step is to carry out spectroscopic observations of the HzRG candidateswith large optical and near-infrared telescopes. These are needed to determine red-shifts from the wavelengths of HzRG emission lines (e.g. Röttgering et al. 1997;DeBreuck et al. 2001; De Breuck et al. 2006; Jarvis et al. 2001b; Bornancini et al.2007) (see Sect. 3.2).
The main limitation on finding HzRGs has been the scarcity of available observ-ing time on large optical/IR telescopes for the last stage in the process. Becausecandidates are located too far apart in the sky to permit multi-object spectroscopy,tedious long-slit spectroscopy on many individual fields is required to determine theredshifts.
Although radio selection ensures that there is no a priori selection against dustproperties (e.g. extinction), there are other observational selection effects that intro-duce bias into the redshift distributions of HzRGs and the list given in the appendix.The first obvious source of bias is that the determination of a spectroscopic redshiftis dependent on being able to observe bright emission lines with ground-based tele-scopes. The primary line for such redshift measurement (e.g. McCarthy, 1993) isLy αλ1216Å (typical equivalent widths of several hundred Å). Useful additional linesare CIV λ1549Å, HeII λ1640Å and CIII] λ1909Å (equivalent widths in excess of∼60Å). There is a so-called “redshift desert” 1.2 < z < 1.8 (e.g. Cruz et al. 2006),where [OII] λ3727Å is too red and Ly αλ1216Å is too blue to be easily observed fromground-based optical telescopes. Objects located within the redshift desert are thusunder-represented in samples of HzRGs.
A second source of bias is redshift incompleteness. A small fraction of radio sources,(∼4%) is not identified to K ∼ 22 and about a third of those with K-band identifi-cations do not show any emission or absorption lines, even after long exposures on8–10 m class optical/IR telescopes. These objects either (i) have emission lines that
123
72 G. Miley, C. De Breuck
are hidden by substantial dust obscuration (e.g. De Breuck et al. 2001; Reuland et al.2003a), (ii) are located at such large redshifts that Lyα and other bright emission linesfall outside the easily observable spectral windows, or (iii) are peculiar in that theyradiate no strong emission lines.
1.4 Redshift distribution of HzRGs
HzRGs are extremely rare. Luminous steep-spectrum radio sources associated withHzRGs have typical luminosities of L2.7G H z > 1033 erg s−1 Hz−1 ster−1. The numberdensity of radio sources with this luminosity in the redshift range 2 < z < 5 is a fewtimes 10−8 Mpc−3, with large uncertainties (Dunlop and Peacock 1990; Willott et al.2001; Venemans et al. 2007).
Although HzRGs are sparsely distributed in the early Universe, such objects arealmost non-existent at low redshifts. The co-moving space density of luminous steep-spectrum radio sources increases dramatically by a factor of 100–1000 between 0 ≤z < 2.5 and then appears to flatten out (Willott et al. 2001; Jarvis et al. 2001c).Although there are huge uncertainties in the evolution of the luminosity function athigher redshifts, no significant cut-off in space density has yet been observed.
The redshifts at which the space density of radio sources is maximum correspondto a crucial era in the evolution of the Universe. It coincides with the epoch when(i) luminous quasars also appear to have had their maximum space density (e.g. Pei1995; Fan et al. 2001) (ii) star formation was rampant and more than an order ofmagnitude larger than the present (Madau et al. 1998; Lilly et al. 1996; Schiminovichet al. 2005) and (iii) galaxy clusters were forming, but were not yet gravitationallybound structures.
The question of why the most luminous radio sources (and the most luminousquasars) became extinct in the local Universe is an intriguing one that is still notunderstood (Sect. 5.3).
1.5 Constituents of HzRGs
Radio galaxies have several distinct emitting components which provide diagnosticsabout various physical constituents of the early Universe. A list of known HzRGbuilding blocks is given in Table 1, together with a summary of techniques used tostudy them. Also included are a list of the resultant diagnostics, some useful relevantreferences and our best estimate for the typical mass of the component in HzRGs. Wecaution the reader to thoroughly examine the assumptions inherent in deriving eachof the diagnostics. Although, these assumptions are needed in order to reach someconclusions about the nature of HzRGs, it is important never to forget that they existand to be sceptical about the “houses of cards” that are frequently involved.
Because they are highly luminous and (unlike quasars) spatially resolvablefrom the ground, most components of HzRGs provide important diagnostic informa-tion about the spatial distributions of processes within HzRGs and their environment.
123

Distant radio galaxies and their environments 73
Table 1 Constituents of distant radio galaxies
Constituent Observable Typical diagnostics Refs.a Mass(M)
Relativistic plasma Radio continuum Magnetic field, age, ener-getics, pressure, particleacceleration. Jet collima-tion and propagation
1, 2
X-ray continuum Magnetic field, equiparti-tion, pressures
3, 4, 1
Hot ionised gasTe ∼ 107–108 Kne ∼ 10−1.5 cm−3
Radio (de)polari-sation
Density, magnetic field, 11011−12
X-rays Temperature, density mass
Warm ionised gasTe ∼ 104–105 Kne ∼ 100.5−1.5cm−3
UV-opticalemission lines
Temperature, density, kine-matics, mass, ionisation,metallicity, filling factor
5, 6, 7,8 109−10.5
Nebularcontinuum
SED contamination 9, 10
Cool atomic gasTs ∼ 103 Kn(HI) ∼ 101 cm−3
HI absorption Kinematics, column den-sities, spin temperature,sizes, mass
11, 8107−8
UV-opticalabsorption lines
Kinematics, mass,columndensities, metallicity
8, 12,13, 14
Molecular gasT ∼ 50–500 Kn(H2) > 102 cm−3
(Sub)millimetre lines Temperature, density, mass 151010−11
DustT ∼ 50–500 K
UV-opticalpolarisation
Dust composition, scatter-ing, mass, hidden quasar
16, 17108−9
(Sub)millimetre con-tinuum
Temperature, mass, heatingsource
18
Old starst > 1 Gyr
Optical to near IRcontinuum
Age, mass, formation epoch 191011−12
Young starst < 0.5 Gyr
UV-optical Star formation rates, ages,history
20, 8109−10
Lyα Star formation rate 20
Quasar (hidden or dor-mant)
UV-optical polarisa-tionbroad lines
Luminosity 21, 22
Supermassive black hole(SMBH)
Extended radio,Quasar
Formation, evolution 23, 24 ∼109
a References: 1 = Miley (1980), 2 = Klamer et al. (2006), 3 = Felten and Morrison (1966), 4 = Schwartz(2002), 5 = Osterbrock and Ferland (2006), 6 = Groves et al. (2004a), 7 = Groves et al. (2004b), 8 =Dopita and Sutherland (2003), 9 = Aller (1984), 10 = Dickson et al. (1995), 11 = Morganti (2006), 12 =van Ojik et al. (1997a), 13 = Binette et al. (2000), 14 = Binette et al. (2006), 15 = Downes et al. (1993),16 = Cimatti et al. (1993), 17 = Vernet et al. (2001b), 18 = Reuland et al. (2004), 19 = Seymour et al.(2007), 20 = Madau et al. (1998), 21 = Cimatti et al. (1993), 22 = Vernet et al. (2001b), 23 = Blandford(2001), 24 = Peacock (1999)
The fact that the different constituents are present in the same objects and that theinterrelationships and interactions between them can be studied make distant radiogalaxies unique laboratories for probing the early Universe.
123

74 G. Miley, C. De Breuck
Fig. 1 Spectral energy distribution (SED) of the continuum emission from the HzRG 4C23.56 at z = 2.5,illustrating the contributions from the various constituents [from De Breuck et al. in preparation]. Col-oured lines show the decomposition of the SED into individual components, under many assumptions.Cyan radio synchrotron (Sect. 2); Black Absorbed non-thermal X-ray AGN (Sect. 2.5); Yellow nebularcontinuum (Sect. 3.2.6); Blue AGN-heated thermal dust emission (Sect. 3.5); Red Starburst-heated dustemission (Sect. 3.5); Green Stars (Sect. 4); Magenta scattered quasar (Sects. 3.5.2 and 5). The addition ofthe overlapping modeled components fits the SED well
As can be seen in Table 1, several constituents of HzRGs are inferred to be extremelymassive, including old stars (up to ∼1012 M), hot gas (up to ∼1012 M) and molec-ular gas (up to ∼ 1011 M).
Figure 1 shows the spectral energy distribution (SED) of a typical HzRG from radioto X-ray wavelengths, together with a decomposition into various observable HzRGconstituents—relativistic plasma, gas and dust, stars and the active galactic nuclei(AGN). We shall discuss each of these building blocks individually in Sects. 2, 3, 4and 5. Note from Fig. 1 that disentangling the various components in the optical andthe infrared is difficult and the results are often extremely model dependent and severalalternative solutions may be equally consistent with the available multi-wavelengthdata.
2 Relativistic plasma
“All things are double, one against another” Ecclesiasticus (xlvii. 24)“The problem is how much to stress the sameness of twins and how much to emphasisetheir differences.”, Baby and Child Care, Benjamin Spock, 1946
Shortly after the discovery of extragalactic radio sources, their non-thermal spectraand polarisations led to the conclusion that their emission is produced by synchrotronradiation from a relativistic plasma. The large radio luminosities together with thelifetimes of the synchrotron-emitting electrons imply total energies of ≥ 1060 erg (e.g.Miley 1980). These huge energies, the collimation on sub-parsec scales and the simi-
123

Distant radio galaxies and their environments 75
larity of orientation between the compact and overall radio structures led to the con-clusion that the collimated relativistic beams are produced by rotating supermassiveblack holes (SMBHs) located at the centres of the host galaxies. The SMBHs arepostulated to have rotation axes aligned with the radio source axes. The radio sourcesare powered through gravitational energy from material accreting onto the SMBHs,that is converted into kinetic energy of the collimated relativistic jets (see Sect. 5.2).
2.1 HzRGS and low-redshift radio galaxies
Extragalactic radio sources can be classified according to their sizes.
• Most radio sources detected in low-frequency radio surveys (ν ∼< 2 GHz) are“extended”, with projected linear sizes ranging from several tens of kiloparsecto several megaparsecs, i.e. much larger than those of their optical galaxy hosts.Extended extragalactic radio sources have non-thermal spectra, with typical spec-tral indices at low redshifts of α ∼ −0.7, with flux proportional to να . An exampleis Cygnus A in Fig. 3.
• Most radio sources detected in high-frequency radio surveys are “compact”, withtypical sizes of < 1 pc and relatively flat spectral indices (α > −0.4).
• A small fraction of sources have linear sizes between ∼ 100 pc and a few kpc.These sources have peaked spectra that are self absorbed at low frequencies (< afew GHz) and are variously known as “peakers”, gigahertz-peaked spectrum (GPS)sources or compact steep-spectrum (CSS) sources.
Galaxies and quasars host extragalactic radio sources of all three classes, withextended radio sources predominantly identified with galaxies and compact sourcesmainly associated with quasars.
HzRGs generally host extended extragalactic radio sources and differ in severalproperties from low-redshift radio galaxies. At larger redshifts the typical radio lumi-nosities increase, the typical sizes decrease (Sect. 2.3) and the typical radio spectrasteepen (Sect. 2.4). The host galaxies of HzRGs differ from the low-redshift radiogalaxy hosts in (i) the presence of emission-line halos (Sect. 3.2, (ii) increased clum-piness of the continuum emission (Sect. 4.3) and (iii) alignments of the radio sourceswith both the emission-line halos (Sect. 3.2.3) and the UV/optical galaxy continuumemission (Sect. 4.3) (Fig. 2).
2.2 Radio sizes and morphologies: size as an evolutionary clock
The radio structures of HzRGs have been studied by Carilli et al. (1997) andPentericci et al. (2000b). Both articles describe observations of 37 radio galaxieswith z > 2 using the VLA at 4.7 and 8.2 GHz, at resolutions down to 0.25′′. In accor-dance with their large radio luminosities, most HzRGs are “Fanaroff–Riley ClassII” radio sources (Fanaroff and Riley 1974), with double structures, edge-brightenedmophologies and one or more hot-spots located at the extremities of their lobes(Miley 1980; Carilli et al. 1994, 1997; Pentericci et al. 2000b). In general HzRGsdo not have appreciable flat-spectrum core components at their nuclei, but the use of
123
76 G. Miley, C. De Breuck
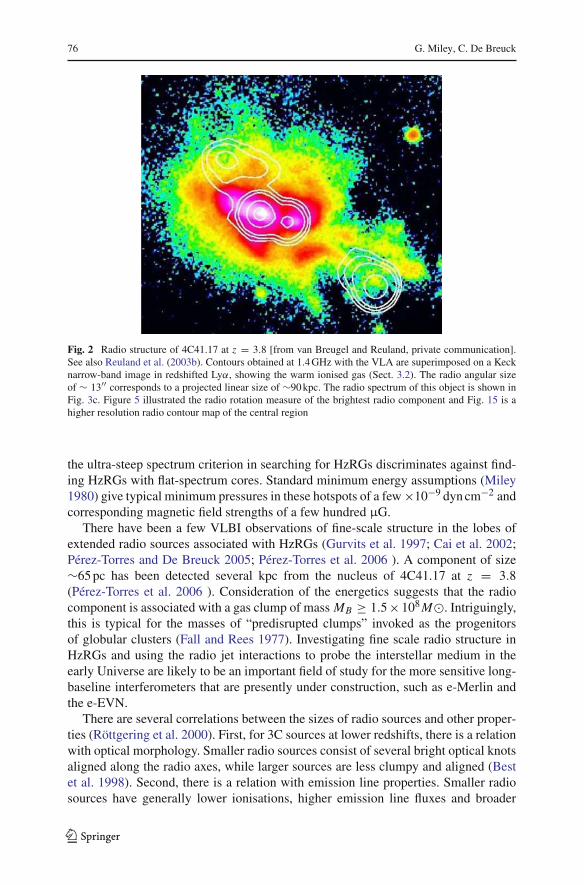
Fig. 2 Radio structure of 4C41.17 at z = 3.8 [from van Breugel and Reuland, private communication].See also Reuland et al. (2003b). Contours obtained at 1.4 GHz with the VLA are superimposed on a Kecknarrow-band image in redshifted Lyα, showing the warm ionised gas (Sect. 3.2). The radio angular sizeof ∼ 13′′ corresponds to a projected linear size of ∼90 kpc. The radio spectrum of this object is shown inFig. 3c. Figure 5 illustrated the radio rotation measure of the brightest radio component and Fig. 15 is ahigher resolution radio contour map of the central region
the ultra-steep spectrum criterion in searching for HzRGs discriminates against find-ing HzRGs with flat-spectrum cores. Standard minimum energy assumptions (Miley1980) give typical minimum pressures in these hotspots of a few ×10−9 dyn cm−2 andcorresponding magnetic field strengths of a few hundred µG.
There have been a few VLBI observations of fine-scale structure in the lobes ofextended radio sources associated with HzRGs (Gurvits et al. 1997; Cai et al. 2002;Pérez-Torres and De Breuck 2005; Pérez-Torres et al. 2006 ). A component of size∼65 pc has been detected several kpc from the nucleus of 4C41.17 at z = 3.8(Pérez-Torres et al. 2006 ). Consideration of the energetics suggests that the radiocomponent is associated with a gas clump of mass MB ≥ 1.5 × 10⁸ M. Intriguingly,this is typical for the masses of “predisrupted clumps” invoked as the progenitorsof globular clusters (Fall and Rees 1977). Investigating fine scale radio structure inHzRGs and using the radio jet interactions to probe the interstellar medium in theearly Universe are likely to be an important field of study for the more sensitive long-baseline interferometers that are presently under construction, such as e-Merlin andthe e-EVN.
There are several correlations between the sizes of radio sources and other proper-ties (Röttgering et al. 2000). First, for 3C sources at lower redshifts, there is a relationwith optical morphology. Smaller radio sources consist of several bright optical knotsaligned along the radio axes, while larger sources are less clumpy and aligned (Bestet al. 1998). Second, there is a relation with emission line properties. Smaller radiosources have generally lower ionisations, higher emission line fluxes and broader
123

Distant radio galaxies and their environments 77
line widths than larger sources (Best et al. 1999). Third, there is a connection withLyα absorption. HzRGs with smaller radio sizes are more likely to have Lyα absorp-tion than larger sources (Sect. 3.3.2) (van Ojik et al. 1997a). Taken together, thesecorrelations are consistent with an evolutionary scenario in which radio size can beused as a “clock” that measures the time elapsed since the start of the radio activity.
Note that the large sizes of radio sources (usually several tens of kpc) imply that thenucleus of host galaxies has been undergoing activity for at least > 105 years (lighttravel time across the source) and up to > 108 years (assuming that the jets advance at afew hundred km/s). Hence we know that AGN associated with extended radio sourcesmust be long-lived. This is not the case for radio-quiet or compact radio quasars, thatmay only have been active quasars for a few ×102 years.
2.3 Radio size vs redshift correlation
It has been known since the nineteen sixties that there is a statistical decrease of theangular size of radio sources with redshift (Miley 1968). More recent work includesmeasurement of the angular size-redshift relation for luminous extended radio sources(Nilsson et al. 1993; Neeser et al. 1995; Daly and Guerra 2002), quasars (Buchalteret al. 1998) and compact radio sources (Gurvits et al. 1999).
Over the years there have been many valiant attempts to use the angular-redshiftrelation to derive information about the geometry of the Universe (e.g. determinationof q0 and Ω0) and even to set constraints on dark energy (Podariu et al. 2003). However,there are many observational selection effects involved. Furthermore, it is difficult todisentangle varying geometry of the Universe from effects due to physical evolutionof the radio sources, their host galaxies and the surrounding ambient medium. Forexample, the sizes of radio sources can be expected to decrease at larger redshifts dueto a systematic increase in density of the ambient medium. Also the energy densityof the cosmic microwave background increases as (1 + z)4, substantially enhancinginverse Compton losses. This will tend to extinguish radio sources earlier in their lives,making them on average smaller.
In summary, the many non-cosmological effects that influence the angular size-redshift relation have made it impossible to draw robust conclusions about cosmologyfrom such considerations.
2.4 Radio spectral index vs redshift correlation
One of the most intriguing properties of the relativistic plasma in HzRGs is the strongcorrelation that exists between the steepness of radio source spectra and the redshiftof the associated radio galaxies (Tielens et al. 1979; Blumenthal and Miley 1979).Radio sources with very steep spectral indices at low frequencies ∼< 1 GHz tend tobe associated with galaxies at high redshift (e.g. Fig. 3). This empirical correlationbetween radio spectral steepness and redshift has proved to be an efficient methodfor finding distant radio galaxies. Most known HzRGs (Table 3) have been discov-ered through following up those radio sources with the steepest ten percentile of radiospectra (spectral index, α ∼ −1).
123

78 G. Miley, C. De Breuck
Fig. 3 Left Plot of radio spectral index versus redshift, showing that more distant sources have steeperspectra [from De Breuck et al. (2000b)]. Above right Radio spectrum of the luminous radio galaxy CygnusA at z = 0.05, showing spectral curvature. Bottom right Radio spectrum of the HzRG 4C41.17 and itsvarious components [from Chambers et al. (1990)]. This is still one of the most well determined spectra ofa HzRG at low frequencies. Note the absence of significant spectral curvature
The conventional explanation for the z ∼ α correlation is that it is the result of aconcave radio spectrum (see Cygnus A in Fig. 3), coupled with a radio K-correction.For higher redshifts, observations of sources at a fixed observed frequency willsample emission at higher rest-frame frequencies where the concave spectrum becomessteeper. The most important mechanisms for making the radio spectra concave are syn-chrotron and inverse Compton losses at high frequencies (e.g. Klamer et al. 2006) andsynchrotron self-absorption at low frequencies.
Although there is evidence from radio colour–colour plots that systematic concavecurvature is present in the radio spectra (e.g. Bornancini et al. 2007), such an explana-tion alone is insufficient to explain the observed correlation. The radio spectra of manydistant luminous radio galaxies are not concave at the relevant frequencies. The radiosource with the most accurately determined spectrum over a wide frequency range is4C 41.17 at z = 3.8 (bottom right in Fig. 3). This source has an extremely straightspectrum between 40 MHz and 5 GHz, the relevant frequency range for the z ∼ α
correlation (Chambers et al. 1990). Although the spectrum steepens above 5 GHz, thisis too high a frequency to contribute to the z ∼ α correlation. Furthermore, a recent
123

Distant radio galaxies and their environments 79
study by Klamer et al. (2006) showed that 33 of 37 sources in their SUMSS-NVSSsample have straight and not concave spectra between 0.8 and 18 GHz.
Two alternative effects have been proposed to explain the observed z ∼ α rela-tion. The first possibility is that the z ∼ α relation is an indirect manifestation of aluminosity, L ∼ α effect (Chambers et al. 1990; Blundell and Rawlings 1999).
Classical synchrotron theory predicts that continuous particle injection will result ina spectrum with a low-frequency cut-off, νl , whose frequency depends on the sourceluminosity, L according to νl ∼ L−6/7. For a flux-limited sample, Malmquist biaswill cause sources at higher redshift to have preferentially larger radio luminosities.Over the relevant frequency range, the L−6/7 vs νl effect would therefore result inthe observation of an z ∼ α relation. However, it is unlikely that this luminosity–spectrum relation is the correct explanation, or at least the whole story. Athreya andKapahi (1998a) showed that a z ∼ α correlation still persists even when samples arerestricted to a limited range of L .
A second explanation is that some physical effect causes the spectral index tosteepen with higher ambient density and that the ambient density increases with red-shift (Athreya and Kapahi 1998a; Klamer et al. 2006). For example, putting the radiosource in a denser environment would cause the upstream fluid velocity of the rela-tivistic particles to decrease and a first-order Fermi acceleration process would thenproduce a steeper synchrotron spectrum. Recently Klamer et al. (2006) pointed outthat such a mechanism would (i) result in both z ∼ α and L ∼ α correlations and(ii) provide a natural physical link between high-redshift radio galaxies and nearbycluster halos.
However, it is difficult to produce the observed z ∼ α relation from such a simpledensity-dependent effect alone. The clumpy UV/optical morphologies (e.g. Sect. 6.1)indicate that the density of gas around HzRGs is highly non-uniform and that the den-sity is larger close to the nucleus than in the outer regions. Furthermore, the internalspatial variations of spectral index within individual source is observed to be smallerthan the source to source variations of the integrated spectral indices (e.g. Carilli et al.1994). If the ambient medium is highly non-uniform, how can one side of a radiosource “know” that the other side has an uncommon ultra-steep spectrum? It is there-fore likelier that the ultra-steep spectra are produced by some mechanism in which thespectral index is determined within the galaxy nucleus rather than by the environmentat the locations of the radio lobes.
In summary, the origin of the z ∼ α effect is still unclear and more detailed infor-mation is needed about the dependence of the radio spectrum on redshift. In the nearfuture accurate measurements of low-frequency radio spectra of HzRGs with newfacilities such as LOFAR will be important for such studies.
2.5 Non-thermal X-ray emission
Although X-ray measurements of HzRGs are sensitivity-limited, significant progressin the field has been made in the last decade using the Chandra and XMM X-ray tele-scopes. Extended X-ray emission has been detected from about a dozen high-redshiftradio galaxies and radio-loud quasars (Carilli et al. 2002b; Fabian et al. 2003a,b;
123
80 G. Miley, C. De Breuck
Scharf et al. 2003; Yuan et al. 2003; Belsole et al. 2004; Overzier et al. 2005; Blundellet al. 2006; Erlund et al. 2006; Johnson et al. 2007). The extended X-ray emission istypically elongated in the direction of the radio source, indicating that there is somephysical link between the X-ray emission and the relativistic plasma.
Several mechanisms have been proposed for producing the extended X-ray emis-sion. The one that is most widely suggested inverse Compton scattering (IC) of thecosmic microwave background (Fabian et al. 2003a; Scharf et al. 2003; Belsole et al.2004; Erlund et al. 2006; Johnson et al. 2007). Because the density of CMB pho-tons increase as (1 + z)4, IC scattering of the CMB becomes increasingly importantat high redshift. Under the assumption that the X-ray emission is due to this pro-cess, comparison of the radio and X-ray luminosities (Felten and Rees 1969) yieldsmagnetic field strengths consistent with equipartition (Belsole et al. 2004; Overzieret al. 2005; Johnson et al. 2007). Because the radiative lifetimes of radio synchrotron-emitting electrons are shorter than the lifetimes of the X-ray emitting IC electrons,the IC emission traces older particles. In 4C 23.56 at z = 2.48, the X-ray emissionis observed to extend by ∼500 kpc (Johnson et al. 2007), implying an energy in bothrelativistic and IC-emitting electrons of ≥1059 erg, an energy reservoir equivalentto ∼108 supernovae.
Other processes that have been invoked to produce the extended X-ray emissioninclude inverse-Compton up-scattering of synchrotron photons in the jet (synchrotronself-Compton emission—SSC) (Scharf et al. 2003) and thermal emission from shocks(Carilli et al. 2002b; Belsole et al. 2004) (see Sect. 3.1).
3 Gas and dust
“Sometimes you can’t stick your head in the engine, so you have to examine theexhaust” Donald E. Osterbrock
Gas and dust, in various states, are important constituents of HzRGs and must playa fundamental role in their evolution. Gas has been observed over a wide range oftemperatures and having a variety of forms.
3.1 Hot ionised gas—radio depolarisation
X-ray observations show that hot ionised gas is widespread at the centres of clustersand around radio galaxies at low redshifts. Typical derived parameters are temperaturesof ∼ 107.5 K, densities of 0.05 cm−2, and masses of a few ×1012 cm−3, with pressuresof ∼10−9 dyne cm−2. Such a gas would be sufficient to confine both the radio-emittingplasma and the Lyα halos (see Sect. 3.2) of HzRGs. For low and intermediate redshiftclusters, bubble-like structures in X-rays have been attributed to energy injection intosuch a hot intracluster medium by radio jets (e.g. McNamara et al. 2000).
The sensitivity of the present generation of X-ray telescopes is only marginally suf-ficient for detecting similar hot gas at z ∼ 2. X-ray emission has been observed fromthe Spiderweb Galaxy at z = 2.2 (Fig. 4) (Carilli et al. 2002b). The X-ray emission is
123

Distant radio galaxies and their environments 81
Fig. 4 X-ray emission from the Spiderweb Galaxy, PKS 1138-262 at z = 2.2, observed with the ChandraX-ray Telescope [from Carilli et al. (2002b)]. X-ray contours are superimposed on a VLA gray scale repre-sentation of the 5 GHz radio continuum emission at 0.5′′ in resolution. The cross marks the position of theradio galaxy nucleus. Note that the X-ray and radio emission are aligned with each other. See also Fig. 16.
extended along the radio source axis and attributed to thermal emission produced byshocks as the synchrotron-emitting relativistic jet that propagates outwards.
An alternative technique for detecting and studying this hot gas is through its effecton the polarisation of background radio emission (e.g. Miley 1980). As it propa-gates through a magnetoionic medium the polarisation of linearly polarised radiationis rotated through an angle χ that is proportional to the square of the wavelength,λ (cm).
∆χ = 5.73 × 10⁻³ RMλ2, where R is the observed rotation measure, given byRM is RM = 812
∫nt (s)B‖(s)ds ∼ 8.1 × 10⁸nt B‖s(rad m−2).
Here s (kpc) is the path length through the medium, nt (cm−3) is the density ofthermal electrons and B‖ is the component of magnetic field along the line of sight.The intrinsic rotation measure is RM = RMobs × (1 + z)2.
Observations of radio polarisation data for > 40 HzRGs (Carilli et al. 1994, 1997;Athreya et al. 1998b; Pentericci et al. 2000b; Broderick et al. 2007) revealed that severalsources have extremely large rotation measures (RMs), up to more than 1,000 rad m−2
in the rest frame (Carilli et al. 1997; Athreya et al. 1998b) (e.g. Fig. 5), with consid-erable variation across the sources. An obvious interpretation of the large observedrotation measures is that HzRGs are embedded in dense gas. At low-redshifts the larg-est rotation measures are observed for radio sources that are located in X-ray emittingclusters that are inferred to be “cooling flows” (Ge and Owen 1994). Hence the largerotation measures of HzRGs are strong circumstantial evidence that these objects arealso located in cluster environments at high redshifts (Sect. 7).
Assuming that (i) the rotation is produced over a line-of-sight path length that iscomparable with the projected dimensions of the radio sources and (ii) the magneticfield strength is close to the equipartition values, the derived electron densities are∼0.05 cm−3, comparable to those obtained for low-redshift clusters from the X-rays.
123

82 G. Miley, C. De Breuck
Fig. 5 The observed polarisation position angle as a function of the square of the wavelength2 for a radioknot of 4C41.17 at z = 3.8 [from Carilli et al. (1994)]. The knot is the brightest of the 4 radio knots shownin Fig. 2. Note the excellent fit to a λ2 dependance and the large resultant rotation measure for the knot
3.2 Warm ionised gas
The bright emission lines emitted by luminous radio galaxies allow their redshifts tobe determined and have been an important reason why radio galaxies have been suchimportant cosmological probes. The emission lines are emitted by warm (104.5 K) gasand provide a powerful tool for studying physical conditions within the HzRGs.
Emission lines observed from active galactic nuclei are both “permitted” recom-bination lines and collisionally excited “forbidden” lines. When a free electron iscaptured by an atomic nucleus it cascades to the ground state emitting a series ofrecombination lines. The most prominent recombination lines are due to the mostcommon elements, hydrogen and helium. However, some of the strongest lines inthe spectra of emission nebulae correspond to so-called “forbidden” transitions thathave miniscule probability of occurring relative to the permitted transitions, but whoseenergies lie within a few kT of the ground levels and can therefore be easily populatedby collisions. Each element has a critical density below which most de-excitations areradiative and a line is produced. Forbidden lines are only produced by gas with densi-ties in the range ∼10–105cm−3 and the line ratios contain important information aboutthe density, temperature, ionisation and abundances of the emitting gas (Osterbrockand Ferland 2006; Peterson 1997).
A composite emission-line spectrum for HzRGs, and a list of emission line strengthswere given by McCarthy (1993). During the early nineties it was found that, forhigh-redshift radio galaxies, nuclear emission lines are generally accompanied by anadditional component that is highly extended spatially. The presence of giant lumi-nous ionised gas nebulae are amongst the most remarkable features of HzRGs (e.g.Reuland et al. 2003a). These “halos” have sizes of up to ∼200 kpc (e.g. Fig. 16) andtheir study provides a wealth of information about kinematics and physical conditionswithin and surrounding the HzRGs and on the origin of the gas.
123

Distant radio galaxies and their environments 83
Fig. 6 Velocities and velocity dispersions across MRC 2104-242 at z = 2.5 measured with VIMOS on theVLT [from Villar-Martín (2007)]. This HzRG is surrounded by a giant Lya nebula that extends by ∼120 kpcThe position of the radio core is indicated with a cross. The velocity field appears symmetric and orderedimplying either rotation or radial motions. See also van Ojik et al. (1996)
During the last 15 years considerable progress has been made in studying the prop-erties of Lyα halos, using large ground-based optical/IR telescopes. Observations oftheir emission line spectra have been extended into the infrared (optical rest-frame),where additional useful physical diagnostics can be obtained. Also, the kinematics ofseveral HzRGs have been mapped in detail. An excellent recent review of the emis-sion-line properties of HzRGs has been given by Villar-Martín (2007). For detailedinformation the reader is referred to that review and the references therein.
The ionised gas halos have Lyα luminosities of typically ∼1043.5 erg s−1 and linewidths varying from a few hundred km/s in their outer parts to >1000 km s−1, nearthe galaxy nuclei. The usual emission-line diagnostics (Osterbrock and Ferland 2006)show that the gas has temperatures of Te∼104–105 K, densities of ne∼100.5–101.5 cm−3
and masses of ∼109–1010 M. The warm gas occupies a relatively small fraction ofthe total volume of the HzRGs, with filling factors estimated to be ∼10−5 comparedwith unity for the hot gas. Although the topology of the gas is not well determined,the properties of the emission lines and the covering factor deduced from statistics ofabsorption lines (Sect. 3.3.2) clouds led to a model (van Ojik et al. 1997a) in whichthe halos are composed of ∼1012 clouds, each having a size of about 40 light days,i.e. comparable with that of the solar system. van Ojik et al. (1997a) speculate that theclouds might be associated with the early formation stages of individual stars.
The morphologies of the Lyα halos are clumpy and irregular. Their overall structuresare often aligned with the radio axes and sometimes extend beyond the extremities ofthe radio source. There appear to be two distinct regimes in the halos that often blendtogether. The inner regions close to the radio jets are clumpy, with velocity spreadsof >1, 000 km s−1. They appear to have been perturbed by the jets. The outer regionsare more quiescent, with velocity ranges of a few hundred km s−1). They appear to bemore relaxed than the inner regions (e.g. Fig. 7).
123

84 G. Miley, C. De Breuck
HST − VLA
−2 0 2
Offset ["]
10
5
0
−5
−10
Off
set [
"]
−2 0 2
N
E
Lyα
1210 1220
λrest [Å]
NV
1240 1250
λrest [Å]
CIV
1545 1560
λrest [Å]
HeII
1635 1650
λrest [Å]
Ap. 5
Ap. 4
Ap. 3
Ap. 2
Ap. 1
Fig. 7 Long slit spectroscopy of the ionised gas halo in MRC 0943-242 at z = 2.9 [from Villar-Martín(2007); Humphrey et al. (2006)]. VLA radio map overlaid with the WFPC2 HST image (left), spatiallyaligned with the 2-dimensional Keck spectra of the main UV rest frame emission lines. The impact ofjet–gas interactions on the observed properties of the giant nebula (size ∼70 kpc) can be seen in the muchbroader and brighter emission lines within the radio structures compared with the faint emission detectedbeyond
The relative intensities of emission lines are, in principle, powerful diagnostic toolsfor studying physical conditions in the warm line-emitting gas. However, disentan-gling the effects of ionisation, abundances, density and temperature using the emissionline ratios is complicated and requires detailed modelling, incorporating all facets ofthe HzRGs. We shall now discuss the physical conditions within the warm gas halosin more detail.
3.2.1 Ionisation
Various mechanisms have been proposed for exciting the gas. These include (i) photoi-onisation from an AGN, (ii) photoionisation from stars, (iii) photoionisation by ion-izing X-rays emitted by shocked hot gas and (iv) collisional ionisation from shocks.Plots of optical-line ratios have been used extensively to study the ionisation of gasin nearby active galaxies, where evidence for both jet- and accretion-powered shocksand for photoionisation by the central AGN has been found (e.g. Villar-Martín andBinette 1997; Villar-Martín et al. 1997; Bicknell et al. 2000; Groves et al. 2004a,b).
Although these relationships have been most accurately calibrated in the rest-frameoptical region of the spectrum, line diagnostic diagrams have also been developed foruse in the ultraviolet (Allen et al. 1998; Groves et al. 2004b), the spectral region ofHzRGs sampled by optical observations. Interpretation of emission line ratios arecomplicated by effects of dust and viewing angles (Villar-Martín and Binette 1996).
123

Distant radio galaxies and their environments 85
Also most HzRG spectra are spatially integrated over regions of 10 or more kiloparsec,where conditions and sources of excitation may change. In a recent comprehensivestudy using as many as 35 emission lines throughout the rest-frame UV and opticalspectra Humphrey et al. (2006) concluded that photoionisation is the dominant sourceof excitation in the quiescent gas. A harder source of photoionisation than stars isneeded, consistent with photons from an AGN.
If a quasar is exciting the warm gas in the halo, why do we not see it? The usualexplanation is that the quasar emits radiation anisotropically. It is highly absorbed inthe direction in which we view it, but not along the radio axis. Support for this idea isprovided by the large optical polarisations measured for some HzRGs. (Sect. 3.5.2).However, if highly anisotropic flux from a hidden quasar is indeed the dominant sourceof excitation, it is difficult to understand why many of the Lyα halos are approximatelysymmetric in shape. An alternative explanation is that the quasar activity is isotropicand highly variable, with short sharp periods of intense activity and longer periods ofrelative passivity, when the quasar is dormant (see Sect. 5.1).
Although photoionisation by a quasar is presently the “best bet” for the dominantsource of excitation, it is not likely to be the only culprit. Considerable variation isobserved in the relative emission line strengths from object to object and within indi-vidual HzRGs. There is strong evidence that there is also collisional excitation fromshocks, particularly close to the radio jets—(see e.g. Bicknell et al. 2000; Best et al.2000; Sect. 4.3).
3.2.2 Abundances and star formation
Although Lyα is by far the brightest emission line emitted by the warm gas halos,other lines are also detected. In 4C41.17 at z = 3.8, kinematical structures in the Lyα
line are closely followed in the carbon CIV and oxygen [OII] and [OIII] lines, withthe [OIII] λ5007 emission extending by as much as 60 kpc from the nucleus (Reulandet al. 2007). See also Fig. 7.
The chemical abundance of the halo gas is close to solar (Vernet et al. 2001b;Humphrey et al. 2006), consistent with the HzRG having undergone prodigious starformation at earlier epochs. Further indications that the star formation rate in HzRGswas higher in the past come from measurements of the Ly α luminosities and Lyα/HeIIratios that are both systematically larger for HzRGs with z > 3, than for those with2 < z < 3 (Villar-Martín et al. 2007a,b).
The relative intensity of the NV λ1240Å line varies from being an order of mag-nitude fainter than the carbon and helium lines (De Breuck et al. 2000a) to being asluminous as Lyα (e.g. van Ojik et al. 1994). This has been interpreted as indicatingthat there are large variations in metallicity between HzRGs.
3.2.3 Inner kinematics: outflows, jet interactions and superwinds
In considering the kinematics of the ionised gas halos, we shall separately considerthe nuclear turbulent regions, where there is evidence for outflows and the outer pas-sive regions where the most likely dominant systematic motions are inwards. Theinner regions show shocked gas closely associated with the radio lobes. These dis-
123

86 G. Miley, C. De Breuck
play disturbed kinematics and have expansion velocities and/or velocity dispersions>1,000 km s−1.
Besides synchrotron jets there is evidence that starburst “superwinds” (Armus et al.1990; Zirm et al. 2005) are also present in the inner regions of the Lyα halos. Boththe jets and the superwinds will exert sufficient pressure on the warm gas to drive itoutwards. Interactions between radio jets and the ambient gas is important in somelow-redshift radio galaxies (e.g. Heckman et al. 1982, 1984; van Breugel et al. 1984,1985a,b). The radio sources are observed to excite, disturb and entrain the gas. Like-wise, the gas can bend and decollimate radio jets and enhance the intensity of their radioemission through shock-driven particle acceleration. In general small radio sourcesshow more jet-gas interactions than large ones (Best et al. 2000). At z > 2, HzRGexhibit signatures of even more vigorous jet-gas interactions (e.g. Villar-Martín et al.1998, 1999a,b, 2003; Humphrey et al. 2006). The kinematics is more turbulent and theionisation is higher in the region of the jet than in the quiescent outer halo (Humphreyet al. 2006).
Nesvadba et al. (2006) recently carried out an important study of the SpiderwebGalaxy with an integral field spectrograph in the optical rest frame. They make aconvincing case that there is an accelerated outflow of warm gas in this object. Theonly plausible source of energy for powering this outflow (few ×1060 erg) is the radiojet and, even then, the coupling between the jet and the ISM must be very efficientto account for the observed kinematics. The pressure in the radio jets can drive gasoutwards from the nuclei for tens of kiloparsecs and play an important role, togetherwith starburst-driven superwinds, in “polluting” the intergalactic medium with metals.There is spectroscopic evidence for the ejection of enriched material in 4C 41.17 atz = 3.8 up to a distance of 60 kpc along the radio axis (Reuland et al. 2007). See alsoFig. 7.
In Sect. 4.3 we shall discuss strong evidence that the jet-gas interactions can alsotrigger star formation in HzRGs (Fig. 6).
3.2.4 Outer kinematics: infall of the quiescent halos
An important diagnostic in tracing the origin of the warm gas is the kinematics in theouter region of the giant halos, where they are apparently unperturbed by the radio jet.The outer halos displays systematic velocity variations of a few hundred km/s (e.g.see Fig. 7). Are these systematic velocity variations the result of rotation (van Ojiket al. 1996; Villar-Martín et al. 2003, 2006b), outflows (Zirm et al. 2005; Nesvadbaet al. 2006) or infalling motions?
It is difficult to discriminate between the various kinematic scenarios from veloc-ity data alone, but comparison of spectroscopic and radio data provides additionalrelevant information. In a study of 11 HzRGs with redshifts 2.3 < z < 3.6, severalcorrelated asymmetries were found between the halo kinematics and assymetries inthe radio structures (Humphrey et al. 2007; Villar-Martín et al. 2007b). On the sideof the brightest radio jet and hot spot, the quiescent nebula appears systematicallyredshifted (receding) compared with the other side. On the assumption that the brightradio jet and hot spot are moving towards us and brightened by Doppler boosting (Rees
123

Distant radio galaxies and their environments 87
1967; Kellermann 2003), the quiescent gas must be moving inwards. The brightestradio hotspot is also the least depolarised one, as expected if it is on the closest sideof the HzRG and consistent with the infall scenario.
Could the inflowing motion of the gas be a result of cooling flows, that have longbeen studied in clusters of galaxies at low redshifts (e.g. Fabian 1994; Kaufmannet al. 2006)? Recent XMM and Chandra observations have shown that the coolingrates are reduced by an order of magnitude below the simple cooling flow models attemperatures < ×107 K, probably through interaction of the gas with radio sourcesassociated with galaxies in the cluster. An alternative diagnostic of cooling flows thatare more feasible for HzRGs than X-rays is the measurement of roto-vibrational linesfrom H2 molecules at ∼2,000 K (Jaffe and Bremer 1997; Jaffe et al. 2005). At highredshifts these lines are shifted from the near to mid-IR bands, accessible with theSpitzer Telescope. The H2 lines are a promising tool for studying both the cooling inthe gas around HzRGs and the excitation mechanisms.
To summarise, the kinematics of the warm gas is complex. There is evidence thatgas in the outer regions of the halo is flowing inwards, providing a source of materialfor feeding the active nucleus (Sect. 5) and that gas in the inner region is being drivenoutwards by pressure from jets and starbursts. The various motions in the ionised gashalos are likely to contribute to feedback processes between the AGNs and the galaxiesinvoked in current models of massive galaxy evolution (Sect. 6).
We end our discussion of the halo kinematics on a cautionary note. Most kinematicstudies of HzRGs until now have been based on Lyα, because of its relatively largeequivalent width and its accessibility with optical telescopes. However, Lyα is a reso-nant line and subject to strong scattering and optical depth effects. Hence, the resultantkinematics may not be completely representative of the gas as a whole, particularly inthe inner regions.
3.2.5 Relation to non-radio Lyα nebulae
There may well be a connection between Lyα halos in HzRGs and the disembodiedextended Lyα nebulae that have been discovered in recent years (e.g. Fynbo et al. 1999;Steidel et al. 2000; Francis et al. 2001; Matsuda et al. 2004; Dey et al. 2005; Colbertet al. 2006; Nilsson et al. 2006). These nebulae also have physical extents ∼> 100 kpc
and Lyα line fluxes of ∼10−15 ergs s−1 cm−2. Although in many respects, these Lyα
blobs resemble the giant ionised gas halos around HzRGs, they have < 1% of theassociated radio continuum flux and no obvious source of UV photons bright enoughto excite the nebular emission. However, millimetre emission has been detected fromseveral of these nebulae (Chapman et al. 2001; Smail et al. 2003; Geach et al. 2005)and Matsuda et al. (2004) suggest that the extended Lyα nebulae are also associatedwith dense environments in the early Universe. Just like the HzRG halos, these nebulaecan be excited by quasars that are heavily obscured along the line of sight (Haimanand Rees 2001; Weidinger et al. 2004, 2005), or quasars that undergo recurrant flares(Sect. 5.1). Alternatively, they may be associated with cooling-flow-like phenomena(Haiman et al. 2000; Dijkstra et al. 2006a,b).
123
88 G. Miley, C. De Breuck
3.2.6 Nebular continuum
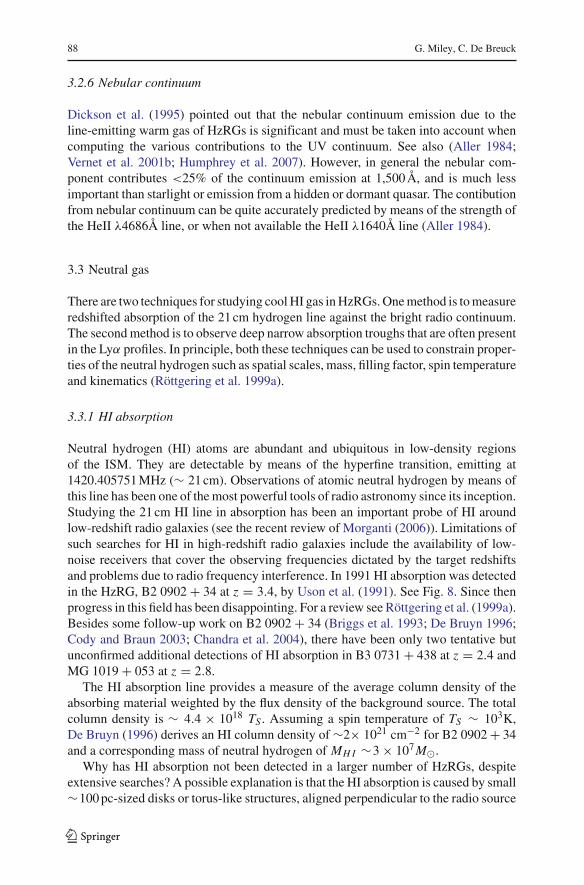
Dickson et al. (1995) pointed out that the nebular continuum emission due to theline-emitting warm gas of HzRGs is significant and must be taken into account whencomputing the various contributions to the UV continuum. See also (Aller 1984;Vernet et al. 2001b; Humphrey et al. 2007). However, in general the nebular com-ponent contributes <25% of the continuum emission at 1,500 Å, and is much lessimportant than starlight or emission from a hidden or dormant quasar. The contibutionfrom nebular continuum can be quite accurately predicted by means of the strength ofthe HeII λ4686Å line, or when not available the HeII λ1640Å line (Aller 1984).
3.3 Neutral gas
There are two techniques for studying cool HI gas in HzRGs. One method is to measureredshifted absorption of the 21 cm hydrogen line against the bright radio continuum.The second method is to observe deep narrow absorption troughs that are often presentin the Lyα profiles. In principle, both these techniques can be used to constrain proper-ties of the neutral hydrogen such as spatial scales, mass, filling factor, spin temperatureand kinematics (Röttgering et al. 1999a).
3.3.1 HI absorption
Neutral hydrogen (HI) atoms are abundant and ubiquitous in low-density regionsof the ISM. They are detectable by means of the hyperfine transition, emitting at1420.405751 MHz (∼ 21 cm). Observations of atomic neutral hydrogen by means ofthis line has been one of the most powerful tools of radio astronomy since its inception.Studying the 21 cm HI line in absorption has been an important probe of HI aroundlow-redshift radio galaxies (see the recent review of Morganti (2006)). Limitations ofsuch searches for HI in high-redshift radio galaxies include the availability of low-noise receivers that cover the observing frequencies dictated by the target redshiftsand problems due to radio frequency interference. In 1991 HI absorption was detectedin the HzRG, B2 0902 + 34 at z = 3.4, by Uson et al. (1991). See Fig. 8. Since thenprogress in this field has been disappointing. For a review see Röttgering et al. (1999a).Besides some follow-up work on B2 0902 + 34 (Briggs et al. 1993; De Bruyn 1996;Cody and Braun 2003; Chandra et al. 2004), there have been only two tentative butunconfirmed additional detections of HI absorption in B3 0731 + 438 at z = 2.4 andMG 1019 + 053 at z = 2.8.
The HI absorption line provides a measure of the average column density of theabsorbing material weighted by the flux density of the background source. The totalcolumn density is ∼ 4.4 × 10¹⁸ TS . Assuming a spin temperature of TS ∼ 103K,De Bruyn (1996) derives an HI column density of ∼2× 1021 cm−2 for B2 0902 + 34and a corresponding mass of neutral hydrogen of MH I ∼3 × 10⁷ M.
Why has HI absorption not been detected in a larger number of HzRGs, despiteextensive searches? A possible explanation is that the HI absorption is caused by small∼100 pc-sized disks or torus-like structures, aligned perpendicular to the radio source
123

Distant radio galaxies and their environments 89
Fig. 8 Absorbing neutral hydrogen. Top The redshifted HI absorption profile of 0902 + 34 at z = 2.4[from Cody and Braun (2003)]. Bottom The redshifted Lyα absorption profile of 0943 242 at z = 2.9, witha model overlaid [from Jarvis et al. (2003)]
(Röttgering et al. 1999a). The radio emission of 0902 + 34 is more centrally concen-trated than that for most HzRGs, consistent with the hypothesis that the absorption isproduced by such a small disk. For the more extended radio sources associated withmost HzRGs, the disk covering fraction would be very small and the disk would notproduce significant absorption.
3.3.2 Lyα absorption
More than a decade ago van Ojik et al. (1997a) discovered that strong absorptionfeatures are common in the Lyα profiles of HzRGs. Such features were present in themajority of the 18 HzRGs that they studied with sufficient spectral resolution. Derivedcolumn densities were in the range 1018 − 1019.5 cm−2.
123

90 G. Miley, C. De Breuck
The absorption, usually interpreted as being due to HI surrounding the HzRG,provides an interesting diagnostic tool for studying and spatially resolving neutralgas surrounding HzRGs. Because the spatial extension of the absorbing region canbe constrained, the Lyα absorption lines provide information about properties of theabsorbing gas (e.g. dynamics and morphologies) that cannot be studied using quasarabsorption lines. Since in most cases the Lyα emission is absorbed over the entire spa-tial extent (up to 50 kpc), the absorbers must have a covering fraction close to unity.From the column densities and spatial scales of the absorbing clouds, the derivedmasses of neutral hydrogen are typically ∼108 M.
Additional information about the properties of the HI absorbers was obtained byWilman et al. (2004). In a study of 7 HzRGs with 2.5 < z < 4.1, they identified twodistinct groups of HI absorbers: strong absorbers with column densities of NHI ∼ 1018
to 1020 cm−2 and weaker systems with NH I ∼ 1013 to 1015 cm−2. They suggestthat the strong absorbers may be due to material cooling behind the expanding bowshock of the radio jet and that the weak absorbers form part of the multiphase proto-intracluster medium responsible for the Lyα forest. Furhermore, Krause (2005) carriedout hydrodynamic simulations of a HzRG jet inside a galactic wind shell and showedthat strong HI absorption could be produced.
Absorption is occasionally observed in the profiles of other emission lines thanLyα, such as CIV—(Röttgering et al. 1995). Jarvis et al. (2003) studied the profiles oftwo of the most prominent absorbing HzRGs MRC 0943 − 242 at z = 2.9 and TXS0200 + 015 at z = 2.2 with high spectral resolution. The data are consistent with apicture in which the absorbing gas has low density and low metallicity and is distrib-uted in a smooth absorbing shell located beyond the emission-line gas. However, themetallicity, inferred from the C IV absorption, is considerably lower in 0943 − 242than in the slightly larger source TXS 0200 + 015. This difference in metallicity isexplained as due to chemical enrichment via a starburst-driven superwind (Sect. 3.2.3).Further observations and modelling of the spectrum of MRC 0943 − 242 by Binetteet al. (2000) indicate that in this object the absorbing gas may actually be ionised—seealso (Binette et al. 2006). However, MRC 0943 − 242 may be a special case. It has arelatively small radio size and one of the deepest Lyα absorption trough of all knownabsorbers.
3.4 Molecular gas
Star formation is generally observed to occur in molecular clouds—cold dark conden-sations of molecular gas and dust, that are observable in the millimetre and near-IR.In these clouds atomic hydrogen associates into molecular hydrogen, H2, a speciesthat unfortunately does not emit easily observable spectral lines. The next most abun-dant molecule is carbon monoxide. Because the rotational transitions of the dipo-lar molecule 12CO are caused primarily by collisions with H2, CO is an excellenttracer of molecular hydrogen. The most important redshifted CO transitions for thestudy of high-redshift objects are J = (1–0), (2–1), (3–2), (4–3) and (5–4) at 115.2712,230.5380, 345.7960, 461.0407 and 576.2677 GHz, respectively. These lines are animportant diagnostic for probing the reservoir of cold gas available for star formation.
123

Distant radio galaxies and their environments 91
Intensive searches for CO emission from HzRGs during the early 1990s were unsuc-cessful (Evans et al. 1996; van Ojik et al. 1997b). Since then, the sensitivity of (sub)mil-limetre receivers has been improved and the high-redshift Universe has been openedto molecular line studies (see reviews by Solomon and vanden Bout (2005) and Omont(2007)). Table 2 is a list of HzRGs detected in CO.
To convert the CO to H2 mass, one often assumes a standard conversion factor.For high-redshift CO studies, this factor is calibrated based on observations of nearbyultra-luminous infrared galaxies (ULIRGS) (Downes et al. 1993). With the assump-tion that this value is also applicable to high-redshift objects, one can use the strengthof the (1–0) CO transition to derive the mass of the molecular gas. Because currentcentimetre telescopes do not allow observations of the (1–0) transition at z < 3.6, oneneeds to observe higher order transitions shifted to the atmospheric windows at 3, 2and 1.3 mm.
The inferred masses of H2 in the CO-detected galaxies are between 1010 and1011 M, indicating that there is a large mass of molecular gas in these objects anda substantial reservoir of material available for future star formation. However, thecalculated masses should be treated with caution, because their derivation is based ona large number of assumptions (e.g. Downes et al. 1993). Observations of higher COtransitions are biased to the detection of denser gas than ground-state observations andcan result in an underestimate of the total molecular gas mass.
Observations of multiple rotational transitions allow the temperature and density ofthe molecular gas to be constrained using large velocity gradient models. The resultsindicate that the CO properties are heterogeneous. TN J0924-2201 is only detected inthe ground-state (1–0) transition, but 4C 41.17 is only detected in CO(4–3), despitesensitive searches for the (1–0) transition (Ivison et al. 1996; Papadopoulos et al. 2005).This high excitation level in 4C41.17 implies large gas densities n(H2) > 1, 000 cm−3,consistent with gas fueling a nuclear starburst.
Table 2 HzRGs detected in CO
Name z Transition VCO SCOV M(H2) Referencesb
(km s−1) (Jy km s−1) (1010 M)
53W002 2.390 (3–2) 420 1.2±0.2 1.2 1, 2
B3 J2330+3927 3.086 (4–3) 500 1.3±0.3 7 3
TN J0121+1320 3.517 (4–3) 700 1.2±0.4 3 4
6C 1909+72 3.537 (4–3) 530 1.6±0.3 4.5 5
4C 60.06 3.791 (1–0) … 0.15±0.03a 13 6
(4–3) >1000 2.5±0.4 8 5
4C 41.17 3.792 (1–0) … <0.1 … 7
(4–3) 1000 1.8±0.2 5.4 8
TN J0924-2201 5.197 (1–0) 300 0.09±0.02 ∼10 9
(5–4) 250 1.2±0.3 9
a Only broad component; narrow component has SCOV =0.09±0.01 Jy km s−1
b References: 1 = Scoville et al. (1997), 2 = Alloin et al. (2000), 3 = De Breuck et al. (2003a),4 = De Breuck et al. (2003b), 5 = Papadopoulos et al. (2000), 6 = Greve et al. (2004), 7 = Papado-poulos et al. (2005), 8 = De Breuck et al. (2005), 9 = Klamer et al. (2005)
123

92 G. Miley, C. De Breuck
Fig. 9 CO in 4C41.17 at z = 3.8 with the Plateau de Bure interferometer [from De Breuck et al. (2005)].Shown is the velocity plotted against position offset of CO(4–3), extracted along a PA of 51(see radiomorphology in Fig. 2).The central frequency at 96.093 GHz (z = 3.79786) is based on the wavelength ofthe optical HeIIλ1640 Å emission line. The position–velocity diagram shows the two components of theCO emission. One of these is coincident with the radio core, while a fainter component is spatially offsetfrom it towards the southwestern lobe A
In a few cases the CO appears spatially resolved (Papadopoulos et al. 2000;Greve et al. 2004; De Breuck et al. 2005), extending over 10–20 kpc (e.g. see Fig. 9),providing kinematic information about the molecular gas. Klamer et al. (2004) haveclaimed that there are alignments between the molecular gas and radio morphologiesin some of the detected CO HzRGs, as might be expected from jet-induced star forma-tion (Sect. 4.3). However, higher resolution, larger signal to noise and more statisticsare needed before any conclusions about possible alignments can be drawn.
Offsets between the velocities of the molecular gas (CO) and those of the warm gas(e.g. HeIIλ1640) of up to 500 km/s have been measured (De Breuck et al. 2003a,b,2005). Because the H2 masses exceed those of the warm ionised gas Lyα halos by anorder of magnitude, the CO lines provide a better measure of the systemic redshift ofthe HzRGs than the UV and optical emission lines.
The CO detections listed in Table 2 are not representative of the distribution of COin HzRGs. There are several observational biases inherent in current CO studies:
• Many searches for CO at high redshifts pre-select targets on the basis of prior dustdetections, i.e continuum millimetre flux (see Sect. 3.5.1). However, 850µm con-tinuum emission was not detected for two of the CO-emitting HzRGs-53W002 atz = 2.390 (Scoville et al. 1997; Alloin et al. 2000) and TN J0924-2201 at z = 5.2(Klamer et al. 2004). This indicates that the gas/dust ratios in high-redshift CO sam-ples could be be systematically underestimated due to bias in favour of dusty targets.
123
Distant radio galaxies and their environments 93
• Positive detections are more likely to be published than non-detections. Further-more, the derived limits are often dubious in view of relatively large uncertaintiesin the targeted redshifts. These uncertainties are due to large offsets that are oftenpresent between the CO and optical redshifts, the unknown widths of the COemission lines, and the limited bandwidth of correlators used for the detections.
• For higher redshift objects progressively higher CO transitions need to be observedconsistent with the atmospheric transmission bands acessible to millimetre arrays.Hence, measurements of CO in will tend to trace denser gas in HzRGs than at lowerredshifts. However for z > 3.6, the ground-state transition becomes observablewith centimetre facilities, such as the VLA and ATCA, resulting in a discontinu-ity in the studies of multiple CO transitions needed to constrain the densities andtemperatures of the gas.
To investigate the statistics of CO in HzRGs and the evolution of molecular gas, itis important to carry out deep CO observations on well defined samples of HzRGs inmultiple CO transitions, and without a pre-selection on their cold dust properties. Thefaintness of the CO lines and the uncertainties in their redshifts means that compre-hensive searches for CO presently require large amounts of observing time. Limitingfactors are the sensitivities of current facilities and the relatively limited instantaneousbandwidth covered by the receiver back-ends.
Opportunities for observing molecular gas in HzRGs will be revolutionised duringthe next decade by ALMA and the EVLA. These facilities will provide an enormousimprovement in sensitivity and discovery space throughout the sub-millimetre, milli-metre and centimetre wavebands. Furthermore, their resolution will allow the spatialdistribution of the molecular gas in HzRGs to be studied. On a shorter timescale, themuch wider tuning range and broad-band correlators that are presently coming on-line(e.g. at the EVLA and the ATCA) will provide new opportunities for investigating COin high-redshift objects, particularly the ground state transition.
The increased sensitivity of ALMA will also open the study of fainter molecularand atomic lines in HzRGs. Lines such as HCN or HCO+ probe at least an order ofmagnitude denser molecular gas than CO, and are therefore better tracers of the densemolecular cores in star-forming regions (Papadopoulos 2007).
3.5 Dust
Dust is an important constituent of HzRGs and an additional diagnostic of star forma-tion. It is both a major constituent of the molecular clouds from which stars generallyform and an indicator that substantial star formation has already occurred. The pres-ence of dust means that chemically enriched material is present. Thermal re-radiationfrom dust often dominates the spectral energy distribution of HzRGs at millimetreand sub-millimetre wavelengths (Fig. 1) and dust is observable as a polarizing andabsorbing medium in the optical and ultraviolet.
3.5.1 Millimetre and sub-millimetre emission
Since the detection of 4C41.17 at z = 3.8 (Dunlop et al. 1994; Chini and Kruegel 1994;Ivison 1995) a large number of HzRGs have been observed at millimetre wavelengths
123

94 G. Miley, C. De Breuck
(Archibald et al. 2001; Reuland et al. 2004). Reuland et al. (2004) analysed a sampleof 69 radio galaxies with 1 < z < 5, detected at 850 and/or 450 µm. Isothermal fitsto the submillimetre spectra give dust masses of a few ×108 M at temperatures of∼50K (Archibald et al. 2001).
Possible sources of heating for the dust are X-rays from an AGN (Sect. 5) and UVphotons from young stars. The typical submillimetre luminosity (and hence dust mass)of HzRGs strongly increases with redshift, with a (1 + z)3 dependence out to z ∼ 4.This is evidence that star formation rates were higher and/or the quasars brighter inHzRGs with z > 3.
Disentangling whether the dust is heated by an AGN or young stars is difficult,because the two processes produce dust at partially overlapping temperatures. Evi-dence for heating by young stars comes from the slope of the Rayleigh–Jeans part ofthe thermal dust emission—observed at millimetre and submillimetre wavelengths.This indicates that the dust temperatures are relatively cool, ∼ 50 K, consistent withstarburst-heated emission (e.g. Archibald et al. 2001; Stevens et al. 2003; Reulandet al. 2004). However, there is also evidence for a warmer(∼ 300 K dust) componentin radio galaxies, consistent with AGN heating (Rocca-Volmerange and Remazeilles2005). Furthermore, recent Spitzer observations at 5 < λobs < 70 µm showed that theWien tail part of the dust SED is inconsistent with low dust temperatures. Dust withtemperatures of ∼300 K or higher is required, consistent with AGN heating. Althoughthe submillimetre luminosity of the HzRGs is uncorrelated with radio luminosity, sug-gesting no strong dependence on the strength of the quasar/AGN emission. (Reulandet al. 2004), the rest-frame 5 µm luminosity does appear to be correlated with radioluminosity (Seymour et al. 2007).
It is likely that young stars and AGN both play a role in heating the dust. Clarifi-cation of their relative importance await accurate measurement of the SED near thepeak of the thermal dust emission by the Herschel Telescope and high spatial reso-lution observations of the radial profiles of the thermal dust emission with ALMA.Once properly isolated, starburst-heated dust emission will be a powerful tool formeasuring the star-formation rates in radio galaxies. On the assumption that mostof the submillimetre emission is heated by stars, derived star formation rates are upto a few thousand M yr−1, consistent with those obtained from UV absorption linemeasurements (Sect. 4.2).
3.5.2 UV continuum polarisation
The rest-frame UV polarisation is an important probe of dust in the inner regionsof HzRGs (di Serego Alighieri et al. 1989; di Serego Alighieri 1997; Cimatti et al.1993; Cimatti et al. 1998; Vernet et al. 2001b). The fractional polarisation providesa unique tool for determining the contribution and nature of of scattered light, whilethe polarisation angle allows the location of the scattering medium to be pinpointed.However, polarisation measurements of HzRGs require both high sensitivity and highprecision.
Eight of 10 HzRGs studied by Vernet et al. (2001b), show high continuum polarisa-tion just redward of Lyα, with fractions, fp ranging from 6 to 20% (e.g. Fig. 10). Theshape of the polarised flux (= percentage polarisation × total intensity) is very similar
123

Distant radio galaxies and their environments 95
0.0
0.5
1.0
1.5
1017
× F λ
TXS0211−122
1200 1400 1600 1800 2000 2200 2400 2600
Rest wavelength [Å]
0.0
0.1
0.2
0.3
1017
× F λ
0
5
10
15
20
25
30
35
P [%
]
4000 5000 6000 7000 8000
Observed wavelength [Å]
0
50
100
150
θ
Fig. 10 Spectral and polarisation properties of TXS 0211-122 at z = 2.3 taken from observations withthe Keck Telescope [from Vernet et al. (2001b)]. Plotted from top to bottom are: the observed total fluxspectrum in units of 10−17 erg s−1 cm−2 Å−1 at two different scales, the first to show strong emission linesand the second to show the continuum. Shaded areas indicate regions of bright sky emission
to that of an unobscured quasar (Type 1 AGN) in both the slope of the continuum andthe presence of broad emission lines (Vernet et al. 2001b). This is strong evidencefor the presence of an obscured quasar in the nuclei of HzRGs. The spectral energydistribution of a typical quasar is bluer than most other components that contributeto the SED of HzRGs between the UV and near-IR. The dilution by the other com-ponents is smaller in the rest-frame UV. At z > 2, this waveband is redshifted intothe optical, where the most sensitive (spectro-)polarimeters exist on large telescopes,allowing detailed studies despite the cosmological brightness dimming.
The polarisation angle is in most cases closely perpendicular to the radio struc-ture, indicating that the scattering occurs within the cones traced out by the radio jets(Vernet et al. 2001b). The spatially resolved narrow emission lines (see Sect. 3.2) are
123

96 G. Miley, C. De Breuck
generally not polarised (e.g. Fig. 10), indicating that the scattering medium must belocated between the broad and narrow line regions.
The wavelength dependence of the polarised emission is consistent with both greydust or electron scattering. However, electron scattering can be excluded as it is muchless efficient and would imply masses of the scattering medium which are close to thetotal galaxy mass (Manzini and di Serego Alighieri 1996). A clumpy scattering dustmedium can also produce the observed continuum slope. Using spectropolarimetricobservations near the rest frame 2200 Å dust feature, Solórzano-Iñarrea et al. (2004)argue that the composition of the dust is similar to that of Galactic dust.
Cimatti et al. (1993) presented a dust-scattering model that explains the struc-ture, the polarisation properties and the spectral energy distribution of the ultravioletaligned light with optically thin Mie scattering of quasar radiation emitted in a coneof ∼90 opening angle. The required amount of spherically distributed dust is (1–3)×108 M, consistent with the estimate for the dust mass from the sub-millimetre data(Sect. 3.5.1). However, more recent predictions (Vernet et al. 2001b) indicate thatthe dust responsible for scattering the AGN emission should have a sub-millimetreemission that is an order of magnitude fainter than observed.
Not all HzRGs have significant polarisation. Two of eight objects studied by Vernetet al. (2001b) had fractional polarisation f p < 2.4%. There is no evidence that thenuclei of these HzRGs contain obscured quasars (Sect. 5.1). We discuss informationderived from the UV polarisation observations about the obscured or dormant quasarin Sect. 5.1.
4 STARS
Captain Boyle: "I ofen looked up at the sky an’ assed meself the question–what is thestars, what is the stars?"Joxer Daly: "Ah, that’s the question, that’s the question–what is the stars?"
Act 1 "Juno and the Paycock", Seán O’Casey, Irish playright (1924)
During the last 15 years there has been mounting evidence that stars are a majorconstituent of HzRGs. Stellar signatures include (i) a plateau in the spectral energydistribution (SED) between 1 and 2µm characteristic of stars—the “1.6µm bump”(Simpson and Eisenhardt 1999; Seymour et al. 2007) (Fig. 1), (ii) the detectionof rest-frame UV stellar absorption lines in a few HzRGs (Dey et al. 1997) and(iii) measurement with the HST that the morphologies of several HzRGs follow deVaucouleurs profiles. (e.g. van Breugel et al. 1998; Pentericci et al. 2001; Zirm et al.2005) (Fig. 11).
In principle, spectral energy distributions (SEDs) are a powerful diagnostic of stel-lar populations and galaxy evolution. Young (<0.5 Gyr) stars dominate the SED in theUV, whereas the SED longward of 4,000 Å gives information about populations olderthan ∼1 Gyr. However, disentangling the stellar contribution to the SEDs from thenon-stellar components is complicated (see Fig. 1). At rest-frame UV wavelengths,contributions from scattered quasar light and nebular continuum must be taken intoaccount, whereas re-radiation by dust contributes to the SED at far infrared and mil-limetre wavebands (e.g Fig. 1).
123

Distant radio galaxies and their environments 97
Fig. 11 The IR SED of 4C40.36 at z = 2.265, with modelling, using data taken with IRAC and MIPSon the Spitzer Telescope [from Seymour et al. (2007)]. The solid dark line indicates the total best-fit SED.The stellar and dust components are indicated by dashed and dotted lines, respectively. Note the plateau,corresponding to the stellar “∼1.6µm bump” feature (Simpson and Eisenhardt 1999)
4.1 Old stars: HzRGs as the most massive galaxies
The SEDs of old (> 1 Gyr) stellar populations peak in the near-IR. The galaxies withthe largest K-band luminosities in the early Universe are HzRGs. Because old stars arethe best tracers of stellar mass, the brightness of the observed K -band emission haslong been used to argue that distant radio galaxies are very massive, with masses of upto 1012 M (Rocca-Volmerange et al. 2004). This places them on the upper end of thestellar mass function over the entire redshift range 0 < z < 4 (e.g. Rocca-Volmerangeet al. 2004).
A major tool in HzRG research is the Hubble K –z diagram, introduced by Lilly andLongair (1984). Despite significant spectral correction effects (K-corrections), radiogalaxies form a remarkably narrow sequence out to z ∼ 3, especially when com-pared with near-IR selected field galaxies (e.g. De Breuck et al. 2002) (Fig. 12, 13).The small scatter in the K –z relation for HzRGs was found to be weakly correlatedwith radio luminosity (e.g. Best et al. 1998). Such a correlation can be understoodif the radio power is dominated by the Eddington limiting luminosity of the nuclearsupermassive black hole (Rawlings and Saunders 1991) (Sect. 5.2) and thus a measureof the black hole mass. The well-established relation between black hole and bulgemass (e.g. Magorrian et al. 1998) then implies that radio power would be correlatedwith host galaxy mass, as appears to be the case for low-redshift less-luminous radiogalaxies (Best et al. 2005).
Caution should be exercised in determining the K-band continuum magnitudes forHzRGs and in interpreting the details of the K –z diagram in terms of galaxy masses.There are several reasons for this. First, it is often difficult to disentangle the stellarcomponent from the warm dust component of the K-band flux. Second, depending on
123
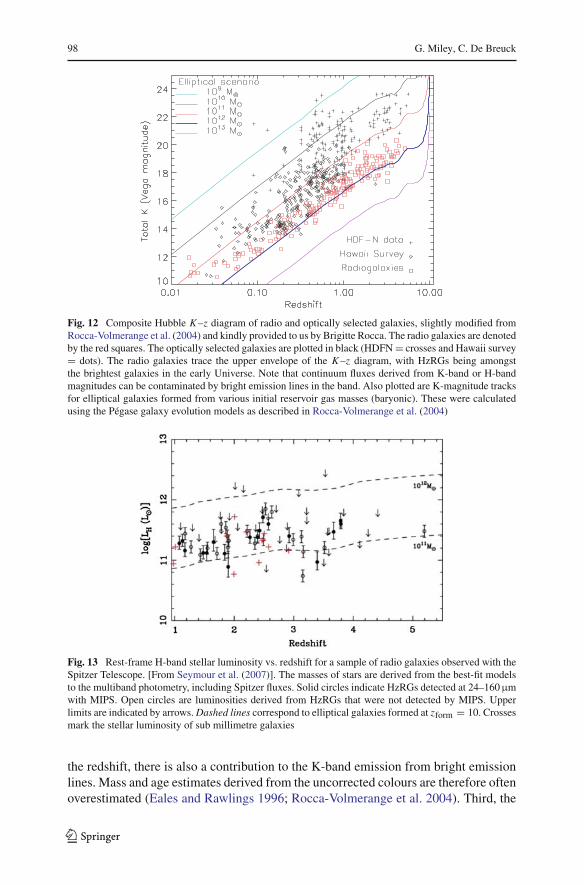
98 G. Miley, C. De Breuck
Fig. 12 Composite Hubble K –z diagram of radio and optically selected galaxies, slightly modified fromRocca-Volmerange et al. (2004) and kindly provided to us by Brigitte Rocca. The radio galaxies are denotedby the red squares. The optically selected galaxies are plotted in black (HDFN = crosses and Hawaii survey= dots). The radio galaxies trace the upper envelope of the K –z diagram, with HzRGs being amongstthe brightest galaxies in the early Universe. Note that continuum fluxes derived from K-band or H-bandmagnitudes can be contaminated by bright emission lines in the band. Also plotted are K-magnitude tracksfor elliptical galaxies formed from various initial reservoir gas masses (baryonic). These were calculatedusing the Pégase galaxy evolution models as described in Rocca-Volmerange et al. (2004)
Fig. 13 Rest-frame H-band stellar luminosity vs. redshift for a sample of radio galaxies observed with theSpitzer Telescope. [From Seymour et al. (2007)]. The masses of stars are derived from the best-fit modelsto the multiband photometry, including Spitzer fluxes. Solid circles indicate HzRGs detected at 24–160µmwith MIPS. Open circles are luminosities derived from HzRGs that were not detected by MIPS. Upperlimits are indicated by arrows. Dashed lines correspond to elliptical galaxies formed at zform = 10. Crossesmark the stellar luminosity of sub millimetre galaxies
the redshift, there is also a contribution to the K-band emission from bright emissionlines. Mass and age estimates derived from the uncorrected colours are therefore oftenoverestimated (Eales and Rawlings 1996; Rocca-Volmerange et al. 2004). Third, the
123

Distant radio galaxies and their environments 99
stellar population models on which the masses are based are subject to considerableuncertainty. For example, incorporation of recent data on thermally pulsating asymp-totic giant branch stars reduce the derived masses by large factors (Bruzual 2007). Inaddition the Initial Mass Function and the gas to dust content at early epochs is highlyuncertain.
Because of its ability to measure the rest-frame near-IR fluxes of HzRGs radio gal-axies, the Spitzer Telescope, has facilitated considerable progress in this field duringthe last few years. Seymour et al. (2007) surveyed 69 radio galaxies having 1 < z < 5.2at 3.6, 4.5, 5.8, 8.0, 16 and 24µm. They decomposed the rest-frame optical to infraredspectral energy distributions into stellar, AGN, and dust components and determinedthe contribution of host galaxy stellar emission at rest-frame H-band. By consistentlyderiving the stellar luminosity at the same rest-frame wavelength near the peak ofthe stellar emission at λrest ∼ 1.6 µm, effects of measuring the K –z diagram withgalaxies over a large range of redshift through fixed observing bands were eliminatedand contamination of the fluxes by AGN and emission lines was minimised.
The Spitzer results confirm that radio galaxies have stellar masses mostly within the1011 to 1012 M range, with almost no dependence on redshift. The fraction of emittedlight at rest-frame H-band from stars was found to be > 0.6 for ∼75% of the HzRGs.The weak correlation of stellar mass with radio power determined using ground-baseddata is only marginally significant in the Spitzer results. Rest-frame near-IR studiesof less luminous radio sources are needed to extend the range in radio luminosity andsettle whether there is indeed a dependence of stellar mass on radio luminosity.
4.2 Young stars—UV absorption lines
HzRGs undergo vigorous star formation. The most direct evidence for this is the detec-tion of rest-frame UV photospheric stellar absorption lines and P-Cygni features drivenby stellar winds. Because observation of these lines requires several hour exposures on10 m-class telescopes, their detection is limited to the S V λ1502 line in 4C 41.17 (Deyet al. 1997), tentative measurement of C III λ1428 in TN J2007–1316 (De Breuck andReuland 2005) and VLT spectroscopy of the Spiderweb Galaxy (Miley et al. 2006;Nesvadba et al. 2006; Hatch et al. 2007). The presence of absorption lines is directevidence for prodigious star formation in 4C41.17 (up to 1,500 M yr−1, after correc-tion for extinction) (Dey et al. 1997; Reuland et al. 2004). For radio galaxies whoserest-frame UV continuum is polarised, scattered AGN continuum emission (Vernetet al. 2001a), make it difficult to measure the star formation rates directly (Fig. 14).
Additional evidence that substantial star formation is occurring in HzRGs is pro-vided by the sub-millimetre observations of dust, for whose heating star formationrates of thousands M per year are needed (but see Sect. 3.5) and the systematicallylarger Ly α luminosities and Lyα/HeII ratios for HzRGs with z > 3, than for thosewith 2 < z < 3 (Villar-Martín et al. 2007a,b) (Sect. 3.2.2).
4.3 The alignment effect—jet-induced star formation
One of the most remarkable properties of HzRG is the approximate alignment betweentheir radio and optical continuum emissions. This phenomenon was completely unex-
123

100 G. Miley, C. De Breuck
Fig. 14 Spectrum of the central 2 × 1 of the HzRG 4C 41.17 at z = 3.8 [from Dey et al. (1997)]. Thisis compared with the UV spectrum of the B1 star-forming knot in the nearby Wolf-Rayet starburst galaxyNGC 1741 (Conti et al. 1996). The ordinate is labeled with the flux density scales for 4C 41.17 and NGC1741B1 on the left and right axes respectively. The two spectra show many similarities in their absorptionline properties
pected when it was discovered two decades ago (Chambers et al. 1987; McCarthyet al. 1987). The “alignment effect” sets in for redshifts z ≥ 0.7. Several modelshave been proposed or considered to account for this alignments (e.g. McCarthy1993). The two most promising models are (i) dust scattering of light from a hid-den quasar at the nucleus of the HzRG (Tadhunter et al. 1998) and (ii) triggeringof star formation by the synchrotron jet as it propagates outward from the nucleus(De Young 1989; Rees 1989; Begelman and Cioffi 1989; Bicknell et al. 2000). Wehave already seen that radio jets frequently interact vigorously with the warm gas inHzRGs.
Since the extensive review by McCarthy (1993), high resolution imaging with theHST has provided important new information on the morphologies of HzRGs and onthe alignment effect (Pentericci et al. 1999; Bicknell et al. 2000; Pentericci et al. 2001).Images with the HST have revealed that HzRG hosts generally have clumpy opticalmorphologies (Pentericci et al. 1998, 1999).
Using HST observations of a sample of 20 HzRGs combined with similar resolu-tion VLA radio maps, Pentericci et al. (1999, 2001) have for the first time examinedthe close relationship between the radio and rest-frame UV and optical morpholo-gies. They find that the alignment effect extends into the rest-frame optical, with thez > 2.5 radio galaxies displaying a much more clumpy structure than their low-redshift counterparts, which are well represented by de Vaucouleurs profiles. At aslightly lower resolution, near-IR imaging with the Keck Telescope (van Breugel et al.1998) also suggest that the morphology changes from aligned clumpy structures atz > 3 to relaxed de Vaucouleurs profiles at z < 3. However, the redshift-dependanceof luminosity and the change in the observing wavelength with redshift complicatesthe interpretation of these results. We note that the IR structures of B2/6C galaxies at
123
Distant radio galaxies and their environments 101
z ∼ 1 appear less aligned with their radio structures than are the brighter 3C galaxiesat this redshift, implying that the strength of the alignment effect depends on radioluminosity (Eales et al. 1997).
It is now clear that no single mechanism can completely account for all the observedproperties of the aligned emission. The occurrence of optical polarisation in HzRGsin some but not all HzRGs is evidence that dust scattering plays a role. However,scattering cannot explain the observed detailed optical morphologies and similar bend-ing behaviour that has been observed between the optical and radio structures. Neithercan dust scattering account for the alignment of the continuum emission redwards ofthe rest frame 4000 A break. The alignment effect is most likely due to a combinationof star formation induced by the jet and scattering of hidden quasar light along theradio source.
The most comprehensive study of jet-induced star formation has been made for4C41.17 at z = 3.8 by Bicknell et al. (2000). The interaction of a high-powered(∼ 1046 erg s−1) jet with a dense cloud in the halo of 4C 41.17 is shown to produceshock-excited emission lines and induce star formation. Such shock-initiated star for-mation could proceed on a timescale of a few ×106 yr), i.e well within the estimatedlifetime of the radio source (few ×107 yr) (Fig. 15).
Studies of several low-redshift radio galaxies provide further evidence that jet-induced star formation occurs. These include NGC 541/Minkowski’s Object (3C40)(van Breugel et al. 1985a; Croft et al. 2006), 3C 285 (van Breugel and Dey 1993) andthe closest radio galaxy Centaurus A (Graham 1998). Such effects can be expected tobe much more prevalent during the era of the Universe at z > 2, when every galaxymay well have undergone nuclear activity.
If the red aligned emission is indeed produced by stars, their ages would be > 1 Gyr,implying that this mode of star formation has operated almost since the formation ofthe host galaxies. It would also require that the radio jet was active and aligned inapproximately the same position angle for this length of time. van Breugel et al.(1998) suggested that the tendency of HzRGs to be clumpier at z > 3 is due to theincreased importance of jet-induced star formation at earlier epochs. We know littleabout how the first population of stars in galaxies were made. Although unconven-tional, it is tempting to speculate that jet-induced star formation played a significantrole in producing stars during the first 3 Gyr after the Big Bang. Gopal-Krishna et al.(2004) have suggested that a large fraction of all proto-galactic material within thecosmic web was impacted by the expanding lobes of radio galaxies during the quasarera, triggering star formation.
5 Active galactic nucleus (AGN)
“Power exercised in secret, especially under the cloak of national security, is doublydangerous” US Senator, W. Proxmire
Because the luminous collimated radio emission must have been generated in theircores, the nuclei of all HzRGs must have been active at some time in their histories.
123
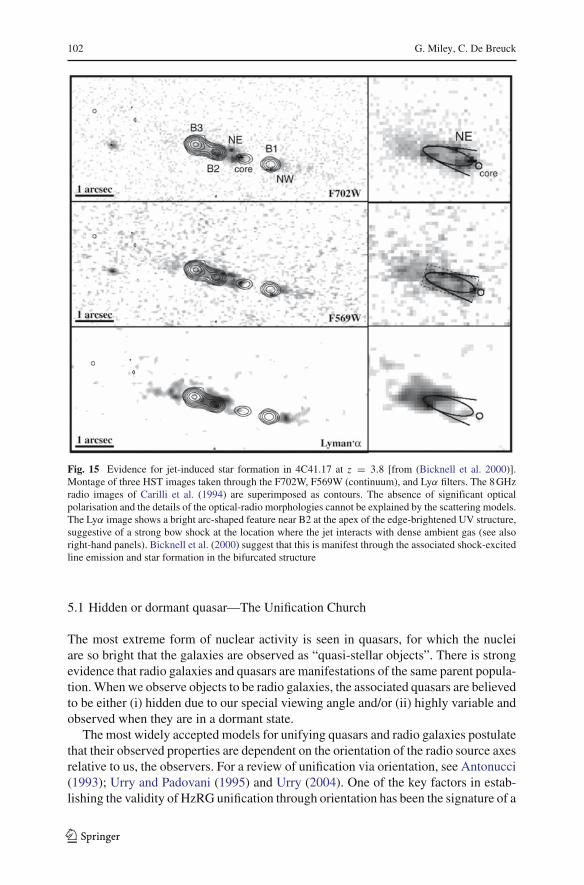
102 G. Miley, C. De Breuck
Fig. 15 Evidence for jet-induced star formation in 4C41.17 at z = 3.8 [from (Bicknell et al. 2000)].Montage of three HST images taken through the F702W, F569W (continuum), and Lyα filters. The 8 GHzradio images of Carilli et al. (1994) are superimposed as contours. The absence of significant opticalpolarisation and the details of the optical-radio morphologies cannot be explained by the scattering models.The Lyα image shows a bright arc-shaped feature near B2 at the apex of the edge-brightened UV structure,suggestive of a strong bow shock at the location where the jet interacts with dense ambient gas (see alsoright-hand panels). Bicknell et al. (2000) suggest that this is manifest through the associated shock-excitedline emission and star formation in the bifurcated structure
5.1 Hidden or dormant quasar—The Unification Church
The most extreme form of nuclear activity is seen in quasars, for which the nucleiare so bright that the galaxies are observed as “quasi-stellar objects”. There is strongevidence that radio galaxies and quasars are manifestations of the same parent popula-tion. When we observe objects to be radio galaxies, the associated quasars are believedto be either (i) hidden due to our special viewing angle and/or (ii) highly variable andobserved when they are in a dormant state.
The most widely accepted models for unifying quasars and radio galaxies postulatethat their observed properties are dependent on the orientation of the radio source axesrelative to us, the observers. For a review of unification via orientation, see Antonucci(1993); Urry and Padovani (1995) and Urry (2004). One of the key factors in estab-lishing the validity of HzRG unification through orientation has been the signature of a
123

Distant radio galaxies and their environments 103
hidden quasar detected in some radio galaxies in polarised light. Polarimetry with theKeck Telescope (Vernet et al. 2001b) (See Sect. 3.5.2) show that HzRGs are usually,but not always, highly polarised just redward of Lyα and that dust-reflected quasarlight appears generally to dominate their rest-frame ultraviolet continua. Furthermore,broad emission lines, with equivalent widths similar to those seen in quasars, aredetected in the two most polarised HzRGs in the Vernet et al. (2001b) sample of nineobjects.
There is a convincing case that an obscured quasar exists in those HzRGs for whichhigh fractional polarisations and broad polarised recombination lines have been mea-sured. What about HzRGs with low polarisation? For these objects, it is possiblethat active quasars are present that are even more highly obscured than the polarisedHzRGs. However an equally plausible explanation is that the quasars are dormant dur-ing the epoch of observation (van Groningen et al. 1980). We know that quasars arehighly variable, varying by as much as 2 magnitudes during a day. Quasar variabilityhas been studied on timescales of up to 50 years (de Vries et al. 2006). The variabilityappears to be intrinsic to the AGNs, and occurs in flares of varying timescales, possiblydue to accretion-disk instabilities.
During the lifetime of an extended radio sources (at least a few ×107 years), qua-sar activity can be expected to vary considerably. Knots in the radio morphologiescan be interpreted as tracing bursts of quasar activity in the radio nuclei (Miley 1980).According to such a dormant quasar model, if the flare duration is substantially shorterthan the quiescent periods the objects would be more likely to be observed as radiogalaxies than radio-loud quasars. Also if the flares recurred on a timescale shorterthan the recombination time (∼104–105 year), the excitation of the gas would persist.A recurrently flaring quasar could also be a source of excitation for some of the non-radio Lyα halos (Sect. 3.2.5).
In summary, there is strong evidence that quasars exist in the nucleus of all HzRGs.Although orientation and varying intrinsic activity both probably contribute to theobserved properties, their relative importance is still unclear.
5.2 Supermassive black hole—powerhouse of the AGN
Extragalactic radio sources, and all active galactic nuclei, are believed to be poweredby gravitational energy produced by rotating supermassive black holes (SMBHs) intheir nuclei (e.g. Lynden-Bell 1969). Material in the galaxies is accreted onto theSMBHs, converted into kinetic energy and ejected as collimated relativistic jets alongthe rotation axes of the SMBHs to produce the radio sources. For a theoretical reviewof this field, see Blandford (2001). Although there is a wide agreement about thegeneral idea, many of the details are not well understood.
Observational evidence for the widespread occurrence of SMBHs in galactic nucleiincludes (i) spectroscopy of the gigamaser in the nucleus of NGC 4258 (Miyoshi et al.1995) (ii) spectroscopy and photometry of galactic nuclei with the HST leading to thecorrelation between the masses of galaxy bulges and SMBHs in early type galaxies(e.g. Magorrian et al. 1998; Kormendy and Gebhardt 2001; Häring and Rix 2004;Novak et al. 2006), (iii) the small collimation scale of radio sources, measured with
123

104 G. Miley, C. De Breuck
VLBI (1017 cm; Junor et al. 1999) and (iv) the similarity of the large-scale and small-scale orientations of some giant radio sources, indicating that the “memory” of colli-mation axis can persist for as long as ∼ 108 year (Fomalont and Miley 1975; Schilizziet al. 1979; Miley 1980).
Because of the interaction of the radio jet with the gas, line widths in the centralregions of HzRGs cannot be used to derive the masses of the presumed SMBHs intheir nuclei, as for radio-quiet galaxies. The empirical correlation of SMBH with thebulges of early type galaxies (Häring and Rix 2004) would predict black hole massesof ∼ 109 M at the centre of a 1012 M HzRG. McLure and Jarvis (2002) derivedsimilar masses for SMBHs in radio-loud quasars from the width of their emission lines.However, such estimates should be treated with caution. There is a possibility that thewidths of the emission lines are widened due to pressure from the radio jets. Also,little is known about how the SMBHs assemble during the formation and evolutionof a massive galaxy, such as HzRG, so extrapolation of results from lower redshiftsmay not be valid. Silk and Rees (1998) postulated that supermassive black holes formwithin the first sub-galactic structures that virialise at high redshift, and are in placebefore most galactic stars have formed.
5.3 Extinction of the “dinosaurs”
Luminous quasars and radio galaxies have undergone strong evolution in their spacedensities since z ∼ 2 (the peak of the “quasar” era”) and both species are now virtuallyextinct (Sect. 1.4). The reason why such extreme manifestations of nuclear activity areno longer with us is not fully understood. One obvious explanation is that the supply of“food” for the SMBHs began to diminish as more and more of the the gas in massivegalaxies was converted to stars (e.g. Menci 2004).
6 Nature of HzRG hosts—massive forming galaxies
Viktor Ambartsumian: “It is easy to show applying statistical considerations, that thegalaxies NGC 5128 (Centaurus A) and Cygnus A cannot be the result of the collisionsof two previously independent galaxies”Rudolf Minkowski “Results of a detailed investigation of NGC 1275 (Perseus A),reported at this symposium, admit to no other interpretation than that this systemconsists of two colliding galaxies”, IAU Symposium No. 5, Dublin, 1955
Having considered the various building blocks of HzRGs in detail, we now addressthe nature of HzRGs and how these objects fit into general schemes of galaxyevolution.
There are several reasons for concluding that HzRGs are massive forming galax-ies. First, we have seen that their large near-IR luminosities imply that HzRGs areamongst the most it massive galaxies in the early Universe (Sect. 4.1). Second, HzRGhosts have clumpy UV continuum morphologies (Sect. 4.3), as expected from galaxiesforming through mergers and in accordance with hierarchical models of massive galaxyevolution (Larson 1992; Dubinski 1998; Gao et al. 2004; Springel et al. 2005b). Third,
123

Distant radio galaxies and their environments 105
the rest-frame UV spectra and millimetre SEDs indicate that HzRGs are undergoingcopious star formation (e.g. Dey et al. 1997) (Sect. 4.2).
Not only are HzRGs massive forming galaxies, but there is also a strong evidencethat they are the progenitors of the most massive galaxies in the local Universe, i.e.the giant galaxies that dominate the central regions of rich local galaxy clusters. Wehave seen that HzRGs are generally embedded in giant (cD-sized) ionised gas halos(Sect. 3.2). In Sect. 7 we shall show that they are often surrounded by galaxy overden-sities, whose structures have sizes of a few Mpc (Sect. 7). For all these reasons, HzRGsare the probable ancestors of brightest cluster galaxies (BCGs) and cD galaxies.
What can studying the development of HzRGs tell us about the evolution of massivegalaxies in general? Recently, two processes have been invoked to explain discrepan-cies between the observed colour and luminosity statistics of faint galaxies and themodel predictions. In contrast with what might be expected from simple hierarchicalmerging scenarios, the data imply that star formation occurs earlier in the history ofthe most massive galaxies than for the less massive ones. This process is called galaxy“downsizing” (Cowie et al. 1996; Heavens et al. 2004; Thomas et al. 2005; Panter et al.2007). AGNs are preferentially found in the most massive galaxies. To quench starformation in these galaxies, it has been proposed that there is some sort of feedbackmechanism, in which the AGN influences the star formation history of the galaxy.This AGN feedback (Di Matteo et al. 2005; Best et al. 2005; Springel et al. 2005a;Croton et al. 2006; Hopkins et al. 2006; Best 2007) provides modelers with additionalparameters that, not surprisingly, gives a better fit to the data. The potential impor-tance of AGN feedback for galaxy formation processes was only realised after it wasshown that every galaxy may host a supermassive black hole (Sect. 5.2), establishinga general link between galaxies and AGN.
As the most massive known galaxies in the early Universe and the seat of powerfulAGN, HzRGs are important laboratories for studying the processes responsible fordownsizing and AGN feedback. In practice, feedback scenarios are complicated andinvolve several physical processes that occur simultaneously. We have seen in Sects. 2,3, 4, and 5 that there is considerable evidence for physical interaction between the var-ious building blocks of HzRGs—relativistic plasma, gas, dust, stars and the AGN. Asthey merge, the satellite galaxies will interchange gas with the ambient medium in thesystem. The gas will move inwards through cooling flows and accretion and providefuel for the supermassive black hole. The SMBHs generate quasars and relativisticjets. Hidden and/or dormant quasars heat the dust. The jets together with superwindsfrom starbursts (Armus et al. 1990; Zirm et al. 2005) drive gas outwards (Nesvadbaet al. 2006) and can trigger star formation. Shocks will be rampant in the chaoticenvironments in which these processes are competing with each other.
Two modes have been distinguished in theoretical models for coupling of the energyoutput of the AGN to the surrounding gas, with rather confusing names. “Quasar-mode” feedback is defined as the situation when radiative coupling occurs that expelsthe gas and thereby quenches star formation in the forming galaxy (Hopkins et al.2006). In “radio-mode” coupling (Best 2007), star formation is slowed down due tothe mechanical energy of the synchrotron radio jets that inhibits cooling of the ambientgas. However, such rigid distinction between feedback processes are highly simplified(e.g. Fu and Stockton 2007).
123

106 G. Miley, C. De Breuck
Fig. 16 The Spiderweb Galaxy. Deep Hubble image of the core of the MRC 1138-262 protocluster atz = 2.2 obtained with the Advanced Camera for Surveys. [From Miley et al. (2006)]. Superimposed on theHST image are contours of Lyα (blue, resolution ∼ 1′′) obtained with ESO’s very Large Telescope (VLT),delineating the gaseous nebula and radio 8GHz contours (red, resolution 0.3′′) obtained with NRAO’s VLA,delineating the non-thermal radio emission. The gaseous nebula extends for >200 kpc and is comparablein size with the envelopes of cD galaxies in the local Universe
It is impossible to understand how these complicated AGN feedback processesinfluences the evolution of massive galaxies from a consideration of statistical dataalone.
We shall now illustrate some of these processes and their relevance to galaxy for-mation by considering a specific example of a HzRG in more detail.
6.1 The Spiderweb Galaxy—a case study
The Spiderweb Galaxy (MRC 1138–262) at a redshift of z = 2.2 is one of the mostintensively studied HzRGs (Miley et al. 2006). This object provides a useful casestudy for illuminating several important physical processes that may occur generallyin the evolution of the most massive galaxies. Because the Spiderweb Galaxy is (i)relatively close-by, (ii) one of the brightest known HzRGs and (iii) is the HzRG withthe deepest HST optical image, it is an important laboratory for testing simulations offorming massive galaxies at the centers of galaxy clusters.
This large galaxy has several of the properties expected for the progenitor of adominant cluster galaxy (Pentericci et al. 1997, 1998, 2000a, 2001). The host galaxyis surrounded by a giant Lyα halo (Pentericci et al. 2000a; Kurk et al. 2004b,a) andembedded in dense hot ionised gas with an ordered magnetic field (Carilli et al. 1998).The radio galaxy is associated with a 3 Mpc-sized structure of galaxies, of estimatedmass > 2 × 10¹⁴ M, the presumed antecedent of a local rich cluster (Sect. 7).
The beautiful ACS Hubble image of the Spiderweb Galaxy is shown in Fig. 16,with the radio source and Lyα halo superimposed. The figure illustrates the structuresof the radio, warm gas and stellar components in a relatively nearby HzRG.
It also provides dramatic evidence that tens of satellite galaxies were merging into amassive galaxy, ∼10 Gyr ago. The morphological complexity and clumpiness agrees
123

Distant radio galaxies and their environments 107
qualitatively with predictions of hierarchical galaxy formation models (Larson 1992;Kauffmann et al. 1993; Baugh et al. 1998; Dubinski 1998; Gao et al. 2004; Springelet al. 2005b), and illustrates this process in unprecedented detail. Lyα spectroscopyshows relative velocities of several hundred km s−1, implying that the satellite galaxies(“flies”) will traverse the 100 kpc extent of the Spiderweb many times in the intervalbetween z ∼ 2.2 and z ∼ 0, consistent with the merger scenario.
An intriguing aspect of the Spiderweb Galaxy is the presence of faint diffuse emis-sion between the satellite galaxies (Hatch et al. 2007). Approximately 50% of theultraviolet light from the Spiderweb Galaxy is in diffuse “intergalactic” light, extend-ing over about 60 kpc diameter halo. The luminosity in diffuse light implies that theemission is dominated young stars with a star formation rate of > 80 M yr−1. Underreasonable assumptions, the diffuse emission seen in the Spiderweb Galaxy couldevolve into the CD envelopes seen in many dominant cluster galaxies seen at lowredshifts.
The total mass of all the flies in the Spiderweb, derived from their UV luminosi-ties (assuming 1 Gyr starbursts), is less than a tenth of the mass of the whole galaxyobtained from its IR luminosity (Miley et al. 2006). Because the UV emission isproduced by ongoing star formation and the IR emission by old stars, this implies thatmost of the galaxy mass may already have assembled by z ∼ 2.2, consistent withdownsizing scenarios.
Merging, downsizing and feedback are all likely to be occurring simultaneously inthe Spiderweb Galaxy. Merging is a plausible fueling source for the nuclear super-massive black holes that produce the radio sources. Pressure from these radio sourcesis sufficient to expel a large fraction of gas from the galaxies (Nesvadba et al. 2006),thereby quenching star formation (Croton et al. 2006). Because radio lifetimes are rel-atively short (few ×107 years), all massive ellipticals may have gone through a similarshort but crucial radio-loud phase during their evolution.
An unexpected feature of the HST image is that there is a significant excess offaint satellite galaxies with linear structures (Miley et al. 2006). These galaxies (linear“flies”) have similar morphologies (e.g. chains and tadpoles) to the linear galaxies thatdominate resolved faint galaxies (i775 > 24) in the Hubble Ultra Deep Field (UDF)(Elmegreen et al. 2005; Straughn et al. 2006). Although linear galaxies must be animportant constituent of the earliest galaxy population, their nature is poorly under-stood. Their presence in a merging system is relevant for theories of their formation.In the Spiderweb Galaxy the motions of the flies with velocities of several hundredkm s−1 through the dense gaseous halo, perturbed by superwinds from the nucleus(Armus et al. 1990; Zirm et al. 2005) and the radio jet, would result in shocks. Theshocks would then lead to Jeans-unstable clouds, enhanced star formation along thedirection of motion and to chain and tadpole morphologies (Taniguchi and Shioya2001; Miley et al. 2006).
7 Environment of HzRGS—protoclusters
“We have traced the broad outline of the development in regions of exceptional fruit-fulness of the first settled village communities into more populous towns and cities”
123

108 G. Miley, C. De Breuck
“The city community arose around the altar of the seed-time blood sacrifice.” TheOutline of History, H. G. Wells, 1920
Within standard Cold Dark Matter (CDM) scenarios the first stars and stellar sys-tems should form through gravitational infall of primordial gas in large CDM halos(e.g. White and Rees 1978). Simulations suggest that these halos merge and formweb-like networks traced by young galaxies and re-ionised gas (e.g. Baugh et al. 1998;De Lucia and Blaizot 2007). The most massive galaxies, and the richest clusters emergefrom regions with the largest overdensities.
7.1 Finding protoclusters using HzRGs
To investigate the emergence of large-scale structure in the Universe, it is importantto find and study the most distant rich clusters of galaxies. Conventional methods forfinding distant galaxy clusters usually rely on the detection of hot cluster gas usingX-ray techniques. These are limited by the sensitivity of X-ray telescopes to ∼< 1.3,i.e. much smaller than the redshifts of HzRGs.
Since HzRGs are amongst the most massive galaxies in the early Universe, theyare likely to inhabit regions that are conducive to the formation of rich galaxy clus-ters. During the mid-1990s observational evidence emerged that HzRGs are located indense cluster-type environments. First, the measurement of large radio rotation mea-sures (RM) around some HzRGs, indicated that the host galaxies are surrounded by ahot magnetised cluster gas (Carilli et al. 1997; Athreya et al. 1998b) (Sect. 3.1). Sec-ondly, an excess of “companion galaxies” was found near HzRGs (Röttgering et al.1996; Pascarelle et al. 1996; Le Fevre et al. 1996; Knopp and Chambers 1997). Theseresults together with the indications that HzRGs hosts are forming dominant clustergalaxies (Sect. 6) prompted the initiation of direct searches for galaxy clusters in thevicinity of HzRGs.
Conventionally the term “galaxy cluster” refers to a bound structure of several hun-dred galaxies. At z ∼ 3, the Universe is only about 2 Gyr old, i.e. insufficient time fora galaxy with a velocity of a few hundred km s−1 to have crossed cluster-scale struc-tures. Hence any overdense structure of galaxies observed at high redshifts must still beforming and cannot be virialised and bound. Following Overzier (2006), we shall usethe term “protocluster” for an overdense structure in the early Universe (z > 2), whoseproperties are consistent with it being the ancestor of a local bound galaxy cluster.
During the last few years there have been several successful direct searches for pro-toclusters around HzRGs, with 8–10 m-class optical/infrared telescopes. One searchtechnique is to use narrow-band imaging to detect emission line objects at redshiftedwavelengths corresponding to those of the target HzRGs. A second technique is tocarry out broad-band imaging with colours chosen to detect “dropout objects” due toredshifted features in the continuum spectral energy distributions. The protoclustercandidate galaxies detected in these imaging experiments were generally followed upby multi-object spectroscopy to confirm their redshifts and their membership of theprotoclusters. The most important emission line for establishing the redshifts of theprotocluster galaxies is Lyα (Pentericci et al. 1997; Kurk et al. 2000; Venemans et al.2002, 2004; Croft et al. 2005; Venemans et al. 2005, 2007). Other relevant emission
123
Distant radio galaxies and their environments 109
lines for such searches for z > 3 are Hα (Kurk et al. 2004a,b) or [OIII]λ5007. Thereare two relevant features in the continuum spectra of galaxies that are exploited forsuch protocluster searches—the Lyman break around the 912 Å Lyman continuumdiscontinuity (Miley et al. 2004; Overzier et al. 2006b,a; Intema et al. 2006) and the4,000 Å break or Balmer break close to 3,648 Å (Kurk et al. 2004b; Kajisawa et al.2006; Kodama et al. 2007). The various galaxy detection techniques are complemen-tary, because they tend to select stellar populations with different ages. For example,Lyα excess galaxies and Lyman break galaxies have young on-going star-formingpopulations, while the Balmer technique is sensitive to stellar populations that areolder than a few ×108 years.
The measured overdensities of Lyα emitters in the radio-selected protoclustersare factors of 3–5 larger than the field density of Lyα emitters at similar redshifts(Venemans et al. 2005, 2007). A recent study with the HST of 4,000 Å break objectsin MRC1138-262 at z = 2.2, the protocluster that contains the Spiderweb Galaxy(Zirm et al. 2007, submitted to Ap.J) shows that the overdensity of red galaxies is 6.2,compared with non-protocluster fields. The photometric redshifts of galaxies in thisfield shows a significant “redshift spike” for 2 < z < 2.5. Although such observa-tions at z > 5 are sensitivity limited, a significant overdensity of both Lyα emitters(Venemans et al. 2004) and Lyman break galaxies (Overzier et al. 2006b) has beenestablished around TN J0924-2201 at z = 5.2, the HzRG with the highest redshiftknown to date.
Possible protoclusters have also been detected in non-targeted optical surveys, withseveral overdense regions found at large redshifts in the form of “redshift spikes” or“filaments” (e.g. Steidel et al. 1998; Keel et al. 1999; Steidel et al. 2000; Möller andFynbo 2001; Shimasaku et al. 2003; Hayashino et al. 2004; Matsuda et al. 2005 ;Steidel et al. 2005; Ouchi et al. 2005). Although caution must be exercised in derivingoverdensities from the redshift distributions alone, because the effects of peculiar gal-axy velocities can influence the apparent clumpiness (Monaco et al. 2005). However,the observed structures around the HzRGs have two additional ingredient expected ofancestors of rich clusters, namely (i) the presence of the HzRG hosts with propertiesexpected of progenitors of dominant cluster galaxies and (ii) sharp peaks in the red-shift distributions of Lyα emitters that lie close to the predetermined redshift of theradio galaxy. Taken together, the measured galaxy overdensities combined with thepresence of HzRGs is strong evidence that the galaxy structures around HzRGs areindeed the ancestors of rich local clusters.
For some of the HzRG-selected protoclusters, there is additional evidence for adense environment from excess counts at millimetre (Ivison et al. 2000; Smail et al.2003; Stevens et al. 2003; De Breuck et al. 2004a; Greve et al. 2007) and X-ray(Pentericci et al. 2002; Overzier et al. 2005) wavelengths. Also, the X-ray countsindicate an enhanced AGN fraction in protoclusters compared to the field (Figs. 17,18, 19).
7.2 Properties of radio-selected protoclusters
The largest and most comprehensive HzRG protocluster search project was based on astudy of eight radio galaxies, with redshifts ranging from 2.2 to 5.2, using the narrow-
123

110 G. Miley, C. De Breuck
Fig. 17 HzRG-selected protocluster around TN J1338-1942 at z = 4.1. [From Venemans et al. (2002,2007)]. Shown are the spatial distribution of the spectroscopically confirmed z = 4.1 Lyα emitters (circlesand diamonds), additional Lyα excess candidates from narrow-band imaging (stars) and the radio galaxy(square). The circles represent emitters with redshift smaller than the median redshift and the diamondswith those larger than the median. The size of the circles is scaled according to the relative velocity of theobject. Larger circles and diamonds represent a larger relative velocity compared with the median velocity.The structure appears to be bound in the northwest of the image and unbound in the south
band Lyα search technique with the VLT (Pentericci et al. 2000a; Kurk et al. 2000;Venemans et al. 2002, 2004; Croft et al. 2005; Venemans et al. 2005, 2007). Followupobservations have been made of candidates in several of the targets using a varietyof ground-based telescopes as well as the Hubble and Spitzer Telescope (Kurk et al.2004b,a; Miley et al. 2004; Overzier et al. 2005, 2006b; Intema et al. 2006; Kodamaet al. 2007). Typically, ∼3 Mpc-scale regions around the HzRGs were covered in theLyα searches. Lyα redshifts were determined for 168 objects. Almost all these objectsare star-forming galaxies at similar redshift to the HzRG, with typical star formationrates of a few M per year, derived from the UV continuum and the Lyα luminosities.
Six of the 8 fields were found to be overdense in Lya emitters by a factor of 3–5 ascompared to the field density of Lyα emitters at similar redshifts. The 6 included allof the most radio-luminous objects (i.e. all HRzGs with radio luminosities L2.7GHz >
6×1033 erg s−1 Hz−1 sr−1) (Venemans et al. 2007). Because these targets were chosenarbitrarily, (redshifts that place Lyα in an available narrow-band filter), it is possiblethat all HzRGs with such large radio luminosities are embedded in such overdensities.
Measured velocity dispersions are in the range ∼300–1,000 km s−1, centered withina few hundred km s−1 of the mean velocity of the radio galaxies. Taking account of the
123

Distant radio galaxies and their environments 111
Fig. 18 HzRG-selected protocluster around TN J1338-1942 at z = 4.1 as in Fig. 17. [From Venemanset al. (2002, 2007)]. Velocity distribution of the confirmed Lyα emitters. The peak velocity of the radiogalaxy is indicated by an arrow. The solid line represents the selection function of the narrow-band filternormalised to the total number of confirmed emitters. Note that the velocity distribution of the detectedemitters is substantially narrower than the filter width and centered within 200 km s−1 of the redshift of theradio galaxy. Similar data are available for six protoclusters
Fig. 19 Morphologies of galaxies in the protocluster TN J1338-1942 at z = 4.1 with the ACS on theHubble Space Telescope [From Overzier et al. (2006a)]. The filter is i775 and each image measures 3′′ ×3′′,corresponding to ∼20 kpc× 20 kpc at z∼4. Left are images for a selection of the overdense g475-dropoutobjects that are candidate Lyman break galaxies (LBGs) in the protocluster. Right are images of 12 spectro-scopically confirmed Lyα excesses (LAE) protocluster members. There are a wide range of morphologiespresent, with some galaxies showing clear evidence for small-scale interactions
123
112 G. Miley, C. De Breuck
relatively narrow peaks in the velocity distributions of the Lyα emitters compared withthe widths of the imaging filters, the measured galaxy overdensities range from ∼5to 15. Estimates for the sizes of the protocluster structures are limited by the typicalsize of the imaging fields used in the searches to date (∼ 8′ equivalent to ∼3 Mpc).Nevertheless, the protocluster sizes are estimated to be in the range ∼2–5 Mpc (Intemaet al. 2006; Venemans et al. 2007).
Because cluster-size overdense structures at high redshifts cannot be old enough tohave become bound, the usual method of calculating cluster masses using the virialtheorem cannot be applied. However, estimates for the masses of the protoclusters canbe obtained from the volume occupied by the overdensity, the mean density of theUniverse at the redshift of the protocluster, the measured galaxy overdensity, and thebias parameter (e.g. Steidel et al. 1998; Venemans et al. 2007). The masses obtained (afew times 1014–1015 M (Kurk et al. 2004a; Venemans et al. 2005)) are comparableto the masses of local rich clusters.
It is interesting to inquire what is the relation of the protocluster structures tothe general large-scale structure of the Universe. Is the topology of the protoclusterfilamentary, or do HzRG-selected protoclusters illuminate the densest most tangledregions of the cosmic web. For TN J1338-1942 at redshift z = 4.1, there are indicationsthat the Mpc-sized protocluster of Lyα excess galaxies may be part of a larger-scalestructure. A 25′ × 25′ survey for Lyman break galaxy candidates (B-band dropouts)showed several significant density enhancements amidst large voids (Intema et al.2006) and Overzier et al. (2006a)showed that this large scale structure ties in closelywith significant sub-clustering across the 3′ × 3′ ACS field near the radio galaxy.
Future wide-field narrow-band imaging and spectroscopy around HzRG-selectedclusters should allow the topology of the Universe in the region of protoclusters to bemapped in detail, providing a glimpse of large-scale structure emerging in the earlyUniverse for comparison with computer simulations.
7.3 Are radio-selected protoclusters typical?
We have seen that protocluster-like structures have been found around almost all ofthe most luminous radio galaxies with z > 2 that have been targeted. However only∼50% of powerful radio sources at z ∼ 0.5 are located in rich clusters and radiosources appear to avoid clusters at low redshift (Hill and Lilly 1991). What is knownabout the environment of radio galaxies having redshifts 1 < z < 2? This range isdifficult to study spectroscopically because of the redshift desert (Sect. 1.3). However,there have been several reports of detections of clusters and/or excesses of red galaxiesaround radio AGN in this redshift range (Hall et al. 1998; Kodama and Bower 2003;Nakata et al. 2002; Best et al. 2003a). We note that there is a strong correlation betweenthe radio luminosities and redshift of objects in such studies due to Malmquist bias.Taking all the data together, there appears to be a substantial increase in the densityof the environment around radio galaxies as a function of redshift and/or luminosity.
The statistics of the luminosity function of radio galaxies are consistent with everybrightest cluster galaxy (BCG) having gone through a luminous radio phase duringits evolution (Venemans et al. 2002, 2007). This statement is based on the facts (i)that the space density of luminous steep-spectrum radio sources decreases by ∼ 100
123

Distant radio galaxies and their environments 113
between 2.5 ≥ z > 0 (Sect. 1.4) and (ii) that the radio synchrotron lifetimes (few×107 year) are ∼ 100 smaller than the cosmological time interval corresponding tothe observed redshift range (few ×109 year). Distant radio galaxies may therefore betypical progenitors of galaxies that dominate the cores of local clusters. Likewise, theancestor of every rich cluster in the local Universe may have gone through a phasein which it hosted a HzRG. This would imply that HzRG-selected protoclusters aretypical ancestors of local galaxy clusters.
7.4 Protocluster evolution
Radio-selected protoclusters are powerful laboratories for tracing the emergence oflarge scale structure and for studying the evolution of galaxies in dense cluster envi-ronments. An interesting parameter that can be measured for line-emitting galaxiesis the velocity dispersion of the protoclusters. Although more statistics are needed,the velocity dispersion appears to decrease with increasing redshift (Venemans et al.2007), consistent with the predictions from simulations of forming massive clusters(e.g. Eke et al., 1996).
A population study of the protocluster around the Spiderweb Galaxy PKS 1138-262at z = 2.2 was carried out by Kurk et al. (2004a,b), using deep optical and infraredobservations with the VLT. Besides Lyα emitters, the study included objects havingapparent Hα excesses and extremely red objects, with colours characteristic of oldgalaxies with 4,000 Å breaks at the redshift of the protocluster. An intriguing result ofthis study is that candidate Hα emitters and 4,000 Å break objects appear more con-centrated towards the centre of the protocluster than the Lyα emitters. This indicatesthat the galaxies that are dominated by old stellar populations are more settled intothe gravitational potential well of the protocluster, consistent with them being older.
An important diagnostic of galaxy and cluster evolution is the cluster color-magnitude diagram (CMD). The presence of a narrow “red sequence” in the clus-ter CMD is well established out to a redshift of 1.4 (Stanford et al. 2005). The redcolors imply that the galaxies are dominated by older stars, whose SED peaks redwardsof the 4,000 Å break. The presence of this red sequence can be used to set a lowerlimit to the redshift at which the stellar populations formed. It is extremely difficult tomeasure the CMD at z > 1.4, even with the largest ground-based telescopes.
However, indications of an emergent red sequence has been found in the CMD ofthe protocluster MRC1138-262 at z = 2.2, both with a wide-field near-IR imager onthe Subaru Telescope (Kodama et al. (2007); Fig. 20) and with the much narrow fieldbut more sensitive NICMOS on the HST (Zirm et al. 2007). The galaxy colors indicatethat while some relatively quiescent galaxies exist in the protocluster, most of the gal-axies are still undergoing star formation Furthermore, Kodama et al. (2007) studiedthree other radio-selected protoclusters and found that the fraction of red galaxiesin the four protoclusters increases between z ∼ 3 and z ∼ 2. To summarize, thereis strong evidence that most protocluster galaxies undergo substantial star formationbetween z ∼ 3 and z ∼ 2 and that the bright end of the red sequence is still beingformed during this epoch.
Information about the early evolution of stellar populations in clusters has beenobtained at even higher redshifts. In the protocluster surrounding the HzRG TN J1338-
123

114 G. Miley, C. De Breuck
Fig. 20 Colour-magnitude diagram of J–KS plotted against KS for the MRC 1138-262 protocluster atz = 2.2 [From Kodama et al. (2007)]. Filled circles indicate protocluster member candidates selected usingcolor selection criteria. Large stars mark the targeted radio galaxies. Dotted error bars show 1s photometricerrors. Solid, dashed and dotted lines show the expected location of the CMD at the relevant redshift forpassive evolution. The iso-stellar mass lines of 1011 and 1010M are shown by thick dotted lines. Thedot-dashed lines indicate 5σ (KS ) and 2σ (J ) detection limits
1942 at z = 4.1, the distribution of Lyα emitters (LAEs) is highly filamentary andappears to avoid the locations of Lyman break galaxy candidates (Overzier et al.2006a). A similar spatial segregation between LAEs and LBGs was observed in astructure around QSO SDSS J0211-0009 at z = 4.87 (Kashikawa et al. 2007). Thisindicates that an age- or mass-density relation was emerging little more than 1 Gyrafter the Big Bang, when the Universe was only 10% of its present age.
We note that derived masses of z > 2 LBGs and LAEs are ∼> 10 smaller than themasses of early-type galaxies in local clusters, indicating that a large fraction of thestellar mass still has to accumulate through merging (Overzier et al. 2006a). Detailedobservations of protocluster regions on much larger scales (∼50 co-moving Mpc) areneeded to test if the number density of LBGs is indeed consistent with forming thecluster red sequence population through merging. Simulations show that clusters withmasses of > 1014 M can be traced back to regions at z = 4–5 of 20–40 Mpc in size,and that these regions are associated with overdensities of typical dark matter haloshosting LAEs and LBGs of δg∼3 and mass overdensities δm in the range 0.2–0.6(Suwa et al. 2006). Also, recent numerical simulations of CDM growth predict thatquasars at z∼6 may lie in the center of very massive dark matter halos of ∼4×10¹² M(Springel et al. 2005a; Li et al. 2007). They are surrounded by many fainter galaxies,that will evolve into massive clusters of ∼4 × 10¹⁵ M at z = 0.
123

Distant radio galaxies and their environments 115
The addition of the new IR-oprical camera WFC3 to the HST and the advent ofseveral new wide-field imagers and multi-object spectrographs on ground-based tele-scopes will allow the detailed evolution of protoclusters to be studied in great detailduring the next few years.
8 Conclusions and future
“Curioser and curiouser!” cried Alice (she was so much surprised that for the momentshe quite forgot how to speak good English). “Now I’m opening out like the largesttelescope that ever was!” Alice’s Adventures in Wonderland, Lewis Caroll, 1865
In this review we have shown that HzRGs are fascinating objects in their ownright and that they provide important diagnostics for studying the early Universe.Knowledge about HzRGs and their evolution is fundamental to understanding theformation and evolution of galaxies and the large scale structure of the Universe.
There are still many aspects of HzRGs that are not understood. Here are some openquestions.
• What is the particle acceleration mechanism in the relativistic plasma and why doHzRGs have much steeper radio spectra than nearby radio sources (Sect. 2.4).
• Why caused the most luminous radio galaxies and quasars to become virtuallyextinct between z ∼ 2 and the present (Sects. 1.4 and 5.3)?
• What is the nature, extent and kinematics of the hot gas, one of the most massiveand least studied constituents of HzRGs (Sect. 3.1)?
• What is the origin of the Lyα halo that appears to be falling into the HzRG andhow is this warm gas (filling factor ∼10−5) distributed with respect to the hotterand colder gas (filling factors ∼1) (Sects. 3.2.4 and 2.4)?
• What are the detailed processes by which the radio jets interact with the gas andtrigger starbursts and how important is jet-induced star formation for producingstars in the early Universe (Sects. 3.2.3 and 4.3)?
• What are the temperature and densities and composition of the molecular gas anddust? how is this distributed spatially and what are the implications for the starformation histories(Sects. 3.4 and 3.5)?
• What is the relative importance of AGN and starburst heating in the mid-IR emis-sion of HzRG?
• What effect does galaxy merging have on star formation and what physical effectsare responsible for downsizing (Sect. 6)?
• What effect does feedback between the AGN and the galaxy have on the evolutionof HzRGs and the general evolution of massive galaxies (Sect. 6)?
• What is the detailed mechanism by which the SMBHs produce quasars and lumi-nous collimated jets?
• How do the AGN/quasars vary on long timescales and what are the causes of thevariability (Sects. 5.1 and 5.2)?
• How is the SMBH built up and what role does merging play in this evolution(Sect. 5.2)?
123

116 G. Miley, C. De Breuck
• What is the size distribution of radio-selected protoclusters and what is is thetopology of the cosmic web in the neighbourhood of the HzRGS (Sect. 7)?
• How do the various populations and constituents of distant protoclusters evolveand eventually become virialised clusters (Sect. 7.4)?
• What is the radio luminosity function of galaxies in radio-selected protoclusters?Is the radio emission from the protocluster galaxies an important contributor toforming the radio halos, that are seen at the centres of many nearby rich clusters?What is the strength and configuration of the protocluster magnetic fields (Sects. 7and 2)?
There are good prospects for making progress during the next decade. Since itsinception, the study of radio galaxies, has been observationally driven. Several fore-front astronomical facilities now being constructed or planned that will give newinsights into the nature of HzRGs and their environments.
First, with a combination of sensitivity and spatial resolution, the new low-fre-quency radio arrays, LOFAR (Röttgering et al. 2006) and the LWA (Kassim et al.2006), will open up the frequency window below ∼50 MHz for HzRG studies. LOFARwill survey the sky to unprecedented depth at low-frequencies and will therefore besensitive to the relatively rare radio sources that have extremely steep spectra. Becauseof the α vs z relation (Sect. 2.4), LOFAR is likely to detect HzRGs at z ∼ 8, if theyexist. Studies of detailed low-frequency spectra and their spatial variations will providenew information about the mechanism responsible for the α vs z relation. Presentlycombination of the new radio surveys with planned new deep optical and infraredwide-field surveys, such as PAN-STARRS (Hodapp et al. 2004) and those with theVST and VISTA (Arnaboldi et al. 2007) will be used to identify HzRGs and providephotometric data.
Another task for sensitive radio arrays, such as LOFAR, the EVLA (Napier 2006)and eventually the Square Kilometre Array (SKA), will be to survey the radio emissionof galaxies in protoclusters. The new arrays will study radio emission produced byrelativistic jets and be able to detect and investigate radio emission from the brighteststar forming protocluster galaxies.
Second, ALMA (Brown et al. 2004) and the EVLA, with their unprecedentedsensitivities and resolutions at millimetre and sub-millimetre wavelengths, will revo-lutionise the study of molecular gas and dust. Several different CO transitions can beobserved, allowing entire “CO ladders” to be constructed and the density and temper-ature structure of the molecular gas to be unraveled. Fainter molecular lines can beused to trace even denser gas than that studied until now. Important information aboutthe dust composition and the gas to dust ratios is likely to be obtained.
ALMA’s sensitivity at millimetre wavelengths should also facilitate observationsof the atomic CI Carbon lines in HzRGs. This would provide an important constrainton the global metalicity of the gas. The fine-structure line of C+ at λrest = 157.74 µmline is one of the main cooling lines in nearby galaxies, and has now also been detectedin several of the most distant quasars known.
Third, we can expect considerable progress in disentangling the detailed evolu-tionary history both of HzRGS and of radio-selected protoclusters. This evolutionarydetective work will be pursued by combining spectroscopic data from the next gen-
123
Distant radio galaxies and their environments 117
eration of spectrographs on 8-m-class telescopes with imaging results from the newcamera, WFC3 (Leckrone et al. 1998), on the Hubble Space Telescope. For example,the detection of supernovae in z ∼ 2 protoclusters will become possible. On a longertimescale, tracing the detailed history of the formation and evolution of HzRGS andthe surrounding protoclusters will be helped enormously with the advent of 30-m-classground-based telescopes in the optical and near-infrared and the James Webb SpaceTelescope (JWST) (Gardner et al. 2006) in the near and mid-infrared.
Fourth, the next generation X-ray telescope, such as XEUS (Bavdaz et al. 2006) orConstellation-X (Tananbaum 2006), will make observations of X-rays from HzRGsan important tool for studying galaxy formation. It will have sufficient sensitivity toperform spectroscopic studies of hot gas in HzRGs. The 0.3–10 keV X-ray band con-tains the inner (K-shell) lines for all of the abundant metals from carbon to zinc aswell as many L-shell lines. These atomic transitions provide important new plasmadiagnostics of the HzRG hot gas.
Fifth, and perhaps most exciting, the potential discovery of HzRGS with z > 6 couldopen up a unique new window for studying the very early Universe during the “Epochof Reionisation”. Recent observational constraints on suggest that cosmic reionisationmay have taken place between z ∼ 11 and z ∼ 6 (Fan et al. 2006). The existence ofHzRGs within the near edge of cosmic reionisation could be used as sensitive probesof intermediate- to small-scale structures in the neutral IGM, through redshifted HIabsorption observations (Sect. 3.3.1) (Carilli et al. 2002b; Furlanetto and Loeb 2002),complementary to the very large scale that can be studied in HI emission.
Finally, we point out that in trying to understand HzRGs or in using them to probethe properties of the early Universe, we should exercise humility, remembering that96% of the energy density in the universe is in a form of dark matter and dark energy,that are not directly observable.
HzRGS pinpoint the progenitors of cosmic megacities in the local Universe. Study-ing them is akin to investigating how human civilisations were urbanised. During thelast few decades we have obtained some glimmerings of how and why this cosmicurbanisation occurred. During the next few decades we shall learn a great deal moreabout the origin of the megacities, the nature of the first city dwellers, their organisa-tional structure and their successes and failures.
Acknowledgments We are grateful for suggestions, useful comments and/or figures from Wil van Breu-gel, Ilana Feain, Jaron Kurk, Nicole Nesvadba, Roderik Overzier, Michiel Reuland, Birgitte Rocca, HuubRöttgering, Bram Venemans and Montse Villar-Martin. GM acknowledges support from an Academy Pro-fessorship of the Royal Netherlands Academy of Arts and Sciences.
Open Access This article is distributed under the terms of the Creative Commons Attribution Noncom-mercial License which permits any noncommercial use, distribution, and reproduction in any medium,provided the original author(s) and source are credited.
Appendix: Known HZRGs
This appendix contains a compendium of HzRGs (z >2, L500(rest) >1027 erg s−1 Hz−1)known at the time of writing. Table 3 lists the HzRGs, their positions, redshifts, radio
123

118 G. Miley, C. De Breuck
luminosities extrapolated to 500 MHz rest frequency and relevant references. For con-venience the HzRGs are listed in order of right ascencion in Table 4. A question markindicates a value that is uncertain.
The luminosities were calculated using
Lν = 4π D2L Sν(1 + z)−α−1,
where DL is the luminosity distance,1 Sν is the observed flux density at the restfrequency, and α is the spectral index (Sν ∝ να).
Why did we choose a rest-frame frequency of 500 MHz to express the radio luminos-ities? The radio sources have steep spectra and are generally taken from low-frequencysurveys, so it is appropriate to express their luminosities at as low a rest frequencyas possible (e.g. Blundell and Rawlings, 2000). For consistency, surveys covering thenorthern and southern sky with comparable spatial resolution should be used. The mostappropriate surveys are the 74 MHz VLA Low-frequency Sky Survey (VLSS; Cohenet al. 2007) and the 1.4 GHz NVSS (Condon et al. 1998). These contain ∼75% of theknown HzRGs. For the entire redshift range of the sample, the observed frequencyassociated to νrest = 500 MHz is located close to the VLSS frequency, but still locatedbetween VLSS and NVSS, thereby avoiding extrapolations to un-observed parts ofthe radio spectrum.
For HzRGs not included in these catalogues, the following combination of surveyswere used in order of preference: WENSS (Rengelink et al. 1997) and NVSS, Texas(Douglas et al. 1996) and NVSS, SUMSS (Mauch et al. 2003) and NVSS, or MRC(Large et al. 1981) and PMN (Griffith and Wright 1993). A small number of HzRGsfrom the CENSORS survey (Brookes et al. 2006) do not yet have measured radiospectra. For these we assumed a constant spectral index of α = −1.1, leading touncertainties in the derived luminosities that could be as much as 0.5 dex. The relevantluminosities are indicated bya.
The table also lists references for the redshifts and relevant followup observa-tions. Although references to the followup work are not complete, they provide auseful pointer for readers who require further information. The key to the referencesto followup observations are: CO = CO, G = General, H = HST imaging, HI = HIabsorption, M = Millimetre/submillimetre, N = Nebular continuum, OP = Opticalpolarisation, OS = Optical/infrared spectroscopy, P = Protocluster, R = Radio, S Spit-zer IR and X = X-rays.
1 Assuming H0 = 70 km s−1 Mpc−1, = 0.7 and M = 0.3.
123

Distant radio galaxies and their environments 119
Table 3 Known radio galaxies with z > 2 and radio luminosities L500(rest) > 1027W Hz−1
Name RA(J2000) DEC(J2000) z References Log (L500) References
MRC 2036-254 20:39:24.5 −25:14:31 2.000 1 28.52 R (47, 48, 49, 50)X (51)
MRC 0015-229 00:17:58.2 −22:38:04 2.01 1 28.32 R (47, 48, 49, 50)
MRC 0156-252 01:58:33.5 −24:59:30 2.016 2 28.46 H (52) R (47, 49,50) S (53)X (51)
MG 2348+0507 23:48:32.0 +05:07:33 2.019 S2 28.58
MP J1758-6738 17:58:52.9 −67:38:34 2.026 3 28.99
TXS 0448+091 04:51:14.6 +09:14:29 2.037 4 28.11 R (47)
NVSS J002402-325253 00:24:02.3 −32:52:54 2.043 5 27.93
MRC 2048-272 20:51:03.4 −27:03:05 2.06 1 28.72 H (52) R (54)
S (53) X (51)
B3 1204+401 12:07:06.2 +39:54:39 2.066 6 28.33 R (54)
PKS 0011-023 00:14:25.5 −02:05:56 2.080 7 28.15 R (54)
5C 7.223 08:24:06.4 +26:28:12 2.092 8 27.71
MG 1401+0921 14:01:18.3 +09:21:24 2.093 9 28.26
7C 1740+6640 17:40:42.2 +66:38:44 2.10 10 27.77
7C 1802+6456 18:02:22.1 +64:56:45 2.110 10 28.18
TN J1102-1651 11:02:47.1 −16:51:34 2.111 3 28.07
4C +39.21 07:58:08.8 +39:29:28 2.119 11 28.51
6C 1134+369 11:37:07.7 +36:39:54 2.125 12 28.31 R (54)
TXS 2034+027 20:36:34.8 +02:56:55 2.129 3 28.45 R (54)
TXS 0214+183 02:17:25.8 +18:37:03 2.131 4 28.46 OS (55) R (47)
WN J1242+3915 12:42:53.1 +39:15:49 2.131 3 28.03
4C +40.49 23:07:53.5 +40:41:49 2.140 11 28.46
NVSS J103615-321659 10:36:15.3 −32:16:57 2.144 13 27.82
4C +43.31 13:52:28.5 +42:59:23 2.149 11 28.43
NVSS J144932-385657 14:49:32.8 −38:56:58 2.152 13 28.07
TXS 0355-037 03:57:48.0 −03:34:08 2.153 4 28.34 OS (55)
TNR 2254+1857 22:54:53.7 +18:57:04 2.154 3 27.80
MRC 1138-262 11:40:48.3 −26:29:10 2.156 1 29.07 G (56) H (57, 52,58)
M (59,60);OS (61); P (62,63, 64, 65, 66,67, 68, 69) R(47, 48, 49, 50)S (53)X (70, 71)
6C**0746+5445 07:50:24.6 +54:38:07 2.156 14 27.64
6C* 0024+356 00:26:52.0 +35:56:24 2.161 15 28.04
MRC 0030-219 00:33:23.9 −21:42:01 2.168 2 28.14 R (47, 49)
123

120 G. Miley, C. De Breuck
Table 3 continued
Name RA(J2000) DEC(J2000) z References Log (L500) References
B2 1056+39 10:59:11.5 +39:25:01 2.171 16 28.20 R (54)
6C* 0135+313 01:38:06.6 +31:32:42 2.199 15 27.97
5C 7.10 08:11:26.5 +26:18:19 2.185 8 28.21
5C 7.269 08:28:39.7 +25:27:30 2.218 17 27.78 M (21)
5C 7.271 08:28:59.5 +24:54:00 2.224 8 27.97
6C* 0142+427 01:45:29.0 +42:57:42 2.225 15 28.10
TXS 0200+015 02:02:42.9 +01:49:11 2.229 4 28.07 OA (55, 72, 73)R (47)
NVSS J101008-383629 10:10:08.0 −38:36:29 2.236 13 28.30
TXS 1113-178 11:16:14.7 −18:06:23 2.239 4 28.46 R (47)
6C* 0115+394 01:17:55.3 +39:44:33 2.241 15 27.93
6C 0629+53 06:33:52.0 +53:16:31 2.246 17 28.35
6C 0901+54 09:05:24.2 +54:05:42 2.249 17 28.11
TN J0452-1737 04:52:26.7 −17:37:54 2.26 3 28.09
4C 40.36 18:10:55.7 +40:45:23 2.265 18, 19 28.79 G (74, 75);M (21)OP (76); OS(77, 78, 79) R(47, 80); S (53)
6C* 0152+463 01:55:45.6 +46:37:11 2.279 15 27.97
4C 40.22 08:59:59.6 +40:24:36 2.28 20 28.39
MRC 1324-262 13:26:54.7 −26:31:43 2.28 1 28.46 R (47, 49, 50)
MG 1747+1821 17:47:07.0 +18:21:11 2.281 21 28.86 M (21) OS (77)
R (47, 54)
6C* 0106+397 01:09:25.4 +40:00:01 2.284 15 28.11
MP J0340-6507 03:40:44.6 −65:07:12 2.289 22 28.82
6C 1106+380 11:09:28.9 +37:44:31 2.290 17 28.44
MG 0936+0503 09:36:10.1 +05:03:49 2.306? S2 28.08
MG 1251+1104 12:51:00.1 +11:04:20 2.322 9 28.42 M (21)
MRC 0349-211 03:51:11.8 −20:58:00 2.329 23 28.28 R (48, 49, 50)
TXS 0211-122 02:14:17.4 −11:58:47 2.340 24, 19 28.48 G (24) H (81,52)
OP (70) OS(55, 78, 79, 82)
R (47)
4C 48.48 19:33:05.6 +48:11:46 2.343 25 28.29 G (24) M (21)
OP (76) OS (78,79, 82) R (47)
TXS 1707+105 17:10:06.9 +10:31:09 2.349 4 28.63 H (81, 52)
OS (55, 83);
S (53)
BRL 0128-264 01:30:27.9 −26:09:57 2.348 26 29.13
6C* 0118+486 01:21:16.3 +48:57:40 2.350 15 27.83
123

Distant radio galaxies and their environments 121
Table 3 continued
Name RA(J2000) DEC(J2000) z References Log (L500) References
NVSS J094949-213432 09:49:49.0 −21:34:33 2.354 27 26.91a
PKS 1425-148 14:28:41.7 −15:02:28 2.355 3 28.66 R (54)
NVSS J232651-370909 23:26:51.5 −37:09:11 2.357 5 28.02
4C -00.54 14:13:15.1 −00:23:00 2.360 4, 19 28.41 H (81, 52) OP(83, 76) OS (55,78, 79, 82) P(84) R (47) S (53)
MG 0001+0846 00:01:15.5 +08:46:39 2.36? S2 28.53
B2 1159+39A 12:01:50.0 +39:19:11 2.370 11 28.22
6C**0854+3500 08:57:15.9 +34:48:24 2.382 14 27.92
LBDS 53W002 17:14:14.8 +50:15:30 2.390 28 27.78 CO (85, 86) M (21)OS (77) S (53)
6C 0930+389 09:33:06.9 +38:41:48 2.395 17 28.41 M (21) R (54) S(53)
4C 34.34 11:16:30.4 +34:42:24 2.400 17 28.46 M (21)
7C 1736+650 17:36:37.5 +65:02:28 2.400 10 27.65
TXS 0748+134 07:51:01.1 +13:19:27 2.419 4 28.31 OS (55) R (47)
NVSS J095226-200105 09:52:26.5 −20:01:05 2.421 27 26.97a
TN J1033-1339 10:33:10.7 −13:39:52 2.425 3 28.35
NVSS J094925-203724 09:49:25.9 −20:37:24 2.427 27 27.27a
4C 40.02 00:30:49.0 +41:10:49 2.428 17 28.64
B3 0731+438 07:35:21.9 +43:44:21 2.429 29 28.89 OP (76) OS (77,78, 79, 82) R (47)
MRC 1106-258 11:08:30.3 −26:05:06 2.43 1 28.48 R (47, 48, 49, 50)
5C 7.15 08:12:19.2 +26:30:18 2.433 8 28.12
MRC 0406-244 04:08:51.4 −24:18:17 2.44 23 29.03 H (52) OS (77) P(84) R (47, 48,49, 50) S (53) X(51)
6C**0834+4129 08:37:49.2 +41:19:54 2.442 14 27.80
8C 1536+620 15:37:09.5 +61:55:36 2.450 LR 28.25
MG 2308+0336 23:08:25.0 +03:37:04 2.457 9 28.51 M (21)
4C 12.32 08:55:21.4 +12:17:27 2.468 30 28.56
3C 257 11:23:09.4 +05:30:18 2.474 31 29.16 M (21) OS (77) S(53)
4C 23.56 21:07:14.8 +23:31:45 2.479 25, 17 28.93 CO (87) G (75)
M (21) OP (83,
76, 89) OS (78,82)
P (85) R (47) S (53)
X (90)
TXS 2332+154 23:34:58.0 +15:45:50 2.481 3 28.36
123
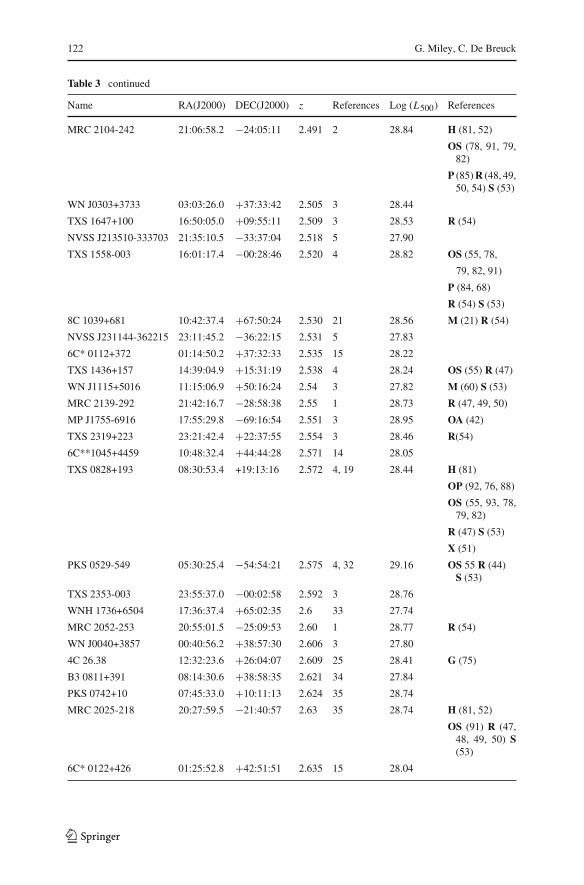
122 G. Miley, C. De Breuck
Table 3 continued
Name RA(J2000) DEC(J2000) z References Log (L500) References
MRC 2104-242 21:06:58.2 −24:05:11 2.491 2 28.84 H (81, 52)
OS (78, 91, 79,82)
P (85) R (48, 49,50, 54) S (53)
WN J0303+3733 03:03:26.0 +37:33:42 2.505 3 28.44
TXS 1647+100 16:50:05.0 +09:55:11 2.509 3 28.53 R (54)
NVSS J213510-333703 21:35:10.5 −33:37:04 2.518 5 27.90
TXS 1558-003 16:01:17.4 −00:28:46 2.520 4 28.82 OS (55, 78,
79, 82, 91)
P (84, 68)
R (54) S (53)
8C 1039+681 10:42:37.4 +67:50:24 2.530 21 28.56 M (21) R (54)
NVSS J231144-362215 23:11:45.2 −36:22:15 2.531 5 27.83
6C* 0112+372 01:14:50.2 +37:32:33 2.535 15 28.22
TXS 1436+157 14:39:04.9 +15:31:19 2.538 4 28.24 OS (55) R (47)
WN J1115+5016 11:15:06.9 +50:16:24 2.54 3 27.82 M (60) S (53)
MRC 2139-292 21:42:16.7 −28:58:38 2.55 1 28.73 R (47, 49, 50)
MP J1755-6916 17:55:29.8 −69:16:54 2.551 3 28.95 OA (42)
TXS 2319+223 23:21:42.4 +22:37:55 2.554 3 28.46 R(54)
6C**1045+4459 10:48:32.4 +44:44:28 2.571 14 28.05
TXS 0828+193 08:30:53.4 +19:13:16 2.572 4, 19 28.44 H (81)
OP (92, 76, 88)
OS (55, 93, 78,79, 82)
R (47) S (53)
X (51)
PKS 0529-549 05:30:25.4 −54:54:21 2.575 4, 32 29.16 OS 55 R (44)S (53)
TXS 2353-003 23:55:37.0 −00:02:58 2.592 3 28.76
WNH 1736+6504 17:36:37.4 +65:02:35 2.6 33 27.74
MRC 2052-253 20:55:01.5 −25:09:53 2.60 1 28.77 R (54)
WN J0040+3857 00:40:56.2 +38:57:30 2.606 3 27.80
4C 26.38 12:32:23.6 +26:04:07 2.609 25 28.41 G (75)
B3 0811+391 08:14:30.6 +38:58:35 2.621 34 27.84
PKS 0742+10 07:45:33.0 +10:11:13 2.624 35 28.74
MRC 2025-218 20:27:59.5 −21:40:57 2.63 35 28.74 H (81, 52)
OS (91) R (47,48, 49, 50) S(53)
6C* 0122+426 01:25:52.8 +42:51:51 2.635 15 28.04
123

Distant radio galaxies and their environments 123
Table 3 continued
Name RA(J2000) DEC(J2000) z References Log (L500) References
MRC 0140-257 01:42:41.2 −25:30:34 2.64 1 28.44 H (52) OS (91)
R (47, 48, 49,50) S
TN J1941-1952 19:41:00.1 −19:52:14 2.667 22 28.85
PKS 1357+007 14:00:21.4 +00:30:19 2.671 4 28.72 OS (55) R (54)
NVSS J233034-330009 23:30:34.5 −33:00:12 2.675 13 28.23
7C 1758+6719 17:58:47.2 +67:19:46 2.70 10 27.99
TXS 2202+128 22:05:14.3 +13:05:34 2.704 4 28.54 H (52) OA (42)
OS (55) R (47)
S (53)
NVSS J094925-200518 09:49:25.8 −20:05:18 2.706 27 27.25a
6C**1102+4329 11:05:43.1 +43:13:25 2.734 14 28.17
TXS 1545-234 15:48:17.5 −23:37:02 2.754 4 28.74 OA (42)OS (55)R (47)
NVSS J152435-352623 15:24:35.4 −35:26:22 2.760 13 28.48
TN J0920-0712 09:20:22.3 −07:12:18 2.762 3 28.48
MG 1019+0534 10:19:33.3 +05:34:35 2.765 9 28.57 M (21) R (54)S (53)
NVSS J111921-363139 11:19:21.8 −36:31:39 2.769 13 29.39
TXS 0417-181 04:19:43.6 −18:01:56 2.770 4 28.64 R (47) OS (55)
NVSS J213637-340318 21:36:38.4 −34:03:21 2.770 13 28.39
WNR J1338+3532 13:38:15.1 +35:32:04 2.772 3 28.42 R (54)
7C 1807+6719 18:07:13.4 +67:19:42 2.78 10 27.99
4C +44.02 00:36:53.5 +44:43:21 2.790 11 28.98
NVSS J140223-363539 14:02:23.6 −36:35:42 2.804 13 28.34
WNH 1821+6117 18:22:18.8 +61:18:37 2.81 33 27.94
4C +03.16 09:00:14.3 +03:24:08 2.814 4 28.48
6C**0824+5344 08:27:58.9 +53:34:15 2.824 14 28.27
NVSS J094552-201441 09:45:51.0 −20:14:47 2.829 27 27.12a
NVSS J095357-203652 09:53:57.4 −20:36:51 2.829 27 27.18a
WNH 1717+6827 17:16:56.4 +68:24:02 2.84 33 27.98
MG 0148+1028 01:48:28.9 +10:28:21 2.845 9 28.56
MRC 0052-241 00:54:29.8 −23:51:30 2.86 1 28.77 P (69)
B2 1132+37 11:35:05.9 +37:08:41 2.88 17 28.71 R (54)
4C 24.28 13:48:14.8 +24:15:50 2.889 25 29.05 G (75) H (81)
M (21) R (47,80) S (53)
TXS 0134+251 01:37:07.0 +25:21:19 2.897 3 28.57
NVSS J213238-335318 21:32:39.0 −33:53:19 2.900 13 28.60
4C 28.58 23:51:59.1 +29:10:29 2.905 25 28.91 G (75) R (80)S (53)
123

124 G. Miley, C. De Breuck
Table 3 continued
Name RA(J2000) DEC(J2000) z References Log (L500) References
MRC 0943-242 09:45:32.8 −24:28:50 2.922 1, 19 28.62 H (81, 52)OA (95, 72, 73)OP (76) OS (78,79, 83) P (69,68) R (47, 49)S (53)
B3 0744+464 07:47:43.7 +46:18:58 2.926 29 28.87 R (47) OS (77)
NVSS J151020-352803 15:10:20.8 −35:28:03 2.937 13 28.35
TXS 0952-217 09:54:29.5 −21:56:53 2.950 27 28.08a
WNH 1758+5821 17:58:48.0 +58:21:41 2.96 33 27.98
6C* 0020+440 00:23:08.5 +44:48:23 2.988 15 28.49
WN J0747+3654 07:47:29.4 +36:54:38 2.992 3 28.14 M (60) S (53)
6C**0743+5019 07:58:06.0 +50:11:03 2.996 14 28.41
WN J0231+3600 02:31:11.5 +36:00:27 3.080 3 28.20 M (60)
WN J1053+5424 10:53:36.3 +54:24:42 3.083 22 28.55
B3 J2330+3927 23:30:24.9 +39:27:11 3.086 36 28.33 CO (36) HI (36)
M (59, 60)
R (96) S (53)
TN J1112-2948 11:12:23.9 −29:48:06 3.09 3 28.76 M (60)
NVSS J095751-213321 09:57:51.3 −21:33:21 3.126 27 28.11a
MRC 0316-257 03:18:12.1 −25:35:10 3.142 2 28.95 H (52) M (60)
OS (77) P (97, 98,68, 99) R (47,48, 49, 50)S (53)
WN J0617+5012 06:17:39.4 +50:12:55 3.153 3 28.02 M (60) S (53)
MRC 0251-273 02:53:16.7 −27:09:10 3.16 1 28.54 M (60) S (53)
WN J1123+3141 11:23:55.9 +31:41:26 3.216 3 28.51 M (60)S (53)
NVSS J230123-364656 23:01:23.5 −36:46:56 3.220 5 28.34 M (60)
6CE 1232+3942 12:35:04.8 +39:25:39 3.221 12 28.99 M (100, 21)
R (47) OS (77)S (53)
WNH 1702+6042 17:03:36.2 +60:38:52 3.223 33 28.23 M (60)
NVSS J232100-360223 23:21:00.6 −36:02:25 3.320 5 28.226C**0832+5443 08:36:09.9 +54:33:26 3.341 14 28.24
B2 0902+34 09:05:30.1 +34:07:57 3.395 37 28.78 H (81) HI (101,102, 103, 104,105) M (106,21) OS (107, 77,108) S (53)
NVSS J094724-210505 09:47:24.5 −21:05:06 3.377 27 27.43a
NVSS J095438-210425 09:54:38.4 −21:04:25 3.431 27 28.13a
NVSS J231402-372925 23:14:02.4 −37:29:27 3.450 5 28.83
TN J0205+2242 02:05:10.7 +22:42:50 3.506 3 28.46 M (60) S (53)
123

Distant radio galaxies and their environments 125
Table 3 continued
Name RA(J2000) DEC(J2000) z References Log (L500) References
TN J0121+1320 01:21:42.7 +13:20:58 3.517 3 28.49 CO (109) M (60)OA (110) S (53)
6C 1909+72 19:08:23.7 +72:20:12 3.537 3 29.12 CO (111)M (112, 113)
R (114) S (53)
4C 1243+036 12:45:38.4 +03:23:20 3.560 38, 19 29.23 H (81) M (21)OP (115)
OS (116, 117)S (53)
WN J1911+6342 19:11:49.5 +63:42:10 3.590 3 28.14 M (60) S (53)
MG 2141+192 21:44:07.5 +19:29:15 3.592 9 29.08 H (81) M (118263)
R (47) S (53)
6C* 0032+412 00:34:53.1 +41:31:32 3.658 15 28.75 M (5) S (119)
TN J1049-1258 10:49:06.2 −12:58:19 3.697 22 28.94
4C 60.07 05:12:54.8 +60:30:51 3.791 25 29.20 CO (237, 120)
G (121) M (5,299, 263)
OS (264) S (53)
4C 41.17 06:50:52.2 +41:30:31 3.792 39, 40 29.18 CO (122, 123
124, 125) G(126, 50)
H (127) M (128,54, 21, 299)
N (129) OS (77,130, 131)
P (132, 133)R (47, 134)
S (53) X (135)
TN J2007-1316 20:07:53.2 −13:16:44 3.837 22 29.13 M (60) S (53)
NVSS J231727-352606 23:17:27.4 −35:26:07 3.874 5 28.71
NVSS J021308-322338 02:13:08.0 −32:23:40 3.976 5 28.40
TN J1338-1942 13:38:26.1 −19:42:30 4.105 41, 42 28.70 M (60) OA (42)
OS (136) P (137,138, 139, 140,141, 142)
R (246)
S (53)
TN J1123-2154 11:23:10.2 −21:54:05 4.109 3 28.45 M (60)
8C 1435+63 14:36:39.0 +63:19:04 4.251 43 29.40 G (143) M (21,144, 299)
R (47) S (53)
6C 0140+326 01:43:43.8 +32:53:49 4.413 44, 3 28.73 M (21) S (53)
123
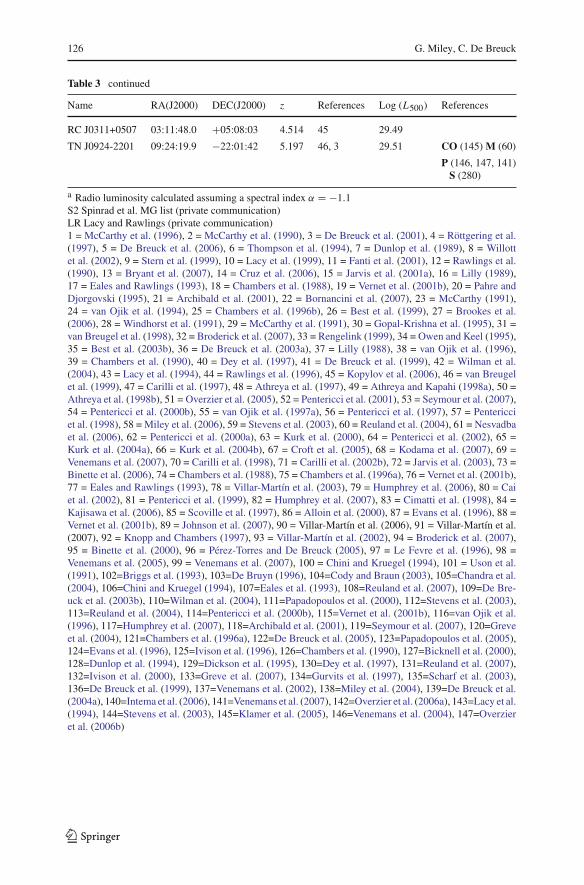
126 G. Miley, C. De Breuck
Table 3 continued
Name RA(J2000) DEC(J2000) z References Log (L500) References
RC J0311+0507 03:11:48.0 +05:08:03 4.514 45 29.49
TN J0924-2201 09:24:19.9 −22:01:42 5.197 46, 3 29.51 CO (145) M (60)
P (146, 147, 141)S (280)
a Radio luminosity calculated assuming a spectral index α = −1.1S2 Spinrad et al. MG list (private communication)LR Lacy and Rawlings (private communication)1 = McCarthy et al. (1996), 2 = McCarthy et al. (1990), 3 = De Breuck et al. (2001), 4 = Röttgering et al.(1997), 5 = De Breuck et al. (2006), 6 = Thompson et al. (1994), 7 = Dunlop et al. (1989), 8 = Willottet al. (2002), 9 = Stern et al. (1999), 10 = Lacy et al. (1999), 11 = Fanti et al. (2001), 12 = Rawlings et al.(1990), 13 = Bryant et al. (2007), 14 = Cruz et al. (2006), 15 = Jarvis et al. (2001a), 16 = Lilly (1989),17 = Eales and Rawlings (1993), 18 = Chambers et al. (1988), 19 = Vernet et al. (2001b), 20 = Pahre andDjorgovski (1995), 21 = Archibald et al. (2001), 22 = Bornancini et al. (2007), 23 = McCarthy (1991),24 = van Ojik et al. (1994), 25 = Chambers et al. (1996b), 26 = Best et al. (1999), 27 = Brookes et al.(2006), 28 = Windhorst et al. (1991), 29 = McCarthy et al. (1991), 30 = Gopal-Krishna et al. (1995), 31 =van Breugel et al. (1998), 32 = Broderick et al. (2007), 33 = Rengelink (1999), 34 = Owen and Keel (1995),35 = Best et al. (2003b), 36 = De Breuck et al. (2003a), 37 = Lilly (1988), 38 = van Ojik et al. (1996),39 = Chambers et al. (1990), 40 = Dey et al. (1997), 41 = De Breuck et al. (1999), 42 = Wilman et al.(2004), 43 = Lacy et al. (1994), 44 = Rawlings et al. (1996), 45 = Kopylov et al. (2006), 46 = van Breugelet al. (1999), 47 = Carilli et al. (1997), 48 = Athreya et al. (1997), 49 = Athreya and Kapahi (1998a), 50 =Athreya et al. (1998b), 51 = Overzier et al. (2005), 52 = Pentericci et al. (2001), 53 = Seymour et al. (2007),54 = Pentericci et al. (2000b), 55 = van Ojik et al. (1997a), 56 = Pentericci et al. (1997), 57 = Pentericciet al. (1998), 58 = Miley et al. (2006), 59 = Stevens et al. (2003), 60 = Reuland et al. (2004), 61 = Nesvadbaet al. (2006), 62 = Pentericci et al. (2000a), 63 = Kurk et al. (2000), 64 = Pentericci et al. (2002), 65 =Kurk et al. (2004a), 66 = Kurk et al. (2004b), 67 = Croft et al. (2005), 68 = Kodama et al. (2007), 69 =Venemans et al. (2007), 70 = Carilli et al. (1998), 71 = Carilli et al. (2002b), 72 = Jarvis et al. (2003), 73 =Binette et al. (2006), 74 = Chambers et al. (1988), 75 = Chambers et al. (1996a), 76 = Vernet et al. (2001b),77 = Eales and Rawlings (1993), 78 = Villar-Martín et al. (2003), 79 = Humphrey et al. (2006), 80 = Caiet al. (2002), 81 = Pentericci et al. (1999), 82 = Humphrey et al. (2007), 83 = Cimatti et al. (1998), 84 =Kajisawa et al. (2006), 85 = Scoville et al. (1997), 86 = Alloin et al. (2000), 87 = Evans et al. (1996), 88 =Vernet et al. (2001b), 89 = Johnson et al. (2007), 90 = Villar-Martín et al. (2006), 91 = Villar-Martín et al.(2007), 92 = Knopp and Chambers (1997), 93 = Villar-Martín et al. (2002), 94 = Broderick et al. (2007),95 = Binette et al. (2000), 96 = Pérez-Torres and De Breuck (2005), 97 = Le Fevre et al. (1996), 98 =Venemans et al. (2005), 99 = Venemans et al. (2007), 100 = Chini and Kruegel (1994), 101 = Uson et al.(1991), 102=Briggs et al. (1993), 103=De Bruyn (1996), 104=Cody and Braun (2003), 105=Chandra et al.(2004), 106=Chini and Kruegel (1994), 107=Eales et al. (1993), 108=Reuland et al. (2007), 109=De Bre-uck et al. (2003b), 110=Wilman et al. (2004), 111=Papadopoulos et al. (2000), 112=Stevens et al. (2003),113=Reuland et al. (2004), 114=Pentericci et al. (2000b), 115=Vernet et al. (2001b), 116=van Ojik et al.(1996), 117=Humphrey et al. (2007), 118=Archibald et al. (2001), 119=Seymour et al. (2007), 120=Greveet al. (2004), 121=Chambers et al. (1996a), 122=De Breuck et al. (2005), 123=Papadopoulos et al. (2005),124=Evans et al. (1996), 125=Ivison et al. (1996), 126=Chambers et al. (1990), 127=Bicknell et al. (2000),128=Dunlop et al. (1994), 129=Dickson et al. (1995), 130=Dey et al. (1997), 131=Reuland et al. (2007),132=Ivison et al. (2000), 133=Greve et al. (2007), 134=Gurvits et al. (1997), 135=Scharf et al. (2003),136=De Breuck et al. (1999), 137=Venemans et al. (2002), 138=Miley et al. (2004), 139=De Breuck et al.(2004a), 140=Intema et al. (2006), 141=Venemans et al. (2007), 142=Overzier et al. (2006a), 143=Lacy et al.(1994), 144=Stevens et al. (2003), 145=Klamer et al. (2005), 146=Venemans et al. (2004), 147=Overzieret al. (2006b)
123

Distant radio galaxies and their environments 127
Table 4 HzRGs in order of right ascencion
Name z Name z Name z
MG 0001+0846 2.360 5C 7.271 2.224 MG 1401+0921 2.093
PKS 0011-023 2.080 TXS 0828+193 2.572 NVSS J140223-363539 2.804
MRC 0015-229 2.010 6C**0832+5443 3.341 4C -00.54 2.360
6C* 0020+440 2.988 6C**0834+4129 2.442 PKS 1425-148 2.355
NVSS J002402-325253 2.043 LBDS 65W172 2.551 8C 1435+63 4.251
6C* 0024+356 2.161 4C 12.32 2.468 TXS 1436+157 2.538
4C 40.02 2.428 6C**0854+3500 2.382 NVSS J144932-385657 2.152
MRC 0030-219 2.168 4C 40.22 2.280 NVSS J151020-352803 2.937
6C* 0032+412 3.658 4C +03.16 2.814 NVSS J152435-352623 2.760
4C +44.02 2.790 6C 0901+54 2.249 8C 1536+620 2.450
WN J0040+3857 2.606 B2 0902+34 3.395 TXS 1545-234 2.754
MRC 0052-241 2.860 TN J0920-0712 2.762 TXS 1558-003 2.520
6C* 0106+397 2.284 TN J0924-2201 5.197 TXS 1647+100 2.509
6C* 0112+372 2.535 6C 0930+389 2.395 WNH 1702+6042 3.223
6C* 0115+394 2.241 MG 0936+0503 2.306 TXS 1707+105 2.349
6C* 0118+486 2.350 MRC 0943-242 2.922 LBDS 53W002 2.390
TN J0121+1320 3.517 NVSS J094552-201441 2.829 WNH 1717+6827 2.840
6C* 0122+426 2.635 NVSS J094724-210505 3.377 WNH 1736+6504 2.600
BRL 0128-264 2.348 NVSS J094925-200518 2.706 7C 1736+650 2.400
TXS 0134+251 2.897 NVSS J094925-203724 2.427 7C 1740+6640 2.100
6C* 0135+313 2.199 NVSS J094949-213432 2.354 MG 1747+1821 2.281
MRC 0140-257 2.640 NVSS J095226-200105 2.421 MP J1755-6916 2.551
6C 0140+326 4.413 NVSS J095357-203652 2.829 7C 1758+6719 2.700
6C* 0142+427 2.225 TXS 0952-217 2.950 WNH 1758+5821 2.960
MG 0148+1028 2.845 NVSS J095438-210425 3.431 MP J1758-6738 2.026
6C* 0152+463 2.279 NVSS J095751-213321 3.126 7C 1802+6456 2.110
MRC 0156-252 2.016 NVSS J101008-383629 2.236 7C 1807+6719 2.780
TXS 0200+015 2.229 MG 1019+0534 2.765 4C 40.36 2.265
TN J0205+2242 3.506 TN J1033-1339 2.425 WNH 1821+6117 2.810
NVSS J021308-322338 3.976 NVSS J103615-321659 2.144 6C 1909+72 3.537
TXS 0211-122 2.340 8C 1039+681 2.530 WN J1911+6342 3.590
TXS 0214+183 2.131 6C**1045+4459 2.571 4C 48.48 2.343
WN J0231+3600 3.080 TN J1049-1258 3.697 TN J1941-1952 2.667
MRC 0251-273 3.160 WN J1053+5424 3.083 TN J2007-1316 3.837
WN J0303+3733 2.505 B2 1056+39 2.171 MRC 2025-218 2.630
RC J0311+0507 4.514 TN J1102-1651 2.111 TXS 2034+027 2.129
MRC 0316-257 3.142 6C**1102+4329 2.734 MRC 2036-254 2.000
MP J0340-6507 2.289 MRC 1106-258 2.430 MRC 2048-272 2.060
MRC 0349-211 2.329 6C 1106+380 2.290 MRC 2052-253 2.600
TXS 0355-037 2.153 TN J1112-2948 3.090 MRC 2104-242 2.491
MRC 0406-244 2.440 WN J1115+5016 2.540 4C 23.56 2.479
123

128 G. Miley, C. De Breuck
Table 4 continued
Name z Name z Name z
TXS 0417-181 2.770 TXS 1113-178 2.239 NVSS J213238-335318 2.900
TXS 0448+091 2.037 4C 34.34 2.400 NVSS J213510-333703 2.518
TN J0452-1737 2.260 NVSS J111921-363139 2.769 NVSS J213637-340318 2.770
4C 60.07 3.791 3C 257 2.474 MRC 2139-292 2.550
PKS 0529-549 2.575 TN J1123-2154 4.109 MG 2141+192 3.592
WN J0617+5012 3.153 WN J1123+3141 3.216 TXS 2202+128 2.704
6C 0629+53 2.246 B2 1132+37 2.880 TNR 2254+1857 2.154
4C 41.17 3.792 6C 1134+369 2.125 NVSS J230123-364656 3.220
B3 0731+438 2.429 MRC 1138-262 2.156 4C +40.49 2.140
PKS 0742+10 2.624 B2 1159+39A 2.370 MG 2308+0336 2.457
WN J0747+3654 2.992 B3 1204+401 2.066 NVSS J231144-362215 2.531
B3 0744+464 2.926 4C 26.38 2.609 NVSS J231402-372925 3.450
6C**0746+5445 2.156 6C 1232+3942 3.221 NVSS J231727-352606 3.874
TXS 0748+134 2.419 WN J1242+3915 2.131 NVSS J232100-360223 3.320
6C**0743+5019 2.996 4C 1243+036 3.560 TXS 2319+223 2.554
4C +39.21 2.119 MG 1251+1104 2.322 NVSS J232651-370909 2.357
5C 7.10 2.185 MRC 1324-262 2.280 B3 J2330+3927 3.086
5C 7.15 2.433 WNR J1338+3532 2.772 NVSS J233034-330009 2.675
B3 0811+391 2.621 TN J1338-1942 4.105 TXS 2332+154 2.481
5C 7.223 2.092 4C 24.28 2.889 MG 2348+0507 2.019
6C**0824+5344 2.824 4C +43.31 2.149 4C 28.58 2.905
5C 7.269 2.218 PKS 1357+007 2.671 TXS 2353-003 2.592
References
Allen MG, Dopita MA, Tsvetanov ZI (1998) Ultraviolet Diagnostics for the Emission-Line Gas in ActiveGalaxies. Astrophys J 493:571 doi:10.1086/305145, arXiv:astro-ph/9801040
Aller LH (ed) (1984) Physics of thermal gaseous nebulae. astrophysics and space science library, vol 112Alloin D, Barvainis R, Guilloteau S (2000) New CO and millimetre continuum observations of the
Z = 2.394 radio galaxy 53W002. Astrophys J Lett 528:L81–L84. doi:10.1086/312429, arXiv:astro-ph/9910196
Antonucci R (1993) Unified models for active galactic nuclei and quasars. ARA& A 31:473–521. doi:10.1146/annurev.aa.31.090193.002353
Archibald EN, Dunlop JS, Hughes DH, Rawlings S, Eales SA, Ivison RJ (2001) A submillimetre survey ofthe star formation history of radio galaxies. Mon Not Roy Astro Soc 323:417–444
Armus L, Heckman TM, Miley GK (1990) The optical emission-line nebulae of powerful far-infraredgalaxies. Astrophys J 364:471–495. doi:10.1086/169431
Arnaboldi M, Neeser MJ, Parker LC, Rosati P, Lombardi M, Dietrich JP, Hummel W (2007) ESO PublicSurveys with the VST and VISTA. The Messenger 127:28
Athreya RM, Kapahi VK (1998) The redshift dependence of spectral index in powerful radio galaxies.J Astrophys Astro 19:63–77
Athreya RM, Kapahi VK, McCarthy PJ, van Breugel W (1997) Steep- spectrum radio cores in high-redshiftgalaxies. Mon Not Roy Astro Soc 289:525–534
Athreya RM, Kapahi VK, McCarthy PJ, van Breugel W (1998) Large rotation measures in radio galaxiesat Z > 2. Astron Astrophys 329:809–820
123

Distant radio galaxies and their environments 129
Baade W, Minkowski R (1954) Identification of the radio sources in Cassiopeia, Cygnus a, and Puppis a.Astrophys J 119:206
Baugh CM, Cole S, Frenk CS, Lacey CG (1998) The epoch of galaxy formation. Astrophys J 498:504.doi:10.1086/305563, arXiv:astro-ph/9703111
Bavdaz M, Lumb D, Gondoin P, Lyngvi A, Rando N, Peacock T, van der Laan T, Wallace K, Mieremet A,Oemrawsingh S, Beijersbergen M, Collon M, Kraft S, Graue R, Kampf D, Freyberg M (2006) TheXEUS X-ray telescope. In: Space Telescopes and instrumentation II: Ultraviolet to gamma ray. Editedby Turner, MJL, Hasinger G (eds) Proceedings of the SPIE. Presented at the Society of photo-opticalInstrumentation engineers (SPIE) conference, vol. 62663, pp. 62661. doi:10.1117/12.670240
Begelman MC, Cioffi DF (1989) Overpressured cocoons in extragalactic radio sources. Astrophys J Lett345:L21–L24. doi:10.1086/185542
Belsole E, Worrall DM, Hardcastle MJ, Birkinshaw M, Lawrence CR (2004) XMM-Newton observationsof three high-redshift radio galaxies. Mon Not Roy Astro Soc 352:924–938. doi:10.1111/j.1365-2966.2004.07983.x, arXiv:astro-ph/0405116
Best PN (2007) Feedback from radio-loud AGN. New Astro Rev 51:168–173. doi:10.1016/j.newar.2006.11.014
Best PN, Longair MS, Röttgering HJA (1998) HST, radio and infrared observations of 28 3CR radio galax-ies at redshift z ∼ 1. II—Old stellar populations in central cluster galaxies. Mon Not Roy Astro Soc295:549, arXiv:astro-ph/9709195
Best PN, Röttgering HJA, Lehnert MD (1999) A 98 per cent spectroscopically complete sample of the mostpowerful equatorial radio sources at 408 MHz. Mon Not Roy Astro Soc 310:223–254, arXiv:astro-ph/9903471
Best PN, Röttgering HJA, Longair MS (2000) Ionisation, shocks and evolution of the emission-line gas ofdistant 3CR radio galaxies. Mon Not Roy Astro Soc 311:23–36. arXiv:astro-ph/9908211
Best PN, Lehnert MD, Miley GK, Röttgering HJA (2003a) Red galaxy overdensities and the varied clusterenvironments of powerful radio sources with z ∼ 1.6. Mon Not Roy Astro Soc 343:1–21. doi:10.1046/j.1365-8711.2003.06667.x, arXiv:astro-ph/0304035
Best PN, Peacock JA, Brookes MH, Dowsett RE, Röttgering HJA, Dunlop JS, Lehnert MD (2003b) The finaltwo redshifts for radio sources from the equatorial BRL sample. Mon Not Roy Astro Soc 346:1021–1024. doi:10.1111/j.1365-2966.2003.07156.x, arXiv:astro-ph/0309081
Best PN, Kauffmann G, Heckman TM, Brinchmann J, Charlot S, Ivezic Ž, White SDM (2005) The hostgalaxies of radio-loud active galactic nuclei: mass dependences, gas cooling and active galactic nucleifeedback. Mon Not Roy Astro Soc 362:25–40. doi:10.1111/j.1365-2966.2005.09192.x, arXiv:astro-ph/0506269
Bicknell GV, Sutherland RS, van Breugel WJM, Dopita MA, Dey A, Miley GK (2000) Jet-induced Emis-sion-Line Nebulosity and Star Formation in the High-Redshift Radio Galaxy 4C 41.17. AstrophysJ 540:678–686. doi:10.1086/309343, arXiv:astro-ph/9909218
Binette L, Kurk JD, Villar-Martín M, Röttgering HJA (2000) A vestige low metallicity gas shell surroundingthe radio galaxy 0943-242 at z = 2.92. Astron Astrophys 356:23–32. astro-ph/0002210
Binette L, Wilman RJ, Villar-Martín M, Fosbury RAE, Jarvis MJ, Röttgering HJA (2006) Ionisation oflarge-scale absorbing haloes and feedback events from high-redshift radio galaxies. Astron Astrophys459:31–42. doi:10.1051/0004-6361:20065079, astro-ph/0607289
Blandford RD (2001) Black holes and relativistic jets. Prog Theor Phys Suppl 143:182–201. arXiv:astro-ph/0110394
Blumenthal G, Miley G (1979) Spectral index dependent properties of steep spectrum radio sources. AstronAstrophys 80:13–21
Blundell KM, Rawlings S (1999) The inevitable youthfulness of known high-redshift radio galaxies. Nature399:330–332. astro-ph/9905333
Blundell KM, Rawlings S (2000) The Spectra and Energies of Classical Double Radio Lobes. AstronJ 119:1111–1122. doi:10.1086/301254, arXiv:astro-ph/0001327
Blundell KM, Rawlings S, Eales SA, Taylor GB, Bradley AD (1998) A sample of 6C radio sources designedto find objects at redshift z>4 - I. The radio data. Mon Not Roy Astro Soc 295:265–279. arXiv:astro-ph/9707336
Blundell KM, Fabian AC, Crawford CS, Erlund MC, Celotti A (2006) Discovery of the Low-Energy Cutoffin a Powerful Giant Radio Galaxy. Astrophys J Lett 644:L13–L16. doi:10.1086/504839, arXiv:astro-ph/0605391
123

130 G. Miley, C. De Breuck
Bornancini CG, De Breuck C, de Vries W, Croft S, van Breugel W, Röttgering H, Minniti D (2007) Imagingand spectroscopy of ultrasteep spectrum radio sources. Mon Not Roy Astro Soc 378:551–562. doi:10.1111/j.1365-2966.2007.11769.x, arXiv:astro-ph/0703664
Briggs FH, Sorar E, Taramopoulos A (1993) Arecibo observation of B2 0902 + 343 in the 21 CentimeterLine at Redshift 3.4. Astrophys J Lett 415:L99. doi:10.1086/187042
Broderick JW, De Breuck C, Hunstead RW, Seymour N (2007) An extreme rotation measure in thehigh-redshift radio galaxy PKS B0529-549. Mon Not Roy Astro Soc 375:1059–1069. doi:10.1111/j.1365-2966.2006.11375.x, arXiv:astro-ph/0612143
Brookes MH, Best PN, Rengelink R, Röttgering HJA (2006) CENSORS: a combined EIS-NVSS survey ofradio sources—II. Infrared imaging and the K–z relation. Mon Not Roy Astro Soc 366:1265–1288.doi:10.1111/j.1365-2966.2005.09916.x, arXiv:astro-ph/0603655
Brown RL, Wild W, Cunningham C (2004) ALMA-the Atacama large millimetre array. Advances in SpaceResearch 34:555–559. doi:10.1016/j.asr.2003.03.028
Bruzual AG (2007) On TP-AGB stars and the mass of galaxies. ArXiv Astrophysics e-prints astro-ph/0703052
Bryant J, Broderick J, Johnston H, Hunstead R, Gaensler B, De Breuck C (2007) A new search for distantradio galaxies in the southern hemisphere- II. K-band imaging and optical spectroscopy. Mon NotRoy Astro Soc
Buchalter A, Helfand DJ, Becker RH, White RL (1998) Constraining Omega 0 with the Angular Size–Redshift Relation of Double-lobed Quasars in the FIRST Survey. Astrophys J 494:503. doi:10.1086/305236, arXiv:astro-ph/9709174
Cai Z, Nan R, Schilizzi RT, Miley GK, Bremer MAR, van Dam B, Röttgering HJA, Liang H, ChambersKC, Gurvits LI, Zhang HY (2002) A 327 MHz VLBI study of high redshift radio galaxies 1345+245,1809 + 407 and 2349 + 289. Astron Astrophys 381:401–407. doi:10.1051/0004-6361:20011579
Carilli CL (2006) HI 21 cm probes of reionisation, and beyond. New Astro Review 50:162–172. doi:10.1016/j.newar.2005.11.031, arXiv:astro-ph/0509055
Carilli CL, Owen FN, Harris DE (1994) Radio continuum polarimetric imaging of high redshift radiogalaxies. Astron J 107:480–493. doi:10.1086/116870
Carilli CL, Röttgering HJA, van Ojik R, Miley GK, van Breugel WJM (1997) Radio Continuum Imag-ing of High-Redshift Radio Galaxies. Astrophys J Suppl 109:1. doi:10.1086/312973, arXiv:astro-ph/9610157
Carilli CL, Harris DE, Pentericci L, Rottergering HJA, Miley GK, Bremer MN (1998) An X-Ray Clusterat Redshift 2.156? Astrophys J Lett 494:L143. doi:10.1086/311199, arXiv:astro-ph/9802066
Carilli CL, Gnedin NY, Owen F (2002a) H I 21 Centimeter Absorption beyond the Epoch of Reionisation.Astrophys J 577:22–30. doi:10.1086/342179, arXiv:astro-ph/0205169
Carilli CL, Harris DE, Pentericci L, Röttgering HJA, Miley GK, Kurk JD, van Breugel W (2002b) TheX-Ray-Radio Alignment in the z = 2.2 Radio Galaxy PKS 1138-262. Astrophys J 567:781–789.doi:10.1086/338669, arXiv:astro-ph/0111193
Chambers KC, Miley GK, van Breugel W (1987) Alignment of radio and optical orientations in high-redshiftradio galaxies. Nature 329:604–606. doi:10.1038/329604a0
Chambers KC, Miley GK, van Breugel WJM (1988) 4C 40.36 - A radio galaxy at a redshift of 2.3. AstrophysJ Lett 327:L47–L50. doi:10.1086/185137
Chambers KC, Miley GK, van Breugel WJM (1990) 4C 41.17 - A radio galaxy at a redshift of 3.8. AstrophysJ 363:21–39. doi:10.1086/169316
Chambers KC, Miley GK, van Breugel WJM, Bremer MAR, Huang JS, Trentham NA (1996a) Ultra–Steep-Spectrum Radio Sources. II. Radio, Infrared, Optical, and HST Imaging of High-Redshift 4C Objects.Astrophys J Suppl 106:247. doi:10.1086/192338
Chambers KC, Miley GK, van Breugel WJM, Huang JS (1996b) Ultra–Steep-Spectrum Radio Sources. I.4C Objects. Astrophys J Suppl 106:215. doi:10.1086/192337
Chandra P, Swarup G, Kulkarni VK, Kantharia NG (2004) Associated HI Absorption in the z = 3.4 RadioGalaxy B2 0902 + 343 Observed with the GMRT. J Astrophys Astro 25:57. arXiv:astro-ph/0407380
Chapman SC, Lewis GF, Scott D, Richards E, Borys C, Steidel CC, Adelberger KL, Shapley AE (2001)Submillimetre imaging of a protocluster region at Z = 3.09. Astrophys J Lett 548:L17–L21. doi:10.1086/318919, arXiv:astro-ph/0010101
Chini R, Kruegel E (1994) Dust at high Z. Astron Astrophys 288:L33–L36Cimatti A, di Serego-Alighieri S, Fosbury RAE, Salvati M, Taylor D (1993) Optical Polarisation in Distant
Radio Galaxies. Mon Not Roy Astro Soc 264:421
123

Distant radio galaxies and their environments 131
Cimatti A, di Serego Alighieri S, Vernet J, Cohen M, Fosbury RAE (1998) The UV Radiation from Zapproximately 2.5 Radio Galaxies: Keck Spectropolarimetry of 4C 23.56 and 4C 00.54. AstrophysJ Lett 499:L21. doi:10.1086/311354, arXiv:astro-ph/9803311
Cody AM, Braun R (2003) Observations of the high-redshift galaxy B2 0902 + 343 at 92 cm. AstronAstrophys 400:871–875. doi:10.1051/0004-6361:20030082, arXiv:astro-ph/0301418
Cohen AS, Lane WM, Cotton WD, Kassim NE, Lazio TJW, Perley RA, Condon JJ, Erickson WC (2007)The VLA low-frequency sky survey. Astron J 134:1245–1262. doi:10.1086/520719, arXiv:0706.1191
Colbert JW, Teplitz H, Francis P, Palunas P, Williger GM, Woodgate B (2006) Ultraviolet-bright,high-redshift ultraluminous infrared galaxies. Astrophys J Lett 637:L89–L92. doi:10.1086/500647,arXiv:astro-ph/0512583
Condon JJ, Cotton WD, Greisen EW, Yin QF, Perley RA, Taylor GB, Broderick JJ (1998) The NRAO VLAsky survey. Astron J 115:1693–1716. doi:10.1086/300337
Conti PS, Leitherer C, Vacca WD (1996) Hubble space telescope ultraviolet spectroscopy of NGC 1741:a nearby template for distant energetic starbursts. Astrophys J Lett 461:L87. doi:10.1086/310005,arXiv:astro-ph/9602084
Cowie LL, Songaila A, Hu EM, Cohen JG (1996) New insight on galaxy formation and evolution fromKeck spectroscopy of the Hawaii deep fields. Astron J 112:839. doi:10.1086/118058, arXiv:astro-ph/9606079
Croft S, Kurk J, van Breugel W, Stanford SA, de Vries W, Pentericci L, Röttgering H (2005) The filamentarylarge-scale structure around the z = 2.16 radio galaxy PKS 1138-262. Astron J 130:867–872. doi:10.1086/431956, arXiv:astro-ph/0505354
Croft S, van Breugel W, de Vries W, Dopita M, Martin C, Morganti R, Neff S, Oosterloo T, Schiminovich D,Stanford SA, van Gorkom J (2006) Minkowski’s object: a starburst triggered by a radio jet, revisited.Astrophys J 647:1040–1055. doi:10.1086/505526, arXiv:astro-ph/0604557
Croton DJ, Springel V, White SDM, De Lucia G, Frenk CS, Gao L, Jenkins A, Kauffmann G, NavarroJF, Yoshida N (2006) The many lives of active galactic nuclei: cooling flows, black holes and theluminosities and colours of galaxies. Mon Not Roy Astro Soc 365:11–28. doi:10.1111/j.1365-2966.2005.09675.x, arXiv:astro-ph/0508046
Cruz MJ, Jarvis MJ, Blundell KM, Rawlings S, Croft S, Klöckner HR, McLure RJ, Simpson C, TargettTA, Willott CJ (2006) The 6C** sample of steep-spectrum radio sources—I. Radio data, near-infraredimaging and optical spectroscopy. Mon Not Roy Astro Soc 373:1531–1562. doi:10.1111/j.1365-2966.2006.11101.x, arXiv:astro-ph/0609790
Daly RA, Guerra EJ (2002) Quintessence, Cosmology, and Fanaroff-Riley Type IIb Radio Galaxies. AstronJ 124:1831–1838. doi:10.1086/342741, arXiv:astro-ph/0209503
De Breuck C, Reuland M (2005) Star formation in high redshift radio galaxies. In: Bender R, Renzini A(eds) Multiwavelength mapping of galaxy formation and evolution, p 374. doi:10.1007/10995020_67
De Breuck C, van Breugel W, Minniti D, Miley G, Röttgering H, Stanford SA, Carilli C (1999) VLTspectroscopy of the z = 4.11 Radio Galaxy TN J1338-1942. Astron Astrophys 352:L51–L56. ar-Xiv:astro-ph/9909178
De Breuck C, Röttgering H, Miley G, van Breugel W, Best P (2000a) A statistical study of emission linesfrom high redshift radio galaxies. Astron Astrophys 362:519–543. arXiv:astro-ph/0008264
De Breuck C, van Breugel W, Röttgering HJA, Miley G (2000b) A sample of 669 ultra steep spectrumradio sources to find high redshift radio galaxies. Astron Astrophys Suppl 143:303–333. arXiv:astro-ph/0002297
De Breuck C, van Breugel W, Röttgering H, Stern D, Miley G, de Vries W, Stanford SA, Kurk J, Overzier R(2001) Spectroscopy of ultra-steep-spectrum radio sources. Astron J 121:1241–1265. doi:10.1086/319392, arXiv:astro-ph/0012065
De Breuck C, van Breugel W, Stanford SA, Röttgering H, Miley G, Stern D (2002) Optical and near-infra-red imaging of ultra-steep-spectrum radio sources: the K–z diagram of radio-selected and opticallyselected galaxies. Astron J 123:637–677. doi:10.1086/324632, arXiv:astro-ph/0109540
De Breuck C, Neri R, Morganti R, Omont A, Rocca-Volmerange B, Stern D, Reuland M, van Breugel W,Röttgering H, Stanford SA, Spinrad H, Vigotti M, Wright M (2003a) CO emission and associated H Iabsorption from a massive gas reservoir surrounding the z = 3 radio galaxy B3 J2330 + 3927. AstronAstrophys 401:911–925. doi:10.1051/0004-6361:20030171, arXiv:astro-ph/0302154
De Breuck C, Neri R, Omont A (2003b) CO emission from /z>3 radio galaxies. New Astro Rev 47:285–289.arXiv:astro-ph/0302196
123
132 G. Miley, C. De Breuck
De Breuck C, Bertoldi F, Carilli C, Omont A, Venemans B, Röttgering H, Overzier R, Reuland M, Miley G,Ivison R, van Breugel W (2004a) A multi-wavelength study of the proto-cluster surrounding thez = 4.1 radio galaxy TN J1338-1942. Astron Astrophys 424:1–12. doi:10.1051/0004-6361:20035885,arXiv:astro-ph/0405339
De Breuck C, Hunstead RW, Sadler EM, Rocca-Volmerange B, Klamer I (2004b) A search for distant radiogalaxies from SUMSS and NVSS - I. Sample definition, radio and K-band imaging. Mon Not RoyAstro Soc 347:837–853. doi:10.1111/j.1365-2966.2004.07270.x, arXiv:astro-ph/0309814
De Breuck C, Downes D, Neri R, van Breugel W, Reuland M, Omont A, Ivison R (2005) Detection of twomassive CO systems in 4C 41.17 at z = 3.8. Astron Astrophys 430:L1–L4. doi:10.1051/0004-6361:200400115, arXiv:astro-ph/0411732
De Breuck C, Klamer I, Johnston H, Hunstead RW, Bryant J, Rocca-Volmerange B, Sadler EM (2006) Asearch for distant radio galaxies from SUMSS and NVSS—II. Optical spectroscopy. Mon Not RoyAstro Soc 366:58–72. doi:10.1111/j.1365-2966.2005.09799.x, arXiv:astro-ph/0511169
De Bruyn AG (1996) H I at High Redshift. In: Bremer MN, Malcolm N (eds) Cold Gas at High Redshift,Astrophysics and Space Science Library, vol 206, pp 171
De Lucia G, Blaizot J (2007) The hierarchical formation of the brightest cluster galaxies. Mon Not RoyAstro Soc 375:2–14. doi:10.1111/j.1365-2966.2006.11287.x, arXiv:astro-ph/0606519
de Vries WH, Becker RH, White RL (2006) Long-Term Optical Quasar Variability. In: Gaskell CM,McHardy IM, Peterson BM, Sergeev SG (eds) Astronomical Society of the Pacific conference series,vol 360, p 29
De Young DS (1989) Star formation in radio galaxies at large redshift. Astrophys J Lett 342:L59–L62.doi:10.1086/185484
Dey A, van Breugel W, Vacca WD, Antonucci R (1997) Triggered star formation in a massive galaxy atZ = 3.8: 4C 41.17. Astrophys J 490:698. doi:10.1086/304911,astro-ph/9707166
Dey A, Bian C, Soifer BT, Brand K, Brown MJI, Chaffee FH, Le Floc’h E, Hill G, Houck JR, JannuziBT, Rieke M, Weedman D, Brodwin M, Eisenhardt P (2005) Discovery of a large ∼ 200 kpc gaseousnebula at z ∼ 2.7 with the Spitzer space telescope. Astrophys J 629:654–666. doi:10.1086/430775,arXiv:astro-ph/0503632
Di Matteo T, Springel V, Hernquist L (2005) Energy input from quasars regulates the growth and activityof black holes and their host galaxies. Nature 433:604–607. doi:10.1038/nature03335, arXiv:astro-ph/0502199
di Serego Alighieri S (1997) Polarimetry with large telescopes. Rodriguez Espinosa JM, Herrero A,Sánchez F (eds) instrumentation for large telescopes, pp. 340. ISBN 0521582911. CambridgeUniversity Press, Cambridge, pp 287–329
di Serego Alighieri S, Fosbury RAE, Tadhunter CN, Quinn PJ (1989) Polarised light in high-redshift radiogalaxies. Nature 341:307–309. doi:10.1038/341307a0
Dickson R, Tadhunter C, Shaw M, Clark N, Morganti R (1995) The nebular contribution to the extendedUV continua of powerful radio galaxies. Mon Not Roy Astro Soc 273:L29–L33
Dijkstra M, Haiman Z, Spaans M (2006a) Lyα radiation from collapsing protogalaxies. I. Characteristicsof the emergent spectrum. Astrophys J 649:14–36. doi:10.1086/506243, arXiv:astro-ph/0510407
Dijkstra M, Haiman Z, Spaans M (2006b) Lyα radiation from collapsing protogalaxies. II. Observationalevidence for gas infall. Astrophys J 649:37–47. doi:10.1086/506244, arXiv:astro-ph/0510409
Dopita MA, Sutherland RS (2003) Astrophysics of the diffuse universe. Astro and astrophysics library,Springer, Berlin ISBN 3540433627
Douglas JN, Bash FN, Bozyan FA, Torrence GW, Wolfe C (1996) The Texas survey of radio sourcescovering -35.5 degrees < declination < 71.5 degrees at 365 MHz. Astron J 111:1945. doi:10.1086/117932
Downes D, Solomon PM, Radford SJE (1993) Molecular gas mass and far-infrared emission from distantluminous galaxies. Astrophys J Lett 414:L13–L16. doi:10.1086/186984
Dubinski J (1998) The Origin of the Brightest Cluster Galaxies. Astrophys J 502:141. doi:10.1086/305901,arXiv:astro-ph/9709102
Dunlop JS, Peacock JA (1990) The Redshift Cut-Off in the Luminosity Function of Radio Galaxies andQuasars. Mon Not Roy Astro Soc 247:19
Dunlop JS, Peacock JA, Savage A, Lilly SJ, Heasley JN, Simon AJB (1989) The parkes selected regions—deep optical and infrared observations of radio galaxies and quasars at high redshifts. Mon Not RoyAstro Soc 238:1171–1231
123
Distant radio galaxies and their environments 133
Dunlop JS, Hughes DH, Rawlings S, Eales SA, Ward MJ (1994) Detection of a large mass of dust in a radiogalaxy at redshift Z = 3.8. Nature 370:347. doi:10.1038/370347a0
Eales S, Rawlings S, Puxley P, Rocca-Volmerange B, Kuntz K (1993) Evidence that the Z = 3.4 radiogalaxy B2 0902 + 34 may be a protogalaxy. Nature 363:140–142. doi:10.1038/363140a0
Eales S, Rawlings S, Law-Green D, Cotter G, Lacy M (1997) A first sample of faint radio sources withvirtually complete redshifts. I—Infrared images, the Hubble diagram and the alignment effect. MonNot Roy Astro Soc 291:593. arXiv:astro-ph/9701023
Eales SA, Rawlings S (1993) Infrared spectroscopy of 11 radio galaxies at Z equals 2-4—Evidence thatsome high-redshift radio galaxies may be protogalaxies. Astrophys J 411:67–88. doi:10.1086/172808
Eales SA, Rawlings S (1996) A panoramic view of radio galaxy evolution from a redshift of 0 to a redshiftof 4.3. Astrophys J 460:68. doi:10.1086/176953
Eke VR, Cole S, Frenk CS (1996) Cluster evolution as a diagnostic for Omega. Mon Not Roy Astro Soc282:263–280. arXiv:astro-ph/9601088
Elmegreen DM, Elmegreen BG, Rubin DS, Schaffer MA (2005) Galaxy morphologies in the hubble ultradeep field: dominance of linear structures at the detection limit. Astrophys J 631:85–100. doi:10.1086/432502, arXiv:astro-ph/0508216
Erlund MC, Fabian AC, Blundell KM, Celotti A, Crawford CS (2006) Extended inverse-compton emissionfrom distant, powerful radio galaxies. Mon Not Roy Astro Soc 371:29–37. doi:10.1111/j.1365-2966.2006.10660.x, arXiv:astro-ph/0606238
Evans AS, Sanders DB, Mazzarella JM, Solomon PM, Downes D, Kramer C, Radford SJE (1996) A searchfor CO emission in high-redshift powerful radio galaxies. Astrophys J 457:658. doi:10.1086/176761
Fabian AC (1994) Cooling Flows in Clusters of Galaxies. ARA& A 32:277–318. doi:10.1146/annurev.aa.32.090194.001425
Fabian AC, Celotti A, Johnstone RM (2003a) Chandra reveals X-rays along the radio axis in the quasar3C 9 at z = 2.012. Mon Not Roy Astro Soc 338:L7–L11. doi:10.1046/j.1365-8711.2003.06111.x,arXiv:astro-ph/0204488
Fabian AC, Sanders JS, Crawford CS, Ettori S (2003b) A deep Chandra observation of the cluster environ-ment of the z = 1.786 radio galaxy 3C 294. Mon Not Roy Astro Soc 341:729–738. doi:10.1046/j.1365-8711.2003.06394.x, arXiv:astro-ph/0301468
Fall SM, Rees MJ (1977) Survival and disruption of galactic substructure. Mon Not Roy Astro Soc 181:37P–42P
Fan X, Narayanan VK, Lupton RH, Strauss MA, Knapp GR, Becker RH, White RL, Pentericci L, LeggettSK, Haiman Z, Gunn JE, Ivezic Ž, Schneider DP, Anderson SF, Brinkmann J, Bahcall NA, Con-nolly AJ, Csabai I, Doi M, Fukugita M, Geballe T, Grebel EK, Harbeck D, Hennessy G, Lamb DQ,Miknaitis G, Munn JA, Nichol R, Okamura S, Pier JR, Prada F, Richards GT, Szalay A, York DG(2001) A survey of z>5.8 quasars in the sloan digital sky survey. I. Discovery of three new quasarsand the spatial density of luminous quasars at z∼6. Astron J 122:2833–2849. doi:10.1086/324111,arXiv:astro-ph/0108063
Fan X, Carilli CL, Keating B (2006) Observational constraints on cosmic reionisation. ARA& A 44:415–462, arXiv:astro-ph/0602375
Fanaroff BL, Riley JM (1974) The morphology of extragalactic radio sources of high and low luminosity.Mon Not Roy Astro Soc 167:31P–36P
Fanti C, Pozzi F, Dallacasa D, Fanti R, Gregorini L, Stanghellini C, Vigotti M (2001) Multi-frequency VLAobservations of a new sample of CSS/GPS radio sources. Astron & Astrophys 369:380–420. doi:10.1051/0004-6361:20010051
Felten JE, Morrison P (1966) Omnidirectional inverse compton and synchrotron radiation from cosmicdistributions of fast electrons and thermal photons. Astrophys J 146:686
Felten JE, Rees MJ (1969) Cosmological implications of the diffuse X-ray background. Nature 221:924Fomalont EB, Miley GK (1975) Structure of the compact radio component in 3C236. Nature 257:99–103Francis PJ, Williger GM, Collins NR, Palunas P, Malumuth EM, Woodgate BE, Teplitz HI, Smette A,
Sutherland RS, Danks AC, Hill RS, Lindler D, Kimble RA, Heap SR, Hutchings JB (2001) A pair ofcompact red galaxies at redshift 2.38, immersed in a 100 kiloparsec scale Lyα nebula. Astrophys J554:1001–1011. doi:10.1086/321417, arXiv:astro-ph/0102263
Fu H, Stockton A (2007) A common origin for quasar extended emission-line regions and their broad-lineregions. Astrophys J Lett 664:L75–L78. doi:10.1086/520959, arXiv:0706.2941
Furlanetto SR, Loeb A (2002) The 21 centimeter forest: radio absorption spectra as probes of minihalosbefore reionisation. Astrophys J 579:1–9. doi:10.1086/342757, arXiv:astro-ph/0206308
123

134 G. Miley, C. De Breuck
Fynbo JU, Møller P, Warren SJ (1999) Extended LY alpha emission from a damped LY alpha absorber atz = 1.93, and the relation between damped LY alpha absorbers and Lyman-break galaxies. Mon NotRoy Astro Soc 305:849–858, arXiv:astro-ph/9812434
Gao L, Loeb A, Peebles PJE, White SDM, Jenkins A (2004) Early formation and late merging of the giantgalaxies. Astrophys J 614:17–25. doi:10.1086/423444, arXiv:astro-ph/0312499
Gardner JP, Mather JC, Clampin M, Doyon R, Greenhouse MA, Hammel HB, Hutchings JB, Jakobsen P,Lilly SJ, Long KS, Lunine JI, McCaughrean MJ, Mountain M, Nella J, Rieke GH, Rieke MJ, Rix HW,Smith EP, Sonneborn G, Stiavelli M, Stockman HS, Windhorst RA, Wright GS (2006) The JamesWebb space telescope. Space Sci Rev 123:485–606. doi:10.1007/s11214-006-8315-7, arXiv:astro-ph/0606175
Ge J, Owen FN (1994) Faraday rotation in cooling flow clusters of galaxies. 2: Survey. Astron J 108:1523–1533. doi:10.1086/117173
Geach JE, Matsuda Y, Smail I, Chapman SC, Yamada T, Ivison RJ, Hayashino T, Ohta K, Shioya Y,Taniguchi Y (2005) A submillimetre survey of Lyman α haloes in the SA22 protocluster at z =3.1. Mon Not Roy Astro Soc 363:1398–1408. doi:10.1111/j.1365-2966.2005.09538.x, arXiv:astro-ph/0508357
Gopal-Krishna, Giraud E, Melnick J, della Valle M (1995) A giant Lyα cloud associated with a dust-laneradio galaxy. at z = 2.468. Astron & Astrophys 303:705
Gopal-Krishna, Wiita PJ, Barai P (2004) Low-level radio emission from radio galaxies and implications forthe large scale structure. J Kor Astron Soc 37:517–525
Graham JA (1998) Shocked gas and star formation in the Centaurus A radio galaxy. Astrophys J 502:245.doi:10.1086/305888
Greve TR, Ivison RJ, Papadopoulos PP (2004) Detection of CO J = 1–0 in the z = 3.79 radio galaxy 4C60.07. Astron & Astrophys 419:99–107. doi:10.1051/0004-6361:20035788, arXiv:astro-ph/0402464
Greve TR, Stern D, Ivison RJ, De Breuck C, Kovács A, Bertoldi F (2007) Wide-field mid-infrared andmillimetre imaging of the high-redshift radio galaxy, 4C41.17. ArXiv e-prints 707, 0707.4482
Griffith MR, Wright AE (1993) The Parkes-MIT-NRAO (PMN) surveys. I—The 4850 MHz surveys anddata reduction. Astron J 105:1666–1679. doi:10.1086/116545
Groves BA, Dopita MA, Sutherland RS (2004a) Dusty, radiation pressure-dominated photoionisa-tion. I. Model description, structure, and grids. Astrophys J Suppl 153:9–73. doi:10.1086/421113,arXiv:astro-ph/0404175
Groves BA, Dopita MA, Sutherland RS (2004b) Dusty, radiation pressure-dominated photoionisation. II.Multiwavelength emission line diagnostics for narrow-line regions. Astrophys J Suppl 153:75–91.doi:10.1086/421114, arXiv:astro-ph/0404176
Gurvits LI, Schilizzi RT, Miley GK, Peck A, Bremer MN, Röttgering H, van Breugel W (1997) A compactradio component in 4C 41.17 at z = 3.8: a massive clump in a forming galaxy. Astron & Astrophys318:11–14
Gurvits LI, Kellermann KI, Frey S (1999) The angular size - redshift relation for compact radio structuresin quasars and radio galaxies. Astron & Astrophys 342:378–388, arXiv:astro-ph/9812018
Haiman Z, Rees MJ (2001) Extended Lyα Emission around young quasars: a constraint on galaxy formation.Astrophys J 556:87–92. doi:10.1086/321567, arXiv:astro-ph/0101174
Haiman Z, Spaans M, Quataert E (2000) Lyα cooling radiation from high-redshift halos. Astrophys J Lett537:L5–L8. doi:10.1086/312754, arXiv:astro-ph/0003366
Hall PB, Green RF, Cohen M (1998) An optical near-infrared study of radio-loud quasar environments.I. Methods and Z = 1 − 2 observations. Astrophys J Suppl 119:1–23. doi:10.1086/313149,arXiv:astro-ph/9806145
Häring N, Rix HW (2004) On the black hole mass-bulge mass relation. Astrophys J Lett 604:L89–L92.doi:10.1086/383567, arXiv:astro-ph/0402376
Hatch NA, Overzier RA, Röttgering HJA, Kurk JD, Miley GK (2007) Diffuse UV light associated with theSpiderweb Galaxy: evidence for in-situ star formation outside galaxies. ArXiv e-prints 710, 0710.4553
Hayashino T, Matsuda Y, Tamura H, Yamauchi R, Yamada T, Ajiki M, Fujita SS, Murayama T, Nagao T,Ohta K, Okamura S, Ouchi M, Shimasaku K, Shioya Y, Taniguchi Y (2004) Large-scale structure ofemission-line galaxies at z = 3.1. Astron J 128:2073–2079. doi:10.1086/424935
Heavens A, Panter B, Jimenez R, Dunlop J (2004) The star-formation history of the Universe from thestellar populations of nearby galaxies. Nature 428:625–627. doi:10.1038/nature02474, arXiv:astro-ph/0403293
123

Distant radio galaxies and their environments 135
Heckman TM, Miley GK, Bali ck B, van Breugel WJM, Butcher HR (1982) An optical and radio investi-gation of the radio galaxy 3C 305. Astrophys J 262:529–553. doi:10.1086/160445
Heckman TM, van Breugel WJM, Miley GK (1984) Emission-line gas associated with the radio lobes ofthe high-luminosity radio source 3C 171. Astrophys J 286:509–516. doi:10.1086/162626
Hill GJ, Lilly SJ (1991) A change in the cluster environments of radio galaxies with cosmic epoch. AstrophysJ 367:1–18. doi:10.1086/169597
Hodapp KW, Kaiser N, Aussel H, Burgett W, Chambers KC, Chun M, Dombeck T, Douglas A, Hafner D,Heasley J, Hoblitt J, Hude C, Isani S, Jedicke R, Jewitt D, Laux U, Luppino GA, Lupton R, MaberryM, Magnier E, Mannery E, Monet D, Morgan J, Onaka P, Price P, Ryan A, Siegmund W, SzapudiI, Tonry J, Wainscoat R, Waterson M (2004) Design of the Pan-STARRS telescopes. AstronomischeNachrichten 325:636–642. doi:10.1002/ansa.200410300
Hopkins PF, Hernquist L, Cox TJ, Di Matteo T, Robertson B, Springel V (2006) A unified, merger-drivenmodel of the origin of starbursts, quasars, the cosmic X-ray background, supermassive black holes,and galaxy spheroids. Astrophys J Suppl 163:1–49. doi:10.1086/499298, arXiv:astro-ph/0506398
Humphrey A, Villar-Martín M, Fosbury R, Vernet J, di Serego Alighieri S (2006) Jet-gas interactions inz ∼ 2.5 radio galaxies: evolution of the ultraviolet line and continuum emission with radio morphology.Mon Not Roy Astro Soc 369:1103–1114. doi:10.1111/j.1365-2966.2006.10224.x, astro-ph/0602504
Humphrey A, Villar-Martín M, Fosbury R, Binette L, Vernet J, De Breuck C, di Serego Alighieri S (2007)Giant Lyα nebulae around z > 2 radio galaxies: evidence for infall. Mon Not Roy Astro Soc 375:705–714. doi:10.1111/j.1365-2966.2006.11344.x, arXiv:astro-ph/0611778
Intema HT, Venemans BP, Kurk JD, Ouchi M, Kodama T, Röttgering HJA, Miley GK, Overzier RA (2006)Large-scale structure of Lyman break galaxies around a radio galaxy protocluster at z ∼ 4. Astron &Astrophys 456:433–437. doi:10.1051/0004-6361:20064812, arXiv:astro-ph/0606298
Ivison RJ (1995) Detection of dust in the most distant known radio galaxy. Mon Not Roy Astro Soc275:L33–L36, arXiv:astro-ph/9506039
Ivison RJ, Papadopoulos P, Seaquist ER, Eales SA (1996) A search for molecular gas in a high-redshiftradio galaxy. Mon Not Roy Astro Soc 278:669–672
Ivison RJ, Dunlop JS, Smail I, Dey A, Liu MC, Graham JR (2000) An excess of submillimetre sourcesnear 4C 41.17: a candidate protocluster at Z = 3.8? Astrophys J 542:27–34. doi:10.1086/309536,arXiv:astro-ph/0005234
Jaffe W, Bremer MN (1997) Molecular hydrogen emission in cooling flows. Mon Not Roy Astro Soc284:L1–L5
Jaffe W, Bremer MN, Baker K (2005) HII and H2 in the envelopes of cooling flow central galaxies. MonNot Roy Astro Soc 360:748–762. doi:10.1111/j.1365-2966.2005.09073.x, arXiv:astro-ph/0504413
Jarvis M, Röttgering HJA (eds) (2003) High-redshift radio galaxies - past, present and future, vol 47Jarvis MJ, Rawlings S, Eales S, Blundell KM, Bunker AJ, Croft S, McLure RJ, Willott CJ (2001a) A
sample of 6C radio sources designed to find objects at redshift z>4 - III. Imaging and the radio gal-axy K-z relation. Mon Not Roy Astro Soc 326:1585–1600. doi:10.1046/j.1365-8711.2001.04730.x,arXiv:astro-ph/0106130
Jarvis MJ, Rawlings S, Lacy M, Blundell KM, Bunker AJ, Eales S, Saunders R, Spinrad H, Stern D, WillottCJ (2001b) A sample of 6C radio sources designed to find objects at redshift z > 4 - II. Spectrophotom-etry and emission-line properties. Mon Not Roy Astro Soc 326:1563–1584. doi:10.1046/j.1365-8711.2001.04726.x, arXiv:astro-ph/0106127
Jarvis MJ, Rawlings S, Willott CJ, Blundell KM, Eales S, Lacy M (2001c) On the redshift cut-off forsteep-spectrum radio sources. Mon Not Roy Astro Soc 327:907–917. doi:10.1046/j.1365-8711.2001.04778.x, arXiv:astro-ph/0106473
Jarvis MJ, Wilman RJ, Röttgering HJA, Binette L (2003) Probing the absorbing haloes around two high-redshift radio galaxies with VLT-UVES∗. Mon Not Roy Astro Soc 338:263–272. doi:10.1046/j.1365-8711.2003.06053.x, arXiv:astro-ph/0209159
Jarvis MJ, Cruz MJ, Cohen AS, Röttgering HJA, Kassim NE (2004) Near-infrared K-band imaging of asample of ultra-steep-spectrum radio sources selected at 74 MHz. Mon Not Roy Astro Soc 355:20–30.doi:10.1111/j.1365-2966.2004.08278.x, arXiv:astro-ph/0408082
Johnson O, Almaini O, Best PN, Dunlop J (2007) 0.5 Mpc-scale extended X-ray emission in the z = 2.48radio galaxy 4C 23.56. Mon Not Roy Astro Soc 376:151–156. doi:10.1111/j.1365-2966.2006.11358.x, arXiv:astro-ph/0608656
Junor W, Biretta JA, Livio M (1999) Formation of the radio jet in M87 at 100 Schwarzschild radii from thecentral black hole. Nature 401:891–892
123

136 G. Miley, C. De Breuck
Kajisawa M, Kodama T, Tanaka I, Yamada T, Bower R (2006) Protoclusters with evolved populationsaround radio galaxies at z ∼ 2.5. Mon Not Roy Astro Soc 371:577–582. doi:10.1111/j.1365-2966.2006.10704.x, arXiv:astro-ph/0606407
Kashikawa N, Kitayama T, Doi M, Misawa T, Komiyama Y, Ota K (2007) The habitat segregation betweenlyman break galaxies and Lyα emitters around a QSO at z ∼ 5. Astrophys J 663:765–773. doi:10.1086/518410, arXiv:0704.2238
Kassim NE, Clarke TE, Cohen AS, Crane PC, Gaussiran T, Gross C, Henning PA, Hicks BC, Junor W,Lane WM, Lazio TJW, Paravastu N, Pihlstrom YM, Polisensky EJ, Ray PS, Stewart KP, Taylor GB,Weiler KW (2006) Exploring the last electromagnetic frontier with the long wavelength array (LWA).In: Long Wavelength Astrophysics, 26th meeting of the IAU, Joint Discussion 12, 21 August 2006,Prague, Czech Republic, JD12, #56 12
Kauffmann G, White SDM, Guiderdoni B (1993) The Formation and Evolution of Galaxies Within MergingDark Matter Haloes. Mon Not Roy Astro Soc 264:201
Kaufmann T, Mayer L, Wadsley J, Stadel J, Moore B (2006) Cooling flows within galactic haloes: the kine-matics and properties of infalling multiphase gas. Mon Not Roy Astro Soc 370:1612–1622. doi:10.1111/j.1365-2966.2006.10599.x, arXiv:astro-ph/0507296
Keel WC, Cohen SH, Windhorst RA, Waddington I (1999) Evidence for large-scale structure at z ∼ 2.4from Lyα imaging. Astron J 118:2547–2560. doi:10.1086/301139, arXiv:astro-ph/9908183
Kellermann KI (2003) Variability, brightness temperature, superluminal motion, doppler boosting, andrelated issues. In: Zensus JA, Cohen MH, Ros E (eds) Radio astronomy at the fringe, AstronomicalSociety of the Pacific conference series, vol 300, p 185
Klamer IJ, Ekers RD, Sadler EM, Hunstead RW (2004) Molecular gas at high redshift: jet-induced starformation? Astrophys J Lett 612:L97–L100. doi:10.1086/424843, arXiv:astro-ph/0408015
Klamer IJ, Ekers RD, Sadler EM, Weiss A, Hunstead RW, De Breuck C (2005) CO (1-0) and CO (5-4)observations of the most distant known radio galaxy at z = 5.2. Astrophys J Lett 621:L1–L4. doi:10.1086/429147, arXiv:astro-ph/0501447
Klamer IJ, Ekers RD, Bryant JJ, Hunstead RW, Sadler EM, De Breuck C (2006) A search for distant radiogalaxies from SUMSS and NVSS - III. Radio spectral energy distributions and the z-α correlation.Mon Not Roy Astro Soc 371:852–866. doi:10.1111/j.1365-2966.2006.10714.x, astro-ph/0606469
Knopp GP, Chambers KC (1997) Dust at high redshift: infrared and optical polarimetry of an ultra–steep-spectrum radio source at Z = 2.572. Astrophys J 487:644. doi:10.1086/304656
Kodama T, Bower R (2003) The Ks -band luminosity and stellar mass functions of galaxies in z = 1 clusters.Mon Not Roy Astro Soc 346:1–12. doi:10.1046/j.1365-2966.2003.07093.x, arXiv:astro-ph/0308130
Kodama T, Tanaka I, Kajisawa M, Kurk J, Venemans B, De Breuck C, Vernet J, Lidman C (2007) The firstappearance of the red sequence of galaxies in proto-clusters at 2 < z < 3. Mon Not Roy Astro Soc377:1717–1725. doi:10.1111/j.1365-2966.2007.11739.x, arXiv:astro-ph/0703382
Kopylov AI, Goss WM, Pariiskii YN, Soboleva NS, Verkhodanov OV, Temirova AV, Zhelenkova OP (2006)RC J0311 + 0507: A candidate for superpowerful radio galaxies in the early universe at redshiftz = 4.514. Astro Letters 32:433–438. doi:10.1134/S1063773706070012, arXiv:0705.2971
Kormendy J, Gebhardt K (2001) Supermassive Black Holes in Galactic Nuclei (Plenary Talk). In: WheelerJC, Martel H (eds) 20th Texas Symposium on relativistic astrophysics, American Institute of physicsconference series, vol 586, p 363
Krause M (2005) Galactic wind shells and high redshift radio galaxies. On the nature of associated absorbers.Astron & Astrophys 436:845–851. doi:10.1051/0004-6361:20042450, arXiv:astro-ph/0503322
Kurk JD, Röttgering HJA, Pentericci L, Miley GK, van Breugel W, Carilli CL, Ford H, Heckman T,McCarthy P, Moorwood A (2000) A Search for clusters at high redshift. I. Candidate Ly alpha emit-ters near 1138-262 at z = 2.2. Astron & Astrophys 358:L1–L4, astro-ph/0005058
Kurk JD, Pentericci L, Overzier RA, Röttgering HJA, Miley GK (2004a) A search for clusters at high red-shift. IV. Spectroscopy of Hα emitters in a proto-cluster at z = 2.16. Astron & Astrophys 428:817–821.doi:10.1051/0004-6361:20041819, astro-ph/0410203
Kurk JD, Pentericci L, Röttgering HJA, Miley GK (2004b) A search for clusters at high redshift. III. Can-didate Hα emitters and EROs in the PKS 1138-262 proto-cluster at z = 2.16. Astron & Astrophys428:793–815. doi:10.1051/0004-6361:20040075, astro-ph/0410202
Lacy M, Miley G, Rawlings S, Saunders R, Dickinson M, Garrington S, Maddox S, Pooley G, Steidel C,Bremer MN, Cotter G, Ojik Rvan , Rottgering H, Warner P (1994) 8C 1435 + 635: a radio galaxy atz = 4.25. Mon Not Roy Astro Soc 271:504–512
123

Distant radio galaxies and their environments 137
Lacy M, Rawlings S, Hill GJ, Bunker AJ, Ridgway SE, Stern D (1999) Optical spectroscopy of two over-lapping, flux-density-limited samples of radio sources in the North Ecliptic Cap, selected at 38 and151MHz. Mon Not Roy Astro Soc 308:1096–1116, arXiv:astro-ph/9905358
Large MI, Mills BY, Little AG, Crawford DF, Sutton JM (1981) The Molonglo Reference Catalogue ofRadio Sources. Mon Not Roy Astro Soc 194:693
Larson R (1992) Galaxy formation and evolution. In: Tenorio-Tagle G, Prieto M, Sanchez F (eds) Starformation in stellar systems, p 125
Le Fevre O, Deltorn JM, Crampton D, Dickinson M (1996) Clustering around the radio galaxy MRC0316-257 at Z = 3.14. Astrophys J Lett 471:L11. doi:10.1086/310319, arXiv:astro-ph/9609020
Leckrone DS, Cheng ES, Feinberg LD, Trauger JT, Macchetto FD, MacKenty JW (1998) Wide Field Cam-era 3 (WFC3) - A Facility Instrument For The Hubble Space Telescope. In: Bulletin of the AmericanAstronomical Society, Bulletin of the American Astronomical Society, vol 30, p 861
Li Y, Hernquist L, Robertson B, Cox TJ, Hopkins PF, Springel V, Gao L, Di Matteo T, Zentner AR,Jenkins A, Yoshida N (2007) Formation of z ∼6 quasars from hierarchical galaxy mergers. AstrophysJ 665:187–208. doi:10.1086/519297, arXiv:astro-ph/0608190
Lilly SJ (1988) Discovery of a radio galaxy at a redshift of 3.395. Astrophys J 333:161–167. doi:10.1086/166732
Lilly SJ (1989) Faint identifications of 1 Jansky radio source empty fields - Radio galaxies at high redshift.Astrophys J 340:77–89. doi:10.1086/167377
Lilly SJ, Longair MS (1984) Stellar populations in distant radio galaxies. Mon Not Roy Astro Soc 211:833–855
Lilly SJ, Le Fevre O, Hammer F, Crampton D (1996) The Canada–France redshift survey: the luminositydensity and star formation history of the universe to Z approximately 1. Astrophys J Lett 460:L1.doi:10.1086/309975, arXiv:astro-ph/9601050
Lynden-Bell D (1969) Galactic nuclei as collapsed old quasars. Nature 223:690Madau P, Pozzetti L, Dickinson M (1998) The star formation history of field galaxies. Astrophys J 498:106.
doi:10.1086/305523, arXiv:astro-ph/9708220Magorrian J, Tremaine S, Richstone D, Bender R, Bower G, Dressler A, Faber SM, Gebhardt K, Green R,
Grillmair C, Kormendy J, Lauer T (1998) The demography of massive dark objects in galaxy centers.Astron J 115:2285–2305. doi:10.1086/300353, arXiv:astro-ph/9708072
Manzini A, di Serego Alighieri S (1996) Dust scattering in radio galaxies. Astron Astrophys 311:79–94Matsuda Y, Yamada T, Hayashino T, Tamura H, Yamauchi R, Ajiki M, Fujita SS, Murayama T, Nagao T,
Ohta K, Okamura S, Ouchi M, Shimasaku K, Shioya Y, Taniguchi Y (2004) A Subaru search for Lyα
blobs in and around the protocluster region at redshift z = 3.1. Astron J 128:569–584. doi:10.1086/422020, arXiv:astro-ph/0405221
Matsuda Y, Yamada T, Hayashino T, Tamura H, Yamauchi R, Murayama T, Nagao T, Ohta K, Okamura S,Ouchi M, Shimasaku K, Shioya Y, Taniguchi Y (2005) Large-scale filamentary structure around theprotocluster at redshift z = 3.1. Astrophys J Lett 634:L125–L128. doi:10.1086/499071, arXiv:astro-ph/0510762
Mauch T, Murphy T, Buttery HJ, Curran J, Hunstead RW, Piestrzynski B, Robertson JG, Sadler EM (2003)SUMSS: a wide-field radio imaging survey of the southern sky—II. The source catalogue. Mon NotRoy Astro Soc 342:1117–1130. doi:10.1046/j.1365-8711.2003.06605.x, arXiv:astro-ph/0303188
McCarthy PJ (1991) High redshift radio galaxies from the Third Bologna Catalogue. Astron J 102:518–521.doi:10.1086/115890
McCarthy PJ (1993) High redshift radio galaxies. ARA& A 31:639–688. doi:10.1146/annurev.aa.31.090193.003231
McCarthy PJ, van Breugel W, Spinrad H, Djorgovski S (1987) A correlation between the radio and opticalmorphologies of distant 3Cr radio galaxies. Astrophys J Lett 321:L29–L33. doi:10.1086/185000
McCarthy PJ, Kapahi VK, van Breugel W, Subrahmanya CR (1990) High-redshift radio galaxies from theMolonglo Catalogue. Astron J 100:1014–1027. doi:10.1086/115575
McCarthy PJ, van Breugel W, Kapahi VK, Subrahmanya CR (1991) High redshift radio galaxies from theMolonglo Catalogue. II. Astron J 102:522–536. doi:10.1086/115891
McCarthy PJ, Kapahi VK, van Breugel W, Persson SE, Athreya R, Subrahmanya CR (1996) The MolongloReference Catalog/1 Jansky Radio Source Survey. I. Radio galaxy identifications. Astrophys J Suppl107:19. doi:10.1086/192353
McLure RJ, Jarvis MJ (2002) Measuring the black hole masses of high-redshift quasars. Mon Not RoyAstro Soc 337:109–116. doi:10.1046/j.1365-8711.2002.05871.x, arXiv:astro-ph/0204473
123

138 G. Miley, C. De Breuck
McNamara BR, Wise M, Nulsen PEJ, David LP, Sarazin CL, Bautz M, Markevitch M, Vikhlinin A, FormanWR, Jones C, Harris DE (2000) Chandra X-ray observations of the hydra A cluster: an interactionbetween the radio source and the X-ray-emitting gas. Astrophys J Lett 534:L135–L138. doi:10.1086/312662, arXiv:astro-ph/0001402
Menci N (2004) Co-evolution of Galaxies and AGNs in Hierarchical Galaxy Formation Models. APSS294:15–22. doi:10.1007/s10509-004-4013-7
Miley G (1980) The structure of extended extragalactic radio sources. ARA& A 18:165–218. doi:10.1146/annurev.aa.18.090180.001121
Miley GK (1968) Variation of the angular sizes of quasars with red-shift. Nature 218:933Miley GK, Overzier RA, Tsvetanov ZI, Bouwens RJ, Benítez N, Blakeslee JP, Ford HC, Illingworth GD,
Postman M, Rosati P, Clampin M, Hartig GF, Zirm AW, Röttgering HJA, Venemans BP, Ardila DR,Bartko F, Broadhurst TJ, Brown RA, Burrows CJ, Cheng ES, Cross NJG, De Breuck C, Feldman PD,Franx M, Golimowski DA, Gronwall C, Infante L, Martel AR, Menanteau F, Meurer GR, SirianniM, Kimble RA, Krist JE, Sparks WB, Tran HD, White RL, Zheng W (2004) A large population ofLyman-break galaxies in a protocluster at redshift z ∼ 4.1. Nature 427:47–50, astro-ph/0401034
Miley GK, Overzier RA, Zirm AW, Ford HC, Kurk J, Pentericci L, Blakeslee JP, Franx M, IllingworthGD, Postman M, Rosati P, Röttgering HJA, Venemans BP, Helder E (2006) The Spiderweb Gal-axy: a forming massive cluster galaxy at z ∼ 2. Astrophys J Lett 650:L29–L32. doi:10.1086/508534,arXiv:astro-ph/0610909
Minkowski R (1960) A New Distant Cluster of Galaxies. Astrophys J 132:908–910. doi:10.1086/146994Miyoshi M, Moran J, Herrnstein J, Greenhill L, Nakai N, Diamond P, Inoue M (1995) Evidence for a
Black-Hole from High Rotation Velocities in a Sub-Parsec Region of NGC4258. Nature 373:127.doi:10.1038/373127a0
Möller P, Fynbo JU (2001) Detection of a redshift 3.04 filament. Astron & Astrophys 372:L57–L60. doi:10.1051/0004-6361:20010606, arXiv:astro-ph/0105114
Monaco P, Møller P, Fynbo JPU, Weidinger M, Ledoux C, Theuns T (2005) Tracing large-scale struc-ture at high redshift with Lyman-α emitters: the effect of peculiar velocities. Astron & Astrophys440:799–808. doi:10.1051/0004-6361:20042570, arXiv:astro-ph/0505477
Morganti R (2006) Neutral hydrogen in radio galaxies: Results from nearby, importance for far away. AstronNachrich 327:127–134. doi:10.1002/ansa.200510492, arXiv:astro-ph/0510261
Nakata F, Kajisawa M, Yamada T, Kodama T, Shimasaku K, Tanaka I, Doi M, Furusawa H, Hamabe M,Iye M, Kimura M, Komiyama Y, Miyazaki S, Okamura S, Ouchi M, Sasaki T, Sekigushi M, YagiM, Yasuda N (2002) Galaxy Population in the Cluster of Galaxies around the Radio Galaxy 3C324at z = 1.2. In: Borgani S, Mezzetti M, Valdarnini R (eds) Tracing Cosmic Evolution with GalaxyClusters, Astronomical Society of the Pacific Conference Series, vol 268, pp 421
Napier PJ (2006) The EVLA Project: Ten Times More Capability for the VLA. In: Backer DC, Moran JM,Turner JL (eds) Revealing the Molecular Universe: One Antenna is Never Enough, AstronomicalSociety of the Pacific Conference Series, vol 356, pp 65
Neeser MJ, Eales SA, Law-Green JD, Leahy JP, Rawlings S (1995) The Linear-Size Evolution of ClassicalDouble Radio Sources. Astrophys J 451:76. doi:10.1086/176201, arXiv:astro-ph/9508036
Nesvadba NPH, Lehnert MD, Eisenhauer F, Gilbert A, Tecza M, Abuter R (2006) Extreme Gas Kinemat-ics in the z = 2.2 Powerful Radio Galaxy MRC 1138-262: Evidence for Efficient Active GalacticNucleus Feedback in the Early Universe? Astrophys J 650:693–705. doi:10.1086/507266, arXiv:astro-ph/0606530
Nilsson K, Valtonen MJ, Kotilainen J, Jaakkola T (1993) On the redshift-apparent size diagram of doubleradio sources. Astrophys J 413:453–476. doi:10.1086/173016
Nilsson KK, Fynbo JPU, Møller P, Sommer-Larsen J, Ledoux C (2006) A Lyman-α blob in the GOODSSouth field: evidence for cold accretion onto a dark matter halo. Astron & Astrophys 452:L23–L26.doi:10.1051/0004-6361:200600025, arXiv:astro-ph/0512396
Novak GS, Faber SM, Dekel A (2006) On the Correlations of Massive Black Holes with Their Host Galaxies.Astrophys J 637:96–103. doi:10.1086/498333, arXiv:astro-ph/0510102
Omont A (2007) Molecules in galaxies. Reports of Progress in Physics 70:1099–1176. doi:10.1088/0034-4885/70/7/R03
Osterbrock DE, Ferland GJ (2006) Astrophysics of gaseous nebulae and active galactic nuclei. Astrophysicsof gaseous nebulae and active galactic nuclei, 2nd ed by D.E. Osterbrock and G.J. Ferland. Sausalito,CA: University Science Books, 2006
123
Distant radio galaxies and their environments 139
Ouchi M, Shimasaku K, Akiyama M, Sekiguchi K, Furusawa H, Okamura S, Kashikawa N, Iye M, KodamaT, Saito T, Sasaki T, Simpson C, Takata T, Yamada T, Yamanoi H, Yoshida M, Yoshida M (2005) TheDiscovery of Primeval Large-Scale Structures with Forming Clusters at Redshift 6. Astrophys J Lett620:L1–L4. doi:10.1086/428499, arXiv:astro-ph/0412648
Overzier RA (2006) Emergence of Cosmic Structures around Distant Radio Galaxies and Quasars. PhDthesis, Leiden Observatory, Leiden University, P.O. Box 9513, 2300 RA Leiden, The Netherlands
Overzier RA, Harris DE, Carilli CL, Pentericci L, Röttgering HJA, Miley GK (2005) On the X-ray emissionof z ∼ 2 radio galaxies: IC scattering of the CMB and no evidence for fully-formed potential wells.Astron & Astrophys 433:87–100. doi:10.1051/0004-6361:2004165, arXiv:astro-ph/0412026
Overzier RA, Bouwens RJ, Cross NJG, Venemans B, Miley GK, Zirm AW, Benitez N, Blakeslee JP, Coe D,Demarco R, Ford H, Homeier N, Illingworth GD, Kurk JD, Martel A, Mei S, Rottgering HJA, Tsve-tanov Z, Zheng W (2006a) Star formation, morphologies and clustering of galaxies in a radio galaxyprotocluster at z = 4.1. ArXiv Astrophysics e-prints astro-ph/0601223
Overzier RA, Miley GK, Bouwens RJ, Cross NJG, Zirm AW, Benítez N, Blakeslee JP, Clampin M, DemarcoR, Ford HC, Hartig GF, Illingworth GD, Martel AR, Röttgering HJA, Venemans B, Ardila DR, Bartko F,Bradley LD, Broadhurst TJ, Coe D, Feldman PD, Franx M, Golimowski DA, Goto T, Gronwall C,Holden B, Homeier N, Infante L, Kimble RA, Krist JE, Mei S, Menanteau F, Meurer GR, Motta V,Postman M, Rosati P, Siriann M, Sparks WB, Tran HD, Tsvetanov ZI, White RL, Zheng W (2006b)Clustering of Star-forming Galaxies Near a Radio Galaxy at z = 5.2. Astrophys J 637:58–73. doi:10.1086/498234, arXiv:astro-ph/0509308
Owen FN, Keel WC (1995) Faint B3 radio galaxies: Luminosity versus evolution effects. Astron J 109:486–499. doi:10.1086/117294
Pahre MA, Djorgovski SG (1995) A Near-Infrared Search for Line Emission from Protogalaxies Using theW. M. Keck Telescope. Astrophys J Lett 449:L1. doi:10.1086/309632, arXiv:astro-ph/9506043
Panter B, Jimenez R, Heavens AF, Charlot S (2007) The star formation histories of galaxies in the SloanDigital Sky Survey. Mon Not Roy Astro Soc 378:1550–1564. doi:10.1111/j.1365-2966.2007.11909.x, arXiv:astro-ph/0608531
Papadopoulos PP (2007) HCN versus HCO+ as Dense Molecular Gas Mass Tracers in Luminous InfraredGalaxies. Astrophys J 656:792–797. doi:10.1086/510186, arXiv:astro-ph/0610477
Papadopoulos PP, Röttgering HJA, van der Werf PP, Guilloteau S, Omont A, van Breugel WJM, Tilanus RPJ(2000) CO (4-3) and Dust Emission in Two Powerful High-Z Radio Galaxies, and CO Lines at HighRedshifts. Astrophys J 528:626–636. doi:10.1086/308215, arXiv:astro-ph/9908286
Papadopoulos PP, Greve TR, Ivison RJ, De Breuck C (2005) A sensitive search for CO J = 1 − 0 emissionin 4C 41.17: high-excitation molecular gas at z = 3.8. Astron & Astrophys 444:813–819. doi:10.1051/0004-6361:20053611, arXiv:astro-ph/0509048
Pascarelle SM, Windhorst RA, Keel WC, Odewahn SC (1996) Sub-galactic clumps at a redshift of 2.39and implications for galaxy formation. Nature 383:45–50. doi:10.1038/383045a0
Peacock JA (1999) Cosmological Physics. Cosmological Physics, by John A. Peacock, pp. 704. ISBN052141072X. Cambridge, UK: Cambridge University Press, January 1999
Pei YC (1995) The luminosity function of quasars. Astrophys J 438:623–631. doi:10.1086/175105Pentericci L, Röttgering HJA, Miley GK, Carilli CL, McCarthy P (1997) The radio galaxy 1138-262 at
z = 2.2: a giant elliptical galaxy at the center of a proto-cluster? Astron & Astrophys 326:580–596Pentericci L, Röttgering HJA, Miley GK, Spinrad H, McCarthy PJ, van Breugel WJM, Macchetto F (1998)
HST Images of the Extremely Clumpy Radio Galaxy 1138-262 at Z = 2.2. Astrophys J 504:139.doi:10.1086/306087
Pentericci L, Röttgering HJA, Miley GK, McCarthy P, Spinrad H, van Breugel WJM, Macchetto F (1999)HST images and properties of the most distant radio galaxies. Astron & Astrophys 341:329–347,astro-ph/9809056
Pentericci L, Kurk JD, Röttgering HJA, Miley GK, van Breugel W, Carilli CL, Ford H, Heckman T,McCarthy P, Moorwood A (2000a) A search for clusters at high redshift. II. A proto cluster around aradio galaxy at z = 2.16. Astron & Astrophys 361:L25–L28, astro-ph/0008143
Pentericci L, Van Reeven W, Carilli CL, Röttgering HJA, Miley GK (2000b) VLA radio continuum obser-vations of a new sample of high redshift radio galaxies. Astron & Astrophys Suppl 145:121–159,astro-ph/0005524
Pentericci L, McCarthy PJ, Röttgering HJA, Miley GK, van Breugel WJM, Fosbury R (2001) NICMOSObservations of High-Redshift Radio Galaxies: Witnessing the Formation of Bright Elliptical Galax-ies? Astrophys J Suppl 135:63–85. doi:10.1086/321781, arXiv:astro-ph/0102323
123
140 G. Miley, C. De Breuck
Pentericci L, Kurk JD, Carilli CL, Harris DE, Miley GK, Röttgering HJA (2002) A Chandra study of X-raysources in the field of the z = 2.16 radio galaxy MRC 1138-262. Astron & Astrophys 396:109–115.doi:10.1051/0004-6361:20021368, arXiv:astro-ph/0209392
Pérez-Torres MA, De Breuck C (2005) The extremely asymmetric radio structure of the z = 3.1 radio gal-axy B3 J2330 + 3927. Mon Not Roy Astro Soc 363:L41–L45. doi:10.1111/j.1745-3933.2005.00080.x, arXiv:astro-ph/0507489
Pérez-Torres MA, De Breuck C, van Breugel W, Miley G (2006) Very high-resolution radio observationsof HzRGs. Astron Nachrich 327:245–248. doi:10.1002/ansa.200510516, arXiv:astro-ph/0508692
Peterson BM (1997) An introduction to active galactic nuclei. Cambridge University Press, Cambridge,Physical description xvi, 238 pp. ISBN 0521473489
Podariu S, Daly RA, Mory MP, Ratra B (2003) Radio galaxy redshift-angular size data constraints on darkenergy. Astrophys J 584:577–579. doi:10.1086/345752, arXiv:astro-ph/0207096
Rawlings S, Saunders R (1991) Evidence for a common central-engine mechanism in all extragalactic radiosources. Nature 349:138–140. doi:10.1038/349138a0
Rawlings S, Eales S, Warren S (1990) The detection of four high-redshift (0.5 much less than Z less thanor equal to 3.22) radiogalaxies by optical spectroscopy of five blank fields. Mon Not Roy Astro Soc243:14P–18P
Rawlings S, Lacy M, Blundell KM, Eales SA, Bunker AJ, Garrington ST (1996) A radio galaxy at redshift4.41. Nature 383:502–505. doi:10.1038/383502a0
Rees MJ (1967) Studies in radio source structure-I. A relativistically expanding model for variable quasi-stellar radio sources. Mon Not Roy Astro Soc 135:345
Rees MJ (1989) The radio/optical alignment of high-z radio galaxies - Triggering of star formation in radiolobes. Mon Not Roy Astro Soc 239:1P–4P
Rengelink RB (1999) The Westerbork Northern Sky Survey; the cosmological evolution of radio sources.PhD thesis, Leiden Observatory, Leiden University, Leiden, The Netherlands
Rengelink RB, Tang Y, Bruyn AGde , Miley GK, Bremer MN, Roettgering HJA, Bremer MAR (1997) TheWesterbork Northern Sky Survey (WENSS), I. A 570 square degree Mini-Survey around the NorthEcliptic Pole. Astron & Astrophys Suppl 124:259–280
Reuland M (2005) Gas, dust and star formation in distant radio galaxies. PhD thesis, Leiden Observatory,Leiden University, Leiden, The Netherlands
Reuland M, van Breugel W, Röttgering H, de Vries W, De Breuck C, Stern D (2003a) An obscured radiogalaxy at high redshift. Astrophys J Lett 582:L71–L74. doi:10.1086/367689, arXiv:astro-ph/0302432
Reuland M, van Breugel W, Röttgering H, de Vries W, Stanford SA, Dey A, Lacy M, Bland-Hawthorn J,Dopita M, Miley G (2003b) Giant Lyα nebulae associated with high-redshift radio galaxies. AstrophysJ 592:755–766. doi:10.1086/375619, arXiv:astro-ph/0303637
Reuland M, Röttgering H, van Breugel W, De Breuck C (2004) Dust and star formation in distant radiogalaxies. Mon Not Roy Astro Soc 353:377–390. doi:10.1111/j.1365-2966.2004.08063.x, arXiv:astro-ph/0405567
Reuland M, van Breugel W, de Vries W, Dopita MA, Dey A, Miley G, Röttgering H, Venemans B, StanfordSA, Lacy M, Spinrad H, Dawson S, Stern D, Bunker A (2007) Metal-enriched gaseous halos arounddistant radio galaxies: clues to Feedback in galaxy formation. Astron J 133:2607–2623. doi:10.1086/516571, arXiv:astro-ph/0702753
Rocca-Volmerange B, Remazeilles M (2005) Evidence of intense hot (∼340 K) dust emission in 3CR radiogalaxies. The most dissipative source of cooling in AGNs. Astron & Astrophys 433:73–77. doi:10.1051/0004-6361:20042106, arXiv:astro-ph/0411733
Rocca-Volmerange B, Le Borgne D, De Breuck C, Fioc M, Moy E (2004) The radio galaxy K-z relation: the1012 MSol mass limit. Masses of galaxies from the LK luminosity, up to z > 4. Astron & Astrophys415:931–940. doi:10.1051/0004-6361:20031717, arXiv:astro-ph/0311490
Röttgering H, de Bruyn G, Pentericci L (1999a) HI and high redshift radio galaxies. In: Röttgering HJA,Best PN, Lehnert MD (eds) The most distant radio galaxies, pp 113
Röttgering HJA, Lacy M, Miley GK, Chambers KC, Saunders R (1994) Samples of ultra-steep spectrumradio sources. Astron & Astrophys Suppl 108:79–141
Röttgering HJA, Miley GK, Chambers KC, Macchetto F (1995) CCD imaging of ultra-steep-spectrum radiosources. Astron & Astrophys Suppl 114:51
Röttgering HJA, West MJ, Miley GK, Chambers KC (1996) The optical counterparts and the environmentsof ultra-steep-spectrum radio sources. Astron & Astrophys 307:376–384
Röttgering HJA, van Ojik R, Miley GK, Chambers KC, van Breugel WJM, de Koff S (1997) Spectroscopy ofultra-steep spectrum radio sources: a sample of z>2 radio galaxies. Astron & Astrophys 326:505–527,arXiv:astro-ph/9608063
123
Distant radio galaxies and their environments 141
Röttgering HJA, Best PN, Lehnert MD (eds) (1999b) The most distant radio galaxiesRöttgering HJA, Best PN, De Breuck C, Kurk J, Pentericci L, van Breugel W (2000) Distant radio galaxies:
the present and future. In: van Haarlem MP (ed) Perspectives on Radio Astro: science with largeantenna arrays, proceedings of the conference on at The Royal Netherlands Academy of Arts andSciences, Amsterdam, 7–9 April 1999. ASTRON„ 340 pp. ISBN: 90-805434-1-1
Röttgering HJA, Braun R, Barthel PD, van Haarlem MP, Miley GK, Morganti R, Snellen I, Falcke H,de Bruyn AG, Stappers RB, Boland WHWM, Butcher HR, de Geus EJ, Koopmans L, Fender R,Kuijpers J, Schilizzi RT, Vogt C, Wijers RAMJ, Wise M, Brouw WN, Hamaker JP, Noordam JE,Oosterloo T, Bahren L, Brentjens MA, Wijnholds SJ, Bregman JD, van Cappellen WA, Gunst AW,Kant GW, Reitsma J, van der Schaaf K, de Vos CM (2006) LOFAR—Opening up a new window onthe Universe. ArXiv Astrophysics e-prints astro-ph/0610596
Scharf C, Smail I, Ivison R, Bower R, van Breugel W, Reuland M (2003) Extended X-Ray Emission around4C 41.17 at z = 3.8. Astrophys J 596:105–113. doi:10.1086/377531, arXiv:astro-ph/0306314
Schilizzi RT, van Ardenne A, Miley GK, Baud B, Baath L, Ronnang BO, Pauliny-Toth IIK (1979) Highresolution observations of the compact central component in the giant radio source 3C 236. Astron &Astrophys 77:1–2
Schiminovich D, Ilbert O, Arnouts S, Milliard B, Tresse L, Le Fèvre O, Treyer M, Wyder TK, Budavári T,Zucca E, Zamorani G, Martin DC, Adami C, Arnaboldi M, Bardelli S, Barlow T, Bianchi L, BolzonellaM, Bottini D, Byun YI, Cappi A, Contini T, Charlot S, Donas J, Forster K, Foucaud S, Franzetti P,Friedman PG, Garilli B, Gavignaud I, Guzzo L, Heckman TM, Hoopes C, Iovino A, Jelinsky P, LeBrun V, Lee YW, Maccagni D, Madore BF, Malina R, Marano B, Marinoni C, McCracken HJ, MazureA, Meneux B, Morrissey P, Neff S, Paltani S, Pellò R, Picat JP, Pollo A, Pozzetti L, Radovich M, RichRM, Scaramella R, Scodeggio M, Seibert M, Siegmund O, Small T, Szalay AS, Vettolani G, Welsh B,Xu CK, Zanichelli A (2005) The GALEX-VVDS measurement of the evolution of the far-ultravioletluminosity density and the cosmic star formation rate. Astrophys J Lett 619:L47–L50. doi:10.1086/427077, arXiv:astro-ph/0411424
Schwartz DA (2002) X-ray jets as cosmic beacons. Astrophys J Lett 569:L23–L26. doi:10.1086/340482Scoville NZ, Yun MS, Windhorst RA, Keel WC, Armus L (1997) CO J = 3–2 emission in the radio galaxy
53W002 at it Z = 2.394. Astrophys J Lett 485:L21. doi:10.1086/310807, arXiv:astro-ph/9706291Seymour N, Stern D, De Breuck C, Vernet J, Rettura A, Dickinson M, Dey A, Eisenhardt P, Fosbury
R, Lacy M, McCarthy P, Miley G, Rocca-Volmerange B, Röttgering H, Stanford SA, Teplitz H,van Breugel W, Zirm A (2007) The massive hosts of radio galaxies across cosmic time. Astrophys JSuppl 171:353–375. doi:10.1086/517887, arXiv:astro-ph/0703224
Shimasaku K, Ouchi M, Okamura S, Kashikawa N, Doi M, Furusawa H, Hamabe M, Hayashino T,Kawabata K, Kimura M, Kodaira K, Komiyama Y, Matsuda Y, Miyazaki M, Miyazaki S, NakataF, Ohta K, Ohyama Y, Sekiguchi M, Shioya Y, Tamura H, Taniguchi Y, Yagi M, Yamada T, YasudaN (2003) Subaru Deep Survey. IV. Discovery of a large-scale structure at redshift ∼= 5. AstrophysJ Lett 586:L111–L114. doi:10.1086/374880, arXiv:astro-ph/0302466
Siebenmorgen R, Krügel E (2007) Dust in starburst nuclei and ULIRGs. SED models for observers. Astron& Astrophys 461:445–453. doi:10.1051/0004-6361:20065700, arXiv:astro-ph/0606444
Siebenmorgen R, Krügel E, Laureijs RJ (2001) The infrared continuum radiation of NGC 1808.A PAH and polarisation study. Astron & Astrophys 377:735–744. doi:10.1051/0004-6361:20010969,arXiv:astro-ph/0107098
Silk J, Rees MJ (1998) Quasars and galaxy formation. Astron & Astrophys 331:L1–L4, arXiv:astro-ph/9801013
Simpson C, Eisenhardt P (1999) The detection and photometric redshift determination of distant galaxiesusing SIRTF’s infrared array camera. PASP 111:691–701, arXiv:astro-ph/9903067
Smail I, Ivison RJ, Gilbank DG, Dunlop JS, Keel WC, Motohara K, Stevens JA (2003) A SCUBA gal-axy in the protocluster around 53W002 at z = 2.4. Astrophys J 583:551–558. doi:10.1086/345474,arXiv:astro-ph/0210183
Smith HE, Spinrad H (1980) An update of the status of the revised 3C catalog of radio sources 22 newgalaxy redshifts. PASP 92:553–569
Solomon PM, Vanden Bout PA (2005) Molecular gas at high redshift. ARA&A 43:677–725, arXiv:astro-ph/0508481
Solórzano-Iñarrea C, Best PN, Röttgering HJA, Cimatti A (2004) VLT spectropolarimetry of two pow-erful radio galaxies at z ∼ 1.4: ultraviolet continuum, emission-line properties and the nature ofhigh-redshift dust. Mon Not Roy Astro Soc 351:997–1014. doi:10.1111/j.1365-2966.2004.07842.x,arXiv:astro-ph/0403390
123

142 G. Miley, C. De Breuck
Spinrad H (1976) Following Minkowski’s footsteps - A survey of distant radio sources. PASP 88:565–573Spinrad H, Westphal J, Kristian J, Sandage A (1977) Spectroscopy and photometry of the distant radio
galaxy 3C 343.1. Astrophys J Lett 216:L87–L89Springel V, Di Matteo T, Hernquist L (2005a) Modelling feedback from stars and black holes in galaxy
mergers. Mon Not Roy Astro Soc 361:776–794. doi:10.1111/j.1365-2966.2005.09238.x, arXiv:astro-ph/0411108
Springel V, White SDM, Jenkins A, Frenk CS, Yoshida N, Gao L, Navarro J, Thacker R, Croton D, HellyJ, Peacock JA, Cole S, Thomas P, Couchman H, Evrard A, Colberg J, Pearce F (2005b) Simulationsof the formation, evolution and clustering of galaxies and quasars. Nature 435:629–636. doi:10.1038/nature03597, arXiv:astro-ph/0504097
Stanford SA, Eisenhardt PR, Brodwin M, Gonzalez AH, Stern D, Jannuzi BT, Dey A, Brown MJI,McKenzie E, Elston R (2005) An IR-selected galaxy cluster at z = 1.41. Astrophys J Lett 634:L129–L132. doi:10.1086/499045, arXiv:astro-ph/0510655
Steidel CC, Adelberger KL, Dickinson M, Giavalisco M, Pettini M, Kellogg M (1998) A large structure ofgalaxies at redshift Z approximately 3 and its cosmological implications. Astrophys J 492:428. doi:10.1086/305073, arXiv:astro-ph/9708125
Steidel CC, Adelberger KL, Shapley AE, Pettini M, Dickinson M, Giavalisco M (2000) Lyα Imaging ofa Proto-Cluster Region at z = 3.09. Astrophys J 532:170–182. doi:10.1086/308568, arXiv:astro-ph/9910144
Steidel CC, Adelberger KL, Shapley AE, Erb DK, Reddy NA, Pettini M (2005) Spectroscopic Identifica-tion of a Protocluster at z = 2.300: environmental dependence of galaxy properties at high redshift.Astrophys J 626:44–50. doi:10.1086/429989, arXiv:astro-ph/0502432
Stern D, Dey A, Spinrad H, Maxfield L, Dickinson M, Schlegel D, González RA (1999) New high-redshiftradio galaxies from the MIT-Green Bank Catalog. Astron J 117:1122–1138. doi:10.1086/300770,arXiv:astro-ph/9811344
Stevens JA, Ivison RJ, Dunlop JS, Smail IR, Percival WJ, Hughes DH, Röttgering HJA, van Breugel WJM,Reuland M (2003) The formation of cluster elliptical galaxies as revealed by extensive star formation.Nature 425:264–267, arXiv:astro-ph/0309495
Straughn AN, Cohen SH, Ryan RE, Hathi NP, Windhorst RA, Jansen RA (2006) Tracing galaxy assem-bly: tadpole galaxies in the hubble ultra deep field. Astrophys J 639:724–730. doi:10.1086/499576,arXiv:astro-ph/0511423
Suwa T, Habe A, Yoshikawa K (2006) Protoclusters in the CDM Universe. Astrophys J Lett 646:L5–L8.doi:10.1086/506607, arXiv:astro-ph/0606292
Tadhunter CN, Morganti R, Robinson A, Dickson R, Villar-Martín M, Fosbury RAE (1998) The nature ofthe optical-radio correlations for powerful radio galaxies. Mon Not Roy Astro Soc 298:1035–1047,astro-ph/9807238
Tananbaum H (2006) The Constellation X-ray Mission. Bull Am Astron Soci 38:393Taniguchi Y, Shioya Y (2001) A new interpretation of chain galaxies at high redshift. Astrophys J 547:146–
153. doi:10.1086/318369, arXiv:astro-ph/0008379Thomas D, Maraston C, Bender R, Mendes de Oliveira C (2005) The epochs of early-type galaxy formation
as a function of environment. Astrophys J 621:673–694. doi:10.1086/426932, arXiv:astro-ph/0410209Thompson D, Djorgovski S, Vigotti M, Grueff G (1994) Identifications and spectroscopy of faint radio
galaxies from the B3 VLA survey. Astron J 108:828–836. doi:10.1086/117114Tielens AGGM, Miley GK, Willis AG (1979) Westerbork observations of 4C sources with steep radio
spectra. Astron & Astrophys Suppl 35:153Urry C (2004) AGN Unification: An Update. In: Richards GT, Hall PB (eds) AGN Physics with the Sloan
Digital Sky Survey, Astronomical Society of the Pacific Conference Series, vol 311, pp 49Urry CM, Padovani P (1995) Unified Schemes for Radio-Loud Active Galactic Nuclei. PASP 107:803,
arXiv:astro-ph/9506063Uson JM, Bagri DS, Cornwell TJ (1991) Radio detections of neutral hydrogen at redshift Z = 3.4. Phys
Rev Lett 67:3328–3331van Breugel W, Heckman T, Butcher H, Miley G (1984) Extended optical line emission from 3C 293—Radio
jets propagating through a rotating gaseous disk. Astrophys J 277:82–91. doi:10.1086/161673van Breugel W, Filippenko AV, Heckman T, Miley G (1985a) Minkowski’s object - A starburst triggered
by a radio jet. Astrophys J 293:83–93. doi:10.1086/163216van Breugel W, Miley G, Heckman T, Butcher H, Bridle A (1985b) Optical emission-line gas associated
with the radio source 3C 277.3. Astrophys J 290:496–500. doi:10.1086/163007
123

Distant radio galaxies and their environments 143
van Breugel W, De Breuck C, Stanford SA, Stern D, Röttgering H, Miley G (1999) A Radio Galaxy atZ = 5.19. Astrophys J Lett 518:L61–L64. doi:10.1086/312080, arXiv:astro-ph/9904272
van Breugel WJM, Dey A (1993) Induced star formation in a radio lobe of 3C 285? Astrophys J 414:563–572. doi:10.1086/173103
van Breugel WJM, Stanford SA, Spinrad H, Stern D, Graham JR (1998) Morphological Evolution in High-Redshift Radio Galaxies and the Formation of Giant Elliptical Galaxies. Astrophys J 502:614. doi:10.1086/305925, arXiv:astro-ph/9803019
van Groningen E, Miley GK, Norman CA (1980) One-sided jets in extragalactic radiosources. Astron &Astrophys 90:L7–L9
van Ojik R, Rottgering HJA, Miley GK, Bremer MN, Macchetto F, Chambers KC (1994) TX0211-122: Astarburst radio galaxy at Z = 2.34. Astron & Astrophys 289:54–60
van Ojik R, Röttgering HJA, Carilli CL, Miley GK, Bremer MN, Macchetto F (1996) A powerful radiogalaxy at z = 3.6 in a giant rotating Lyman α halo. Astron & Astrophys 313:25–44, astro-ph/9608099
van Ojik R, Röttgering HJA, Miley GK, Hunstead RW (1997a) The gaseous environments of radio galaxiesin the early Universe: kinematics of the Lyman α emission and spatially resolved H I absorption.Astron & Astrophys 317:358–384, astro-ph/9608092
van Ojik R, Röttgering HJA, van der Werf PP, Miley GK, Carilli CL, Visser A, Isaak KG, Lacy M, JennessT, Sleath J, Wink J (1997b) A search for molecular gas in high redshift radio galaxies. Astron &Astrophys 321:389–396, arXiv:astro-ph/9610170
Venemans BP, Kurk JD, Miley GK, Röttgering HJA, van Breugel W, Carilli CL, De Breuck C, Ford H,Heckman T, McCarthy P, Pentericci L (2002) The Most Distant Structure of Galaxies Known: AProtocluster at z = 4.1. Astrophys J Lett 569:L11–L14. doi:10.1086/340563, astro-ph/0203249
Venemans BP, Röttgering HJA, Overzier RA, Miley GK, De Breuck C, Kurk JD, van Breugel W,Carilli CL, Ford H, Heckman T, McCarthy P, Pentericci L (2004) Discovery of six Lyα emitters neara radio galaxy at z ∼ 5.2. Astron & Astrophys 424:L17–L20. doi:10.1051/0004-6361:200400041,astro-ph/0408520
Venemans BP, Röttgering HJA, Miley GK, Kurk JD, De Breuck C, Overzier RA, van Breugel WJM, CarilliCL, Ford H, Heckman T, Pentericci L, McCarthy P (2005) Properties of Lyα emitters around theradio galaxy MRC 0316-257. Astron & Astrophys 431:793–812. doi:10.1051/0004-6361:20042038,astro-ph/0501259
Venemans BP, Röttgering HJA, Miley GK, van Breugel WJM, de Breuck C, Kurk JD, Pentericci L, StanfordSA, Overzier RA, Croft S, Ford H (2007) Protoclusters associated with z > 2 radio galaxies . I. Char-acteristics of high redshift protoclusters. Astron & Astrophys 461:823–845. doi:10.1051/0004-6361:20053941, arXiv:astro-ph/0610567
Vernet J, Fosbury RAE, Villar-Martín M, Cohen MH, Cimatti A, di Serego Alighieri S, Goodrich RW(2001a) Erratum: Radio galaxies at z ∼ 2.5: Results from Keck spectropolarimetry. Astron & Astro-phys 370:407–408. doi:10.1051/0004-6361:20010396
Vernet J, Fosbury RAE, Villar-Martín M, Cohen MH, Cimatti A, di Serego Alighieri S, Goodrich RW(2001b) Radio galaxies at z ∼ 2.5: Results from Keck spectropolarimetry. Astron & Astrophys 366:7–25. doi:10.1051/0004-6361:20000076, astro-ph/0010640
Villar-Martín M (2007) Giant Lyα nebulae in the high redshift (z > 2) Universe. New Astro Review51:194–201. doi:10.1016/j.newar.2006.11.017, arXiv:astro-ph/0611763
Villar-Martín M, Binette L (1996) CA depletion and the presence of dust in large scale nebulosities inradiogalaxies. I. Astron & Astrophys 309:97–108, astro-ph/9511113
Villar-Martín M, Binette L (1997) CA depletion and the presence of dust in large scale nebulosities inradiogalaxies. II. Astron & Astrophys 317:350–357, astro-ph/9605195
Villar-Martín M, Binette L, Fosbury RAE (1996) The effects of resonance scattering and dust on the UVline spectrum of radio galaxies. Astron & Astrophys 312:751–760, astro-ph/9605009
Villar-Martín M, Tadhunter C, Clark N (1997) The ionisation mechanism of the extended gas in high redshiftradio galaxies: shocks or AGN photoionisation? Astron & Astrophys 323:21–30, astro-ph/9701016
Villar-Martín M, Tadhunter C, Morganti R, Clark N, Killeen N, Axon D (1998) PKS 1932-464: a jet-cloudinteraction in a radio galaxy? Astron & Astrophys 332:479–492, astro-ph/9801039
Villar-Martín M, Binette L, Fosbury RAE (1999a) The nature of the extreme kinematics in the extendedgas of high redshift radio galaxies. Astron & Astrophys 346:7–12, astro-ph/9903122
Villar-Martín M, Tadhunter C, Morganti R, Axon D, Koekemoer A (1999b) PKS 2250-41 and the role of jet-cloud interactions in powerful radio galaxies. Mon Not Roy Astro Soc 307:24–40, astro-ph/9901201
123

144 G. Miley, C. De Breuck
Villar-Martín M, Alonso-Herrero A, di Serego Alighieri S, Vernet J (2000) Interpreting the kinematics ofthe extended gas in distant radiogalaxies from 8-10 m telescope spectra. Astron & Astrophys Suppl147:291–297, astro-ph/0009275
Villar-Martín M, De Young D, Alonso-Herrero A, Allen M, Binette L (2001) Shocks and dust survival innearby active galaxies: implications for the alignment effect. Mon Not Roy Astro Soc 328:848–854.doi:10.1046/j.1365-8711.2001.04916.x, astro-ph/0108340
Villar-Martín M, Vernet J, di Serego Alighieri S, Fosbury R, Pentericci L, Cohen M, Goodrich R, HumphreyA (2002) Giant low surface brightness haloes in distant radio galaxies: USS0828+193. Mon Not RoyAstro Soc 336:436–444. doi:10.1046/j.1365-8711.2002.05751.x, arXiv:astro-ph/0206118
Villar-Martín M, Vernet J, di Serego Alighieri S, Fosbury R, Humphrey A, Pentericci L (2003) Kinematicallyquiet haloes around z∼ 2.5 radio galaxies. Keck spectroscopy. Mon Not Roy Astro Soc 346:273–294.doi:10.1046/j.1365-2966.2003.07090.x, astro-ph/0309012
Villar-Martín M, Tadhunter C, Morganti R, Holt J (2005) The giant star forming halo associated withthe radio galaxy PKS 1932-46. Mon Not Roy Astro Soc 359:L5–L9. doi:10.1111/j.1745-3933.2005.00022.x, astro-ph/0501414
Villar-Martín M, Gómez JL, González Delgado R, Pérez E (eds) (2006a) The Granada workshop on HighRedshift Radio Galaxies, vol 327
Villar-Martín M, Sánchez SF, De Breuck C, Peletier R, Vernet J, Rettura A, Seymour N, Humphrey A,Stern D, di Serego Alighieri S, Fosbury R (2006b) VIMOS-VLT and Spitzer observations of a radiogalaxy at z = 2.5. Mon Not Roy Astro Soc 366:L1–L5. doi:10.1111/j.1745-3933.2005.00118.x,astro-ph/0510733
Villar-Martín M, Humphrey A, De Breuck C, Fosbury R, Binette L, Vernet J (2007a) Lyα excess in high-redshift radio galaxies: a signature of star formation. Mon Not Roy Astro Soc 375:1299–1310. doi:10.1111/j.1365-2966.2006.11371.x, astro-ph/0612116
Villar-Martín M, Sánchez SF, Humphrey A, Dijkstra M, di Serego Alighieri S, De Breuck C, GonzálezDelgado R (2007b) VIMOS-VLT spectroscopy of the giant Lyα nebulae associated with three z ∼2.5 radio galaxies. Mon Not Roy Astro Soc 378:416–428. doi:10.1111/j.1365-2966.2007.11811.x,arXiv:0704.1116
Weidinger M, Møller P, Fynbo JPU (2004) The Lyman-α glow of gas falling into the dark matter halo of az = 3 galaxy. Nature 430:999–1001. doi:10.1038/nature02793, arXiv:astro-ph/0408478
Weidinger M, Møller P, Fynbo JPU, Thomsen B (2005) The extended Lyman-α emission surrounding thez = 3.04 radio-quiet QSO1205-30: Primordial infalling gas illuminated by the quasar? Astron &Astrophys 436:825–835. doi:10.1051/0004-6361:20042304, arXiv:astro-ph/0503241
White SDM, Rees MJ (1978) Core condensation in heavy halos - A two-stage theory for galaxy formationand clustering. Mon Not Roy Astro Soc 183:341–358
Willott CJ, Rawlings S, Blundell KM, Lacy M, Eales SA (2001) The radio luminosity function from thelow-frequency 3CRR, 6CE and 7CRS complete samples. Mon Not Roy Astro Soc 322:536–552,arXiv:astro-ph/0010419
Willott CJ, Rawlings S, Blundell KM, Lacy M, Hill GJ, Scott SE (2002) Optical spectroscopy of radio gal-axies in the 7C Redshift Survey. Mon Not Roy Astro Soc 335:1120–1132. doi:10.1046/j.1365-8711.2002.05718.x, arXiv:astro-ph/0205507
Wilman RJ, Jarvis MJ, Röttgering HJA, Binette L (2004) HI in the protocluster environment at z > 2: absorb-ing haloes and the Lyα forest. Mon Not Roy Astro Soc 351:1109–1119. doi:10.1111/j.1365-2966.2004.07857.x, arXiv:astro-ph/0403519
Windhorst RA, Burstein D, Mathis DF, Neuschaefer LW, Bertola F, Buson LM, Koo DC, Matthews K,Barthel PD, Chambers KC (1991) The discovery of a young radio galaxy at Z = 2.390—Probinginitial star formation at Z less than approximately 3.0. Astrophys J 380:362–383. doi:10.1086/170596
Yuan W, Fabian AC, Celotti A, Jonker PG (2003) Extended X-ray emission in the high-redshift quasar GB1508+5714 at z = 4.3. Mon Not Roy Astro Soc 346:L7–L10. doi:10.1046/j.1365-2966.2003.07234.x, arXiv:astro-ph/0309318
Zirm AW, Overzier RA, Miley GK, Blakeslee JP, Clampin M, De Breuck C, Demarco R, Ford HC, HartigGF, Homeier N, Illingworth GD, Martel AR, Röttgering HJA, Venemans B, Ardila DR, Bartko F,Benítez N, Bouwens RJ, Bradley LD, Broadhurst TJ, Brown RA, Burrows CJ, Cheng ES, Cross NJG,Feldman PD, Franx M, Golimowski DA, Goto T, Gronwall C, Holden B, Infante L, Kimble RA, KristJE, Lesser MP, Mei S, Menanteau F, Meurer GR, Motta V, Postman M, Rosati P, Sirianni M, SparksWB, Tran HD, Tsvetanov ZI, White RL, Zheng W (2005) Feedback and brightest cluster galaxy for-mation: ACS observations of the radio galaxy TN J1338-1942 at z = 4.1. Astrophys J 630:68–81.doi:10.1086/431921, astro-ph/0505610
123