Module 2: Wildlife Abundance and Habitat
10
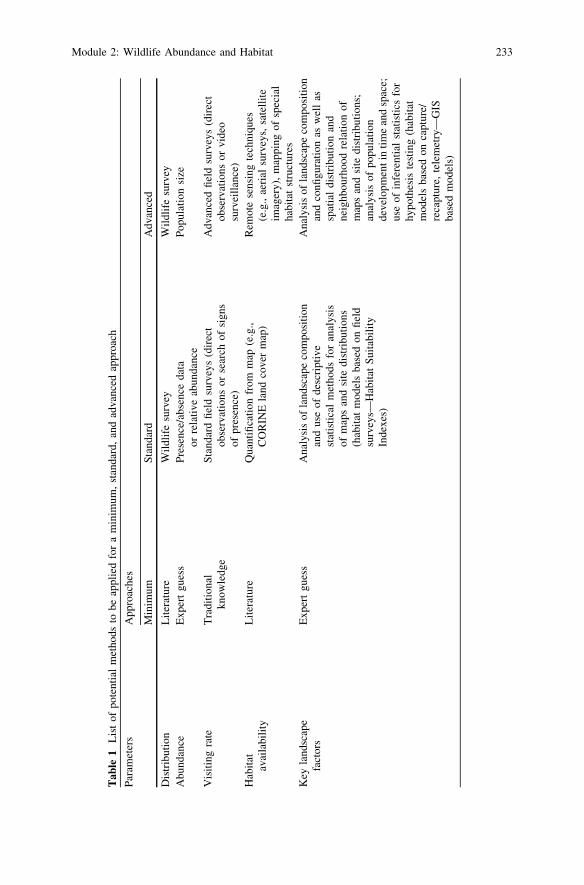
Module 2: Wildlife Abundance and Habitat Margarida Santos-Reis, Reinhard A. Klenke and Klaus Henle Abstract The shared use of natural resources by humans and wildlife is the basis of long-lasting conflicts whose reconciliation is an urgent need. To fully under- stand the degree of damage and the conflict intensity, detailed knowledge is required on the distribution and abundance of animals and thus their visiting rate and contact with vulnerable resources, which in turn vary spatially depending on habitat characteristics and regional resolution instruments. The purpose of this module is to assess how landscape factors and resource management factors influence wildlife abundance and the exposure and vulnerability of the resource to wildlife. Abundance estimates and species-habitat associations are the two key factors in this context. Three approaches are presented (minimum, standard and advanced), varying in time and funding needs, and these range from literature- based educated guesses to powerful predictors using field-survey datasets, as described. We suggest as a first step the standard approach and only if evidences support a strong influence of landscape factors select an advanced approach in a later step of the reconciliation process. M. Santos-Reis (&) Centro de Biologia Ambiental/Departamento de Biologia Animal, Faculdade de Ciências, Universidade de Lisboa, Campo Grande, Bloco C2, 58 Piso, 1749-016 Lisbon, Portugal e-mail: [email protected] R. A. Klenke Á K. Henle Department of Conservation Biology, UFZ—Helmholtz Centre for Environmental Research, Permoserstraße 15, 04318 Leipzig, Germany e-mail: [email protected] K. Henle e-mail: [email protected] R. A. Klenke et al. (eds.), Human-Wildlife Conflicts in Europe, Environmental Science and Engineering, DOI: 10.1007/978-3-540-34789-7_12, Ó Springer-Verlag Berlin Heidelberg 2013 231
Transcript of Module 2: Wildlife Abundance and Habitat
Module 2: Wildlife Abundanceand Habitat
Margarida Santos-Reis, Reinhard A. Klenkeand Klaus Henle
Abstract The shared use of natural resources by humans and wildlife is the basisof long-lasting conflicts whose reconciliation is an urgent need. To fully under-stand the degree of damage and the conflict intensity, detailed knowledge isrequired on the distribution and abundance of animals and thus their visiting rateand contact with vulnerable resources, which in turn vary spatially depending onhabitat characteristics and regional resolution instruments. The purpose of thismodule is to assess how landscape factors and resource management factorsinfluence wildlife abundance and the exposure and vulnerability of the resource towildlife. Abundance estimates and species-habitat associations are the two keyfactors in this context. Three approaches are presented (minimum, standard andadvanced), varying in time and funding needs, and these range from literature-based educated guesses to powerful predictors using field-survey datasets, asdescribed. We suggest as a first step the standard approach and only if evidencessupport a strong influence of landscape factors select an advanced approach in alater step of the reconciliation process.
M. Santos-Reis (&)Centro de Biologia Ambiental/Departamento de Biologia Animal, Faculdade de Ciências,Universidade de Lisboa, Campo Grande, Bloco C2, 58 Piso, 1749-016 Lisbon, Portugale-mail: [email protected]
R. A. Klenke � K. HenleDepartment of Conservation Biology, UFZ—Helmholtz Centre for Environmental Research,Permoserstraße 15, 04318 Leipzig, Germanye-mail: [email protected]
K. Henlee-mail: [email protected]
R. A. Klenke et al. (eds.), Human-Wildlife Conflicts in Europe,Environmental Science and Engineering, DOI: 10.1007/978-3-540-34789-7_12,� Springer-Verlag Berlin Heidelberg 2013
231

1 Rationale and Objectives
Landscape factors influence the distribution and abundance of animals and thus theirvisiting rate and contact with vulnerable resources. Therefore, conflicts may stronglydiffer from landscape to landscape and from location to location within a landscape. Thepurpose of this module is to assess how landscape factors and resource managementfactors influence wildlife abundance and the exposure and vulnerability of the resourceto wildlife. Together with modules 3 (Damage assessment), 5 (Economic and policyanalysis), and 6 (Stakeholder analysis) it will provide spatially differentiated informationabout the degree of damage and the conflict intensity.
The module ‘‘Wildlife abundance and habitat’’ is important whenever thescreening process indicates strong spatial differentiation of the conflict and locallyor regionally differentiated resolution instruments are available or a feasibleoption. It helps addressing the following questions:
• How abundant is the wildlife species and how is their distribution within theconflict area?
• How frequent is its contact with the resource?• Are landscape factors influencing the local status of wildlife and, therefore,
influencing the conflict, e.g., by promoting or preventing losses of commerciallyimportant fish or damage to fishing gear?
• Do we have local problems triggered by conditions and processes at another siteor scale?
Different landscapes are not equally attractive and do not have the same car-rying capacity, e.g., rivers, streams, or small and large ponds in the case of fishpredators. Characteristics of water bodies (e.g., water surface of ponds, percentageof bank cover, fish density) and of the surrounding area (e.g., land cover, density ofwater bodies) explain spatial differences in wildlife occupancy with implicationsfor the intensity of the conflict. In the marine area the concept of landscape factorsis not yet as well developed as for terrestrial habitats, but like in these, structure ofthe sea floor, currents, ice cover, distance to breeding sites, etc. are correspondingfactors that may influence the distribution of the wildlife and/or the resource andcause spatial differences in conflicts. The same applies to estuarine areas whereadditional factors, such as the salinity gradient and the distance to freshwatersources, are spatially differentiated and may influence both the fish-eaters and thewild fish species that may act as important alternative prey to the former.
2 Methods and Approaches
Abundance estimates and species-habitat associations are the two key factors thatmust be assessed in order to understand how landscape factors and resourcemanagement factors influence the exposure and vulnerability of the resource towildlife.
232 M. Santos-Reis et al.
Tab
le1
Lis
tof
pote
ntia
lm
etho
dsto
beap
plie
dfo
ra
min
imum
,st
anda
rd,
and
adva
nced
appr
oach
Par
amet
ers
App
roac
hes
Min
imum
Sta
ndar
dA
dvan
ced
Dis
trib
utio
nL
iter
atur
eW
ildl
ife
surv
eyW
ildl
ife
surv
eyA
bund
ance
Exp
ert
gues
sP
rese
nce/
abse
nce
data
orre
lati
veab
unda
nce
Pop
ulat
ion
size
Vis
itin
gra
teT
radi
tion
alkn
owle
dge
Sta
ndar
dfi
eld
surv
eys
(dir
ect
obse
rvat
ions
orse
arch
ofsi
gns
ofpr
esen
ce)
Adv
ance
dfi
eld
surv
eys
(dir
ect
obse
rvat
ions
orvi
deo
surv
eill
ance
)H
abit
atav
aila
bili
tyL
iter
atur
eQ
uant
ifica
tion
from
map
(e.g
.,C
OR
INE
land
cove
rm
ap)
Rem
ote
sens
ing
tech
niqu
es(e
.g.,
aeri
alsu
rvey
s,sa
tell
ite
imag
ery)
,m
appi
ngof
spec
ial
habi
tat
stru
ctur
esK
eyla
ndsc
ape
fact
ors
Exp
ert
gues
sA
naly
sis
ofla
ndsc
ape
com
posi
tion
and
use
ofde
scri
ptiv
est
atis
tica
lm
etho
dsfo
ran
alys
isof
map
san
dsi
tedi
stri
buti
ons
(hab
itat
mod
els
base
don
fiel
dsu
rvey
s—H
abit
atS
uita
bili
tyIn
dexe
s)
Ana
lysi
sof
land
scap
eco
mpo
siti
onan
dco
nfigu
rati
onas
wel
las
spat
ial
dist
ribu
tion
and
neig
hbou
rhoo
dre
lati
onof
map
san
dsi
tedi
stri
buti
ons;
anal
ysis
ofpo
pula
tion
deve
lopm
enti
nti
me
and
spac
e;us
eof
infe
rent
ial
stat
isti
csfo
rhy
poth
esis
test
ing
(hab
itat
mod
els
base
don
capt
ure/
reca
ptur
e,te
lem
etry
—G
ISba
sed
mod
els)
Module 2: Wildlife Abundance and Habitat 233
2.1 Minimum Approach
A minimum requirement should be a review of readily accessible literature ondistribution, habitat requirements, and habitat preferences of the conflict species(see Table 1). In addition, expert knowledge may be consulted with the advantagethat experts are usually familiar with the relevant literature, but having the dis-advantage that they may belong to specific interest groups within the conflict. Ifavailable data prove to be insufficient or inadequate to assess key factors, field-work, as outlined in the standard approach, is mandatory.
2.2 Standard Approach
A standard approach, which will suffice for most purposes, will be to collect dataon the presence and relative abundance of the wildlife species and on landscapeand human resource factors (e.g., fish stocking densities) assumed to be importantfor the attraction of the wildlife to the resource (see Table 1). The extent ofdamages depends on a mixed set of factors (e.g., availability of alternative prey,multi-species-interactions), more than just the distribution and abundance of thewildlife species. However, the contact with vulnerable resources (visiting rate)
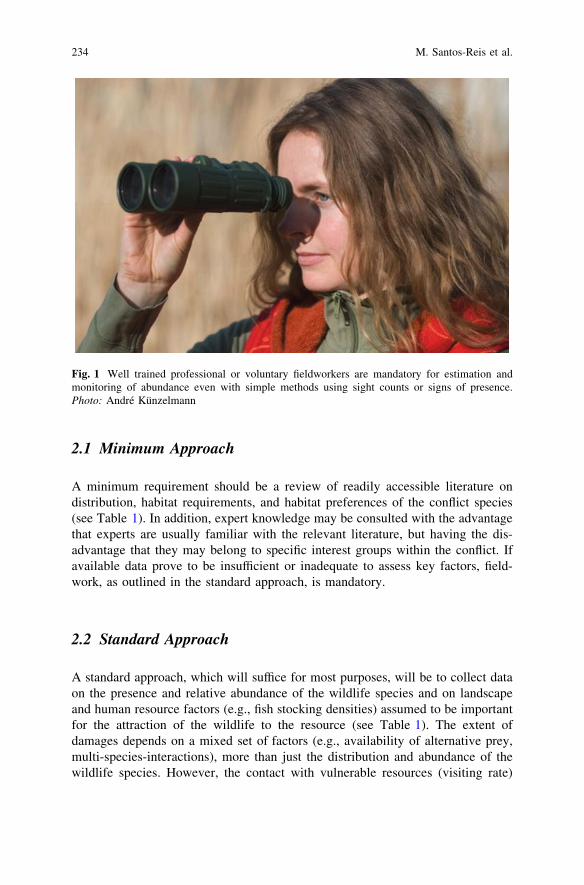
Fig. 1 Well trained professional or voluntary fieldworkers are mandatory for estimation andmonitoring of abundance even with simple methods using sight counts or signs of presence.Photo: André Künzelmann
234 M. Santos-Reis et al.

may contribute to the understanding of the species occupancy pattern and mayexplain perceived damage.
Measurements done by direct observation have the advantage of providing thenumber of animals visiting the resource, but may be time consuming or impossible(e.g., for carnivores), and the mere presence of the observer may influence thevisiting rate (Fig. 1). The number of signs or frequency with which they areobserved in repeated surveys, provides a relative index of visiting rates, notabsolute numbers of animals visiting the resource. In most cases this should besufficient. When using signs of presence, it is mandatory to have trained field-workers. For methodological recommendations to assess visiting rates see Box 1.
Box 1 Visiting Rates and Population Size
Visiting rates are a measurement of the number of times a species encountersthe resource during a certain time span (e.g., day, week). This may be donethrough direct observation of the animals (e.g., birds) or indirectly bysearching specific signs of presence (e.g., carnivores) or by assessingdamage caused to fishing gear (e.g., marine mammals). Measurementsshould be repeated systematically in order to have a reliable value. It mightalso be important to replicate this measurement in time (e.g., seasonally) ifthe biology of the species indicates that its presence varies significantly withtime (e.g., migratory species, species with changes in habitat use duringbreeding). Replicates will allow a better assessment of wildlife impacts oncontested resources.The search of tracks and/or faeces is a common field method when studyingcryptic animals, such as the otter. In the frame of the FRAP project, ottervisiting rates to selected fish ponds were assessed based on repetitive moni-toring of old and fresh spraints. Ponds were checked weekly and the presence(or absence) of fresh (from previous night) and old (from the other six nights)spraints was recorded. A new maximum likelihood approach was developed toestimate the probability of the species visiting the resource per day. Resultsfrom a simulation experiment show that the estimator provides an unbiasedand precise estimate if the sampling effort is strong (5–20 weeks) and theweekly visiting rates lie between 0.1 and 0.6.In a more advanced approach, field surveys may assess visiting rates withvideo surveillance and supply the number and behavior of animals involvedin those visits. Important limitations are that video-surveillance is expensive,time-consuming in the tape analysis, and cannot be applied to a large scale,besides needing to be optimized case by case (e.g., number and position ofvideo cameras). It may be, however, the only solution to understand thereason why in specific situations high visiting rates, assessed through scatand footprint counting, do not correlate with the damage extent in terms ofdiet (e.g., otters in Sado Estuary, Portugal—Sales-Luís et al. 2009) and viceversa.
Module 2: Wildlife Abundance and Habitat 235
Visiting rates may be used as a surrogate of population abundance but do notnecessarily correlate to population size, a parameter required in advancedapproaches. For some species population size can be calculated preciselythrough direct observation (e.g., birds at breeding colonies) and regularmonitoring provides time series data on trends, most useful in advancedapproaches. For others, however, to obtain even a relative index of abun-dance (standard approach) is a rather difficult task, as is the case of mostcarnivores that are mainly solitary, nocturnal, extremely elusive, and live atlow densities. Absolute numbers, necessary for advanced approaches, can beestimated only under special environmental conditions (e.g., new snowcover) or taking profit of recent advances in molecular tools using scats(molecular scatology). Molecular scat analysis is a costly and time-con-suming technique that still has a relatively low rate of success in samplescollected in adverse environmental conditions (e.g., extremely high tem-peratures or level of humidity) and/or incorrectly preserved until analysis,two factors that contribute to DNA degradation. As a methodologicalguideline for estimating relative and absolute numbers of wildlife species,Caughley (1980) is still the best reference for non-specialist users. For userswith more advanced statistical skills, Williams et al. (2002) is recommended.For species specific survey methods Cooperrider et al. (1986) is a very usefulresource. The estimation of visiting rates, as developed and used in theFRAP-project, is described in detail by Gruber et al. (2008).
Based on distribution pattern and habitat requirements, simple species-habitatassociation models can be developed. The advantage of habitat modelling pro-cedures is that the probability of presence or relative abundance of the wildlifespecies can be extrapolated to larger areas and distribution maps can be producedquickly and efficiently, especially if inexpensive environmental data that coverlarge regions are available. See Box 2 ‘‘Habitat analysis and habitat modeling’’ fortechnical and statistical recommendations. Limitations do exist, however, andthese are related to the scale and quality of the datasets (e.g., whereas data may bevery concrete and easily available for some resources, such as fish in small win-tering ponds, they may be extremely difficult to collect in some cases, such as inmarine fish resources) as well as to the time and funding available. Also, whenextrapolating across large spatial scales, one needs to keep in mind that theimportance of landscape factors may change in different types of landscapes.
Box 2 Habitat Analysis and Habitat Modeling
Presence/absence data, either geo-referenced or mapped over a grid system,can be associated to a series of environmental descriptors. They are widelyused to develop habitat models that allow extrapolation to non-sampledareas. Various statistical methods exist to derive habitat models from fielddata, such as simple habitat suitability models, which group environmental
236 M. Santos-Reis et al.

data into classes based on species distribution data, or multivariate statisticalmodels (logistic regression, discriminant analysis, Generalized LinearModels—GLM, Generalized Additive Models—GAM) to predict the loca-tion and extent of habitat for wildlife species. Recent developments in thefield of computational ecology allow the use of mixed ecological datasets,including individual capture/recapture and radio-tracking data. GeographicInformation Systems (GIS) facilitate an optimal use of existing spatial data,e.g., on land cover, soils, geology, or topography. By combining mathe-matical and computer models of natural systems with geographically explicitdetails of the biotic and abiotic components of the environment, theunderstanding of natural systems and the ability to properly manage it and topredict the effects of alternative management options is improved.Most methods require species presence and absence data, with presencesattesting a suitable habitat and absences an unsuitable habitat. An overviewof relevant statistical methods can be found in Corsi et al. (2000). There is,however, an important constraint, which is the fact that blank areas areambiguous as to whether the species is really absent or no records wereavailable. Recent developments in this area include modeling species habitatsuitability with presence only data, a new area that deserves to be furtherexplored (e.g., Hirzel et al. 2002; Pearce and Boyce 2006). Model validationtechniques are however needed to ensure that model predictions are notstatistic artifacts.The sampling points selected for the development of habitat models in thefirst step should cover the whole range of variation of the landscape factorsand should be spaced as far apart as feasible to avoid autocorrelation andpseudo-replication.The advantage of habitat modeling procedures is that, if inexpensive envi-ronmental data covering larger regions are available, the probability ofpresence or relative abundance of the wildlife species can be estimated anddistribution maps can be produced quickly and efficiently.
2.3 Advanced Approach
If the screening process indicates that the conflict may have very strong spatiallydifferentiated components and spatially differentiated mitigation or managementinstruments may be feasible, one should consider the advanced approach, whichconsists of estimating the population size (density) of the wildlife species (Box 1),which then can be related to landscape factors using more sophisticated statisticalmethods (Box 2). The calculation of real loss, based on consumption rates of theresource by wildlife, also requires knowledge of absolute numbers of wildlifevisits to the resource (modules 3 and 5) obtainable only with advanced approaches.Finally, knowledge of the population size of the wildlife species or the carrying
Module 2: Wildlife Abundance and Habitat 237
capacity of the habitat is usually needed for the modeling of the viability of thewildlife species under different management scenarios. Such more in-depthanalyses are usually called for if the adequacy of financial compensations for lossof resources to wildlife may be a key driver of the conflict.
3 Recommendations and Conclusions
Each wildlife species is associated with key landscape factors that are undoubtedlydriving its distribution and density at a certain geographic area. These associationsmay change through time (e.g., seasonally) or space (within its full range) and inturn have a differentiated impact upon the extent of damage the wildlife speciesmay cause. Responses of wildlife to changing landscapes or human resource usefurthermore influence population viability (module 8) and determine which tech-nical mitigation measures are adequate, and where and when they have to be used(module 7). The use of spatially differentiated approaches and the coordination ofthese with mitigation measures (module 7) and policy instruments (module 9) arecrucial to mitigate conflicts (Reimoser 2002).
Therefore, it is mandatory to have updated information on the distribution andstatus of the wildlife species involved in the conflict. Table 1 summarizes potentialapproaches. This may be comparably easy with terrestrial species that are easilyseen and identified (e.g., cormorants) or, although elusive, do leave veryconspicuous and characteristic signs of presence (e.g., otters), but may be moredifficult with wide-ranging marine species (e.g., seals) that need appropriatetechnical means, leaving as an option the carrying out of oral inquiries to relevantinterest groups. However, the presence of a predator at a given conflict area alonedoes not provide sufficient information about the extent of damage the species maycause. To accurately predict the predatory impact, an abundance estimator ishighly recommended. Varying with the species body size, life-style (solitaryvs. gregarious), activity pattern (diurnal vs. nocturnal), and habitat requirements(generalist vs. specialist), this is usually difficult, time-consuming, and needshighly qualified personnel, being however the only option in some situations.
Complementarily, to identify key landscape features that are influencing theoccupancy pattern and abundance of the wildlife species, the use of the freelyavailable CORINE land cover map is recommended as the best possible approachwith limited resources. More expensive (high resolution maps) or time-consuming(field surveys) methods should be restricted to situations where conflict recon-ciliation clearly requires a spatially differentiated approach.
Identification of landscape factors promoting damage to fish farms requiresgood datasets. As outlined in module 3 (Damage assessment), wildlife may have alarge local impact, either directly (fish eaten, damaged or disturbed) or indirectly(damage to catch and gear) (Freitas et al. 2007; Santos-Reis et al. 2013). Land-scape factors that contribute to the carrying capacity of an area may be useful toassess the risk of impact to fisheries. These, however, act at different scales
238 M. Santos-Reis et al.
according to the species and the area. For migratory species (e.g., birds) and forwide ranging marine species (e.g., seals) the landscape scale seems to be theappropriate one, although the relevant factors may be difficult to manage directlyand indirect measures may be needed. For small sized terrestrial species, however,local scale factors better explain damages, and relevant factors may be modified toreduce predation.
In summary, the minimum approach only provides an educated guess about thekey landscape factors that may be influencing wildlife numbers and distribution,and hence about the potential extent of damage (low, medium, or high). With thestandard approach the reliability of the results provides a much better insight intothe conflict. Advanced approaches result in more powerful predictors but are moreexpensive, more time-consuming, and require specialized manpower. Specificallytargeted research projects may be essential for an adjustment of methods to thespecific problem at hand. The obvious way to handle these trade-offs is to use as afirst step the standard approach and then, if the results reveal that landscape factorsare crucial in conflict reconciliation, select an advanced approach in a later step ofthe reconciliation process or try to get the support of a research organization thathas the expertise and scientific interest to pursue an advanced approach.
References
Caughley G (1980) Analysis of vertebrate populations. Wiley, New YorkCooperrider AY, Boyd RJ, Stuart HR (1986) Inventory and monitoring of wildlife habitat. United
States Department of the Interior, Bureau of Land Management, Service Centre, DenverCorsi F, de Leeuw J, Skidmore A (2000) Modelling species distribution with GIS. In: Boitani L,
Fuller T (eds) Research techniques in animal ecology: controversies and consequences.Columbia University Press, New York, pp 389–434
Freitas D, Gomes J, Sales Luís T, Madruga L, Marques C, Baptista G, Rosalino LM, Antunes P,Santos R, Santos-Reis M (2007) Otters and fish farms in the Sado Estuary: ecological andsocio-economic basis of a conflict. Hydrobiologia 587:51–62
Gruber B, Reineking B, Calabrese JM, Kranz A, Poledníková K, Poledník L, Klenke R, ValentinA, Henle K (2008) A new method for estimating visitation rates of cryptic animals viarepeated surveys of indirect signs. J Appl Ecol 45:728–735
Hirzel AH, Hausser J, Chessel D, Perrin N (2002) Ecological-niche factor analysis. How tocompute habitat-suitability maps without absence data. Ecology 83:2027–2036
Pearce JL, Boyce MS (2006) Modelling distribution and abundance with presence-only data.J Appl Ecol 43:405–418
Reimoser F (2002) Wildlife ecological spatial planning (WESP): an instrument for integratingwildlife into comprehensive land management. In: Proceedings of the XXIVth congress of theinternational union of game biologists (Thessaloniki, 1999), pp 176–185
Santos-Reis M, Santos R, Antunes P, Sales-Luís T, Gomes J, Freitas D, Madruga L (2013)Reconciliation of the conflict between otters and fish farmers: lessons from Sado estuary inPortugal. In: Klenke R, Ring I, Kranz A, Jepsen N, Rauschmayer R, Henle K (eds) Human-wildlife conflicts in Europe—fisheries and fish-eating vertebrates as a model case. Springer,Heidelberg, doi:10.1007/978-3-540-34789-7_4
Santos-Reis M, Santos R, Antunes P, Sales-Luís T, Gomes J, Freitas D, Madruga L (2013)Reconciliation of the conflict between otters and fish farmers: lessons from Sado estuary in
Module 2: Wildlife Abundance and Habitat 239
Portugal. In: Klenke R, Ring I, Kranz A, Jepsen N, Rauschmayer R, Henle K (eds) Human-wildlife conflicts in Europe—fisheries and fish-eating vertebrates as a model case. Springer,Heidelberg, pp 30–30
Williams BK, Nichols JD, Conroy MJ (2002) Analysis and management of animal populations.Academic Press, San Diego
Free and Commercial Software for Statistical Analysis and GIS
ArcGIS—ESR. http://www.esri.com. Accessed 08 July 2009BioMapper. http://www2.unil.ch/biomapper/. Accessed 08 July 2009GRASS GIS—The world leading free software GIS. http://grass.fbk.eu. Accessed 08 July 2009R Development Core Team (2006) R: a language and environment for statistical computing. R
foundation for statistical computing, Vienna, Austria. http://www.r-project.org. Accessed 28Aug 2006
SAGA GIS—A system for an automated geographical analysis. http://www.saga-gis.org/en/index.html. Accessed 27 June 2012
Web Pages
CRAN Task View: Analysis of ecological and environmental data. http://cran.r-project.org/web/views/Environmetrics.html. Accessed 08 July 2009
European Environmental Agency (EEA) dataservice. http://dataservice.eea.eu.int/dataservice.Accessed 08 July 2009
Free GIS software and data. http://www.freegis.org. Accessed 08 July 2009Habitat Evaluation Procedures Handbook. http://www.fws.gov/policy/ESMindex.html. Accessed
08 July 2009Patuxent Software Archive. http://www.mbr-pwrc.usgs.gov/software.html. Accessed 08 July
2009phidot.org home page. http://www.phidot.org. Accessed 08 July 2009USGS National Wetlands Research Center: Habitat Suitability Index Models Introduction. http://
www.nwrc.usgs.gov/wdb/pub/hsi/hsiintro.html. Accessed 08 July 2009
240 M. Santos-Reis et al.