Rhizosphere Colonization: Molecular Determinants from Plant-Microbe Coexistence Perspective
1 3
Oecologia (2014) 176:193–206DOI 10.1007/s00442-014-3010-y
COmmunIty eCOlOgy - OrIgInal researCh
Niche‑habitat mechanisms and biotic interactions explain the coexistence and abundance of congeneric sandgrouse species
Ana Benítez‑López · Javier Viñuela · Francisco Suárez · Israel Hervás · Jesús T. García
received: 10 January 2014 / accepted: 25 June 2014 / Published online: 15 July 2014 © springer-Verlag Berlin heidelberg 2014
environmental conditions determine regional densities of pin-tailed sandgrouse whereas biotic interactions explain the density of the black-bellied sandgrouse in areas with abiotic conditions similarly conducive for both species. highly suitable areas for the pin-tailed sandgrouse fall beyond the upper thermal limit of the black-bellied sand-grouse, leading to niche segregation and low densities for the latter. Finally, local niche shift and expansion plus pos-sible heterospecific aggregation allow the pin-tailed sand-grouse to thrive in a priori less favourable environments. this work provides insight into how different mechanisms allow species coexistence and how species densities vary in sympatry compared to allopatry as a result of environ-mental filtering and biotic interactions.
Keywords allopatry · sympatry · Co-occurrence · environmental niche · niche breadth
Introduction
an old yet ongoing challenge for ecologists is ascertaining which factors allow the coexistence between closely related species, which is crucial for understanding the evolution-ary and ecological implications of species interactions (Darwin 1859; Brown 1984). Factors explaining individual species’ ranges, and specially those driving the overlap of related species’ ranges, are complex, and include abiotic (e.g. temperature and precipitation) and biotic factors (e.g. resource availability, competition, and predation) (macar-thur 1972; gaston 2003). the study of how species vary in their requirements and tolerance to these factors has greatly advanced due to the continued conceptual development of analytical techniques for quantifying the niche of species (Chase and leibold 2003; soberón 2007).
Abstract ascertaining which niche processes allow coexistence between closely related species is of special interest in ecology. We quantified variations in the envi-ronmental niches and densities of two congeneric species, the pin-tailed and the black-bellied sandgrouse (Pterocles alchata and Pterocles orientalis) in allopatry and sympa-try under similar abiotic, habitat and dispersal contexts to understand their coexistence. using principal compo-nent analysis, we defined environmental gradients (niche dimensions) including abiotic, habitat and anthropogenic variables, and calculated niche breadth, position and over-lap of both species in sympatry and allopatry. addition-ally, sandgrouse density was modelled as a function of the niche dimensions and the density of the other species. We found evidence that each species occupies distinct environmental niches in sympatry and in allopatry. the black-bellied sandgrouse exploits a broader range of envi-ronmental conditions (wider niche breadth) while the pin-tailed sandgrouse reaches high densities where conditions seem to match its optimum. In sympatry, both species shift their niches to intermediate positions, indicating the importance of abiotic factors in setting coexistence areas.
Communicated by Ola Olsson.
Electronic supplementary material the online version of this article (doi:10.1007/s00442-014-3010-y) contains supplementary material, which is available to authorized users.
a. Benítez-lópez (*) · J. Viñuela · J. t. garcía Instituto de Investigación en recursos Cinegéticos, IreC (CsIC-uClm-JCCm), ronda de toledo s/n, 13071 Ciudad real, spaine-mail: [email protected]
F. suárez · I. hervás Departamento de ecología, edificio de Biología, universidad autónoma de madrid, Calle Darwin 2, 28049 madrid, spain

194 Oecologia (2014) 176:193–206
1 3
hutchinson (1957) defined the niche as a multidimen-sional hypervolume in which a species maintains a viable population. the entire hypervolume under which an organ-ism can potentially exist describes its fundamental niche (abiotic conditions), whereas the portion of the fundamen-tal niche that a species actually occupies due to, in particu-lar, biotic interactions (i.e. competitors or closely related species) defines its realized niche. two niche-based mecha-nisms that explain species distribution and abundance are the niche-breadth and the niche-position hypotheses (gas-ton et al. 1997). the former postulates that species attaining large geographical distributions and occurring at high local densities are capable of this because they occupy a broader range of habitats and exploit diverse environmental condi-tions and resources (Brown 1984). according to the latter, abundant species use resources that are common in the par-ticular area and time or perform successfully under a cer-tain set of environmental conditions [i.e. their niche posi-tion matches the current prevailing conditions (Devictor et al. 2010)], while rare species utilize locally scarce and restricted resources (gaston et al. 1997). the two hypoth-eses are not mutually exclusive (heino 2005) and although the niche-position hypothesis has widely been supported in the past (gaston and Blackburn 2000; gregory and gas-ton 2000; hanski et al. 1993) the niche-breadth hypothe-sis has recently gained support (Brändle and Brandl 2008; slatyer et al. 2013) and both may be complementary (i.e. a species with a broader niche might be more likely to have widespread environmental conditions included within that niche).
although single-species studies are useful for uncov-ering potential niche-related mechanisms, virtually all species co-occur with many other species, so the role of species interactions should be incorporated to the study of factors that determine the abundance and distribution of species (Wisz et al. 2013). When two or more closely related species co-occur at a given time and place, the ques-tion arises: how can they coexist? On the one hand, adapta-tion of co-occurring species to similar abiotic environments can drive species to develop similar ecological preferences and thus, closely related species may compete for eco-logical resources (garcía and arroyo 2005). On the other hand, an increased cost of competition for similar resources among co-occurring species can drive competitive exclu-sion, constraining coexistence of species (macarthur and levins 1967). Comparing whether the niche position and niche breadth of a species vary between allopatric and sym-patric situations along one or more environmental gradi-ents would provide evidence of interaction (avoidance or aggregation) and niche segregation between closely related species (Chunco et al. 2012; rannap et al. 2009). Inter-specific interactions may affect species density in sympa-tric sites (sanza et al. 2012), depending on environmental
conditions, or may even induce changes in the ecological niche allowing a species to use in sympatry habitats rarely used in allopatry (i.e. martín et al. 2010). also, conspecific cues might promote the aggregation of individuals at tra-ditionally occupied sites or in areas where they success-fully bred in the past (i.e. allopatric areas) (Osborne et al. 2007), regardless of whether environmental conditions have changed. hence, biotic factors may also separate the suitability of a habitat from its attractiveness for occupation through both positive and negative interactions affecting species–habitat relationships. studying how different prop-erties of the niche together shape species’ distribution pat-terns of closely related species in allopatric and sympatric scenarios is thus of great interest in ecology and conserva-tion biology.
a particularly powerful approach to disentangle the rela-tive role of niche mechanisms and biotic factors as drivers of co-existence and abundance of closely related species would be to assess niche breadth and position in sym-patry and allopatry under similar abiotic, habitat and dis-persal contexts. here, we use such an approach to evalu-ate different mechanisms by which closely related species distribute and coexist by assessing large-scale similarities and differences in environmental niches and variations in population densities in sympatric and allopatric scenarios. We use sympatric Pterocles spp. (the pin-tailed sandgrouse Pterocles alchata and the black-bellied sandgrouse Ptero-cles orientalis) as model species. sandgrouse are an excel-lent model system for the investigation of environmental niche similarities and interspecific interactions because species in this family share a relatively narrow range of climatic, topographic and trophic requirements, occupying similar feeding and breeding habitats (Benítez-lópez et al. 2013; herranz and suárez 1999), thus allowing for a clear potential influence of biotic factors to a higher extent than in other animal groups that have experienced higher niche diversification. Both species are ground-nesting birds asso-ciated with open arid habitats, natural steppes and agricul-tural ‘pseudo-steppes’, and are thus especially exposed to foreseeable land use changes (agricultural intensification) and habitat anthropogenization (Benítez-lópez et al. 2013). Finally, both sandgrouse species have well-developed thermal adaptations (hinsley et al. 1993), and the abiotic environment (climate) is expected to particularly influence their distribution. environmental niches are usually defined with climatic gradients or with climatic and habitat gradi-ents (Barnagaud et al. 2012), but current species’ niches are likely to be influenced by human-mediated processes (eriksson 2013). We propose using modern analytical tech-niques to study the realized environmental niches of conge-neric sandgrouse in sympatry and allopatry by considering a wide set of environmental variables that include human-related environmental factors, and to assess the importance

195Oecologia (2014) 176:193–206
1 3
of the biotic and the abiotic factors in setting the regions of co-occurrence of these closely related species. Our results might provide valuable indications about the ecological plasticity of co-occurring species towards habitat changes and, thus, about their vulnerability to human land use.
Materials and methods
study areas
We selected the three main biogeographical areas where both species are distributed in europe, which are located in spain. these are the southern Plateau (Castilla-la mancha autonomous community; Clm), the ebro Valley (VeBr) and extremadura (eXt) (Fig. 1) (Benítez-lópez et al. 2013). these areas are located in the meso-mediterranean bioclimatic stage mostly, but the supra-mediterranean belt is also found in VeBr (rivas-martínez 2004). the average annual temperature ranges from 15.5 to 17 °C and the aver-age annual rainfall is 500–600 mm.
species and environmental data
We extracted species data from the 2005 national Breed-ing sandgrouse survey, coordinated by the sociedad espa-ñola de Ornitología (seO)/Birdlife (suárez et al. 2006), which is the most recent source of information for sand-grouse species in europe. the sampling and analysis unit was the universal transverse mercator 100 km2, and the
survey method was the line transect. sampling focused on a priori adequate habitats (pastures, fallow land, ploughed land, stubble and low shrub steppes), according to exist-ing scientific knowledge on habitat requirements (herranz and suárez 1999). For each detected bird or flock (hereaf-ter ‘sighting’), the distance perpendicular to the observer’s trajectory (line transect) was estimated. every square was surveyed one or two times using line transects (from one to five per square) in a stratified way: sampling effort (cumu-lative transect length, 1.2–85 km per square) matched the proportion of adequate habitat within the square (suárez et al. 2006). In total, 1,736 transects comprising a total length of 5,694 km were surveyed. From all surveyed squares (n = 665) we extracted 315 (2,874 km of transects) covering the three study regions (see Online resource 1 for further details about the survey).
sandgrouse density (number of birds per km2 in each square) was estimated from these data using the cumula-tive transect length per square to measure survey effort (suárez et al. 2006) and to estimate surveyed area within a square. given that detectability of each species could be different due to differences in body size, social behav-iour or habitat selection (see Benítez-lópez et al. 2013), we calculated one value of detectability per species, pool-ing all sightings from all squares and using the distribution of all sampled distances at which sightings were recorded (thomas et al. 2006). We used a non-parametric approach to estimate detectability (no a priori parametric detection function was fit, i.e. half normal, hazard rate) assuming that it is maximum (detectability = 1, all birds are counted) at the closest perpendicular distance to the observer and that it decreases as the distance from the observer increases (the further the distance the lower the probability of detecting an individual; see Online resource 1 for detailed descrip-tion of the method and an example). this methodology was specifically developed for steppe bird census data that may be potentially subject to a relatively large error in distance estimates obtained in open landscapes (with few reference points) and by multiple observers (Carrascal et al. 2010). the detection distances were right truncated excluding out-liers (Buckland et al. 2001); i.e. disregarding the 5 % of the longest perpendicular distances from the transect line (>300 m for both species). Detectability was 0.48 for the pin-tailed sandgrouse and 0.39 for the black-bellied sand-grouse and the effective census strip width (esW = trunca-tion distance × detectability) was 144 and 118 m at each side of the transect, respectively. the area surveyed in each square was then the transect length (km) × 2 × esW (km).
given the variability of transect length per square we tested whether the precision of density estimates varied with survey effort. We defined three survey-effort catego-ries: squares with transect lengths below the 25 % quartile (<5.2 km per square) fell in the low survey-effort category,
Fig. 1 map of spain showing sandgrouse distribution over the study areas and occurrence used for this study. Red Black-bellied sandgrouse, green pin-tailed sandgrouse, blue sympatric areas (modified from Benítez-lópez et al. 2013). EXT extremadura, CLM Castilla-la man-cha autonomous community, VEBR ebro Valley (colour figure online)
196 Oecologia (2014) 176:193–206
1 3
and those with lengths over the 75 % quartile (9.8 km per square) were allocated to the high survey-effort category, with the rest of lengths corresponding to the intermediate survey-effort category.
Based on previous information about the ecology of sandgrouse (Benítez-lópez et al. 2013) we recorded a set of variables (anthropogenic, climatic, topographic, land use, landscape) of potential relevance for explaining sand-grouse environmental requirements (niche breadth and position) and variations in sandgrouse density. the varia-bles were measured using geographic Information systems and digital cartography from different sources [table 1; see Benítez-lópez et al. (2013) for a detailed explanation of how the variables were obtained].
Data analyses
to summarize landscape-scale environmental variation, we applied a principal components analysis (PCa) with varimax normalized rotation to reduce the original set of 35 explanatory variables into orthogonalized components (mcgarigal et al. 2000). the principal components (PCs) were taken as niche dimensions and used as predictors in our models. In the case of habitat data, PCs typically rep-resent overall trends in the habitat, such as major land use and geographical gradients. In the case of climate and topography, PCs represent topographic and climatic gradi-ents. We retained PCs which had eigenvalues >1 (11 PCs, see "results").
For each PC we calculated the niche breadth and niche overlap for squares where only one of the species occurred (allopatric squares) and for squares where the two species co-occurred (sympatric squares) using kernel density esti-mations (KDe) (mouillot et al. 2005) (Online resource 1). this allowed us to assess how each species modifies its niche for a certain environmental axis when coexisting with the other species. KDe gives a smooth, flexible, non-parametric curve for a probability density function over the data points, with the area under the curve equal to one. We used optimal band widths to produce the kernel curves (sil-verman 1986). For continuous data, such as our PCs, niche overlap based on non-parametric kernel density functions (nOK) on axis pc is calculated as:
where fipcni and fjpcni are the kernel population density functions for species i and j, respectively, and for the pcni (adapted from mouillot et al. 2005).
We generated three kernel curves (representing niche breadth) for each PC (two for allopatric squares and one for sympatric squares) and calculated the overlapping area between them (niche overlap), adapting the script available
(1)NOK(i,j,pcni)= 1 −
1
2
∫|fipcni
(x) − fjpcni(x)|dx
in geange et al. (2011) to our data (r Development Core team 2012). mean niche overlap was obtained by averag-ing niche overlap (nO) between allopatric and sympatric squares over each different axis (mouillot et al. 2005), where PC is the number of axes.
nO is 0 when the two distributions are completely sepa-rate, and is 1 when they exactly coincide.
niche comparisons must be done in a way that rules out detecting as different two niches which only differ due to sampling variation (geange et al. 2011). to differentiate whether species in allopatric and sympatric squares occu-pied similar or different niches for each PC, we produced null models (see gotelli 2000). null models use randomi-zation or permutation tests (1,000 permutations) which do not rely on distributional assumptions (manly 2007). Cal-culating pseudo-values of the test statistic that would arise if H0 (no niche differentiation) were true generates the null distribution. this is achieved by permutating species labels over all types of squares. the position of an empirically derived test statistic in relation to the pseudo-values gen-erated by the null model provides the P-value for the test (geange et al. 2011).
We applied generalized linear models (glm) (mcCul-lagh and nelder 1989) to relate sandgrouse density to environmental factors of the landscape. Our first approach was to fit glms with a Poisson probability distribution with a log link, but there was severe overdispersion in our data (θ = 9.03 for the pin-tailed sandgrouse and 6.39 for the black-bellied sandgrouse for models without interac-tions, and 134.9 and 52.0, respectively, for models includ-ing interactions). hence, we fitted glms with a negative binomial probability distribution (Crawley 2007) with a log link function and surveyed area as an offset, which notably increased the fit (expected deviance increased by 11 % for the pin-tailed sandgrouse, and 15 % for the black-bellied sandgrouse) and reduced overdispersion (ϕ = 1.05 and 1.17, respectively). First, we tested whether there were dif-ferences in species density per region. second, we assessed the relationship between both species’ densities within each region, using the density of one of the sandgrouse species as a dependent variable, the density of the other sandgrouse species as covariate, region as a factor and the interaction between the covariate and the factor (region). We also tested for differences in the density of each spe-cies between allopatric and sympatric squares in each region. subsequently, we built environmental models using the 11 PCs as explanatory variables, region as a factor, and their interactions. this allowed us to assess which fac-tors are important in explaining sandgrouse density, and if
(2)NOK(i,j) =1
PC
PC∑pc=1
NOK(i,j,pc)
197Oecologia (2014) 176:193–206
1 3
their effect differed depending on the region (interaction). If our best global model included interactions, we built models per region, including all PCs and the density of the pin-tailed sandgrouse or of the black-bellied sandgrouse as dependent variables. model selection was done starting with the most complex model (with interactions), dropping one term at a time and comparing competing nested models
by means of likelihood ratio tests until reaching the most explanatory model with all terms with P(χ2) < 0.05 (the one that explained the most deviance) (Zuur et al. 2009). We repeated this procedure until we obtained eight mod-els, one per species including the whole set of squares (two global models), and one per species and region (six regional models).
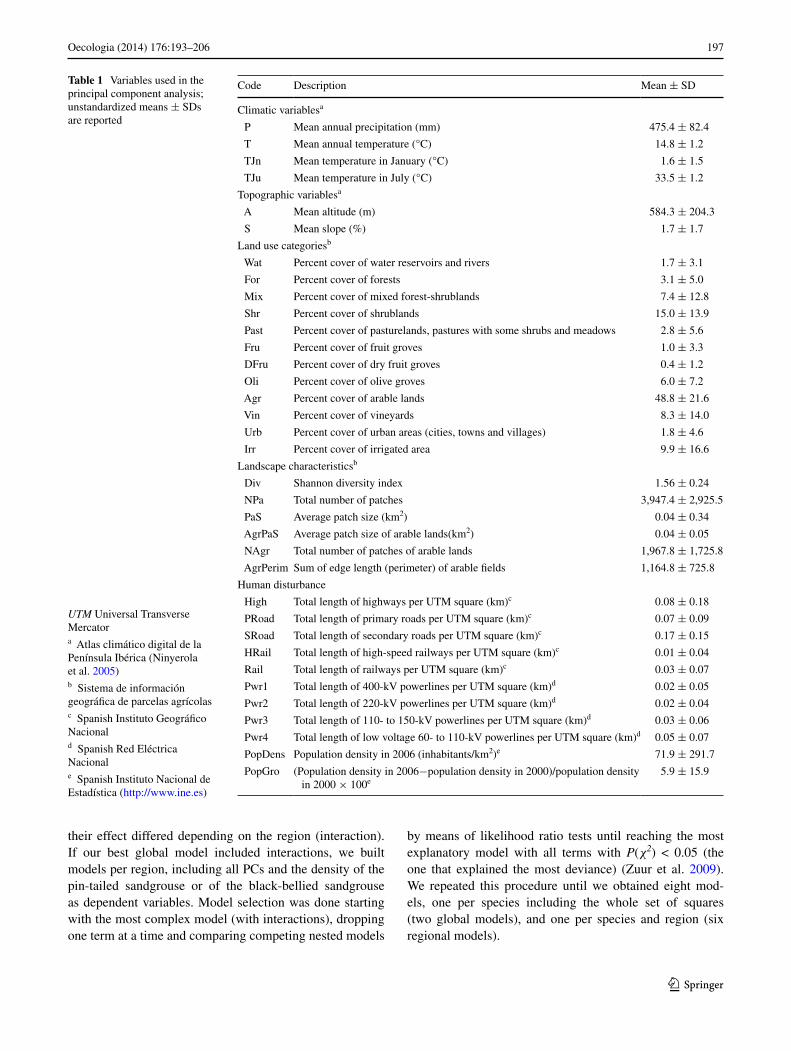
Table 1 Variables used in the principal component analysis; unstandardized means ± sDs are reported
UTM universal transverse mercatora atlas climático digital de la Península Ibérica (ninyerola et al. 2005)b sistema de información geográfica de parcelas agrícolasc spanish Instituto geográfico nacionald spanish red eléctrica nacionale spanish Instituto nacional de estadística (http://www.ine.es)
Code Description mean ± sD
Climatic variablesa
P mean annual precipitation (mm) 475.4 ± 82.4
t mean annual temperature (°C) 14.8 ± 1.2
tJn mean temperature in January (°C) 1.6 ± 1.5
tJu mean temperature in July (°C) 33.5 ± 1.2
topographic variablesa
a mean altitude (m) 584.3 ± 204.3
s mean slope (%) 1.7 ± 1.7
land use categoriesb
Wat Percent cover of water reservoirs and rivers 1.7 ± 3.1
For Percent cover of forests 3.1 ± 5.0
mix Percent cover of mixed forest-shrublands 7.4 ± 12.8
shr Percent cover of shrublands 15.0 ± 13.9
Past Percent cover of pasturelands, pastures with some shrubs and meadows 2.8 ± 5.6
Fru Percent cover of fruit groves 1.0 ± 3.3
DFru Percent cover of dry fruit groves 0.4 ± 1.2
Oli Percent cover of olive groves 6.0 ± 7.2
agr Percent cover of arable lands 48.8 ± 21.6
Vin Percent cover of vineyards 8.3 ± 14.0
urb Percent cover of urban areas (cities, towns and villages) 1.8 ± 4.6
Irr Percent cover of irrigated area 9.9 ± 16.6
landscape characteristicsb
Div shannon diversity index 1.56 ± 0.24
nPa total number of patches 3,947.4 ± 2,925.5
Pas average patch size (km2) 0.04 ± 0.34
agrPas average patch size of arable lands(km2) 0.04 ± 0.05
nagr total number of patches of arable lands 1,967.8 ± 1,725.8
agrPerim sum of edge length (perimeter) of arable fields 1,164.8 ± 725.8
human disturbance
high total length of highways per utm square (km)c 0.08 ± 0.18
Proad total length of primary roads per utm square (km)c 0.07 ± 0.09
sroad total length of secondary roads per utm square (km)c 0.17 ± 0.15
hrail total length of high-speed railways per utm square (km)c 0.01 ± 0.04
rail total length of railways per utm square (km)c 0.03 ± 0.07
Pwr1 total length of 400-kV powerlines per utm square (km)d 0.02 ± 0.05
Pwr2 total length of 220-kV powerlines per utm square (km)d 0.02 ± 0.04
Pwr3 total length of 110- to 150-kV powerlines per utm square (km)d 0.03 ± 0.06
Pwr4 total length of low voltage 60- to 110-kV powerlines per utm square (km)d 0.05 ± 0.07
PopDens Population density in 2006 (inhabitants/km2)e 71.9 ± 291.7
Popgro (Population density in 2006−population density in 2000)/population density in 2000 × 100e
5.9 ± 15.9
198 Oecologia (2014) 176:193–206
1 3
statistical analyses were performed using r 2.14 statisti-cal software (r Development Core team 2012).
Results
no significant differences in sandgrouse density existed between the three categories of survey effort for each region (F4, 306 = 1.96, P = 0.100 for the pin-tailed sand-grouse and F4, 306 = 0.63, P = 0.639 for the black-bellied sandgrouse). the precision did not improve with survey effort (se25th = 0.67, se25th–75th = 0.46, se75th = 0.63 for the pin-tailed sandgrouse; se25th = 0.37, se25th–75th = 0.26, se75th = 0.35 for the black-bellied sandgrouse), so all squares (n = 315) were included in subsequent analyses.
globally, the black-bellied sandgrouse was more widely distributed (76 % of squares, n = 315) than the pin-tailed sandgrouse (59 % of squares, n = 315). region-ally, in Clm the pin-tailed sandgrouse was present in more squares than the black-bellied sandgrouse (74 vs. 54 % of squares, respectively, n = 112), but in the other two regions the black-bellied sandgrouse occupied notably more squares than the pin-tailed sandgrouse (88 vs. 58 %, n = 120 in VeBr and 88 vs. 39 %, n = 83 in eXt). the overlap between both species’ distributions in the regions considered is 34 % (Fig. 1), with the pin-tailed sandgrouse being in sympatry more frequently (58 % of squares) than the black-bellied sandgrouse (45 % of squares), indicat-ing that the environmental conditions are suitable for the establishment of both species over a large area within the actual range of the pin-tailed sandgrouse. In particular, both species are frequently found in sympatry in the ebro Val-ley (46 %) whereas the overlap is notably lower in Clm (28 %) and eXt (27 %; Fig. 1).
niche position, niche breadth and niche overlap in allopatry and sympatry
the PCa resulted in 11 PCs that explain 70.9 % of the total variance. the factor loadings, eigenvalues and percentage of variation explained by the PCa are shown in Online resource 2 (table Or1) and the interpretation of each axis on basis of the loadings of each variable is given in table 2. PC1 and PC3 were clearly related to abiotic and land use variables, whereas anthropogenic variables fell principally within PC2 and PC4. PC1 represented a gradient from nat-ural vegetation (pastures/mixed forest-shrublands) to agri-cultural landscapes with clear climatic relationships: the more a species tended to be positioned towards natural hab-itats, the wetter and warmer (temperate) were its climatic position (Fig. 2). In turn, climate and land use also defined PC3, with niches associated with rugged landscapes with arboreal vegetation contrasting with the opposite extreme
characterized by hot areas (mediterranean climate) (Fig. 2). additional land use and climatic variables were retained in PCs with less explained variance (PC5, PC6, PC7 and PC9), while the rest of the axes were related to anthropo-genic variables (PC8, PC10 and PC11).
When we contrasted the niche positions in PC1 and PC3 between sympatry, allopatry for the black-bellied sandgrouse and allopatry for the pin-tailed sandgrouse, we found significant differences for both PC scores (anOVa PC1, F2, 312 = 27.58, P < 0.001; PC3, F2, 312 = 13.71, P < 0.001). a tukey honest significant difference (hsD) (P < 0.05) test revealed that allopatric black-bellied sand-grouse sites are substantially wetter and warmer and posi-tioned along the gradient towards more natural habitats than sympatric and pin-tailed sandgrouse sites. In turn, allopat-ric pin-tailed sandgrouse sites appeared to be more similar to sympatric sites (PC1; Fig. 2), which was further con-firmed by the niche-overlap analyses (table 3). also, pin-tailed sandgrouse sites are characterized by a hotter climate, particularly in the summer, than black-bellied sandgrouse sites, which seem to be more tolerant of rugged landscapes with arboreal vegetation, whereas sympatric sites occupy an intermediate position (PC3, tukey hsD test, P < 0.05; Fig. 2). thus, niche overlap was higher between allopatric and sympatric sites than between allopatric sites (table 3). niche breadth was substantially wider for allopatric black-bellied sandgrouse for both PCs, whereas the pin-tailed sandgrouse’s niche was narrower, particularly for PC3. Both species shifted their niches in sympatric sites, but the black-bellied sandgrouse also had a narrower niche for both PCs. as a result, climatic and habitat niches (PC1, PC3) differ both in their position and in their breadth between allopatric pin-tailed sandgrouse, allopatric black-bellied sandgrouse and sympatric sites (Fig. 3).
regarding the anthropogenic axes (PC2 and PC4), there were significant differences between allopatric and sympatric sites for PC2 (anOVa PC2, F2, 312 = 5.16, P = 0.006) but not for PC4 (anOVa PC4, F2, 312 = 2.39, P = 0.093), with high niche overlap between the three situ-ations (table 3). In the case of PC2, allopatric pin-tailed sandgrouse sites were significantly different from allopatric black-bellied sandgrouse and from sympatric sites (tukey hsD test, P < 0.05), with niche overlaps of 0.76 and 0.77, respectively, whereas no statistical differences were found between black-bellied sandgrouse in allopatric sites and in sympatric sites (niche overlap = 0.93; table 3). the com-bination of both PCs in multispace reflects that both spe-cies avoid areas of high human pressure, evidenced through high human population density, urban areas and major transport infrastructure (positive values of PC4), but they still seem to tolerate areas where the human population is growing and energy infrastructure expanding (positive val-ues of PC2) (Fig. 3).
199Oecologia (2014) 176:193–206
1 3
Population density and regional niche variation
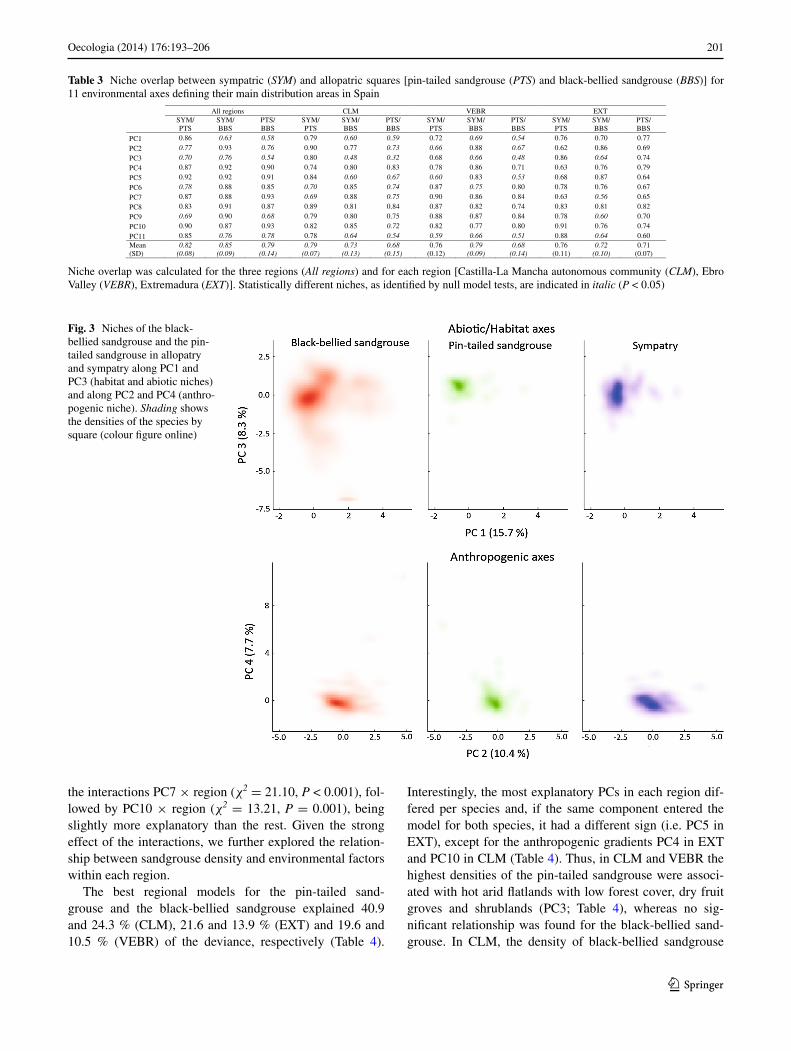
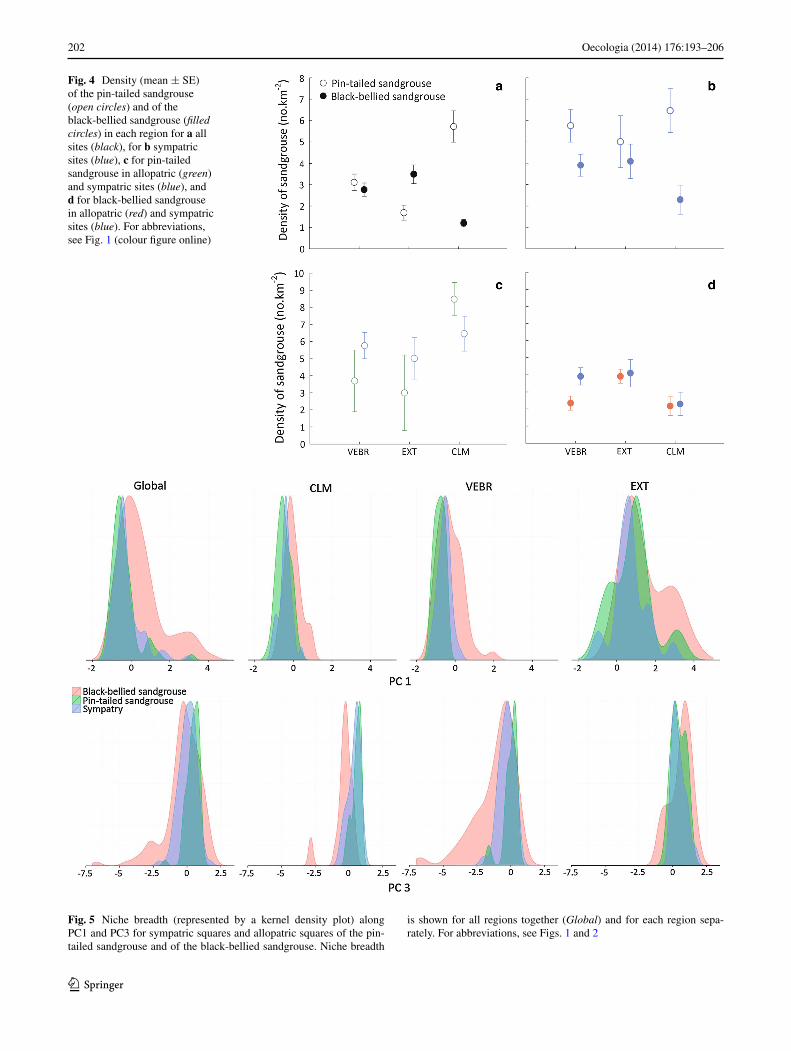
the density of both species greatly differed among the three regions considered (pin-tailed sandgrouse, F2,312 = 13.49, P < 0.001; black-bellied sandgrouse, F2,312 = 14.04, P < 0.001; Fig. 4). the density of the pin-tailed sandgrouse was significantly higher in Clm (mean number of sand-grouse/km2 ± se, 5.72 ± 0.73) than in eXt (1.69 ± 0.35; tukey hsD test, P < 0.001) and in VeBr (3.10 ± 0.39; tukey hsD test, P < 0.001), but similar in eXt and VeBr (tukey hsD test, P = 0.178; Fig. 4a). On the contrary, in Clm, the density of black-bellied sandgrouse was signifi-cantly lower (1.20 ± 0.17) than in eXt (3.49 ± 0.44, tukey hsD test, P < 0.001) and VeBr (2.77 ± 0.31, tukey hsD test, P < 0.001), and was similar in eXt and VeBr (tukey hsD test, P = 0.239; Fig. 4a). the pin-tailed sandgrouse was more abundant than the black-bellied sandgrouse in Clm, whereas the latter was more abundant in eXt than the former (Fig. 4a). When considering only sympatric sites, the density of the pin-tailed sandgrouse was higher than the density of the black-bellied sandgrouse in Clm and in VeBr (Fig. 4b).
there were no differences in sandgrouse densities between sympatric and allopatric sites (pin-tailed sand-grouse, F 2,179 = 2.00, P = 0.138; black-bellied sandgrouse, F 2,232 = 1.25, P = 0.287), although in Clm the density of the pin-tailed sandgrouse tended to be higher in allopatric sites (8.48 ± 0.87) than in sympatric ones (6.46 ± 1.13; Fig. 4c), and in VeBr the density of black-bellied sand-grouse was higher in sympatric than in allopatric sites (Fig. 4d). the densities of both species were negatively related in Clm (slope ± se, −0.20 ± 0.09, P = 0.026) but positively, although not significantly, related in VeBr (0.07 ± 0.04, P = 0.108).
niche space occupied by the two species also varied regionally (Fig. 5; table 3), with variations in niche posi-tions and niche breadth along some environmental and anthropogenic axes and between sympatric and allopatric sites. In Clm, where the relationship between the densi-ties of the two species is negative, both species seem to occupy a narrower niche for the main environmental gra-dients (PC1 and PC3; Fig. 5) than globally, reflecting the more restricted range of environmental conditions in
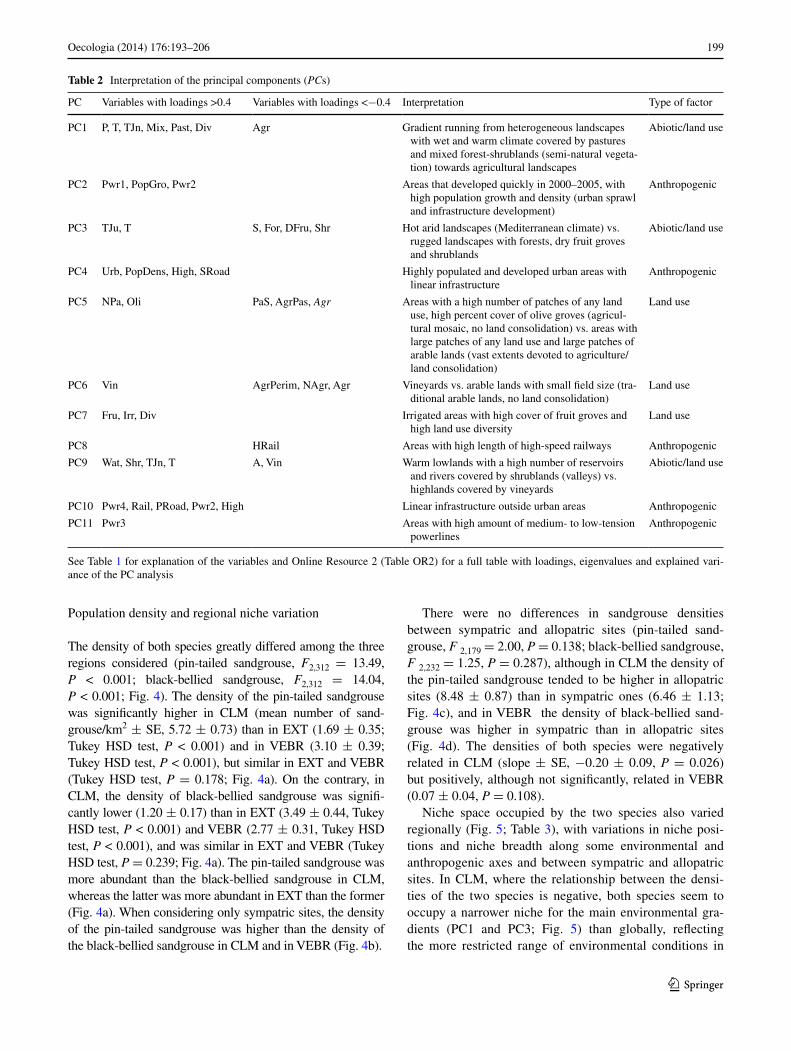
Table 2 Interpretation of the principal components (PCs)
see table 1 for explanation of the variables and Online resource 2 (table Or2) for a full table with loadings, eigenvalues and explained vari-ance of the PC analysis
PC Variables with loadings >0.4 Variables with loadings <−0.4 Interpretation type of factor
PC1 P, t, tJn, mix, Past, Div agr gradient running from heterogeneous landscapes with wet and warm climate covered by pastures and mixed forest-shrublands (semi-natural vegeta-tion) towards agricultural landscapes
abiotic/land use
PC2 Pwr1, Popgro, Pwr2 areas that developed quickly in 2000–2005, with high population growth and density (urban sprawl and infrastructure development)
anthropogenic
PC3 tJu, t s, For, DFru, shr hot arid landscapes (mediterranean climate) vs. rugged landscapes with forests, dry fruit groves and shrublands
abiotic/land use
PC4 urb, PopDens, high, sroad highly populated and developed urban areas with linear infrastructure
anthropogenic
PC5 nPa, Oli Pas, agrPas, Agr areas with a high number of patches of any land use, high percent cover of olive groves (agricul-tural mosaic, no land consolidation) vs. areas with large patches of any land use and large patches of arable lands (vast extents devoted to agriculture/land consolidation)
land use
PC6 Vin agrPerim, nagr, agr Vineyards vs. arable lands with small field size (tra-ditional arable lands, no land consolidation)
land use
PC7 Fru, Irr, Div Irrigated areas with high cover of fruit groves and high land use diversity
land use
PC8 hrail areas with high length of high-speed railways anthropogenic
PC9 Wat, shr, tJn, t a, Vin Warm lowlands with a high number of reservoirs and rivers covered by shrublands (valleys) vs. highlands covered by vineyards
abiotic/land use
PC10 Pwr4, rail, Proad, Pwr2, high linear infrastructure outside urban areas anthropogenic
PC11 Pwr3 areas with high amount of medium- to low-tension powerlines
anthropogenic

200 Oecologia (2014) 176:193–206
1 3
this region. also, the black-bellied sandgrouse niche is clearly positioned towards the opposite side of sympat-ric and allopatric pin-tailed sandgrouse sites. as a result, niche similarity for the main environmental axes between allopatric black-bellied sandgrouse and allopatric pin-tailed sandgrouse is minimum (table 3). In this region, the slight niche overlap observed between sympatric and allopatric black-bellied sandgrouse sites suggests that the black-bellied sandgrouse shifted its niche when in sympa-try (table 3; Fig. 5). On the contrary, both species seem to expand their environmental niches in eXt, which are not only broader here but also positioned towards positive values of the PC1 (natural habitat with temperate climate) (Fig. 5). also, there is a substantial overlap between the niche spaces occupied by both species, both in sympatry and allopatry. Finally, in VeBr, where the densities of the two species are positively related, niche overlap is low among allopatric black-bellied sandgrouse and allopatric
pin-tailed sandgrouse sites, and both species shift their niches when in sympatry, achieving higher densities than in allopatric sites (Fig. 4).
the importance of environmental and anthropogenic factors
the best global models for the densities of the pin-tailed sandgrouse and of the black-bellied sandgrouse explained 29.6 and 24.5 % of the deviance, respectively. there were significant interactions between some environmental fac-tors (PCs) and region for both species, indicating that the effect of these factors on density differed between the three regions (Online resource 2, tables Or2, Or3). In gen-eral, the density of the pin-tailed sandgrouse was mostly explained by the interaction PC3 × region (χ2 = 32.18, P < 0.001) and PC1 (χ2 = 26.08, P < 0.001). the density of the black-bellied sandgrouse was mostly explained by
Fig. 2 niche breadth and position of the black-bellied sandgrouse (BBS) and the pin-tailed sandgrouse (PTS) in allopatric sites and in sympat-ric sites (SYM) along the four main principal component (PC) analysis axes. Upper panels main abiotic/habitat axes (PC1 and PC3); lower panels main anthropogenic axes (PC2 and PC4). the box shows the interquartile range (IQr; the 25th and 75th percentiles). Whiskers show the 75th per-centile + 1.5 × IQr and 25th percentile − 1.5 × IQr. Data beyond the end of the whisk-ers are outliers and plotted as points. Non-overlapping notches are roughly equivalent to 95 % confidence intervals, and therefore provide strong evidence that the medians differ (mcgill et al. 1978) (colour figure online)
201Oecologia (2014) 176:193–206
1 3
the interactions PC7 × region (χ2 = 21.10, P < 0.001), fol-lowed by PC10 × region (χ2 = 13.21, P = 0.001), being slightly more explanatory than the rest. given the strong effect of the interactions, we further explored the relation-ship between sandgrouse density and environmental factors within each region.
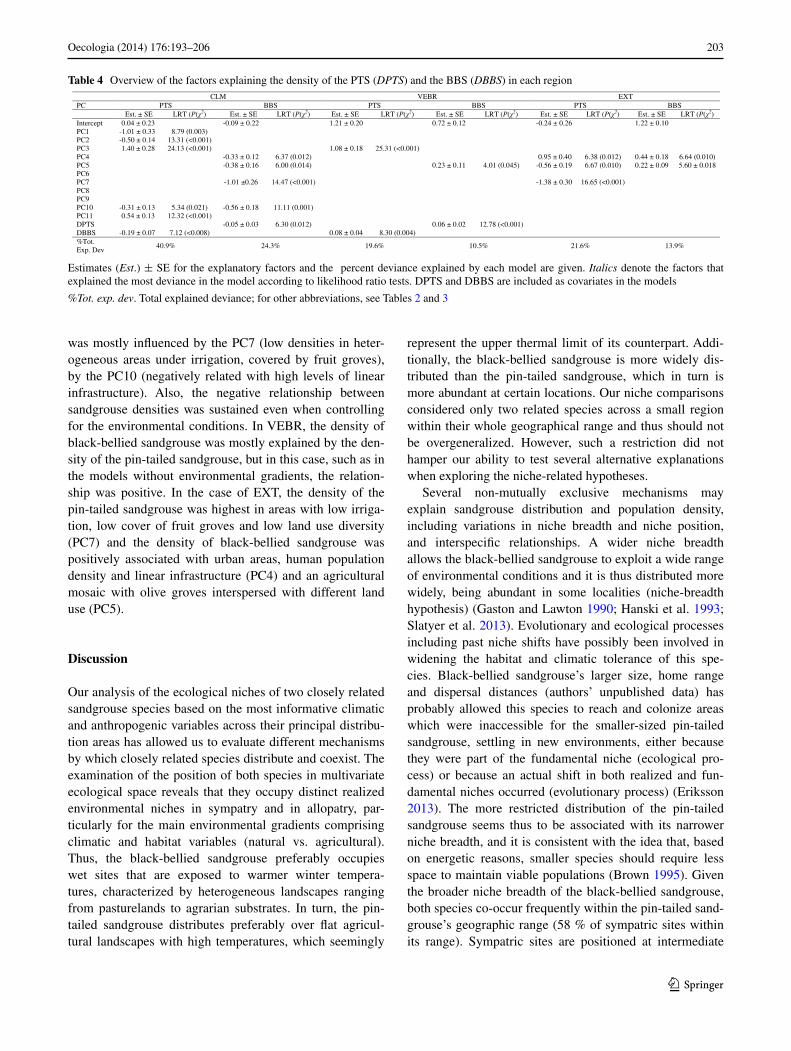
the best regional models for the pin-tailed sand-grouse and the black-bellied sandgrouse explained 40.9 and 24.3 % (Clm), 21.6 and 13.9 % (eXt) and 19.6 and 10.5 % (VeBr) of the deviance, respectively (table 4).
Interestingly, the most explanatory PCs in each region dif-fered per species and, if the same component entered the model for both species, it had a different sign (i.e. PC5 in eXt), except for the anthropogenic gradients PC4 in eXt and PC10 in Clm (table 4). thus, in Clm and VeBr the highest densities of the pin-tailed sandgrouse were associ-ated with hot arid flatlands with low forest cover, dry fruit groves and shrublands (PC3; table 4), whereas no sig-nificant relationship was found for the black-bellied sand-grouse. In Clm, the density of black-bellied sandgrouse
Table 3 niche overlap between sympatric (SYM) and allopatric squares [pin-tailed sandgrouse (PTS) and black-bellied sandgrouse (BBS)] for 11 environmental axes defining their main distribution areas in spain
All regions CLM VEBR EXTSYM/PTS
SYM/BBS
PTS/BBS
SYM/PTS
SYM/BBS
PTS/BBS
SYM/PTS
SYM/BBS
PTS/BBS
SYM/PTS
SYM/BBS
PTS/BBS
PC1 0.86 0.63 0.58 0.79 0.60 0.59 0.72 0.69 0.54 0.76 0.70 0.77
PC2 0.77 0.93 0.76 0.90 0.77 0.73 0.66 0.88 0.67 0.62 0.86 0.69
PC3 0.70 0.76 0.54 0.80 0.48 0.32 0.68 0.66 0.48 0.86 0.64 0.74
PC4 0.87 0.92 0.90 0.74 0.80 0.83 0.78 0.86 0.71 0.63 0.76 0.79
PC5 0.92 0.92 0.91 0.84 0.60 0.67 0.60 0.83 0.53 0.68 0.87 0.64
PC6 0.78 0.88 0.85 0.70 0.85 0.74 0.87 0.75 0.80 0.78 0.76 0.67
PC7 0.87 0.88 0.93 0.69 0.88 0.75 0.90 0.86 0.84 0.63 0.56 0.65
PC8 0.83 0.91 0.87 0.89 0.81 0.84 0.87 0.82 0.74 0.83 0.81 0.82
PC9 0.69 0.90 0.68 0.79 0.80 0.75 0.88 0.87 0.84 0.78 0.60 0.70
PC10 0.90 0.87 0.93 0.82 0.85 0.72 0.82 0.77 0.80 0.91 0.76 0.74
PC11 0.85 0.76 0.78 0.78 0.64 0.54 0.59 0.66 0.51 0.88 0.64 0.60Mean (SD)
0.82(0.08)
0.85(0.09)
0.79(0.14)
0.79(0.07)
0.73(0.13)
0.68(0.15)
0.76(0.12)
0.79(0.09)
0.68(0.14)
0.76(0.11)
0.72(0.10)
0.71(0.07)
niche overlap was calculated for the three regions (All regions) and for each region [Castilla-la mancha autonomous community (CLM), ebro Valley (VEBR), extremadura (EXT)]. statistically different niches, as identified by null model tests, are indicated in italic (P < 0.05)
Fig. 3 niches of the black-bellied sandgrouse and the pin-tailed sandgrouse in allopatry and sympatry along PC1 and PC3 (habitat and abiotic niches) and along PC2 and PC4 (anthro-pogenic niche). Shading shows the densities of the species by square (colour figure online)
202 Oecologia (2014) 176:193–206
1 3
Fig. 4 Density (mean ± se) of the pin-tailed sandgrouse (open circles) and of the black-bellied sandgrouse (filled circles) in each region for a all sites (black), for b sympatric sites (blue), c for pin-tailed sandgrouse in allopatric (green) and sympatric sites (blue), and d for black-bellied sandgrouse in allopatric (red) and sympatric sites (blue). For abbreviations, see Fig. 1 (colour figure online)
Fig. 5 niche breadth (represented by a kernel density plot) along PC1 and PC3 for sympatric squares and allopatric squares of the pin-tailed sandgrouse and of the black-bellied sandgrouse. niche breadth
is shown for all regions together (Global) and for each region sepa-rately. For abbreviations, see Figs. 1 and 2
203Oecologia (2014) 176:193–206
1 3
was mostly influenced by the PC7 (low densities in heter-ogeneous areas under irrigation, covered by fruit groves), by the PC10 (negatively related with high levels of linear infrastructure). also, the negative relationship between sandgrouse densities was sustained even when controlling for the environmental conditions. In VeBr, the density of black-bellied sandgrouse was mostly explained by the den-sity of the pin-tailed sandgrouse, but in this case, such as in the models without environmental gradients, the relation-ship was positive. In the case of eXt, the density of the pin-tailed sandgrouse was highest in areas with low irriga-tion, low cover of fruit groves and low land use diversity (PC7) and the density of black-bellied sandgrouse was positively associated with urban areas, human population density and linear infrastructure (PC4) and an agricultural mosaic with olive groves interspersed with different land use (PC5).
Discussion
Our analysis of the ecological niches of two closely related sandgrouse species based on the most informative climatic and anthropogenic variables across their principal distribu-tion areas has allowed us to evaluate different mechanisms by which closely related species distribute and coexist. the examination of the position of both species in multivariate ecological space reveals that they occupy distinct realized environmental niches in sympatry and in allopatry, par-ticularly for the main environmental gradients comprising climatic and habitat variables (natural vs. agricultural). thus, the black-bellied sandgrouse preferably occupies wet sites that are exposed to warmer winter tempera-tures, characterized by heterogeneous landscapes ranging from pasturelands to agrarian substrates. In turn, the pin-tailed sandgrouse distributes preferably over flat agricul-tural landscapes with high temperatures, which seemingly
represent the upper thermal limit of its counterpart. addi-tionally, the black-bellied sandgrouse is more widely dis-tributed than the pin-tailed sandgrouse, which in turn is more abundant at certain locations. Our niche comparisons considered only two related species across a small region within their whole geographical range and thus should not be overgeneralized. however, such a restriction did not hamper our ability to test several alternative explanations when exploring the niche-related hypotheses.
several non-mutually exclusive mechanisms may explain sandgrouse distribution and population density, including variations in niche breadth and niche position, and interspecific relationships. a wider niche breadth allows the black-bellied sandgrouse to exploit a wide range of environmental conditions and it is thus distributed more widely, being abundant in some localities (niche-breadth hypothesis) (gaston and lawton 1990; hanski et al. 1993; slatyer et al. 2013). evolutionary and ecological processes including past niche shifts have possibly been involved in widening the habitat and climatic tolerance of this spe-cies. Black-bellied sandgrouse’s larger size, home range and dispersal distances (authors’ unpublished data) has probably allowed this species to reach and colonize areas which were inaccessible for the smaller-sized pin-tailed sandgrouse, settling in new environments, either because they were part of the fundamental niche (ecological pro-cess) or because an actual shift in both realized and fun-damental niches occurred (evolutionary process) (eriksson 2013). the more restricted distribution of the pin-tailed sandgrouse seems thus to be associated with its narrower niche breadth, and it is consistent with the idea that, based on energetic reasons, smaller species should require less space to maintain viable populations (Brown 1995). given the broader niche breadth of the black-bellied sandgrouse, both species co-occur frequently within the pin-tailed sand-grouse’s geographic range (58 % of sympatric sites within its range). sympatric sites are positioned at intermediate
Table 4 Overview of the factors explaining the density of the Pts (DPTS) and the BBs (DBBS) in each regionCLM VEBR EXT
PC PTS BBS PTS BBS PTS BBSEst. ± SE LRT (P( 2) Est. ± SE LRT (P( 2) Est. ± SE LRT (P( 2) Est. ± SE LRT (P( 2) Est. ± SE LRT (P( 2) Est. ± SE LRT (P( 2)
Intercept 0.04 ± 0.23 -0.09 ± 0.22 1.21 ± 0.20 0.72 ± 0.12 -0.24 ± 0.26 1.22 ± 0.10PC1 -1.01 ± 0.33 8.79 (0.003)PC2 -0.50 ± 0.14 13.31 (<0.001)PC3 1.40 ± 0.28 24.13 (<0.001) 1.08 ± 0.18 25.31 (<0.001)PC4 -0.33 ± 0.12 6.37 (0.012) 0.95 ± 0.40 6.38 (0.012) 0.44 ± 0.18 6.64 (0.010)PC5 -0.38 ± 0.16 6.00 (0.014) 0.23 ± 0.11 4.01 (0.045) -0.56 ± 0.19 6.67 (0.010) 0.22 ± 0.09 5.60 ± 0.018PC6PC7 -1.01 ±0.26 14.47 (<0.001) -1.38 ± 0.30 16.65 (<0.001)PC8PC9PC10 -0.31 ± 0.13 5.34 (0.021) -0.56 ± 0.18 11.11 (0.001)PC11 0.54 ± 0.13 12.32 (<0.001)DPTS -0.05 ± 0.03 6.30 (0.012) 0.06 ± 0.02 12.78 (<0.001)DBBS -0.19 ± 0.07 7.12 (<0.008) 0.08 ± 0.04 8.30 (0.004)%Tot.Exp. Dev
40.9% 24.3% 19.6% 10.5% 21.6% 13.9%
estimates (Est.) ± se for the explanatory factors and the percent deviance explained by each model are given. Italics denote the factors that explained the most deviance in the model according to likelihood ratio tests. DPts and DBBs are included as covariates in the models
%Tot. exp. dev. total explained deviance; for other abbreviations, see tables 2 and 3

204 Oecologia (2014) 176:193–206
1 3
climates and habitats (relative to allopatry), suggesting that the abiotic environment is the primary factor mediating co-occurrence between sandgrouse and the main driver of both species’ ranges, such as for other species (swenson 2006; Walls 2009).
ecological niche differences between allopatry and sympatry along several niche axes are further corrobo-rated at regional level, and are reflected in the results of the regional density models. environmental niches differ sub-stantially between allopatric sites in two regions (Clm and VeBr), but are similar in the other region (eXt). Interest-ingly, in the two regions where allopatric sites differ the most the relationships between the densities of both species are opposite and their distributions differ (Figs. 1, 4). addi-tionally, the most explanatory PCs in each region differ per species or have different signs. the density of the pin-tailed sandgrouse is highly influenced by habitat and climatic gra-dients, whereas black-bellied sandgrouse’s density is par-ticularly influenced by habitat gradients and, overall, by the density of its congeneric species. Furthermore, the density of both species is higher in regions where their distribution is wider, supporting the positive regional distribution-den-sity relationship (heino 2005).
the black-bellied sandgrouse attains the highest den-sities both in allopatry and sympatry in eXt, which are similar to densities in sympatric sites in VeBr. this sug-gests that environmental conditions in eXt are the most adequate for this species, and that in areas where the environment is less suitable (VeBr) the interaction with the other congeneric species may foster the black-bellied sandgrouse’s performance (in terms of abundance). Indeed the main factor explaining the density of the black-bellied sandgrouse in this region is the density of its counterpart. additionally, the environment in sympatry tends to be more similar to that of allopatric pin-tailed sandgrouse than to that of allopatric black-bellied sandgrouse, which is further consistent with the idea that association with the pin-tailed sandgrouse may facilitate the abundance of the black-bel-lied sandgrouse in this region. thus, although abiotic con-ditions primarily set the regions of co-occurrence, biotic interactions should not be neglected. the more generalist and less abundant black-bellied sandgrouse may be using the presence of the more specialist and more abundant pin-tailed sandgrouse as a heterospecific cue for informa-tion about the availability of suitable habitats and mutually beneficial resources at a finer scale (availability of feeding grounds, water points, shelter from predator etc.) (i.e. srid-har et al. 2009; martín et al. 2010) for the establishment of new populations [sandgrouse are nomadic and partial migrants (Benítez-lópez et al. 2010; Casas et al. 2012)]. given the low deviance of the model when accounting only for large-scale environmental variables, it seems reasona-ble that the density of the black-bellied sandgrouse may be
further explained by fine-grained variables in this region. a more detailed study at a finer scale would help us to eluci-date whether behavioural patterns are facilitating the coex-istence and performance of the black-bellied sandgrouse in less adequate environments, or if they are just a conse-quence of the local convergence of ecological conditions.
although intuitively the niche breadth hypothesis may explain the narrower niche breadth and more restricted distribution of pin-tailed sandgrouse, the niche-position hypothesis should not be disregarded as it seems to fit the density-distribution relationship equally, at least in Clm. In this region, which is the core area of the distribution and holds a continuum of highly suitable sites (Benítez-lópez et al. 2013), the pin-tailed sandgrouse holds the highest densities both in sympatry and in allopatry [i.e. ‘abundant centre’ distribution hypothesis (Brown 1984)]; and it is more widely distributed than in the other regions, yet keep-ing a narrow niche. therefore, it seems that its niche posi-tion matches the environmental conditions in this region, fostering its abundance. Indeed, constant environmental conditions during a species lifetime favour species with a high level of grinnellian specialization (levins 1968). additionally, the density of the pin-tailed sandgrouse is higher in allopatric squares than in sympatric squares and both species densities are negatively related. this relation-ship is not fully supported statistically when analysing only sympatric squares, so this might be an artefact derived from pin-tailed sandgrouse’s wider distribution in this region (the black-bellied sandgrouse is absent in more squares than the pin-tailed sandgrouse). Following this idea, a simi-lar pattern should arise in VeBr where the distribution of the black-bellied sandgrouse is wider and there are more squares where the density of the pin-tailed sandgrouse is zero; however, the opposite occurs. thus, in Clm, the pres-ence of the pin-tailed sandgrouse does not attract the black-bellied sandgrouse, probably because the environmental conditions in the pin-tailed sandgrouse allopatric sites fall beyond the environmental limits of the black-bellied sand-grouse [most likely, thermal limits (Benítez-lópez et al. 2013; hinsley et al. 1993)]. hence, the negative relation-ship between both species’ densities in Clm appears to be driven by dissimilar environmental requirements, leading to partial niche segregation. additionally, conspecific interac-tions might be involved in the process of habitat occupancy, with individuals of the pin-tailed sandgrouse aggregating in squares with specific environmental conditions, resulting in higher densities in allopatry.
Both species seem to expand their environmental niches in eXt, which are not only broader but also positioned towards positive values of the PC1 (natural habitat with temperate climate). this is the region where the environ-mental conditions are the most different compared to the other regions, with more availability of natural habitats

205Oecologia (2014) 176:193–206
1 3
(Online resource 1, table Or4). as stated before, the performance of the generalist black-bellied sandgrouse is highest in this region, seemingly because, within it wide niche, the environmental conditions in this region better match its requirements. In turn, the pin-tailed sandgrouse appears to thrive in these environments by niche shifts and variations in niche breadth, such as those seen in other spe-cialists (see Devictor et al. 2010), and by partial association with the black-bellied sandgrouse in sites with less natural habitat (agriculture).
Both sandgrouse species are positioned on the negative end of the ‘anthropogenic niches’, avoiding densely popu-lated urban areas and major transport infrastructures, and partially tolerating areas where the human population is growing and energy infrastructure developing (correspond-ing with spanish rural areas). One of the novelties of this work is the inclusion of the human dimension within the species niche. species niches are usually defined in terms of climate (climatic niche) or habitat (habitat niche), or both (Barnagaud et al. 2012). It can be argued that the habi-tat niche already partly takes into consideration anthropo-genic influence [most current landscapes have been shaped by humans, i.e. cultural landscapes (eriksson 2013)]. how-ever, if we are to define contemporary species niches, the anthropogenic dimension should be formally included given the widespread modification of the environment as a result of human activities. this will allow us to predict more accurately a species’ response to global change (cli-mate change plus land use change, including urban sprawl and infrastructure development).
the blending of ecological niche modelling, abundance modelling and species interactions can guide greater insight into the factors that affect species’ co-occurrence and has great potential for application to multi-species bird conser-vation programs. Our results display a clear example of how different mechanisms act synergically to allow the coexist-ence of closely related species. thus, although at a large scale abiotic factors seem to mediate areas of co-occurrence between sympatric species, biotic interactions should not be disregarded, and can even become more important than the former in some cases (Chunco et al. 2012). In view of our results, we may conclude that the niche-breadth hypoth-esis seems to fit the black-bellied sandgrouse distribution and the pin-tailed sandgrouse distribution globally, whereas the niche-position hypothesis explains why both species attain high densities in regions with optimum environmen-tal conditions, achieving wide regional distributions when such conditions are widespread. Finally, biotic interactions may play a role in the achievement of higher densities of the black-bellied sandgrouse when environmental condi-tions are not optimum for either of the two sandgrouse, but similarly conducive. In this sense, we recommend the inclu-sion of biotic interactions in species distribution models
which will most likely improve the predictions of responses of interacting species to climate and land use change in allopatric and sympatric scenarios.
Acknowledgments Financial support was provided by the Direc-ción general de Investigación (project Cgl2008-04282/BOs) and the hnV project (spanish ministry of rural and marine environment). seO/Birdlife provided data from the sandgrouse national census. a. Benítez-lópez was supported by the 2012-BIn-4462 research grant awarded by the universidad de Castilla-la mancha. We thank Fidel sánchez for his help at some stages during the process of data compi-lation and analyses in arcgIs 9.3.
References
Barnagaud J-y, Devictor V, Jiguet F, Barbet-massin m, le Viol I, archaux F (2012) relating habitat and climatic niches in birds. Plos One 7:e32819. doi:10.1371/journal.pone.0032819
Benítez-lópez a, martín Ca, Casas F, mougeot F, garcía Jt, Viñuela J (2010) Áreas de campeo y movimientos estacionales de la ganga ibérica Pterocles alchata. In: Casinello J, Castro F (eds) XIII Congreso nacional y X Iberoamericano de etología. Ponen-cias y comunicaciones, Ciudad real, p 130
Benítez-lópez a, Viñuela J, hervás I, suárez F, garcía Jt (2013) modelling sandgrouse (Pterocles spp.) distributions and large-scale habitat requirements in spain: implications for conservation. environ Conserv 41:1–14. doi:10.1017/s0376892913000192
Brändle m, Brandl r (2008) Distribution, abundance and niche breadth of birds: scale matters. glob ecol Biogeogr 10:173–177
Brown Jh (1984) On the relationship between abundance and distri-bution of species. am nat 124:255–279
Brown Jh (1995) macroecology. university of Chicago Press, Chicago
Buckland st, anderson Dr, Burnham KP, laake Jl, Borchers Dl, thomas l (2001) Introduction to distance sampling. Oxford uni-versity Press, Oxford
Carrascal lm, seoane J, Polo V (2010) a shortcut to obtain reliable estimations of detectability in extensive multispecific census pro-grams. theoretical and empirical demonstrations. In: Bermejo a (ed) Bird numbers 2010. monitoring, indicators and targets. Book of abstracts of the 18th Conference of the european Bird Census Council (eBCC). seO/Birdlife, madrid, pp 98–99
Casas F et al (2012) movimientos estacionales de la ganga ibérica (Pterocles alchata) en la reserva de la Biosfera de las Bardenas reales (navarra). In: redondo t (ed) XIV Congreso nacional y XI Iberoamericano de etología. libro de resúmenes. Digital CsIC, sevilla
Chase Jm, leibold ma (2003) ecological niches: linking classi-cal and contemporary approaches. university of Chicago Press, Chicago
Chunco aJ, Jobe t, Pfennig Ks (2012) Why do species co-occur? a test of alternative hypotheses describing abiotic differences in sympatry versus allopatry using spadefoot toads. Plos One 7:e32748. doi:10.1371/journal.pone.0032748
Crawley mJ (2007) the r book. Wiley, ChichesterDarwin C (1859) On the origin of species by means of natural selec-
tion. murray, londonDevictor V et al (2010) Defining and measur-
ing ecological specialization. J appl ecol 47:15–25. doi:10.1111/j.1365-2664.2009.01744.x
eriksson O (2013) species pools in cultural landscapes—niche con-struction, ecological opportunity and niche shifts. ecography 36:403–413. doi:10.1111/j.1600-0587.2012.07913.x

206 Oecologia (2014) 176:193–206
1 3
garcía J, arroyo B (2005) Food-niche differentiation in sympatric hen Circus cyaneus and montagu’s harriers Circus pygargus. Ibis 147:144–154
gaston KJ (2003) the structure and dynamics of geographic ranges. Oxford university Press, Oxford
gaston K, Blackburn t (2000) Pattern and process in macroecology. Blackwell, Oxford
gaston KJ, lawton Jh (1990) effects of scale and habitat on the relationship between regional distribution and local abundance. Oikos 58:329–335
gaston KJ, Blackburn tm, lawton Jh (1997) Interspecific abun-dance-range size relationships: an appraisal of mechanisms. J anim ecol 66:579–601. doi:10.2307/5951
geange sW, Pledger s, Burns KC, shima Js (2011) a unified analysis of niche overlap incorporating data of different types. methods ecol evol 2:175–184. doi:10.1111/j.2041-210X.2010.00070.x
gotelli nJ (2000) null model analysis of species co-occurrence pat-terns. ecology 81:2606–2621
gregory rD, gaston KJ (2000) explanations of commonness and rarity in British breeding birds: separating resource use and resource availability. Oikos 88:515–526. doi:10.1034/j.1600- 0706.2000.880307.x
hanski I, Kouki J, halkka a (1993) three explanations of the rela-tionship between density and distribution of species. In: ricklefs r, schluter D (eds) species diversity in ecological communities: historical and geographical perspectives. Chicago university Press, Chicago, pp 108–116
heino J (2005) Positive relationship between regional distribution and local abundance in stream insects: a consequence of niche breadth or niche position? ecography 28:345–354. doi:10.1111/j.0906- 7590.2005.04151.x
herranz J, suárez F (1999) la ganga ibérica (Pterocles alchata) y la ganga ortega (Pterocles orientalis) en españa. Distribución, abundancia, biología y conservación. Colección técnica. minis-terio de medio ambiente, Organismo autónomo Parques nacion-ales, madrid
hinsley sa, Ferns Pn, thomas Dh, Pinshow B (1993) Black-bel-lied sandgrouse (Pterocles orientalis) and pin-tailed sandgrouse (Pterocles alchata): closely related species with differing bioen-ergetic adaptations to arid zones. Physiol Zool 66:20–42
hutchinson ge (1957) Concluding remarks. Cold spring harbor symp Quant Biol 22:415–427
levins r (1968) evolution in changing environments: some theoreti-cal explorations. Princeton university Press, Princeton
macarthur rh (1972) geographical ecology: patterns in the distribu-tion of species. Princeton university Press, Princeton
macarthur r, levins r (1967) the limiting similarity, convergence, and divergence of coexisting species. am nat 101:377–385
manly BFJ (2007) randomization, bootstrap and monte Carlo meth-ods in biology, 3rd edn. Chapman hall, london
martín Ca, Casas F, mougeot F, garcía Jt, Viñuela J (2010) Posi-tive interactions between vulnerable species in agrarian pseudo-steppes: habitat use by pin-tailed sandgrouse depends on its association with the little bustard. anim Conserv 13:383–389. doi:10.1111/j.1469-1795.2010.00349.x
mcCullagh P, nelder Ja (1989) generalized linear models. Chapman & hall/CrC, london
mcgarigal K, Cushman s, stafford s (2000) multivariate statistics for wildlife and ecology research. springer, new york
mcgill r, tukey JW, larsen Wa (1978) Variations of box plots. am stat 32:12–16
mouillot D et al (2005) niche overlap estimates based on quantitative functional traits: a new family of non-parametric indices. Oecolo-gia 145:345–353. doi:10.1007/s00442-005-0151-z
ninyerola m, Pons X, roure J (2005) atlas Climático Digital de la Península Ibérica. metodología y aplicaciones en Bioclima-tología y geobotánica. universidad autónoma de Barcelona, Bel-laterra, spain
Osborne Pe, suárez-seoane s, Carlos alonso J (2007) Behav-ioural mechanisms that undermine species envelope mod-els: the causes of patchiness in the distribution of great bustards Otis tarda in spain. ecography 30:819–829. doi:10.1111/j.2007.0906-7590.05233.x
r Development-Core-team (2012) r: a language and environment for statistical computing. r Foundation for statistical Computing, Vienna http://www.r-project.org
rannap r, lõhmus a, Briggs l (2009) niche position, but not niche breadth, differs in two coexisting amphibians having contrasting trends in europe. Divers Distrib 15:692–700
rivas-martínez s (2004) Bioclimatic map of europe: bioclimates, scale 1:16 mill. Cartographic service, university of león, león
sanza ma, traba J, morales mB, rivera D, Delgado mP (2012) effects of landscape, conspecifics and heterospecifics on habi-tat selection by breeding farmland birds: the case of the Calan-dra lark (Melanocorypha calandra) and corn bunting (Emberiza calandra). J Ornithol 153:1–9. doi:10.1007/s10336-011-0773-3
silverman B (1986) Density estimation for statistics and data analy-sis. Chapman hall, london
slatyer ra, hirst m, sexton JP (2013) niche breadth predicts geo-graphical range size: a general ecological pattern. ecol lett 16:1104–1114. doi:10.1111/ele.12140
soberón J (2007) grinnellian and eltonian niches and geographic dis-tributions of species. ecol lett 10:1115–1123. doi:10.1111/j.1461- 0248.2007.01107.x
sridhar h, Beauchamp g, shanker K (2009) Why do birds participate in mixed-species foraging flocks? a large-scale synthesis. anim Behav 78:337–347
suárez F, hervás I, herranz J, Del moral JC (2006) la ganga ibé-rica y la ganga ortega en españa: población en 2005 y método de censo. seO/Birdlife, madrid
swenson n (2006) gis-based niche models reveal unifying climatic mechanisms that maintain the location of avian hybrid zones in a north american suture zone. J evol Biol 19:717–725. doi:10.1111/j.1420-9101.2005.01066.x
thomas l et al (2006) Distance sampling. In: el-shaarawi ah, Piegorsch WW (eds) encyclopedia of environmetrics. Wiley, Chichester
Walls sC (2009) the role of climate in the dynamics of a hybrid zone in appalachian salamanders. glob Change Biol 15:1903–1910. doi:10.1111/j.1365-2486.2009.01867.x
Wisz ms et al (2013) the role of biotic interactions in shaping distributions and realised assemblages of species: implica-tions for species distribution modelling. Biol rev 88:15–30. doi:10.1111/j.1469-185X.2012.00235.x
Zuur aF, Ieno en, Walker nJ, saveliev aa, smith gm (2009) mixed effects models and extensions in ecology with r. springer, new york
Copyright © 2022 FDOKUMEN