Distribution and abundance of shorebirds in the coastal wetlands of the Yucatan Peninsula, Mexico
Upload
khangminh22Category
view
0download
0
HAL Id: hal-03454657https://hal.uca.fr/hal-03454657
Submitted on 29 Nov 2021
HAL is a multi-disciplinary open accessarchive for the deposit and dissemination of sci-entific research documents, whether they are pub-lished or not. The documents may come fromteaching and research institutions in France orabroad, or from public or private research centers.
L’archive ouverte pluridisciplinaire HAL, estdestinée au dépôt et à la diffusion de documentsscientifiques de niveau recherche, publiés ou non,émanant des établissements d’enseignement et derecherche français ou étrangers, des laboratoirespublics ou privés.
Distributed under a Creative Commons Attribution| 4.0 International License
Distribution patterns of Vibrionaceae abundance on thelanding stages in coastal area: Understanding the
influence of physicochemical variables by using multiplelinear regression models and corrgram for matrix
correlationTamsa Antoine, Fils Mamert, Marlyse Luciane, Brice Joel, Pulchérie
Blandine, Vivien Olive, Tchakonté Siméon, Sylvie Belengfe, Sime-NgandoTélesphore, Moise Nola
To cite this version:Tamsa Antoine, Fils Mamert, Marlyse Luciane, Brice Joel, Pulchérie Blandine, et al.. Distributionpatterns of Vibrionaceae abundance on the landing stages in coastal area: Understanding the influ-ence of physicochemical variables by using multiple linear regression models and corrgram for matrixcorrelation. African Journal of Microbiology Research, Academic Journal, 2021, 15 (6), pp.304-317.�10.5897/AJMR2021.9530�. �hal-03454657�
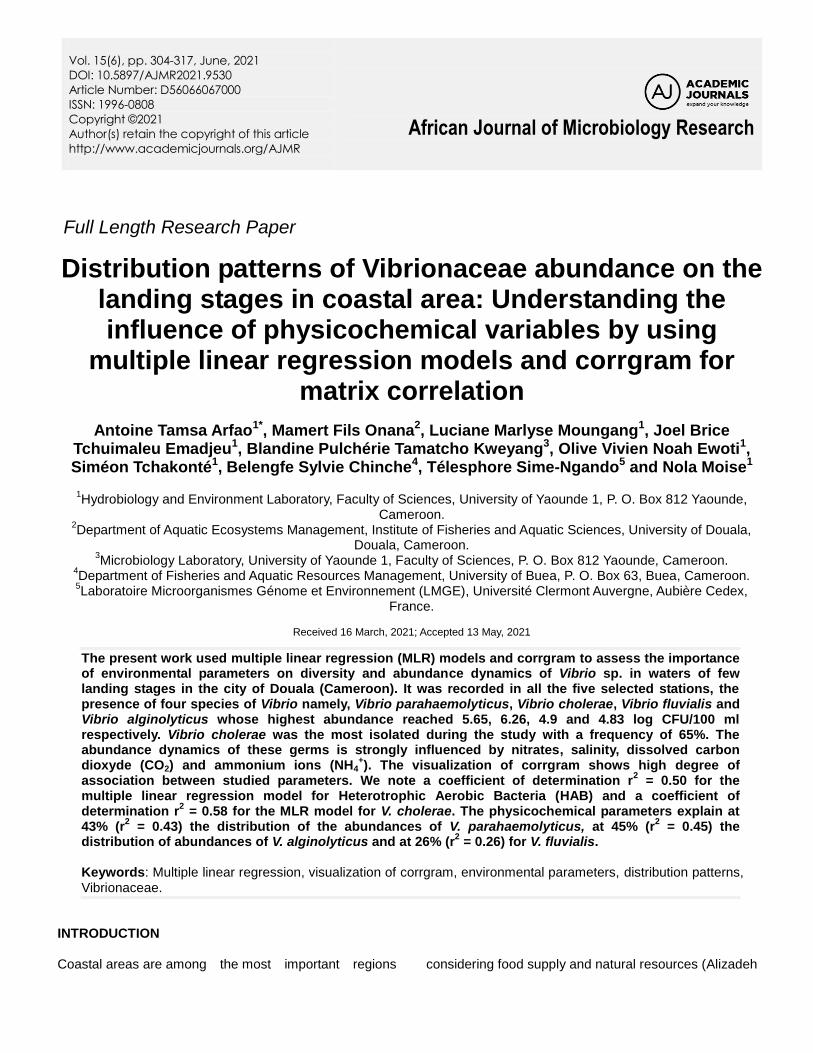
Vol. 15(6), pp. 304-317, June, 2021
DOI: 10.5897/AJMR2021.9530
Article Number: D56066067000
ISSN: 1996-0808
Copyright ©2021
Author(s) retain the copyright of this article
http://www.academicjournals.org/AJMR
African Journal of Microbiology Research
Full Length Research Paper
Distribution patterns of Vibrionaceae abundance on the landing stages in coastal area: Understanding the influence of physicochemical variables by using
multiple linear regression models and corrgram for matrix correlation
Antoine Tamsa Arfao1*, Mamert Fils Onana2, Luciane Marlyse Moungang1, Joel Brice Tchuimaleu Emadjeu1, Blandine Pulchérie Tamatcho Kweyang3, Olive Vivien Noah Ewoti1, Siméon Tchakonté1, Belengfe Sylvie Chinche4, Télesphore Sime-Ngando5 and Nola Moise1
1Hydrobiology and Environment Laboratory, Faculty of Sciences, University of Yaounde 1, P. O. Box 812 Yaounde,
Cameroon. 2Department of Aquatic Ecosystems Management, Institute of Fisheries and Aquatic Sciences, University of Douala,
Douala, Cameroon. 3Microbiology Laboratory, University of Yaounde 1, Faculty of Sciences, P. O. Box 812 Yaounde, Cameroon.
4Department of Fisheries and Aquatic Resources Management, University of Buea, P. O. Box 63, Buea, Cameroon.
5Laboratoire Microorganismes Génome et Environnement (LMGE), Université Clermont Auvergne, Aubière Cedex,
France.
Received 16 March, 2021; Accepted 13 May, 2021
The present work used multiple linear regression (MLR) models and corrgram to assess the importance of environmental parameters on diversity and abundance dynamics of Vibrio sp. in waters of few landing stages in the city of Douala (Cameroon). It was recorded in all the five selected stations, the presence of four species of Vibrio namely, Vibrio parahaemolyticus, Vibrio cholerae, Vibrio fluvialis and Vibrio alginolyticus whose highest abundance reached 5.65, 6.26, 4.9 and 4.83 log CFU/100 ml respectively. Vibrio cholerae was the most isolated during the study with a frequency of 65%. The abundance dynamics of these germs is strongly influenced by nitrates, salinity, dissolved carbon dioxyde (CO2) and ammonium ions (NH4
+). The visualization of corrgram shows high degree of
association between studied parameters. We note a coefficient of determination r2 = 0.50 for the
multiple linear regression model for Heterotrophic Aerobic Bacteria (HAB) and a coefficient of determination r
2 = 0.58 for the MLR model for V. cholerae. The physicochemical parameters explain at
43% (r2 = 0.43) the distribution of the abundances of V. parahaemolyticus, at 45% (r
2 = 0.45) the
distribution of abundances of V. alginolyticus and at 26% (r2 = 0.26) for V. fluvialis.
Keywords: Multiple linear regression, visualization of corrgram, environmental parameters, distribution patterns, Vibrionaceae.
INTRODUCTION Coastal areas are among the most important regions considering food supply and natural resources (Alizadeh
et al., 2018). They are vulnerable to the extremely variable conditions of coastal environments such as tides, storms and low flows (Conley, 2000; Gonzáles et al., 2004). This is the case of the urbanized hydrographic network of the Wouri, which is subjected to anthropogenic pressures due to the anarchic proliferation of industrial and urban activities and tidal phenomena (Tchakonté, 2016). The high activity in the coastal and marine waters can make an impact on the pollution and the quality of coastal and marine waters (Tanjung et al., 2019). Monitoring of the coastal water quality is vital from the perspectives of coastal resource usage and management (Pravakar et al., 2015). Estuaries and coastal areas are high strategic areas for economies and environment. They perform many biological and ecological functions such as fish nursery grounds. The ecological functioning of these nurseries is vital to allow the normal life cycle of many marine species of major economic interests.
Coasts are transitional surfaces between continents and the sea (Beatley et al., 1994). These are areas where the predominantly continental and oceanic mechanisms ignite and interact intensely. From an economic point of view, the coastal zone is essentially made up of consumers of fishery products and infrastructure that depend on river or sea ports (Niang et al., 2012). This structuring therefore brings out a submerged zone, made up of aquatic ecosystems (rivers, estuaries and seas) and another emerged (terrestrial) where intense economic activities take place within the limits of the coastal region which is located on either side of the coastline. Faced with multiple environmental stresses, bacteria in general and those of the genus Vibrio in particular have remarkable survival strategies and adaptations capacities of their physiological functions (Zhong et al., 2009).
Several studies have revealed that the dynamics of bacterioplankton abundance is generally controlled by various environmental parameters of the medium (Nola et al., 2002; Castaneda et al., 2005; Ben et al., 2014; Tamsa Arfao et al., 2021). The water quality depends of the physicochemical parameters of the waters (Hamuna et al., 2018). Vibrio species are known autochthonous populations found in freshwaters and marine sediments worldwide (Osunla and Okoh, 2017). However, few data are available on the distribution of vibrioplankton in Cameroonian coastal waters in general and at landing stages in particular. Little is known about the influence of physicochemical parameters on the diversity and abundance of bacteria of the vibrio genus in coastal areas. But, the influence of physicochemical parameters on this abundance dynamic has not been addressed very much.
Arfao et al. 305
Multiple linear regressions and correlation matrices are used by researchers to assess the quality of water environments. Multiple linear regression (MLR) is used to determine mathematical relationship among a number of random variables. In other terms, MLR examines how multiple independent variables are related to one dependent variable. Once each of the independent factors has been determined to predict the dependent variable, the information on the multiple variables can be used to create an accurate prediction on the level of effect they have on the outcome variable. These analysis method has been used for River water modelling prediction (Abba et al., 2017). The present work aims, through multiple linear regressions and correlation matrices, to determine the parameters which influence on the diversity and abundance of bacteria of the Vibrio genus at the landing stages in coastal areas. MATERIALS AND METHODS
Study area and sampling stations
The study took place from February to July 2019 in the city of Douala, economic capital city of Cameroon and capital city of the Littoral Region. It is geographically located in the Golf of Guinea at the intersection of the parallel 04°03 North latitude and the 09°04 meridian East longitude. The climate is equatorial, Cameroonian type, coastal sub-type, with monomodal rainfall characterized by heavy rainfall (3414 mm on average in 2011) and an average ambient temperature of 26.3°C. There are two unevenly distributed seasons, a long rainy season which lasts nine months (March - November) and a short dry season which lasts three months (December - February) (Suchel, 1972).
Concerning the metrological data of the city of Douala during the study period, the air temperature varied from 26.1 to 27.6°C, the relative humidity as for it varies between 74 and 78%. The values of insolation and rainfall reach 190 KWh / m2 / d and 592.2 mm respectively.
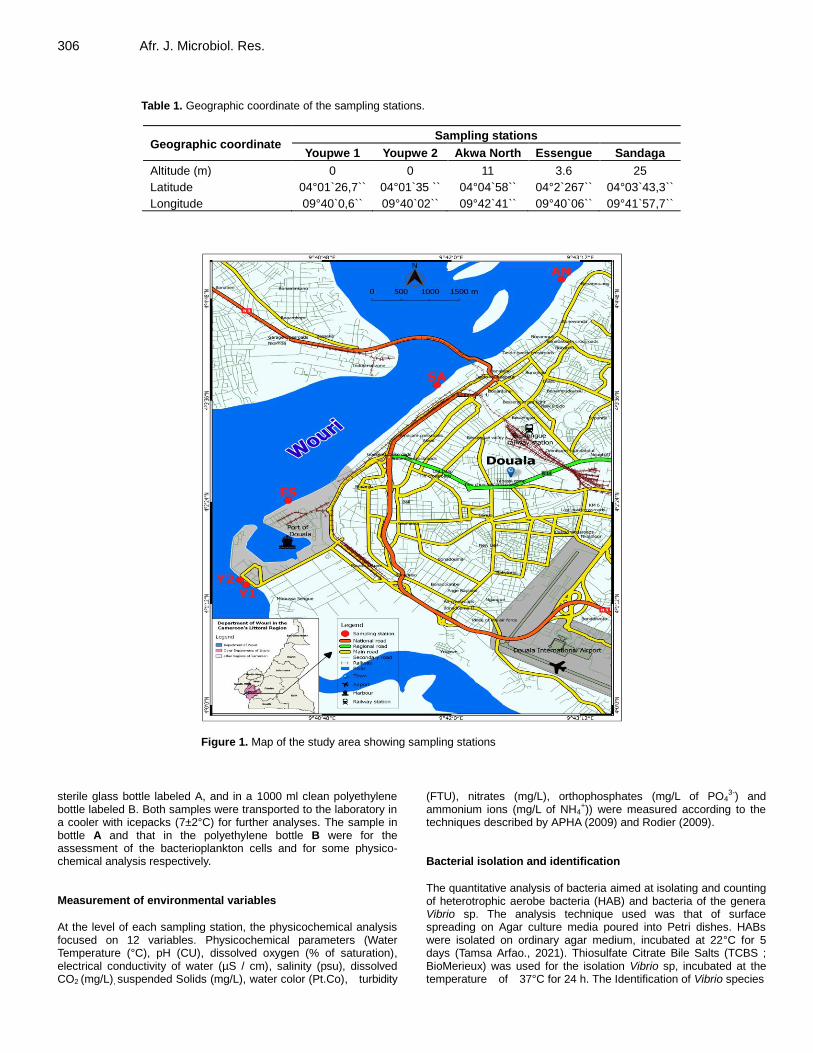
The vegetation, initially of the humid dense forest type, is completely degraded nowadays. The very dense hydrographic network is made up of the Wouri and Dibamba rivers and their tributaries which irrigate almost the entire city. At the petrographic level, the soils consist mainly of sandy and clayey-sandy formations (Giresse et al., 1996). In order to have a clear idea of the location of the different study sites, the geographical coordinates of all the sampling stations were determined using a Garmin Etrex 30 brand GPS. Those coordinates are given in Table 1. Figure 1 shows the geographical location of the study area and the sampling stations.
The choice of sampling stations was made on the basis of their accessibility, their economic importance and their proximity to marketplaces. These different stations serve as clearinghouse for the landing of sea products of various species (shrimp, fish, skate), and the risks of contamination of the landing stages are higher. A total of five stations were chosen including two stations at the Youpwe landing stage (Youpwe 1 and 2), one station at the Essengue and Akwa North landing stages and a last station at the Sandaga port. At each site, water sample was collected in a 500 ml
*Corresponding author. E-mail: [email protected].
Author(s) agree that this article remain permanently open access under the terms of the Creative Commons Attribution
License 4.0 International License
306 Afr. J. Microbiol. Res.
Table 1. Geographic coordinate of the sampling stations.
Geographic coordinate Sampling stations
Youpwe 1 Youpwe 2 Akwa North Essengue Sandaga
Altitude (m) 0 0 11 3.6 25
Latitude 04°01`26,7`` 04°01`35 `` 04°04`58`` 04°2`267`` 04°03`43,3``
Longitude 09°40`0,6`` 09°40`02`` 09°42`41`` 09°40`06`` 09°41`57,7``
Figure 1. Map of the study area showing sampling stations
sterile glass bottle labeled A, and in a 1000 ml clean polyethylene bottle labeled B. Both samples were transported to the laboratory in a cooler with icepacks (7±2°C) for further analyses. The sample in bottle A and that in the polyethylene bottle B were for the assessment of the bacterioplankton cells and for some physico-chemical analysis respectively. Measurement of environmental variables
At the level of each sampling station, the physicochemical analysis focused on 12 variables. Physicochemical parameters (Water Temperature (°C), pH (CU), dissolved oxygen (% of saturation), electrical conductivity of water (µS / cm), salinity (psu), dissolved CO2 (mg/L), suspended Solids (mg/L), water color (Pt.Co), turbidity
(FTU), nitrates (mg/L), orthophosphates (mg/L of PO43-) and
ammonium ions (mg/L of NH4+)) were measured according to the
techniques described by APHA (2009) and Rodier (2009). Bacterial isolation and identification
The quantitative analysis of bacteria aimed at isolating and counting of heterotrophic aerobe bacteria (HAB) and bacteria of the genera Vibrio sp. The analysis technique used was that of surface spreading on Agar culture media poured into Petri dishes. HABs were isolated on ordinary agar medium, incubated at 22°C for 5 days (Tamsa Arfao., 2021). Thiosulfate Citrate Bile Salts (TCBS ; BioMerieux) was used for the isolation Vibrio sp, incubated at the temperature of 37°C for 24 h. The Identification of Vibrio species
began with the research for mobility type and Gram staining. Gram stain provides information on the morphology and structure of the bacteria wall. The parameters considered were the colour, size and shape of the colonies on the TCBS agar. Classical biochemical identification has made it possible to search for enzymes such as oxidase, lysine decarboxylase, ornithine decarboxylase, urease, tryptophanase and βgalactosidase (Holt et al., 2000). From a pure culture colony on alkaline nutrient agar, a suspension in sterile distilled water was prepared. The bacterial suspension were distributed in the capsules of the API 20E system (BioMérieux, France). The metabolites produced were made evident by color reactions or by addition of reagents, after 24 h of incubation at 37°C. Corresponding bacterial species were determined numerically with the help of APIDENT 2.0 software. The identification rate was maintained at least at 98%. The count of isolated germs was carried out using an OSI brand colony counter. Bacterial abundances are expressed in decimal logarithmic units Colonial Forming Units (CFU) per 100 ml of water sample.
Data and statistical analysis Data was typed using Microsoft Excel and imported into the programme SPSS version 25.0 for analysis. The Kolmogorov-Smirnov test was first applied to check the normality of the distribution before comparing environmental parameters and abundances of bacteria isolated. The Kruskal – Wallis test and Mann – Whitney test were then performed with SPSS 25.0 to verify significant differences between stations considering each environmental parameter. The corrplot function of R Software version 3.5.0 allowed us to obtain corrgram. A corrgram represents the graph of a correlation matrix. The corrgram is very important to highlight the most correlated variables. In this type of graph, the correlation coefficients are colored according to their value. The correlation matrix can also be reordered according to the degree of correlation between the variables. This corrgram was used to measure the degree of association between abiotic variables on one hand, and between abiotic and biological variables on the other hand. Multiple linear regression models were done to establish relationships between the physicochemical variables and abundance bacteria of Vibrionacaea. This statistacal method predicts the level of variation between the variables and defined by the following equation:
𝑦𝑖 = 𝑏0 + 𝑏1𝑥1 + 𝑏2𝑥2 + ⋯+𝑏𝑖𝑥𝑖
Where, for i = n observations, yi is dependent variable, xi is explanatory variables, b0 is y-intercept (constant term) and bi the slope coefficients for each explanatory variable (Parmar and Bhardwaj, 2015; Chen and Liu, 2015).
RESULTS
Environmental variables
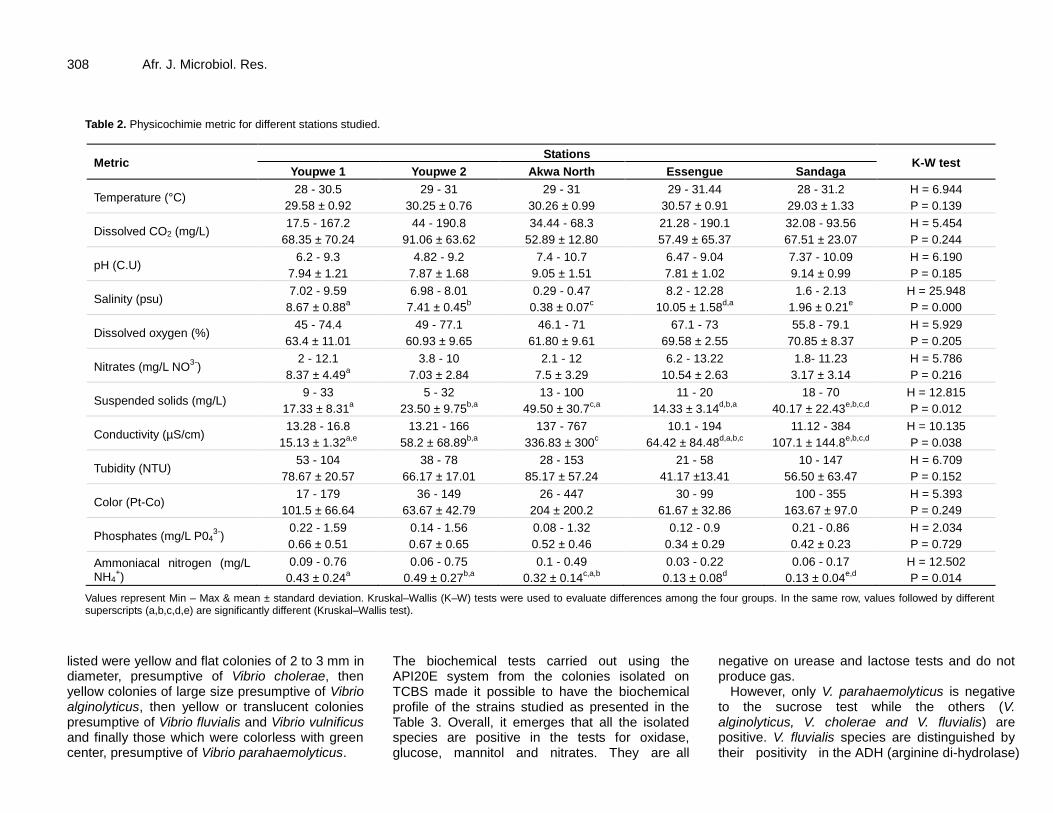
The minimum and maximum values, the mean values and standard deviations of the physicochemical parameters measured at each landing stage studied are presented in Table 2. The results of the comparison tests of the Kruskal Wallis test have also been presented. The water temperature and pH values varied from 28 to 31.44°C and from 7.81 ± 1.02 and 9.14 ± 0.99 CU. The average temperature values fluctuated between 29.03 ± 1.33 and 30.57 ± 0.91°C with a high value recorded in March at the Essengue landing stage. The lowest pH
Arfao et al. 307 value was recorded in February at Youpwe 2 and the highest value in June at Akwa North landing stage. Dissolved CO2 content varied with mean values between 52.89 ± 12.80 and 91.06 ± 63.62 mg/L. No significant difference was observed between the stations (Kruskal-Wallis H test; p > 0.05) for these two parameters. The same was true for the pH values, which also showed no significant difference between the different landing stages.
Suspended solids contents were relatively high at most stations throughout the sampling period. The mean values ranged from 14.33 ± 3.14 mg/L to 49.50 ± 30.7 mg/L. The evolution of suspended solids content showed significant differences (Kruskal-Wallis H test; p < 0.05), in particular between the Youpwe 1 and Sandaga wharves, between Youpwe 2 and Akwa North, and between Essengue and Akwa North (Mann-Whitney U test; p < 0.05). Turbidity contents ranged from 10 to 153 NTU. The lowest values were obtained at the Sandaga stations and the highest in March at the Akwa North station. Water color fluctuated between 17 and 447 Pt.Co during the study. The variation profile of these two parameters does not show any significant difference between the different stations studied (p > 0.05). Regarding ammonium ions, significant differences (p < 0.05) were observed with mean values between 0.13 ± 0.08 and 0.49 ± 0.27 mg/L. The differences observed were between Youpwe 1 and the other landing stages except those of Youpwe 2 and Akwa North (p < 0.05). Water salinity showed relatively stable spatial fluctuations during the study period. However, the highest salinity concentration was obtained in March in Essengue (12.28 psu) and the lowest in July at the Akwa North landing stage (0.29 psu) with average values between 0.38 ± 0.07 and 10.05 ± 1.58 psu. Variations in salinity were significant between all the stations (Kruskal-Wallis H test and Mann-Whitney U test; p < 0.05), except between the Youpwe 1 and Essengue docks where there is no significant difference (p ˃ 0.05). Dissolved oxygen saturation rate had mean values between 60.93 ± 9.65 and 70.85 ± 8.37%, the greatest value being observed at the Sandaga landing stage. The same statistical results are observed for waters which content nitrates and phosphates (Kruskal-Wallis H test; p > 0.05). Electrical conductivity varied between 10.1 and 767 µS/cm at the landing stages of Essengue and Akwa North respectively. A significant difference was recorded (p < 0.05), in particular between the Youpwe 1 and Akwa North wharves, between Youpwe 2 and Akwa North. The lowest nitrate content in the water was obtained in Sandaga in April (1.8 mg/L) while the highest nitrate concentration was 13.22 mg/L. This value was recorded in Essengue in June. The highest level of phosphates reached the value of 1.591 mg/L, observed at the Youpwe 1.
Biochemical characterization of isolates The cultural characters of the different Vibrio species
308 Afr. J. Microbiol. Res.
Table 2. Physicochimie metric for different stations studied.
Metric Stations
K-W test Youpwe 1 Youpwe 2 Akwa North Essengue Sandaga
Temperature (°C) 28 - 30.5
29.58 ± 0.92
29 - 31
30.25 ± 0.76
29 - 31
30.26 ± 0.99
29 - 31.44
30.57 ± 0.91
28 - 31.2
29.03 ± 1.33
H = 6.944
P = 0.139
Dissolved CO2 (mg/L) 17.5 - 167.2
68.35 ± 70.24
44 - 190.8
91.06 ± 63.62
34.44 - 68.3
52.89 ± 12.80
21.28 - 190.1
57.49 ± 65.37
32.08 - 93.56
67.51 ± 23.07
H = 5.454
P = 0.244
pH (C.U) 6.2 - 9.3
7.94 ± 1.21
4.82 - 9.2
7.87 ± 1.68
7.4 - 10.7
9.05 ± 1.51
6.47 - 9.04
7.81 ± 1.02
7.37 - 10.09
9.14 ± 0.99
H = 6.190
P = 0.185
Salinity (psu) 7.02 - 9.59
8.67 ± 0.88a
6.98 - 8.01
7.41 ± 0.45b
0.29 - 0.47
0.38 ± 0.07c
8.2 - 12.28
10.05 ± 1.58d,a
1.6 - 2.13
1.96 ± 0.21e
H = 25.948
P = 0.000
Dissolved oxygen (%) 45 - 74.4
63.4 ± 11.01
49 - 77.1
60.93 ± 9.65
46.1 - 71
61.80 ± 9.61
67.1 - 73
69.58 ± 2.55
55.8 - 79.1
70.85 ± 8.37
H = 5.929
P = 0.205
Nitrates (mg/L NO3-
) 2 - 12.1
8.37 ± 4.49a
3.8 - 10
7.03 ± 2.84
2.1 - 12
7.5 ± 3.29
6.2 - 13.22
10.54 ± 2.63
1.8- 11.23
3.17 ± 3.14
H = 5.786
P = 0.216
Suspended solids (mg/L) 9 - 33
17.33 ± 8.31a
5 - 32
23.50 ± 9.75b,a
13 - 100
49.50 ± 30.7c,a
11 - 20
14.33 ± 3.14d,b,a
18 - 70
40.17 ± 22.43e,b,c,d
H = 12.815
P = 0.012
Conductivity (µS/cm) 13.28 - 16.8
15.13 ± 1.32a,e
13.21 - 166
58.2 ± 68.89b,a
137 - 767
336.83 ± 300c
10.1 - 194
64.42 ± 84.48d,a,b,c
11.12 - 384
107.1 ± 144.8e,b,c,d
H = 10.135
P = 0.038
Tubidity (NTU) 53 - 104
78.67 ± 20.57
38 - 78
66.17 ± 17.01
28 - 153
85.17 ± 57.24
21 - 58
41.17 ±13.41
10 - 147
56.50 ± 63.47
H = 6.709
P = 0.152
Color (Pt-Co) 17 - 179
101.5 ± 66.64
36 - 149
63.67 ± 42.79
26 - 447
204 ± 200.2
30 - 99
61.67 ± 32.86
100 - 355
163.67 ± 97.0
H = 5.393
P = 0.249
Phosphates (mg/L P043-
) 0.22 - 1.59
0.66 ± 0.51
0.14 - 1.56
0.67 ± 0.65
0.08 - 1.32
0.52 ± 0.46
0.12 - 0.9
0.34 ± 0.29
0.21 - 0.86
0.42 ± 0.23
H = 2.034
P = 0.729
Ammoniacal nitrogen (mg/L NH4
+)
0.09 - 0.76
0.43 ± 0.24a
0.06 - 0.75
0.49 ± 0.27b,a
0.1 - 0.49
0.32 ± 0.14c,a,b
0.03 - 0.22
0.13 ± 0.08d
0.06 - 0.17
0.13 ± 0.04e,d
H = 12.502
P = 0.014
Values represent Min – Max & mean ± standard deviation. Kruskal–Wallis (K–W) tests were used to evaluate differences among the four groups. In the same row, values followed by different superscripts (a,b,c,d,e) are significantly different (Kruskal–Wallis test).
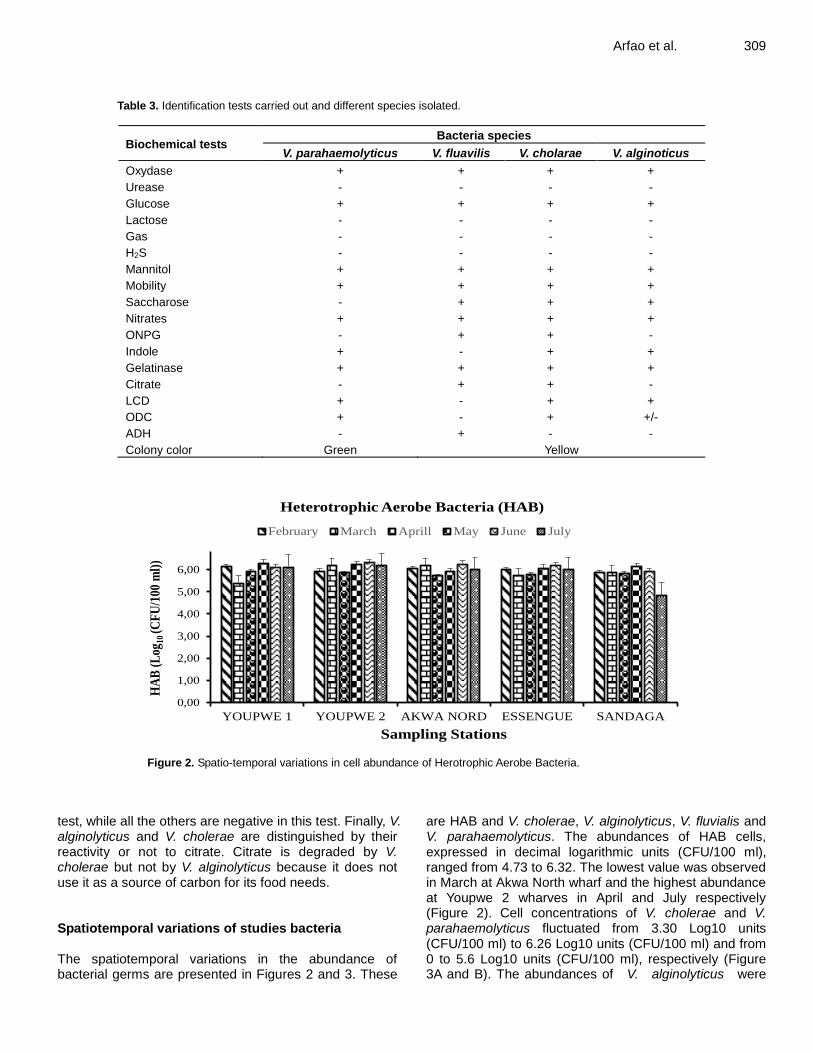
listed were yellow and flat colonies of 2 to 3 mm in diameter, presumptive of Vibrio cholerae, then yellow colonies of large size presumptive of Vibrio alginolyticus, then yellow or translucent colonies presumptive of Vibrio fluvialis and Vibrio vulnificus and finally those which were colorless with green center, presumptive of Vibrio parahaemolyticus.
The biochemical tests carried out using the API20E system from the colonies isolated on TCBS made it possible to have the biochemical profile of the strains studied as presented in the Table 3. Overall, it emerges that all the isolated species are positive in the tests for oxidase, glucose, mannitol and nitrates. They are all
negative on urease and lactose tests and do not produce gas.
However, only V. parahaemolyticus is negative to the sucrose test while the others (V. alginolyticus, V. cholerae and V. fluvialis) are positive. V. fluvialis species are distinguished by their positivity in the ADH (arginine di-hydrolase)
Arfao et al. 309
Table 3. Identification tests carried out and different species isolated.
Biochemical tests Bacteria species
V. parahaemolyticus V. fluavilis V. cholarae V. alginoticus
Oxydase + + + +
Urease - - - -
Glucose + + + +
Lactose - - - -
Gas - - - -
H2S - - - -
Mannitol + + + +
Mobility + + + +
Saccharose - + + +
Nitrates + + + +
ONPG - + + -
Indole + - + +
Gelatinase + + + +
Citrate - + + -
LCD + - + +
ODC + - + +/-
ADH - + - -
Colony color Green Yellow
0,00
1,00
2,00
3,00
4,00
5,00
6,00
YOUPWE 1 YOUPWE 2 AKWA NORD ESSENGUE SANDAGA
HA
B (
Log
10 (C
FU
/100
ml)
)
Sampling Stations
Heterotrophic Aerobe Bacteria (HAB)
February March Aprill May June July
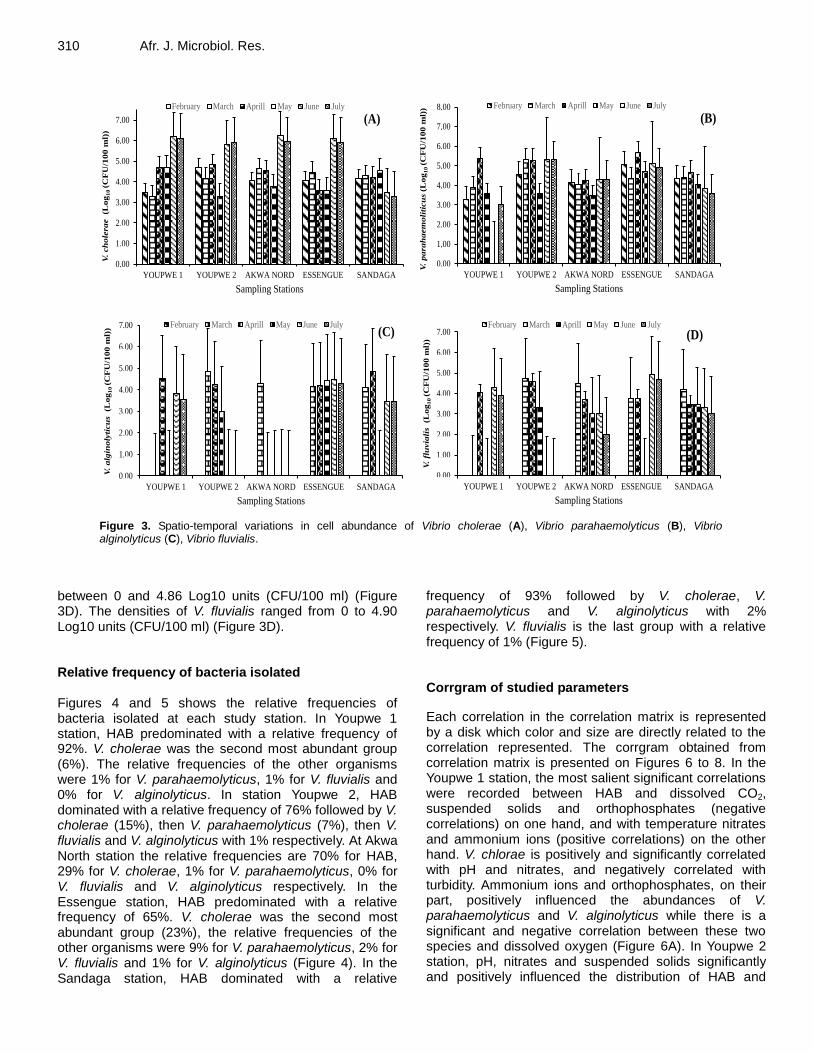
Figure 2. Spatio-temporal variations in cell abundance of Herotrophic Aerobe Bacteria.
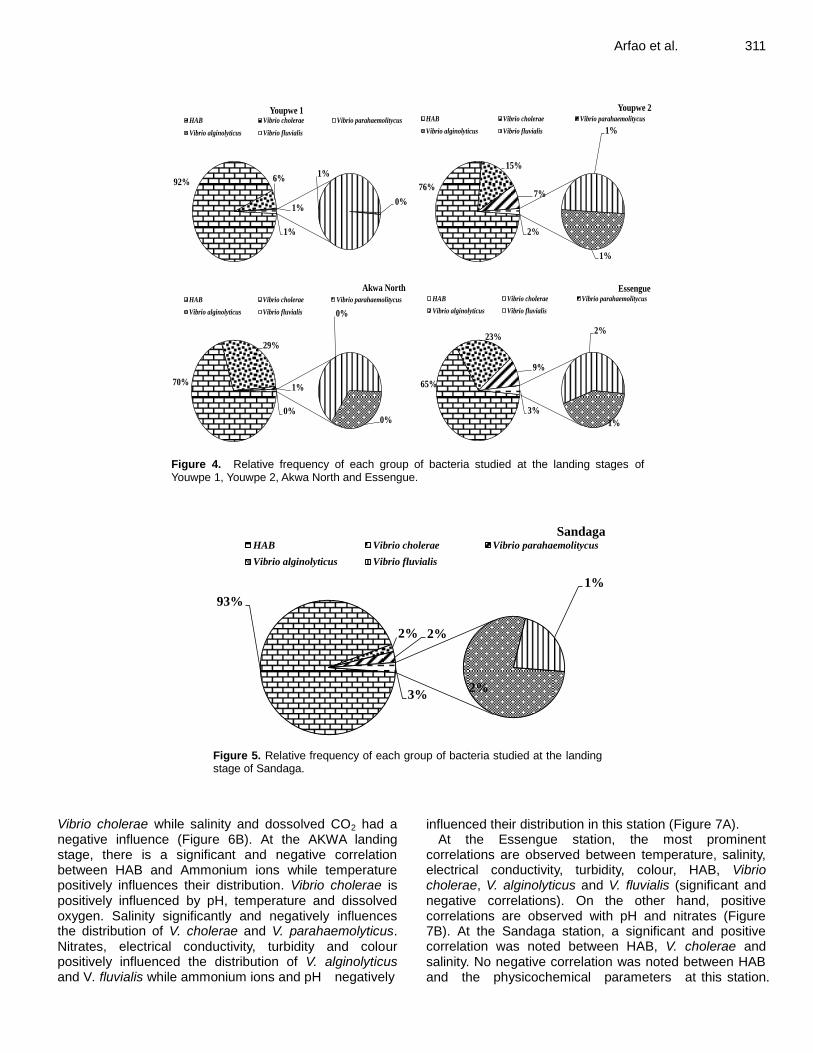
test, while all the others are negative in this test. Finally, V. alginolyticus and V. cholerae are distinguished by their reactivity or not to citrate. Citrate is degraded by V. cholerae but not by V. alginolyticus because it does not use it as a source of carbon for its food needs. Spatiotemporal variations of studies bacteria The spatiotemporal variations in the abundance of bacterial germs are presented in Figures 2 and 3. These
are HAB and V. cholerae, V. alginolyticus, V. fluvialis and V. parahaemolyticus. The abundances of HAB cells, expressed in decimal logarithmic units (CFU/100 ml), ranged from 4.73 to 6.32. The lowest value was observed in March at Akwa North wharf and the highest abundance at Youpwe 2 wharves in April and July respectively (Figure 2). Cell concentrations of V. cholerae and V. parahaemolyticus fluctuated from 3.30 Log10 units (CFU/100 ml) to 6.26 Log10 units (CFU/100 ml) and from 0 to 5.6 Log10 units (CFU/100 ml), respectively (Figure 3A and B). The abundances of V. alginolyticus were
310 Afr. J. Microbiol. Res.
0,00
1,00
2,00
3,00
4,00
5,00
6,00
7,00
YOUPWE 1 YOUPWE 2 AKWA NORD ESSENGUE SANDAGA
V.
ch
ole
rae
(Log
10
(C
FU
/100 m
l))
Sampling Stations
(A)February March Aprill May June July
0,00
1,00
2,00
3,00
4,00
5,00
6,00
7,00
8,00
YOUPWE 1 YOUPWE 2 AKWA NORD ESSENGUE SANDAGA
V.
parah
aem
oli
ticu
s (
Log
10
(C
FU
/100 m
l))
Sampling Stations
(B)February March Aprill May June July
0,00
1,00
2,00
3,00
4,00
5,00
6,00
7,00
YOUPWE 1 YOUPWE 2 AKWA NORD ESSENGUE SANDAGA
V.
alg
inoly
ticu
s (L
og
10
(C
FU
/100 m
l))
Sampling Stations
(C)February March Aprill May June July
0,00
1,00
2,00
3,00
4,00
5,00
6,00
7,00
YOUPWE 1 YOUPWE 2 AKWA NORD ESSENGUE SANDAGA
V.
flu
via
lis (L
og
10
(C
FU
/100 m
l))
Sampling Stations
(D)February March Aprill May June July
Figure 3. Spatio-temporal variations in cell abundance of Vibrio cholerae (A), Vibrio parahaemolyticus (B), Vibrio alginolyticus (C), Vibrio fluvialis.
between 0 and 4.86 Log10 units (CFU/100 ml) (Figure 3D). The densities of V. fluvialis ranged from 0 to 4.90 Log10 units (CFU/100 ml) (Figure 3D). Relative frequency of bacteria isolated Figures 4 and 5 shows the relative frequencies of bacteria isolated at each study station. In Youpwe 1 station, HAB predominated with a relative frequency of 92%. V. cholerae was the second most abundant group (6%). The relative frequencies of the other organisms were 1% for V. parahaemolyticus, 1% for V. fluvialis and 0% for V. alginolyticus. In station Youpwe 2, HAB dominated with a relative frequency of 76% followed by V. cholerae (15%), then V. parahaemolyticus (7%), then V. fluvialis and V. alginolyticus with 1% respectively. At Akwa North station the relative frequencies are 70% for HAB, 29% for V. cholerae, 1% for V. parahaemolyticus, 0% for V. fluvialis and V. alginolyticus respectively. In the Essengue station, HAB predominated with a relative frequency of 65%. V. cholerae was the second most abundant group (23%), the relative frequencies of the other organisms were 9% for V. parahaemolyticus, 2% for V. fluvialis and 1% for V. alginolyticus (Figure 4). In the Sandaga station, HAB dominated with a relative
frequency of 93% followed by V. cholerae, V. parahaemolyticus and V. alginolyticus with 2% respectively. V. fluvialis is the last group with a relative frequency of 1% (Figure 5). Corrgram of studied parameters
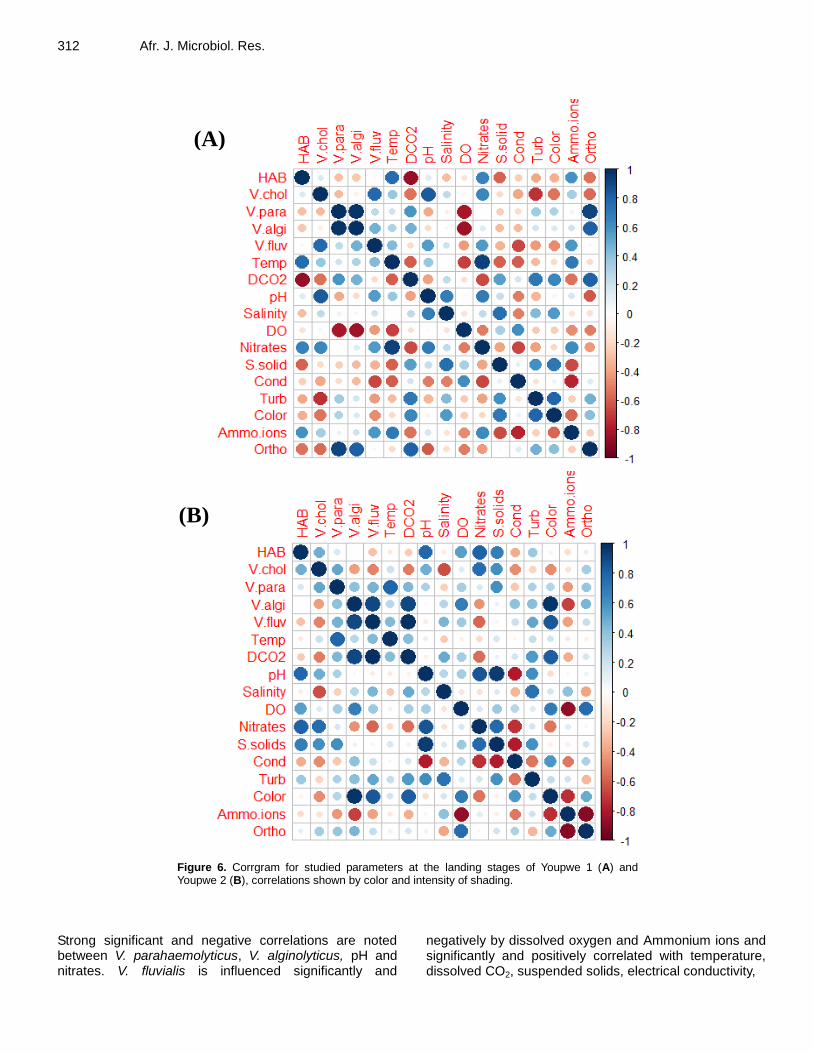
Each correlation in the correlation matrix is represented by a disk which color and size are directly related to the correlation represented. The corrgram obtained from correlation matrix is presented on Figures 6 to 8. In the Youpwe 1 station, the most salient significant correlations were recorded between HAB and dissolved CO2, suspended solids and orthophosphates (negative correlations) on one hand, and with temperature nitrates and ammonium ions (positive correlations) on the other hand. V. chlorae is positively and significantly correlated with pH and nitrates, and negatively correlated with turbidity. Ammonium ions and orthophosphates, on their part, positively influenced the abundances of V. parahaemolyticus and V. alginolyticus while there is a significant and negative correlation between these two species and dissolved oxygen (Figure 6A). In Youpwe 2 station, pH, nitrates and suspended solids significantly and positively influenced the distribution of HAB and
Arfao et al. 311
76%
15%
7%
1%
1%
2%
Youpwe 2HAB Vibrio cholerae Vibrio parahaemolitycus
Vibrio alginolyticus Vibrio fluvialis
92% 6%
1%0%
1%
1%
Youpwe 1HAB Vibrio cholerae Vibrio parahaemolitycus
Vibrio alginolyticus Vibrio fluvialis
70%
29%
1%
0%
0%
0%
Akwa North
HAB Vibrio cholerae Vibrio parahaemolitycus
Vibrio alginolyticus Vibrio fluvialis
65%
23%
9%
1%
2%
3%
EssengueHAB Vibrio cholerae Vibrio parahaemolitycus
Vibrio alginolyticus Vibrio fluvialis
Figure 4. Relative frequency of each group of bacteria studied at the landing stages of Youwpe 1, Youwpe 2, Akwa North and Essengue.
93%
2% 2%
2%
1%
3%
SandagaHAB Vibrio cholerae Vibrio parahaemolitycus
Vibrio alginolyticus Vibrio fluvialis
Figure 5. Relative frequency of each group of bacteria studied at the landing stage of Sandaga.
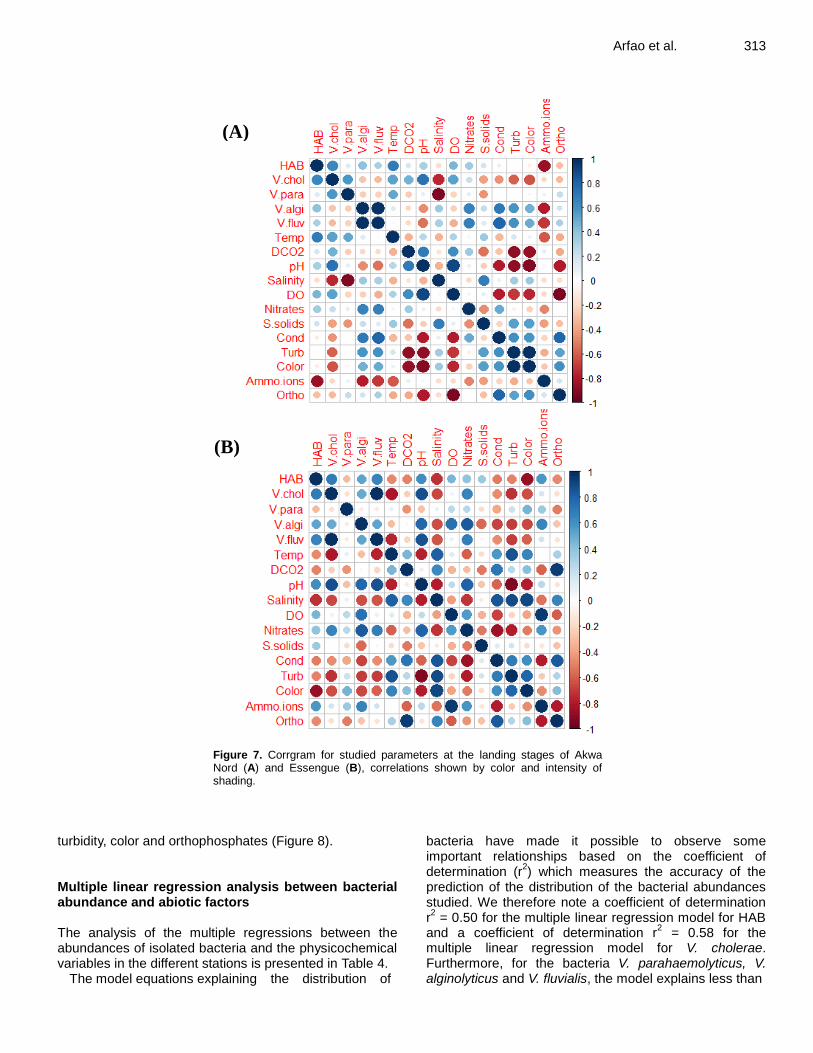
Vibrio cholerae while salinity and dossolved CO2 had a negative influence (Figure 6B). At the AKWA landing stage, there is a significant and negative correlation between HAB and Ammonium ions while temperature positively influences their distribution. Vibrio cholerae is positively influenced by pH, temperature and dissolved oxygen. Salinity significantly and negatively influences the distribution of V. cholerae and V. parahaemolyticus. Nitrates, electrical conductivity, turbidity and colour positively influenced the distribution of V. alginolyticus and V. fluvialis while ammonium ions and pH negatively
influenced their distribution in this station (Figure 7A). At the Essengue station, the most prominent
correlations are observed between temperature, salinity, electrical conductivity, turbidity, colour, HAB, Vibrio cholerae, V. alginolyticus and V. fluvialis (significant and negative correlations). On the other hand, positive correlations are observed with pH and nitrates (Figure 7B). At the Sandaga station, a significant and positive correlation was noted between HAB, V. cholerae and salinity. No negative correlation was noted between HAB and the physicochemical parameters at this station.
312 Afr. J. Microbiol. Res.
(A)
(B)
Figure 6. Corrgram for studied parameters at the landing stages of Youpwe 1 (A) and Youpwe 2 (B), correlations shown by color and intensity of shading.
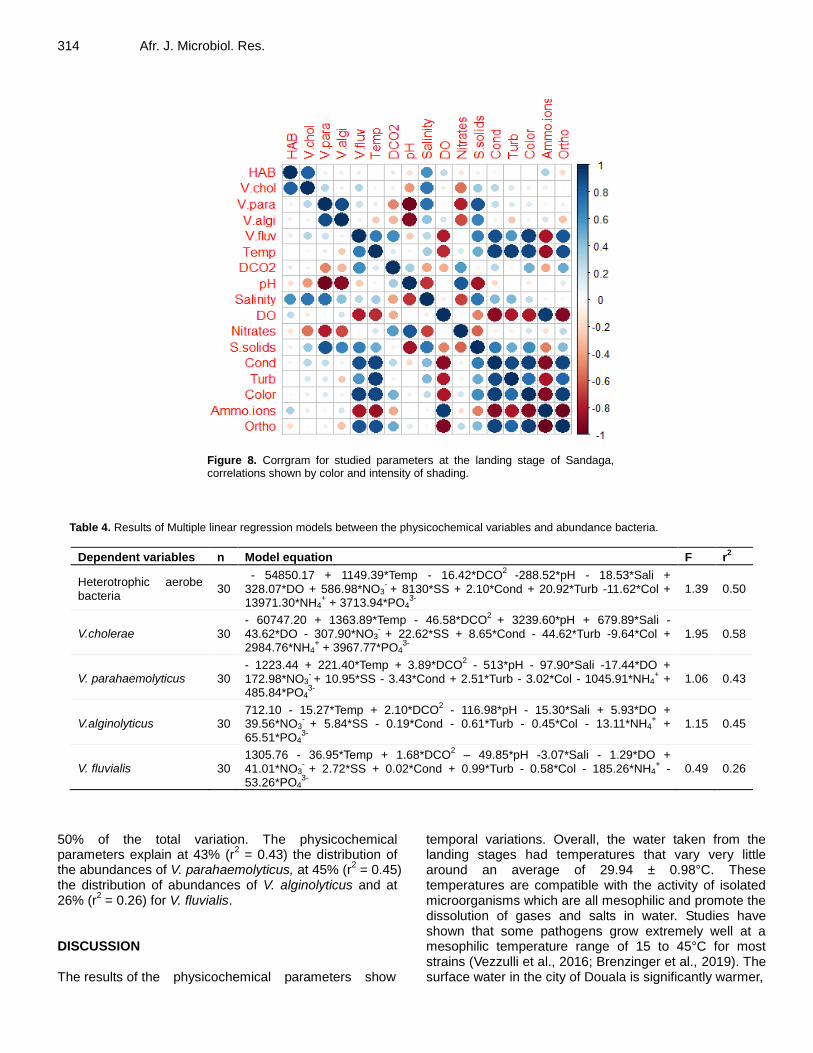
Strong significant and negative correlations are noted between V. parahaemolyticus, V. alginolyticus, pH and nitrates. V. fluvialis is influenced significantly and
negatively by dissolved oxygen and Ammonium ions and significantly and positively correlated with temperature, dissolved CO2, suspended solids, electrical conductivity,
Arfao et al. 313
(A)
(B)
Figure 7. Corrgram for studied parameters at the landing stages of Akwa Nord (A) and Essengue (B), correlations shown by color and intensity of shading.
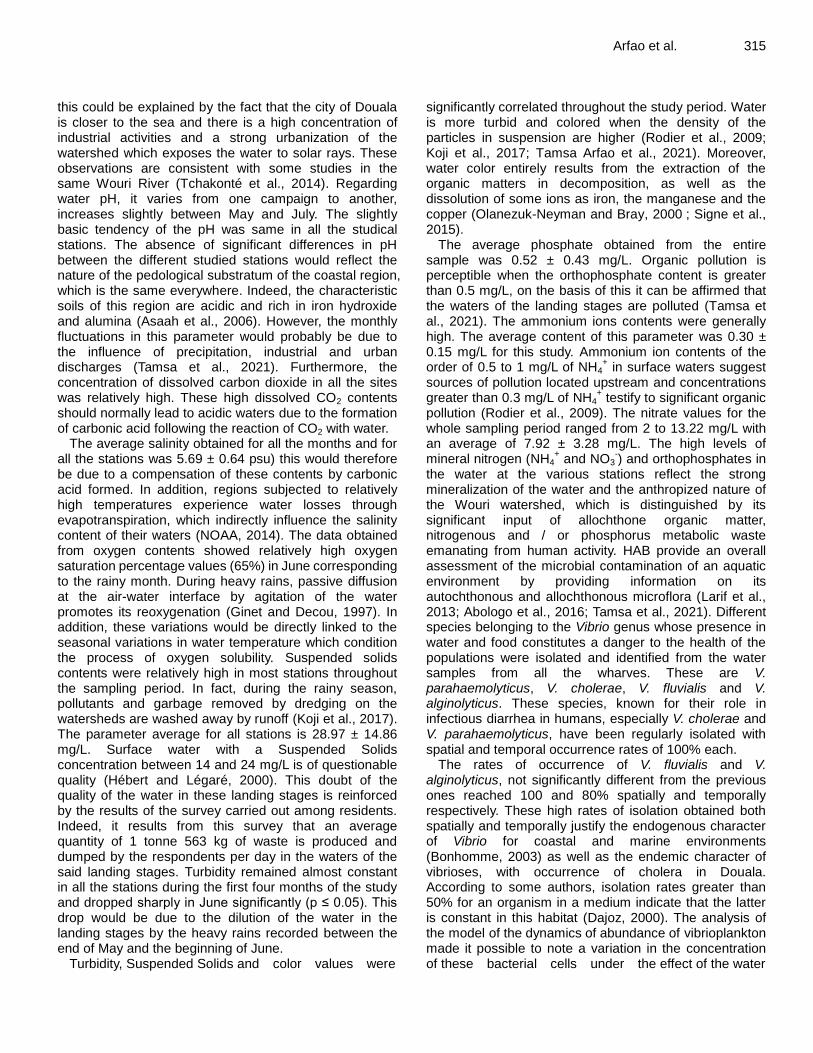
turbidity, color and orthophosphates (Figure 8). Multiple linear regression analysis between bacterial abundance and abiotic factors The analysis of the multiple regressions between the abundances of isolated bacteria and the physicochemical variables in the different stations is presented in Table 4.
The model equations explaining the distribution of
bacteria have made it possible to observe some important relationships based on the coefficient of determination (r
2) which measures the accuracy of the
prediction of the distribution of the bacterial abundances studied. We therefore note a coefficient of determination r2 = 0.50 for the multiple linear regression model for HAB
and a coefficient of determination r2 = 0.58 for the
multiple linear regression model for V. cholerae. Furthermore, for the bacteria V. parahaemolyticus, V. alginolyticus and V. fluvialis, the model explains less than
314 Afr. J. Microbiol. Res.
Figure 8. Corrgram for studied parameters at the landing stage of Sandaga, correlations shown by color and intensity of shading.
Table 4. Results of Multiple linear regression models between the physicochemical variables and abundance bacteria.
Dependent variables n Model equation F r2
Heterotrophic aerobe bacteria
30 - 54850.17 + 1149.39*Temp - 16.42*DCO
2 -288.52*pH - 18.53*Sali +
328.07*DO + 586.98*NO3- + 8130*SS + 2.10*Cond + 20.92*Turb -11.62*Col +
13971.30*NH4+ + 3713.94*PO4
3-
1.39 0.50
V.cholerae 30 - 60747.20 + 1363.89*Temp - 46.58*DCO
2 + 3239.60*pH + 679.89*Sali -
43.62*DO - 307.90*NO3-
+ 22.62*SS + 8.65*Cond - 44.62*Turb -9.64*Col + 2984.76*NH4
+ + 3967.77*PO4
3-
1.95 0.58
V. parahaemolyticus 30 - 1223.44 + 221.40*Temp + 3.89*DCO
2 - 513*pH - 97.90*Sali -17.44*DO +
172.98*NO3- + 10.95*SS - 3.43*Cond + 2.51*Turb - 3.02*Col - 1045.91*NH4
+ +
485.84*PO43-
1.06 0.43
V.alginolyticus 30 712.10 - 15.27*Temp + 2.10*DCO
2 - 116.98*pH - 15.30*Sali + 5.93*DO +
39.56*NO3-
+ 5.84*SS - 0.19*Cond - 0.61*Turb - 0.45*Col - 13.11*NH4+ +
65.51*PO43-
1.15 0.45
V. fluvialis 30 1305.76 - 36.95*Temp + 1.68*DCO
2 – 49.85*pH -3.07*Sali - 1.29*DO +
41.01*NO3-
+ 2.72*SS + 0.02*Cond + 0.99*Turb - 0.58*Col - 185.26*NH4+ -
53.26*PO43-
0.49 0.26
50% of the total variation. The physicochemical parameters explain at 43% (r
2 = 0.43) the distribution of
the abundances of V. parahaemolyticus, at 45% (r2 = 0.45)
the distribution of abundances of V. alginolyticus and at 26% (r
2 = 0.26) for V. fluvialis.
DISCUSSION The results of the physicochemical parameters show
temporal variations. Overall, the water taken from the landing stages had temperatures that vary very little around an average of 29.94 ± 0.98°C. These temperatures are compatible with the activity of isolated microorganisms which are all mesophilic and promote the dissolution of gases and salts in water. Studies have shown that some pathogens grow extremely well at a mesophilic temperature range of 15 to 45°C for most strains (Vezzulli et al., 2016; Brenzinger et al., 2019). The surface water in the city of Douala is significantly warmer,
this could be explained by the fact that the city of Douala is closer to the sea and there is a high concentration of industrial activities and a strong urbanization of the watershed which exposes the water to solar rays. These observations are consistent with some studies in the same Wouri River (Tchakonté et al., 2014). Regarding water pH, it varies from one campaign to another, increases slightly between May and July. The slightly basic tendency of the pH was same in all the studical stations. The absence of significant differences in pH between the different studied stations would reflect the nature of the pedological substratum of the coastal region, which is the same everywhere. Indeed, the characteristic soils of this region are acidic and rich in iron hydroxide and alumina (Asaah et al., 2006). However, the monthly fluctuations in this parameter would probably be due to the influence of precipitation, industrial and urban discharges (Tamsa et al., 2021). Furthermore, the concentration of dissolved carbon dioxide in all the sites was relatively high. These high dissolved CO2 contents should normally lead to acidic waters due to the formation of carbonic acid following the reaction of CO2 with water.
The average salinity obtained for all the months and for all the stations was 5.69 ± 0.64 psu) this would therefore be due to a compensation of these contents by carbonic acid formed. In addition, regions subjected to relatively high temperatures experience water losses through evapotranspiration, which indirectly influence the salinity content of their waters (NOAA, 2014). The data obtained from oxygen contents showed relatively high oxygen saturation percentage values (65%) in June corresponding to the rainy month. During heavy rains, passive diffusion at the air-water interface by agitation of the water promotes its reoxygenation (Ginet and Decou, 1997). In addition, these variations would be directly linked to the seasonal variations in water temperature which condition the process of oxygen solubility. Suspended solids contents were relatively high in most stations throughout the sampling period. In fact, during the rainy season, pollutants and garbage removed by dredging on the watersheds are washed away by runoff (Koji et al., 2017). The parameter average for all stations is 28.97 ± 14.86 mg/L. Surface water with a Suspended Solids concentration between 14 and 24 mg/L is of questionable quality (Hébert and Légaré, 2000). This doubt of the quality of the water in these landing stages is reinforced by the results of the survey carried out among residents. Indeed, it results from this survey that an average quantity of 1 tonne 563 kg of waste is produced and dumped by the respondents per day in the waters of the said landing stages. Turbidity remained almost constant in all the stations during the first four months of the study and dropped sharply in June significantly (p ≤ 0.05). This drop would be due to the dilution of the water in the landing stages by the heavy rains recorded between the end of May and the beginning of June.
Turbidity, Suspended Solids and color values were
Arfao et al. 315 significantly correlated throughout the study period. Water is more turbid and colored when the density of the particles in suspension are higher (Rodier et al., 2009; Koji et al., 2017; Tamsa Arfao et al., 2021). Moreover, water color entirely results from the extraction of the organic matters in decomposition, as well as the dissolution of some ions as iron, the manganese and the copper (Olanezuk-Neyman and Bray, 2000 ; Signe et al., 2015).
The average phosphate obtained from the entire sample was 0.52 ± 0.43 mg/L. Organic pollution is perceptible when the orthophosphate content is greater than 0.5 mg/L, on the basis of this it can be affirmed that the waters of the landing stages are polluted (Tamsa et al., 2021). The ammonium ions contents were generally high. The average content of this parameter was 0.30 ± 0.15 mg/L for this study. Ammonium ion contents of the order of 0.5 to 1 mg/L of NH4
+ in surface waters suggest
sources of pollution located upstream and concentrations greater than 0.3 mg/L of NH4
+ testify to significant organic
pollution (Rodier et al., 2009). The nitrate values for the whole sampling period ranged from 2 to 13.22 mg/L with an average of 7.92 ± 3.28 mg/L. The high levels of mineral nitrogen (NH4
+ and NO3
-) and orthophosphates in
the water at the various stations reflect the strong mineralization of the water and the anthropized nature of the Wouri watershed, which is distinguished by its significant input of allochthone organic matter, nitrogenous and / or phosphorus metabolic waste emanating from human activity. HAB provide an overall assessment of the microbial contamination of an aquatic environment by providing information on its autochthonous and allochthonous microflora (Larif et al., 2013; Abologo et al., 2016; Tamsa et al., 2021). Different species belonging to the Vibrio genus whose presence in water and food constitutes a danger to the health of the populations were isolated and identified from the water samples from all the wharves. These are V. parahaemolyticus, V. cholerae, V. fluvialis and V. alginolyticus. These species, known for their role in infectious diarrhea in humans, especially V. cholerae and V. parahaemolyticus, have been regularly isolated with spatial and temporal occurrence rates of 100% each.
The rates of occurrence of V. fluvialis and V. alginolyticus, not significantly different from the previous ones reached 100 and 80% spatially and temporally respectively. These high rates of isolation obtained both spatially and temporally justify the endogenous character of Vibrio for coastal and marine environments (Bonhomme, 2003) as well as the endemic character of vibrioses, with occurrence of cholera in Douala. According to some authors, isolation rates greater than 50% for an organism in a medium indicate that the latter is constant in this habitat (Dajoz, 2000). The analysis of the model of the dynamics of abundance of vibrioplankton made it possible to note a variation in the concentration of these bacterial cells under the effect of the water
316 Afr. J. Microbiol. Res. temperature, organic matter, pH, dissolved oxygen and salinity. According to similar modeling work, the increase in the concentration of vibrioplankton is explained by temperature and salinity in surface water in Georgia (USA) (Turner et al., 2009). Many authors have reported on the temperature and salinity as determining factors in the regulation of growth and survival of Vibrios in surface water (Wang and Gu, 2005; Johnson et al., 2012). Other authors have contributed to the elaboration of predictive model for V. cholerae on the basis of the variation of temperature and salinity (Louis et al., 2003; Huq et al., 2005). Positive correlation exhibited by temperature indicates its importance on distribution and abundance of Vibrio spp (Osunla et al., 2021). Indeed, bacteria of the Vibrio genus are able to adapt theirselves to low levels of salinity in water with high temperatures in the Wouri estuary. The regression models with HAB and V. cholerae explain more than 50% of the total variation and the physicochemical parameters explain at 43% the distribution of the abundances of V. parahaemolyticus, at 45% the distribution of abundances of V. alginolyticus and at 26% for V. fluvialis. In fact, several authors have widely published on the influence of temperature and salinity on the abundances of Vibrionaceae in coastal and estuarine waters (Johnson et al., 2012; Baker-Austin et al., 2013). Bacterial species of the genus Vibrio are often associated with aquatic environments with particular physical and chemical properties. Thus, those incriminated in epidemics have always been associated with sea water (saline). Somes authors shown that the distribution of Vibrio species positively and significantly correlated with turbidity, temperature, dissolved oxygen, pH, total dissolved solid, total suspended solid, electrical conductivity and salinity (Osunla et al., 2021). The strong positive association of water temperature on the occurrence of V. cholerae, for example in the Akwa landing stage, confirms this relationship. In addition, the highest concentration of vibrioplankton in urban waters can be explained by the ability of these bacteria to adapt to organic pollution. According to some authors, vibrios are able to reduce forms of nitrogen in water to take advantage of urban pollution (Grimes et al., 2009). Conclusion
At the end of this study, it emerges that the waters of the wharves are home to a large community of heterotrophic aerobic mesophilic bacteria including 4 species of the Vibrio genera, namely V. cholerae, V. parahaemolyticus, V. alginolyticus, and V. fluvialis. V. cholerae was the most frequently isolated and also the most abundant. The isolation of these bacteria in the water points studied can be source of real public health problems for the using populations, and are incriminated in many diarrheal diseases, food poisoning and gastroenteritis would justify the outbreaks of vibriosis recorded in Douala for several years. The Multiple linear regression models and the
visualization of corrgram revealed that the diversity and abundance dynamics of these germs is strongly influenced by nitrates, salinity, dissolved carborn dioxyde and ammonium ions.
CONFLICT OF INTERESTS
The authors have not declared any conflict of interests. REFERENCES Abba SI, Hadi SJ, Abdullahi J (2017). River water modelling prediction
using multi linear regression, artificial neural network, and adaptive neuro-fuzzy inference system. Procedia Computer Science 120:75-82.
Abologo AL, Essomba NC, Banock L, Bilong BC (2016). Qualité microbiologique des eaux des fleuves Nyong et Wouri (Cameroun) et impact potentiel sur la santé des populations riveraines. International Journal of Biological Chemical Sciences 10(3):1235-1249.
Alizadeh MJ, Kavianpour MR, Danesh M, Adolf J, Shamshirband S, Chau KW (2018). Effect of river flow on the quality of estuarine and coastal waters using machine learning models. Engineering Applications of Computational Fluid Mechanics 12(1):810-823.
American Public Health Association (APHA) (2009). Standard Methods for the Examination of Water and Wastewater. America Public Health Association, APHA-AWWAWPCF (Eds.), Pennsylvania, Washington.
Asaah VA, Abimbola AF, Suh CE (2006). Heavy Metal Concentration and Distribution in Surface Soils of the Bassa Industrial Zone 1 Douala Cameroon. Arabian Journal for Science and Engineering 31(2):147-158.
Baker-Austin C, Trinanes JA, Taylor NGH, Hartnell R, Siitonen A, Martinez UJ (2013). Emerging Vibrio risk at high latitudes in response to ocean warming. Nature Climate Change 3(1):73-77.
Beatley T, Browner DJ, Schwab AK (1994). An Introduction to Coastal Zone Management Island Press, Washington D.C. P 98.
Ben MA, Chahlaoui A, Rour E, Chahboune M (2014). Diversité taxonomique et structure de la macrofaune benthique des eaux superficielles de l’oued khoumane. Journal of Materials and Environmental Science 5(1):183-198.
Bonhomme AJ (2003). Les bactéries du genre Vibrio et la santé publique vétérinaire. Doctorat vétérinaire. Ecole Nationale Vétérinaire d’Alfort. P 109.
Brenzinger S, Van der Aart LT, Van Wezel GP, Lacroix JM, Glatter T, Briegel A (2019). Structural and proteomic changes in viable but non-culturable Vibrio cholerae. Frontier in Microbiology 10:793.
Castaneda CM, Sedas VP, Borunda EO, Reynoso FL (2005). Influence of water temperature and salinity on seasonal occurrences of Vibrio cholerae and enteric bacteria in oyster-producing areas of Veracruz. Marine Pollution Bulletin 50(12):1641-1648.
Chen W, Liu W (2015). Water Quality Modeling in Reservoirs Using Multivariate Linear Regression and Two Neural Network Models. Advances in Artificial Neural Systems ID 521721. P 12.
Conley DJ (2000). Biogeochemical nutrient cycles and nutriment strategies. Hydrobiologia 410:87-96.
Dajoz R (2000). Précis d’Ecologie. 7ème édition, Dunod, Paris, France P 615.
Ginet R, Decou V (1997). Initiation à la biologie et à l'écologie souterraines. Ed. Delarge Paris P 345.
Giresse P, Megope-foonde J, Ngueutchoua G, Aloisi J, Kuete M (1996). Carte sédimentologique du plateau continental du Cameroun. Rapport de l’Institut Français de recherche scientifique pour le développement en coopération. ORSTOM (ed).
Gonzáles HE, Giesecke R, Vargas CA, Pavez M, Iriarte JL, Santibáñez P, Castro L, Escribano R, Pagès F (2004). Carbon cycling through the pelagic foodweb in the northern Humboldt Current off Chile (23°S). ICES Journal of Marine Science 61(4):572-584.
Grimes DJ, Johnson CN, Dillon KS, Flowers AR, Noriea NF, Berutti T (2009). What Genomic Sequence Information Has Revealed About
Vibrio Ecology in the Ocean-A Review. Microbial Ecologie 58(3):447-460.
Hamuna B, Tanjung RHP, Suwito, Maury HK (2018). Study of sea water quality and pollution in¬dex based on physical-chemical parameters in De¬papre District waters, Jayapura. Jurnal Ilmu Ling¬kungan 16(1):35-43. (in Indonesian).
Hébert S, Légaré S (2000). Suivi de la qualité des rivières et petits cours d’eau. Direction du suivi de l’état de l’environnement, ministère de l’Environnement, Québec, envirodoq No ENV-2001-0141, rapport N° QE-123, P 24.
Holt JG, Krieg NR, Sneath PH, Staley JT, Williams ST (2000). Bergey’s manual of determinative bacteriology. Williams and Wilkins, ed Philadelphia.
Huq A, Sack RB, Nizam A, Longini IM, Nair GB, Ali A, Morris Jr JG, Khan MNH, Siddique AK, Yunus M, Albert MJ, Sack DA, Colwell RR (2005). Critical factors influencing the occurrence of Vibrio cholerae in the environment of Bangladesh. Applied and Environmental Microbiology 71(8):4645-4654.
Johnson CN, Bowers JC, Griffitt KJ, Molina V, Clostio RW, Shaofeng P, Laws E, Paranjpye RN, Strom MS, Chen A, Hasan NA, Huq A, Noriea III NF, Grimes DJ, Colwell RR (2012). Ecology of Vibrio parahaemolyticus and Vibrio vulnificus in the coastal and estuarine waters of Louisiana, Maryland, Mississippi, and Washington (United States). Applied Environmental Microbiology 78(20):7249-7257.
Koji E, Noah EO, Onana FM, Tchakonté S, Lontsi DC, Tamsa AA, Bricheux G, Sime-Ngando T, Nola M (2017). Influence of Anthropogenic Pollution on the Abundance Dynamics of Some Freshwater Invertebrates in the Coastal Area of Cameroon. Journal of Environmental Protection 8(7):810-829.
Larif M, Soulaymani A, Hnach M, El Midaoui A (2013). Contamination spatio-temporelle d’origine hydrique de l’oued Boufekrane dans la région de Meknès-Tafilalt (Maroc). International Journal of Biological and Chemical Sciences 7(1):172-184.
Louis VR, Russek-Cohen E, Choopun N, Rivera ING, Gangle B, Jiang SC, Rubin A, Patz JA, Huq A, Colwell RR (2003). Predictability of Vibrio cholerae in Chesapeake Bay. Environmental Microbiology 69(5):2773-2785.
Niang I, Naï G, Folorunsho R, Diop M, Sow M, Trawally D, Faye S, Bihibindi A, Diop N, Karibuhoye C (2012). Guide sur les options d'adaptation en zones côtières à l'intention des décideurs. UNESCO/COI. P 54.
NOAA (2014). Oil Spills in Mangroves: Planning and Response Considerations (Maryland: Office of Response and Restoration) P 96.
Nola M, Njiné T, Djuikom E, Sikati FV (2002). Faecal coliforms and faecal streptococci community in the underground water in an equatorial area in Cameroon (Central Africa): the importance of some environmental chemical factors. Water Research 36(13):3289-3297.
Olanezuk-Neyman K, Bray R (2000). The Role of Physico-Chemical and Biological Processes in Manganese and Ammonia Nitrogen Removal from Groundwater. Polish Journal of Environmental Studies 9(2):91-96.
Osunla CA, Okoh AI (2017). Vibrio pathogens: A public health concern in rural water resources in Sub-Saharan Africa. International Journal of Environmental Research and Public Health 14(10):1188.
Osunla AC, Abioye OE, Okoh AI (2021). Distribution and Public Health Significance of Vibrio Pathogens Recovered from Selected Treated Effluents in the Eastern Cape Province, South Africa. Water 13:932.
Arfao et al. 317 Parmar KS, Bhardwaj R (2015). River Water Prediction Modeling Using
Neural Networks, Fuzzy and Wavelet Coupled Model. Water Resources Management 29(1):17-33.
Pravakar M, Panda US, Pradhan U, Kumar CS, Naik S, Begum M, Ishwarya J (2015). Coastal water quality monitoring and modelling off Chennai city. Procedia Engineering 116:955-962.
Rodier J, Legube B, Marlet N, Brunet R (2009). L’analyse de l’eau. 9e édition, DUNOD, Paris. P 1579.
Signe JM, Lontsi CD, Njoya AM, Eheth JS, Tchakonté S, Tamsa AA, Ateba HB, Bricheux G, Nola M, Sime-Ngando T (2015). Assessment of the potential effect of somme streams properties on the isolated Aeromonas hydrophila strains susceptibility against some β-Lactams and Sulfamids. Research in Biotechnology 6(5):33-44.
Suchel JB (1972). Le climat du Cameroun. Thèse de Doctorat 3eme cycle, Université de Bordeaux III. P 186.
Tamsa AA, Onana FM, Koji E, Moungang LM, Noah EOV, Tchuimaleu EJB, Tchakonté S, Njoya AM, Sime-Ngando T, Nola M (2021). Using Principal Component Analysis to Assess Water Quality from the Landing Stages in Coastal Region. American Journal of Water Resources 9(1):23-31. doi: 10.12691/ajwr-9-1-4.
Tanjung RHP, Hamuna B, Alianto (2019). Assessment of Water Quality and Pollution Index in Coastal Waters of Mimika, Indonesia. Journal of Ecological Engineering 20(2):87-94.
Tchakonté S, Ajeagah GA, Diomandé D, Camara AI, Konan KM, Ngassam P (2014). Impact of anthropogenic activities on water quality and Freshwater Shrimps diversity and distribution in five rivers in Douala, Cameroon. Journal of Biodiversity and Environmental Sciences 4(2):183-194.
Tchakonté S (2016). Diversite et structure des peuplements de macroinvertebres benthiques des cours d’eau urbains et periurbains de Douala (Cameroun). These de Doctorat/PhD, Universite de Yaounde P 306.
Turner JW, Brooks G, Dana C, Erin KL (2009). Plankton composition and environmental factors contribute to Vibrio seasonality. Multidisciplinary Journal of Microbial Ecology 3(9):1082-1092.
Vezzulli L, Grande C, Reid PC, Hélaouët P, Edwards M, Höfle MG, Brettar I, Colwell RR, Pruzzo C (2016). Climate influence on Vibrio and associated human diseases during the past half-century in the coastal North Atlantic. Proceeding of the National Academic of Sciences 113(34):5062-5071.
Wang YL, Gu J-D (2005). Influence of temperature, salinity and pH on the growth of environmental Aeromonas and Vibrio species isolated from Mai Po and the Inner Deep Bay Nature Reserve Ramsar Site of Hong Kong. Journal of Basic Microbiology 45(1):83-93.
Zhong L, Chen J, Zhang XH, Jiang YA (2009). Entry of Vibrio cincinnatiensis into viable but non culturable state and its resuscitation. Letters in Applied Microbiology 48(2):247-252.
Copyright © 2022 FDOKUMEN