Spatial Patterns in European Rabbit Abundance After a Population Collapse
14
Research Article Spatial patterns in European rabbit abundance after a population collapse Ne´stor Ferna´ ndez 1,2, * 1 Department of Applied Biology, Don ˜ana Biological Station, Spanish Council for Scientific Research – CSIC, Avda. Marı´a Luisa s/n Pabellon de Peru ´, 41013 Seville, Spain; 2 Current address: Department of Ecologi- cal Modelling, UFZ – Centre for Environmental Research Leipzig-Halle, Permoserstrasse 15, D-04301 Leipzig, Germany; *Author for correspondence (e-mail: [email protected]) Received 18 September 2003; accepted in revised form 29 September 2004 Key words: Conservation, Epidemics, Habitat heterogeneityMediterranean ecosystems, Oryctolagus cuni- culus, Population density, Predictive abundance models, Spatial scale Abstract Assessing the associations between spatial patterns in population abundance and environmental hetero- geneity is critical for understanding various population processes and for managing species and commu- nities. This study evaluates responses in the abundance of the European rabbit (Oryctolagus cuniculus), an important prey for predators of conservation concern in Mediterranean ecosystems, to environmental heterogeneity at different spatial scales. Multi-scale habitat models of rabbit abundance in three areas of Don˜ana, south-western Spain, were developed using a spatially extensive dataset of faecal pellet counts as an abundance index. The best models included habitat variables at the three spatial scales examined: distance from lagoons (broad scale), mean landscape shrub coverage and interspersion of pastures (home- range scale), and shrub and pasture cover (microhabitat scale). These variables may well have been related to the availability of food and refuge for the species at the different scales. However, the models’ fit to data and their predictive accuracy for an independent sample varied among the study regions. Accurate pre- dictions in some areas showed that the combination of variables at various spatial scales can provide a reliable method for assessing the abundance of ecologically complex species such as the European rabbit over large areas. On the other hand, the models failed to identify abundance patterns in a population that suffered the strongest demographic collapse after viral epidemics, underlining the difficulty of generalizing this approach. In the latter case, factors difficult to implement in static models such as disease history and prevalence, predator regulation and others may underlie the lack of association. Habitat models can provide useful guidelines for the management of landscape attributes relevant to rabbits and help improve the conservation of Mediterranean communities. However, other influential factors not obviously related to environmental heterogeneity should also be analyzed in more detail. Introduction The distributions of abundance in animal popu- lations are spatially heterogeneous (Brown et al. 1995, Ives and Klopfer 1997, Keitt et al. 2002). This heterogeneity can greatly influence popula- tion dynamics through parameters such as breeding performance, survival rates and dispersal (Aars and Ims 2000; Paradis et al. 2002). More- over, patterns in the abundance of one or a small number of species may have crucial effects on the structure and functioning of many communities through density–dependent interactions with other species and large-scale alterations of the structure Landscape Ecology (2005) 20:897–910 ȑ Springer 2005 DOI 10.1007/s10980-004-3976-7
-
Upload
independent -
Category
Documents
-
view
1 -
download
0
Transcript of Spatial Patterns in European Rabbit Abundance After a Population Collapse
Research Article
Spatial patterns in European rabbit abundance after a population collapse
Nestor Fernandez1,2,*1Department of Applied Biology, Donana Biological Station, Spanish Council for Scientific Research – CSIC,Avda. Marıa Luisa s/n Pabellon de Peru, 41013 Seville, Spain; 2Current address: Department of Ecologi-cal Modelling, UFZ – Centre for Environmental Research Leipzig-Halle, Permoserstrasse 15, D-04301Leipzig, Germany; *Author for correspondence (e-mail: [email protected])
Received 18 September 2003; accepted in revised form 29 September 2004
Key words: Conservation, Epidemics, Habitat heterogeneityMediterranean ecosystems, Oryctolagus cuni-culus, Population density, Predictive abundance models, Spatial scale
Abstract
Assessing the associations between spatial patterns in population abundance and environmental hetero-geneity is critical for understanding various population processes and for managing species and commu-nities. This study evaluates responses in the abundance of the European rabbit (Oryctolagus cuniculus), animportant prey for predators of conservation concern in Mediterranean ecosystems, to environmentalheterogeneity at different spatial scales. Multi-scale habitat models of rabbit abundance in three areas ofDonana, south-western Spain, were developed using a spatially extensive dataset of faecal pellet counts asan abundance index. The best models included habitat variables at the three spatial scales examined:distance from lagoons (broad scale), mean landscape shrub coverage and interspersion of pastures (home-range scale), and shrub and pasture cover (microhabitat scale). These variables may well have been relatedto the availability of food and refuge for the species at the different scales. However, the models’ fit to dataand their predictive accuracy for an independent sample varied among the study regions. Accurate pre-dictions in some areas showed that the combination of variables at various spatial scales can provide areliable method for assessing the abundance of ecologically complex species such as the European rabbitover large areas. On the other hand, the models failed to identify abundance patterns in a population thatsuffered the strongest demographic collapse after viral epidemics, underlining the difficulty of generalizingthis approach. In the latter case, factors difficult to implement in static models such as disease history andprevalence, predator regulation and others may underlie the lack of association. Habitat models canprovide useful guidelines for the management of landscape attributes relevant to rabbits and help improvethe conservation of Mediterranean communities. However, other influential factors not obviously related toenvironmental heterogeneity should also be analyzed in more detail.
Introduction
The distributions of abundance in animal popu-lations are spatially heterogeneous (Brown et al.1995, Ives and Klopfer 1997, Keitt et al. 2002).This heterogeneity can greatly influence popula-tion dynamics through parameters such as
breeding performance, survival rates and dispersal(Aars and Ims 2000; Paradis et al. 2002). More-over, patterns in the abundance of one or a smallnumber of species may have crucial effects on thestructure and functioning of many communitiesthrough density–dependent interactions with otherspecies and large-scale alterations of the structure
Landscape Ecology (2005) 20:897–910 � Springer 2005
DOI 10.1007/s10980-004-3976-7
of vegetation (e.g. Paine 1992; Palomares et al.1995; Weltzin et al. 1997; Kotliar 2000). Therefore,identifying factors influencing spatial heterogene-ity in abundance is critical for an ecologicalunderstanding of populations and has importantimplications for species management and conser-vation (e.g. Coops and Catling 2002; Fisher et al.2002; Lichstein et al. 2002).
Recent research suggests that patterns in popu-lation abundance are a product of the distributionof resources necessary to satisfy the species’ nicherequirements (Brown et al. 1995). This implies thatanimal abundance could be predicted by analyzinghabitat and landscape variables related to envi-ronmental conditions and resources relevant to thespecies (e.g. Micol et al. 1994; Flather and Sauer1996). However, pattern prediction is a complextopic – for several reasons. Firstly, it is a multi-factorial problem involving the ways in whichresource availability, predation, competition, dis-eases and other factors affect various populationparameters. Secondly, the intervening factors mayoperate at various spatial scales (e.g. Wiens et al.1987; Kotliar and Wiens 1990; Bissonette et al.1997; Saab 1999; Schweiger et al. 1999). Forexample, relevant scales for many animals mayinclude the microhabitat where individuals obtainresources (e.g. food and refuge), the landscapemosaic used by individuals or groups within moreor less stable home ranges, and the landscapecontext surrounding home ranges that may influ-ence population-level processes.
Empirical habitat modeling can provide aneffective means of evaluating and predicting re-sponses in population abundance to environmentalheterogeneity at multiple spatial scales (e.g. Boyceand McDonald 1999; Guisan and Zimmermann2000). This approach may greatly benefit the studyof populations over large areas, where more tra-ditional methods such as experimental control andtesting individual effects are often unfeasible.Moreover, model extrapolation can help addresspractical issues such as identifying ‘hotspots’ ofhigh population abundance, selecting the mostpromising areas for planning reserves, and assess-ing habitat management strategies for species res-toration. However, the reliability of habitat modelsmay be challenged when other factors, such asdemographics or history, have an additionalimpact on population abundance (e.g. Rushtonet al. 1994; Bustamante 1997; Pearce and Ferrier
2001). Therefore, multi-scale habitat modelingrequires further investigation to assess associationsbetween environmental variables and populationabundance, and to evaluate how these associationsmay vary among populations of the same speciesthat may be affected by different constraints.
The European rabbit (Oryctolagus cuniculus) is aprey species of key importance in Mediterraneanecosystems. It constitutes the diet of more than 30predators in southern Europe, and also exerts astrong influence on the habitats of other speciesthrough vegetation consumption, seed dispersaland burrowing (Delibes and Hiraldo 1981; Sori-guer 1986; Gomez-Sal et al. 1999). During the lastfive decades, the species has suffered widespreadpopulation collapses throughout the Mediterra-nean as a result of two different epidemics: myxo-matosis and Rabbit Hemorrhagic Disease, RHD(Thompson and King 1994; Villafuerte et al. 1995).This resulted in the extinction of many populationsof Mediterranean predators, such as the criticallyendangered Iberian lynx (Lynx pardinus) and theSpanish Imperial Eagle (Aquila adalberti) (Rodrı-guez and Delibes 1992; Ferrer 1993). Conse-quently, strong conservation concerns have arisenregarding the identification of current broad-scalepatterns in European rabbit abundance and howthey are related to the distribution of resources.
In this study, the abundance of the Europeanrabbit is analyzed in relation to habitat variables atthe scales of microhabitat, home-range landscapecomposition, and landscape context. The main aimwas to establish whether, after a long history ofdramatic population declines, current abundancefollows any predictable pattern related to the spatialdistribution of resources.Habitatmodels developedin different regions ought to predict abundance wellif the current regulation of rabbit populations weregoverned by patterns in environmental heteroge-neity. Moreover, these models could be used toassess the relative importance of environmentalvariables measured at different scales for predictingabundance, and hence provide managementguidelines at scales favoring rabbit populations.
Methods
Study area
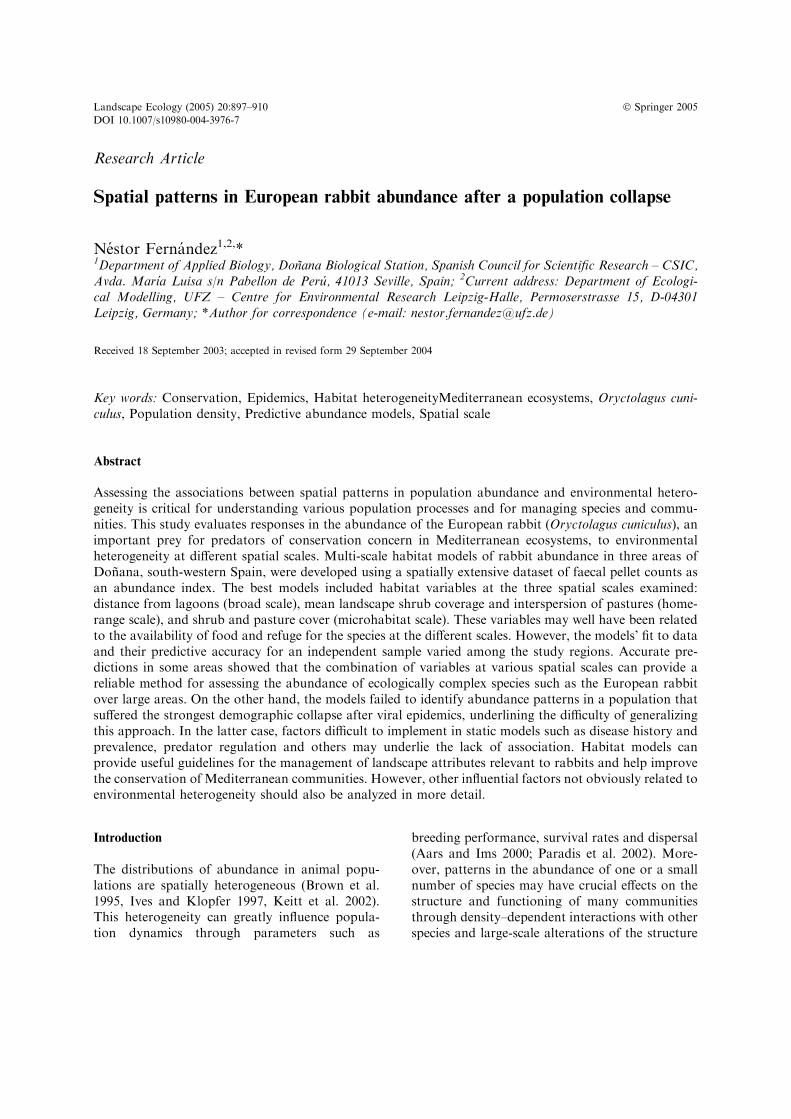
The study was performed in the Donana Nationaland Natural Parks (Figure 1) in south-western
898
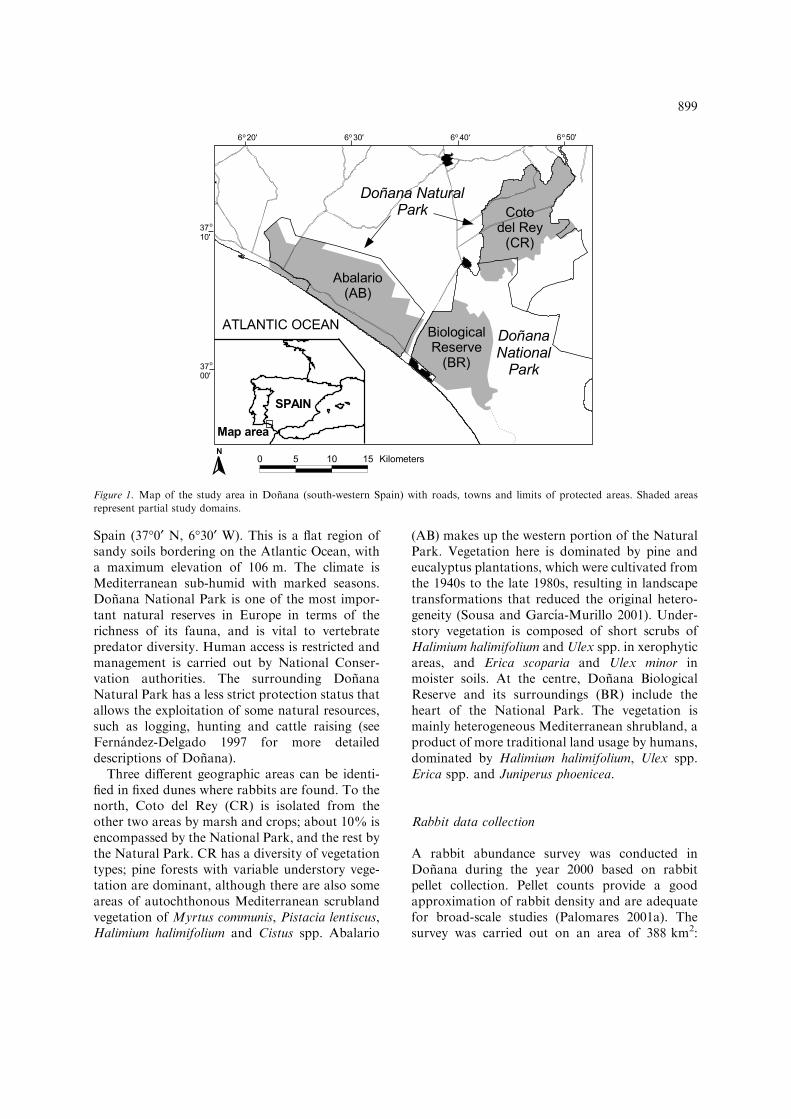
Spain (37�0¢ N, 6�30¢ W). This is a flat region ofsandy soils bordering on the Atlantic Ocean, witha maximum elevation of 106 m. The climate isMediterranean sub-humid with marked seasons.Donana National Park is one of the most impor-tant natural reserves in Europe in terms of therichness of its fauna, and is vital to vertebratepredator diversity. Human access is restricted andmanagement is carried out by National Conser-vation authorities. The surrounding DonanaNatural Park has a less strict protection status thatallows the exploitation of some natural resources,such as logging, hunting and cattle raising (seeFernandez-Delgado 1997 for more detaileddescriptions of Donana).
Three different geographic areas can be identi-fied in fixed dunes where rabbits are found. To thenorth, Coto del Rey (CR) is isolated from theother two areas by marsh and crops; about 10% isencompassed by the National Park, and the rest bythe Natural Park. CR has a diversity of vegetationtypes; pine forests with variable understory vege-tation are dominant, although there are also someareas of autochthonous Mediterranean scrublandvegetation of Myrtus communis, Pistacia lentiscus,Halimium halimifolium and Cistus spp. Abalario
(AB) makes up the western portion of the NaturalPark. Vegetation here is dominated by pine andeucalyptus plantations, which were cultivated fromthe 1940s to the late 1980s, resulting in landscapetransformations that reduced the original hetero-geneity (Sousa and Garcıa-Murillo 2001). Under-story vegetation is composed of short scrubs ofHalimium halimifolium and Ulex spp. in xerophyticareas, and Erica scoparia and Ulex minor inmoister soils. At the centre, Donana BiologicalReserve and its surroundings (BR) include theheart of the National Park. The vegetation ismainly heterogeneous Mediterranean shrubland, aproduct of more traditional land usage by humans,dominated by Halimium halimifolium, Ulex spp.Erica spp. and Juniperus phoenicea.
Rabbit data collection
A rabbit abundance survey was conducted inDonana during the year 2000 based on rabbitpellet collection. Pellet counts provide a goodapproximation of rabbit density and are adequatefor broad-scale studies (Palomares 2001a). Thesurvey was carried out on an area of 388 km2:
Figure 1. Map of the study area in Donana (south-western Spain) with roads, towns and limits of protected areas. Shaded areas
represent partial study domains.
899

116 km2 in CR, 163 km2 in AB and 109 km2 inBR. Sampling was concentrated between mid-Julyand mid-September, after the annual peak ofmaximum abundance following reproduction, andwhen the persistence of fecal pellets in the field ishigher and abundance estimates from pellets aremore reliable (Villafuerte et al. 1997; Palomares2001a). The sample consisted of 750 plots (250 perarea) identified using randomly generated UTMcoordinates with a minimum spacing of 200 m andat least 100 m from the study area borders. Plotswere located using a Global Positioning System(Garmin GPS III Pilot, Garmin Corp., Olathe,Kansas, USA). In each plot, pellets were countedin two 0.5 m2 circles 5 m apart. Rabbit abundancewas indexed as the sum of these two counts.
Description of scales and variables
A multiple-scale modeling approach was adoptedto analyze relationships between patterns in rabbitabundance and the composition and configuration
of resources. This involved both study domains ofdifferent sizes and environmental variables mea-sured at different scales. Rabbit abundance wasmodeled in four study domains: the whole studyarea of Donana (referred to below as the globalstudy domain model), and three sub-regionswithin this area (partial study domain models ofCR, AB and RB, respectively). With respect tohabitat metrics, variables were selected at threedifferent spatial scales (Table 1): (1) the landscapecontext above the home-range scale, which in-cluded proximity and geographic location metricspotentially related to abundance regulation at thepopulation level; (2) the structure of landscapemosaics at the home-range scale, related to re-source availability for rabbit groups within homeranges; and (3) microhabitat attributes at a lowerscale, related more closely to resource usage withinhome ranges (e.g. Johnson 1980).
At the landscape context scale, five variableswere measured using a geographic informationsystem (GIS). These were selected taking into ac-count factors that may regulate rabbit populations
Table 1. Environmental variables at the three spatial scales used for modeling European rabbit abundance in Donana, Spain.
Code Type Definition DO (n = 750) AB CR BR
Landscape context
LÆLc Discrete Land cover type – – – –
LÆDMar Continuous Distance to the marsh (m) 8397 ± 264 16,933 ± 140 4581 ± 217 3678 ± 167
LÆDLag Continuous Distance to nearest pond >1 ha (m) 807 ± 25 860 ± 52 566 ± 25.5 994 ± 44
LÆDUrb Continuous Distance to urban areas with >100
inhabitants (m)
6234 ± 95 7196 ± 192 5723 ± 140 5728 ± 143
LÆPro Discrete Protection status – – – –
Home-range landscape composition
HrÆBush Continuous Mean landscape bushy vegetation cover
(index ranging 0–4)
0.4 ± 0.02 0.1 ± 0.02 0.4 ± 0.04 0.6 ± 0.05
HrÆShr Continuous Mean landscape shrub cover (0–4) 2.3 ± 0.03 2.2 ± 0.05 2.0 ± 0.07 2.8 ± 0.06
HrÆPas Continuous Mean landscape pasture cover (0–4) 0.5 ± 0.03 0.2 ± 0.02 0.8 ± 0.06 0.4 ± 0.05
HrÆ%Inu Continuous Landscape proportion of flooding patches 2.6 ± 0.4 2.2 ± 0.5 2.1 ± 0.5 3.7 ± 0.9
HrÆEdge Continuous Density of shrub-pasture ecotones (m/ha) 5.8 ± 0.7 2.6 ± 0.0 7.4 ± 1.5 7.5 ± 1.4
HrÆDomVeg Discrete Predominant vegetation class – – – –
HrÆNVeg Continuous Number of different vegetation
classes (max. n = 9).
2.0 ± 0.03 1.9 ± 0.06 1.8 ± 0.05 2.2 ± 0.06
HrÆAwd Continuous Landscape average weighted
fractal dimension
1.0 ± 0.01 1.0 ± 0.01 1.0 ± 0.01 1.0 ± 0.01
Microhabitat
MÆShr Continuous Mean shrub cover (%) 44.4 ± 1.0 43.6 ± 1.4 33.2 ± 1.9 56.6 ± 1.6
MÆBush Continuous Mean bushy vegetation cover 9.2 ± 0.7 1.74 ± 0.6 13.3 ± 1.3 12.5 ± 1.5
MÆPas Continuous Mean pasture cover 15.2 ± 0.9 7.24 ± 0.9 25.6 ± 1.9 12.8 ± 1.3
MÆHshr Continuous Mean shrub height (m) 0.8 ± 0.04 0.9 ± 0.02 0.7 ± 0.1 0.9 ± 0.03
MÆDomShr Discrete Predominant shrub species – – – –
MÆDomPas Discrete Type of predominant pasture – – – –
Mean values of continuous variables and their standard errors are shown for each study domain: the global domain of Donana (DO)
and partial domains of Abalario (AB), Coto del Rey (CR) and Biological Reserve (BR).
900

over broad areas, such as land use history, currenthuman impact or exposure to different predators(Rogers and Myers 1979; Palomares et al. 1995;Fernandez-Delgado 1997; Travaini et al. 1997). (1)Land cover divided into the three broad vegetationunits that differ in land-use history: Shrubland,Pastureland and Pine forests. Plots were assignedto each of these units using 1:50,000 land covermaps (Moreira and Fernandez-Palacios 1995). (2)Distance from the border of the marsh was alsomeasured from this digital map. (3) Distance fromlagoons of more than 1 ha (either seasonal orpermanent) was calculated from 1:40,000 and1:15,000 digital cartography (Montes et al. 1998;C. Montes et al., unpublished map; author,unpublished map). (4) Distance from urban areas,including towns and villages with a population ofmore than 100 (Instituto de Cartografıa de And-alucıa 1999). (5) Protection status was either Na-tional Park (more protected) or Natural Park (lessprotected).
At the home-range scale, landscape compositionvariables were measured within a circular area witha 100 m radius around rabbit sampling plots. Thisarea is equivalent to the largest mean home-rangesize observed for a rabbit population in Donana(=3.0 ha; Villafuerte et al. 1994). Variables wereselected depending on their potential associationwith essential rabbit resources at this scale, such asprotective vegetation against predators, feedingpastures or exposure to warren flooding (Morenoand Villafuerte1995; Lombardi et al. 2003; Palo-mares 2003). Eight variables were measured: (1)Mean cover of bushy vegetation, referring solely tothe more sheltering tall shrubs and thickets(>1.5 m, mainly Myrtus communis, Pistacia len-tiscus, Erica spp. and Juniperus phoenicea), whereas(2) mean shrub coverage referred to short shrubs(<1.5 m; Halimium halimifolium, Ulex spp.,Stauracanthus genistoides, Erica spp., etc). Bothvariables were calculated using the formulaHrÆveg =
P(Apatch * dveg)/Ahr, where HrÆveg =
mean cover of vegetation type veg; Apatch = patcharea; dveg = index of patch cover density for veg,measured to the nearest 25%; and Ahr = 3 ha. (3)Mean pasture coverage was calculated similarly forgrasses. (4) The proportion of landscape occupiedby flooding patches included permanent andseasonal ponds and other occasionally floodedpatches with hydrophilic vegetation. (5) The den-sity of ecotones between shrubs and pastures was
calculated for edges between patches with shrub orpasture cover>50%. (6) Dominant vegetation wasintroduced as a categorical variable providinginformation about the most abundant vegetationclass in the circle and subdivided into ten classes:matureMediterranean shrubland, xerophytic scrubformations, heaths and peat bogs, grassland, juni-per formations of Juniperus phoenicea, eucalyptusplantations, pine forests, recent pine plantations,hydrophilic vegetation and seasonal pools, andbare soils. These patch classes were also used tocalculate: (7) the number of vegetation types as avegetation richness measure; and (8) a weightedfractal dimension index as a landscape patterncomplexity measure. All these variables were esti-mated using a GIS and a digital vector map ofthe structure of vegetation, which was assembledfrom the interpretation of 1:15,000 color + infra-red aerial photographs (see Fernandez et al. 2003for more details). This was a fine-grained map with4874 vegetation polygons covering the study area,which had a minimum size of 0.05 ha and a modeof 2.5 ha.
At the microhabitat scale, six vegetation vari-ables were measured in situ during the rabbit sur-vey within a circular area of 25 m radii aroundsampling plots. These included the percentage ofthe area covered by (1) shrub vegetation, (2) bushyvegetation and (3) pastures, respectively; (4) meanshrub height; (5) dominant shrub species and (6)dominant pastures family (Asteraceae or Poaceae).Percentages were estimated visually to the nearest10% by comparison with template drawings ofknown coverage, and heights to the nearest 0.1 m.
Most GIS routines and calculations were per-formed in ArcInfo 8.0 (ESRI, Inc., Redlands, CA,USA), except for proximity and fractal dimensionmetrics, which were calculated using two scripts inArcView 3.1 (ESRI, Inc., Redlands, CA, USA):Nearest Features 3.5 (Jenness Enterprises, Flag-staff, AZ, USA) and Patch Analyst 2.2 (by R.Rempel, Lakehead University, Ontario, Canada).
Habitat modeling
The modeling approach was based on the specifi-cation a priori of an exploratory set of competingmodels, and their subsequent comparison to selecta best approximating model explaining the abun-dance patterns observed. This best model
901
represented a compromise between data fittingand a low number of parameters in the model(Burnham and Anderson 1998).
The set of a priori exploratory models was spec-ified under criteria of biological plausibility basedon previous information on rabbit ecology. Thesemodels included habitat variables at three scales,combinations of two adjacent scales, and individualscales. Correlation among predictors was checkedbeforehand using Spearman’s rank coefficient (q),and only non-correlated variables or those withweak correlation (q < 0.4) were included in thesame models. The a priorimodels were identical forall study domains except for the inclusion of Pro-tection in the global study domain and CR. A totalof 140 a priori models were set for the globaldomain and CR, and 100 for AB and RB.
Next, the a priori models were fitted in theframework of generalized linear models (GLMs;McCullagh and Nelder 1989), using in each studydomain a 2/3 random subset of the original sample(i.e. n = 500 for the global and n = 167 for eachpartial domain). The remaining 1/3 of the samplewas reserved for model evaluation purposes (seebelow). GLMs were fitted using a negative bino-mial variance function, which is appropriate forskewed count data distributions, and a logarithmiclink (White and Bennetts 1996). Some predictorswere non-linearly related to rabbit abundance andthese were modeled using parametric naturalspline terms with 3 degrees of freedom (Chambersand Hastie 1993). GLMs were fitted using glm.nbfunction in MASS library for S-Plus V. 2000Professional (Venables and Ripley 1997; Math-Soft, Inc., Seattle, Washington, USA).
A bias-corrected Akaike’s Information Crite-rion (AICc) was calculated for each fitted model,and the model with the lowest AICc was selected asthe most parsimonious (Akaike 1973; Hurvich andTsay 1991). A weighted AICc score index (wi) wasalso calculated to estimate the uncertainty ofactually selecting the best approximating modelfrom the set under consideration (Burnham andAnderson 1998). Although only the best modelwas selected for latter predictions, a ‘confidenceset’ of models with wi > 0.05 (i.e. with a >5%chance of being selected as the best approximatingmodel) was explored as alternative pattern-hypotheses that could not be rejected. Modelselection statistics were also compared with a nullmodel including only the intercept.
Finally, model fit to rabbit abundance data wasestimated using the Spearman’s rank correlationcoefficient (qm) between the log-transformednumbers of pellets observed and model-predictedscores (e.g. Guisan and Zimmermann 2000).
Model evaluation
The capacity of best approximating model func-tions for predicting rabbit abundance was evalu-ated for the different study domains using therandom subset of 1/3 of observations reserved forthis purpose. For each partial sub-region, both theglobal model of Donana and the specific sub-region model were evaluated using two coeffi-cients. The Spearman correlation coefficient be-tween observed abundance and model predictionswas calculated first (qt). This statistic provided ameasure of the association between observed andpredicted abundances over the continuous rangeof abundances. Secondly, each observation wasassigned to categories of high and low rabbitabundance using an arbitrary cut-off at the 75%percentile of the pellet count sample (=33 rab-bit pellets m�1). Then, an index of categoricalcoincidence between counts and model predictionswas estimated using Cohen’s Kappa (e.g. Manel etal. 2001). This index provided an estimation ofmodel capacity for predicting a minority of loca-tions with high relative rabbit abundance, usefulfor many management purposes.
Results
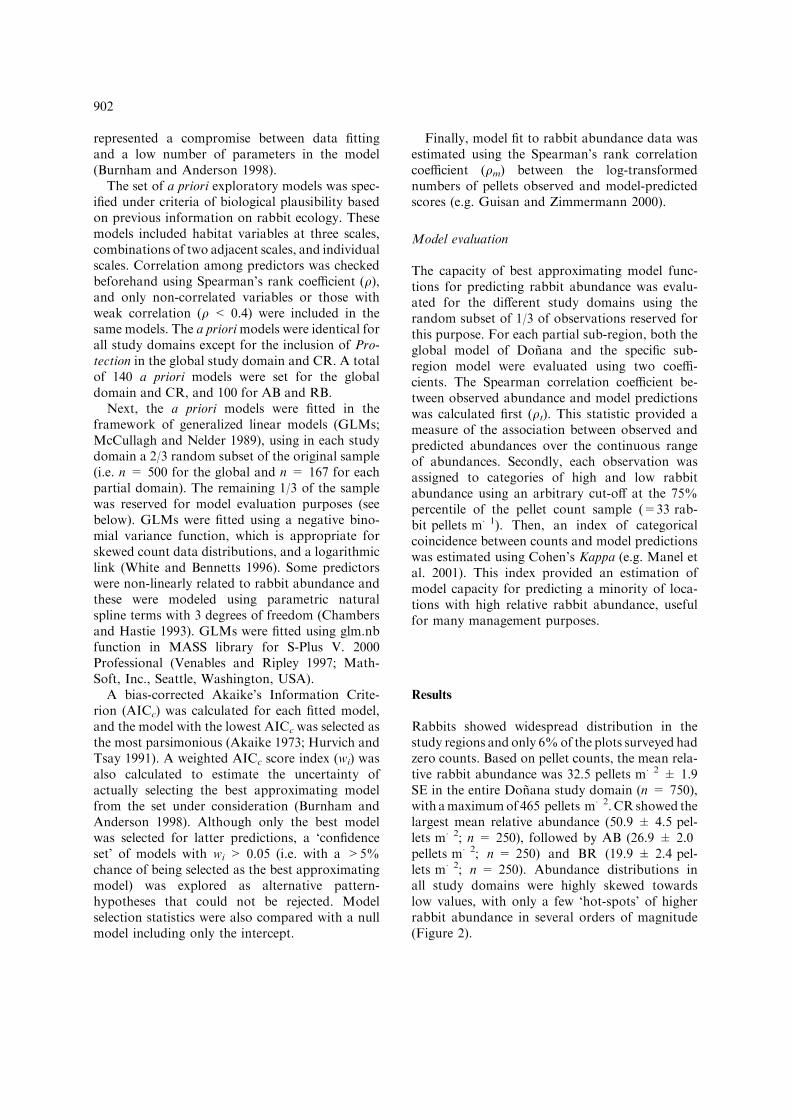
Rabbits showed widespread distribution in thestudy regions and only 6%of the plots surveyed hadzero counts. Based on pellet counts, the mean rela-tive rabbit abundance was 32.5 pellets m�2 ± 1.9SE in the entire Donana study domain (n = 750),with amaximumof 465 pellets m�2. CR showed thelargest mean relative abundance (50.9 ± 4.5 pel-lets m�2; n = 250), followed by AB (26.9 ± 2.0pellets m�2; n = 250) and BR (19.9 ± 2.4 pel-lets m�2; n = 250). Abundance distributions inall study domains were highly skewed towardslow values, with only a few ‘hot-spots’ of higherrabbit abundance in several orders of magnitude(Figure 2).
902

Global study domain model
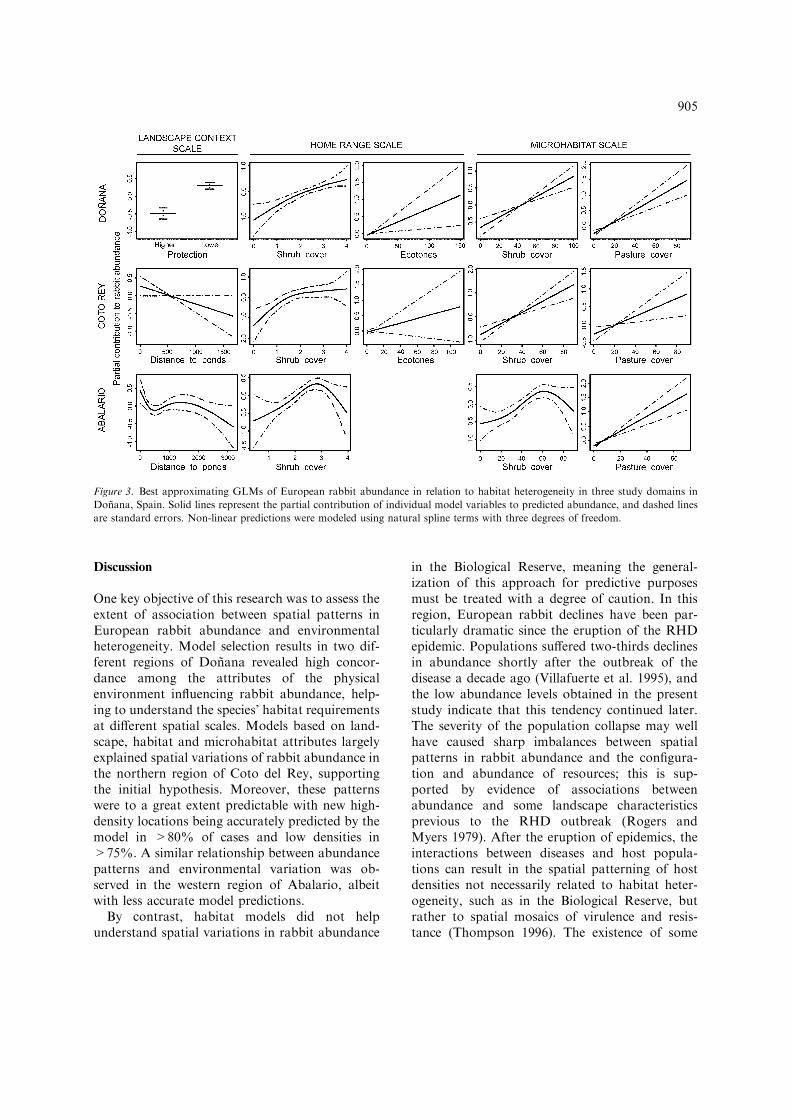
Model selection results indicated that patterns inrabbit abundance were associated with habitatvariables at all the spatial scales under consider-ation: the landscape context, home-range land-scape composition and microhabitat. Protectionstatus at the context scale, mean cover of shrubsat the scale of home ranges, and shrub and pas-ture cover at microhabitats were consistentlypresent in three models, constituting a 95% con-fidence set on the best approximating one. Inaddition, the most parsimonious of these models(Table 2) included density of ecotones betweenshrub and pasture patches at the home-rangescale. As shown in Figure 3, this model predictedhigher rabbit density in locations within the less
protected Natural Park, regardless of otherlandscape and microhabitat characteristics. Rab-bit abundance was positively associated withshrub cover, which provides shelter against pre-dators, at both the home-range and the micro-habitat scales. It was also associated with shrubinterspersion with pastures providing food, whichwas reflected in the positive effect of shrub–pas-ture ecotones at the home-range scale and ofpasture cover in microhabitats. The best approx-imating model showed a moderate correlationbetween observed and predicted pellet counts(Table 2), indicating an acceptable fit to the ori-ginal data. Two alternative models constitutingthe confidence model set differed from the best inthe inclusion of distance from ponds and lagoonsas a predictor.
Number of rabbit pellets m-1
0 50 100 150 200
Num
ber
of s
ampl
ing
plot
s
0
5
10
15
20
Number of rabbit pellets m-1
0 50 100 150 2000
5
10
15
20
25
30
35
0 50 100 150 2000
5
10
15
20
0 50 100 150 200
Num
ber
of s
ampl
ing
plot
s
0
10
20
30
40
50
Abalario
Biol. ReserveCoto del Rey
Doñana
Figure 2. Frequency distributions of relative abundance of the European rabbit in four study domains, measured through pellet
counts. Black dots represent frequencies of sampling plots with £ 200 pellets m�1. White dots at X = 200 represent the number of
plots with >200 pellets m�1 in each study domain.
903

Partial study domain models
All the best approximating models for CR and ABconfirmed that variables at three spatial scalesinfluenced patterns in rabbit abundance (Table 2).
The best model for CR revealed a positive effectof distance to lagoons and streams on rabbitabundance. This result suggested that rabbitsbenefited from moister areas with a higher watertable. Predictions at the home-range and micro-habitat scales were similar to the global domainmodel described above (Figure 3). Three othercandidate models with a >5% chance of beingselected differed from the former by eitherincluding the protection status, excluding thedensity of shrub–pasture ecotones, or both.
A similar best approximating model wasobtained for AB, although some predictors werenon-linearly related to rabbit abundance (Fig-ure 3). In contrast to other study domains, thebest model here did not include shrub–pasture
ecotones. These ecotones were scarcely present inthe AB data set (5% of the sample), which im-peded obtaining reliable parameter estimates forthis variable. Overall qm scores indicated goodmodel fit to the original rabbit abundance data,particularly in the region of CR (Table 2).
Conversely, analyses in BR did not provide asatisfactory approximating model to identifypatterns in rabbit abundance. Selection uncer-tainty was high and 37 models were needed toobtain a 95% confidence set on the bestapproximating one. In addition, output predic-tions from the best model correlated poorly withdata on rabbit abundance used for model build-ing (Table 2).
Model evaluation
The global domain model was found to be mod-erately accurate when confronted with indepen-dent evaluation data (qt = 0.417; p < 0.001).However, this accuracy varied considerably amongthe three study regions. The global model satis-factorily predicted variations in rabbit abundancewithin CR, where correlation between predictionsand independent data was qt = 0.655; p < 0.001.This correlation was also significant in AB, albeitweaker (qt = 0.238; p = 0.015). Conversely, pre-dictions in BR were inaccurate (qt = 0.085;p = 0.504). The evaluation of specific models fortheir corresponding partial domains producedsimilar results. Correlation in CR was qt = 0.601;p < 0.001; in AB, qt = 0.259; p = 0.019; and inBR, qt = 0.087; p = 0.42.
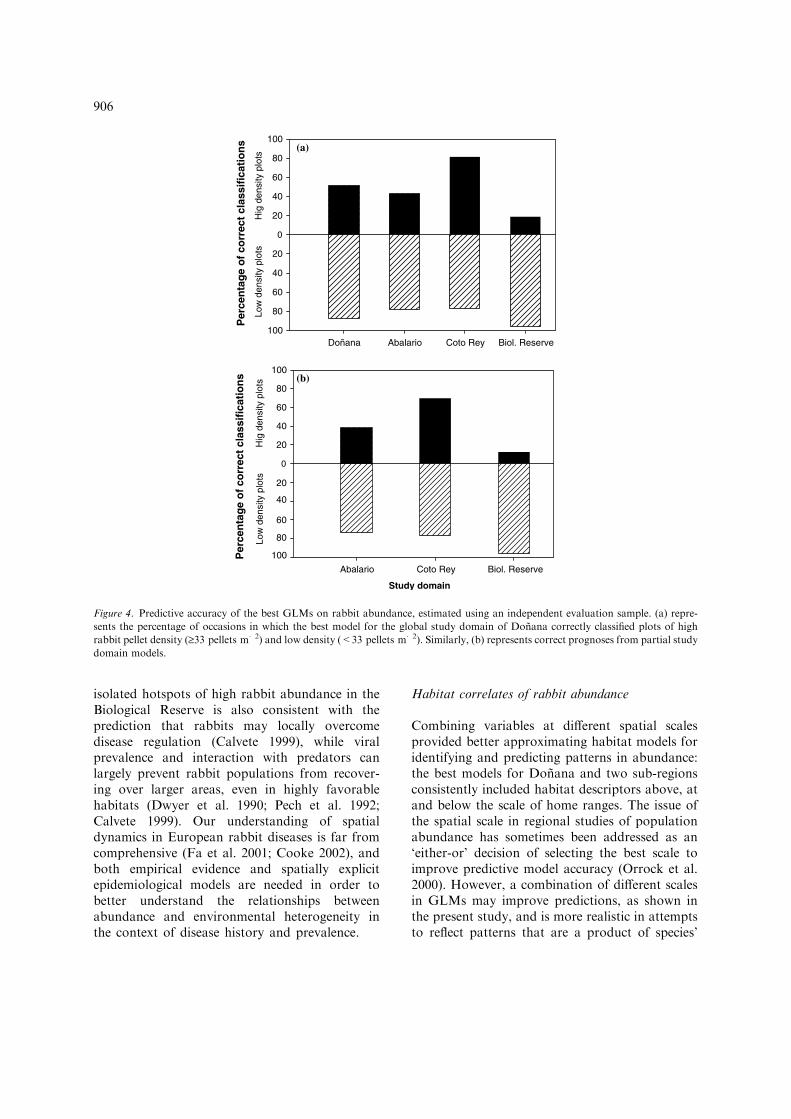
Model accuracy for categorical predictions ofabundance is best represented in Figure 4. Asshown, the global domain model accurately clas-sified both high-density and low-density plotsfrom the evaluation sample in CR (Cohen’sKappa = 0.60). This accuracy tended to be lessprecise for high than low densities in AB (Kap-pa = 0.27), and the model was completely unableto predict high densities in BR (Kappa = 0.10).Accordingly, the overall accuracy for Donana wasinfluenced by lower rates of correct classificationfor high rabbit density locations (Kappa = 0.41).Cohen’s Kappa scores derived from the applica-tion of partial study domains were similar tothose reported for the global model (results notshown).
Table 2. Best approximating models for European rabbit
abundance in Donana, Spain.
Predictors AICc wi qm
Donana – global study domain
Null model �86311.6 <0.001 –
LÆPro, ns(HrÆShr), HrÆEdge,SÆShr, SÆPas
�86424.1 0.512 0.421**
Abalario (AB)
Null model �28068.0 <0.001 –
ns (LÆDLag), ns (HrÆShr),ns(MÆShr), MÆPas
�28126.4 0.373 0.528**
Coto del Rey (CR)
Null model �46116.5 <0.001 –
LÆDLag, ns(HrÆShr), HrÆEdge,MÆShr, MÆPas
�46190.1 0.301 0.640**
Biological Reserve (BR)
Null model �18978.8 0.001 –
HrÆShr, MÆPas �18988.7 <0.175 0.126
Variable codes are from Table 1; ns before a code notates
natural spline terms (d.f. = 3). For comparison purposes,
Akaikes’s information criterion scores (AICc) from intercept-
only null models are also presented. wi informs on AIC weights,
and qm is the Spearman rank correlation coefficient between
model predictions and the observed abundance. Dispersion
parameters for the best models were as follows: Donana:
h = 0.83 ± 0.05 SE; Abalario: h = 1.78 ± 0.19 SE; Coto
Rey: h = 0.92 ± 0.09 SE; Biological Reserve: h = 0.55 ±
0.06 SE.
**p < 0.001.
904
Discussion
One key objective of this research was to assess theextent of association between spatial patterns inEuropean rabbit abundance and environmentalheterogeneity. Model selection results in two dif-ferent regions of Donana revealed high concor-dance among the attributes of the physicalenvironment influencing rabbit abundance, help-ing to understand the species’ habitat requirementsat different spatial scales. Models based on land-scape, habitat and microhabitat attributes largelyexplained spatial variations of rabbit abundance inthe northern region of Coto del Rey, supportingthe initial hypothesis. Moreover, these patternswere to a great extent predictable with new high-density locations being accurately predicted by themodel in >80% of cases and low densities in>75%. A similar relationship between abundancepatterns and environmental variation was ob-served in the western region of Abalario, albeitwith less accurate model predictions.
By contrast, habitat models did not helpunderstand spatial variations in rabbit abundance
in the Biological Reserve, meaning the general-ization of this approach for predictive purposesmust be treated with a degree of caution. In thisregion, European rabbit declines have been par-ticularly dramatic since the eruption of the RHDepidemic. Populations suffered two-thirds declinesin abundance shortly after the outbreak of thedisease a decade ago (Villafuerte et al. 1995), andthe low abundance levels obtained in the presentstudy indicate that this tendency continued later.The severity of the population collapse may wellhave caused sharp imbalances between spatialpatterns in rabbit abundance and the configura-tion and abundance of resources; this is sup-ported by evidence of associations betweenabundance and some landscape characteristicsprevious to the RHD outbreak (Rogers andMyers 1979). After the eruption of epidemics, theinteractions between diseases and host popula-tions can result in the spatial patterning of hostdensities not necessarily related to habitat heter-ogeneity, such as in the Biological Reserve, butrather to spatial mosaics of virulence and resis-tance (Thompson 1996). The existence of some
Figure 3. Best approximating GLMs of European rabbit abundance in relation to habitat heterogeneity in three study domains in
Donana, Spain. Solid lines represent the partial contribution of individual model variables to predicted abundance, and dashed lines
are standard errors. Non-linear predictions were modeled using natural spline terms with three degrees of freedom.
905
isolated hotspots of high rabbit abundance in theBiological Reserve is also consistent with theprediction that rabbits may locally overcomedisease regulation (Calvete 1999), while viralprevalence and interaction with predators canlargely prevent rabbit populations from recover-ing over larger areas, even in highly favorablehabitats (Dwyer et al. 1990; Pech et al. 1992;Calvete 1999). Our understanding of spatialdynamics in European rabbit diseases is far fromcomprehensive (Fa et al. 2001; Cooke 2002), andboth empirical evidence and spatially explicitepidemiological models are needed in order tobetter understand the relationships betweenabundance and environmental heterogeneity inthe context of disease history and prevalence.
Habitat correlates of rabbit abundance
Combining variables at different spatial scalesprovided better approximating habitat models foridentifying and predicting patterns in abundance:the best models for Donana and two sub-regionsconsistently included habitat descriptors above, atand below the scale of home ranges. The issue ofthe spatial scale in regional studies of populationabundance has sometimes been addressed as an‘either-or’ decision of selecting the best scale toimprove predictive model accuracy (Orrock et al.2000). However, a combination of different scalesin GLMs may improve predictions, as shown inthe present study, and is more realistic in attemptsto reflect patterns that are a product of species’
Doñana Abalario Coto Rey Biol. Reserve
Per
cen
tag
e o
f co
rrec
t cl
assi
fica
tio
ns
-100
-80
-60
-40
-20
0
20
40
60
80
100
Low
den
sity
plo
ts
(a)
Hig
den
sity
plo
ts
Hig
h a
bu
nd
ance
Lo
w a
bu
nd
ance
Study domain
Abalario Coto Rey Biol. Reserve
Per
cen
tag
e o
f co
rrec
t cl
assi
fica
tio
ns
0
20
20
40
40
60
60
80
80
100
100
(b)
Hig
den
sity
plo
tsLo
w d
ensi
ty p
lots
Figure 4. Predictive accuracy of the best GLMs on rabbit abundance, estimated using an independent evaluation sample. (a) repre-
sents the percentage of occasions in which the best model for the global study domain of Donana correctly classified plots of high
rabbit pellet density (‡33 pellets m�2) and low density (<33 pellets m�2). Similarly, (b) represents correct prognoses from partial study
domain models.
906
hierarchical responses to habitat heterogeneity(e.g. Kotliar and Wiens 1990; Mazerolle andVillard 1999).
The ecological significance of the resultingmodels is best explained by the capacity of land-scapes to provide basic rabbit resources. Rabbitsbenefit from shorter distances from streams andlagoons, where water table levels are lower andgreen pastures endure longer during droughts. InMediterranean environments, the maintenance ofmoist pastures during the dry season enhancesrabbit productivity, given that reproduction islargely affected by the availability of moist grasshigh in protein (Villafuerte et al. 1997). The posi-tive effect of ponds and lagoons on rabbit abun-dance was observed beyond the scale of homeranges. A similar pattern was observed by Palo-mares et al. (2001) for moist pastures bordering onthe marsh in a smaller area of Donana, which fa-vored rabbit abundance up to 300 m apart withinthe shrubland. On the other hand, rabbit abun-dance was linearly correlated with the density ofshrubland–pastureland ecotones and non-linearlywith mean landscape shrub cover at the home-range scale. Shrub-dominated landscapes favorrabbit predator avoidance and diminish the risk ofmortality (Lombardi et al. 2003), but this cover isalso to the detriment of pastures to feed on (Mo-reno and Villafuerte 1995). Therefore, areas withinterspersed patches of shrubland and pasturelandprovide a favorable combination of food and ref-uge, which is reflected in the broad-scale positiveeffects of ecotones on abundance. Rabbit associ-ation with shrub and pasture cover at the micro-habitat scale was largely consistent with findings atthe home-range scale.
Implications for conservation
Spatial variation in European rabbit abundancegreatly influences terrestrial communities in Med-iterranean ecosystems as many vertebrate preda-tors, including some highly endangered species,depend on this prey (e.g. Ferrer 1993; Palomares2001b; Fernandez et al. 2003). Nevertheless, thefew existing studies evaluating methods to reviverabbit populations have mostly been performed atsmall spatial scales relative to predator spatialrequirements (Moreno and Villafuerte 1995;Calvete et al. 1997; Letty et al. 2000). The present
study may provide useful guidelines for developinglandscape-oriented management strategies for therecovery of rabbits over broader areas. For in-stance, vegetation should be managed to increaseshrub–pasture interspersion at the scale of rabbithome ranges, and this strategy should involvelarge areas so that rabbit abundance can beinfluenced at the spatial scale required by predatorpopulations. This is supported by local experi-ments that have demonstrated the effectiveness ofsmall burnings within shrubland (a traditionalmanagement approach that has been abandonedin many areas) to increase pasture availability andrabbit abundance (Moreno and Villafuerte 1995).In addition, rabbit recovery efforts should befocused on landscapes close to lagoons and pondswith higher pasture growth.
However, this study also identifies potential dif-ficulties that may arise in rabbit population man-agement. The results indicate that in Donana, acritically important area for conservation insouthern Europe (Fernandez-Delgado 1997), rab-bits were less abundant in the strictly protectedNational Park than in the surroundings. This con-servation paradox could be explained by the higherabundance of rabbit predators inside the park as aresult of protection (Travaini et al. 1997). Highpredator density, particularly of generalist preda-tors, is an important factor regulating rabbit pop-ulations at lowdensities (Pech et al. 1992; Palomareset al. 1995). Moreover, predators can greatlyundermine rabbit recovery after epidemic-relatedpopulation declines through low-prey-density sta-ble equilibrium states and predation pit effects.Therefore, protection and landscape managementmay be insufficient for the recovery of rabbits insome situations of weak association between pop-ulation abundance and landscape structure, par-ticularly where other potential regulating factorsmay be involved.
Conclusion
The present study shows that, even for the samespecies in nearby regions with similar habitatcharacteristics, habitat models can properly pre-dict broad-scale spatial variations in abundance insome areas, but may provide little insight in oth-ers. In the first case, models revealed their abilityto provide information about landscape and
907

microhabitat attributes important for the abun-dance of the species. Resource availability maywell underlie the relationship outlined in thesemodels. In the second case, historical and dynamicpopulation processes, which are difficult to incor-porate into static habitat models, may haveresulted in imbalances in the spatial relationshipsbetween rabbit abundance and habitat heteroge-neity. Although the conservation of biodiversity inMediterranean areas would benefit from broad-scale habitat analyses of rabbit abundance aspresented here, further integrated research is nee-ded to better understand the spatial effects oflandscape structure, predators and epidemics onrabbit abundance. This is crucial to derivingsolutions to current conservation problems stem-ming from rabbit population collapse in Mediter-ranean ecosystems.
Acknowledgments
This research was supported by the SpanishDireccion General de Investigacion (projectsPB97-1163 and BOS2001-2301) and the EuropeanUnion FEDER program (project 1FD97-0789),and sponsored by Land Rover Espana. Theauthor was funded by a pre-doctoral grant fromthe Spanish Ministry of Science and Technology,and a Marie Curie Fellowship from the EuropeanUnion hosted at UFZ – Centre for EnvironmentalResearch, Leipzig-Halle. I would like to thankJose Manuel Moreira and the personnel at Ser-vicio de Evaluacion de Recursos Naturales ofJunta de Andalucıa for facilitating aerial photo-graphs, satellite images and other spatial data;and Marıa Mendez, Lupe Moreno, Merce Suarezand a number of students for their valuableassistance in the field work. Emily Nicholson andChris Abbey kindly reviewed the English. Com-ments from M. Delibes, F. Palomares, E. Revilla,A. Rodrıguez, S. Moreno, S. Cabezas and twoanonymous referees greatly improved earlier ver-sions of the manuscript.
References
Aars J. and Ims R.A. 2000. Population dynamic and genetic
consequences of spatial density–dependent dispersal in pat-
chy populations. Am. Nat. 155: 252–264.
Akaike H. 1973. Information theory as an extension of the
maximum likelihood principle. In: Petrov B.N. and Csaki F.
(eds), Second International Symposium on Information
Theory. Akademiai Kiado, Budapest, Hungary, pp. 267–281.
Bissonette J.A., Harrison D.J., Hargis C.D. and Chapin T.G.
1997. The influence of spatial scale and scale-sensitive prop-
erties in habitat selection by American marten. In: Bissonette
J.A. (ed.), Wildlife and Landscape Ecology: Effects of Pattern
and Scale. Springer-Verlag, New York, USA, pp. 368–385.
Boyce M.S. and McDonald L.L. 1999. Relating populations to
habitats using resource selection functions. Trends Ecol.
Evol. 14: 268–272.
Brown J.H., Mehlman D.W. and Stevens G.C. 1995. Spatial
variation in abundance. Ecology 76: 2028–2043.
Burnham K.P. and Anderson D.R. 1998. Model Selection and
Inference. A Practical Information-theoretic Approach.
Springer-Verlag, New York, USA.
Bustamante J. 1997. Predictive models for lesser kestrel Falco
naumanni distribution, abundance and extinction in southern
Spain. Biol. Conserv. 80: 153–160.
Calvete C. 1999. Epidemiologıa de enfermedad hemorragica
(VHD) y mixomatosis en el conejo silvestre (Oryctolagus
cuniculus) en el Valle Medio del Ebro. Ph.D., University of
Zaragoza, Zaragoza, Spain.
Calvete C., Villafuerte R., Lucientes J. and Osacar J. 1997.
Effectiveness of traditional wild rabbit restocking in Spain.
J. Zool. 241: 271–277.
Chambers J.M. and Hastie T.J. 1993. Statistical Models in
S. Chapman & Hall, London, UK.
Cooke B.D. 2002. Rabbit haemorrhagic disease: field epide-
miology and the management of wild rabbit populations.
Rev. Sci. Tech. De L Office Int. Epizoot. 21: 347–358.
Coops N.C. and Catling P.C. 2002. Prediction of the spatial
distribution and relative abundance of ground-dwelling
mammals using remote sensing imagery and simulation
models. Landscape Ecol. 17: 173–188.
Delibes M. and Hiraldo F. 1981. The rabbit as a prey in the
Iberian Mediterranean ecosystem. In: Myers K. and Mac-
Innes C.D. (eds), Proceedings of the World Lagomorph
Conference. University of Guelph, Guelp, Ontario, Canada,
pp. 614–622.
Dwyer G., Levin S.A. and Buttel L. 1990. A simulation model
of the population dynamics and evolution of myxomatosis.
Ecol. Monogr. 60: 423–447.
Fa J.E., Sharples C.M., Bell D.J. and DeAngelis D. 2001. An
individual-based model of rabbit viral haemorrhagic disease
in European wild rabbits (Oryctolagus cuniculus). Ecol.
Model. 144: 121–138.
Fernandez N., Delibes M., Palomares F. and Mladenoff D.J.
2003. Identifying breeding habitat for the Iberian lynx:
inferences from a fine-scale spatial analysis. Ecol. Appl. 13:
1310–1324.
Fernandez-Delgado C. 1997. Conservation management of an
European Natural Area: Donana National Park, Spain. In:
Meffe G.K. and Carroll C.R. (eds), Principles of Conserva-
tion Biology, 2nd ed. Sinauer Associates, Inc. Publishers,
Sunderland, MA, USA, pp. 458–467.
Ferrer M. 1993. El aguila imperial. Quercus, Madrid, Spain.
Fisher R.N., Suarez A.V. and Case T.J. 2002. Spatial patterns
in the abundance of the coastal horned lizard. Conserv. Biol.
16: 205–215.
908

Flather C.H. and Sauer J.R. 1996. Using landscape ecology to
test hypotheses about large-scale abundance patterns in
migratory birds. Ecology 77: 28–35.
Gomez-Sal A., Rey-Benayas J.M., Lopez-Pintor A. and
Rebollo S. 1999. Role of disturbance in maintaining a
savanna-like pattern in Mediterranean Retama sphaerocarpa
shrubland. J. Veget. Sci. 10: 365–370.
Guisan A. and Zimmermann N.E. 2000. Predictive habitat
distribution models in ecology. Ecol. Model. 135: 147–186.
Hurvich C.M. and Tsay C.L. 1991. Regression and time series
model selection in small samples. Biometrika 76: 297–307.
Instituto de Cartografıa de Andalucıa. 1999. Mapa Digital de
Andalucıa 1:100,000. Junta de Andalucıa, Sevilla, Spain.
Ives A.R. and Klopfer E.D. 1997. Spatial variation in abun-
dance created by stochastic temporal variation. Ecology 78:
1907–1913.
Johnson D.H. 1980. The comparison of usage and availability
measurements for evaluating resource preference. Ecology
61: 65–71.
Keitt H.K., Bjørnstand O.N., Dixon P.M. and Citron-Pousty S.
2002. Accounting for spatial pattern when modeling organ-
ism-environment interactions. Ecography 25: 616–625.
Kotliar N.B. 2000. Application of the new keystone-species
concept to prairie dogs: how well does it work? Conserv. Biol.
14: 1715–1721.
Kotliar N.B. and Wiens J.A. 1990. Multiple scales of patchiness
and patch structure: a hierarchical framework for the study
of heterogeneity. Oikos 59: 253–260.
Letty J., Marchandeau S., Clobert J. and Aubineau J. 2000.
Improving translocation success: an experimental study of
anti-stress treatment and release method for wild rabbits.
Animal Conserv. 3: 211–219.
Lichstein J.W., Simons T.R. and Franzreb K.E. 2002. Land-
scape effects on breeding songbird abundance in managed
forests. Ecol. Appl. 12: 836–857.
Lombardi L., Fernandez N., Moreno S. and Villafuerte R.
2003. Habitat-related differences in rabbit abundance, dis-
tribution and activity. J. Mammal. 84: 26–36.
Manel S., Williams H.C. and Ormerod S.J. 2001. Evaluating
presence-absence models in ecology: the need to account for
prevalence. J. Appl. Ecol. 38: 921–931.
Mazerolle M.J. and Villard M.-A. 1999. Patch characteristics
and landscape context as predictors of species presence and
abundance: a review. Ecoscience 6: 117–124.
McCullagh P. and Nelder J.A. 1989. Generalized Linear
Models, 2nd ed. Chapman and Hall, London, UK.
Micol T., Doncaster C.P. and Mackinlay L.A. 1994. Correlates
of local variation in the abundance of hedgehogs Erinaceus
europaeus. J. Animal Ecol. 63: 851–860.
Montes C., Borja F., Bravo M.A. and Moreira J.M. (eds) 1998.
Reconocimiento biofısico de Espacios Naturales Protegidos.
Donana: una aproximacion ecosistemica. Junta de And-
alucıa, Consejerıa de Medio Ambiente, Madrid.
Moreira J.M. and Fernandez-Palacios A. 1995. Usos y co-
berturas del suelo en Andalucıa: seguimiento a traves de
imagenes de satelite. Agencia de Medio Ambiente, Junta de
Andalucıa, Sevilla, Spain.
Moreno S. and Villafuerte R. 1995. Traditional management of
scrubland for the conservation of rabbits Oryctolagus cuni-
culus and their predators in Donana National Park, Spain.
Biol. Conserv. 73: 81–85.
Orrock J.L., Pagels J.F., McShea W.J. and Harper E.K. 2000.
Predicting presence and abundance of a smallmammal species:
the effect of scale and resolution. Ecol. Appl. 10: 1356–1366.
Paine R.T. 1992. Food-web analysis through field measurement
of per capita interaction strength. Nature 355: 73–75.
Palomares F. 2001a. Comparison of 3 methods to estimate
rabbit abundance in a Mediterranean environment. Wildlife
Soc. Bull. 29: 578–585.
Palomares F. 2001b. Vegetation structure and prey abundance
requirements of the Iberian lynx: implications for the design
of reserves and corridors. J. Appl. Ecol. 38: 9–18.
Palomares F. 2003. The negative impact of heavy rains on the
abundance of a Mediterranean population of European
rabbits. Mammal. Biol. 68: 224–234.
Palomares F., Delibes M., Revilla E., Calzada J. and Fedriani
J.M. 2001. Spatial ecology of Iberian lynx and abundance of
European rabbits in southwestern Spain. Wildlife Monogr.
148: 1–36.
Palomares F., Gaona P., Ferreras P. and Delibes M. 1995.
Positive effects on game species of top predators by con-
trolling smaller predator populations: an example with lynx,
mongooses, and rabbits. Conserv. Biol. 9: 295–305.
Paradis E., Baillie S., Sutherland W.J. and Gregory R.D. 2002.
Exploring density–dependent relationships in demographic
parameters in populations of birds at large spatial scale.
Oikos 97: 293–307.
Pearce J. and Ferrier S. 2001. The practical value of modelling
relative abundance of species for regional conservation
planning: a case study. Biol. Conserv. 98: 33–43.
Pech R.P., Sinclair A.R.E., Newsome A.E. and Catling P.C.
1992. Limits to predator regulation of rabbits in Australia:
evidence from predator-removal experiments. Oecologia 89:
102–112.
Rodrıguez A. and Delibes M. 1992. Current range and status of
the Iberian lynx Felis pardina Temminck 1824 in Spain. Biol.
Conserv. 61: 189–196.
Rogers P.M. and Myers K. 1979. Ecology of the European wild
rabbit, Oryctolagus cuniculus (L.), in Mediterranean habitats.
J. Appl. Ecol. 16: 691–703.
Rushton S.P., Hill D. and Carter S.P. 1994. The abundance of
river corridor birds in relation to their habitats: a modelling
approach. J. Appl. Ecol. 31: 313–328.
Saab V. 1999. Importance of spatial scale to habitat use by
breeding birds in riparian forests: a hierarchical analysis.
Ecol. Appl. 9: 135–151.
Schweiger E.W., Diffendorfer J.E., Pierotti R. and Holt R.D.
1999. The relative importance of small-scale and landscape-
level heterogeneity in structuring small mammal distribu-
tions. In: Barret G.W. and Peles J.D. (eds), Landscape
Ecology of Small Mammals. Springer-Verlag, Athens, GA,
USA. pp.175–207.
Soriguer R.C. 1986. The rabbit as a plant seed disperser.
Mammal Rev. 16: 197–200.
Sousa A. and Garcıa-Murillo P. 2001. Can place names be used
as indicators of landscape changes? Application to the
Donana Natural Park (Spain). Landscape Ecol. 16: 391–406.
Thompson J.N. 1996. Evolutionary ecology and the conserva-
tion of biodiversity. Trends Ecol. Evol. 11: 300–303.
Thompson H.V. and King C.M. 1994. The European Rabbit.
The History and Biology of a Successful Colonizer. Oxford
University Press.
909
Travaini A., Delibes M., Ferreras P. and Palomares F. 1997.
Diversity, abundance or rare species as a target for the con-
servation of mammalian carnivores: a case study in Southern
Spain. Biodiv. Conserv. 6: 529–535.
Venables W.N. and Ripley B.D. 1997. Modern Applied Sta-
tistics with S-Plus. Springer, New York, USA.
Villafuerte R., Calvete C., Blanco J.C. and Lucientes J. 1995.
Incidence of viral hemorrhagic disease in wild rabbit popu-
lations in Spain. Mammalia 59: 651–659.
Villafuerte R., Calvete C., Gortazar C. and Moreno S. 1994.
First epizootic of rabbit hemorrhagic disease in free living
populations of Oryctolagus cuniculus at Donana National
Park, Spain. J. Wildlife Dis. 30: 176–179.
Villafuerte R., Lazo A. and Moreno S. 1997. Influence of food
abundance and quality on rabbit fluctuations: conservation
and management implications in Donana National Park (SW
Spain). La Terre et la Vie 52: 345–355.
Weltzin J.F., Archer S. and Heitschmidt R.K. 1997. Small-
mammal regulation of vegetation structure in a temperate
Savanna. Ecology 78: 751–763.
White G.C. and Bennetts R.E. 1996. Analysis of frequency
count data using the negative binomial distribution. Ecology
77: 2549–2557.
Wiens J.A., Rotenberry J.T. and Van Horne B. 1987. Habitat
occupancy patterns of North American shrubsteppe birds:
the effects of spatial scale. Oikos 48: 132–147.
910