The Socompa collapse and avalanche event
28
Journal of volcanology and geothennal research ELSEVIER Journal of Volcanology and Geothermal Research 66 ( 1995) 309-336 The Socompa collapse and avalanche event G. Wadge a,*, P.W. Francis b, C.F. Ramirez C a NERC Unit for Thematic Information Systems. Department of Geography. University of Reading. Reading RG6 2AB. UK b Planetary Geosciences Division. Hawaii Institute of Geophysics. 2525 Correa Road. Honolulu. HI 96822. USA C Servicio Nacional de Geologia y Mineria. Casilla 10465. Santiago. Chile Received 12 March 1992; revised version accepted 25 January 1993 Abstract Failure of the northwestern flank of the Socompa volcano, north Chile, about 7000 years ago created a 40-km-long debris avalanche deposit. The deposit is remarkably well-exposed. We have combined spectral reflectance data, field observations and analysis of digital topographic surfaces to reconstruct the sequence of collapse events, and to constrain the volumes and sources of materials comprising the avalanche. Collapse involved three principle components: the debris avalanche deposit itself (volume 26 km 3 , after 30% expansion); large slide blocks (11 km3); and detached blocks (23 km 3 ) which remained in the upper part of the amphitheatre. The debris l\valanche deposit comprised two main units and seven subunits. Landsat Thematic Mapper data enabled estimation of the proportions of spectrally distinct lithological components within these heterogeneous units. About 35% of the deposit area is composed of ignimbrites and gravels derived from a 1 00-200-m-thick slice of basement rock underlying the northwestern flank of the volcano. Dacite domes and lavas, originally situated in the southern and western parts of the amphitheatre, constitute much of the remainder of the deposit. Blocks composed largely of sequences of lavas and pyroclastic deposits, originally located in the northern and eastern parts of the amphitheatre, slid coherently 7 km northwestwards and accumulated near the mouth of the amphitheatre. Modelling of locations of centroids in the original cone and of displaced components shows that potential energy loss during collapse was 3.8X 10 17 J (cf. 0.7X 10 17 J for Mount St. Helens 1980). Significantly, components of the avalanche with least potential energy travelled the furthest laterally, perhaps demonstrating efficient transfer of momentum from rear to front of the avalanche. Retrogressive flank failures of the original cone contributed successive components to the avalanche; most of these combined to form a single moving mass, but some appear to have been emplaced separately. 1. Introduction Volclin Socompa is an Andean composite volcano which straddles the border between Chile and Argen- tina at 24°S. About 7000 years ago, the northwestern (Chilean) sector of the volcano collapsed, sending a debris-avalanche nearly 40 km to the northwest over a relatively fiat, arid plain. Since the collapse, the amphi- theatre has been partially filled by new volcanic depos- * Corresponding author. 0377-0273/95/$09.50 © 1995 Elsevier Science B.V. All rights reserved SSDI0377-0273(94)00083-2 its but the avalanche deposit has been preserved in near pristine condition by the arid climate. The debris-ava- lanche at Socompa was not witnessed (unlike Mount St. Helens in 1980; Voight et a\., 1981), nor is the resulting deposit the largest known (e.g., Mt. Shasta; Crandell, 1989), but it is arguably the best-preserved example of a major volcanic debris-avalanche deposit on Earth. It promises to yield valuable insights into the nature of major avalanche phenomena. It would be impossible to understand the Socompa avalanche deposit without remotely sensed images,
-
Upload
independent -
Category
Documents
-
view
2 -
download
0
Transcript of The Socompa collapse and avalanche event

Journal of volcanology and geothennal research
ELSEVIER Journal of Volcanology and Geothermal Research 66 ( 1995) 309-336
The Socompa collapse and avalanche event
G. Wadge a,*, P.W. Francis b, C.F. Ramirez C
a NERC Unit for Thematic Information Systems. Department of Geography. University of Reading. Reading RG6 2AB. UK b Planetary Geosciences Division. Hawaii Institute of Geophysics. 2525 Correa Road. Honolulu. HI 96822. USA
C Servicio Nacional de Geologia y Mineria. Casilla 10465. Santiago. Chile
Received 12 March 1992; revised version accepted 25 January 1993
Abstract
Failure of the northwestern flank of the Socompa volcano, north Chile, about 7000 years ago created a 40-km-long debris avalanche deposit. The deposit is remarkably well-exposed. We have combined spectral reflectance data, field observations and analysis of digital topographic surfaces to reconstruct the sequence of collapse events, and to constrain the volumes and sources of materials comprising the avalanche. Collapse involved three principle components: the debris avalanche deposit itself (volume 26 km3, after 30% expansion); large slide blocks (11 km3); and detached blocks (23 km3) which remained in the upper part of the amphitheatre. The debris l\valanche deposit comprised two main units and seven subunits. Landsat Thematic Mapper data enabled estimation of the proportions of spectrally distinct lithological components within these heterogeneous units. About 35% of the deposit area is composed of ignimbrites and gravels derived from a 1 00-200-m-thick slice of basement rock underlying the northwestern flank of the volcano. Dacite domes and lavas, originally situated in the southern and western parts of the amphitheatre, constitute much of the remainder of the deposit. Blocks composed largely of sequences of lavas and pyroclastic deposits, originally located in the northern and eastern parts of the amphitheatre, slid coherently 7 km northwestwards and accumulated near the mouth of the amphitheatre. Modelling of locations of centroids in the original cone and of displaced components shows that potential energy loss during collapse was 3.8X 10¹⁷ J (cf. 0.7X 10¹⁷ J for Mount St. Helens 1980). Significantly, components of the avalanche with least potential energy travelled the furthest laterally, perhaps demonstrating efficient transfer of momentum from rear to front of the avalanche. Retrogressive flank failures of the original cone contributed successive components to the avalanche; most of these combined to form a single moving mass, but some appear to have been emplaced separately.
1. Introduction
Volclin Socompa is an Andean composite volcano which straddles the border between Chile and Argentina at 24°S. About 7000 years ago, the northwestern (Chilean) sector of the volcano collapsed, sending a debris-avalanche nearly 40 km to the northwest over a relatively fiat, arid plain. Since the collapse, the amphitheatre has been partially filled by new volcanic depos-
* Corresponding author.
0377-0273/95/$09.50 © 1995 Elsevier Science B.V. All rights reserved SSDI0377-0273(94)00083-2
its but the avalanche deposit has been preserved in near pristine condition by the arid climate. The debris-avalanche at Socompa was not witnessed (unlike Mount St. Helens in 1980; Voight et a\., 1981), nor is the resulting deposit the largest known (e.g., Mt. Shasta; Crandell, 1989), but it is arguably the best-preserved example of a major volcanic debris-avalanche deposit on Earth. It promises to yield valuable insights into the nature of major avalanche phenomena.
It would be impossible to understand the Socompa avalanche deposit without remotely sensed images,

310 G. Wadge et al. / Journal o/Volcanology and Geothermal Research 66 (1995) 309-336
because the horizontal scale is such that the interrelationships of the individual components of the deposit cannot be fully appreciated on the ground. Remotely sensed images have been the starting point for most of the previous work at Socompa. Deruelle (1978) presented aerial photographs in his interpretation of the deposit as a pyroclastic flow. Francis et al. (1985) used Space Shuttle photographs to illustrate the principal subdivisions in interpreting the deposit as a major debris-avalanche. Rothery and Francis (1987) compared digital MOMS and Landsat MSS images whilst Francis and Self ( 1987) and Francis and Wells ( 1988) illustrated the deposit with a Landsat Thematic Mapper image. Ramirez (1988) also used Thematic Mapper images and aerial photography as photo-interpretative aids to his ground-based studies of the geology of Socompa. Our present study also uses remotely sensed data; aerial photography and digital Thematic Mapper data, combined with the field reference data of Ramirez (1988, 1992).
The primary objective of this paper is to provide quantitative constraints on the locations, volumes, and energy budget of the components involved in the collapse event. We have used the spectral information present in the seven bands of a Landsat Thematic Mapper image to map in a quantitative manner the distribution of the main rock types present in the deposit. We have also created a variety of digital elevation models of the volcano and its deposit and use these models to calculate centroids of mass of the components of the avalanche. Using these centroids and the map data, we constrain the sources and likely sequence of collapse, and we examine the implications of these results for emplacement mechanisms.
2. Field and remotely sensed evidence
Socompa is the youngest and westernmost member of a NE-SW -trending chain of - 6000 m a.s.l. volcanoes, including Pular and Pajonales (Figs. 1,2). Activity at Socompa has typically consisted of eruptions of dacitic and andesitic lavas from a central cone, extrusion of dacite domes and occasional plinian eruptions (Ramirez, 1995). The surface of the modem edifice appears to post-date the last glacial episode ( < 11,000 yr B.P.), since no moraines have been observed on the volcano (de Silva and Francis, 1991). A single 14C
date suggests that a catastrophic sector collapse of the northwestern flank of the volcano took place about 7200 yr B.P. to form the debris-avalanche deposit discussed here.
Remotely sensed images of Socompa show an amphitheatre whose walls subtend about 70° on the northwestern sector of the volcano (Fig. 1). From the mouth of this amphitheatre a deposit with distinct boundaries extends for a distance of about 40 km, covering an area of about 490 km2
• At the mouth of the amphitheatre is a series of prismatic ridges several hundreds of metres high. These are gigantic coherent blocks of the volcano which slid into their present location and also rotated. We use the term toreua (Reiche, 1937) to describe this landform, since it more precisely describes the morphology and mode of origin of these major blocks than the more general term 'slump block', used for a wide variety of mass movement deposits. The amphitheatre is now partly infilled by younger lava flows, lava domes and pyroclastic deposits. Young pyroclastic flows emerged from the amphitheatre to the west where the slide blocks are lowest, and their deposits now partly cover the proximal part of the debrisavalanche deposit, in an area known as the Campo Amarillo (Fig. 2). Because of the dry climate in this part of the Andes, fluvial erosion of the deposits has been negligible, and most of the structural features indicative of flow and deformation during the collapse event are remarkably well-preserved (Ramirez, 1988). There is an altitude difference of over 3 km from the summit of the volcano prior to collapse ( - 6300 m a.s.l.) to the toe of the deposit (3000 m a.s.l.). Most of the debris-avalanche was deposited in a shallow valley ( - 300 m relief from 3400 m to 3100 m a.s.l.) trending obliquely across the northwest transport direction.
Four distinct morphostructural elements are present at Socompa (Fig. 2): (1) the Old Cone (pre-collapse volcano); (2) the Young Massif (slide blocks and post-collapse lavas of the volcano which are nested within the amphitheatre); (3) the toreuas at the mouth of the amphitheatre; and (4) the debris-avalanche deposit itself. Basement rocks underlying the volcano also played a significant role in the collapse.
2.1. Basement
Palaeozoic and Mesozoic rocks outcrop west and north of Socompa in the north-trending Sierra de

G. Wadge et al. / Journal of Volcanology and Geothermal Research 66 (1995) 309-336 311
Fig. I. Landsat Thematic Mapper image of Socompa. This is a false-colour composite of bands 7, 4 and 2 from Landsat scene 50378-14014. Blue tones on the summits of volcanoes are snow; red tones on avalanche deposit and within amphitheatre are oxidised dacites; brown and dark grey tones within avalanche deposit are other varieties of fresh dacite; light grey tones are ignimbrites and gravels from sub volcanic basement. White tones on the northea~t flank of Socompa indicate a plinian pumice fall deposit. The image is about 45 km across; see Fig. 2 for an interpretation of the geology of this scene.
Almeida range which is abutted by the debris-avalanche deposit. East of the avalanche deposit, Cenozoic volcanic and sedimentary rocks are exposed, notably the Mio-Pliocene Quebrada Salin Beds (Ramirez, 1988, 1992) which consist of gravels, pyroclastic flow deposits and lava flows at least 250 m thick (at Quebrada Salin; Q, Fig. 2). Towards the top of this sequence, ignimbrite sheets (including the Arenoso
and Tucucaro ignimbrites) of Pliocene age are found, 15 km west of Socompa (A; Fig. 2). The Quebrada Salin Beds are exposed at several places around Socompa itself including the Flexura inlier within the debris-avalanche deposit (F; Fig. 7, Fig. 2) . These beds are assumed to be the uppermost basement to the volcano, although later Pliocene to Quaternary monogenetic lava flows and cones overlie the Quebrada Salin

312
+
+ +
+
+
Ailo del Inea
+
G. Wadge et al.! Journal of Volcanology and Geothermal Research 66 (1995) 309-336
}
Central Andes
Quaternary volcanic areas
Km
!':I:;::::H Post-Collapse deposits
f~:'«:<1 Debris avalanche deposit
.. Torevas/Amphitheatre blocks
c:=J Old Cone
LJ AliuviumlSalars
~ Pliocene-Ouaternary volcanics
~ Quebdrada Salin Beds
~ Paleozoic/Mesozoic rocks
N
r 10 I
Fig. 2. Geological setting of Socompa volcano. Exposures of Quebrada Salin Beds discussed in the text are indicated by: Q = Quebrada Salin, F = Flexura and A = Arenosa.
G. WadRe et al. / Journal of Volcanology and Geothermal Research 66 (1995) 309-336 313
LEGEND
Explosion crater
Pyroclastic flow deposits
Dacite lava flows
Domo del Nucleo debris avalanche deposit
Amphitheatre blocks
Torevas
Old Cone
Probable domes exposed in amphitheatre walls
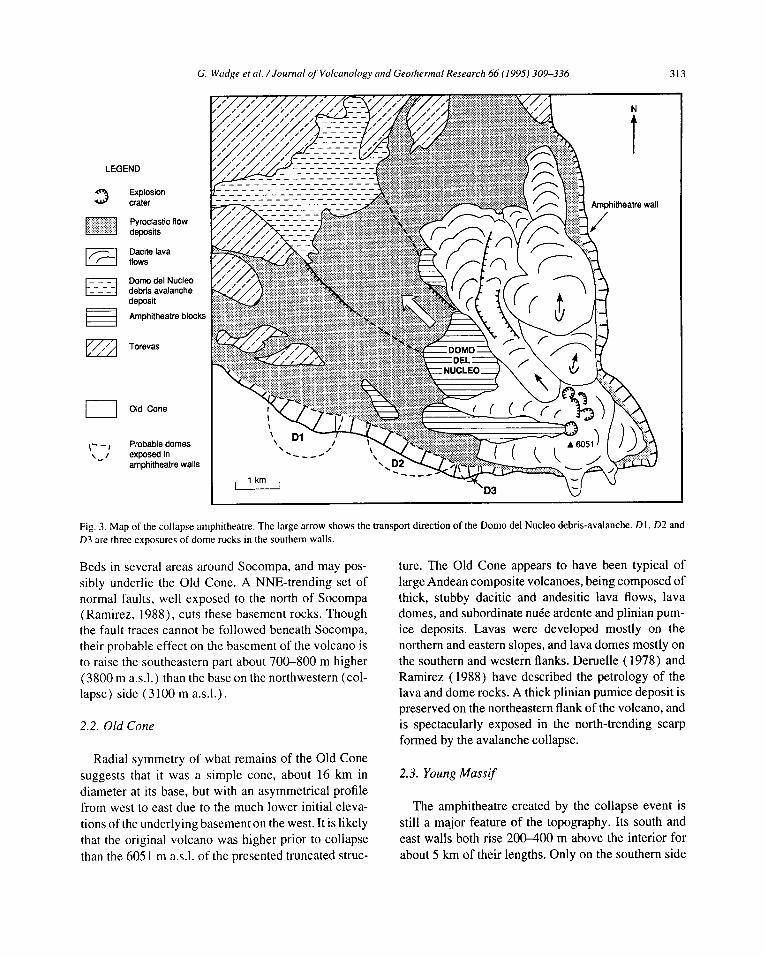
Fig. 3. Map of the collapse amphitheatre. The large arrow shows the transport direction of the Domo del Nuc1eo debris-avalanche. D 1. D2 and D3 are three exposures of dome rocks in the southern walls.
Beds in several areas around Socompa, and may possibly underlie the Old Cone. A NNE-trending set of normal faults, well exposed to the north of Socompa (Ramirez, 1988), cuts these basement rocks. Though the fault traces cannot be followed beneath Socompa, their probable effect on the basement of the volcano is to raise the southeastern part about 700-800 m higher (3800 m a.s.l.) than the base on the northwestern (collapse) side (3100 m a.s.l.) .
2.2. Old Cone
Radial symmetry of what remains of the Old Cone suggests that it was a simple cone, about 16 km in diameter at its base, but with an asymmetrical profile from west to east due to the much lower initial elevations of the underlying basement on the west. It is likely that the original volcano was higher prior to collapse than the 6051 m a.s.l. of the presented truncated struc-
ture. The Old Cone appears to have been typical of large Andean composite volcanoes, being composed of thick, stubby dacitic and andesitic lava flows, lava domes, and subordinate nuee ardente and plinian pumice deposits. Lavas were developed mostly on the northern and eastern slopes, and lava domes mostly on the southern and western flanks. Deruelle ( 1978) and Ramirez (1988) have described the petrology of the lava and dome rocks. A thick plinian pumice deposit is preserved on the northeastern flank of the volcano, and is spectacularly exposed in the north-trending scarp formed by the avalanche collapse.
2.3. Young Massif
The amphitheatre created by the collapse event is still a major feature of the topography. Its south and east walls both rise 200-400 m above the interior for about 5 km of their lengths. Only on the southern side

314 G. Wadge et al. / Journal o/Volcanology and Geothermal Research 66 (1995) 309-336
Fig. 4. Looking southeast towards the summit of Socompa. The light grey-coloured mass in centre is Domo del Nucleo, a large detached block. It is overlain by a post-collapse lava (dark grey; centre). A second displaced block, also overlain by lava is exposed at right. Talus slope of Domo del Nucleo is about 400 m high.
of the summit region have post-collapse lavas obliterated the top of the amphitheatre wall. The southern wall is about 9 km long, trends about 100° and is slightly concave to the north; the eastern wall is of similar length and trends about 170°. A separate embayment at the highest part of the amphitheatre extends the main collapse amphitheatre east of the present summit (Fig. 3).
The geology of the walls of the amphitheatre has not been studied in detail, but reconnaissance suggests that the interiors of one, and possibly three, dacite domes are exposed in the southern wall (Fig. 3). Other complete domes occur on the more southerly flank of the volcano (Fig. I). No domes are exposed in the eastern wall, but pyroxene-hornblende andesite lava flows covering the northeastern flanks are beheaded by the escarpment.
Within the collapse amphitheatre, the Young Massif is composed of several voluminous lava flows draped
over some large blocks detached from the collapse scarp (Fig. 4). Largest of these is a mass of oxidised dacite known as the Domo del NucJeo, with 500-mhigh reddish talus slopes prominent to the west. South of Domo del NucIeo is a west-trending gully exposing an apparently coherent sequence oflava flows dipping 36° to the south (Fig. 4). There are probably other major remnants of the pre-collapse volcano now totally buried within the amphitheatre, as is discussed later. Five younger dacite flows have been recognised overlying the slide blocks. Activity ended with the highest dome from which several short coulee flows overspilled the amphitheatre scarp to the south, and also extended over a large slumped block on the west, sending a talus of boulders down to the foot of the massif. On the rounded top of this dome is a summit explosion crater at an elevation of 5850 m a.s.l., and four other small craters on its northeast side between 5600 and

G. Wadge et al. I Journal of Volcanology and Geothermal Research 66 (1995) 309-336 315
Fig. 5. Vertical air photograph of largest (4000 m a.s.l. unit) toreva block in mouth of amphitheatre. At top left is primary avalanche deposit showing lineated and chevron textures. Pale-toned deposit near left margin is Camp Amarillo, a post -collapse pyroclastic deposit. At centrebottom toreva blocks are overlain by a secondary avalanche whose flow front is about 40 m high. Scale bar = I km.
5800 m a.s.l.. These craters represent the sites of the most recent eruptive activity on Socompa. Although the time scales are different, events at Socompa resemble those at Mount St. Helens in that collapse was followed by pyroclastic eruptions and extrusion of dacite lavas. At Mount St. Helens, a dacite dome was extruded through the floor of the amphitheatre, which contained only a relatively thin layer of avalanche debris, whereas at Socompa the amphitheatre was partly filled with collapse blocks.
After the collapse event, the walls of the amphitheatre and the slumped blocks detached from it formed cliffs perhaps as much as 2000 m high. These were unstable, and secondary collapse events took place. The youngest of these collapses affected the Domo del Nucleo. An avalanche which detached from the front
of the dome descended about 800 m vertically, and travelled about 6 km horizontally, creating a avalanche deposit covering some 12 km2 of the floor of the amphitheatre, with a prominent lobed flow front some 40 m high. The age of this deposit is not known but it is later than the toreuas and earlier than some of the pyroclastic deposits of the Campo Amarillo. This debris-avalanche deposit would in itself be noteworthy were it not dwarfed by the scale of the main deposit.
2.4. The Toreva Blocks
One of the most distinctive features of Socompa is the presence of gigantic blocks of the volcano that slid towards the mouth of the amphitheatre during the collapse event. These toreua blocks are probably the best

316 G. Wadge et al. / Journal o/Volcanology and Geothermal Research 66 (1995) 309-336
km Flexura ~~ 0 2 3
% N
1 i
4000~D'
a.~.I. ~ --'-'_':'_.-':'--
3000
~ 4000 m unit (Bloque Grande)
D 3800 m unit 4~OIOL~C' a.s .. r 3000
:i< .. 3700 m unit
~~ 4000~B'
m "", .. ," ooooo0;:'a.. ;:~~ .. '_.c~_~-Q_Q.~_~~
III 3550 m unit
0 Pumice covered units ..
CJ Minor units
4000~A ... A' .:.; .... : ... m .... '" .",. ",
a.s.1. ..,
3000
! EscarpmenlS ,
Inferred \ - toreva
[- boundaries Cross sections
Fig. 6. Map and cross sections of the torevas. The inset map shows their general location.
developed examples of this landform (Reiche, 1937) in the world, They form an almost complete barrier between the amphitheatre and the other debris-avalanche deposits between altitudes of 3500 and 4000 m a.s.!, (Figs, 5, 6), Most of the torevas are concentrated in the northern mouth of the amphitheatre, Though fewer are exposed in the west, their summit levels there are the same as the highest in the north ( 4000 m a.s.!,).
In the central, northwest-facing part of the amphitheatre the toreuas have an imbricate structure with prominent northwest-facing scarps (trending between about 030° and 045°) isolating roughly planar, backtilted surfaces at approximate levels of 3550, 3700, 3800 and 4000 m a,s.! .. In the central torevas, the original stratigraphy of the Old Cone is strikingly preserved, At their base are mudflow and pyroclastic deposits from the basement sequence underlying the volcano, Overlying these are andesitic lava flows and pyroclastic flows of the volcano itself, Remotely sensed
data do not suggest that the toreuas contain identifiable remnants of domes, but field mapping is needed to verify this, The stratigraphic sequence is generally tilted back towards the amphitheatre.
The northeastern end of the 4000 m a.s.1. unit (Fig, 6) has the appearance of a cliffed plateau measuring 3 X 1.5 X 0.4 km and disrupted by numerous cross-cutting escarpments, Despite this disruption it retains the impression of a single coherent block of the volcano's former northern flank, The truncated remnant of an unburied lava flow is discernible on its surface, as is a pumice deposit. Immediately to the east (east of C' in Fig, 6), a different toreva abuts the eastern amphitheatre wall. It is distinct from the other tore vas in having a thicker mantle of pumice. This mantle of pumice also covers much of the eastern flank of the volcano and probably represents a plinian eruption that was one of the last major eruptive events prior to the collapse,

G. Wadge et al. / Journal of Volcanology and Geothermal Research 66 (1995) 309-336 317
N
1
o km 10
~ ~ ~ ~
~ t:::::::::t
[2] th::f;:;j ~
EC2
EC1
Mo5
Mo4
Mo3
Mo2
Mo1
} EICenizal Unit
Monturaqui Unit
.. Torevas/AmphRheatre blocks
II::!:!~'::III Post-collapse deposRs
•
Fig. 7. Map of the Monturaqui and EI Cenizal Units of the debris-avalanche deposit and their subunits. Nomenclature of units follows Ramirez (1988, 1992), but their sequence in the legend does not have stratigraphic significance. The boundaries have been modified, mainly in the distal region, from those of Ramirez ( 1988). The bold ticked line represents the escarpment created by secondary flow movement to the east. The bold dashed line marks the approximate boundary between the areas ofM04 rich in spectral endmember F to the north, and areas rich in spectral endmember D to the south. The northwestern most part of Mo I constitutes the marginal levee of the deposit, typically 40 m high (Fig. I, Fig. 8). The dotted line is the approximate position of the break of slope in the basement (down to the northwest).
There is no evidence of avalanche material overlying the toreuas, except for the Domo del Nucleo deposit which is younger than the main collapse event. Thus, the toreuas moved into place after detachment of the main debris-avalanche. The preponderance of toreuas
on the northern side of the amphitheatre together with the lack of evidence for dome material within them suggests that most of the toreuas slid from a position high on the northern, rather than western flanks of the volcano.

318 G. Wadge et al. / Journal of Volcanology and Geothermal Research 66 (1995) 309-336
Fig. 8. Oblique view looking north, showing western margin of the debris-avalanche deposit. Marginal levee overlies sandy desert in foreground and hills of crystalline basement in middle distance. Antofagasta to Salta railroad winds along margin. The levee itself is a lineated flat surface, but secondary flow towards right formed an irregular surface and an interior scarp, visible in centre foreground.
2.5. The debris-avalanche deposit
The Socompa debris-avalanche deposit, known as the Negros de Aras deposit before its origin was determined (Bruggen, 1942; Deruelle, 1978), occupies the Monturaqui-EI Cenizal valley, extending between the Sierra de Almeida in the west and the Lorna del Inca hills in the east. The straight line distance from the summit of the volcano to the most distant point on the marginal levee is 35 km, although the avalanche travelled a maximum curvilinear distance of about 40 km. Maximum width of the deposit is 20 km and maximum thickness in medial areas is about 90 m. Total area covered by the avalanche deposit, beyond the limits of the original cone, is about 490 km2
• On its northern and western sides, the deposit is bounded by prominent, steep-sided levees exceeding 40 m in thickness even at
the most distal point. On its eastern side, the deposit is bounded by much less prominent levees, perhaps reflecting differences in material properties. On remotely sensed images, a prominent scarp extends northeastwards across the central part of the deposit. This scarp is up to 50 m high in places, decreasing southwestwards, and is highlighted on images by lighttoned gypsiferous playa lake deposits ponded against the scarp on the lower, southeastern side. The material now northwest of the scarp was initially propelled northwestwards over topography sloping eastwards, and was subsequently deflected downslope, partly overriding deposits now exposed southeast of the scarp (Francis and Self, 1987). This interpretation is supported by surface structures southeast of the scarp, where the deposit is characterised by linear, northwesttrending streams of debris which are truncated at the

G. Wadge et al. / Journal of Volcanology and Geothermal Research 66 (1995) 309-336 319
scarp. Northwest of the scarp, the deposit is noticeably disorganised. We interpret the scarp simply as the result of later parts of the avalanche overriding earlier deposited material.
Two distinct units have been recognised within the deposit on the basis of their distribution, lithology and topography: the Monturaqui Unit and the EI Cenizal Unit (Ramirez, 1988) (Fig. 7).
Monturaqui Unit The Monturaqui Unit forms most of the avalanche
deposit (Fig. 7). Southeast of the scarp it consists of a vast apron of elongated debris ridges with intervening depressions, and finer-scale ( - 10 m) topography of mounds and small enclosed depressions. Northwest of the scarp, the Unit is generally similar, but shows less well-defined linear debris streams and from the ground appears as a chaotic expanse of boulder-strewn mounds. 'Hummock' and 'inter-hummock' depressions characteristic of other debris-avalanche deposits (Siebert, 1984) are absent (Fig. 8). Measured individual boulders range up to 25 m. Unvisited boulders (discernible on air photos) are probably larger.
At least five different subunits can be recognised within the Monturaqui Unit, based on their spectral, lithological and textural properties (Ramirez, 1988, 1992). We retain his nomenclature here, although the implied order of his units differs from our interpretation of the sequence of events. Although extensive shearing and some mixing have taken place, each subunit retains speci fic characteristics that suggest an origin on distinct parts of the original cone.
Monturaqui 1 (Mol) Best displayed in the pale-toned marginal levees in
the north and west of the deposit, this unit consists predominantly of gravels and ignimbrites typical of the Quebrada Salin beds and Arenoso ignimbrite in the basement underlying the volcano. Lithological banding within the deposit suggests the original stratigraphic relationships are preserved, despite disaggregation and shearing. Some metre-sized blocks of gypsumcemented gravels retain original sedimentary structures. Most of the clasts within the gravels are themselves andesitic and dacitic lavas. The levees display closely-spaced northwest-trending lineations and small strike-slip displacements, which we interpret as expressing the emplacement direction.
Monturaqui 2 (Mo2) Exposures of this subunit are found mainly north
west of the scarp. Boulders are composed of dacite lavas showing various degrees of weathering and oxidation giving hues ranging from black to red. Surface topographic relief is greater (about 10 m) and more irregular in this unit than others, perhaps reflecting greater mechanical strength of the materials, but still does not approach the scale of many such deposits, where individual hummocks are often tens of metres high (Siebert, 1984). South of the scarp, boulder 'streets' and chevron patterns with northwest oriented axes, are also developed on the surface (Fig. 5), probably resulting from differential shear processes within the moving avalanche.
Monturaqui 3 (Mo3) This subunit forms a narrow but conspicuous debris
stream within the proximal region, broadening beyond the scarp. Fresh, glassy black dacite blocks showing breadcrust and prismatic jointing several metres in diameter suggests travel while hot and plastic (prismatic jointed blocks are notably fragile and would have disintegrated during transport). These indicate magma was present in the volcano at the moment of collapse. Because the new magmatic material is apparently confined to a single, narrow debris stream, this may indicate that it was derived from a lava flow being erupted on the surface of the volcano, rather than from a 'cryptodome' intruded within the volcanic edifice, as at Mount St. Helens. In the latter case, blocks of dacite from the cryptodome were widespread within the avalanche deposit. However, it is possible that the apparent narrowness of this debris stream may be due to the later cover ofM04 and M05.
Monturaqui 4 (Mo4) This extensive subunit occupies much of the south
ern part of the deposits. Huge blocks ( > 10m) of red oxidised dacite lavas cover much of the surface and give the subunit its characteristic appearance, both on the ground and in enhanced form on remotely sensed images. These blocks are composed of biotite-amphibole dacite lavas, conspicuous for the presence of plagioclase phenocrysts up to 2 cm in diameter. Many blocks appear oxidised throughout, suggesting that oxidation was primary and not due to weathering. Local autobrecciated blocks suggest that the dacites were
320 G. Wadge et al. / Journal o/Volcanology and Geothermal Research 66 (1995) 309-336
derived from lavas erupted on the flanks of the Old Cone. Highly sheared dacitic ignimbrites are also widely distributed within this subunit. The red dacite boulders typically overly the ignimbrites, which protrude through the lava blocks as white pinnacles and spires. This relationship may reflect original stratigraphy, but may also represent mechanical segregation between the dense, strong dacite boulders and the weak, incoherent ignimbrites during emplacement.
Monturaqui 5 (Mo5) Distinctive pale grey dacite lavas form a minor but
distinct subunit in the southern part of the deposit, apparently underlying the rocks of M04. The rocks of this subunit are petrographically similar to a pre-collapse lava dome exposed in the southern wall of the amphitheatre (Fig. 3), and may have been derived from a similar setting.
EI Cenizal Unit The EI Cenizal Unit lies to the east of the Monturaqui
Unit and contains two subunits. It appears to have initially travelled north and north-northeastwards, obliquely to the movement direction of the Monturaqui Unit.
EI Cenizall (EC1) This consists of disintegrated andesitic lavas pro
ducing a very rugged terrain for much of its length, covered proximally with thick, plinian pumice. It flowed noth-northeastwards from the amphitheatre where it is associated with the large pumice covered toreva (Figs. 5, 6).
EI Cenizal2 (EC2) Similar in terms of texture and spectral propertie~ to
Monturaqui 1, this subunit comprises most of the El Cenizal Unit. It is thinner than Mol, such that inliers of the underlying surface show through in one or two places, for example, where older lavas were partially buried. Massive boulders are scarce. Its thinness and lack of high, steep flow boundaries (levees) suggests a lower yield strength than the Monturaqui Unit. Low strength could reflect entrapped water, but there is no evidence of involvement of water in the form of secondary mudflows. The subunit appears to consist of sediments and gravels from basement underlying the volcano. Bedded lake deposits, diatomite, carbonate
and gypsiferous sediments and gravels have all been found. These sedimentary facies indicate that the Quebrada Salin Beds beneath the Old Cone contained playa lake deposits as well as volcaniclastic gravels and ignimbrites.
3. Spectral analysis of the debris-avalanche deposit
3.1. Spectral mixture maps
Landsat Thematic Mapper image data (Fig. 1) contain information on spectral reflectance in seven broadbandpass channels. The subunits recognised by Ramirez (1988) as modified here (Mol-5, ECI-2; Fig. 7) are spectrally distinct areas of the debris-avalanche deposit which probably correspond to rock units that formed the northwest flank of the volcano. Field observations reveal that each subunit is itself composed of a mixture of different coloured rock lithologies which is heterogeneous at many scales. This mixture is averaged by the 30 m x 30 m field of view of the Landsat Thematic Mapper sensor to yield composite spectral signatures. To clarify the distribution of materials within the deposit, we have identified the spectrally distinct lithological components and have investigated how these components may be mixed in varying proportions to match the spectral signals received by the Thematic Mapper sensor. In this way we have created maps of the proportional distribution of each of the spectral components over the whole deposit.
There are several ways to perform this analysis ( e.g., Johnson et aI., 1985; Adams et aI., 1986; Mustard and Pieters, 1987). We chose our spectral components or end-members by selection of image pixels most likely to be 'pure' representatives, based on visual inspection of enhanced Thematic Mapper images supported by comparison with laboratory reflectance spectra of field samples (A. Pontual, pers. commun., 1990). More rigorous methods of end-member selection were not considered appropriate without a more thorough study using additional field sampling and laboratory reflectance spectral measurements. The 'unmixing' analysis of image data was performed by least squares techniques, assuming linear mixing of the previously defined end-members, with components constrained to sum to 100% (Settle and Drake, 1993).

G. Wadge et al. / Journal of Volcanology and Geothermal Research 66 (1995) 309-336 321
3.2. Spectral end-members
Figure 9 summarises the reflectance properties of the spectral end-members that were extracted directly from the Thematic Mapper imagery. Although band 6 (the thermal infrared part of the spectrum) samples the scene at much coarser spatial resolution (120 m square) than the other channels (30 m square) it has been incorporated in the analysis because it contains considerable discriminatory information. End-members A-E correspond to rock types known from field work (Table I) and extracted from subunits where they form the major component. During the course of early attempts at unmixing analysis it was discovered that an additional end-member, F, was required to yield satisfactory residual errors. F is an important component, together with end-member D, of the distal parts of subunit M04, but its field composition is unknown.
180 1 2 3 4
TM BANDS
160
140
120
......... /
100
ON
80
Subtle spectral differences between Band C are the result of a greater degree of oxidation of dacite in B. End-member E is considerably more reflective in Thematic Mapper bands 1, 2 and 3 than Band C. The visibly brightest end-member, A, is also distinguished from E in having a high response in band 5. Endmembers D and F are distinct from the others in having relatively low values in bands 1 and 2 as a result of absorption by ferrous iron. The reason for the lower values of band 6 (thermal infrared) of F relative to D is unknown.
3.3. Spatial distribution
Unmixing analysis using the spectral end-members defined above yields maps of the proportions of each end-member in each pixel of the scene (Fig. 10). From these maps the areas covered by each rock type within
5 7
......
6
/.. /~' .
. " II
./ //>
. 1// I "/ . ,l:
.I I j/ I .. '
/' 1// I :
/ I." ./ Il
I I " . 1/:
60
'// _-------- ............... E I:,' _---- " Ih
40
C ,...... I" _ .. _ .. _--.. .."'.. ...... ...... , / :0" "-"-"-"-" ______ -- B ...................... ............ /,: ------------ -...... . ............ --------- -----------~~~:-.-- ./
20
}-1m Thermal
Fig. 9. The image values (DN) of the spectral endmembers used in the un mixing analysis of the debris-avalanche deposit of the Landsat Thematic Mapper image (Fig. 10). The average digital number of each of the end members was calculated from small numbers of pixels thought to represent 'pure' lithological types and extracted from the image data. These numbers are plotted against the wavelengths (microns) of the mid-points of the relevant Thematic Mapper bandpasses. Note the break of scale between bands 7 and 6.

322 G. Wadge et al. / Journal of Volcanology and Geothermal Research 66 (1995) 309-336
Table I Areal proportions of image end-members for each subunit of debris avalanche deposit
Subunit End-member Proportions (% of Subunit Area) [Rock Type(s)]
A B C [ Ignimbrite/Gravel] [Weakly Oxidised [Black Dacite]
Dacite]
Mol 63 4 II Mo2 15 28 26 Mo3 27 7 48 M04 20 II 14 Mo5 27 7 8 ECI 45 16 3 EC2 52 7 7 All Subunits 35 II 18
each subunit have been calculated (Table 1). Endmember A, corresponding to basement ignimbrites and gravels, comprising 35% of the area, is the dominant spectral component of the surface of the debris-avalanche deposit, and is thus about twice as abundant as of the next most common component. Table 1 and Fig. 10 summarise the relationships between the spectral components and the seven subunits mapped previously. As Table 1 shows, all the subunits contain some proportion of the 6 end-members.
End-member A is present in significant amounts in all subunits, but is particularly plentiful in Mol, EC1 and EC2. End-members B, C, D and E dominate the subunits from which they were extracted (M02, M03, M04 and M05) . Mo 1 is the least 'mixed' of the mapped subunits. The equivalent El Cenizal subunit, EC2, is distinguished from Mo 1 in having a higher contribution from end-member E. Subunits M03 and M05 are also both largely mixtures of A together with C and E respectively. In contrast, M02, M04 and EC2 are much more heterogeneous. M02 and EC2 appear to consist of mixtures of four major components and M04 of five major components.
The errors shown in Table 1 (not shown in image form in Fig. 10) refer to the statistical residual of the least squares fits for each pixel, aggregated in this case for the image areas corresponding to the map subunits. If there is noise in the data, or unknown spectral endmembers not used in the analysis, they will contribute to these errors. Some, but not all, of the residual errors can be correlated with small areas of evaporite deposition in hollows. Very small amounts of dry vegetation
D E F Error [Strongly Oxidised [Pale Grey Dacite] [Oxidised Dacite] Dacite]
3 II 6 2 16 6 7 2 6 6 3 3
28 6 19 2 4 48 5 2 4 14 16 2 2 22 8 2 9 16 9 2
may also contribute. The data in Table 1 are for large areas and hide heterogeneity on different scales. Patches of A appear to be 'windows' of up to kilometre scale of subunit Mo 1 exposed within M04 (e.g. around the northwestern M05 exposure). Within the distal areas of M02 and M04 there appear to be complex mixtures of end-members A, B, C and D at scales from several 100 m to less than 30 m (subpixel). Although local relief over the debris-avalanche deposit is never greater than a few tens of metres there is some shadowing in the Thematic Mapper image of the deposit. This is particularly noticeable over subunit EC2 and may be partly responsible for the intimate mixing of end-members A and E predicted by the model. Overall, errors due to shadowing are probably insignificant.
The distribution of endmember B in figure 10 suggests that that the subunit mapping (Fig. 7) of the northern, distal part of subunit M03 may be incorrect, and that it should be assigned to Mo2.
Thus, the spectral unmixing analysis of the Thematic Mapper image shows that:
( 1) The surface of the deposit can be described spectrally in terms of six end-members, of which A (ignimbrite/gravel derived from the basement) is the most important in terms of its total amount (35%) and its dispersion (significant amounts found in all parts of the deposit).
(2) The other spectral components are varieties of dacite lava whose differences reflect the degree of oxidation of the groundmass and, to a lesser extent, phenocryst content.

G. Wadge et al. I JOllrnal of Volcanology and Geothermal Research 66 (1995) 309-336 323
Fig. 10. Image maps of the proportions of each of 6 spectral end members (A-F) created by linear unmixing analysis of a Landsat Thematic Mapper scene. Pixels with 100% of a particular endmember are white and 0% is represented by black with a linear grey scale between. The approximate outlines of the debris-avalanche deposit from Fig. 7 are superimposed.

324 G. Wadge et al. / Journal of Volcanology and Geothermal Research 66 (1995) 309-336
5
Fig. II. The apparent emplacement areas of the subunits of the debris-avalanche deposit, after removal of areas of overlap (present in panel 8). The Monturaqui Unit sequence ( 1-5) implies a chronology of emplacement events whose validity is discussed in the text; the chronological relationships between the Monturaqui sequence and the EI Cenizal sequence (6-7) is unclear.
Table 2 Estimated areas of emplacement units of the debris-avalanche deposit and theoretical areas covered by end-member components
Subunit Deposit Area Theoretical End-member Component Area (km2
) (km2)
A B C D E F Mol 226 142 9 25 7 25 14 Mo2 141 21 39 37 23 8 10 Mo3 62 17 4 30 4 4 2 M04 III 22 12 16 31 7 21 Mo5 31 8 2 2 15 2 ECI 16 7 3 1 1 2 3 EC2 155 81 11 11 3 34 12
Totals 298 80 122 70 95 64 % 41 11 17 9 13 9

G. Wadge et al. / Journal o/Volcanology and Geothermal Research 66 (1995) 309-336 325
( 3) Comparison of the spectral mixture maps with the photo-interpreted deposit subunits shows that subunits M03 and M05 are essentially mixtures of C (black dacite), E (pale grey dacite) and basement rocks. M02 and M04, in contrast, are much more heterogeneous and consist of mixtures at the scale of 100' s-l 0' s of metres of B (weakly oxidised dacite), C (black dacite), D (strongly oxidised dacite) and F (oxidised dacite) together with A (basement rocks).
(4) In subunit M04 the dominant spectral component in the proximal terrain (D) is distinct from that in the distal terrain (F). The northern, distal lobe of subunit M03 appears spectrally to belong to M02.
3.4. Spatial and temporal distribution of debrisavalanche deposit subunits
We have interpreted mutual relationships of the subunits of the debris-avalanche deposit using photointerpretation techniques, including criteria such as crosscutting relationships in linearly-textured terrain and apparent inliers (e.g., M05 within M04). These relationships suggest the sequential chronology for the Monturaqui Unit outlined in Fig. 11 (Mol - M02 -M03 - M05 - M04 ). The EC 1 subunit of the El Cenizal Unit was emplaced after the EC2 subunit. The relationship of the similar Mo I and EC2 subunits is less clear. In the distal region where the two are juxtaposed, EC2 appears to overlie Mol, but this relationship could be a result of secondary movement. Their overall similarity leads us to suppose that the emplacement of Mol and EC2 was approximately contemporaneous. Subsequent sub-units of the Monturaqui Unit (M02-M05) appear to overlie EC2. These interpretations implicitly assume that the subunits of the avalanche deposit represent separate emplacement units; an assumption we discuss explicitly later. From the outlines of Fig. 11 the approximate areas of the emplacement units can be calculated (Table 2). Combining these values with the end-member proportions of Table 1 allows the areas of the different rock types making up the emplacement units to be calculated (Table 2). According to this estimate, end-member A (ignimbrite/gravels) from the volcano basement comprises 41 % of the area of the deposit.
4. The collapse event
4.1. Surface models
We now explore the volumetric budget of the collapse event, using digital models of the surfaces of the components involved together with geological constraints that can be inferred from fieldwork.
Digital elevation models (DEMs) are representations of topography as a grid of elevations or height values stored as a computer array. As the basis for the work described in this section, a DEM of the area around Socompa was created from a I :50,000 scale topographic map which had a contour interval of 50 m. These contours were digitised and spot heights, drainage, ridge and cliff lines were used as additional control on the subsequent surface generation process. This process was based on the Delauney triangulation technique (McCulloch, 1988), which enabled a grid with a horizontal interval of 50 m to be created from the triangulated surface. The initial precision of this DEM was 16 bit. An 8-bit version was also created with a vertical interval of 13 m for the full range of elevations in the area (2900-6050 m a.s.l.). This model precision is sufficient to represent the topography of the volcano at the accuracy required for budget calculations, but it is insufficient to represent accurately the detailed morphology of the surface of the debris-avalanche deposit.
4.2. AmphitheatrefToreva DEMs
Other DEMs were created by editing the vector data representing the original analogue topographic map to represent of the volcano's shape before, during and after the collapse event. The following models were created: PRE: The volcano immediately prior to collapse. DETACH: A model with all the material above the detachment plane of the collapse removed. POSTl: As for DETACH but with the torevas added. POST2: As for POSTl but with the upper amphitheatre
blocks added. NOW: The present-day surface.
Four models are shown in Fig. 12. Geological evidence and lines of reasoning used to constrain these models are as follows.
Socompa is an approximately axisymmetrical volcano. In recreating the old surface above the amphithe-
326 G. Wadge et al. / Journal oj Volcanology and Geothermal Research 66 (1995) 309-336
b
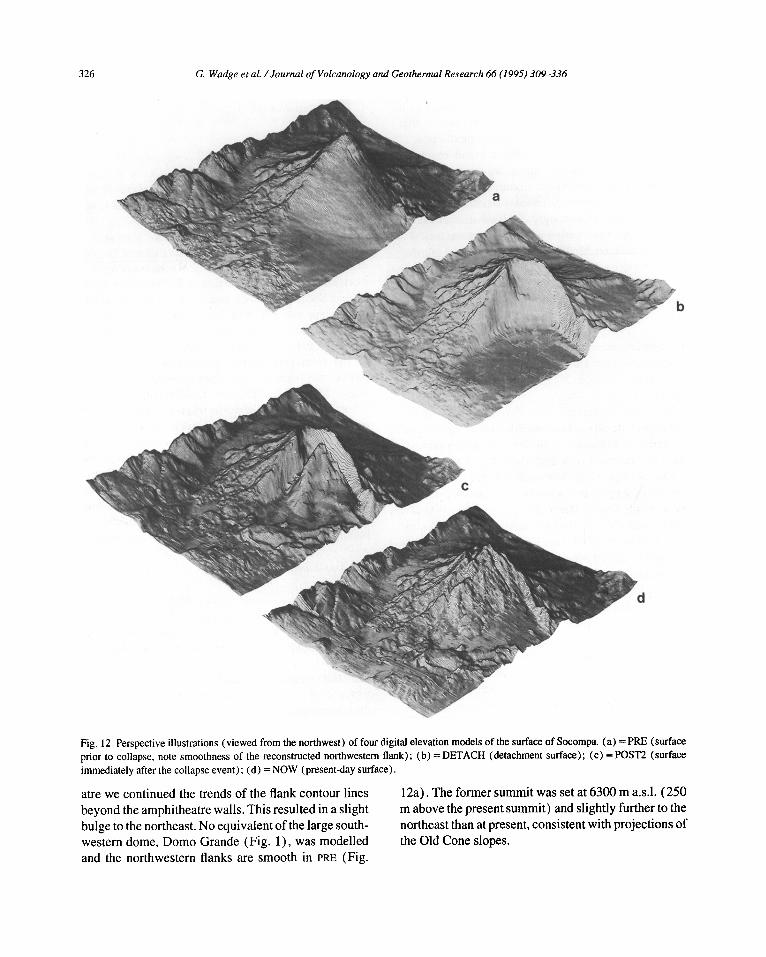
Fig. 12. Perspective illustrations (viewed from the northwest) of four digital elevation models of the surface of Socompa. (a) = PRE (surface prior to collapse, note smoothness of the reconstructed northwestern flank); (b) = DETACH (detachment surface); (c) =POST2 (surface immediately after the collapse event); (d) = NOW (present-day surface).
atre we continued the trends of the flank contour lines beyond the amphitheatre walls. This resulted in a slight bulge to the northeast. No equivalent of the large southwestern dome, Domo Grande (Fig. 1), was modelled and the northwestern flanks are smooth in PRE (Fig.
12a). The former summit was set at 6300 m a.s.l. (250 m above the present summit) and slightly further to the northeast than at present, consistent with projections of the Old Cone slopes.

G. Wadge et al. / lournal of Volcanology and Geothermal Research 66 (1995) 309-336 327
In creating DETACH we assumed that there was a single detachment surface above which material within the amphitheatre was displaced during the collapse event. This surface is exposed at the amphitheatre walls but its base is not seen. To model its shape at depth we assumed a near horizontal surface dipping gently to the northeast, based on the observations of the detachment surface at Mount St. Helens (Voight et aI., 1983) and other major volcanic collapse amphitheatres (Siebert, 1984). The lowest altitude at the front of the torevas is about 3450 m a.s.1.. The lowest altitude behind the torevas is 3589 m a.s.1. near points C'/D' on Fig. 6. These two altitudes represent the maximum possible values for the height of the detachment surface at these places. We have placed the lowest altitude of the detachment where it intersects the former surface at 3375 m a.s.l.. The surface rises at a gradient of 0.0125 to an altitude of about 3500 m a.s.1. close to the present amphitheatre walls where it becomes near vertical (Fig. 12b) .
To estimate the volume of the torevas, POST! was created with the toreva massif in its present-day position superimposed on top of DETACH. A minor inaccuracy in this model involves the inclusion of the volume of the younger avalanche deposit that overrides the torevas from the Domo del Nucleo. The volume of this is small (a few tenths of a cubic kilometre).
Some material which took part in the collapse remained within the upper amphitheatre as discussed earlier. Much of this material has been buried by subsequent volcanic deposits. In POST2 we modelled the upper surface of this upper amphitheatre material as it would have been immediately after the collapse. As starting points for this surface, we took the exposed surfaces of the Domo del Nucleo and the southern wall of the summit gulIy which reach as high as 5500 m a.s.1. (Fig. 4). Four kilometres west of the Domo del Nucleo is another exposed block of older rocks now largely buried by pyroclastic flows. The highest point of this block (4064 m a.s.l.) suggests it might be considered as part of the torevas, but it is separated from them and is here included as part of the upper amphitheatre. It is not clear what underlies the major lava flows of the northern part of the Young Massif (Figs. 3, 4). We assumed between 100 and 300 m thickness of colIapse material I ying above the detachment surface to create the POST2 surface (Fig. 12c).
4.3. Debris-avalanche deposit DEM
The topography of the surface over which the avalanche flowed is not accurately known. However, severallines of evidence alI ow us to estimate the thickness of the deposit. Firstly, there is evidence of the underlying topography beneath Ee2 in the southeastern part of the deposit, west of Lorna del Inca (Fig. 2). There are some major kipukas or inIiers of older rocks in this region, including the Flexura locality (Fig. 3). On imagery, the outlines of a large, lobate lava flow can be recognised beneath its cover of debris northwest of Flexura (Fig. I). Also, the topography reveals the probable northwestern course of a major drainage, the Quebrada Salin. We interpret this evidence to indicate that the easternmost region covered by the deposit had the greatest relief and sloped steeply to the northwest. At two other locations buried topographic features are still evident. Southwest (near Monturaqui), the distal lobes of the Pliocene Aguas Delgadas lava flows are overrun by the avalanche deposit. In the west, the Palaeozoic rocks of the Alto del Inca abut the deposit, and the topography of the deposit surface here suggests buried relief. Apparently elsewhere, the pre-colIapse topography was relatively smooth, consisting largely of gravels, sands, playa deposits and only minor drainage channels, typical of much of the Atacama desert.
Direct evidence of deposit thickness comes from two sources, measurement of thicknesses at deposit margins and boreholes drilIed in search of water (Ramirez, 1988). Figure 13 shows the locations of these measurements. At the margins, the deposit has a thickness typicalIy in the range 20-60 m. Values lower than this occur in the southwest near Monturaqui and in the southeast, south of the Negrillar lava fields, where thicknesses faIl to less than 10m. The greatest margin thickness (40-60 m) occurs in the northwest and north where the distal levee is developed. The greatest measured thickness (90 m) came from the borehole in the central proximal part of the deposit. The deposit thicknesses south of the median escarpment on the eastern side of the field show modest thicknesses (8-24 m), decreasing toward the margins. To the north of the escarpment the deposit thickens to 60 m.
These data enabled an approximate isopach map of deposit thicknesses to be made (Fig. 14). From that a DEM (DEPOSIT in Table 3) was constructed based on the folIowing assumptions:

328 G. Wadge ef al. / Journal of Volcanology and Geothermal Research 66 (1995) 309-336
N
I o km 5
20
Borehole measured thickness (m) of the Campo Amarillo pumice deposit
Borehole measured thickness (m) of the debris avalanche deposit
Estimated thickness (m) of the debris avalanche deposit
• Borehole
Fig. 13. Location map of borehole measurements of thickness of the debris-avalanche deposit and values estimated from the margins. Data from Ramirez (1988).
( I) The thickness of the central distal part of the deposit, about which we have little direct evidence is assumed to be about 60 m, consistent with the maximum measured thicknesses to the north and south.
(2) The greatest thickness in the central proximal part of the deposit is 95 m, similar to the largest measured value of 90 m.
(3) The southeastern part of the deposit is assumed to be thin ( < 30 m) except for a 50-m-thick marginal area, flanking the Lorna del Inca and corresponding to subunit Eel.
Subtracting this isopach map from the present-day topography shows that the inferred original surface has a broad (20 kIn wide), shallow (300 m deep) bowlshaped basin, whose axis trended northeast across the central portion of the deposit.
4.4. Volume and potential energy budgets
By performing subtraction operations on the DEMs for the amphitheatreltoreva region we can calculate the volumes of specific components of the collapse

G. Wadge et al. / Journal of Volcanology and Geothermal Research 66 (1995) 309-336 329
t I
Fig. 14. Isopach map of the debris-avalanche deposit based on the values in Fig. 13 and the assumptions discussed in the text.
(Table 3). For instance, POST] minus DETACH gives the volume of the tore vas. The result of the operation PRE minus POST2 gives the volume 'missing' from the amphitheatre and constrains the source volume of the debris flow avalanche. The DEM of the debris flow avalanche deposit itself was calculated independently
Table 3 Volume Budget of the Socompa Collapse Event
DEMModel Volume Centroid I
(km3) (x, y, z)
PRE-DETACH 53.7 421,691,90 POSTI-DETACH 11.5 364,616,45
of these amphitheatreltoreva DEMs. The debris-avalanche deposit has a volume of 25.7 km3, almost 30% greater than the deficit volume of the amphitheatre (19.2 km3
). This volume difference can be reasonably explained by dilation of the material during avalanching. By comparison, at Mount St. Helens in 1980 the equivalent estimated dilation was about 20% (Voight et al., 1983). A striking feature of the Socompa event compared with other volcano failures is that more than half of the detached material remained coherent, in the form of the tore vas and the upper amphitheatre blocks.
In addition to calculating volumes, the position of the centroids for those volumes were also calculated by a computer program following the algorithm of Rosenfeld and Kak (1976) (Table 3). This information allows the potential energies of these volumes to be estimated (Table 4). An energy budget shows that about 3.8 X 10¹⁷ J was released during the collapse. This is about five times the energy release of the 1980 Mount St. Helens collapse (0.7 X 10¹⁷ J; Voight et al., 1983). Partitioning this total energy into appropriate kinetic energy and momentum components is the key to quantitative modelling of the emplacement dynamics at Socompa.
4.5. Sources of the avalanche
Linear debris trains in the proximal, primary parts of subunits Mo2, Mo3, Mo4 and Mo5 (Figs. 1,5) indicate northwest vectors of transport out of the amphitheatre. This northwest-trending fabric can also be seen in the
Physical Meaning
Total volume of Collapse Event Volume of Torevas
POST2-POSTI 23.0 415,698,119 Volume of Upper Amphitheatre Blocks PRE-POST2 2 19.2 437,701,122 Parental Volume of Debris-Avalanche
Deposit NOW-POST2 14.8 441,698,113 Volume of Post -Collapse Infill DEPOSIT 25.7 Volume of Debris-Avalanche Deposit
I X and y coordinates are in units of SOm from an origin at 24° 03' 15" Sand 68° 29'45" W counted as east and south positive. The z coordinate is in units of 13m above a datum of 2900m a.s.l.. 2 The operation PRE-POST2 produces a positive component corresponding to material lost from the amphitheatre and a negative component corresponding to the volume of toreva blocks above the PRE surface. The volume quoted is the balance of the two. The centroid coordinates is of the "missing" amphitheatre volume.

330 G. Wadge et at. / Journal of Volcanology and Geothermal Research 66 (1995) 309-336
marginal levee of Mo 1, 35 km from the volcano, and suggests that this subunit was initially emplaced by linear transport to the northwest. There is evidence for the provenance of some of these emplacement units within the amphitheatre walls. The dominant spectral component ofM05 (E) can be matched with the dome D3 exposed in the western amphitheatre wall (Fig. 3). Similarly, the oxidised and highly oxidised dacite endmembers of M04 can be matched, though less specifically, with the exposed domes D 1 and D2 in the western wall. The location of M04, in the extreme southwest of the deposit would fit with the spectral evidence for a source region close to the western wall. There is no known evidence at present for the source rocks of spectral types A, Band C within the amphitheatre walls. Quebrada Salin Beds outcrop at an altitude of 3750 m a.s.l.just north of the amphitheatre's western wall near Q (Fig. 2). Type A rocks are presumed to have formed the bulk of the lower northwestern flank with a thin carapace of volcanic rocks comprising the source of subunits Mo 1 and EC2. The sources of M02 and M03 are presumed to lie higher to the southeast of this.
As noted previously, the northeasterly strike of the tore vas and their position on the northern side of the amphitheatre indicates that they must have slid from a position on the northern flank of the volcano. The pumice-covered tore vas (Fig. 3) are intimately associated with EC I, and both are thought to derive from a region high on the northern flank, abutting the northern amphitheatre wall where pumice-covered andesitic lava flows are truncated. Those blocks located within the upper
Table 4 Energy Budget of the Socompa Collapse
Component P.E. I P.E. Loss (J X 1017
)
Total Collapse 15.8 U. Amphitheatre 8.8
3.8 Torevas 2 1.7 1.0
Debris-Avalance 1.5 1.3
I Potential energy above a datum of 2900m a.s.l..
Fig. 15. Sketch map showing the probable source regions within the amphitheatre and transport vectors for the components of the debrisavalanche and torevas.
part of the amphitheatre have moved probably only a few hundred metres to a few kilometres from their source, in the highest, southeastern corner of the amphitheatre. Our interpretation of the possible relative spatial positions of the sources of the components of the avalanche is shown in Fig. 15.
4.6. Sequence of events
The trigger for the Socompa collapse is unknown. Gravitational loading due to dome building or volca-
L 3 c
(km)
7.0 1.6
16.8 3.3
L4 , (km)
9.0
35.0
0.14 [ 8.1°]
0.D78 [4.5")
[f) 6
0.18 [10°)
0.094 [5.4°)
2 Assumes a source region as in figure 15; maximum height=5000m a.s.l.; centroid height = 4500m a.s.l.. 3 He. Le = centroid vertical and horizontal distance differences 4 H" L, = vertical and horizontal distance differences from top of source to end of runout , Average apparent friction coefficient (. Fahrboschung angle (angle between a line connecting the top of the slide scarp and the distal toe of the deposit and the horizontal)

G. Wadge et at. / Journal of Volcanology and Geothermal Research 66 (1995) 309-336 331
nogenic or tectonic earthquakes may have played a role. Northeast-trending faults were suggested by Francis and Self (1987) to underlie the amphitheatre mouth region, but there is no direct evidence to link these with a triggering event. Evidence for an eruption accompanying collapse comes from a possible 'blast' deposit identified southwest of the avalanche deposit. Evidence for the existence of magma within the volcano also comes from the apparently plastic behaviour of blocks in the Mo3 subunit. However, the role of the volcanism in the collapse is uncertain. Absence of evidence for mudflows at the toe of the avalanche deposit suggests that relatively little water was present in the collapse mass. Its location in an arid part of the Central Andes means that the Socompa collapse inevitably took place under much drier conditions than those, for example, prevailing at Mount St. Helens and Mt. Shasta. However, there is no direct evidence bearing on the amount of water present in the volcanic sub-surface at the time of collapse.
It is likely that collapse at Socompa took place as a series of events. Once collapse had begun, we assume that retrogressive failures migrated southeastwards from the northwestern flank, and eventually incorporated the summit region itself, as at Mount St. Helens (Voight et aI., 1983). Downslope some of this mass disintegrated to form highly mobile debris avalanches that moved northwestwards over the desert surface, at about 3100 m a.s.l.. At the western margin of the deposit momentum carried the debris avalanches about 8-10 km upslope to an altitude of about 3400-3500 m a.s.l..
As previously noted, the Monturaqui Unit appears to have been emplaced in the sequence Mol, Mo2, Mo3, Mo5 and Mo4 and from sources located progressively southwards in the western part of the amphitheatre (Fig. 15). Lineations in the distal marginal levee of Mo I show that this subunit was moving northwestwards as it came to rest. However, inside the levee, Mo 1 material and the distal parts of the other subunits changed trajectory and moved eastwards. As a result of this eastward motion, an inner escarpment to the original Mol levee was formed and a northeast-trending escarpment created at the southeastern edge of this motion between simple, lineated proximal deposits and more complex, curvilinear patterns in the more distal
terrain.
Not all the failed masses disintegrated. After the debris avalanches had moved out of the amphitheatre, rotational landsliding transported gigantic coherent blocks 5 to 8 km to the mouth of the amphitheatre, where they now form the tore vas. One of these blocks, adjacent to the western wall of the amphitheatre, apparently did partially disintegrate to form a separate avalanche deposit, EC1, that moved a further 7 km to the north-northeast. The final events invol ved failure of the amphitheatre walls beyond the summit and onto the southern and eastern flanks. Unlike the tore vas, these last detached blocks did not travel far, probably because their internal planes of structural weakness (the original quaquaversal volcanic stratigraphy) dipped to the south and east. Failure of the upper amphitheatre blocks was by toppling (Hoek and Bray, 1981) rather than sliding.
S. Implications for emplacement dynamics
Socompa differs from other large debris-avalanche deposits in some respects, and examination of the possible causes of these differences may cast light on mechanisms leading to flank failure and the emplacement of debris avalanches. Key questions posed by the Socompa collapse are: Why do basement rocks comprise such a large proportion of the Socompa debrisavalanche deposit? What special conditions led to the formation of prominent torevas at Socompa? Do subunits of the debris-avalanche deposit represent separate events in terms of movement kinetics?
5.1. Basement contribution to the collapse event
The areal proportion of basement rock types exposed at the surface at present is 35% and the volumetric contribution is probably greater. The levees in the distal terrain of subunits Mo 1 and EC2, which have the highest proportion of basement component, are thick (35-60 m) and suggest that Mo 1 in particular is the thickest subunit of the whole deposit. Consideration of this factor would boost the volumetric proportion of basement materials and we speculate that this proportion may be as high as 60%. Taking 40-60% as the likely range of volumetric contribution of basement material gives

332 G. Wadge et al. / Journal o/Volcanology and Geothermal Research 66 (1995) 309-336
7.8-11.5 km3 for the volume of basement material prior to disintegration during collapse (Table 3) .
The upper surface of the basement rocks on the northwestern flank of Socompa can currently only be inferred from outcrops of the Quebrada Salin Beds to the northeast and southwest of the amphitheatre (Fig. 2), at an altitude of about 3700 m a.s.l., about 250 m above the modelled detachment surface (3400-3500 m a.s.l.). The basement surface was lower to the northwest. The area of the modelled detachment plane is about 80 km2
, suggesting an average thicknesses of 100 to 144 m to account for the volume of basement material involved in the collapse (Fig. 16).
Why did the detachment plane not occur at the basement/volcano interface? The most likely factor is the step in the basement surface on the northwestern flank of which the northeast-trending ridge from the mouth of the amphitheatre to the Lorna del Inca is an expression (Figs. 1, 7). The topographic loading stresses would have favoured a failure surface that became subhorizontal below the level of this step where ground slopes less than a few degrees are encountered (Yu and Coates, 1970). Furthermore, within the basement sedimentary sequence, paleo-phreatic surfaces may have provided possible slip surfaces.
5.2. Conditions for Toreva development
Gigantic toreuas are rare at other volcano collapse events but are known at submarine continental margins (e.g., Von Huene etal., 1989) and on Mars (Lucchitta, 1979). At Socompa, the toreuas represent blocks of the middle to upper northern flanks of the volcano that slid laterally for over 7 km and descended about 1 km in height. They deformed internally but remained essentially intact and must have travelled along the detachment plane of the earlier phase of the collapse. If the movement of the toreuas is treated as a problem of frictional sliding, the average apparent friction coefficient can be calculated as the quotient of the vertical (He) and horizontal (Le) distances moved by the centroids of mass: He/ Lc ( = tan j; where j is the kinetic angle of friction) (c.f. Pariseau and Voight, 1979). This value for the toreuas is about 0.14 U = 8.1°) (Table 4). A similar, slightly greater figure (0.18; Fahrboschung angle = 10°) is obtained from the runout geometry (Hsii, 1975). These values are considerably less than the static friction coefficient usually assumed
for rock surfaces of at least 0.6. Equivalent calculations by Voight et al. (1983) for the early (first 40 seconds) movement of the first slide failure at Mount St. Helens produced a friction coefficient of 0.09 U = 5°). This lower value reflects the fact that the Mount St. Helens block was disintegrating into a debris-avalanche, a process that did not occur for the Socompa toreuas over a similar transport distance. The most likely process involved is freely moving particle-particle interaction at the base of the moving mass. Campbell (1989) discussed such a mechanism for debris flows generally. Whatever process existed at the base of the Socompa tore vas to reduce friction, the bulk of the blocks retained coherence and the apparent coefficient of friction was reduced from 0.6 to 0.14 without f1uidisation of most of the moving mass [see the discussion of Hsti (1990) and Campbell (1990) on this topic]. Arguments based on momentum transfer in mass change models (e.g., Cannon and Savage, 1988) cannot account for more than about a halving of the apparent coefficient of friction, even with substantial mass loss early in transport (Van Gassen and Cruden, 1989).
What then were the factors responsible for maintaining block coherence? One factor is the difference between the lava and ash stratigraphy comprising the toreuas, and dome material comprising some of the debris-avalanche subunits. Perhaps cohesion forces in the layered strata were greater than those in that part of the volcano dominated by domes.
The Socompa collapse was also unusual in the angle subtended by the amphitheatre walls (about 70°). Many collapse amphitheatres subtend much smaller angles, or have subparallel walls (Siebert, 1984). Despite this geometry, evidence for transport vectors out of the amphitheatre are predominantly to the northwest, including most of the toreuas. Thus, the toreua blocks did not slide down failure planes coinciding with structural dip planes, which in the source region of the toreuas would have been to the north. This factor may have contributed to the lack of disintegration. Disintegration of the later components of the retrogressive failures at Mount St. Helens were probably significantly helped by volcanic explosions as the magmatic system was unroofed (Voight et aI., 1983). Conversely, the Socompa toreuas are evidence of a lack of explosive disruption, at least from below the northern part of the amphitheatre.

G. Wadge et al. I Journal of Volcanology and Geothermal Research 66 (1995) 309-336 333
metres
Present summit profile ....... . 6000
(a)
'- ........ \.. R:lstufated retrogressive Hypothetical" failure surfaces ~, \ \" \ \
\ " \ \ \. ............. _? \~? \
, ---'\ \?
Arenosa ignimbrite " "-... '~
5000
4000 ..... -... , """- ...... --'--~~~------.:..:~..:.::.:.~22·:::~~§2:::;:.±;;;~l.:.::;~:;:'li.o.:::.w.;::;. :;:;:-;:~T":."..,.,.""""".._
3000L------------------------------------------------------------------------
metres
6000
5000
4000
Inner amphitheatre /slide blocks (conjectural)
~
(b)
Toreva blocks
3000~-------------------------------------------------------------------------
metres
6000 (c)
5000
4000
3000~-------------------------------------------------------------------------
metres
6000
5000
4000
3000L---------------________________________________________________________ ___
Fig. 16. Sketch sections through the summit and northwestern flank of Socompa. (a) The relationship between the detachment surface (dashed line) and the basement, denoted here by the shaded band of the Arenosa ignimbrite. Note the wedging out of the ignimbrite at the step near the eventual position of the foreuas. The question marks signify the hypothetical nature of the intermediate failure surfaces. (b) Immediately after collapse (equivalent to POST2 DEM). (c) Shows development of new dacite lava domes and flows to create the Young Massif. (d) Presentday situation.
5.3. Emplacement of sub-units of the debrisavalanche deposit
Treated as a single avalanche, the Socompa deposit gi yes an average apparent friction coefficient, based on centroids, for the whole deposit of 0.078 U=4S) (Table 4 ), similar to the value obtained from the run out
parameters (0.094; j=5.4°). This is about twice the value obtained for the toreua movement, and almost identical to the equivalent figure for the Mount St. Helens 1980 collapse (Voight et a!., 1983), No attempt has been made to produce equivalent figures for subunits of the avalanche, but the value for Mo 1 would be considerably lower than 0.078, This concept of simple

334 G. Wadge et al. / Journal of Volcanology and Geothermal Research 66 (1995) 309-336
Coulomb resistance has been employed in creating spatial models of volcanic deposition using the 'energyline' model (e.g., Malin and Sheridan, 1982; Wadge and Isaacs, 1988; McEwen and Malin, 1989). This type of model has been applied to Socompa, and the results (details not presented here) can replicate the western boundary of the deposit but not the eastern side, where 'secondary' flow controls the margin form.
Recognition of the failure of three separate slide blocks at Mount St. Helens in 1980 (Voight et aI., 1981) demonstrates that the initiation of major debris avalanches can be multiple events, although at Mount St. Helens the initially separate slide blocks apparently combined downslope to form a single avalanche (Voight et aI., 1983). This, coupled with the observation of distinct subunits of the debris-avalanche deposit at Socompa, leads to the supposition that the avalanche deposition process may also be composite. Eppler et al. (1987) described multiple deposition units in a debris-avalanche deposit at Chaos Crags, though the time interval between each unit is unclear. For Socompa there are two alternatives: (1) there were successive independent failures, or (2) successive failure planes in the amphitheatre, sampled different lithologies at successively higher levels and fed a single complex avalanche process with continuous momentum exchange. The difference between these two hypotheses is that the emplacement of the subunits can be treated as separate events in the first case and as a single, complex, event in the second.
There is an inverse relationship at Socompa between potential energy of collapse source and horizontal transport distance. Subunits Mo 1 and EC2 are the furthest travelled, yet their main source volumes must have had the lowest potential energies. This interesting observation can be explained in two ways. Firstly, the frictional losses for these units may have been less. The material properties of the ignimbrite/gravels that predominate in these units may have made these masses more susceptible to mobilisation than the rocks of the Old Cone which dominate the other emplacement subunits. Also, the first avalanche at Socompa would have encountered a ground surface that may have been smooth at the metre scale, and hence frictional coupling between avalanche and surface would be low. In contrast, subsequent debris would move over the rough surface of the previously emplaced deposits. This
explanation supports the separate event emplacement model.
Forward transfer of momentum is an important factor in the emplacement of any avalanche. The greater the vertical interval sampled by the detaching mass, the greater the potential for transfer of momentum forward. Hence the lowest subunits, Mo 1 and EC2, should have a lesser capability for forward momentum transfer. Mol may have been accelerated to greater velocities than it would otherwise have achieved by momentum transfer from other sub-units with source volumes at higher elevations. The idea is not persuasive in the case of EC2 which, unlike Mo I, is not succeeded by other subunits.
Choosing between the hypotheses of single or multiple failures requires more information. This should include relevant field evidence (e.g. superposition and flow unit boundaries) and theoretical tests.
Many volcanic debris-avalanche deposits (Siebert, 1984) consist of terrain in which hundreds of hummocks or small hills with tens to hundreds of metres of relief are dispersed in a matrix of finely disintegrated material. These hills usually consist of blocks of coherent volcanic stratigraphy or brecciated volcanic rock. Often, as in the case of the Shasta deposit (Crandell, 1989), the matrix grades into a distal mudflow facies. The Socompa deposit clearly does not fit this picture. It does not have the bimodal hummock/ matrix character, but is a much more thoroughly disintegrated deposit and it does not have a mudflow facies. Our study suggests that the conditions favouring disintegrated deposits may be source rocks dominated by volcanic domes and/or unconsolidated ignimbrites/ gravels. Where coherent layered laval ash sequences were involved in the collapse at Socompa, torevas were produced on a huge scale, late in the collapse event.
6. Conclusions
About 7000 years B.P., the northwestern flank of Socompa collapsed, involving three major components: a complex debris-avalanche which travelled about 40 km, a series of kilometre-scale tore vas which slid about 7 km, and blocks that toppled into the upper part of the collapse amphitheatre.
The pristine nature of the debris-avalanche deposit surface enables the deposit to be divided into the Mon-

G. Wadge ef a/.! Journal of Volcanology and Geothermal Research 66 (1995) 309-336 335
turaqui and El Cenizal Units and seven subunits. The heterogeneous composition of these subunits has been quantitatively analysed using unmixing analysis of the spectral information in a Landsat Thematic Mapper image. About 35% ofthe exposed surface of the deposit consists of ignimbrite and gravels derived from the basement of Socompa. Volumetrically this proportion may be greater still. The rest of the deposit mainly comprises dacite derived from dome lavas, with variable degrees of oxidation.
Digital models of the surface of the volcano during the collapse event allow volumes and centroids of the major collapse components to be calculated. The torevas have a volume of about 11 km3
, the upper amphitheatre blocks a volume of 23 km3
, and the source volume of the debris-avalanche about 19 km3
• This latter figure compares with an independently derived estimate of the volume of the debris-avalanche deposit of about 26 km3
, indicating about 30% expansion during emplacement.
The source of the tore vas was interbedded lavas and pyroclastic deposits from the northern and eastern parts of the amphitheatre. An average apparent coefficient of friction for the tore vas of 0.4 indicates that these blocks had a low base friction regime.
The sources of the debris-avalanche were dacite domes in the southern and western parts of the amphitheatre, overlying a 100-200-m-thick layer of basement ignimbrite and gravels. Emplacement dynamics of the debris-avalanche deposit were complex and principally involved northwest-directed transport down a shallow valley and up the other side to a vertical height of about 300 m, as well as a secondary, eastwarddirected flow regime. Those components of collapse with the lowest potential energy (e.g., basement) travelled furthest and those with the highest potential energy (e.g., tore vas ) travelled the shortest distance. This relation suggests a momentum exchange mechanism from the rear to the front of the failed mass. There is evidence to support two alternative models: ( 1) successive separate collapse events, and (2) a single event with complex internal momentum exchange. Further modelling and field studies are needed to resolve the details of the processes involved.
Acknowledgements
We have benefited from discussions about the Socompa collapse with numerous colleagues including
S. Self and S. Pontual. J. Naranjo, M. Gardeweg and other colleagues from the Chilean Servicio Nacional de Geologia y Mineria are thanked for help and logistics in the field at Socompa. The manuscript was substantially improved by helpful reviews from Barry Voight and Lee Siebert. PWF is supported at the Planetary Geosciences Department, University of Hawaii by NASA Grant NAGW 1929; GW was supported under Natural Environment Research Council Contract No. F60/G6/12.
References
Adams, J.B .• Smith. M.O. and Johnson. P.E .• 1986. Spectral mixture modeling: a new analysis of rock and soil types at the Viking Lander I site. J. Geophys. Res .. 91: 8098-8112.
Bruggen. J. 1942. Geologia de la puna de San Pedro de Atacama y sus formaciones de arensicas y arcillas rojas. Annales Primer Congreso Panamerican de Ingeniera de Minas y Geologia; Tmo 1. 374 p.
Campbell. C.S .• 1989. Self-lubrication for long runout landslides. J. Geo!.. 97: 653-665.
Campbell. C.S .. 1990. Self-lubrication for long runout landslidesa reply. J. Geo!.. 98: 794--796.
Cannon. S.H. and Savage. W.z .. 1988. A mass-change model for the estimation of debris-flow runout. J. Geo!., 96: 221-227.
Crandell, D.R., 1989. Gigantic debris-avalanche of Pleistocene age from ancestral Mount Shasta volcano. California. and debris avalanche hazard zonation. U.S. Geo!. Surv., Bull. 1861.29 pp.
Deruelle, B.. 1978. The Negros de Aras nuee ardente deposits: a cataclysmic eruption of Socompa volcano (Andes of Atacama. north Chile). Bul!. Volcano!.. 41: 175-186.
de Silva, S.L. and Francis. P.W .. 1991. Volcanoes of the Central Andes. Springer-Verlag. Heidelberg. 160 pp.
Eppler, D.B.. Fink. J. and Fletcher. R., 1987. Rheologic properties and kinematics of emplacement of the Chaos Jumbles rockfall avalanche. Lassen Volcanic National Park. California. J. Geophys. Res .• 92: 3623-3633.
Francis. P.W .. Gardeweg. M .• Ramirez. C.F. and Rothery. D.A., 1985. Catastrophic debris avalanche deposit of Socompa volcano, northern Chile. Geology. 13: 600-603.
Francis, P.W. and Self. S .• 1987. Collapsing volcanoes. Sci. Am .• 255(6): 90--97.
Francis. P.W. and Wells. G.L., 1988. Landsat Thematic Mapper observations of large volcanic debris avalanche deposits in the Central Andes. Bul!. Volcano!., 50: 258-278.
Hoek. E. and Bray. 1. W .. 1981. Rock Slope Engineering. Institute of Mining and Metallurgy. London, 358 pp.
Hsii, K.J .• 1975. Catastrophic debris streams (Sturzstroms) generated by rockfalls. Bull. Geo!. Soc. Am .• 86: 129-140.
Hsii. K.J .. 1990. Self-lubrication for long-runout landslides: a discussion.1. Geo!.. 98: 792-794.

336 G. Wadge et al. / Journal of Volcanology and Geothermal Research 66 (1995) 309-336
Johnson, P.E., Smith, M.O. and Adams, J.8., 1985. Quantitative analysis of planetary reflectance spectra with principal components analyses. J. Geophys. Res., 90: C805-C81O.
Lucchitta, B.K., 1979. Landslides in Valles Marineris. J. Geophys. Res., 84: 8097-8113.
Malin, M.e. and Sheridan, M.P., 1982. Computer-assisted mapping of pyroclastic surges. Science, 217: 637-640.
McCulloch, MJ., 1988. Terrain and surface modelling systems: theory and practice. Photogramm. Rec., 12: 747-779.
McEwen, A.S. and Malin, M.e., 1989. Dynamics of Mount St. Helens' 1980 pyroclastic flows, rockslide-avalanche, lahars and blast. J. Volcanol. Geotherm. Res., 37: 205-231.
Mustard, J.P. and Pieters, e.M., 1987. Quantitative abundance esti
mates from bidirectional reflectance measurements. J. Geophys.
Res., 92: E617-E626. Pariseau, W.G. and Voight, 8., 1979. Rockslides and avalanches
basic principles and perspectives in the realm of civil and mining operations. In: B. Voight (Editor), Rockslides and Avalanches,
2. Elsevier, Amsterdam, pp. 1-92,. Ramirez, e.P., 1988. The geology of Socompa volcano and its debris
avalanche deposit, northern Chile. M.Sc. diss., Open University,
232 pp. Ramirez, e.P., 1995. The geology of Socompa volcano and its debris
avalanche deposit. Mem. Servo Nac. Geol. Miner. (in press). Reiche, P., 1937. The toreva-block - a distinctive landslide type. J.
Geol., 45: 538-548.
Rosenfeld, A. and Kak, A.C., 1976. Digital Picture Processing. Academic Press Inc., New York, NY.
Rothery, D.A. and Prancis, P.W., 1987. Synergistic use of MOMS-01 and TM data. Int. J. Remote Sensing, 8: 501-508.
Settle, J J. and Drake, N., 1992. Linear mixing and the estimation of ground cover proportions. Int. J. Remote Sensing, 14: 1159-1177.
Siebert, L., 1984. Large volcanic debris avalanches: characteristics of source areas, deposits, and associated eruptions. J. Volcano!. Geotherrn. Res., 22: 163-197.
Van Gassen, W. and Cruden, D.M., 1989. Momentum transfer and friction in the debris of rock avalanches. Can. Geotech. J., 26: 623-628.
Voight, B., Glicken, H., Janda, R. and Douglass, P.M., 1981. Catastrophic rockslide-avalanche of May 18. U.S. Geol. Surv., Prof. Pap., 1250: 347-377.
Voight, B., Janda, R., Glicken, H. and Douglass, P.M., 1983. Nature and mechanics of the Mount St. Helens rockslide avalanche of 18 May 1980. Geotechnique, 33: 243-273.
Von Huene, R., Bourgois, J., Miller, J. and Pautot, G., 1989. A large tsunamogenic landslide and debris flow along the Peru Trench. 1. Geophys. Res., 94: 1703-1714.
Wadge, G. and Isaacs, M.C., 1988. Mapping the volcanic hazards from Soufriere Hills Volcano, Montserrat, West Indies using an image processor. J. Geol. Soc. London, 145: 541-552.
Yu, Y.S. and Coates, D.P., 1970. Analysis of rock slopes using the finite element method. Dept. Energy, Mines and Resources, Research Report, R229, Ottawa, Canada.