DEA-130 Modernization of Tubular Collapse Performance ...
110
DEA-130 Modernization of Tubular Collapse Performance Properties API/HSE/MMS Participant Report October 2002
-
Upload
khangminh22 -
Category
Documents
-
view
0 -
download
0
Transcript of DEA-130 Modernization of Tubular Collapse Performance ...
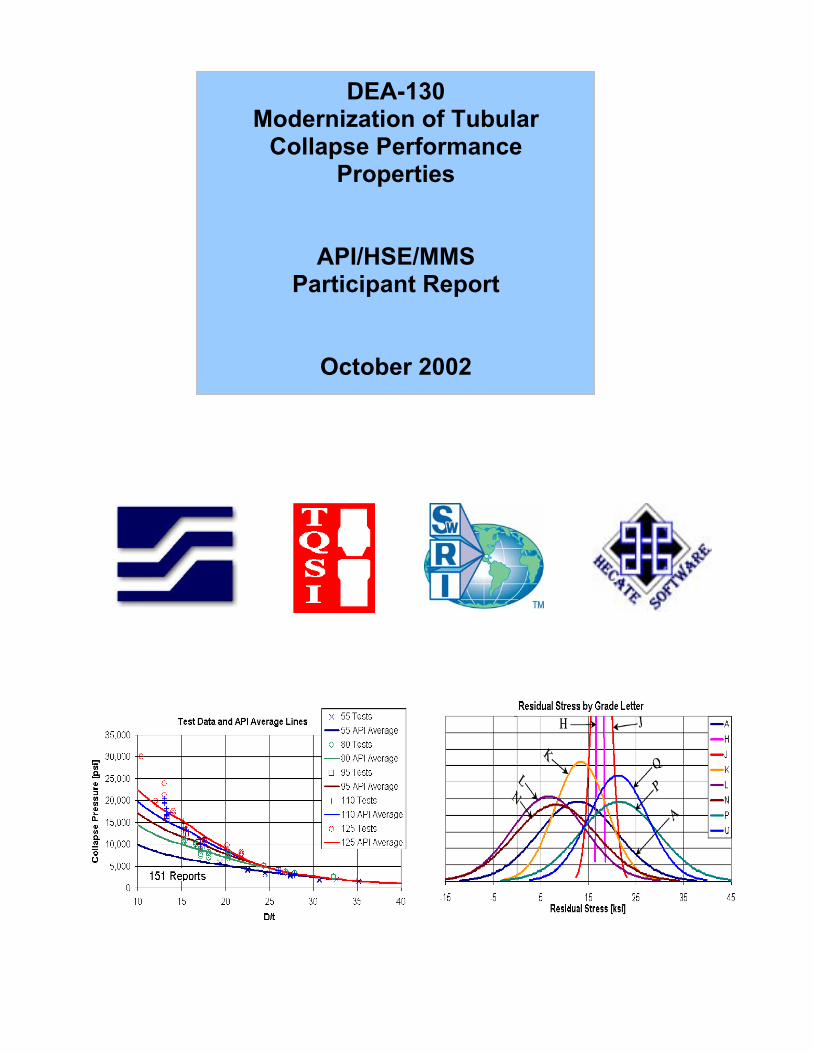
DEA-130 Modernization of Tubular
Collapse PerformanceProperties
API/HSE/MMSParticipant Report
October 2002
DEA-130 MODERNIZATION OF TUBULAR COLLAPSE
PERFORMANCE PROPERTIES
API/HSE/MMS PARTICIPANT REPORT
Report Prepared By:
___________________________________ W. T. Asbill, Stress Engineering Services, Co-Chairman
___________________________________ Ron Livesay, Hecate Software
___________________________________ Stephen Crabtree, Technical & Quality Solutions Inc.
Report Approved By:
Dr. M. L. Payne, BP Houston, Co-Chairman __________________________________
October 2002

TABLE OF CONTENTS
PAGE NO. 1.0 EXECUTIVE SUMMARY...................................................................................... 1
2.0 PROGRAM SCOPE ............................................................................................. 4
3.0 PROGRAM PARTICIPANTS................................................................................ 5
3.1 OPERATORS .................................................................................................... 5
3.2 INDUSTRY AND GOVERNMENT AGENCIES.................................................. 5
3.3 PROGRAM STEERING COMMITTEE............................................................... 5
3.4 PIPE MANUFACTURERS ................................................................................. 6
3.5 CONTRACTOR AND SUBCONTRACTORS ..................................................... 6
4.0 PARTICIPATING MANUFACTURERS................................................................. 7
4.1 SUMMARY OF MANUFACTURERS ................................................................. 7
4.2 PRODUCTS....................................................................................................... 7
4.3 PROCESSES .................................................................................................... 7
5.0 PRODUCTS SELECTED FOR COLLAPSE TESTING....................................... 11
6.0 DESCRIPTION OF TESTS PERFORMED......................................................... 16
6.1 MATERIAL YIELD STRENGTH TESTS .......................................................... 16
6.2 COLLAPSE TESTS ......................................................................................... 17
6.3 RESIDUAL STRESS TESTS ........................................................................... 21
7.0 SUMMARY OF COLLAPSE AND RESIDUAL STRESS TESTS ........................ 26
8.0 SPECIAL SOFTWARE ....................................................................................... 32
8.1 THE DATABASE ............................................................................................. 34
8.1.1 Table Manufactures .................................................................................. 35
8.1.2 Table Pipes ............................................................................................... 35
8.1.3 Tables ODs, Walls, Eccentricities, Ovalities.............................................. 36
8.1.4 Tables SS and SS Point............................................................................ 37
8.1.5 Table Nominal Walls ................................................................................. 37
8.2 PIPER.XLS ...................................................................................................... 38
8.2.1 Sheet Pipes............................................................................................... 38
8.2.2 Sheet Details............................................................................................. 39
8.2.3 Sheet ODs................................................................................................. 40
i
8.2.4 Sheet Wall Thickness................................................................................ 41
8.2.5 Sheet Ovalities .......................................................................................... 42
8.2.6 Sheet Eccentricities................................................................................... 43
8.2.7 Sheet Compare ......................................................................................... 44
8.2.7.1 Use of “User Defined” Functions ........................................................ 46
8.2.7.2 Handling “User Defined” Functions..................................................... 47
8.2.7.3 API Formulae ..................................................................................... 47
8.2.7.4 Tamano Formulae .............................................................................. 48
8.2.7.5 Using API and Tamano Functions...................................................... 50
8.2.8 Sheet SS................................................................................................... 51
9.0 COMPARISON OF PIPE GEOMETRY AND YIELD STRENGTH...................... 52
9.1 OD ................................................................................................................... 52
9.1.1 Measurement Method ............................................................................... 52
9.1.2 High Collapse............................................................................................ 52
9.1.3 Straightening Method ................................................................................ 53
9.2 WALL THICKNESS.......................................................................................... 54
9.2.1 Measurement Station (Offset) ................................................................... 54
9.2.2 Angle......................................................................................................... 55
9.2.3 High Collapse............................................................................................ 55
9.2.4 Process ..................................................................................................... 56
9.3 YIELD STRENGTH.......................................................................................... 57
9.3.1 Grade ........................................................................................................ 57
9.3.2 Process Grade A....................................................................................... 58
9.3.3 Process Grade H....................................................................................... 58
9.3.4 Process Grade J ....................................................................................... 59
9.3.5 Process Grade K....................................................................................... 59
9.3.6 Process Grade L ....................................................................................... 60
9.3.7 Process Grade N....................................................................................... 61
9.3.8 Process Grade P....................................................................................... 62
9.3.9 Process Grade Q ...................................................................................... 62
9.4 RESIDUAL STRESS........................................................................................ 63
9.4.1 High Collapse............................................................................................ 63
ii
9.4.2 Process ..................................................................................................... 64
9.4.3 Grade ........................................................................................................ 64
9.4.4 Straightening Process ............................................................................... 65
9.5 OVALITY.......................................................................................................... 65
9.5.1 Lognormal Distributions ............................................................................ 65
9.5.2 High Collapse............................................................................................ 66
9.5.3 Process ..................................................................................................... 68
9.5.4 Straightening ............................................................................................. 69
9.6 ECCENTRICITY .............................................................................................. 70
9.6.1 High Collapse............................................................................................ 70
9.6.2 Process ..................................................................................................... 71
9.6.3 Straightening ............................................................................................. 72
9.7 STRESS-STRAIN ............................................................................................ 73
10.0 DISCUSSION OF COLLAPSE PRESSURES .................................................... 74
10.1 ACTUAL VERSUS API AND TAMANO COLLAPSE PRESSURES................. 74
11.0 COMPARISON OF MANUFACTURERS............................................................ 79
11.1 Sheet Pipes ..................................................................................................... 80
11.2 All Sheets Other than Pipes............................................................................. 81
11.3 Sheet OD ......................................................................................................... 82
11.4 Sheet Wall ....................................................................................................... 83
11.5 Sheet YS and Yield Plots by Grade ................................................................. 85
11.5.1 Sheet YS................................................................................................... 85
11.5.2 Yield Plots by Grade ................................................................................. 85
11.6 Sheet Ovality ................................................................................................... 95
11.7 Sheet Ecc ........................................................................................................ 97
11.8 Sheet RS ......................................................................................................... 99
11.9 Sheet Collapse .............................................................................................. 101
iii
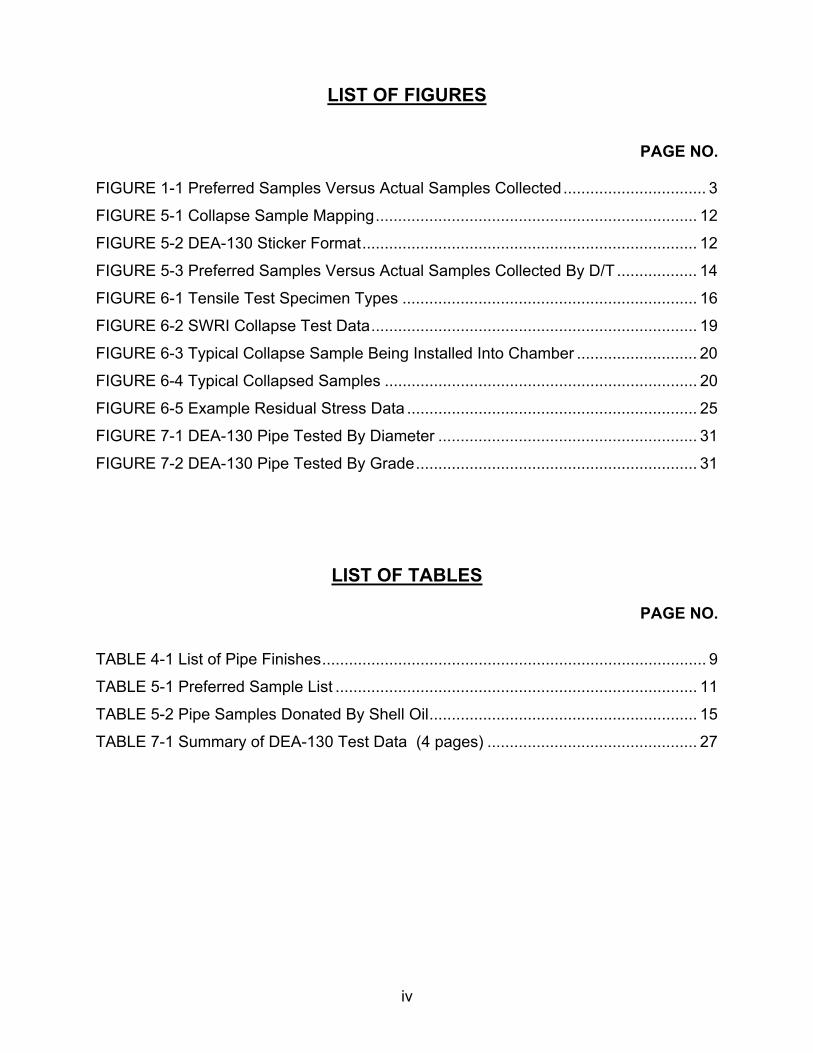
LIST OF FIGURES
PAGE NO.
FIGURE 1-1 Preferred Samples Versus Actual Samples Collected................................ 3
FIGURE 5-1 Collapse Sample Mapping........................................................................ 12
FIGURE 5-2 DEA-130 Sticker Format........................................................................... 12
FIGURE 5-3 Preferred Samples Versus Actual Samples Collected By D/T .................. 14
FIGURE 6-1 Tensile Test Specimen Types .................................................................. 16
FIGURE 6-2 SWRI Collapse Test Data......................................................................... 19
FIGURE 6-3 Typical Collapse Sample Being Installed Into Chamber ........................... 20
FIGURE 6-4 Typical Collapsed Samples ...................................................................... 20
FIGURE 6-5 Example Residual Stress Data ................................................................. 25
FIGURE 7-1 DEA-130 Pipe Tested By Diameter .......................................................... 31
FIGURE 7-2 DEA-130 Pipe Tested By Grade............................................................... 31
LIST OF TABLES
PAGE NO.
TABLE 4-1 List of Pipe Finishes...................................................................................... 9
TABLE 5-1 Preferred Sample List ................................................................................. 11
TABLE 5-2 Pipe Samples Donated By Shell Oil............................................................ 15
TABLE 7-1 Summary of DEA-130 Test Data (4 pages) ............................................... 27
iv
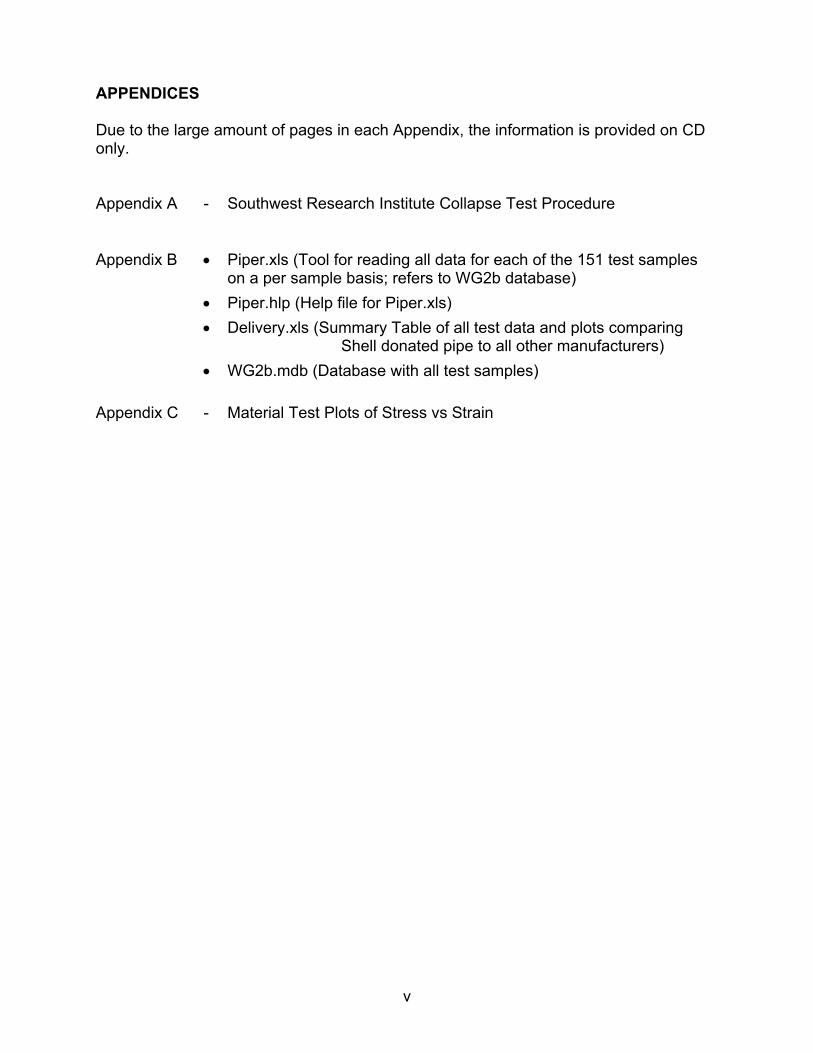
APPENDICES
Due to the large amount of pages in each Appendix, the information is provided on CD only.
Appendix A - Southwest Research Institute Collapse Test Procedure
Appendix B • Piper.xls (Tool for reading all data for each of the 151 test samples on a per sample basis; refers to WG2b database)
• Piper.hlp (Help file for Piper.xls) • Delivery.xls (Summary Table of all test data and plots comparing
Shell donated pipe to all other manufacturers) • WG2b.mdb (Database with all test samples)
Appendix C - Material Test Plots of Stress vs Strain
v
DEA-130 MODERNIZATION OF TUBULAR COLLAPSE PERFORMANCE PROPERTIES
1.0 EXECUTIVE SUMMARY
In recent years, some users of OCTG casing and tubing have realized the improved performance of today’s pipe. This includes both internal or burst resistance and external or collapse resistance. This improvement is due to newer methods of making and finishing tubulars and the manufacturers are to be thanked for these improvements.
Pipe performance is primarily given by API bulletins and specifications and is based on data and engineering that was produced in the 1960s. These burst and collapse values were and are very important to the user and form the basis from which drilling engineers design their oil and gas wells. Currently the petroleum industry is aware of the somewhat outdated API pipe performance values and is actively working to improve pipe burst and collapse ratings. The main group doing this work is ISO/API TC67/SC5/WG2b, which has been meeting for the past three years. The group has been diligently seeking both burst and collapse test data from the industry to use in providing new equations and ratings for pipe performance. From the beginning, WG2b was aware of the lack of well documented collapse test data, particularly data on pipe made in the past 5,10 and 20 years.
The convener of WG2b is Dr. M. L. Payne. During the late1990s Dr. Payne was with ARCO and he investigated the collapse performance of several pipe mill products. Through testing and statistical analysis, Payne was able to take advantage of today’s pipe collapse resistance and ARCO drilled and completed many wells with lighter pipe weights than traditionally had been used, providing ARCO a significant savings. From this work, Payne put together a joint industry proposal and presented this to the Drilling Engineering Association. The proposal was successful and became known as DEA130. The purpose of DEA-130 was to perform collapse tests and carefully document the pipe samples and test data. This report was prepared for the operating companies participating in the program.
The participants of DEA-130 consisted of 12 end-users, three industry / government agencies and 11 pipe manufacturers. The program was performed by four engineering companies and was directed by a Steering Committee (SC), which was made up of representatives of the end-users and agencies. The pipe manufacturers were selected by the Steering Committee and invited to join the program. All current producers of OCTG pipe that were invited accepted the invitation. Stress Engineering Services was the primary contractor. Subcontractors were (1) Technical & Quality Solutions Inc. (TQSI) which made the mill visits and selected the pipe samples, (2) Southwest Research Institute (SWRI) which performed the collapse tests and (3) Hecate which provided special software and data reduction. The deliverables consisted of - all the data, software and reduction with manufacturers identified for the end-users; all of the data and some software without the manufacturers identified for the agencies; and all of the data but with only each manufacturer’s own data identified and some software for the manufacturers.
October 2002 Page 1 of 103 SES/TQSI/Hecate

DEA-130 MODERNIZATION OF TUBULAR COLLAPSE PERFORMANCE PROPERTIES
During the first six months of the program, each manufacturing participant made a presentation to the Steering Committee to describe their products and manufacturing processes and the committee produced a “preferred” list of pipe to be tested. This list contained a total of 246 possible pipe samples. Thereafter, over a period of approximately nine months, TQSI made visits to all of the pipe mills and selected the pipe samples, which were then shipped to SWRI for testing. A condition of the selection was that TQSI had to accept pipe that was available in the manufacturer’s yard at the time of the visit.
The mill visits produced a total of 216 pipe samples. Each sample was carefully identified and additional pipe adjacent the sample was taken for material tensile testing, residual stress testing and extra pipe for possible other testing. Typically, four samples of a given size/weight/grade were selected with one serving as a spare. In addition to these samples, Shell Oil donated 17 samples of high chrome/high alloy pipe.
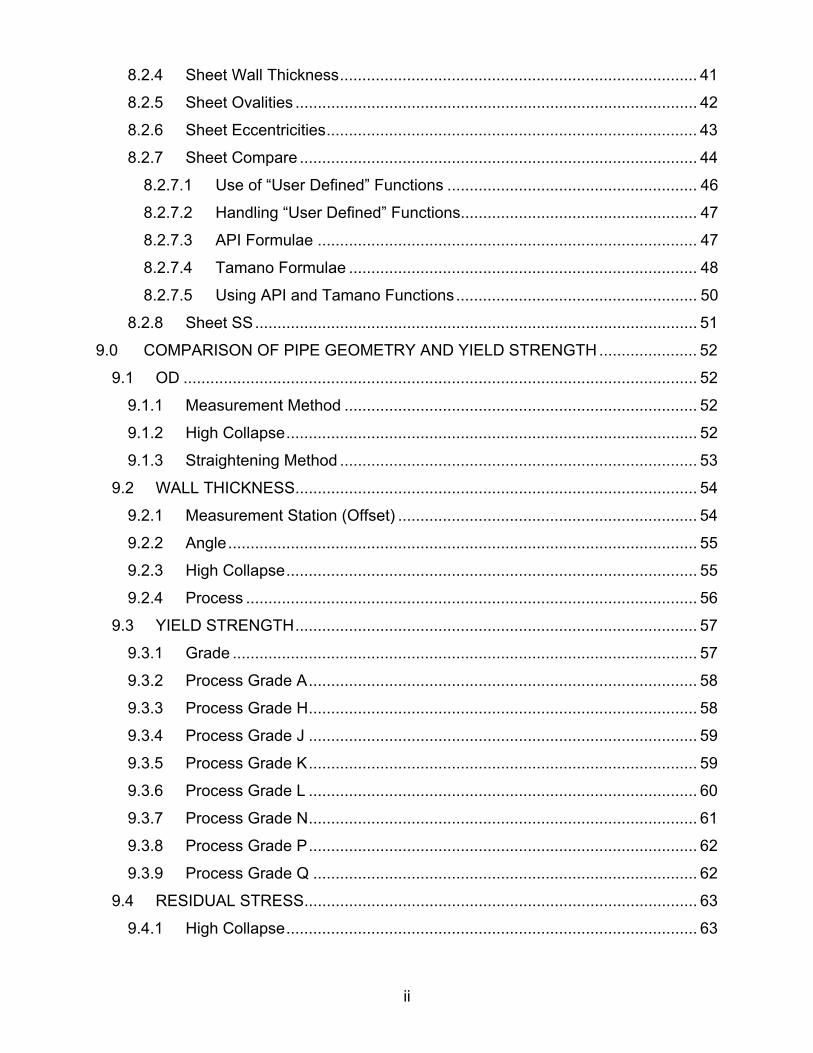
A total of 151 samples were tested. While the samples tested did not totally match the SC’s “preferred” pipes, overall the match was reasonably good. Figure 1-1 shows the preferred pipe, selected pipe, Shell donated pipe and samples tested.
Each sample tested was measured for OD, wall and ovality in 1D increments (total of 9 planes of measurements). Residual stress tests were made from pipe directly adjacent the collapse sample. Prior to shipping, material tensile tests were made directly adjacent the collapse sample and several feet past the other end of the sample. The manufacturers made these tensile tests. The collapse pressure and location of the deformed failure were reported by SWRI.
Data reduction is given that compares the parameters that are significant to collapse, namely OD, wall thickness, ovality, eccentricity, yield strength, shape of the stress-strain curve and residual stress. Plots of the test data are given along with current API collapse rating and WG2b’s most recent proposed new equation for predicting collapse. Pipe performance by manufacturer is plotted for comparison purposes.
The data is provided in Microsoft Access so that the participants can perform further reduction as desired.
October 2002 Page 2 of 103 SES/TQSI/Hecate

DEA-130 MODERNIZATION OF TUBULAR COLLAPSE PERFORMANCE PROPERTIES
FIGURE 1-1 Preferred Samples Versus Actual Samples Collected
October 2002 Page 3 of 103 SES/TQSI/Hecate
DEA-130 MODERNIZATION OF TUBULAR COLLAPSE PERFORMANCE PROPERTIES
2.0 PROGRAM SCOPE
DEA-130 was structured to provide proprietary benefit to participating companies, while also providing public benefit to the industry through the acquisition of a collapse database on modern pipe for use by API and ISO. The objective was to collect as much collapse test data as possible and to formulate software that could reduce the collapse data and predict pipe collapse limits. The software would also allow comparisons between mill products to be made.
Operator participants received all of the results of the collapse tests, material tensile tests and residual stress tests, including identification of the pipe sample manufacturer. Industry standard and government agencies received all of the test data, however without identity of the test sample manufacturer. Manufacturing participants received the entire test data with only their pipe results identified (all other data was in anonymous form). All participants and API, MMS and HSE received the database that is a compilation of the test data.
October 2002 Page 4 of 103 SES/TQSI/Hecate

DEA-130 MODERNIZATION OF TUBULAR COLLAPSE PERFORMANCE PROPERTIES
3.0 PROGRAM PARTICIPANTS
The program was first presented as a Drilling Engineering Association (DEA) joint industry program in February of 1999. This was a quarterly meeting of the DEA at the ARCO facility in Plano TX. At that meeting, Dr. Mike Payne presented the background of the proposed project and the need for collapse pipe values for today’s pipe. Additional presentations of the program were made at the API 1999 Winter Work Week and API 1999 Standardization Conference. The kick-off meeting of the DEA-130 program was held in October of 1999.
3.1 OPERATORS
Eleven operating companies joined the program, as follows: 1. ARCO (now a part of BP) 2. AMOCO (now a part of BP) 3. Burlington Resources 4. Chevron (now with Texaco) 5. Marathon Oil 6. PEMEX 7. REW-DEA 8. Shell E&P Technology 9. Texaco (now with Chevron)
10. Total Fina (now includes Elf) 11. Unocal 12. Phillips Petroleum Co. (acquired rights to DEA-130 with their purchase of ARCO
Alaska, Inc., in 2000)
3.2 INDUSTRY AND GOVERNMENT AGENCIES
Three industry and/or government agencies joined as follows: 1. American Petroleum Institute (API) 2. Health and Safety Executive (HSE - UK) 3. Mineral Management Service (MMS)
3.3 PROGRAM STEERING COMMITTEE
A Steering Committee (SC) was formed to direct the activities of the program and to oversee the budget. The SC consisted of one representative from the above fourteen participants above plus one backup representative.
October 2002 Page 5 of 103 SES/TQSI/Hecate

DEA-130 MODERNIZATION OF TUBULAR COLLAPSE PERFORMANCE PROPERTIES
3.4 PIPE MANUFACTURERS
The SC selected the pipe manufacturers that they wanted to join the program and to test the manufacturers pipe. All of the pipe mills that were invited to join, did join the program, with the exception of one mill that had just announced that they were about to stop offering OCTG pipe. A total of 11 pipe mills joined the program.
3.5 CONTRACTOR AND SUBCONTRACTORS
Four companies were contracted to perform the program work as follows: 1. Contractor – Stress Engineering Services (SES) 2. Subcontractor for selecting the pipe samples – Technical and Quality
Solutions Inc (TQSI) 3. Subcontractor for performing the collapse tests and residual stress
tests – Southwest Research Institute (SWRI) 4. Subcontractor for software and data reduction – Hecate
The program was co-chaired by Dr. Mike Payne of BP and Mr. Tom Asbill of Stress Engineering Services.
October 2002 Page 6 of 103 SES/TQSI/Hecate

DEA-130 MODERNIZATION OF TUBULAR COLLAPSE PERFORMANCE PROPERTIES
4.0 PARTICIPATING MANUFACTURERS
In order to accumulate the required data points for the project, the steering committee solicited various manufacturers to participate in the project. The manufacturers solicited were randomly chosen by the steering committee, but with the intent of gaining the participation of manufacturers who produce a full range of products. The range of products required for this project is detailed in Section 5.0 of this report.
Through the efforts of the steering committee, 11 manufacturers elected to participate in this project. Although only 11 manufacturers participated, many of the manufacturers have multiple facilities, which enabled the collection of the desired tubular collapse samples.
4.1 SUMMARY OF MANUFACTURERS
After the manufacturers were selected and became approved participates in the project, the steering committee prepared, submitted and requested that the manufacturers complete the attached “Fact Sheet”. The “Fact Sheet” was prepared to gather specific information about the manufacturer’s operations and included topics covering the manufacturing processes used at the various facilities and the probable products available to select collapse samples from each of the facilities. A copy of the original “Fact Sheet” submitted to the manufacturers was provided to the operator participants only.
4.2 PRODUCTS
To identify the types of products each of the manufacturers provide, the Steering Committee prepared a table for the manufacturers to complete in conjunction with the aforementioned “Fact Sheet”. This table, when completed by the manufacturer, provided a Matrix for their products, i.e., sizes, grades and processes used to finish the products, which assisted in identifying the types of samples which might be available for selection at each of the various manufacturer’s facilities.
As was noted by the Steering Committee, the majority of the manufacturers produce similar sizes with the difference in the products being the type of processing performed, e.g., hot rotary straightened, gag straightened and stress relieved, etc. These varying processes significantly affect the performance properties of the finished product .
4.3 PROCESSES
There are numerous methods of processing tubulars to provide the finished product supplied to the end-user. In simplified terms, the major processing techniques most commonly used include the production of seamless and EW tubulars.
October 2002 Page 7 of 103 SES/TQSI/Hecate

DEA-130 MODERNIZATION OF TUBULAR COLLAPSE PERFORMANCE PROPERTIES
In order to reach this finished product stage, the manufacturing process begins with the making of steel to form these products. In just the steel making process there are multiple techniques, which involve various mixtures of metallurgical elements, e.g., nickel, chromium, carbon, etc., to produce the final product. The percentage of these elements in the mixture impacts the resultant performance properties of the tubular. In the steel making process there have been significant advancements. As an example, improved chemistry control during the casting stages- e.g. the use of argon steering and calcium injection to enhance the cleanliness of steel. Here “clean” steel refers to superior grain structure in the steel and absence of defects, voids, and impurities. These types of improvements have been implemented in many of the steel manufacturing facilities.
Following the steel making process, the steel is rolled in primary mills to a semi-finished shape of blooms, slabs or as is most common for seamless tubular mills, it is formed into billets through a continuous casting process.
From this stage the steel is processed through various piercing and sizing operations. Since the geometry/dimensions play an important role in the performance of the product, i.e., ovality, eccentricity, total wall thickness, etc., tight controls must be placed on these operations. This is especially critical when enhanced collapse performance is required.
Upon completing the sizing operations, the product is processed through final heat treating phases to accomplish the required strength. The heat treating operations have encountered significant advances. Improved furnaces provide manufacturers with the ability to obtain and track temperatures more accurately, and thus yield better material properties. The improved furnace designs use the “walking beam” or “conveyor driven” systems to ensure uniform heating of the tubes as they move through the furnace. New furnace types include computer controlled baffling systems to provide an even distribution of heat throughout the oven. These computerized enhancements ensure adequate soak times for austenitizing and tempering of steel. This is a significant improvement over batch type furnaces, which can suffer from poor temperature control and the lack of uniformity in heat distribution.
After heat treatment the product is normally processed through a straightening operation. This operation is completed in several different manners, which can consist of gag straightening or rotary straightening while the steel is either hot or cold. Unfortunately, this straightening operation can induce residual stress, which can reduce the overall performance of the finished product. These stresses can be mitigated by means of either stress relieving the product at temperatures around 900° F, or processing the product through the straightening operation after completing the heat treating process and before the steel has cooled below this temperature. Improvements in post heat treatment processes such as “hot rotary straightening” have contributed to reducing residual stresses in tubulars.
October 2002 Page 8 of 103 SES/TQSI/Hecate
DEA-130 MODERNIZATION OF TUBULAR COLLAPSE PERFORMANCE PROPERTIES
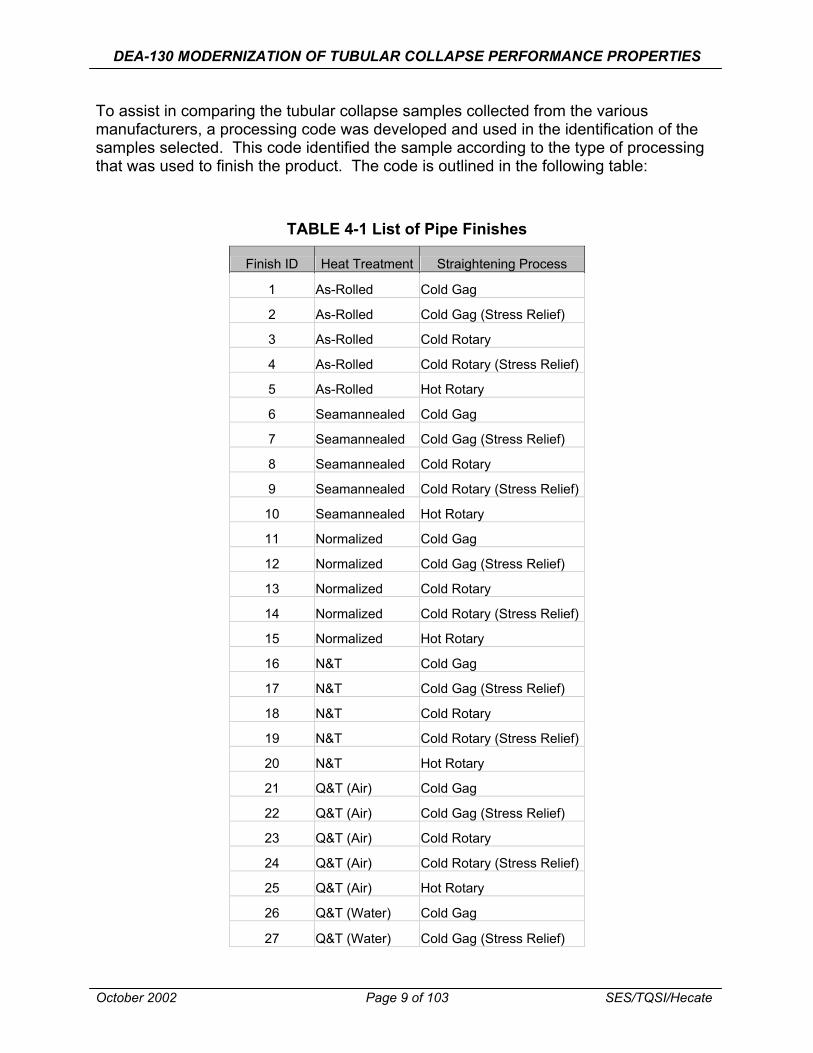
To assist in comparing the tubular collapse samples collected from the various manufacturers, a processing code was developed and used in the identification of the samples selected. This code identified the sample according to the type of processing that was used to finish the product. The code is outlined in the following table:
TABLE 4-1 List of Pipe Finishes
Finish ID Heat Treatment Straightening Process
1 As-Rolled Cold Gag
2 As-Rolled Cold Gag (Stress Relief)
3 As-Rolled Cold Rotary
4 As-Rolled Cold Rotary (Stress Relief)
5 As-Rolled Hot Rotary
6 Seamannealed Cold Gag
7 Seamannealed Cold Gag (Stress Relief)
8 Seamannealed Cold Rotary
9 Seamannealed Cold Rotary (Stress Relief)
10 Seamannealed Hot Rotary
11 Normalized Cold Gag
12 Normalized Cold Gag (Stress Relief)
13 Normalized Cold Rotary
14 Normalized Cold Rotary (Stress Relief)
15 Normalized Hot Rotary
16 N&T Cold Gag
17 N&T Cold Gag (Stress Relief)
18 N&T Cold Rotary
19 N&T Cold Rotary (Stress Relief)
20 N&T Hot Rotary
21 Q&T (Air) Cold Gag
22 Q&T (Air) Cold Gag (Stress Relief)
23 Q&T (Air) Cold Rotary
24 Q&T (Air) Cold Rotary (Stress Relief)
25 Q&T (Air) Hot Rotary
26 Q&T (Water) Cold Gag
27 Q&T (Water) Cold Gag (Stress Relief)
October 2002 Page 9 of 103 SES/TQSI/Hecate

DEA-130 MODERNIZATION OF TUBULAR COLLAPSE PERFORMANCE PROPERTIES
Finish ID Heat Treatment Straightening Process
28 Q&T (Water) Cold Rotary
29 Q&T (Water) Cold Rotary (Stress Relief)
30 Q&T (Water) Hot Rotary
31 Q&T (Oil) Cold Gag
32 Q&T (Oil) Cold Gag (Stress Relief)
33 Q&T (Oil) Cold Rotary
34 Q&T (Oil) Cold Rotary (Stress Relief)
35 Q&T (Oil) Hot Rotary
36 Cold Drawn No straightening
October 2002 Page 10 of 103 SES/TQSI/Hecate

DEA-130 MODERNIZATION OF TUBULAR COLLAPSE PERFORMANCE PROPERTIES
5.0 PRODUCTS SELECTED FOR COLLAPSE TESTING
After numerous meetings with the project steering committee and discussions with ISO/API Work Group 2b, a list of the preferred collapse samples was compiled, which was identified as the “Preferred Sample List”. This list provided a mixture of the various processing techniques along with a substantial range of D/t’s. The list of the Preferred Samples is detailed in Table 5-1 below:
TABLE 5-1 Preferred Sample List
TUBULAR DESCRIPTION NO. OD WEIGHT WALL GRADE D/T
1 4.5 12.6 0.271 P110 16.61 2 4.5 12.6 0.271 L80 or L8013Cr 16.61 3 4.5 18.8 0.43 L80-13Cr 10.47 4 5.5 14 0.244 J55/K55 22.54 5 5.5 17 0.304 L80 18.09 6 5.5 23 0.415 L80 13.25 7 7 17 0.231 J55/K55 30.30 8 7 26 0.362 K55 19.34 9 7 29 0.408 N80Q 17.16 10 7 29 0.408 P110 17.16 11 7 32 0.453 P110 15.45 12 7 35 0.498 C95 14.06 13 7 35 0.498 P110 14.06 14 7.625 29.7 0.375 P110 20.33 15 7.625 59 0.812 P110 9.39 16 8.625 28 0.304 J55/K55 28.37 17 9.625 36 0.352 K55 27.34 18 9.625 40 0.395 N80 24.37 19 9.625 40 0.395 P110 24.37 20 9.625 53.5 0.545 P110 17.66 21 9.625 53.5 0.545 Q125 17.66 22 10.75 40.5 0.35 HCK55 30.71 23 11.75 42 0.333 H40 35.29 24 11.875 71.8 0.582 Q125 20.40 25 13.375 54.5 0.38 K55 35.20 26 13.375 68 0.48 P110 27.86 27 13.375 72 (12-1/4" drift) 0.514 N80Q 26.02 28 13.375 72 (12-1/4" drift) 0.514 P110 26.02 29 13.625 88.2 0.625 Q125 21.80 30 16 84 0.495 N80 32.32 31 16 97 0.57 P110 28.07 32 18.625 87.5 0.435 X56 42.82 33 20 133 0.635 K55 31.50
October 2002 Page 11 of 103 SES/TQSI/Hecate
DEA-130 MODERNIZATION OF TUBULAR COLLAPSE PERFORMANCE PROPERTIES
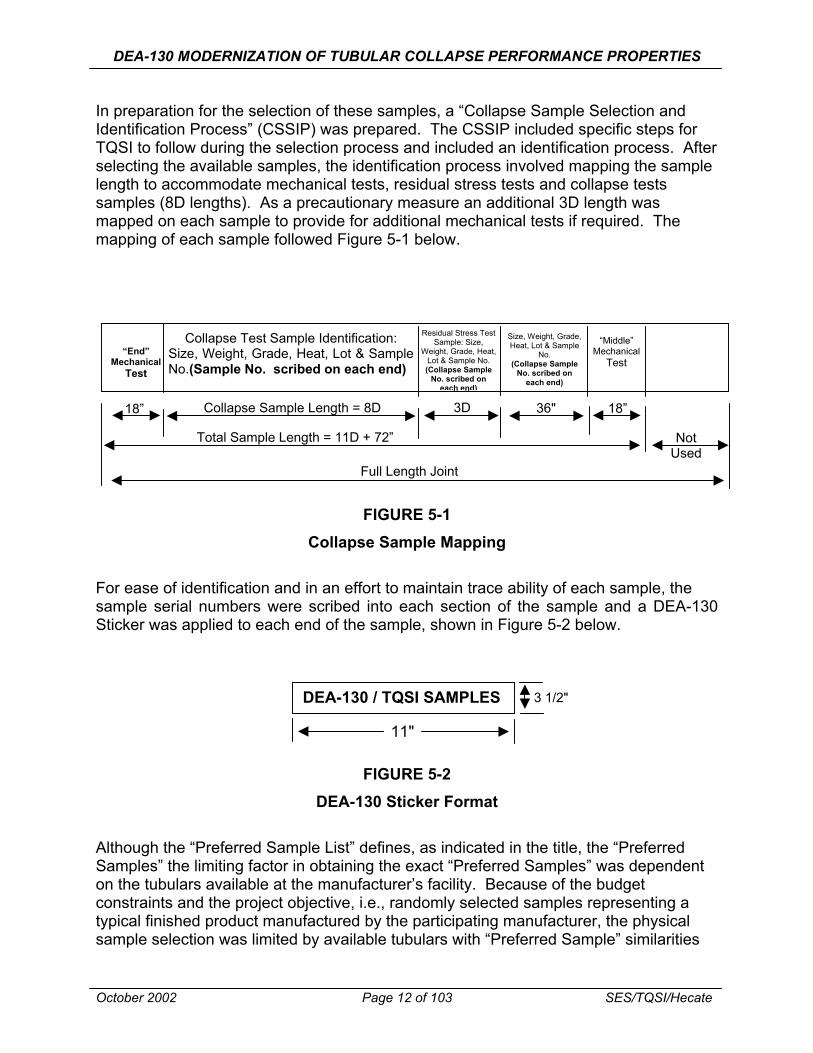
In preparation for the selection of these samples, a “Collapse Sample Selection and Identification Process” (CSSIP) was prepared. The CSSIP included specific steps for TQSI to follow during the selection process and included an identification process. After selecting the available samples, the identification process involved mapping the sample length to accommodate mechanical tests, residual stress tests and collapse tests samples (8D lengths). As a precautionary measure an additional 3D length was mapped on each sample to provide for additional mechanical tests if required. The mapping of each sample followed Figure 5-1 below.
Residual Stress Test Size, Weight, Grade, Collapse Test Sample Identification: “Middle”Sample: Size, Heat, Lot & Sample Weight, Grade, Heat, “End” Mechanical No. Size, Weight, Grade, Heat, Lot & Sample Lot & Sample No. Mechanical Test (Collapse Sample(Collapse SampleNo.(Sample No. scribed on each end) No. scribed on Test No. scribed on each end)each end)
3DCollapse Sample Length = 8D 36" 18”18”
Total Sample Length = 11D + 72” Not Used
Full Length Joint
FIGURE 5-1 Collapse Sample Mapping
For ease of identification and in an effort to maintain trace ability of each sample, the sample serial numbers were scribed into each section of the sample and a DEA-130 Sticker was applied to each end of the sample, shown in Figure 5-2 below.
3 1/2"DEA-130 / TQSI SAMPLES
11"
FIGURE 5-2 DEA-130 Sticker Format
Although the “Preferred Sample List” defines, as indicated in the title, the “Preferred Samples” the limiting factor in obtaining the exact “Preferred Samples” was dependent on the tubulars available at the manufacturer’s facility. Because of the budget constraints and the project objective, i.e., randomly selected samples representing a typical finished product manufactured by the participating manufacturer, the physical sample selection was limited by available tubulars with “Preferred Sample” similarities
October 2002 Page 12 of 103 SES/TQSI/Hecate

DEA-130 MODERNIZATION OF TUBULAR COLLAPSE PERFORMANCE PROPERTIES
(OD, Grade, D/t, etc.). Due to these constraints, the actual samples selected differed from the “Preferred Samples”. A comparison of the “Preferred Samples” versus the “Actual Samples” selected is detailed in Figure 5-3. The total number of samples selected was 216. All samples were sent to Southwest Research Institute in San Antonio, Texas, with shipping provided by the manufacturer. Overall, the obtained samples reasonably met the desired range of pipe OD, D/t and material. The main difference was fewer non-Q&T than desired and more Q&T and High Collapse, particularly the HC products. However, as stated earlier, pipe samples obtained had to be from the products that were at the manufacturer at the time when TQSI made the visit.
Note: Non-API grades have been identified as “A”.
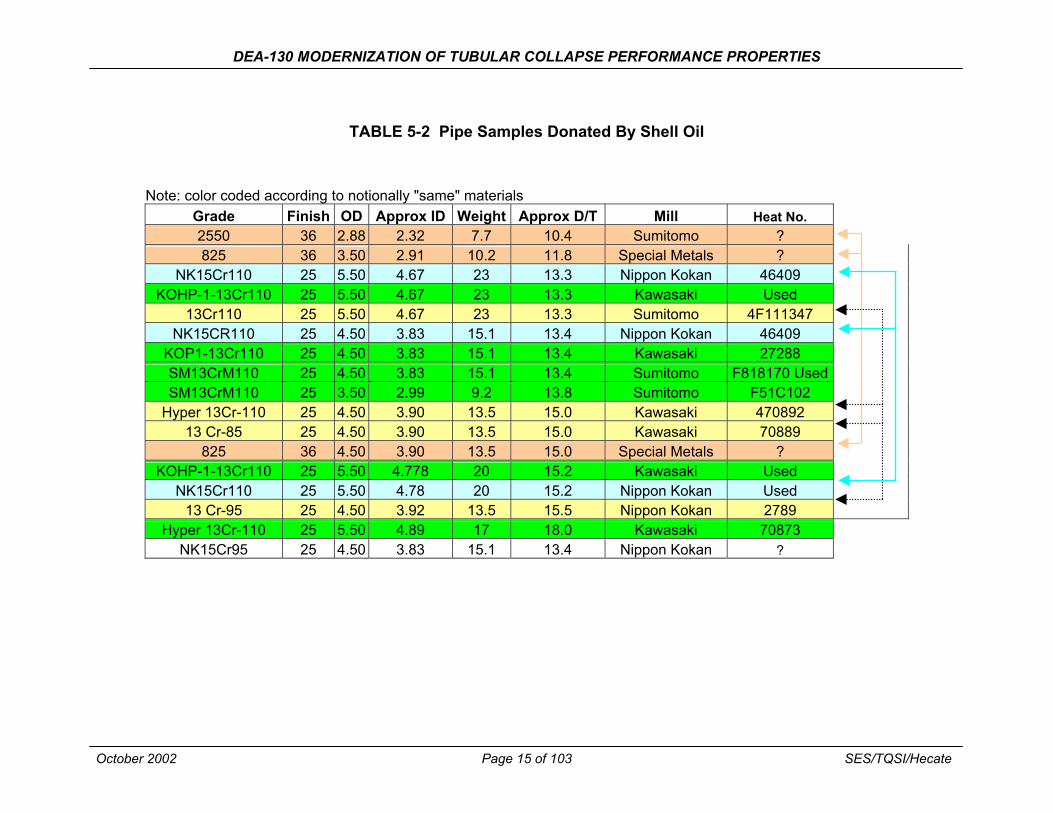
In addition to the “Actual Samples” selected at the various participating manufacturer’s facilities, Shell Oil (a Participating Sponsor of the project) contributed seventeen (17) tubular collapse samples for testing. These samples are identified in Table 5-2, and were all high chrome/high alloy materials.
October 2002 Page 13 of 103 SES/TQSI/Hecate

DEA-130 MODERNIZATION OF TUBULAR COLLAPSE PERFORMANCE PROPERTIES
FIGURE 5-3 Preferred Samples Versus Actual Samples Collected By D/T
October 2002 Page 14 of 103 SES/TQSI/Hecate
DEA-130 MODERNIZATION OF TUBULAR COLLAPSE PERFORMANCE PROPERTIES
TABLE 5-2 Pipe Samples Donated By Shell Oil
Note: color coded according to notionally "same" materials Grade Finish OD Approx ID Weight Approx D/T Mill Heat No. 2550 36 2.88 2.32 7.7 10.4 Sumitomo ? 825 36 3.50 2.91 10.2 11.8 Special Metals ?
NK15Cr110 25 5.50 4.67 23 13.3 Nippon Kokan 46409 KOHP-1-13Cr110 25 5.50 4.67 23 13.3 Kawasaki Used
13Cr110 25 5.50 4.67 23 13.3 Sumitomo 4F111347 NK15CR110 25 4.50 3.83 15.1 13.4 Nippon Kokan 46409
KOP1-13Cr110 25 4.50 3.83 15.1 13.4 Kawasaki 27288 SM13CrM110 25 4.50 3.83 15.1 13.4 Sumitomo F818170 Used SM13CrM110 25 3.50 2.99 9.2 13.8 Sumitomo F51C102
Hyper 13Cr-110 25 4.50 3.90 13.5 15.0 Kawasaki 470892 13 Cr-85 25 4.50 3.90 13.5 15.0 Kawasaki 70889
825 36 4.50 3.90 13.5 15.0 Special Metals ? KOHP-1-13Cr110 25 5.50 4.778 20 15.2 Kawasaki Used
NK15Cr110 25 5.50 4.78 20 15.2 Nippon Kokan Used 13 Cr-95 25 4.50 3.92 13.5 15.5 Nippon Kokan 2789
Hyper 13Cr-110 25 5.50 4.89 17 18.0 Kawasaki 70873 NK15Cr95 25 4.50 3.83 15.1 13.4 Nippon Kokan ?
October 2002 Page 15 of 103 SES/TQSI/Hecate

DEA-130 MODERNIZATION OF TUBULAR COLLAPSE PERFORMANCE PROPERTIES
6.0 DESCRIPTION OF TESTS PERFORMED
6.1 MATERIAL YIELD STRENGTH TESTS
Tension tests provide information on the strength and ductility of materials under uniaxial axial stresses. This information is useful in quality control, comparison of materials as well as static strength requirements. In its simplest form, the tension test is accomplished by gripping opposite ends of a test specimen. An axial force is then applied, resulting in gradual elongation and eventual fracture of the test specimen. During this process force extension data, a quantitative measure of how the test specimen deforms under the applied force, is monitored and recorded. The mechanical properties determined from the tension test include:
• Elastic Deformation properties o Modulus of elasticity (Young’s Modulus) o Poisson’s Ratio
• Ductility Properties o Elongation o Reduction of Area
• Strain-Hardening Characteristics • Yield Strength • Ultimate Tensile Strength
Each of the collapse samples selected from the manufacturers was material tested by the manufacturer. The test was conducted following the requirements outlined in ASTM E8. Test specimens were machined from each end of the collapse samples selected and labeled as “End” and “Middle”. These test specimens were machined into round bar or strip specimens, shown in Figure 6-1, depending on the testing machine capacity and the collapse sample wall thickness.
FIGURE 6-1 Tensile Test Specimen Types
October 2002 Page 16 of 103 SES/TQSI/Hecate

DEA-130 MODERNIZATION OF TUBULAR COLLAPSE PERFORMANCE PROPERTIES
In the pre-testing process various data points would be collected to determine the resultant elastic, ductility, yield and tensile strength in the post-testing phase of the operation. These data points are as follows:
Pre-Test Measurements: Overall Length Distance between Shoulders Gage Length Diameter or Width Width of Grip Section Radius of Fillet Cross Sectional Area
During the actual testing a comparison between stress and strain was recorded and provided on a diagram to provide accuracy in determining specific properties, i.e., modulus of elasticity, etc. As defined in the latest edition of API Specification 5CT, the actual yield point of each test specimen was determined at a specified Total Extension Under Load of Gauge Length. The extension point at which these strengths were measured, varied by grade (0.50% through 95 yield material, 0.60% for 110 yield material and 0.65% for 125 yield material).
Upon reaching the ultimate strength of the test specimen (fracture point), post test measurements were completed to compare against the pre-test measurements. The results for each specimen tested are detailed in Section 11.5 of this report.
6.2 COLLAPSE TESTS
The SWRI normal procedure for collapse tests is given in Appendix A. Their procedure includes making pre-test measurements of the pipe at the mid-length of the pipe, in accordance with API Bul 5C3. The measurements consist of the average outside diameter (OD) using a pi tape, maximum OD for ovality, minimum OD for ovality, and eight wall thickness readings spaced 45° apart.
The SC decided that more than one set of pre-test measurements would give more data and be beneficial for data reduction and predicting pipe collapse pressure. It was decided that pre-test pipe measurements would be made in 1D increments along the length. The pipe sample length was 8D and therefore nine sets of pre-test measurements were taken and recorded for each sample. The pipe sample length of 8D resulted from meetings of the ISO 10400 workgroup (WG2b) during which some members presented data that showed shorter sample lengths tended to give unrealistically high collapse pressures. The group had determined that an unrestrained sample length of 8D was sufficient to give true collapse pressure.
A list of instructions for handling and testing the pipe samples was prepared by SES and approved by the SC. On November 7, 2000, these instructions were provided to SWRI for testing the DEA – 130 samples, which were as follows:
October 2002 Page 17 of 103 SES/TQSI/Hecate

DEA-130 MODERNIZATION OF TUBULAR COLLAPSE PERFORMANCE PROPERTIES
1. Cut pipe sample length to L = 8D (or as required for testing) and square the ends as required.
2. Save the excess pipe with clear identification as to the manufacturer and pipe sample number. Some residual stress measurements may be performed at a later time.
3. Pre test measurements: • Record wall, average OD (pi tape) and ovality (max OD and min OD) in
increments of 1D along the length (9 increments total) per API 5C3. • Record overall length and weight of each sample.
4. Perform collapse test and record collapse pressure.
5. Post test observations.
6. Record location/direction of the ovality relative to the eight wall thickness measurements.
7. Digital photographs of typical setup and samples (not all samples).
8. All data to be provided in Excel spreadsheet.
9. Material tensile tests? To be determined later. If done, will use excess material.
10. Store the test samples for at least 12 months before scrapping and notify SES before doing so.
Figure 6-2 is a spreadsheet that was written by SES, approved by the SC and provided to SWRI for recording the pre-test measurements, collapse pressure and post-test observation of where the collapse occurred. The spreadsheet also made several calculations such as average thickness and eccentricity. The length and weight of each pipe sample was measured and recorded on the sheet. All pipe sample data was given on this one page spreadsheet and the SWRI / API 5C3 reporting format was not used.
Figures 6-3 and 6-4 are photographs that show a typical test setup and test sample.
The collapse test results for all manufacturers are given in Appendix B.
October 2002 Page 18 of 103 SES/TQSI/Hecate

DEA-130 MODERNIZATION OF TUBULAR COLLAPSE PERFORMANCE PROPERTIES
FIGURE 6-2 SWRI Collapse Test Data SOUTHWEST RESEARCH INSTITUTE
DEA-130 PIPE COLLAPSE DATA SHEET Filename : Example
Pipe Sample: Example Sample Collapse Pressure : 11,684 Psig Grade: Example Failure Location (small axis) 135/315 DEG
Nom.Weight(lb/ft.) 53.50 Sample Weight: 341.9 lbs. Test Date : Example Pipe O.D. 9 5/8 Pipe Length: 77 inch
Actual Weight(lb/ft.) 53.33 Longitude End "A" 1 x O.D. 2 x O.D. 3 x O.D. 4 x O.D. 5 x O.D. 6 x O.D. 7 x O.D. End "B" AVG Radial Axis Wall Thickness (inches) Degrees 0 0.565 0.570 0.570 0.565 0.568 0.572 0.558 0.555 0.550 0.564
45 0.537 0.539 0.542 0.547 0.549 0.548 0.536 0.535 0.530 0.540 90 0.550 0.553 0.556 0.556 0.560 0.560 0.559 0.560 0.559 0.557
135 0.538 0.535 0.536 0.538 0.543 0.537 0.542 0.546 0.550 0.541 180 0.555 0.552 0.552 0.553 0.559 0.558 0.560 0.565 0.568 0.558 225 0.533 0.529 0.526 0.526 0.531 0.528 0.535 0.528 0.536 0.530 270 0.543 0.539 0.535 0.538 0.529 0.532 0.524 0.525 0.531 0.533 315 0.540 0.541 0.539 0.540 0.532 0.533 0.517 0.521 0.527 0.532
Avg.Thickness 0.545 0.545 0.545 0.545 0.546 0.546 0.541 0.542 0.544 0.544 Avg O.D. (PI-Tape) 9.715 9.717 9.718 9.718 9.715 9.715 9.716 9.716 9.716 9.716 Actual O.D. @ 0/180 9.714 9.707 9.715 9.708 9.702 9.706 9.711 9.705 9.716 9.709 Ovality Gauge Max (+) .003/270 .004/270 .000/270 .007/270 .015/270 .000/270 .000/270 .012/270 .005/270 Ovality Gauge Min (-) .005/135 .005/135 .006/135 .012/135 .000/135 .005/135 .015/135 .000/135 .005/135 Ovality Max & Min indicated in inches. 2nd number represents location in degrees. Ovality, (Max-Min)/Avg 0.08% 0.09% 0.06% 0.20% 0.15% 0.05% 0.15% 0.12% 0.10% 0.11% Eccentricity, 0-180 1.83% 3.30% 3.31% 2.20% 1.65% 2.56% 0.37% 1.85% 3.31% 2.26% (tmax-tmin)/tavg 45-225 0.73% 1.84% 2.94% 3.85% 3.29% 3.66% 0.18% 1.29% 1.10% 2.10%
90-270 1.28% 2.57% 3.86% 3.30% 5.67% 5.13% 6.47% 6.46% 5.15% 4.43% 135-315 0.37% 1.10% 0.55% 0.37% 2.01% 0.73% 4.62% 4.61% 4.23% 2.07%
Actual Avg D/T 17.82 17.84 17.85 17.82 17.78 17.79 17.95 17.93 17.86 17.85 T-Max 0.572 T-Min 0.517 T-Avg. 0.544 STDEV. 0.013791512
Pipe Sample Failure Details: SAMPLE FLATTENED 2D TO 6D W/SMALL AXIS AT 135 & 315 DEG
135 DEG 315 DEG
October 2002 Page 19 of 103 SES/TQSI/Hecate

DEA-130 MODERNIZATION OF TUBULAR COLLAPSE PERFORMANCE PROPERTIES
FIGURE 6-3 Typical Collapse Sample Being Installed Into Chamber
FIGURE 6-4
Typical Collapsed Samples
October 2002 Page 20 of 103 SES/TQSI/Hecate

DEA-130 MODERNIZATION OF TUBULAR COLLAPSE PERFORMANCE PROPERTIES
6.3 RESIDUAL STRESS TESTS
Finished pipe contains residual stresses that are a result of the manufacturing process. The ISO 10400 workgroup has determined that the amount of residual stress is a significant factor to the collapse resistance of pipe and one of the variables in the calculation of collapse pressure is the residual stress in the circumferential direction. Therefore, it was decided that residual stresses for the pipe samples tested in this program were required.
An investigation was made to learn more about pipe residual stress and how it was measured. The following information was found: • Currently pipe mills do little to none measurements for residual stress. This was
determined from a questionnaire that was sent by the ISO 10400 workgroup. What little work that has been done used the split ring method (discussed below).
• A popular method for circumferential residual stress in pipe is the split ring method. One of the first known methods was by D. K. Crampton in 1930 in his paper “Internal Stress and Cracking in Brass Tubes”1. Crampton gave an equation for calculating the residual stress that is based on pipe OD and wall thickness measurements. A ring is removed from the pipe, OD and walls measured, the ring is split longitudinally and the OD is measured again. A summary of Crampton’s paper is given below:
1. The majority of this paper deals with metallurgical aspects of season and corrosion cracking of brass tubes. A small part of the paper is concerned with residual stresses from manufacturing, and a summary of this is given below.
2. Residual stresses by the method of Heyn and Bauer and Sachs is stated as being the proper ones to use for intensity and distribution of residual stresses. However, Crampton says these are too tedious and prohibitive to use.
3. Crampton discusses both longitudinal strips in the tubes for measuring longitudinal residual stress and circumferential strips for measuring circumferential stress. For DEA-130, collapse of pipe is only concerned with circumferential stress.
4. Crampton used the more general method for determining circumferential residual stress proposed by Hatfield and Thirkell. He simplified their method by using wider rings and he investigated the effect of the width of the ring.
5. Circumferential residual stress measurements were made on 2-1/8” OD x 1/8” wall brass tubes using the split ring method.
6. Residual circumferential stress was calculated from: S = ET/2((R1-R2)/(R1xR2), where E = modulus of elasticity T = wall thickness R1 = final mean radius of curvature
October 2002 Page 21 of 103 SES/TQSI/Hecate
DEA-130 MODERNIZATION OF TUBULAR COLLAPSE PERFORMANCE PROPERTIES
R2 = initial mean radius of curvature
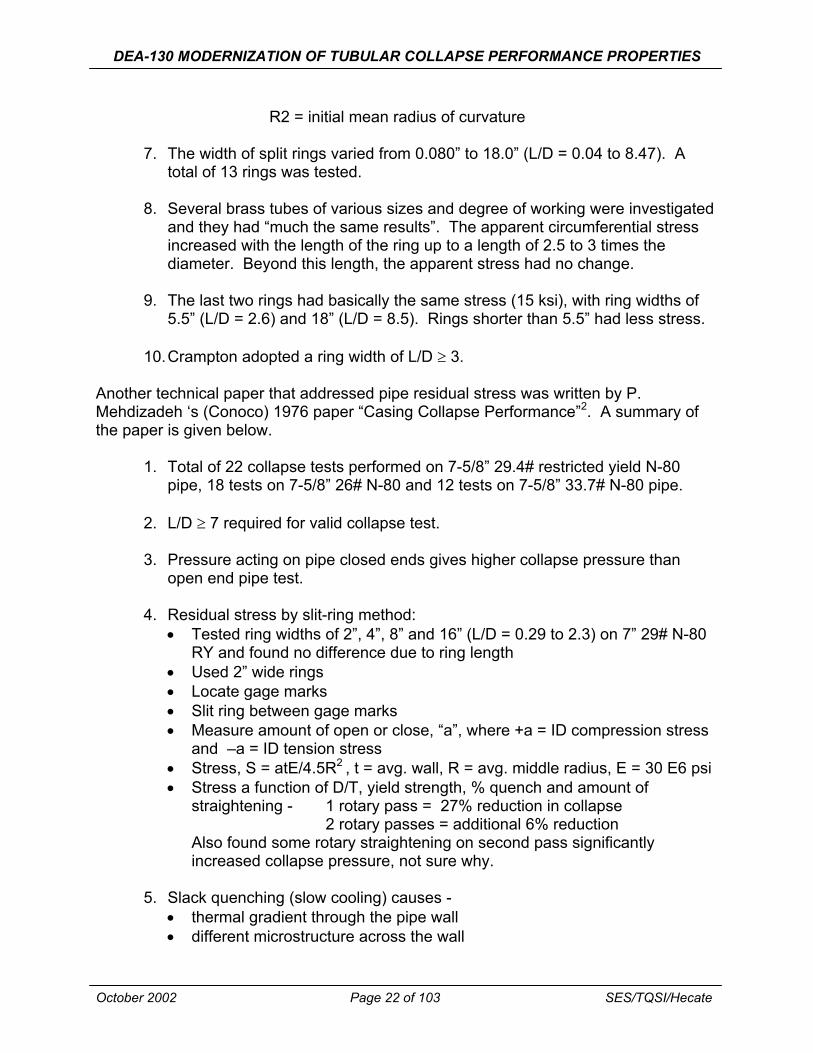
7. The width of split rings varied from 0.080” to 18.0” (L/D = 0.04 to 8.47). A total of 13 rings was tested.
8. Several brass tubes of various sizes and degree of working were investigated and they had “much the same results”. The apparent circumferential stress increased with the length of the ring up to a length of 2.5 to 3 times the diameter. Beyond this length, the apparent stress had no change.
9. The last two rings had basically the same stress (15 ksi), with ring widths of 5.5” (L/D = 2.6) and 18” (L/D = 8.5). Rings shorter than 5.5” had less stress.
10.Crampton adopted a ring width of L/D ≥ 3.
Another technical paper that addressed pipe residual stress was written by P. Mehdizadeh ‘s (Conoco) 1976 paper “Casing Collapse Performance”2. A summary of the paper is given below.
1. Total of 22 collapse tests performed on 7-5/8” 29.4# restricted yield N-80 pipe, 18 tests on 7-5/8” 26# N-80 and 12 tests on 7-5/8” 33.7# N-80 pipe.
2. L/D ≥ 7 required for valid collapse test.
3. Pressure acting on pipe closed ends gives higher collapse pressure than open end pipe test.
4. Residual stress by slit-ring method: • Tested ring widths of 2”, 4”, 8” and 16” (L/D = 0.29 to 2.3) on 7” 29# N-80
RY and found no difference due to ring length • Used 2” wide rings • Locate gage marks • Slit ring between gage marks • Measure amount of open or close, “a”, where +a = ID compression stress
and –a = ID tension stress • Stress, S = atE/4.5R2 , t = avg. wall, R = avg. middle radius, E = 30 E6 psi • Stress a function of D/T, yield strength, % quench and amount of
straightening - 1 rotary pass = 27% reduction in collapse 2 rotary passes = additional 6% reduction
Also found some rotary straightening on second pass significantly increased collapse pressure, not sure why.
5. Slack quenching (slow cooling) causes -• thermal gradient through the pipe wall • different microstructure across the wall
October 2002 Page 22 of 103 SES/TQSI/Hecate
DEA-130 MODERNIZATION OF TUBULAR COLLAPSE PERFORMANCE PROPERTIES
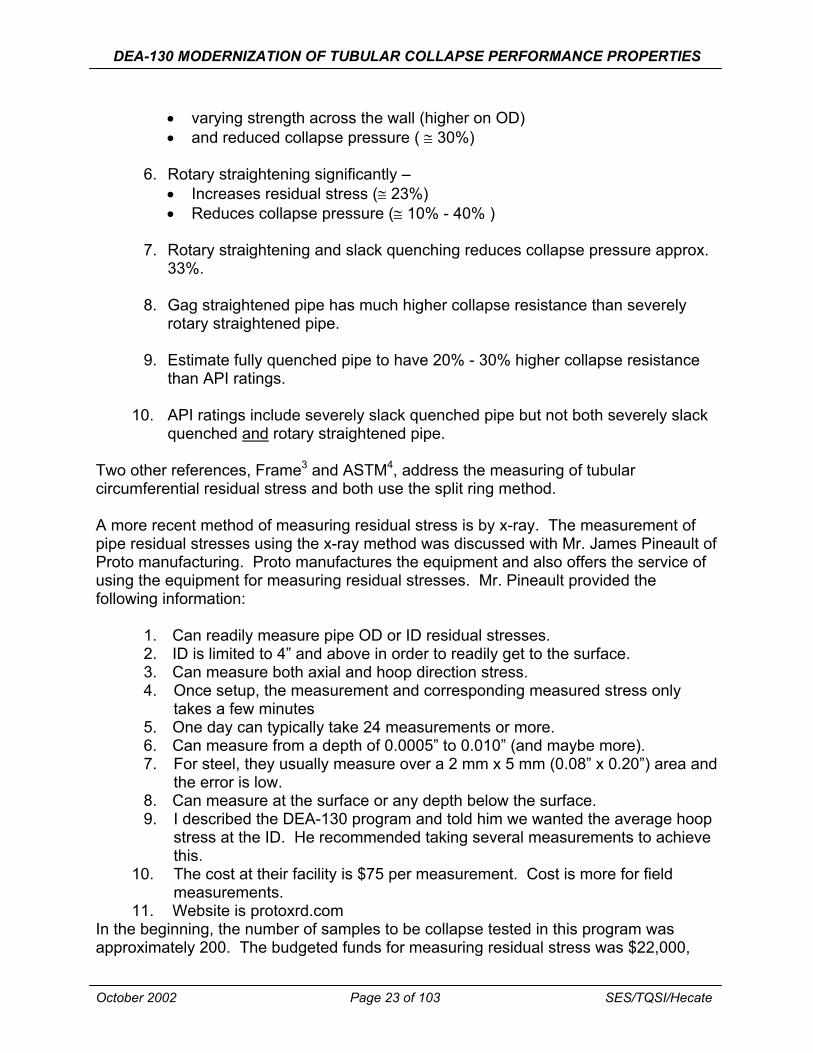
• varying strength across the wall (higher on OD) • and reduced collapse pressure ( ≅ 30%)
6. Rotary straightening significantly – • Increases residual stress (≅ 23%) • Reduces collapse pressure (≅ 10% - 40% )
7. Rotary straightening and slack quenching reduces collapse pressure approx. 33%.
8. Gag straightened pipe has much higher collapse resistance than severely rotary straightened pipe.
9. Estimate fully quenched pipe to have 20% - 30% higher collapse resistance than API ratings.
10. API ratings include severely slack quenched pipe but not both severely slack quenched and rotary straightened pipe.
Two other references, Frame3 and ASTM4, address the measuring of tubular circumferential residual stress and both use the split ring method.
A more recent method of measuring residual stress is by x-ray. The measurement of pipe residual stresses using the x-ray method was discussed with Mr. James Pineault of Proto manufacturing. Proto manufactures the equipment and also offers the service of using the equipment for measuring residual stresses. Mr. Pineault provided the following information:
1. Can readily measure pipe OD or ID residual stresses. 2. ID is limited to 4” and above in order to readily get to the surface. 3. Can measure both axial and hoop direction stress. 4. Once setup, the measurement and corresponding measured stress only
takes a few minutes 5. One day can typically take 24 measurements or more. 6. Can measure from a depth of 0.0005” to 0.010” (and maybe more). 7. For steel, they usually measure over a 2 mm x 5 mm (0.08” x 0.20”) area and
the error is low. 8. Can measure at the surface or any depth below the surface. 9. I described the DEA-130 program and told him we wanted the average hoop
stress at the ID. He recommended taking several measurements to achieve this.
10. The cost at their facility is $75 per measurement. Cost is more for field measurements.
11. Website is protoxrd.com In the beginning, the number of samples to be collapse tested in this program was approximately 200. The budgeted funds for measuring residual stress was $22,000,
October 2002 Page 23 of 103 SES/TQSI/Hecate
DEA-130 MODERNIZATION OF TUBULAR COLLAPSE PERFORMANCE PROPERTIES
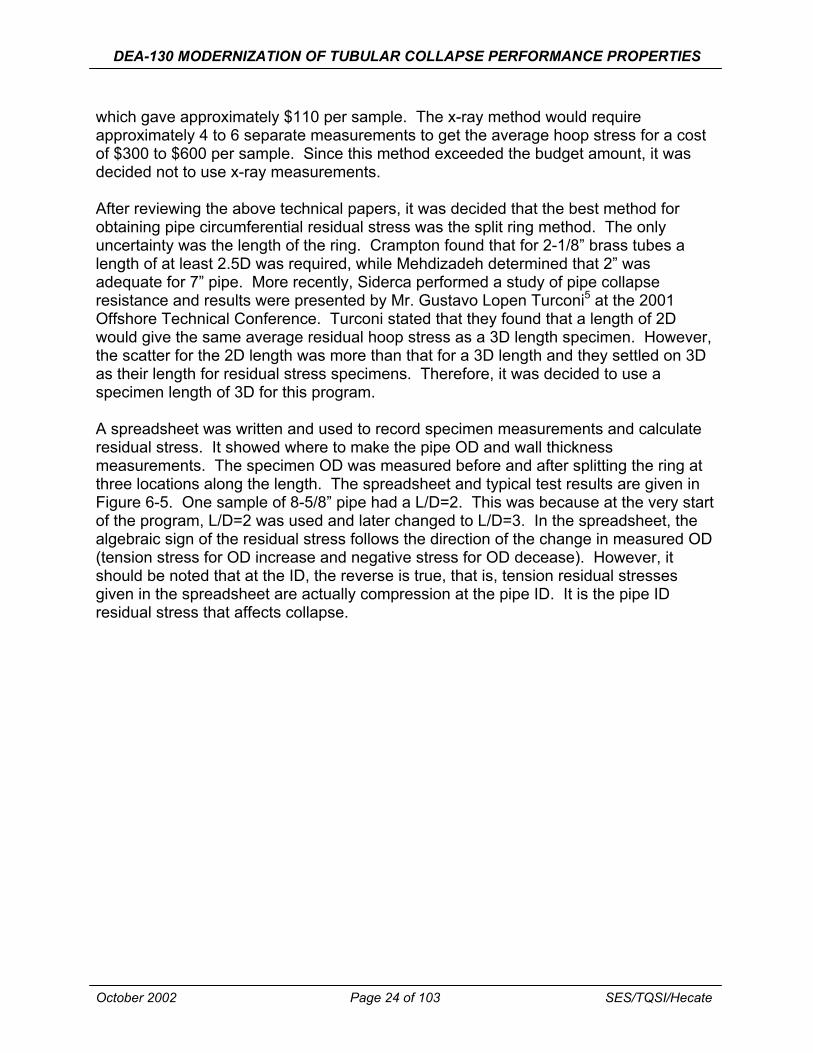
which gave approximately $110 per sample. The x-ray method would require approximately 4 to 6 separate measurements to get the average hoop stress for a cost of $300 to $600 per sample. Since this method exceeded the budget amount, it was decided not to use x-ray measurements.
After reviewing the above technical papers, it was decided that the best method for obtaining pipe circumferential residual stress was the split ring method. The only uncertainty was the length of the ring. Crampton found that for 2-1/8” brass tubes a length of at least 2.5D was required, while Mehdizadeh determined that 2” was adequate for 7” pipe. More recently, Siderca performed a study of pipe collapse resistance and results were presented by Mr. Gustavo Lopen Turconi5 at the 2001 Offshore Technical Conference. Turconi stated that they found that a length of 2D would give the same average residual hoop stress as a 3D length specimen. However, the scatter for the 2D length was more than that for a 3D length and they settled on 3D as their length for residual stress specimens. Therefore, it was decided to use a specimen length of 3D for this program.
A spreadsheet was written and used to record specimen measurements and calculate residual stress. It showed where to make the pipe OD and wall thickness measurements. The specimen OD was measured before and after splitting the ring at three locations along the length. The spreadsheet and typical test results are given in Figure 6-5. One sample of 8-5/8” pipe had a L/D=2. This was because at the very start of the program, L/D=2 was used and later changed to L/D=3. In the spreadsheet, the algebraic sign of the residual stress follows the direction of the change in measured OD (tension stress for OD increase and negative stress for OD decease). However, it should be noted that at the ID, the reverse is true, that is, tension residual stresses given in the spreadsheet are actually compression at the pipe ID. It is the pipe ID residual stress that affects collapse.
October 2002 Page 24 of 103 SES/TQSI/Hecate

DEA-130 MODERNIZATION OF TUBULAR COLLAPSE PERFORMANCE PROPERTIES
FIGURE 6-5 Example Residual Stress Data
October 2002 Page 25 of 103 SES/TQSI/Hecate
DEA-130 MODERNIZATION OF TUBULAR COLLAPSE PERFORMANCE PROPERTIES
7.0 SUMMARY OF COLLAPSE AND RESIDUAL STRESS TESTS
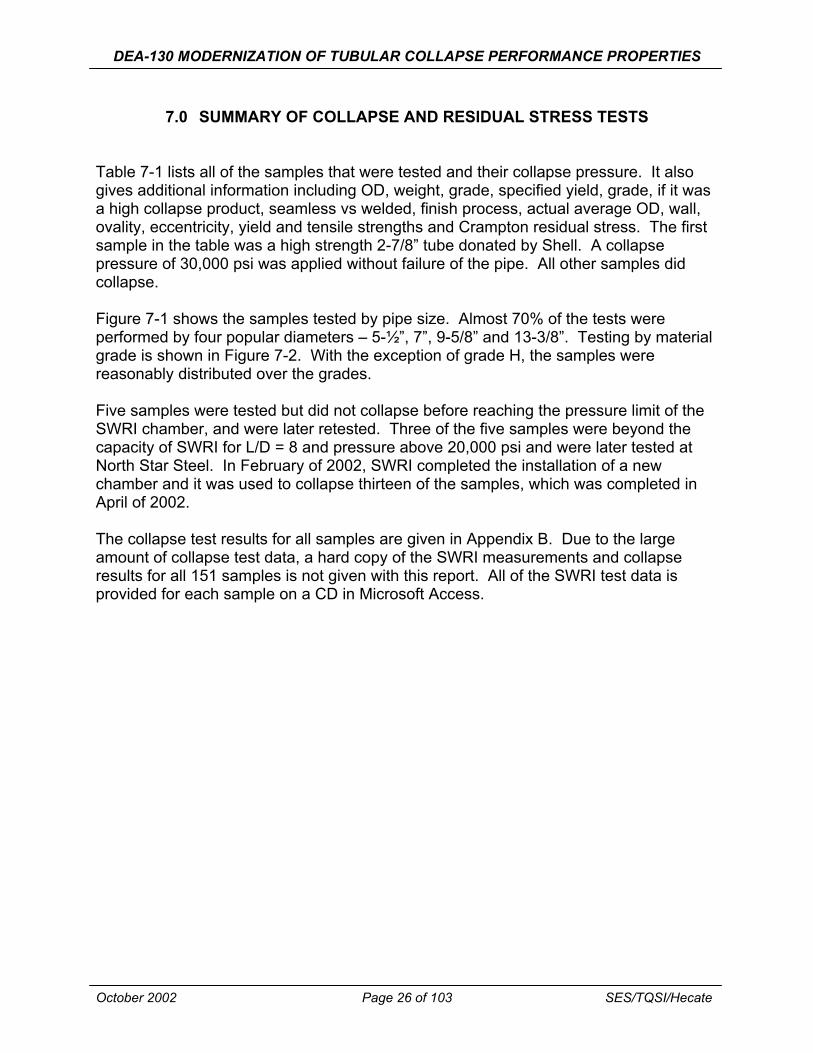
Table 7-1 lists all of the samples that were tested and their collapse pressure. It also gives additional information including OD, weight, grade, specified yield, grade, if it was a high collapse product, seamless vs welded, finish process, actual average OD, wall, ovality, eccentricity, yield and tensile strengths and Crampton residual stress. The first sample in the table was a high strength 2-7/8” tube donated by Shell. A collapse pressure of 30,000 psi was applied without failure of the pipe. All other samples did collapse.
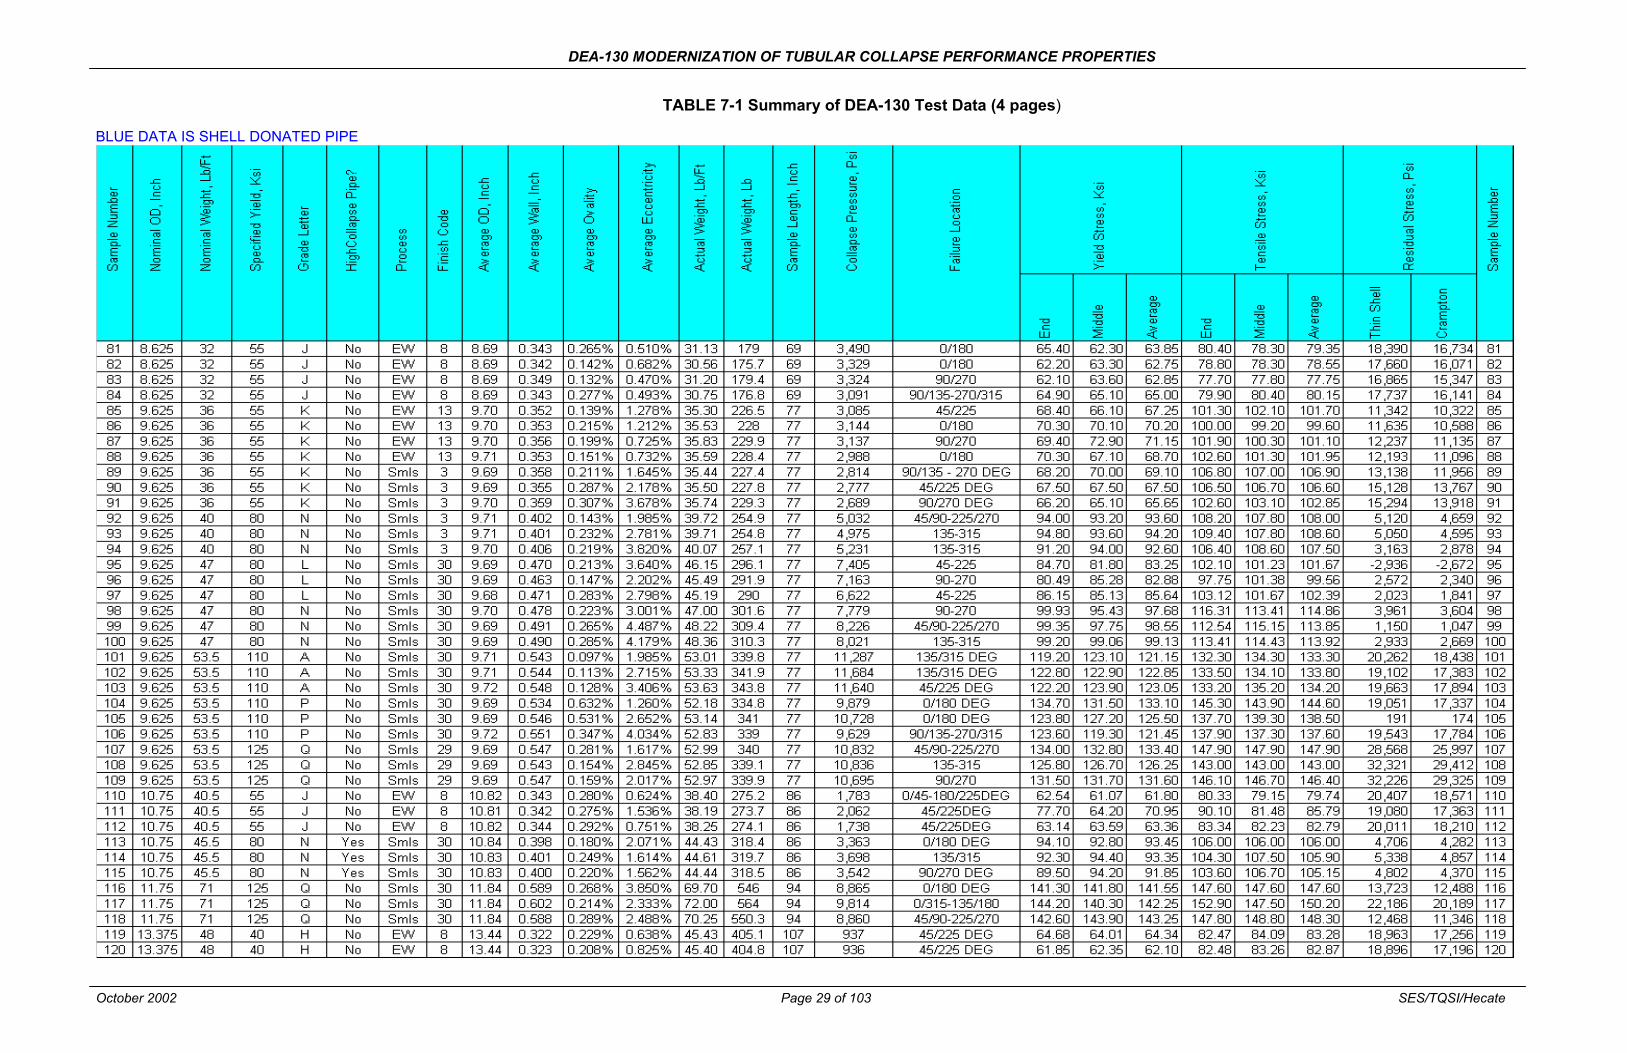
Figure 7-1 shows the samples tested by pipe size. Almost 70% of the tests were performed by four popular diameters – 5-½”, 7”, 9-5/8” and 13-3/8”. Testing by material grade is shown in Figure 7-2. With the exception of grade H, the samples were reasonably distributed over the grades.
Five samples were tested but did not collapse before reaching the pressure limit of the SWRI chamber, and were later retested. Three of the five samples were beyond the capacity of SWRI for L/D = 8 and pressure above 20,000 psi and were later tested at North Star Steel. In February of 2002, SWRI completed the installation of a new chamber and it was used to collapse thirteen of the samples, which was completed in April of 2002.
The collapse test results for all samples are given in Appendix B. Due to the large amount of collapse test data, a hard copy of the SWRI measurements and collapse results for all 151 samples is not given with this report. All of the SWRI test data is provided for each sample on a CD in Microsoft Access.
October 2002 Page 26 of 103 SES/TQSI/Hecate

DEA-130 MODERNIZATION OF TUBULAR COLLAPSE PERFORMANCE PROPERTIES
TABLE 7-1 Summary of DEA-130 Test Data (4 pages)
BLUE DATA IS SHELL DONATED PIPE
October 2002 Page 27 of 103 SES/TQSI/Hecate

DEA-130 MODERNIZATION OF TUBULAR COLLAPSE PERFORMANCE PROPERTIES
TABLE 7-1 Summary of DEA-130 Test Data (4 pages)
BLUE DATA IS SHELL DONATED PIPE
October 2002 Page 28 of 103 SES/TQSI/Hecate
DEA-130 MODERNIZATION OF TUBULAR COLLAPSE PERFORMANCE PROPERTIES
TABLE 7-1 Summary of DEA-130 Test Data (4 pages)
BLUE DATA IS SHELL DONATED PIPE
October 2002 Page 29 of 103 SES/TQSI/Hecate

DEA-130 MODERNIZATION OF TUBULAR COLLAPSE PERFORMANCE PROPERTIES
TABLE 7-1 Summary of DEA-130 Test Data (4 pages)
BLUE DATA IS SHELL DONATED PIPE
Note: Grade A = Proprietary LC = 13% Chrome –80 All others are API
October 2002 Page 30 of 103 SES/TQSI/Hecate
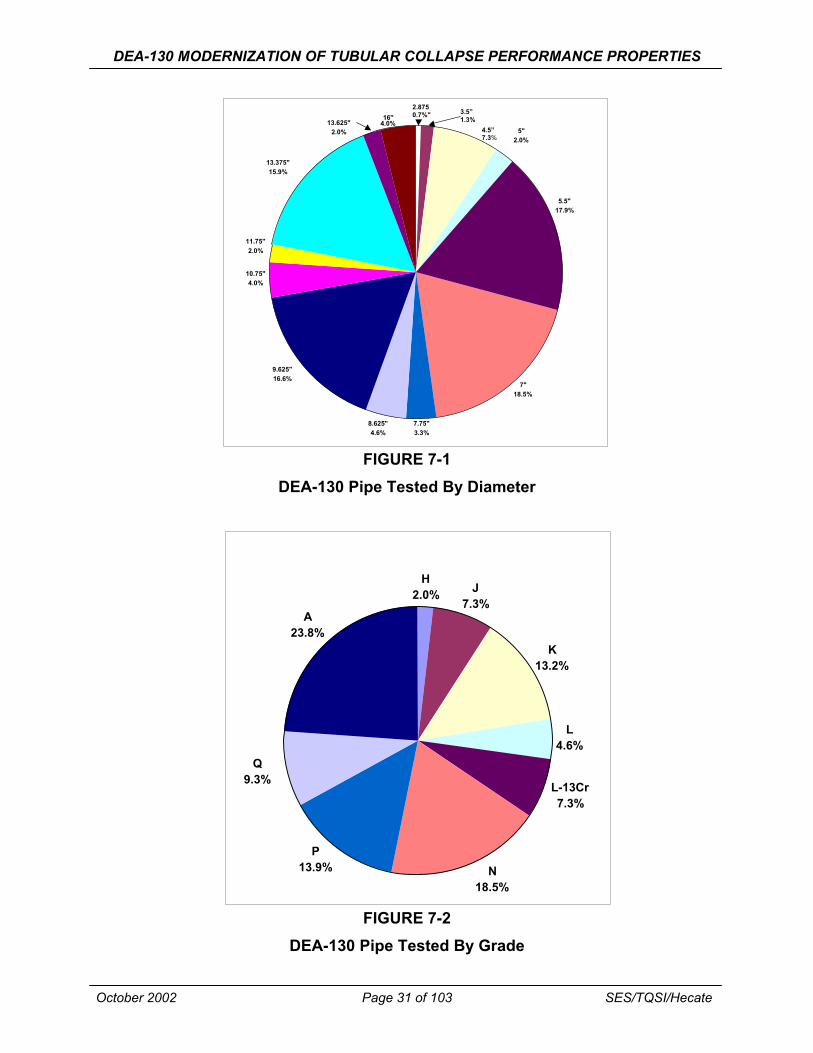
Figure 8.1 Dea-130 pipe tested by diameter
Figure 8.2 Dea-130 pipe tested by grade
DEA-130 MODERNIZATION OF TUBULAR COLLAPSE PERFORMANCE PROPERTIES
5" 2.0%
5.5" 17.9%
7" 18.5%
7.75" 3.3%
8.625" 4.6%
9.625" 16.6%
10.75" 4.0%
11.75" 2.0%
13.375" 15.9%
13.625" 2.0%
16" 4.0%
2.875 0.7%" 3.5”
1.3% 4.5” 7.3%
FIGURE 7-1
H 2.0% J
7.3%
K 13.2%
L-13Cr 7.3%
N 18.5%
P 13.9%
Q 9.3%
A 23.8%
L 4.6%
DEA-130 Pipe Tested By Diameter
FIGURE 7-2 DEA-130 Pipe Tested By Grade
October 2002 Page 31 of 103 SES/TQSI/Hecate
DEA-130 MODERNIZATION OF TUBULAR COLLAPSE PERFORMANCE PROPERTIES
8.0 SPECIAL SOFTWARE
During acquisition and combing of the acquired data for DEA-130 a number of tools and data repositories were developed.
October 2002 Page 32 of 103 SES/TQSI/Hecate
DEA-130 MODERNIZATION OF TUBULAR COLLAPSE PERFORMANCE PROPERTIES
By design, a central repository of the entire effort is an Access database named Succumb.mdb.
suc·cumb (se-kùm¹) verb, intransitive 1. To submit to an overpowering force or yield to an overwhelming desire; give up or give in. See synonyms at
yield.
Data in Succumb.mdb is quite raw and assumes that downstream tools will be used to examine the data. Making a copy of Succumb.mdb and shrouding all manufacturer-specifying information accomplished publication of the data in Succumb.mdb. This public version of the database is referred to as the WG2b version. This was a result of making the first public version available to API/ISO TC67/SC5/WG2b.
This section discusses some of the downstream tools.
October 2002 Page 33 of 103 SES/TQSI/Hecate

DEA-130 MODERNIZATION OF TUBULAR COLLAPSE PERFORMANCE PROPERTIES
8.1 THE DATABASE
Residing on your delivery CD is an Access Database. The schema for that database is shown below.
Relationships are shown with the connecting lines. Depending on the delivery, the name of the database can be Succumb.mdb, WG2b.mdb or YourName.mdb.
October 2002 Page 34 of 103 SES/TQSI/Hecate

DEA-130 MODERNIZATION OF TUBULAR COLLAPSE PERFORMANCE PROPERTIES
8.1.1 Table Manufactures
There is one record in this table for each manufacture that participated in DEA-130. Manufacturers contributed by providing pipe for testing.
Manufacturer ID is a unique number for each manufacturer. Generally these are useless numbers and exist only to establish the relationship with Table Pipes.
Company Number identifies the manufacturer in a standard way. These numbers were used as prefixes on physical pipes and in all reporting.
Company Name is the text string name.
Mill was initially intended to specify the source of the particular pipe but was never fully implemented. In the DEA-130 internal database, it is used to indicate manufacturer for the Shell donated pipes.
***Note: In all public releases of the database, all manufacturer-revealing information in this table has been obfuscated. In manufacturer specific versions of the database, the identified manufacturer’s information has been restored.
8.1.2 Table Pipes
There is one record in this table for each pipe that had any testing done on it. There are 216 records in this table.
Pipe ID is a unique number that only exists to allow relationships with pipes. It is often used for brevity (e.g. Pipe 3). Pipe ID is not the same in all databases for security purposes.
Name is the long, text name of the pipe. In the public versions of the database, this is a random number.
Manufacturer ID is just a relationship link back to the table of that name.
Mill was never used.
Heat reflects the manufacturers report. This value is always blank in public versions of the database.
Nominal OD, Nominal Weight, Nominal Yield Strength and Grade Letter are self explanatory. Grade Letter is one character representing the API grade where possible. The letter ‘A’ is used to indicate a proprietary grade.
Grade is a character string assigned by the manufacturer and oft times contains information about manufacturer specific yields and/or processes. For this reason, the
October 2002 Page 35 of 103 SES/TQSI/Hecate

DEA-130 MODERNIZATION OF TUBULAR COLLAPSE PERFORMANCE PROPERTIES
public version is either blank or contains the characters ‘Cr’ when those letters were included by the manufacturer to indicate that chromium was used in the pipe.
High Collapse is a Boolean (Yes/No) that indicates if the manufacturer reported that with the pipe.
Process is either ‘Smls’ indicating seamless or ‘EW’ indicating some kind of electric weld process.
Finish is a number {1…36} indicating the finishing process. Refer to the table in Section 8.2.7 for details.
Actual Weight, Sample Weight and Sample Length are self-explanatory.
bCollapsed is a Boolean (Yes/No) that indicates if the pipe actually collapsed. There was one instance where the attempt to collapse the pipe failed. The CollapsePressure reported for that pipe indicated the maximum pressure reached in the failed attempt. With that one exception, Collapse Pressure is the actual failed (collapse) pressure.
Failure Location and Failure Details were reports by SWRI from observations on the collapsed pipe. In the SWRI reports, Failure Location is “Failure Location (small axis)” and typically is given like “90-270 DEG”. Failure Details oft times includes the Failure Location information as well as some indication at to the length of the collapsed region. For example, “SAMPLE FLATTENED AT 90/270 DEG FROM END A TO 7D”. The angular reference was arbitrary per sample but was used consistently throughout the reporting. Thus, the angular information in wall thickness and eccentricity are directly related to the collapse angle information.
Test Date is the date of the test. This is not included in public versions of the database.
Yield End, Yield Mid and Yield represent at most yield strength values from two tensile tests. In some cases only one value was reported. It was stored in Yield while the other two Yield fields were left blank. If two Yield reports were made (i.e. Yield End and Yield Mid), then Yield was the simple average of those two.
Tensile End, Tensile Mid and Tensile were treated the same as Yield above.
RS Thin Wall and RS Crampton are the two common methods of residual stress calculations.
8.1.3 Tables ODs, Walls, Eccentricities, Ovalities
These represent the results of the sample measurements made by SWRI. Refer to Sections 8.2.3 to 8.2.6 for details.
October 2002 Page 36 of 103 SES/TQSI/Hecate
DEA-130 MODERNIZATION OF TUBULAR COLLAPSE PERFORMANCE PROPERTIES
8.1.4 Tables SS and SS Point
These two tables hold the full results of the tensile tests. There is one or two records in SS for each pipe and any number of records in SSPoint for each record in SS. In all cases, SSPoint data give stress in [psi] and strain in [%]. Refer to Section 8.2.8 for details.
8.1.5 Table Nominal Walls
This is an unrelated but handy table that lists Nominal information for about 245 tubes and pipes. Each record presents:
Casing Yes/No Is this pipe considered casing rather than tubing? OD In inches. Weight In pounds per foot. Wall In inches.
It is typically used is queries to attach a nominal wall thickness to a pipe in Table Pipes.
October 2002 Page 37 of 103 SES/TQSI/Hecate
DEA-130 MODERNIZATION OF TUBULAR COLLAPSE PERFORMANCE PROPERTIES
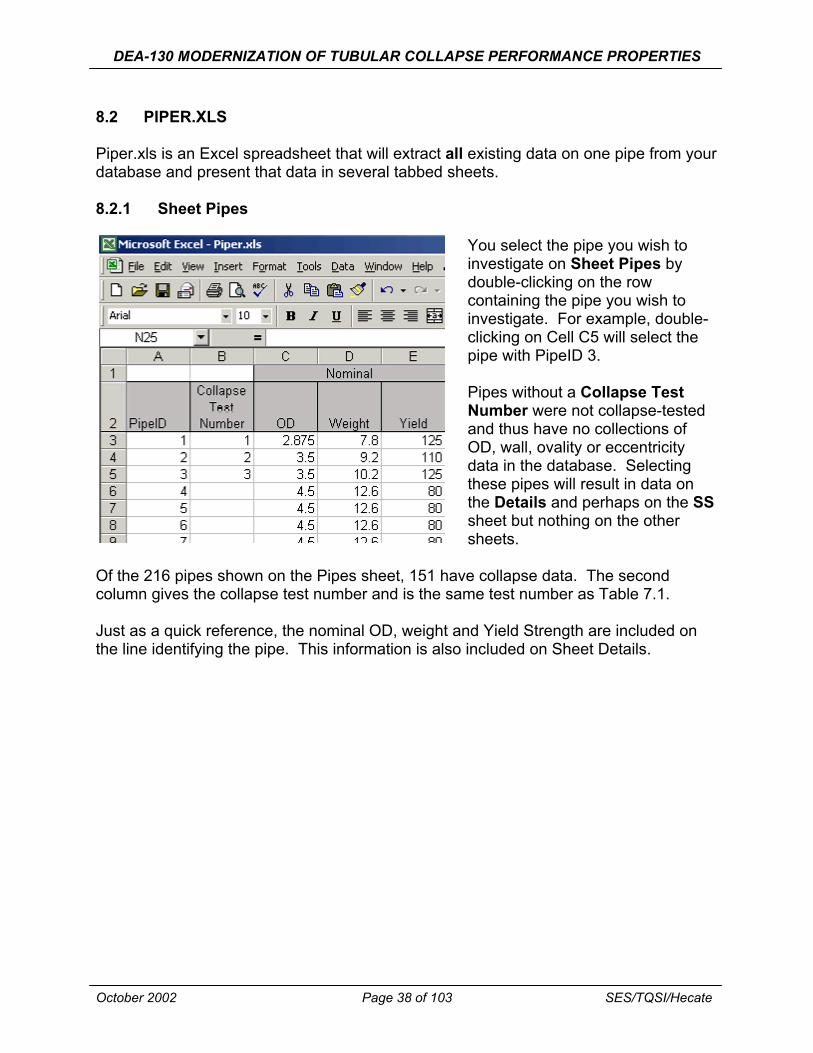
8.2 PIPER.XLS
Piper.xls is an Excel spreadsheet that will extract all existing data on one pipe from your database and present that data in several tabbed sheets.
8.2.1 Sheet Pipes
You select the pipe you wish to investigate on Sheet Pipes by double-clicking on the row containing the pipe you wish to investigate. For example, double-clicking on Cell C5 will select the pipe with PipeID 3.
Pipes without a Collapse TestNumber were not collapse-tested and thus have no collections of OD, wall, ovality or eccentricity data in the database. Selecting these pipes will result in data on the Details and perhaps on the SS sheet but nothing on the other sheets.
Of the 216 pipes shown on the Pipes sheet, 151 have collapse data. The second column gives the collapse test number and is the same test number as Table 7.1.
Just as a quick reference, the nominal OD, weight and Yield Strength are included on the line identifying the pipe. This information is also included on Sheet Details.
October 2002 Page 38 of 103 SES/TQSI/Hecate
DEA-130 MODERNIZATION OF TUBULAR COLLAPSE PERFORMANCE PROPERTIES
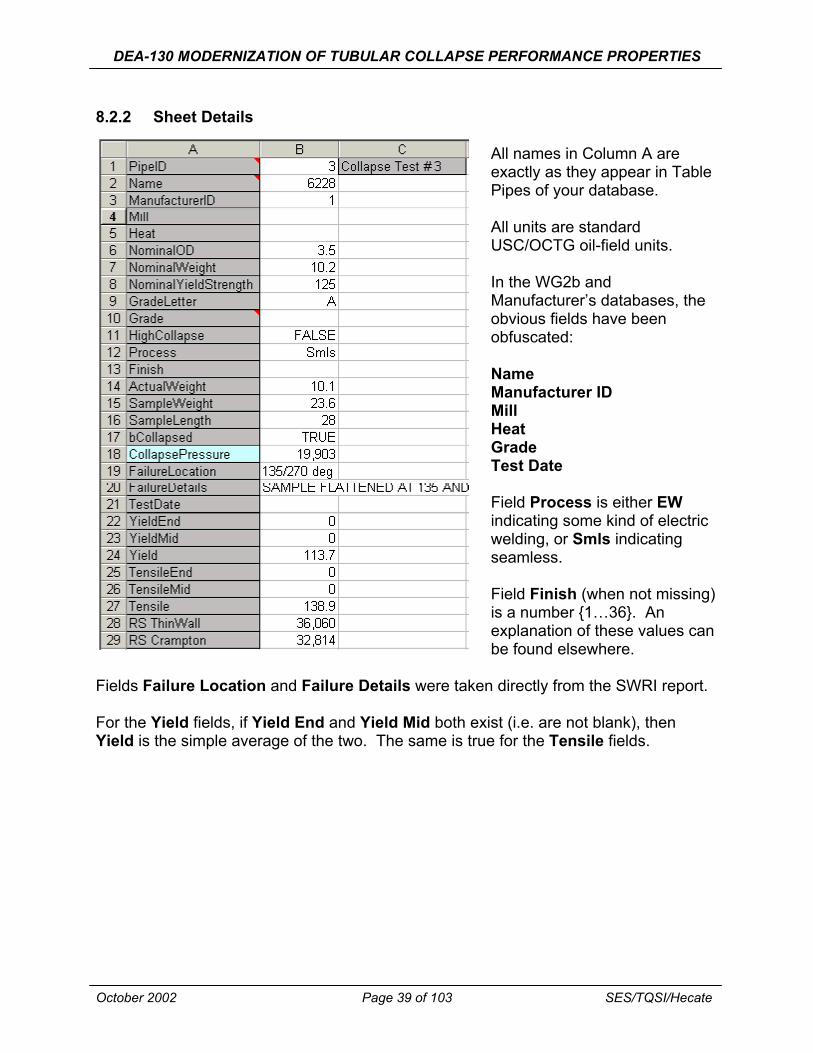
8.2.2 Sheet Details
All names in Column A are exactly as they appear in Table Pipes of your database.
All units are standard USC/OCTG oil-field units.
In the WG2b and Manufacturer’s databases, the obvious fields have been obfuscated:
Name Manufacturer ID Mill Heat Grade Test Date
Field Process is either EW indicating some kind of electric welding, or Smls indicating seamless.
Field Finish (when not missing) is a number {1…36}. An explanation of these values can be found elsewhere.
Fields Failure Location and Failure Details were taken directly from the SWRI report.
For the Yield fields, if Yield End and Yield Mid both exist (i.e. are not blank), then Yield is the simple average of the two. The same is true for the Tensile fields.
October 2002 Page 39 of 103 SES/TQSI/Hecate

DEA-130 MODERNIZATION OF TUBULAR COLLAPSE PERFORMANCE PROPERTIES
8.2.3 Sheet ODs
Assuming OD data exists for the selected pipe, Sheet ODs will present the 18 measures values.
Offset is reported in inches from the reference (arbitrarily selected) “End” and is the length along the sample in 1D increments.
OD is the outside diameter reported in inches at the specified Offset.
Source is: 0 -> Unknown 1 -> Pi Tape 2 -> OD Micrometer at 0°-180° position
There are 18 reports because both a Pi Tape and an OD Micrometer measurement were made at the end and then at eight offsets of 1D (i.e. one pipe diameter). Thus, in this example, it is clear that the Nominal OD of the pipe is 3½ inches.
All known OD data is reported in the plot.
October 2002 Page 40 of 103 SES/TQSI/Hecate
DEA-130 MODERNIZATION OF TUBULAR COLLAPSE PERFORMANCE PROPERTIES
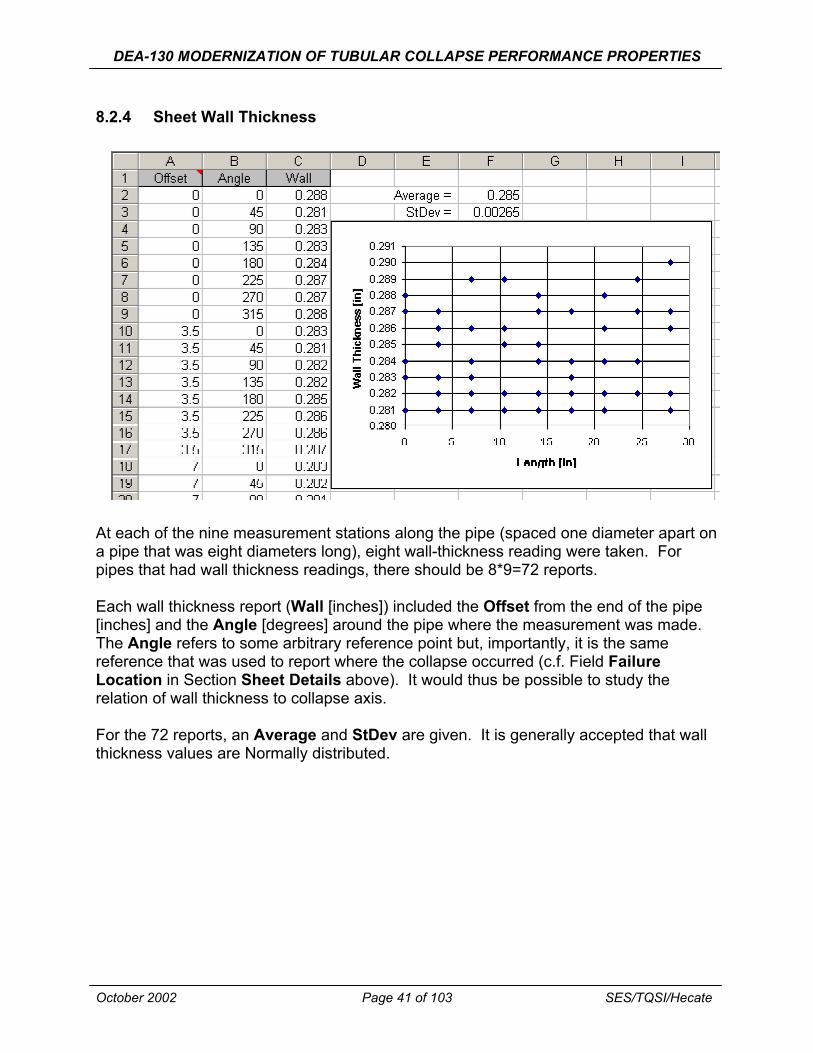
8.2.4 Sheet Wall Thickness
At each of the nine measurement stations along the pipe (spaced one diameter apart on a pipe that was eight diameters long), eight wall-thickness reading were taken. For pipes that had wall thickness readings, there should be 8*9=72 reports.
Each wall thickness report (Wall [inches]) included the Offset from the end of the pipe [inches] and the Angle [degrees] around the pipe where the measurement was made. The Angle refers to some arbitrary reference point but, importantly, it is the same reference that was used to report where the collapse occurred (c.f. Field Failure Location in Section Sheet Details above). It would thus be possible to study the relation of wall thickness to collapse axis.
For the 72 reports, an Average and StDev are given. It is generally accepted that wall thickness values are Normally distributed.
October 2002 Page 41 of 103 SES/TQSI/Hecate

DEA-130 MODERNIZATION OF TUBULAR COLLAPSE PERFORMANCE PROPERTIES
8.2.5 Sheet Ovalities
One Ovality report was made for each of the nine measurement stations along the pipe. Measurement stations were separated by one pipe diameter and pipes were cut to be eight diameters long.
Ovality is calculated as:
o = Gaugemax − Gaugemin * 100
Pi Tape(avg)
In the original reports from SWRI, some (but not all) of the OD gauge reports had angles reported with the gauge reports. These angles were not recorded in the database.
OD gauge reports (also not recorded per se in the database) were made as variations from the 0°-180° measured and reported OD.
October 2002 Page 42 of 103 SES/TQSI/Hecate

DEA-130 MODERNIZATION OF TUBULAR COLLAPSE PERFORMANCE PROPERTIES
8.2.6 Sheet Eccentricities
Eccentricity is calculated as:
t − t e = max min *100
tavg
where t is wall thickness.
Four eccentricity calculations are included for pipes that were tested. Using the eight wall thickness readings described in Sheet Wall above, four eccentricity calculations were possible. They are reported as an Offset from the end of the pipe [inches] and the Angle[degrees] where the calculation was done.
There is some presumption about the nature of pipe eccentricity in using this approach (concentric circles), but they seem reasonable and appropriate. Since the wall readings are available, variations on this approach are certainly possible.
An Average and StDev for all 36 values are provided as a quick reference. In general, the industry assumes eccentricity is Lognormally, not Normally distributed but, since those values are a bit awkward to work with, a Normal population was assumed.
October 2002 Page 43 of 103 SES/TQSI/Hecate

DEA-130 MODERNIZATION OF TUBULAR COLLAPSE PERFORMANCE PROPERTIES
8.2.7 Sheet Compare
This sheet demonstrates one possible use of the data extracted from the database. This sheet is constructed entirely from information found elsewhere in the workbook and some “User Defined” functions described below. Knowing that there are always nine measurement stations along the pipe allows construction of nine sets of Tamano input parameters. These parameters also provide all information necessary to API (5C3) estimates of collapse pressure.
Here is a brief description of the Tamano parameters (Tamano equations described in report Section 9.2.7.4) and how they were obtained on Sheet Compare:
OD Average of 2 values at station found on Sheet ODs. Wall Average of 8 values at station found on Sheet Walls. YS Single value for pipe (Cell B24) on Sheet Details. Ovality Single value at station found on Sheet Ovalities. Ecc Average of 4 values at station found on Sheet
Eccentricities. RS Single value for pipe (Cell B29) on Sheet Details. Q&T Single value for pipe (Cell B13) on Sheet Details.
October 2002 Page 44 of 103 SES/TQSI/Hecate
123456789
101112131415161718192021222324252627282930313233343536
DEA-130 MODERNIZATION OF TUBULAR COLLAPSE PERFORMANCE PROPERTIES
FinishID Heat Treatment As-Rolled As-Rolled As-Rolled As-Rolled As-Rolled Seamannealed Seamannealed Seamannealed Seamannealed Seamannealed Normalized Normalized Normalized Normalized Normalized N&T N&T N&T N&T N&T Q&T (Air) Q&T (Air) Q&T (Air) Q&T (Air) Q&T (Air) Q&T (Water) Q&T (Water) Q&T (Water) Q&T (Water) Q&T (Water) Q&T (Oil) Q&T (Oil) Q&T (Oil) Q&T (Oil) Q&T (Oil) Cold Drawn
Straightening Process Cold Gag Cold Gag (Stress Relief) Cold Rotary Cold Rotary (Stress Relief) Hot Rotary Cold Gag Cold Gag (Stress Relief) Cold Rotary Cold Rotary (Stress Relief) Hot Rotary Cold Gag Cold Gag (Stress Relief) Cold Rotary Cold Rotary (Stress Relief) Hot Rotary Cold Gag Cold Gag (Stress Relief) Cold Rotary Cold Rotary (Stress Relief) Hot Rotary Cold Gag Cold Gag (Stress Relief) Cold Rotary Cold Rotary (Stress Relief) Hot Rotary Cold Gag Cold Gag (Stress Relief) Cold Rotary Cold Rotary (Stress Relief) Hot Rotary Cold Gag Cold Gag (Stress Relief) Cold Rotary Cold Rotary (Stress Relief) Hot Rotary No Straightening
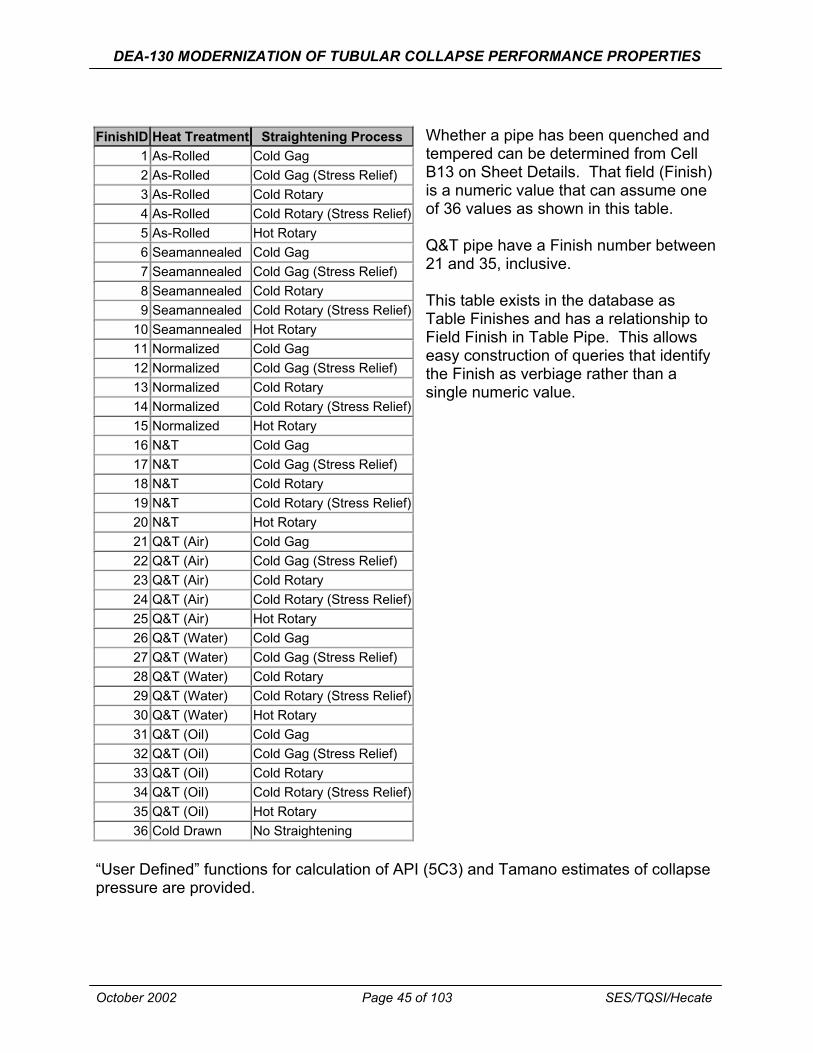
Whether a pipe has been quenched and tempered can be determined from Cell B13 on Sheet Details. That field (Finish) is a numeric value that can assume one of 36 values as shown in this table.
Q&T pipe have a Finish number between 21 and 35, inclusive.
This table exists in the database as Table Finishes and has a relationship to Field Finish in Table Pipe. This allows easy construction of queries that identify the Finish as verbiage rather than a single numeric value.
“User Defined” functions for calculation of API (5C3) and Tamano estimates of collapse pressure are provided.
October 2002 Page 45 of 103 SES/TQSI/Hecate

DEA-130 MODERNIZATION OF TUBULAR COLLAPSE PERFORMANCE PROPERTIES
8.2.7.1 Use of “User Defined” Functions
Perhaps the easiest way to invoke a “User Defined” function is with the fx button in Excel.
First select a cell and then press fx. You will be presented with something like the dialog shown here. In the Function category, find and select User Defined.
Next, in the Function name list box, find and select the function of interest. Function usage will immediately be provided.
Press OK.
You will be presented with a dialog prompting you for the various input data. Just click on the cell that contains the input data (Dot=D/t ratio).
October 2002 Page 46 of 103 SES/TQSI/Hecate

DEA-130 MODERNIZATION OF TUBULAR COLLAPSE PERFORMANCE PROPERTIES
8.2.7.2 Handling “User Defined” Functions
“User Defined” functions in Excel are just routines written in a Microsoft version of Basic called Visual Basic for Applications (VBA). VBA differs from regular Basic in a few peculiar ways but for the functions described here, there is essentially no difference.
The best way to have access to the “User Defined” functions in other Excel workbooks is to export them to some place as VBA files (*.bas) and subsequently load them in to new Excel workbooks. You should find two such files already unloaded and on your distribution CD. They are named modAPI.bas and modTamano.bas and contain the functions discussed below as well as other related functions.
8.2.7.3 API Formulae
There are two important, “User Defined” functions associated with API collapse pressure: APIavg and APImin. They can be found in file modAPI.bas on your distribution CD but are already included in Piper.xls.
APImin will provide the API Bulletin 5C36 predictions of collapse pressure. This function is implemented exactly as described in that API document.
APIavg presents the average values used by API when developing the formulae found in places like "Bulletin on Formulas and Calculations for Casing, Tubing, Drill Pipe, and Line Pipe Properties"6, aka API Bulletin 5C3, Sixth Edition, October 1, 1994. The difference between APIavg and APImin is (compliments of Paul Cernocky):
• No difference in the Yield Strength Collapse region. • In the Plastic Collapse region, the (-C) term is missing. Or rather, it is present in
APImin. • There is no Transition Collapse region. • Elastic Collapse values are un-reduced by the 71.25% safety factor apparently in
the 46.95E6 coefficient.
APIavg should be comparable to actual collapse and Tamano estimates.
From API Bulletin 5C3, Sixth Edition, October 1, 1994 -
Yield Strength Collapse Pressure Formula (D / t)−1
P = 2Y Eq. (1) YP P (D / t)2
(per 5C3)
Plastic Collapse Pressure Formula
October 2002 Page 47 of 103 SES/TQSI/Hecate

DEA-130 MODERNIZATION OF TUBULAR COLLAPSE PERFORMANCE PROPERTIES
PP = YP D
A / t
− B
− C Eq. (3)
Transition Collapse Pressure Formula
PT = YP F
− G Eq. (5)
D / t
Elastic Collapse Pressure Formula 46.95x10⁶
PE =(D / t) ( ( D / t)−1)2 Eq. (7)
Collapse Pressure Under Axial Tension Stress 2Ypa = 1− 0.75(Sa /Yp ) − 0.5Sa /Yp
Yp Eq. (8)
A = 2.8762 + 0.10679x10⁻⁵Yp + 0.21301x10⁻¹⁰Yp 2 − 0.53132x10⁻¹⁶Yp
3 Eq. (21) B = 0.026233 + 0.50609x10⁻⁶Yp Eq. (22)
C = −465.93 + 0.030867Yp − 0.10483x10⁻⁷ Yp 2 + 0.36989x10⁻¹³Yp
3 Eq. (23)
6 3B / A 3
46.95x10 2 + B / AF = Eq. (26)
p Y
2 + 3B
(B / A
/ A) − (B / A)1−
23 + BB // AA
2
G = FB / A Eq. (27)
8.2.7.4 Tamano Formulae
What is referred to here as The Tamano Equation refers to the algorithm published in a 1985 Nippon report.7 Both functions described below are included in Piper.xls and in the external file modTamano.bas available on your distribution CD.
In its initial form, the Tamano formula is:
Pest = 1 (PEO + PGO )−
1 (PEO − PGO )2 + PEOPGOH ...(17)
2 4 Estimated Collapse Pressure
where
October 2002 Page 48 of 103 SES/TQSI/Hecate

DEA-130 MODERNIZATION OF TUBULAR COLLAPSE PERFORMANCE PROPERTIES
E 1PEO = 2 2 2 (2) Elastic Collapse Pressure1−ν D D
−1t t
D
PGO = 2σ Yt
−12
1+
1.47 …(7) General Yield Pressure
D D
−1
t t
H = 0.0808u(%) + 0.00114e(%) − 0.1412σ R ...(16) Correction Factor σY
µ is ovality, e is eccentricity, σ R is the circumferential residual stress in the inside surface of the test pipe, and σY is the yield strength of the ideal pipe.
API/ISO TC67/SC5/WB2b has proposed two substantial changes.
First is an updating of some of the coefficients. A new form of the Correction Factor as:
H = 0.071u(%) + 0.0022e(%) − 0.18 σ R New Correction Factor8
σ Y
A multiplicative 1.08 factor to the Elastic Collapse was also developed by WG2b so that:
E 1PEO = (1.08)2 2 2 New Elastic Collapse Pressure 1−ν D D
−1t t
This formulation is available as Tamano40. The function input parameters are: • Dot D/t [unit less] • Y Yield Stress [psi or ksi] • O Ovality [%] • Ec Eccentricity [%] • XS Axial Stress [psi] • RS Residual Stress [psi] • E (Optional) Young’s Modulus (defaults to 30x106) • nu (Optional) Poisson's Ratio (defaults to 0.28)
October 2002 Page 49 of 103 SES/TQSI/Hecate
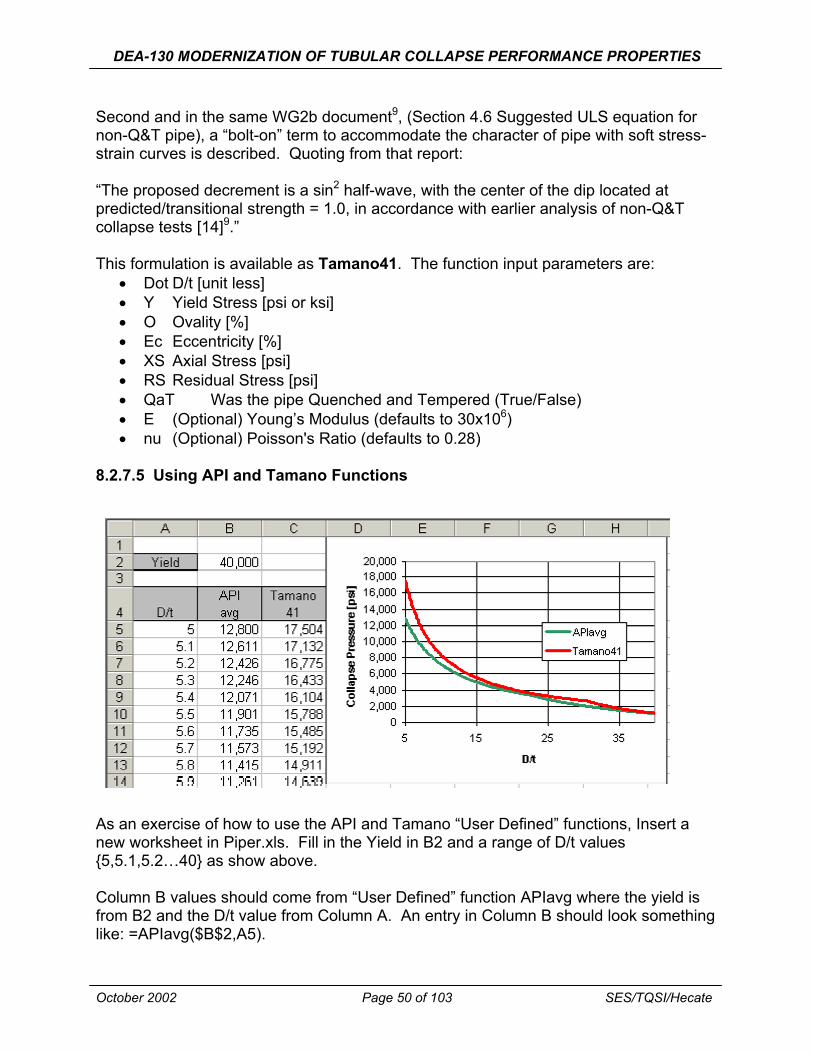
DEA-130 MODERNIZATION OF TUBULAR COLLAPSE PERFORMANCE PROPERTIES
Second and in the same WG2b document9, (Section 4.6 Suggested ULS equation for non-Q&T pipe), a “bolt-on” term to accommodate the character of pipe with soft stress-strain curves is described. Quoting from that report:
“The proposed decrement is a sin2 half-wave, with the center of the dip located at predicted/transitional strength = 1.0, in accordance with earlier analysis of non-Q&T collapse tests [14]9.”
This formulation is available as Tamano41. The function input parameters are: • Dot D/t [unit less] • Y Yield Stress [psi or ksi] • O Ovality [%] • Ec Eccentricity [%] • XS Axial Stress [psi] • RS Residual Stress [psi] • QaT Was the pipe Quenched and Tempered (True/False) • E (Optional) Young’s Modulus (defaults to 30x106) • nu (Optional) Poisson's Ratio (defaults to 0.28)
8.2.7.5 Using API and Tamano Functions
As an exercise of how to use the API and Tamano “User Defined” functions, Insert a new worksheet in Piper.xls. Fill in the Yield in B2 and a range of D/t values {5,5.1,5.2…40} as show above.
Column B values should come from “User Defined” function APIavg where the yield is from B2 and the D/t value from Column A. An entry in Column B should look something like: =APIavg($B$2,A5).
October 2002 Page 50 of 103 SES/TQSI/Hecate

DEA-130 MODERNIZATION OF TUBULAR COLLAPSE PERFORMANCE PROPERTIES
To compare Tamano to API, some assumption must be made about the other input parameters to the Tamano model. For simplicity, set all other Tamano input values equal to zero and answer the “Has this pipe been through Q&T?” question (input field QaT) as “True”. An entry for Column C should look something like: =Tamano41(A5,$B$2,0,0,0,0,TRUE)
8.2.8 Sheet SS
This sheet presents the stress-strain data for the pipe. In all cases, the units are [psi] for the stress and [%] for the strain.
End and Middle refer to the place where the sample was taken. There were two samples taken per pipe.
October 2002 Page 51 of 103 SES/TQSI/Hecate

DEA-130 MODERNIZATION OF TUBULAR COLLAPSE PERFORMANCE PROPERTIES
9.0 COMPARISON OF PIPE GEOMETRY AND YIELD STRENGTH
This section discusses the measured metrics: OD, wall thickness, yield strength, residual stress, ovality and eccentricity.
9.1 OD
9.1.1 Measurement Method
Two OD measurements were usually taken at each of the nine measurement stations, one Pi-tape and one gauge/micrometer at 0/180°. There were 1,359 Pi tape and 1,251 micrometer OD reports. The difference in OD reports was because the very first
samples did not require the micrometer measurements.
Comparison of the two methods can be accomplished by pooling the reports into two populations and then assuming both are Normally distributed.
PI OD Tape Gauge
Mean 1.006632 1.006288 SD 0.00189 0.001847
Although the Pi-Tape method gave slightly higher results, the difference between the two (0.000344) is only 0.034% of the average.
9.1.2 High Collapse
Of the 151 pipes that were collapse tested (thus had OD measurements), 29 were reported by the manufacture to be “High Collapse”.
There is virtually no difference between “High Collapse” and other pipe regarding their OD distributions.
October 2002 Page 52 of 103 SES/TQSI/Hecate

DEA-130 MODERNIZATION OF TUBULAR COLLAPSE PERFORMANCE PROPERTIES
The difference between the two means is 3.61x10⁻⁵, which is 0.004% of their average value.
PI Tape OD Gauge
Mean 1.006497 1.00646 SD 0.001795 0.001896 Count 486 2,124
9.1.3 Straightening Method
Of the 151 pipes with OD data, 11 did not report straightening, 51 were hot rotary straightened and 89 were cold straightened. Of the cold straightened, 3 were cold gag, 77 were cold rotary and 9 were cold rotary with stress relief.
PI Tape OD Gauge
Mean 1.006132 1.007058 SD 0.001978 0.0016 Count 918 1,494
The difference between the two means is 0.000925, which is 0.092% of their average value.
October 2002 Page 53 of 103 SES/TQSI/Hecate

DEA-130 MODERNIZATION OF TUBULAR COLLAPSE PERFORMANCE PROPERTIES
9.2 WALL THICKNESS
All 151 pipes that were collapse tested report 72 wall measurements each: 10,872 wall thickness reports. This population has been examined in four approaches.
9.2.1 Measurement Station (Offset)
For each pipe, eight wall thickness measurements (ever 45°) were taken at the end of the pipe and then every one diameter down the pipe. Since all pipe were eight diameters long, that was nine measurement stations.
Presenting the data as nine populations, one at each measurement station, suggests there is no dependence on measurement station, or length along the sample.
October 2002 Page 54 of 103 SES/TQSI/Hecate
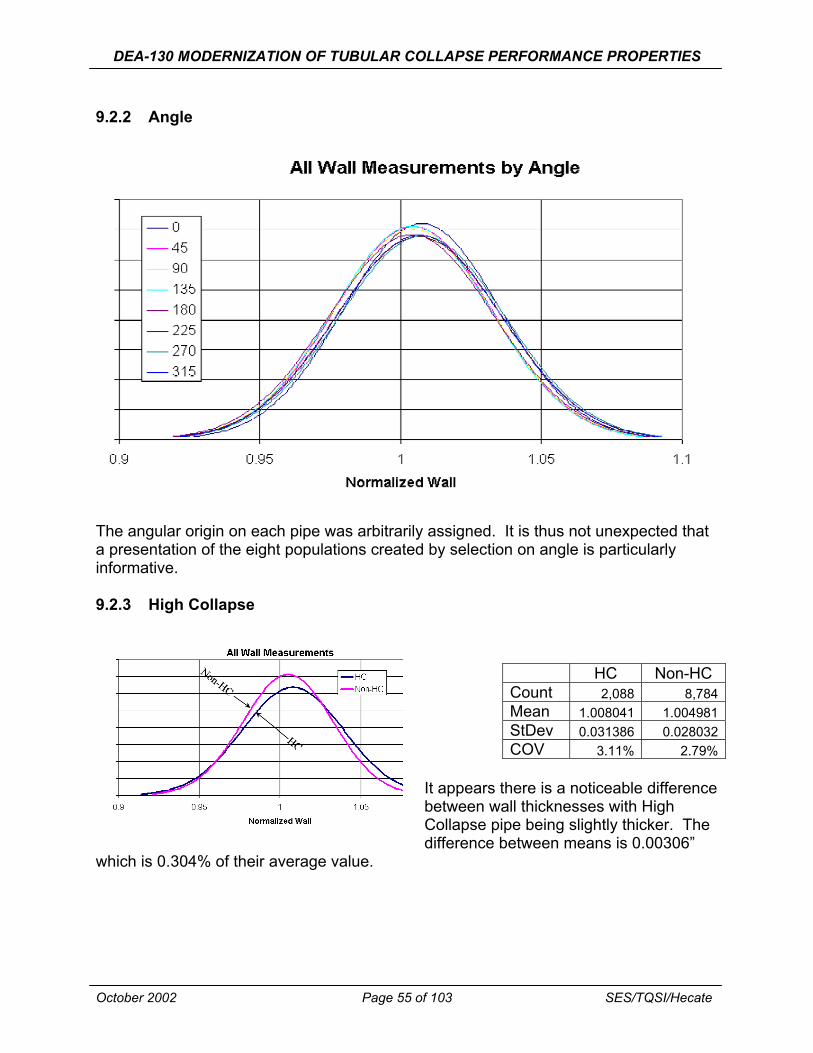
DEA-130 MODERNIZATION OF TUBULAR COLLAPSE PERFORMANCE PROPERTIES
9.2.2 Angle
The angular origin on each pipe was arbitrarily assigned. It is thus not unexpected that a presentation of the eight populations created by selection on angle is particularly informative.
9.2.3 High Collapse
HC Non-HC Count 2,088 8,784 Mean 1.008041 1.004981 StDev 0.031386 0.028032 COV 3.11% 2.79%
It appears there is a noticeable difference between wall thicknesses with High Collapse pipe being slightly thicker. The difference between means is 0.00306”
which is 0.304% of their average value.
October 2002 Page 55 of 103 SES/TQSI/Hecate
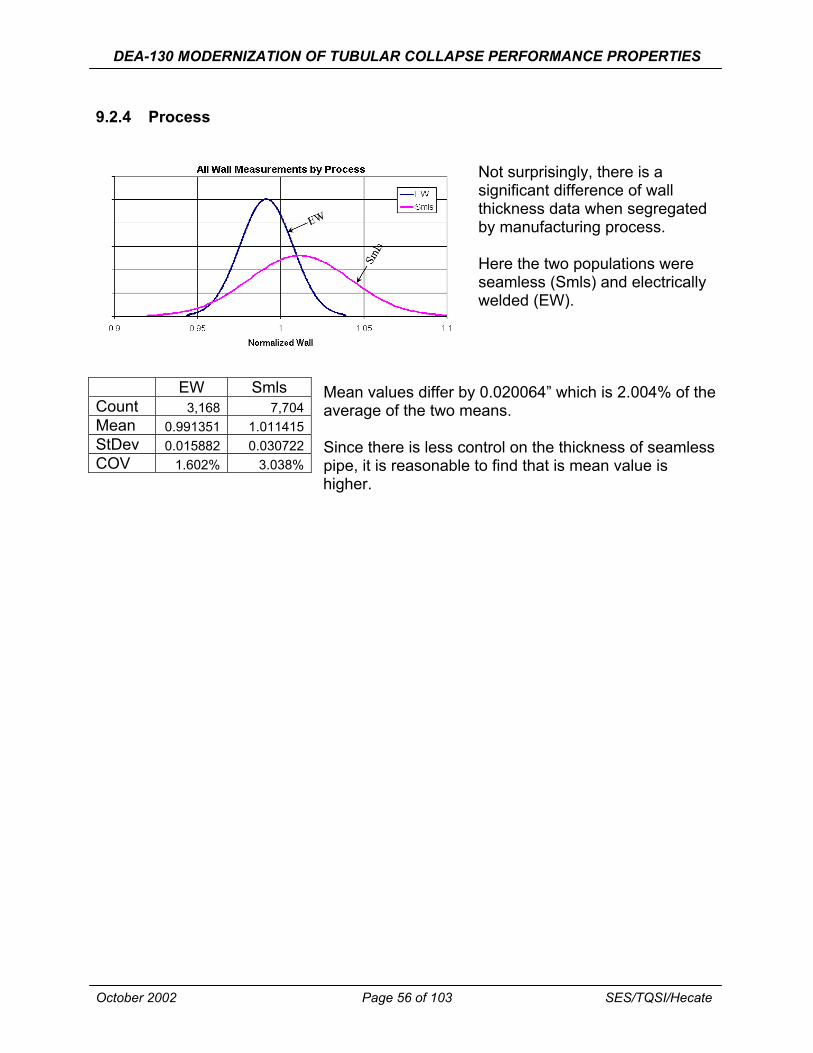
DEA-130 MODERNIZATION OF TUBULAR COLLAPSE PERFORMANCE PROPERTIES
9.2.4 Process
Not surprisingly, there is a significant difference of wall thickness data when segregated by manufacturing process.
Here the two populations were seamless (Smls) and electrically welded (EW).
EW Smls Count 3,168 7,704 Mean 0.991351 1.011415 StDev 0.015882 0.030722 COV 1.602% 3.038%
Mean values differ by 0.020064” which is 2.004% of the average of the two means.
Since there is less control on the thickness of seamless pipe, it is reasonable to find that is mean value is higher.
October 2002 Page 56 of 103 SES/TQSI/Hecate

DEA-130 MODERNIZATION OF TUBULAR COLLAPSE PERFORMANCE PROPERTIES
9.3 YIELD STRENGTH
Of the 216 pipes that were tensile tested, 17 had a single test while the remaining 199 had two tests. A total of 17 + 2*199 = 415 yield stress constitutes the population of tests.
9.3.1 Grade
A H J K L N P Q count 63 8 24 50 68 76 90 36
1.092221 1.581703 1.183668 1.240364 1.071946 1.207891 1.153136 1.120649 0.10158 0.030599 0.068224 0.054501 0.03519 0.072949 0.047892 0.055759
9.30% 1.93% 5.76% 4.39% 3.28% 6.04% 4.15% 4.98%
mean SD
COV
It became apparent after an examination of the data when segregated by grade that all subsequent discriminations must be done within grade.
Recall that the fictitious Grade A designates those pipes where the grade reported by the manufacturer was proprietary and could not be mapped to an API grade.
October 2002 Page 57 of 103 SES/TQSI/Hecate
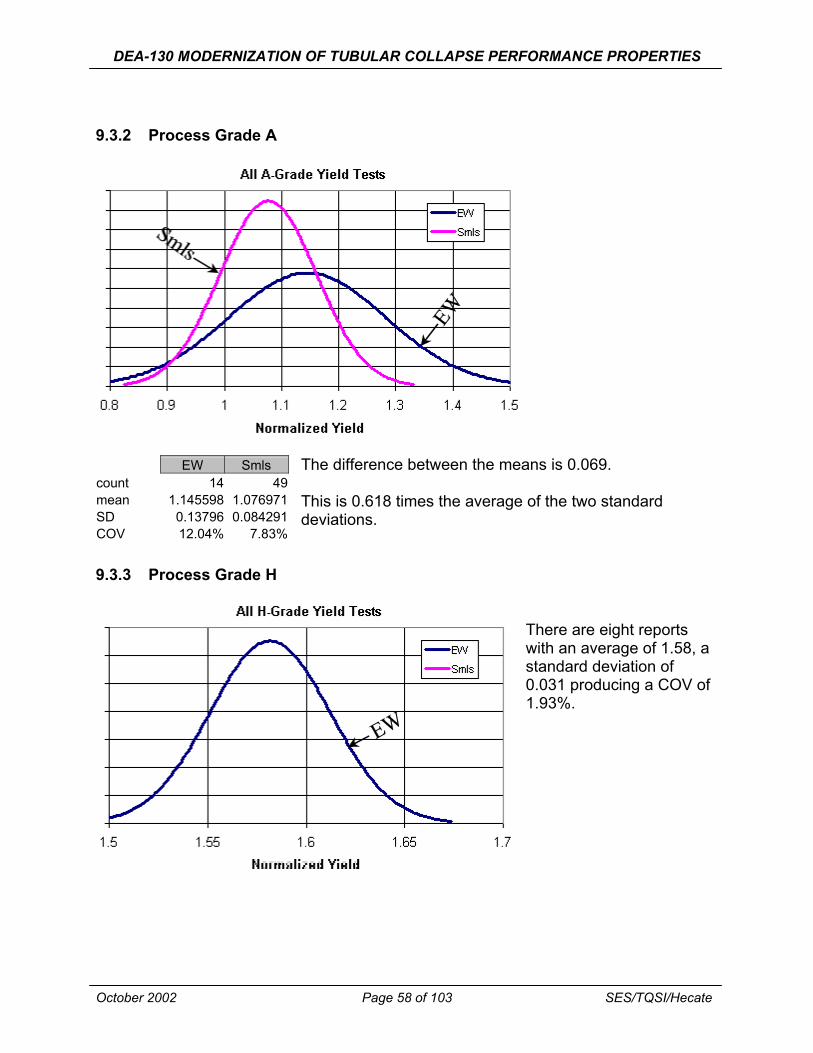
DEA-130 MODERNIZATION OF TUBULAR COLLAPSE PERFORMANCE PROPERTIES
9.3.2 Process Grade A
The difference between the means is 0.069. count 14 49 mean SD
1.145598 1.076971 0.13796 0.084291
This is 0.618 times the average of the two standard deviations.
COV 12.04% 7.83%
EW Smls
9.3.3 Process Grade H
There are eight reports with an average of 1.58, a standard deviation of 0.031 producing a COV of 1.93%.
October 2002 Page 58 of 103 SES/TQSI/Hecate
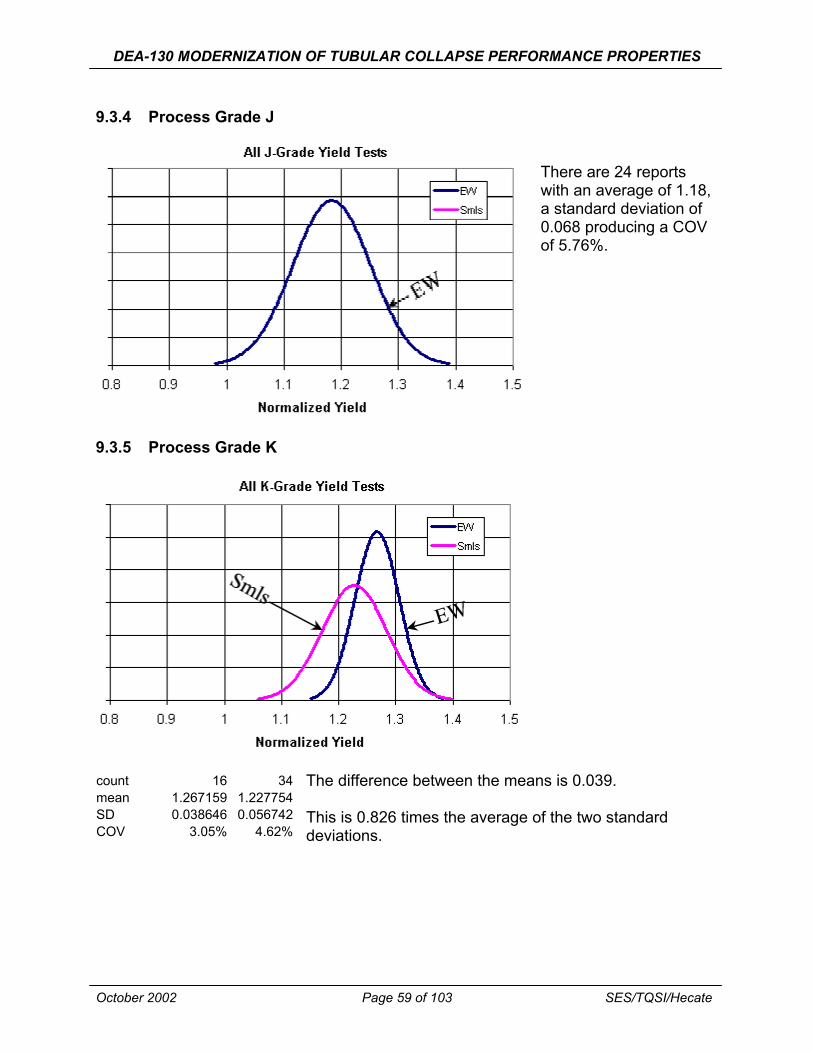
DEA-130 MODERNIZATION OF TUBULAR COLLAPSE PERFORMANCE PROPERTIES
9.3.4 Process Grade J
9.3.5 Process Grade K
There are 24 reports with an average of 1.18, a standard deviation of 0.068 producing a COV of 5.76%.
count 16 34 The difference between the means is 0.039. mean 1.267159 1.227754 SD 0.038646 0.056742 This is 0.826 times the average of the two standard COV 3.05% 4.62% deviations.
October 2002 Page 59 of 103 SES/TQSI/Hecate

DEA-130 MODERNIZATION OF TUBULAR COLLAPSE PERFORMANCE PROPERTIES
9.3.6 Process Grade L
EW Smls The difference between the means is 0.002. count 8 60 mean SD
1.073438 1.071747 0.036091 0.035375
This is 0.047 times the average of the two standard deviations.
COV 3.36% 3.30%
October 2002 Page 60 of 103 SES/TQSI/Hecate

DEA-130 MODERNIZATION OF TUBULAR COLLAPSE PERFORMANCE PROPERTIES
9.3.7 Process Grade N
EW Smls The difference between the means is 0.022. count 16 60 mean SD
1.225234 1.203266 0.064379 0.074884
This is 0.315 times the average of the two standard deviations.
COV 5.25% 6.22%
October 2002 Page 61 of 103 SES/TQSI/Hecate
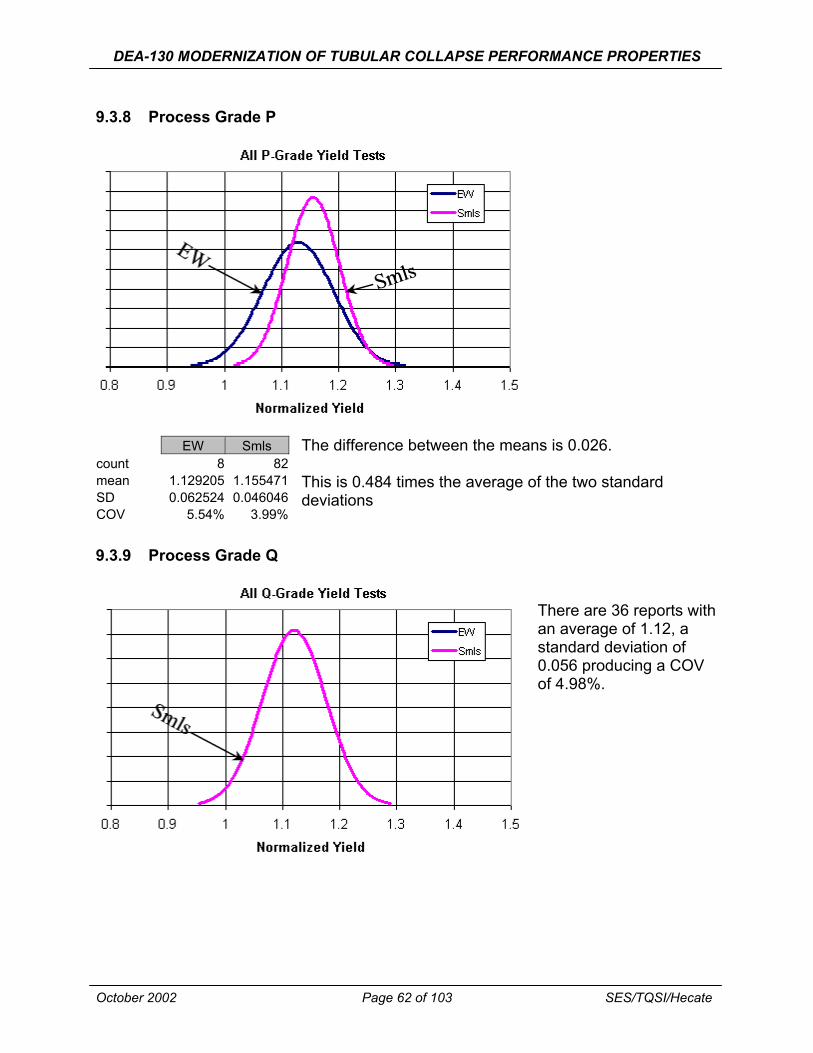
DEA-130 MODERNIZATION OF TUBULAR COLLAPSE PERFORMANCE PROPERTIES
9.3.8 Process Grade P
The difference between the means is 0.026. count 8 82 mean SD
1.129205 1.155471 0.062524 0.046046
This is 0.484 times the average of the two standard deviations
COV 5.54% 3.99%
EW Smls
9.3.9 Process Grade Q
There are 36 reports with an average of 1.12, a standard deviation of 0.056 producing a COV of 4.98%.
October 2002 Page 62 of 103 SES/TQSI/Hecate
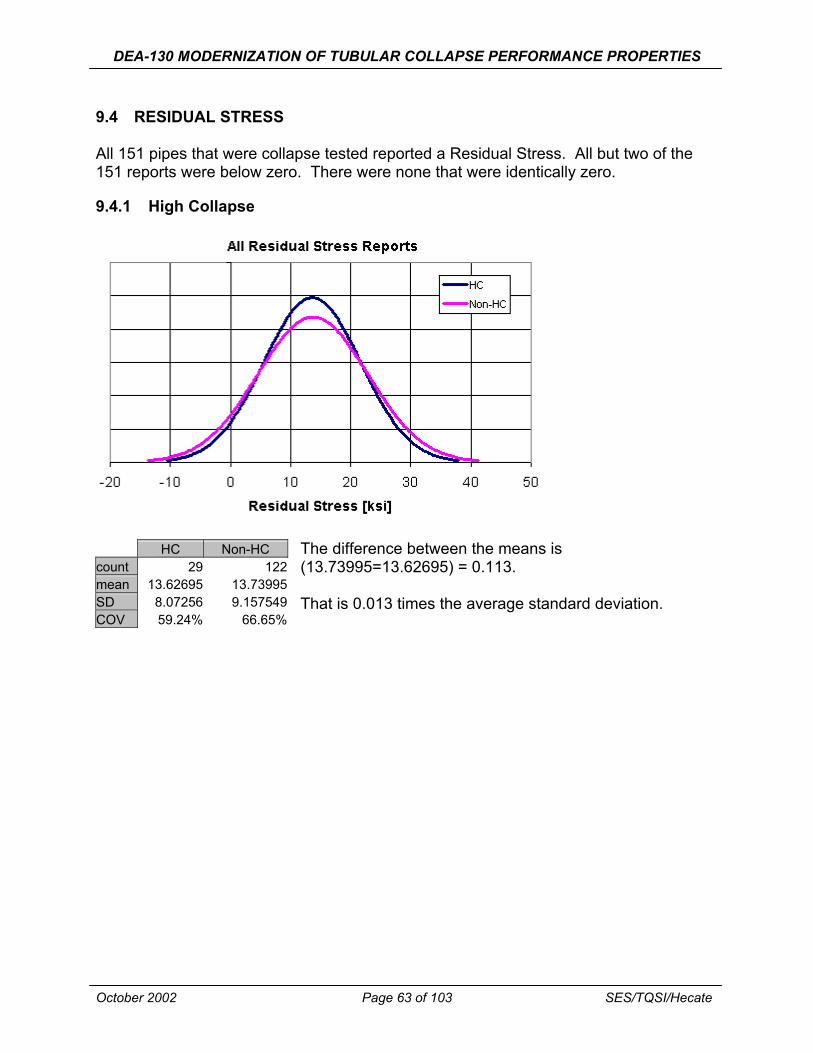
DEA-130 MODERNIZATION OF TUBULAR COLLAPSE PERFORMANCE PROPERTIES
9.4 RESIDUAL STRESS
All 151 pipes that were collapse tested reported a Residual Stress. All but two of the 151 reports were below zero. There were none that were identically zero.
9.4.1 High Collapse
HC Non-HC count 29
13.62695 8.07256 59.24%
122 13.73995 9.157549
66.65%
mean SD COV
The difference between the means is (13.73995=13.62695) = 0.113.
That is 0.013 times the average standard deviation.
October 2002 Page 63 of 103 SES/TQSI/Hecate

DEA-130 MODERNIZATION OF TUBULAR COLLAPSE PERFORMANCE PROPERTIES
9.4.2 Process
EW Smls count 44 107
17.3667 12.21795 6.249502 9.450038
35.99% 77.35%
mean SD COV
The difference between the means is (17.3667-12.21795) = 5.149.
That is 0.656 times the average standard deviation.
9.4.3 Grade
October 2002 Page 64 of 103 SES/TQSI/Hecate
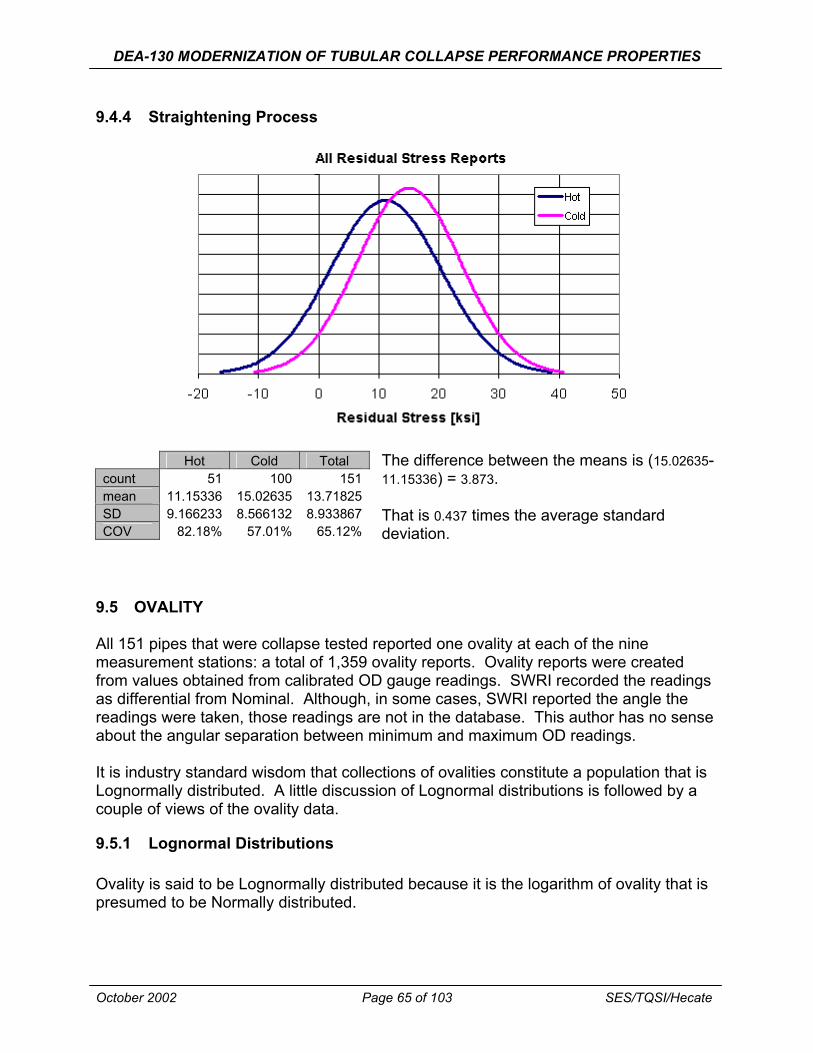
DEA-130 MODERNIZATION OF TUBULAR COLLAPSE PERFORMANCE PROPERTIES
9.4.4 Straightening Process
Hot Cold Total count 51
11.15336 9.166233
82.18%
100 15.02635 8.566132
57.01%
151 13.71825 8.933867
65.12%
mean SD COV
The difference between the means is (15.0263511.15336) = 3.873.
That is 0.437 times the average standard deviation.
9.5 OVALITY
All 151 pipes that were collapse tested reported one ovality at each of the nine measurement stations: a total of 1,359 ovality reports. Ovality reports were created from values obtained from calibrated OD gauge readings. SWRI recorded the readings as differential from Nominal. Although, in some cases, SWRI reported the angle the readings were taken, those readings are not in the database. This author has no sense about the angular separation between minimum and maximum OD readings.
It is industry standard wisdom that collections of ovalities constitute a population that is Lognormally distributed. A little discussion of Lognormal distributions is followed by a couple of views of the ovality data.
9.5.1 Lognormal Distributions
Ovality is said to be Lognormally distributed because it is the logarithm of ovality that is presumed to be Normally distributed.
October 2002 Page 65 of 103 SES/TQSI/Hecate
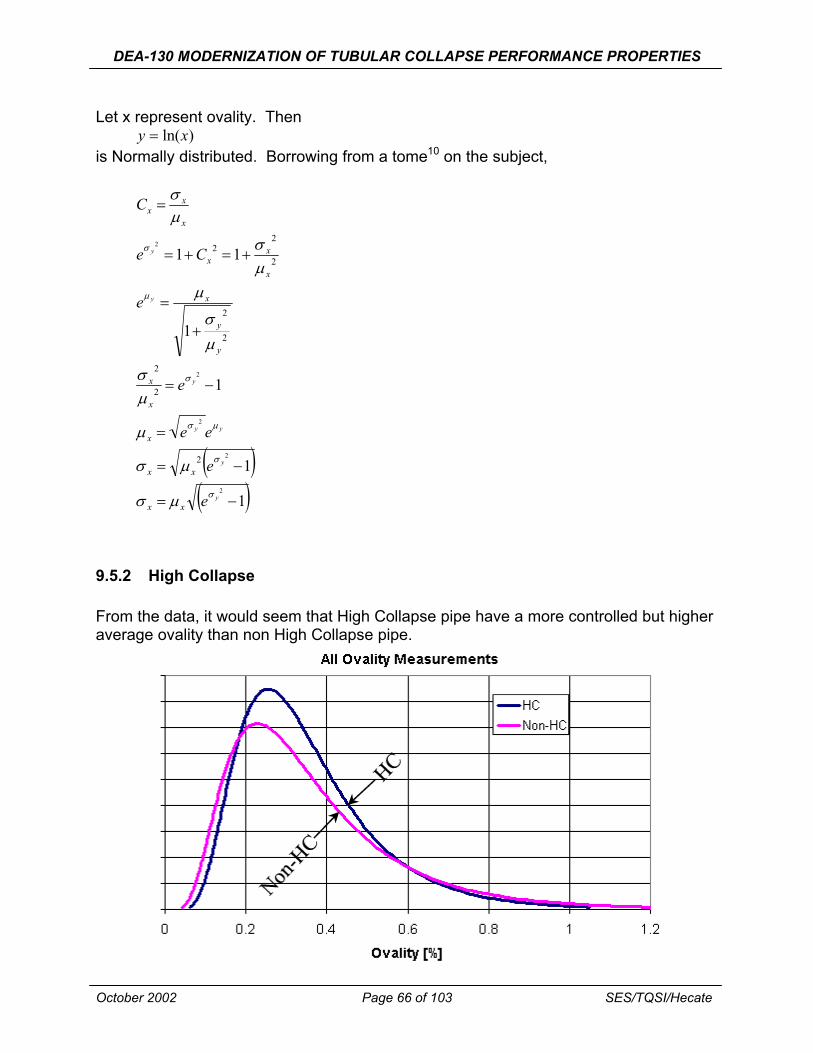
DEA-130 MODERNIZATION OF TUBULAR COLLAPSE PERFORMANCE PROPERTIES
Let x represent ovality. Then y = ln(x)
is Normally distributed. Borrowing from a tome10 on the subject,
σ xC = x µ x
σ 2 σ 22
e y = 1+ Cx = 1+ x 2µ x
µ y µ xe = σ 2
1+ y 2µ y
2σ x 2
2
= e σ y −1µ x
µ x = e σ y 2
eµ y
2
σ = µ 2 (e σ y −1)x x
2 yσ = µ (e σ −1)x x
9.5.2 High Collapse
From the data, it would seem that High Collapse pipe have a more controlled but higher average ovality than non High Collapse pipe.
October 2002 Page 66 of 103 SES/TQSI/Hecate
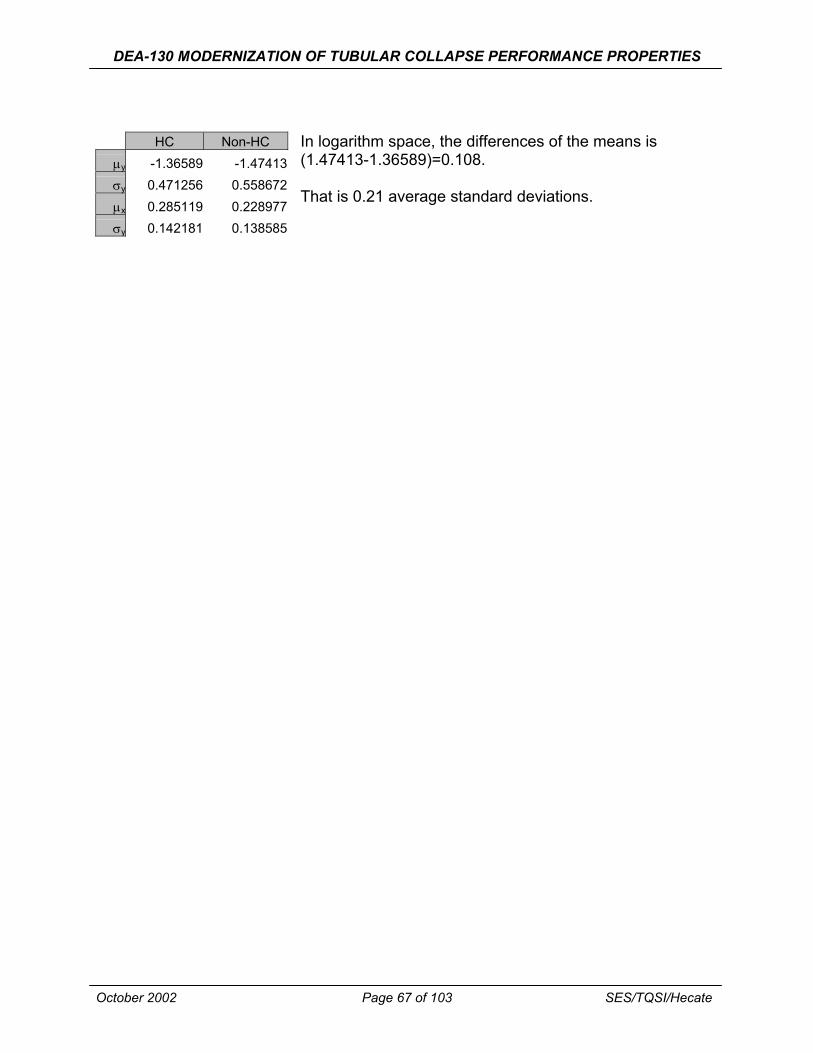
DEA-130 MODERNIZATION OF TUBULAR COLLAPSE PERFORMANCE PROPERTIES
HC Non-HC µy -1.36589
0.471256 0.285119 0.142181
-1.47413 0.558672 0.228977 0.138585
σy
µx
σy
In logarithm space, the differences of the means is (1.47413-1.36589)=0.108.
That is 0.21 average standard deviations.
October 2002 Page 67 of 103 SES/TQSI/Hecate
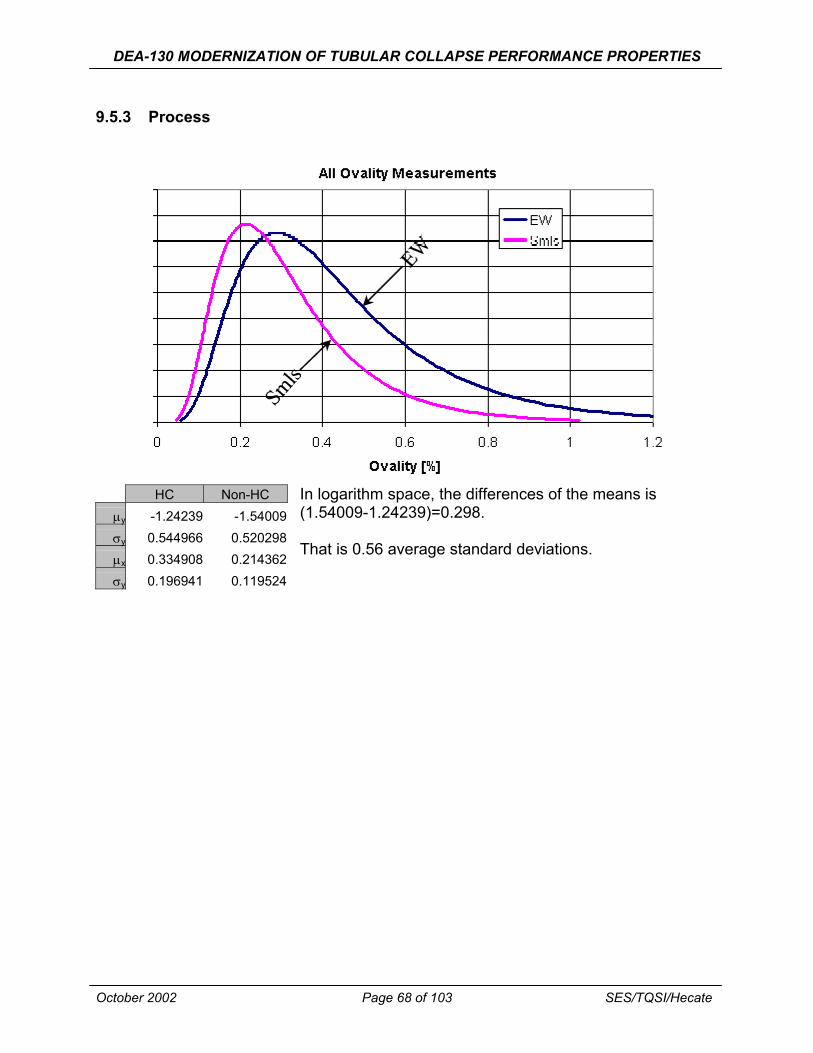
DEA-130 MODERNIZATION OF TUBULAR COLLAPSE PERFORMANCE PROPERTIES
9.5.3 Process
HC Non-HC µy -1.24239
0.544966 0.334908 0.196941
-1.54009 0.520298 0.214362 0.119524
σy
µx
σy
In logarithm space, the differences of the means is (1.54009-1.24239)=0.298.
That is 0.56 average standard deviations.
October 2002 Page 68 of 103 SES/TQSI/Hecate

DEA-130 MODERNIZATION OF TUBULAR COLLAPSE PERFORMANCE PROPERTIES
9.5.4 Straightening
HC Non-HC µy -1.55864
0.528121 0.24191
0.137206
-1.37049 0.483855 0.253982 0.130447
σy
µx
σy
In logarithm space, the differences of the means is (1.55864-1.37049)=0.188.
That is 0.37 average standard deviations.
October 2002 Page 69 of 103 SES/TQSI/Hecate
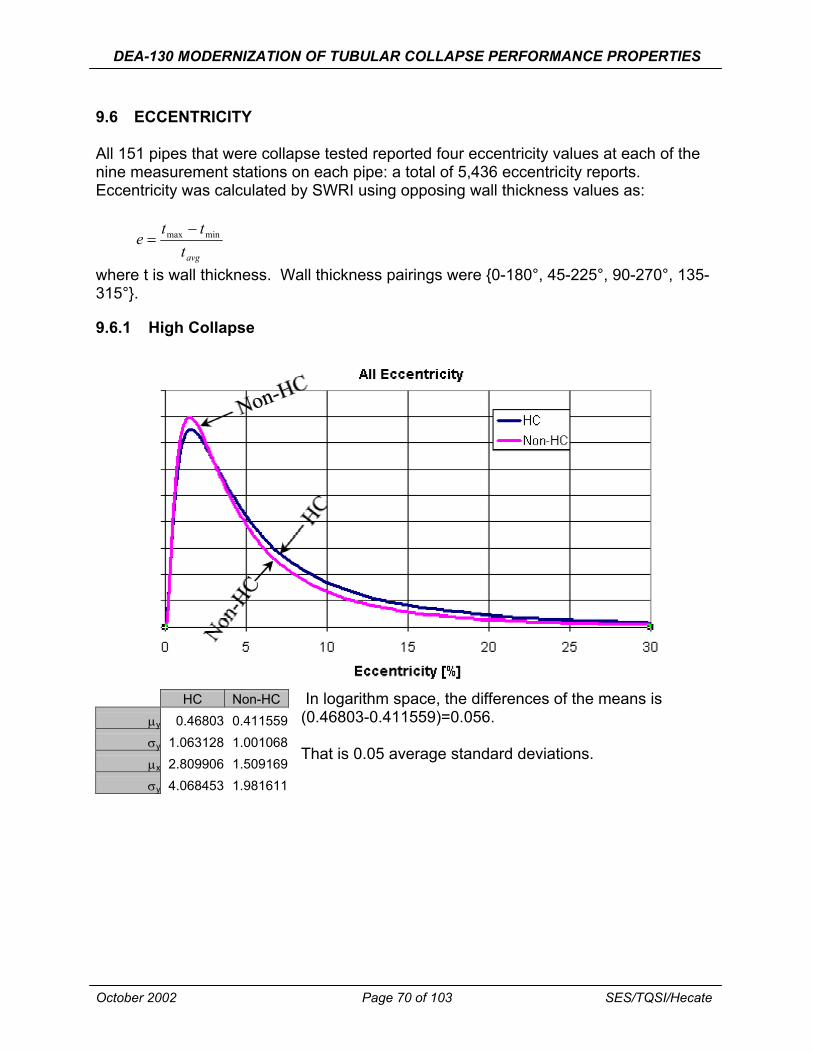
DEA-130 MODERNIZATION OF TUBULAR COLLAPSE PERFORMANCE PROPERTIES
9.6 ECCENTRICITY
All 151 pipes that were collapse tested reported four eccentricity values at each of the nine measurement stations on each pipe: a total of 5,436 eccentricity reports. Eccentricity was calculated by SWRI using opposing wall thickness values as:
tmax − tmine = tavg
where t is wall thickness. Wall thickness pairings were {0-180°, 45-225°, 90-270°, 135315°}.
9.6.1 High Collapse
HC Non-HC µy 0.46803 0.411559
1.063128 1.001068 2.809906 1.509169 4.068453 1.981611
σy
µx
σy
In logarithm space, the differences of the means is (0.46803-0.411559)=0.056.
That is 0.05 average standard deviations.
October 2002 Page 70 of 103 SES/TQSI/Hecate

DEA-130 MODERNIZATION OF TUBULAR COLLAPSE PERFORMANCE PROPERTIES
9.6.2 Process
HC Non-HC µy -0.37025 0.714796
0.769571 0.933428 0.92855 2.043769 0.83468 2.409557
σy
µx
σy
In logarithm space, the differences of the means is (0.37025+0.714796)=1.085.
That is 1.27 average standard deviations.
October 2002 Page 71 of 103 SES/TQSI/Hecate

DEA-130 MODERNIZATION OF TUBULAR COLLAPSE PERFORMANCE PROPERTIES
9.6.3 Straightening
HC Non-HC µy 0.653547 0.246315
0.912924 1.056776 2.916143 1.279302 3.326447 1.833909
σy
µx
σy
In logarithm space, the differences of the means is (0.653547+0.246315)=0.407.
That is 0.41 average standard deviations.
October 2002 Page 72 of 103 SES/TQSI/Hecate

DEA-130 MODERNIZATION OF TUBULAR COLLAPSE PERFORMANCE PROPERTIES
9.7 STRESS-STRAIN
Of the 216 pipes, 1 had no stress-strain data, 17 had only one set of stress-strain data and the remaining 198 pipes have two stress-strain data sets, one for each end.
A point consists of a {strain, stress} doublet. Strain always has units of [%], stress [psi].
Hecate digitized the stress-strain plots provided by the manufacturers. There are a total of 227,422 stress-strain data points. The maximum number of data points in a data set is 1,294, the minimum is 83 and on average, there are 551 data points.
All plots look very much the same. A Pipe Description is given that always contains the PipeID (e.g. 163) and whether the data set is for the end (E) or middle (M). This is followed by the nominal OD (e.g. 10.75”), weight [ppf] (e.g. 45.5) and some attempt at the grade (e.g. N-80).
If the manufacturer reported the pipe as High Collapse, then “HC” will also appear.
On the right side of each plot is the process {“Smls”, ”EW”}, the Finish when it is known. When known, the test yield strength (YS), test tensile strength (Ten), residual stress (RS) are reported in units of [ksi]. And finally, if known, the collapse pressure (Pc) in units of [psi].
Refer to Appendix C for a complete presentation of the known stress-strain data.
.
October 2002 Page 73 of 103 SES/TQSI/Hecate

DEA-130 MODERNIZATION OF TUBULAR COLLAPSE PERFORMANCE PROPERTIES
10.0 DISCUSSION OF COLLAPSE PRESSURES
There were 151 pipes that underwent collapse pressure testing. All but one actually collapsed.
10.1 ACTUAL VERSUS API AND TAMANO COLLAPSE PRESSURES
Yield [ksi] 40 55 80 85 95
110 125
Count This is the breakdown of the 151 pipes that were subject to collapse 3 testing by Nominal Yield Strength.
3147
1104217
Total 151
The following plots give the collapse test data by material grade. They also contain the API Average and API Minimum collapse curves and the Tamano curve. It should be noted that the Tamano curve is for a “perfect” pipe; that is, the curve assumes zero ovality, eccentricity and residual stress.
October 2002 Page 74 of 103 SES/TQSI/Hecate

DEA-130 MODERNIZATION OF TUBULAR COLLAPSE PERFORMANCE PROPERTIES
October 2002 Page 75 of 103 SES/TQSI/Hecate

DEA-130 MODERNIZATION OF TUBULAR COLLAPSE PERFORMANCE PROPERTIES
October 2002 Page 76 of 103 SES/TQSI/Hecate

DEA-130 MODERNIZATION OF TUBULAR COLLAPSE PERFORMANCE PROPERTIES
Reports
October 2002 Page 77 of 103 SES/TQSI/Hecate

DEA-130 MODERNIZATION OF TUBULAR COLLAPSE PERFORMANCE PROPERTIES
All of the collapse values were above the API Minimum curve. As a whole, the values were evenly scattered both above and below the API Average curve. Most of the values are below the Tamano curve, with the main reason being that no ovality, eccentricity or residual stress was included.
October 2002 Page 78 of 103 SES/TQSI/Hecate

DEA-130 MODERNIZATION OF TUBULAR COLLAPSE PERFORMANCE PROPERTIES
11.0 COMPARISON OF MANUFACTURERS
Delivery.xls is an Excel workbook that contains information about all pipes excluding manufacturer-specific information, and is given in Appendix B.
This workbook is stand-alone. That is, there is no connection to any database.
There are 12 worksheets as indicated above. Each will be discussed in the order they appear.
Except for Pipes, each sheet contains one graphic of the named data with all applicable manufacturers represented. For ovality, eccentricity and residual stress, the data is presented both as Normal and Lognormal distributions. There is some uncertainty as to the true, underlying distributions of the various metrics but these two distribution assumptions are used as a means of showing relations between the manufacturers. Care should be taken in interpreting the data since manufacturers did not all produce the same kind of pipe nor the same quantity of pipe. This is obvious with eccentricity where the seamless and EW pipes have very different character.
There are two plot formats: Normal and Lognormal. Normal is provided for all metrics, Lognormal only for ovality, eccentricity and residual stress. There is no presumption that either adequately represents the underlying distribution. They are used merely for presentation convenience.
For Normal plots, the ordinate represents the frequency distribution:
1 −
(µ 2 −
σ x 2 )2
f (x, µ ,σ ) =
Variable x is the abscissa value (i.e. the independent variable), µ is the mean and σ the standard deviation. Importantly,
∫ f = 1 , i.e., the area under each plot equals 1.
The legend of the normal plots gives the mean and standard deviation for the Shell donated pipe vs all others parenthetically as (µ;σ). In all cases, the range of x is limited to -3σ ≤ x ≤ 3σ. This plot is useful in an examination of the relative locations of the means (µ) and standard deviations (σ) for each population.
For Lognormal plots, the metric under scrutiny is u = ln(x) where ln(x) is the natural log of the metric x. For example, if x is eccentricity, then u = ln(eccentricity). Similar to the normal plots, the legend contains the mean, standard deviation and count for each
2 σπe
October 2002 Page 79 of 103 SES/TQSI/Hecate

DEA-130 MODERNIZATION OF TUBULAR COLLAPSE PERFORMANCE PROPERTIES
manufacturer. However, means (µ) and standard deviations (σ) are reported for u, not x. Note that it is not legitimate to assume that
mean(x) = emean(u )
11.1 Sheet Pipes
All 151 pipes that were collapse tested are represented. This is all of the data from Table Pipes in the database (WG2b.mdb) for those pipes that collapsed.
In all cases, the Shell donated pipe is presented in blue.
Merged columns A3, B3 and C3 give the date of construction of the workbook. This will allow identification of revisions, updates, etc.
October 2002 Page 80 of 103 SES/TQSI/Hecate

DEA-130 MODERNIZATION OF TUBULAR COLLAPSE PERFORMANCE PROPERTIES
11.2 All Sheets Other than Pipes
Columns A:L represent the metric data for each of the manufacturers. Row 1 is the mean value of the metric for that manufacturer; row 2 is the standard deviation. Row 3 is always blank. Row 4 and below contain values of the metric in no particular order. In general, the number of rows for each manufacture is not equal.
No formulas appear in these columns. All calculations (e.g. normalization) were done in the program that created the workbook.
Column N presents 200 equally-spaced intervals between -3 and 3 inclusive (201 rows). These are the basis for the abscissa values as discussed below.
Columns O:AL are pairs of columns that contain exactly 201 rows. Each pair of columns (e.g. Columns O:P, Q:R, etc.) represent one manufacturer. The left column in each pair is the abscissa presented as
x = µ + σφ
for the Normal distribution assumption, and
x = expµ +σφ
for the Lognormal distribution assumption. φ is a variable from the assumed standard deviation range {-3,3}.
Right column values are Excel’s NormDist(x, µ, σ, false). NormDist “returns the normal distribution for the specified mean and standard distribution.” The false requests the density function rather than a cumulative value.
One thing to keep in mind when comparing some of the data/plots and manufacturers is the two processes for making the pipe. These are the welded pipe and seamless pipe
October 2002 Page 81 of 103 SES/TQSI/Hecate

DEA-130 MODERNIZATION OF TUBULAR COLLAPSE PERFORMANCE PROPERTIES
11.3 Sheet OD
Data was generated by dividing the measured OD by the specified (nominal) OD.
There are 2,610 OD reports.
1 1.002 1.004 1.006 1.008 1.01 1.012 1.014 1.016
Normalized OD (Actual/Specified)
The middle of the group had a value of approximately 1.007 and the light green plot at the right most side had a value of 1.0085, which is 0.70% and 0.85% over the specified OD, respectively. The smallest mean normalized OD was the brown plot at 1.0045.
API Specification 5CT11 requires the OD of pipe equal to or above 4-1/2” to be between +1.0% and –0.5%. All mean values were between 1.0045 and 1.0085 and satisfy this requirement. Only three samples were below 4-1/2” OD. Of the 2,610 OD readings, 50 readings were above 1.0% of API specified. Forty-four of these were on 7” samples and six were on 9-5/8” pipe. The 50 readings were scattered over four different pipe grades- N-80, P-110, A95 and A110. Approximately half were on API pipe and half on HC pipe.
October 2002 Page 82 of 103 SES/TQSI/Hecate

DEA-130 MODERNIZATION OF TUBULAR COLLAPSE PERFORMANCE PROPERTIES
It is important to note that manufacturers frequently bias their OD tolerances to address other issues such as threading compliance (minimize black crested threads) or to facilitate special drifts that are larger than standard drifts.
11.4 Sheet Wall
Data was generated by dividing the measured wall thickness by the specified (nominal) wall thickness. Specified (nominal) wall thicknesses can be found in the database in Table NominalWalls. This table was created to assist in queries where the wall thickness was not explicitly provided.
For example, given a 7”, 32# pipe, no information is provided about wall thickness. A query that includes wall thickness can be constructed using an Inner-Join on NominalOD and NominalWeight in Table Pipes with OD and Weight in Table NominalWalls. The Weight from NominalWalls will then be available.
For example, this query contains the pipe ID, pipe name, OD, weight and associated wall thickness.
SELECT Pipes.PipeID, Pipes.Name, Pipes.NominalOD, Pipes.NominalWeight, NominalWalls.WallFROM Pipes INNER JOIN NominalWalls ON(Pipes.NominalWeight = NominalWalls.Weight) AND(Pipes.NominalOD = NominalWalls.OD);
There are 10,872 wall thickness reports.
October 2002 Page 83 of 103 SES/TQSI/Hecate

DEA-130 MODERNIZATION OF TUBULAR COLLAPSE PERFORMANCE PROPERTIES
0.94 0.96 0.98 1 1.02 1.04 1.06 1.08 1.1
Normalized Wall Thickness (Actual/Specified)
The manufacturer with the smallest mean wall was the dark blue plot and the largest was the maroon plot. The welded pipe manufacturers had the least wall thickness as well as the narrowest range, which is to be expected for welded pipe versus seamless pipe (see Section 9.2.4, page 56).
Only one wall value was below 87.5%. This was 0.873 (amount short basically negligible) on a 11-3/4” Q-125 sample.
October 2002 Page 84 of 103 SES/TQSI/Hecate
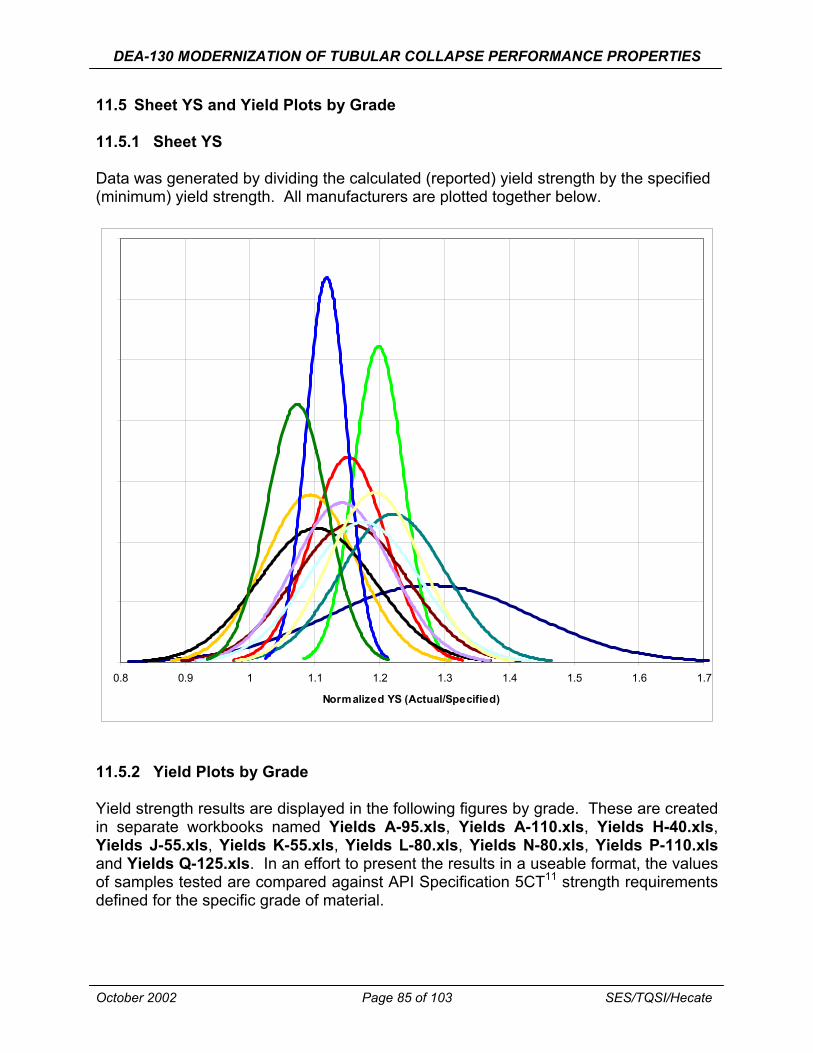
DEA-130 MODERNIZATION OF TUBULAR COLLAPSE PERFORMANCE PROPERTIES
11.5 Sheet YS and Yield Plots by Grade
11.5.1 Sheet YS
Data was generated by dividing the calculated (reported) yield strength by the specified (minimum) yield strength. All manufacturers are plotted together below.
0.8 0.9 1 1.1 1.2 1.3 1.4 1.5 1.6 1.7
Normalized YS (Actual/Specified)
11.5.2 Yield Plots by Grade
Yield strength results are displayed in the following figures by grade. These are created in separate workbooks named Yields A-95.xls, Yields A-110.xls, Yields H-40.xls, Yields J-55.xls, Yields K-55.xls, Yields L-80.xls, Yields N-80.xls, Yields P-110.xls and Yields Q-125.xls. In an effort to present the results in a useable format, the values of samples tested are compared against API Specification 5CT11 strength requirements defined for the specific grade of material.
October 2002 Page 85 of 103 SES/TQSI/Hecate

DEA-130 MODERNIZATION OF TUBULAR COLLAPSE PERFORMANCE PROPERTIES
Two plots are presented. First is a bar chart where each bar represents one pipe. Pipes are segregated by manufacturer. Next is a bell-curve plot of the same data. The letter “A” represents all proprietary grades and is not any API grade.
A -9 5
9 0
9 5
1 0 0
1 0 5
1 1 0
1 1 5
1 2 0
1 2 5
1 3 0
Ave
rage
Yie
ld S
treng
th [k
si]
A P I M i n Y i e ld A P I M a x Y i e ld
A-95
90 95 100 105 110 115 120 125 130 135
Yield Strength [ksi]
October 2002 Page 86 of 103 SES/TQSI/Hecate

DEA-130 MODERNIZATION OF TUBULAR COLLAPSE PERFORMANCE PROPERTIES
A-110
105
110
115
120
125
130
135
140
145 Av
erag
e Yiel
d Stre
ngth
[ksi]
API Min Yield API Max Yield
A-110
110 112 114 116 118 120 122 124 126 128
Yield Strength [ksi]
October 2002 Page 87 of 103 SES/TQSI/Hecate

DEA-130 MODERNIZATION OF TUBULAR COLLAPSE PERFORMANCE PROPERTIES
H-40
35
40
45
50
55
60
65
70
75
80
85 Av
erag
e Yiel
d Stre
ngth
[ksi]
API Min Yield API Max Yield
H-40
60 62 64 66
Yield Strength [ksi]
October 2002 Page 88 of 103 SES/TQSI/Hecate
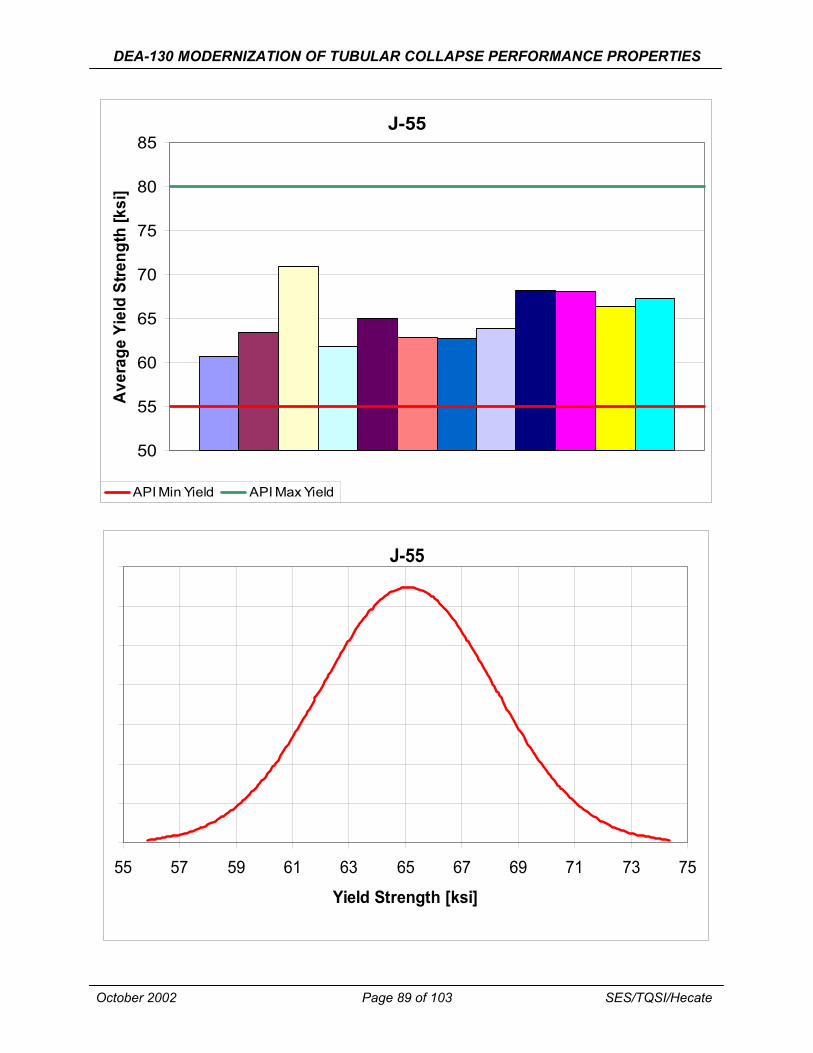
DEA-130 MODERNIZATION OF TUBULAR COLLAPSE PERFORMANCE PROPERTIES
Aver
age
Yiel
d St
reng
th [k
si]
API Min Yield API Max Yield
J-55
55 57 59 61 63 65 67 69 71 73 75
Yield Strength [ksi]
J-5585
80
75
70
65
60
55
50
October 2002 Page 89 of 103 SES/TQSI/Hecate
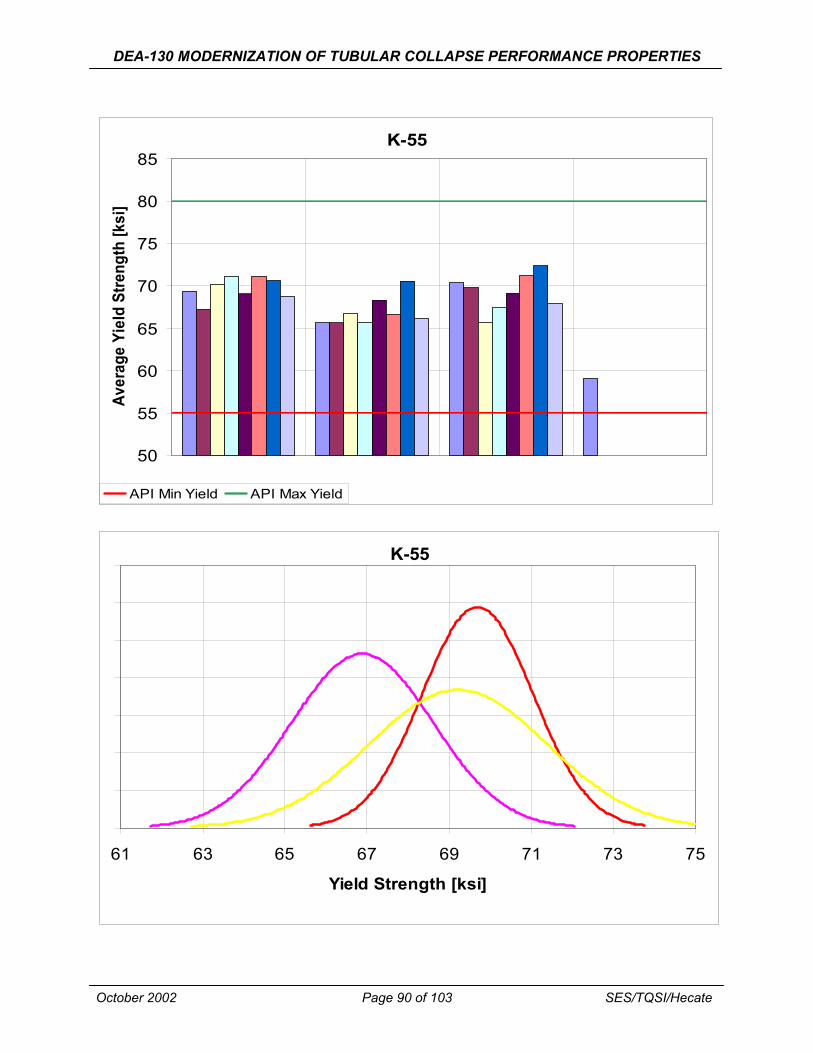
DEA-130 MODERNIZATION OF TUBULAR COLLAPSE PERFORMANCE PROPERTIES
K-55
50
55
60
65
70
75
80
85
Aver
age
Yiel
d St
reng
th [k
si]
API Min Yield API Max Yield
K-55
61 63 65 67 69 71 73 75
Yield Strength [ksi]
October 2002 Page 90 of 103 SES/TQSI/Hecate
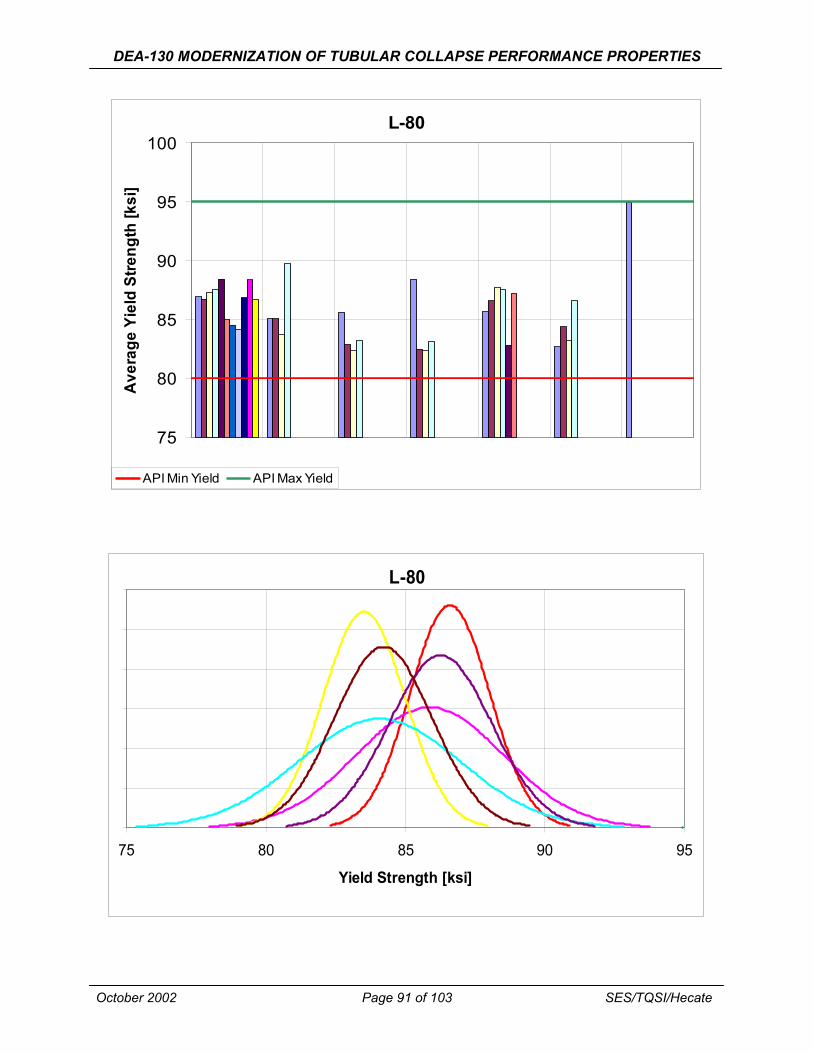
DEA-130 MODERNIZATION OF TUBULAR COLLAPSE PERFORMANCE PROPERTIES
L-80
75
80
85
90
95
100 Av
erag
e Yi
eld
Stre
ngth
[ksi
]
API Min Yield API Max Yield
L-80
75 80 85 90 95
Yield Strength [ksi]
October 2002 Page 91 of 103 SES/TQSI/Hecate
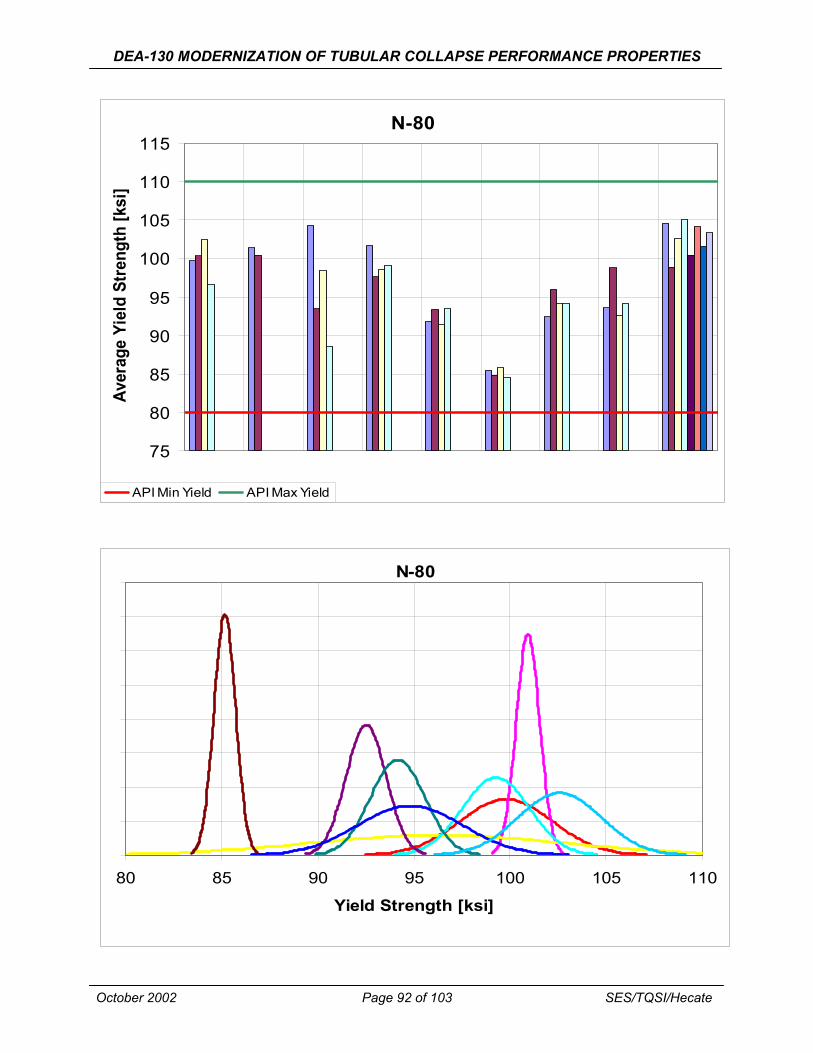
DEA-130 MODERNIZATION OF TUBULAR COLLAPSE PERFORMANCE PROPERTIES
N-80
75
80
85
90
95
100
105
110
115 Av
erag
e Yi
eld
Stre
ngth
[ksi
]
API Min Yield API Max Yield
N-80
80 85 90 95 100 105 110
Yield Strength [ksi]
October 2002 Page 92 of 103 SES/TQSI/Hecate

DEA-130 MODERNIZATION OF TUBULAR COLLAPSE PERFORMANCE PROPERTIES
Aver
age
Yiel
d St
reng
th [k
si]
API Min Yield API Max Yield
P-110
105 110 115 120 125 130 135 140 145 150
Yield Strength [ksi]
P-110145
140
135
130
125
120
115
110
105
October 2002 Page 93 of 103 SES/TQSI/Hecate

DEA-130 MODERNIZATION OF TUBULAR COLLAPSE PERFORMANCE PROPERTIES
Aver
age
Yiel
d St
reng
th [k
si]
API Min Yield API Max Yield
Q-125
120 130 140 150 160
Yield Strength [ksi]
Q-125155
150
145
140
135
130
125
120
October 2002 Page 94 of 103 SES/TQSI/Hecate

DEA-130 MODERNIZATION OF TUBULAR COLLAPSE PERFORMANCE PROPERTIES
No average sample yield strength values were below the specified minimum value. One manufacturer had several average sample yield strengths that were above the API limit and these were for Q-125 grade. One L-80 average yield strength was at the maximum API limit of 95 ksi.
11.6 Sheet Ovality
Ovality is not measured directly but rather calculated as:
max OD − min OD o = avgOD
Ovality data is reported on Sheet Ovality this way. Often it is reported as percent, i.e.
max OD − min OD o = *100avgOD
There are 1,359 ovality values in the database.
-0.002 0 0.002 0.004 0.006 0.008 0.01
Ovality
October 2002 Page 95 of 103 SES/TQSI/Hecate

DEA-130 MODERNIZATION OF TUBULAR COLLAPSE PERFORMANCE PROPERTIES
Below is the same data presented assuming a Lognormal distribution.
0 0.001 0.002 0.003 0.004 0.005 0.006 0.007 0.008 0.009 0.01
Ovality
The significance of these curves is that the peak represents the most probable occurrence of ovality. This data indicates that the manufacturer with the least amount of ovality is the dark blue plot and the manufacture with the greatest is the red plot (somewhat affected by the product, all red samples were cold sized). Of all the manufacturers, the green plot had the smallest standard deviation of ovality.
October 2002 Page 96 of 103 SES/TQSI/Hecate

DEA-130 MODERNIZATION OF TUBULAR COLLAPSE PERFORMANCE PROPERTIES
11.7 Sheet Ecc
Eccentricity is not measured directly but rather calculated as:
t max− t min e = tavg
where t is wall thickness.
It is reported on Sheet Ecc this way. Often it is reported as percent, i.e.
t max− t min e = *100 tavg
There are 5,436 eccentricity values in the database.
-0.02 0 0.02 0.04 0.06 0.08 0.1Eccentricity
October 2002 Page 97 of 103 SES/TQSI/Hecate

DEA-130 MODERNIZATION OF TUBULAR COLLAPSE PERFORMANCE PROPERTIES
Below is the same data presented assuming a Lognormal distribution.
0 0.01 0.02 0.03 0.04 0.05 0.06 0.07 0.08 0.09 0.1
Ecce ntr icity
The welded pipe manufacturers had the smallest amount of eccentricity, plots brown, black and purple.
The seamless manufacturers all had about the same amount of eccentricity and about the same variance.
October 2002 Page 98 of 103 SES/TQSI/Hecate

DEA-130 MODERNIZATION OF TUBULAR COLLAPSE PERFORMANCE PROPERTIES
11.8 Sheet RS
Two methods of residual stress were calculated as part of DEA-130. One was the Crampton method while the other was based on thin shell theory. The Crampton method was deemed most familiar and is the only one presented. It is reported in units of [psi].
Each of the 151 pipes that were collapse tested had a Crampton residual stress report.
-20,000 -10,000 0 10,000 20,000 30,000 40,000
RS Cram pton
October 2002 Page 99 of 103 SES/TQSI/Hecate

DEA-130 MODERNIZATION OF TUBULAR COLLAPSE PERFORMANCE PROPERTIES
Residual Stress can be either positive or negative, depending upon the process, heat treat and straightening. In this study, only two pipe samples had a negative residual stress (and both were small values). Therefore there could be an argument made for the case that Residual Stress is usually positive. This suggests using the assumption that the underlying population is Lognormally distributed.
All positive Residual Stress were used to create this presentation:
0 5,000 10,000 15,000 20,000 25,000 30,000 35,000 40,000
RS Crampton
The brown plot had the largest average residual stress at approximately 22 ksi and also one of the largest variances of stress. The manufacturer with the smallest residual stress was the red plot. The light purple plot had the largest variance of residual stress. Residual stress is also dependent on hot vs cold straightening as shown in Section 9.4.4, page 65.
It is interesting to note that the gray plot clearly had the most consistent residual stress with an average of 17.5 ksi and a very small variance.
October 2002 Page 100 of 103 SES/TQSI/Hecate

DEA-130 MODERNIZATION OF TUBULAR COLLAPSE PERFORMANCE PROPERTIES
11.9 Sheet Collapse
Collapse values were normalized first against API “minimum” and then to API “average” values. Refer to API Bulletin 5C3 and section 8.2.7.3 of this report for details of the API minimum and average values.
There was some pipe that did not fit nicely into API categories. For example there are some pipes reported with proprietary yield strength of 95/110. Every effort was made to find an appropriate yield strength value to use in the API calculations used for normalization.
0.9 1 1.1 1.2 1.3 1.4 1.5 1.6 1.7 1.8
Normalized Collapse (Actual/API-min)
API Minimum Collapse Pressure is the pressure listed in API Bulletin 5C212 and is the value typically used in the design of tubing and casing strings. Any collapse test pressure results below this API value would have serious problems. Fortunately, no test results were below this value.
The highest mean collapse resistance was the dark brown plot with the orange plot being the second highest. The purple plot had the lowest mean collapse pressures with the light brown having the second lowest.
October 2002 Page 101 of 103 SES/TQSI/Hecate

DEA-130 MODERNIZATION OF TUBULAR COLLAPSE PERFORMANCE PROPERTIES
In terms of range of collapse pressure, the yellow plot had the largest variance followed with the orange plot. The blue plot had the smallest variance with the red plot the second smallest.
0.7 0.8 0.9 1 1.1 1.2 1.3 1.4
Normalized Collapse (Actual/API-avg)
API Average Collapse Pressure is the statistically average collapse pressure from the tests that the API Bulletin 5C2 pressures are based on. The values are not listed in any API documents but can be calculated from the equations given in API Bulletin 5C3. The API Average Collapse Pressure is basically the collapse pressure without a safety factor applied. The ratio between API Average and API Minimum is not constant with D/t.
On the high end, four manufacturers were in close agreement. The highest mean collapse resistance was the dark green plot with the dark purple plot being the second highest. The dark blue plot had the lowest mean collapse pressures with the light green plot having the second lowest.
In terms of variance of collapse pressure, the green, dark purple and blue plots had the largest variance and dark blue the smallest variance with the red plot having the next smallest.
Because of relatively small sampling, these observations may be indicative of more general behaviors but should be confirmed when necessary for important design decisions.
October 2002 Page 102 of 103 SES/TQSI/Hecate

DEA-130 MODERNIZATION OF TUBULAR COLLAPSE PERFORMANCE PROPERTIES
LIST OF REFERENCES
1. Internal Stress and Season Cracking in Base Tubes, D.K. Crampton, Transactions of the American Institute of Mining and Metallurgical Engineers, Institute of Metals Division, 1930, papers presented Sept 9-12, 1929 and Feb 1720, 1930
2. Casing Collapse Performance, P. Mehdizadeh, Transactions of the ASME, Journal of Engineering for Industry, August 1976
3. Casing Setting Depths Are Not Assured by Physical Properties of the Steel, W.M. Frame, Drilling and Production Practice API, 1939
4. Standard Practice for Estimating the Approximate Residual Circumferential Stress in Straight Thin-Walled Tubing, ASTM, E 1928-98
5. Effect of Measurement Procedures on Estimating Geometrical Parameters of Pipes, Andrea P. Assanelli, SPE, FUDETEC; and Gustavo Lopez Turconi, SIDERCA
6. Bulletin on Formulas and Calculations for Casing, Tubing, Drill Pipe, and Line Pipe Properties, API Bulletin 5C3
7. A New Empirical Formula for Collapse Resistance of Commercial Casing, Toshitaka Tamano, Toshitaro Mimaki, Samon Yanagimoto, Nippon Steel Technical Report No. 26 July 1985, UDC 622.276: 621.643: 620.173
8. Collapse: Trial Calibration (3), report prepared by Amerada Hess for API/ISO TC67/SC5/WG2b, October 2000
9. Collapse: Effect of Stress-Strain Curve Shape, report prepared by Amerada Hess for API/ISO TC67/SC5/WG2b, September 1999
10. Mechanical Engineering Design (McGraw-Hill in Mechanical Engineering), Shigley and Mischke, 3rd Edition
11. Petroleum and Natural Gas Industries – Steel Pipes for Use as Casing and Tubing for Wells, API Specification 5CT
12. Bulletin on Performance Properties of Casing, Tubing and Drill Pipe, API Bulletin 5C2
October 2002 Page 103 of 103 SES/TQSI/Hecate